UNITED STATES
SECURITIES AND EXCHANGE COMMISSION
Washington, D.C. 20549
Form N-CSR
CERTIFIED SHAREHOLDER REPORT OF REGISTERED MANAGEMENT
INVESTMENT COMPANIES
Investment Company Act File Number 811-22321
MAINSTAY FUNDS TRUST
(Exact name of Registrant as specified in charter)
51 Madison Avenue, New York, NY 10010
(Address of principal executive offices) (Zip code)
J. Kevin Gao, Esq.
30 Hudson Street
Jersey City, New Jersey 07302
(Name and address of agent for service)
Registrant’s telephone number, including area code: (212) 576-7000
Date of fiscal year end: April 30
(MainStay CBRE Global Infrastructure Fund, MainStay CBRE Real Estate Fund, MainStay Conservative ETF Allocation Fund, MainStay Defensive ETF Allocation Fund, MainStay Equity ETF Allocation Fund, MainStay Growth ETF Allocation Fund, MainStay Moderate ETF Allocation Fund, and MainStay ESG Multi-Asset Allocation Fund)
Date of reporting period: October 31, 2023
FORM N-CSR
The information presented in this Form N-CSR relates solely to the
MainStay CBRE Global Infrastructure Fund, MainStay CBRE Real Estate Fund, MainStay Conservative
ETF Allocation Fund, MainStay Defensive ETF Allocation Fund, MainStay Equity ETF Allocation Fund,
MainStay Growth ETF Allocation Fund, MainStay Moderate ETF Allocation Fund, and MainStay ESG
Multi-Asset Allocation Fund, each a
series of the Registrant.
Item 1. Reports to Stockholders.
MainStay CBRE Global Infrastructure Fund
Message from the President and Semiannual Report
Unaudited | October 31, 2023
Special Notice:
Beginning in July 2024, new regulations issued by the Securities and Exchange Commission (SEC) will take effect requiring open-end mutual fund companies and ETFs to (1) overhaul the content of their shareholder reports and (2) mail paper copies of the new tailored shareholder reports to shareholders who have not opted to receive these documents electronically.
If you have not yet elected to receive your shareholder reports electronically, please contact your financial intermediary or visit newyorklifeinvestments.com/accounts.
| Not FDIC/NCUA Insured | Not a Deposit | May Lose Value | No Bank Guarantee | Not Insured by Any Government Agency |
This page intentionally left blank
Message from the President
Interest rates and inflation were the primary forces driving market behavior during the six-month reporting period ended October 31, 2023, with equity indices delivering mixed performance while bond indices generally declined.
U.S. inflation levels, as measured by the Consumer Price Index, ranged between 3.0% and 4.0% throughout the reporting period, down from the peak of 9.1% in June 2022, although well above the 2.0% target set by the U.S. Federal Reserve (the “Fed”). At the same time, the benchmark federal funds rate climbed to over 5%, its highest level since the financial crisis of 2007, as the Fed attempted to drive inflation still lower. Comments from Fed members reinforced the central bank’s hawkish stance in response to surprisingly robust U.S. economic growth and rising wage pressures, thus increasing the likelihood that interest rates would stay higher for longer. International developed markets exhibited similar dynamics of persistently elevated inflation and rising interest rates.
Against a backdrop of high interest rates, political dysfunction in Washington D.C. and intensifying global geopolitical instability—including the ongoing war in Ukraine and the outbreak of hostilities in the Middle East—equity markets struggled to advance. The S&P 500® Index, a widely regarded benchmark of large-cap U.S. market performance, eked out a slight gain, bolstered by the strong performance of mega-cap, growth-oriented, technology-related shares as investors flocked to companies creating the infrastructure for developments in artificial intelligence. However, smaller-cap stocks and value-oriented shares trended lower. Among industry sectors, information technology posted the strongest gains, followed by consumer discretionary, which rose in response to healthy consumer spending trends, while energy shares benefited from rising petroleum prices. All other sectors lost ground. Utilities declined most sharply as rising interest rates undermined the appeal of high-yielding stocks, while real estate came under pressure from
rising mortgage rates and weak levels of office occupancy, and consumer staples declined as market sentiment turned away from defensive, value-oriented businesses. International equities broadly trailed their U.S. counterparts as economic growth in the rest of world generally lagged that of the United States, and as the U.S. dollar rose in value compared to most other global currencies.
Bond prices were driven lower by rising yields and increasing expectations of high interest rates for an extended period of time. The U.S. yield curve steepened, with the 30-year Treasury yield exceeding 5% for the first time in more than a decade. The yield curve remained inverted, with the 10-year Treasury yield ending the period at 4.88%, compared with 5.07% for the 2-year Treasury yield. Corporate bonds outperformed long-term Treasury bonds, but still trended lower under pressure from rising yields and an uptick in default rates. Among corporates, lower-credit-quality instruments performed relatively well compared to their higher-credit-quality counterparts, while floating rate securities performed better still.
In the face of today’s uncertain market environment, New York Life Investments remains dedicated to providing the guidance, resources and investment solutions you need to pursue your financial goals.
Thank you for trusting us to help meet your investment needs.
Sincerely,
Kirk C. Lehneis
President
The opinions expressed are as of the date of this report and are subject to change. There is no guarantee that any forecast made will come to pass. This material does not constitute investment advice and is not intended as an endorsement of any specific investment. Past performance is no guarantee of future results.
Not part of the Semiannual Report
Investors should refer to the Fund’s Summary Prospectus and/or Prospectus and consider the Fund’s investment objectives, strategies, risks, charges and expenses carefully before investing. The Summary Prospectus and/or Prospectus contain this and other information about the Fund. You may obtain copies of the Fund’s Summary Prospectus, Prospectus and Statement of Additional Information, which includes information about the MainStay Funds Trust's Trustees, free of charge, upon request, by calling toll-free 800-624-6782, by writing to NYLIFE Distributors LLC, Attn: MainStay Marketing Department, 30 Hudson Street, Jersey City, NJ 07302 or by sending an e-mail to MainStayShareholderServices@nylim.com. These documents are also available via the MainStay Funds’ website at newyorklifeinvestments.com. Please read the Fund’s Summary Prospectus and/or Prospectus carefully before investing.
Investment and Performance Comparison (Unaudited)
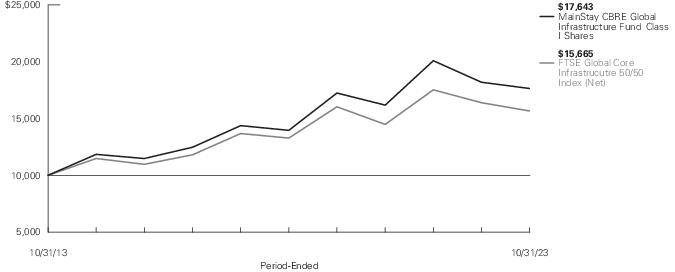
Performance data quoted represents past performance. Past performance is no guarantee of future results. Because of market volatility and other factors, current performance may be lower or higher than the figures shown. Investment return and principal value will fluctuate, and as a result, when shares are redeemed, they may be worth more or less than their original cost. The graph below depicts the historical performance of Class I shares of the Fund. Performance will vary from class to class based on differences in class-specific expenses and sales charges. For performance information current to the most recent month-end, please call 800-624-6782 or visit newyorklifeinvestments.com.
The performance table and graph do not reflect the deduction of taxes that a shareholder would pay on distributions or Fund share redemptions. Total returns reflect maximum applicable sales charges as indicated in the table below, if any, changes in share price, and reinvestment of dividend and capital gain distributions. The graph assumes the initial investment amount shown below and reflects the deduction of all sales charges that would have applied for the period of investment. Performance figures may reflect certain fee waivers and/or expense limitations, without which total returns may have been lower. For more information on share classes and current fee waivers and/or expense limitations (if any), please refer to the Notes to Financial Statements.
| Average Annual Total Returns for the Period-Ended October 31, 2023 |
| Class | Sales Charge | | Inception
Date1 | Six
Months2 | One
Year | Five
Years | Ten Years
or Since
Inception | Gross
Expense
Ratio3 |
| Class A Shares4 | Maximum 5.50% Initial Sales Charge | With sales charges | 10/16/2013 | -18.05% | -8.65% | 3.26% | 4.91% | 1.27% |
| | | Excluding sales charges | | -13.28 | -3.33 | 4.49 | 5.53 | 1.27 |
| Investor Class Shares5 | Maximum 5.00% Initial Sales Charge | With sales charges | 2/24/2020 | -17.71 | -8.19 | N/A | -3.18 | 1.29 |
| | | Excluding sales charges | | -13.37 | -3.36 | N/A | -1.68 | 1.29 |
| Class C Shares4 | Maximum 1.00% CDSC | With sales charges | 2/28/2019 | -14.49 | -4.98 | N/A | 1.95 | 2.04 |
| | if Redeemed Within One Year of Purchase | Excluding sales charges | | -13.63 | -4.04 | N/A | 1.95 | 2.04 |
| Class I Shares4 | No Sales Charge | | 6/28/2013 | -13.13 | -3.02 | 4.79 | 5.84 | 1.02 |
| Class R6 Shares | No Sales Charge | | 2/24/2020 | -13.16 | -2.95 | N/A | -1.26 | 0.89 |
| 1. | Effective at the close of business on February 21, 2020, the Fund changed its fiscal and tax year end from October 31 to April 30. |
| 2. | Not annualized. |
| 3. | The gross expense ratios presented reflect the Fund’s “Total Annual Fund Operating Expenses” from the most recent Prospectus, as supplemented, and may differ from other expense ratios disclosed in this report. |
| 4. | Performance figures for Class A shares, Class C shares and Class I shares reflect the historical performance of the then-existing Class A shares, Class C shares and Class I shares, respectively, of the Voya CBRE Global Infrastructure Fund (the predecessor to the Fund, which was subject to a different fee structure) for periods prior to February 21, 2020. The MainStay CBRE Global Infrastructure Fund commenced operations on February 24, 2020. |
| 5. | Prior to June 30, 2020, the maximum initial sales charge was 5.50%, which is reflected in the applicable average annual total return figures shown. |
The footnotes on the next page are an integral part of the table and graph and should be carefully read in conjunction with them.
| Benchmark Performance* | Six
Months1 | One
Year | Five
Years | Ten
Years |
| FTSE Global Core Infrastructure 50/50 Index (Net)2 | -11.78% | -4.44% | 3.36% | 4.59% |
| Morningstar Infrastructure Category Average3 | -12.21 | -4.30 | 4.13 | 4.32 |
| * | Returns for indices reflect no deductions for fees, expenses or taxes, except for foreign withholding taxes where applicable. Results assume reinvestment of all dividends and capital gains. An investment cannot be made directly in an index. |
| 1. | Not annualized. |
| 2. | The FTSE Global Core Infrastructure 50/50 Index (Net) is a market-capitalization-weighted index of worldwide infrastructure and infrastructure-related securities. Constituent weights are adjusted semi-annually according to three broad industry sectors: 50% utilities, 30% transportation, and a 20% mix of other sectors. |
| 3. | The Morningstar Infrastructure Category Average is representative of funds that invest more than 60% of their assets in stocks of companies engaged in infrastructure activities. Industries considered to be part of the infrastructure sector include: oil & gas midstream; waste management; airports; integrated shipping; railroads; shipping & ports; trucking; engineering & construction; infrastructure operations; and the utilities sector. Results are based on average total returns of similar funds with all dividends and capital gain distributions reinvested. |
The footnotes on the preceding page are an integral part of the table and graph and should be carefully read in conjunction with them.
| 6 | MainStay CBRE Global Infrastructure Fund |
Cost in Dollars of a $1,000 Investment in MainStay CBRE Global Infrastructure Fund (Unaudited)
The example below is intended to describe the fees and expenses borne by shareholders during the six-month period from May 1, 2023 to October 31, 2023, and the impact of those costs on your investment.
Example
As a shareholder of the Fund you incur two types of costs: (1) transaction costs, including exchange fees and sales charges (loads) on purchases (as applicable), and (2) ongoing costs, including management fees, distribution and/or service (12b-1) fees and other Fund expenses (as applicable). This example is intended to help you understand your ongoing costs (in dollars) of investing in the Fund and to compare these costs with the ongoing costs of investing in other mutual funds. The example is based on an investment of $1,000 made at the beginning of the six-month period and held for the entire period from May 1, 2023 to October 31, 2023.
This example illustrates your Fund’s ongoing costs in two ways:
Actual Expenses
The second and third data columns in the table below provide information about actual account values and actual expenses. You may use the information in these columns, together with the amount you invested, to estimate the expenses that you paid during the six months ended October 31, 2023. Simply divide your account value by $1,000 (for example, an
$8,600 account value divided by $1,000 = 8.6), then multiply the result by the number under the heading entitled “Expenses Paid During Period” to estimate the expenses you paid on your account during this period.
Hypothetical Example for Comparison Purposes
The fourth and fifth data columns in the table below provide information about hypothetical account values and hypothetical expenses based on the Fund’s actual expense ratio and an assumed rate of return of 5% per year before expenses, which is not the Fund’s actual return. The hypothetical account values and expenses may not be used to estimate the actual ending account balances or expenses you paid for the six-month period shown. You may use this information to compare the ongoing costs of investing in the Fund with the ongoing costs of investing in other mutual funds. To do so, compare this 5% hypothetical example with the 5% hypothetical examples that appear in the shareholder reports of the other mutual funds.
Please note that the expenses shown in the table are meant to highlight your ongoing costs only and do not reflect any transactional costs, such as exchange fees or sales charges (loads). Therefore, the fourth and fifth data columns of the table are useful in comparing ongoing costs only and will not help you determine the relative total costs of owning different funds. In addition, if these transactional costs were included, your costs would have been higher.
| Share Class | Beginning
Account
Value
5/1/23 | Ending Account
Value (Based
on Actual
Returns and
Expenses)
10/31/23 | Expenses
Paid
During
Period1 | Ending Account
Value (Based
on Hypothetical
5% Annualized
Return and
Actual Expenses)
10/31/23 | Expenses
Paid
During
Period1 | Net Expense
Ratio
During
Period2 |
| Class A Shares | $1,000.00 | $867.20 | $6.05 | $1,018.65 | $ 6.55 | 1.29% |
| Investor Class Shares | $1,000.00 | $866.30 | $6.24 | $1,018.45 | $ 6.75 | 1.33% |
| Class C Shares | $1,000.00 | $863.70 | $9.74 | $1,014.68 | $10.53 | 2.08% |
| Class I Shares | $1,000.00 | $868.70 | $4.56 | $1,020.26 | $ 4.93 | 0.97% |
| Class R6 Shares | $1,000.00 | $868.40 | $4.23 | $1,020.61 | $ 4.57 | 0.90% |
| 1. | Expenses are equal to the Fund’s annualized expense ratio of each class multiplied by the average account value over the period, divided by 366 and multiplied by 184 (to reflect the six-month period). The table above represents the actual expenses incurred during the six-month period. In addition to the fees and expenses which the Fund bears directly, it also indirectly bears a pro rata share of the fees and expenses of the underlying funds in which it invests. Such indirect expenses are not included in the above-reported expense figures. |
| 2. | Expenses are equal to the Fund's annualized expense ratio to reflect the six-month period. |
Country Composition as of October 31, 2023 (Unaudited)
| United States | 58.0% |
| Australia | 7.1 |
| Spain | 6.6 |
| Canada | 6.4 |
| France | 6.0 |
| Japan | 5.6 |
| United Kingdom | 3.3 |
| Italy | 3.0 |
| Portugal | 2.0% |
| China | 1.6 |
| Mexico | 1.3 |
| Hong Kong | 0.6 |
| Other Assets, Less Liabilities | –1.5 |
| | 100.0% |
See Portfolio of Investments beginning on page 11 for specific holdings within these categories. The Fund's holdings are subject to change.
Top Ten Holdings and/or Issuers Held as of October 31, 2023 (excluding short-term investments) (Unaudited)
| 1. | American Tower Corp. |
| 2. | NextEra Energy, Inc. |
| 3. | WEC Energy Group, Inc. |
| 4. | Vinci SA |
| 5. | Aena SME SA |
| 6. | Transurban Group |
| 7. | Targa Resources Corp. |
| 8. | CSX Corp. |
| 9. | Sempra |
| 10. | Central Japan Railway Co. |
| 8 | MainStay CBRE Global Infrastructure Fund |
Portfolio Management Discussion and Analysis (Unaudited)
Questions answered by portfolio managers Jeremy Anagnos, CFA, Joseph P. Smith, CFA, Daniel Foley, CFA, and Hinds Howard of CBRE Investment Management Listed Real Assets LLC.
How did MainStay CBRE Global Infrastructure Fund perform relative to its benchmark and peer group during the six months ended October 31, 2023?
For the six months ended October 31, 2023, Class I shares of MainStay CBRE Global Infrastructure Fund returned −13.13%, underperforming the −11.78% return of the Fund’s primary benchmark, the FTSE Global Core Infrastructure 50/50 Index (Net) (the “Index”). Over the same period, Class I shares also underperformed the −12.21% return of the Morningstar Infrastructure Category Average.1
What factors affected the Fund’s relative performance during the reporting period?
The Fund underperformed the Index primarily due to negative stock selection, particularly in emerging markets. Underweight exposure to the outperforming emerging markets sector also detracted from relative returns, although to a lesser degree. Stock selection in Europe further undermined relative performance. Conversely, the Fund’s strongest relative performance came from stock selection in North America, where all sectors made positive contributions, and in Asia, where communications and transport holdings bolstered returns. (Contributions take weightings and total returns into account.) From a sector perspective, selection in communications added to performance, benefiting from exposure to the data center industry, which experienced strong fundamentals and growing demand related to data-intensive artificial intelligence (“AI”) applications. While underweight exposure to lagging North American utilities also enhanced returns, other allocations generally detracted across regions and sectors.
During the reporting period, which sectors and subsectors were the strongest positive contributors to the Fund’s relative performance and which sectors and subsectors were particularly weak?
The strongest positive contributions to the Fund’s performance relative to the Index came from North American utilities and communications as well as Asian communications. During the reporting period, utilities in North America generated volatile performance amid rising rates. The Fund was well positioned, with a focus on companies with strong balance sheets and relatively little rate sensitivity. Communications in Asia and North America benefited from data center exposure, which rose on solid fundamentals and increasing AI demand.
The weakest contributors to relative performance included emerging markets, European communications and Asian utilities. Emerging markets were a detractor due to both negative stock selection and underweight exposure to this outperforming region. European communications were sold off in the latter part of the
reporting period in response to a rising rate environment. In Asia, where Japanese utilities materially outperformed Hong Kong-listed names, the Fund held no exposure in Japan and modest exposure to Hong Kong–a combination that undermined relative performance.
During the reporting period, which individual stocks made the strongest positive contributions to the Fund’s absolute performance and which stocks detracted the most?
The holdings making the largest positive contributions to absolute performance during the reporting period included liquid natural gas (“LNG”) infrastructure company Cheniere Energy and U.S. midstream energy company Targa Resources. As the largest owner and operator of U.S. LNG export facilities, Cheniere was well positioned to capitalize on increasing global demand for natural gas through sales of existing assets and contracts for future development. Targa, with assets focused on natural gas liquid from the Permian Basin in Texas, likewise experienced surging domestic and global demand. Additionally, Targa’s share price benefited from the company’s disciplined use of capital, improving its balance sheet while also increasing shareholder returns through stock buybacks and increased dividends.
During the same period, positions in European telecommunication tower company Cellnex Telecom and diversified U.S. utility The AES Corporation detracted most from the Fund’s absolute performance. Cellnex shares declined alongside those of other highly leveraged global tower companies, as a rapidly rising interest rate environment raised the prospect of higher interest costs on refinancing. Negative headlines regarding renewable development—as well as poor results in the clean energy technology market driven by materials and labor cost inflation and higher financing costs—weighed on shares of The AES Corporation, which is viewed as a leader in both categories.
What were some of the Fund’s largest purchases and sales during the reporting period?
During the reporting period, we substantially increased the Fund’s positions in the U.S. midstream sector, adding a new position in Kinder Morgan as well as adding large increases to holdings in Targa Resources, Cheniere Energy and, to a lesser extent, Pembina Pipeline. We expect the recovery in commodity prices and sustained energy inflation to provide support for fundamental improvement in midstream assets. We continue to believe that natural gas midstream is well positioned to benefit from global demand, particularly given supply limits related to the war in Ukraine. Kinder Morgan owns one of the largest natural gas pipeline networks in North America, and the stock’s
| 1. | See "Investment and Performance Comparison" for other share class returns, which may be higher or lower than Class I share returns, and for more information on benchmark and peer group returns. |
underperformance relative to its peers for much of 2023 provided an attractive entry point based on valuation.
The Fund’s largest sales during the reporting period involved positions in U.K. utilities SSE and National Grid, along with tower companies Crown Castle International, based in the United States, and Cellnex Telecom, based in Spain. The sales of the Fund’s U.K. utilities holdings reflected their relatively high valuation compared with U.S. utilities, which had underperformed. We reduced the Fund’s holdings in tower companies due to their sensitivity to higher interest rates and our view that the sustained high interest rates were likely to persist.
How did the Fund’s subsector weightings change during the reporting period?
During the reporting period, we increased the Fund’s exposure to more economically sensitive sectors while decreasing exposure to more interest rate sensitive sectors. In particular, we increased exposure to the midstream and freight rail sectors in the United States. Midstream benefits from energy inflation, which increased during the reporting period. Freight rail saw weak volumes throughout 2023, but appeared to be nearing an inflection point, with improved activity likely in the next 12-to-18 months. Both sectors traded at undemanding valuations. In light of recent rate increases and U.S. Federal Reserve statements indicating that interest rates would likely remain higher for longer than previously expected, we reduced exposure to more interest rate sensitive sectors like utilities and towers on a global basis. While these sectors have offsets in the form of regulations or contractual increases to boost revenues in a higher inflation environment, market sentiment focused on the interest rate increases and the high leverage of these businesses remained headwinds.
How was the Fund positioned at the end of the reporting period?
As of October 31, 2023, the Fund remains positioned to benefit from long-term growth in renewable development, which translates into a preference for integrated utilities over regulated utilities. We believe that energy security has regained attention globally and midstream assets in North America, particularly natural gas-oriented assets, are attractively positioned to meet this need. The Fund is also positioned to benefit from exposure to long-term data growth through a preference for communications infrastructure exposure. Within transports, we favor leisure-exposed airports, toll roads, freight rail companies and passenger rail stocks in Japan. The Fund continues to hold underweight exposure to emerging markets due to ongoing
regulatory and policy challenges that can lead to excessive volatility and negative returns.
The opinions expressed are those of the portfolio managers as of the date of this report and are subject to change. There is no guarantee that any forecasts will come to pass. This material does not constitute investment advice and is not intended as an endorsement of any specific investment.
| 10 | MainStay CBRE Global Infrastructure Fund |
Portfolio of Investments October 31, 2023†^(Unaudited)
| | Shares | Value |
| Common Stocks 101.3% |
| Australia 7.1% |
| Atlas Arteria Ltd. (Transportation) | 10,280,153 | $ 34,627,652 |
| NEXTDC Ltd. (Communications) (a) | 1,026,775 | 7,653,183 |
| Transurban Group (Transportation) | 5,122,344 | 38,407,422 |
| | | 80,688,257 |
| Canada 6.4% |
| Canadian National Railway Co. (Transportation) | 138,647 | 14,670,037 |
| Enbridge, Inc. (Midstream / Pipelines) | 915,251 | 29,330,272 |
| Pembina Pipeline Corp. (Midstream / Pipelines) | 934,215 | 28,752,332 |
| | | 72,752,641 |
| China 1.6% |
| China Resources Gas Group Ltd. (Utilities) | 2,998,000 | 8,869,199 |
| Guangdong Investment Ltd. (Utilities) | 13,226,253 | 9,025,679 |
| | | 17,894,878 |
| France 6.0% |
| Eiffage SA (Transportation) | 301,003 | 27,294,702 |
| Vinci SA (Transportation) | 365,924 | 40,453,004 |
| | | 67,747,706 |
| Hong Kong 0.6% |
| CK Infrastructure Holdings Ltd. (Utilities) | 1,479,360 | 6,853,046 |
| Italy 3.0% |
| Enel SpA (Utilities) | 5,261,448 | 33,336,023 |
| Japan 5.6% |
| Central Japan Railway Co. (Transportation) | 1,651,165 | 36,993,939 |
| West Japan Railway Co. (Transportation) | 705,813 | 26,756,401 |
| | | 63,750,340 |
| Mexico 1.3% |
| Grupo Aeroportuario del Pacifico SAB de CV, Class B (Transportation) | 1,230,501 | 14,353,911 |
| Portugal 2.0% |
| EDP - Energias de Portugal SA (Utilities) | 5,401,366 | 22,689,286 |
| Spain 6.6% |
| Aena SME SA (Transportation) | 271,313 | 39,257,682 |
| | Shares | Value |
| |
| Spain (continued) |
| Cellnex Telecom SA (Communications) | 1,211,434 | $ 35,532,004 |
| | | 74,789,686 |
| United Kingdom 3.3% |
| National Grid plc (Utilities) | 2,267,259 | 26,967,671 |
| Pennon Group plc (Utilities) | 1,108,398 | 9,787,425 |
| | | 36,755,096 |
| United States 57.8% |
| AES Corp. (The) (Utilities) | 1,472,284 | 21,937,031 |
| ALLETE, Inc. (Utilities) (b) | 141,834 | 7,593,792 |
| Ameren Corp. (Utilities) | 400,094 | 30,291,117 |
| American Electric Power Co., Inc. (Utilities) | 54,768 | 4,137,175 |
| American Tower Corp. (Communications) | 342,833 | 61,089,412 |
| Cheniere Energy, Inc. (Midstream / Pipelines) | 218,729 | 36,400,880 |
| CMS Energy Corp. (Utilities) | 476,504 | 25,893,227 |
| Constellation Energy Corp. (Utilities) | 95,276 | 10,758,566 |
| Crown Castle, Inc. (Communications) | 129,417 | 12,033,193 |
| CSX Corp. (Transportation) | 1,262,202 | 37,676,730 |
| Equinix, Inc. (Communications) | 30,044 | 21,921,304 |
| Kinder Morgan, Inc. (Midstream / Pipelines) | 1,671,770 | 27,082,674 |
| NextEra Energy Partners LP (Utilities) (b) | 196,340 | 5,314,924 |
| NextEra Energy, Inc. (Utilities) | 1,006,864 | 58,700,170 |
| NiSource, Inc. (Utilities) | 499,400 | 12,564,904 |
| OGE Energy Corp. (Utilities) | 486,224 | 16,628,861 |
| PG&E Corp. (Utilities) (a) | 1,224,926 | 19,966,294 |
| PPL Corp. (Utilities) | 1,365,358 | 33,546,846 |
| Revenir Energy Inc. (Midstream / Pipelines) (a)(c)(d) | 5,055 | 16,884 |
| Revenir Energy Inc. (Midstream / Pipelines) (a)(c)(d) | 27,942 | 93,326 |
| SBA Communications Corp. (Communications) | 72,254 | 15,074,352 |
| Sempra (Utilities) | 528,456 | 37,007,774 |
| Southern Co. (The) (Utilities) | 481,519 | 32,406,229 |
| Targa Resources Corp. (Midstream / Pipelines) | 457,006 | 38,210,272 |
| Union Pacific Corp. (Transportation) | 112,133 | 23,279,932 |
| WEC Energy Group, Inc. (Utilities) | 517,115 | 42,087,990 |
| Xcel Energy, Inc. (Utilities) | 346,952 | 20,563,845 |
| | | 652,277,704 |
Total Common Stocks
(Cost $1,261,199,146) | | 1,143,888,574 |
The notes to the financial statements are an integral part of, and should be read in conjunction with, the financial statements.
11
Portfolio of Investments October 31, 2023†^(Unaudited) (continued)
| | Shares | | Value |
| Short-Term Investment 0.2% |
| Unaffiliated Investment Company 0.2% |
| United States 0.2% |
| Invesco Government & Agency Portfolio, 5.357% (e)(f) | 1,624,750 | | $ 1,624,750 |
Total Short-Term Investment
(Cost $1,624,750) | | | 1,624,750 |
Total Investments
(Cost $1,262,823,896) | 101.5% | | 1,145,513,324 |
| Other Assets, Less Liabilities | (1.5) | | (16,634,113) |
| Net Assets | 100.0% | | $ 1,128,879,211 |
| † | Percentages indicated are based on Fund net assets. |
| ^ | Industry and country classifications may be different than those used for compliance monitoring purposes. |
| (a) | Non-income producing security. |
| (b) | All or a portion of this security was held on loan. As of October 31, 2023, the aggregate market value of securities on loan was $1,592,344. The Fund received cash collateral with a value of $1,624,750. (See Note 2(I)) |
| (c) | Illiquid security—As of October 31, 2023, the total market value deemed illiquid under procedures approved by the Board of Trustees was $110,210, which represented less than one-tenth of a percent of the Fund’s net assets. |
| (d) | Security in which significant unobservable inputs (Level 3) were used in determining fair value. |
| (e) | Current yield as of October 31, 2023. |
| (f) | Represents a security purchased with cash collateral received for securities on loan. |
Investments in Affiliates (in 000's)
Investments in issuers considered to be affiliate(s) of the Fund during the six-month period ended October 31, 2023 for purposes of Section 2(a)(3) of the Investment Company Act of 1940, as amended, were as follows:
| Affiliated Investment Companies | Value,
Beginning
of Period | Purchases
at Cost | Proceeds
from
Sales | Net
Realized
Gain/(Loss)
on Sales | Change in
Unrealized
Appreciation/
(Depreciation) | Value,
End of
Period | Dividend
Income | Other
Distributions | Shares
End of
Period |
| MainStay U.S. Government Liquidity Fund | $ 8,287 | $ 139,108 | $ (147,395) | $ — | $ — | $ — | $ 153 | $ — | — |
The notes to the financial statements are an integral part of, and should be read in conjunction with, the financial statements.
| 12 | MainStay CBRE Global Infrastructure Fund |
The following is a summary of the fair valuations according to the inputs used as of October 31, 2023, for valuing the Fund’s assets:
| Description | Quoted
Prices in
Active
Markets for
Identical
Assets
(Level 1) | | Significant
Other
Observable
Inputs
(Level 2) | | Significant
Unobservable
Inputs
(Level 3) | | Total |
| Asset Valuation Inputs | | | | | | | |
| Investments in Securities (a) | | | | | | | |
| Common Stocks | $ 1,143,778,364 | | $ — | | $ 110,210 | | $ 1,143,888,574 |
| Short-Term Investment | | | | | | | |
| Unaffiliated Investment Company | 1,624,750 | | — | | — | | 1,624,750 |
| Total Investments in Securities | $ 1,145,403,114 | | $ — | | $ 110,210 | | $ 1,145,513,324 |
| (a) | For a complete listing of investments and their industries, see the Portfolio of Investments. |
The table below sets forth the diversification of the Fund’s investments by sector.
Sector Diversification
| | Value | | Percent † ^ |
| Utilities | $ 496,927,074 | | 44.2% |
| Transportation | 333,771,412 | | 29.5 |
| Midstream / Pipelines | 159,886,640 | | 14.1 |
| Communications | 153,303,448 | | 13.5 |
| | 1,143,888,574 | | 101.3 |
| Short-Term Investment | 1,624,750 | | 0.2 |
| Other Assets, Less Liabilities | (16,634,113) | | (1.5) |
| Net Assets | $1,128,879,211 | | 100.0% |
| † | Percentages indicated are based on Fund net assets. |
| ^ | Industry and country classifications may be different than those used for compliance monitoring purposes. |
The notes to the financial statements are an integral part of, and should be read in conjunction with, the financial statements.
13
Statement of Assets and Liabilities as of October 31, 2023 (Unaudited)
| Assets |
Investment in securities, at value
(identified cost $1,262,823,896) including securities on loan of $1,592,344 | $1,145,513,324 |
Cash denominated in foreign currencies
(identified cost $125) | 125 |
| Receivables: | |
| Investment securities sold | 19,959,080 |
| Dividends | 2,120,554 |
| Fund shares sold | 1,363,268 |
| Securities lending | 332 |
| Other assets | 57,915 |
| Total assets | 1,169,014,598 |
| Liabilities |
| Cash collateral received for securities on loan | 1,624,750 |
| Due to custodian | 16,578,501 |
| Payables: | |
| Fund shares redeemed | 18,583,248 |
| Investment securities purchased | 1,998,277 |
| Manager (See Note 3) | 729,507 |
| Transfer agent (See Note 3) | 454,919 |
| Professional fees | 60,589 |
| Custodian | 41,526 |
| NYLIFE Distributors (See Note 3) | 30,589 |
| Shareholder communication | 28,757 |
| Trustees | 4,652 |
| Accrued expenses | 72 |
| Total liabilities | 40,135,387 |
| Net assets | $1,128,879,211 |
| Composition of Net Assets |
| Shares of beneficial interest outstanding (par value of $.001 per share) unlimited number of shares authorized | $ 103,102 |
| Additional paid-in-capital | 1,558,087,170 |
| | 1,558,190,272 |
| Total distributable earnings (loss) | (429,311,061) |
| Net assets | $1,128,879,211 |
| Class A | |
| Net assets applicable to outstanding shares | $ 80,081,528 |
| Shares of beneficial interest outstanding | 7,320,561 |
| Net asset value per share outstanding | $ 10.94 |
| Maximum sales charge (5.50% of offering price) | 0.64 |
| Maximum offering price per share outstanding | $ 11.58 |
| Investor Class | |
| Net assets applicable to outstanding shares | $ 1,902,745 |
| Shares of beneficial interest outstanding | 174,013 |
| Net asset value per share outstanding | $ 10.93 |
| Maximum sales charge (5.00% of offering price) | 0.58 |
| Maximum offering price per share outstanding | $ 11.51 |
| Class C | |
| Net assets applicable to outstanding shares | $ 15,329,169 |
| Shares of beneficial interest outstanding | 1,408,129 |
| Net asset value and offering price per share outstanding | $ 10.89 |
| Class I | |
| Net assets applicable to outstanding shares | $1,030,925,863 |
| Shares of beneficial interest outstanding | 94,141,268 |
| Net asset value and offering price per share outstanding | $ 10.95 |
| Class R6 | |
| Net assets applicable to outstanding shares | $ 639,906 |
| Shares of beneficial interest outstanding | 58,429 |
| Net asset value and offering price per share outstanding | $ 10.95 |
The notes to the financial statements are an integral part of, and should be read in conjunction with, the financial statements.
| 14 | MainStay CBRE Global Infrastructure Fund |
Statement of Operations for the six months ended October 31, 2023 (Unaudited)
| Investment Income (Loss) |
| Income | |
| Dividends-unaffiliated (net of foreign tax withholding of $1,621,396) | $ 32,705,809 |
| Securities lending, net | 159,789 |
| Dividends-affiliated | 153,202 |
| Total income | 33,018,800 |
| Expenses | |
| Manager (See Note 3) | 6,882,271 |
| Transfer agent (See Note 3) | 1,159,787 |
| Distribution/Service—Class A (See Note 3) | 116,839 |
| Distribution/Service—Investor Class (See Note 3) | 2,657 |
| Distribution/Service—Class C (See Note 3) | 90,631 |
| Professional fees | 83,508 |
| Custodian | 75,579 |
| Registration | 59,911 |
| Shareholder communication | 48,291 |
| Interest expense | 45,194 |
| Trustees | 25,970 |
| Miscellaneous | 53,400 |
| Total expenses before waiver/reimbursement | 8,644,038 |
| Expense waiver/reimbursement from Manager (See Note 3) | (491,548) |
| Net expenses | 8,152,490 |
| Net investment income (loss) | 24,866,310 |
| Realized and Unrealized Gain (Loss) |
| Net realized gain (loss) on: | |
| Unaffiliated investment transactions | (40,860,052) |
| Foreign currency transactions | (416,501) |
| Net realized gain (loss) | (41,276,553) |
| Net change in unrealized appreciation (depreciation) on: | |
| Unaffiliated investments | (204,734,551) |
| Translation of other assets and liabilities in foreign currencies | (39,538) |
| Net change in unrealized appreciation (depreciation) | (204,774,089) |
| Net realized and unrealized gain (loss) | (246,050,642) |
| Net increase (decrease) in net assets resulting from operations | $(221,184,332) |
The notes to the financial statements are an integral part of, and should be read in conjunction with, the financial statements.
15
Statements of Changes in Net Assets
for the six months ended October 31, 2023 (Unaudited) and the year ended April 30, 2023
| | Six months
ended
October 31,
2023 | Year
ended
April 30,
2023 |
| Increase (Decrease) in Net Assets |
| Operations: | | |
| Net investment income (loss) | $ 24,866,310 | $ 33,878,395 |
| Net realized gain (loss) | (41,276,553) | (54,492,022) |
| Net change in unrealized appreciation (depreciation) | (204,774,089) | 37,646,073 |
| Net increase (decrease) in net assets resulting from operations | (221,184,332) | 17,032,446 |
| Distributions to shareholders: | | |
| Class A | (1,347,758) | (2,556,120) |
| Investor Class | (30,154) | (62,277) |
| Class C | (189,328) | (402,553) |
| Class I | (23,086,922) | (53,898,639) |
| Class R6 | (11,999) | (278,160) |
| Total distributions to shareholders | (24,666,161) | (57,197,749) |
| Capital share transactions: | | |
| Net proceeds from sales of shares | 219,378,650 | 1,009,200,139 |
| Net asset value of shares issued to shareholders in reinvestment of distributions | 18,753,369 | 39,221,114 |
| Cost of shares redeemed | (971,665,270) | (553,345,710) |
| Increase (decrease) in net assets derived from capital share transactions | (733,533,251) | 495,075,543 |
| Net increase (decrease) in net assets | (979,383,744) | 454,910,240 |
| Net Assets |
| Beginning of period | 2,108,262,955 | 1,653,352,715 |
| End of period | $1,128,879,211 | $2,108,262,955 |
The notes to the financial statements are an integral part of, and should be read in conjunction with, the financial statements.
| 16 | MainStay CBRE Global Infrastructure Fund |
Financial Highlights selected per share data and ratios
| | Six months ended
October 31, | | Year Ended April 30, | | November 1,
2019 through
April 30, | | Year Ended October 31, |
| Class A | 2023 * | | 2023 | | 2022 | | 2021 | | 2020 # | | 2019 | | 2018 |
| Net asset value at beginning of period | $ 12.80 | | $ 13.11 | | $ 12.81 | | $ 10.39 | | $ 11.99 | | $ 10.04 | | $ 11.40 |
| Net investment income (loss) | 0.16(a) | | 0.19(a) | | 0.23(a) | | 0.16(a) | | 0.07(a) | | 0.16 | | 0.19 |
| Net realized and unrealized gain (loss) | (1.85) | | (0.17) | | 0.26 | | 2.42 | | (1.30) | | 2.12 | | (0.51) |
| Total from investment operations | (1.69) | | 0.02 | | 0.49 | | 2.58 | | (1.23) | | 2.28 | | (0.32) |
| Less distributions: | | | | | | | | | | | | | |
| From net investment income | (0.17) | | (0.21) | | (0.19) | | (0.16) | | (0.06) | | (0.17) | | (0.25) |
| From net realized gain on investments | — | | (0.12) | | — | | — | | (0.29) | | (0.16) | | (0.79) |
| Return of capital | — | | — | | — | | — | | (0.02) | | — | | — |
| Total distributions | (0.17) | | (0.33) | | (0.19) | | (0.16) | | (0.37) | | (0.33) | | (1.04) |
| Net asset value at end of period | $ 10.94 | | $ 12.80 | | $ 13.11 | | $ 12.81 | | $ 10.39 | | $ 11.99 | | $ 10.04 |
| Total investment return (b) | (13.28)% | | 0.33% | | 3.91% | | 25.04% | | (10.57)% | | 23.24% | | (3.16)% |
| Ratios (to average net assets)/Supplemental Data: | | | | | | | | | | | | | |
| Net investment income (loss) | 2.64%†† | | 1.50% | | 1.75% | | 1.35% | | 1.32%†† | | 1.51% | | 1.89% |
| Net expenses | 1.29%†† (c)(d) | | 1.27%(d) | | 1.26%(d) | | 1.29%(d) | | 1.32%†† (d)(e) | | 1.35% | | 1.35% |
| Expenses (before waiver/reimbursement) | 1.29%†† (c)(d) | | 1.27%(d) | | 1.26%(d) | | 1.35%(d) | | 1.54%†† (d)(e) | | 1.56% | | 1.83% |
| Portfolio turnover rate | 18% | | 43% | | 32% | | 51% | | 49% | | 53% | | 61% |
| Net assets at end of period (in 000's) | $ 80,082 | | $ 102,258 | | $ 88,715 | | $ 45,642 | | $ 11,237 | | $ 11,700 | | $ 1,787 |
| * | Unaudited. |
| # | The Fund changed its fiscal year end from October 31 to April 30. |
| †† | Annualized. |
| (a) | Per share data based on average shares outstanding during the period. |
| (b) | Total investment return is calculated exclusive of sales charges and assumes the reinvestment of dividends and distributions. For periods of less than one year, total return is not annualized. |
| (c) | Net of interest expense of 0.01%. (See Note 6) |
| (d) | In addition to the fees and expenses which the Fund bears directly, it also indirectly bears a pro-rata share of the fees and expenses of the underlying funds in which it invests. Such indirect expenses are not included in the above expense ratios. |
| (e) | Net of interest expense of less than 0.01%. (See Note 6) |
The notes to the financial statements are an integral part of, and should be read in conjunction with, the financial statements.
17
Financial Highlights selected per share data and ratios
| | Six months ended
October 31, | | Year Ended April 30, | | February 24,
2020^ through
April 30, |
| Investor Class | 2023 * | | 2023 | | 2022 | | 2021 | | 2020 |
| Net asset value at beginning of period | $ 12.80 | | $ 13.11 | | $ 12.80 | | $ 10.38 | | $ 12.50 |
| Net investment income (loss) (a) | 0.16 | | 0.19 | | 0.23 | | 0.13 | | (0.00)‡ |
| Net realized and unrealized gain (loss) | (1.86) | | (0.17) | | 0.26 | | 2.43 | | (2.08) |
| Total from investment operations | (1.70) | | 0.02 | | 0.49 | | 2.56 | | (2.08) |
| Less distributions: | | | | | | | | | |
| From net investment income | (0.17) | | (0.21) | | (0.18) | | (0.14) | | (0.03) |
| From net realized gain on investments | — | | (0.12) | | — | | — | | — |
| Return of capital | — | | — | | — | | — | | (0.01) |
| Total distributions | (0.17) | | (0.33) | | (0.18) | | (0.14) | | (0.04) |
| Net asset value at end of period | $ 10.93 | | $ 12.80 | | $ 13.11 | | $ 12.80 | | $ 10.38 |
| Total investment return (b) | (13.37)% | | 0.34% | | 3.85% | | 24.87% | | (16.66)% |
| Ratios (to average net assets)/Supplemental Data: | | | | | | | | | |
| Net investment income (loss) | 2.60%†† | | 1.49% | | 1.77% | | 1.11% | | (0.12)%†† |
| Net expenses (c) | 1.33%††(d) | | 1.29% | | 1.31% | | 1.45% | | 1.45%†† |
| Expenses (before waiver/reimbursement) (c) | 1.33%††(d) | | 1.29% | | 1.31% | | 1.76% | | 1.67%†† |
| Portfolio turnover rate | 18% | | 43% | | 32% | | 51% | | 49% |
| Net assets at end of period (in 000's) | $ 1,903 | | $ 2,338 | | $ 2,430 | | $ 2,159 | | $ 106 |
| * | Unaudited. |
| ^ | Inception date. |
| ‡ | Less than one cent per share. |
| †† | Annualized. |
| (a) | Per share data based on average shares outstanding during the period. |
| (b) | Total investment return is calculated exclusive of sales charges and assumes the reinvestment of dividends and distributions. For periods of less than one year, total return is not annualized. |
| (c) | In addition to the fees and expenses which the Fund bears directly, it also indirectly bears a pro-rata share of the fees and expenses of the underlying funds in which it invests. Such indirect expenses are not included in the above expense ratios. |
| (d) | Net of interest expense of 0.01%. (See Note 6) |
The notes to the financial statements are an integral part of, and should be read in conjunction with, the financial statements.
| 18 | MainStay CBRE Global Infrastructure Fund |
Financial Highlights selected per share data and ratios
| | Six months ended
October 31, | | Year Ended April 30, | | November 1,
2019 through
April 30,
2020# | | February 28,
2019^
through
October 31, |
| Class C | 2023 * | | 2023 | | 2022 | | 2021 | | 2019 |
| Net asset value at beginning of period | $ 12.74 | | $ 13.04 | | $ 12.75 | | $ 10.37 | | $ 11.96 | | $ 10.82 |
| Net investment income (loss) (a) | 0.11 | | 0.09 | | 0.12 | | 0.06 | | 0.03 | | 0.04 |
| Net realized and unrealized gain (loss) | (1.84) | | (0.16) | | 0.27 | | 2.42 | | (1.29) | | 1.22 |
| Total from investment operations | (1.73) | | (0.07) | | 0.39 | | 2.48 | | (1.26) | | 1.26 |
| Less distributions: | | | | | | | | | | | |
| From net investment income | (0.12) | | (0.11) | | (0.10) | | (0.10) | | (0.03) | | (0.12) |
| From net realized gain on investments | — | | (0.12) | | — | | — | | (0.29) | | — |
| Return of capital | — | | — | | — | | — | | (0.01) | | — |
| Total distributions | (0.12) | | (0.23) | | (0.10) | | (0.10) | | (0.33) | | (0.12) |
| Net asset value at end of period | $ 10.89 | | $ 12.74 | | $ 13.04 | | $ 12.75 | | $ 10.37 | | $ 11.96 |
| Total investment return (b) | (13.63)% | | (0.42)% | | 3.11% | | 24.04% | | (10.89)% | | 11.67% |
| Ratios (to average net assets)/Supplemental Data: | | | | | | | | | | | |
| Net investment income (loss) | 1.86%†† | | 0.74% | | 0.89% | | 0.52% | | 0.58%†† | | 0.46%†† |
| Net expenses | 2.08%†† (c)(d) | | 2.04%(d) | | 2.06%(d) | | 2.08%(d) | | 2.09%†† (d)(e) | | 2.10%†† |
| Expenses (before waiver/reimbursement) | 2.08%†† (c)(d) | | 2.04%(d) | | 2.06%(d) | | 2.51%(d) | | 2.36%†† (d)(e) | | 2.31%†† |
| Portfolio turnover rate | 18% | | 43% | | 32% | | 51% | | 49% | | 53% |
| Net assets at end of period (in 000’s) | $ 15,329 | | $ 20,401 | | $ 24,119 | | $ 11,522 | | $ 992 | | $ 1,048 |
| * | Unaudited. |
| # | The Fund changed its fiscal year end from October 31 to April 30. |
| ^ | Inception date. |
| †† | Annualized. |
| (a) | Per share data based on average shares outstanding during the period. |
| (b) | Total investment return is calculated exclusive of sales charges and assumes the reinvestment of dividends and distributions. For periods of less than one year, total return is not annualized. |
| (c) | Net of interest expense of 0.01%. (See Note 6) |
| (d) | In addition to the fees and expenses which the Fund bears directly, it also indirectly bears a pro-rata share of the fees and expenses of the underlying funds in which it invests. Such indirect expenses are not included in the above expense ratios. |
| (e) | Net of interest expense of less than 0.01%. (See Note 6) |
The notes to the financial statements are an integral part of, and should be read in conjunction with, the financial statements.
19
Financial Highlights selected per share data and ratios
| | Six months ended
October 31, | | Year Ended April 30, | | November 1,
2019 through
April 30,
2020# | | Year Ended October 31, |
| Class I | 2023 * | | 2023 | | 2022 | | 2021 | | 2019 | | 2018 |
| Net asset value at beginning of period | $ 12.81 | | $ 13.12 | | $ 12.82 | | $ 10.39 | | $ 11.99 | | $ 10.04 | | $ 11.40 |
| Net investment income (loss) | 0.19(a) | | 0.22(a) | | 0.27(a) | | 0.21(a) | | 0.09(a) | | 0.20 | | 0.23 |
| Net realized and unrealized gain (loss) | (1.86) | | (0.16) | | 0.26 | | 2.41 | | (1.30) | | 2.11 | | (0.52) |
| Total from investment operations | (1.67) | | 0.06 | | 0.53 | | 2.62 | | (1.21) | | 2.31 | | (0.29) |
| Less distributions: | | | | | | | | | | | | | |
| From net investment income | (0.19) | | (0.25) | | (0.23) | | (0.19) | | (0.08) | | (0.20) | | (0.28) |
| From net realized gain on investments | — | | (0.12) | | — | | — | | (0.29) | | (0.16) | | (0.79) |
| Return of capital | — | | — | | — | | — | | (0.02) | | — | | — |
| Total distributions | (0.19) | | (0.37) | | (0.23) | | (0.19) | | (0.39) | | (0.36) | | (1.07) |
| Net asset value at end of period | $ 10.95 | | $ 12.81 | | $ 13.12 | | $ 12.82 | | $ 10.39 | | $ 11.99 | | $ 10.04 |
| Total investment return (b) | (13.13)% | | 0.63% | | 4.19% | | 25.46% | | (10.46)% | | 23.52% | | (2.88)% |
| Ratios (to average net assets)/Supplemental Data: | | | | | | | | | | | | | |
| Net investment income (loss) | 3.11%†† | | 1.79% | | 2.09% | | 1.78% | | 1.59%†† | | 1.83% | | 2.14% |
| Net expenses | 0.97%†† (c)(d) | | 0.97%(d) | | 0.97%(d) | | 0.97%(d) | | 1.05%†† (d)(e) | | 1.10% | | 1.10% |
| Expenses (before waiver/reimbursement) | 1.04%†† (c)(d) | | 1.02%(d) | | 1.01%(d) | | 1.10%(d) | | 1.18%†† (d)(e) | | 1.14% | | 1.41% |
| Portfolio turnover rate | 18% | | 43% | | 32% | | 51% | | 49% | | 53% | | 61% |
| Net assets at end of period (in 000's) | $ 1,030,926 | | $ 1,982,388 | | $ 1,527,548 | | $ 465,299 | | $ 208,291 | | $ 225,176 | | $ 71,919 |
| * | Unaudited. |
| # | The Fund changed its fiscal year end from October 31 to April 30. |
| †† | Annualized. |
| (a) | Per share data based on average shares outstanding during the period. |
| (b) | Total investment return is calculated exclusive of sales charges and assumes the reinvestment of dividends and distributions. Class I shares are not subject to sales charges. For periods of less than one year, total return is not annualized. |
| (c) | Net of interest expense of 0.01%. (See Note 6) |
| (d) | In addition to the fees and expenses which the Fund bears directly, it also indirectly bears a pro-rata share of the fees and expenses of the underlying funds in which it invests. Such indirect expenses are not included in the above expense ratios. |
| (e) | Net of interest expense of less than 0.01%. (See Note 6) |
The notes to the financial statements are an integral part of, and should be read in conjunction with, the financial statements.
| 20 | MainStay CBRE Global Infrastructure Fund |
Financial Highlights selected per share data and ratios
| | Six months ended
October 31, | | Year Ended April 30, | | February 24,
2020^ through
April 30, |
| Class R6 | 2023 * | | 2023 | | 2022 | | 2021 | | 2020 |
| Net asset value at beginning of period | $ 12.82 | | $ 13.12 | | $ 12.82 | | $ 10.39 | | $ 12.51 |
| Net investment income (loss) (a) | 0.19 | | 0.23 | | 0.35 | | 0.17 | | 0.02 |
| Net realized and unrealized gain (loss) | (1.86) | | (0.15) | | 0.19 | | 2.45 | | (2.11) |
| Total from investment operations | (1.67) | | 0.08 | | 0.54 | | 2.62 | | (2.09) |
| Less distributions: | | | | | | | | | |
| From net investment income | (0.20) | | (0.26) | | (0.24) | | (0.19) | | (0.02) |
| From net realized gain on investments | — | | (0.12) | | — | | — | | — |
| Return of capital | — | | — | | — | | — | | (0.01) |
| Total distributions | (0.20) | | (0.38) | | (0.24) | | (0.19) | | (0.03) |
| Net asset value at end of period | $ 10.95 | | $ 12.82 | | $ 13.12 | | $ 12.82 | | $ 10.39 |
| Total investment return (b) | (13.16)% | | 0.78% | | 4.23% | | 25.50% | | (16.65)% |
| Ratios (to average net assets)/Supplemental Data: | | | | | | | | | |
| Net investment income (loss) | 3.08%†† | | 1.80% | | 2.63% | | 1.47% | | 0.85%†† |
| Net expenses (c) | 0.90%††(d) | | 0.89% | | 0.91% | | 0.95% | | 0.95%†† |
| Expenses (before waiver/reimbursement) (c) | 0.90%††(d) | | 0.89% | | 0.91% | | 1.02% | | 1.13%†† |
| Portfolio turnover rate | 18% | | 43% | | 32% | | 51% | | 49% |
| Net assets at end of period (in 000's) | $ 640 | | $ 878 | | $ 10,541 | | $ 350 | | $ 21 |
| * | Unaudited. |
| ^ | Inception date. |
| †† | Annualized. |
| (a) | Per share data based on average shares outstanding during the period. |
| (b) | Total investment return is calculated exclusive of sales charges and assumes the reinvestment of dividends and distributions. Class R6 shares are not subject to sales charges. For periods of less than one year, total return is not annualized. |
| (c) | In addition to the fees and expenses which the Fund bears directly, it also indirectly bears a pro-rata share of the fees and expenses of the underlying funds in which it invests. Such indirect expenses are not included in the above expense ratios. |
| (d) | Net of interest expense of 0.01%. (See Note 6) |
The notes to the financial statements are an integral part of, and should be read in conjunction with, the financial statements.
21
Notes to Financial Statements (Unaudited)
Note 1-Organization and Business
MainStay Funds Trust (the “Trust”) was organized as a Delaware statutory trust on April 28, 2009. The Trust is registered under the Investment Company Act of 1940, as amended (the “1940 Act”), as an open-end management investment company, and is comprised of thirty-seven funds (collectively referred to as the “Funds”). These financial statements and notes relate to the MainStay CBRE Global Infrastructure Fund (the "Fund"), a “diversified” fund, as that term is defined in the 1940 Act, as interpreted or modified by regulatory authorities having jurisdiction, from time to time.
The following table lists the Fund's share classes that have been registered and commenced operations:
| Class | Commenced Operations |
| Class A | October 16, 2013 |
| Investor Class | February 24, 2020 |
| Class C | February 28, 2019 |
| Class I | June 28, 2013 |
| Class R6 | February 24, 2020 |
Class A and Investor Class shares are offered at net asset value (“NAV”) per share plus an initial sales charge. No initial sales charge applies to investments of $1 million or more (and certain other qualified purchases) in Class A and Investor Class shares. However, a contingent deferred sales charge (“CDSC”) of 1.00% may be imposed on certain redemptions made within 18 months of the date of purchase on shares that were purchased without an initial sales charge. Class C shares are offered at NAV without an initial sales charge, although a 1.00% CDSC may be imposed on certain redemptions of such shares made within one year of the date of purchase of Class C shares. Class I and Class R6 shares are offered at NAV without a sales charge. In addition, depending upon eligibility, Class C shares convert to either Class A or Investor Class shares at the end of the calendar quarter eight years after the date they were purchased. Additionally, Investor Class shares may convert automatically to Class A shares. Under certain circumstances and as may be permitted by the Trust’s multiple class plan pursuant to Rule 18f-3 under the 1940 Act, specified share classes of the Fund may be converted to one or more other share classes of the Fund as disclosed in the capital share transactions within these Notes. The classes of shares have the same voting (except for issues that relate solely to one class), dividend, liquidation and other rights, and the same terms and conditions, except that under distribution plans pursuant to Rule 12b-1 under the 1940 Act, Class C shares are subject to higher distribution and/or service fees than Class A and Investor Class shares. Class I and Class R6 shares are not subject to a distribution and/or service fee.
The Fund's investment objective is to seek total return.
Note 2–Significant Accounting Policies
The Fund is an investment company and accordingly follows the investment company accounting and reporting guidance of the Financial Accounting Standards Board (“FASB”) Accounting Standards Codification
Topic 946 Financial Services—Investment Companies. The Fund prepares its financial statements in accordance with generally accepted accounting principles (“GAAP”) in the United States of America and follows the significant accounting policies described below.
(A) Securities Valuation. Investments are usually valued as of the close of regular trading on the New York Stock Exchange (the "Exchange") (usually 4:00 p.m. Eastern time) on each day the Fund is open for business ("valuation date").
Pursuant to Rule 2a-5 under the 1940 Act, the Board of Trustees of the Trust (the "Board") has designated New York Life Investment Management LLC (“New York Life Investments” or the "Manager") as its Valuation Designee (the "Valuation Designee"). The Valuation Designee is responsible for performing fair valuations relating to all investments in the Fund’s portfolio for which market quotations are not readily available; periodically assessing and managing material valuation risks; establishing and applying fair value methodologies; testing fair valuation methodologies; evaluating and overseeing pricing services; ensuring appropriate segregation of valuation and portfolio management functions; providing quarterly, annual and prompt reporting to the Board, as appropriate; identifying potential conflicts of interest; and maintaining appropriate records. The Valuation Designee has established a valuation committee ("Valuation Committee") to assist in carrying out the Valuation Designee’s responsibilities and establish prices of securities for which market quotations are not readily available. The Fund's and the Valuation Designee's policies and procedures ("Valuation Procedures") govern the Valuation Designee’s selection and application of methodologies for determining and calculating the fair value of Fund investments. The Valuation Designee may value the Fund's portfolio securities for which market quotations are not readily available and other Fund assets utilizing inputs from pricing services and other third-party sources. The Valuation Committee meets (in person, via electronic mail or via teleconference) on an ad-hoc basis to determine fair valuations and on a quarterly basis to review fair value events with respect to certain securities for which market quotations are not readily available, including valuation risks and back-testing results, and preview reports to the Board.
The Valuation Committee establishes prices of securities for which market quotations are not readily available based on such methodologies and measurements on a regular basis after considering information that is reasonably available and deemed relevant by the Valuation Committee. The Board shall oversee the Valuation Designee and review fair valuation materials on a prompt, quarterly and annual basis and approve proposed revisions to the Valuation Procedures.
Investments for which market quotations are not readily available are valued at fair value as determined in good faith pursuant to the Valuation Procedures. A market quotation is readily available only when that quotation is a quoted price (unadjusted) in active markets for identical investments that the Fund can access at the measurement date, provided that a quotation will not be readily available if it is not reliable. "Fair value" is defined as the price the Fund would reasonably expect to receive upon selling an asset or liability in an orderly transaction to an independent
| 22 | MainStay CBRE Global Infrastructure Fund |
buyer in the principal or most advantageous market for the asset or liability. Fair value measurements are determined within a framework that establishes a three-tier hierarchy that maximizes the use of observable market data and minimizes the use of unobservable inputs to establish a classification of fair value measurements for disclosure purposes. "Inputs" refer broadly to the assumptions that market participants would use in pricing the asset or liability, including assumptions about risk, such as the risk inherent in a particular valuation technique used to measure fair value using a pricing model and/or the risk inherent in the inputs for the valuation technique. Inputs may be observable or unobservable. Observable inputs reflect the assumptions market participants would use in pricing the asset or liability based on market data obtained from sources independent of the Fund. Unobservable inputs reflect the Fund’s own assumptions about the assumptions market participants would use in pricing the asset or liability based on the information available. The inputs or methodology used for valuing assets or liabilities may not be an indication of the risks associated with investing in those assets or liabilities. The three-tier hierarchy of inputs is summarized below.
| • | Level 1—quoted prices (unadjusted) in active markets for an identical asset or liability |
| • | Level 2—other significant observable inputs (including quoted prices for a similar asset or liability in active markets, interest rates and yield curves, prepayment speeds, credit risk, etc.) |
| • | Level 3—significant unobservable inputs (including the Fund's own assumptions about the assumptions that market participants would use in measuring fair value of an asset or liability) |
The level of an asset or liability within the fair value hierarchy is based on the lowest level of an input, both individually and in the aggregate, that is significant to the fair value measurement. The aggregate value by input level of the Fund’s assets and liabilities as of October 31, 2023, is included at the end of the Portfolio of Investments.
The Fund may use third-party vendor evaluations, whose prices may be derived from one or more of the following standard inputs, among others:
| • Broker/dealer quotes | • Benchmark securities |
| • Two-sided markets | • Reference data (corporate actions or material event notices) |
| • Bids/offers | • Monthly payment information |
| • Industry and economic events | • Reported trades |
An asset or liability for which a market quotation is not readily available is valued by methods deemed reasonable in good faith by the Valuation Committee, following the Valuation Procedures to represent fair value. Under these procedures, the Valuation Designee generally uses a market-based approach which may use related or comparable assets or liabilities, recent transactions, market multiples, book values and other relevant information. The Valuation Designee may also use an income-based valuation approach in which the anticipated future cash flows of the asset or liability are discounted to calculate fair value. Discounts may also be applied due to the nature and/or duration of any
restrictions on the disposition of the asset or liability. Fair value represents a good faith approximation of the value of a security. Fair value determinations involve the consideration of a number of subjective factors, an analysis of applicable facts and circumstances and the exercise of judgment. As a result, it is possible that the fair value for a security determined in good faith in accordance with the Valuation Procedures may differ from valuations for the same security determined for other funds using their own valuation procedures. Although the Valuation Procedures are designed to value a security at the price the Fund may reasonably expect to receive upon the security's sale in an orderly transaction, there can be no assurance that any fair value determination thereunder would, in fact, approximate the amount that the Fund would actually realize upon the sale of the security or the price at which the security would trade if a reliable market price were readily available. During the six-month period ended October 31, 2023, there were no material changes to the fair value methodologies.
Securities which may be valued in this manner include, but are not limited to: (i) a security for which trading has been halted or suspended or otherwise does not have a readily available market quotation on a given day; (ii) a debt security that has recently gone into default and for which there is not a current market quotation; (iii) a security of an issuer that has entered into a restructuring; (iv) a security that has been delisted from a national exchange; (v) a security subject to trading collars for which no or limited trading takes place; and (vi) a security whose principal market has been temporarily closed at a time when, under normal conditions, it would be open. Securities valued in this manner are generally categorized as Level 2 or 3 in the hierarchy. As of October 31, 2023, securities that were fair valued in such a manner are shown in the Portfolio of Investments.
Certain securities held by the Fund may principally trade in foreign markets. Events may occur between the time the foreign markets close and the time at which the Fund's NAVs are calculated. These events may include, but are not limited to, situations relating to a single issuer in a market sector, significant fluctuations in U.S. or foreign markets, natural disasters, armed conflicts, governmental actions or other developments not tied directly to the securities markets. Should the Valuation Designee conclude that such events may have affected the accuracy of the last price of such securities reported on the local foreign market, the Valuation Designee may, pursuant to the Valuation Procedures, adjust the value of the local price to reflect the estimated impact on the price of such securities as a result of such events. In this instance, securities are generally categorized as Level 3 in the hierarchy. Additionally, certain foreign equity securities are also fair valued whenever the movement of a particular index exceeds certain thresholds. In such cases, the securities are fair valued by applying factors provided by a third-party vendor in accordance with the Valuation Procedures and are generally categorized as Level 2 in the hierarchy. No foreign equity securities held by the Fund as of October 31, 2023 were fair valued in such a manner.
If the principal market of certain foreign equity securities is closed in observance of a local foreign holiday, these securities are valued using the last closing price of regular trading on the relevant exchange and fair
Notes to Financial Statements (Unaudited) (continued)
valued by applying factors provided by a third-party vendor in accordance with the Valuation Procedures. These securities are generally categorized as Level 2 in the hierarchy. No securities held by the Fund as of October 31, 2023, were fair valued in such a manner.
Equity securities, rights and warrants, if applicable, are valued at the last quoted sales prices as of the close of regular trading on the relevant exchange on each valuation date. Securities that are not traded on the valuation date are valued at the mean of the last quoted bid and ask prices. Prices are normally taken from the principal market in which each security trades. These securities are generally categorized as Level 1 in the hierarchy.
Investments in mutual funds, including money market funds, are valued at their respective NAVs at the close of business each day on the valuation date. These securities are generally categorized as Level 1 in the hierarchy.
Temporary cash investments acquired in excess of 60 days to maturity at the time of purchase are valued using the latest bid prices or using valuations based on a matrix system (which considers such factors as security prices, yields, maturities and ratings), both as furnished by independent pricing services. Temporary cash investments that mature in 60 days or less at the time of purchase ("Short-Term Investments") are valued using the amortized cost method of valuation, unless the use of such method would be inappropriate. The amortized cost method involves valuing a security at its cost on the date of purchase and thereafter assuming a constant amortization to maturity of the difference between such cost and the value on maturity date. Amortized cost approximates the current fair value of a security. Securities valued using the amortized cost method are not valued using quoted prices in an active market and are generally categorized as Level 2 in the hierarchy.
The information above is not intended to reflect an exhaustive list of the methodologies that may be used to value portfolio investments. The Valuation Procedures permit the use of a variety of valuation methodologies in connection with valuing portfolio investments. The methodology used for a specific type of investment may vary based on the market data available or other considerations. The methodologies summarized above may not represent the specific means by which portfolio investments are valued on any particular business day.
A portfolio investment may be classified as an illiquid investment under the Trust's written liquidity risk management program and related procedures (“Liquidity Program”). Illiquidity of an investment might prevent the sale of such investment at a time when the Manager or the Subadvisor might wish to sell, and these investments could have the effect of decreasing the overall level of the Fund's liquidity. Further, the lack of an established secondary market may make it more difficult to value illiquid investments, requiring the Fund to rely on judgments that may be somewhat subjective in measuring value, which could vary materially from the amount that the Fund could realize upon disposition. Difficulty in selling illiquid investments may result in a loss or may be costly to the Fund. An illiquid investment is any investment that the Manager or Subadvisor reasonably expects cannot be sold or disposed of
in current market conditions in seven calendar days or less without the sale or disposition significantly changing the market value of the investment. The liquidity classification of each investment will be made using information obtained after reasonable inquiry and taking into account, among other things, relevant market, trading and investment-specific considerations in accordance with the Liquidity Program. Illiquid investments are often fair valued in accordance with the Fund's procedures described above. The liquidity of the Fund's investments was determined as of October 31, 2023, and can change at any time. Illiquid investments as of October 31, 2023, are shown in the Portfolio of Investments.
(B) Income Taxes. The Fund's policy is to comply with the requirements of the Internal Revenue Code of 1986, as amended (the “Internal Revenue Code”), applicable to regulated investment companies and to distribute all of its taxable income to the shareholders of the Fund within the allowable time limits.
The Manager evaluates the Fund’s tax positions to determine if the tax positions taken meet the minimum recognition threshold in connection with accounting for uncertainties in income tax positions taken or expected to be taken for the purposes of measuring and recognizing tax liabilities in the financial statements. Recognition of tax benefits of an uncertain tax position is permitted only to the extent the position is “more likely than not” to be sustained assuming examination by taxing authorities. The Manager analyzed the Fund's tax positions taken on federal, state and local income tax returns for all open tax years (for up to three tax years) and has concluded that no provisions for federal, state and local income tax are required in the Fund's financial statements. The Fund's federal, state and local income tax and federal excise tax returns for tax years for which the applicable statutes of limitations have not expired are subject to examination by the Internal Revenue Service and state and local departments of revenue.
(C) Foreign Taxes. The Fund may be subject to foreign taxes on income and other transaction-based taxes imposed by certain countries in which it invests. A portion of the taxes on gains on investments or currency purchases/repatriation may be reclaimable. The Fund will accrue such taxes and reclaims as applicable, based upon its current interpretation of tax rules and regulations that exist in the markets in which it invests.
The Fund may be subject to taxation on realized capital gains, repatriation proceeds and other transaction-based taxes imposed by certain countries in which it invests. The Fund will accrue such taxes as applicable based upon its current interpretation of tax rules and regulations that exist in the market in which it invests. Capital gains taxes relating to positions still held are reflected as a liability in the Statement of Assets and Liabilities, as well as an adjustment to the Fund's net unrealized appreciation (depreciation). Taxes related to capital gains realized, if any, are reflected as part of net realized gain (loss) in the Statement of Operations. Changes in tax liabilities related to capital gains taxes on unrealized investment gains, if any, are reflected as part of the change in net unrealized appreciation (depreciation) on investments in the Statement of
| 24 | MainStay CBRE Global Infrastructure Fund |
Operations. Transaction-based charges are generally assessed as a percentage of the transaction amount.
(D) Dividends and Distributions to Shareholders. Dividends and distributions are recorded on the ex-dividend date. The Fund intends to declare and pay dividends from net investment income, if any, at least quarterly and distributions from net realized capital and currency gains, if any, at least annually. Unless a shareholder elects otherwise, all dividends and distributions are reinvested at NAV in the same class of shares of the Fund. Dividends and distributions to shareholders are determined in accordance with federal income tax regulations and may differ from determinations using GAAP.
(E) Security Transactions and Investment Income. The Fund records security transactions on the trade date. Realized gains and losses on security transactions are determined using the identified cost method. Dividend income is recognized on the ex-dividend date, net of any foreign tax withheld at the source, and interest income is accrued as earned using the effective interest rate method. Distributions received from real estate investment trusts may be classified as dividends, capital gains and/or return of capital.
The Fund may also invest up to 25% of its net assets in master limited partnerships.
Investment income and realized and unrealized gains and losses on investments of the Fund are allocated pro rata to the separate classes of shares based upon their relative net assets on the date the income is earned or realized and unrealized gains and losses are incurred.
(F) Expenses. Expenses of the Trust are allocated to the individual Funds in proportion to the net assets of the respective Funds when the expenses are incurred, except where direct allocations of expenses can be made. Expenses (other than transfer agent expenses and fees incurred under the shareholder services plans and/or the distribution plans further discussed in Note 3(B)) are allocated to separate classes of shares pro rata based upon their relative net assets on the date the expenses are incurred. The expenses borne by the Fund, including those of related parties to the Fund, are shown in the Statement of Operations.
Additionally, the Fund may invest in mutual funds, which are subject to management fees and other fees that may cause the costs of investing in mutual funds to be greater than the costs of owning the underlying securities directly. These indirect expenses of mutual funds are not included in the amounts shown as expenses in the Statement of Operations or in the expense ratios included in the Financial Highlights.
(G) Use of Estimates. In preparing financial statements in conformity with GAAP, the Manager makes estimates and assumptions that affect the reported amounts and disclosures in the financial statements. Actual results could differ from those estimates and assumptions.
(H) Foreign Currency Transactions. The Fund's books and records are maintained in U.S. dollars. Prices of securities denominated in foreign currency amounts are translated into U.S. dollars at the mean between
the buying and selling rates last quoted by any major U.S. bank at the following dates:
(i) market value of investment securities, other assets and liabilities— at the valuation date; and
(ii) purchases and sales of investment securities, income and expenses—at the date of such transactions.
The assets and liabilities that are denominated in foreign currency amounts are presented at the exchange rates and market values at the close of the period. The realized and unrealized changes in net assets arising from fluctuations in exchange rates and market prices of securities are not separately presented.
Net realized gain (loss) on foreign currency transactions represents net currency gains or losses realized as a result of differences between the amounts of securities sale proceeds or purchase cost, dividends, interest and withholding taxes as recorded on the Fund's books, and the U.S. dollar equivalent amount actually received or paid. Net currency gains or losses from valuing such foreign currency denominated assets and liabilities, other than investments at valuation date exchange rates, are reflected in unrealized foreign exchange gains or losses.
(I) Securities Lending. In order to realize additional income, the Fund may engage in securities lending, subject to the limitations set forth in the 1940 Act and relevant guidance by the staff of the Securities and Exchange Commission (“SEC”). If the Fund engages in securities lending, the Fund will lend through its custodian, JPMorgan Chase Bank, N.A., ("JPMorgan"), acting as securities lending agent on behalf of the Fund. Under the current arrangement, JPMorgan will manage the Fund's collateral in accordance with the securities lending agency agreement between the Fund and JPMorgan, and indemnify the Fund against counterparty risk. The loans will be collateralized by cash (which may be invested in a money market fund) and/or non-cash collateral (which may include U.S. Treasury securities and/or U.S. government agency securities issued or guaranteed by the United States government or its agencies or instrumentalities) at least equal at all times to the market value of the securities loaned. The Fund bears the risk of delay in recovery of, or loss of rights in, the securities loaned. The Fund may also record a realized gain or loss on securities deemed sold due to a borrower’s inability to return securities on loan. The Fund bears the risk of any loss on investment of cash collateral. The Fund will receive compensation for lending its securities in the form of fees or it will retain a portion of interest earned on the investment of any cash collateral. The Fund will also continue to receive interest and dividends on the securities loaned and any gain or loss in the market price of the securities loaned that may occur during the term of the loan will be for the account of the Fund. Income earned from securities lending activities, if any, is reflected in the Statement of Operations. Securities on loan as of October 31, 2023, are shown in the Portfolio of Investments.
(J) Foreign Securities Risk. The Fund may invest in foreign securities, which carry certain risks that are in addition to the usual risks inherent in domestic securities. Foreign regulatory regimes and securities
Notes to Financial Statements (Unaudited) (continued)
markets can have less stringent investor protections and disclosure standards and less liquid trading markets than U.S. regulatory regimes and securities markets, and can experience political, social and economic developments that may affect the value of investments in foreign securities. These risks include those resulting from currency fluctuations, future adverse political or economic developments and possible imposition of currency exchange blockages or other foreign governmental laws or restrictions. Economic sanctions and other similar governmental actions or developments could, among other things, effectively restrict or eliminate the Fund's ability to purchase or sell certain foreign securities or groups of foreign securities, and thus may make the Fund's investments in such securities less liquid or more difficult to value. These risks are likely to be greater in emerging markets than in developed markets. The ability of issuers of debt securities held by the Fund to meet their obligations may be affected by, among other things, economic or political developments in a specific country, industry or region.
(K) Indemnifications. Under the Trust’s organizational documents, its officers and trustees are indemnified against certain liabilities that may arise out of performance of their duties to the Trust. Additionally, in the normal course of business, the Fund enters into contracts with third-party service providers that contain a variety of representations and warranties and that may provide general indemnifications. The Fund's maximum exposure under these arrangements is unknown, as this would involve future claims that may be made against the Fund that have not yet occurred. The Manager believes that the risk of loss in connection with these potential indemnification obligations is remote. However, there can be no assurance that material liabilities related to such obligations will not arise in the future, which could adversely impact the Fund.
Note 3–Fees and Related Party Transactions
(A) Manager and Subadvisor. New York Life Investments, a registered investment adviser and an indirect, wholly-owned subsidiary of New York Life Insurance Company ("New York Life"), serves as the Fund's Manager pursuant to an Amended and Restated Management Agreement ("Management Agreement"). The Manager provides offices, conducts clerical, recordkeeping and bookkeeping services and keeps most of the financial and accounting records required to be maintained by the Fund. Except for the portion of salaries and expenses that are the responsibility of the Fund, the Manager pays the salaries and expenses of all personnel affiliated with the Fund and certain operational expenses of the Fund. The Fund reimburses New York Life Investments in an amount equal to the portion of the compensation of the Chief Compliance Officer attributable to the Fund. CBRE Investment Management Listed Real Assets LLC ("CBRE" or the "Subadvisor"), a registered investment adviser, serves as the Subadvisor to the Fund and is responsible for the day-to-day portfolio management of the Fund. Pursuant to the terms of a Subadvisory Agreement ("Subadvisory Agreement") between New York Life Investments and CBRE, New York Life Investments pays for the services of the Subadvisor.
Effective August 28, 2023, pursuant to the Management Agreement, the Fund pays the Manager a monthly fee for the services performed and the facilities furnished at an annual rate of the Fund’s average daily net assets as follows: 0.85% on assets up to $3 billion and 0.84% on assets over $3 billion. During the six-month period ended October 31, 2023, the effective management fee rate was 0.85% of the Fund’s average daily net assets, exclusive of any applicable waivers/reimbursements.
Prior to August 28, 2023, pursuant to the Management Agreement, the Fund paid the Manager a monthly fee for the services performed and the facilities furnished at an annual rate of 0.85% of the Fund’s average daily net assets.
New York Life Investments has contractually agreed to waive fees and/or reimburse expenses so that Total Annual Fund Operating Expenses (excluding taxes, interest, litigation, extraordinary expenses, brokerage and other transaction expenses relating to the purchase or sale of portfolio investments and acquired (underlying) fund fees and expenses) do not exceed the following percentages of average daily net assets: Class A, 1.33%; Investor Class, 1.45%; Class C, 2.08%; Class I, 0.97%; and Class R6, 0.95%. This agreement will remain in effect until August 31, 2024, and shall renew automatically for one-year terms unless New York Life Investments provides written notice of termination prior to the start of the next term or upon approval of the Board.
During the six-month period ended October 31, 2023, New York Life Investments earned fees from the Fund in the amount of $6,882,271 and waived fees and/or reimbursed expenses, including the waiver/reimbursement of certain class specific expenses in the amount of $491,548 and paid the Subadvisor fees in the amount of $3,195,362.
JPMorgan provides sub-administration and sub-accounting services to the Fund pursuant to an agreement with New York Life Investments. These services include calculating the daily NAVs of the Fund, maintaining the general ledger and sub-ledger accounts for the calculation of the Fund's NAVs, and assisting New York Life Investments in conducting various aspects of the Fund's administrative operations. For providing these services to the Fund, JPMorgan is compensated by New York Life Investments.
Pursuant to an agreement between the Trust and New York Life Investments, New York Life Investments is responsible for providing or procuring certain regulatory reporting services for the Fund. The Fund will reimburse New York Life Investments for the actual costs incurred by New York Life Investments in connection with providing or procuring these services for the Fund.
(B) Distribution and Service Fees. The Trust, on behalf of the Fund, has entered into a distribution agreement with NYLIFE Distributors LLC (the “Distributor”), an affiliate of New York Life Investments. The Fund has adopted distribution plans (the “Plans”) in accordance with the provisions of Rule 12b-1 under the 1940 Act.
Pursuant to the Class A and Investor Class Plans, the Distributor receives a monthly fee from the Class A and Investor Class shares at an annual
| 26 | MainStay CBRE Global Infrastructure Fund |
rate of 0.25% of the average daily net assets of the Class A and Investor Class shares for distribution and/or service activities as designated by the Distributor. Pursuant to the Class C Plan, Class C shares pay the Distributor a monthly distribution fee at an annual rate of 0.75% of the average daily net assets of the Class C shares, along with a service fee at an annual rate of 0.25% of the average daily net assets of the Class C shares, for a total 12b-1 fee of 1.00%. Class I and Class R6 shares are not subject to a distribution and/or service fee.
The Plans provide that the distribution and service fees are payable to the Distributor regardless of the amounts actually expended by the Distributor for distribution of the Fund's shares and service activities.
(C) Sales Charges. The Fund was advised by the Distributor that the amount of initial sales charges retained on sales of Class A and Investor Class shares during the six-month period ended October 31, 2023, were $9,918 and $170, respectively.
The Fund was also advised that the Distributor retained CDSCs on redemptions of Class A and Class C shares during the six-month period ended October 31, 2023, of $1,984 and $569, respectively.
(D) Transfer, Dividend Disbursing and Shareholder Servicing Agent. NYLIM Service Company LLC, an affiliate of New York Life Investments, is the Fund's transfer, dividend disbursing and shareholder servicing agent pursuant to an agreement between NYLIM Service Company LLC and the Trust. NYLIM Service Company LLC has entered into an agreement with SS&C Global Investor & Distributor Solutions, Inc. ("SS&C"), pursuant to which SS&C performs certain transfer agent services on behalf of NYLIM Service Company LLC. New York Life Investments has contractually agreed to limit the transfer agency expenses charged to the Fund’s share classes to a maximum of 0.35% of that share class’s average daily net assets on an annual basis after deducting any applicable Fund or class-level expense reimbursement or small account fees. This agreement will remain in effect until August 31, 2024, and shall renew automatically for one-year terms unless New York Life Investments provides written notice of termination prior to the start of the next term or upon approval of the Board. During the six-month period ended October 31, 2023, transfer agent expenses incurred by the Fund and any reimbursements, pursuant to the aforementioned Transfer Agency expense limitation agreement, were as follows:
| Class | Expense | Waived |
| Class A | $ 68,084 | $— |
| Investor Class | 1,962 | — |
| Class C | 16,711 | — |
| Class I | 1,073,015 | — |
| Class R6 | 15 | — |
(E) Small Account Fee. Shareholders with small accounts adversely impact the cost of providing transfer agency services. In an effort to reduce total transfer agency expenses, the Fund has implemented a small account fee on certain types of accounts. As described in the Fund's prospectus, certain shareholders with an account balance of less than
$1,000 ($5,000 for Class A share accounts) are charged an annual per account fee of $20 (assessed semi-annually), the proceeds from which offset transfer agent fees as reflected in the Statement of Operations. This small account fee will not apply to certain types of accounts as described further in the Fund’s prospectus.
(F) Capital. As of October 31, 2023, New York Life and its affiliates beneficially held shares of the Fund with the values and percentages of net assets as follows:
Note 4-Federal Income Tax
As of October 31, 2023, the cost and unrealized appreciation (depreciation) of the Fund’s investment portfolio, including applicable derivative contracts and other financial instruments, as determined on a federal income tax basis, were as follows:
| | Federal Tax
Cost | Gross
Unrealized
Appreciation | Gross
Unrealized
(Depreciation) | Net
Unrealized
Appreciation/
(Depreciation) |
| Investments in Securities | $1,283,505,365 | $15,250,438 | $(153,242,479) | $(137,992,041) |
As of April 30, 2023, for federal income tax purposes, capital loss carryforwards of $251,512,781 is limited to $405,362 on an annual basis to offset any net realized capital gains. This limitation is due to Internal Revenue Code Sections 381-384. Capital loss carryforwards, as shown in the table below, were available to the extent provided by the regulations to offset future realized gains of the Fund subject to the limitation described above.
Total Capital Loss
Available Through | Short-Term
Capital Loss
Amounts (000’s) | Long-Term
Capital Loss
Amounts (000’s) |
| Unlimited | $156,815 | $94,698 |
During the year ended April 30, 2023, the tax character of distributions paid as reflected in the Statements of Changes in Net Assets was as follows:
| | 2023 |
| Distributions paid from: | |
| Ordinary Income | $43,678,063 |
| Long-Term Capital Gains | 13,519,686 |
| Total | $57,197,749 |
Note 5–Custodian
JPMorgan is the custodian of cash and securities held by the Fund. Custodial fees are charged to the Fund based on the Fund's net assets and/or the market value of securities held by the Fund and the number of certain transactions incurred by the Fund.
Notes to Financial Statements (Unaudited) (continued)
Note 6–Line of Credit
The Fund and certain other funds managed by New York Life Investments maintain a line of credit with a syndicate of banks in order to secure a source of funds for temporary purposes to meet unanticipated or excessive redemption requests.
Effective July 25, 2023, under the credit agreement (the “Credit Agreement”), the aggregate commitment amount is $600,000,000 with an additional uncommitted amount of $100,000,000. The commitment fee is an annual rate of 0.15% of the average commitment amount payable quarterly, regardless of usage, to JPMorgan, who serves as the agent to the syndicate. The commitment fee is allocated among the Fund and certain other funds managed by New York Life Investments based upon their respective net assets and other factors. Interest on any revolving credit loan is charged based upon the Federal Funds Rate, Daily Simple Secured Overnight Financing Rate ("SOFR") + 0.10%, or the Overnight Bank Funding Rate, whichever is higher. The Credit Agreement expires on July 23, 2024, although the Fund, certain other funds managed by New York Life Investments and the syndicate of banks may renew the Credit Agreement for an additional year on the same or different terms or enter into a credit agreement with a different syndicate of banks. Prior to July 25, 2023, the aggregate commitment amount and the commitment fee were the same as those under the current Credit Agreement. During the six-month period ended October 31, 2023, the Fund utilized the line of credit for 12 days, maintained an average daily balance of $22,042,167, at a weighted average interest rate of 6.15% and incurred interest expense in the amount of $45,194. As of October 31, 2023, there were no borrowings outstanding with respect to the Fund under the Credit Agreement.
Note 7–Interfund Lending Program
Pursuant to an exemptive order issued by the SEC, the Fund, along with certain other funds managed by New York Life Investments, may participate in an interfund lending program. The interfund lending program provides an alternative credit facility that permits the Fund and certain other funds managed by New York Life Investments to lend or borrow money for temporary purposes directly to or from one another, subject to the conditions of the exemptive order. During the six-month period ended October 31, 2023, there were no interfund loans made or outstanding with respect to the Fund.
Note 8–Purchases and Sales of Securities (in 000’s)
During the six-month period ended October 31, 2023, purchases and sales of securities, other than short-term securities, were $290,358 and $999,424, respectively.
Note 9–Capital Share Transactions
Transactions in capital shares for the six-month period ended October 31, 2023 and the year ended April 30, 2023, were as follows:
| Class A | Shares | Amount |
| Six-month period ended October 31, 2023: | | |
| Shares sold | 645,576 | $ 7,796,093 |
| Shares issued to shareholders in reinvestment of distributions | 108,788 | 1,289,606 |
| Shares redeemed | (1,370,865) | (16,145,646) |
| Net increase (decrease) in shares outstanding before conversion | (616,501) | (7,059,947) |
| Shares converted into Class A (See Note 1) | 8,127 | 99,141 |
| Shares converted from Class A (See Note 1) | (59,667) | (740,093) |
| Net increase (decrease) | (668,041) | $ (7,700,899) |
| Year ended April 30, 2023: | | |
| Shares sold | 2,929,490 | $ 37,054,021 |
| Shares issued to shareholders in reinvestment of distributions | 201,420 | 2,470,392 |
| Shares redeemed | (1,847,772) | (22,767,505) |
| Net increase (decrease) in shares outstanding before conversion | 1,283,138 | 16,756,908 |
| Shares converted into Class A (See Note 1) | 13,183 | 168,235 |
| Shares converted from Class A (See Note 1) | (73,115) | (935,517) |
| Net increase (decrease) | 1,223,206 | $ 15,989,626 |
| |
| Investor Class | Shares | Amount |
| Six-month period ended October 31, 2023: | | |
| Shares sold | 3,469 | $ 41,579 |
| Shares issued to shareholders in reinvestment of distributions | 2,484 | 29,426 |
| Shares redeemed | (14,400) | (173,772) |
| Net increase (decrease) in shares outstanding before conversion | (8,447) | (102,767) |
| Shares converted into Investor Class (See Note 1) | 5,229 | 63,585 |
| Shares converted from Investor Class (See Note 1) | (5,489) | (66,568) |
| Net increase (decrease) | (8,707) | $ (105,750) |
| Year ended April 30, 2023: | | |
| Shares sold | 27,154 | $ 345,340 |
| Shares issued to shareholders in reinvestment of distributions | 4,981 | 61,132 |
| Shares redeemed | (33,754) | (421,376) |
| Net increase (decrease) in shares outstanding before conversion | (1,619) | (14,904) |
| Shares converted into Investor Class (See Note 1) | 7,674 | 95,996 |
| Shares converted from Investor Class (See Note 1) | (8,634) | (110,489) |
| Net increase (decrease) | (2,579) | $ (29,397) |
| |
| 28 | MainStay CBRE Global Infrastructure Fund |
| Class C | Shares | Amount |
| Six-month period ended October 31, 2023: | | |
| Shares sold | 70,240 | $ 849,407 |
| Shares issued to shareholders in reinvestment of distributions | 15,690 | 186,658 |
| Shares redeemed | (274,332) | (3,255,555) |
| Net increase (decrease) in shares outstanding before conversion | (188,402) | (2,219,490) |
| Shares converted from Class C (See Note 1) | (5,259) | (63,585) |
| Net increase (decrease) | (193,661) | $ (2,283,075) |
| Year ended April 30, 2023: | | |
| Shares sold | 277,436 | $ 3,481,910 |
| Shares issued to shareholders in reinvestment of distributions | 32,416 | 398,277 |
| Shares redeemed | (547,298) | (6,677,519) |
| Net increase (decrease) in shares outstanding before conversion | (237,446) | (2,797,332) |
| Shares converted from Class C (See Note 1) | (10,193) | (127,321) |
| Net increase (decrease) | (247,639) | $ (2,924,653) |
| |
| Class I | Shares | Amount |
| Six-month period ended October 31, 2023: | | |
| Shares sold | 17,545,392 | $ 210,637,362 |
| Shares issued to shareholders in reinvestment of distributions | 1,455,466 | 17,236,696 |
| Shares redeemed | (79,615,946) | (951,901,703) |
| Net increase (decrease) in shares outstanding before conversion | (60,615,088) | (724,027,645) |
| Shares converted into Class I (See Note 1) | 59,571 | 740,093 |
| Shares converted from Class I (See Note 1) | (2,640) | (32,573) |
| Net increase (decrease) | (60,558,157) | $(723,320,125) |
| Year ended April 30, 2023: | | |
| Shares sold | 76,586,421 | $ 967,256,332 |
| Shares issued to shareholders in reinvestment of distributions | 2,936,803 | 36,014,942 |
| Shares redeemed | (41,280,583) | (512,768,856) |
| Net increase (decrease) in shares outstanding before conversion | 38,242,641 | 490,502,418 |
| Shares converted into Class I (See Note 1) | 73,057 | 935,517 |
| Shares converted from Class I (See Note 1) | (2,086) | (26,421) |
| Net increase (decrease) | 38,313,612 | $ 491,411,514 |
| |
| Class R6 | Shares | Amount |
| Six-month period ended October 31, 2023: | | |
| Shares sold | 4,737 | $ 54,209 |
| Shares issued to shareholders in reinvestment of distributions | 926 | 10,983 |
| Shares redeemed | (15,715) | (188,594) |
| Net increase (decrease) | (10,052) | $ (123,402) |
| Year ended April 30, 2023: | | |
| Shares sold | 83,285 | $ 1,062,536 |
| Shares issued to shareholders in reinvestment of distributions | 22,623 | 276,371 |
| Shares redeemed | (840,682) | (10,710,454) |
| Net increase (decrease) | (734,774) | $ (9,371,547) |
Note 10–Other Matters
As of the date of this report, the Fund faces a heightened level of risk associated with current uncertainty, volatility and state of economies, financial markets, rising interest rates, and labor and health conditions around the world. Events such as war, acts of terrorism, recessions, rapid inflation, the imposition of international sanctions, earthquakes, hurricanes, epidemics and pandemics and other unforeseen natural or human disasters may have broad adverse social, political and economic effects on the global economy, which could negatively impact the value of the Fund's investments. Developments that disrupt global economies and financial markets may magnify factors that affect the Fund's performance.
Note 11–Subsequent Events
In connection with the preparation of the financial statements of the Fund as of and for the six-month period ended October 31, 2023, events and transactions subsequent to October 31, 2023, through the date the financial statements were issued, have been evaluated by the Manager for possible adjustment and/or disclosure. No subsequent events requiring financial statement adjustment or disclosure have been identified.
Proxy Voting Policies and Procedures and Proxy Voting Record
The Fund is required to file with the SEC its proxy voting record for the 12-month period ending June 30 on Form N-PX. A description of the policies and procedures that are used to vote proxies relating to portfolio securities of the Fund is available free of charge upon request by calling 800-624-6782 or visiting the SEC’s website at www.sec.gov. The most recent Form N-PX or proxy voting record is available free of charge upon request by calling 800-624-6782; visiting newyorklifeinvestments.com; or visiting the SEC’s website at www.sec.gov.
Shareholder Reports and Quarterly Portfolio Disclosure
The Fund is required to file its complete schedule of portfolio holdings with the SEC 60 days after its first and third fiscal quarter on Form N-PORT. The Fund's holdings report is available free of charge upon request by calling New York Life Investments at 800-624-6782.
| 30 | MainStay CBRE Global Infrastructure Fund |
Equity
U.S. Equity
MainStay Epoch U.S. Equity Yield Fund
MainStay Fiera SMID Growth Fund
MainStay PineStone U.S. Equity Fund
MainStay S&P 500 Index Fund
MainStay Winslow Large Cap Growth Fund
MainStay WMC Enduring Capital Fund
MainStay WMC Growth Fund
MainStay WMC Small Companies Fund
MainStay WMC Value Fund
International Equity
MainStay Epoch International Choice Fund
MainStay PineStone International Equity Fund
MainStay WMC International Research Equity Fund
Emerging Markets Equity
MainStay Candriam Emerging Markets Equity Fund
Global Equity
MainStay Epoch Capital Growth Fund
MainStay Epoch Global Equity Yield Fund
MainStay PineStone Global Equity Fund
Fixed Income
Taxable Income
MainStay Candriam Emerging Markets Debt Fund
MainStay Floating Rate Fund
MainStay MacKay High Yield Corporate Bond Fund
MainStay MacKay Short Duration High Yield Fund
MainStay MacKay Strategic Bond Fund
MainStay MacKay Total Return Bond Fund
MainStay MacKay U.S. Infrastructure Bond Fund
MainStay Short Term Bond Fund
Tax-Exempt Income
MainStay MacKay California Tax Free Opportunities Fund1
MainStay MacKay High Yield Municipal Bond Fund
MainStay MacKay New York Tax Free Opportunities Fund2
MainStay MacKay Short Term Municipal Fund
MainStay MacKay Strategic Municipal Allocation Fund
MainStay MacKay Tax Free Bond Fund
Money Market
MainStay Money Market Fund
Mixed Asset
MainStay Balanced Fund
MainStay Income Builder Fund
MainStay MacKay Convertible Fund
Speciality
MainStay CBRE Global Infrastructure Fund
MainStay CBRE Real Estate Fund
MainStay Cushing MLP Premier Fund
Asset Allocation
MainStay Conservative Allocation Fund
MainStay Conservative ETF Allocation Fund
MainStay Defensive ETF Allocation Fund
MainStay Equity Allocation Fund
MainStay Equity ETF Allocation Fund
MainStay ESG Multi-Asset Allocation Fund
MainStay Growth Allocation Fund
MainStay Growth ETF Allocation Fund
MainStay Moderate Allocation Fund
MainStay Moderate ETF Allocation Fund
Manager
New York Life Investment Management LLC
New York, New York
Subadvisors
Candriam3
Strassen, Luxembourg
CBRE Investment Management Listed Real Assets LLC
Radnor, Pennsylvania
Cushing Asset Management, LP
Dallas, Texas
Epoch Investment Partners, Inc.
New York, New York
Fiera Capital Inc.
New York, New York
IndexIQ Advisors LLC3
New York, New York
MacKay Shields LLC3
New York, New York
NYL Investors LLC3
New York, New York
PineStone Asset Management Inc.
Montreal, Québec
Wellington Management Company LLP
Boston, Massachusetts
Winslow Capital Management, LLC
Minneapolis, Minnesota
Legal Counsel
Dechert LLP
Washington, District of Columbia
Independent Registered Public Accounting Firm
KPMG LLP
Philadelphia, Pennsylvania
Distributor
NYLIFE Distributors LLC3
Jersey City, New Jersey
Custodian
JPMorgan Chase Bank, N.A.
New York, New York
1.
This Fund is registered for sale in AZ, CA, NV, OR, TX, UT, WA and MI (Class A and Class I shares only), and CO, FL, GA, HI, ID, MA, MD, NH, NJ and NY (Class I shares only).
| 2. | This Fund is registered for sale in CA, CT, DE, FL, MA, NJ, NY and VT. |
| 3. | An affiliate of New York Life Investment Management LLC. |
Not part of the Semiannual Report
For more information
800-624-6782
newyorklifeinvestments.com
“New York Life Investments” is both a service mark, and the common trade name, of certain investment advisors affiliated with New York Life Insurance Company. The MainStay Funds® are managed by New York Life Investment Management LLC and distributed by NYLIFE Distributors LLC, 30 Hudson Street, Jersey City, NJ 07302, a wholly owned subsidiary of New York Life Insurance Company. NYLIFE Distributors LLC is a Member FINRA/SIPC.
©2023 NYLIFE Distributors LLC. All rights reserved.
| 5013764MS139-23 | MSCBGI10-12/23 |
(NYLIM) NL479
MainStay CBRE Real Estate Fund
Message from the President and Semiannual Report
Unaudited | October 31, 2023
Special Notice:
Beginning in July 2024, new regulations issued by the Securities and Exchange Commission (SEC) will take effect requiring open-end mutual fund companies and ETFs to (1) overhaul the content of their shareholder reports and (2) mail paper copies of the new tailored shareholder reports to shareholders who have not opted to receive these documents electronically.
If you have not yet elected to receive your shareholder reports electronically, please contact your financial intermediary or visit newyorklifeinvestments.com/accounts.
| Not FDIC/NCUA Insured | Not a Deposit | May Lose Value | No Bank Guarantee | Not Insured by Any Government Agency |
This page intentionally left blank
Message from the President
Interest rates and inflation were the primary forces driving market behavior during the six-month reporting period ended October 31, 2023, with equity indices delivering mixed performance while bond indices generally declined.
U.S. inflation levels, as measured by the Consumer Price Index, ranged between 3.0% and 4.0% throughout the reporting period, down from the peak of 9.1% in June 2022, although well above the 2.0% target set by the U.S. Federal Reserve (the “Fed”). At the same time, the benchmark federal funds rate climbed to over 5%, its highest level since the financial crisis of 2007, as the Fed attempted to drive inflation still lower. Comments from Fed members reinforced the central bank’s hawkish stance in response to surprisingly robust U.S. economic growth and rising wage pressures, thus increasing the likelihood that interest rates would stay higher for longer. International developed markets exhibited similar dynamics of persistently elevated inflation and rising interest rates.
Against a backdrop of high interest rates, political dysfunction in Washington D.C. and intensifying global geopolitical instability—including the ongoing war in Ukraine and the outbreak of hostilities in the Middle East—equity markets struggled to advance. The S&P 500® Index, a widely regarded benchmark of large-cap U.S. market performance, eked out a slight gain, bolstered by the strong performance of mega-cap, growth-oriented, technology-related shares as investors flocked to companies creating the infrastructure for developments in artificial intelligence. However, smaller-cap stocks and value-oriented shares trended lower. Among industry sectors, information technology posted the strongest gains, followed by consumer discretionary, which rose in response to healthy consumer spending trends, while energy shares benefited from rising petroleum prices. All other sectors lost ground. Utilities declined most sharply as rising interest rates undermined the appeal of high-yielding stocks, while real estate came under pressure from
rising mortgage rates and weak levels of office occupancy, and consumer staples declined as market sentiment turned away from defensive, value-oriented businesses. International equities broadly trailed their U.S. counterparts as economic growth in the rest of world generally lagged that of the United States, and as the U.S. dollar rose in value compared to most other global currencies.
Bond prices were driven lower by rising yields and increasing expectations of high interest rates for an extended period of time. The U.S. yield curve steepened, with the 30-year Treasury yield exceeding 5% for the first time in more than a decade. The yield curve remained inverted, with the 10-year Treasury yield ending the period at 4.88%, compared with 5.07% for the 2-year Treasury yield. Corporate bonds outperformed long-term Treasury bonds, but still trended lower under pressure from rising yields and an uptick in default rates. Among corporates, lower-credit-quality instruments performed relatively well compared to their higher-credit-quality counterparts, while floating rate securities performed better still.
In the face of today’s uncertain market environment, New York Life Investments remains dedicated to providing the guidance, resources and investment solutions you need to pursue your financial goals.
Thank you for trusting us to help meet your investment needs.
Sincerely,
Kirk C. Lehneis
President
The opinions expressed are as of the date of this report and are subject to change. There is no guarantee that any forecast made will come to pass. This material does not constitute investment advice and is not intended as an endorsement of any specific investment. Past performance is no guarantee of future results.
Not part of the Semiannual Report
Investors should refer to the Fund’s Summary Prospectus and/or Prospectus and consider the Fund’s investment objectives, strategies, risks, charges and expenses carefully before investing. The Summary Prospectus and/or Prospectus contain this and other information about the Fund. You may obtain copies of the Fund’s Summary Prospectus, Prospectus and Statement of Additional Information, which includes information about the MainStay Funds Trust's Trustees, free of charge, upon request, by calling toll-free 800-624-6782, by writing to NYLIFE Distributors LLC, Attn: MainStay Marketing Department, 30 Hudson Street, Jersey City, NJ 07302 or by sending an e-mail to MainStayShareholderServices@nylim.com. These documents are also available via the MainStay Funds’ website at newyorklifeinvestments.com. Please read the Fund’s Summary Prospectus and/or Prospectus carefully before investing.
Investment and Performance Comparison (Unaudited)
Performance data quoted represents past performance. Past performance is no guarantee of future results. Because of market volatility and other factors, current performance may be lower or higher than the figures shown. Investment return and principal value will fluctuate, and as a result, when shares are redeemed, they may be worth more or less than their original cost. The graph below depicts the historical performance of Class I shares of the Fund. Performance will vary from class to class based on differences in class-specific expenses and sales charges. For performance information current to the most recent month-end, please call 800-624-6782 or visit newyorklifeinvestments.com.
The performance table and graph do not reflect the deduction of taxes that a shareholder would pay on distributions or Fund share redemptions. Total returns reflect maximum applicable sales charges as indicated in the table below, if any, changes in share price, and reinvestment of dividend and capital gain distributions. The graph assumes the initial investment amount shown below and reflects the deduction of all sales charges that would have applied for the period of investment. Performance figures may reflect certain fee waivers and/or expense limitations, without which total returns may have been lower. For more information on share classes and current fee waivers and/or expense limitations (if any), please refer to the Notes to Financial Statements.
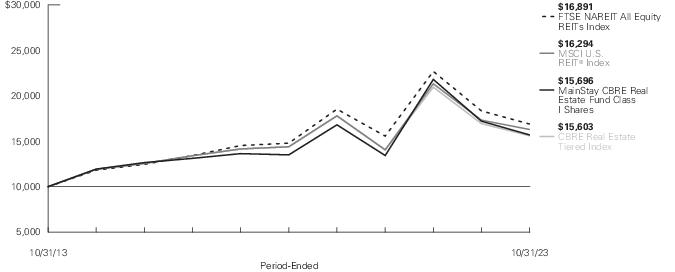
| Average Annual Total Returns for the Period-Ended October 31, 2023 |
| Class | Sales Charge | | Inception
Date1 | Six
Months2 | One
Year | Five
Years | Ten Years
or Since
Inception | Gross
Expense
Ratio3 |
| Class A Shares4 | Maximum 5.50% Initial Sales Charge | With sales charges | 12/20/2002 | -16.71% | -14.17% | 1.47% | 3.67% | 1.35% |
| | | Excluding sales charges | | -11.86 | -9.18 | 2.68 | 4.28 | 1.35 |
| Investor Class Shares5 | Maximum 5.00% Initial Sales Charge | With sales charges | 2/24/2020 | -16.30 | -13.77 | N/A | -5.01 | 1.29 |
| | | Excluding sales charges | | -11.90 | -9.23 | N/A | -3.55 | 1.29 |
| Class C Shares4 | Maximum 1.00% CDSC | With sales charges | 1/17/2003 | -12.95 | -10.47 | 1.93 | 3.47 | 2.04 |
| | If Redeemed Within One Year of Purchase | Excluding sales charges | | -12.07 | -9.79 | 1.93 | 3.47 | 2.04 |
| Class I Shares4 | No Sales Charge | | 12/31/1996 | -11.60 | -8.77 | 3.06 | 4.61 | 1.10 |
| Class R3 Shares4, 6 | No Sales Charge | | 8/5/2011 | -11.86 | -9.27 | 2.45 | 4.04 | 1.70 |
| Class R6 Shares4 | No Sales Charge | | 7/3/2014 | -11.65 | -8.69 | 3.14 | 3.73 | 0.82 |
| 1. | Effective at the close of business on February 21, 2020, the Fund changed its fiscal and tax year end from October 31 to April 30. |
| 2. | Not annualized. |
| 3. | The gross expense ratios presented reflect the Fund’s “Total Annual Fund Operating Expenses” from the most recent Prospectus, as supplemented, and may differ from other expense ratios disclosed in this report. |
| 4. | Performance figures for Class A shares, Class C shares, Class I shares, Class R3 shares and Class R6 shares, reflect the historical performance of the then-existing Class A shares, Class C shares, Class I shares, Class R and Class R6 shares of the Voya Real Estate Fund (the predecessor to the Fund, which was subject to a different fee structure) for periods prior to February 21, 2020. |
| 5. | Prior to June 30, 2020, the maximum initial sales charge for Investor Class shares was 5.50%, which is reflected in the average annual total return figures shown. |
| 6. | As of October 31, 2023, Class R3 shares are closed to new investors and, upon the close of business on December 29, 2023, Class R3 shares are closed to additional investments by existing shareholders. Additionally, Class R3 shares will be liquidated on or about February 28, 2024 (the "Liquidation Date"). It is expected that the Fund will distribute to remaining shareholders invested in Class R3 shares, on or promptly after the Liquidation Date, a liquidating distribution in cash or cash equivalents equal to the net asset value of such shares. |
The footnotes on the next page are an integral part of the table and graph and should be carefully read in conjunction with them.
| Benchmark Performance* | Six
Months1 | One
Year | Five
Years | Ten
Years |
| FTSE NAREIT All Equity REITs Index2 | -10.39% | -7.89% | 2.69% | 5.38% |
| CBRE Real Estate Tiered Index3 | -10.39 | -7.89 | 1.63 | 4.55 |
| MSCI U.S. REIT® Index4 | -9.46 | -5.92 | 2.51 | 5.00 |
| Morningstar Real Estate Category Average5 | -9.82 | -6.52 | 2.05 | 4.42 |
| * | Returns for indices reflect no deductions for fees, expenses or taxes, except for foreign withholding taxes where applicable. Results assume reinvestment of all dividends and capital gains. An investment cannot be made directly in an index. |
| 1. | Not annualized. |
| 2. | The Fund has selected the FTSE NAREIT All Equity REITs Index as its primary benchmark. The FTSE NAREIT All Equity REITs Index is a free-float adjusted, market capitalization-weighted index of U.S. equity REITs. Constituents of the index include all tax-qualified REITs with more than 50 percent of total assets in qualifying real estate assets other than mortgages secured by real property. |
| 3. | The Fund has selected a tiered benchmark as its secondary benchmark. The returns for the CBRE Real Estate Tiered Index represent the returns of the MSCI U.S. REIT® Index prior to January 1, 2021 and the returns of the FTSE NAREIT All Equity REITs Index thereafter. |
| 4. | The Fund has also selected the MSCI U.S. REIT® Index as an additional benchmark. The MSCI U.S. REIT® Index is a free float-adjusted market capitalization weighted index that is comprised of equity REITs. The MSCI U.S. REIT® Index is based on the MSCI USA Investable Market Index, its parent index, which captures the large, mid and small cap segments of the U.S. market. |
| 5. | The Morningstar Real Estate Category Average is representative of funds that invest primarily in real estate investment trusts of various types. REITs are companies that develop and manage real estate properties. There are several different types of REITs, including apartment, factory-outlet, healthcare, hotel, industrial, mortgage, office, and shopping center REITs. Some funds in this category also invest in real estate operating companies. Results are based on average total returns of similar funds with all dividends and capital gain distributions reinvested. |
The footnotes on the preceding page are an integral part of the table and graph and should be carefully read in conjunction with them.
| 6 | MainStay CBRE Real Estate Fund |
Cost in Dollars of a $1,000 Investment in MainStay CBRE Real Estate Fund (Unaudited)
The example below is intended to describe the fees and expenses borne by shareholders during the six-month period from May 1, 2023 to October 31, 2023, and the impact of those costs on your investment.
Example
As a shareholder of the Fund you incur two types of costs: (1) transaction costs, including exchange fees and sales charges (loads) on purchases (as applicable), and (2) ongoing costs, including management fees, distribution and/or service (12b-1) fees and other Fund expenses (as applicable). This example is intended to help you understand your ongoing costs (in dollars) of investing in the Fund and to compare these costs with the ongoing costs of investing in other mutual funds. The example is based on an investment of $1,000 made at the beginning of the six-month period and held for the entire period from May 1, 2023 to October 31, 2023.
This example illustrates your Fund’s ongoing costs in two ways:
Actual Expenses
The second and third data columns in the table below provide information about actual account values and actual expenses. You may use the information in these columns, together with the amount you invested, to estimate the expenses that you paid during the six months ended October 31, 2023. Simply divide your account value by $1,000 (for example, an
$8,600 account value divided by $1,000 = 8.6), then multiply the result by the number under the heading entitled “Expenses Paid During Period” to estimate the expenses you paid on your account during this period.
Hypothetical Example for Comparison Purposes
The fourth and fifth data columns in the table below provide information about hypothetical account values and hypothetical expenses based on the Fund’s actual expense ratio and an assumed rate of return of 5% per year before expenses, which is not the Fund’s actual return. The hypothetical account values and expenses may not be used to estimate the actual ending account balances or expenses you paid for the six-month period shown. You may use this information to compare the ongoing costs of investing in the Fund with the ongoing costs of investing in other mutual funds. To do so, compare this 5% hypothetical example with the 5% hypothetical examples that appear in the shareholder reports of the other mutual funds.
Please note that the expenses shown in the table are meant to highlight your ongoing costs only and do not reflect any transactional costs, such as exchange fees or sales charges (loads). Therefore, the fourth and fifth data columns of the table are useful in comparing ongoing costs only and will not help you determine the relative total costs of owning different funds. In addition, if these transactional costs were included, your costs would have been higher.
| Share Class | Beginning
Account
Value
5/1/23 | Ending Account
Value (Based
on Actual
Returns and
Expenses)
10/31/23 | Expenses
Paid
During
Period1 | Ending Account
Value (Based
on Hypothetical
5% Annualized
Return and
Actual Expenses)
10/31/23 | Expenses
Paid
During
Period1 | Net Expense
Ratio
During
Period2 |
| Class A Shares | $1,000.00 | $881.40 | $5.58 | $1,019.20 | $5.99 | 1.18% |
| Investor Class Shares | $1,000.00 | $881.00 | $5.96 | $1,018.80 | $6.39 | 1.26% |
| Class C Shares | $1,000.00 | $879.30 | $9.12 | $1,015.43 | $9.78 | 1.93% |
| Class I Shares | $1,000.00 | $884.00 | $3.93 | $1,020.96 | $4.22 | 0.83% |
| Class R3 Shares | $1,000.00 | $881.40 | $6.76 | $1,017.95 | $7.25 | 1.43% |
| Class R6 Shares | $1,000.00 | $883.50 | $3.50 | $1,021.42 | $3.76 | 0.74% |
| 1. | Expenses are equal to the Fund’s annualized expense ratio of each class multiplied by the average account value over the period, divided by 366 and multiplied by 184 (to reflect the six-month period). The table above represents the actual expenses incurred during the six-month period. In addition to the fees and expenses which the Fund bears directly, it also indirectly bears a pro rata share of the fees and expenses of the underlying funds in which it invests. Such indirect expenses are not included in the above-reported expense figures. |
| 2. | Expenses are equal to the Fund's annualized expense ratio to reflect the six-month period. |
Sector Composition as of October 31, 2023 (Unaudited)
| Technology Towers | 16.2% |
| Residential | 14.8 |
| Self Storage Property | 10.1 |
| Net Lease Properties | 10.1 |
| Healthcare Facilities | 10.1 |
| Industrial Properties | 8.9 |
| Technology Datacenters | 8.1 |
| Enclosed Malls | 5.7 |
| Community Shopping Centers | 5.5% |
| Hotels | 5.1 |
| Office Buildings | 3.5 |
| Timber | 1.7 |
| Short–Term Investments | 0.3 |
| Other Assets, Less Liabilities | –0.1 |
| | 100.0% |
See Portfolio of Investments beginning on page 10 for specific holdings within these categories. The Fund's holdings are subject to change.
Top Ten Holdings and/or Issuers Held as of October 31, 2023 (excluding short-term investments) (Unaudited)
| 1. | American Tower Corp. |
| 2. | Equinix, Inc. |
| 3. | Public Storage |
| 4. | Prologis, Inc. |
| 5. | Welltower, Inc. |
| 6. | Simon Property Group, Inc. |
| 7. | SBA Communications Corp. |
| 8. | Invitation Homes, Inc. |
| 9. | Rexford Industrial Realty, Inc. |
| 10. | Alexandria Real Estate Equities, Inc. |
| 8 | MainStay CBRE Real Estate Fund |
Portfolio Management Discussion and Analysis (Unaudited)
Questions answered by portfolio managers Joseph P. Smith, CFA, Jonathan Miniman, CFA, and Kenneth S. Weinberg, CFA, of CBRE Investment Management Listed Real Assets LLC.
How did MainStay CBRE Real Estate Fund perform relative to its benchmarks and peer group during the six months ended October 31, 2023?
For the six months ended October 31, 2023, Class I shares of MainStay CBRE Real Estate Fund returned −11.60%, underperforming the −10.39% return of the Fund’s primary benchmark, the FTSE Nareit All Equity REITs Index; the −10.39% return of the CBRE Real Estate Tiered Index, which is the Fund’s secondary benchmark; and the −9.46% return of MSCI U.S. REIT® Index, which is an additional benchmark of the Fund. Over the same period, Class I shares also underperformed the −9.82% return of the Morningstar Real Estate Category Average.1
What factors affected the Fund’s relative performance during the reporting period?
During the reporting period, the Fund’s performance relative to the FTSE Nareit All Equity REITs Index suffered due to disappointing stock selection and, to a lesser degree, negative contributions from sector allocation. (Contributions take weightings and total returns into account.)
During the reporting period, which sectors were the strongest positive contributors to the Fund’s relative performance and which sectors were particularly weak?
The strongest positive contributions to the Fund’s relative performance from a sector allocation perspective came from net lease properties, hotels and towers. The weakest relative contributors to performance included residential properties, office properties and storage facilities.
During the reporting period, which individual stocks made the strongest positive contributions to the Fund’s absolute performance and which stocks detracted the most?
The strongest positive contributors to the Fund’s absolute performance during the reporting period were Welltower (health care), Digital Realty (data centers) and Equinix (data centers). While the Fund still held positions in Welltower and Equinix at the end of the reporting period, we sold the Fund’s position in Digital Realty on strong outperformance. The holdings that detracted most from the Fund’s absolute performance were Crown Castle (cell towers), Public Storage (self-storage) and Prologis (logistics facilities). At the end of the reporting period, the Fund continued to hold positions in Crown Castle, Public Storage and Prologis as we believe these companies represent an attractive combination of value and growth.
What were some of the Fund’s largest purchases and sales during the reporting period?
The Fund’s largest purchases during the reporting period included shares in cell tower company SBA Communications, which exhibited a combination of improving growth characteristics and reasonable relative value following a period of material underperformance; and industrial REIT Public Storage, an industry leader with a superior balance sheet representing attractive value. The Fund’s largest sales during the same period included holdings in data center REIT Digital Realty, described in the previous response, and residential REIT Sun Communities, which we exited in favor of more attractive relative values.
How did the Fund’s sector weightings change during the reporting period?
During the reporting period, the Fund increased its exposure most substantially to the cell towers and office sectors, areas where we believe there are attractive relative valuations. In the case of cell towers, the group appeared attractively valued after a period of material underperformance. In the case of office, we believe the sector has reached an inflection point, trading at heavily discounted prices, with double-digit initial yields, relative to the level at which we believe the private market bottoms. During the same period, the Fund reduced its exposure most substantially to the residential and data center sectors. We reduced residential exposure, primarily in the manufactured housing area, in light of a moderating earnings growth outlook. We reduced exposure to data centers after significant outperformance.
How was the Fund positioned at the end of the reporting period?
As of October 31, 2023, the Fund holds its most overweight positions relative to the FTSE Nareit All Equity REITs Index in the storage, towers and hotels sectors. As of the same date, the Fund holds its most significantly underweight positions in the net lease, industrial and data centers sectors.
| 1. | See "Investment and Performance Comparison" for other share class returns, which may be higher or lower than Class I share returns, and for more information on benchmark and peer group returns. |
The opinions expressed are those of the portfolio managers as of the date of this report and are subject to change. There is no guarantee that any forecasts will come to pass. This material does not constitute investment advice and is not intended as an endorsement of any specific investment.
Portfolio of Investments October 31, 2023†^(Unaudited)
| | Shares | Value |
| Common Stocks 99.8% |
| Community Shopping Centers 5.5% |
| Brixmor Property Group, Inc. | 261,742 | $ 5,441,616 |
| Kite Realty Group Trust | 113,893 | 2,428,199 |
| Regency Centers Corp. | 42,980 | 2,589,975 |
| Retail Opportunity Investments Corp. | 178,719 | 2,098,161 |
| SITE Centers Corp. | 106,826 | 1,245,591 |
| | | 13,803,542 |
| Enclosed Malls 5.7% |
| Macerich Co. (The) | 282,770 | 2,748,524 |
| Simon Property Group, Inc. | 106,604 | 11,714,714 |
| | | 14,463,238 |
| Healthcare Facilities 10.1% |
| Alexandria Real Estate Equities, Inc. | 86,725 | 8,076,699 |
| Healthpeak Properties, Inc. | 144,324 | 2,244,238 |
| Ventas, Inc. | 43,912 | 1,864,504 |
| Welltower, Inc. | 158,645 | 13,264,308 |
| | | 25,449,749 |
| Hotels 5.1% |
| Hilton Worldwide Holdings, Inc. | 21,246 | 3,219,406 |
| Park Hotels & Resorts, Inc. | 271,928 | 3,135,330 |
| Ryman Hospitality Properties, Inc. | 34,431 | 2,947,294 |
| Sunstone Hotel Investors, Inc. | 381,809 | 3,550,824 |
| | | 12,852,854 |
| Industrial Properties 8.9% |
| Prologis, Inc. | 133,474 | 13,447,505 |
| Rexford Industrial Realty, Inc. | 208,816 | 9,029,204 |
| | | 22,476,709 |
| Net Lease Properties 10.1% |
| Agree Realty Corp. | 47,458 | 2,654,801 |
| Broadstone Net Lease, Inc. | 202,055 | 2,859,078 |
| Essential Properties Realty Trust, Inc. | 122,179 | 2,681,829 |
| Four Corners Property Trust, Inc. | 117,307 | 2,498,639 |
| Realty Income Corp. | 84,299 | 3,994,087 |
| Spirit Realty Capital, Inc. | 167,681 | 6,034,839 |
| VICI Properties, Inc. | 171,982 | 4,798,298 |
| | | 25,521,571 |
| Office Buildings 3.5% |
| Empire State Realty Trust, Inc., Class A | 230,632 | 1,865,813 |
| Highwoods Properties, Inc. | 137,900 | 2,467,031 |
| Kilroy Realty Corp. | 91,196 | 2,606,382 |
| Vornado Realty Trust | 106,761 | 2,049,811 |
| | | 8,989,037 |
| | Shares | | Value |
| |
| Residential 14.8% |
| Apartment Income REIT Corp. | 190,376 | | $ 5,560,883 |
| AvalonBay Communities, Inc. | 15,750 | | 2,610,405 |
| Camden Property Trust | 87,092 | | 7,392,369 |
| Essex Property Trust, Inc. | 32,082 | | 6,862,981 |
| Invitation Homes, Inc. | 305,074 | | 9,057,647 |
| Sun Communities, Inc. | 28,077 | | 3,123,286 |
| Tricon Residential, Inc. | 426,086 | | 2,824,950 |
| | | | 37,432,521 |
| Self Storage Property 10.1% |
| CubeSmart | 220,139 | | 7,504,539 |
| Public Storage | 76,150 | | 18,177,766 |
| | | | 25,682,305 |
| Technology Datacenters 8.1% |
| Equinix, Inc. | 28,205 | | 20,579,496 |
| Technology Towers 16.2% |
| American Tower Corp. | 126,251 | | 22,496,665 |
| Crown Castle, Inc. | 83,964 | | 7,806,973 |
| SBA Communications Corp. | 51,598 | | 10,764,891 |
| | | | 41,068,529 |
| Timber 1.7% |
| Weyerhaeuser Co. | 148,782 | | 4,268,556 |
Total Common Stocks
(Cost $262,722,662) | | | 252,588,107 |
| Short-Term Investment 0.3% |
| Affiliated Investment Company 0.3% |
| MainStay U.S. Government Liquidity Fund, 5.275% (a) | 704,563 | | 704,563 |
Total Short-Term Investment
(Cost $704,563) | | | 704,563 |
Total Investments
(Cost $263,427,225) | 100.1% | | 253,292,670 |
| Other Assets, Less Liabilities | (0.1) | | (156,722) |
| Net Assets | 100.0% | | $ 253,135,948 |
| † | Percentages indicated are based on Fund net assets. |
| ^ | Industry classifications may be different than those used for compliance monitoring purposes. |
| (a) | Current yield as of October 31, 2023. |
The notes to the financial statements are an integral part of, and should be read in conjunction with, the financial statements.
| 10 | MainStay CBRE Real Estate Fund |
Investments in Affiliates (in 000's)
Investments in issuers considered to be affiliate(s) of the Fund during the six-month period ended October 31, 2023 for purposes of Section 2(a)(3) of the Investment Company Act of 1940, as amended, were as follows:
| Affiliated Investment Companies | Value,
Beginning
of Period | Purchases
at Cost | Proceeds
from
Sales | Net
Realized
Gain/(Loss)
on Sales | Change in
Unrealized
Appreciation/
(Depreciation) | Value,
End of
Period | Dividend
Income | Other
Distributions | Shares
End of
Period |
| MainStay U.S. Government Liquidity Fund | $ 474 | $ 23,841 | $ (23,610) | $ — | $ — | $ 705 | $ 35 | $ — | 705 |
| Abbreviation(s): |
| REIT—Real Estate Investment Trust |
The following is a summary of the fair valuations according to the inputs used as of October 31, 2023, for valuing the Fund’s assets:
| Description | Quoted
Prices in
Active
Markets for
Identical
Assets
(Level 1) | | Significant
Other
Observable
Inputs
(Level 2) | | Significant
Unobservable
Inputs
(Level 3) | | Total |
| Asset Valuation Inputs | | | | | | | |
| Investments in Securities (a) | | | | | | | |
| Common Stocks | $ 252,588,107 | | $ — | | $ — | | $ 252,588,107 |
| Short-Term Investment | | | | | | | |
| Affiliated Investment Company | 704,563 | | — | | — | | 704,563 |
| Total Investments in Securities | $ 253,292,670 | | $ — | | $ — | | $ 253,292,670 |
| (a) | For a complete listing of investments and their industries, see the Portfolio of Investments. |
The notes to the financial statements are an integral part of, and should be read in conjunction with, the financial statements.
11
Statement of Assets and Liabilities as of October 31, 2023 (Unaudited)
| Assets |
Investment in unaffiliated securities, at value
(identified cost $262,722,662) | $252,588,107 |
Investment in affiliated investment companies, at value
(identified cost $704,563) | 704,563 |
| Receivables: | |
| Investment securities sold | 1,467,002 |
| Dividends | 175,940 |
| Fund shares sold | 174,472 |
| Securities lending | 76 |
| Other assets | 42,127 |
| Total assets | 255,152,287 |
| Liabilities |
| Foreign currency due to custodian, at value | 22,038 |
| Payables: | |
| Investment securities purchased | 1,260,230 |
| Fund shares redeemed | 340,620 |
| Transfer agent (See Note 3) | 134,789 |
| Manager (See Note 3) | 101,071 |
| Shareholder communication | 75,014 |
| Professional fees | 43,266 |
| NYLIFE Distributors (See Note 3) | 27,698 |
| Custodian | 7,340 |
| Trustees | 479 |
| Accrued expenses | 3,794 |
| Total liabilities | 2,016,339 |
| Net assets | $253,135,948 |
| Composition of Net Assets |
| Shares of beneficial interest outstanding (par value of $.001 per share) unlimited number of shares authorized | $ 32,877 |
| Additional paid-in-capital | 298,689,856 |
| | 298,722,733 |
| Total distributable earnings (loss) | (45,586,785) |
| Net assets | $253,135,948 |
| Class A | |
| Net assets applicable to outstanding shares | $113,741,614 |
| Shares of beneficial interest outstanding | 16,666,326 |
| Net asset value per share outstanding | $ 6.82 |
| Maximum sales charge (5.50% of offering price) | 0.40 |
| Maximum offering price per share outstanding | $ 7.22 |
| Investor Class | |
| Net assets applicable to outstanding shares | $ 178,332 |
| Shares of beneficial interest outstanding | 26,171 |
| Net asset value per share outstanding | $ 6.81 |
| Maximum sales charge (5.00% of offering price) | 0.36 |
| Maximum offering price per share outstanding | $ 7.17 |
| Class C | |
| Net assets applicable to outstanding shares | $ 2,965,464 |
| Shares of beneficial interest outstanding | 367,684 |
| Net asset value and offering price per share outstanding | $ 8.07 |
| Class I | |
| Net assets applicable to outstanding shares | $120,349,325 |
| Shares of beneficial interest outstanding | 13,936,802 |
| Net asset value and offering price per share outstanding | $ 8.64 |
| Class R3 | |
| Net assets applicable to outstanding shares | $ 1,196,612 |
| Shares of beneficial interest outstanding | 177,664 |
| Net asset value and offering price per share outstanding | $ 6.74 |
| Class R6 | |
| Net assets applicable to outstanding shares | $ 14,704,601 |
| Shares of beneficial interest outstanding | 1,702,642 |
| Net asset value and offering price per share outstanding | $ 8.64 |
The notes to the financial statements are an integral part of, and should be read in conjunction with, the financial statements.
| 12 | MainStay CBRE Real Estate Fund |
Statement of Operations for the six months ended October 31, 2023 (Unaudited)
| Investment Income (Loss) |
| Income | |
| Dividends-unaffiliated (net of foreign tax withholding of $33,517) | $ 5,575,674 |
| Dividends-affiliated | 35,079 |
| Securities lending, net | 611 |
| Total income | 5,611,364 |
| Expenses | |
| Manager (See Note 3) | 1,079,802 |
| Transfer agent (See Note 3) | 442,486 |
| Distribution/Service—Class A (See Note 3) | 162,381 |
| Distribution/Service—Investor Class (See Note 3) | 248 |
| Distribution/Service—Class C (See Note 3) | 17,578 |
| Distribution/Service—Class R3 (See Note 3) | 3,564 |
| Registration | 51,288 |
| Professional fees | 47,036 |
| Custodian | 12,381 |
| Trustees | 4,079 |
| Shareholder service (See Note 3) | 713 |
| Miscellaneous | 5,423 |
| Total expenses before waiver/reimbursement | 1,826,979 |
| Expense waiver/reimbursement from Manager (See Note 3) | (387,973) |
| Net expenses | 1,439,006 |
| Net investment income (loss) | 4,172,358 |
| Realized and Unrealized Gain (Loss) |
| Net realized gain (loss) on: | |
| Unaffiliated investment transactions | (7,145,060) |
| Foreign currency transactions | (3,390) |
| Net realized gain (loss) | (7,148,450) |
| Net change in unrealized appreciation (depreciation) on: | |
| Unaffiliated investments | (31,468,162) |
| Translation of other assets and liabilities in foreign currencies | 202 |
| Net change in unrealized appreciation (depreciation) | (31,467,960) |
| Net realized and unrealized gain (loss) | (38,616,410) |
| Net increase (decrease) in net assets resulting from operations | $(34,444,052) |
The notes to the financial statements are an integral part of, and should be read in conjunction with, the financial statements.
13
Statements of Changes in Net Assets
for the six months ended October 31, 2023 (Unaudited) and the year ended April 30, 2023
| | Six months
ended
October 31,
2023 | Year
ended
April 30,
2023 |
| Increase (Decrease) in Net Assets |
| Operations: | | |
| Net investment income (loss) | $ 4,172,358 | $ 7,106,413 |
| Net realized gain (loss) | (7,148,450) | (28,590,861) |
| Net change in unrealized appreciation (depreciation) | (31,467,960) | (56,029,421) |
| Net increase (decrease) in net assets resulting from operations | (34,444,052) | (77,513,869) |
| Distributions to shareholders: | | |
| Class A | (1,151,718) | (44,659,487) |
| Investor Class | (1,733) | (58,405) |
| Class C | (10,673) | (1,221,063) |
| Class I | (1,120,161) | (43,591,182) |
| Class R3 | (11,116) | (562,871) |
| Class R6 | (146,387) | (4,440,769) |
| | (2,441,788) | (94,533,777) |
| Distributions to shareholders from return of capital: | | |
| Class A | — | (872,279) |
| Investor Class | — | (1,141) |
| Class C | — | (23,850) |
| Class I | — | (851,413) |
| Class R3 | — | (10,994) |
| Class R6 | — | (86,736) |
| | — | (1,846,413) |
| Total distributions to shareholders | (2,441,788) | (96,380,190) |
| Capital share transactions: | | |
| Net proceeds from sales of shares | 23,795,108 | 48,489,555 |
| Net asset value of shares issued to shareholders in reinvestment of distributions | 2,260,995 | 90,519,704 |
| Cost of shares redeemed | (44,743,204) | (123,743,106) |
| Increase (decrease) in net assets derived from capital share transactions | (18,687,101) | 15,266,153 |
| Net increase (decrease) in net assets | (55,572,941) | (158,627,906) |
| Net Assets |
| Beginning of period | 308,708,889 | 467,336,795 |
| End of period | $253,135,948 | $ 308,708,889 |
The notes to the financial statements are an integral part of, and should be read in conjunction with, the financial statements.
| 14 | MainStay CBRE Real Estate Fund |
Financial Highlights selected per share data and ratios
| | Six months ended
October 31,
2023* | | Year Ended April 30, | | June 1
2019 through
April 30,
2020# | | Year Ended May 31, |
| Class A | 2023 | | 2022 | | 2021 | | 2019 | | 2018 |
| Net asset value at beginning of period | $ 7.81 | | $ 13.38 | | $ 12.20 | | $ 8.97 | | $ 12.32 | | $ 14.43 | | $ 17.81 |
| Net investment income (loss) (a) | 0.10 | | 0.18 | | 0.13 | | 0.16 | | 0.18 | | 0.21 | | 0.28 |
| Net realized and unrealized gain (loss) | (1.02) | | (2.45) | | 1.47 | | 3.59 | | (1.52) | | 1.29 | | (0.07) |
| Total from investment operations | (0.92) | | (2.27) | | 1.60 | | 3.75 | | (1.34) | | 1.50 | | 0.21 |
| Less distributions: | | | | | | | | | | | | | |
| From net investment income | (0.07) | | (0.39) | | (0.24) | | (0.20) | | (0.26) | | (0.21) | | (0.28) |
| From net realized gain on investments | — | | (2.85) | | (0.18) | | — | | (1.32) | | (3.40) | | (3.31) |
| Return of capital | — | | (0.06) | | — | | (0.32) | | (0.43) | | — | | — |
| Total distributions | (0.07) | | (3.30) | | (0.42) | | (0.52) | | (2.01) | | (3.61) | | (3.59) |
| Net asset value at end of period | $ 6.82 | | $ 7.81 | | $ 13.38 | | $ 12.20 | | $ 8.97 | | $ 12.32 | | $ 14.43 |
| Total investment return (b) | (11.86)% | | (16.94)% | | 13.06% | | 42.72% | | (13.80)% | | 12.73% | | 0.23% |
| Ratios (to average net assets)/Supplemental Data: | | | | | | | | | | | | | |
| Net investment income (loss) | 2.73%†† | | 1.79% | | 0.96% | | 1.64% | | 1.69%†† | | 1.58% | | 1.69% |
| Net expenses | 1.18%††(c) | | 1.18%(c) | | 1.18%(c) | | 1.18%(c) | | 1.17%†† (c)(d) | | 1.24% | | 1.29% |
| Expenses (before waiver/reimbursement) | 1.41%††(c) | | 1.35%(c) | | 1.30%(c) | | 1.45%(c) | | 1.36%†† (c)(d) | | 1.31% | | 1.31% |
| Portfolio turnover rate | 40% | | 65% | | 70% | | 93% | | 88% | | 82% | | 102% |
| Net assets at end of period (in 000's) | $ 113,742 | | $ 137,276 | | $ 193,441 | | $ 177,328 | | $ 149,970 | | $ 89,037 | | $ 81,475 |
| * | Unaudited. |
| # | The Fund changed its fiscal year end from May 31 to April 30. |
| †† | Annualized. |
| (a) | Per share data based on average shares outstanding during the period. |
| (b) | Total investment return is calculated exclusive of sales charges and assumes the reinvestment of dividends and distributions. For periods of less than one year, total return is not annualized. |
| (c) | In addition to the fees and expenses which the Fund bears directly, it also indirectly bears a pro-rata share of the fees and expenses of the underlying funds in which it invests. Such indirect expenses are not included in the above expense ratios. |
| (d) | Net of interest expense of less than 0.01%. |
The notes to the financial statements are an integral part of, and should be read in conjunction with, the financial statements.
15
Financial Highlights selected per share data and ratios
| | Six months ended
October 31,
2023* | | Year Ended April 30, | | February 24, 2020^ through
April 30,
2020 |
| Investor Class | 2023 | | 2022 | | 2021 | |
| Net asset value at beginning of period | $ 7.80 | | $ 13.39 | | $ 12.19 | | $ 8.97 | | $ 12.17 |
| Net investment income (loss) (a) | 0.10 | | 0.18 | | 0.13 | | 0.15 | | (0.04) |
| Net realized and unrealized gain (loss) | (1.02) | | (2.46) | | 1.48 | | 3.58 | | (3.10) |
| Total from investment operations | (0.92) | | (2.28) | | 1.61 | | 3.73 | | (3.14) |
| Less distributions: | | | | | | | | | |
| From net investment income | (0.07) | | (0.40) | | (0.23) | | (0.20) | | (0.06) |
| From net realized gain on investments | — | | (2.85) | | (0.18) | | — | | — |
| Return of capital | — | | (0.06) | | — | | (0.31) | | — |
| Total distributions | (0.07) | | (3.31) | | (0.41) | | (0.51) | | (0.06) |
| Net asset value at end of period | $ 6.81 | | $ 7.80 | | $ 13.39 | | $ 12.19 | | $ 8.97 |
| Total investment return (b) | (11.90)% | | (17.00)% | | 13.15% | | 42.41% | | (25.74)% |
| Ratios (to average net assets)/Supplemental Data: | | | | | | | | | |
| Net investment income (loss) | 2.68%†† | | 1.82% | | 0.98% | | 1.53% | | (2.55)%†† |
| Net expenses (c) | 1.26%†† | | 1.21% | | 1.15% | | 1.26% | | 1.35%†† |
| Expenses (before waiver/reimbursement) (c) | 1.35%†† | | 1.29% | | 1.26% | | 1.34% | | 1.56%†† |
| Portfolio turnover rate | 40% | | 65% | | 70% | | 93% | | 88% |
| Net assets at end of period (in 000's) | $ 178 | | $ 195 | | $ 227 | | $ 157 | | $ 103 |
| * | Unaudited. |
| ^ | Inception date. |
| †† | Annualized. |
| (a) | Per share data based on average shares outstanding during the period. |
| (b) | Total investment return is calculated exclusive of sales charges and assumes the reinvestment of dividends and distributions. For periods of less than one year, total return is not annualized. |
| (c) | In addition to the fees and expenses which the Fund bears directly, it also indirectly bears a pro-rata share of the fees and expenses of the underlying funds in which it invests. Such indirect expenses are not included in the above expense ratios. |
The notes to the financial statements are an integral part of, and should be read in conjunction with, the financial statements.
| 16 | MainStay CBRE Real Estate Fund |
Financial Highlights selected per share data and ratios
| | Six months ended
October 31,
2023* | | Year Ended April 30, | | June 1
2019 through
April 30,
2020# | | Year Ended May 31, |
| Class C | 2023 | | 2022 | | 2021 | | 2019 | | 2018 |
| Net asset value at beginning of period | $ 9.21 | | $ 15.05 | | $ 13.66 | | $ 9.96 | | $ 13.47 | | $ 15.44 | | $ 18.80 |
| Net investment income (loss) | 0.09(a) | | 0.12(a) | | 0.03(a) | | 0.07(a) | | 0.11(a) | | 0.11 | | 0.16(a) |
| Net realized and unrealized gain (loss) | (1.20) | | (2.76) | | 1.66 | | 4.02 | | (1.71) | | 1.42 | | (0.08) |
| Total from investment operations | (1.11) | | (2.64) | | 1.69 | | 4.09 | | (1.60) | | 1.53 | | 0.08 |
| Less distributions: | | | | | | | | | | | | | |
| From net investment income | (0.03) | | (0.30) | | (0.12) | | (0.15) | | (0.18) | | (0.10) | | (0.13) |
| From net realized gain on investments | — | | (2.85) | | (0.18) | | — | | (1.32) | | (3.40) | | (3.31) |
| Return of capital | — | | (0.05) | | — | | (0.24) | | (0.41) | | — | | — |
| Total distributions | (0.03) | | (3.20) | | (0.30) | | (0.39) | | (1.91) | | (3.50) | | (3.44) |
| Net asset value at end of period | $ 8.07 | | $ 9.21 | | $ 15.05 | | $ 13.66 | | $ 9.96 | | $ 13.47 | | $ 15.44 |
| Total investment return (b) | (12.07)% | | (17.58)% | | 12.27% | | 41.65% | | (14.44)% | | 11.90% | | (0.50)% |
| Ratios (to average net assets)/Supplemental Data: | | | | | | | | | | | | | |
| Net investment income (loss) | 1.97%†† | | 1.04% | | 0.22% | | 0.66% | | 1.00%†† | | 0.85% | | 0.90% |
| Net expenses | 1.93%††(c) | | 1.93%(c) | | 1.91%(c) | | 1.93%(c) | | 1.92%†† (c)(d) | | 1.99% | | 2.04% |
| Expenses (before waiver/reimbursement) | 2.10%††(c) | | 2.04%(c) | | 2.01%(c) | | 2.09%(c) | | 2.13%†† (c)(d) | | 2.06% | | 2.06% |
| Portfolio turnover rate | 40% | | 65% | | 70% | | 93% | | 88% | | 82% | | 102% |
| Net assets at end of period (in 000's) | $ 2,965 | | $ 3,963 | | $ 7,220 | | $ 10,202 | | $ 20,942 | | $ 11,216 | | $ 13,449 |
| * | Unaudited. |
| # | The Fund changed its fiscal year end from May 31 to April 30. |
| †† | Annualized. |
| (a) | Per share data based on average shares outstanding during the period. |
| (b) | Total investment return is calculated exclusive of sales charges and assumes the reinvestment of dividends and distributions. For periods of less than one year, total return is not annualized. |
| (c) | In addition to the fees and expenses which the Fund bears directly, it also indirectly bears a pro-rata share of the fees and expenses of the underlying funds in which it invests. Such indirect expenses are not included in the above expense ratios. |
| (d) | Net of interest expense of less than 0.01%. |
The notes to the financial statements are an integral part of, and should be read in conjunction with, the financial statements.
17
Financial Highlights selected per share data and ratios
| | Six months ended
October 31,
2023* | | Year Ended April 30, | | June 1
2019 through
April 30,
2020# | | Year Ended May 31, |
| Class I | 2023 | | 2022 | | 2021 | | 2019 | | 2018 |
| Net asset value at beginning of period | $ 9.86 | | $ 15.85 | | $ 14.37 | | $ 10.49 | | $ 14.08 | | $ 15.99 | | $ 19.36 |
| Net investment income (loss) (a) | 0.15 | | 0.26 | | 0.21 | | 0.22 | | 0.24 | | 0.30 | | 0.37 |
| Net realized and unrealized gain (loss) | (1.29) | | (2.91) | | 1.74 | | 4.22 | | (1.79) | | 1.45 | | (0.09) |
| Total from investment operations | (1.14) | | (2.65) | | 1.95 | | 4.44 | | (1.55) | | 1.75 | | 0.28 |
| Less distributions: | | | | | | | | | | | | | |
| From net investment income | (0.08) | | (0.43) | | (0.29) | | (0.22) | | (0.28) | | (0.26) | | (0.34) |
| From net realized gain on investments | — | | (2.85) | | (0.18) | | — | | (1.32) | | (3.40) | | (3.31) |
| Return of capital | — | | (0.06) | | — | | (0.34) | | (0.44) | | — | | — |
| Total distributions | (0.08) | | (3.34) | | (0.47) | | (0.56) | | (2.04) | | (3.66) | | (3.65) |
| Net asset value at end of period | $ 8.64 | | $ 9.86 | | $ 15.85 | | $ 14.37 | | $ 10.49 | | $ 14.08 | | $ 15.99 |
| Total investment return (b) | (11.60)% | | (16.68)% | | 13.51% | | 43.19% | | (13.54)% | | 13.08% | | 0.63% |
| Ratios (to average net assets)/Supplemental Data: | | | | | | | | | | | | | |
| Net investment income (loss) | 3.05%†† | | 2.13% | | 1.32% | | 1.92% | | 2.01%†† | | 1.95% | | 2.02% |
| Net expenses | 0.83%††(c) | | 0.83%(c) | | 0.83%(c) | | 0.83%(c) | | 0.84%†† (c)(d) | | 0.91% | | 0.91% |
| Expenses (before waiver/reimbursement) | 1.16%††(c) | | 1.10%(c) | | 1.05%(c) | | 1.20%(c) | | 1.04%†† (c)(d) | | 0.97% | | 0.92% |
| Portfolio turnover rate | 40% | | 65% | | 70% | | 93% | | 88% | | 82% | | 102% |
| Net assets at end of period (in 000's) | $ 120,349 | | $ 148,962 | | $ 241,719 | | $ 202,597 | | $ 232,730 | | $ 166,056 | | $ 311,814 |
| * | Unaudited. |
| # | The Fund changed its fiscal year end from May 31 to April 30. |
| †† | Annualized. |
| (a) | Per share data based on average shares outstanding during the period. |
| (b) | Total investment return is calculated exclusive of sales charges and assumes the reinvestment of dividends and distributions. Class I shares are not subject to sales charges. For periods of less than one year, total return is not annualized. |
| (c) | In addition to the fees and expenses which the Fund bears directly, it also indirectly bears a pro-rata share of the fees and expenses of the underlying funds in which it invests. Such indirect expenses are not included in the above expense ratios. |
| (d) | Net of interest expense of less than 0.01%. |
The notes to the financial statements are an integral part of, and should be read in conjunction with, the financial statements.
| 18 | MainStay CBRE Real Estate Fund |
Financial Highlights selected per share data and ratios
| | Six months ended
October 31,
2023* | | Year Ended April 30, | | June 1,
2019
through
April 30,
2020# | | Year Ended May 31, |
| Class R3 | 2023 | | 2022 | | 2021 | | 2019 | | 2018 |
| Net asset value at beginning of period | $ 7.71 | | $ 13.26 | | $ 12.09 | | $ 8.89 | | $ 12.23 | | $ 14.35 | | $ 17.73 |
| Net investment income (loss) | 0.09(a) | | 0.15(a) | | 0.10(a) | | 0.11(a) | | 0.15(a) | | 0.18 | | 0.23(a) |
| Net realized and unrealized gain (loss) | (1.00) | | (2.43) | | 1.46 | | 3.59 | | (1.51) | | 1.28 | | (0.06) |
| Total from investment operations | (0.91) | | (2.28) | | 1.56 | | 3.70 | | (1.36) | | 1.46 | | 0.17 |
| Less distributions: | | | | | | | | | | | | | |
| From net investment income | (0.06) | | (0.36) | | (0.21) | | (0.19) | | (0.23) | | (0.18) | | (0.24) |
| From net realized gain on investments | — | | (2.85) | | (0.18) | | — | | (1.32) | | (3.40) | | (3.31) |
| Return of capital | — | | (0.06) | | — | | (0.31) | | (0.43) | | — | | — |
| Total distributions | (0.06) | | (3.27) | | (0.39) | | (0.50) | | (1.98) | | (3.58) | | (3.55) |
| Net asset value at end of period | $ 6.74 | | $ 7.71 | | $ 13.26 | | $ 12.09 | | $ 8.89 | | $ 12.23 | | $ 14.35 |
| Total investment return (b) | (11.86)% | | (17.18)% | | 12.83% | | 42.47% | | (14.04)% | | 12.43% | | —% |
| Ratios (to average net assets)/Supplemental Data: | | | | | | | | | | | | | |
| Net investment income (loss) | 2.49%†† | | 1.56% | | 0.72% | | 1.14% | | 1.42%†† | | 1.36% | | 1.43% |
| Net expenses | 1.43%††(c) | | 1.43%(c) | | 1.43%(c) | | 1.43%(c) | | 1.42%†† (c)(d) | | 1.49% | | 1.54% |
| Expenses (before waiver/reimbursement) | 1.76%††(c) | | 1.70%(c) | | 1.65%(c) | | 1.80%(c) | | 1.61%†† (c)(d) | | 1.56% | | 1.56% |
| Portfolio turnover rate | 40% | | 65% | | 70% | | 93% | | 88% | | 82% | | 102% |
| Net assets at end of period (in 000's) | $ 1,197 | | $ 1,510 | | $ 2,672 | | $ 2,298 | | $ 2,527 | | $ 2,454 | | $ 2,965 |
| * | Unaudited. |
| # | The Fund changed its fiscal year end from May 31 to April 30. |
| †† | Annualized. |
| (a) | Per share data based on average shares outstanding during the period. |
| (b) | Total investment return is calculated exclusive of sales charges and assumes the reinvestment of dividends and distributions. Class R3 shares are not subject to sales charges. For periods of less than one year, total return is not annualized. |
| (c) | In addition to the fees and expenses which the Fund bears directly, it also indirectly bears a pro-rata share of the fees and expenses of the underlying funds in which it invests. Such indirect expenses are not included in the above expense ratios. |
| (d) | Net of interest expense of less than 0.01%. |
The notes to the financial statements are an integral part of, and should be read in conjunction with, the financial statements.
19
Financial Highlights selected per share data and ratios
| | Six months ended
October 31,
2023* | | Year Ended April 30, | | June 1
2019 through
April 30,
2020# | | Year Ended May 31, |
| Class R6 | 2023 | | 2022 | | 2021 | | 2019 | | 2018 |
| Net asset value at beginning of period | $ 9.87 | | $ 15.85 | | $ 14.37 | | $ 10.49 | | $ 14.09 | | $ 15.99 | | $ 19.36 |
| Net investment income (loss) | 0.15(a) | | 0.27(a) | | 0.22(a) | | 0.09(a) | | 0.26(a) | | 0.32 | | 0.37(a) |
| Net realized and unrealized gain (loss) | (1.29) | | (2.90) | | 1.74 | | 4.36 | | (1.80) | | 1.45 | | (0.08) |
| Total from investment operations | (1.14) | | (2.63) | | 1.96 | | 4.45 | | (1.54) | | 1.77 | | 0.29 |
| Less distributions: | | | | | | | | | | | | | |
| From net investment income | (0.09) | | (0.44) | | (0.30) | | (0.22) | | (0.30) | | (0.27) | | (0.35) |
| From net realized gain on investments | — | | (2.85) | | (0.18) | | — | | (1.32) | | (3.40) | | (3.31) |
| Return of capital | — | | (0.06) | | — | | (0.35) | | (0.44) | | — | | — |
| Total distributions | (0.09) | | (3.35) | | (0.48) | | (0.57) | | (2.06) | | (3.67) | | (3.66) |
| Net asset value at end of period | $ 8.64 | | $ 9.87 | | $ 15.85 | | $ 14.37 | | $ 10.49 | | $ 14.09 | | $ 15.99 |
| Total investment return (b) | (11.65)% | | (16.52)% | | 13.61% | | 43.35% | | (13.53)% | | 13.24% | | 0.69% |
| Ratios (to average net assets)/Supplemental Data: | | | | | | | | | | | | | |
| Net investment income (loss) | 3.17%†† | | 2.23% | | 1.40% | | 0.80% | | 2.06%†† | | 2.05% | | 2.12% |
| Net expenses | 0.74%††(c) | | 0.74%(c) | | 0.74%(c) | | 0.74%(c) | | 0.76%†† (c)(d) | | 0.83% | | 0.86% |
| Expenses (before waiver/reimbursement) | 0.84%††(c) | | 0.82%(c) | | 0.84%(c) | | 0.84%(c) | | 0.88%†† (c)(d) | | 0.89% | | 0.86% |
| Portfolio turnover rate | 40% | | 65% | | 70% | | 93% | | 88% | | 82% | | 102% |
| Net assets at end of period (in 000's) | $ 14,705 | | $ 16,802 | | $ 22,058 | | $ 15,574 | | $ 56,250 | | $ 79,327 | | $ 79,646 |
| * | Unaudited. |
| # | The Fund changed its fiscal year end from May 31 to April 30. |
| †† | Annualized. |
| (a) | Per share data based on average shares outstanding during the period. |
| (b) | Total investment return is calculated exclusive of sales charges and assumes the reinvestment of dividends and distributions. Class R6 shares are not subject to sales charges. For periods of less than one year, total return is not annualized. |
| (c) | In addition to the fees and expenses which the Fund bears directly, it also indirectly bears a pro-rata share of the fees and expenses of the underlying funds in which it invests. Such indirect expenses are not included in the above expense ratios. |
| (d) | Net of interest expense of less than 0.01%. |
The notes to the financial statements are an integral part of, and should be read in conjunction with, the financial statements.
| 20 | MainStay CBRE Real Estate Fund |
Notes to Financial Statements (Unaudited)
Note 1-Organization and Business
MainStay Funds Trust (the “Trust”) was organized as a Delaware statutory trust on April 28, 2009. The Trust is registered under the Investment Company Act of 1940, as amended (the “1940 Act”), as an open-end management investment company, and is comprised of thirty-seven funds (collectively referred to as the “Funds”). These financial statements and notes relate to the MainStay CBRE Real Estate Fund (the "Fund"), a “non-diversified” fund, as that term is defined in the 1940 Act, as interpreted or modified by regulatory authorities having jurisdiction, from time to time.
The following table lists the Fund's share classes that have been registered and commenced operations:
| Class | Commenced Operations |
| Class A | December 20, 2002 |
| Investor Class | February 24, 2020 |
| Class C | January 17, 2003 |
| Class I | December 31, 1996 |
| Class R3* | August 5, 2011 |
| Class R6 | July 3, 2014 |
| * | As of October 31, 2023, Class R3 shares are closed to new investors and, upon the close of business on December 29, 2023, Class R3 shares are closed to additional investments by existing shareholders. Additionally, Class R3 shares will be liquidated on or about February 28, 2024 (the "Liquidation Date"). It is expected that the Fund will distribute to remaining shareholders invested in Class R3 shares, on or promptly after the Liquidation Date, a liquidating distribution in cash or cash equivalents equal to the net asset value of such shares. |
Class A and Investor Class shares are offered at net asset value (“NAV”) per share plus an initial sales charge. No initial sales charge applies to investments of $1 million or more (and certain other qualified purchases) in Class A and Investor Class shares. A contingent deferred sales charge (“CDSC”) of 1.00% may be imposed on certain redemptions of Class A and Investor Class shares made within 18 months of the date of purchase on shares that were purchased without an initial sales charge. Class C shares are offered at NAV without an initial sales charge, although a 1.00% CDSC may be imposed on certain redemptions of such shares made within one year of the date of purchase of Class C shares. Class I, Class R3 and Class R6 shares are offered at NAV without a sales charge. In addition, depending upon eligibility, Class C shares convert to either Class A or Investor Class shares at the end of the calendar quarter eight years after the date they were purchased. Additionally, as disclosed in the Fund’s prospectus, Class A shares may convert automatically to Investor Class shares and Investor Class shares may convert automatically to Class A shares. Under certain circumstances and as may be permitted by the Trust’s multiple class plan pursuant to Rule 18f-3 under the 1940 Act, specified share classes of the Fund may be converted to one or more other share classes of the Fund as disclosed in the capital share transactions. See Note 9 for additional information. The six classes of shares have the same voting (except for issues that relate solely to one class), dividend, liquidation and other rights, and the same terms and conditions, except that under distribution plans pursuant to Rule 12b-1
under the 1940 Act, Class C shares are subject to higher distribution and/or service fees than Class A, Investor Class and Class R3 shares. Class I and Class R6 shares are not subject to a distribution and/or service fee.
At a meeting held on September 25-26, 2023, the Board of Trustees (the “Board”) of the Trust, after careful consideration of a number of factors and upon the recommendation of the Fund's investment adviser, New York Life Investment Management LLC (“New York Life Investments” or the "Manager"), approved a proposal to liquidate Class R3 shares of the Fund on or about February 28, 2024, pursuant to the terms of a plan of liquidation.
The Fund's investment objective is to seek total return.
Note 2–Significant Accounting Policies
The Fund is an investment company and accordingly follows the investment company accounting and reporting guidance of the Financial Accounting Standards Board (“FASB”) Accounting Standards Codification Topic 946 Financial Services—Investment Companies. The Fund prepares its financial statements in accordance with generally accepted accounting principles (“GAAP”) in the United States of America and follows the significant accounting policies described below.
(A) Securities Valuation. Investments are usually valued as of the close of regular trading on the New York Stock Exchange (the "Exchange") (usually 4:00 p.m. Eastern time) on each day the Fund is open for business ("valuation date").
Pursuant to Rule 2a-5 under the 1940 Act, the Board has designated New York Life Investments as its Valuation Designee (the "Valuation Designee"). The Valuation Designee is responsible for performing fair valuations relating to all investments in the Fund’s portfolio for which market quotations are not readily available; periodically assessing and managing material valuation risks; establishing and applying fair value methodologies; testing fair valuation methodologies; evaluating and overseeing pricing services; ensuring appropriate segregation of valuation and portfolio management functions; providing quarterly, annual and prompt reporting to the Board, as appropriate; identifying potential conflicts of interest; and maintaining appropriate records. The Valuation Designee has established a valuation committee ("Valuation Committee") to assist in carrying out the Valuation Designee’s responsibilities and establish prices of securities for which market quotations are not readily available. The Fund's and the Valuation Designee's policies and procedures ("Valuation Procedures") govern the Valuation Designee’s selection and application of methodologies for determining and calculating the fair value of Fund investments. The Valuation Designee may value the Fund's portfolio securities for which market quotations are not readily available and other Fund assets utilizing inputs from pricing services and other third-party sources. The Valuation Committee meets (in person, via electronic mail or via teleconference) on an ad-hoc basis to determine fair valuations and on a quarterly basis to review fair value events with respect to certain securities for which market quotations are
Notes to Financial Statements (Unaudited) (continued)
not readily available, including valuation risks and back-testing results, and preview reports to the Board.
The Valuation Committee establishes prices of securities for which market quotations are not readily available based on such methodologies and measurements on a regular basis after considering information that is reasonably available and deemed relevant by the Valuation Committee. The Board shall oversee the Valuation Designee and review fair valuation materials on a prompt, quarterly and annual basis and approve proposed revisions to the Valuation Procedures.
Investments for which market quotations are not readily available are valued at fair value as determined in good faith pursuant to the Valuation Procedures. A market quotation is readily available only when that quotation is a quoted price (unadjusted) in active markets for identical investments that the Fund can access at the measurement date, provided that a quotation will not be readily available if it is not reliable. "Fair value" is defined as the price the Fund would reasonably expect to receive upon selling an asset or liability in an orderly transaction to an independent buyer in the principal or most advantageous market for the asset or liability. Fair value measurements are determined within a framework that establishes a three-tier hierarchy that maximizes the use of observable market data and minimizes the use of unobservable inputs to establish a classification of fair value measurements for disclosure purposes. "Inputs" refer broadly to the assumptions that market participants would use in pricing the asset or liability, including assumptions about risk, such as the risk inherent in a particular valuation technique used to measure fair value using a pricing model and/or the risk inherent in the inputs for the valuation technique. Inputs may be observable or unobservable. Observable inputs reflect the assumptions market participants would use in pricing the asset or liability based on market data obtained from sources independent of the Fund. Unobservable inputs reflect the Fund’s own assumptions about the assumptions market participants would use in pricing the asset or liability based on the information available. The inputs or methodology used for valuing assets or liabilities may not be an indication of the risks associated with investing in those assets or liabilities. The three-tier hierarchy of inputs is summarized below.
| • | Level 1—quoted prices (unadjusted) in active markets for an identical asset or liability |
| • | Level 2—other significant observable inputs (including quoted prices for a similar asset or liability in active markets, interest rates and yield curves, prepayment speeds, credit risk, etc.) |
| • | Level 3—significant unobservable inputs (including the Fund's own assumptions about the assumptions that market participants would use in measuring fair value of an asset or liability) |
The level of an asset or liability within the fair value hierarchy is based on the lowest level of an input, both individually and in the aggregate, that is significant to the fair value measurement. The aggregate value by input level of the Fund’s assets and liabilities as of October 31, 2023, is included at the end of the Portfolio of Investments.
The Fund may use third-party vendor evaluations, whose prices may be derived from one or more of the following standard inputs, among others:
| • Broker/dealer quotes | • Benchmark securities |
| • Two-sided markets | • Reference data (corporate actions or material event notices) |
| • Bids/offers | • Monthly payment information |
| • Industry and economic events | • Reported trades |
An asset or liability for which a market quotation is not readily available is valued by methods deemed reasonable in good faith by the Valuation Committee, following the Valuation Procedures to represent fair value. Under these procedures, the Valuation Designee generally uses a market-based approach which may use related or comparable assets or liabilities, recent transactions, market multiples, book values and other relevant information. The Valuation Designee may also use an income-based valuation approach in which the anticipated future cash flows of the asset or liability are discounted to calculate fair value. Discounts may also be applied due to the nature and/or duration of any restrictions on the disposition of the asset or liability. Fair value represents a good faith approximation of the value of a security. Fair value determinations involve the consideration of a number of subjective factors, an analysis of applicable facts and circumstances and the exercise of judgment. As a result, it is possible that the fair value for a security determined in good faith in accordance with the Valuation Procedures may differ from valuations for the same security determined for other funds using their own valuation procedures. Although the Valuation Procedures are designed to value a security at the price the Fund may reasonably expect to receive upon the security's sale in an orderly transaction, there can be no assurance that any fair value determination thereunder would, in fact, approximate the amount that the Fund would actually realize upon the sale of the security or the price at which the security would trade if a reliable market price were readily available. During the six-month period ended October 31, 2023, there were no material changes to the fair value methodologies.
Securities which may be valued in this manner include, but are not limited to: (i) a security for which trading has been halted or suspended or otherwise does not have a readily available market quotation on a given day; (ii) a debt security that has recently gone into default and for which there is not a current market quotation; (iii) a security of an issuer that has entered into a restructuring; (iv) a security that has been delisted from a national exchange; (v) a security subject to trading collars for which no or limited trading takes place; and (vi) a security whose principal market has been temporarily closed at a time when, under normal conditions, it would be open. Securities valued in this manner are generally categorized as Level 2 or 3 in the hierarchy. No securities held by the Fund as of October 31, 2023, were fair valued in such a manner.
Equity securities, rights and warrants, if applicable, are valued at the last quoted sales prices as of the close of regular trading on the relevant exchange on each valuation date. Securities that are not traded on the valuation date are valued at the mean of the last quoted bid and ask prices. Prices are normally taken from the principal market in which each
| 22 | MainStay CBRE Real Estate Fund |
security trades. These securities are generally categorized as Level 1 in the hierarchy.
Investments in mutual funds, including money market funds, are valued at their respective NAVs at the close of business each day on the valuation date. These securities are generally categorized as Level 1 in the hierarchy.
Temporary cash investments acquired in excess of 60 days to maturity at the time of purchase are valued using the latest bid prices or using valuations based on a matrix system (which considers such factors as security prices, yields, maturities and ratings), both as furnished by independent pricing services. Temporary cash investments that mature in 60 days or less at the time of purchase ("Short-Term Investments") are valued using the amortized cost method of valuation, unless the use of such method would be inappropriate. The amortized cost method involves valuing a security at its cost on the date of purchase and thereafter assuming a constant amortization to maturity of the difference between such cost and the value on maturity date. Amortized cost approximates the current fair value of a security. Securities valued using the amortized cost method are not valued using quoted prices in an active market and are generally categorized as Level 2 in the hierarchy.
The information above is not intended to reflect an exhaustive list of the methodologies that may be used to value portfolio investments. The Valuation Procedures permit the use of a variety of valuation methodologies in connection with valuing portfolio investments. The methodology used for a specific type of investment may vary based on the market data available or other considerations. The methodologies summarized above may not represent the specific means by which portfolio investments are valued on any particular business day.
(B) Income Taxes. The Fund's policy is to comply with the requirements of the Internal Revenue Code of 1986, as amended (the “Internal Revenue Code”), applicable to regulated investment companies and to distribute all of its taxable income to the shareholders of the Fund within the allowable time limits.
The Manager evaluates the Fund’s tax positions to determine if the tax positions taken meet the minimum recognition threshold in connection with accounting for uncertainties in income tax positions taken or expected to be taken for the purposes of measuring and recognizing tax liabilities in the financial statements. Recognition of tax benefits of an uncertain tax position is permitted only to the extent the position is “more likely than not” to be sustained assuming examination by taxing authorities. The Manager analyzed the Fund's tax positions taken on federal, state and local income tax returns for all open tax years (for up to three tax years) and has concluded that no provisions for federal, state and local income tax are required in the Fund's financial statements. The Fund's federal, state and local income tax and federal excise tax returns for tax years for which the applicable statutes of limitations have not expired are subject to examination by the Internal Revenue Service and state and local departments of revenue.
(C) Dividends and Distributions to Shareholders. Dividends and distributions are recorded on the ex-dividend date. The Fund intends to declare and pay dividends from net investment income, if any, at least quarterly and distributions from net realized capital and currency gains, if any, at least annually. Unless a shareholder elects otherwise, all dividends and distributions are reinvested at NAV in the same class of shares of the Fund. Dividends and distributions to shareholders are determined in accordance with federal income tax regulations and may differ from determinations using GAAP.
(D) Security Transactions and Investment Income. The Fund records security transactions on the trade date. Realized gains and losses on security transactions are determined using the identified cost method. Dividend income is recognized on the ex-dividend date, net of any foreign tax withheld at the source, and interest income is accrued as earned using the effective interest rate method. Distributions received from real estate investment trusts may be classified as dividends, capital gains and/or return of capital.
Investment income and realized and unrealized gains and losses on investments of the Fund are allocated pro rata to the separate classes of shares based upon their relative net assets on the date the income is earned or realized and unrealized gains and losses are incurred.
(E) Expenses. Expenses of the Trust are allocated to the individual Funds in proportion to the net assets of the respective Funds when the expenses are incurred, except where direct allocations of expenses can be made. Expenses (other than transfer agent expenses and fees incurred under the shareholder services plans and/or the distribution plans further discussed in Note 3(B)) are allocated to separate classes of shares pro rata based upon their relative net assets on the date the expenses are incurred. The expenses borne by the Fund, including those of related parties to the Fund, are shown in the Statement of Operations.
Additionally, the Fund may invest in mutual funds, which are subject to management fees and other fees that may cause the costs of investing in mutual funds to be greater than the costs of owning the underlying securities directly. These indirect expenses of mutual funds are not included in the amounts shown as expenses in the Statement of Operations or in the expense ratios included in the Financial Highlights.
(F) Use of Estimates. In preparing financial statements in conformity with GAAP, the Manager makes estimates and assumptions that affect the reported amounts and disclosures in the financial statements. Actual results could differ from those estimates and assumptions.
(G) Foreign Currency Transactions. The Fund's books and records are maintained in U.S. dollars. Prices of securities denominated in foreign currency amounts are translated into U.S. dollars at the mean between the buying and selling rates last quoted by any major U.S. bank at the following dates:
(i) market value of investment securities, other assets and liabilities— at the valuation date; and
Notes to Financial Statements (Unaudited) (continued)
(ii) purchases and sales of investment securities, income and expenses—at the date of such transactions.
The assets and liabilities that are denominated in foreign currency amounts are presented at the exchange rates and market values at the close of the period. The realized and unrealized changes in net assets arising from fluctuations in exchange rates and market prices of securities are not separately presented.
Net realized gain (loss) on foreign currency transactions represents net currency gains or losses realized as a result of differences between the amounts of securities sale proceeds or purchase cost, dividends, interest and withholding taxes as recorded on the Fund's books, and the U.S. dollar equivalent amount actually received or paid. Net currency gains or losses from valuing such foreign currency denominated assets and liabilities, other than investments at valuation date exchange rates, are reflected in unrealized foreign exchange gains or losses.
(H) Securities Lending. In order to realize additional income, the Fund may engage in securities lending, subject to the limitations set forth in the 1940 Act and relevant guidance by the staff of the Securities and Exchange Commission (“SEC”). If the Fund engages in securities lending, the Fund will lend through its custodian, JPMorgan Chase Bank, N.A., ("JPMorgan"), acting as securities lending agent on behalf of the Fund. Under the current arrangement, JPMorgan will manage the Fund's collateral in accordance with the securities lending agency agreement between the Fund and JPMorgan, and indemnify the Fund against counterparty risk. The loans will be collateralized by cash (which may be invested in a money market fund) and/or non-cash collateral (which may include U.S. Treasury securities and/or U.S. government agency securities issued or guaranteed by the United States government or its agencies or instrumentalities) at least equal at all times to the market value of the securities loaned. The Fund bears the risk of delay in recovery of, or loss of rights in, the securities loaned. The Fund may also record a realized gain or loss on securities deemed sold due to a borrower’s inability to return securities on loan. The Fund bears the risk of any loss on investment of cash collateral. The Fund will receive compensation for lending its securities in the form of fees or it will retain a portion of interest earned on the investment of any cash collateral. The Fund will also continue to receive interest and dividends on the securities loaned and any gain or loss in the market price of the securities loaned that may occur during the term of the loan will be for the account of the Fund. Income earned from securities lending activities, if any, is reflected in the Statement of Operations. As of October 31, 2023, the Fund did not have any portfolio securities on loan.
(I) Real Estate Investments. The Fund’s investments in the real estate sector have many of the same risks as direct ownership of real estate, including the risk that the value of real estate could decline due to a variety of factors that affect the real estate market generally. These risks include, among others, declines in the value of real estate, changes in local and general economic conditions, supply and demand, interest rates, changes in zoning laws, overbuilding, extended vacancies of properties, regulatory limitations on rents, losses due to environmental
liabilities, property taxes and operating expenses. The Fund’s investments in real estate companies are particularly sensitive to economic downturns.
(J) Indemnifications. Under the Trust’s organizational documents, its officers and trustees are indemnified against certain liabilities that may arise out of performance of their duties to the Trust. Additionally, in the normal course of business, the Fund enters into contracts with third-party service providers that contain a variety of representations and warranties and that may provide general indemnifications. The Fund's maximum exposure under these arrangements is unknown, as this would involve future claims that may be made against the Fund that have not yet occurred. The Manager believes that the risk of loss in connection with these potential indemnification obligations is remote. However, there can be no assurance that material liabilities related to such obligations will not arise in the future, which could adversely impact the Fund.
Note 3–Fees and Related Party Transactions
(A) Manager and Subadvisor. New York Life Investments, a registered investment adviser and an indirect, wholly-owned subsidiary of New York Life Insurance Company ("New York Life"), serves as the Fund's Manager pursuant to an Amended and Restated Management Agreement ("Management Agreement"). The Manager provides offices, conducts clerical, recordkeeping and bookkeeping services and keeps most of the financial and accounting records required to be maintained by the Fund. Except for the portion of salaries and expenses that are the responsibility of the Fund, the Manager pays the salaries and expenses of all personnel affiliated with the Fund and certain operational expenses of the Fund. The Fund reimburses New York Life Investments in an amount equal to the portion of the compensation of the Chief Compliance Officer attributable to the Fund. CBRE Investment Management Listed Real Assets LLC ("CBRE" or the "Subadvisor"), a registered investment adviser, serves as the Subadvisor to the Fund and is responsible for the day-to-day portfolio management of the Fund. Pursuant to the terms of a Subadvisory Agreement ("Subadvisory Agreement") between New York Life Investments and CBRE, New York Life Investments pays for the services of the Subadvisor.
Pursuant to the Management Agreement, the Fund pays the Manager a monthly fee for the services performed and the facilities furnished at an annual rate of 0.75% of the Fund's average daily net assets.
New York Life Investments has contractually agreed to waive fees and/or reimburse expenses so that Total Annual Fund Operating Expenses (excluding taxes, interest, litigation, extraordinary expenses, brokerage and other transaction expenses relating to the purchase or sale of portfolio investments and acquired (underlying) fund fees and expenses) do not exceed the following percentages of average daily net assets: Class A, 1.18%; Investor Class, 1.35%; Class C, 1.93%; Class I, 0.83%; Class R3, 1.43% and Class R6, 0.74%. This agreement will remain in effect until August 31, 2024, and shall renew automatically for
| 24 | MainStay CBRE Real Estate Fund |
one-year terms unless New York Life Investments provides written notice of termination prior to the start of the next term or upon approval of the Board.
During the six-month period ended October 31, 2023, New York Life Investments earned fees from the Fund in the amount of $1,079,802 and waived fees and/or reimbursed expenses, including the waiver/reimbursement of certain class specific expenses in the amount of $387,973 and paid the Subadvisor fees in the amount of $345,995.
JPMorgan provides sub-administration and sub-accounting services to the Fund pursuant to an agreement with New York Life Investments. These services include calculating the daily NAVs of the Fund, maintaining the general ledger and sub-ledger accounts for the calculation of the Fund's NAVs, and assisting New York Life Investments in conducting various aspects of the Fund's administrative operations. For providing these services to the Fund, JPMorgan is compensated by New York Life Investments.
Pursuant to an agreement between the Trust and New York Life Investments, New York Life Investments is responsible for providing or procuring certain regulatory reporting services for the Fund. The Fund will reimburse New York Life Investments for the actual costs incurred by New York Life Investments in connection with providing or procuring these services for the Fund.
(B) Distribution and Service Fees. The Trust, on behalf of the Fund, has entered into a distribution agreement with NYLIFE Distributors LLC (the “Distributor”), an affiliate of New York Life Investments. The Fund has adopted distribution plans (the “Plans”) in accordance with the provisions of Rule 12b-1 under the 1940 Act.
Pursuant to the Class A and Investor Class Plans, the Distributor receives a monthly fee from the Class A and Investor Class shares at an annual rate of 0.25% of the average daily net assets of the Class A and Investor Class shares for distribution and/or service activities as designated by the Distributor. Pursuant to the Class C Plan, Class C shares pay the Distributor a monthly distribution fee at an annual rate of 0.75% of the average daily net assets of the Class C shares along with a service fee at an annual rate of 0.25% of the average daily net assets of the Class C shares, for a total 12b-1 fee of 1.00%. Pursuant to the Class R3 Plan, Class R3 shares pay the Distributor a monthly distribution fee at an annual rate of 0.25% of the average daily net assets of the Class R3 shares along with a service fee at an annual rate of 0.25% of the average daily net assets of the Class R3 shares, for a total 12b-1 fee of 0.50%. Class I and Class R6 shares are not subject to a distribution and/or service fee.
The Plans provide that the distribution and service fees are payable to the Distributor regardless of the amounts actually expended by the Distributor for distribution of the Fund's shares and service activities.
In accordance with the Shareholder Services Plans for the Class R3 shares, the Manager has agreed to provide, through its affiliates or independent third parties, various shareholder and administrative support
services to shareholders of the Class R3 shares. For its services, the Manager, its affiliates or independent third-party service providers are entitled to a shareholder service fee accrued daily and paid monthly at an annual rate of 0.10% of the average daily net assets of the Class R3 shares. This is in addition to any fees paid under the Class R3 Plan.
During the six-month period ended October 31, 2023, shareholder service fees incurred by the Fund were as follows:
(C) Sales Charges. The Fund was advised by the Distributor that the amount of initial sales charges retained on sales of Class A and Investor Class shares during the six-month period ended October 31, 2023, were $1,538 and $26, respectively.
The Fund was also advised that the Distributor retained CDSCs on redemptions of Class A and Class C shares during the six-month period ended October 31, 2023, of $222 and $89, respectively.
(D) Transfer, Dividend Disbursing and Shareholder Servicing Agent. NYLIM Service Company LLC, an affiliate of New York Life Investments, is the Fund's transfer, dividend disbursing and shareholder servicing agent pursuant to an agreement between NYLIM Service Company LLC and the Trust. NYLIM Service Company LLC has entered into an agreement with SS&C Global Investor & Distributor Solutions, Inc. ("SS&C"), pursuant to which SS&C performs certain transfer agent services on behalf of NYLIM Service Company LLC. New York Life Investments has contractually agreed to limit the transfer agency expenses charged to the Fund’s share classes to a maximum of 0.35% of that share class’s average daily net assets on an annual basis after deducting any applicable Fund or class-level expense reimbursement or small account fees. This agreement will remain in effect until August 31, 2024, and shall renew automatically for one-year terms unless New York Life Investments provides written notice of termination prior to the start of the next term or upon approval of the Board. During the six-month period ended October 31, 2023, transfer agent expenses incurred by the Fund and any reimbursements, pursuant to the aforementioned Transfer Agency expense limitation agreement, were as follows:
| Class | Expense | Waived |
| Class A | $211,995 | $— |
| Investor Class | 267 | — |
| Class C | 4,722 | — |
| Class I | 222,849 | — |
| Class R3 | 2,326 | — |
| Class R6 | 327 | — |
(E) Small Account Fee. Shareholders with small accounts adversely impact the cost of providing transfer agency services. In an effort to reduce total transfer agency expenses, the Fund has implemented a small account fee on certain types of accounts. As described in the Fund's prospectus, certain shareholders with an account balance of less than $1,000 ($5,000 for Class A share accounts) are charged an annual per
Notes to Financial Statements (Unaudited) (continued)
account fee of $20 (assessed semi-annually), the proceeds from which offset transfer agent fees as reflected in the Statement of Operations. This small account fee will not apply to certain types of accounts as described further in the Fund’s prospectus.
Note 4-Federal Income Tax
As of October 31, 2023, the cost and unrealized appreciation (depreciation) of the Fund’s investment portfolio, including applicable derivative contracts and other financial instruments, as determined on a federal income tax basis, were as follows:
| | Federal Tax
Cost | Gross
Unrealized
Appreciation | Gross
Unrealized
(Depreciation) | Net
Unrealized
Appreciation/
(Depreciation) |
| Investments in Securities | $269,449,994 | $23,035,470 | $(39,192,794) | $(16,157,324) |
As of April 30, 2023, for federal income tax purposes, capital loss carryforwards of $23,910,636, as shown in the table below, were available to the extent provided by the regulations to offset future realized gains of the Fund. Accordingly, no capital gains distributions are expected to be paid to shareholders until net gains have been realized in excess of such amounts.
Capital Loss
Available Through | Short-Term
Capital Loss
Amounts (000’s) | Long-Term
Capital Loss
Amounts (000’s) |
| Unlimited | $18,441 | $5,470 |
During the year ended April 30, 2023, the tax character of distributions paid as reflected in the Statements of Changes in Net Assets was as follows:
| | 2023 |
| Distributions paid from: | |
| Ordinary Income | $25,991,405 |
| Long-Term Capital Gains | 68,542,372 |
| Return of Capital | 1,846,413 |
| Total | $96,380,190 |
Note 5–Custodian
JPMorgan is the custodian of cash and securities held by the Fund. Custodial fees are charged to the Fund based on the Fund's net assets and/or the market value of securities held by the Fund and the number of certain transactions incurred by the Fund.
Note 6–Line of Credit
The Fund and certain other funds managed by New York Life Investments maintain a line of credit with a syndicate of banks in order to secure a source of funds for temporary purposes to meet unanticipated or excessive redemption requests.
Effective July 25, 2023, under the credit agreement (the “Credit Agreement”), the aggregate commitment amount is $600,000,000 with an additional uncommitted amount of $100,000,000. The commitment fee is an annual rate of 0.15% of the average commitment amount payable quarterly, regardless of usage, to JPMorgan, who serves as the agent to the syndicate. The commitment fee is allocated among the Fund and certain other funds managed by New York Life Investments based upon their respective net assets and other factors. Interest on any revolving credit loan is charged based upon the Federal Funds Rate, Daily Simple Secured Overnight Financing Rate ("SOFR") + 0.10%, or the Overnight Bank Funding Rate, whichever is higher. The Credit Agreement expires on July 23, 2024, although the Fund, certain other funds managed by New York Life Investments and the syndicate of banks may renew the Credit Agreement for an additional year on the same or different terms or enter into a credit agreement with a different syndicate of banks. Prior to July 25, 2023, the aggregate commitment amount and the commitment fee were the same as those under the current Credit Agreement. During the six-month period ended October 31, 2023, there were no borrowings made or outstanding with respect to the Fund under the Credit Agreement.
Note 7–Interfund Lending Program
Pursuant to an exemptive order issued by the SEC, the Fund, along with certain other funds managed by New York Life Investments, may participate in an interfund lending program. The interfund lending program provides an alternative credit facility that permits the Fund and certain other funds managed by New York Life Investments to lend or borrow money for temporary purposes directly to or from one another, subject to the conditions of the exemptive order. During the six-month period ended October 31, 2023, there were no interfund loans made or outstanding with respect to the Fund.
Note 8–Purchases and Sales of Securities (in 000’s)
During the six-month period ended October 31, 2023, purchases and sales of securities, other than short-term securities, were $112,798 and $128,024, respectively.
| 26 | MainStay CBRE Real Estate Fund |
Note 9–Capital Share Transactions
Transactions in capital shares for the six-month period ended October 31, 2023 and the year ended April 30, 2023, were as follows:
| Class A | Shares | Amount |
| Six-month period ended October 31, 2023: | | |
| Shares sold | 826,517 | $ 6,254,792 |
| Shares issued to shareholders in reinvestment of distributions | 147,231 | 1,070,354 |
| Shares redeemed | (1,870,786) | (14,079,601) |
| Net increase (decrease) in shares outstanding before conversion | (897,038) | (6,754,455) |
| Shares converted into Class A (See Note 1) | 4,947 | 35,849 |
| Shares converted from Class A (See Note 1) | (10,932) | (81,980) |
| Net increase (decrease) | (903,023) | $ (6,800,586) |
| Year ended April 30, 2023: | | |
| Shares sold | 1,243,603 | $ 11,821,300 |
| Shares issued to shareholders in reinvestment of distributions | 5,289,781 | 42,857,119 |
| Shares redeemed | (3,425,488) | (33,264,137) |
| Net increase (decrease) in shares outstanding before conversion | 3,107,896 | 21,414,282 |
| Shares converted into Class A (See Note 1) | 9,732 | 79,856 |
| Shares converted from Class A (See Note 1) | (2,339) | (25,965) |
| Net increase (decrease) | 3,115,289 | $ 21,468,173 |
| |
| Investor Class | Shares | Amount |
| Six-month period ended October 31, 2023: | | |
| Shares sold | 5,047 | $ 37,981 |
| Shares issued to shareholders in reinvestment of distributions | 239 | 1,733 |
| Shares redeemed | (4,574) | (34,688) |
| Net increase (decrease) in shares outstanding before conversion | 712 | 5,026 |
| Shares converted into Investor Class (See Note 1) | 635 | 4,950 |
| Shares converted from Investor Class (See Note 1) | (215) | (1,535) |
| Net increase (decrease) | 1,132 | $ 8,441 |
| Year ended April 30, 2023: | | |
| Shares sold | 6,325 | $ 57,457 |
| Shares issued to shareholders in reinvestment of distributions | 7,375 | 59,541 |
| Shares redeemed | (4,721) | (46,914) |
| Net increase (decrease) in shares outstanding before conversion | 8,979 | 70,084 |
| Shares converted into Investor Class (See Note 1) | 2,617 | 25,834 |
| Shares converted from Investor Class (See Note 1) | (3,550) | (27,928) |
| Net increase (decrease) | 8,046 | $ 67,990 |
| |
| Class C | Shares | Amount |
| Six-month period ended October 31, 2023: | | |
| Shares sold | 43,375 | $ 384,298 |
| Shares issued to shareholders in reinvestment of distributions | 1,253 | 10,492 |
| Shares redeemed | (104,052) | (928,636) |
| Net increase (decrease) in shares outstanding before conversion | (59,424) | (533,846) |
| Shares converted from Class C (See Note 1) | (3,017) | (27,282) |
| Net increase (decrease) | (62,441) | $ (561,128) |
| Year ended April 30, 2023: | | |
| Shares sold | 20,628 | $ 222,355 |
| Shares issued to shareholders in reinvestment of distributions | 130,422 | 1,240,539 |
| Shares redeemed | (195,491) | (2,175,862) |
| Net increase (decrease) in shares outstanding before conversion | (44,441) | (712,968) |
| Shares converted from Class C (See Note 1) | (5,149) | (55,087) |
| Net increase (decrease) | (49,590) | $ (768,055) |
| |
| Class I | Shares | Amount |
| Six-month period ended October 31, 2023: | | |
| Shares sold | 1,604,131 | $ 15,350,920 |
| Shares issued to shareholders in reinvestment of distributions | 113,256 | 1,042,725 |
| Shares redeemed | (2,889,685) | (27,665,601) |
| Net increase (decrease) in shares outstanding before conversion | (1,172,298) | (11,271,956) |
| Shares converted into Class I (See Note 1) | 8,942 | 84,754 |
| Shares converted from Class I (See Note 1) | (1,716) | (14,756) |
| Net increase (decrease) | (1,165,072) | $(11,201,958) |
| Year ended April 30, 2023: | | |
| Shares sold | 2,603,780 | $ 31,441,943 |
| Shares issued to shareholders in reinvestment of distributions | 4,118,909 | 41,999,850 |
| Shares redeemed | (6,874,637) | (81,717,143) |
| Net increase (decrease) in shares outstanding before conversion | (151,948) | (8,275,350) |
| Shares converted into Class I (See Note 1) | 1,964 | 25,965 |
| Shares converted from Class I (See Note 1) | (1,470) | (14,318) |
| Net increase (decrease) | (151,454) | $ (8,263,703) |
| |
Notes to Financial Statements (Unaudited) (continued)
| Class R3 | Shares | Amount |
| Six-month period ended October 31, 2023: | | |
| Shares sold | 8,483 | $ 63,530 |
| Shares issued to shareholders in reinvestment of distributions | 1,449 | 10,373 |
| Shares redeemed | (28,019) | (203,883) |
| Net increase (decrease) | (18,087) | $ (129,980) |
| Year ended April 30, 2023: | | |
| Shares sold | 28,387 | $ 272,231 |
| Shares issued to shareholders in reinvestment of distributions | 67,696 | 542,324 |
| Shares redeemed | (100,863) | (989,931) |
| Net increase (decrease) in shares outstanding before conversion | (4,780) | (175,376) |
| Shares converted from Class R3 (See Note 1) | (997) | (8,357) |
| Net increase (decrease) | (5,777) | $ (183,733) |
| |
| Class R6 | Shares | Amount |
| Six-month period ended October 31, 2023: | | |
| Shares sold | 176,812 | $ 1,703,587 |
| Shares issued to shareholders in reinvestment of distributions | 13,592 | 125,318 |
| Shares redeemed | (190,979) | (1,830,795) |
| Net increase (decrease) | (575) | $ (1,890) |
| Year ended April 30, 2023: | | |
| Shares sold | 400,769 | $ 4,674,269 |
| Shares issued to shareholders in reinvestment of distributions | 375,674 | 3,820,331 |
| Shares redeemed | (464,903) | (5,549,119) |
| Net increase (decrease) | 311,540 | $ 2,945,481 |
Note 10–Other Matters
As of the date of this report, the Fund faces a heightened level of risk associated with current uncertainty, volatility and state of economies, financial markets, rising interest rates, and labor and health conditions around the world. Events such as war, acts of terrorism, recessions, rapid inflation, the imposition of international sanctions, earthquakes, hurricanes, epidemics and pandemics and other unforeseen natural or human disasters may have broad adverse social, political and economic effects on the global economy, which could negatively impact the value of the Fund's investments. Developments that disrupt global economies and financial markets may magnify factors that affect the Fund's performance.
Note 11–Subsequent Events
In connection with the preparation of the financial statements of the Fund as of and for the six-month period ended October 31, 2023, events and transactions subsequent to October 31, 2023, through the date the financial statements were issued, have been evaluated by the Manager for possible adjustment and/or disclosure. No subsequent events requiring financial statement adjustment or disclosure have been identified.
| 28 | MainStay CBRE Real Estate Fund |
Proxy Voting Policies and Procedures and Proxy Voting Record
The Fund is required to file with the SEC its proxy voting record for the 12-month period ending June 30 on Form N-PX. A description of the policies and procedures that are used to vote proxies relating to portfolio securities of the Fund is available free of charge upon request by calling 800-624-6782 or visiting the SEC’s website at www.sec.gov. The most recent Form N-PX or proxy voting record is available free of charge upon request by calling 800-624-6782; visiting newyorklifeinvestments.com; or visiting the SEC’s website at www.sec.gov.
Shareholder Reports and Quarterly Portfolio Disclosure
The Fund is required to file its complete schedule of portfolio holdings with the SEC 60 days after its first and third fiscal quarter on Form N-PORT. The Fund's holdings report is available free of charge upon request by calling New York Life Investments at 800-624-6782.
This page intentionally left blank.
Equity
U.S. Equity
MainStay Epoch U.S. Equity Yield Fund
MainStay Fiera SMID Growth Fund
MainStay PineStone U.S. Equity Fund
MainStay S&P 500 Index Fund
MainStay Winslow Large Cap Growth Fund
MainStay WMC Enduring Capital Fund
MainStay WMC Growth Fund
MainStay WMC Small Companies Fund
MainStay WMC Value Fund
International Equity
MainStay Epoch International Choice Fund
MainStay PineStone International Equity Fund
MainStay WMC International Research Equity Fund
Emerging Markets Equity
MainStay Candriam Emerging Markets Equity Fund
Global Equity
MainStay Epoch Capital Growth Fund
MainStay Epoch Global Equity Yield Fund
MainStay PineStone Global Equity Fund
Fixed Income
Taxable Income
MainStay Candriam Emerging Markets Debt Fund
MainStay Floating Rate Fund
MainStay MacKay High Yield Corporate Bond Fund
MainStay MacKay Short Duration High Yield Fund
MainStay MacKay Strategic Bond Fund
MainStay MacKay Total Return Bond Fund
MainStay MacKay U.S. Infrastructure Bond Fund
MainStay Short Term Bond Fund
Tax-Exempt Income
MainStay MacKay California Tax Free Opportunities Fund1
MainStay MacKay High Yield Municipal Bond Fund
MainStay MacKay New York Tax Free Opportunities Fund2
MainStay MacKay Short Term Municipal Fund
MainStay MacKay Strategic Municipal Allocation Fund
MainStay MacKay Tax Free Bond Fund
Money Market
MainStay Money Market Fund
Mixed Asset
MainStay Balanced Fund
MainStay Income Builder Fund
MainStay MacKay Convertible Fund
Speciality
MainStay CBRE Global Infrastructure Fund
MainStay CBRE Real Estate Fund
MainStay Cushing MLP Premier Fund
Asset Allocation
MainStay Conservative Allocation Fund
MainStay Conservative ETF Allocation Fund
MainStay Defensive ETF Allocation Fund
MainStay Equity Allocation Fund
MainStay Equity ETF Allocation Fund
MainStay ESG Multi-Asset Allocation Fund
MainStay Growth Allocation Fund
MainStay Growth ETF Allocation Fund
MainStay Moderate Allocation Fund
MainStay Moderate ETF Allocation Fund
Manager
New York Life Investment Management LLC
New York, New York
Subadvisors
Candriam3
Strassen, Luxembourg
CBRE Investment Management Listed Real Assets LLC
Radnor, Pennsylvania
Cushing Asset Management, LP
Dallas, Texas
Epoch Investment Partners, Inc.
New York, New York
Fiera Capital Inc.
New York, New York
IndexIQ Advisors LLC3
New York, New York
MacKay Shields LLC3
New York, New York
NYL Investors LLC3
New York, New York
PineStone Asset Management Inc.
Montreal, Québec
Wellington Management Company LLP
Boston, Massachusetts
Winslow Capital Management, LLC
Minneapolis, Minnesota
Legal Counsel
Dechert LLP
Washington, District of Columbia
Independent Registered Public Accounting Firm
KPMG LLP
Philadelphia, Pennsylvania
Distributor
NYLIFE Distributors LLC3
Jersey City, New Jersey
Custodian
JPMorgan Chase Bank, N.A.
New York, New York
1.
This Fund is registered for sale in AZ, CA, NV, OR, TX, UT, WA and MI (Class A and Class I shares only), and CO, FL, GA, HI, ID, MA, MD, NH, NJ and NY (Class I shares only).
| 2. | This Fund is registered for sale in CA, CT, DE, FL, MA, NJ, NY and VT. |
| 3. | An affiliate of New York Life Investment Management LLC. |
Not part of the Semiannual Report
For more information
800-624-6782
newyorklifeinvestments.com
“New York Life Investments” is both a service mark, and the common trade name, of certain investment advisors affiliated with New York Life Insurance Company. The MainStay Funds® are managed by New York Life Investment Management LLC and distributed by NYLIFE Distributors LLC, 30 Hudson Street, Jersey City, NJ 07302, a wholly owned subsidiary of New York Life Insurance Company. NYLIFE Distributors LLC is a Member FINRA/SIPC.
©2023 NYLIFE Distributors LLC. All rights reserved.
| 5013903MS139-23 | MSCBRE10-12/23 |
(NYLIM) NL480
MainStay ETF Asset Allocation Funds
Message from the President and Semiannual Report
Unaudited | October 31, 2023
| MainStay Defensive ETF Allocation Fund |
| MainStay Conservative ETF Allocation Fund |
| MainStay Moderate ETF Allocation Fund |
| MainStay Growth ETF Allocation Fund |
| MainStay Equity ETF Allocation Fund |
| MainStay ESG Multi-Asset Allocation Fund |
Special Notice:
Beginning in July 2024, new regulations issued by the Securities and Exchange Commission (SEC) will take effect requiring open-end mutual fund companies and ETFs to (1) overhaul the content of their shareholder reports and (2) mail paper copies of the new tailored shareholder reports to shareholders who have not opted to receive these documents electronically.
If you have not yet elected to receive your shareholder reports electronically, please contact your financial intermediary or visit newyorklifeinvestments.com/accounts.
| Not FDIC/NCUA Insured | Not a Deposit | May Lose Value | No Bank Guarantee | Not Insured by Any Government Agency |
This page intentionally left blank
Message from the President
Interest rates and inflation were the primary forces driving market behavior during the six-month reporting period ended October 31, 2023, with equity indices delivering mixed performance while bond indices generally declined.
U.S. inflation levels, as measured by the Consumer Price Index, ranged between 3.0% and 4.0% throughout the reporting period, down from the peak of 9.1% in June 2022, although well above the 2.0% target set by the U.S. Federal Reserve (the “Fed”). At the same time, the benchmark federal funds rate climbed to over 5%, its highest level since the financial crisis of 2007, as the Fed attempted to drive inflation still lower. Comments from Fed members reinforced the central bank’s hawkish stance in response to surprisingly robust U.S. economic growth and rising wage pressures, thus increasing the likelihood that interest rates would stay higher for longer. International developed markets exhibited similar dynamics of persistently elevated inflation and rising interest rates.
Against a backdrop of high interest rates, political dysfunction in Washington D.C. and intensifying global geopolitical instability—including the ongoing war in Ukraine and the outbreak of hostilities in the Middle East—equity markets struggled to advance. The S&P 500® Index, a widely regarded benchmark of large-cap U.S. market performance, eked out a slight gain, bolstered by the strong performance of mega-cap, growth-oriented, technology-related shares as investors flocked to companies creating the infrastructure for developments in artificial intelligence. However, smaller-cap stocks and value-oriented shares trended lower. Among industry sectors, information technology posted the strongest gains, followed by consumer discretionary, which rose in response to healthy consumer spending trends, while energy shares benefited from rising petroleum prices. All other sectors lost ground. Utilities declined most sharply as rising interest rates undermined the appeal of high-yielding stocks, while real estate came under pressure from
rising mortgage rates and weak levels of office occupancy, and consumer staples declined as market sentiment turned away from defensive, value-oriented businesses. International equities broadly trailed their U.S. counterparts as economic growth in the rest of world generally lagged that of the United States, and as the U.S. dollar rose in value compared to most other global currencies.
Bond prices were driven lower by rising yields and increasing expectations of high interest rates for an extended period of time. The U.S. yield curve steepened, with the 30-year Treasury yield exceeding 5% for the first time in more than a decade. The yield curve remained inverted, with the 10-year Treasury yield ending the period at 4.88%, compared with 5.07% for the 2-year Treasury yield. Corporate bonds outperformed long-term Treasury bonds, but still trended lower under pressure from rising yields and an uptick in default rates. Among corporates, lower-credit-quality instruments performed relatively well compared to their higher-credit-quality counterparts, while floating rate securities performed better still.
In the face of today’s uncertain market environment, New York Life Investments remains dedicated to providing the guidance, resources and investment solutions you need to pursue your financial goals.
Thank you for trusting us to help meet your investment needs.
Sincerely,
Kirk C. Lehneis
President
The opinions expressed are as of the date of this report and are subject to change. There is no guarantee that any forecast made will come to pass. This material does not constitute investment advice and is not intended as an endorsement of any specific investment. Past performance is no guarantee of future results.
Not part of the Semiannual Report
Investors should refer to each Fund’s Summary Prospectus and/or Prospectus and consider each Fund’s investment objectives, strategies, risks, charges and expenses carefully before investing. The Summary Prospectus and/or Prospectus contain this and other information about each Fund. You may obtain copies of each Fund’s Summary Prospectus, Prospectus and Statement of Additional Information, which includes information about the MainStay Funds Trust's Trustees, free of charge, upon request, by calling toll-free 800-624-6782, by writing to NYLIFE Distributors LLC, Attn: MainStay Marketing Department, 30 Hudson Street, Jersey City, NJ 07302 or by sending an e-mail to MainStayShareholderServices@nylim.com. These documents are also available via the MainStay Funds’ website at newyorklifeinvestments.com. Please read each Fund’s Summary Prospectus and/or Prospectus carefully before investing.
MainStay Defensive ETF Allocation Fund
Investment and Performance Comparison (Unaudited)
Performance data quoted represents past performance. Past performance is no guarantee of future results. Because of market volatility and other factors, current performance may be lower or higher than the figures shown. Investment return and principal value will fluctuate, and as a result, when shares are redeemed, they may be worth more or less than their original cost. The graph below depicts the historical performance of Class I shares of the Fund. Performance will vary from class to class based on differences in class-specific expenses and sales charges. For performance information current to the most recent month-end, please call 800-624-6782 or visit newyorklifeinvestments.com.
The performance table and graph do not reflect the deduction of taxes that a shareholder would pay on distributions or Fund share redemptions. Total returns reflect maximum applicable sales charges as indicated in the table below, if any, changes in share price, and reinvestment of dividend and capital gain distributions. The graph assumes the initial investment amount shown below and reflects the deduction of all sales charges that would have applied for the period of investment. Performance figures may reflect certain fee waivers and/or expense limitations, without which total returns may have been lower. For more information on share classes and current fee waivers and/or expense limitations (if any), please refer to the Notes to Financial Statements.
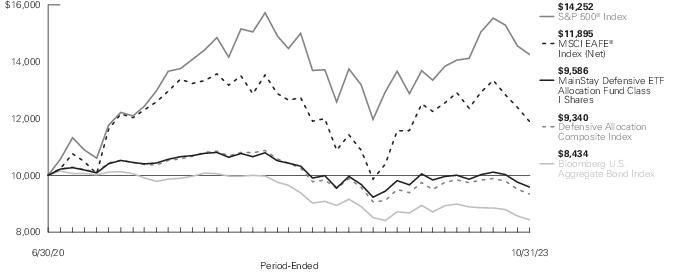
| Average Annual Total Returns for the Period-Ended October 31, 2023* |
| Class | Sales Charge | | Inception
Date | Six
Months1 | One
Year | Since
Inception | Gross
Expense
Ratio2 |
| Class A Shares | Maximum 3.00% Initial Sales Charge | With sales charges | 6/30/2020 | -7.18% | -1.90% | -2.42% | 2.12% |
| | | Excluding sales charges | | -4.30 | 1.14 | -1.53 | 2.12 |
| Class C Shares | Maximum 1.00% CDSC | With sales charges | 6/30/2020 | -5.61 | -0.58 | -2.26 | 2.97 |
| | if redeemed Within One Year of Purchase | Excluding sales charges | | -4.67 | 0.39 | -2.26 | 2.97 |
| Class I Shares | No Sales Charge | | 6/30/2020 | -4.18 | 1.51 | -1.26 | 1.87 |
| Class R3 Shares3 | No Sales Charge | | 6/30/2020 | -4.38 | 0.90 | -1.85 | 2.49 |
| SIMPLE Class Shares | No Sales Charge | | 8/31/2020 | -4.44 | 0.86 | -2.66 | 2.46 |
| * | The Fund will be liquidated on or about February 28, 2024 (the "Liquidation Date"). It is expected that the Fund will distribute to remaining shareholders, on or promptly after the Liquidation Date, a liquidating distribution in cash, cash equivalents, or portfolio securities equal to the shareholder’s proportionate interest in the net assets of the Fund. |
| 1. | Not annualized. |
| 2. | The gross expense ratios presented reflect the Fund’s “Total Annual Fund Operating Expenses” from the most recent Prospectus, as supplemented, and may differ from other expense ratios disclosed in this report. |
| 3. | As of October 31, 2023, Class R3 shares are closed to new investors and, upon the close of business on December 29, 2023, Class R3 shares are closed to additional investments by existing shareholders. |
The footnotes on the next page are an integral part of the table and graph and should be carefully read in conjunction with them.
| Benchmark Performance* | Six
Months1 | One
Year | Since
Inception |
| Bloomberg U.S. Aggregate Bond Index2 | -6.13% | 0.36% | -4.98% |
| S&P 500® Index3 | 1.39 | 10.14 | 11.21 |
| MSCI EAFE® Index (Net)4 | -7.88 | 14.40 | 5.34 |
| Defensive Allocation Composite Index5 | -5.08 | 2.54 | -2.03 |
| Morningstar Conservative Allocation Category Average6 | -3.58 | 1.81 | 0.10 |
| * | Returns for indices reflect no deductions for fees, expenses or taxes, except for foreign withholding taxes where applicable. Results assume reinvestment of all dividends and capital gains. An investment cannot be made directly in an index. |
| 1. | Not annualized. |
| 2. | The Fund has selected the Bloomberg U.S. Aggregate Bond Index as the primary broad-based securities market index for comparison purposes. The Bloomberg U.S. Aggregate Bond Index is a broad-based benchmark that measures the investment grade, U.S. dollar-denominated, fixed-rate taxable bond market, including Treasuries, government-related and corporate securities, mortgage-backed securities (agency fixed-rate and hybrid adjustable rate mortgage pass-throughs), asset-backed securities and commercial mortgage-backed securities. |
| 3. | The S&P 500® Index is the Fund's secondary benchmark. The S&P 500® Index is widely regarded as the standard index for measuring large-cap U.S. stock market performance. |
| 4. | The Fund has selected the MSCI EAFE® Index (Net) as an additional benchmark. The MSCI EAFE® Index (Net) consists of international stocks representing the developed world outside of North America. |
| 5. | The Fund has selected the Defensive Allocation Composite Index as an additional benchmark. The Defensive Allocation Index consists of the S&P 500® Index, the MSCI EAFE® Index (Net) and the Bloomberg U.S. Aggregate Bond Index weighted 15%, 5% and 80%, respectively. |
| 6. | The Morningstar Conservative Allocation Category Average is representative of funds in allocation categories that seek to provide both income and capital appreciation by primarily investing in multiple asset classes, including stocks, bonds, and cash. These conservative strategies prioritize preservation of capital over appreciation. They typically expect volatility similar to a strategic equity exposure between 15% and 30%. Results are based on average total returns of similar funds with all dividends and capital gain distributions reinvested. |
The footnotes on the preceding page are an integral part of the table and graph and should be carefully read in conjunction with them.
| 6 | MainStay Defensive ETF Allocation Fund |
Cost in Dollars of a $1,000 Investment in MainStay Defensive ETF Allocation Fund (Unaudited)
The example below is intended to describe the fees and expenses borne by shareholders during the six-month period from May 1, 2023 to October 31, 2023, and the impact of those costs on your investment.
Example
As a shareholder of the Fund you incur two types of costs: (1) transaction costs, including exchange fees and sales charges (loads) on purchases (as applicable), and (2) ongoing costs, including management fees, distribution and/or service (12b-1) fees and other Fund expenses (as applicable). This example is intended to help you understand your ongoing costs (in dollars) of investing in the Fund and to compare these costs with the ongoing costs of investing in other mutual funds. The example is based on an investment of $1,000 made at the beginning of the six-month period and held for the entire period from May 1, 2023 to October 31, 2023.
This example illustrates your Fund’s ongoing costs in two ways:
Actual Expenses
The second and third data columns in the table below provide information about actual account values and actual expenses. You may use the information in these columns, together with the amount you invested, to estimate the expenses that you paid during the six months ended October 31, 2023. Simply divide your account value by $1,000 (for example, an
$8,600 account value divided by $1,000 = 8.6), then multiply the result by the number under the heading entitled “Expenses Paid During Period” to estimate the expenses you paid on your account during this period.
Hypothetical Example for Comparison Purposes
The fourth and fifth data columns in the table below provide information about hypothetical account values and hypothetical expenses based on the Fund’s actual expense ratio and an assumed rate of return of 5% per year before expenses, which is not the Fund’s actual return. The hypothetical account values and expenses may not be used to estimate the actual ending account balances or expenses you paid for the six-month period shown. You may use this information to compare the ongoing costs of investing in the Fund with the ongoing costs of investing in other mutual funds. To do so, compare this 5% hypothetical example with the 5% hypothetical examples that appear in the shareholder reports of the other mutual funds.
Please note that the expenses shown in the table are meant to highlight your ongoing costs only and do not reflect any transactional costs, such as exchange fees or sales charges (loads). Therefore, the fourth and fifth data columns of the table are useful in comparing ongoing costs only and will not help you determine the relative total costs of owning different funds. In addition, if these transactional costs were included, your costs would have been higher.
| Share Class | Beginning
Account
Value
5/1/23 | Ending Account
Value (Based
on Actual
Returns and
Expenses)
10/31/23 | Expenses
Paid
During
Period1 | Ending Account
Value (Based
on Hypothetical
5% Annualized
Return and
Actual Expenses)
10/31/23 | Expenses
Paid
During
Period1 | Net Expense
Ratio
During
Period2 |
| Class A Shares | $1,000.00 | $957.00 | $3.94 | $1,021.12 | $4.06 | 0.80% |
| Class C Shares | $1,000.00 | $953.30 | $7.61 | $1,017.34 | $7.86 | 1.55% |
| Class I Shares | $1,000.00 | $958.20 | $2.71 | $1,022.37 | $2.80 | 0.55% |
| Class R3 Shares | $1,000.00 | $956.20 | $5.65 | $1,019.36 | $5.84 | 1.15% |
| SIMPLE Class Shares | $1,000.00 | $955.60 | $5.16 | $1,019.86 | $5.33 | 1.05% |
| 1. | Expenses are equal to the Fund’s annualized expense ratio of each class multiplied by the average account value over the period, divided by 366 and multiplied by 184 (to reflect the six-month period). The table above represents the actual expenses incurred during the six-month period. In addition to the fees and expenses which the Fund bears directly, it also indirectly bears a pro rata share of the fees and expenses of the underlying funds in which it invests. Such indirect expenses are not included in the above-reported expense figures. |
| 2. | Expenses are equal to the Fund's annualized expense ratio to reflect the six-month period. |
Asset Diversification as of October 31, 2023 (Unaudited)
| Equity Funds | 20.4 % |
| Fixed Income Funds | 78.1 |
| Short-Term Investments | 31.6 |
| Other Assets, Less Liabilities | (30.1) |
See Portfolio of Investments beginning on page 12 for specific holdings within these categories. The Fund’s holdings are subject to change.
| 8 | MainStay Defensive ETF Allocation Fund |
Portfolio Management Discussion and Analysis (Unaudited)
Questions answered by portfolio managers Jae S. Yoon, CFA, Jonathan Swaney, Poul Kristensen, CFA, and Amit Soni, CFA, of New York Life Investment Management LLC, the Fund’s Manager.
How did MainStay Defensive ETF Allocation Fund perform relative to its benchmarks and peer group during the six months ended October 31, 2023?
For the six months ended October 31, 2023, Class I shares of MainStay Defensive ETF Allocation Fund returned −4.18%, outperforming the −6.13% return of the Fund’s primary benchmark, the Bloomberg U.S. Aggregate Bond Index, and underperforming the 1.39% return of the S&P 500® Index, which is the Fund’s secondary benchmark. Over the same period, Class I shares of the Fund outperformed the −7.88% return of the MSCI EAFE® Index (Net), and the −5.08% return of the Defensive Allocation Composite Index, both of which are additional benchmarks of the Fund. For the six months ended October 31, 2023, Class I shares of the Fund underperformed the −3.58% return of the Morningstar Conservative Allocation Category Average.1
What factors affected the Fund’s relative performance during the reporting period?
The Fund is a “fund of funds" that seeks to achieve its investment objective by investing in unaffiliated, passively managed, exchange-traded funds (“Underlying ETFs”). The Underlying ETFs may invest in U.S. equities, international equities and fixed-income instruments, making comparisons to any single index generally less suitable than a weighted combination of indices, which is a more useful yardstick by which to measure performance. During the reporting period, asset class policy was the primary determinant of the Fund’s relative performance.
Fund management internally maintains a blend of indices that are taken into consideration when managing the Fund. During the reporting period, the Fund moderately underperformed the internally maintained blend of indices, primarily due to asset class policy decisions.
At the start of the reporting period, the Fund held slightly underweight exposure to equities in anticipation of a possible recession induced by a combination of higher interest rates, reduced willingness on the part of banks to lend, and the fall in money supply accompanying the quantitative tightening program undertaken by the U.S. Federal Reserve (the “Fed”). However, equities rallied sharply from May through July 2023, detracting from the Fund’s relative performance. We gradually reduced the Fund’s underweight exposure to equities over the summer and
then eliminated the position altogether, lessening the benefit that came with the market’s retreat from August through October.
Relative performance lost substantially more ground as a result of the Fund’s underweight exposure to certain mega-cap technology-related companies. The companies, tagged “the Magnificent 7,” included Alphabet, Amazon.com, Apple, Meta Platforms, Microsoft, NVIDIA and Tesla. All were richly valued, implying rapid earnings growth ahead. We were skeptical that the companies, already among the largest firms in the world with dominant positions in their respective industries, could meet these high growth expectations. Accordingly, we shifted the Fund out of capitalization-weighted large-cap index products, favoring other options—most notably an equally weighted version of the S&P 500® Index. However, ongoing enthusiasm for the potential of artificial intelligence (“AI”) to bolster the Magnificent 7’s business prospects supported rising stock prices. From May through October 2023, the Bloomberg Magnificent 7 Total Return Index2 returned 21%, compared to a loss of 5% for the S&P 500® Equal Weight Index.3
Other positions detracting from relative performance included a number of defensive holdings adopted in anticipation of an economic contraction and more challenging conditions in capital markets. These included exposure to low volatility stocks, exposure to traditionally defensive sectors (such as health care), extending duration4 in Treasury bonds and shying away from speculative-grade credit (such as bank loans).
Some positions made positive contributions to relative performance. (Contributions take weightings and total returns into account.) A tilt into energy stocks benefited from a rise in the price of oil—presumably a result of Saudi production cuts along with rising geopolitical tensions at least partly tied to the Palestinian-Israeli conflict. Other positives included a decisive preference for Japan over Europe within the developed international space and exposure to uranium miners.
How did you allocate the Fund’s assets during the reporting period and why?
Stock/bond blend: As mentioned above, in anticipation of a recession that would drive down stock prices through both reduced corporate earnings and lower valuation multiples, the Fund held modestly underweight exposure to equities for much of the reporting period. We gradually reduced that underweight
| 1. | See "Investment and Performance Comparison" for other share class returns, which may be higher or lower than Class I share returns, and for more information on benchmark and peer group returns. |
| 2. | The Bloomberg Magnificent 7 Total Return Index is an equal-dollar weighted equity benchmark consisting of a fixed basket of 7 widely-traded companies classified in the United States and representing the Communications, Consumer Discretionary and Technology sectors as defined by Bloomberg Industry Classification System (BICS). An investment cannot be made directly in an index. |
| 3. | The S&P 500® Equal Weight Index (“EWI”) is the equal-weight version of the widely-used S&P 500® Index. The S&P 500® EWI includes the same constituents as the capitalization weighted S&P 500® Index, but each company in the S&P 500® EWI is allocated a fixed weight, or 0.2% of the Index total at each quarterly rebalance. An investment cannot be made directly in an index. |
| 4. | Duration is a measure of the price sensitivity of a fixed-income investment to changes in interest rates. Duration is expressed as a number of years and is considered a more accurate sensitivity gauge than average maturity. |
position as the reporting period wore on and the expected economic contraction failed to materialize. As of the end of the reporting period, the Fund held slightly greater total equity exposure than the Defensive Allocation Composite Index.
Duration: With yields having risen considerably in the preceding three years, we had increased the Fund’s duration to very close to neutral by the end of April 2023. Yields continued to rise over the summer and into the fall as investors worried about heavy new U.S. Treasury issuance, a “higher for longer” monetary policy, stubborn inflationary pressures and rising yields abroad. We believed that a combination of waning consumption, normalized supply chains and improving productivity would eventually curb inflation and yields would drop sharply. Accordingly, we added duration as yields climbed, such that the Fund’s duration was slightly more than six months long as of the end of the reporting period.
Equity style: Whereas we shifted to a neutral posture in terms of the stock/bond blend during the reporting period, we maintained a conservative stance in terms of the Fund’s equity style in order to protect against the potential onset of a recession. Specifically, the Fund favored value over growth, with a particular emphasis on defensive sectors (health care and utilities) and characteristics (low volatility).
Equity size: Being skeptical of the ability of mega-cap market leaders to consistently deliver the high rates of earnings growth required to justify their relative valuations, we steered the Fund away from these names to a degree. In particular, we increased exposure to the S&P 500® EWI in which market cap does not affect the weight of each constituent. Whereas the Magnificent 7 represented approximately 30% of the S&P 500® Index, they represented only 1.4% of the S&P 500® EWI. We further limited the impact of mega-cap market leaders on the Fund through exposure to the S&P Mid Cap 400® Index.5
Geographic exposure: In our view, European equities appeared vulnerable during the reporting period. Persistently high wage growth seemed likely to compel the European Central Bank to maintain restrictive monetary policy for the foreseeable future, while their export-heavy economies wrestled with declining global trade volumes, and energy price spikes remained a risk amid elevated geopolitical tensions. Conversely, the Bank of Japan remained engaged in accommodative policy, with Japanese exports boosted by a weak yen and shareholder governance increasingly prioritized by company management, largely in the form of share buybacks. With these trends in mind, we tilted the Fund away from European markets in favor of Japanese stocks, with net exposure to non-U.S. stocks held close to neutral.
Energy: The Fund maintained exposure to upstream energy producers and oilfield/gas field service providers as a commodity play to provide an additional inflation hedge. These holdings also positioned the Fund to take advantage of opportunities for domestic producers to benefit as Western nations revisit energy policy to source supplies from stable and friendly jurisdictions rather than autocratic petrostates that present national security risks. While the Fund’s energy position was small, it had a disproportionately positive impact on performance.
How did the Fund’s allocations change over the course of the reporting period?
The single largest change to the Fund’s allocations involved the introduction and subsequent growth of a position in iShares® 20+ Year Treasury Bond ETF, which we used to extend the Fund’s duration as bond yields rose. The purchases were funded from cash. The next largest change involved an increased allocation to Invesco S&P 500® Equal Weight ETF. This was also funded from cash, as we sought to remove the Fund’s underweight equity position without significantly increasing exposure to the Magnificent 7.
All other adjustments proved comparatively modest. They included the closure of positions in SPDR® S&P® Oil & Gas Exploration ETF and VanEck Oil Services ETF (the latter of which was later restored); a reduction in holdings of iShares® Core S&P Small-Cap ETF and Invesco Senior Loan ETF; an increase in exposure to iShares® MSCI Japan ETF; and an allocation to Utilities Select Sector SPDR® Fund.
The Fund also opened a small position in Global X Uranium ETF, which invests primarily in uranium mining firms. Climate change concerns and the limitations of renewable energy are driving a reconsideration of nuclear energy sources, for which fuel supply is somewhat limited. We foresee a supply/demand imbalance developing that is likely to support businesses involved with extracting and processing uranium.
During the reporting period, which Underlying Equity ETFs had the highest total returns and which Underlying Equity ETFs had the lowest total returns?
Of those Underlying Equity ETFs held for the entire reporting period, only iShares® MSCI Japan ETF generated a positive return. The smallest losses came from iShares® Core S&P Mid-Cap ETF and Schwab U.S. Mid-Cap ETF.
Underlying Equity ETFs held for the entire reporting period that saw the largest declines included iShares® Core MSCI EAFE ETF, Invesco S&P 500® Low Volatility ETF and Health Care Select Sector SPDR® Fund.
| 5. | The S&P Mid Cap 400® Index measures the performance of the mid-cap segment of the U.S. market. The Index is composed of 400 constituent companies. An investment cannot be made directly in an index. |
| 10 | MainStay Defensive ETF Allocation Fund |
Which Underlying Equity ETFs were the strongest positive contributors to the Fund’s performance and which Underlying Equity ETFs were particularly weak?
Contribution to return is a function not only of Underlying ETF performance and average allocation, but also the variation in that allocation across time. The Underlying Equity ETFs making the largest positive contributions to return included VanEck Oil Services ETF, SPDR® S&P® Oil & Gas Exploration & Production ETF and Global X Uranium ETF. The most significant detractors included Invesco S&P 500® Equal Weight ETF, iShares® Core MSCI EAFE ETF and iShares® Core S&P Small-Cap ETF.
During the reporting period, which Underlying Fixed-Income ETFs had the highest total returns and which Underlying Fixed-Income ETFs had the lowest total returns?
The Underlying Fixed-Income ETFs posting the highest total returns included Invesco Senior Loan ETF, a cash sweep account and iShares® 0–5 Year High Yield Corporate Bond ETF. Among Underlying Fixed-Income ETFs held for the entire reporting period, those posting the steepest losses included Schwab U.S. Aggregate Bond ETF, iShares® Core U.S. Aggregate Bond ETF and iShares® Broad USD Investment Grade Corporate Bond ETF.
Which Underlying Fixed-Income ETFs were the strongest positive contributors to the Fund’s performance and which Underlying Fixed-Income ETFs were particularly weak?
The Underlying Fixed-Income ETFs making the largest contributions to return included Invesco Senior Loan ETF, a cash sweep account and iShares® 0–5 Year High Yield Corporate Bond ETF. The most significant detractors from absolute performance included Schwab U.S. Aggregate Bond ETF and iShares® Core U.S. Aggregate Bond ETF, followed by iShares® 20+ Year Treasury Bond ETF.
How was the Fund positioned at the end of the reporting period?
For some time now, we have held the view that a recession in response to dramatic monetary policy tightening and the expiration of pandemic era support programs is all but inevitable. That remains the case today, and indications of the onset of this
recession are beginning to accumulate. We firmly expect corporate profits will decline over the next several quarters, eventually taking stock prices down with them, while also driving down Treasury yields and pushing credit spreads6 out. Accordingly, the Fund maintains a relatively defensive posture.
Having been reminded of just how difficult it is to call a market top, we are resistant to being underweight equities, so we have parked the Fund in neutral along this dimension for the time being, although we intend to exploit any significant pullbacks—should they arrive—by building an overweight position.
Defensive positioning is more clearly visible within asset classes. Most notably, we have extended the Fund’s duration considerably through purchases of a long-dated Treasury bond ETF, with the expectation that it will be the beneficiary of a flight to quality as economic and market conditions deteriorate. Additionally, we are maintaining exposure to bank loans at a below-benchmark weight, and skewing holdings of high yield bonds to favor shorter maturity instruments, which tend to exhibit less volatility and smaller losses than longer-maturity bonds.
On the equity side, the Fund favors sectors that have generally exhibited lower volatility and retained their value better during drawdowns. Prominent among these are utilities and health care.
| 6. | The terms “spread” and “yield spread” may refer to the difference in yield between a security or type of security and comparable U.S. Treasury issues. The terms may also refer to the difference in yield between two specific securities or types of securities at a given time. The term “credit spread” typically refers to the difference in yield between corporate or municipal bonds (or a specific category of these bonds) and comparable U.S. Treasury issues. |
None of Schwab Strategic Trust, Schwab® U.S. Aggregate Bond ETF, Schwab U.S. Mid-Cap ETF, or Charles Schwab Investment Management, Inc. make any representations regarding the advisability of investing in MainStay Defensive ETF Allocation Fund.
iShares® is a registered trademark of BlackRock (BlackRock, Inc. and its subsidiaries). Neither BlackRock nor the iShares® Funds make any representations regarding the advisability of investing in MainStay Defensive ETF Allocation Fund.
The opinions expressed are those of the portfolio managers as of the date of this report and are subject to change. There is no guarantee that any forecasts will come to pass. This material does not constitute investment advice and is not intended as an endorsement of any specific investment.
Portfolio of Investments October 31, 2023†^(Unaudited)
| | Shares | | Value |
| Investment Companies 98.5% |
| Equity Funds 20.4% |
| Global X Uranium ETF (a) | 4,191 | | $ 112,486 |
| Health Care Select Sector SPDR Fund | 829 | | 103,244 |
| Invesco S&P 500 Equal Weight ETF (a) | 3,046 | | 413,738 |
| Invesco S&P 500 Low Volatility ETF (a) | 1,752 | | 102,282 |
| iShares Core MSCI EAFE ETF | 1,650 | | 102,894 |
| iShares Core S&P Mid-Cap ETF | 755 | | 178,180 |
| iShares Core S&P Small-Cap ETF | 2,841 | | 252,536 |
| iShares MSCI Japan ETF | 5,279 | | 311,250 |
| Materials Select Sector SPDR Fund | 1,343 | | 102,149 |
| Schwab U.S. Mid-Cap ETF | 707 | | 45,262 |
| Utilities Select Sector SPDR Fund | 1,754 | | 104,696 |
| Vanguard Mega Cap ETF | 1,056 | | 157,619 |
| Vanguard Mid-Cap ETF | 886 | | 175,791 |
Total Equity Funds
(Cost $2,221,839) | | | 2,162,127 |
| Fixed Income Funds 78.1% |
| Invesco Senior Loan ETF (a) | 40,948 | | 851,718 |
| iShares 0-5 Year High Yield Corporate Bond ETF (a) | 17,086 | | 692,495 |
| iShares 20+ Year Treasury Bond ETF | 6,776 | | 566,338 |
| iShares Broad USD High Yield Corporate Bond ETF (a) | 10,846 | | 370,825 |
| iShares Broad USD Investment Grade Corporate Bond ETF | 23,667 | | 1,113,296 |
| iShares Core U.S. Aggregate Bond ETF (a) | 24,061 | | 2,221,072 |
| Schwab U.S. Aggregate Bond ETF | 51,207 | | 2,222,896 |
| Vanguard Short-Term Bond ETF | 2,889 | | 216,733 |
Total Fixed Income Funds
(Cost $9,303,203) | | | 8,255,373 |
Total Investment Companies
(Cost $11,525,042) | | | 10,417,500 |
| Short-Term Investments 31.6% |
| Affiliated Investment Company 1.2% |
| MainStay U.S. Government Liquidity Fund, 5.275% (b) | 128,554 | | 128,554 |
| Unaffiliated Investment Company 30.4% |
| Invesco Government & Agency Portfolio, 5.357% (b)(c) | 3,208,445 | | 3,208,445 |
Total Short-Term Investments
(Cost $3,336,999) | | | 3,336,999 |
Total Investments
(Cost $14,862,041) | 130.1% | | 13,754,499 |
| Other Assets, Less Liabilities | (30.1) | | (3,179,414) |
| Net Assets | 100.0% | | $ 10,575,085 |
The notes to the financial statements are an integral part of, and should be read in conjunction with, the financial statements.
| 12 | MainStay Defensive ETF Allocation Fund |
| † | Percentages indicated are based on Fund net assets. |
| ^ | Industry classifications may be different than those used for compliance monitoring purposes. |
| (a) | All or a portion of this security was held on loan. As of October 31, 2023, the aggregate market value of securities on loan was $3,170,346; the total market value of collateral held by the Fund was $3,232,307. The market value of the collateral held included non-cash collateral in the form of U.S. Treasury securities with a value of $23,862. The Fund received cash collateral with a value of $3,208,445. (See Note 2(G)) |
| (b) | Current yield as of October 31, 2023. |
| (c) | Represents a security purchased with cash collateral received for securities on loan. |
Investments in Affiliates (in 000's)
Investments in issuers considered to be affiliate(s) of the Fund during the six-month period ended October 31, 2023 for purposes of Section 2(a)(3) of the Investment Company Act of 1940, as amended, were as follows:
| Affiliated Investment Companies | Value,
Beginning
of Period | Purchases
at Cost | Proceeds
from
Sales | Net
Realized
Gain/(Loss)
on Sales | Change in
Unrealized
Appreciation/
(Depreciation) | Value,
End of
Period | Dividend
Income | Other
Distributions | Shares
End of
Period |
| MainStay U.S. Government Liquidity Fund | $ 935 | $ 1,946 | $ (2,752) | $ — | $ — | $ 129 | $ 15 | $ — | 129 |
| Abbreviation(s): |
| EAFE—Europe, Australasia and Far East |
| ETF—Exchange-Traded Fund |
| MSCI—Morgan Stanley Capital International |
| SPDR—Standard & Poor’s Depositary Receipt |
| USD—United States Dollar |
The following is a summary of the fair valuations according to the inputs used as of October 31, 2023, for valuing the Fund’s assets:
| Description | Quoted
Prices in
Active
Markets for
Identical
Assets
(Level 1) | | Significant
Other
Observable
Inputs
(Level 2) | | Significant
Unobservable
Inputs
(Level 3) | | Total |
| Asset Valuation Inputs | | | | | | | |
| Investments in Securities (a) | | | | | | | |
| Investment Companies | | | | | | | |
| Equity Funds | $ 2,162,127 | | $ — | | $ — | | $ 2,162,127 |
| Fixed Income Funds | 8,255,373 | | — | | — | | 8,255,373 |
| Total Investment Companies | 10,417,500 | | — | | — | | 10,417,500 |
| Short-Term Investments | | | | | | | |
| Affiliated Investment Company | 128,554 | | — | | — | | 128,554 |
| Unaffiliated Investment Company | 3,208,445 | | — | | — | | 3,208,445 |
| Total Short-Term Investments | 3,336,999 | | — | | — | | 3,336,999 |
| Total Investments in Securities | $ 13,754,499 | | $ — | | $ — | | $ 13,754,499 |
| (a) | For a complete listing of investments, see the Portfolio of Investments. |
The notes to the financial statements are an integral part of, and should be read in conjunction with, the financial statements.
13
Statement of Assets and Liabilities as of October 31, 2023 (Unaudited)
| Assets |
Investment in unaffiliated securities, at value
(identified cost $14,733,487) including securities on loan of $3,170,346 | $13,625,945 |
Investment in affiliated investment companies, at value
(identified cost $128,554) | 128,554 |
| Receivables: | |
| Manager (See Note 3) | 7,087 |
| Fund shares sold | 3,263 |
| Securities lending | 3,108 |
| Dividends | 934 |
| Other assets | 44,663 |
| Total assets | 13,813,554 |
| Liabilities |
| Cash collateral received for securities on loan | 3,208,445 |
| Payables: | |
| Professional fees | 15,074 |
| Custodian | 5,215 |
| Shareholder communication | 4,963 |
| NYLIFE Distributors (See Note 3) | 2,586 |
| Transfer agent (See Note 3) | 1,810 |
| Trustees | 27 |
| Accrued expenses | 349 |
| Total liabilities | 3,238,469 |
| Net assets | $10,575,085 |
| Composition of Net Assets |
| Shares of beneficial interest outstanding (par value of $.001 per share) unlimited number of shares authorized | $ 1,217 |
| Additional paid-in-capital | 12,176,875 |
| | 12,178,092 |
| Total distributable earnings (loss) | (1,603,007) |
| Net assets | $10,575,085 |
| Class A | |
| Net assets applicable to outstanding shares | $9,358,234 |
| Shares of beneficial interest outstanding | 1,077,018 |
| Net asset value per share outstanding | $ 8.69 |
| Maximum sales charge (3.00% of offering price) | 0.27 |
| Maximum offering price per share outstanding | $ 8.96 |
| Class C | |
| Net assets applicable to outstanding shares | $ 212,235 |
| Shares of beneficial interest outstanding | 24,442 |
| Net asset value and offering price per share outstanding | $ 8.68 |
| Class I | |
| Net assets applicable to outstanding shares | $ 39,409 |
| Shares of beneficial interest outstanding | 4,535 |
| Net asset value and offering price per share outstanding | $ 8.69 |
| Class R3 | |
| Net assets applicable to outstanding shares | $ 72,370 |
| Shares of beneficial interest outstanding | 8,331 |
| Net asset value and offering price per share outstanding | $ 8.69 |
| SIMPLE Class | |
| Net assets applicable to outstanding shares | $ 892,837 |
| Shares of beneficial interest outstanding | 102,724 |
| Net asset value and offering price per share outstanding | $ 8.69 |
The notes to the financial statements are an integral part of, and should be read in conjunction with, the financial statements.
| 14 | MainStay Defensive ETF Allocation Fund |
Statement of Operations for the six months ended October 31, 2023 (Unaudited)
| Investment Income (Loss) |
| Income | |
| Dividends-unaffiliated | $ 199,559 |
| Dividends-affiliated | 15,086 |
| Securities lending, net | 10,798 |
| Total income | 225,443 |
| Expenses | |
| Manager (See Note 3) | 10,882 |
| Registration | 33,677 |
| Professional fees | 18,058 |
| Distribution/Service—Class A (See Note 3) | 12,155 |
| Distribution/Service—Class C (See Note 3) | 1,133 |
| Distribution/Service—Class R3 (See Note 3) | 188 |
| Distribution/Service—SIMPLE Class (See Note 3) | 2,036 |
| Custodian | 7,857 |
| Transfer agent (See Note 3) | 4,752 |
| Trustees | 128 |
| Shareholder service (See Note 3) | 38 |
| Miscellaneous | 2,116 |
| Total expenses before waiver/reimbursement | 93,020 |
| Expense waiver/reimbursement from Manager (See Note 3) | (47,544) |
| Net expenses | 45,476 |
| Net investment income (loss) | 179,967 |
| Realized and Unrealized Gain (Loss) |
| Net realized gain (loss) on unaffiliated investments | (63,720) |
| Net change in unrealized appreciation (depreciation) on unaffiliated investments | (583,073) |
| Net realized and unrealized gain (loss) | (646,793) |
| Net increase (decrease) in net assets resulting from operations | $(466,826) |
The notes to the financial statements are an integral part of, and should be read in conjunction with, the financial statements.
15
Statements of Changes in Net Assets
for the six months ended October 31, 2023 (Unaudited) and the year ended April 30, 2023
| | Six months
ended
October 31,
2023 | Year
ended
April 30,
2023 |
| Increase (Decrease) in Net Assets |
| Operations: | | |
| Net investment income (loss) | $ 179,967 | $ 295,424 |
| Net realized gain (loss) | (63,720) | (350,565) |
| Net change in unrealized appreciation (depreciation) | (583,073) | 138,487 |
| Net increase (decrease) in net assets resulting from operations | (466,826) | 83,346 |
| Distributions to shareholders: | | |
| Class A | (158,459) | (337,870) |
| Class C | (2,780) | (5,491) |
| Class I | (713) | (1,493) |
| Class R3 | (1,076) | (1,517) |
| SIMPLE Class | (12,349) | (16,132) |
| Total distributions to shareholders | (175,377) | (362,503) |
| Capital share transactions: | | |
| Net proceeds from sales of shares | 1,793,549 | 3,467,813 |
| Net asset value of shares issued to shareholders in reinvestment of distributions | 174,702 | 361,248 |
| Cost of shares redeemed | (1,162,571) | (2,959,484) |
| Increase (decrease) in net assets derived from capital share transactions | 805,680 | 869,577 |
| Net increase (decrease) in net assets | 163,477 | 590,420 |
| Net Assets |
| Beginning of period | 10,411,608 | 9,821,188 |
| End of period | $10,575,085 | $10,411,608 |
The notes to the financial statements are an integral part of, and should be read in conjunction with, the financial statements.
| 16 | MainStay Defensive ETF Allocation Fund |
Financial Highlights selected per share data and ratios
| | Six months ended
October 31,
2023* | | Year Ended April 30, | | June 30, 2020^ through
April 30, |
| Class A | 2023 | | 2022 | | 2021 |
| Net asset value at beginning of period | $ 9.23 | | $ 9.50 | | $ 10.44 | | $ 10.00 |
| Net investment income (loss) (a) | 0.15 | | 0.27 | | 0.18 | | 0.13 |
| Net realized and unrealized gain (loss) | (0.54) | | (0.21) | | (0.84) | | 0.41 |
| Total from investment operations | (0.39) | | 0.06 | | (0.66) | | 0.54 |
| Less distributions: | | | | | | | |
| From net investment income | (0.15) | | (0.26) | | (0.19) | | (0.10) |
| From net realized gain on investments | — | | (0.07) | | (0.09) | | — |
| Total distributions | (0.15) | | (0.33) | | (0.28) | | (0.10) |
| Net asset value at end of period | $ 8.69 | | $ 9.23 | | $ 9.50 | | $ 10.44 |
| Total investment return (b) | (4.30)% | | 0.74% | | (6.49)% | | 5.38% |
| Ratios (to average net assets)/Supplemental Data: | | | | | | | |
| Net investment income (loss) | 3.35%†† | | 2.96% | | 1.79% | | 1.45%†† |
| Net expenses (c) | 0.80%†† | | 0.80% | | 0.80% | | 0.80%†† |
| Expenses (before waiver/reimbursement) (c) | 1.67%†† | | 1.98% | | 1.75% | | 2.36%†† |
| Portfolio turnover rate | 15% | | 64% | | 79% | | 69% |
| Net assets at end of period (in 000’s) | $ 9,358 | | $ 9,400 | | $ 9,366 | | $ 8,572 |
| * | Unaudited. |
| ^ | Inception date. |
| †† | Annualized. |
| (a) | Per share data based on average shares outstanding during the period. |
| (b) | Total investment return is calculated exclusive of sales charges and assumes the reinvestment of dividends and distributions. For periods of less than one year, total return is not annualized. |
| (c) | In addition to the fees and expenses which the Fund bears directly, it also indirectly bears a pro-rata share of the fees and expenses of the underlying funds in which it invests. Such indirect expenses are not included in the above expense ratios. |
The notes to the financial statements are an integral part of, and should be read in conjunction with, the financial statements.
17
Financial Highlights selected per share data and ratios
| | Six months ended
October 31,
2023* | | Year Ended April 30, | | June 30, 2020^ through
April 30, |
| Class C | 2023 | | 2022 | | 2021 |
| Net asset value at beginning of period | $ 9.22 | | $ 9.49 | | $ 10.44 | | $ 10.00 |
| Net investment income (loss) (a) | 0.12 | | 0.21 | | 0.11 | | 0.06 |
| Net realized and unrealized gain (loss) | (0.55) | | (0.22) | | (0.85) | | 0.43 |
| Total from investment operations | (0.43) | | (0.01) | | (0.74) | | 0.49 |
| Less distributions: | | | | | | | |
| From net investment income | (0.11) | | (0.19) | | (0.12) | | (0.05) |
| From net realized gain on investments | — | | (0.07) | | (0.09) | | — |
| Total distributions | (0.11) | | (0.26) | | (0.21) | | (0.05) |
| Net asset value at end of period | $ 8.68 | | $ 9.22 | | $ 9.49 | | $ 10.44 |
| Total investment return (b) | (4.67)% | | (0.02)% | | (7.28)% | | 4.85% |
| Ratios (to average net assets)/Supplemental Data: | | | | | | | |
| Net investment income (loss) | 2.60%†† | | 2.32% | | 1.07% | | 0.74%†† |
| Net expenses (c) | 1.55%†† | | 1.55% | | 1.55% | | 1.55%†† |
| Expenses (before waiver/reimbursement) (c) | 2.48%†† | | 2.83% | | 2.60% | | 3.13%†† |
| Portfolio turnover rate | 15% | | 64% | | 79% | | 69% |
| Net assets at end of period (in 000’s) | $ 212 | | $ 229 | | $ 117 | | $ 162 |
| * | Unaudited. |
| ^ | Inception date. |
| †† | Annualized. |
| (a) | Per share data based on average shares outstanding during the period. |
| (b) | Total investment return is calculated exclusive of sales charges and assumes the reinvestment of dividends and distributions. For periods of less than one year, total return is not annualized. |
| (c) | In addition to the fees and expenses which the Fund bears directly, it also indirectly bears a pro-rata share of the fees and expenses of the underlying funds in which it invests. Such indirect expenses are not included in the above expense ratios. |
The notes to the financial statements are an integral part of, and should be read in conjunction with, the financial statements.
| 18 | MainStay Defensive ETF Allocation Fund |
Financial Highlights selected per share data and ratios
| | Six months ended
October 31,
2023* | | Year Ended April 30, | | June 30, 2020^ through
April 30, |
| Class I | 2023 | | 2022 | | 2021 |
| Net asset value at beginning of period | $ 9.23 | | $ 9.50 | | $ 10.44 | | $ 10.00 |
| Net investment income (loss) (a) | 0.17 | | 0.30 | | 0.24 | | 0.16 |
| Net realized and unrealized gain (loss) | (0.55) | | (0.22) | | (0.87) | | 0.40 |
| Total from investment operations | (0.38) | | 0.08 | | (0.63) | | 0.56 |
| Less distributions: | | | | | | | |
| From net investment income | (0.16) | | (0.28) | | (0.22) | | (0.12) |
| From net realized gain on investments | — | | (0.07) | | (0.09) | | — |
| Total distributions | (0.16) | | (0.35) | | (0.31) | | (0.12) |
| Net asset value at end of period | $ 8.69 | | $ 9.23 | | $ 9.50 | | $ 10.44 |
| Total investment return (b) | (4.18)% | | 1.00% | | (6.25)% | | 5.65% |
| Ratios (to average net assets)/Supplemental Data: | | | | | | | |
| Net investment income (loss) | 3.70%†† | | 3.24% | | 2.33% | | 1.82%†† |
| Net expenses (c) | 0.55%†† | | 0.55% | | 0.55% | | 0.55%†† |
| Expenses (before waiver/reimbursement) (c) | 1.41%†† | | 1.73% | | 1.50% | | 2.11%†† |
| Portfolio turnover rate | 15% | | 64% | | 79% | | 69% |
| Net assets at end of period (in 000’s) | $ 39 | | $ 41 | | $ 35 | | $ 2,040 |
| * | Unaudited. |
| ^ | Inception date. |
| †† | Annualized. |
| (a) | Per share data based on average shares outstanding during the period. |
| (b) | Total investment return is calculated exclusive of sales charges and assumes the reinvestment of dividends and distributions. Class I shares are not subject to sales charges. For periods of less than one year, total return is not annualized. |
| (c) | In addition to the fees and expenses which the Fund bears directly, it also indirectly bears a pro-rata share of the fees and expenses of the underlying funds in which it invests. Such indirect expenses are not included in the above expense ratios. |
The notes to the financial statements are an integral part of, and should be read in conjunction with, the financial statements.
19
Financial Highlights selected per share data and ratios
| | Six months ended
October 31,
2023* | | Year Ended April 30, | | June 30, 2020^ through
April 30, |
| Class R3 | 2023 | | 2022 | | 2021 |
| Net asset value at beginning of period | $ 9.22 | | $ 9.49 | | $ 10.44 | | $ 10.00 |
| Net investment income (loss) (a) | 0.14 | | 0.24 | | 0.15 | | 0.11 |
| Net realized and unrealized gain (loss) | (0.54) | | (0.22) | | (0.85) | | 0.41 |
| Total from investment operations | (0.40) | | 0.02 | | (0.70) | | 0.52 |
| Less distributions: | | | | | | | |
| From net investment income | (0.13) | | (0.22) | | (0.16) | | (0.08) |
| From net realized gain on investments | — | | (0.07) | | (0.09) | | — |
| Total distributions | (0.13) | | (0.29) | | (0.25) | | (0.08) |
| Net asset value at end of period | $ 8.69 | | $ 9.22 | | $ 9.49 | | $ 10.44 |
| Total investment return (b) | (4.38)% | | 0.36% | | (6.91)% | | 5.18% |
| Ratios (to average net assets)/Supplemental Data: | | | | | | | |
| Net investment income (loss) | 3.00%†† | | 2.58% | | 1.45% | | 1.22%†† |
| Net expenses (c) | 1.15%†† | | 1.15% | | 1.15% | | 1.15%†† |
| Expenses (before waiver/reimbursement) (c) | 2.02%†† | | 2.35% | | 2.10% | | 2.71%†† |
| Portfolio turnover rate | 15% | | 64% | | 79% | | 69% |
| Net assets at end of period (in 000’s) | $ 72 | | $ 76 | | $ 32 | | $ 26 |
| * | Unaudited. |
| ^ | Inception date. |
| †† | Annualized. |
| (a) | Per share data based on average shares outstanding during the period. |
| (b) | Total investment return is calculated exclusive of sales charges and assumes the reinvestment of dividends and distributions. Class R3 shares are not subject to sales charges. For periods of less than one year, total return is not annualized. |
| (c) | In addition to the fees and expenses which the Fund bears directly, it also indirectly bears a pro-rata share of the fees and expenses of the underlying funds in which it invests. Such indirect expenses are not included in the above expense ratios. |
The notes to the financial statements are an integral part of, and should be read in conjunction with, the financial statements.
| 20 | MainStay Defensive ETF Allocation Fund |
Financial Highlights selected per share data and ratios
| | Six months ended
October 31,
2023* | | Year Ended April 30, | | August 31, 2020^ through
April 30, |
| SIMPLE Class | 2023 | | 2022 | | 2021 |
| Net asset value at beginning of period | $ 9.23 | | $ 9.50 | | $ 10.44 | | $ 10.26 |
| Net investment income (loss) (a) | 0.14 | | 0.25 | | 0.15 | | 0.10 |
| Net realized and unrealized gain (loss) | (0.55) | | (0.22) | | (0.83) | | 0.16 |
| Total from investment operations | (0.41) | | 0.03 | | (0.68) | | 0.26 |
| Less distributions: | | | | | | | |
| From net investment income | (0.13) | | (0.23) | | (0.17) | | (0.08) |
| From net realized gain on investments | — | | (0.07) | | (0.09) | | — |
| Total distributions | (0.13) | | (0.30) | | (0.26) | | (0.08) |
| Net asset value at end of period | $ 8.69 | | $ 9.23 | | $ 9.50 | | $ 10.44 |
| Total investment return (b) | (4.44)% | | 0.47% | | (6.74)% | | 2.56% |
| Ratios (to average net assets)/Supplemental Data: | | | | | | | |
| Net investment income (loss) | 3.06%†† | | 2.68% | | 1.45% | | 1.13%†† |
| Net expenses (c) | 1.05%†† | | 1.05% | | 1.05% | | 1.05%†† |
| Expenses (before waiver/reimbursement) (c) | 1.98%†† | | 2.32% | | 2.10% | | 2.63%†† |
| Portfolio turnover rate | 15% | | 64% | | 79% | | 69% |
| Net assets at end of period (in 000’s) | $ 893 | | $ 666 | | $ 271 | | $ 80 |
| * | Unaudited. |
| ^ | Inception date. |
| †† | Annualized. |
| (a) | Per share data based on average shares outstanding during the period. |
| (b) | Total investment return is calculated exclusive of sales charges and assumes the reinvestment of dividends and distributions. SIMPLE Class shares are not subject to sales charges. For periods of less than one year, total return is not annualized. |
| (c) | In addition to the fees and expenses which the Fund bears directly, it also indirectly bears a pro-rata share of the fees and expenses of the underlying funds in which it invests. Such indirect expenses are not included in the above expense ratios. |
The notes to the financial statements are an integral part of, and should be read in conjunction with, the financial statements.
21
MainStay Conservative ETF Allocation Fund
Investment and Performance Comparison (Unaudited)
Performance data quoted represents past performance. Past performance is no guarantee of future results. Because of market volatility and other factors, current performance may be lower or higher than the figures shown. Investment return and principal value will fluctuate, and as a result, when shares are redeemed, they may be worth more or less than their original cost. The graph below depicts the historical performance of Class I shares of the Fund. Performance will vary from class to class based on differences in class-specific expenses and sales charges. For performance information current to the most recent month-end, please call 800-624-6782 or visit newyorklifeinvestments.com.
The performance table and graph do not reflect the deduction of taxes that a shareholder would pay on distributions or Fund share redemptions. Total returns reflect maximum applicable sales charges as indicated in the table below, if any, changes in share price, and reinvestment of dividend and capital gain distributions. The graph assumes the initial investment amount shown below and reflects the deduction of all sales charges that would have applied for the period of investment. Performance figures may reflect certain fee waivers and/or expense limitations, without which total returns may have been lower. For more information on share classes and current fee waivers and/or expense limitations (if any), please refer to the Notes to Financial Statements.

| Average Annual Total Returns for the Period-Ended October 31, 2023 |
| Class | Sales Charge | | Inception
Date | Six
Months1 | One
Year | Since
Inception | Gross
Expense
Ratio2 |
| Class A Shares | Maximum 3.00% Initial Sales Charge | With sales charges | 6/30/2020 | -6.80% | -0.90% | -0.22% | 1.09% |
| | | Excluding sales charges | | -3.92 | 2.17 | 0.69 | 1.09 |
| Class C Shares | Maximum 1.00% CDSC | With sales charges | 6/30/2020 | -5.16 | 0.51 | -0.05 | 1.89 |
| | if redeemed Within One Year of Purchase | Excluding sales charges | | -4.21 | 1.50 | -0.05 | 1.89 |
| Class I Shares | No Sales Charge | | 6/30/2020 | -3.80 | 2.54 | 0.95 | 0.84 |
| Class R3 Shares | No Sales Charge | | 6/30/2020 | -4.09 | 1.82 | 0.33 | 1.44 |
| SIMPLE Class Shares | No Sales Charge | | 8/31/2020 | -4.04 | 1.94 | -0.94 | 1.40 |
| 1. | Not annualized. |
| 2. | The gross expense ratios presented reflect the Fund’s “Total Annual Fund Operating Expenses” from the most recent Prospectus, as supplemented, and may differ from other expense ratios disclosed in this report. |
The footnotes on the next page are an integral part of the table and graph and should be carefully read in conjunction with them.
| 22 | MainStay Conservative ETF Allocation Fund |
| Benchmark Performance* | Six
Months1 | One
Year | Since
Inception |
| Bloomberg U.S. Aggregate Bond Index2 | -6.13% | 0.36% | -4.98% |
| S&P 500® Index3 | 1.39 | 10.14 | 11.21 |
| MSCI EAFE® Index (Net)4 | -7.88 | 14.40 | 5.34 |
| Conservative Allocation Composite Index5 | -4.04 | 4.72 | 0.93 |
| Morningstar Moderately Conservative Allocation Category Average6 | -3.57 | 2.73 | 1.60 |
| * | Returns for indices reflect no deductions for fees, expenses or taxes, except for foreign withholding taxes where applicable. Results assume reinvestment of all dividends and capital gains. An investment cannot be made directly in an index. |
| 1. | Not annualized. |
| 2. | The Fund has selected the Bloomberg U.S. Aggregate Bond Index as the primary broad-based securities market index for comparison purposes. The Bloomberg U.S. Aggregate Bond Index is a broad-based benchmark that measures the investment grade, U.S. dollar-denominated, fixed-rate taxable bond market, including Treasuries, government-related and corporate securities, mortgage-backed securities (agency fixed-rate and hybrid adjustable rate mortgage pass-throughs), asset-backed securities and commercial mortgage-backed securities. |
| 3. | The S&P 500® Index is the Fund's secondary benchmark. The S&P 500® Index is widely regarded as the standard index for measuring large-cap U.S. stock market performance. |
| 4. | The Fund has selected the MSCI EAFE® Index (Net) as an additional benchmark. The MSCI EAFE® Index (Net) consists of international stocks representing the developed world outside of North America. |
| 5. | The Fund has selected the Conservative Allocation Composite Index as an additional benchmark. The Conservative Allocation Composite Index consists of the S&P 500® Index, the MSCI EAFE® Index (Net) and the Bloomberg U.S. Aggregate Bond Index weighted 30%, 10% and 60%, respectively. |
| 6. | The Morningstar Moderately Conservative Allocation Category Average is a representative of funds in allocation categories that seek to provide both income and capital appreciation by primarily investing in multiple asset classes, including stocks, bonds, and cash. These moderately conservative strategies prioritize preservation of capital over appreciation. They typically expect volatility similar to a strategic equity exposure between 30% and 50%. Results are based on average total returns of similar funds with all dividends and capital gain distributions reinvested. |
The footnotes on the preceding page are an integral part of the table and graph and should be carefully read in conjunction with them.
Cost in Dollars of a $1,000 Investment in MainStay Conservative ETF Allocation Fund (Unaudited)
The example below is intended to describe the fees and expenses borne by shareholders during the six-month period from May 1, 2023 to October 31, 2023, and the impact of those costs on your investment.
Example
As a shareholder of the Fund you incur two types of costs: (1) transaction costs, including exchange fees and sales charges (loads) on purchases (as applicable), and (2) ongoing costs, including management fees, distribution and/or service (12b-1) fees and other Fund expenses (as applicable). This example is intended to help you understand your ongoing costs (in dollars) of investing in the Fund and to compare these costs with the ongoing costs of investing in other mutual funds. The example is based on an investment of $1,000 made at the beginning of the six-month period and held for the entire period from May 1, 2023 to October 31, 2023.
This example illustrates your Fund’s ongoing costs in two ways:
Actual Expenses
The second and third data columns in the table below provide information about actual account values and actual expenses. You may use the information in these columns, together with the amount you invested, to estimate the expenses that you paid during the six months ended October 31, 2023. Simply divide your account value by $1,000 (for example, an
$8,600 account value divided by $1,000 = 8.6), then multiply the result by the number under the heading entitled “Expenses Paid During Period” to estimate the expenses you paid on your account during this period.
Hypothetical Example for Comparison Purposes
The fourth and fifth data columns in the table below provide information about hypothetical account values and hypothetical expenses based on the Fund’s actual expense ratio and an assumed rate of return of 5% per year before expenses, which is not the Fund’s actual return. The hypothetical account values and expenses may not be used to estimate the actual ending account balances or expenses you paid for the six-month period shown. You may use this information to compare the ongoing costs of investing in the Fund with the ongoing costs of investing in other mutual funds. To do so, compare this 5% hypothetical example with the 5% hypothetical examples that appear in the shareholder reports of the other mutual funds.
Please note that the expenses shown in the table are meant to highlight your ongoing costs only and do not reflect any transactional costs, such as exchange fees or sales charges (loads). Therefore, the fourth and fifth data columns of the table are useful in comparing ongoing costs only and will not help you determine the relative total costs of owning different funds. In addition, if these transactional costs were included, your costs would have been higher.
| Share Class | Beginning
Account
Value
5/1/23 | Ending Account
Value (Based
on Actual
Returns and
Expenses)
10/31/23 | Expenses
Paid
During
Period1 | Ending Account
Value (Based
on Hypothetical
5% Annualized
Return and
Actual Expenses)
10/31/23 | Expenses
Paid
During
Period1 | Net Expense
Ratio
During
Period2 |
| Class A Shares | $1,000.00 | $960.80 | $3.94 | $1,021.12 | $4.06 | 0.80% |
| Class C Shares | $1,000.00 | $957.90 | $7.63 | $1,017.34 | $7.86 | 1.55% |
| Class I Shares | $1,000.00 | $962.00 | $2.71 | $1,022.37 | $2.80 | 0.55% |
| Class R3 Shares | $1,000.00 | $959.10 | $5.66 | $1,019.36 | $5.84 | 1.15% |
| SIMPLE Class Shares | $1,000.00 | $959.60 | $5.17 | $1,019.86 | $5.33 | 1.05% |
| 1. | Expenses are equal to the Fund’s annualized expense ratio of each class multiplied by the average account value over the period, divided by 366 and multiplied by 184 (to reflect the six-month period). The table above represents the actual expenses incurred during the six-month period. In addition to the fees and expenses which the Fund bears directly, it also indirectly bears a pro rata share of the fees and expenses of the underlying funds in which it invests. Such indirect expenses are not included in the above-reported expense figures. |
| 2. | Expenses are equal to the Fund's annualized expense ratio to reflect the six-month period. |
| 24 | MainStay Conservative ETF Allocation Fund |
Asset Diversification as of October 31, 2023 (Unaudited)
| Equity Funds | 40.5 % |
| Fixed Income Funds | 58.7 |
| Short-Term Investments | 23.5 |
| Other Assets, Less Liabilities | (22.7) |
See Portfolio of Investments beginning on page 29 for specific holdings within these categories. The Fund’s holdings are subject to change.
Portfolio Management Discussion and Analysis (Unaudited)
Questions answered byportfolio managers Jae S. Yoon, CFA, Jonathan Swaney, Poul Kristensen, CFA, and Amit Soni, CFA, of New York Life Investment Management LLC, the Fund’s Manager.
How did MainStay Conservative ETF Allocation Fund perform relative to its benchmarks and peer group during the six months ended October 31, 2023?
For the six months ended October 31, 2023, Class I shares of MainStay Conservative ETF Allocation Fund returned −3.80%, outperforming the −6.13% return of the Fund’s primary benchmark, the Bloomberg U.S. Aggregate Bond Index, and underperforming the 1.39% return of the S&P 500® Index, which is the Fund’s secondary benchmark. Over the same period, Class I shares of the Fund outperformed the −7.88% return of the MSCI EAFE® Index (Net), and the −4.04% return of the Conservative Allocation Composite Index, both of which are additional benchmarks of the Fund. For the six months ended October 31, 2023, Class I shares of the Fund underperformed the −3.57% return of the Morningstar Moderately Conservative Allocation Category Average.1
What factors affected the Fund’s relative performance during the reporting period?
The Fund is a “fund of funds" that seeks to achieve its investment objective by investing in unaffiliated, passively managed, exchange-traded funds (“Underlying ETFs”). The Underlying ETFs may invest in U.S. equities, international equities and fixed-income instruments, making comparisons to any single index generally less suitable than a weighted combination of indices, which is a more useful yardstick by which to measure performance. During the reporting period, asset class policy was the primary determinant of the Fund’s relative performance.
Fund management internally maintains a blend of indices that are taken into consideration when managing the Fund. During the reporting period, the Fund moderately underperformed the internally maintained blend of indices, primarily due to asset class policy decisions.
At the start of the reporting period, the Fund held slightly underweight exposure to equities in anticipation of a possible recession induced by a combination of higher interest rates, reduced willingness on the part of banks to lend, and the fall in money supply accompanying the quantitative tightening program undertaken by the U.S. Federal Reserve (the “Fed”). However, equities rallied sharply from May through July 2023, detracting from the Fund’s relative performance. We gradually reduced the Fund’s underweight exposure to equities over the summer and
then eliminated the position altogether, lessening the benefit that came with the market’s retreat from August through October.
Relative performance lost substantially more ground as a result of the Fund’s underweight exposure to certain mega-cap technology-related companies. The companies, tagged “the Magnificent 7,” included Alphabet, Amazon.com, Apple, Meta Platforms, Microsoft, NVIDIA and Tesla. All were richly valued, implying rapid earnings growth ahead. We were skeptical that the companies, already among the largest firms in the world with dominant positions in their respective industries, could meet these high growth expectations. Accordingly, we shifted the Fund out of capitalization-weighted large-cap index products, favoring other options—most notably an equally weighted version of the S&P 500® Index. However, ongoing enthusiasm for the potential of artificial intelligence (“AI”) to bolster the Magnificent 7’s business prospects supported rising stock prices. From May through October 2023, the Bloomberg Magnificent 7 Total Return Index2 returned 21%, compared to a loss of 5% for the S&P 500® Equal Weight Index.3
Other positions detracting from relative performance included a number of defensive holdings adopted in anticipation of an economic contraction and more challenging conditions in capital markets. These included exposure to low volatility stocks, exposure to traditionally defensive sectors (such as health care), extending duration4 in Treasury bonds and shying away from speculative-grade credit (such as bank loans).
Some positions made positive contributions to relative performance. (Contributions take weightings and total returns into account.) A tilt into energy stocks benefited from a rise in the price of oil—presumably a result of Saudi production cuts along with rising geopolitical tensions at least partly tied to the Palestinian-Israeli conflict. Other positives included a decisive preference for Japan over Europe within the developed international space and exposure to uranium miners.
How did you allocate the Fund’s assets during the reporting period and why?
Stock/bond blend: As mentioned above, in anticipation of a recession that would drive down stock prices through both reduced corporate earnings and lower valuation multiples, the Fund held modestly underweight exposure to equities for much of the reporting period. We gradually reduced that underweight
| 1. | See "Investment and Performance Comparison" for other share class returns, which may be higher or lower than Class I share returns, and for more information on benchmark and peer group returns. |
| 2. | The Bloomberg Magnificent 7 Total Return Index is an equal-dollar weighted equity benchmark consisting of a fixed basket of 7 widely-traded companies classified in the United States and representing the Communications, Consumer Discretionary and Technology sectors as defined by Bloomberg Industry Classification System (BICS). An investment cannot be made directly in an index. |
| 3. | The S&P 500® Equal Weight Index (“EWI”) is the equal-weight version of the widely-used S&P 500® Index. The S&P 500® EWI includes the same constituents as the capitalization weighted S&P 500® Index, but each company in the S&P 500® EWI is allocated a fixed weight, or 0.2% of the Index total at each quarterly rebalance. An investment cannot be made directly in an index. |
| 4. | Duration is a measure of the price sensitivity of a fixed-income investment to changes in interest rates. Duration is expressed as a number of years and is considered a more accurate sensitivity gauge than average maturity. |
| 26 | MainStay Conservative ETF Allocation Fund |
position as the reporting period wore on and the expected economic contraction failed to materialize. As of the end of the reporting period, the Fund held slightly greater total equity exposure than the Conservative Allocation Composite Index.
Duration: With yields having risen considerably in the preceding three years, we had increased the Fund’s duration to very close to neutral by the end of April 2023. Yields continued to rise over the summer and into the fall as investors worried about heavy new U.S. Treasury issuance, a “higher for longer” monetary policy, stubborn inflationary pressures and rising yields abroad. We believed that a combination of waning consumption, normalized supply chains and improving productivity would eventually curb inflation and yields would drop sharply. Accordingly, we added duration as yields climbed, such that the Fund’s duration was slightly more than six months long as of the end of the reporting period.
Equity style: Whereas we shifted to a neutral posture in terms of the stock/bond blend during the reporting period, we maintained a conservative stance in terms of the Fund’s equity style in order to protect against the potential onset of a recession. Specifically, the Fund favored value over growth, with a particular emphasis on defensive sectors (health care and utilities) and characteristics (low volatility).
Equity size: Being skeptical of the ability of mega-cap market leaders to consistently deliver the high rates of earnings growth required to justify their relative valuations, we steered the Fund away from these names to a degree. In particular, we increased exposure to the S&P 500® EWI in which market cap does not affect the weight of each constituent. Whereas the Magnificent 7 represented approximately 30% of the S&P 500® Index, they represented only 1.4% of the S&P 500® EWI. We further limited the impact of mega-cap market leaders on the Fund through exposure to the S&P Mid Cap 400® Index.5
Geographic exposure: In our view, European equities appeared vulnerable during the reporting period. Persistently high wage growth seemed likely to compel the European Central Bank to maintain restrictive monetary policy for the foreseeable future, while their export-heavy economies wrestled with declining global trade volumes, and energy price spikes remained a risk amid elevated geopolitical tensions. Conversely, the Bank of Japan remained engaged in accommodative policy, with Japanese exports boosted by a weak yen and shareholder governance increasingly prioritized by company management, largely in the form of share buybacks. With these trends in mind, we tilted the Fund away from European markets in favor of Japanese stocks, with net exposure to non-U.S. stocks held close to neutral.
Energy: The Fund maintained exposure to upstream energy producers and oilfield/gas field service providers as a commodity play to provide an additional inflation hedge. These holdings also positioned the Fund to take advantage of opportunities for domestic producers to benefit as Western nations revisit energy policy to source supplies from stable and friendly jurisdictions rather than autocratic petrostates that present national security risks. While the Fund’s energy position was small, it had a disproportionately positive impact on performance.
How did the Fund’s allocations change over the course of the reporting period?
The single largest change to the Fund’s allocations involved the introduction and subsequent growth of a position in iShares® 20+ Year Treasury Bond ETF, which we used to extend the Fund’s duration as bond yields rose. The purchases were funded from cash. The next largest change involved an increased allocation to Invesco S&P 500® Equal Weight ETF. This was also funded from cash, as we sought to remove the Fund’s underweight equity position without significantly increasing exposure to the Magnificent 7.
All other adjustments proved comparatively modest. They included the closure of positions in SPDR® S&P® Oil & Gas Exploration ETF and VanEck Oil Services ETF (the latter of which was later restored); a reduction in holdings of iShares® Core S&P Small-Cap ETF and Invesco Senior Loan ETF; an increase in exposure to iShares® MSCI Japan ETF; and an allocation to Utilities Select Sector SPDR® Fund.
The Fund also opened a small position in Global X Uranium ETF, which invests primarily in uranium mining firms. Climate change concerns and the limitations of renewable energy are driving a reconsideration of nuclear energy sources, for which fuel supply is somewhat limited. We foresee a supply/demand imbalance developing that is likely to support businesses involved with extracting and processing uranium.
During the reporting period, which Underlying Equity ETFs had the highest total returns and which Underlying Equity ETFs had the lowest total returns?
Of those Underlying Equity ETFs held for the entire reporting period, only iShares® MSCI Japan ETF generated a positive return. The smallest losses came from iShares® Core S&P Mid-Cap ETF and Schwab U.S. Mid-Cap ETF.
Underlying Equity ETFs held for the entire reporting period that saw the largest declines included iShares® Core MSCI EAFE ETF, Invesco S&P 500® Low Volatility ETF and Health Care Select Sector SPDR® Fund.
| 5. | The S&P Mid Cap 400® Index measures the performance of the mid-cap segment of the U.S. market. The Index is composed of 400 constituent companies. An investment cannot be made directly in an index. |
Which Underlying Equity ETFs were the strongest positive contributors to the Fund’s performance and which Underlying Equity ETFs were particularly weak?
Contribution to return is a function not only of Underlying ETF performance and average allocation, but also the variation in that allocation across time. The Underlying Equity ETFs making the largest positive contributions to return included VanEck Oil Services ETF, SPDR® S&P® Oil & Gas Exploration & Production ETF and Global X Uranium ETF. The most significant detractors included Invesco S&P 500® Equal Weight ETF, iShares® Core MSCI EAFE ETF and iShares® Core S&P Small-Cap ETF.
During the reporting period, which Underlying Fixed-Income ETFs had the highest total returns and which Underlying Fixed-Income ETFs had the lowest total returns?
The Underlying Fixed-Income ETFs posting the highest total returns included Invesco Senior Loan ETF, a cash sweep account and iShares® 0–5 Year High Yield Corporate Bond ETF. Among Underlying Fixed-Income ETFs held for the entire reporting period, those posting the steepest losses included Schwab U.S. Aggregate Bond ETF, iShares® Core U.S. Aggregate Bond ETF and iShares® Broad USD Investment Grade Corporate Bond ETF.
Which Underlying Fixed-Income ETFs were the strongest positive contributors to the Fund’s performance and which Underlying Fixed-Income ETFs were particularly weak?
The Underlying Fixed-Income ETFs making the largest contributions to return included Invesco Senior Loan ETF, a cash sweep account and iShares® 0–5 Year High Yield Corporate Bond ETF. The most significant detractors from absolute performance included Schwab U.S. Aggregate Bond ETF and iShares® Core U.S. Aggregate Bond ETF, followed by iShares® 20+ Year Treasury Bond ETF.
How was the Fund positioned at the end of the reporting period?
For some time now, we have held the view that a recession in response to dramatic monetary policy tightening and the expiration of pandemic era support programs is all but inevitable. That remains the case today, and indications of the onset of said
recession are beginning to accumulate. We firmly expect corporate profits will decline over the next several quarters, eventually taking stock prices down with them, while also driving down Treasury yields and pushing credit spreads6 out. Accordingly, the Fund maintains a relatively defensive posture.
Having been reminded of just how difficult it is to call a market top, we are resistant to being underweight equities, so we have parked the Fund in neutral along this dimension for the time being, although we intend to exploit any significant pullbacks—should they arrive—by building an overweight position.
Defensive positioning is more clearly visible within asset classes. Most notably, we have extended the Fund’s duration considerably through purchases of a long-dated Treasury bond ETF, with the expectation that it will be the beneficiary of a flight to quality as economic and market conditions deteriorate. Additionally, we are maintaining exposure to bank loans at a below-benchmark weight, and skewing holdings of high yield bonds to favor shorter maturity instruments, which tend to exhibit less volatility and smaller losses than longer-maturity bonds.
On the equity side, the Fund favors sectors that have generally exhibited lower volatility and retained their value better during drawdowns. Prominent among these are utilities and health care.
| 6. | The terms “spread” and “yield spread” may refer to the difference in yield between a security or type of security and comparable U.S. Treasury issues. The terms may also refer to the difference in yield between two specific securities or types of securities at a given time. The term “credit spread” typically refers to the difference in yield between corporate or municipal bonds (or a specific category of these bonds) and comparable U.S. Treasury issues. |
None of Schwab Strategic Trust, Schwab® U.S. Aggregate Bond ETF, Schwab U.S. Mid-Cap ETF, or Charles Schwab Investment Management, Inc. make any representations regarding the advisability of investing in MainStay Conservative ETF Allocation Fund.
iShares® is a registered trademark of BlackRock (BlackRock, Inc. and its subsidiaries). Neither BlackRock nor the iShares® Funds make any representations regarding the advisability of investing in MainStay Conservative ETF Allocation Fund.
The opinions expressed are those of the portfolio managers as of the date of this report and are subject to change. There is no guarantee that any forecasts will come to pass. This material does not constitute investment advice and is not intended as an endorsement of any specific investment.
| 28 | MainStay Conservative ETF Allocation Fund |
Portfolio of Investments October 31, 2023†^(Unaudited)
| | Shares | | Value |
| Investment Companies 99.2% |
| Equity Funds 40.5% |
| Global X Uranium ETF | 14,622 | | $ 392,454 |
| Health Care Select Sector SPDR Fund (a) | 2,880 | | 358,675 |
| Invesco S&P 500 Equal Weight ETF (a) | 12,054 | | 1,637,295 |
| Invesco S&P 500 Low Volatility ETF | 6,375 | | 372,172 |
| iShares Core MSCI EAFE ETF | 29,486 | | 1,838,747 |
| iShares Core MSCI Emerging Markets ETF | 7,984 | | 366,785 |
| iShares Core S&P Mid-Cap ETF | 3,925 | | 926,300 |
| iShares Core S&P Small-Cap ETF | 20,230 | | 1,798,245 |
| iShares MSCI Japan ETF | 19,024 | | 1,121,655 |
| Materials Select Sector SPDR Fund (a) | 4,819 | | 366,533 |
| Schwab U.S. Mid-Cap ETF | 5,440 | | 348,269 |
| Utilities Select Sector SPDR Fund | 6,307 | | 376,465 |
| Vanguard Mega Cap ETF (a) | 22,123 | | 3,302,079 |
| Vanguard Mega Cap Value ETF | 5,559 | | 550,674 |
| Vanguard Mid-Cap ETF (a) | 6,260 | | 1,242,047 |
Total Equity Funds
(Cost $14,631,962) | | | 14,998,395 |
| Fixed Income Funds 58.7% |
| Invesco Senior Loan ETF (a) | 97,544 | | 2,028,915 |
| iShares 0-5 Year High Yield Corporate Bond ETF (a) | 41,648 | | 1,687,994 |
| iShares 20+ Year Treasury Bond ETF | 24,110 | | 2,015,114 |
| iShares Broad USD High Yield Corporate Bond ETF (a) | 33,117 | | 1,132,270 |
| iShares Broad USD Investment Grade Corporate Bond ETF | 59,985 | | 2,821,694 |
| iShares Core U.S. Aggregate Bond ETF (a) | 60,975 | | 5,628,602 |
| Schwab U.S. Aggregate Bond ETF (a) | 129,644 | | 5,627,846 |
| Vanguard Short-Term Bond ETF | 10,079 | | 756,127 |
Total Fixed Income Funds
(Cost $24,431,317) | | | 21,698,562 |
Total Investment Companies
(Cost $39,063,279) | | | 36,696,957 |
| Short-Term Investments 23.5% |
| Affiliated Investment Company 0.8% |
| MainStay U.S. Government Liquidity Fund, 5.275% (b) | 292,108 | | 292,108 |
| Unaffiliated Investment Company 22.7% |
| Invesco Government & Agency Portfolio, 5.357% (b)(c) | 8,397,104 | | 8,397,104 |
Total Short-Term Investments
(Cost $8,689,212) | | | 8,689,212 |
Total Investments
(Cost $47,752,491) | 122.7% | | 45,386,169 |
| Other Assets, Less Liabilities | (22.7) | | (8,408,608) |
| Net Assets | 100.0% | | $ 36,977,561 |
The notes to the financial statements are an integral part of, and should be read in conjunction with, the financial statements.
29
Portfolio of Investments October 31, 2023†^(Unaudited) (continued)
| † | Percentages indicated are based on Fund net assets. |
| ^ | Industry classifications may be different than those used for compliance monitoring purposes. |
| (a) | All or a portion of this security was held on loan. As of October 31, 2023, the aggregate market value of securities on loan was $10,167,089; the total market value of collateral held by the Fund was $10,361,941. The market value of the collateral held included non-cash collateral in the form of U.S. Treasury securities with a value of $1,964,837. The Fund received cash collateral with a value of $8,397,104. (See Note 2(G)) |
| (b) | Current yield as of October 31, 2023. |
| (c) | Represents a security purchased with cash collateral received for securities on loan. |
Investments in Affiliates (in 000's)
Investments in issuers considered to be affiliate(s) of the Fund during the six-month period ended October 31, 2023 for purposes of Section 2(a)(3) of the Investment Company Act of 1940, as amended, were as follows:
| Affiliated Investment Companies | Value,
Beginning
of Period | Purchases
at Cost | Proceeds
from
Sales | Net
Realized
Gain/(Loss)
on Sales | Change in
Unrealized
Appreciation/
(Depreciation) | Value,
End of
Period | Dividend
Income | Other
Distributions | Shares
End of
Period |
| MainStay U.S. Government Liquidity Fund | $ 3,634 | $ 5,582 | $ (8,924) | $ — | $ — | $ 292 | $ 53 | $ — | 292 |
| Abbreviation(s): |
| EAFE—Europe, Australasia and Far East |
| ETF—Exchange-Traded Fund |
| MSCI—Morgan Stanley Capital International |
| SPDR—Standard & Poor’s Depositary Receipt |
| USD—United States Dollar |
The following is a summary of the fair valuations according to the inputs used as of October 31, 2023, for valuing the Fund’s assets:
| Description | Quoted
Prices in
Active
Markets for
Identical
Assets
(Level 1) | | Significant
Other
Observable
Inputs
(Level 2) | | Significant
Unobservable
Inputs
(Level 3) | | Total |
| Asset Valuation Inputs | | | | | | | |
| Investments in Securities (a) | | | | | | | |
| Investment Companies | | | | | | | |
| Equity Funds | $ 14,998,395 | | $ — | | $ — | | $ 14,998,395 |
| Fixed Income Funds | 21,698,562 | | — | | — | | 21,698,562 |
| Total Investment Companies | 36,696,957 | | — | | — | | 36,696,957 |
| Short-Term Investments | | | | | | | |
| Affiliated Investment Company | 292,108 | | — | | — | | 292,108 |
| Unaffiliated Investment Company | 8,397,104 | | — | | — | | 8,397,104 |
| Total Short-Term Investments | 8,689,212 | | — | | — | | 8,689,212 |
| Total Investments in Securities | $ 45,386,169 | | $ — | | $ — | | $ 45,386,169 |
| (a) | For a complete listing of investments, see the Portfolio of Investments. |
The notes to the financial statements are an integral part of, and should be read in conjunction with, the financial statements.
| 30 | MainStay Conservative ETF Allocation Fund |
Statement of Assets and Liabilities as of October 31, 2023 (Unaudited)
| Assets |
Investment in unaffiliated securities, at value
(identified cost $47,460,383) including securities on loan of $10,167,089 | $45,094,061 |
Investment in affiliated investment companies, at value
(identified cost $292,108) | 292,108 |
| Cash | 130 |
| Receivables: | |
| Fund shares sold | 27,617 |
| Securities lending | 8,454 |
| Dividends | 2,448 |
| Other assets | 46,548 |
| Total assets | 45,471,366 |
| Liabilities |
| Cash collateral received for securities on loan | 8,397,104 |
| Payables: | |
| Fund shares redeemed | 45,754 |
| Professional fees | 15,294 |
| Investment securities purchased | 9,938 |
| NYLIFE Distributors (See Note 3) | 8,826 |
| Transfer agent (See Note 3) | 6,515 |
| Custodian | 5,425 |
| Manager (See Note 3) | 2,715 |
| Shareholder communication | 2,202 |
| Accrued expenses | 32 |
| Total liabilities | 8,493,805 |
| Net assets | $36,977,561 |
| Composition of Net Assets |
| Shares of beneficial interest outstanding (par value of $.001 per share) unlimited number of shares authorized | $ 3,891 |
| Additional paid-in-capital | 41,309,654 |
| | 41,313,545 |
| Total distributable earnings (loss) | (4,335,984) |
| Net assets | $36,977,561 |
| Class A | |
| Net assets applicable to outstanding shares | $33,502,928 |
| Shares of beneficial interest outstanding | 3,525,272 |
| Net asset value per share outstanding | $ 9.50 |
| Maximum sales charge (3.00% of offering price) | 0.29 |
| Maximum offering price per share outstanding | $ 9.79 |
| Class C | |
| Net assets applicable to outstanding shares | $ 219,810 |
| Shares of beneficial interest outstanding | 23,149 |
| Net asset value and offering price per share outstanding | $ 9.50 |
| Class I | |
| Net assets applicable to outstanding shares | $ 32,487 |
| Shares of beneficial interest outstanding | 3,424 |
| Net asset value and offering price per share outstanding | $ 9.49 |
| Class R3 | |
| Net assets applicable to outstanding shares | $ 431,950 |
| Shares of beneficial interest outstanding | 45,518 |
| Net asset value and offering price per share outstanding | $ 9.49 |
| SIMPLE Class | |
| Net assets applicable to outstanding shares | $ 2,790,386 |
| Shares of beneficial interest outstanding | 294,002 |
| Net asset value and offering price per share outstanding | $ 9.49 |
The notes to the financial statements are an integral part of, and should be read in conjunction with, the financial statements.
31
Statement of Operations for the six months ended October 31, 2023 (Unaudited)
| Investment Income (Loss) |
| Income | |
| Dividends-unaffiliated | $ 626,149 |
| Dividends-affiliated | 52,515 |
| Securities lending, net | 30,879 |
| Total income | 709,543 |
| Expenses | |
| Manager (See Note 3) | 39,278 |
| Distribution/Service—Class A (See Note 3) | 44,813 |
| Distribution/Service—Class C (See Note 3) | 1,307 |
| Distribution/Service—Class R3 (See Note 3) | 1,110 |
| Distribution/Service—SIMPLE Class (See Note 3) | 6,720 |
| Registration | 34,177 |
| Professional fees | 18,886 |
| Transfer agent (See Note 3) | 17,979 |
| Custodian | 8,333 |
| Trustees | 540 |
| Shareholder service (See Note 3) | 222 |
| Miscellaneous | 2,700 |
| Total expenses before waiver/reimbursement | 176,065 |
| Expense waiver/reimbursement from Manager (See Note 3) | (13,882) |
| Net expenses | 162,183 |
| Net investment income (loss) | 547,360 |
| Realized and Unrealized Gain (Loss) |
| Net realized gain (loss) on unaffiliated investments | (86,762) |
| Net change in unrealized appreciation (depreciation) on unaffiliated investments | (1,995,639) |
| Net realized and unrealized gain (loss) | (2,082,401) |
| Net increase (decrease) in net assets resulting from operations | $(1,535,041) |
The notes to the financial statements are an integral part of, and should be read in conjunction with, the financial statements.
| 32 | MainStay Conservative ETF Allocation Fund |
Statements of Changes in Net Assets
for the six months ended October 31, 2023 (Unaudited) and the year ended April 30, 2023
| | Six months
ended
October 31,
2023 | Year
ended
April 30,
2023 |
| Increase (Decrease) in Net Assets |
| Operations: | | |
| Net investment income (loss) | $ 547,360 | $ 900,372 |
| Net realized gain (loss) | (86,762) | (1,445,003) |
| Net change in unrealized appreciation (depreciation) | (1,995,639) | 985,170 |
| Net increase (decrease) in net assets resulting from operations | (1,535,041) | 440,539 |
| Distributions to shareholders: | | |
| Class A | (475,927) | (961,007) |
| Class C | (1,860) | (7,847) |
| Class I | (489) | (1,028) |
| Class R3 | (5,083) | (9,791) |
| SIMPLE Class | (32,714) | (45,805) |
| Total distributions to shareholders | (516,073) | (1,025,478) |
| Capital share transactions: | | |
| Net proceeds from sales of shares | 4,968,513 | 10,453,424 |
| Net asset value of shares issued to shareholders in reinvestment of distributions | 510,949 | 1,017,247 |
| Cost of shares redeemed | (5,133,641) | (6,741,449) |
| Increase (decrease) in net assets derived from capital share transactions | 345,821 | 4,729,222 |
| Net increase (decrease) in net assets | (1,705,293) | 4,144,283 |
| Net Assets |
| Beginning of period | 38,682,854 | 34,538,571 |
| End of period | $36,977,561 | $38,682,854 |
The notes to the financial statements are an integral part of, and should be read in conjunction with, the financial statements.
33
Financial Highlights selected per share data and ratios
| | Six months ended
October 31,
2023* | | Year Ended April 30, | | June 30, 2020^ through
April 30, |
| Class A | 2023 | | 2022 | | 2021 |
| Net asset value at beginning of period | $ 10.02 | | $ 10.22 | | $ 11.13 | | $ 10.00 |
| Net investment income (loss) (a) | 0.14 | | 0.25 | | 0.18 | | 0.11 |
| Net realized and unrealized gain (loss) | (0.53) | | (0.16) | | (0.84) | | 1.12 |
| Total from investment operations | (0.39) | | 0.09 | | (0.66) | | 1.23 |
| Less distributions: | | | | | | | |
| From net investment income | (0.13) | | (0.25) | | (0.18) | | (0.09) |
| From net realized gain on investments | — | | (0.04) | | (0.07) | | (0.01) |
| Total distributions | (0.13) | | (0.29) | | (0.25) | | (0.10) |
| Net asset value at end of period | $ 9.50 | | $ 10.02 | | $ 10.22 | | $ 11.13 |
| Total investment return (b) | (3.92)% | | 0.96% | | (6.09)% | | 12.33% |
| Ratios (to average net assets)/Supplemental Data: | | | | | | | |
| Net investment income (loss) | 2.81%†† | | 2.56% | | 1.63% | | 1.25%†† |
| Net expenses (c) | 0.80%†† | | 0.80% | | 0.80% | | 0.80%†† |
| Expenses (before waiver/reimbursement) (c) | 0.87%†† | | 0.96% | | 0.91% | | 1.49%†† |
| Portfolio turnover rate | 20% | | 65% | | 62% | | 56% |
| Net assets at end of period (in 000’s) | $ 33,503 | | $ 35,481 | | $ 32,925 | | $ 23,951 |
| * | Unaudited. |
| ^ | Inception date. |
| †† | Annualized. |
| (a) | Per share data based on average shares outstanding during the period. |
| (b) | Total investment return is calculated exclusive of sales charges and assumes the reinvestment of dividends and distributions. For periods of less than one year, total return is not annualized. |
| (c) | In addition to the fees and expenses which the Fund bears directly, it also indirectly bears a pro-rata share of the fees and expenses of the underlying funds in which it invests. Such indirect expenses are not included in the above expense ratios. |
The notes to the financial statements are an integral part of, and should be read in conjunction with, the financial statements.
| 34 | MainStay Conservative ETF Allocation Fund |
Financial Highlights selected per share data and ratios
| | Six months ended
October 31,
2023* | | Year Ended April 30, | | June 30, 2020^ through
April 30, |
| Class C | 2023 | | 2022 | | 2021 |
| Net asset value at beginning of period | $ 10.00 | | $ 10.19 | | $ 11.10 | | $ 10.00 |
| Net investment income (loss) (a) | 0.11 | | 0.18 | | 0.10 | | 0.05 |
| Net realized and unrealized gain (loss) | (0.53) | | (0.16) | | (0.85) | | 1.10 |
| Total from investment operations | (0.42) | | 0.02 | | (0.75) | | 1.15 |
| Less distributions: | | | | | | | |
| From net investment income | (0.08) | | (0.17) | | (0.09) | | (0.04) |
| From net realized gain on investments | — | | (0.04) | | (0.07) | | (0.01) |
| Total distributions | (0.08) | | (0.21) | | (0.16) | | (0.05) |
| Net asset value at end of period | $ 9.50 | | $ 10.00 | | $ 10.19 | | $ 11.10 |
| Total investment return (b) | (4.21)% | | 0.29% | | (6.81)% | | 11.51% |
| Ratios (to average net assets)/Supplemental Data: | | | | | | | |
| Net investment income (loss) | 2.21%†† | | 1.81% | | 0.90% | | 0.58%†† |
| Net expenses (c) | 1.55%†† | | 1.55% | | 1.55% | | 1.55%†† |
| Expenses (before waiver/reimbursement) (c) | 1.67%†† | | 1.76% | | 1.73% | | 2.24%†† |
| Portfolio turnover rate | 20% | | 65% | | 62% | | 56% |
| Net assets at end of period (in 000’s) | $ 220 | | $ 369 | | $ 413 | | $ 472 |
| * | Unaudited. |
| ^ | Inception date. |
| †† | Annualized. |
| (a) | Per share data based on average shares outstanding during the period. |
| (b) | Total investment return is calculated exclusive of sales charges and assumes the reinvestment of dividends and distributions. For periods of less than one year, total return is not annualized. |
| (c) | In addition to the fees and expenses which the Fund bears directly, it also indirectly bears a pro-rata share of the fees and expenses of the underlying funds in which it invests. Such indirect expenses are not included in the above expense ratios. |
The notes to the financial statements are an integral part of, and should be read in conjunction with, the financial statements.
35
Financial Highlights selected per share data and ratios
| | Six months ended
October 31,
2023* | | Year Ended April 30, | | June 30, 2020^ through
April 30, |
| Class I | 2023 | | 2022 | | 2021 |
| Net asset value at beginning of period | $ 10.01 | | $ 10.20 | | $ 11.13 | | $ 10.00 |
| Net investment income (loss) (a) | 0.15 | | 0.28 | | 0.21 | | 0.15 |
| Net realized and unrealized gain (loss) | (0.53) | | (0.16) | | (0.85) | | 1.10 |
| Total from investment operations | (0.38) | | 0.12 | | (0.64) | | 1.25 |
| Less distributions: | | | | | | | |
| From net investment income | (0.14) | | (0.27) | | (0.22) | | (0.11) |
| From net realized gain on investments | — | | (0.04) | | (0.07) | | (0.01) |
| Total distributions | (0.14) | | (0.31) | | (0.29) | | (0.12) |
| Net asset value at end of period | $ 9.49 | | $ 10.01 | | $ 10.20 | | $ 11.13 |
| Total investment return (b) | (3.80)% | | 1.32% | | (5.86)% | | 12.47% |
| Ratios (to average net assets)/Supplemental Data: | | | | | | | |
| Net investment income (loss) | 3.06%†† | | 2.81% | | 1.89% | | 1.71%†† |
| Net expenses (c) | 0.55%†† | | 0.55% | | 0.55% | | 0.55%†† |
| Expenses (before waiver/reimbursement) (c) | 0.62%†† | | 0.71% | | 0.66% | | 1.24%†† |
| Portfolio turnover rate | 20% | | 65% | | 62% | | 56% |
| Net assets at end of period (in 000’s) | $ 32 | | $ 34 | | $ 33 | | $ 61 |
| * | Unaudited. |
| ^ | Inception date. |
| †† | Annualized. |
| (a) | Per share data based on average shares outstanding during the period. |
| (b) | Total investment return is calculated exclusive of sales charges and assumes the reinvestment of dividends and distributions. Class I shares are not subject to sales charges. For periods of less than one year, total return is not annualized. |
| (c) | In addition to the fees and expenses which the Fund bears directly, it also indirectly bears a pro-rata share of the fees and expenses of the underlying funds in which it invests. Such indirect expenses are not included in the above expense ratios. |
The notes to the financial statements are an integral part of, and should be read in conjunction with, the financial statements.
| 36 | MainStay Conservative ETF Allocation Fund |
Financial Highlights selected per share data and ratios
| | Six months ended
October 31,
2023* | | Year Ended April 30, | | June 30, 2020^ through
April 30, |
| Class R3 | 2023 | | 2022 | | 2021 |
| Net asset value at beginning of period | $ 10.01 | | $ 10.21 | | $ 11.12 | | $ 10.00 |
| Net investment income (loss) (a) | 0.12 | | 0.21 | | 0.14 | | 0.07 |
| Net realized and unrealized gain (loss) | (0.53) | | (0.16) | | (0.84) | | 1.12 |
| Total from investment operations | (0.41) | | 0.05 | | (0.70) | | 1.19 |
| Less distributions: | | | | | | | |
| From net investment income | (0.11) | | (0.21) | | (0.14) | | (0.06) |
| From net realized gain on investments | — | | (0.04) | | (0.07) | | (0.01) |
| Total distributions | (0.11) | | (0.25) | | (0.21) | | (0.07) |
| Net asset value at end of period | $ 9.49 | | $ 10.01 | | $ 10.21 | | $ 11.12 |
| Total investment return (b) | (4.09)% | | 0.60% | | (6.42)% | | 11.96% |
| Ratios (to average net assets)/Supplemental Data: | | | | | | | |
| Net investment income (loss) | 2.44%†† | | 2.13% | | 1.29% | | 0.79%†† |
| Net expenses (c) | 1.15%†† | | 1.15% | | 1.15% | | 1.15%†† |
| Expenses (before waiver/reimbursement) (c) | 1.22%†† | | 1.31% | | 1.26% | | 1.84%†† |
| Portfolio turnover rate | 20% | | 65% | | 62% | | 56% |
| Net assets at end of period (in 000’s) | $ 432 | | $ 433 | | $ 90 | | $ 68 |
| * | Unaudited. |
| ^ | Inception date. |
| †† | Annualized. |
| (a) | Per share data based on average shares outstanding during the period. |
| (b) | Total investment return is calculated exclusive of sales charges and assumes the reinvestment of dividends and distributions. Class R3 shares are not subject to sales charges. For periods of less than one year, total return is not annualized. |
| (c) | In addition to the fees and expenses which the Fund bears directly, it also indirectly bears a pro-rata share of the fees and expenses of the underlying funds in which it invests. Such indirect expenses are not included in the above expense ratios. |
The notes to the financial statements are an integral part of, and should be read in conjunction with, the financial statements.
37
Financial Highlights selected per share data and ratios
| | Six months ended
October 31,
2023* | | Year Ended April 30, | | August 31, 2020^ through
April 30, |
| SIMPLE Class | 2023 | | 2022 | | 2021 |
| Net asset value at beginning of period | $ 10.01 | | $ 10.21 | | $ 11.12 | | $ 10.46 |
| Net investment income (loss) (a) | 0.13 | | 0.22 | | 0.14 | | 0.08 |
| Net realized and unrealized gain (loss) | (0.53) | | (0.15) | | (0.82) | | 0.66 |
| Total from investment operations | (0.40) | | 0.07 | | (0.68) | | 0.74 |
| Less distributions: | | | | | | | |
| From net investment income | (0.12) | | (0.23) | | (0.16) | | (0.07) |
| From net realized gain on investments | — | | (0.04) | | (0.07) | | (0.01) |
| Total distributions | (0.12) | | (0.27) | | (0.23) | | (0.08) |
| Net asset value at end of period | $ 9.49 | | $ 10.01 | | $ 10.21 | | $ 11.12 |
| Total investment return (b) | (4.04)% | | 0.72% | | (6.29)% | | 7.13% |
| Ratios (to average net assets)/Supplemental Data: | | | | | | | |
| Net investment income (loss) | 2.53%†† | | 2.27% | | 1.30% | | 0.92%†† |
| Net expenses (c) | 1.05%†† | | 1.05% | | 1.05% | | 1.05%†† |
| Expenses (before waiver/reimbursement) (c) | 1.17%†† | | 1.27% | | 1.23% | | 1.74%†† |
| Portfolio turnover rate | 20% | | 65% | | 62% | | 56% |
| Net assets at end of period (in 000’s) | $ 2,790 | | $ 2,367 | | $ 1,077 | | $ 195 |
| * | Unaudited. |
| ^ | Inception date. |
| †† | Annualized. |
| (a) | Per share data based on average shares outstanding during the period. |
| (b) | Total investment return is calculated exclusive of sales charges and assumes the reinvestment of dividends and distributions. SIMPLE Class shares are not subject to sales charges. For periods of less than one year, total return is not annualized. |
| (c) | In addition to the fees and expenses which the Fund bears directly, it also indirectly bears a pro-rata share of the fees and expenses of the underlying funds in which it invests. Such indirect expenses are not included in the above expense ratios. |
The notes to the financial statements are an integral part of, and should be read in conjunction with, the financial statements.
| 38 | MainStay Conservative ETF Allocation Fund |
MainStay Moderate ETF Allocation Fund
Investment and Performance Comparison (Unaudited)
Performance data quoted represents past performance. Past performance is no guarantee of future results. Because of market volatility and other factors, current performance may be lower or higher than the figures shown. Investment return and principal value will fluctuate, and as a result, when shares are redeemed, they may be worth more or less than their original cost. The graph below depicts the historical performance of Class I shares of the Fund. Performance will vary from class to class based on differences in class-specific expenses and sales charges. For performance information current to the most recent month-end, please call 800-624-6782 or visit newyorklifeinvestments.com.
The performance table and graph do not reflect the deduction of taxes that a shareholder would pay on distributions or Fund share redemptions. Total returns reflect maximum applicable sales charges as indicated in the table below, if any, changes in share price, and reinvestment of dividend and capital gain distributions. The graph assumes the initial investment amount shown below and reflects the deduction of all sales charges that would have applied for the period of investment. Performance figures may reflect certain fee waivers and/or expense limitations, without which total returns may have been lower. For more information on share classes and current fee waivers and/or expense limitations (if any), please refer to the Notes to Financial Statements.
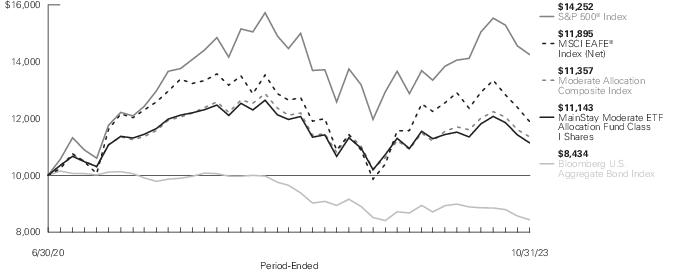
| Average Annual Total Returns for the Period-Ended October 31, 2023 |
| Class | Sales Charge | | Inception
Date | Six
Months1 | One
Year | Since
Inception | Gross
Expense
Ratio2 |
| Class A Shares | Maximum 3.00% Initial Sales Charge | With sales charges | 6/30/2020 | -6.26% | 0.49% | 2.08% | 0.82% |
| | | Excluding sales charges | | -3.36 | 3.60 | 3.02 | 0.82 |
| Class C Shares | Maximum 1.00% CDSC | With sales charges | 6/30/2020 | -4.71 | 1.79 | 2.20 | 1.64 |
| | if redeemed Within One Year of Purchase | Excluding sales charges | | -3.74 | 2.79 | 2.20 | 1.64 |
| Class I Shares | No Sales Charge | | 6/30/2020 | -3.27 | 3.87 | 3.30 | 0.57 |
| Class R3 Shares | No Sales Charge | | 6/30/2020 | -3.55 | 3.25 | 2.67 | 1.17 |
| SIMPLE Class Shares | No Sales Charge | | 8/31/2020 | -3.56 | 3.28 | 0.76 | 1.14 |
| 1. | Not annualized. |
| 2. | The gross expense ratios presented reflect the Fund’s “Total Annual Fund Operating Expenses” from the most recent Prospectus, as supplemented, and may differ from other expense ratios disclosed in this report. |
The footnotes on the next page are an integral part of the table and graph and should be carefully read in conjunction with them.
| Benchmark Performance* | Six
Months1 | One
Year | Since
Inception |
| S&P 500® Index2 | 1.39% | 10.14% | 11.21% |
| MSCI EAFE® Index (Net)3 | -7.88 | 14.40 | 5.34 |
| Bloomberg U.S. Aggregate Bond Index4 | -6.13 | 0.36 | -4.98 |
| Moderate Allocation Composite Index5 | -3.01 | 6.91 | 3.89 |
| Morningstar Moderate Allocation Category Average6 | -2.36 | 4.16 | 4.61 |
| * | Returns for indices reflect no deductions for fees, expenses or taxes, except for foreign withholding taxes where applicable. Results assume reinvestment of all dividends and capital gains. An investment cannot be made directly in an index. |
| 1. | Not annualized. |
| 2. | The S&P 500® Index is the Fund’s primary broad-based securities market index for comparison purposes. S&P 500® is a trademark of The McGraw-Hill Companies, Inc. The S&P 500® Index is widely regarded as the standard index for measuring large-cap U.S. stock market performance. |
| 3. | The MSCI EAFE® Index (Net) is the Fund's secondary benchmark. The MSCI EAFE® Index (Net) consists of international stocks representing the developed world outside of North America. |
| 4. | The Fund has selected the Bloomberg U.S. Aggregate Bond Index as an additional benchmark. The Bloomberg U.S. Aggregate Bond Index is a broad-based benchmark that measures the performance of the investment grade, U.S. dollar-denominated, fixed-rate taxable bond market, including Treasuries, government-related and corporate securities, mortgage-backed securities (agency fixed-rate and hybrid adjustable rate mortgage pass-throughs), asset-backed securities, and commercial mortgage-backed securities. |
| 5. | The Fund has selected the Moderate Allocation Composite Index as an additional benchmark. The Moderate Allocation Composite Index consists of the S&P 500® Index, the MSCI EAFE® Index (Net) and the Bloomberg U.S. Aggregate Bond Index weighted 45%, 15% and 40%, respectively. |
| 6. | The Morningstar Moderate Allocation Category Average is representative of funds in allocation categories that seek to provide both income and capital appreciation by primarily investing in multiple asset classes, including stocks, bonds, and cash. These moderate strategies seek to balance preservation of capital with appreciation. They typically expect volatility similar to a strategic equity exposure between 50% and 70%. Results are based on average total returns of similar funds with all dividends and capital gain distributions reinvested. |
The footnotes on the preceding page are an integral part of the table and graph and should be carefully read in conjunction with them.
| 40 | MainStay Moderate ETF Allocation Fund |
Cost in Dollars of a $1,000 Investment in MainStay Moderate ETF Allocation Fund (Unaudited)
The example below is intended to describe the fees and expenses borne by shareholders during the six-month period from May 1, 2023 to October 31, 2023, and the impact of those costs on your investment.
Example
As a shareholder of the Fund you incur two types of costs: (1) transaction costs, including exchange fees and sales charges (loads) on purchases (as applicable), and (2) ongoing costs, including management fees, distribution and/or service (12b-1) fees and other Fund expenses (as applicable). This example is intended to help you understand your ongoing costs (in dollars) of investing in the Fund and to compare these costs with the ongoing costs of investing in other mutual funds. The example is based on an investment of $1,000 made at the beginning of the six-month period and held for the entire period from May 1, 2023 to October 31, 2023.
This example illustrates your Fund’s ongoing costs in two ways:
Actual Expenses
The second and third data columns in the table below provide information about actual account values and actual expenses. You may use the information in these columns, together with the amount you invested, to estimate the expenses that you paid during the six months ended October 31, 2023. Simply divide your account value by $1,000 (for example, an
$8,600 account value divided by $1,000 = 8.6), then multiply the result by the number under the heading entitled “Expenses Paid During Period” to estimate the expenses you paid on your account during this period.
Hypothetical Example for Comparison Purposes
The fourth and fifth data columns in the table below provide information about hypothetical account values and hypothetical expenses based on the Fund’s actual expense ratio and an assumed rate of return of 5% per year before expenses, which is not the Fund’s actual return. The hypothetical account values and expenses may not be used to estimate the actual ending account balances or expenses you paid for the six-month period shown. You may use this information to compare the ongoing costs of investing in the Fund with the ongoing costs of investing in other mutual funds. To do so, compare this 5% hypothetical example with the 5% hypothetical examples that appear in the shareholder reports of the other mutual funds.
Please note that the expenses shown in the table are meant to highlight your ongoing costs only and do not reflect any transactional costs, such as exchange fees or sales charges (loads). Therefore, the fourth and fifth data columns of the table are useful in comparing ongoing costs only and will not help you determine the relative total costs of owning different funds. In addition, if these transactional costs were included, your costs would have been higher.
| Share Class | Beginning
Account
Value
5/1/23 | Ending Account
Value (Based
on Actual
Returns and
Expenses)
10/31/23 | Expenses
Paid
During
Period1 | Ending Account
Value (Based
on Hypothetical
5% Annualized
Return and
Actual Expenses)
10/31/23 | Expenses
Paid
During
Period1 | Net Expense
Ratio
During
Period2 |
| Class A Shares | $1,000.00 | $966.40 | $3.31 | $1,021.77 | $3.40 | 0.67% |
| Class C Shares | $1,000.00 | $962.60 | $7.25 | $1,017.75 | $7.46 | 1.47% |
| Class I Shares | $1,000.00 | $967.30 | $2.08 | $1,023.03 | $2.14 | 0.42% |
| Class R3 Shares | $1,000.00 | $964.50 | $5.04 | $1,020.01 | $5.18 | 1.02% |
| SIMPLE Class Shares | $1,000.00 | $964.40 | $4.79 | $1,020.26 | $4.93 | 0.97% |
| 1. | Expenses are equal to the Fund’s annualized expense ratio of each class multiplied by the average account value over the period, divided by 366 and multiplied by 184 (to reflect the six-month period). The table above represents the actual expenses incurred during the six-month period. In addition to the fees and expenses which the Fund bears directly, it also indirectly bears a pro rata share of the fees and expenses of the underlying funds in which it invests. Such indirect expenses are not included in the above-reported expense figures. |
| 2. | Expenses are equal to the Fund's annualized expense ratio to reflect the six-month period. |
Asset Diversification as of October 31, 2023 (Unaudited)
| Equity Funds | 60.6 % |
| Fixed Income Funds | 38.6 |
| Short-Term Investments | 26.0 |
| Other Assets, Less Liabilities | (25.2) |
See Portfolio of Investments beginning on page 46 for specific holdings within these categories. The Fund’s holdings are subject to change.
| 42 | MainStay Moderate ETF Allocation Fund |
Portfolio Management Discussion and Analysis (Unaudited)
Questions answered by portfolio managers Jae S. Yoon, CFA, Jonathan Swaney, Poul Kristensen, CFA, and Amit Soni, CFA, of New York Life Investment Management LLC, the Fund’s Manager.
How did MainStay Moderate ETF Allocation Fund perform relative to its benchmarks and peer group during the six months ended October 31, 2023?
For the six months ended October 31, 2023, Class I shares of MainStay Moderate ETF Allocation Fund returned −3.27%, underperforming the 1.39% return of the Fund’s primary benchmark, the S&P 500® Index, and outperforming the −7.88% return of the MSCI EAFE® Index (Net), which is the Fund’s secondary benchmark. Over the same period, Class I shares of the Fund outperformed the −6.13% return of the Bloomberg U.S. Aggregate Bond Index, and underperformed the −3.01% return of the Moderate Allocation Composite Index, both of which are additional benchmarks of the Fund. For the six months ended October 31, 2023, Class I shares of the Fund underperformed the −2.36% return of the Morningstar Moderate Allocation Category Average.1
What factors affected the Fund’s relative performance during the reporting period?
The Fund is a “fund of funds" that seeks to achieve its investment objective by investing in unaffiliated, passively managed, exchange-traded funds (“Underlying ETFs”). The Underlying ETFs may invest in U.S. equities, international equities and fixed-income instruments, making comparisons to any single index generally less suitable than a weighted combination of indices, which is a more useful yardstick by which to measure performance. During the reporting period, asset class policy was the primary determinant of the Fund’s relative performance.
Fund management internally maintains a blend of indices that are taken into consideration when managing the Fund. During the reporting period, the Fund moderately underperformed the internally maintained blend of indices, primarily due to asset class policy decisions.
At the start of the reporting period, the Fund held slightly underweight exposure to equities in anticipation of a possible recession induced by a combination of higher interest rates, reduced willingness on the part of banks to lend, and the fall in money supply accompanying the quantitative tightening program undertaken by the U.S. Federal Reserve (the “Fed”). However, equities rallied sharply from May through July 2023, detracting from the Fund’s relative performance. We gradually reduced the Fund’s underweight exposure to equities over the summer and
then eliminated the position altogether, lessening the benefit that came with the market’s retreat from August through October.
Relative performance lost substantially more ground as a result of the Fund’s underweight exposure to certain mega-cap technology-related companies. The companies, tagged “the Magnificent 7,” included Alphabet, Amazon.com, Apple, Meta Platforms, Microsoft, NVIDIA and Tesla. All were richly valued, implying rapid earnings growth ahead. We were skeptical that the companies, already among the largest firms in the world with dominant positions in their respective industries, could meet these high growth expectations. Accordingly, we shifted the Fund out of capitalization-weighted large-cap index products, favoring other options—most notably an equally weighted version of the S&P 500® Index. However, ongoing enthusiasm for the potential of artificial intelligence (“AI”) to bolster the Magnificent 7’s business prospects supported rising stock prices. From May through October 2023, the Bloomberg Magnificent 7 Total Return Index2 returned 21%, compared to a loss of 5% for the S&P 500® Equal Weight Index.3
Other positions detracting from relative performance included a number of defensive holdings adopted in anticipation of an economic contraction and more challenging conditions in capital markets. These included exposure to low volatility stocks, exposure to traditionally defensive sectors (such as health care), extending duration4 in Treasury bonds and shying away from speculative-grade credit (such as bank loans).
Some positions made positive contributions to relative performance. (Contributions take weightings and total returns into account.) A tilt into energy stocks benefited from a rise in the price of oil—presumably a result of Saudi production cuts along with rising geopolitical tensions at least partly tied to the Palestinian-Israeli conflict. Other positives included a decisive preference for Japan over Europe within the developed international space and exposure to uranium miners.
How did you allocate the Fund’s assets during the reporting period and why?
Stock/bond blend: As mentioned above, in anticipation of a recession that would drive down stock prices through both reduced corporate earnings and lower valuation multiples, the Fund held modestly underweight exposure to equities for much of the reporting period. We gradually reduced that underweight
| 1. | See "Investment and Performance Comparison" for other share class returns, which may be higher or lower than Class I share returns, and for more information on benchmark and peer group returns. |
| 2. | The Bloomberg Magnificent 7 Total Return Index is an equal-dollar weighted equity benchmark consisting of a fixed basket of 7 widely-traded companies classified in the United States and representing the Communications, Consumer Discretionary and Technology sectors as defined by Bloomberg Industry Classification System (BICS). An investment cannot be made directly in an index. |
| 3. | The S&P 500® Equal Weight Index (“EWI”) is the equal-weight version of the widely-used S&P 500® Index. The S&P 500® EWI includes the same constituents as the capitalization weighted S&P 500® Index, but each company in the S&P 500® EWI is allocated a fixed weight, or 0.2% of the Index total at each quarterly rebalance. An investment cannot be made directly in an index. |
| 4. | Duration is a measure of the price sensitivity of a fixed-income investment to changes in interest rates. Duration is expressed as a number of years and is considered a more accurate sensitivity gauge than average maturity. |
position as the reporting period wore on and the expected economic contraction failed to materialize. As of the end of the reporting period, the Fund held slightly greater total equity exposure than the Moderate Allocation Composite Index.
Duration: With yields having risen considerably in the preceding three years, we had increased the Fund’s duration to very close to neutral by the end of April 2023. Yields continued to rise over the summer and into the fall as investors worried about heavy new U.S. Treasury issuance, a “higher for longer” monetary policy, stubborn inflationary pressures and rising yields abroad. We believed that a combination of waning consumption, normalized supply chains and improving productivity would eventually curb inflation and yields would drop sharply. Accordingly, we added duration as yields climbed, such that the Fund’s duration was slightly more than six months long as of the end of the reporting period.
Equity style: Whereas we shifted to a neutral posture in terms of the stock/bond blend during the reporting period, we maintained a conservative stance in terms of the Fund’s equity style in order to protect against the potential onset of a recession. Specifically, the Fund favored value over growth, with a particular emphasis on defensive sectors (health care and utilities) and characteristics (low volatility).
Equity size: Being skeptical of the ability of mega-cap market leaders to consistently deliver the high rates of earnings growth required to justify their relative valuations, we steered the Fund away from these names to a degree. In particular, we increased exposure to the S&P 500® EWI in which market cap does not affect the weight of each constituent. Whereas the Magnificent 7 represented approximately 30% of the S&P 500® Index, they represented only 1.4% of the S&P 500® EWI. We further limited the impact of mega-cap market leaders on the Fund through exposure to the S&P Mid Cap 400® Index.5
Geographic exposure: In our view, European equities appeared vulnerable during the reporting period. Persistently high wage growth seemed likely to compel the European Central Bank to maintain restrictive monetary policy for the foreseeable future, while their export-heavy economies wrestled with declining global trade volumes, and energy price spikes remained a risk amid elevated geopolitical tensions. Conversely, the Bank of Japan remained engaged in accommodative policy, with Japanese exports boosted by a weak yen and shareholder governance increasingly prioritized by company management, largely in the form of share buybacks. With these trends in mind, we tilted the Fund away from European markets in favor of Japanese stocks, with net exposure to non-U.S. stocks held close to neutral.
Energy: The Fund maintained exposure to upstream energy producers and oilfield/gas field service providers as a commodity play to provide an additional inflation hedge. These holdings also positioned the Fund to take advantage of opportunities for domestic producers to benefit as Western nations revisit energy policy to source supplies from stable and friendly jurisdictions rather than autocratic petrostates that present national security risks. While the Fund’s energy position was small, it had a disproportionately positive impact on performance.
How did the Fund’s allocations change over the course of the reporting period?
The single largest change to the Fund’s allocations involved the introduction and subsequent growth of a position in 20+ Year Treasury Bond ETF, which we used to extend the Fund’s duration as bond yields rose. The purchases were funded from cash. The next largest change involved an increased allocation to Invesco S&P 500® Equal Weight ETF. This was also funded from cash, as we sought to remove the Fund’s underweight equity position without significantly increasing exposure to the Magnificent 7.
All other adjustments proved comparatively modest. They included the closure of positions in SPDR® S&P® Oil & Gas Exploration ETF and VanEck Oil Services ETF (the latter of which was later restored); a reduction in holdings of Invesco Senior Loan ETF; exiting Schwab U.S. Small-Cap ETF; an increase in exposure to iShares® MSCI Japan ETF; and an allocation to Utilities Select Sector SPDR® Fund.
The Fund also opened a small position in Global X Uranium ETF, which invests primarily in uranium mining firms. Climate change concerns and the limitations of renewable energy are driving a reconsideration of nuclear energy sources, for which fuel supply is somewhat limited. We foresee a supply/demand imbalance developing that is likely to support businesses involved with extracting and processing uranium.
During the reporting period, which Underlying Equity ETFs had the highest total returns and which Underlying Equity ETFs had the lowest total returns?
Of those Underlying Equity ETFs held for the entire reporting period, only iShares® MSCI Japan ETF generated a positive return. The smallest losses came from iShares® Core S&P Mid-Cap ETF and Schwab U.S. Mid-Cap ETF.
Underlying Equity ETFs held for the entire reporting period that saw the largest declines included iShares® Core MSCI EAFE ETF, Invesco S&P 500® Low Volatility ETF and Health Care Select Sector SPDR® Fund.
| 5. | The S&P Mid Cap 400® Index measures the performance of the mid-cap segment of the U.S. market. The Index is composed of 400 constituent companies. An investment cannot be made directly in an index. |
| 44 | MainStay Moderate ETF Allocation Fund |
Which Underlying Equity ETFs were the strongest positive contributors to the Fund’s performance and which Underlying Equity ETFs were particularly weak?
Contribution to return is a function not only of Underlying ETF performance and average allocation, but also the variation in that allocation across time. The Underlying Equity ETFs making the largest positive contributions to return included Vanguard Mega Cap ETF, VanEck Oil Services ETF and SPDR® S&P® Oil & Gas Exploration & Production ETF. The most significant detractors included iShares® Core MSCI EAFE ETF, Vanguard Mid-Cap ETF and Invesco S&P 500® Equal Weight ETF.
During the reporting period, which Underlying Fixed-Income ETFs had the highest total returns and which Underlying Fixed-Income ETFs had the lowest total returns?
The Underlying Fixed-Income ETFs posting the highest total returns included Invesco Senior Loan ETF, a cash sweep account and iShares® 0–5 Year High Yield Corporate Bond ETF. Among Underlying Fixed-Income ETFs held for the entire reporting period, those posting the steepest losses included Schwab U.S. Aggregate Bond ETF, iShares® Core U.S. Aggregate Bond ETF and iShares® Broad USD Investment Grade Corporate Bond ETF.
Which Underlying Fixed-Income ETFs were the strongest positive contributors to the Fund’s performance and which Underlying Fixed-Income ETFs were particularly weak?
The Underlying Fixed-Income ETFs making the largest contributions to return included Invesco Senior Loan ETF, a cash sweep account and iShares® 0–5 Year High Yield Corporate Bond ETF. The most significant detractors from absolute performance included iShares® 20+ Year Treasury Bond ETF, followed by Schwab U.S. Aggregate Bond ETF and iShares® Core U.S. Aggregate Bond ETF.
How was the Fund positioned at the end of the reporting period?
For some time now, we have held the view that a recession in response to dramatic monetary policy tightening and the expiration of pandemic era support programs is all but inevitable. That remains the case today, and indications of the onset of this
recession are beginning to accumulate. We firmly expect corporate profits will decline over the next several quarters, eventually taking stock prices down with them, while also driving down Treasury yields and pushing credit spreads6 out. Accordingly, the Fund maintains a relatively defensive posture.
Having been reminded of just how difficult it is to call a market top, we are resistant to being underweight equities, so we have parked the Fund in neutral along this dimension for the time being, although we intend to exploit any significant pullbacks—should they arrive—by building an overweight position.
Defensive positioning is more clearly visible within asset classes. Most notably, we have extended the Fund’s duration considerably through purchases of a long-dated Treasury bond ETF, with the expectation that it will be the beneficiary of a flight to quality as economic and market conditions deteriorate. Additionally, we are maintaining exposure to bank loans at a below-benchmark weight, and skewing holdings of high yield bonds to favor shorter maturity instruments, which tend to exhibit less volatility and smaller losses than longer-maturity bonds.
On the equity side, the Fund favors sectors that have generally exhibited lower volatility and retained their value better during drawdowns. Prominent among these are utilities and health care.
| 6. | The terms “spread” and “yield spread” may refer to the difference in yield between a security or type of security and comparable U.S. Treasury issues. The terms may also refer to the difference in yield between two specific securities or types of securities at a given time. The term “credit spread” typically refers to the difference in yield between corporate or municipal bonds (or a specific category of these bonds) and comparable U.S. Treasury issues. |
None of Schwab Strategic Trust, Schwab® U.S. Aggregate Bond ETF, Schwab U.S. Small-Cap ETF, Schwab U.S. Mid-Cap ETF, or Charles Schwab Investment Management, Inc. make any representations regarding the advisability of investing in MainStay Moderate ETF Allocation Fund.
iShares® is a registered trademark of BlackRock (BlackRock, Inc. and its subsidiaries). Neither BlackRock nor the iShares® Funds make any representations regarding the advisability of investing in MainStay Moderate ETF Allocation Fund.
The opinions expressed are those of the portfolio managers as of the date of this report and are subject to change. There is no guarantee that any forecasts will come to pass. This material does not constitute investment advice and is not intended as an endorsement of any specific investment.
Portfolio of Investments October 31, 2023†^(Unaudited)
| | Shares | Value |
| Investment Companies 99.2% |
| Equity Funds 60.6% |
| Global X Uranium ETF | 42,743 | $ 1,147,222 |
| Health Care Select Sector SPDR Fund | 8,539 | 1,063,447 |
| Invesco S&P 500 Equal Weight ETF (a) | 35,635 | 4,840,302 |
| Invesco S&P 500 Low Volatility ETF | 18,936 | 1,105,484 |
| iShares Core MSCI EAFE ETF | 157,534 | 9,823,820 |
| iShares Core MSCI Emerging Markets ETF | 46,798 | 2,149,900 |
| iShares Core S&P Mid-Cap ETF | 14,341 | 3,384,476 |
| iShares Core S&P Small-Cap ETF | 59,957 | 5,329,578 |
| iShares MSCI Japan ETF | 56,139 | 3,309,955 |
| Materials Select Sector SPDR Fund (a) | 14,190 | 1,079,291 |
| Schwab U.S. Mid-Cap ETF (a) | 32,006 | 2,049,024 |
| Utilities Select Sector SPDR Fund | 19,107 | 1,140,497 |
| Vanguard Mega Cap ETF (a) | 137,933 | 20,587,880 |
| Vanguard Mega Cap Value ETF | 16,558 | 1,640,236 |
| Vanguard Mid-Cap ETF (a) | 37,706 | 7,481,248 |
Total Equity Funds
(Cost $64,118,482) | | 66,132,360 |
| Fixed Income Funds 38.6% |
| Invesco Senior Loan ETF (a) | 160,058 | 3,329,206 |
| iShares 0-5 Year High Yield Corporate Bond ETF (a) | 68,644 | 2,782,141 |
| iShares 20+ Year Treasury Bond ETF | 71,188 | 5,949,893 |
| iShares Broad USD High Yield Corporate Bond ETF (a) | 81,268 | 2,778,553 |
| iShares Broad USD Investment Grade Corporate Bond ETF | 106,456 | 5,007,690 |
| iShares Core U.S. Aggregate Bond ETF (a) | 108,412 | 10,007,512 |
| Schwab U.S. Aggregate Bond ETF (a) | 230,631 | 10,011,692 |
| Vanguard Short-Term Bond ETF | 29,796 | 2,235,296 |
Total Fixed Income Funds
(Cost $46,881,262) | | 42,101,983 |
Total Investment Companies
(Cost $110,999,744) | | 108,234,343 |
| Short-Term Investments 26.0% |
| Affiliated Investment Company 0.9% |
| MainStay U.S. Government Liquidity Fund, 5.275% (b) | 938,140 | 938,140 |
| Unaffiliated Investment Companies 25.1% |
| BlackRock Liquidity FedFund, 5.349% (b)(c) | 8,000,000 | 8,000,000 |
| Dreyfus Treasury Obligations Cash Management Fund, 5.376% (b)(c) | 5,000,000 | 5,000,000 |
| Goldman Sachs Financial Square Government Fund, 5.356% (b)(c) | 5,000,000 | 5,000,000 |
The notes to the financial statements are an integral part of, and should be read in conjunction with, the financial statements.
| 46 | MainStay Moderate ETF Allocation Fund |
| | Shares | | Value |
| Short-Term Investments (continued) |
| Unaffiliated Investment Companies (continued) |
| Invesco Government & Agency Portfolio, 5.357% (b)(c) | 9,419,848 | | $ 9,419,848 |
| | | | 27,419,848 |
Total Short-Term Investments
(Cost $28,357,988) | | | 28,357,988 |
Total Investments
(Cost $139,357,732) | 125.2% | | 136,592,331 |
| Other Assets, Less Liabilities | (25.2) | | (27,500,081) |
| Net Assets | 100.0% | | $ 109,092,250 |
| † | Percentages indicated are based on Fund net assets. |
| ^ | Industry classifications may be different than those used for compliance monitoring purposes. |
| (a) | All or a portion of this security was held on loan. As of October 31, 2023, the aggregate market value of securities on loan was $28,099,886; the total market value of collateral held by the Fund was $28,607,796. The market value of the collateral held included non-cash collateral in the form of U.S. Treasury securities with a value of $1,187,948. The Fund received cash collateral with a value of $27,419,848. (See Note 2(G)) |
| (b) | Current yield as of October 31, 2023. |
| (c) | Represents a security purchased with cash collateral received for securities on loan. |
Investments in Affiliates (in 000's)
Investments in issuers considered to be affiliate(s) of the Fund during the six-month period ended October 31, 2023 for purposes of Section 2(a)(3) of the Investment Company Act of 1940, as amended, were as follows:
| Affiliated Investment Companies | Value,
Beginning
of Period | Purchases
at Cost | Proceeds
from
Sales | Net
Realized
Gain/(Loss)
on Sales | Change in
Unrealized
Appreciation/
(Depreciation) | Value,
End of
Period | Dividend
Income | Other
Distributions | Shares
End of
Period |
| MainStay U.S. Government Liquidity Fund | $ 9,771 | $ 8,098 | $ (16,931) | $ — | $ — | $ 938 | $ 149 | $ — | 938 |
| Abbreviation(s): |
| EAFE—Europe, Australasia and Far East |
| ETF—Exchange-Traded Fund |
| MSCI—Morgan Stanley Capital International |
| SPDR—Standard & Poor’s Depositary Receipt |
| USD—United States Dollar |
The notes to the financial statements are an integral part of, and should be read in conjunction with, the financial statements.
47
Portfolio of Investments October 31, 2023†^(Unaudited) (continued)
The following is a summary of the fair valuations according to the inputs used as of October 31, 2023, for valuing the Fund’s assets:
| Description | Quoted
Prices in
Active
Markets for
Identical
Assets
(Level 1) | | Significant
Other
Observable
Inputs
(Level 2) | | Significant
Unobservable
Inputs
(Level 3) | | Total |
| Asset Valuation Inputs | | | | | | | |
| Investments in Securities (a) | | | | | | | |
| Investment Companies | | | | | | | |
| Equity Funds | $ 66,132,360 | | $ — | | $ — | | $ 66,132,360 |
| Fixed Income Funds | 42,101,983 | | — | | — | | 42,101,983 |
| Total Investment Companies | 108,234,343 | | — | | — | | 108,234,343 |
| Short-Term Investments | | | | | | | |
| Affiliated Investment Company | 938,140 | | — | | — | | 938,140 |
| Unaffiliated Investment Companies | 27,419,848 | | — | | — | | 27,419,848 |
| Total Short-Term Investments | 28,357,988 | | — | | — | | 28,357,988 |
| Total Investments in Securities | $ 136,592,331 | | $ — | | $ — | | $ 136,592,331 |
| (a) | For a complete listing of investments, see the Portfolio of Investments. |
The notes to the financial statements are an integral part of, and should be read in conjunction with, the financial statements.
| 48 | MainStay Moderate ETF Allocation Fund |
Statement of Assets and Liabilities as of October 31, 2023 (Unaudited)
| Assets |
Investment in unaffiliated securities, at value
(identified cost $138,419,592) including securities on loan of $28,099,886 | $135,654,191 |
Investment in affiliated investment companies, at value
(identified cost $938,140) | 938,140 |
| Receivables: | |
| Fund shares sold | 141,514 |
| Securities lending | 17,005 |
| Dividends | 8,684 |
| Other assets | 49,368 |
| Total assets | 136,808,902 |
| Liabilities |
| Cash collateral received for securities on loan | 27,419,848 |
| Payables: | |
| Fund shares redeemed | 202,477 |
| NYLIFE Distributors (See Note 3) | 26,252 |
| Manager (See Note 3) | 18,669 |
| Transfer agent (See Note 3) | 18,261 |
| Professional fees | 15,688 |
| Investment securities purchased | 9,790 |
| Custodian | 5,667 |
| Total liabilities | 27,716,652 |
| Net assets | $109,092,250 |
| Composition of Net Assets |
| Shares of beneficial interest outstanding (par value of $.001 per share) unlimited number of shares authorized | $ 10,272 |
| Additional paid-in-capital | 115,709,567 |
| | 115,719,839 |
| Total distributable earnings (loss) | (6,627,589) |
| Net assets | $109,092,250 |
| Class A | |
| Net assets applicable to outstanding shares | $96,534,317 |
| Shares of beneficial interest outstanding | 9,085,070 |
| Net asset value per share outstanding | $ 10.63 |
| Maximum sales charge (3.00% of offering price) | 0.33 |
| Maximum offering price per share outstanding | $ 10.96 |
| Class C | |
| Net assets applicable to outstanding shares | $ 340,182 |
| Shares of beneficial interest outstanding | 32,283 |
| Net asset value and offering price per share outstanding | $ 10.54 |
| Class I | |
| Net assets applicable to outstanding shares | $ 78,155 |
| Shares of beneficial interest outstanding | 7,340 |
| Net asset value and offering price per share outstanding | $ 10.65 |
| Class R3 | |
| Net assets applicable to outstanding shares | $ 1,957,452 |
| Shares of beneficial interest outstanding | 184,828 |
| Net asset value and offering price per share outstanding | $ 10.59 |
| SIMPLE Class | |
| Net assets applicable to outstanding shares | $10,182,144 |
| Shares of beneficial interest outstanding | 962,044 |
| Net asset value and offering price per share outstanding | $ 10.58 |
The notes to the financial statements are an integral part of, and should be read in conjunction with, the financial statements.
49
Statement of Operations for the six months ended October 31, 2023 (Unaudited)
| Investment Income (Loss) |
| Income | |
| Dividends-unaffiliated | $ 1,477,323 |
| Dividends-affiliated | 148,504 |
| Securities lending, net | 67,184 |
| Total income | 1,693,011 |
| Expenses | |
| Manager (See Note 3) | 111,261 |
| Distribution/Service—Class A (See Note 3) | 124,646 |
| Distribution/Service—Class C (See Note 3) | 1,762 |
| Distribution/Service—Class R3 (See Note 3) | 4,262 |
| Distribution/Service—SIMPLE Class (See Note 3) | 23,525 |
| Transfer agent (See Note 3) | 52,277 |
| Registration | 35,329 |
| Professional fees | 20,879 |
| Custodian | 8,746 |
| Shareholder communication | 2,570 |
| Trustees | 1,491 |
| Shareholder service (See Note 3) | 852 |
| Miscellaneous | 3,798 |
| Total expenses | 391,398 |
| Net investment income (loss) | 1,301,613 |
| Realized and Unrealized Gain (Loss) |
| Net realized gain (loss) on unaffiliated investments | 278,705 |
| Net change in unrealized appreciation (depreciation) on unaffiliated investments | (5,482,209) |
| Net realized and unrealized gain (loss) | (5,203,504) |
| Net increase (decrease) in net assets resulting from operations | $(3,901,891) |
The notes to the financial statements are an integral part of, and should be read in conjunction with, the financial statements.
| 50 | MainStay Moderate ETF Allocation Fund |
Statements of Changes in Net Assets
for the six months ended October 31, 2023 (Unaudited) and the year ended April 30, 2023
| | Six months
ended
October 31,
2023 | Year
ended
April 30,
2023 |
| Increase (Decrease) in Net Assets |
| Operations: | | |
| Net investment income (loss) | $ 1,301,613 | $ 2,030,182 |
| Net realized gain (loss) | 278,705 | (5,100,556) |
| Net change in unrealized appreciation (depreciation) | (5,482,209) | 4,653,294 |
| Net increase (decrease) in net assets resulting from operations | (3,901,891) | 1,582,920 |
| Distributions to shareholders: | | |
| Class A | — | (1,597,645) |
| Class C | — | (3,083) |
| Class I | — | (1,463) |
| Class R3 | — | (20,458) |
| SIMPLE Class | — | (88,538) |
| Total distributions to shareholders | — | (1,711,187) |
| Capital share transactions: | | |
| Net proceeds from sales of shares | 16,457,983 | 26,632,045 |
| Net asset value of shares issued to shareholders in reinvestment of distributions | — | 1,708,293 |
| Cost of shares redeemed | (8,715,386) | (13,571,395) |
| Increase (decrease) in net assets derived from capital share transactions | 7,742,597 | 14,768,943 |
| Net increase (decrease) in net assets | 3,840,706 | 14,640,676 |
| Net Assets |
| Beginning of period | 105,251,544 | 90,610,868 |
| End of period | $109,092,250 | $105,251,544 |
The notes to the financial statements are an integral part of, and should be read in conjunction with, the financial statements.
51
Financial Highlights selected per share data and ratios
| | Six months ended
October 31,
2023* | | Year Ended April 30, | | June 30, 2020^ through
April 30, |
| Class A | 2023 | | 2022 | | 2021 |
| Net asset value at beginning of period | $ 11.00 | | $ 11.06 | | $ 11.88 | | $ 10.00 |
| Net investment income (loss) (a) | 0.13 | | 0.23 | | 0.18 | | 0.10 |
| Net realized and unrealized gain (loss) | (0.50) | | (0.10) | | (0.83) | | 1.85 |
| Total from investment operations | (0.37) | | 0.13 | | (0.65) | | 1.95 |
| Less distributions: | | | | | | | |
| From net investment income | — | | (0.17) | | (0.15) | | (0.06) |
| From net realized gain on investments | — | | (0.02) | | (0.02) | | (0.01) |
| Total distributions | — | | (0.19) | | (0.17) | | (0.07) |
| Net asset value at end of period | $ 10.63 | | $ 11.00 | | $ 11.06 | | $ 11.88 |
| Total investment return (b) | (3.36)% | | 1.30% | | (5.60)% | | 19.50% |
| Ratios (to average net assets)/Supplemental Data: | | | | | | | |
| Net investment income (loss) | 2.38%†† | | 2.17% | | 1.53% | | 1.02%†† |
| Net expenses (c) | 0.67%†† | | 0.71% | | 0.70% | | 0.80%†† |
| Expenses (before waiver/reimbursement) (c) | 0.67%†† | | 0.71% | | 0.70% | | 1.04%†† |
| Portfolio turnover rate | 15% | | 63% | | 58% | | 45% |
| Net assets at end of period (in 000’s) | $ 96,534 | | $ 95,456 | | $ 86,128 | | $ 54,345 |
| * | Unaudited. |
| ^ | Inception date. |
| †† | Annualized. |
| (a) | Per share data based on average shares outstanding during the period. |
| (b) | Total investment return is calculated exclusive of sales charges and assumes the reinvestment of dividends and distributions. For periods of less than one year, total return is not annualized. |
| (c) | In addition to the fees and expenses which the Fund bears directly, it also indirectly bears a pro-rata share of the fees and expenses of the underlying funds in which it invests. Such indirect expenses are not included in the above expense ratios. |
The notes to the financial statements are an integral part of, and should be read in conjunction with, the financial statements.
| 52 | MainStay Moderate ETF Allocation Fund |
Financial Highlights selected per share data and ratios
| | Six months ended
October 31,
2023* | | Year Ended April 30, | | June 30, 2020^ through
April 30, |
| Class C | 2023 | | 2022 | | 2021 |
| Net asset value at beginning of period | $ 10.95 | | $ 11.00 | | $ 11.83 | | $ 10.00 |
| Net investment income (loss) (a) | 0.09 | | 0.15 | | 0.08 | | 0.03 |
| Net realized and unrealized gain (loss) | (0.50) | | (0.10) | | (0.83) | | 1.85 |
| Total from investment operations | (0.41) | | 0.05 | | (0.75) | | 1.88 |
| Less distributions: | | | | | | | |
| From net investment income | — | | (0.08) | | (0.06) | | (0.04) |
| From net realized gain on investments | — | | (0.02) | | (0.02) | | (0.01) |
| Total distributions | — | | (0.10) | | (0.08) | | (0.05) |
| Net asset value at end of period | $ 10.54 | | $ 10.95 | | $ 11.00 | | $ 11.83 |
| Total investment return (b) | (3.74)% | | 0.48% | | (6.44)% | | 18.82% |
| Ratios (to average net assets)/Supplemental Data: | | | | | | | |
| Net investment income (loss) | 1.59%†† | | 1.37% | | 0.70% | | 0.29%†† |
| Net expenses (c) | 1.47%†† | | 1.53% | | 1.54% | | 1.55%†† |
| Expenses (before waiver/reimbursement) (c) | 1.47%†† | | 1.53% | | 1.54% | | 1.77%†† |
| Portfolio turnover rate | 15% | | 63% | | 58% | | 45% |
| Net assets at end of period (in 000’s) | $ 340 | | $ 341 | | $ 389 | | $ 506 |
| * | Unaudited. |
| ^ | Inception date. |
| †† | Annualized. |
| (a) | Per share data based on average shares outstanding during the period. |
| (b) | Total investment return is calculated exclusive of sales charges and assumes the reinvestment of dividends and distributions. For periods of less than one year, total return is not annualized. |
| (c) | In addition to the fees and expenses which the Fund bears directly, it also indirectly bears a pro-rata share of the fees and expenses of the underlying funds in which it invests. Such indirect expenses are not included in the above expense ratios. |
The notes to the financial statements are an integral part of, and should be read in conjunction with, the financial statements.
53
Financial Highlights selected per share data and ratios
| | Six months ended
October 31,
2023* | | Year Ended April 30, | | June 30, 2020^ through
April 30, |
| Class I | 2023 | | 2022 | | 2021 |
| Net asset value at beginning of period | $ 11.01 | | $ 11.07 | | $ 11.87 | | $ 10.00 |
| Net investment income (loss) (a) | 0.15 | | 0.27 | | 0.22 | | 0.13 |
| Net realized and unrealized gain (loss) | (0.51) | | (0.11) | | (0.83) | | 1.84 |
| Total from investment operations | (0.36) | | 0.16 | | (0.61) | | 1.97 |
| Less distributions: | | | | | | | |
| From net investment income | — | | (0.20) | | (0.17) | | (0.09) |
| From net realized gain on investments | — | | (0.02) | | (0.02) | | (0.01) |
| Total distributions | — | | (0.22) | | (0.19) | | (0.10) |
| Net asset value at end of period | $ 10.65 | | $ 11.01 | | $ 11.07 | | $ 11.87 |
| Total investment return (b) | (3.27)% | | 1.56% | | (5.31)% | | 19.79% |
| Ratios (to average net assets)/Supplemental Data: | | | | | | | |
| Net investment income (loss) | 2.62%†† | | 2.52% | | 1.83% | | 1.40%†† |
| Net expenses (c) | 0.42%†† | | 0.46% | | 0.45% | | 0.55%†† |
| Expenses (before waiver/reimbursement) (c) | 0.42%†† | | 0.46% | | 0.45% | | 0.79%†† |
| Portfolio turnover rate | 15% | | 63% | | 58% | | 45% |
| Net assets at end of period (in 000’s) | $ 78 | | $ 74 | | $ 73 | | $ 52 |
| * | Unaudited. |
| ^ | Inception date. |
| †† | Annualized. |
| (a) | Per share data based on average shares outstanding during the period. |
| (b) | Total investment return is calculated exclusive of sales charges and assumes the reinvestment of dividends and distributions. Class I shares are not subject to sales charges. For periods of less than one year, total return is not annualized. |
| (c) | In addition to the fees and expenses which the Fund bears directly, it also indirectly bears a pro-rata share of the fees and expenses of the underlying funds in which it invests. Such indirect expenses are not included in the above expense ratios. |
The notes to the financial statements are an integral part of, and should be read in conjunction with, the financial statements.
| 54 | MainStay Moderate ETF Allocation Fund |
Financial Highlights selected per share data and ratios
| | Six months ended
October 31,
2023* | | Year Ended April 30, | | June 30, 2020^ through
April 30, |
| Class R3 | 2023 | | 2022 | | 2021 |
| Net asset value at beginning of period | $ 10.98 | | $ 11.04 | | $ 11.86 | | $ 10.00 |
| Net investment income (loss) (a) | 0.11 | | 0.20 | | 0.15 | | 0.07 |
| Net realized and unrealized gain (loss) | (0.50) | | (0.10) | | (0.84) | | 1.85 |
| Total from investment operations | (0.39) | | 0.10 | | (0.69) | | 1.92 |
| Less distributions: | | | | | | | |
| From net investment income | — | | (0.14) | | (0.11) | | (0.05) |
| From net realized gain on investments | — | | (0.02) | | (0.02) | | (0.01) |
| Total distributions | — | | (0.16) | | (0.13) | | (0.06) |
| Net asset value at end of period | $ 10.59 | | $ 10.98 | | $ 11.04 | | $ 11.86 |
| Total investment return (b) | (3.55)% | | 0.94% | | (5.92)% | | 19.22% |
| Ratios (to average net assets)/Supplemental Data: | | | | | | | |
| Net investment income (loss) | 2.02%†† | | 1.83% | | 1.22% | | 0.76%†† |
| Net expenses (c) | 1.02%†† | | 1.06% | | 1.05% | | 1.15%†† |
| Expenses (before waiver/reimbursement) (c) | 1.02%†† | | 1.06% | | 1.05% | | 1.39%†† |
| Portfolio turnover rate | 15% | | 63% | | 58% | | 45% |
| Net assets at end of period (in 000’s) | $ 1,957 | | $ 1,240 | | $ 854 | | $ 403 |
| * | Unaudited. |
| ^ | Inception date. |
| †† | Annualized. |
| (a) | Per share data based on average shares outstanding during the period. |
| (b) | Total investment return is calculated exclusive of sales charges and assumes the reinvestment of dividends and distributions. Class R3 shares are not subject to sales charges. For periods of less than one year, total return is not annualized. |
| (c) | In addition to the fees and expenses which the Fund bears directly, it also indirectly bears a pro-rata share of the fees and expenses of the underlying funds in which it invests. Such indirect expenses are not included in the above expense ratios. |
The notes to the financial statements are an integral part of, and should be read in conjunction with, the financial statements.
55
Financial Highlights selected per share data and ratios
| | Six months ended
October 31,
2023* | | Year Ended April 30, | | August 31, 2020^ through
April 30, |
| SIMPLE Class | 2023 | | 2022 | | 2021 |
| Net asset value at beginning of period | $ 10.97 | | $ 11.03 | | $ 11.85 | | $ 10.66 |
| Net investment income (loss) (a) | 0.11 | | 0.19 | | 0.13 | | 0.06 |
| Net realized and unrealized gain (loss) | (0.50) | | (0.09) | | (0.81) | | 1.19 |
| Total from investment operations | (0.39) | | 0.10 | | (0.68) | | 1.25 |
| Less distributions: | | | | | | | |
| From net investment income | — | | (0.14) | | (0.12) | | (0.05) |
| From net realized gain on investments | — | | (0.02) | | (0.02) | | (0.01) |
| Total distributions | — | | (0.16) | | (0.14) | | (0.06) |
| Net asset value at end of period | $ 10.58 | | $ 10.97 | | $ 11.03 | | $ 11.85 |
| Total investment return (b) | (3.56)% | | 0.97% | | (5.89)% | | 11.75% |
| Ratios (to average net assets)/Supplemental Data: | | | | | | | |
| Net investment income (loss) | 2.03%†† | | 1.78% | | 1.07% | | 0.62%†† |
| Net expenses (c) | 0.97%†† | | 1.03% | | 1.05% | | 1.05%†† |
| Expenses (before waiver/reimbursement) (c) | 0.97%†† | | 1.03% | | 1.05% | | 1.27%†† |
| Portfolio turnover rate | 15% | | 63% | | 58% | | 45% |
| Net assets at end of period (in 000’s) | $ 10,182 | | $ 8,140 | | $ 3,167 | | $ 475 |
| * | Unaudited. |
| ^ | Inception date. |
| †† | Annualized. |
| (a) | Per share data based on average shares outstanding during the period. |
| (b) | Total investment return is calculated exclusive of sales charges and assumes the reinvestment of dividends and distributions. SIMPLE Class shares are not subject to sales charges. For periods of less than one year, total return is not annualized. |
| (c) | In addition to the fees and expenses which the Fund bears directly, it also indirectly bears a pro-rata share of the fees and expenses of the underlying funds in which it invests. Such indirect expenses are not included in the above expense ratios. |
The notes to the financial statements are an integral part of, and should be read in conjunction with, the financial statements.
| 56 | MainStay Moderate ETF Allocation Fund |
MainStay Growth ETF Allocation Fund
Investment and Performance Comparison (Unaudited)
Performance data quoted represents past performance. Past performance is no guarantee of future results. Because of market volatility and other factors, current performance may be lower or higher than the figures shown. Investment return and principal value will fluctuate, and as a result, when shares are redeemed, they may be worth more or less than their original cost. The graph below depicts the historical performance of Class I shares of the Fund. Performance will vary from class to class based on differences in class-specific expenses and sales charges. For performance information current to the most recent month-end, please call 800-624-6782 or visit newyorklifeinvestments.com.
The performance table and graph do not reflect the deduction of taxes that a shareholder would pay on distributions or Fund share redemptions. Total returns reflect maximum applicable sales charges as indicated in the table below, if any, changes in share price, and reinvestment of dividend and capital gain distributions. The graph assumes the initial investment amount shown below and reflects the deduction of all sales charges that would have applied for the period of investment. Performance figures may reflect certain fee waivers and/or expense limitations, without which total returns may have been lower. For more information on share classes and current fee waivers and/or expense limitations (if any), please refer to the Notes to Financial Statements.
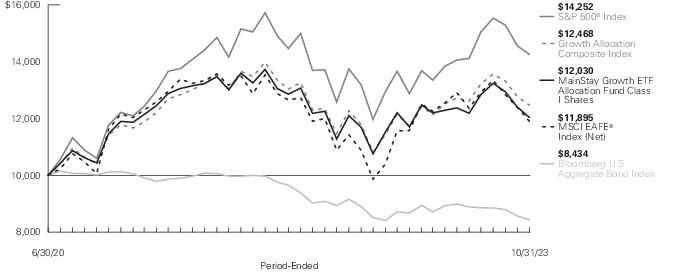
| Average Annual Total Returns for the Period-Ended October 31, 2023 |
| Class | Sales Charge | | Inception
Date | Six
Months1 | One
Year | Since
Inception | Gross
Expense
Ratio2 |
| Class A Shares | Maximum 3.00% Initial Sales Charge | With sales charges | 6/30/2020 | -5.77% | 1.16% | 4.48% | 0.94% |
| | | Excluding sales charges | | -2.86 | 4.28 | 5.44 | 0.94 |
| Class C Shares | Maximum 1.00% CDSC | With sales charges | 6/30/2020 | -4.18 | 2.41 | 4.64 | 1.72 |
| | if redeemed Within One Year of Purchase | Excluding sales charges | | -3.21 | 3.41 | 4.64 | 1.72 |
| Class I Shares | No Sales Charge | | 6/30/2020 | -2.78 | 4.46 | 5.69 | 0.69 |
| Class R3 Shares | No Sales Charge | | 6/30/2020 | -3.03 | 3.83 | 5.06 | 1.29 |
| SIMPLE Class Shares | No Sales Charge | | 8/31/2020 | -2.95 | 4.02 | 2.75 | 1.22 |
| 1. | Not annualized. |
| 2. | The gross expense ratios presented reflect the Fund’s “Total Annual Fund Operating Expenses” from the most recent Prospectus, as supplemented, and may differ from other expense ratios disclosed in this report. |
The footnotes on the next page are an integral part of the table and graph and should be carefully read in conjunction with them.
| Benchmark Performance* | Six
Months1 | One
Year | Since
Inception |
| S&P 500® Index2 | 1.39% | 10.14% | 11.21% |
| MSCI EAFE® Index (Net)3 | -7.88 | 14.40 | 5.34 |
| Bloomberg U.S. Aggregate Bond Index4 | -6.13 | 0.36 | -4.98 |
| Growth Allocation Composite Index5 | -1.99 | 9.11 | 6.84 |
| Morningstar Moderately Aggressive Allocation Category Average6 | -2.60 | 4.49 | 5.74 |
| * | Returns for indices reflect no deductions for fees, expenses or taxes, except for foreign withholding taxes where applicable. Results assume reinvestment of all dividends and capital gains. An investment cannot be made directly in an index. |
| 1. | Not annualized. |
| 2. | The S&P 500® Index is the Fund’s primary broad-based securities market index for comparison purposes. S&P 500® is a trademark of The McGraw-Hill Companies, Inc. The S&P 500® Index is widely regarded as the standard index for measuring large-cap U.S. stock market performance. |
| 3. | The MSCI EAFE® Index (Net) is the Fund's secondary benchmark. The MSCI EAFE® Index (Net) consists of international stocks representing the developed world outside of North America. |
| 4. | The Fund has selected the Bloomberg U.S. Aggregate Bond Index as an additional benchmark. The Bloomberg U.S. Aggregate Bond Index is a broad-based benchmark that measures the performance of the investment grade, U.S. dollar-denominated, fixed-rate taxable bond market, including Treasuries, government-related and corporate securities, mortgage-backed securities (agency fixed-rate and hybrid adjustable rate mortgage pass-throughs), asset-backed securities, and commercial mortgage-backed securities. |
| 5. | The Fund has selected the Growth Allocation Composite Index as an additional benchmark. The Growth Allocation Composite Index consists of the S&P 500® Index, the MSCI EAFE® Index (Net) and the Bloomberg U.S. Aggregate Bond Index weighted 60%, 20% and 20%, respectively. |
| 6. | The Morningstar Moderately Aggressive Allocation Category Average is representative of funds in allocation categories that seek to provide both income and capital appreciation by primarily investing in multiple asset classes, including stocks, bonds, and cash. These moderately aggressive strategies prioritize capital appreciation over preservation. They typically expect volatility similar to a strategic equity exposure between 70% and 85%. Results are based on average total returns of similar funds with all dividends and capital gain distributions reinvested. |
The footnotes on the preceding page are an integral part of the table and graph and should be carefully read in conjunction with them.
| 58 | MainStay Growth ETF Allocation Fund |
Cost in Dollars of a $1,000 Investment in MainStay Growth ETF Allocation Fund (Unaudited)
The example below is intended to describe the fees and expenses borne by shareholders during the six-month period from May 1, 2023 to October 31, 2023, and the impact of those costs on your investment.
Example
As a shareholder of the Fund you incur two types of costs: (1) transaction costs, including exchange fees and sales charges (loads) on purchases (as applicable), and (2) ongoing costs, including management fees, distribution and/or service (12b-1) fees and other Fund expenses (as applicable). This example is intended to help you understand your ongoing costs (in dollars) of investing in the Fund and to compare these costs with the ongoing costs of investing in other mutual funds. The example is based on an investment of $1,000 made at the beginning of the six-month period and held for the entire period from May 1, 2023 to October 31, 2023.
This example illustrates your Fund’s ongoing costs in two ways:
Actual Expenses
The second and third data columns in the table below provide information about actual account values and actual expenses. You may use the information in these columns, together with the amount you invested, to estimate the expenses that you paid during the six months ended October 31, 2023. Simply divide your account value by $1,000 (for example, an
$8,600 account value divided by $1,000 = 8.6), then multiply the result by the number under the heading entitled “Expenses Paid During Period” to estimate the expenses you paid on your account during this period.
Hypothetical Example for Comparison Purposes
The fourth and fifth data columns in the table below provide information about hypothetical account values and hypothetical expenses based on the Fund’s actual expense ratio and an assumed rate of return of 5% per year before expenses, which is not the Fund’s actual return. The hypothetical account values and expenses may not be used to estimate the actual ending account balances or expenses you paid for the six-month period shown. You may use this information to compare the ongoing costs of investing in the Fund with the ongoing costs of investing in other mutual funds. To do so, compare this 5% hypothetical example with the 5% hypothetical examples that appear in the shareholder reports of the other mutual funds.
Please note that the expenses shown in the table are meant to highlight your ongoing costs only and do not reflect any transactional costs, such as exchange fees or sales charges (loads). Therefore, the fourth and fifth data columns of the table are useful in comparing ongoing costs only and will not help you determine the relative total costs of owning different funds. In addition, if these transactional costs were included, your costs would have been higher.
| Share Class | Beginning
Account
Value
5/1/23 | Ending Account
Value (Based
on Actual
Returns and
Expenses)
10/31/23 | Expenses
Paid
During
Period1 | Ending Account
Value (Based
on Hypothetical
5% Annualized
Return and
Actual Expenses)
10/31/23 | Expenses
Paid
During
Period1 | Net Expense
Ratio
During
Period2 |
| Class A Shares | $1,000.00 | $971.40 | $3.62 | $1,021.47 | $3.71 | 0.73% |
| Class C Shares | $1,000.00 | $967.90 | $7.42 | $1,017.60 | $7.61 | 1.50% |
| Class I Shares | $1,000.00 | $972.20 | $2.38 | $1,022.72 | $2.44 | 0.48% |
| Class R3 Shares | $1,000.00 | $969.70 | $5.35 | $1,019.71 | $5.48 | 1.08% |
| SIMPLE Class Shares | $1,000.00 | $970.50 | $4.95 | $1,020.11 | $5.08 | 1.00% |
| 1. | Expenses are equal to the Fund’s annualized expense ratio of each class multiplied by the average account value over the period, divided by 366 and multiplied by 184 (to reflect the six-month period). The table above represents the actual expenses incurred during the six-month period. In addition to the fees and expenses which the Fund bears directly, it also indirectly bears a pro rata share of the fees and expenses of the underlying funds in which it invests. Such indirect expenses are not included in the above-reported expense figures. |
| 2. | Expenses are equal to the Fund's annualized expense ratio to reflect the six-month period. |
Asset Diversification as of October 31, 2023 (Unaudited)
| Equity Funds | 80.3 % |
| Fixed Income Funds | 18.5 |
| Short-Term Investments | 17.5 |
| Other Assets, Less Liabilities | (16.3) |
See Portfolio of Investments beginning on page 64 for specific holdings within these categories. The Fund’s holdings are subject to change.
| 60 | MainStay Growth ETF Allocation Fund |
Portfolio Management Discussion and Analysis (Unaudited)
Questions answered by portfolio managers Jae S. Yoon, CFA, Jonathan Swaney, Poul Kristensen, CFA, and Amit Soni, CFA, of New York Life Investment Management LLC, the Fund’s Manager.
How did MainStay Growth ETF Allocation Fund perform relative to its benchmarks and peer group during the six months ended October 31, 2023?
For the six months ended October 31, 2023, Class I shares of MainStay Growth ETF Allocation Fund returned −2.78%, underperforming the 1.39% return of the Fund’s primary benchmark, the S&P 500® Index, and outperforming the −7.88% return of the MSCI EAFE® Index (Net), which is the Fund’s secondary benchmark. Over the same period, Class I shares of the Fund outperformed the −6.13% return of the Bloomberg U.S. Aggregate Bond Index, and underperformed the −1.99% return of the Growth Allocation Composite Index, both of which are additional benchmarks of the Fund. For the six months ended October 31, 2023, Class I shares of the Fund underperformed the −2.60% return of the Morningstar Moderately Aggressive Allocation Category Average.1
What factors affected the Fund’s relative performance during the reporting period?
The Fund is a “fund of funds" that seeks to achieve its investment objective by investing in unaffiliated, passively managed, exchange-traded funds (“Underlying ETFs”). The Underlying ETFs may invest in U.S. equities, international equities and fixed-income instruments, making comparisons to any single index generally less suitable than a weighted combination of indices, which is a more useful yardstick by which to measure performance. During the reporting period, asset class policy was the primary determinant of the Fund’s relative performance.
Fund management internally maintains a blend of indices that are taken into consideration when managing the Fund. During the reporting period, the Fund moderately underperformed the internally maintained blend of indices, primarily due to asset class policy decisions.
At the start of the reporting period, the Fund held slightly underweight exposure to equities in anticipation of a possible recession induced by a combination of higher interest rates, reduced willingness on the part of banks to lend, and the fall in money supply accompanying the quantitative tightening program undertaken by the U.S. Federal Reserve (the “Fed”). However, equities rallied sharply from May through July 2023, detracting from the Fund’s relative performance. We gradually reduced the Fund’s underweight exposure to equities over the summer and
then eliminated the position altogether, lessening the benefit that came with the market’s retreat from August through October.
Relative performance lost substantially more ground as a result of the Fund’s underweight exposure to certain mega-cap technology-related companies. The companies, tagged “the Magnificent 7,” included Alphabet, Amazon.com, Apple, Meta Platforms, Microsoft, NVIDIA and Tesla. All were richly valued, implying rapid earnings growth ahead. We were skeptical that the companies, already among the largest firms in the world with dominant positions in their respective industries, could meet these high growth expectations. Accordingly, we shifted the Fund out of capitalization-weighted large-cap index products, favoring other options—most notably an equally weighted version of the S&P 500® Index. However, ongoing enthusiasm for the potential of artificial intelligence (“AI”) to bolster the Magnificent 7’s business prospects supported rising stock prices. From May through October 2023, the Bloomberg Magnificent 7 Total Return Index2 returned 21%, compared to a loss of 5% for the S&P 500® Equal Weight Index.3
Other positions detracting from relative performance included a number of defensive holdings adopted in anticipation of an economic contraction and more challenging conditions in capital markets. These included exposure to low volatility stocks, exposure to traditionally defensive sectors (such as health care), extending duration4 in Treasury bonds and shying away from speculative-grade credit (such as bank loans).
Some positions made positive contributions to relative performance. (Contributions take weightings and total returns into account.) A tilt into energy stocks benefited from a rise in the price of oil—presumably a result of Saudi production cuts along with rising geopolitical tensions at least partly tied to the Palestinian-Israeli conflict. Other positives included a decisive preference for Japan over Europe within the developed international space and exposure to uranium miners.
How did you allocate the Fund’s assets during the reporting period and why?
Stock/bond blend: As mentioned above, in anticipation of a recession that would drive down stock prices through both reduced corporate earnings and lower valuation multiples, the Fund held modestly underweight exposure to equities for much of the reporting period. We gradually reduced that underweight
| 1. | See "Investment and Performance Comparison" for other share class returns, which may be higher or lower than Class I share returns, and for more information on benchmark and peer group returns. |
| 2. | The Bloomberg Magnificent 7 Total Return Index is an equal-dollar weighted equity benchmark consisting of a fixed basket of 7 widely-traded companies classified in the United States and representing the Communications, Consumer Discretionary and Technology sectors as defined by Bloomberg Industry Classification System (BICS). An investment cannot be made directly in an index. |
| 3. | The S&P 500® Equal Weight Index (“EWI”) is the equal-weight version of the widely-used S&P 500® Index. The S&P 500® EWI includes the same constituents as the capitalization weighted S&P 500® Index, but each company in the S&P 500® EWI is allocated a fixed weight, or 0.2% of the Index total at each quarterly rebalance. An investment cannot be made directly in an index. |
| 4. | Duration is a measure of the price sensitivity of a fixed-income investment to changes in interest rates. Duration is expressed as a number of years and is considered a more accurate sensitivity gauge than average maturity. |
position as the reporting period wore on and the expected economic contraction failed to materialize. As of the end of the reporting period, the Fund held slightly greater total equity exposure than the Growth Allocation Composite Index.
Duration: With yields having risen considerably in the preceding three years, we had increased the Fund’s duration to very close to neutral by the end of April 2023. Yields continued to rise over the summer and into the fall as investors worried about heavy new U.S. Treasury issuance, a “higher for longer” monetary policy, stubborn inflationary pressures and rising yields abroad. We believed that a combination of waning consumption, normalized supply chains and improving productivity would eventually curb inflation and yields would drop sharply. Accordingly, we added duration as yields climbed, such that the Fund’s duration was slightly more than six months long as of the end of the reporting period.
Equity style: Whereas we shifted to a neutral posture in terms of the stock/bond blend during the reporting period, we maintained a conservative stance in terms of the Fund’s equity style in order to protect against the potential onset of a recession. Specifically, the Fund favored value over growth, with a particular emphasis on defensive sectors (health care and utilities) and characteristics (low volatility).
Equity size: Being skeptical of the ability of mega-cap market leaders to consistently deliver the high rates of earnings growth required to justify their relative valuations, we steered the Fund away from these names to a degree. In particular, we increased exposure to the S&P 500® EWI in which market cap does not affect the weight of each constituent. Whereas the Magnificent 7 represented approximately 30% of the S&P 500® Index, they represented only 1.4% of the S&P 500® EWI. We further limited the impact of mega-cap market leaders on the Fund through exposure to the S&P Mid Cap 400® Index.5
Geographic exposure: In our view, European equities appeared vulnerable during the reporting period. Persistently high wage growth seemed likely to compel the European Central Bank to maintain restrictive monetary policy for the foreseeable future, while their export-heavy economies wrestled with declining global trade volumes, and energy price spikes remained a risk amid elevated geopolitical tensions. Conversely, the Bank of Japan remained engaged in accommodative policy, with Japanese exports boosted by a weak yen and shareholder governance increasingly prioritized by company management, largely in the form of share buybacks. With these trends in mind, we tilted the Fund away from European markets in favor of Japanese stocks, with net exposure to non-U.S. stocks held close to neutral.
Energy: The Fund maintained exposure to upstream energy producers and oilfield/gas field service providers as a commodity play to provide an additional inflation hedge. These holdings also positioned the Fund to take advantage of opportunities for domestic producers to benefit as Western nations revisit energy policy to source supplies from stable and friendly jurisdictions rather than autocratic petrostates that present national security risks. While the Fund’s energy position was small, it had a disproportionately positive impact on performance.
How did the Fund’s allocations change over the course of the reporting period?
The single largest change to the Fund’s allocations involved the introduction and subsequent growth of a position in iShares® 20+ Year Treasury Bond ETF, which we used to extend the Fund’s duration as bond yields rose. The purchases were funded from cash. The next largest change involved an increased allocation to Invesco S&P 500® Equal Weight ETF. This was also funded from cash, as we sought to remove the Fund’s underweight equity position without significantly increasing exposure to the Magnificent 7.
All other adjustments proved comparatively modest. They included the closure of positions in SPDR® S&P® Oil & Gas Exploration ETF and VanEck Oil Services ETF (the latter of which was later restored); reductions in holdings of Invesco Senior Loan ETF and Schwab U.S. Small-Cap ETF; an increase in exposure to iShares® MSCI Japan ETF; and an allocation to Utilities Select Sector SPDR® Fund.
The Fund also opened a small position in Global X Uranium ETF, which invests primarily in uranium mining firms. Climate change concerns and the limitations of renewable energy are driving a reconsideration of nuclear energy sources, for which fuel supply is somewhat limited. We foresee a supply/demand imbalance developing that is likely to support businesses involved with extracting and processing uranium.
During the reporting period, which Underlying Equity ETFs had the highest total returns and which Underlying Equity ETFs had the lowest total returns?
Of those Underlying Equity ETFs held for the entire reporting period, only iShares® MSCI Japan ETF generated a positive return. The smallest losses came from iShares® Core S&P Mid-Cap ETF and Schwab U.S. Mid-Cap ETF.
Underlying Equity ETFs held for the entire reporting period that saw the largest declines included iShares® Core MSCI EAFE ETF, Invesco S&P 500® Low Volatility ETF and Health Care Select Sector SPDR® Fund.
| 5. | The S&P Mid Cap 400® Index measures the performance of the mid-cap segment of the U.S. market. The Index is composed of 400 constituent companies. An investment cannot be made directly in an index. |
| 62 | MainStay Growth ETF Allocation Fund |
Which Underlying Equity ETFs were the strongest positive contributors to the Fund’s performance and which Underlying Equity ETFs were particularly weak?
Contribution to return is a function not only of Underlying ETF performance and average allocation, but also the variation in that allocation across time. The Underlying Equity ETFs making the largest positive contributions to return included Vanguard Mega Cap ETF, VanEck Oil Services ETF and SPDR® S&P® Oil & Gas Exploration & Production ETF. The most significant detractors included iShares® Core MSCI EAFE ETF, Vanguard Mid-Cap ETF and Invesco S&P 500® Equal Weight ETF.
During the reporting period, which Underlying Fixed-Income ETFs had the highest total returns and which Underlying Fixed-Income ETFs had the lowest total returns?
The Underlying Fixed-Income ETFs posting the highest total returns included Invesco Senior Loan ETF, a cash sweep account and iShares® 0–5 Year High Yield Corporate Bond ETF. Among Underlying Fixed-Income ETFs held for the entire reporting period, those posting the steepest losses included Schwab U.S. Aggregate Bond ETF, iShares® Core U.S. Aggregate Bond ETF and iShares® Broad USD Investment Grade Corporate Bond ETF.
Which Underlying Fixed-Income ETFs were the strongest positive contributors to the Fund’s performance and which Underlying Fixed-Income ETFs were particularly weak?
The Underlying Fixed-Income ETFs making the largest contributions to return included a cash sweep account, Invesco Senior Loan ETF and iShares® 0–5 Year High Yield Corporate Bond ETF. The most significant detractors from absolute performance included iShares® 20+ Year Treasury Bond ETF, followed by Schwab U.S. Aggregate Bond ETF and iShares® Core U.S. Aggregate Bond ETF.
How was the Fund positioned at the end of the reporting period?
For some time now, we have held the view that a recession in response to dramatic monetary policy tightening and the expiration of pandemic era support programs is all but inevitable. That remains the case today, and indications of the onset of this
recession are beginning to accumulate. We firmly expect corporate profits will decline over the next several quarters, eventually taking stock prices down with them, while also driving down Treasury yields and pushing credit spreads6 out. Accordingly, the Fund maintains a relatively defensive posture.
Having been reminded of just how difficult it is to call a market top, we are resistant to being underweight equities, so we have parked the Fund in neutral along this dimension for the time being, although we intend to exploit any significant pullbacks—should they arrive—by building an overweight position.
Defensive positioning is more clearly visible within asset classes. Most notably, we have extended the Fund’s duration considerably through purchases of a long-dated Treasury bond ETF, with the expectation that it will be the beneficiary of a flight to quality as economic and market conditions deteriorate. Additionally, we are maintaining exposure to bank loans at a below-benchmark weight, and skewing holdings of high yield bonds to favor shorter maturity instruments, which tend to exhibit less volatility and smaller losses than longer-maturity bonds.
On the equity side, the Fund favors sectors that have generally exhibited lower volatility and retained their value better during drawdowns. Prominent among these are utilities and health care.
| 6. | The terms “spread” and “yield spread” may refer to the difference in yield between a security or type of security and comparable U.S. Treasury issues. The terms may also refer to the difference in yield between two specific securities or types of securities at a given time. The term “credit spread” typically refers to the difference in yield between corporate or municipal bonds (or a specific category of these bonds) and comparable U.S. Treasury issues. |
None of Schwab Strategic Trust, Schwab® U.S. Aggregate Bond ETF, Schwab U.S. Small Cap ETF, Schwab U.S. Mid-Cap ETF, or Charles Schwab Investment Management, Inc. make any representations regarding the advisability of investing in MainStay Growth ETF Allocation Fund.
iShares® is a registered trademark of BlackRock (BlackRock, Inc. and its subsidiaries). Neither BlackRock nor the iShares® Funds make any representations regarding the advisability of investing in MainStay Growth ETF Allocation Fund.
The opinions expressed are those of the portfolio managers as of the date of this report and are subject to change. There is no guarantee that any forecasts will come to pass. This material does not constitute investment advice and is not intended as an endorsement of any specific investment.
Portfolio of Investments October 31, 2023†^(Unaudited)
| | Shares | Value |
| Investment Companies 98.8% |
| Equity Funds 80.3% |
| Global X Uranium ETF | 33,641 | $ 902,924 |
| Health Care Select Sector SPDR Fund | 6,759 | 841,766 |
| Invesco S&P 500 Equal Weight ETF (a) | 27,916 | 3,791,830 |
| Invesco S&P 500 Low Volatility ETF | 14,904 | 870,096 |
| iShares Core MSCI EAFE ETF | 179,483 | 11,192,560 |
| iShares Core MSCI Emerging Markets ETF | 55,924 | 2,569,149 |
| iShares Core S&P Mid-Cap ETF | 13,339 | 3,148,004 |
| iShares Core S&P Small-Cap ETF | 54,211 | 4,818,816 |
| iShares MSCI Japan ETF | 44,511 | 2,624,369 |
| Materials Select Sector SPDR Fund | 11,168 | 849,438 |
| Schwab U.S. Mid-Cap ETF | 37,995 | 2,432,440 |
| Schwab U.S. Small-Cap ETF | 93,694 | 3,631,579 |
| Utilities Select Sector SPDR Fund | 15,038 | 897,618 |
| Vanguard Mega Cap ETF (a) | 137,813 | 20,569,968 |
| Vanguard Mega Cap Value ETF (a) | 13,032 | 1,290,950 |
| Vanguard Mid-Cap ETF | 45,034 | ��8,935,196 |
Total Equity Funds
(Cost $68,416,207) | | 69,366,703 |
| Fixed Income Funds 18.5% |
| Invesco Senior Loan ETF (a) | 125,973 | 2,620,238 |
| iShares 0-5 Year High Yield Corporate Bond ETF (a) | 48,976 | 1,984,997 |
| iShares 20+ Year Treasury Bond ETF | 56,991 | 4,763,308 |
| iShares Broad USD High Yield Corporate Bond ETF (a) | 64,467 | 2,204,127 |
| iShares Broad USD Investment Grade Corporate Bond ETF | 11,073 | 520,874 |
| iShares Core U.S. Aggregate Bond ETF (a) | 11,375 | 1,050,026 |
| Schwab U.S. Aggregate Bond ETF | 24,201 | 1,050,565 |
| Vanguard Short-Term Bond ETF | 23,427 | 1,757,494 |
Total Fixed Income Funds
(Cost $17,043,078) | | 15,951,629 |
Total Investment Companies
(Cost $85,459,285) | | 85,318,332 |
| Short-Term Investments 17.5% |
| Affiliated Investment Company 1.0% |
| MainStay U.S. Government Liquidity Fund, 5.275% (b) | 909,399 | 909,399 |
| Unaffiliated Investment Companies 16.5% |
| Invesco Government & Agency Portfolio, 5.357% (b)(c) | 11,231,954 | 11,231,954 |
| RBC U.S. Government Money Market Fund, 5.399% (b)(c) | 1,000,000 | 1,000,000 |
The notes to the financial statements are an integral part of, and should be read in conjunction with, the financial statements.
| 64 | MainStay Growth ETF Allocation Fund |
| | Shares | | Value |
| Short-Term Investments (continued) |
| Unaffiliated Investment Companies (continued) |
| State Street Institutional U.S. Government Money Market Fund, 5.358% (b)(c) | 2,000,000 | | $ 2,000,000 |
| | | | 14,231,954 |
Total Short-Term Investments
(Cost $15,141,353) | | | 15,141,353 |
Total Investments
(Cost $100,600,638) | 116.3% | | 100,459,685 |
| Other Assets, Less Liabilities | (16.3) | | (14,092,646) |
| Net Assets | 100.0% | | $ 86,367,039 |
| † | Percentages indicated are based on Fund net assets. |
| ^ | Industry classifications may be different than those used for compliance monitoring purposes. |
| (a) | All or a portion of this security was held on loan. As of October 31, 2023, the aggregate market value of securities on loan was $14,069,623; the total market value of collateral held by the Fund was $14,302,765. The market value of the collateral held included non-cash collateral in the form of U.S. Treasury securities with a value of $70,811. The Fund received cash collateral with a value of $14,231,954. (See Note 2(G)) |
| (b) | Current yield as of October 31, 2023. |
| (c) | Represents a security purchased with cash collateral received for securities on loan. |
Investments in Affiliates (in 000's)
Investments in issuers considered to be affiliate(s) of the Fund during the six-month period ended October 31, 2023 for purposes of Section 2(a)(3) of the Investment Company Act of 1940, as amended, were as follows:
| Affiliated Investment Companies | Value,
Beginning
of Period | Purchases
at Cost | Proceeds
from
Sales | Net
Realized
Gain/(Loss)
on Sales | Change in
Unrealized
Appreciation/
(Depreciation) | Value,
End of
Period | Dividend
Income | Other
Distributions | Shares
End of
Period |
| MainStay U.S. Government Liquidity Fund | $ 7,400 | $ 5,731 | $ (12,222) | $ — | $ — | $ 909 | $ 115 | $ — | 909 |
| Abbreviation(s): |
| EAFE—Europe, Australasia and Far East |
| ETF—Exchange-Traded Fund |
| MSCI—Morgan Stanley Capital International |
| SPDR—Standard & Poor’s Depositary Receipt |
| USD—United States Dollar |
The notes to the financial statements are an integral part of, and should be read in conjunction with, the financial statements.
65
Portfolio of Investments October 31, 2023†^(Unaudited) (continued)
The following is a summary of the fair valuations according to the inputs used as of October 31, 2023, for valuing the Fund’s assets:
| Description | Quoted
Prices in
Active
Markets for
Identical
Assets
(Level 1) | | Significant
Other
Observable
Inputs
(Level 2) | | Significant
Unobservable
Inputs
(Level 3) | | Total |
| Asset Valuation Inputs | | | | | | | |
| Investments in Securities (a) | | | | | | | |
| Investment Companies | | | | | | | |
| Equity Funds | $ 69,366,703 | | $ — | | $ — | | $ 69,366,703 |
| Fixed Income Funds | 15,951,629 | | — | | — | | 15,951,629 |
| Total Investment Companies | 85,318,332 | | — | | — | | 85,318,332 |
| Short-Term Investments | | | | | | | |
| Affiliated Investment Company | 909,399 | | — | | — | | 909,399 |
| Unaffiliated Investment Companies | 14,231,954 | | — | | — | | 14,231,954 |
| Total Short-Term Investments | 15,141,353 | | — | | — | | 15,141,353 |
| Total Investments in Securities | $ 100,459,685 | | $ — | | $ — | | $ 100,459,685 |
| (a) | For a complete listing of investments, see the Portfolio of Investments. |
The notes to the financial statements are an integral part of, and should be read in conjunction with, the financial statements.
| 66 | MainStay Growth ETF Allocation Fund |
Statement of Assets and Liabilities as of October 31, 2023 (Unaudited)
| Assets |
Investment in unaffiliated securities, at value
(identified cost $99,691,239) including securities on loan of $14,069,623 | $ 99,550,286 |
Investment in affiliated investment companies, at value
(identified cost $909,399) | 909,399 |
| Receivables: | |
| Fund shares sold | 463,487 |
| Securities lending | 13,022 |
| Dividends | 7,092 |
| Other assets | 48,999 |
| Total assets | 100,992,285 |
| Liabilities |
| Cash collateral received for securities on loan | 14,231,954 |
| Payables: | |
| Fund shares redeemed | 181,096 |
| Investment securities purchased | 137,371 |
| NYLIFE Distributors (See Note 3) | 21,293 |
| Transfer agent (See Note 3) | 17,637 |
| Professional fees | 15,267 |
| Manager (See Note 3) | 14,691 |
| Custodian | 5,676 |
| Shareholder communication | 204 |
| Accrued expenses | 57 |
| Total liabilities | 14,625,246 |
| Net assets | $ 86,367,039 |
| Composition of Net Assets |
| Shares of beneficial interest outstanding (par value of $.001 per share) unlimited number of shares authorized | $ 7,481 |
| Additional paid-in-capital | 89,475,981 |
| | 89,483,462 |
| Total distributable earnings (loss) | (3,116,423) |
| Net assets | $ 86,367,039 |
| Class A | |
| Net assets applicable to outstanding shares | $73,050,467 |
| Shares of beneficial interest outstanding | 6,325,227 |
| Net asset value per share outstanding | $ 11.55 |
| Maximum sales charge (3.00% of offering price) | 0.36 |
| Maximum offering price per share outstanding | $ 11.91 |
| Class C | |
| Net assets applicable to outstanding shares | $ 285,266 |
| Shares of beneficial interest outstanding | 24,911 |
| Net asset value and offering price per share outstanding | $ 11.45 |
| Class I | |
| Net assets applicable to outstanding shares | $ 103,968 |
| Shares of beneficial interest outstanding | 9,016 |
| Net asset value and offering price per share outstanding | $ 11.53 |
| Class R3 | |
| Net assets applicable to outstanding shares | $ 811,481 |
| Shares of beneficial interest outstanding | 70,492 |
| Net asset value and offering price per share outstanding | $ 11.51 |
| SIMPLE Class | |
| Net assets applicable to outstanding shares | $12,115,857 |
| Shares of beneficial interest outstanding | 1,051,166 |
| Net asset value and offering price per share outstanding | $ 11.53 |
The notes to the financial statements are an integral part of, and should be read in conjunction with, the financial statements.
67
Statement of Operations for the six months ended October 31, 2023 (Unaudited)
| Investment Income (Loss) |
| Income | |
| Dividends-unaffiliated | $ 1,012,134 |
| Dividends-affiliated | 115,336 |
| Securities lending, net | 70,760 |
| Total income | 1,198,230 |
| Expenses | |
| Manager (See Note 3) | 86,247 |
| Distribution/Service—Class A (See Note 3) | 92,397 |
| Distribution/Service—Class C (See Note 3) | 1,530 |
| Distribution/Service—Class R3 (See Note 3) | 1,964 |
| Distribution/Service—SIMPLE Class (See Note 3) | 27,822 |
| Transfer agent (See Note 3) | 50,694 |
| Registration | 35,967 |
| Professional fees | 20,021 |
| Custodian | 8,885 |
| Shareholder communication | 1,833 |
| Trustees | 1,121 |
| Shareholder service (See Note 3) | 393 |
| Miscellaneous | 3,234 |
| Total expenses | 332,108 |
| Net investment income (loss) | 866,122 |
| Realized and Unrealized Gain (Loss) |
| Net realized gain (loss) on unaffiliated investments | (226,904) |
| Net change in unrealized appreciation (depreciation) on unaffiliated investments | (3,389,971) |
| Net realized and unrealized gain (loss) | (3,616,875) |
| Net increase (decrease) in net assets resulting from operations | $(2,750,753) |
The notes to the financial statements are an integral part of, and should be read in conjunction with, the financial statements.
| 68 | MainStay Growth ETF Allocation Fund |
Statements of Changes in Net Assets
for the six months ended October 31, 2023 (Unaudited) and the year ended April 30, 2023
| | Six months
ended
October 31,
2023 | Year
ended
April 30,
2023 |
| Increase (Decrease) in Net Assets |
| Operations: | | |
| Net investment income (loss) | $ 866,122 | $ 1,189,736 |
| Net realized gain (loss) | (226,904) | (3,507,501) |
| Net change in unrealized appreciation (depreciation) | (3,389,971) | 3,790,020 |
| Net increase (decrease) in net assets resulting from operations | (2,750,753) | 1,472,255 |
| Distributions to shareholders: | | |
| Class A | — | (904,515) |
| Class C | — | (2,440) |
| Class I | — | (1,696) |
| Class R3 | — | (7,027) |
| SIMPLE Class | — | (91,952) |
| Total distributions to shareholders | — | (1,007,630) |
| Capital share transactions: | | |
| Net proceeds from sales of shares | 15,719,039 | 29,043,850 |
| Net asset value of shares issued to shareholders in reinvestment of distributions | — | 1,007,165 |
| Cost of shares redeemed | (6,034,045) | (8,232,844) |
| Increase (decrease) in net assets derived from capital share transactions | 9,684,994 | 21,818,171 |
| Net increase (decrease) in net assets | 6,934,241 | 22,282,796 |
| Net Assets |
| Beginning of period | 79,432,798 | 57,150,002 |
| End of period | $86,367,039 | $79,432,798 |
The notes to the financial statements are an integral part of, and should be read in conjunction with, the financial statements.
69
Financial Highlights selected per share data and ratios
| | Six months ended
October 31,
2023* | | Year Ended April 30, | | June 30, 2020^ through
April 30, |
| Class A | 2023 | | 2022 | | 2021 |
| Net asset value at beginning of period | $ 11.89 | | $ 11.92 | | $ 12.79 | | $ 10.00 |
| Net investment income (loss) (a) | 0.13 | | 0.22 | | 0.18 | | 0.09 |
| Net realized and unrealized gain (loss) | (0.47) | | (0.07) | | (0.89) | | 2.76 |
| Total from investment operations | (0.34) | | 0.15 | | (0.71) | | 2.85 |
| Less distributions: | | | | | | | |
| From net investment income | — | | (0.18) | | (0.15) | | (0.05) |
| From net realized gain on investments | — | | (0.00)‡ | | (0.01) | | (0.01) |
| Total distributions | — | | (0.18) | | (0.16) | | (0.06) |
| Net asset value at end of period | $ 11.55 | | $ 11.89 | | $ 11.92 | | $ 12.79 |
| Total investment return (b) | (2.86)% | | 1.32% | | (5.69)% | | 28.56% |
| Ratios (to average net assets)/Supplemental Data: | | | | | | | |
| Net investment income (loss) | 2.05%†† | | 1.88% | | 1.41% | | 0.90%†† |
| Net expenses (c) | 0.73%†† | | 0.80% | | 0.80% | | 0.80%†† |
| Expenses (before waiver/reimbursement) (c) | 0.73%†† | | 0.82% | | 0.85% | | 1.41%†† |
| Portfolio turnover rate | 15% | | 57% | | 54% | | 47% |
| Net assets at end of period (in 000’s) | $ 73,050 | | $ 68,880 | | $ 52,475 | | $ 29,705 |
| * | Unaudited. |
| ^ | Inception date. |
| ‡ | Less than one cent per share. |
| †† | Annualized. |
| (a) | Per share data based on average shares outstanding during the period. |
| (b) | Total investment return is calculated exclusive of sales charges and assumes the reinvestment of dividends and distributions. For periods of less than one year, total return is not annualized. |
| (c) | In addition to the fees and expenses which the Fund bears directly, it also indirectly bears a pro-rata share of the fees and expenses of the underlying funds in which it invests. Such indirect expenses are not included in the above expense ratios. |
The notes to the financial statements are an integral part of, and should be read in conjunction with, the financial statements.
| 70 | MainStay Growth ETF Allocation Fund |
Financial Highlights selected per share data and ratios
| | Six months ended
October 31,
2023* | | Year Ended April 30, | | June 30, 2020^ through
April 30, |
| Class C | 2023 | | 2022 | | 2021 |
| Net asset value at beginning of period | $ 11.83 | | $ 11.86 | | $ 12.73 | | $ 10.00 |
| Net investment income (loss) (a) | 0.08 | | 0.13 | | 0.09 | | 0.03 |
| Net realized and unrealized gain (loss) | (0.46) | | (0.07) | | (0.90) | | 2.74 |
| Total from investment operations | (0.38) | | 0.06 | | (0.81) | | 2.77 |
| Less distributions: | | | | | | | |
| From net investment income | — | | (0.09) | | (0.05) | | (0.03) |
| From net realized gain on investments | — | | (0.00)‡ | | (0.01) | | (0.01) |
| Total distributions | — | | (0.09) | | (0.06) | | (0.04) |
| Net asset value at end of period | $ 11.45 | | $ 11.83 | | $ 11.86 | | $ 12.73 |
| Total investment return (b) | (3.21)% | | 0.54% | | (6.40)% | | 27.72% |
| Ratios (to average net assets)/Supplemental Data: | | | | | | | |
| Net investment income (loss) | 1.31%†† | | 1.15% | | 0.67% | | 0.28%†† |
| Net expenses (c) | 1.50%†† | | 1.55% | | 1.55% | | 1.55%†† |
| Expenses (before waiver/reimbursement) (c) | 1.50%†† | | 1.60% | | 1.64% | | 2.12%†† |
| Portfolio turnover rate | 15% | | 57% | | 54% | | 47% |
| Net assets at end of period (in 000’s) | $ 285 | | $ 314 | | $ 310 | | $ 288 |
| * | Unaudited. |
| ^ | Inception date. |
| ‡ | Less than one cent per share. |
| †† | Annualized. |
| (a) | Per share data based on average shares outstanding during the period. |
| (b) | Total investment return is calculated exclusive of sales charges and assumes the reinvestment of dividends and distributions. For periods of less than one year, total return is not annualized. |
| (c) | In addition to the fees and expenses which the Fund bears directly, it also indirectly bears a pro-rata share of the fees and expenses of the underlying funds in which it invests. Such indirect expenses are not included in the above expense ratios. |
The notes to the financial statements are an integral part of, and should be read in conjunction with, the financial statements.
71
Financial Highlights selected per share data and ratios
| | Six months ended
October 31,
2023* | | Year Ended April 30, | | June 30, 2020^ through
April 30, |
| Class I | 2023 | | 2022 | | 2021 |
| Net asset value at beginning of period | $ 11.86 | | $ 11.89 | | $ 12.75 | | $ 10.00 |
| Net investment income (loss) (a) | 0.14 | | 0.22 | | 0.22 | | 0.12 |
| Net realized and unrealized gain (loss) | (0.47) | | (0.05) | | (0.89) | | 2.75 |
| Total from investment operations | (0.33) | | 0.17 | | (0.67) | | 2.87 |
| Less distributions: | | | | | | | |
| From net investment income | — | | (0.20) | | (0.18) | | (0.11) |
| From net realized gain on investments | — | | (0.00)‡ | | (0.01) | | (0.01) |
| Total distributions | — | | (0.20) | | (0.19) | | (0.12) |
| Net asset value at end of period | $ 11.53 | | $ 11.86 | | $ 11.89 | | $ 12.75 |
| Total investment return (b) | (2.78)% | | 1.58% | | (5.41)% | | 28.79% |
| Ratios (to average net assets)/Supplemental Data: | | | | | | | |
| Net investment income (loss) | 2.32%†† | | 1.95% | | 1.70% | | 1.23%†† |
| Net expenses (c) | 0.48%†† | | 0.55% | | 0.55% | | 0.55%†† |
| Expenses (before waiver/reimbursement) (c) | 0.48%†† | | 0.57% | | 0.60% | | 1.16%†† |
| Portfolio turnover rate | 15% | | 57% | | 54% | | 47% |
| Net assets at end of period (in 000’s) | $ 104 | | $ 107 | | $ 40 | | $ 40 |
| * | Unaudited. |
| ^ | Inception date. |
| ‡ | Less than one cent per share. |
| †† | Annualized. |
| (a) | Per share data based on average shares outstanding during the period. |
| (b) | Total investment return is calculated exclusive of sales charges and assumes the reinvestment of dividends and distributions. Class I shares are not subject to sales charges. For periods of less than one year, total return is not annualized. |
| (c) | In addition to the fees and expenses which the Fund bears directly, it also indirectly bears a pro-rata share of the fees and expenses of the underlying funds in which it invests. Such indirect expenses are not included in the above expense ratios. |
The notes to the financial statements are an integral part of, and should be read in conjunction with, the financial statements.
| 72 | MainStay Growth ETF Allocation Fund |
Financial Highlights selected per share data and ratios
| | Six months ended
October 31,
2023* | | Year Ended April 30, | | June 30, 2020^ through
April 30, |
| Class R3 | 2023 | | 2022 | | 2021 |
| Net asset value at beginning of period | $ 11.87 | | $ 11.90 | | $ 12.77 | | $ 10.00 |
| Net investment income (loss) (a) | 0.10 | | 0.18 | | 0.11 | | 0.05 |
| Net realized and unrealized gain (loss) | (0.46) | | (0.08) | | (0.87) | | 2.76 |
| Total from investment operations | (0.36) | | 0.10 | | (0.76) | | 2.81 |
| Less distributions: | | | | | | | |
| From net investment income | — | | (0.13) | | (0.10) | | (0.03) |
| From net realized gain on investments | — | | (0.00)‡ | | (0.01) | | (0.01) |
| Total distributions | — | | (0.13) | | (0.11) | | (0.04) |
| Net asset value at end of period | $ 11.51 | | $ 11.87 | | $ 11.90 | | $ 12.77 |
| Total investment return (b) | (3.03)% | | 0.96% | | (6.01)% | | 28.16% |
| Ratios (to average net assets)/Supplemental Data: | | | | | | | |
| Net investment income (loss) | 1.66%†† | | 1.54% | | 0.83% | | 0.48%†† |
| Net expenses (c) | 1.08%†† | | 1.15% | | 1.15% | | 1.15%†† |
| Expenses (before waiver/reimbursement) (c) | 1.08%†† | | 1.17% | | 1.20% | | 1.76%†† |
| Portfolio turnover rate | 15% | | 57% | | 54% | | 47% |
| Net assets at end of period (in 000’s) | $ 811 | | $ 685 | | $ 486 | | $ 158 |
| * | Unaudited. |
| ^ | Inception date. |
| ‡ | Less than one cent per share. |
| †† | Annualized. |
| (a) | Per share data based on average shares outstanding during the period. |
| (b) | Total investment return is calculated exclusive of sales charges and assumes the reinvestment of dividends and distributions. Class R3 shares are not subject to sales charges. For periods of less than one year, total return is not annualized. |
| (c) | In addition to the fees and expenses which the Fund bears directly, it also indirectly bears a pro-rata share of the fees and expenses of the underlying funds in which it invests. Such indirect expenses are not included in the above expense ratios. |
The notes to the financial statements are an integral part of, and should be read in conjunction with, the financial statements.
73
Financial Highlights selected per share data and ratios
| | Six months ended
October 31,
2023* | | Year Ended April 30, | | August 31, 2020^ through
April 30, |
| SIMPLE Class | 2023 | | 2022 | | 2021 |
| Net asset value at beginning of period | $ 11.88 | | $ 11.91 | | $ 12.78 | | $ 10.86 |
| Net investment income (loss) (a) | 0.11 | | 0.18 | | 0.14 | | 0.07 |
| Net realized and unrealized gain (loss) | (0.46) | | (0.06) | | (0.89) | | 1.90 |
| Total from investment operations | (0.35) | | 0.12 | | (0.75) | | 1.97 |
| Less distributions: | | | | | | | |
| From net investment income | — | | (0.15) | | (0.11) | | (0.04) |
| From net realized gain on investments | — | | (0.00)‡ | | (0.01) | | (0.01) |
| Total distributions | — | | (0.15) | | (0.12) | | (0.05) |
| Net asset value at end of period | $ 11.53 | | $ 11.88 | | $ 11.91 | | $ 12.78 |
| Total investment return (b) | (2.95)% | | 1.06% | | (5.92)% | | 18.11% |
| Ratios (to average net assets)/Supplemental Data: | | | | | | | |
| Net investment income (loss) | 1.75%†† | | 1.57% | | 1.11% | | 0.71%†† |
| Net expenses (c) | 1.00%†† | | 1.05% | | 1.05% | | 1.05%†† |
| Expenses (before waiver/reimbursement) (c) | 1.00%†† | | 1.10% | | 1.14% | | 1.62%†† |
| Portfolio turnover rate | 15% | | 57% | | 54% | | 47% |
| Net assets at end of period (in 000’s) | $ 12,116 | | $ 9,447 | | $ 3,838 | | $ 962 |
| * | Unaudited. |
| ^ | Inception date. |
| ‡ | Less than one cent per share. |
| †† | Annualized. |
| (a) | Per share data based on average shares outstanding during the period. |
| (b) | Total investment return is calculated exclusive of sales charges and assumes the reinvestment of dividends and distributions. SIMPLE Class shares are not subject to sales charges. For periods of less than one year, total return is not annualized. |
| (c) | In addition to the fees and expenses which the Fund bears directly, it also indirectly bears a pro-rata share of the fees and expenses of the underlying funds in which it invests. Such indirect expenses are not included in the above expense ratios. |
The notes to the financial statements are an integral part of, and should be read in conjunction with, the financial statements.
| 74 | MainStay Growth ETF Allocation Fund |
MainStay Equity ETF Allocation Fund
Investment and Performance Comparison (Unaudited)
Performance data quoted represents past performance. Past performance is no guarantee of future results. Because of market volatility and other factors, current performance may be lower or higher than the figures shown. Investment return and principal value will fluctuate, and as a result, when shares are redeemed, they may be worth more or less than their original cost. The graph below depicts the historical performance of Class I shares of the Fund. Performance will vary from class to class based on differences in class-specific expenses and sales charges. For performance information current to the most recent month-end, please call 800-624-6782 or visit newyorklifeinvestments.com.
The performance table and graph do not reflect the deduction of taxes that a shareholder would pay on distributions or Fund share redemptions. Total returns reflect maximum applicable sales charges as indicated in the table below, if any, changes in share price, and reinvestment of dividend and capital gain distributions. The graph assumes the initial investment amount shown below and reflects the deduction of all sales charges that would have applied for the period of investment. Performance figures may reflect certain fee waivers and/or expense limitations, without which total returns may have been lower. For more information on share classes and current fee waivers and/or expense limitations (if any), please refer to the Notes to Financial Statements.
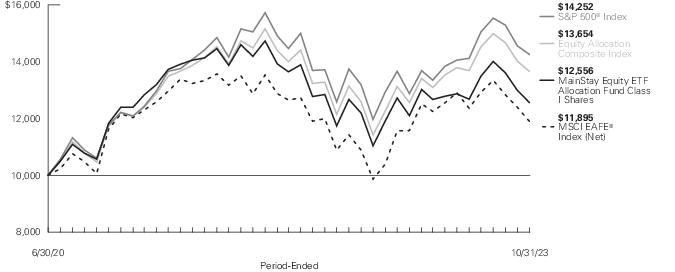
| Average Annual Total Returns for the Period-Ended October 31, 2023 |
| Class | Sales Charge | | Inception
Date | Six
Months1 | One
Year | Since
Inception | Gross
Expense
Ratio2 |
| Class A Shares | Maximum 3.00% Initial Sales Charge | With sales charges | 6/30/2020 | -5.49% | 1.93% | 5.83% | 0.99% |
| | | Excluding sales charges | | -2.56 | 5.09 | 6.80 | 0.99 |
| Class C Shares | Maximum 1.00% CDSC | With sales charges | 6/30/2020 | -3.95 | 3.31 | 5.99 | 1.79 |
| | if redeemed Within One Year of Purchase | Excluding sales charges | | -2.98 | 4.31 | 5.99 | 1.79 |
| Class I Shares | No Sales Charge | | 6/30/2020 | -2.42 | 5.39 | 7.06 | 0.74 |
| Class R3 Shares | No Sales Charge | | 6/30/2020 | -2.81 | 4.73 | 6.42 | 1.34 |
| SIMPLE Class Shares | No Sales Charge | | 8/31/2020 | -2.73 | 4.83 | 3.47 | 1.29 |
| 1. | Not annualized. |
| 2. | The gross expense ratios presented reflect the Fund’s “Total Annual Fund Operating Expenses” from the most recent Prospectus, as supplemented, and may differ from other expense ratios disclosed in this report. |
The footnotes on the next page are an integral part of the table and graph and should be carefully read in conjunction with them.
| Benchmark Performance* | Six
Months1 | One
Year | Since
Inception |
| S&P 500® Index2 | 1.39% | 10.14% | 11.21% |
| MSCI EAFE® Index (Net)3 | -7.88 | 14.40 | 5.34 |
| Equity Allocation Composite Index4 | -0.98 | 11.30 | 9.79 |
| Morningstar Aggressive Allocation Category Average5 | -2.85 | 4.49 | 5.94 |
| * | Returns for indices reflect no deductions for fees, expenses or taxes, except for foreign withholding taxes where applicable. Results assume reinvestment of all dividends and capital gains. An investment cannot be made directly in an index. |
| 1. | Not annualized. |
| 2. | The S&P 500® Index is the Fund’s primary broad-based securities market index for comparison purposes. S&P 500® is a trademark of The McGraw-Hill Companies, Inc. The S&P 500® Index is widely regarded as the standard index for measuring large-cap U.S. stock market performance. |
| 3. | The MSCI EAFE® Index (Net) is the Fund's secondary benchmark. The MSCI EAFE® Index (Net) consists of international stocks representing the developed world outside of North America. |
| 4. | The Fund has selected the Equity Allocation Composite Index as an additional benchmark. The Equity Allocation Composite Index consists of the S&P 500® Index and the MSCI EAFE® Index (Net) weighted 75% and 25%, respectively. |
| 5. | The Morningstar Aggressive Allocation Category Average is representative of funds in allocation categories that seek to provide both income and capital appreciation by primarily investing in multiple asset classes, including stocks, bonds, and cash. These aggressive strategies typically allocate at least 10% to equities of foreign companies and prioritize capital appreciation over preservation. They typically expect volatility similar to a strategic equity exposure of more than 85%. Results are based on average total returns of similar funds with all dividends and capital gain distributions reinvested. |
The footnotes on the preceding page are an integral part of the table and graph and should be carefully read in conjunction with them.
| 76 | MainStay Equity ETF Allocation Fund |
Cost in Dollars of a $1,000 Investment in MainStay Equity ETF Allocation Fund (Unaudited)
The example below is intended to describe the fees and expenses borne by shareholders during the six-month period from May 1, 2023 to October 31, 2023, and the impact of those costs on your investment.
Example
As a shareholder of the Fund you incur two types of costs: (1) transaction costs, including exchange fees and sales charges (loads) on purchases (as applicable), and (2) ongoing costs, including management fees, distribution and/or service (12b-1) fees and other Fund expenses (as applicable). This example is intended to help you understand your ongoing costs (in dollars) of investing in the Fund and to compare these costs with the ongoing costs of investing in other mutual funds. The example is based on an investment of $1,000 made at the beginning of the six-month period and held for the entire period from May 1, 2023 to October 31, 2023.
This example illustrates your Fund’s ongoing costs in two ways:
Actual Expenses
The second and third data columns in the table below provide information about actual account values and actual expenses. You may use the information in these columns, together with the amount you invested, to estimate the expenses that you paid during the six months ended October 31, 2023. Simply divide your account value by $1,000 (for example, an
$8,600 account value divided by $1,000 = 8.6), then multiply the result by the number under the heading entitled “Expenses Paid During Period” to estimate the expenses you paid on your account during this period.
Hypothetical Example for Comparison Purposes
The fourth and fifth data columns in the table below provide information about hypothetical account values and hypothetical expenses based on the Fund’s actual expense ratio and an assumed rate of return of 5% per year before expenses, which is not the Fund’s actual return. The hypothetical account values and expenses may not be used to estimate the actual ending account balances or expenses you paid for the six-month period shown. You may use this information to compare the ongoing costs of investing in the Fund with the ongoing costs of investing in other mutual funds. To do so, compare this 5% hypothetical example with the 5% hypothetical examples that appear in the shareholder reports of the other mutual funds.
Please note that the expenses shown in the table are meant to highlight your ongoing costs only and do not reflect any transactional costs, such as exchange fees or sales charges (loads). Therefore, the fourth and fifth data columns of the table are useful in comparing ongoing costs only and will not help you determine the relative total costs of owning different funds. In addition, if these transactional costs were included, your costs would have been higher.
| Share Class | Beginning
Account
Value
5/1/23 | Ending Account
Value (Based
on Actual
Returns and
Expenses)
10/31/23 | Expenses
Paid
During
Period1 | Ending Account
Value (Based
on Hypothetical
5% Annualized
Return and
Actual Expenses)
10/31/23 | Expenses
Paid
During
Period1 | Net Expense
Ratio
During
Period2 |
| Class A Shares | $1,000.00 | $974.40 | $3.87 | $1,021.22 | $3.96 | 0.78% |
| Class C Shares | $1,000.00 | $970.20 | $7.68 | $1,017.34 | $7.86 | 1.55% |
| Class I Shares | $1,000.00 | $975.80 | $2.63 | $1,022.47 | $2.69 | 0.53% |
| Class R3 Shares | $1,000.00 | $971.90 | $5.60 | $1,019.46 | $5.74 | 1.13% |
| SIMPLE Class Shares | $1,000.00 | $972.70 | $5.21 | $1,019.86 | $5.33 | 1.05% |
| 1. | Expenses are equal to the Fund’s annualized expense ratio of each class multiplied by the average account value over the period, divided by 366 and multiplied by 184 (to reflect the six-month period). The table above represents the actual expenses incurred during the six-month period. In addition to the fees and expenses which the Fund bears directly, it also indirectly bears a pro rata share of the fees and expenses of the underlying funds in which it invests. Such indirect expenses are not included in the above-reported expense figures. |
| 2. | Expenses are equal to the Fund's annualized expense ratio to reflect the six-month period. |
Asset Diversification as of October 31, 2023 (Unaudited)
| Equity Funds | 99.5 % |
| Short-Term Investments | 5.5 |
| Other Assets, Less Liabilities | (5.0) |
See Portfolio of Investments beginning on page 82 for specific holdings within these categories. The Fund’s holdings are subject to change.
| 78 | MainStay Equity ETF Allocation Fund |
Portfolio Management Discussion and Analysis (Unaudited)
Questions answered by portfolio managers Jae S. Yoon, CFA, Jonathan Swaney, Poul Kristensen, CFA, and Amit Soni, CFA, of New York Life Investment Management LLC, the Fund’s Manager.
How did MainStay Equity ETF Allocation Fund perform relative to its benchmarks and peer group during the six months ended October 31, 2023?
For the six months ended October 31, 2023, Class I shares of MainStay Equity ETF Allocation Fund returned −2.42%, underperforming the 1.39% return of the Fund’s primary benchmark, the S&P 500® Index, and outperforming the −7.88% return of the MSCI EAFE® Index (Net), which is the Fund’s secondary benchmark. Over the same period, Class I shares of the Fund underperformed the −0.98% return of the Equity Allocation Composite Index, which is an additional benchmark of the Fund, and outperformed the −2.85% return of the Morningstar Aggressive Allocation Category Average.1
What factors affected the Fund’s relative performance during the reporting period?
The Fund is a “fund of funds" that seeks to achieve its investment objective by investing in unaffiliated, passively managed, exchange-traded funds (“Underlying ETFs”). The Underlying ETFs may invest in U.S. equities, international equities and fixed-income instruments that span a range of capitalizations and geographies, making comparisons to any single index generally less suitable than a weighted combination of indices, which is a more useful yardstick by which to measure performance. During the reporting period, asset class policy was the primary determinant of the Fund’s relative performance.
Fund management internally maintains a blend of indices that are taken into consideration when managing the Fund. During the reporting period, the Fund moderately underperformed the internally maintained blend of indices, primarily due to asset class policy decisions.
At the start of the reporting period, the Fund held slightly underweight exposure to equities by way of a sizeable cash position. We established the underweight equity position in anticipation of a possible recession, induced by a combination of higher interest rates, reduced willingness on the part of banks to lend, and the fall in money supply accompanying the quantitative tightening program undertaken by the U.S. Federal Reserve (the “Fed”). However, equities rallied sharply from May through July 2023, detracting from the Fund’s relative performance. We gradually reduced the Fund’s underweight exposure to equities over the summer and then eliminated the position altogether, lessening the benefit that came with the market’s retreat from August through October.
Relative performance lost substantially more ground as a result of the Fund’s underweight exposure to certain mega-cap technology-related companies. The companies, tagged “the Magnificent 7,” included Alphabet, Amazon.com, Apple, Meta Platforms, Microsoft, NVIDIA and Tesla. All were richly valued, implying rapid earnings growth ahead. We were skeptical that the companies, already among the largest firms in the world with dominant positions in their respective industries, could meet these high growth expectations. Accordingly, we shifted the Fund out of capitalization-weighted large-cap index products, favoring other options—most notably an equally weighted version of the S&P 500® Index. However, ongoing enthusiasm for the potential of artificial intelligence (“AI”) to bolster the Magnificent 7’s business prospects supported rising stock prices. From May through October 2023, the Bloomberg Magnificent 7 Total Return Index2 returned 21%, compared to a loss of 5% for the S&P 500® Equal Weight Index.3
Other positions detracting from relative performance included a number of defensive holdings adopted in anticipation of an economic contraction and more challenging conditions in capital markets. These included exposure to low volatility stocks and traditionally defensive sectors, such as health care.
Some positions made positive contributions to relative performance. (Contributions take weightings and total returns into account.) A tilt into energy stocks benefited from a rise in the price of oil—presumably a result of Saudi production cuts along with rising geopolitical tensions at least partly tied to the Palestinian-Israeli conflict. Other positives included a decisive preference for Japan over Europe within the developed international space and exposure to uranium miners.
How did you allocate the Fund’s assets during the reporting period and why?
Equity sensitivity: As mentioned above, in anticipation of a recession that would drive down stock prices through both reduced corporate earnings and lower valuation multiples, the Fund maintained a sizeable cash position and held modestly underweight exposure to equities for much of the reporting period. We gradually reduced that underweight equity position as the reporting period wore on and the expected economic contraction failed to materialize. As of the end of the reporting period, the Fund held slightly greater total equity exposure than the Equity Allocation Composite Index.
| 1. | See "Investment and Performance Comparison" for other share class returns, which may be higher or lower than Class I share returns, and for more information on benchmark and peer group returns. |
| 2. | The Bloomberg Magnificent 7 Total Return Index is an equal-dollar weighted equity benchmark consisting of a fixed basket of 7 widely-traded companies classified in the United States and representing the Communications, Consumer Discretionary and Technology sectors as defined by Bloomberg Industry Classification System (BICS). An investment cannot be made directly in an index. |
| 3. | The S&P 500® Equal Weight Index (“EWI”) is the equal-weight version of the widely-used S&P 500® Index. The S&P 500® EWI includes the same constituents as the capitalization weighted S&P 500® Index, but each company in the S&P 500® EWI is allocated a fixed weight, or 0.2% of the Index total at each quarterly rebalance. An investment cannot be made directly in an index. |
Equity style: Whereas we shifted to a neutral posture in terms of the stock/bond blend during the reporting period, we maintained a conservative stance in terms of the Fund’s equity style in order to protect against the potential onset of a recession. Specifically, the Fund favored value over growth, with a particular emphasis on defensive sectors (health care and utilities) and characteristics (low volatility).
Equity size: Being skeptical of the ability of mega-cap market leaders to consistently deliver the high rates of earnings growth required to justify their relative valuations, we steered the Fund away from these names to a degree. In particular, we increased exposure to the S&P 500® EWI in which market cap does not affect the weight of each constituent. Whereas the Magnificent 7 represented approximately 30% of the S&P 500® Index, they represented only 1.4% of the S&P 500® EWI. We further limited the impact of mega-cap market leaders on the Fund through exposure to the S&P Mid Cap 400® Index.4
Geographic exposure: In our view, European equities appeared vulnerable during the reporting period. Persistently high wage growth seemed likely to compel the European Central Bank to maintain restrictive monetary policy for the foreseeable future, while their export-heavy economies wrestled with declining global trade volumes, and energy price spikes remained a risk amid elevated geopolitical tensions. Conversely, the Bank of Japan remained engaged in accommodative policy, with Japanese exports boosted by a weak yen and shareholder governance increasingly prioritized by company management, largely in the form of share buybacks. With these trends in mind, we tilted the Fund away from European markets in favor of Japanese stocks, with net exposure to non-U.S. stocks held close to neutral.
Energy: The Fund maintained exposure to upstream energy producers and oilfield/gas field service providers as a commodity play to provide an additional inflation hedge. These holdings also positioned the Fund to take advantage of opportunities for domestic producers to benefit as Western nations revisit energy policy to source supplies from stable and friendly jurisdictions rather than autocratic petrostates that present national security risks. While the Fund’s energy position was small, it had a disproportionately positive impact on performance.
How did the Fund’s allocations change over the course of the reporting period?
The single largest change to the Fund’s allocations involved an increased allocation to Invesco S&P 500® Equal Weight ETF. This was funded largely from cash, as we sought to remove the Fund’s underweight equity position without significantly increasing
exposure to the Magnificent 7. All other adjustments proved comparatively modest. They included the closure of positions in SPDR® S&P® Oil & Gas Exploration ETF and VanEck Oil Services ETF (the latter of which was later restored), reductions in holdings of Schwab U.S. Small-Cap ETF and an allocation to Utilities Select Sector SPDR® Fund.
The Fund also opened a small position in Global X Uranium ETF, which invests primarily in uranium mining firms. Climate change concerns and the limitations of renewable energy are driving a reconsideration of nuclear energy sources, for which fuel supply is somewhat limited. We foresee a supply/demand imbalance developing that is likely to support businesses involved with extracting and processing uranium.
During the reporting period, which Underlying Equity ETFs had the highest total returns and which Underlying Equity ETFs had the lowest total returns?
Of those Underlying Equity ETFs held for the entire reporting period, only iShares® MSCI Japan ETF generated a positive return. The smallest losses came from iShares® Core S&P Mid-Cap ETF and Schwab U.S. Mid-Cap ETF.
Underlying Equity ETFs held for the entire reporting period that saw the largest declines included iShares® Core MSCI EAFE ETF, Invesco S&P 500® Low Volatility ETF and Health Care Select Sector SPDR® Fund.
Which Underlying Equity ETFs were the strongest positive contributors to the Fund’s performance and which Underlying Equity ETFs were particularly weak?
Contribution to return is a function not only of Underlying ETF performance and average allocation, but also the variation in that allocation across time. The Underlying Equity ETFs making the largest positive contributions to return included Vanguard Mega Cap ETF, VanEck Oil Services ETF and SPDR® S&P® Oil & Gas Exploration & Production ETF. The most significant detractors included iShares® Core MSCI EAFE ETF, Vanguard Mid-Cap ETF and Schwab U.S. Small-Cap ETF.
How was the Fund positioned at the end of the reporting period?
For some time now, we have held the view that a recession in response to dramatic monetary policy tightening and the expiration of pandemic era support programs is all but inevitable. That remains the case today, and indications of the onset of this recession are beginning to accumulate. We firmly expect corporate profits will decline over the next several quarters,
| 4. | The S&P Mid Cap 400® Index measures the performance of the mid-cap segment of the U.S. market. The Index is composed of 400 constituent companies. An investment cannot be made directly in an index. |
| 80 | MainStay Equity ETF Allocation Fund |
eventually taking stock prices down with them, while also driving down Treasury yields and pushing credit spreads5 out. Accordingly, the Fund maintains a relatively defensive posture, with a tilt toward sectors that have generally exhibited lower volatility and retained their value better during drawdowns. Prominent among these are utilities and healthcare. Shying away from high-flying mega-cap technology-related stocks might also be perceived as a conservative stance.
| 5. | The terms “spread” and “yield spread” may refer to the difference in yield between a security or type of security and comparable U.S. Treasury issues. The terms may also refer to the difference in yield between two specific securities or types of securities at a given time. The term “credit spread” typically refers to the difference in yield between corporate or municipal bonds (or a specific category of these bonds) and comparable U.S. Treasury issues. |
None of Schwab Strategic Trust, Schwab® U.S. Small Cap ETF, Schwab U.S. Mid-Cap ETF, or Charles Schwab Investment Management, Inc. make any representations regarding the advisability of investing in MainStay Equity ETF Allocation Fund.
iShares® is a registered trademark of BlackRock (BlackRock, Inc. and its subsidiaries). Neither BlackRock nor the iShares® Funds make any representations regarding the advisability of investing in MainStay Equity ETF Allocation Fund.
The opinions expressed are those of the portfolio managers as of the date of this report and are subject to change. There is no guarantee that any forecasts will come to pass. This material does not constitute investment advice and is not intended as an endorsement of any specific investment.
Portfolio of Investments October 31, 2023†^(Unaudited)
| | Shares | | Value |
| Investment Companies 99.5% |
| Equity Funds 99.5% |
| Global X Uranium ETF | 24,816 | | $ 666,061 |
| Health Care Select Sector SPDR Fund | 4,965 | | 618,341 |
| Invesco S&P 500 Equal Weight ETF (a) | 20,674 | | 2,808,149 |
| Invesco S&P 500 Low Volatility ETF (a) | 10,994 | | 641,830 |
| iShares Core MSCI EAFE ETF | 167,687 | | 10,456,961 |
| iShares Core MSCI Emerging Markets ETF | 61,856 | | 2,841,665 |
| iShares Core S&P Mid-Cap ETF | 9,886 | | 2,333,096 |
| iShares Core S&P Small-Cap ETF | 45,204 | | 4,018,184 |
| iShares MSCI Japan ETF | 32,789 | | 1,933,240 |
| Materials Select Sector SPDR Fund | 8,238 | | 626,582 |
| Schwab U.S. Mid-Cap ETF | 28,261 | | 1,809,269 |
| Schwab U.S. Small-Cap ETF | 139,924 | | 5,423,454 |
| Utilities Select Sector SPDR Fund | 11,093 | | 662,141 |
| Vanguard Mega Cap ETF | 138,253 | | 20,635,643 |
| Vanguard Mega Cap Value ETF | 9,613 | | 952,264 |
| Vanguard Mid-Cap ETF | 33,144 | | 6,576,101 |
Total Investment Companies
(Cost $63,029,639) | | | 63,002,981 |
| Short-Term Investments 5.5% |
| Affiliated Investment Company 0.5% |
| MainStay U.S. Government Liquidity Fund, 5.275% (b) | 309,266 | | 309,266 |
| Unaffiliated Investment Companies 5.0% |
| Goldman Sachs Financial Square Government Fund, 5.356% (b)(c) | 500,000 | | 500,000 |
| Invesco Government & Agency Portfolio, 5.357% (b)(c) | 2,675,423 | | 2,675,423 |
| | | | 3,175,423 |
Total Short-Term Investments
(Cost $3,484,689) | | | 3,484,689 |
Total Investments
(Cost $66,514,328) | 105.0% | | 66,487,670 |
| Other Assets, Less Liabilities | (5.0) | | (3,157,130) |
| Net Assets | 100.0% | | $ 63,330,540 |
| † | Percentages indicated are based on Fund net assets. |
| ^ | Industry classifications may be different than those used for compliance monitoring purposes. |
| (a) | All or a portion of this security was held on loan. As of October 31, 2023, the aggregate market value of securities on loan was $3,110,023. The Fund received cash collateral with a value of $3,175,423. (See Note 2(G)) |
| (b) | Current yield as of October 31, 2023. |
| (c) | Represents a security purchased with cash collateral received for securities on loan. |
The notes to the financial statements are an integral part of, and should be read in conjunction with, the financial statements.
| 82 | MainStay Equity ETF Allocation Fund |
Investments in Affiliates (in 000's)
Investments in issuers considered to be affiliate(s) of the Fund during the six-month period ended October 31, 2023 for purposes of Section 2(a)(3) of the Investment Company Act of 1940, as amended, were as follows:
| Affiliated Investment Companies | Value,
Beginning
of Period | Purchases
at Cost | Proceeds
from
Sales | Net
Realized
Gain/(Loss)
on Sales | Change in
Unrealized
Appreciation/
(Depreciation) | Value,
End of
Period | Dividend
Income | Other
Distributions | Shares
End of
Period |
| MainStay U.S. Government Liquidity Fund | $ 1,199 | $ 4,828 | $ (5,718) | $ — | $ — | $ 309 | $ 21 | $ — | 309 |
| Abbreviation(s): |
| EAFE—Europe, Australasia and Far East |
| ETF—Exchange-Traded Fund |
| MSCI—Morgan Stanley Capital International |
| SPDR—Standard & Poor’s Depositary Receipt |
The following is a summary of the fair valuations according to the inputs used as of October 31, 2023, for valuing the Fund’s assets:
| Description | Quoted
Prices in
Active
Markets for
Identical
Assets
(Level 1) | | Significant
Other
Observable
Inputs
(Level 2) | | Significant
Unobservable
Inputs
(Level 3) | | Total |
| Asset Valuation Inputs | | | | | | | |
| Investments in Securities (a) | | | | | | | |
| Investment Companies | | | | | | | |
| Equity Funds | $ 63,002,981 | | $ — | | $ — | | $ 63,002,981 |
| Short-Term Investments | | | | | | | |
| Affiliated Investment Company | 309,266 | | — | | — | | 309,266 |
| Unaffiliated Investment Companies | 3,175,423 | | — | | — | | 3,175,423 |
| Total Short-Term Investments | 3,484,689 | | — | | — | | 3,484,689 |
| Total Investments in Securities | $ 66,487,670 | | $ — | | $ — | | $ 66,487,670 |
| (a) | For a complete listing of investments, see the Portfolio of Investments. |
The notes to the financial statements are an integral part of, and should be read in conjunction with, the financial statements.
83
Statement of Assets and Liabilities as of October 31, 2023 (Unaudited)
| Assets |
Investment in unaffiliated securities, at value
(identified cost $66,205,062) including securities on loan of $3,110,023 | $66,178,404 |
Investment in affiliated investment companies, at value
(identified cost $309,266) | 309,266 |
| Receivables: | |
| Fund shares sold | 173,408 |
| Securities lending | 4,966 |
| Dividends | 1,274 |
| Other assets | 48,698 |
| Total assets | 66,716,016 |
| Liabilities |
| Cash collateral received for securities on loan | 3,175,423 |
| Payables: | |
| Investment securities purchased | 106,151 |
| Fund shares redeemed | 43,344 |
| NYLIFE Distributors (See Note 3) | 15,581 |
| Professional fees | 15,299 |
| Transfer agent (See Note 3) | 12,660 |
| Manager (See Note 3) | 10,669 |
| Custodian | 5,427 |
| Shareholder communication | 922 |
| Total liabilities | 3,385,476 |
| Net assets | $63,330,540 |
| Composition of Net Assets |
| Shares of beneficial interest outstanding (par value of $.001 per share) unlimited number of shares authorized | $ 5,213 |
| Additional paid-in-capital | 66,161,816 |
| | 66,167,029 |
| Total distributable earnings (loss) | (2,836,489) |
| Net assets | $63,330,540 |
| Class A | |
| Net assets applicable to outstanding shares | $53,725,218 |
| Shares of beneficial interest outstanding | 4,419,605 |
| Net asset value per share outstanding | $ 12.16 |
| Maximum sales charge (3.00% of offering price) | 0.38 |
| Maximum offering price per share outstanding | $ 12.54 |
| Class C | |
| Net assets applicable to outstanding shares | $ 153,926 |
| Shares of beneficial interest outstanding | 12,786 |
| Net asset value and offering price per share outstanding | $ 12.04 |
| Class I | |
| Net assets applicable to outstanding shares | $ 110,668 |
| Shares of beneficial interest outstanding | 9,148 |
| Net asset value and offering price per share outstanding | $ 12.10 |
| Class R3 | |
| Net assets applicable to outstanding shares | $ 424,548 |
| Shares of beneficial interest outstanding | 35,077 |
| Net asset value and offering price per share outstanding | $ 12.10 |
| SIMPLE Class | |
| Net assets applicable to outstanding shares | $ 8,916,180 |
| Shares of beneficial interest outstanding | 736,310 |
| Net asset value and offering price per share outstanding | $ 12.11 |
The notes to the financial statements are an integral part of, and should be read in conjunction with, the financial statements.
| 84 | MainStay Equity ETF Allocation Fund |
Statement of Operations for the six months ended October 31, 2023 (Unaudited)
| Investment Income (Loss) |
| Income | |
| Dividends-unaffiliated | $ 593,478 |
| Securities lending, net | 30,947 |
| Dividends-affiliated | 21,430 |
| Total income | 645,855 |
| Expenses | |
| Manager (See Note 3) | 63,162 |
| Distribution/Service—Class A (See Note 3) | 67,702 |
| Distribution/Service—Class C (See Note 3) | 827 |
| Distribution/Service—Class R3 (See Note 3) | 945 |
| Distribution/Service—SIMPLE Class (See Note 3) | 20,850 |
| Transfer agent (See Note 3) | 38,035 |
| Registration | 35,516 |
| Professional fees | 19,013 |
| Custodian | 8,567 |
| Trustees | 817 |
| Shareholder communication | 688 |
| Shareholder service (See Note 3) | 189 |
| Miscellaneous | 2,931 |
| Total expenses before waiver/reimbursement | 259,242 |
| Expense waiver/reimbursement from Manager (See Note 3) | (305) |
| Net expenses | 258,937 |
| Net investment income (loss) | 386,918 |
| Realized and Unrealized Gain (Loss) |
| Net realized gain (loss) on unaffiliated investments | (335,170) |
| Net change in unrealized appreciation (depreciation) on unaffiliated investments | (1,970,636) |
| Net realized and unrealized gain (loss) | (2,305,806) |
| Net increase (decrease) in net assets resulting from operations | $(1,918,888) |
The notes to the financial statements are an integral part of, and should be read in conjunction with, the financial statements.
85
Statements of Changes in Net Assets
for the six months ended October 31, 2023 (Unaudited) and the year ended April 30, 2023
| | Six months
ended
October 31,
2023 | Year
ended
April 30,
2023 |
| Increase (Decrease) in Net Assets |
| Operations: | | |
| Net investment income (loss) | $ 386,918 | $ 501,773 |
| Net realized gain (loss) | (335,170) | (2,533,214) |
| Net change in unrealized appreciation (depreciation) | (1,970,636) | 2,796,287 |
| Net increase (decrease) in net assets resulting from operations | (1,918,888) | 764,846 |
| Distributions to shareholders: | | |
| Class A | — | (428,787) |
| Class C | — | (386) |
| Class I | — | (1,373) |
| Class R3 | — | (3,242) |
| SIMPLE Class | — | (41,309) |
| Total distributions to shareholders | — | (475,097) |
| Capital share transactions: | | |
| Net proceeds from sales of shares | 12,655,957 | 21,075,269 |
| Net asset value of shares issued to shareholders in reinvestment of distributions | — | 470,614 |
| Cost of shares redeemed | (4,195,610) | (6,921,340) |
| Increase (decrease) in net assets derived from capital share transactions | 8,460,347 | 14,624,543 |
| Net increase (decrease) in net assets | 6,541,459 | 14,914,292 |
| Net Assets |
| Beginning of period | 56,789,081 | 41,874,789 |
| End of period | $63,330,540 | $56,789,081 |
The notes to the financial statements are an integral part of, and should be read in conjunction with, the financial statements.
| 86 | MainStay Equity ETF Allocation Fund |
Financial Highlights selected per share data and ratios
| | Six months ended
October 31,
2023* | | Year Ended April 30, | | June 30, 2020^ through
April 30, |
| Class A | 2023 | | 2022 | | 2021 |
| Net asset value at beginning of period | $ 12.48 | | $ 12.54 | | $ 13.64 | | $ 10.00 |
| Net investment income (loss) (a) | 0.08 | | 0.13 | | 0.15 | | 0.07 |
| Net realized and unrealized gain (loss) | (0.40) | | (0.07) | | (1.10) | | 3.62 |
| Total from investment operations | (0.32) | | 0.06 | | (0.95) | | 3.69 |
| Less distributions: | | | | | | | |
| From net investment income | — | | (0.12) | | (0.14) | | (0.04) |
| From net realized gain on investments | — | | (0.00)‡ | | (0.01) | | (0.01) |
| Total distributions | — | | (0.12) | | (0.15) | | (0.05) |
| Net asset value at end of period | $ 12.16 | | $ 12.48 | | $ 12.54 | | $ 13.64 |
| Total investment return (b) | (2.56)% | | 0.54% | | (7.21)% | | 37.04% |
| Ratios (to average net assets)/Supplemental Data: | | | | | | | |
| Net investment income (loss) | 1.27%†† | | 1.10% | | 1.08% | | 0.63%†† |
| Net expenses (c) | 0.78%†† | | 0.80% | | 0.80% | | 0.80%†† |
| Expenses (before waiver/reimbursement) (c) | 0.78%†† | | 0.92% | | 0.92% | | 1.90%†† |
| Portfolio turnover rate | 13% | | 35% | | 43% | | 24% |
| Net assets at end of period (in 000’s) | $ 53,725 | | $ 48,992 | | $ 38,162 | | $ 20,221 |
| * | Unaudited. |
| ^ | Inception date. |
| ‡ | Less than one cent per share. |
| †† | Annualized. |
| (a) | Per share data based on average shares outstanding during the period. |
| (b) | Total investment return is calculated exclusive of sales charges and assumes the reinvestment of dividends and distributions. For periods of less than one year, total return is not annualized. |
| (c) | In addition to the fees and expenses which the Fund bears directly, it also indirectly bears a pro-rata share of the fees and expenses of the underlying funds in which it invests. Such indirect expenses are not included in the above expense ratios. |
The notes to the financial statements are an integral part of, and should be read in conjunction with, the financial statements.
87
Financial Highlights selected per share data and ratios
| | Six months ended
October 31,
2023* | | Year Ended April 30, | | June 30, 2020^ through
April 30, |
| Class C | 2023 | | 2022 | | 2021 |
| Net asset value at beginning of period | $ 12.41 | | $ 12.46 | | $ 13.57 | | $ 10.00 |
| Net investment income (loss) (a) | 0.04 | | 0.05 | | 0.05 | | (0.02) |
| Net realized and unrealized gain (loss) | (0.41) | | (0.07) | | (1.11) | | 3.63 |
| Total from investment operations | (0.37) | | (0.02) | | (1.06) | | 3.61 |
| Less distributions: | | | | | | | |
| From net investment income | — | | (0.03) | | (0.04) | | (0.03) |
| From net realized gain on investments | — | | (0.00)‡ | | (0.01) | | (0.01) |
| Total distributions | — | | (0.03) | | (0.05) | | (0.04) |
| Net asset value at end of period | $ 12.04 | | $ 12.41 | | $ 12.46 | | $ 13.57 |
| Total investment return (b) | (2.98)% | | (0.16)% | | (7.92)% | | 36.13% |
| Ratios (to average net assets)/Supplemental Data: | | | | | | | |
| Net investment income (loss) | 0.60%†† | | 0.39% | | 0.38% | | (0.20)%†† |
| Net expenses (c) | 1.55%†† | | 1.55% | | 1.55% | | 1.55%†† |
| Expenses (before waiver/reimbursement) (c) | 1.56%†† | | 1.72% | | 1.75% | | 2.61%†† |
| Portfolio turnover rate | 13% | | 35% | | 43% | | 24% |
| Net assets at end of period (in 000’s) | $ 154 | | $ 172 | | $ 177 | | $ 175 |
| * | Unaudited. |
| ^ | Inception date. |
| ‡ | Less than one cent per share. |
| †† | Annualized. |
| (a) | Per share data based on average shares outstanding during the period. |
| (b) | Total investment return is calculated exclusive of sales charges and assumes the reinvestment of dividends and distributions. For periods of less than one year, total return is not annualized. |
| (c) | In addition to the fees and expenses which the Fund bears directly, it also indirectly bears a pro-rata share of the fees and expenses of the underlying funds in which it invests. Such indirect expenses are not included in the above expense ratios. |
The notes to the financial statements are an integral part of, and should be read in conjunction with, the financial statements.
| 88 | MainStay Equity ETF Allocation Fund |
Financial Highlights selected per share data and ratios
| | Six months ended
October 31,
2023* | | Year Ended April 30, | | June 30, 2020^ through
April 30, |
| Class I | 2023 | | 2022 | | 2021 |
| Net asset value at beginning of period | $ 12.40 | | $ 12.47 | | $ 13.56 | | $ 10.00 |
| Net investment income (loss) (a) | 0.10 | | 0.17 | | 0.07 | | 0.08 |
| Net realized and unrealized gain (loss) | (0.40) | | (0.09) | | (0.98) | | 3.62 |
| Total from investment operations | (0.30) | | 0.08 | | (0.91) | | 3.70 |
| Less distributions: | | | | | | | |
| From net investment income | — | | (0.15) | | (0.17) | | (0.13) |
| From net realized gain on investments | — | | (0.00)‡ | | (0.01) | | (0.01) |
| Total distributions | — | | (0.15) | | (0.18) | | (0.14) |
| Net asset value at end of period | $ 12.10 | | $ 12.40 | | $ 12.47 | | $ 13.56 |
| Total investment return (b) | (2.42)% | | 0.73% | | (6.96)% | | 37.30% |
| Ratios (to average net assets)/Supplemental Data: | | | | | | | |
| Net investment income (loss) | 1.54%†† | | 1.42% | | 0.49% | | 0.80%†† |
| Net expenses (c) | 0.53%†† | | 0.55% | | 0.48% | | 0.55%†† |
| Expenses (before waiver/reimbursement) (c) | 0.53%†† | | 0.67% | | 0.60% | | 1.65%†† |
| Portfolio turnover rate | 13% | | 35% | | 43% | | 24% |
| Net assets at end of period (in 000’s) | $ 111 | | $ 113 | | $ 152 | | $ 2,684 |
| * | Unaudited. |
| ^ | Inception date. |
| ‡ | Less than one cent per share. |
| †† | Annualized. |
| (a) | Per share data based on average shares outstanding during the period. |
| (b) | Total investment return is calculated exclusive of sales charges and assumes the reinvestment of dividends and distributions. Class I shares are not subject to sales charges. For periods of less than one year, total return is not annualized. |
| (c) | In addition to the fees and expenses which the Fund bears directly, it also indirectly bears a pro-rata share of the fees and expenses of the underlying funds in which it invests. Such indirect expenses are not included in the above expense ratios. |
The notes to the financial statements are an integral part of, and should be read in conjunction with, the financial statements.
89
Financial Highlights selected per share data and ratios
| | Six months ended
October 31,
2023* | | Year Ended April 30, | | June 30, 2020^ through
April 30, |
| Class R3 | 2023 | | 2022 | | 2021 |
| Net asset value at beginning of period | $ 12.45 | | $ 12.51 | | $ 13.61 | | $ 10.00 |
| Net investment income (loss) (a) | 0.06 | | 0.09 | | 0.10 | | 0.04 |
| Net realized and unrealized gain (loss) | (0.41) | | (0.07) | | (1.10) | | 3.62 |
| Total from investment operations | (0.35) | | 0.02 | | (1.00) | | 3.66 |
| Less distributions: | | | | | | | |
| From net investment income | — | | (0.08) | | (0.09) | | (0.04) |
| From net realized gain on investments | — | | (0.00)‡ | | (0.01) | | (0.01) |
| Total distributions | — | | (0.08) | | (0.10) | | (0.05) |
| Net asset value at end of period | $ 12.10 | | $ 12.45 | | $ 12.51 | | $ 13.61 |
| Total investment return (b) | (2.81)% | | 0.18% | | (7.47)% | | 36.62% |
| Ratios (to average net assets)/Supplemental Data: | | | | | | | |
| Net investment income (loss) | 0.92%†† | | 0.78% | | 0.74% | | 0.39%†† |
| Net expenses (c) | 1.13%†† | | 1.15% | | 1.15% | | 1.15%†† |
| Expenses (before waiver/reimbursement) (c) | 1.13%†† | | 1.27% | | 1.27% | | 2.25%†† |
| Portfolio turnover rate | 13% | | 35% | | 43% | | 24% |
| Net assets at end of period (in 000’s) | $ 425 | | $ 334 | | $ 472 | | $ 445 |
| * | Unaudited. |
| ^ | Inception date. |
| ‡ | Less than one cent per share. |
| †† | Annualized. |
| (a) | Per share data based on average shares outstanding during the period. |
| (b) | Total investment return is calculated exclusive of sales charges and assumes the reinvestment of dividends and distributions. Class R3 shares are not subject to sales charges. For periods of less than one year, total return is not annualized. |
| (c) | In addition to the fees and expenses which the Fund bears directly, it also indirectly bears a pro-rata share of the fees and expenses of the underlying funds in which it invests. Such indirect expenses are not included in the above expense ratios. |
The notes to the financial statements are an integral part of, and should be read in conjunction with, the financial statements.
| 90 | MainStay Equity ETF Allocation Fund |
Financial Highlights selected per share data and ratios
| | Six months ended
October 31,
2023* | | Year Ended April 30, | | August 31, 2020^ through
April 30, |
| SIMPLE Class | 2023 | | 2022 | | 2021 |
| Net asset value at beginning of period | $ 12.45 | | $ 12.51 | | $ 13.61 | | $ 11.08 |
| Net investment income (loss) (a) | 0.06 | | 0.09 | | 0.11 | | 0.06 |
| Net realized and unrealized gain (loss) | (0.40) | | (0.06) | | (1.10) | | 2.52 |
| Total from investment operations | (0.34) | | 0.03 | | (0.99) | | 2.58 |
| Less distributions: | | | | | | | |
| From net investment income | — | | (0.09) | | (0.10) | | (0.04) |
| From net realized gain on investments | — | | (0.00)‡ | | (0.01) | | (0.01) |
| Total distributions | — | | (0.09) | | (0.11) | | (0.05) |
| Net asset value at end of period | $ 12.11 | | $ 12.45 | | $ 12.51 | | $ 13.61 |
| Total investment return (b) | (2.73)% | | 0.28% | | (7.38)% | | 23.32% |
| Ratios (to average net assets)/Supplemental Data: | | | | | | | |
| Net investment income (loss) | 0.97%†† | | 0.77% | | 0.78% | | 0.51%†† |
| Net expenses (c) | 1.05%†† | | 1.05% | | 1.05% | | 1.05%†† |
| Expenses (before waiver/reimbursement) (c) | 1.06%†† | | 1.22% | | 1.25% | | 2.11%†† |
| Portfolio turnover rate | 13% | | 35% | | 43% | | 24% |
| Net assets at end of period (in 000’s) | $ 8,916 | | $ 7,178 | | $ 2,911 | | $ 811 |
| * | Unaudited. |
| ^ | Inception date. |
| ‡ | Less than one cent per share. |
| †† | Annualized. |
| (a) | Per share data based on average shares outstanding during the period. |
| (b) | Total investment return is calculated exclusive of sales charges and assumes the reinvestment of dividends and distributions. SIMPLE Class shares are not subject to sales charges. For periods of less than one year, total return is not annualized. |
| (c) | In addition to the fees and expenses which the Fund bears directly, it also indirectly bears a pro-rata share of the fees and expenses of the underlying funds in which it invests. Such indirect expenses are not included in the above expense ratios. |
The notes to the financial statements are an integral part of, and should be read in conjunction with, the financial statements.
91
MainStay ESG Multi-Asset Allocation Fund
Investment and Performance Comparison (Unaudited)
Performance data quoted represents past performance. Past performance is no guarantee of future results. Because of market volatility and other factors, current performance may be lower or higher than the figures shown. Investment return and principal value will fluctuate, and as a result, when shares are redeemed, they may be worth more or less than their original cost. The graph below depicts the historical performance of Class I shares of the Fund. Performance will vary from class to class based on differences in class-specific expenses and sales charges. For performance information current to the most recent month-end, please call 800-624-6782 or visit newyorklifeinvestments.com.
The performance table and graph do not reflect the deduction of taxes that a shareholder would pay on distributions or Fund share redemptions. Total returns reflect maximum applicable sales charges as indicated in the table below, if any, changes in share price, and reinvestment of dividend and capital gain distributions. The graph assumes the initial investment amount shown below and reflects the deduction of all sales charges that would have applied for the period of investment. Performance figures may reflect certain fee waivers and/or expense limitations, without which total returns may have been lower. For more information on share classes and current fee waivers and/or expense limitations (if any), please refer to the Notes to Financial Statements.
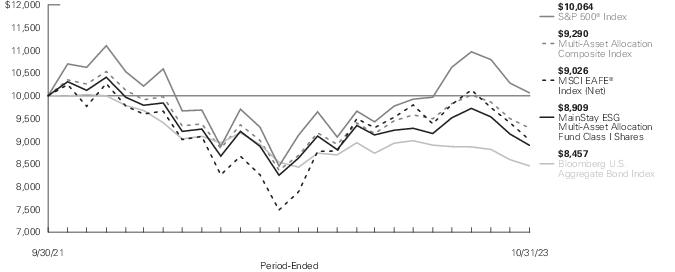
| Average Annual Total Returns for the Period-Ended October 31, 2023* |
| Class | Sales Charge | | Inception
Date | Six
Months1 | One
Year | Since
Inception | Gross
Expense
Ratio2 |
| Class A Shares | Maximum 3.00% Initial Sales Charge | With sales charges | 9/30/2021 | -7.04% | -0.04% | -6.96% | 2.00% |
| | | Excluding sales charges | | -4.16 | 3.05 | -5.59 | 2.00 |
| Class C Shares | Maximum 1.00% CDSC | With sales charges | 9/30/2021 | -5.46 | 1.27 | -6.29 | 2.88 |
| | if redeemed Within One Year of Purchase | Excluding sales charges | | -4.51 | 2.27 | -6.29 | 2.88 |
| Class I Shares | No Sales Charge | | 9/30/2021 | -4.05 | 3.21 | -5.39 | 1.77 |
| Class R3 Shares3 | No Sales Charge | | 9/30/2021 | -4.28 | 2.69 | -5.90 | 2.38 |
| SIMPLE Class Shares | No Sales Charge | | 9/30/2021 | -4.28 | 2.66 | -5.85 | 2.38 |
| * | The Fund will be liquidated on or about February 28, 2024 (the "Liquidation Date"). It is expected that the Fund will distribute to remaining shareholders, on or promptly after the Liquidation Date, a liquidating distribution in cash, cash equivalents, or portfolio securities equal to the shareholder’s proportionate interest in the net assets of the Fund. |
| 1. | Not annualized. |
| 2. | The gross expense ratios presented reflect the Fund’s “Total Annual Fund Operating Expenses” from the most recent Prospectus, as supplemented, and may differ from other expense ratios disclosed in this report. |
| 3. | As of October 31, 2023, Class R3 shares are closed to new investors and, upon the close of business on December 29, 2023, Class R3 shares are closed to additional investments by existing shareholders. |
The footnotes on the next page are an integral part of the table and graph and should be carefully read in conjunction with them.
| 92 | MainStay ESG Multi-Asset Allocation Fund |
| Benchmark Performance* | Six
Months1 | One
Year | Since
Inception |
| S&P 500® Index2 | 1.39% | 10.14% | 0.31% |
| MSCI EAFE® Index (Net)3 | -7.88 | 14.40 | -4.80 |
| Bloomberg U.S. Aggregate Bond Index4 | -6.13 | 0.36 | -7.72 |
| Multi-Asset Allocation Composite Index5 | -3.01 | 6.91 | -3.47 |
| Morningstar Moderate Allocation Category Average6 | -2.36 | 4.16 | -3.71 |
| * | Returns for indices reflect no deductions for fees, expenses or taxes, except for foreign withholding taxes where applicable. Results assume reinvestment of all dividends and capital gains. An investment cannot be made directly in an index. |
| 1. | Not annualized. |
| 2. | The S&P 500® Index is the Fund’s primary broad-based securities market index for comparison purposes. S&P 500® is a trademark of The McGraw-Hill Companies, Inc. The S&P 500® Index is widely regarded as the standard index for measuring large-cap U.S. stock market performance. |
| 3. | The MSCI EAFE® Index (Net) is the Fund's secondary benchmark. The MSCI EAFE® Index (Net) consists of international stocks representing the developed world outside of North America. |
| 4. | The Fund has selected the Bloomberg U.S. Aggregate Bond Index as an additional benchmark. The Bloomberg U.S. Aggregate Bond Index is a broad-based benchmark that measures the performance of the investment grade, U.S. dollar-denominated, fixed-rate taxable bond market, including Treasuries, government-related and corporate securities, mortgage-backed securities (agency fixed-rate and hybrid adjustable rate mortgage pass-throughs), asset-backed securities, and commercial mortgage-backed securities. |
| 5. | The Fund has selected the Multi-Asset Allocation Composite Index as an additional benchmark. The Multi-Asset Allocation Composite Index consists of the S&P 500® Index, the MSCI EAFE® Index (Net) and the Bloomberg U.S. Aggregate Bond Index weighted 45%, 15% and 40%, respectively. |
| 6. | The Morningstar Moderate Allocation Category Average is representative of funds in allocation categories that seek to provide both income and capital appreciation by primarily investing in multiple asset classes, including stocks, bonds, and cash. These moderate strategies seek to balance preservation of capital with appreciation. They typically expect volatility similar to a strategic equity exposure between 50% and 70%. Results are based on average total returns of similar funds with all dividends and capital gain distributions reinvested. |
The footnotes on the preceding page are an integral part of the table and graph and should be carefully read in conjunction with them.
Cost in Dollars of a $1,000 Investment in MainStay ESG Multi-Asset Allocation Fund (Unaudited)
The example below is intended to describe the fees and expenses borne by shareholders during the six-month period from May 1, 2023 to October 31, 2023, and the impact of those costs on your investment.
Example
As a shareholder of the Fund you incur two types of costs: (1) transaction costs, including exchange fees and sales charges (loads) on purchases (as applicable), and (2) ongoing costs, including management fees, distribution and/or service (12b-1) fees and other Fund expenses (as applicable). This example is intended to help you understand your ongoing costs (in dollars) of investing in the Fund and to compare these costs with the ongoing costs of investing in other mutual funds. The example is based on an investment of $1,000 made at the beginning of the six-month period and held for the entire period from May 1, 2023 to October 31, 2023.
This example illustrates your Fund’s ongoing costs in two ways:
Actual Expenses
The second and third data columns in the table below provide information about actual account values and actual expenses. You may use the information in these columns, together with the amount you invested, to estimate the expenses that you paid during the six months ended October 31, 2023. Simply divide your account value by $1,000 (for example, an
$8,600 account value divided by $1,000 = 8.6), then multiply the result by the number under the heading entitled “Expenses Paid During Period” to estimate the expenses you paid on your account during this period.
Hypothetical Example for Comparison Purposes
The fourth and fifth data columns in the table below provide information about hypothetical account values and hypothetical expenses based on the Fund’s actual expense ratio and an assumed rate of return of 5% per year before expenses, which is not the Fund’s actual return. The hypothetical account values and expenses may not be used to estimate the actual ending account balances or expenses you paid for the six-month period shown. You may use this information to compare the ongoing costs of investing in the Fund with the ongoing costs of investing in other mutual funds. To do so, compare this 5% hypothetical example with the 5% hypothetical examples that appear in the shareholder reports of the other mutual funds.
Please note that the expenses shown in the table are meant to highlight your ongoing costs only and do not reflect any transactional costs, such as exchange fees or sales charges (loads). Therefore, the fourth and fifth data columns of the table are useful in comparing ongoing costs only and will not help you determine the relative total costs of owning different funds. In addition, if these transactional costs were included, your costs would have been higher.
| Share Class | Beginning
Account
Value
5/1/23 | Ending Account
Value (Based
on Actual
Returns and
Expenses)
10/31/23 | Expenses
Paid
During
Period1 | Ending Account
Value (Based
on Hypothetical
5% Annualized
Return and
Actual Expenses)
10/31/23 | Expenses
Paid
During
Period1 | Net Expense
Ratio
During
Period2 |
| Class A Shares | $1,000.00 | $958.40 | $3.94 | $1,021.12 | $4.06 | 0.80% |
| Class C Shares | $1,000.00 | $954.90 | $7.62 | $1,017.34 | $7.86 | 1.55% |
| Class I Shares | $1,000.00 | $959.50 | $2.71 | $1,022.37 | $2.80 | 0.55% |
| Class R3 Shares | $1,000.00 | $957.20 | $5.66 | $1,019.36 | $5.84 | 1.15% |
| SIMPLE Class Shares | $1,000.00 | $957.20 | $5.17 | $1,019.86 | $5.33 | 1.05% |
| 1. | Expenses are equal to the Fund’s annualized expense ratio of each class multiplied by the average account value over the period, divided by 366 and multiplied by 184 (to reflect the six-month period). The table above represents the actual expenses incurred during the six-month period. In addition to the fees and expenses which the Fund bears directly, it also indirectly bears a pro rata share of the fees and expenses of the underlying funds in which it invests. Such indirect expenses are not included in the above-reported expense figures. |
| 2. | Expenses are equal to the Fund's annualized expense ratio to reflect the six-month period. |
| 94 | MainStay ESG Multi-Asset Allocation Fund |
Asset Diversification as of October 31, 2023 (Unaudited)
| Unaffiliated Investment Companies | 91.8 % |
| Affiliated Investment Companies | 7.5 |
| Short-Term Investments | 6.5 |
| Other Assets, Less Liabilities | (5.8) |
See Portfolio of Investments beginning on page 99 for specific holdings within these categories. The Fund’s holdings are subject to change.
Portfolio Management Discussion and Analysis (Unaudited)
Questions answered by portfolio managers Jae S. Yoon, CFA, Jonathan Swaney, Poul Kristensen, CFA, and Amit Soni, CFA, of New York Life Investment Management LLC, the Fund’s Manager.
How did MainStay ESG Multi-Asset Allocation Fund perform relative to its benchmarks and peer group during the six months ended October 31, 2023?
For the six months ended October 31, 2023, Class I shares of MainStay ESG Multi-Asset Allocation Fund returned −4.05%, underperforming the 1.39% return of the Fund’s primary benchmark, the S&P 500® Index, and outperforming the −7.88% return of the MSCI EAFE® Index (Net), which is the Fund’s secondary benchmark. Over the same period, Class I shares of the Fund outperformed the −6.13% return of the Bloomberg U.S. Aggregate Bond Index, and underperformed the −3.01% return of the Multi-Asset Allocation Composite Index, both of which are additional benchmarks of the Fund. For the six months ended October 31, 2023, Class I shares underperformed the −2.36% return of the Morningstar Moderate Allocation Category Average.1
What factors affected the Fund’s relative performance during the reporting period?
The Fund is a “fund of funds" that seeks to achieve its investment objective by investing in both affiliated and unaffiliated exchange-traded funds (“Underlying ETFs”) where the consideration of environmental, social and governance (“ESG”) factors is a significant part of the investment strategy and that meet the Fund’s overall investment criteria. The Underlying ETFs may invest in U.S. equities, international equities and fixed-income instruments, making comparisons to any single index generally less suitable than a weighted combination of indices, which is a more useful yardstick by which to measure performance. During the reporting period, asset class policy was the primary determinant of the Fund’s relative performance.
Fund management internally maintains a blend of indices that are taken into consideration when managing the Fund. During the reporting period, the Fund moderately underperformed the internally maintained blend of indices, primarily due to a combination of active positioning at the asset class level and headwinds facing ESG-oriented strategies broadly.
At the start of the reporting period, the Fund held slightly underweight exposure to equities in anticipation of a possible recession induced by a combination of higher interest rates, reduced willingness on the part of banks to lend, and the fall in money supply accompanying the quantitative tightening program undertaken by the U.S. Federal Reserve (the “Fed”). However, equities rallied sharply from May through July 2023, detracting
from the Fund’s relative performance. We gradually reduced the Fund’s underweight exposure to equities over the summer and then eliminated the position altogether, lessening the benefit that came with the market’s retreat from August through October.
Relative performance lost substantially more ground as a result of the Fund’s underweight exposure to certain mega-cap technology-related companies. The companies, tagged “the Magnificent 7,” included Alphabet, Amazon.com, Apple, Meta Platforms, Microsoft, NVIDIA and Tesla. All were richly valued, implying rapid earnings growth ahead. We were skeptical that the companies, already among the largest firms in the world with dominant positions in their respective industries, could meet these high growth expectations. Accordingly, we shifted the Fund out of capitalization-weighted large-cap index products, favoring other options—most notably the S&P 500® Equal Weight Index.2 However, ongoing enthusiasm for the potential of artificial intelligence (“AI”) to bolster the Magnificent 7’s business prospects supported rising stock prices. From May through October 2023, the Bloomberg Magnificent 7 Total Return Index3 returned 21%, compared to a loss of 5% for S&P 500® EWI.
Underweight exposure to bank loans, which generally carry speculative grade credit ratings, further detracted from relative performance. The Fund adopted this position in anticipation of an economic contraction and more challenging conditions in capital markets.
A comparison of the median performance of ESG funds within each asset class to a return representing that asset class indicates that the reporting period presented challenges for ESG strategies generally. The specific ESG funds in which the Fund invested outperformed the median of ESG funds within their category in many cases, lessening the blow to performance. This is not particularly surprising. Underlying ETFs are selected on the basis of ESG rating, cost and how closely they fit the broad market index of their respective asset class. That being so, we would expect underperformance/outperformance to be less extreme than the category median. Accordingly, in periods when ESG is performing well, the specific Underlying ETFs owned within the Fund are likely to perform well, but less well than the median of all ESG funds—and vice versa.
How did you allocate the Fund’s assets during the reporting period and why?
Stock/bond blend: As mentioned above, in anticipation of a recession that would drive down stock prices through both
| 1. | See "Investment and Performance Comparison" for other share class returns, which may be higher or lower than Class I share returns, and for more information on benchmark and peer group returns. |
| 2. | The S&P 500® Equal Weight Index (“EWI”) is the equal-weight version of the widely-used S&P 500® Index. The S&P 500® EWI includes the same constituents as the capitalization weighted S&P 500® Index, but each company in the S&P 500® EWI is allocated a fixed weight, or 0.2% of the Index total at each quarterly rebalance. An investment cannot be made directly in an index. |
| 3. | The Bloomberg Magnificent 7 Total Return Index is an equal-dollar weighted equity benchmark consisting of a fixed basket of 7 widely-traded companies classified in the United States and representing the Communications, Consumer Discretionary and Technology sectors as defined by Bloomberg Industry Classification System (BICS). An investment cannot be made directly in an index. |
| 96 | MainStay ESG Multi-Asset Allocation Fund |
reduced corporate earnings and lower valuation multiples, the Fund held modestly underweight exposure to equities for much of the reporting period. We gradually reduced that underweight position as the reporting period wore on and the expected economic contraction failed to materialize. As of the end of the reporting period, the Fund held slightly greater total equity exposure than the Multi-Asset Allocation Composite Index.
Equity style: Whereas we shifted to a neutral posture in terms of the stock/bond blend during the reporting period, we maintained a conservative stance in terms of the Fund’s equity style in order to protect against the potential onset of a recession. Specifically, the Fund favored value over growth.
Equity size: Being skeptical of the ability of mega-cap market leaders to consistently deliver the high rates of earnings growth required to justify their relative valuations, we steered the Fund away from these names to a degree. One strategy we adopted was to increase the Fund’s exposure to the S&P 500® EWI in which market cap does not affect the weight of each constituent. Whereas the Magnificent 7 represented approximately 30% of the S&P 500® Index, they represented only 1.4% of the S&P 500® EWI. We further limited the impact of mega-cap market leaders on the Fund through exposure to the S&P Mid Cap 400® Index.4
How did the Fund’s allocations change over the course of the reporting period?
The single largest change to the Fund’s allocations involved the introduction and subsequent growth of a position in iShares® ESG Aware U.S. Aggregate Bond ETF, which we used to extend the Fund’s duration5 as bond yields rose. The purchases were largely funded from cash. Another sizeable change that can be tied back to asset class policy involved an increased allocation to Invesco ESG S&P 500® Equal Weight ETF, as we sought to limit exposure to the Magnificent 7.
Most other reallocations occurred within an asset class and reflected the changing characteristics of the available funds as we sought to find an optimal balance between ESG rating, cost and benchmark tracking error. One example is the purchase of Xtrackers S&P 500 ESG ETF while selling SPDR® S&P 500® ESG
ETF. Another is the introduction of IQ Candriam U.S. Mid Cap Equity ETF while taking down positions in Nuveen ESG Mid-Cap Value ETF and Nuveen ESG Mid-Cap Growth ETF.
During the reporting period, which Underlying Equity ETFs had the highest total returns and which Underlying Equity ETFs had the lowest total returns?
Of those Underlying Equity ETFs held for the entire reporting period, only iShares® ESG Screened S&P 500 ETF generated a positive return. The smallest losses came from iShares® ESG Advanced MSCI EM ETF and iShares® ESG Aware MSCI EM ETF.
Underlying Equity ETFs held for the entire reporting period that saw the largest declines included Nuveen ESG Small-Cap ETF, iShares® ESG Aware MSCI EAFE ETF and IQ Candriam International Equity ETF.
Which Underlying Equity ETFs were the strongest positive contributors to the Fund’s performance and which Underlying Equity ETFs were particularly weak?
Contribution to return is a function not only of Underlying ETF performance and average allocation, but also the variation in that allocation across time. The Underlying Equity ETFs making the largest positive contributions to return included SPDR® S&P 500® ESG ETF, American Century Sustainable Equity ETF and IQ Candriam U.S. Large Cap Equity ETF. The most significant detractors included iShares® ESG Aware MSCI EAFE ETF, Xtrackers S&P 500 ESG ETF and IQ Candriam U.S. Mid Cap Equity ETF.
During the reporting period, which Underlying Fixed-Income ETFs had the highest total returns and which Underlying Fixed-Income ETFs had the lowest total returns?
The cash sweep account was the only Underlying Fixed-Income vehicle to generate a positive return. The smallest losses were observed in iShares® ESG Aware 1–5 Year USD Corporate Bond ETF and iShares® ESG Advanced High Yield ETF. The Underlying Fixed-Income ETFs posting the steepest losses included iShares® ESG Advanced Total USD Bond Market ETF, Vanguard ESG
| 4. | The S&P Mid Cap 400® Index measures the performance of the mid-cap segment of the U.S. market. The Index is composed of 400 constituent companies. An investment cannot be made directly in an index. |
| 5. | Duration is a measure of the price sensitivity of a fixed-income investment to changes in interest rates. Duration is expressed as a number of years and is considered a more accurate sensitivity gauge than average maturity. |
U.S. Corporate Bond ETF and Nuveen ESG High Yield Corporate Bond ETF.
Which Underlying Fixed-Income ETFs were the strongest positive contributors to the Fund’s performance and which Underlying Fixed-Income ETFs were particularly weak?
The Underlying Fixed-Income ETFs making the largest contributions to return included a cash sweep account, iShares® ESG Advanced High Yield ETF and iShares® ESG Aware 1–5 Year USD Corporate Bond ETF. The most significant detractors from absolute performance included iShares® ESG Advanced Total USD Bond Market ETF, Vanguard ESG U.S. Corporate Bond ETF and iShares® ESG Aware U.S. Aggregate Bond ETF.
How was the Fund positioned at the end of the reporting period?
For some time now, we have held the view that a recession in response to dramatic monetary policy tightening and the expiration of pandemic era support programs is all but inevitable. That remains the case today, and indications of the onset of this recession are beginning to accumulate. We firmly expect corporate profits will decline over the next several quarters, eventually taking stock prices down with them, while also driving down Treasury yields and pushing credit spreads6 out.
Having been reminded of just how difficult it is to call a market top, however, we are resistant to being underweight equities, so we have parked the Fund in neutral along this dimension for the time being, although we intend to exploit any significant pullbacks—should they arrive—by building an overweight position.
A modestly defensive posture can be seen in the Fund’s below-benchmark allocation to bank loans. Similarly, allocations to value strategies and an equally weighted strategy may be perceived as conservative in the sense that they steer the fund away from high-flying (and potentially vulnerable) mega-cap growth companies at the margin.
| 6. | The terms “spread” and “yield spread” may refer to the difference in yield between a security or type of security and comparable U.S. Treasury issues. The terms may also refer to the difference in yield between two specific securities or types of securities at a given time. The term “credit spread” typically refers to the difference in yield between corporate or municipal bonds (or a specific category of these bonds) and comparable U.S. Treasury issues. |
iShares® is a registered trademark of BlackRock (BlackRock, Inc. and its subsidiaries). Neither BlackRock nor the iShares® Funds make any representations regarding the advisability of investing in MainStay ESG Multi-Asset Allocation Fund.
The opinions expressed are those of the portfolio managers as of the date of this report and are subject to change. There is no guarantee that any forecasts will come to pass. This material does not constitute investment advice and is not intended as an endorsement of any specific investment.
| 98 | MainStay ESG Multi-Asset Allocation Fund |
Portfolio of Investments October 31, 2023†^(Unaudited)
| | Shares | | Value |
| Affiliated Investment Companies 7.5% |
| Equity Funds 7.5% |
| IQ Candriam International Equity ETF (a) | 12,532 | | $ 312,405 |
| IQ Candriam U.S. Mid Cap Equity ETF | 23,761 | | 593,792 |
Total Affiliated Investment Companies
(Cost $951,603) | | | 906,197 |
| Unaffiliated Investment Companies 91.8% |
| Equity Funds 53.1% |
| Invesco ESG S&P 500 Equal Weight ETF (a) | 25,629 | | 535,095 |
| iShares ESG Advanced MSCI EM ETF (a) | 1,447 | | 47,852 |
| iShares ESG Aware MSCI EAFE ETF | 18,531 | | 1,240,280 |
| iShares ESG Aware MSCI EM ETF | 6,519 | | 191,463 |
| iShares ESG Aware MSCI USA Small-Cap ETF | 14,842 | | 466,781 |
| iShares ESG Screened S&P 500 ETF (a) | 33,396 | | 1,059,989 |
| Nuveen ESG Large-Cap Value ETF (a) | 10,963 | | 357,284 |
| Nuveen ESG Mid-Cap Growth ETF | 10,649 | | 366,858 |
| Nuveen ESG Mid-Cap Value ETF (a) | 16,483 | | 442,404 |
| Nuveen ESG Small-Cap ETF (a) | 3,601 | | 116,672 |
| Xtrackers MSCI USA ESG Leaders Equity ETF | 2,305 | | 89,204 |
| Xtrackers S&P 500 ESG ETF (a) | 38,835 | | 1,493,206 |
Total Equity Funds
(Cost $6,703,491) | | | 6,407,088 |
| Fixed Income Funds 38.7% |
| iShares ESG Advanced High Yield Corporate Bond ETF (a) | 6,199 | | 263,165 |
| iShares ESG Advanced Total USD Bond Market ETF | 28,385 | | 1,143,064 |
| iShares ESG Aware 1-5 Year USD Corporate Bond ETF (a) | 7,060 | | 167,322 |
| iShares ESG Aware U.S. Aggregate Bond ETF (a) | 39,849 | | 1,772,085 |
| Nuveen ESG High Yield Corporate Bond ETF (a) | 27,908 | | 549,788 |
| Vanguard ESG U.S. Corporate Bond ETF (a) | 13,360 | | 777,953 |
Total Fixed Income Funds
(Cost $4,878,932) | | | 4,673,377 |
Total Unaffiliated Investment Companies
(Cost $11,582,423) | | | 11,080,465 |
| Short-Term Investments 6.5% |
| Affiliated Investment Company 0.4% |
| MainStay U.S. Government Liquidity Fund, 5.275% (b) | 54,729 | | 54,729 |
| Unaffiliated Investment Company 6.1% |
| Invesco Government & Agency Portfolio, 5.357% (b)(c) | 731,900 | | 731,900 |
Total Short-Term Investments
(Cost $786,629) | 6.5% | | 786,629 |
Total Investments
(Cost $13,320,655) | 105.8% | | 12,773,291 |
| Other Assets, Less Liabilities | (5.8) | | (701,616) |
| Net Assets | 100.0% | | $ 12,071,675 |
The notes to the financial statements are an integral part of, and should be read in conjunction with, the financial statements.
99
Portfolio of Investments October 31, 2023†^(Unaudited) (continued)
| † | Percentages indicated are based on Fund net assets. |
| ^ | Industry classifications may be different than those used for compliance monitoring purposes. |
| (a) | All or a portion of this security was held on loan. As of October 31, 2023, the aggregate market value of securities on loan was $735,606; the total market value of collateral held by the Fund was $754,292. The market value of the collateral held included non-cash collateral in the form of U.S. Treasury securities with a value of $22,392. The Fund received cash collateral with a value of $731,900. (See Note 2(G)) |
| (b) | Current yield as of October 31, 2023. |
| (c) | Represents a security purchased with cash collateral received for securities on loan. |
Investments in Affiliates (in 000's)
Investments in issuers considered to be affiliate(s) of the Fund during the six-month period ended October 31, 2023 for purposes of Section 2(a)(3) of the Investment Company Act of 1940, as amended, were as follows:
| Affiliated Investment Companies | Value,
Beginning
of Period | Purchases
at Cost | Proceeds
from
Sales | Net
Realized
Gain/(Loss)
on Sales | Change in
Unrealized
Appreciation/
(Depreciation) | Value,
End of
Period | Dividend
Income | Other
Distributions | Shares
End of
Period |
| IQ Candriam International Equity ETF (a) | $ 369 | $ 126 | $ (149) | $ (4) | $ (30) | $ 312 | $ 6 | $ — | 13 |
| IQ Candriam U.S. Large Cap Equity ETF (b) | 350 | 175 | (533) | 40 | (32) | — | 2 | — | — |
| IQ Candriam U.S. Mid Cap Equity ETF | — | 636 | — | — | (42) | 594 | — | — | 24 |
| MainStay U.S. Government Liquidity Fund | 1,099 | 1,048 | (2,092) | — | — | 55 | 6 | — | 55 |
| | $1,818 | $1,985 | $(2,774) | $ 36 | $ (104) | $ 961 | $ 14 | $ — | |
| | |
| (a) | Prior to August 31, 2023, known as IQ Candriam ESG International Equity ETF |
| (b) | Prior to August 31, 2023, known as IQ Candriam ESG U.S. Large Cap Equity ETF. |
| Abbreviation(s): |
| EAFE—Europe, Australasia and Far East |
| EM—Emerging Markets |
| ETF—Exchange-Traded Fund |
| MSCI—Morgan Stanley Capital International |
| USD—United States Dollar |
The notes to the financial statements are an integral part of, and should be read in conjunction with, the financial statements.
| 100 | MainStay ESG Multi-Asset Allocation Fund |
The following is a summary of the fair valuations according to the inputs used as of October 31, 2023, for valuing the Fund’s assets:
| Description | Quoted
Prices in
Active
Markets for
Identical
Assets
(Level 1) | | Significant
Other
Observable
Inputs
(Level 2) | | Significant
Unobservable
Inputs
(Level 3) | | Total |
| Asset Valuation Inputs | | | | | | | |
| Investments in Securities (a) | | | | | | | |
| Affiliated Investment Companies | | | | | | | |
| Equity Funds | $ 906,197 | | $ — | | $ — | | $ 906,197 |
| Unaffiliated Investment Companies | | | | | | | |
| Equity Funds | 6,407,088 | | — | | — | | 6,407,088 |
| Fixed Income Funds | 4,673,377 | | — | | — | | 4,673,377 |
| Total Unaffiliated Investment Companies | 11,080,465 | | — | | — | | 11,080,465 |
| Short-Term Investments | | | | | | | |
| Affiliated Investment Company | 54,729 | | — | | — | | 54,729 |
| Unaffiliated Investment Company | 731,900 | | — | | — | | 731,900 |
| Total Short-Term Investments | 786,629 | | — | | — | | 786,629 |
| Total Investments in Securities | $ 12,773,291 | | $ — | | $ — | | $ 12,773,291 |
| (a) | For a complete listing of investments, see the Portfolio of Investments. |
The notes to the financial statements are an integral part of, and should be read in conjunction with, the financial statements.
101
Statement of Assets and Liabilities as of October 31, 2023 (Unaudited)
| Assets |
Investment in unaffiliated securities, at value
(identified cost $12,314,323) including securities on loan of $735,606 | $11,812,365 |
Investment in affiliated investment companies, at value
(identified cost $1,006,332) | 960,926 |
| Receivables: | |
| Manager (See Note 3) | 6,056 |
| Securities lending | 5,663 |
| Fund shares sold | 1,414 |
| Dividends | 204 |
| Other assets | 55,651 |
| Total assets | 12,842,279 |
| Liabilities |
| Cash collateral received for securities on loan | 731,900 |
| Due to custodian | 108 |
| Payables: | |
| Professional fees | 15,534 |
| Transfer agent (See Note 3) | 12,077 |
| Custodian | 5,742 |
| Shareholder communication | 4,397 |
| NYLIFE Distributors (See Note 3) | 800 |
| Accrued expenses | 46 |
| Total liabilities | 770,604 |
| Net assets | $12,071,675 |
| Composition of Net Assets |
| Shares of beneficial interest outstanding (par value of $.001 per share) unlimited number of shares authorized | $ 1,415 |
| Additional paid-in-capital | 13,814,519 |
| | 13,815,934 |
| Total distributable earnings (loss) | (1,744,259) |
| Net assets | $12,071,675 |
| Class A | |
| Net assets applicable to outstanding shares | $2,771,664 |
| Shares of beneficial interest outstanding | 325,322 |
| Net asset value per share outstanding | $ 8.52 |
| Maximum sales charge (3.00% of offering price) | 0.26 |
| Maximum offering price per share outstanding | $ 8.78 |
| Class C | |
| Net assets applicable to outstanding shares | $ 21,826 |
| Shares of beneficial interest outstanding | 2,577 |
| Net asset value and offering price per share outstanding | $ 8.47 |
| Class I | |
| Net assets applicable to outstanding shares | $8,836,448 |
| Shares of beneficial interest outstanding | 1,035,317 |
| Net asset value and offering price per share outstanding | $ 8.54 |
| Class R3 | |
| Net assets applicable to outstanding shares | $ 61,559 |
| Shares of beneficial interest outstanding | 7,245 |
| Net asset value and offering price per share outstanding | $ 8.50 |
| SIMPLE Class | |
| Net assets applicable to outstanding shares | $ 380,178 |
| Shares of beneficial interest outstanding | 44,726 |
| Net asset value and offering price per share outstanding | $ 8.50 |
The notes to the financial statements are an integral part of, and should be read in conjunction with, the financial statements.
| 102 | MainStay ESG Multi-Asset Allocation Fund |
Statement of Operations for the six months ended October 31, 2023 (Unaudited)
| Investment Income (Loss) |
| Income | |
| Dividends-unaffiliated | $ 138,752 |
| Securities lending, net | 34,740 |
| Dividends-affiliated | 13,841 |
| Total income | 187,333 |
| Expenses | |
| Manager (See Note 3) | 12,608 |
| Registration | 40,319 |
| Professional fees | 17,428 |
| Custodian | 7,831 |
| Distribution/Service—Class A (See Note 3) | 3,584 |
| Distribution/Service—Class C (See Note 3) | 115 |
| Distribution/Service—Class R3 (See Note 3) | 163 |
| Distribution/Service—SIMPLE Class (See Note 3) | 849 |
| Transfer agent (See Note 3) | 427 |
| Trustees | 172 |
| Shareholder service (See Note 3) | 32 |
| Miscellaneous | 2,453 |
| Total expenses before waiver/reimbursement | 85,981 |
| Expense waiver/reimbursement from Manager (See Note 3) | (46,564) |
| Net expenses | 39,417 |
| Net investment income (loss) | 147,916 |
| Realized and Unrealized Gain (Loss) |
| Net realized gain (loss) on: | |
| Unaffiliated investments | (291,167) |
| Affiliated investments | 35,874 |
| Net realized gain (loss) | (255,293) |
| Net change in unrealized appreciation (depreciation) on: | |
| Unaffiliated investments | (310,110) |
| Affiliated investments | (103,749) |
| Net change in unrealized appreciation (depreciation) | (413,859) |
| Net realized and unrealized gain (loss) | (669,152) |
| Net increase (decrease) in net assets resulting from operations | $(521,236) |
The notes to the financial statements are an integral part of, and should be read in conjunction with, the financial statements.
103
Statements of Changes in Net Assets
for the six months ended October 31, 2023 (Unaudited) and the year ended April 30, 2023
| | Six months
ended
October 31,
2023 | Year
ended
April 30,
2023 |
| Increase (Decrease) in Net Assets |
| Operations: | | |
| Net investment income (loss) | $ 147,916 | $ 240,145 |
| Net realized gain (loss) | (255,293) | (872,100) |
| Net change in unrealized appreciation (depreciation) | (413,859) | 781,170 |
| Net increase (decrease) in net assets resulting from operations | (521,236) | 149,215 |
| Distributions to shareholders: | | |
| Class A | — | (33,195) |
| Class C | — | (152) |
| Class I | — | (151,197) |
| Class R3 | — | (423) |
| SIMPLE Class | — | (2,415) |
| Total distributions to shareholders | — | (187,382) |
| Capital share transactions: | | |
| Net proceeds from sales of shares | 475,836 | 1,918,429 |
| Net asset value of shares issued to shareholders in reinvestment of distributions | — | 187,382 |
| Cost of shares redeemed | (199,421) | (183,624) |
| Increase (decrease) in net assets derived from capital share transactions | 276,415 | 1,922,187 |
| Net increase (decrease) in net assets | (244,821) | 1,884,020 |
| Net Assets |
| Beginning of period | 12,316,496 | 10,432,476 |
| End of period | $12,071,675 | $12,316,496 |
The notes to the financial statements are an integral part of, and should be read in conjunction with, the financial statements.
| 104 | MainStay ESG Multi-Asset Allocation Fund |
Financial Highlights selected per share data and ratios
| | Six months ended
October 31,
2023* | | Year Ended April 30, | | September 30, 2021^ through
April 30, |
| Class A | 2023 | | 2022 |
| Net asset value at beginning of period | $ 8.89 | | $ 8.97 | | $ 10.00 |
| Net investment income (loss) (a) | 0.10 | | 0.18 | | 0.05 |
| Net realized and unrealized gain (loss) | (0.47) | | (0.13) | | (0.82) |
| Total from investment operations | (0.37) | | 0.05 | | (0.77) |
| Less distributions: | | | | | |
| From net investment income | — | | (0.13) | | (0.26) |
| From net realized gain on investments | — | | — | | (0.00)‡ |
| Net asset value at end of period | $ 8.52 | | $ 8.89 | | $ 8.97 |
| Total investment return (b) | (4.16)% | | 0.58% | | (7.99)% |
| Ratios (to average net assets)/Supplemental Data: | | | | | |
| Net investment income (loss) | 2.15%†† | | 2.06% | | 0.93%†† |
| Net expenses (c) | 0.80%†† | | 0.77% | | 0.80%†† |
| Expenses (before waiver/reimbursement) (c) | 1.53%†† | | 1.82% | | 2.40%†† |
| Portfolio turnover rate | 71% | | 142% | | 70% |
| Net assets at end of period (in 000’s) | $ 2,772 | | $ 2,747 | | $ 1,161 |
| * | Unaudited. |
| ^ | Inception date. |
| ‡ | Less than one cent per share. |
| †† | Annualized. |
| (a) | Per share data based on average shares outstanding during the period. |
| (b) | Total investment return is calculated exclusive of sales charges and assumes the reinvestment of dividends and distributions. For periods of less than one year, total return is not annualized. |
| (c) | In addition to the fees and expenses which the Fund bears directly, it also indirectly bears a pro-rata share of the fees and expenses of the underlying funds in which it invests. Such indirect expenses are not included in the above expense ratios. |
| | Six months ended
October 31,
2023* | | Year Ended April 30, | | September 30, 2021^ through
April 30, |
| Class C | 2023 | | 2022 |
| Net asset value at beginning of period | $ 8.87 | | $ 8.95 | | $ 10.00 |
| Net investment income (loss) (a) | 0.06 | | 0.10 | | 0.02 |
| Net realized and unrealized gain (loss) | (0.46) | | (0.12) | | (0.83) |
| Total from investment operations | (0.40) | | (0.02) | | (0.81) |
| Less distributions: | | | | | |
| From net investment income | — | | (0.06) | | (0.24) |
| From net realized gain on investments | — | | — | | (0.00)‡ |
| Net asset value at end of period | $ 8.47 | | $ 8.87 | | $ 8.95 |
| Total investment return (b) | (4.51)% | | (0.20)% | | (8.37)% |
| Ratios (to average net assets)/Supplemental Data: | | | | | |
| Net investment income (loss) | 1.43%†† | | 1.20% | | 0.36%†† |
| Net expenses (c) | 1.55%†† | | 1.55% | | 1.55%†† |
| Expenses (before waiver/reimbursement) (c) | 2.44%†† | | 2.70% | | 3.15%†† |
| Portfolio turnover rate | 71% | | 142% | | 70% |
| Net assets at end of period (in 000’s) | $ 22 | | $ 23 | | $ 23 |
| * | Unaudited. |
| ^ | Inception date. |
| ‡ | Less than one cent per share. |
| †† | Annualized. |
| (a) | Per share data based on average shares outstanding during the period. |
| (b) | Total investment return is calculated exclusive of sales charges and assumes the reinvestment of dividends and distributions. For periods of less than one year, total return is not annualized. |
| (c) | In addition to the fees and expenses which the Fund bears directly, it also indirectly bears a pro-rata share of the fees and expenses of the underlying funds in which it invests. Such indirect expenses are not included in the above expense ratios. |
The notes to the financial statements are an integral part of, and should be read in conjunction with, the financial statements.
105
Financial Highlights selected per share data and ratios
| | Six months ended
October 31,
2023* | | Year Ended April 30, | | September 30, 2021^ through
April 30, |
| Class I | 2023 | | 2022 |
| Net asset value at beginning of period | $ 8.90 | | $ 8.98 | | $ 10.00 |
| Net investment income (loss) (a) | 0.11 | | 0.19 | | 0.08 |
| Net realized and unrealized gain (loss) | (0.47) | | (0.12) | | (0.84) |
| Total from investment operations | (0.36) | | 0.07 | | (0.76) |
| Less distributions: | | | | | |
| From net investment income | — | | (0.15) | | (0.26) |
| From net realized gain on investments | — | | — | | (0.00)‡ |
| Net asset value at end of period | $ 8.54 | | $ 8.90 | | $ 8.98 |
| Total investment return (b) | (4.04)%(c) | | 0.73% | | (7.83)% |
| Ratios (to average net assets)/Supplemental Data: | | | | | |
| Net investment income (loss) | 2.43%†† | | 2.19% | | 1.36%†† |
| Net expenses (d) | 0.55%†† | | 0.55% | | 0.55%†† |
| Expenses (before waiver/reimbursement) (d) | 1.28%†† | | 1.59% | | 2.15%†† |
| Portfolio turnover rate | 71% | | 142% | | 70% |
| Net assets at end of period (in 000’s) | $ 8,836 | | $ 9,209 | | $ 9,135 |
| * | Unaudited. |
| ^ | Inception date. |
| ‡ | Less than one cent per share. |
| †† | Annualized. |
| (a) | Per share data based on average shares outstanding during the period. |
| (b) | Total investment return is calculated exclusive of sales charges and assumes the reinvestment of dividends and distributions. Class I shares are not subject to sales charges. For periods of less than one year, total return is not annualized. |
| (c) | Total investment return may reflect adjustments to conform to generally accepted accounting principles. |
| (d) | In addition to the fees and expenses which the Fund bears directly, it also indirectly bears a pro-rata share of the fees and expenses of the underlying funds in which it invests. Such indirect expenses are not included in the above expense ratios. |
The notes to the financial statements are an integral part of, and should be read in conjunction with, the financial statements.
| 106 | MainStay ESG Multi-Asset Allocation Fund |
Financial Highlights selected per share data and ratios
| | Six months ended
October 31,
2023* | | Year Ended April 30, | | September 30, 2021^ through
April 30, |
| Class R3 | 2023 | | 2022 |
| Net asset value at beginning of period | $ 8.88 | | $ 8.96 | | $ 10.00 |
| Net investment income (loss) (a) | 0.08 | | 0.14 | | 0.03 |
| Net realized and unrealized gain (loss) | (0.46) | | (0.12) | | (0.82) |
| Total from investment operations | (0.38) | | 0.02 | | (0.79) |
| Less distributions: | | | | | |
| From net investment income | — | | (0.10) | | (0.25) |
| From net realized gain on investments | — | | — | | (0.00)‡ |
| Net asset value at end of period | $ 8.50 | | $ 8.88 | | $ 8.96 |
| Total investment return (b) | (4.28)% | | 0.22% | | (8.17)% |
| Ratios (to average net assets)/Supplemental Data: | | | | | |
| Net investment income (loss) | 1.83%†† | | 1.58% | | 0.52%†† |
| Net expenses (c) | 1.15%†† | | 1.15% | | 1.15%†† |
| Expenses (before waiver/reimbursement) (c) | 1.88%†† | | 2.20% | | 2.75%†† |
| Portfolio turnover rate | 71% | | 142% | | 70% |
| Net assets at end of period (in 000’s) | $ 62 | | $ 64 | | $ 40 |
| * | Unaudited. |
| ^ | Inception date. |
| ‡ | Less than one cent per share. |
| †† | Annualized. |
| (a) | Per share data based on average shares outstanding during the period. |
| (b) | Total investment return is calculated exclusive of sales charges and assumes the reinvestment of dividends and distributions. Class R3 shares are not subject to sales charges. For periods of less than one year, total return is not annualized. |
| (c) | In addition to the fees and expenses which the Fund bears directly, it also indirectly bears a pro-rata share of the fees and expenses of the underlying funds in which it invests. Such indirect expenses are not included in the above expense ratios. |
The notes to the financial statements are an integral part of, and should be read in conjunction with, the financial statements.
107
Financial Highlights selected per share data and ratios
| | Six months ended
October 31,
2023* | | Year Ended April 30, | | September 30, 2021^ through
April 30, |
| SIMPLE Class | 2023 | | 2022 |
| Net asset value at beginning of period | $ 8.88 | | $ 8.96 | | $ 10.00 |
| Net investment income (loss) (a) | 0.08 | | 0.15 | | 0.03 |
| Net realized and unrealized gain (loss) | (0.46) | | (0.13) | | (0.82) |
| Total from investment operations | (0.38) | | 0.02 | | (0.79) |
| Less distributions: | | | | | |
| From net investment income | — | | (0.10) | | (0.25) |
| From net realized gain on investments | — | | — | | (0.00)‡ |
| Net asset value at end of period | $ 8.50 | | $ 8.88 | | $ 8.96 |
| Total investment return (b) | (4.28)% | | 0.31% | | (8.15)% |
| Ratios (to average net assets)/Supplemental Data: | | | | | |
| Net investment income (loss) | 1.85%†† | | 1.75% | | 0.57%†† |
| Net expenses (c) | 1.05%†† | | 1.05% | | 1.05%†† |
| Expenses (before waiver/reimbursement) (c) | 1.94%†† | | 2.20% | | 2.65%†† |
| Portfolio turnover rate | 71% | | 142% | | 70% |
| Net assets at end of period (in 000’s) | $ 380 | | $ 273 | | $ 74 |
| * | Unaudited. |
| ^ | Inception date. |
| ‡ | Less than one cent per share. |
| †† | Annualized. |
| (a) | Per share data based on average shares outstanding during the period. |
| (b) | Total investment return is calculated exclusive of sales charges and assumes the reinvestment of dividends and distributions. SIMPLE Class shares are not subject to sales charges. For periods of less than one year, total return is not annualized. |
| (c) | In addition to the fees and expenses which the Fund bears directly, it also indirectly bears a pro-rata share of the fees and expenses of the underlying funds in which it invests. Such indirect expenses are not included in the above expense ratios. |
The notes to the financial statements are an integral part of, and should be read in conjunction with, the financial statements.
| 108 | MainStay ESG Multi-Asset Allocation Fund |
Notes to Financial Statements (Unaudited)
Note 1-Organization and Business
MainStay Funds Trust (the “Trust”) was organized as a Delaware statutory trust on April 28, 2009. The Trust is registered under the Investment Company Act of 1940, as amended (the “1940 Act”), as an open-end management investment company, and is comprised of thirty-seven funds (collectively referred to as the “Funds” and each individually, referred to as a “Fund"). These financial statements and notes relate to the MainStay Defensive ETF Allocation Fund, MainStay Conservative ETF Allocation Fund, MainStay Moderate ETF Allocation Fund, MainStay Growth ETF Allocation Fund, MainStay Equity ETF Allocation Fund and MainStay ESG Multi-Asset Allocation Fund (commenced operations September 30, 2021) (collectively referred to as the "ETF Allocation Funds" and each individually referred to as an "ETF Allocation Fund"). Each is a “diversified” fund, as that term is defined in the 1940 Act, as interpreted or modified by regulatory authorities having jurisdiction, from time to time.
The following table lists each ETF Allocation Fund's share classes that have been registered and commenced operations:
| Fund | Share Classes Commenced Operations |
| MainStay Defensive ETF Allocation Fund* | Class A, Class C, Class I, Class R3**, SIMPLE Class |
| MainStay Conservative ETF Allocation Fund | Class A, Class C, Class I, Class R3, SIMPLE Class |
| MainStay Moderate ETF Allocation Fund | Class A, Class C, Class I, Class R3, SIMPLE Class |
| MainStay Growth ETF Allocation Fund | Class A, Class C, Class I, Class R3, SIMPLE Class |
| MainStay Equity ETF Allocation Fund | Class A, Class C, Class I, Class R3, SIMPLE Class |
| MainStay ESG Multi-Asset Allocation Fund* | Class A, Class C, Class I, Class R3**, SIMPLE Class |
*The MainStay Defensive ETF Allocation Fund and MainStay ESG Multi-Asset Allocation Fund will be liquidated on or about February 28, 2024 (the "Liquidation Date"). It is expected that the MainStay Defensive ETF Allocation Fund and MainStay ESG Multi-Asset Allocation Fund will distribute to remaining shareholders, on or promptly after the Liquidation Date, a liquidating distribution in cash, cash equivalents, or portfolio securities equal to the shareholder's proportionate interest in the net assets of each Fund.
**As of October 31, 2023, Class R3 shares of the MainStay Defensive ETF Allocation Fund and MainStay ESG Multi-Asset Allocation Fund are closed to all new investors and, upon the close of business on December 29, 2023, Class R3 shares of the MainStay Defensive ETF Allocation Fund and MainStay ESG Multi-Asset Allocation Fund are closed to additional investments by existing shareholders.
Class A shares are offered at net asset value (“NAV”) per share plus an initial sales charge. No initial sales charge applies to investments of $250,000 or more (and certain other qualified purchases) in Class A shares. However, a contingent deferred sales charge (“CDSC”) of 0.50% may be imposed on certain redemptions made within 18 months of the date of purchase on shares that were purchased without an initial sales
charge. Class C shares are offered at NAV without an initial sales charge, although a CDSC of 1.00% may be imposed on certain redemptions of such shares made within one year of the date of purchase of Class C shares. Class I, Class R3 and SIMPLE Class shares are offered at NAV without a sales charge. Depending upon eligibility, Class C shares convert to Class A shares at the end of the calendar quarter eight years after the date they were purchased. SIMPLE Class shares convert to Class A shares at the end of the calendar quarter ten years after the date they were purchased. Share class conversions are based on the relevant NAVs of the two classes at the time of the conversion, and no sales load or other charge is imposed. Under certain circumstances and as may be permitted by the Trust’s multiple class plan pursuant to Rule 18f-3 under the 1940 Act, specified share classes of an ETF Allocation Fund may be converted to one or more other share classes of the ETF Allocation Fund as disclosed in the capital share transactions within these Notes. The classes of shares have the same voting (except for issues that relate solely to one class), dividend, liquidation and other rights, and the same terms and conditions, except that under distribution plans pursuant to Rule 12b-1 under the 1940 Act, Class C shares are subject to higher distribution and/or service fees than Class A, Class R3 and SIMPLE Class shares. Class I shares are not subject to a distribution and/or service fee. Class R3 shares are subject to a shareholder service fee, which is in addition to fees paid under the distribution plans for Class R3 shares.
At a meeting held on September 25-26, 2023, the Board of Trustees (the “Board”) of the Trust, after careful consideration of a number of factors and upon the recommendation of the Funds' investment adviser, New York Life Investment Management LLC (“New York Life Investments” or the "Manager"), approved a proposal to liquidate Class R3 shares of MainStay Defensive ETF Allocation Fund and MainStay ESG Multi-Asset Allocation Fund on or about February 28, 2024, pursuant to the terms of a plan of liquidation.
The investment objective for each of the ETF Allocation Funds is as follows:
The MainStay Defensive ETF Allocation Fund seeks current income.
The MainStay Conservative ETF Allocation Fund seeks current income and, secondarily, long-term growth of capital.
The MainStay Moderate ETF Allocation Fund seeks long-term growth of capital and, secondarily, current income.
The MainStay Growth ETF Allocation Fund seeks long-term growth of capital and, secondarily, current income.
The MainStay Equity ETF Allocation Fund seeks long-term growth of capital.
The MainStay ESG Multi-Asset Allocation Fund seeks long-term growth of capital and, secondarily, current income.
The ETF Allocation Funds are "funds-of-funds" that seek to achieve their investment objectives by investing in passively-managed exchange-traded funds (the “Underlying ETFs”).
Notes to Financial Statements (Unaudited) (continued)
Note 2–Significant Accounting Policies
The ETF Allocation Funds are investment companies and accordingly follow the investment company accounting and reporting guidance of the Financial Accounting Standards Board (“FASB”) Accounting Standards Codification Topic 946 Financial Services—Investment Companies. The ETF Allocation Funds prepare their financial statements in accordance with generally accepted accounting principles (“GAAP”) in the United States of America and follow the significant accounting policies described below.
(A) Securities Valuation. Investments are usually valued as of the close of regular trading on the New York Stock Exchange (the "Exchange") (usually 4:00 p.m. Eastern time) on each day the ETF Allocation Funds are open for business ("valuation date").
Pursuant to Rule 2a-5 under the 1940 Act, the Board has designated New York Life Investments as its Valuation Designee (the "Valuation Designee"). The Valuation Designee is responsible for performing fair valuations relating to all investments in each ETF Allocation Fund’s portfolio for which market quotations are not readily available; periodically assessing and managing material valuation risks; establishing and applying fair value methodologies; testing fair valuation methodologies; evaluating and overseeing pricing services; ensuring appropriate segregation of valuation and portfolio management functions; providing quarterly, annual and prompt reporting to the Board, as appropriate; identifying potential conflicts of interest; and maintaining appropriate records. The Valuation Designee has established a valuation committee ("Valuation Committee") to assist in carrying out the Valuation Designee’s responsibilities and establish prices of securities for which market quotations are not readily available. The ETF Allocation Funds' and the Valuation Designee's policies and procedures ("Valuation Procedures") govern the Valuation Designee’s selection and application of methodologies for determining and calculating the fair value of ETF Allocation Fund investments. The Valuation Designee may value the ETF Allocation Funds' portfolio securities for which market quotations are not readily available and other ETF Allocation Fund assets utilizing inputs from pricing services and other third-party sources. The Valuation Committee meets (in person, via electronic mail or via teleconference) on an ad-hoc basis to determine fair valuations and on a quarterly basis to review fair value events with respect to certain securities for which market quotations are not readily available, including valuation risks and back-testing results, and preview reports to the Board.
The Valuation Committee establishes prices of securities for which market quotations are not readily available based on such methodologies and measurements on a regular basis after considering information that is reasonably available and deemed relevant by the Valuation Committee. The Board shall oversee the Valuation Designee and review fair valuation materials on a prompt, quarterly and annual basis and approve proposed revisions to the Valuation Procedures.
Investments for which market quotations are not readily available are valued at fair value as determined in good faith pursuant to the Valuation
Procedures. A market quotation is readily available only when that quotation is a quoted price (unadjusted) in active markets for identical investments that each ETF Allocation Fund can access at the measurement date, provided that a quotation will not be readily available if it is not reliable. "Fair value" is defined as the price the ETF Allocation Fund would reasonably expect to receive upon selling an asset or liability in an orderly transaction to an independent buyer in the principal or most advantageous market for the asset or liability. Fair value measurements are determined within a framework that establishes a three-tier hierarchy that maximizes the use of observable market data and minimizes the use of unobservable inputs to establish a classification of fair value measurements for disclosure purposes. "Inputs" refer broadly to the assumptions that market participants would use in pricing the asset or liability, including assumptions about risk, such as the risk inherent in a particular valuation technique used to measure fair value using a pricing model and/or the risk inherent in the inputs for the valuation technique. Inputs may be observable or unobservable. Observable inputs reflect the assumptions market participants would use in pricing the asset or liability based on market data obtained from sources independent of each ETF Allocation Fund. Unobservable inputs reflect each ETF Allocation Fund’s own assumptions about the assumptions market participants would use in pricing the asset or liability based on the information available. The inputs or methodology used for valuing assets or liabilities may not be an indication of the risks associated with investing in those assets or liabilities. The three-tier hierarchy of inputs is summarized below.
| • | Level 1—quoted prices (unadjusted) in active markets for an identical asset or liability |
| • | Level 2—other significant observable inputs (including quoted prices for a similar asset or liability in active markets, interest rates and yield curves, prepayment speeds, credit risk, etc.) |
| • | Level 3—significant unobservable inputs (including each ETF Allocation Fund's own assumptions about the assumptions that market participants would use in measuring fair value of an asset or liability) |
The level of an asset or liability within the fair value hierarchy is based on the lowest level of an input, both individually and in the aggregate, that is significant to the fair value measurement. The aggregate value by input level of each ETF Allocation Fund’s assets and liabilities as of October 31, 2023, is included at the end of each ETF Allocation Fund’s Portfolio of Investments.
Exchange-traded funds (“ETFs”) are valued at the last quoted sales prices as of the close of regular trading on the relevant exchange on each valuation date. Securities that are not traded on the valuation date are valued at the mean of the last quoted bid and ask prices. Prices are normally taken from the principal market in which each security trades. These securities are generally categorized as Level 1 in the hierarchy.
Investments in mutual funds, including money market funds, are valued at their respective NAVs at the close of business each day on the valuation date. These securities are generally categorized as Level 1 in the hierarchy.
| 110 | Mainstay ETF Asset Allocation Funds |
Temporary cash investments acquired in excess of 60 days to maturity at the time of purchase are valued using the latest bid prices or using valuations based on a matrix system (which considers such factors as security prices, yields, maturities and ratings), both as furnished by independent pricing services. Temporary cash investments that mature in 60 days or less at the time of purchase ("Short-Term Investments") are valued using the amortized cost method of valuation, unless the use of such method would be inappropriate. The amortized cost method involves valuing a security at its cost on the date of purchase and thereafter assuming a constant amortization to maturity of the difference between such cost and the value on maturity date. Amortized cost approximates the current fair value of a security. Securities valued using the amortized cost method are not valued using quoted prices in an active market and are generally categorized as Level 2 in the hierarchy.
The information above is not intended to reflect an exhaustive list of the methodologies that may be used to value portfolio investments. The Valuation Procedures permit the use of a variety of valuation methodologies in connection with valuing portfolio investments. The methodology used for a specific type of investment may vary based on the market data available or other considerations. The methodologies summarized above may not represent the specific means by which portfolio investments are valued on any particular business day.
(B) Income Taxes. Each ETF Allocation Fund is treated as a separate entity for federal income tax purposes. The ETF Allocation Funds' policy is to comply with the requirements of the Internal Revenue Code of 1986, as amended (the “Internal Revenue Code”), applicable to regulated investment companies and to distribute all of its taxable income to the shareholders of each ETF Allocation Fund within the allowable time limits. Therefore, no federal, state and local income tax provisions are required.
Management evaluates each ETF Allocation Fund’s tax positions to determine if the tax positions taken meet the minimum recognition threshold in connection with accounting for uncertainties in income tax positions taken or expected to be taken for the purposes of measuring and recognizing tax liabilities in the financial statements. Recognition of tax benefits of an uncertain tax position is permitted only to the extent the position is “more likely than not” to be sustained assuming examination by taxing authorities. Management has analyzed the ETF Allocation Funds' tax positions taken on federal, state and local income tax returns for all open tax years (for up to three tax years) and has concluded that no provisions for federal, state and local income tax are required in the ETF Allocation Funds' financial statements. The ETF Allocation Funds' federal, state and local income tax and federal excise tax returns for tax years for which the applicable statutes of limitations have not expired are subject to examination by the Internal Revenue Service and state and local departments of revenue.
(C) Dividends and Distributions to Shareholders. Dividends and distributions are recorded on the ex-dividend date. The MainStay Moderate ETF Allocation Fund, MainStay Growth ETF Allocation Fund and MainStay Equity ETF Allocation Fund and MainStay ESG Multi-Asset Allocation Fund each intends to declare and pay dividends from net
investment income, if any, at least annually. The MainStay Conservative ETF Allocation Fund and MainStay Defensive ETF Allocation Fund each intends to declare and pay dividends from net investment income, if any, at least quarterly. Each MainStay ETF Allocation Fund declare and distribute capital gains, if any, at least annually. Unless a shareholder elects otherwise, all dividends and distributions are reinvested in the same class of shares of the respective ETF Allocation Fund at NAV. Dividends and distributions to shareholders are determined in accordance with federal income tax regulations and may differ from determinations using GAAP.
(D) Security Transactions and Investment Income. The ETF Allocation Funds record security transactions on the trade date. Realized gains and losses on security transactions are determined using the identified cost method. Dividends and distributions received by the ETF Allocation Funds from the Underlying ETFs are recorded on the ex-dividend date.
Investment income and realized and unrealized gains and losses on investments of the ETF Allocation Funds are allocated pro rata to the separate classes of shares based upon their relative net assets on the date the income is earned or realized and unrealized gains and losses are incurred.
(E) Expenses. Expenses of the Trust are allocated to the individual Funds in proportion to the net assets of the respective Funds when the expenses are incurred, except where direct allocations of expenses can be made. Expenses (other than transfer agent expenses and fees incurred under the shareholder services plans and/or the distribution plans further discussed in Note 3(B)) are allocated to separate classes of shares pro rata based upon their relative net assets on the date the expenses are incurred. The expenses borne by the ETF Allocation Funds, including those of related parties to the ETF Allocation Funds, are shown in the Statement of Operations.
In addition, the ETF Allocation Funds bear a pro rata share of the fees and expenses of the Underlying ETFs in which they invest. Because the Underlying ETFs have varied expense and fee levels and the ETF Allocation Funds may own different proportions of the Underlying ETFs at different times, the amount of fees and expenses incurred indirectly by each ETF Allocation Fund may vary. Shares of the Underlying ETFs are subject to management fees and other fees that may cause the costs of investing in Underlying ETFs to be greater than the costs of owning the underlying securities directly. These indirect expenses of the Underlying ETFs are not included in the amounts shown in the Statement of Operations or in the expense ratios included in the Financial Highlights.
(F) Use of Estimates. In preparing financial statements in conformity with GAAP, the Manager makes estimates and assumptions that affect the reported amounts and disclosures in the financial statements. Actual results could differ from those estimates and assumptions.
(G) Securities Lending. In order to realize additional income, the ETF Allocation Funds may engage in securities lending, subject to the limitations set forth in the 1940 Act and relevant guidance by the staff of
Notes to Financial Statements (Unaudited) (continued)
the Securities and Exchange Commission (“SEC”). If the ETF Allocation Funds engage in securities lending, the ETF Allocation Funds will lend through their custodian, JPMorgan Chase Bank, N.A., ("JPMorgan"), acting as securities lending agent on behalf of the ETF Allocation Funds. Under the current arrangement, JPMorgan will manage the ETF Allocation Funds' collateral in accordance with the securities lending agency agreement between the ETF Allocation Funds and JPMorgan, and indemnify the ETF Allocation Funds against counterparty risk. The loans will be collateralized by cash (which may be invested in a money market fund) and/or non-cash collateral (which may include U.S. Treasury securities and/or U.S. government agency securities issued or guaranteed by the United States government or its agencies or instrumentalities) at least equal at all times to the market value of the securities loaned. Non-cash collateral held at year end is segregated and cannot be transferred by the ETF Allocation Funds. The ETF Allocation Funds bear the risk of delay in recovery of, or loss of rights in, the securities loaned. The ETF Allocation Funds may also record a realized gain or loss on securities deemed sold due to a borrower’s inability to return securities on loan. The ETF Allocation Funds bear the risk of any loss on investment of cash collateral. The ETF Allocation Funds will receive compensation for lending its securities in the form of fees or it will retain a portion of interest earned on the investment of any cash collateral. The ETF Allocation Funds will also continue to receive interest and dividends on the securities loaned and any gain or loss in the market price of the securities loaned that may occur during the term of the loan will be for the account of the ETF Allocation Funds. Income earned from securities lending activities, if any, is reflected in the Statement of Operations. Securities on loan as of October 31, 2023, are shown in the Portfolio of Investments.
(H) Indemnifications. Under the Trust’s organizational documents, its officers and trustees are indemnified against certain liabilities that may arise out of performance of their duties to the Trust. Additionally, in the
normal course of business, the ETF Allocation Funds enter into contracts with third-party service providers that contain a variety of representations and warranties and that may provide general indemnifications. The ETF Allocation Funds' maximum exposure under these arrangements is unknown, as this would involve future claims that may be made against the ETF Allocation Funds that have not yet occurred. The Manager believes that the risk of loss in connection with these potential indemnification obligations is remote. However, there can be no assurance that material liabilities related to such obligations will not arise in the future, which could adversely impact the ETF Allocation Funds.
Note 3–Fees and Related Party Transactions
(A) Manager. New York Life Investments, a registered investment adviser and an indirect, wholly-owned subsidiary of New York Life Insurance Company (“New York Life”), serves as the ETF Allocation Funds' Manager pursuant to an Amended and Restated Management Agreement (“Management Agreement”) and is responsible for the day-to-day portfolio management of the ETF Allocation Funds. The Manager provides offices, conducts clerical, recordkeeping and bookkeeping services, and keeps most of the financial and accounting records required to be maintained by the ETF Allocation Funds. Except for the portion of salaries and expenses that are the responsibility of the ETF Allocation Funds, the Manager pays the salaries and expenses of all personnel affiliated with the ETF Allocation Funds and certain operational expenses of the ETF Allocation Funds. The ETF Allocation Funds reimburse New York Life Investments in an amount equal to the portion of the compensation of the Chief Compliance Officer attributable to the ETF Allocation Funds.
Pursuant to the Management Agreement, each ETF Allocation Fund pays the Manager a monthly fee for the services performed and facilities furnished at an annual rate of 0.20% of each ETF Allocation Fund's average daily net assets.
| 112 | Mainstay ETF Asset Allocation Funds |
New York Life Investments has contractually agreed to waive fees and/or reimburse expenses so that Total Annual Fund Operating Expenses (excluding taxes, interest, litigation, extraordinary expenses, brokerage and other transaction expenses relating to the purchase and sale of portfolio investments, and acquired (underlying) fund fees and expenses) of a class do not exceed the following percentages of average daily net assets for each class:
| Fund | Class A | Class C | Class I | Class R3 | SIMPLE Class |
| MainStay Defensive ETF Allocation Fund | 0.80% | 1.55% | 0.55% | 1.15% | 1.05% |
| MainStay Conservative ETF Allocation Fund | 0.80 | 1.55 | 0.55 | 1.15 | 1.05 |
| MainStay Moderate ETF Allocation Fund | 0.80 | 1.55 | 0.55 | 1.15 | 1.05 |
| MainStay Growth ETF Allocation Fund | 0.80 | 1.55 | 0.55 | 1.15 | 1.05 |
| MainStay Equity ETF Allocation Fund | 0.80 | 1.55 | 0.55 | 1.15 | 1.05 |
| MainStay ESG Multi-Asset Allocation Fund | 0.80 | 1.55 | 0.55 | 1.15 | 1.05 |
This agreement will remain in effect until August 31, 2024, and shall renew automatically for one-year terms unless New York Life Investments provides written notice of termination prior to the start of the next term or upon approval of the Board.
During the period ended October 31, 2023, New York Life Investments earned fees from the ETF Allocation Funds and waived fees and/or reimbursed expenses as follows:
| Fund | Earned | Waived/Reimbursed |
| MainStay Defensive ETF Allocation Fund | $ 10,882 | $(47,544) |
| MainStay Conservative ETF Allocation Fund | 39,278 | (13,882) |
| MainStay Moderate ETF Allocation Fund | 111,261 | — |
| MainStay Growth ETF Allocation Fund | 86,247 | — |
| MainStay Equity ETF Allocation Fund | 63,162 | (305) |
| MainStay ESG Multi-Asset Allocation Fund | 12,608 | (46,564) |
JPMorgan provides sub-administration and sub-accounting services to the ETF Allocation Funds pursuant to an agreement with New York Life Investments. These services include calculating the daily NAVs of the ETF Allocation Funds, maintaining the general ledger and sub-ledger accounts for the calculation of the ETF Allocation Funds' respective NAVs, and assisting New York Life Investments in conducting various aspects of the ETF Allocation Funds' administrative operations. For providing these services to the ETF Allocation Funds, JPMorgan is compensated by New York Life Investments.
Pursuant to an agreement between the Trust and New York Life Investments, New York Life Investments is responsible for providing or procuring certain regulatory reporting services for the ETF Allocation Funds. The ETF Allocation Funds will reimburse New York Life Investments for the actual costs incurred by New York Life Investments in connection with providing or procuring these services for the ETF Allocation Funds.
(B) Distribution, Service and Shareholder Service Fees. The Trust, on behalf of the ETF Allocation Funds, has entered into a distribution agreement with NYLIFE Distributors LLC (the “Distributor”), an affiliate of New York Life Investments. The ETF Allocation Funds have
adopted distribution plans (the “Plans”) in accordance with the provisions of Rule 12b-1 under the 1940 Act.
Pursuant to the Class A Plan, the Distributor receives a monthly fee from the Class A shares at an annual rate of 0.25% of the average daily net assets of the Class A shares for distribution and/or service activities as designated by the Distributor. Pursuant to the Class C Plan, Class C shares pay the Distributor a monthly distribution fee at an annual rate of 0.75% of the average daily net assets of the Class C shares, along with a service fee at an annual rate of 0.25% of the average daily net assets of the Class C shares, for a total 12b-1 fee of 1.00%. Pursuant to the Class R3 and SIMPLE Class Plans, Class R3 and SIMPLE Class shares pay the Distributor a monthly distribution fee at an annual rate of 0.25% of the average daily net assets of the Class R3 and SIMPLE Class shares, along with a service fee at an annual rate of 0.25% of the average daily net assets of the Class R3 and SIMPLE Class shares, for a total 12b-1 fee of 0.50%. Class I shares are not subject to a distribution and/or service fee.
The Plans provide that the distribution and service fees are payable to the Distributor regardless of the amounts actually expended by the Distributor for distribution of the ETF Allocation Funds' shares and service activities.
In accordance with the Shareholder Services Plans for the Class R3 shares, the Manager has agreed to provide, through its affiliates or independent third parties, various shareholder and administrative support services to shareholders of the Class R3 shares. For its services, the Manager, its affiliates or independent third-party service providers are entitled to a shareholder service fee accrued daily and paid monthly at an annual rate of 0.10% of the average daily net assets of the Class R3 shares. This is in addition to any fees paid under the Class R3 Plan.
During the six-month period ended October 31, 2023, shareholder service fees incurred by the Fund were as follows:
| MainStay Defensive ETF Allocation Fund |
| Class R3 | $ 38 |
| |
| MainStay Conservative ETF Allocation Fund |
| Class R3 | $222 |
| |
Notes to Financial Statements (Unaudited) (continued)
| MainStay Moderate ETF Allocation Fund |
| Class R3 | $852 |
|
| MainStay Growth ETF Allocation Fund |
| Class R3 | $393 |
| |
| MainStay Equity ETF Allocation Fund |
| Class R3 | $189 |
| |
| MainStay ESG Multi-Asset Allocation Fund |
| Class R3 | $ 32 |
(C) Sales Charges. The ETF Allocation Funds were advised by the Distributor that the amount of initial sales charges retained on sales of each class of shares during the six-month period ended October 31, 2023, was as follows:
| MainStay Defensive ETF Allocation Fund | |
| Class A | $ 2,210 |
| |
| MainStay Conservative ETF Allocation Fund | |
| Class A | $ 6,312 |
| |
| MainStay Moderate ETF Allocation Fund | |
| Class A | $ 23,198 |
| |
| MainStay Growth ETF Allocation Fund | |
| Class A | $ 21,837 |
| |
| MainStay Equity ETF Allocation Fund | |
| Class A | $ 19,092 |
| |
| MainStay ESG Multi-Asset Allocation Fund | |
| Class A | $ 318 |
The ETF Allocation Funds were also advised that the Distributor retained CDSCs on redemptions of Class A and Class C shares during the six-month period ended October 31, 2023, as follows:
| MainStay Defensive ETF Allocation Fund | |
| Class A | $ 129 |
| |
| MainStay Conservative ETF Allocation Fund | |
| Class A | $ 3,225 |
| |
| MainStay Moderate ETF Allocation Fund | |
| Class A | $ 255 |
| Class C | 2 |
| |
| MainStay Growth ETF Allocation Fund | |
| Class A | $ 577 |
| |
| MainStay Equity ETF Allocation Fund | |
| Class C | $ 22 |
| |
| MainStay ESG Multi-Asset Allocation Fund | |
| Class A | $ 193 |
(D) Transfer, Dividend Disbursing and Shareholder Servicing Agent. NYLIM Service Company LLC, an affiliate of New York Life Investments, is the ETF Allocation Funds' transfer, dividend disbursing and shareholder servicing agent pursuant to an agreement between NYLIM Service Company LLC and the Trust. NYLIM Service Company LLC has entered into an agreement with SS&C Global Investor & Distribution Solutions, Inc. ("SS&C"), pursuant to which SS&C performs certain transfer agent services on behalf of NYLIM Service Company LLC. Effective June 30, 2020, New York Life Investments has contractually agreed to limit the transfer agency expenses charged to each of the Fund’s share classes to a maximum of 0.35% of that share class’s average daily net assets on an annual basis after deducting any applicable Fund or class-level expense reimbursement or small account fees. This agreement will remain in effect until August 31, 2024, and shall renew automatically for one-year terms unless New York Life Investments provides written notice of termination prior to the start of the next term or upon approval of the Board. During the six-month period ended October 31, 2023, transfer agent expenses incurred by the ETF Allocation Funds and any reimbursements, pursuant to the aforementioned Transfer Agency expense limitation agreement, were as follows:
| MainStay Defensive ETF Allocation Fund | Expense | Waived |
| Class A | $ 3,971 | $ — |
| Class C | 160 | — |
| Class I | 17 | — |
| Class R3 | 31 | — |
| SIMPLE Class | 573 | — |
| MainStay Conservative ETF Allocation Fund | Expense | Waived |
| Class A | $ 15,742 | $ — |
| Class C | 181 | — |
| Class I | 15 | — |
| Class R3 | 195 | — |
| SIMPLE Class | 1,846 | — |
| 114 | Mainstay ETF Asset Allocation Funds |
| MainStay Moderate ETF Allocation Fund | Expense | Waived |
| Class A | $ 44,506 | $ — |
| Class C | 252 | — |
| Class I | 35 | — |
| Class R3 | 759 | — |
| SIMPLE Class | 6,725 | — |
| MainStay Growth ETF Allocation Fund | Expense | Waived |
| Class A | $ 42,473 | $ — |
| Class C | 208 | — |
| Class I | 63 | — |
| Class R3 | 450 | — |
| SIMPLE Class | 7,500 | — |
| MainStay Equity ETF Allocation Fund | Expense | Waived |
| Class A | $ 31,664 | $ — |
| Class C | 119 | — |
| Class I | 69 | — |
| Class R3 | 221 | — |
| SIMPLE Class | 5,962 | — |
| MainStay ESG Multi-Asset Allocation Fund | Expense | Waived |
| Class A | $ 31 | $ — |
| Class C | 19 | — |
| Class I | 104 | — |
| Class R3 | 1 | — |
| SIMPLE Class | 272 | — |
(E) Capital. As of October 31, 2023, New York Life and its affiliates beneficially held shares of the ETF Allocation Funds with the values and percentages of net assets as follows:
| MainStay Defensive ETF Allocation Fund | | |
| Class C | $ 23,163 | 10.9% |
| Class I | 23,693 | 60.1 |
| Class R3 | 23,466 | 32.4 |
| |
| MainStay Conservative ETF Allocation Fund | | |
| Class C | $ 24,956 | 11.4% |
| Class I | 32,487 | 100.0 |
| Class R3 | 25,253 | 5.8 |
| |
| MainStay Moderate ETF Allocation Fund | | |
| Class I | $ 28,655 | 36.7% |
| Class R3 | 27,300 | 1.4 |
| |
| MainStay Growth ETF Allocation Fund | | |
| Class C | $ 29,082 | 10.2% |
| Class I | 28,907 | 27.8 |
| Class R3 | 29,479 | 3.6 |
| |
| MainStay Equity ETF Allocation Fund | | |
| Class C | $ 30,353 | 19.7% |
| Class I | 16,922 | 15.3 |
| Class R3 | 30,770 | 7.2 |
| |
| MainStay ESG Multi-Asset Allocation Fund | | |
| Class A | $ 22,172 | 0.8% |
| Class C | 21,826 | 100.0 |
| Class I | 8,819,682 | 99.8 |
| Class R3 | 22,022 | 35.8 |
| SIMPLE Class | 22,049 | 5.8 |
Note 4-Federal Income Tax
As of October 31, 2023, the cost and unrealized appreciation (depreciation) of each ETF Allocation Fund’s investment portfolio, including applicable derivative contracts and other financial instruments, as determined on a federal income tax basis, were as follows:
| MainStay Defensive ETF Allocation Fund |
| | Federal Tax
Cost | Gross
Unrealized
Appreciation | Gross
Unrealized
(Depreciation) | Net
Unrealized
Appreciation/
(Depreciation) |
| Investments in Securities | $15,234,888 | $16,909 | $(1,497,298) | $(1,480,389) |
| MainStay Conservative ETF Allocation Fund |
| | Federal Tax
Cost | Gross
Unrealized
Appreciation | Gross
Unrealized
(Depreciation) | Net
Unrealized
Appreciation/
(Depreciation) |
| Investments in Securities | $48,889,499 | $885,938 | $(4,389,268) | $(3,503,330) |
| MainStay Moderate ETF Allocation Fund |
| | Federal Tax
Cost | Gross
Unrealized
Appreciation | Gross
Unrealized
(Depreciation) | Net
Unrealized
Appreciation/
(Depreciation) |
| Investments in Securities | $142,614,877 | $570,601 | $(6,593,147) | $(6,022,546) |
Notes to Financial Statements (Unaudited) (continued)
| MainStay Growth ETF Allocation Fund |
| | Federal Tax
Cost | Gross
Unrealized
Appreciation | Gross
Unrealized
(Depreciation) | Net
Unrealized
Appreciation/
(Depreciation) |
| Investments in Securities | $103,023,771 | $529,901 | $(3,093,987) | $(2,564,086) |
| MainStay Equity ETF Allocation Fund |
| | Federal Tax
Cost | Gross
Unrealized
Appreciation | Gross
Unrealized
(Depreciation) | Net
Unrealized
Appreciation/
(Depreciation) |
| Investments in Securities | $68,512,679 | $173,070 | $(2,198,079) | $(2,025,009) |
| MainStay ESG Multi-Asset Allocation Fund |
| | Federal Tax
Cost | Gross
Unrealized
Appreciation | Gross
Unrealized
(Depreciation) | Net
Unrealized
Appreciation/
(Depreciation) |
| Investments in Securities | $13,661,685 | $27,984 | $(916,378) | $(888,394) |
As of April 30, 2023, for federal income tax purposes, capital loss carryforwards of $86,624, as shown in the table below, were available to the extent provided by the regulations to offset future realized gains of MainStay Defensive ETF Allocation Fund. Accordingly, no capital gains distributions are expected to be paid to shareholders until net gains have been realized in excess of such amounts.
Capital Loss
Available Through | Short-Term
Capital Loss
Amounts (000’s) | Long-Term
Capital Loss
Amounts (000’s) |
| Unlimited | $49 | $37 |
As of April 30, 2023, for federal income tax purposes, capital loss carryforwards of $811,117, as shown in the table below, were available to the extent provided by the regulations to offset future realized gains of MainStay Conservative ETF Allocation Fund. Accordingly, no capital gains distributions are expected to be paid to shareholders until net gains have been realized in excess of such amounts.
Capital Loss
Available Through | Short-Term
Capital Loss
Amounts (000’s) | Long-Term
Capital Loss
Amounts (000’s) |
| Unlimited | $402 | $409 |
As of April 30, 2023, for federal income tax purposes, capital loss carryforwards of $2,905,279, as shown in the table below, were available to the extent provided by the regulations to offset future realized gains of MainStay Moderate ETF Allocation Fund. Accordingly, no capital gains
distributions are expected to be paid to shareholders until net gains have been realized in excess of such amounts.
Capital Loss
Available Through | Short-Term
Capital Loss
Amounts (000’s) | Long-Term
Capital Loss
Amounts (000’s) |
| Unlimited | $1,467 | $1,438 |
As of April 30, 2023, for federal income tax purposes, capital loss carryforwards of $1,504,149, as shown in the table below, were available to the extent provided by the regulations to offset future realized gains of MainStay Growth ETF Allocation Fund. Accordingly, no capital gains distributions are expected to be paid to shareholders until net gains have been realized in excess of such amounts.
Capital Loss
Available Through | Short-Term
Capital Loss
Amounts (000’s) | Long-Term
Capital Loss
Amounts (000’s) |
| Unlimited | $870 | $634 |
As of April 30, 2023, for federal income tax purposes, capital loss carryforwards of $894,939, as shown in the table below, were available to the extent provided by the regulations to offset future realized gains of MainStay Equity ETF Allocation Fund. Accordingly, no capital gains distributions are expected to be paid to shareholders until net gains have been realized in excess of such amounts.
Capital Loss
Available Through | Short-Term
Capital Loss
Amounts (000’s) | Long-Term
Capital Loss
Amounts (000’s) |
| Unlimited | $474 | $421 |
As of April 30, 2023, for federal income tax purposes, capital loss carryforwards of $718,337, as shown in the table below, were available to the extent provided by the regulations to offset future realized gains of MainStay ESG Multi-Asset Allocation Fund. Accordingly, no capital gains distributions are expected to be paid to shareholders until net gains have been realized in excess of such amounts.
Capital Loss
Available Through | Short-Term
Capital Loss
Amounts (000’s) | Long-Term
Capital Loss
Amounts (000’s) |
| Unlimited | $492 | $226 |
| 116 | Mainstay ETF Asset Allocation Funds |
During the year ended April 30, 2023, the tax character of distributions paid as reflected in the Statements of Changes in Net Assets was as follows:
| | 2023 |
| Fund | Ordinary
Income | Long-Term
Capital Gains | Total |
| MainStay Defensive ETF Allocation Fund | $ 292,414 | $ 70,089 | $ 362,503 |
| MainStay Conservative ETF Allocation Fund | 911,176 | 114,302 | 1,025,478 |
| MainStay Moderate ETF Allocation Fund | 1,538,434 | 172,753 | 1,711,187 |
| MainStay Growth ETF Allocation Fund | 990,454 | 17,176 | 1,007,630 |
| MainStay Equity ETF Allocation Fund | 470,068 | 5,029 | 475,097 |
| MainStay ESG Multi-Asset Allocation Fund | 187,382 | — | 187,382 |
Note 5–Custodian
JPMorgan is the custodian of cash and securities held by the ETF Allocation Funds. Custodial fees are charged to each ETF Allocation Fund based on each ETF Allocation Fund's net assets and/or the market value of securities held by each ETF Allocation Fund and the number of certain transactions incurred by each ETF Allocation Fund.
Note 6–Line of Credit
The ETF Allocation Funds and certain other funds managed by New York Life Investments maintain a line of credit with a syndicate of banks in order to secure a source of funds for temporary purposes to meet unanticipated or excessive redemption requests.
Effective July 25, 2023, under the credit agreement (the “Credit Agreement”), the aggregate commitment amount is $600,000,000 with an additional uncommitted amount of $100,000,000. The commitment fee is an annual rate of 0.15% of the average commitment amount payable quarterly, regardless of usage, to JPMorgan, who serves as the agent to the syndicate. The commitment fee is allocated among the ETF Allocation Funds and certain other funds managed by New York Life Investments based upon their respective net assets and other factors. Interest on any revolving credit loan is charged based upon the Federal Funds Rate, Daily Simple Secured Overnight Financing Rate ("SOFR") + 0.10%, or the Overnight Bank Funding Rate, whichever is higher. The Credit Agreement expires on July 23, 2024, although the ETF Allocation Funds, certain other funds managed by New York Life Investments and the syndicate of banks may renew the Credit Agreement for an additional year on the same or different terms or enter into a credit agreement with a different syndicate of banks. Prior to July 25, 2023, the aggregate
commitment amount and the commitment fee were the same as those under the current Credit Agreement. During the six-month period ended October 31, 2023, there were no borrowings made or outstanding with respect to the ETF Allocation Funds under the Credit Agreement.
Note 7–Interfund Lending Program
Pursuant to an exemptive order issued by the SEC, the ETF Allocation Funds, along with certain other funds managed by New York Life Investments, may participate in an interfund lending program. The interfund lending program provides an alternative credit facility that permits the ETF Allocation Funds and certain other funds managed by New York Life Investments to lend or borrow money for temporary purposes directly to or from one another, subject to the conditions of the exemptive order. During the six-month period ended October 31, 2023, there were no interfund loans made or outstanding with respect to the ETF Allocation Funds.
Note 8–Purchases and Sales of Securities (in 000’s)
During the six-month period ended October 31, 2023, purchases and sales of securities were as follows:
| Fund | Purchases | Sales |
| MainStay Defensive ETF Allocation Fund | $ 3,123 | $ 1,515 |
| MainStay Conservative ETF Allocation Fund | 11,264 | 7,545 |
| MainStay Moderate ETF Allocation Fund | 33,688 | 15,684 |
| MainStay Growth ETF Allocation Fund | 28,900 | 11,923 |
| MainStay Equity ETF Allocation Fund | 17,616 | 7,839 |
| MainStay ESG Multi-Asset Allocation Fund | 10,122 | 8,653 |
Note 9–Capital Share Transactions
Transactions in capital shares for the period ended October 31, 2023, were as follows:
Notes to Financial Statements (Unaudited) (continued)
MainStay Defensive ETF Allocation Fund
| Class A | Shares | Amount |
| Six-month period ended October 31, 2023: | | |
| Shares sold | 162,583 | $ 1,484,483 |
| Shares issued to shareholders in reinvestment of distributions | 17,519 | 157,784 |
| Shares redeemed | (122,857) | (1,121,383) |
| Net increase (decrease) in shares outstanding before conversion | 57,245 | 520,884 |
| Shares converted into Class A (See Note 1) | 972 | 8,887 |
| Net increase (decrease) | 58,217 | $ 529,771 |
| Year ended April 30, 2023: | | |
| Shares sold | 310,910 | $ 2,857,044 |
| Shares issued to shareholders in reinvestment of distributions | 37,215 | 336,689 |
| Shares redeemed | (315,645) | (2,899,248) |
| Net increase (decrease) in shares outstanding before conversion | 32,480 | 294,485 |
| Shares converted into Class A (See Note 1) | 702 | 6,430 |
| Net increase (decrease) | 33,182 | $ 300,915 |
| |
| Class C | Shares | Amount |
| Six-month period ended October 31, 2023: | | |
| Shares sold | 320 | $ 2,920 |
| Shares issued to shareholders in reinvestment of distributions | 309 | 2,780 |
| Shares redeemed | (166) | (1,499) |
| Net increase (decrease) in shares outstanding before conversion | 463 | 4,201 |
| Shares converted from Class C (See Note 1) | (832) | (7,551) |
| Net increase (decrease) | (369) | $ (3,350) |
| Year ended April 30, 2023: | | |
| Shares sold | 16,427 | $ 150,140 |
| Shares issued to shareholders in reinvestment of distributions | 596 | 5,417 |
| Shares redeemed | (3,878) | (35,650) |
| Net increase (decrease) in shares outstanding before conversion | 13,145 | 119,907 |
| Shares converted from Class C (See Note 1) | (703) | (6,430) |
| Net increase (decrease) | 12,442 | $ 113,477 |
| |
| Class I | Shares | Amount |
| Six-month period ended October 31, 2023: | | |
| Shares sold | 1,099 | $ 10,000 |
| Shares issued to shareholders in reinvestment of distributions | 79 | 713 |
| Shares redeemed | (1,099) | (10,066) |
| Net increase (decrease) | 79 | $ 647 |
| Year ended April 30, 2023: | | |
| Shares sold | 623 | $ 5,793 |
| Shares issued to shareholders in reinvestment of distributions | 165 | 1,493 |
| Net increase (decrease) | 788 | $ 7,286 |
| |
| Class R3 | Shares | Amount |
| Six-month period ended October 31, 2023: | | |
| Shares issued to shareholders in reinvestment of distributions | 119 | $ 1,076 |
| Net increase (decrease) | 119 | $ 1,076 |
| Year ended April 30, 2023: | | |
| Shares sold | 4,693 | $ 43,058 |
| Shares issued to shareholders in reinvestment of distributions | 168 | 1,517 |
| Net increase (decrease) | 4,861 | $ 44,575 |
| |
| SIMPLE Class | Shares | Amount |
| Six-month period ended October 31, 2023: | | |
| Shares sold | 32,611 | $ 296,146 |
| Shares issued to shareholders in reinvestment of distributions | 1,371 | 12,349 |
| Shares redeemed | (3,252) | (29,623) |
| Net increase (decrease) in shares outstanding before conversion | 30,730 | 278,872 |
| Shares converted from SIMPLE Class (See Note 1) | (145) | (1,336) |
| Net increase (decrease) | 30,585 | $ 277,536 |
| Year ended April 30, 2023: | | |
| Shares sold | 44,509 | $ 411,778 |
| Shares issued to shareholders in reinvestment of distributions | 1,779 | 16,132 |
| Shares redeemed | (2,700) | (24,586) |
| Net increase (decrease) | 43,588 | $ 403,324 |
MainStay Conservative ETF Allocation Fund
| Class A | Shares | Amount |
| Six-month period ended October 31, 2023: | | |
| Shares sold | 417,047 | $ 4,156,296 |
| Shares issued to shareholders in reinvestment of distributions | 47,532 | 470,808 |
| Shares redeemed | (491,123) | (4,861,091) |
| Net increase (decrease) in shares outstanding before conversion | (26,544) | (233,987) |
| Shares converted into Class A (See Note 1) | 12,097 | 122,038 |
| Net increase (decrease) | (14,447) | $ (111,949) |
| Year ended April 30, 2023: | | |
| Shares sold | 873,450 | $ 8,657,169 |
| Shares issued to shareholders in reinvestment of distributions | 98,111 | 952,780 |
| Shares redeemed | (660,115) | (6,526,437) |
| Net increase (decrease) in shares outstanding before conversion | 311,446 | 3,083,512 |
| Shares converted into Class A (See Note 1) | 5,356 | 53,415 |
| Net increase (decrease) | 316,802 | $ 3,136,927 |
| |
| 118 | Mainstay ETF Asset Allocation Funds |
| Class C | Shares | Amount |
| Six-month period ended October 31, 2023: | | |
| Shares sold | 1,179 | $ 11,700 |
| Shares issued to shareholders in reinvestment of distributions | 188 | 1,855 |
| Shares redeemed | (3,125) | (31,278) |
| Net increase (decrease) in shares outstanding before conversion | (1,758) | (17,723) |
| Shares converted from Class C (See Note 1) | (11,958) | (120,137) |
| Net increase (decrease) | (13,716) | $ (137,860) |
| Year ended April 30, 2023: | | |
| Shares sold | 2,612 | $ 26,020 |
| Shares issued to shareholders in reinvestment of distributions | 809 | 7,847 |
| Shares redeemed | (2,009) | (19,773) |
| Net increase (decrease) in shares outstanding before conversion | 1,412 | 14,094 |
| Shares converted from Class C (See Note 1) | (5,042) | (50,072) |
| Net increase (decrease) | (3,630) | $ (35,978) |
| |
| Class I | Shares | Amount |
| Six-month period ended October 31, 2023: | | |
| Shares issued to shareholders in reinvestment of distributions | 49 | $ 489 |
| Net increase (decrease) | 49 | $ 489 |
| Year ended April 30, 2023: | | |
| Shares issued to shareholders in reinvestment of distributions | 107 | $ 1,028 |
| Net increase (decrease) | 107 | $ 1,028 |
| |
| Class R3 | Shares | Amount |
| Six-month period ended October 31, 2023: | | |
| Shares sold | 3,997 | $ 39,940 |
| Shares issued to shareholders in reinvestment of distributions | 514 | 5,083 |
| Shares redeemed | (2,245) | (22,654) |
| Net increase (decrease) | 2,266 | $ 22,369 |
| Year ended April 30, 2023: | | |
| Shares sold | 33,419 | $ 324,331 |
| Shares issued to shareholders in reinvestment of distributions | 1,008 | 9,791 |
| Net increase (decrease) | 34,427 | $ 334,122 |
| |
| SIMPLE Class | Shares | Amount |
| Six-month period ended October 31, 2023: | | |
| Shares sold | 76,496 | $ 760,577 |
| Shares issued to shareholders in reinvestment of distributions | 3,308 | 32,714 |
| Shares redeemed | (22,003) | (218,618) |
| Net increase (decrease) in shares outstanding before conversion | 57,801 | 574,673 |
| Shares converted from SIMPLE Class (See Note 1) | (191) | (1,901) |
| Net increase (decrease) | 57,610 | $ 572,772 |
| Year ended April 30, 2023: | | |
| Shares sold | 146,265 | $ 1,445,904 |
| Shares issued to shareholders in reinvestment of distributions | 4,700 | 45,801 |
| Shares redeemed | (19,775) | (195,239) |
| Net increase (decrease) in shares outstanding before conversion | 131,190 | 1,296,466 |
| Shares converted from SIMPLE Class (See Note 1) | (336) | (3,343) |
| Net increase (decrease) | 130,854 | $ 1,293,123 |
MainStay Moderate ETF Allocation Fund
| Class A | Shares | Amount |
| Six-month period ended October 31, 2023: | | |
| Shares sold | 1,149,281 | $ 12,745,458 |
| Shares redeemed | (746,613) | (8,274,493) |
| Net increase (decrease) in shares outstanding before conversion | 402,668 | 4,470,965 |
| Shares converted into Class A (See Note 1) | 2,699 | 30,367 |
| Shares converted from Class A (See Note 1) | (208) | (2,282) |
| Net increase (decrease) | 405,159 | $ 4,499,050 |
| Year ended April 30, 2023: | | |
| Shares sold | 1,931,302 | $ 20,758,714 |
| Shares issued to shareholders in reinvestment of distributions | 151,908 | 1,594,972 |
| Shares redeemed | (1,196,225) | (12,811,527) |
| Net increase (decrease) in shares outstanding before conversion | 886,985 | 9,542,159 |
| Shares converted into Class A (See Note 1) | 4,114 | 43,271 |
| Net increase (decrease) | 891,099 | $ 9,585,430 |
| |
Notes to Financial Statements (Unaudited) (continued)
| Class C | Shares | Amount |
| Six-month period ended October 31, 2023: | | |
| Shares sold | 2,516 | $ 27,577 |
| Shares redeemed | (496) | (5,554) |
| Net increase (decrease) in shares outstanding before conversion | 2,020 | 22,023 |
| Shares converted from Class C (See Note 1) | (863) | (9,590) |
| Net increase (decrease) | 1,157 | $ 12,433 |
| Year ended April 30, 2023: | | |
| Shares sold | 3,362 | $ 35,869 |
| Shares issued to shareholders in reinvestment of distributions | 294 | 3,083 |
| Shares redeemed | (3,751) | (39,764) |
| Net increase (decrease) in shares outstanding before conversion | (95) | (812) |
| Shares converted from Class C (See Note 1) | (4,140) | (43,271) |
| Net increase (decrease) | (4,235) | $ (44,083) |
| |
| Class I | Shares | Amount |
| Six-month period ended October 31, 2023: | | |
| Shares sold | 631 | $ 7,000 |
| Net increase (decrease) | 631 | $ 7,000 |
| Year ended April 30, 2023: | | |
| Shares sold | 2,321 | $ 25,321 |
| Shares issued to shareholders in reinvestment of distributions | 139 | 1,463 |
| Shares redeemed | (2,354) | (25,251) |
| Net increase (decrease) | 106 | $ 1,533 |
| |
| Class R3 | Shares | Amount |
| Six-month period ended October 31, 2023: | | |
| Shares sold | 71,866 | $ 792,050 |
| Net increase (decrease) | 71,866 | $ 792,050 |
| Year ended April 30, 2023: | | |
| Shares sold | 67,966 | $ 715,346 |
| Shares issued to shareholders in reinvestment of distributions | 1,930 | 20,241 |
| Shares redeemed | (34,261) | (373,494) |
| Net increase (decrease) | 35,635 | $ 362,093 |
| |
| SIMPLE Class | Shares | Amount |
| Six-month period ended October 31, 2023: | | |
| Shares sold | 261,095 | $ 2,885,898 |
| Shares redeemed | (39,338) | (435,339) |
| Net increase (decrease) in shares outstanding before conversion | 221,757 | 2,450,559 |
| Shares converted into SIMPLE Class (See Note 1) | 209 | 2,282 |
| Shares converted from SIMPLE Class (See Note 1) | (1,903) | (20,777) |
| Net increase (decrease) | 220,063 | $ 2,432,064 |
| Year ended April 30, 2023: | | |
| Shares sold | 476,351 | $ 5,096,795 |
| Shares issued to shareholders in reinvestment of distributions | 8,448 | 88,534 |
| Shares redeemed | (29,925) | (321,359) |
| Net increase (decrease) | 454,874 | $ 4,863,970 |
MainStay Growth ETF Allocation Fund
| Class A | Shares | Amount |
| Six-month period ended October 31, 2023: | | |
| Shares sold | 997,977 | $12,089,971 |
| Shares redeemed | (468,858) | (5,667,498) |
| Net increase (decrease) in shares outstanding before conversion | 529,119 | 6,422,473 |
| Shares converted into Class A (See Note 1) | 2,897 | 35,644 |
| Net increase (decrease) | 532,016 | $ 6,458,117 |
| Year ended April 30, 2023: | | |
| Shares sold | 1,965,632 | $22,781,235 |
| Shares issued to shareholders in reinvestment of distributions | 79,943 | 904,151 |
| Shares redeemed | (656,085) | (7,574,788) |
| Net increase (decrease) in shares outstanding before conversion | 1,389,490 | 16,110,598 |
| Shares converted into Class A (See Note 1) | 1,891 | 21,668 |
| Net increase (decrease) | 1,391,381 | $16,132,266 |
| |
| 120 | Mainstay ETF Asset Allocation Funds |
| Class C | Shares | Amount |
| Six-month period ended October 31, 2023: | | |
| Shares sold | 1,320 | $ 16,269 |
| Shares redeemed | (681) | (8,221) |
| Net increase (decrease) in shares outstanding before conversion | 639 | 8,048 |
| Shares converted from Class C (See Note 1) | (2,228) | (27,098) |
| Net increase (decrease) | (1,589) | $ (19,050) |
| Year ended April 30, 2023: | | |
| Shares sold | 2,576 | $ 29,341 |
| Shares issued to shareholders in reinvestment of distributions | 216 | 2,440 |
| Shares redeemed | (561) | (6,530) |
| Net increase (decrease) in shares outstanding before conversion | 2,231 | 25,251 |
| Shares converted from Class C (See Note 1) | (1,900) | (21,668) |
| Net increase (decrease) | 331 | $ 3,583 |
| |
| Class I(a) | Shares | Amount |
| Year ended April 30, 2023: | | |
| Shares sold | 5,656 | $ 64,602 |
| Shares issued to shareholders in reinvestment of distributions | 151 | 1,696 |
| Shares redeemed | (196) | (2,291) |
| Net increase (decrease) | 5,611 | $ 64,007 |
| |
| Class R3 | Shares | Amount |
| Six-month period ended October 31, 2023: | | |
| Shares sold | 12,792 | $ 155,405 |
| Shares redeemed | (13) | (154) |
| Net increase (decrease) | 12,779 | $ 155,251 |
| Year ended April 30, 2023: | | |
| Shares sold | 21,476 | $ 247,926 |
| Shares issued to shareholders in reinvestment of distributions | 622 | 7,027 |
| Shares redeemed | (5,214) | (60,043) |
| Net increase (decrease) | 16,884 | $ 194,910 |
| |
| SIMPLE Class | Shares | Amount |
| Six-month period ended October 31, 2023: | | |
| Shares sold | 286,324 | $ 3,457,394 |
| Shares redeemed | (29,454) | (358,172) |
| Net increase (decrease) in shares outstanding before conversion | 256,870 | 3,099,222 |
| Shares converted from SIMPLE Class (See Note 1) | (704) | (8,546) |
| Net increase (decrease) | 256,166 | $ 3,090,676 |
| Year ended April 30, 2023: | | |
| Shares sold | 514,843 | $ 5,920,746 |
| Shares issued to shareholders in reinvestment of distributions | 8,121 | 91,851 |
| Shares redeemed | (50,203) | (589,192) |
| Net increase (decrease) | 472,761 | $ 5,423,405 |
| (a) | No activity during the six-month period ended October 31, 2023. |
MainStay Equity ETF Allocation Fund
| Class A | Shares | Amount |
| Six-month period ended October 31, 2023: | | |
| Shares sold | 779,953 | $ 9,992,251 |
| Shares redeemed | (287,271) | (3,681,870) |
| Net increase (decrease) in shares outstanding before conversion | 492,682 | 6,310,381 |
| Shares converted into Class A (See Note 1) | 1,319 | 17,445 |
| Net increase (decrease) | 494,001 | $ 6,327,826 |
| Year ended April 30, 2023: | | |
| Shares sold | 1,356,954 | $16,425,863 |
| Shares issued to shareholders in reinvestment of distributions | 36,098 | 425,944 |
| Shares redeemed | (512,629) | (6,190,399) |
| Net increase (decrease) in shares outstanding before conversion | 880,423 | 10,661,408 |
| Shares converted into Class A (See Note 1) | 1,808 | 21,760 |
| Net increase (decrease) | 882,231 | $10,683,168 |
| |
Notes to Financial Statements (Unaudited) (continued)
| Class C | Shares | Amount |
| Six-month period ended October 31, 2023: | | |
| Shares sold | 1,097 | $ 14,071 |
| Shares redeemed | (1,748) | (22,643) |
| Net increase (decrease) in shares outstanding before conversion | (651) | (8,572) |
| Shares converted from Class C (See Note 1) | (388) | (4,991) |
| Net increase (decrease) | (1,039) | $ (13,563) |
| Year ended April 30, 2023: | | |
| Shares sold | 2,381 | $ 28,448 |
| Shares issued to shareholders in reinvestment of distributions | 33 | 386 |
| Shares redeemed | (998) | (11,796) |
| Net increase (decrease) in shares outstanding before conversion | 1,416 | 17,038 |
| Shares converted from Class C (See Note 1) | (1,824) | (21,760) |
| Net increase (decrease) | (408) | $ (4,722) |
| |
| Class I(a) | Shares | Amount |
| Year ended April 30, 2023: | | |
| Shares sold | 389 | $ 4,804 |
| Shares issued to shareholders in reinvestment of distributions | 117 | 1,373 |
| Shares redeemed | (3,552) | (40,820) |
| Net increase (decrease) | (3,046) | $ (34,643) |
| |
| Class R3 | Shares | Amount |
| Six-month period ended October 31, 2023: | | |
| Shares sold | 9,647 | $ 121,689 |
| Shares redeemed | (1,411) | (18,527) |
| Net increase (decrease) | 8,236 | $ 103,162 |
| Year ended April 30, 2023: | | |
| Shares sold | 7,075 | $ 85,264 |
| Shares issued to shareholders in reinvestment of distributions | 141 | 1,664 |
| Shares redeemed | (18,147) | (223,350) |
| Net increase (decrease) | (10,931) | $ (136,422) |
| |
| SIMPLE Class | Shares | Amount |
| Six-month period ended October 31, 2023: | | |
| Shares sold | 198,039 | $ 2,527,946 |
| Shares redeemed | (37,320) | (472,570) |
| Net increase (decrease) in shares outstanding before conversion | 160,719 | 2,055,376 |
| Shares converted from SIMPLE Class (See Note 1) | (966) | (12,454) |
| Net increase (decrease) | 159,753 | $ 2,042,922 |
| Year ended April 30, 2023: | | |
| Shares sold | 377,568 | $ 4,530,890 |
| Shares issued to shareholders in reinvestment of distributions | 3,502 | 41,247 |
| Shares redeemed | (37,224) | (454,975) |
| Net increase (decrease) | 343,846 | $ 4,117,162 |
| (a) | No activity during the six-month period ended October 31, 2023. |
MainStay ESG Multi-Asset Allocation Fund
| Class A | Shares | Amount |
| Six-month period ended October 31, 2023: | | |
| Shares sold | 37,872 | $ 343,881 |
| Shares redeemed | (21,543) | (192,049) |
| Net increase (decrease) | 16,329 | $ 151,832 |
| Year ended April 30, 2023: | | |
| Shares sold | 195,321 | $1,692,800 |
| Shares issued to shareholders in reinvestment of distributions | 3,919 | 33,195 |
| Shares redeemed | (19,676) | (173,318) |
| Net increase (decrease) | 179,564 | $1,552,677 |
| |
| Class C(a) | Shares | Amount |
| Year ended April 30, 2023: | | |
| Shares issued to shareholders in reinvestment of distributions | 17 | $ 152 |
| Net increase (decrease) | 17 | $ 152 |
| |
| Class I(a) | Shares | Amount |
| Year ended April 30, 2023: | | |
| Shares issued to shareholders in reinvestment of distributions | 17,851 | $ 151,197 |
| Net increase (decrease) | 17,851 | $ 151,197 |
| |
| Class R3(a) | Shares | Amount |
| Year ended April 30, 2023: | | |
| Shares sold | 2,737 | $ 23,980 |
| Shares issued to shareholders in reinvestment of distributions | 50 | 423 |
| Net increase (decrease) | 2,787 | $ 24,403 |
| |
| 122 | Mainstay ETF Asset Allocation Funds |
| SIMPLE Class | Shares | Amount |
| Six-month period ended October 31, 2023: | | |
| Shares sold | 14,826 | $ 131,955 |
| Shares redeemed | (842) | (7,372) |
| Net increase (decrease) | 13,984 | $ 124,583 |
| Year ended April 30, 2023: | | |
| Shares sold | 23,250 | $ 201,649 |
| Shares issued to shareholders in reinvestment of distributions | 285 | 2,415 |
| Shares redeemed | (1,080) | (10,306) |
| Net increase (decrease) | 22,455 | $ 193,758 |
| (a) | No activity during the six-month period ended October 31, 2023. |
Note 10–Other Matters
As of the date of this report, the Funds face a heightened level of risk associated with current uncertainty, volatility and state of economies, financial markets, rising interest rates, and labor and health conditions around the world. Events such as war, acts of terrorism, recessions, rapid inflation, the imposition of international sanctions, earthquakes, hurricanes, epidemics and pandemics and other unforeseen natural or human disasters may have broad adverse social, political and economic effects on the global economy, which could negatively impact the value of the Funds' investments. Developments that disrupt global economies and financial markets may magnify factors that affect the Funds' performance.
Note 11–Subsequent Events
In connection with the preparation of the financial statements of the ETF Allocation Funds as of and for the six-month period ended October 31, 2023, events and transactions subsequent to October 31, 2023, through the date the financial statements were issued have been evaluated by the Manager for possible adjustment and/or disclosure. No subsequent events requiring financial statement adjustment or disclosure have been identified, other than the following:
At a meeting held on December 6-7, 2023, the Board, after careful consideration of a number of factors and upon the recommendation of New York Life Investments, approved a proposal to liquidate the MainStay Defensive ETF Allocation Fund and MainStay ESG Multi-Asset Allocation Fund, on or about February 28, 2024, pursuant to the terms of plans of liquidation.
Proxy Voting Policies and Procedures and Proxy Voting Record
Each ETF Allocation Fund is required to file with the SEC its proxy voting record for the 12-month period ending June 30 on Form N-PX. A description of the policies and procedures that are used to vote proxies relating to portfolio securities of each ETF Allocation Fund is available free of charge upon request by calling 800-624-6782 or visiting the SEC’s website at www.sec.gov. The most recent Form N-PX or proxy voting record is available free of charge upon request by calling 800-624-6782; visiting newyorklifeinvestments.com; or visiting the SEC’s website at www.sec.gov.
Shareholder Reports and Quarterly Portfolio Disclosure
Each ETF Allocation Fund is required to file its complete schedule of portfolio holdings with the SEC 60 days after its first and third fiscal quarter on Form N-PORT. The ETF Allocation Funds' holdings report is available free of charge upon request by calling New York Life Investments at 800-624-6782.
| 124 | Mainstay ETF Asset Allocation Funds |
This page intentionally left blank.
This page intentionally left blank.
Equity
U.S. Equity
MainStay Epoch U.S. Equity Yield Fund
MainStay Fiera SMID Growth Fund
MainStay PineStone U.S. Equity Fund
MainStay S&P 500 Index Fund
MainStay Winslow Large Cap Growth Fund
MainStay WMC Enduring Capital Fund
MainStay WMC Growth Fund
MainStay WMC Small Companies Fund
MainStay WMC Value Fund
International Equity
MainStay Epoch International Choice Fund
MainStay PineStone International Equity Fund
MainStay WMC International Research Equity Fund
Emerging Markets Equity
MainStay Candriam Emerging Markets Equity Fund
Global Equity
MainStay Epoch Capital Growth Fund
MainStay Epoch Global Equity Yield Fund
MainStay PineStone Global Equity Fund
Fixed Income
Taxable Income
MainStay Candriam Emerging Markets Debt Fund
MainStay Floating Rate Fund
MainStay MacKay High Yield Corporate Bond Fund
MainStay MacKay Short Duration High Yield Fund
MainStay MacKay Strategic Bond Fund
MainStay MacKay Total Return Bond Fund
MainStay MacKay U.S. Infrastructure Bond Fund
MainStay Short Term Bond Fund
Tax-Exempt Income
MainStay MacKay California Tax Free Opportunities Fund1
MainStay MacKay High Yield Municipal Bond Fund
MainStay MacKay New York Tax Free Opportunities Fund2
MainStay MacKay Short Term Municipal Fund
MainStay MacKay Strategic Municipal Allocation Fund
MainStay MacKay Tax Free Bond Fund
Money Market
MainStay Money Market Fund
Mixed Asset
MainStay Balanced Fund
MainStay Income Builder Fund
MainStay MacKay Convertible Fund
Speciality
MainStay CBRE Global Infrastructure Fund
MainStay CBRE Real Estate Fund
MainStay Cushing MLP Premier Fund
Asset Allocation
MainStay Conservative Allocation Fund
MainStay Conservative ETF Allocation Fund
MainStay Defensive ETF Allocation Fund
MainStay Equity Allocation Fund
MainStay Equity ETF Allocation Fund
MainStay ESG Multi-Asset Allocation Fund
MainStay Growth Allocation Fund
MainStay Growth ETF Allocation Fund
MainStay Moderate Allocation Fund
MainStay Moderate ETF Allocation Fund
Manager
New York Life Investment Management LLC
New York, New York
Subadvisors
Candriam3
Strassen, Luxembourg
CBRE Investment Management Listed Real Assets LLC
Radnor, Pennsylvania
Cushing Asset Management, LP
Dallas, Texas
Epoch Investment Partners, Inc.
New York, New York
Fiera Capital Inc.
New York, New York
IndexIQ Advisors LLC3
New York, New York
MacKay Shields LLC3
New York, New York
NYL Investors LLC3
New York, New York
PineStone Asset Management Inc.
Montreal, Québec
Wellington Management Company LLP
Boston, Massachusetts
Winslow Capital Management, LLC
Minneapolis, Minnesota
Legal Counsel
Dechert LLP
Washington, District of Columbia
Independent Registered Public Accounting Firm
KPMG LLP
Philadelphia, Pennsylvania
Distributor
NYLIFE Distributors LLC3
Jersey City, New Jersey
Custodian
JPMorgan Chase Bank, N.A.
New York, New York
1.
This Fund is registered for sale in AZ, CA, NV, OR, TX, UT, WA and MI (Class A and Class I shares only), and CO, FL, GA, HI, ID, MA, MD, NH, NJ and NY (Class I shares only).
| 2. | This Fund is registered for sale in CA, CT, DE, FL, MA, NJ, NY and VT. |
| 3. | An affiliate of New York Life Investment Management LLC. |
Not part of the Semiannual Report
For more information
800-624-6782
newyorklifeinvestments.com
“New York Life Investments” is both a service mark, and the common trade name, of certain investment advisors affiliated with New York Life Insurance Company. The MainStay Funds® are managed by New York Life Investment Management LLC and distributed by NYLIFE Distributors LLC, 30 Hudson Street, Jersey City, NJ 07302, a wholly owned subsidiary of New York Life Insurance Company. NYLIFE Distributors LLC is a Member FINRA/SIPC.
©2023 NYLIFE Distributors LLC. All rights reserved.
| 5013904MS139-23 | MSAAETF10-12/23 |
(NYLIM) NL486
Item 2. Code of Ethics.
Not applicable.
| Item 3. | Audit Committee Financial Expert. |
Not applicable.
| Item 4. | Principal Accountant Fees and Services. |
Not applicable.
| Item 5. | Audit Committee of Listed Registrants. |
Not applicable.
The Schedule of Investments is included as part of Item 1 of this report.
| Item 7. | Disclosure of Proxy Voting Policies and Procedures for Closed-End Management Investment Companies. |
Not applicable.
| Item 8. | Portfolio Managers of Closed-End Management Investment Companies. |
Not applicable.
| Item 9. | Purchases of Equity Securities by Closed-End Management Investment Company and Affiliated Purchasers. |
Not applicable.
| Item 10. | Submission of Matters to a Vote of Security Holders. |
Since the Registrant’s last response to this Item, there have been no material changes to the procedures by which shareholders may recommend nominees to the Registrant’s Board of Trustees.
Item 11. Controls and Procedures.
| (a) | Based on an evaluation of the Registrant’s Disclosure Controls and Procedures (as defined in Rule 30a-3(c) under the Investment Company Act of 1940) (the “Disclosure Controls”), as of a date within 90 days prior to the filing date (the “Filing Date”) of this Form N-CSR (the “Report”), the Registrant’s principal executive officer and principal financial officer have concluded that the Disclosure Controls are reasonably designed to ensure that information required to be disclosed by the Registrant in the Report is recorded, processed, summarized and reported by the Filing Date, including ensuring that information required to be disclosed in the Report is accumulated and communicated to the Registrant’s management, including the Registrant’s principal executive officer and principal financial officer, as appropriate to allow timely decisions regarding required disclosure. |
| (b) | There were no changes in the Registrant’s internal control over financial reporting (as defined in Rule 30a-3(d)) under the Investment Company Act of 1940 that occurred during the period covered by this report that has materially affected, or is reasonably likely to materially affect, the Registrant’s internal control over financial reporting. |
| Item 12. | Disclosure of Securities Lending Activities for Closed-End Management Investment Companies. |
Not applicable.
(a) Section 302 Certifications are attached.
(b) Section 906 Certifications are attached.
SIGNATURES
Pursuant to the requirements of the Securities Exchange Act of 1934 and the Investment Company Act of 1940, the Registrant has duly caused this Report to be signed on its behalf by the undersigned, thereunto duly authorized.
MAINSTAY FUNDS TRUST
| | |
| By: | | /s/ Kirk C. Lehneis |
| | Kirk C. Lehneis President and Principal Executive Officer |
| |
| Date: | | January 5, 2024 |
Pursuant to the requirements of the Securities Exchange Act of 1934 and the Investment Company Act of 1940, this Report has been signed below by the following persons on behalf of the Registrant and in the capacities and on the dates indicated.
| | |
| By: | | /s/ Kirk C. Lehneis |
| | Kirk C. Lehneis President and Principal Executive Officer |
| |
| Date: | | January 5, 2024 |
| |
| By: | | /s/ Jack R. Benintende |
| | Jack R. Benintende Treasurer and Principal Financial and Accounting Officer |
| |
| Date: | | January 5, 2024 |