Washington, D.C. 20549
Gifford R. Zimmerman
Form N-CSR is to be used by management investment companies to file reports with the Commission not later than 10 days after the transmission to stockholders of any report that is required to be transmitted to stockholders under Rule 30e-1 under the Investment Company Act of 1940 (17 CFR 270.30e-1). The Commission may use the information provided on Form N-CSR in its regulatory, disclosure review, inspection, and policymaking roles.
A registrant is required to disclose the information specified by Form N-CSR, and the Commission will make this information public. A registrant is not required to respond to the collection of information contained in Form N-CSR unless the Form displays a currently valid Office of Management and Budget (“OMB”) control number. Please direct comments concerning the accuracy of the information collection burden estimate and any suggestions for reducing the burden to Secretary, Securities and Exchange Commission, 450 Fifth Street, NW, Washington, DC 20549-0609. The OMB has reviewed this collection of information under the clearance requirements of 44 U.S.C. ss. 3507.
ITEM 1. REPORTS TO STOCKHOLDERS.
Life is Complex
Nuveen makes things e-simple.
It only takes a minute to sign up for e-Reports. Once enrolled, you'll receive an e-mail as soon as your Nuveen Fund information is ready—no more waiting for delivery by regular mail. Just click on the link within the e-mail to see the report and save it on your computer if you wish.
Free e-Reports right to your e-mail!
www.investordelivery.com
If you receive your Nuveen Fund dividends and statements from your financial advisor or brokerage account.
or
www.nuveen.com/accountaccess
If you receive your Nuveen Fund dividends and statements directly from Nuveen.
Table of Contents
| Chairman's Letter to Shareholders | 4 |
| | |
| Portfolio Managers' Comments | 5 |
| | |
| Fund Leverage | 10 |
| | |
| Share Information | 11 |
| | |
| Risk Considerations | 13 |
| | |
| Performance Overview and Holding Summaries | 14 |
| | |
| Shareholder Meeting Report | 22 |
| | |
| Report of Independent Registered Public Accounting Firm | 23 |
| | |
| Portfolios of Investments | 24 |
| | |
| Statement of Assets and Liabilities | 72 |
| | |
| Statement of Operations | 73 |
| | |
| Statement of Changes in Net Assets | 74 |
| | |
| Financial Highlights | 76 |
| | |
| Notes to Financial Statements | 80 |
| | |
| Additional Fund Information | 92 |
| | |
| Glossary of Terms Used in this Report | 93 |
| | |
| Reinvest Automatically, Easily and Conveniently | 95 |
| | |
| Annual Investment Management Agreement Approval Process | 96 |
| | |
| Board Members and Officers | 104 |
Chairman's Letter to Shareholders
Dear Shareholders,
After a sluggish first half of 2016, the U.S. economy gained some momentum in the third quarter. In fact, it was the economy's strongest quarterly acceleration in two years, propelled by healthy consumer spending, a temporary surge in exports and a turnaround in inventories. As the year winds down, 2016 looks on track to deliver the same steady-but-slow growth that has characterized the seven-year recovery.
A year ago, the U.S. Federal Reserve (Fed) took the first step toward policy "normalization" by raising its benchmark interest rate at its December 2015 meeting. Speculation about the Fed's intentions since then has been a strong influence on the markets throughout 2016. After remaining on hold for a year, the Fed judged that the economy's modest growth, the return to "full" employment and an uptick in inflation were sufficient to raise the target rate at the December 2016 meeting.
Global conditions continue to look subdued by comparison. Investors continue to adjust to the idea of a slower Chinese economy, which has helped commodity prices stabilize and lift global inflation expectations. The U.K.'s June 23rd "Brexit" vote to leave the European Union introduced a new set of economic and political uncertainties to the already fragile conditions across Europe. Moreover, there are growing concerns that global central banks' unprecedented efforts to revive growth may be showing signs of fatigue. Interest rates are currently negative in Europe and Japan and near or at zero in the U.S., U.K. and elsewhere; nonetheless, growth has remained subdued.
Since the election, U.S. stocks have rallied strongly on expectations that the Republican controlled Congress and Trump administration will pursue more business friendly policies. But the details have yet to be seen. Given muted global growth, the risk of policy errors by central banks around the world, the unfolding Brexit process and an uncertain political outlook (not just in the U.S. but also in Europe), we anticipate that turbulence remains on the horizon for the time being. In this environment, Nuveen remains committed to both managing downside risks and seeking upside potential. If you're concerned about how resilient your investment portfolio might be, we encourage you to talk to your financial advisor. On behalf of the other members of the Nuveen Fund Board, we look forward to continuing to earn your trust in the months and years ahead.
Sincerely,
William J. Schneider
Chairman of the Board
December 22, 2016
Portfolio Managers' Comments
Nuveen Municipal Value Fund, Inc. (NUV)
Nuveen AMT-Free Municipal Value Fund (NUW)
Nuveen Municipal Income Fund, Inc. (NMI)
Nuveen Enhanced Municipal Value Fund (NEV)
These Funds feature portfolio management by Nuveen Asset Management, LLC (NAM), an affiliate of Nuveen Investments, Inc. Portfolio managers Daniel J. Close, CFA, Christopher L. Drahn, CFA, and Steven M. Hlavin discuss U.S. economic and municipal market conditions, key investment strategies and the twelve-month performance of these four national Funds. Dan has managed NUV and NUW since 2016. Chris assumed portfolio management responsibility for NMI in 2011. Steve has been involved in the management of NEV since its inception in 2009, taking on full portfolio management responsibility in 2010.
Effective May 31, 2016, Tom Spalding retired from NAM and Daniel J. Close, CFA, took over portfolio management responsibilities for NUV and NUW.
What factors affected the U.S. economy and the national municipal market during the twelve-month reporting period ended October 31, 2016?
The restrained pace of growth that has defined the U.S. economic recovery since 2009 continued in the twelve-month reporting period. Growth over the previous four calendar quarters averaged below 2% (annualized), as measured by real gross domestic product (GDP), which is the value of goods and services produced by the nation's economy less the value of the goods and services used up in production, adjusted for price changes. For most of the reporting period, consumer spending remained healthy but was offset by the drag from the inventory cycle, lackluster business spending and weak net exports. As a result, GDP growth stayed below 1.5% from the fourth quarter of 2015 through the second quarter of 2016. However, decent consumer spending, an inventory turnaround and a short-term jump in exports contributed to a more robust gain of 3.2% in the third quarter, as reported by the "second" estimate of the Bureau of Economic Analysis.
| |
| Certain statements in this report are forward-looking statements. Discussions of specific investments are for illustration only and are not intended as recommendations of individual investments. The forward-looking statements and other views expressed herein are those of the portfolio managers as of the date of this report. Actual future results or occurrences may differ significantly from those anticipated in any forward-looking statements, and the views expressed herein are subject to change at any time, due to numerous market and other factors. The Funds disclaim any obligation to update publicly or revise any forward-looking statements or views expressed herein. |
For financial reporting purposes, the ratings disclosed are the highest rating given by one of the following national rating agencies: Standard & Poor's (S&P), Moody's Investors Service, Inc. (Moody's) or Fitch, Inc. (Fitch). This treatment of split-rated securities may differ from that used for other purposes, such as for Fund investment policies. Credit ratings are subject to change. AAA, AA, A and BBB are investment grade ratings, while BB, B, CCC, CC, C and D are below investment grade ratings. Certain bonds backed by U.S. Government or agency securities are regarded as having an implied rating equal to the rating of such securities. Holdings designated N/R are not rated by these national rating agencies. Ratings are not covered by the report of independent registered public accounting firm.
Bond insurance guarantees only the payment of principal and interest on the bond when due, and not the value of the bonds themselves, which will fluctuate with the bond market and the financial success of the issuer and the insurer. Insurance relates specifically to the bonds in the portfolio and not to the share prices of a Fund. No representation is made as to the insurers' ability to meet their commitments.
Refer to the Glossary of Terms Used in this Report for further definition of the terms used within this section.
Portfolio Managers' Comments (continued)
Consumers, whose purchases comprise the largest component of the U.S. economy, benefited from employment growth and firming wages over the twelve-month reporting period. As reported by the Bureau of Labor Statistics, the unemployment rate was little changed at 4.9% in October 2016 from 5.0% in October 2015, and job gains averaged slightly above 200,000 per month for the past twelve months. Although consumer spending gains were rather muted in the latter half of 2015, spending surged in the second quarter of 2016. Although inflation began to accelerate slightly in the reporting period, the overall level remained low, which also contributed to consumers' willingness to buy. The Consumer Price Index (CPI) rose 1.6% over the twelve-month reporting period ended October 2016 on a seasonally adjusted basis, as reported by the U.S. Bureau of Labor Statistics. The core CPI (which excludes food and energy) increased 2.1% during the same period, slightly above the Fed's unofficial longer term inflation objective of 2.0%.
The housing market was another bright spot in the economy. The S&P CoreLogic Case-Shiller U.S. National Home Price Index, which covers all nine U.S. census divisions, recorded a 5.5% annual gain in September 2016 (most recent data available at the time this report was prepared) (effective July 26, 2016, the S&P/Case-Shiller U.S. National Home Price Index was renamed the S&P CoreLogic Case-Shiller U.S. National Home Price Index). The 10-City and 20-City Composites reported year-over-year increases of 4.3% and 5.1%, respectively.
However, business investment remained soft over the reporting period. Corporate earnings growth continued to be constrained by diminished demand expectations amid sluggish U.S. and global growth, the impact of falling commodity prices and a strong U.S. dollar. Additionally, a murky outlook kept capital spending muted. Concerns about financial market turbulence in early 2016, the U.K.'s "Brexit" vote to leave the European Union (EU) and the U.S. presidential election weighed on business sentiment throughout the reporting period.
The consistent growth of the economy prompted the U.S. Federal Reserve (Fed) to raise the Fed funds rate from the zero bound range to a range of 0.25% to 0.50% in December 2015. The widely anticipated move had little impact on the financial markets. Over the remainder of the reporting period, speculation on the timing of future rate hikes drove short-term swings in the markets, including falling bond yields, rallies in the U.S. dollar and bouts of volatility in stock prices. For most of 2016, the Fed kept this rate unchanged due to concerns ranging from low inflation in the U.S. to weakening growth prospects globally and the U.K.'s Brexit vote. However, the third quarter's strong GDP report and an uptick in inflation boosted expectations that the Fed would likely increase the target rate at the December 2016 meeting. As anticipated, subsequent to the close of the reporting period, the Fed raised the rate to a range of 0.50% to 0.75%.
Other market-moving events during the reporting period included a spike in volatility in January and February 2016 triggered by deteriorating sentiment about China's economy, another sharp downturn in oil prices and concerns about central bank policy both in the U.S. and around the world. The Brexit referendum on June 23 also caught investors off guard. In response, U.K. sterling fell to 30-year lows and global equities tumbled while perceived safe-haven assets such as gold, the U.S. dollar and government bonds saw large inflows. However, the markets stabilized fairly quickly post-Brexit vote, buoyed by reassurances from global central banks and a perception that the temporary price rout presented an attractive buying opportunity. Following a relatively calm July and August 2016, volatility resumed in the final months of the reporting period. Investors worried whether central banks were reaching the limits of their effectiveness as global growth continues to stagnate. The health of the European banking sector came into question, renewing concerns about the potential to trigger a wider crisis. Political uncertainty increased leading up to the November U.S. presidential election, and after the close of the reporting period, the unexpected win of Donald Trump contributed to an initial sell-off across global markets. However, after digesting the "shock", U. S. equities rallied strongly and global developed market stocks pared their losses, while emerging markets, fixed income and gold remained lower.
The broad municipal bond market performed well during the twelve-month reporting period, supported by falling interest rates, a favorable supply-demand balance and generally improving credit fundamentals. Although interest rates began to drift higher in the final month of the reporting period in anticipation of a possible Fed rate hike in December, they still ended at lower than where they started the reporting period. The largest declines were in longer-dated bond yields, while yields on the short end (zero to four years) of the yield curve increased, driven by anticipation of new money market fund regulations that triggered volatility in short-term rates. This caused the municipal yield curve to flatten over the reporting period.
The demand for municipal bonds continued to outpace supply. During the reporting period, municipal bond gross issuance nationwide totaled $435.6 billion, a 2.9% gain from the issuance for the twelve-month period ended October 31, 2015. Gross issuance remains robust as issuers continue to actively and aggressively refund their outstanding debt given the very low interest rate environment. In these transactions the issuers are issuing new bonds and taking the bond proceeds and redeeming (calling) old bonds. These refunding transactions have ranged from 40%-60% of total issuance over the past few years. Thus, the net issuance (all bonds issued less bonds redeemed) is actually much lower than the gross issuance. In fact, the total municipal bonds outstanding has actually declined in each of the past four calendar years. So, the gross is surging, but the net is not and this has been an overall positive technical factor on municipal bond investment performance.
While supply has tightened, investor demand for municipal bonds has risen. Municipal bond mutual funds reported net inflows in 2015, and the inflows for the first four months of 2016 had already exceeded 2015's total volume for the year. The bouts of heightened volatility across other risky assets, uncertainty about the Fed's rate increases and the low to negative yields of European and Asian bonds have bolstered the appeal of municipal bonds' risk-adjusted returns and tax-equivalent yields. The municipal bond market is less directly influenced by the Fed's rate adjustments and its demand base is largely comprised of U.S. investors, factors which have helped municipal bonds deliver relatively attractive returns with less volatility than other market segments.
The fundamental backdrop also remained favorable for municipal bonds. Despite the U.S. economy's rather sluggish recovery, improving state and local balance sheets have contributed to generally good credit fundamentals. Higher tax revenue growth, better expense management and a more cautious approach to new debt issuance have led to credit upgrades and stable credit outlooks for many state and local issuers. While some pockets of weakness continued to grab headlines, including Illinois, New Jersey and Puerto Rico, their problems were largely contained, with minimal spillover into the broader municipal market.
What key strategies were used to manage these Funds during the twelve-month reporting period ended October 31, 2016?
Municipal market conditions remained favorable during the reporting period, supported by positive technical factors, stable credit fundamentals for municipal issuers and a backdrop of moderate economic growth and low inflation. During this time, we continued to take a bottom-up approach to discovering sectors that appeared undervalued as well as individual bonds that we believed had the potential to perform well over the long term.
Our trading activity continued to focus on pursuing the Funds' investment objectives. We continued to seek bonds in areas of the market that we expected to perform well as the economy continued to improve. The Funds' positioning emphasized intermediate and longer maturities, lower rated credits and sectors offering higher yields. To fund these purchases, we generally reinvested the proceeds from called and maturing bonds. In some cases, we sold bonds that we believed had deteriorating fundamentals or could be traded for a better relative value.
NUV was an active buyer during this reporting period, with positions added across roughly a dozen sectors and a mix of new issue and secondary market purchases. The majority of NUV's purchases were from the longer part of the intermediate maturity range. We also bought a smaller portion of very short dated (weekly) securities as a source of short-term liquidity to be deployed when new long-term opportunities arise. While called and maturing bonds provided most of the proceeds to fund these buys, we also sold NUV's remaining holdings in Puerto Rico bonds and eliminated its holding of American Airlines common stock. The Fund received American Airlines stock when its holding of bonds issued by Puerto Rico Ports Authority for American Airlines was converted into equity as part of the merger with US Airways, which was completed in December 2013. Over time, we have sold the shares (completing the sale of the position during this reporting period) and reinvested the proceeds into municipal bonds.
NUW invested in airport, dedicated tax and ports bonds. Like NUV, we also bought weekly securities in NUW. The cash to buy these bonds came primarily from calls and maturities, as well as the elimination of a position in Virgin Islands Diageo bonds. NMI added modestly to its tobacco and health care holdings, and call activity and maturities were fairly light for the Fund during this reporting period. NEV bought bonds issued for industrial development revenue/pollution control revenue (IDR/PCR), tobacco settlement, City
Portfolio Managers' Comments (continued)
of Chicago, higher education and infrastructure projects (airports and toll roads). During this reporting period, NEV generated more proceeds from bond sales than from call activity, which together funded the purchase of new opportunities. We trimmed NEV's Virgin Islands exposure, as well as sold a number of holdings with lower book yields and longer durations. NEV also received cash proceeds from a shelf offering during this reporting period (discussed in the Notes to Financial Statements section of this annual report), which were used to help fund buying activity.
As of October 31, 2016, all of these Funds continued to use inverse floating rate securities. We employ inverse floaters for a variety of reasons, including duration management, income enhancement and total return enhancement.
How did the Funds perform during the twelve-month reporting period ended October 31, 2016?
The tables in each Fund's Performance Overview and Holding Summaries section of this report provide the Funds' total returns for the one-year, five-year, ten-year and since inception periods ended October 31, 2016. Each Fund's total returns at net asset value (NAV) are compared with the performance of a corresponding market index and Lipper classification average.
For the twelve months ended October 31, 2016, the total returns at NAV for all four of these Funds exceeded the return for the national S&P Municipal Bond Index. NUV and NMI outperformed the average return for the Lipper General & Insured Unleveraged Municipal Debt Funds Classification Average and NUW lagged the return for this Lipper average for the twelve-month reporting period. NEV trailed the Lipper General & Insured Leveraged Municipal Debt Funds Classification Average return for the reporting period.
Yield curve and duration positioning was among the influences affecting performance. NUV and NUW were positioned with a "barbell" strategy, with overweight allocations to both the longest and shortest ends of the yield curve while maintaining an underweight to the intermediate portion. During this reporting period, yields rose on the short end of the yield curve but declined for intermediate to longer bonds, resulting in the underperformance of bonds with shorter maturities relative to those with longer maturities. For the NUV, the strong performance of its overweight to longer bonds more than offset the underperformance of its shorter maturities. However, by comparison, NUW's yield curve and duration positioning was a slight detractor from relative performance, due to weighting differences between NUV and NUW. NMI and NEV continued to overweight the longer parts of the yield curve and underweight the shorter end, which was advantageous in this reporting period.
Credit ratings allocations were a positive contributor to all four Funds' performance. Credit spread contraction and investor demand for higher yielding securities continued to support the outperformance of lower rated over higher rated municipal bonds in this reporting period. The Funds were positioned with overweight allocations to the lower quality categories and underweight allocations to the highest quality categories, which was beneficial to performance.
On a sector basis, tobacco was the best performing sector in the broad municipal market over this reporting period. Other revenue supported sectors also continued to lead performance, including health care, long term care and tollroads. All four Funds included exposure to these outperforming sectors, which aided performance. Conversely, the pre-refunded sector and tax-supported categories such as general obligation (GO) bonds were among the weakest performers. The Funds' allocations to pre-refunded bonds were negative for performance during this reporting period.
In addition, the use of leverage was an important positive factor affecting performance of NEV. Leverage is discussed in more detail later in the Fund Leverage section of this report.
An Update Involving Puerto Rico
As noted in the Funds' previous shareholder reports, we continue to monitor situations in the broader municipal market for any impact on the Funds' holdings and performance: the ongoing economic problems of Puerto Rico is one such case. Puerto Rico's continued economic weakening, escalating debt service obligations, and long-standing inability to deliver a balanced budget led to multiple downgrades on its debt over the past two years. Puerto Rico has warned investors since 2014 that the island's debt burden may be unsustainable and the Commonwealth has been exploring various strategies to deal with this burden, including Chapter 9 bankruptcy, which is currently not available by law. On June 30, 2016, President Obama signed the Puerto Rico Oversight, Management and Economic Stability Act (PROMESA) into law. The legislation creates a path for Puerto Rico to establish an independent oversight board responsible for managing the government's financial operations and restructure debt. Implementation is expected to take time, as the law focuses on developing a comprehensive five-year fiscal plan.
In terms of Puerto Rico holdings, shareholders should note that NEV had limited exposure to Puerto Rico debt, 0.62%, which was either insured or investment grade, while NUV, NUW and NMI did not hold any Puerto Rico bonds. The Puerto Rico credits offered higher yields, added diversification and triple exemption (i.e., exemption from most federal, state and local taxes). Puerto Rico general obligation debt is currently rated Caa2/CC/CC (below investment grade) by Moody's, S&P and Fitch, respectively, with negative outlooks.
A Note About Investment Valuations
The municipal securities held by the Funds are valued by the Funds' pricing service using a range of market-based inputs and assumptions. A different municipal pricing service might incorporate different assumptions and inputs into its valuation methodology, potentially resulting in different values for the same securities. These differences could be significant, both as to such individual securities, and as to the value of a given Fund's portfolio in its entirety. Thus, the current net asset value of a Fund's shares may be impacted, higher or lower, if the Fund were to change pricing service, or if its pricing service were to materially change its valuation methodology. On October 4, 2016, the Funds' current municipal bond pricing service was acquired by the parent company of another pricing service. The two services have not yet combined their valuation organizations and process, but may do so in the future. Thus there is an increased risk that the organization acting as each Fund's pricing service may change, or that the Funds' pricing service may change its valuation methodology, either of which could have an impact on the net asset value of each Fund's shares.
Fund Leverage
IMPACT OF THE FUNDS' LEVERAGE STRATEGIES ON PERFORMANCE
One important factor impacting the returns of NEV relative to its comparative benchmark was the Fund's use of leverage through investments in inverse floating rate securities, which represent leveraged investments in underlying bonds. This was also a factor, although less significantly, for NUV, NUW and NMI because their use of leverage is more modest. The Funds use leverage because our research has shown that, over time, leveraging provides opportunities for additional income, particularly in the recent market environment where short-term market rates are at or near historical lows, meaning that the short-term rates the Fund has been paying on its leveraging instruments have been much lower than the interest the Fund has been earning on its portfolio of long-term bonds that it has bought with the proceeds of that leverage. However, use of leverage also can expose the Fund to additional price volatility. When a Fund uses leverage, the Fund will experience a greater increase in its net asset value if the municipal bonds acquired through the use of leverage increase in value, but it will also experience a correspondingly larger decline in its net asset value if the bonds acquired through leverage decline in value, which will make the Fund's net asset value more volatile, and its total return performance more variable over time. In addition, income in levered funds will typically decrease in comparison to unlevered funds when short-term interest rates increase and increase when short-term interest rates decrease. Leverage made a positive contribution to the performance of the Funds over this reporting period.
As of October 31, 2016, the Funds' percentages of leverage are as shown in the accompanying table.
| | NUV | NUW | NMI | NEV | |
| Effective Leverage* | 1.42% | 6.53% | 5.86% | 32.94% | |
| * | Effective Leverage is a Fund's effective economic leverage, and includes both regulatory leverage and the leverage effects of certain derivative and other investments in a Fund's portfolio that increase the Fund's investment exposure. Currently, the leverage effects of Tender Option Bond (TOB) inverse floater holdings are included in effective leverage values. |
Share Information
DISTRIBUTION INFORMATION
The following information regarding the Funds' distributions is current as of October 31, 2016. Each Fund's distribution levels may vary over time based on each Fund's investment activity and portfolio investment value changes.
During the current reporting period, each Fund's distributions to shareholders were as shown in the accompanying table.
| | | Per Share Amounts |
| Ex-Dividend Date | | | NUV | | | NUW | | | NMI | | | NEV | |
| November 2015 | | $ | 0.0325 | | $ | 0.0650 | | $ | 0.0415 | | $ | 0.0800 | |
| December | | | 0.0325 | | | 0.0650 | | | 0.0415 | | | 0.0800 | |
| January | | | 0.0325 | | | 0.0650 | | | 0.0415 | | | 0.0800 | |
| February | | | 0.0325 | | | 0.0650 | | | 0.0415 | | | 0.0800 | |
| March | | | 0.0325 | | | 0.0650 | | | 0.0415 | | | 0.0800 | |
| April | | | 0.0325 | | | 0.0650 | | | 0.0415 | | | 0.0800 | |
| May | | | 0.0325 | | | 0.0650 | | | 0.0415 | | | 0.0800 | |
| June | | | 0.0325 | | | 0.0650 | | | 0.0415 | | | 0.0800 | |
| July | | | 0.0325 | | | 0.0650 | | | 0.0415 | | | 0.0800 | |
| August | | | 0.0325 | | | 0.0650 | | | 0.0415 | | | 0.0800 | |
| September | | | 0.0325 | | | 0.0600 | | | 0.0415 | | | 0.0725 | |
| October 2016 | | | 0.0325 | | | 0.0600 | | | 0.0415 | | | 0.0725 | |
| Total Monthly Per Share Distributions | | $ | 0.3900 | | $ | 0.7700 | | $ | 0.4980 | | $ | 0.9450 | |
| Ordinary Income Distribution* | | $ | 0.0019 | | $ | 0.0152 | | $ | 0.0098 | | $ | 0.0051 | |
| Total Distributions from Net Investment Income | | $ | 0.3919 | | $ | 0.7852 | | $ | 0.5078 | | $ | 0.9501 | |
| | | | | | | | | | | | | | |
| Yields | | | | | | | | | | | | | |
| Market Yield** | | | 3.91 | % | | 4.25 | % | | 4.08 | % | | 5.90 | % |
| Taxable-Equivalent Yield** | | | 5.43 | % | | 5.90 | % | | 5.67 | % | | 8.19 | % |
| * | Distribution paid in December 2015. |
| ** | Market Yield is based on the Fund's current annualized monthly dividend divided by the Fund's current market price as of the end of the reporting period. Taxable-Equivalent Yield represents the yield that must be earned on a fully taxable investment in order to equal the yield of the Fund on an after-tax basis. It is based on a federal income tax rate of 28.0%. When comparing a Fund to investments that generate qualified dividend income, the Taxable-Equivalent Yield is lower. |
Each Fund in this report seeks to pay regular monthly dividends out of its net investment income at a rate that reflects its past and projected net income performance. To permit each Fund to maintain a more stable monthly dividend, the Fund may pay dividends at a rate that may be more or less than the amount of net income actually earned by the Fund during the period. If a Fund has cumulatively earned more than it has paid in dividends, it will hold the excess in reserve as undistributed net investment income (UNII) as part of the Fund's net asset value. Conversely, if a Fund has cumulatively paid in dividends more than it has earned, the excess will constitute a negative UNII that will likewise be reflected in the Fund's net asset value. Each Fund will, over time, pay all its net investment income as dividends to shareholders.
As of October 31, 2016, the Funds had positive UNII balances for tax purposes and positive UNII balances for financial reporting purposes.
Share Information (continued)
All monthly dividends paid by each Fund during the current reporting period were paid from net investment income. If a portion of the Fund's monthly distributions was sourced from or comprised of elements other than net investment income, including capital gains and/or a return of capital, shareholders would have received a notice to that effect. For financial reporting purposes, the composition and per share amounts of each Fund's dividends for the reporting period are presented in this report's Statement of Changes in Net Assets and Financial Highlights, respectively. For income tax purposes, distribution information for each Fund as of its most recent tax year end is presented in Note 6 — Income Tax Information within the Notes to Financial Statements of this report.
EQUITY SHELF PROGRAMS
During the current reporting period, the following Funds were authorized by the Securities and Exchange Commission (SEC) to issue additional shares through an equity shelf program (Shelf Offering). Under these programs, each Fund, subject to market conditions, may raise additional capital from time to time in varying amounts and offering methods at a net price at or above the Fund's NAV per share. During the current fiscal period, each Fund was authorized to issue additional shares under one or more shelf offerings. The total amount of shares authorized under these shelf offerings are as shown in the accompanying table.
| | NUV | NUW | NEV | |
| Additional authorized shares | 19,600,000 | 2,600,000 | 5,200,000 | |
During the current reporting period, each Fund sold common shares through its Shelf Offering at a weighted average premium to its NAV per share as shown in the accompanying table.
| | | NUV | | | NUW | | | NEV | |
| Shares sold through shelf offering | | | 900,076 | | | | 992,372 | | | | 3,842,469 | |
| Weighted average premium to NAV per share sold | | | 1.22 | % | | | 2.34 | % | | | 1.80 | % |
During the current reporting period, NMI and NEV each filed an initial registration statement with the SEC to establish new Shelf Offerings, which are not yet effective.
Refer to Notes to Financial Statements, Note 4 – Fund Shares, Equity Shelf Programs and Offering Costs for further details of Shelf Offerings and each Fund's respective transactions.
SHARE REPURCHASES
During August 2016, the Funds' Board of Directors/Trustees reauthorized an open-market share repurchase program, allowing each Fund to repurchase an aggregate of up to approximately 10% of its outstanding shares.
As of October 31, 2016, and since the inception of the Funds' repurchase programs, the Funds have cumulatively repurchased and retired their outstanding shares as shown in the accompanying table.
| | NUV | NUW | NMI | NEV | |
| Shares cumulatively repurchased and retired | — | — | — | — | |
| Shares authorized for repurchase | 20,645,000 | 1,430,000 | 830,000 | 2,455,000 | |
OTHER SHARE INFORMATION
As of October 31, 2016, and during the current reporting period, the Funds' share prices were trading at a premium/(discount) to their NAVs as shown in the accompanying table.
| | | NUV | | NUW | | NMI | | NEV | |
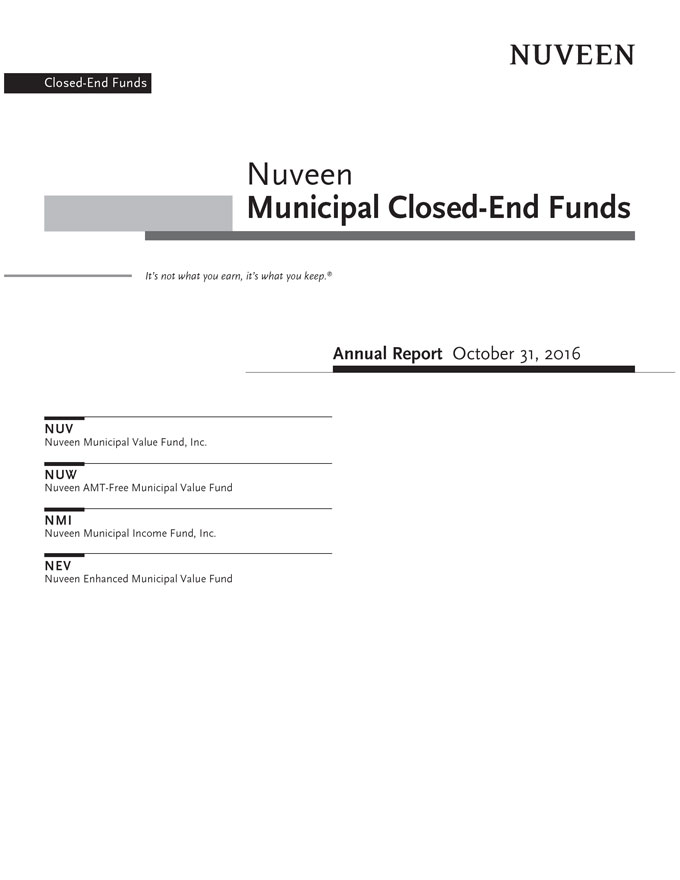
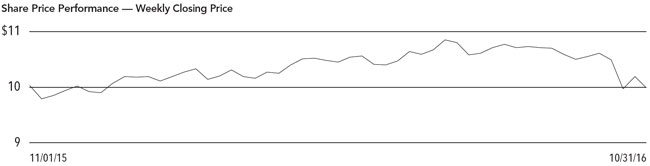
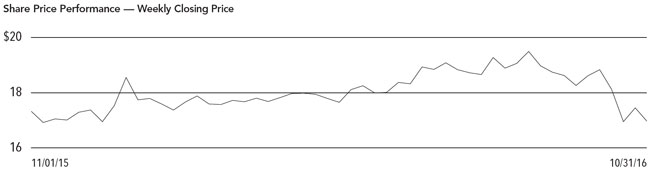
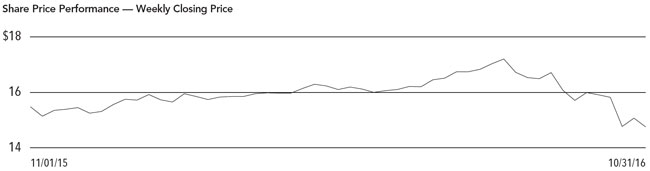
| NAV | | $ | 10.39 | | $ | 17.22 | | $ | 11.61 | | $ | 15.58 | |
| Share price | | $ | 9.98 | | $ | 16.96 | | $ | 12.20 | | $ | 14.75 | |
| Premium/(Discount) to NAV | | | (3.95 | )% | | (1.51 | )% | | 5.08 | % | | (5.33 | )% |
| 12-month average premium/(discount) to NAV | | | (0.81 | )% | | 3.62 | % | | 5.50 | % | | 1.04 | % |
Risk Considerations
Fund shares are not guaranteed or endorsed by any bank or other insured depository institution, and are not federally insured by the Federal Deposit Insurance Corporation.
Nuveen Municipal Value Fund, Inc. (NUV)
Investing in closed-end funds involves risk; principal loss is possible. There is no guarantee the Fund's investment objectives will be achieved. Closed-end fund shares may frequently trade at a discount or premium to their net asset value. Debt or fixed income securities such as those held by the Fund, are subject to market risk, credit risk, interest rate risk, derivatives risk, liquidity risk, and income risk. As interest rates rise, bond prices fall. These and other risk considerations such as tax risk are described in more detail on the Fund's web page at www.nuveen.com/NUV.
Nuveen AMT-Free Municipal Value Fund (NUW)
Investing in closed-end funds involves risk; principal loss is possible. There is no guarantee the Fund's investment objectives will be achieved. Closed-end fund shares may frequently trade at a discount or premium to their net asset value. Debt or fixed income securities such as those held by the Fund, are subject to market risk, credit risk, interest rate risk, derivatives risk, liquidity risk, and income risk. As interest rates rise, bond prices fall. These and other risk considerations such as tax risk are described in more detail on the Fund's web page at www.nuveen.com/NUW.
Nuveen Municipal Income Fund, Inc. (NMI)
Investing in closed-end funds involves risk; principal loss is possible. There is no guarantee the Fund's investment objectives will be achieved. Closed-end fund shares may frequently trade at a discount or premium to their net asset value. Debt or fixed income securities such as those held by the Fund, are subject to market risk, credit risk, interest rate risk, derivatives risk, liquidity risk, and income risk. As interest rates rise, bond prices fall. These and other risk considerations such as tax risk are described in more detail on the Fund's web page at www.nuveen.com/NMI.
Nuveen Enhanced Municipal Value Fund (NEV)
Investing in closed-end funds involves risk; principal loss is possible. There is no guarantee the Fund's investment objectives will be achieved. Closed-end fund shares may frequently trade at a discount or premium to their net asset value. Debt or fixed income securities such as those held by the Fund, are subject to market risk, credit risk, interest rate risk, derivatives risk, liquidity risk, and income risk. As interest rates rise, bond prices fall. Leverage increases return volatility and magnifies the Fund's potential return and its risks; there is no guarantee a fund's leverage strategy will be successful. The Fund uses only inverse floaters for its leverage, increasing its exposure to interest rate risk and credit risk, including counter-party credit risk. These and other risk considerations such as tax risk are described in more detail on the Fund's web page at www.nuveen.com/NEV.
| NUV | |
| | Nuveen Municipal Value Fund, Inc. |
| | Performance Overview and Holding Summaries as of October 31, 2016 |
Refer to the Glossary of Terms Used in this Report for further definition of the terms used within this section.
Average Annual Total Returns as of October 31, 2016
| | Average Annual | |
| | 1-Year | 5-Year | 10-Year | |
| NUV at NAV | 5.74% | 6.02% | 4.83% | |
| NUV at Share Price | 2.91% | 5.25% | 4.71% | |
| S&P Municipal Bond Index | 4.53% | 4.57% | 4.53% | |
| Lipper General & Insured Unleveraged Municipal Debt Funds Classification Average | 5.34% | 5.86% | 4.89% | |
Past performance is not predictive of future results. Current performance may be higher or lower than the data shown. Returns do not reflect the deduction of taxes that shareholders may have to pay on Fund distributions or upon the sale of Fund shares. Returns at NAV are net of Fund expenses, and assume reinvestment of distributions. Comparative index and Lipper return information is provided for the Fund's shares at NAV only. Indexes and Lipper averages are not available for direct investment.
This data relates to the securities held in the Fund's portfolio of investments as of the end of the reporting period. It should not be construed as a measure of performance for the Fund itself. Holdings are subject to change.
For financial reporting purposes, the ratings disclosed are the highest rating given by one of the following national rating agencies: Standard & Poor's Group, Moody's Investors Service, Inc. or Fitch, Inc. This treatment of split-rated securities may differ from that used for other purposes, such as for Fund investment policies. Credit ratings are subject to change. AAA, AA, A and BBB are investment grade ratings; BB, B, CCC, CC, C and D are below-investment grade ratings. Certain bonds backed by U.S. Government or agency securities are regarded as having an implied rating equal to the rating of such securities. Holdings designated N/R are not rated by these national rating agencies.
| Fund Allocation | |
| (% of net assets) | |
| Long-Term Municipal Bonds | 98.8% |
| Corporate Bonds | 0.0% |
| Short-Term Municipal Bonds | 0.9% |
| Other Assets Less Liabilities | 1.0% |
| Net Assets Plus Floating Rate Obligations | 100.7% |
| Floating Rate Obligations | (0.7)% |
| Net Assets | 100% |
| Credit Quality | |
| (% of total investment exposure) | |
| AAA/U.S. Guaranteed | 19.1% |
| AA | 44.7% |
| A | 15.5% |
| BBB | 8.8% |
| BB or Lower | 10.8% |
| N/R (not rated) | 1.1% |
| Total | 100% |
| Portfolio Composition | |
| (% of total investments) | |
| Tax Obligation/Limited | 19.7% |
| Transportation | 17.8% |
| Health Care | 16.6% |
| U.S. Guaranteed | 13.0% |
| Tax Obligation/General | 12.1% |
| Consumer Staples | 7.2% |
| Other | 13.6% |
| Total | 100% |
| States and Territories | |
| (% of total municipal bonds) | |
| Illinois | 14.6% |
| Texas | 13.8% |
| California | 12.6% |
| Florida | 5.8% |
| Colorado | 5.3% |
| Ohio | 5.2% |
| New York | 4.6% |
| New Jersey | 4.3% |
| Michigan | 3.8% |
| Wisconsin | 3.6% |
| Nevada | 3.0% |
| Indiana | 2.8% |
| Virginia | 2.4% |
| Other | 18.2% |
| Total | 100% |
| NUW | |
| | Nuveen AMT-Free Municipal Value Fund |
| | Performance Overview and Holding Summaries as of October 31, 2016 |
Refer to the Glossary of Terms Used in this Report for further definition of the terms used within this section.
Average Annual Total Returns as of October 31, 2016
| | Average Annual | |
| | | | Since | |
| | 1-Year | 5-Year | Inception | |
| NUW at NAV | 4.90% | 5.84% | 7.71% | |
| NUW at Share Price | 2.99% | 4.86% | 6.92% | |
| S&P Municipal Bond Index | 4.53% | 4.57% | 5.56% | |
| Lipper General & Insured Unleveraged Municipal Debt Funds Classification Average | 5.34% | 5.86% | 6.06% | |
Since inception returns are from 2/25/09. Past performance is not predictive of future results. Current performance may be higher or lower than the data shown. Returns do not reflect the deduction of taxes that shareholders may have to pay on Fund distributions or upon the sale of Fund shares. Returns at NAV are net of Fund expenses, and assume reinvestment of distributions. Comparative index and Lipper return information is provided for the Fund's shares at NAV only. Indexes and Lipper averages are not available for direct investment.
This data relates to the securities held in the Fund's portfolio of investments as of the end of the reporting period. It should not be construed as a measure of performance for the Fund itself. Holdings are subject to change.
For financial reporting purposes, the ratings disclosed are the highest rating given by one of the following national rating agencies: Standard & Poor's Group, Moody's Investors Service, Inc. or Fitch, Inc. This treatment of split-rated securities may differ from that used for other purposes, such as for Fund investment policies. Credit ratings are subject to change. AAA, AA, A and BBB are investment grade ratings; BB, B, CCC, CC, C and D are below-investment grade ratings. Certain bonds backed by U.S. Government or agency securities are regarded as having an implied rating equal to the rating of such securities. Holdings designated N/R are not rated by these national rating agencies.
| Fund Allocation | |
| (% of net assets) | |
| Long-Term Municipal Bonds | 99.9% |
| Other Assets Less Liabilities | 3.0% |
| Net Assets Plus Floating Rate Obligations | 102.9% |
| Floating Rate Obligations | (2.9)% |
| Net Assets | 100% |
| Credit Quality | |
| (% of total investment exposure) | |
| AAA/U.S. Guaranteed | 33.5% |
| AA | 32.1% |
| A | 15.3% |
| BBB | 10.5% |
| BB or Lower | 7.4% |
| N/R (not rated) | 1.2% |
| Total | 100% |
| Portfolio Composition | |
| (% of total investments) | |
| U.S. Guaranteed | 29.4% |
| Tax Obligation/Limited | 12.4% |
| Tax Obligation/General | 11.7% |
| Health Care | 10.7% |
| Transportation | 10.7% |
| Utilities | 9.3% |
| Consumer Staples | 6.9% |
| Other | 8.9% |
| Total | 100% |
| States and Territories | |
| (% of total municipal bonds) | |
| California | 13.2% |
| Illinois | 11.7% |
| Florida | 10.0% |
| Indiana | 6.7% |
| Louisiana | 6.5% |
| Texas | 5.8% |
| Wisconsin | 5.8% |
| New Jersey | 5.4% |
| Ohio | 5.4% |
| Colorado | 4.7% |
| Nevada | 4.0% |
| New York | 3.6% |
| Other | 17.2% |
| Total | 100% |
| NMI | |
| | Nuveen Municipal Income Fund, Inc. |
| | Performance Overview and Holding Summaries as of October 31, 2016 |
Refer to the Glossary of Terms Used in this Report for further definition of the terms used within this section.
Average Annual Total Returns as of October 31, 2016
| | Average Annual | |
| | 1-Year | 5-Year | 10-Year | |
| NMI at NAV | 5.71% | 6.50% | 5.60% | |
| NMI at Share Price | 15.22% | 6.85% | 6.69% | |
| S&P Municipal Bond Index | 4.53% | 4.57% | 4.53% | |
| Lipper General & Insured Unleveraged Municipal Debt Funds Classification Average | 5.34% | 5.86% | 4.89% | |
Past performance is not predictive of future results. Current performance may be higher or lower than the data shown. Returns do not reflect the deduction of taxes that shareholders may have to pay on Fund distributions or upon the sale of Fund shares. Returns at NAV are net of Fund expenses, and assume reinvestment of distributions. Comparative index and Lipper return information is provided for the Fund's shares at NAV only. Indexes and Lipper averages are not available for direct investment.
This data relates to the securities held in the Fund's portfolio of investments as of the end of the reporting period. It should not be construed as a measure of performance for the Fund itself. Holdings are subject to change.
For financial reporting purposes, the ratings disclosed are the highest rating given by one of the following national rating agencies: Standard & Poor's Group, Moody's Investors Service, Inc. or Fitch, Inc. This treatment of split-rated securities may differ from that used for other purposes, such as for Fund investment policies. Credit ratings are subject to change. AAA, AA, A and BBB are investment grade ratings; BB, B, CCC, CC, C and D are below-investment grade ratings. Certain bonds backed by U.S. Government or agency securities are regarded as having an implied rating equal to the rating of such securities. Holdings designated N/R are not rated by these national rating agencies.
| Fund Allocation | |
| (% of net assets) | |
| Long-Term Municipal Bonds | 101.4% |
| Other Assets Less Liabilities | (1.4)% |
| Net Assets | 100% |
| Credit Quality | |
| (% of total investment exposure) | |
| AAA/U.S. Guaranteed | 13.7% |
| AA | 24.9% |
| A | 27.5% |
| BBB | 22.0% |
| BB or Lower | 8.2% |
| N/R (not rated) | 3.7% |
| Total | 100% |
| Portfolio Composition | |
| (% of total investments) | |
| Health Care | 20.1% |
| Tax Obligation/General | 12.7% |
| Utilities | 11.7% |
| Tax Obligation/Limited | 10.4% |
| U.S. Guaranteed | 10.0% |
| Transportation | 9.8% |
| Education and Civic Organizations | 9.2% |
| Consumer Staples | 5.5% |
| Other | 10.6% |
| Total | 100% |
| States and Territories | |
| (% of total municipal bonds) | |
| California | 17.5% |
| Texas | 10.1% |
| Illinois | 10.0% |
| Missouri | 8.6% |
| Colorado | 7.9% |
| Wisconsin | 5.7% |
| Florida | 5.4% |
| Ohio | 4.4% |
| New York | 3.7% |
| Pennsylvania | 3.4% |
| Georgia | 2.2% |
| Kentucky | 2.2% |
| Other | 18.9% |
| Total | 100% |
| NEV | |
| | Nuveen Enhanced Municipal Value Fund |
| | Performance Overview and Holding Summaries as of October 31, 2016 |
Refer to the Glossary of Terms Used in this Report for further definition of the terms used within this section.
Average Annual Total Returns as of October 31, 2016
| | Average Annual | |
| | | | Since | |
| | 1-Year | 5-Year | Inception | |
| NEV at NAV | 6.10% | 8.81% | 7.74% | |
| NEV at Share Price | 1.85% | 8.17% | 6.35% | |
| S&P Municipal Bond Index | 4.53% | 4.57% | 4.59% | |
| Lipper General & Insured Leveraged Municipal Debt Funds Classification Average | 7.63% | 8.07% | 6.61% | |
Since inception returns are from 9/25/09. Past performance is not predictive of future results. Current performance may be higher or lower than the data shown. Returns do not reflect the deduction of taxes that shareholders may have to pay on Fund distributions or upon the sale of Fund shares. Returns at NAV are net of Fund expenses, and assume reinvestment of distributions. Comparative index and Lipper return information is provided for the Fund's shares at NAV only. Indexes and Lipper averages are not available for direct investment.
This data relates to the securities held in the Fund's portfolio of investments as of the end of the reporting period. It should not be construed as a measure of performance for the Fund itself. Holdings are subject to change.
For financial reporting purposes, the ratings disclosed are the highest rating given by one of the following national rating agencies: Standard & Poor's Group, Moody's Investors Service, Inc. or Fitch, Inc. This treatment of split-rated securities may differ from that used for other purposes, such as for Fund investment policies. Credit ratings are subject to change. AAA, AA, A and BBB are investment grade ratings; BB, B, CCC, CC, C and D are below-investment grade ratings. Certain bonds backed by U.S. Government or agency securities are regarded as having an implied rating equal to the rating of such securities. Holdings designated N/R are not rated by these national rating agencies.
| Fund Allocation | |
| (% of net assets) | |
| Long-Term Municipal Bonds | 110.6% |
| Common Stocks | 0.8% |
| Short-Term Municipal Bonds | 0.3% |
| Other Assets Less Liabilities | 0.8% |
| Net Assets Plus Floating Rate Obligations | 112.5% |
| Floating Rate Obligations | (12.5)% |
| Net Assets | 100% |
| Credit Quality | |
| (% of total investment exposure) | |
| AAA/U.S. Guaranteed | 15.1% |
| AA | 37.0% |
| A | 17.6% |
| BBB | 12.8% |
| BB or Lower | 11.2% |
| N/R (not rated) | 6.3% |
| Total | 100% |
| Portfolio Composition | |
| (% of total investments) | |
| Health Care | 20.4% |
| Tax Obligation/Limited | 19.5% |
| Transportation | 12.7% |
| U.S. Guaranteed | 8.6% |
| Education and Civic Organizations | 7.7% |
| Utilities | 7.5% |
| Consumer Staples | 5.6% |
| Tax Obligation/General | 5.6% |
| Other | 12.4% |
| Total | 100% |
| States and Territories | |
| (% of total municipal bonds) | |
| California | 13.6% |
| Illinois | 11.5% |
| Ohio | 9.9% |
| Wisconsin | 9.1% |
| Pennsylvania | 6.3% |
| Florida | 5.2% |
| Georgia | 4.0% |
| Texas | 3.9% |
| New Jersey | 3.9% |
| New York | 3.6% |
| Colorado | 3.4% |
| Louisiana | 3.2% |
| Washington | 3.2% |
| Other | 19.2% |
| Total | 100% |
| Shareholder Meeting Report |
The annual meeting of shareholders was held in the offices of Nuveen Investments on August 3, 2016 for NUV, NUW, NMI and NEV; at this meeting the shareholders were asked to elect Board Members.
| | NUV | | NUW | | NMI | | NEV | |
| | Common | | Common | | Common | | Common | |
| | shares | | shares | | shares | | shares | |
| Approval of the Board Members was reached as follows: | | | | | | | | |
| William C. Hunter | | | | | | | | |
| For | 177,664,623 | | 12,649,149 | | 7,219,165 | | 21,558,851 | |
| Withhold | 3,621,456 | | 345,820 | | 232,021 | | 295,576 | |
| Total | 181,286,079 | | 12,994,969 | | 7,451,186 | | 21,854,427 | |
| Judith M. Stockdale | | | | | | | | |
| For | 177,246,696 | | 12,616,695 | | 7,194,902 | | 21,465,360 | |
| Withhold | 4,039,383 | | 378,274 | | 256,284 | | 389,067 | |
| Total | 181,286,079 | | 12,994,969 | | 7,451,186 | | 21,854,427 | |
| Carole E. Stone | | | | | | | | |
| For | 177,497,771 | | 12,639,452 | | 7,212,125 | | 21,483,762 | |
| Withhold | 3,788,308 | | 355,517 | | 239,061 | | 370,665 | |
| Total | 181,286,079 | | 12,994,969 | | 7,451,186 | | 21,854,427 | |
| Margaret L. Wolff | | | | | | | | |
| For | 177,543,763 | | 12,657,263 | | 7,221,662 | | 21,534,319 | |
| Withhold | 3,742,316 | | 337,706 | | 229,524 | | 320,108 | |
| Total | 181,286,079 | | 12,994,969 | | 7,451,186 | | 21,854,427 | |
| Report of Independent Registered Public Accounting Firm |
To the Board of Directors/Trustees and Shareholders of
Nuveen Municipal Value Fund, Inc.
Nuveen AMT-Free Municipal Value Fund
Nuveen Municipal Income Fund, Inc.
Nuveen Enhanced Municipal Value Fund:
We have audited the accompanying statements of assets and liabilities, including the portfolios of investments, of Nuveen Municipal Value Fund, Inc., Nuveen AMT-Free Municipal Value Fund, Nuveen Municipal Income Fund, Inc., and Nuveen Enhanced Municipal Value Fund (the "Funds") as of October 31, 2016, and the related statements of operations for the year then ended, the statements of changes in net assets for each of the years in the two-year period then ended, and the financial highlights for each of the years in the three-year period then ended. These financial statements and financial highlights are the responsibility of the Funds' management. Our responsibility is to express an opinion on these financial statements and financial highlights based on our audits. The financial highlights for the periods presented through October 31, 2013 were audited by other auditors whose report dated December 27, 2013 expressed an unqualified opinion on those financial highlights.
We conducted our audits in accordance with the standards of the Public Company Accounting Oversight Board (United States). Those standards require that we plan and perform the audit to obtain reasonable assurance about whether the financial statements and financial highlights are free of material misstatement. An audit includes examining, on a test basis, evidence supporting the amounts and disclosures in the financial statements. Our procedures included confirmation of securities owned as of October 31, 2016, by correspondence with the custodian and brokers or other appropriate auditing procedures. An audit also includes assessing the accounting principles used and significant estimates made by management, as well as evaluating the overall financial statement presentation. We believe that our audits provide a reasonable basis for our opinion.
In our opinion, the financial statements and financial highlights referred to above present fairly, in all material respects, the financial position of the Funds as of October 31, 2016, the results of their operations for the year then ended, the changes in their net assets for each of the years in the two-year period then ended, and the financial highlights for each of the years in the three-year period then ended, in conformity with U.S. generally accepted accounting principles.
/s/ KPMG LLP
Chicago, Illinois
December 29, 2016
| NUV | | |
| | Nuveen Municipal Value Fund, Inc. | |
| | Portfolio of Investments | October 31, 2016 |
| | Principal | | | Optional Call | | | | | |
| | Amount (000) | | Description (1) | Provisions (2) | | Ratings (3) | | Value | |
| | | | LONG-TERM INVESTMENTS – 98.8% | | | | | | |
| | | | MUNICIPAL BONDS – 98.8% | | | | | | |
| | | | Alaska – 0.1% | | | | | | |
| $ | 2,710 | | Northern Tobacco Securitization Corporation, Alaska, Tobacco Settlement Asset-Backed Bonds, Series 2006A, 5.000%, 6/01/32 | 1/17 at 100.00 | | B3 | $ | 2,659,567 | |
| | | | Arizona – 0.8% | | | | | | |
| | 2,500 | | Phoenix Civic Improvement Corporation, Arizona, Airport Revenue Bonds, Senior Lien Series 2008A, 5.000%, 7/01/38 | 7/18 at 100.00 | | AA– | | 2,653,475 | |
| | 2,575 | | Quechan Indian Tribe of the Fort Yuma Reservation, Arizona, Government Project Bonds, Series 2008, 7.000%, 12/01/27 | 12/17 at 102.00 | | B– | | 2,507,252 | |
| | 5,600 | | Salt Verde Financial Corporation, Arizona, Senior Gas Revenue Bonds, Citigroup Energy Inc Prepay Contract Obligations, Series 2007, 5.000%, 12/01/37 | No Opt. Call | | BBB+ | | 6,732,656 | |
| | 4,240 | | Scottsdale Industrial Development Authority, Arizona, Hospital Revenue Bonds, Scottsdale Healthcare, Series 2006C. Re-offering, 5.000%, 9/01/35 – AGC Insured | 9/20 at 100.00 | | AA | | 4,665,823 | |
| | 14,915 | | Total Arizona | | | | | 16,559,206 | |
| | | | Arkansas – 0.3% | | | | | | |
| | 1,150 | | Benton Washington Regional Public Water Authority, Arkansas, Water Revenue Bonds, Refunding & Improvement Series 2007, 4.750%, 10/01/33 (Pre-refunded 10/01/17) – SYNCORA GTY Insured | 10/17 at 100.00 | | A (4) | | 1,191,986 | |
| | 5,650 | | Fayetteville, Arkansas, Sales and Use Tax Revenue Bonds, Series 2006A, 4.750%, 11/01/18 – AGM Insured | No Opt. Call | | AA | | 5,669,379 | |
| | 6,800 | | Total Arkansas | | | | | 6,861,365 | |
| | | | California – 12.5% | | | | | | |
| | 5,000 | | Alameda Corridor Transportation Authority, California, Revenue Bonds, Refunding Second Subordinate Lien Series 2016B, 5.000%, 10/01/36 | 10/26 at 100.00 | | BBB+ | | 5,833,450 | |
| | 4,615 | | Anaheim Public Financing Authority, California, Lease Revenue Bonds, Public Improvement Project, Series 1997C, 0.000%, 9/01/23 – AGM Insured | No Opt. Call | | AA | | 3,995,205 | |
| | 5,000 | | Bay Area Toll Authority, California, Revenue Bonds, San Francisco Bay Area Toll Bridge, Series 2013S-4, 5.000%, 4/01/38 | 4/23 at 100.00 | | AA– | | 5,849,750 | |
| | 4,800 | | California County Tobacco Securitization Agency, Tobacco Settlement Asset-Backed Bonds, Gold Country Settlement Funding Corporation, Refunding Series 2006, 0.000%, 6/01/33 | 1/17 at 38.96 | | CCC | | 1,854,096 | |
| | | | California County Tobacco Securitization Agency, Tobacco Settlement Asset-Backed Bonds, Los Angeles County Securitization Corporation, Series 2006A: | | | | | | |
| | 3,275 | | 5.450%, 6/01/28 | 12/18 at 100.00 | | B3 | | 3,355,467 | |
| | 4,200 | | 5.600%, 6/01/36 | 12/18 at 100.00 | | B3 | | 4,312,098 | |
| | 1,175 | | California Department of Water Resources, Central Valley Project Water System Revenue Bonds, Refunding Series 2016AW, 5.000%, 12/01/33 | 12/26 at 100.00 | | AAA | | 1,453,075 | |
| | 10,000 | | California Health Facilities Financing Authority, California, Revenue Bonds, Sutter Health, Refunding Series 2016B, 5.000%, 11/15/46 | 11/26 at 100.00 | | AA– | | 11,752,100 | |
| | 3,850 | | California Health Facilities Financing Authority, Revenue Bonds, Saint Joseph Health System, Series 2013A, 5.000%, 7/01/33 | 7/23 at 100.00 | | AA– | | 4,455,451 | |
| | 2,335 | | California Municipal Finance Authority, Revenue Bonds, Eisenhower Medical Center, Series 2010A, 5.750%, 7/01/40 | 7/20 at 100.00 | | Baa2 | | 2,555,004 | |
| | 2,130 | | California Pollution Control Financing Authority, Revenue Bonds, Pacific Gas and Electric Company, Series 2004C, 4.750%, 12/01/23 – FGIC Insured (Alternative Minimum Tax) | 6/17 at 100.00 | | A3 | | 2,175,241 | |
| | 1,625 | | California State Public Works Board, Lease Revenue Bonds, Various Capital Projects, Series 2013I, 5.000%, 11/01/38 | 11/23 at 100.00 | | A+ | | 1,917,549 | |
| | Principal | | | Optional Call | | | | | |
| | Amount (000) | | Description (1) | Provisions (2) | | Ratings (3) | | Value | |
| | | | California (continued) | | | | | | |
| $ | 4,400 | | California State, General Obligation Bonds, Refunding Series 2007, 4.500%, 8/01/30 | 2/17 at 100.00 | | AA– | $ | 4,437,224 | |
| | | | California State, General Obligation Bonds, Various Purpose Series 2007: | | | | | | |
| | 9,730 | | 5.000%, 6/01/37 (Pre-refunded 6/01/17) | 6/17 at 100.00 | | Aaa | | 9,973,347 | |
| | 6,270 | | 5.000%, 6/01/37 (Pre-refunded 6/01/17) | 6/17 at 100.00 | | Aaa | | 6,426,813 | |
| | 5,000 | | California State, General Obligation Bonds, Various Purpose Series 2011, 5.000%, 10/01/41 | 10/21 at 100.00 | | AA– | | 5,773,250 | |
| | 3,645 | | California Statewide Communities Development Authority, California, Revenue Bonds, Loma Linda University Medical Center, Series 2016A, 5.000%, 12/01/41 | 6/26 at 100.00 | | BB | | 4,071,064 | |
| | 275 | | California Statewide Community Development Authority, Certificates of Participation, Internext Group, Series 1999, 5.375%, 4/01/17 | 1/17 at 100.00 | | BBB+ | | 276,144 | |
| | 3,125 | | California Statewide Community Development Authority, Revenue Bonds, Methodist Hospital Project, Series 2009, 6.750%, 2/01/38 (Pre-refunded 8/01/19) | 8/19 at 100.00 | | N/R (4) | | 3,619,156 | |
| | 3,600 | | California Statewide Community Development Authority, Revenue Bonds, St. Joseph Health System, Series 2007A, 5.750%, 7/01/47 (Pre-refunded 7/01/18) – FGIC Insured | 7/18 at 100.00 | | AA– (4) | | 3,894,696 | |
| | 6,120 | | Chino Valley Unified School District, San Bernardino County, California, General Obligation Bonds, Series 2006D, 0.000%, 8/01/30 | 8/17 at 53.63 | | Aa2 | | 3,175,301 | |
| | 5,000 | | Coast Community College District, Orange County, California, General Obligation Bonds, Series 2006C, 5.000%, 8/01/32 (Pre-refunded 8/01/18) – AGM Insured | 8/18 at 100.00 | | Aa1 (4) | | 5,363,400 | |
| | 4,505 | | Covina-Valley Unified School District, Los Angeles County, California, General Obligation Bonds, Series 2003B, 0.000%, 6/01/28 – FGIC Insured | No Opt. Call | | AA– | | 2,996,906 | |
| | 16,045 | | Desert Community College District, Riverside County, California, General Obligation Bonds, Election 2004 Series 2007C, 0.000%, 8/01/33 – AGM Insured | 8/17 at 42.63 | | AA | | 6,770,027 | |
| | 2,180 | | Foothill/Eastern Transportation Corridor Agency, California, Toll Road Revenue Bonds, Refunding Series 2013A, 6.850%, 1/15/42 | 1/31 at 100.00 | | BBB– | | 1,855,115 | |
| | 30,000 | | Foothill/Eastern Transportation Corridor Agency, California, Toll Road Revenue Bonds, Series 1995A, 0.000%, 1/01/22 (ETM) | No Opt. Call | | Aaa | | 27,806,400 | |
| | | | Golden State Tobacco Securitization Corporation, California, Tobacco Settlement Asset-Backed Bonds, Series 2007A-1: | | | | | | |
| | 23,995 | | 4.500%, 6/01/27 | 6/17 at 100.00 | | B | | 24,052,348 | |
| | 14,475 | | 5.000%, 6/01/33 | 6/17 at 100.00 | | B– | | 14,323,302 | |
| | 1,500 | | 5.125%, 6/01/47 | 6/17 at 100.00 | | B– | | 1,454,010 | |
| | | | Merced Union High School District, Merced County, California, General Obligation Bonds, Series 1999A: | | | | | | |
| | 2,500 | | 0.000%, 8/01/23 – FGIC Insured | No Opt. Call | | AA– | | 2,149,200 | |
| | 2,555 | | 0.000%, 8/01/24 – FGIC Insured | No Opt. Call | | AA– | | 2,109,510 | |
| | 2,365 | | Montebello Unified School District, Los Angeles County, California, General Obligation Bonds, Election 1998 Series 2004, 0.000%, 8/01/27 – FGIC Insured | No Opt. Call | | AA– | | 1,738,370 | |
| | | | Mount San Antonio Community College District, Los Angeles County, California, General Obligation Bonds, Election of 2008, Series 2013A: | | | | | | |
| | 3,060 | | 0.000%, 8/01/28 (5) | 2/28 at 100.00 | | AA | | 2,927,930 | |
| | 2,315 | | 0.000%, 8/01/43 (5) | 8/35 at 100.00 | | AA | | 1,913,695 | |
| | 3,550 | | M-S-R Energy Authority, California, Gas Revenue Bonds, Citigroup Prepay Contracts, Series 2009C, 6.500%, 11/01/39 | No Opt. Call | | A | | 4,949,942 | |
| | | | Napa Valley Community College District, Napa and Sonoma Counties, California, General Obligation Bonds, Election 2002 Series 2007C: | | | | | | |
| | 7,200 | | 0.000%, 8/01/29 – NPFG Insured | 8/17 at 54.45 | | Aa2 | | 3,885,696 | |
| | 11,575 | | 0.000%, 8/01/31 – NPFG Insured | 8/17 at 49.07 | | Aa2 | | 5,621,399 | |
| | 2,350 | | Palomar Pomerado Health Care District, California, Certificates of Participation, Series 2009, 6.750%, 11/01/39 (Pre-refunded 11/01/19) | 11/19 at 100.00 | | Ba1 (4) | | 2,735,564 | |
| | 10,150 | | Placer Union High School District, Placer County, California, General Obligation Bonds, Series 2004C, 0.000%, 8/01/33 – AGM Insured | No Opt. Call | | AA | | 5,900,296 | |
| NUV | Nuveen Municipal Value Fund, Inc. | |
| | Portfolio of Investments (continued) | October 31, 2016 |
| | Principal | | | Optional Call | | | | | |
| | Amount (000) | | Description (1) | Provisions (2) | | Ratings (3) | | Value | |
| | | | California (continued) | | | | | | |
| $ | 4,000 | | Rancho Mirage Joint Powers Financing Authority, California, Revenue Bonds, Eisenhower Medical Center, Refunding Series 2007A, 5.000%, 7/01/47 | 7/17 at 100.00 | | Baa2 | $ | 4,076,920 | |
| | 15,505 | | Riverside Public Financing Authority, California, Tax Allocation Bonds, University Corridor, Series 2007C, 5.000%, 8/01/37 – NPFG Insured | 8/17 at 100.00 | | AA– | | 15,874,794 | |
| | | | San Bruno Park School District, San Mateo County, California, General Obligation Bonds, Series 2000B: | | | | | | |
| | 2,575 | | 0.000%, 8/01/24 – FGIC Insured | No Opt. Call | | AA | | 2,176,158 | |
| | 2,660 | | 0.000%, 8/01/25 – FGIC Insured | No Opt. Call | | AA | | 2,165,878 | |
| | 250 | | San Francisco Redevelopment Financing Authority, California, Tax Allocation Revenue Bonds, Mission Bay South Redevelopment Project, Series 2011D, 7.000%, 8/01/41 (Pre-refunded 2/01/21) | 2/21 at 100.00 | | BBB+ (4) | | 311,545 | |
| | 12,095 | | San Joaquin Hills Transportation Corridor Agency, Orange County, California, Toll Road Revenue Bonds, Refunding Series 1997A, 0.000%, 1/15/25 – NPFG Insured | No Opt. Call | | AA– | | 9,457,806 | |
| | 5,000 | | San Jose, California, Airport Revenue Bonds, Series 2007A, 6.000%, 3/01/47 – AMBAC Insured (Alternative Minimum Tax) | 3/17 at 100.00 | | A2 | | 5,077,750 | |
| | 13,220 | | San Mateo County Community College District, California, General Obligation Bonds, Series 2006A, 0.000%, 9/01/28 – NPFG Insured | No Opt. Call | | AAA | | 10,099,287 | |
| | 5,000 | | San Mateo Union High School District, San Mateo County, California, General Obligation Bonds, Election of 2000, Series 2002B, 0.000%, 9/01/24 – FGIC Insured | No Opt. Call | | Aaa | | 4,267,750 | |
| | 5,815 | | San Ysidro School District, San Diego County, California, General Obligation Bonds, Refunding Series 2015, 0.000%, 8/01/48 | No Opt. Call | | AA | | 1,273,427 | |
| | 2,000 | | Tobacco Securitization Authority of Northern California, Tobacco Settlement Asset-Backed Bonds, Refunding Series 2005A-2, 5.400%, 6/01/27 | 6/17 at 100.00 | | B+ | | 2,002,860 | |
| | | | University of California, General Revenue Bonds, Series 2009O: | | | | | | |
| | 370 | | 5.250%, 5/15/39 (Pre-refunded 5/15/19) | 5/19 at 100.00 | | N/R (4) | | 411,103 | |
| | 720 | | 5.250%, 5/15/39 (Pre-refunded 5/15/19) | 5/19 at 100.00 | | AA (4) | | 798,494 | |
| | 210 | | 5.250%, 5/15/39 (Pre-refunded 5/15/19) | 5/19 at 100.00 | | N/R (4) | | 232,894 | |
| | 304,910 | | Total California | | | | | 267,935,257 | |
| | | | Colorado – 5.3% | | | | | | |
| | 5,000 | | Arkansas River Power Authority, Colorado, Power Revenue Bonds, Series 2006, 5.250%, 10/01/40 – SYNCORA GTY Insured | 1/17 at 100.00 | | BBB– | | 5,010,450 | |
| | 5,200 | | Colorado Health Facilities Authority, Colorado, Revenue Bonds, Catholic Health Initiatives, Series 2006A, 4.500%, 9/01/38 | 1/17 at 100.00 | | A– | | 5,214,092 | |
| | 7,105 | | Colorado Health Facilities Authority, Colorado, Revenue Bonds, Catholic Health Initiatives, Series 2013A, 5.250%, 1/01/45 | 1/23 at 100.00 | | A– | | 7,928,683 | |
| | 1,700 | | Colorado Health Facilities Authority, Colorado, Revenue Bonds, Poudre Valley Health System, Series 2005C, 5.250%, 3/01/40 – AGM Insured | 9/18 at 102.00 | | AA | | 1,825,919 | |
| | 2,845 | | Colorado Health Facilities Authority, Colorado, Revenue Bonds, Sisters of Charity of Leavenworth Health Services Corporation, Refunding Composite Deal Series 2010B, 5.000%, 1/01/21 | 1/20 at 100.00 | | AA– | | 3,192,175 | |
| | 15,925 | | Colorado Health Facilities Authority, Colorado, Revenue Bonds, Sisters of Charity of Leavenworth Health Services Corporation, Series 2010A, 5.000%, 1/01/40 | 1/20 at 100.00 | | AA– | | 17,409,051 | |
| | 750 | | Colorado Health Facilities Authority, Revenue Bonds, Longmont United Hospital, Series 2006B, 5.000%, 12/01/23 (Pre-refunded 12/01/16) – RAAI Insured | 12/16 at 100.00 | | AA (4) | | 752,677 | |
| | 2,000 | | Colorado State Board of Governors, Colorado State University Auxiliary Enterprise System Revenue Bonds, Series 2012A, 5.000%, 3/01/41 | 3/22 at 100.00 | | Aa2 | | 2,281,380 | |
| | | | Denver City and County, Colorado, Airport System Revenue Bonds, Series 2012B: | | | | | | |
| | 2,750 | | 5.000%, 11/15/25 | No Opt. Call | | A+ | | 3,294,032 | |
| | 2,200 | | 5.000%, 11/15/29 | 11/22 at 100.00 | | A+ | | 2,591,996 | |
| | 5,160 | | Denver City and County, Colorado, Airport System Revenue Bonds, Subordinate Lien Series 2013B, 5.000%, 11/15/43 | 11/23 at 100.00 | | A | | 5,877,085 | |
| | Principal | | | Optional Call | | | | | |
| | Amount (000) | | Description (1) | Provisions (2) | | Ratings (3) | | Value | |
| | | | Colorado (continued) | | | | | | |
| | | | E-470 Public Highway Authority, Colorado, Senior Revenue Bonds, Series 2000B: | | | | | | |
| $ | 9,660 | | 0.000%, 9/01/29 – NPFG Insured | No Opt. Call | | AA– | $ | 6,485,917 | |
| | 24,200 | | 0.000%, 9/01/31 – NPFG Insured | No Opt. Call | | AA– | | 14,990,448 | |
| | 17,000 | | 0.000%, 9/01/32 – NPFG Insured | No Opt. Call | | AA– | | 10,116,870 | |
| | 7,600 | | E-470 Public Highway Authority, Colorado, Toll Revenue Bonds, Refunding Series 2006B, 0.000%, 9/01/39 – NPFG Insured | 9/26 at 52.09 | | AA– | | 2,706,588 | |
| | | | E-470 Public Highway Authority, Colorado, Toll Revenue Bonds, Series 2004B: | | | | | | |
| | 7,700 | | 0.000%, 9/01/27 – NPFG Insured | 9/20 at 67.94 | | AA– | | 4,606,371 | |
| | 10,075 | | 0.000%, 3/01/36 – NPFG Insured | 9/20 at 41.72 | | AA– | | 3,628,310 | |
| | 5,000 | | Ebert Metropolitan District, Colorado, Limited Tax General Obligation Bonds, Series 2007, 5.350%, 12/01/37 (Pre-refunded 12/01/17) – RAAI Insured | 12/17 at 100.00 | | AA (4) | | 5,250,350 | |
| | 5,000 | | Rangely Hospital District, Rio Blanco County, Colorado, General Obligation Bonds, Refunding Series 2011, 6.000%, 11/01/26 | 11/21 at 100.00 | | Baa1 | | 5,897,100 | |
| | 3,750 | | Regional Transportation District, Colorado, Denver Transit Partners Eagle P3 Project Private Activity Bonds, Series 2010, 6.000%, 1/15/41 | 7/20 at 100.00 | | BBB+ | | 4,267,912 | |
| | 140,620 | | Total Colorado | | | | | 113,327,406 | |
| | | | Connecticut – 0.1% | | | | | | |
| | 1,500 | | Connecticut Health and Educational Facilities Authority, Revenue Bonds, Hartford HealthCare, Series 2011A, 5.000%, 7/01/41 | 7/21 at 100.00 | | A | | 1,641,645 | |
| | 8,696 | | Mashantucket Western Pequot Tribe, Connecticut, Special Revenue Bonds, Subordinate Series 2013A, 6.050%, 7/01/31, PIK, (6) | No Opt. Call | | N/R | | 338,891 | |
| | 10,196 | | Total Connecticut | | | | | 1,980,536 | |
| | | | District of Columbia – 0.6% | | | | | | |
| | 15,000 | | District of Columbia Tobacco Settlement Corporation, Tobacco Settlement Asset-Backed Bonds, Series 2006A, 0.000%, 6/15/46 | 1/17 at 16.33 | | N/R | | 1,919,250 | |
| | 10,000 | | Washington Convention Center Authority, District of Columbia, Dedicated Tax Revenue Bonds, Senior Lien Refunding Series 2007A, 4.500%, 10/01/30 – AMBAC Insured | 1/17 at 100.00 | | A1 | | 10,025,900 | |
| | 25,000 | | Total District of Columbia | | | | | 11,945,150 | |
| | | | Florida – 5.8% | | | | | | |
| | 3,000 | | Cape Coral, Florida, Water and Sewer Revenue Bonds, Refunding Series 2011, 5.000%, 10/01/41 – AGM Insured | 10/21 at 100.00 | | AA | | 3,457,380 | |
| | 565 | | Florida Development Finance Corporation, Educational Facilities Revenue Bonds, Renaissance Charter School Income Projects, Series 2015A, 6.000%, 6/15/35 | 6/25 at 100.00 | | N/R | | 591,256 | |
| | 2,845 | | Greater Orlando Aviation Authority, Florida, Airport Facilities Revenue Bonds, Refunding Series 2009C, 5.000%, 10/01/34 (Pre-refunded 10/01/19) | 10/19 at 100.00 | | AA– (4) | | 3,174,337 | |
| | 2,290 | | Hillsborough County Aviation Authority, Florida, Revenue Bonds, Tampa International Airport, Subordinate Lien Series 2015B, 5.000%, 10/01/40 | 10/24 at 100.00 | | A+ | | 2,629,676 | |
| | 5,000 | | Marion County Hospital District, Florida, Revenue Bonds, Munroe Regional Medical Center, Refunding and Improvement Series 2007, 5.000%, 10/01/34 (Pre-refunded 10/01/17) | 10/17 at 100.00 | | BBB+ (4) | | 5,195,850 | |
| | 5,090 | | Miami-Dade County Expressway Authority, Florida, Toll System Revenue Bonds, Series 2010A, 5.000%, 7/01/40 | 7/20 at 100.00 | | A | | 5,699,018 | |
| | 9,500 | | Miami-Dade County Health Facility Authority, Florida, Hospital Revenue Bonds, Miami Children’s Hospital, Series 2010A, 6.000%, 8/01/46 | 8/21 at 100.00 | | A+ | | 10,977,725 | |
| | 2,000 | | Miami-Dade County, Florida, Aviation Revenue Bonds, Miami International Airport, Refunding Series 2014B, 5.000%, 10/01/37 | 10/24 at 100.00 | | A | | 2,333,620 | |
| | 6,000 | | Miami-Dade County, Florida, Aviation Revenue Bonds, Miami International Airport, Series 2009B, 5.500%, 10/01/36 (Pre-refunded 10/01/19) | 10/19 at 100.00 | | A (4) | | 6,767,700 | |
| | 4,000 | | Miami-Dade County, Florida, Aviation Revenue Bonds, Miami International Airport, Series 2010B, 5.000%, 10/01/29 | 10/20 at 100.00 | | A | | 4,535,840 | |
| NUV | Nuveen Municipal Value Fund, Inc. | |
| | Portfolio of Investments (continued) | October 31, 2016 |
| | Principal | | | Optional Call | | | | | |
| | Amount (000) | | Description (1) | Provisions (2) | | Ratings (3) | | Value | |
| | | | Florida (continued) | | | | | | |
| $ | 4,000 | | Miami-Dade County, Florida, Transit System Sales Surtax Revenue Bonds, Refunding Series 2012, 5.000%, 7/01/42 | 7/22 at 100.00 | | AA | $ | 4,593,400 | |
| | 9,590 | | Miami-Dade County, Florida, Water and Sewer System Revenue Bonds, Series 2010, 5.000%, 10/01/39 – AGM Insured | 10/20 at 100.00 | | AA | | 10,794,792 | |
| | 5,520 | | Orange County Health Facilities Authority, Florida, Hospital Revenue Bonds, Orlando Health, Inc., Series 2016B, 4.000%, 10/01/45 | 10/26 at 100.00 | | A | | 5,751,785 | |
| | 10,725 | | Orlando, Florida, Contract Tourist Development Tax Payments Revenue Bonds, Series 2014A, 5.000%, 11/01/44 | 5/24 at 100.00 | | AA+ | | 12,311,227 | |
| | 3,250 | | Palm Beach County Health Facilities Authority, Florida, Revenue Bonds, Jupiter Medical Center, Series 2013A, 5.000%, 11/01/43 | 11/22 at 100.00 | | BBB+ | | 3,516,337 | |
| | 9,440 | | Port Saint Lucie. Florida, Special Assessment Revenue Bonds, Southwest Annexation District 1, Series 2007B, 5.000%, 7/01/40 (Pre-refunded 7/01/17) – NPFG Insured | 7/17 at 100.00 | | AA– (4) | | 9,708,474 | |
| | 2,500 | | Seminole Tribe of Florida, Special Obligation Bonds, Series 2007A, 144A, 5.250%, 10/01/27 | 10/17 at 100.00 | | BBB | | 2,575,350 | |
| | 6,865 | | South Broward Hospital District, Florida, Hospital Revenue Bonds, Refunding Series 2015, 4.000%, 5/01/34 | 5/25 at 100.00 | | AA | | 7,269,143 | |
| | | | South Miami Health Facilities Authority, Florida, Hospital Revenue, Baptist Health System Obligation Group, Refunding Series 2007: | | | | | | |
| | 3,035 | | 5.000%, 8/15/19 | 8/17 at 100.00 | | AA– | | 3,133,273 | |
| | 14,730 | | 5.000%, 8/15/42 (UB) (7) | 8/17 at 100.00 | | AA– | | 15,079,543 | |
| | 3,300 | | Tampa, Florida, Health System Revenue Bonds, Baycare Health System, Series 2012A, 5.000%, 11/15/33 | 5/22 at 100.00 | | Aa2 | | 3,756,720 | |
| | 113,245 | | Total Florida | | | | | 123,852,446 | |
| | | | Georgia – 0.1% | | | | | | |
| | 2,500 | | Atlanta, Georgia, Water and Wastewater Revenue Bonds, Refunding Series 2015, 5.000%, 11/01/34 | 5/25 at 100.00 | | AA– | | 2,957,025 | |
| | | | Guam – 0.0% | | | | | | |
| | 330 | | Guam International Airport Authority, Revenue Bonds, Series 2013C, 6.375%, 10/01/43 (Alternative Minimum Tax) | 10/23 at 100.00 | | BBB | | 394,766 | |
| | | | Hawaii – 0.2% | | | | | | |
| | 3,625 | | Honolulu City and County, Hawaii, General Obligation Bonds, Refunding Series 2009A, 5.250%, 4/01/32 (Pre-refunded 4/01/19) | 4/19 at 100.00 | | Aa1 (4) | | 3,997,432 | |
| | | | Illinois – 14.6% | | | | | | |
| | 5,000 | | Chicago Board of Education, Illinois, General Obligation Bonds, Dedicated Revenues, Series 2016A, 7.000%, 12/01/44 | 12/25 at 100.00 | | B | | 5,317,100 | |
| | 2,945 | | Chicago Board of Education, Illinois, General Obligation Bonds, Dedicated Revenues, Series 2016B, 6.500%, 12/01/46 | 12/26 at 100.00 | | B | | 3,025,398 | |
| | 17,725 | | Chicago Board of Education, Illinois, Unlimited Tax General Obligation Bonds, Dedicated Tax Revenues, Series 1998B-1, 0.000%, 12/01/24 – FGIC Insured | No Opt. Call | | AA– | | 12,934,641 | |
| | 7,495 | | Chicago Board of Education, Illinois, Unlimited Tax General Obligation Bonds, Dedicated Tax Revenues, Series 1999A, 0.000%, 12/01/31 – FGIC Insured | No Opt. Call | | AA– | | 3,698,857 | |
| | 1,500 | | Chicago Park District, Illinois, General Obligation Bonds, Limited Tax Series 2011A, 5.000%, 1/01/36 | 1/22 at 100.00 | | AA+ | | 1,607,625 | |
| | | | Chicago, Illinois, General Obligation Bonds, Project & Refunding Series 2006A: | | | | | | |
| | 2,750 | | 4.750%, 1/01/30 – AGM Insured | 1/17 at 100.00 | | AA | | 2,758,470 | |
| | 5,000 | | 4.625%, 1/01/31 – AGM Insured | 1/17 at 100.00 | | AA | | 5,014,800 | |
| | 595 | | Chicago, Illinois, General Obligation Bonds, Project and Refunding Series 2006A, 5.000%, 1/01/17 – AGM Insured | 12/16 at 100.00 | | AA | | 598,267 | |
| | 230 | | Chicago, Illinois, General Obligation Bonds, Refunding Series 2005A, 5.000%, 1/01/17 – AGM Insured | 12/16 at 100.00 | | AA | | 230,807 | |
| | Principal | | | Optional Call | | | | | |
| | Amount (000) | | Description (1) | Provisions (2) | | Ratings (3) | | Value | |
| | | | Illinois (continued) | | | | | | |
| $ | 285 | | Chicago, Illinois, General Obligation Bonds, Series 2002A, 5.625%, 1/01/39 – AMBAC Insured | 1/17 at 100.00 | | AA– | $ | 285,841 | |
| | 7,750 | | Chicago, Illinois, General Obligation Bonds, Series 2004A, 5.000%, 1/01/34 – AGM Insured | 1/17 at 100.00 | | AA | | 7,775,342 | |
| | 3,320 | | Cook and DuPage Counties Combined School District 113A Lemont, Illinois, General Obligation Bonds, Series 2002, 0.000%, 12/01/20 – FGIC Insured | No Opt. Call | | AA– | | 3,086,172 | |
| | 3,020 | | Cook County High School District 209, Proviso Township, Illinois, General Obligation Bonds, Series 2004, 5.000%, 12/01/19 (Pre-refunded 12/01/16) – AGM Insured | 12/16 at 100.00 | | AA (4) | | 3,030,510 | |
| | 8,875 | | Cook County, Illinois, General Obligation Bonds, Refunding Series 2010A, 5.250%, 11/15/33 | 11/20 at 100.00 | | AA– | | 9,615,086 | |
| | 3,260 | | Cook County, Illinois, Recovery Zone Facility Revenue Bonds, Navistar International Corporation Project, Series 2010, 6.500%, 10/15/40 | 10/20 at 100.00 | | Caa1 | | 3,401,973 | |
| | 5,000 | | Cook County, Illinois, Sales Tax Revenue Bonds, Series 2012, 5.000%, 11/15/37 | No Opt. Call | | AAA | | 5,604,250 | |
| | 13,070 | | Illinois Development Finance Authority, Local Government Program Revenue Bonds, Kane, Cook and DuPage Counties School District U46 – Elgin, Series 2002, 0.000%, 1/01/19 – AGM Insured | No Opt. Call | | Aa3 | | 12,503,677 | |
| | 14,960 | | Illinois Development Finance Authority, Local Government Program Revenue Bonds, Kane, Cook and DuPage Counties School District U46 – Elgin, Series 2002, 0.000%, 1/01/19 – AGM Insured (ETM) | No Opt. Call | | Aa3 (4) | | 14,572,536 | |
| | 1,800 | | Illinois Development Finance Authority, Local Government Program Revenue Bonds, Winnebago and Boone Counties School District 205 – Rockford, Series 2000, 0.000%, 2/01/19 – AGM Insured | No Opt. Call | | A2 | | 1,722,456 | |
| | 1,875 | | Illinois Finance Authority, Revenue Bonds, Central DuPage Health, Series 2009B, 5.500%, 11/01/39 | 11/19 at 100.00 | | AA+ | | 2,116,612 | |
| | 3,000 | | Illinois Finance Authority, Revenue Bonds, Central DuPage Health, Series 2009, 5.250%, 11/01/39 | 11/19 at 100.00 | | AA+ | | 3,288,030 | |
| | 1,735 | | Illinois Finance Authority, Revenue Bonds, OSF Healthcare System, Refunding Series 2010A, 6.000%, 5/15/39 | 5/20 at 100.00 | | A | | 1,973,823 | |
| | 3,110 | | Illinois Finance Authority, Revenue Bonds, OSF Healthcare System, Refunding Series 2010A, 6.000%, 5/15/39 (Pre-refunded 5/15/20) | 5/20 at 100.00 | | N/R (4) | | 3,636,336 | |
| | | | Illinois Finance Authority, Revenue Bonds, Provena Health, Series 2009A: | | | | | | |
| | 45 | | 7.750%, 8/15/34 (Pre-refunded 8/15/19) | 8/19 at 100.00 | | N/R (4) | | 53,059 | |
| | 4,755 | | 7.750%, 8/15/34 (Pre-refunded 8/15/19) | 8/19 at 100.00 | | BBB– (4) | | 5,629,682 | |
| | | | Illinois Finance Authority, Revenue Bonds, Resurrection Health Care System, Series 1999B: | | | | | | |
| | 70 | | 5.000%, 5/15/19 (Pre-refunded 5/15/18) – AGM Insured | 5/18 at 100.00 | | AA (4) | | 74,410 | |
| | 1,930 | | 5.000%, 5/15/19 (Pre-refunded 5/15/18) – AGM Insured | 5/18 at 100.00 | | AA (4) | | 2,051,590 | |
| | 5,000 | | Illinois Finance Authority, Revenue Bonds, Rush University Medical Center Obligated Group, Series 2015A, 5.000%, 11/15/38 | 5/25 at 100.00 | | A+ | | 5,766,600 | |
| | 4,260 | | Illinois Finance Authority, Revenue Bonds, Sherman Health Systems, Series 2007A, 5.500%, 8/01/37 (Pre-refunded 8/01/17) | 8/17 at 100.00 | | N/R (4) | | 4,409,995 | |
| | 4,475 | | Illinois Finance Authority, Revenue Bonds, Silver Cross Hospital and Medical Centers, Refunding Series 2008A, 5.500%, 8/15/30 | 8/18 at 100.00 | | BBB+ | | 4,699,824 | |
| | | | Illinois Finance Authority, Revenue Bonds, Silver Cross Hospital and Medical Centers, Refunding Series 2015C: | | | | | | |
| | 560 | | 5.000%, 8/15/35 | 8/25 at 100.00 | | Baa1 | | 633,685 | |
| | 825 | | 5.000%, 8/15/44 | 8/25 at 100.00 | | Baa1 | | 918,217 | |
| | 2,500 | | Illinois Finance Authority, Revenue Bonds, The University of Chicago Medical Center, Series 2011C, 5.500%, 8/15/41 (Pre-refunded 2/15/21) | 2/21 at 100.00 | | AA– (4) | | 2,955,800 | |
| | 3,000 | | Illinois Finance Authority, Revenue Bonds, University of Chicago, Series 2012A, 5.000%, 10/01/51 | 10/21 at 100.00 | | AA+ | | 3,313,830 | |
| | 5,245 | | Illinois Finance Authority, Revenue Bonds, University of Chicago, Tender Option Bond Trust 2015-XF0248, 8.642%, 7/01/46 (Pre-refunded 7/01/17) (IF) (7) | 7/17 at 100.00 | | AA+ (4) | | 5,539,035 | |
| | 1,205 | | Illinois Health Facilities Authority, Revenue Bonds, South Suburban Hospital, Series 1992, 7.000%, 2/15/18 (ETM) | No Opt. Call | | N/R (4) | | 1,259,659 | |
| | 3,750 | | Illinois Sports Facility Authority, State Tax Supported Bonds, Series 2001, 5.500%, 6/15/30 – AMBAC Insured | 1/17 at 100.00 | | BBB | | 3,763,912 | |
| NUV | Nuveen Municipal Value Fund, Inc. | |
| | Portfolio of Investments (continued) | October 31, 2016 |
| | Principal | | | Optional Call | | | | | |
| | Amount (000) | | Description (1) | Provisions (2) | | Ratings (3) | | Value | |
| | | | Illinois (continued) | | | | | | |
| $ | 1,755 | | Illinois State, General Obligation Bonds, October Series 2016, 5.000%, 2/01/29 (WI/DD, Settling 11/02/16) | 2/27 at 100.00 | | BBB+ | $ | 1,908,299 | |
| | 655 | | Illinois State, General Obligation Bonds, Refunding Series 2012, 5.000%, 8/01/25 | 8/22 at 100.00 | | BBB+ | | 703,477 | |
| | 5,590 | | Illinois Toll Highway Authority, Toll Highway Revenue Bonds, Senior Lien Series 2013A, 5.000%, 1/01/38 | 1/23 at 100.00 | | AA– | | 6,387,302 | |
| | 5,000 | | Lombard Public Facilities Corporation, Illinois, First Tier Conference Center and Hotel Revenue Bonds, Series 2005A-2, 5.500%, 1/01/36 – ACA Insured (6) | 1/17 at 100.00 | | D | | 3,999,500 | |
| | 16,800 | | Metropolitan Pier and Exposition Authority, Illinois, Revenue Bonds, McCormick Place Expansion Project, Refunding Series 1996A, 0.000%, 12/15/21 – NPFG Insured | No Opt. Call | | AA– | | 14,276,304 | |
| | | | Metropolitan Pier and Exposition Authority, Illinois, Revenue Bonds, McCormick Place Expansion Project, Refunding Series 2002B: | | | | | | |
| | 3,070 | | 5.500%, 6/15/20 – NPFG Insured | 6/17 at 101.00 | | AA– | | 3,184,112 | |
| | 3,950 | | 5.550%, 6/15/21 – NPFG Insured | 6/17 at 101.00 | | AA– | | 4,097,453 | |
| | | | Metropolitan Pier and Exposition Authority, Illinois, Revenue Bonds, McCormick Place Expansion Project, Refunding Series 2002B: | | | | | | |
| | 705 | | 5.500%, 6/15/20 (Pre-refunded 6/15/17) – NPFG Insured | 6/17 at 101.00 | | AA– (4) | | 732,918 | |
| | 1,765 | | 5.550%, 6/15/21 (Pre-refunded 6/15/17) – NPFG Insured | 6/17 at 101.00 | | AA– (4) | | 1,835,441 | |
| | | | Metropolitan Pier and Exposition Authority, Illinois, Revenue Bonds, McCormick Place Expansion Project, Series 1993A: | | | | | | |
| | 9,415 | | 0.000%, 6/15/17 – NPFG Insured | No Opt. Call | | AA– | | 9,306,822 | |
| | 9,270 | | 0.010%, 6/15/18 – FGIC Insured | No Opt. Call | | AA– | | 8,929,791 | |
| | 2,905 | | Metropolitan Pier and Exposition Authority, Illinois, Revenue Bonds, McCormick Place Expansion Project, Series 1993A, 0.000%, 6/15/17 – NPFG Insured (ETM) | No Opt. Call | | AA– (4) | | 2,888,732 | |
| | | | Metropolitan Pier and Exposition Authority, Illinois, Revenue Bonds, McCormick Place Expansion Project, Series 1994B: | | | | | | |
| | 7,250 | | 0.000%, 6/15/18 – NPFG Insured | No Opt. Call | | AA– | | 6,983,925 | |
| | 3,635 | | 0.000%, 6/15/21 – NPFG Insured | No Opt. Call | | AA– | | 3,141,803 | |
| | 5,190 | | 0.000%, 6/15/28 – NPFG Insured | No Opt. Call | | AA– | | 3,227,038 | |
| | 11,670 | | 0.000%, 6/15/29 – FGIC Insured | No Opt. Call | | AA– | | 6,856,825 | |
| | | | Metropolitan Pier and Exposition Authority, Illinois, Revenue Bonds, McCormick Place Expansion Project, Series 2002A: | | | | | | |
| | 10,000 | | 0.000%, 6/15/24 – NPFG Insured (5) | 6/22 at 101.00 | | AA– | | 11,244,600 | |
| | 4,950 | | 0.000%, 12/15/32 – NPFG Insured | No Opt. Call | | AA– | | 2,455,893 | |
| | 21,375 | | 0.000%, 6/15/34 – NPFG Insured | No Opt. Call | | AA– | | 9,901,327 | |
| | 10,000 | | 0.000%, 12/15/34 – NPFG Insured | No Opt. Call | | AA– | | 4,532,100 | |
| | 21,000 | | 0.000%, 12/15/35 – NPFG Insured | No Opt. Call | | AA– | | 9,026,010 | |
| | 21,970 | | 0.000%, 6/15/36 – NPFG Insured | No Opt. Call | | AA– | | 9,166,104 | |
| | 10,375 | | 0.000%, 12/15/36 – NPFG Insured | No Opt. Call | | AA– | | 4,233,207 | |
| | 25,825 | | 0.000%, 6/15/39 – NPFG Insured | No Opt. Call | | AA– | | 9,261,103 | |
| | 6,095 | | Regional Transportation Authority, Cook, DuPage, Kane, Lake, McHenry and Will Counties, Illinois, General Obligation Bonds, Series 2002A, 6.000%, 7/01/32 – NPFG Insured | No Opt. Call | | AA | | 8,545,068 | |
| | 1,160 | | Round Lake, Lake County, Illinois, Special Tax Bonds, Lakewood Grove Special Service Area 4, Series 2007, 4.700%, 3/01/33 – AGC Insured | 3/17 at 100.00 | | AA | | 1,173,630 | |
| | 5,020 | | Southwestern Illinois Development Authority, Local Government Revenue Bonds, Edwardsville Community Unit School District 7 Project, Series 2007, 0.000%, 12/01/23 – AGM Insured | No Opt. Call | | AA | | 4,139,592 | |
| | 3,100 | | Springfield, Illinois, Electric Revenue Bonds, Senior Lien Series 2007, 5.000%, 3/01/22 (Pre-refunded 3/01/17) – NPFG Insured | 3/17 at 100.00 | | AA– (4) | | 3,144,330 | |
| | 615 | | University of Illinois, Health Services Facilities System Revenue Bonds, Series 2013, 6.000%, 10/01/42 | 10/23 at 100.00 | | A | | 726,715 | |
| | 1,575 | | Will County Community School District 161, Summit Hill, Illinois, Capital Appreciation School Bonds, Series 1999, 0.000%, 1/01/18 – FGIC Insured | No Opt. Call | | A3 | | 1,532,380 | |
| | Principal | | | Optional Call | | | | | |
| | Amount (000) | | Description (1) | Provisions (2) | | Ratings (3) | | Value | |
| | | | Illinois (continued) | | | | | | |
| $ | 720 | | Will County Community School District 161, Summit Hill, Illinois, Capital Appreciation School Bonds, Series 1999, 0.000%, 1/01/18 – FGIC Insured (ETM) | No Opt. Call | | A3 (4) | $ | 711,713 | |
| | | | Will County Community Unit School District 201U, Crete-Monee, Illinois, General Obligation Bonds, Capital Appreciation Series 2004: | | | | | | |
| | 3,560 | | 0.000%, 11/01/16 – NPFG Insured | No Opt. Call | | AA– | | 3,560,000 | |
| | 2,550 | | 0.000%, 11/01/22 – NPFG Insured | No Opt. Call | | AA– | | 2,206,183 | |
| | | | Will County Community Unit School District 201U, Crete-Monee, Illinois, General Obligation Bonds, Capital Appreciation Series 2004: | | | | | | |
| | 120 | | 0.000%, 11/01/16 – NPFG Insured (ETM) | No Opt. Call | | A3 (4) | | 120,000 | |
| | 780 | | 0.000%, 11/01/22 – NPFG Insured (ETM) | No Opt. Call | | A3 (4) | | 708,724 | |
| | 391,335 | | Total Illinois | | | | | 313,716,328 | |
| | | | Indiana – 2.8% | | | | | | |
| | 300 | | Anderson, Indiana, Economic Development Revenue Bonds, Anderson University, Series 2007, 5.000%, 10/01/24 | 4/17 at 100.00 | | BB+ | | 300,468 | |
| | 5,010 | | Indiana Finance Authority, Hospital Revenue Bonds, Community Health Network Project, Series 2012A, 5.000%, 5/01/42 | 5/23 at 100.00 | | A | | 5,605,589 | |
| | 2,250 | | Indiana Finance Authority, Hospital Revenue Bonds, Indiana University Health Obligation Group, Refunding 2015A, 4.000%, 12/01/40 | 6/25 at 100.00 | | AA | | 2,358,270 | |
| | 5,740 | | Indiana Finance Authority, Private Activity Bonds, Ohio River Bridges East End Crossing Project, Series 2013A, 5.000%, 7/01/48 (Alternative Minimum Tax) | 7/23 at 100.00 | | BBB+ | | 6,294,197 | |
| | 6,400 | | Indiana Finance Authority, Tax-Exempt Private Activity Revenue Bonds, I-69 Section 5 Project, Series 2014, 5.000%, 9/01/46 (Alternative Minimum Tax) | 9/24 at 100.00 | | BB– | | 6,765,568 | |
| | 2,250 | | Indiana Health and Educational Facilities Financing Authority, Revenue Bonds, Sisters of Saint Francis Health Services Inc, Series 2006E, 5.250%, 5/15/41 (Pre-refunded 5/01/18) – AGM Insured | 5/18 at 100.00 | | Aa3 (4) | | 2,397,420 | |
| | | | Indiana Health Facility Financing Authority, Revenue Bonds, Community Foundation of Northwest Indiana, Series 2007: | | | | | | |
| | 1,030 | | 5.500%, 3/01/37 (Pre-refunded 3/01/17) | 3/17 at 100.00 | | N/R (4) | | 1,046,542 | |
| | 970 | | 5.500%, 3/01/37 (Pre-refunded 3/01/17) | 3/17 at 100.00 | | A+ (4) | | 981,805 | |
| | 8,235 | | Indiana Municipal Power Agency, Power Supply Revenue Bonds, Series 2007A, 5.000%, 1/01/42 (Pre-refunded 1/01/17) – NPFG Insured | 1/17 at 100.00 | | AA– (4) | | 8,293,880 | |
| | | | Indianapolis Local Public Improvement Bond Bank, Indiana, Series 1999E: | | | | | | |
| | 12,550 | | 0.000%, 2/01/21 – AMBAC Insured | No Opt. Call | | AA | | 11,662,338 | |
| | 2,400 | | 0.000%, 2/01/25 – AMBAC Insured | No Opt. Call | | AA | | 1,998,432 | |
| | 14,595 | | 0.000%, 2/01/27 – AMBAC Insured | No Opt. Call | | AA | | 11,370,089 | |
| | 850 | | Whiting Redevelopment District, Indiana, Tax Increment Revenue Bonds, Lakefront Development Project, Series 2010, 6.750%, 1/15/32 | 7/20 at 100.00 | | N/R | | 930,886 | |
| | 62,580 | | Total Indiana | | | | | 60,005,484 | |
| | | | Iowa – 1.2% | | | | | | |
| | 14,500 | | Iowa Finance Authority, Iowa, Midwestern Disaster Area Revenue Bonds, Iowa Fertilizer Company Project, Series 2013, 5.500%, 12/01/22 | 12/18 at 100.00 | | B | | 14,710,975 | |
| | | | Iowa Tobacco Settlement Authority, Asset Backed Settlement Revenue Bonds, Series 2005C: | | | | | | |
| | 175 | | 5.375%, 6/01/38 | 1/17 at 100.00 | | B+ | | 174,986 | |
| | 7,000 | | 5.625%, 6/01/46 | 1/17 at 100.00 | | B+ | | 6,924,960 | |
| | 4,965 | | Iowa Tobacco Settlement Authority, Tobacco Asset-Backed Revenue Bonds, Series 2005B, 5.600%, 6/01/34 | 6/17 at 100.00 | | B+ | | 4,989,130 | |
| | 26,640 | | Total Iowa | | | | | 26,800,051 | |
| | | | Kansas – 0.0% | | | | | | |
| | 45 | | Wyandotte County-Kansas City Unified Government, Kansas, Sales Tax Special Obligation Capital Appreciation Revenue Bonds Redevelopment Project Area B – Major Multi-Sport Athletic Complex Project, Subordinate Lien Series 2010B, 0.000%, 6/01/21 (Mandatory put 11/12/15) (Pre-refunded 12/01/16) | 12/16 at 76.41 | | A– (4) | | 34,361 | | |
| NUV | Nuveen Municipal Value Fund, Inc. | |
| | Portfolio of Investments (continued) | October 31, 2016 |
| | Principal | | | Optional Call | | | | | |
| | Amount (000) | | Description (1) | Provisions (2) | | Ratings (3) | | Value | |
| | | | Kentucky – 0.6% | | | | | | |
| $ | 685 | | Greater Kentucky Housing Assistance Corporation, FHA-Insured Section 8 Mortgage Revenue Refunding Bonds, Series 1997A, 6.100%, 1/01/24 – NPFG Insured | 1/17 at 100.00 | | AA– | $ | 687,007 | |
| | | | Kenton County Airport Board, Kentucky, Airport Revenue Bonds, Cincinnati/Northern Kentucky International Airport, Series 2016: | | | | | | |
| | 1,530 | | 5.000%, 1/01/27 | 1/26 at 100.00 | | A+ | | 1,852,723 | |
| | 1,600 | | 5.000%, 1/01/28 | 1/26 at 100.00 | | A+ | | 1,920,016 | |
| | 1,750 | | Kentucky Economic Development Finance Authority, Louisville Arena Project Revenue Bonds, Louisville Arena Authority, Inc., Series 2008-A1, 6.000%, 12/01/38 – AGC Insured | 6/18 at 100.00 | | AA | | 1,855,105 | |
| | 1,170 | | Kentucky Municipal Power Agency, Power System Revenue Bonds, Prairie State Project Series 2007A, 5.000%, 9/01/37 (Pre-refunded 9/01/17) – NPFG Insured | 9/17 at 100.00 | | AA– (4) | | 1,211,301 | |
| | 6,000 | | Kentucky Public Transportation Infrastructure Authority, First Tier Toll Revenue Bonds, Downtown Crossing Project, Convertible Capital Appreciation Series 2013C, 0.000%, 7/01/39 (5) | 7/31 at 100.00 | | Baa3 | | 5,098,620 | |
| | 12,735 | | Total Kentucky | | | | | 12,624,772 | |
| | | | Louisiana – 1.7% | | | | | | |
| | 12,000 | | Louisiana Local Government Environmental Facilities & Community Development Authority, Revenue Bonds, Westlake Chemical Corporation Project, Series 2007, 6.750%, 11/01/32 | 11/17 at 100.00 | | BBB | | 12,611,280 | |
| | 2,310 | | Louisiana Local Government Environmental Facilities and Community Development Authority, Revenue Bonds, Westlake Chemical Corporation Projects, Series 2009A, 6.500%, 8/01/29 | 8/20 at 100.00 | | BBB | | 2,654,767 | |
| | 5,450 | | Louisiana Local Government Environmental Facilities and Community Development Authority, Revenue Bonds, Westlake Chemical Corporation Projects, Series 2010A-1, 6.500%, 11/01/35 | 11/20 at 100.00 | | BBB | | 6,316,604 | |
| | 5,075 | | Louisiana Public Facilities Authority, Revenue Bonds, Nineteenth Judicial District Court Building Project, Series 2007, 5.500%, 6/01/41 (Pre-refunded 6/01/17) – NPFG Insured | 6/17 at 100.00 | | AA– (4) | | 5,217,303 | |
| | | | Louisiana Public Facilities Authority, Revenue Bonds, Ochsner Clinic Foundation Project, Series 2007A: | | | | | | |
| | 2,640 | | 5.250%, 5/15/38 | 5/17 at 100.00 | | A– | | 2,688,682 | |
| | 1,415 | | 5.375%, 5/15/43 | 5/17 at 100.00 | | A– | | 1,441,885 | |
| | | | Louisiana Public Facilities Authority, Revenue Bonds, Ochsner Clinic Foundation Project, Series 2007A: | | | | | | |
| | 1,005 | | 5.250%, 5/15/38 (Pre-refunded 5/15/17) | 5/17 at 100.00 | | N/R (4) | | 1,029,683 | |
| | 525 | | 5.375%, 5/15/43 (Pre-refunded 5/15/17) | 5/17 at 100.00 | | N/R (4) | | 538,251 | |
| | 4,420 | | Louisiana Stadium and Exposition District, Revenue Refunding Bonds, Senior Lien Series 2013A, 5.000%, 7/01/28 | 7/23 at 100.00 | | AA– | | 5,088,702 | |
| | 34,840 | | Total Louisiana | | | | | 37,587,157 | |
| | | | Maine – 0.3% | | | | | | |
| | 4,250 | | Maine Health and Higher Educational Facilities Authority Revenue Bonds, Eastern Maine Medical Center Obligated Group Issue, Series 2013, 5.000%, 7/01/33 | 7/23 at 100.00 | | BBB | | 4,696,420 | |
| | 1,050 | | Maine Health and Higher Educational Facilities Authority, Revenue Bonds, Maine General Medical Center, Series 2011, 6.750%, 7/01/41 | 7/21 at 100.00 | | BBB– | | 1,175,580 | |
| | 5,300 | | Total Maine | | | | | 5,872,000 | |
| | | | Maryland – 0.8% | | | | | | |
| | | | Baltimore, Maryland, Senior Lien Convention Center Hotel Revenue Bonds, Series 2006A: | | | | | | |
| | 1,300 | | 5.250%, 9/01/17 – SYNCORA GTY Insured | 1/17 at 100.00 | | Ba1 | | 1,304,186 | |
| | 3,240 | | 4.600%, 9/01/30 – SYNCORA GTY Insured | 1/17 at 100.00 | | Ba1 | | 3,248,716 | |
| | 1,545 | | 5.250%, 9/01/39 – SYNCORA GTY Insured | 1/17 at 100.00 | | Ba1 | | 1,549,156 | |
| | 2,500 | | Baltimore, Maryland, Subordinate Lien Convention Center Hotel Revenue Bonds, Series 2006B, 5.875%, 9/01/39 | 1/17 at 100.00 | | BB | | 2,505,600 | |
| | 1,050 | | Maryland Economic Development Corporation, Private Activity Revenue Bonds AP, Purple Line Light Rail Project, Green Bonds, Series 2016D, 5.000%, 3/31/41 (Alternative Minimum Tax) | 9/26 at 100.00 | | BBB+ | | 1,189,440 | |
| | 1,050 | | Maryland Health and Higher Educational Facilities Authority, Maryland, Hospital Revenue Bonds, Meritus Medical Center, Series 2015, 5.000%, 7/01/40 | 7/25 at 100.00 | | BBB | | 1,179,759 | |
| | Principal | | | Optional Call | | | | | |
| | Amount (000) | | Description (1) | Provisions (2) | | Ratings (3) | | Value | |
| | | | Maryland (continued) | | | | | | |
| $ | 1,500 | | Maryland Health and Higher Educational Facilities Authority, Revenue Bonds, Adventist Healthcare, Series 2011A, 6.125%, 1/01/36 | 1/22 at 100.00 | | Baa3 | $ | 1,763,145 | |
| | 3,510 | | Maryland Health and Higher Educational Facilities Authority, Revenue Bonds, Mercy Medical Center, Series 2016A, 4.000%, 7/01/42 | 7/26 at 100.00 | | BBB | | 3,671,811 | |
| | 15,695 | | Total Maryland | | | | | 16,411,813 | |
| | | | Massachusetts – 2.0% | | | | | | |
| | | | Massachusetts Bay Transportation Authority, Assessment Bonds, Series 2008A: | | | | | | |
| | 1,450 | | 5.250%, 7/01/34 (Pre-refunded 7/01/18) | 7/18 at 100.00 | | N/R (4) | | 1,555,966 | |
| | 3,550 | | 5.250%, 7/01/34 (Pre-refunded 7/01/18) | 7/18 at 100.00 | | AAA | | 3,809,434 | |
| | 2,100 | | Massachusetts Development Finance Agency, Hospital Revenue Bonds, Cape Cod Healthcare Obligated Group, Series 2013, 5.250%, 11/15/41 | 11/23 at 100.00 | | A | | 2,421,531 | |
| | | | Massachusetts Development Finance Agency, Revenue Bonds, Boston Medical Center Issue, Series 2016E: | | | | | | |
| | 2,905 | | 5.000%, 7/01/35 | 7/26 at 100.00 | | BBB | | 3,296,623 | |
| | 1,105 | | 5.000%, 7/01/36 | 7/26 at 100.00 | | BBB | | 1,253,965 | |
| | 2,765 | | Massachusetts Development Finance Agency, Revenue Bonds, Dana-Farber Cancer Institute Issue, Series 2016N, 5.000%, 12/01/41 | 12/26 at 100.00 | | A1 | | 3,241,714 | |
| | 500 | | Massachusetts Health and Educational Facilities Authority, Revenue Bonds, CareGroup Inc., Series 2008E-1 &2, 5.125%, 7/01/38 (Pre-refunded 7/01/18) | 7/18 at 100.00 | | A– (4) | | 535,335 | |
| | 2,300 | | Massachusetts Health and Educational Facilities Authority, Revenue Refunding Bonds, Suffolk University Issue, Series 2009A, 5.750%, 7/01/39 | 7/19 at 100.00 | | BBB | | 2,522,203 | |
| | 11,400 | | Massachusetts Housing Finance Agency, Housing Bonds, Series 2009F, 5.700%, 6/01/40 (Alternative Minimum Tax) | 12/18 at 100.00 | | AA– | | 11,884,158 | |
| | 9,110 | | Massachusetts School Building Authority, Dedicated Sales Tax Revenue Bonds, Senior Series 2013A, 5.000%, 5/15/43 | 5/23 at 100.00 | | AA+ | | 10,601,307 | |
| | 980 | | Massachusetts Turnpike Authority, Metropolitan Highway System Revenue Bonds, Senior Series 1997A, 0.000%, 1/01/29 – NPFG Insured | No Opt. Call | | AA– | | 737,087 | |
| | 320 | | Massachusetts Water Pollution Abatement Trust, Pooled Loan Program Bonds, Series 2000-6, 5.500%, 8/01/30 | 8/30 at 100.00 | | Aaa | | 321,293 | |
| | 38,485 | | Total Massachusetts | | | | | 42,180,616 | |
| | | | Michigan – 3.5% | | | | | | |
| | | | Detroit Academy of Arts and Sciences, Michigan, Public School Academy Revenue Bonds, Refunding Series 2013: | | | | | | |
| | 2,000 | | 6.000%, 10/01/33 | 10/23 at 100.00 | | N/R | | 1,933,960 | |
| | 2,520 | | 6.000%, 10/01/43 | 10/23 at 100.00 | | N/R | | 2,375,856 | |
| | 7,150 | | Detroit Local Development Finance Authority, Michigan, Tax Increment Bonds, Series 1998A, 5.500%, 5/01/21 | 11/16 at 100.00 | | B– | | 7,077,785 | |
| | 1,415 | | Detroit Water and Sewerage Department, Michigan, Sewage Disposal System Revenue Bonds, Refunding Senior Lien Series 2012A, 5.250%, 7/01/39 | 7/22 at 100.00 | | A | | 1,582,069 | |
| | 3,700 | | Detroit, Michigan, Distributable State Aid General Obligation Bonds, Limited Tax Series 2010, 4.500%, 11/01/23 (Pre-refunded 3/01/17) | 3/17 at 103.00 | | AA (4) | | 3,854,660 | |
| | 15 | | Detroit, Michigan, Second Lien Sewerage Disposal System Revenue Bonds, Series 2005A, 4.500%, 7/01/35 – NPFG Insured | 1/17 at 100.00 | | AA– | | 15,029 | |
| | 3,000 | | Detroit, Michigan, Senior Lien Sewerage Disposal System Revenue Bonds, Series 2001B, 5.500%, 7/01/29 – FGIC Insured | No Opt. Call | | AA– | | 3,726,240 | |
| | 3,395 | | Detroit, Michigan, Sewage Disposal System Revenue Bonds, Second Lien Series 2006A, 5.500%, 7/01/36 (Pre-refunded 7/01/18) – BHAC Insured | 7/18 at 100.00 | | AA+ (4) | | 3,638,931 | |
| | 7,525 | | Detroit, Michigan, Sewage Disposal System Revenue Bonds, Series 2001C-2, 5.250%, 7/01/29 – FGIC Insured | 7/18 at 100.00 | | AA+ | | 7,985,003 | |
| NUV | Nuveen Municipal Value Fund, Inc. | |
| | Portfolio of Investments (continued) | October 31, 2016 |
| | Principal | | | Optional Call | | | | | |
| | Amount (000) | | Description (1) | Provisions (2) | | Ratings (3) | | Value | |
| | | | Michigan (continued) | | | | | | |
| $ | 5 | | Detroit, Michigan, Water Supply System Second Lien Revenue Bonds, Series 2003B, 5.000%, 7/01/34 – NPFG Insured | 1/17 at 100.00 | | AA– | $ | 5,016 | |
| | 5 | | Detroit, Michigan, Water Supply System Senior Lien Revenue Bonds, Series 2003A, 5.000%, 7/01/34 – NPFG Insured | 1/17 at 100.00 | | A | | 5,016 | |
| | 2,200 | | Detroit, Michigan, Water Supply System Senior Lien Revenue Bonds, Series 2005B, 4.750%, 7/01/34 (Pre-refunded 7/01/18) – BHAC Insured | 7/18 at 100.00 | | AA+ (4) | | 2,336,180 | |
| | 2,000 | | Kalamazoo Hospital Finance Authority, Michigan, Hospital Revenue Refunding Bonds, Bronson Methodist Hospital, Series 2010, 5.250%, 5/15/36 – AGM Insured | 5/20 at 100.00 | | A2 | | 2,208,360 | |
| | 1,950 | | Michigan Finance Authority, Local Government Loan Program Revenue Bonds, Detroit Water & Sewerage Department Water Supply System Local Project, Series 2014C-1, 5.000%, 7/01/44 | 7/22 at 100.00 | | A | | 2,144,298 | |
| | 4,585 | | Michigan Finance Authority, Revenue Bonds, Trinity Health Credit Group, Refunding Series 2011, 5.000%, 12/01/39 | 12/21 at 100.00 | | AA– | | 5,299,435 | |
| | 15 | | Michigan Finance Authority, Revenue Bonds, Trinity Health Credit Group, Refunding Series 2011, 5.000%, 12/01/39 (Pre-refunded 12/01/21) | 12/21 at 100.00 | | N/R (4) | | 17,819 | |
| | 5,000 | | Michigan Finance Authority, Revenue Bonds, Trinity Health Credit Group, Refunding Series 2015, 5.000%, 12/01/35 | 6/22 at 100.00 | | AA | | 5,726,050 | |
| | 2,155 | | Michigan Municipal Bond Authority, Clean Water Revolving Fund Revenue Bonds, Series 2010, 5.000%, 10/01/29 (Pre-refunded 10/01/20) | 10/20 at 100.00 | | AAA | | 2,446,334 | |
| | 5,000 | | Michigan State Building Authority, Revenue Bonds, Facilities Program, Refunding Series 2011-II-A, 5.375%, 10/15/41 | 10/21 at 100.00 | | Aa2 | | 5,746,100 | |
| | 10,000 | | Michigan State Building Authority, Revenue Bonds, Facilities Program, Refunding Series 2015-I, 5.000%, 4/15/30 | 10/25 at 100.00 | | Aa2 | | 11,950,400 | |
| | 2,890 | | Oakland University, Michigan, General Revenue Bonds, Series 2012, 5.000%, 3/01/42 | No Opt. Call | | A1 | | 3,231,714 | |
| | 1,150 | | Royal Oak Hospital Finance Authority, Michigan, Hospital Revenue Bonds, William Beaumont Hospital, Refunding Series 2009V, 8.250%, 9/01/39 (Pre-refunded 9/01/18) | 9/18 at 100.00 | | Aaa | | 1,304,640 | |
| | 1,100 | | Wayne County Airport Authority, Michigan, Revenue Bonds, Detroit Metropolitan Wayne County Airport, Series 2015D, 5.000%, 12/01/45 | 12/25 at 100.00 | | A | | 1,268,091 | |
| | 68,775 | | Total Michigan | | | | | 75,878,986 | |
| | | | Minnesota – 0.9% | | | | | | |
| | 1,670 | | Breckenridge, Minnesota, Revenue Bonds, Catholic Health Initiatives, Series 2004A, 5.000%, 5/01/30 | 1/17 at 100.00 | | A– | | 1,675,645 | |
| | 6,375 | | Minneapolis, Minnesota, Health Care System Revenue Bonds, Fairview Hospital and Healthcare Services, Series 2008A, 6.625%, 11/15/28 (Pre-refunded 11/15/18) | 11/18 at 100.00 | | A+ (4) | | 7,109,272 | |
| | 3,200 | | Rochester, Minnesota, Health Care Facilities Revenue Bonds, Mayo Clinic, Refunding Series 2016B, 5.000%, 11/15/36 | No Opt. Call | | AA | | 4,221,600 | |
| | 6,730 | | Saint Paul Housing and Redevelopment Authority, Minnesota, Health Care Facility Revenue Bonds, HealthPartners Obligated Group, Series 2006, 5.250%, 5/15/36 (Pre-refunded 11/15/16) | 11/16 at 100.00 | | Aaa | | 6,741,778 | |
| | 17,975 | | Total Minnesota | | | | | 19,748,295 | |
| | | | Missouri – 0.9% | | | | | | |
| | 3,465 | | Missouri Health and Educational Facilities Authority, Health Facilities Revenue Bonds, CoxHealth, Series 2013A, 5.000%, 11/15/48 | 11/23 at 100.00 | | A2 | | 3,880,454 | |
| | 12,000 | | Missouri Health and Educational Facilities Authority, Revenue Bonds, SSM Health Care System, Series 2010B, 5.000%, 6/01/30 | 6/20 at 100.00 | | AA– | | 13,179,720 | |
| | | | Saint Louis, Missouri, Parking Revenue Bonds, Series 2006A: | | | | | | |
| | 1,875 | | 4.500%, 12/15/25 (Pre-refunded 12/15/16) | 12/16 at 100.00 | | AA– (4) | | 1,883,644 | |
| | 725 | | 4.500%, 12/15/25 (Pre-refunded 12/15/16) – NPFG Insured | 12/16 at 100.00 | | AA– (4) | | 728,350 | |
| | 18,065 | | Total Missouri | | | | | 19,672,168 | |
| | Principal | | | Optional Call | | | | | |
| | Amount (000) | | Description (1) | Provisions (2) | | Ratings (3) | | Value | |
| | | | Nebraska – 0.3% | | | | | | |
| $ | 1,400 | | Douglas County Hospital Authority 3, Nebraska, Health Facilities Revenue Bonds, Nebraska Methodist Health System, Refunding Series 2015, 5.000%, 11/01/45 | 11/25 at 100.00 | | A– | $ | 1,584,604 | |
| | 5,000 | | Omaha Public Power District, Nebraska, Electric System Revenue Bonds, Series 2008A, 5.500%, 2/01/39 (Pre-refunded 2/01/18) | 2/18 at 100.00 | | AA (4) | | 5,290,650 | |
| | 6,400 | | Total Nebraska | | | | | 6,875,254 | |
| | | | Nevada – 3.0% | | | | | | |
| | 2,000 | | Clark County, Nevada, Airport Revenue Bonds, Subordinate Lien Series 2007A-1, 5.000%, 7/01/26 – AMBAC Insured (Alternative Minimum Tax) | No Opt. Call | | A+ | | 2,045,620 | |
| | 5,075 | | Clark County, Nevada, Airport Revenue Bonds, Subordinate Lien Series 2010B, 5.750%, 7/01/42 | 1/20 at 100.00 | | A+ | | 5,764,845 | |
| | | | Las Vegas Valley Water District, Nevada, General Obligation Bonds, Refunding Series 2015: | | | | | | |
| | 5,220 | | 5.000%, 6/01/33 | 12/24 at 100.00 | | Aa1 | | 6,258,362 | |
| | 10,000 | | 5.000%, 6/01/34 | 12/24 at 100.00 | | Aa1 | | 11,948,500 | |
| | 9,000 | | 5.000%, 6/01/39 | 12/24 at 100.00 | | Aa1 | | 10,637,370 | |
| | 5,000 | | Las Vegas Valley Water District, Nevada, General Obligation Bonds, Refunding Water Improvement Series 2016A, 5.000%, 6/01/41 | 6/26 at 100.00 | | Aa1 | | 5,914,250 | |
| | 275 | | Nevada State, General Obligation Bonds, Municipal Bond Bank Projects R9A-R12, Refunding Series 2005F, 5.000%, 12/01/16 – AGM Insured | 11/16 at 100.00 | | AA+ | | 276,040 | |
| | 10,000 | | North Las Vegas, Nevada, General Obligation Bonds, Series 2006, 5.000%, 5/01/36 – NPFG Insured | 1/17 at 100.00 | | AA– | | 10,008,000 | |
| | 10,000 | | Reno, Nevada, Health Facility Revenue Bonds, Catholic Healthcare West, Series 2007A, 5.250%, 7/01/31 – BHAC Insured (UB) (7) | 7/17 at 100.00 | | AA+ | | 10,234,800 | |
| | 1,500 | | Sparks Tourism Improvement District 1, Legends at Sparks Marina, Nevada, Senior Sales Tax Revenue Bonds Series 2008A, 6.750%, 6/15/28 | 6/18 at 100.00 | | B1 | | 1,569,165 | |
| | 58,070 | | Total Nevada | | | | | 64,656,952 | |
| | | | New Hampshire – 0.1% | | | | | | |
| | 1,500 | | New Hampshire Business Finance Authority, Revenue Bonds, Elliot Hospital Obligated Group Issue, Series 2009A, 6.125%, 10/01/39 (Pre-refunded 10/01/19) | 10/19 at 100.00 | | Baa1 (4) | | 1,718,790 | |
| | | | New Jersey – 4.0% | | | | | | |
| | 930 | | New Jersey Economic Development Authority, Private Activity Bonds, The Goethals Bridge Replacement Project, Series 2013, 5.125%, 1/01/39 – AGM Insured (Alternative Minimum Tax) | 1/24 at 100.00 | | AA | | 1,056,554 | |
| | 2,550 | | New Jersey Economic Development Authority, Revenue Bonds, Motor Vehicle Surcharge, Series 2004A, 5.250%, 7/01/33 – NPFG Insured | 1/17 at 100.00 | | AA– | | 2,620,151 | |
| | 5,990 | | New Jersey Economic Development Authority, School Facilities Construction Bonds, Series 2005N-1, 5.500%, 9/01/25 – AGM Insured | No Opt. Call | | AA | | 7,307,021 | |
| | 4,000 | | New Jersey Economic Development Authority, School Facilities Construction Financing Program Bonds, Refunding Series 2013NN, 5.000%, 3/01/25 | 3/23 at 100.00 | | A3 | | 4,459,800 | |
| | 3,300 | | New Jersey Health Care Facilities Financing Authority, New Jersey, Revenue Bonds, Saint Peters University Hospital, Series 2007, 5.750%, 7/01/37 | 7/18 at 100.00 | | BB+ | | 3,450,414 | |
| | 4,740 | | New Jersey Health Care Facilities Financing Authority, Revenue Bonds, Saint Barnabas Health Care System, Refunding Series 2006B, 0.000%, 7/01/34 | 1/17 at 41.49 | | A+ | | 1,954,112 | |
| | 9,420 | | New Jersey Transportation Trust Fund Authority, Transportation System Bonds, Capital Appreciation Series 2010A, 0.000%, 12/15/31 | No Opt. Call | | A3 | | 4,831,047 | |
| | | | New Jersey Transportation Trust Fund Authority, Transportation System Bonds, Refunding Series 2006C: | | | | | | |
| | 30,000 | | 0.000%, 12/15/30 – FGIC Insured | No Opt. Call | | AA– | | 17,472,600 | |
| | 27,000 | | 0.000%, 12/15/32 – AGM Insured | No Opt. Call | | AA | | 14,291,640 | |
| | 6,095 | | New Jersey Transportation Trust Fund Authority, Transportation System Bonds, Series 2011B, 5.000%, 6/15/42 | No Opt. Call | | A3 | | 6,481,850 | |
| NUV | Nuveen Municipal Value Fund, Inc. | |
| | Portfolio of Investments (continued) | October 31, 2016 |
| | Principal | | | Optional Call | | | | | |
| | Amount (000) | | Description (1) | Provisions (2) | | Ratings (3) | | Value | |
| | | | New Jersey (continued) | | | | | | |
| $ | 4,500 | | New Jersey Transportation Trust Fund Authority, Transportation System Bonds, Series 2013AA, 5.000%, 6/15/29 | 6/23 at 100.00 | | A3 | $ | 4,971,825 | |
| | | | New Jersey Transportation Trust Fund Authority, Transportation System Bonds, Series 2015AA: | | | | | | |
| | 2,750 | | 5.250%, 6/15/32 | 6/25 at 100.00 | | A3 | | 3,098,865 | |
| | 2,150 | | 5.250%, 6/15/34 | 6/25 at 100.00 | | A3 | | 2,407,484 | |
| | 1,135 | | Rutgers State University, New Jersey, Revenue Bonds, Refunding Series 2013L, 5.000%, 5/01/43 | 5/23 at 100.00 | | Aa3 | | 1,316,804 | |
| | | | Tobacco Settlement Financing Corporation, New Jersey, Tobacco Settlement Asset-Backed Bonds, Series 2007-1A: | | | | | | |
| | 4,335 | | 4.625%, 6/01/26 | 6/17 at 100.00 | | B+ | | 4,355,375 | |
| | 6,215 | | 4.750%, 6/01/34 | 6/17 at 100.00 | | B– | | 5,987,904 | |
| | 115,110 | | Total New Jersey | | | | | 86,063,446 | |
| | | | New Mexico – 0.0% | | | | | | |
| | 910 | | University of New Mexico, Revenue Bonds, Refunding Series 1992A, 6.000%, 6/01/21 | No Opt. Call | | AA | | 1,009,600 | |
| | | | New York – 4.5% | | | | | | |
| | 9,490 | | Hudson Yards Infrastructure Corporation, New York, Revenue Bonds, Series 2006A, 5.000%, 2/15/47 – FGIC Insured | 2/17 at 100.00 | | A | | 9,603,880 | |
| | 5,160 | | Long Island Power Authority, New York, Electric System Revenue Bonds, Series 2008A, 5.500%, 5/01/33 (Pre-refunded 5/01/19) – BHAC Insured | 5/19 at 100.00 | | AA+ (4) | | 5,733,947 | |
| | 12,855 | | Long Island Power Authority, New York, Electric System Revenue Bonds, Series 2011A, 5.000%, 5/01/38 | 5/21 at 100.00 | | A– | | 14,354,022 | |
| | 5,000 | | Metropolitan Transportation Authority, New York, Transportation Revenue Bonds, Series 2016C-1, 5.000%, 11/15/39 | 11/26 at 100.00 | | AA– | | 5,870,700 | |
| | 1,510 | | New York City Industrial Development Agency, New York, Civic Facility Revenue Bonds, Vaughn College of Aeronautics, Series 2006B, 5.000%, 12/01/31 | 12/16 at 100.00 | | BB– | | 1,512,310 | |
| | 9,850 | | New York City Industrial Development Authority, New York, PILOT Revenue Bonds, Yankee Stadium Project, Series 2006, 4.750%, 3/01/46 – NPFG Insured | 1/17 at 100.00 | | AA– | | 9,882,111 | |
| | 3,525 | | New York City Municipal Water Finance Authority, New York, Water and Sewer System Revenue Bonds, Second Generation Resolution, Series 2009EE-2, 5.250%, 6/15/40 | No Opt. Call | | AA+ | | 3,895,654 | |
| | 1,680 | | New York City Transitional Finance Authority, New York, Future Tax Secured Bonds, Fiscal Series 2007B, 4.750%, 11/01/27 | 5/17 at 100.00 | | AAA | | 1,713,331 | |
| | 3,320 | | New York City Transitional Finance Authority, New York, Future Tax Secured Bonds, Fiscal Series 2007B, 4.750%, 11/01/27 (Pre-refunded 5/01/17) | 5/17 at 100.00 | | N/R (4) | | 3,387,595 | |
| | 10,000 | | New York Liberty Development Corporation, New York, Liberty Revenue Bonds, 3 World Trade Center Project, Class 1 Series 2014, 5.000%, 11/15/44 | 11/24 at 100.00 | | N/R | | 11,286,500 | |
| | 2,700 | | New York Liberty Development Corporation, New York, Liberty Revenue Bonds, 4 World Trade Center Project, Series 2011, 5.750%, 11/15/51 | No Opt. Call | | A+ | | 3,170,259 | |
| | 8,270 | | New York Transportation Development Corporation, Special Facilities Bonds, LaGuardia Airport Terminal B Redevelopment Project, Series 2016A, 5.250%, 1/01/50 (Alternative Minimum Tax) | 7/24 at 100.00 | | BBB | | 9,177,302 | |
| | 3,250 | | Port Authority of New York and New Jersey, Consolidated Revenue Bonds, One Hundred Forty Eighth Series 2007, 5.000%, 8/15/33 (Pre-refunded 8/15/17) – AGM Insured | 8/17 at 100.00 | | AA (4) | | 3,360,760 | |
| | 9,925 | | Port Authority of New York and New Jersey, Special Project Bonds, JFK International Air Terminal LLC Project, Eighth Series 2010, 6.000%, 12/01/42 | 12/20 at 100.00 | | Baa1 | | 11,516,375 | |
| | 3,000 | | Triborough Bridge and Tunnel Authority, New York, General Purpose Revenue Bonds, Refunding Series 2015A, 5.000%, 11/15/50 | 5/25 at 100.00 | | AA– | | 3,468,540 | |
| | 89,535 | | Total New York | | | | | 97,933,286 | |
| | Principal | | | Optional Call | | | | | |
| | Amount (000) | | Description (1) | Provisions (2) | | Ratings (3) | | Value | |
| | | | North Carolina – 0.6% | | | | | | |
| $ | 3,000 | | Charlotte-Mecklenburg Hospital Authority, North Carolina, Health Care Revenue Bonds, DBA Carolinas HealthCare System, Series 2008A, 5.000%, 1/15/47 (Pre-refunded 1/15/18) | 1/18 at 100.00 | | AA– (4) | $ | 3,151,260 | |
| | 1,500 | | Charlotte-Mecklenburg Hospital Authority, North Carolina, Health Care Revenue Bonds, DBA Carolinas HealthCare System, Series 2011A, 5.125%, 1/15/37 | 1/21 at 100.00 | | AA– | | 1,679,115 | |
| | | | North Carolina Department of Transportation, Private Activity Revenue Bonds, I-77 Hot Lanes Project, Series 2015: | | | | | | |
| | 905 | | 5.000%, 12/31/37 (Alternative Minimum Tax) | 6/25 at 100.00 | | BBB– | | 1,013,582 | |
| | 2,025 | | 5.000%, 6/30/54 (Alternative Minimum Tax) | 6/25 at 100.00 | | BBB– | | 2,214,176 | |
| | 2,010 | | North Carolina Medical Care Commission, Health Care Facilities Revenue Bonds, Duke University Health System, Series 2010A, 5.000%, 6/01/42 (Pre-refunded 6/01/20) | 6/20 at 100.00 | | AA (4) | | 2,285,310 | |
| | 1,255 | | North Carolina Medical Care Commission, Health System Revenue Bonds, Mission Health Combined Group, Series 2007, 4.500%, 10/01/31 | 10/17 at 100.00 | | AA– | | 1,288,559 | |
| | 745 | | North Carolina Medical Care Commission, Health System Revenue Bonds, Mission Health Combined Group, Series 2007, 4.500%, 10/01/31 (Pre-refunded 10/01/17) | 10/17 at 100.00 | | N/R (4) | | 770,889 | |
| | 11,440 | | Total North Carolina | | | | | 12,402,891 | |
| | | | North Dakota – 0.4% | | | | | | |
| | 7,820 | | Fargo, North Dakota, Health System Revenue Bonds, Sanford Health, Refunding Series 2011, 6.250%, 11/01/31 | 11/21 at 100.00 | | A+ | | 9,389,787 | |
| | | | Ohio – 5.0% | | | | | | |
| | 9,405 | | American Municipal Power Ohio Inc., Prairie State Energy Campus Project Revenue Bonds, Series 2008A, 5.250%, 2/15/43 (Pre-refunded 2/15/18) | 2/18 at 100.00 | | N/R (4) | | 9,937,981 | |
| | 595 | | American Municipal Power Ohio Inc., Prairie State Energy Campus Project Revenue Bonds, Series 2008A, 5.250%, 2/15/43 | 2/18 at 100.00 | | A1 | | 623,971 | |
| | | | Buckeye Tobacco Settlement Financing Authority, Ohio, Tobacco Settlement Asset-Backed Revenue Bonds, Senior Lien, Series 2007A-2: | | | | | | |
| | 6,615 | | 5.375%, 6/01/24 | 6/17 at 100.00 | | B– | | 6,536,149 | |
| | 6,075 | | 5.125%, 6/01/24 | 6/17 at 100.00 | | B– | | 5,758,493 | |
| | 12,205 | | 5.875%, 6/01/30 | 6/17 at 100.00 | | B– | | 11,566,068 | |
| | 17,165 | | 5.750%, 6/01/34 | 6/17 at 100.00 | | B– | | 16,089,269 | |
| | 4,020 | | 6.000%, 6/01/42 | 6/17 at 100.00 | | B– | | 3,856,627 | |
| | 11,940 | | 5.875%, 6/01/47 | 6/17 at 100.00 | | B– | | 11,300,852 | |
| | 16,415 | | Buckeye Tobacco Settlement Financing Authority, Ohio, Tobacco Settlement Asset-Backed Revenue Bonds, Senior Lien, Series 2007A-3, 6.250%, 6/01/37 | 6/22 at 100.00 | | B– | | 16,035,321 | |
| | 1,730 | | Lucas County, Ohio, Hospital Revenue Bonds, ProMedica Healthcare Obligated Group, Series 2011A, 6.000%, 11/15/41 | 11/21 at 100.00 | | AA | | 2,062,852 | |
| | 13,000 | | Ohio Air Quality Development Authority, Ohio, Pollution Control Revenue Bonds, FirstEnergy Generation Corporation Project, Refunding Series 2009D, 4.250%, 8/01/29 (Mandatory put 9/15/21) | No Opt. Call | | B | | 12,800,580 | |
| | 4,110 | | Ohio State, Private Activity Bonds, Portsmouth Gateway Group, LLC – Borrower, Portsmouth Bypass Project, Series 2015, 5.000%, 12/31/39 – AGM Insured (Alternative Minimum Tax) | 6/25 at 100.00 | | AA | | 4,642,656 | |
| | 4,975 | | Ohio Turnpike Commission, Turnpike Revenue Bonds, Infrastructure Project, Junior Lien Series 2013A-1, 5.000%, 2/15/48 | 2/23 at 100.00 | | A+ | | 5,602,696 | |
| | 108,250 | | Total Ohio | | | | | 106,813,515 | |
| | | | Oklahoma – 0.3% | | | | | | |
| | 1,400 | | Fort Sill Apache Tribe of Oklahoma Economic Development Authority, Gaming Enterprise Revenue Bonds, Fort Sill Apache Casino, Series 2011A, 8.500%, 8/25/26 | 8/21 at 100.00 | | N/R | | 1,667,120 | |
| | 2,000 | | Norman Regional Hospital Authority, Oklahoma, Hospital Revenue Bonds, Series 2007, 5.125%, 9/01/37 | 9/17 at 100.00 | | BBB+ | | 2,018,560 | |
| NUV | Nuveen Municipal Value Fund, Inc. | |
| | Portfolio of Investments (continued) | October 31, 2016 |
| | Principal | | | Optional Call | | | | | |
| | Amount (000) | | Description (1) | Provisions (2) | | Ratings (3) | | Value | |
| | | | Oklahoma (continued) | | | | | | |
| | | | Oklahoma Development Finance Authority, Health System Revenue Bonds, Integris Baptist Medical Center, Refunding Series 2015A: | | | | | | |
| $ | 1,590 | | 5.000%, 8/15/27 | 8/25 at 100.00 | | AA– | $ | 1,947,734 | |
| | 1,250 | | 5.000%, 8/15/29 | 8/25 at 100.00 | | AA– | | 1,510,238 | |
| | 6,240 | | Total Oklahoma | | | | | 7,143,652 | |
| | | | Oregon – 0.1% | | | | | | |
| | 760 | | Oregon Facilities Authority, Revenue Bonds, Willamette University, Series 2007A, 5.000%, 10/01/32 | 10/17 at 100.00 | | A | | 785,232 | |
| | 2,100 | | Oregon Facilities Authority, Revenue Bonds, Willamette University, Series 2007A, 5.000%, 10/01/32 (Pre-refunded 10/01/17) | 10/17 at 100.00 | | N/R (4) | | 2,182,257 | |
| | 2,860 | | Total Oregon | | | | | 2,967,489 | |
| | | | Pennsylvania – 0.8% | | | | | | |
| | | | Pennsylvania State University, Revenue Bonds, Series 2016A: | | | | | | |
| | 1,325 | | 5.000%, 9/01/35 | 9/26 at 100.00 | | Aa1 | | 1,590,398 | |
| | 1,675 | | 5.000%, 9/01/36 | 9/26 at 100.00 | | Aa1 | | 2,005,695 | |
| | 1,250 | | Pennsylvania Turnpike Commission, Motor License Fund-Enhanced Turnpike Subordinate Special Revenue Bonds, Series 2014A, 0.000%, 12/01/37 (5) | No Opt. Call | | AA– | | 1,110,400 | |
| | 2,715 | | Pennsylvania Turnpike Commission, Motor License Fund-Enhanced Turnpike Subordinate Special Revenue, Series 2011B, 5.000%, 12/01/41 | 12/21 at 100.00 | | AA– | | 3,027,442 | |
| | 7,500 | | Pennsylvania Turnpike Commission, Motor License Fund-Enhanced Turnpike Subordinate Special Revenue, Series 2013A, 5.000%, 12/01/43 | 12/22 at 100.00 | | AA– | | 8,506,575 | |
| | 14,465 | | Total Pennsylvania | | | | | 16,240,510 | |
| | | | South Carolina – 1.8% | | | | | | |
| | | | Piedmont Municipal Power Agency, South Carolina, Electric Revenue Bonds, Series 2004A-2: | | | | | | |
| | 12,760 | | 0.000%, 1/01/28 – AMBAC Insured | No Opt. Call | | AA | | 9,287,366 | |
| | 9,535 | | 0.000%, 1/01/29 – AMBAC Insured | No Opt. Call | | AA | | 6,673,070 | |
| | 3,000 | | South Carolina Public Service Authority, Electric System Revenue Bonds, Santee Cooper, Refunding Series 2011B, 5.000%, 12/01/16 | No Opt. Call | | AA– | | 3,010,950 | |
| | | | South Carolina Public Service Authority, Santee Cooper Revenue Obligations, Refunding & Improvement Series 2015A: | | | | | | |
| | 5,500 | | 5.000%, 12/01/50 | 6/25 at 100.00 | | AA– | | 6,198,170 | |
| | 8,000 | | 5.000%, 12/01/55 | 6/25 at 100.00 | | AA– | | 9,009,200 | |
| | 3,455 | | South Carolina Public Service Authority, Santee Cooper Revenue Obligations, Series 2014A, 5.500%, 12/01/54 | 6/24 at 100.00 | | AA– | | 4,075,380 | |
| | 42,250 | | Total South Carolina | | | | | 38,254,136 | |
| | | | Tennessee – 0.5% | | | | | | |
| | 2,780 | | Jackson, Tennessee, Hospital Revenue Bonds, Jackson-Madison County General Hospital Project, Refunding & Improvement Series 2008, 5.625%, 4/01/38 | 4/18 at 100.00 | | A+ | | 2,940,100 | |
| | 7,520 | | Jackson, Tennessee, Hospital Revenue Bonds, Jackson-Madison County General Hospital Project, Refunding & Improvement Series 2008, 5.625%, 4/01/38 (Pre-refunded 4/01/18) | 4/18 at 100.00 | | N/R (4) | | 8,027,299 | |
| | 10,300 | | Total Tennessee | | | | | 10,967,399 | |
| | | | Texas – 13.7% | | | | | | |
| | 2,000 | | Austin Convention Enterprises Inc., Texas, Convention Center Hotel Revenue Bonds, Second Tier Series 2006B, 5.750%, 1/01/34 | 1/17 at 100.00 | | BB | | 2,009,120 | |
| | 5,560 | | Beaumont Independent School District, Jefferson County, Texas, General Obligation Bonds, Series 2008, 5.000%, 2/15/38 (Pre-refunded 2/15/17) | 2/17 at 100.00 | | AAA | | 5,629,222 | |
| | 5,110 | | Brazos River Authority, Texas, Pollution Control Revenue Refunding Bonds, TXU Electric Company, Series 1999C, 7.700%, 3/01/32 (Alternative Minimum Tax) (6) | 1/17 at 100.00 | | N/R | | 176,142 | |
| | Principal | | | Optional Call | | | | | |
| | Amount (000) | | Description (1) | Provisions (2) | | Ratings (3) | | Value | |
| | | | Texas (continued) | | | | | | |
| $ | 2,100 | | Carrollton-Farmers Branch Independent School District, Dallas County, Texas, General Obligation Bonds, Series 2007, 4.500%, 2/15/17 | No Opt. Call | | AAA | $ | 2,123,856 | |
| | 2,420 | | Central Texas Regional Mobility Authority, Revenue Bonds, Refunding Senior Lien Series 2013A, 5.000%, 1/01/43 | 1/23 at 100.00 | | BBB+ | | 2,671,898 | |
| | 5,355 | | Central Texas Regional Mobility Authority, Revenue Bonds, Refunding Subordinate Lien Series 2016, 4.000%, 1/01/41 | 1/26 at 100.00 | | BBB | | 5,558,972 | |
| | 7,500 | | Dallas-Fort Worth International Airport, Texas, Joint Revenue Bonds, Improvement Series 2012D, 5.000%, 11/01/38 (Alternative Minimum Tax) | No Opt. Call | | A+ | | 8,361,225 | |
| | 240 | | Decatur Hospital Authority, Texas, Revenue Bonds, Wise Regional Health System, Series 2014A, 5.250%, 9/01/44 | 9/24 at 100.00 | | BB+ | | 257,023 | |
| | 5,000 | | El Paso County Hospital District, Texas, General Obligation Bonds, Certificates of Obligation, Series 2013, 5.000%, 8/15/39 | 8/23 at 100.00 | | AA– | | 5,588,700 | |
| | 6,005 | | Friendswood Independent School District, Galveston County, Texas, General Obligation Bonds, Schoolhouse Series 2008, 5.000%, 2/15/37 (Pre-refunded 2/15/18) | 2/18 at 100.00 | | AAA | | 6,327,889 | |
| | 27,340 | | Grand Parkway Transportation Corporation, Texas, System Toll Revenue Bonds, Subordinate Lien Series 2013B, 5.000%, 4/01/53 | 10/23 at 100.00 | | AA+ | | 31,684,326 | |
| | 2,845 | | Harris County Cultural Education Facilities Finance Corporation, Texas, Revenue Bonds, Houston Methodist Hospital System, Series 2015, 4.000%, 12/01/45 | 6/25 at 100.00 | | AA | | 2,988,388 | |
| | 5,000 | | Harris County Hospital District, Texas, Revenue Bonds, Series 2007A, 5.250%, 2/15/42 (Pre-refunded 2/15/17) – NPFG Insured | 2/17 at 100.00 | | AA+ (4) | | 5,066,000 | |
| | 5,000 | | Harris County, Texas, Toll Road Revenue Bonds, Refunding Senior Lien Series 2016A, 5.000%, 8/15/41 | 8/26 at 100.00 | | Aa2 | | 5,917,100 | |
| | 7,295 | | Harris County-Houston Sports Authority, Texas, Revenue Bonds, Capital Appreciation Refunding Senior Lien Series 2014A, 0.000%, 11/15/50 – AGM Insured | 11/31 at 39.79 | | AA | | 1,622,408 | |
| | 11,900 | | Harris County-Houston Sports Authority, Texas, Revenue Bonds, Junior Lien Series 2001H, 0.000%, 11/15/27 – NPFG Insured | No Opt. Call | | AA– | | 8,131,032 | |
| | 1,845 | | Harris County-Houston Sports Authority, Texas, Revenue Bonds, Refunding Second Lien Series 2014C, 5.000%, 11/15/32 | 11/24 at 100.00 | | A3 | | 2,116,750 | |
| | 14,905 | | Harris County-Houston Sports Authority, Texas, Revenue Bonds, Third Lien Series 2004A-3, 0.000%, 11/15/33 – NPFG Insured | 11/24 at 59.10 | | AA– | | 6,493,214 | |
| | | | Houston, Texas, Hotel Occupancy Tax and Special Revenue Bonds, Convention and Entertainment Project, Series 2001B: | | | | | | |
| | 24,755 | | 0.000%, 9/01/29 – AMBAC Insured | No Opt. Call | | A2 | | 16,705,169 | |
| | 12,940 | | 0.000%, 9/01/30 – AMBAC Insured | No Opt. Call | | A2 | | 8,418,764 | |
| | 10,000 | | 0.000%, 9/01/31 – AMBAC Insured | No Opt. Call | | A2 | | 6,122,500 | |
| | 5,120 | | Leander Independent School District, Williamson and Travis Counties, Texas, General Obligation Bonds, Refunding Series 2015A, 5.000%, 8/15/39 | 8/25 at 100.00 | | AAA | | 6,035,661 | |
| | 2,000 | | Love Field Airport Modernization Corporation, Texas, Special Facilities Revenue Bonds, Southwest Airlines Company – Love Field Modernization Program Project, Series 2012, 5.000%, 11/01/28 (Alternative Minimum Tax) | 11/22 at 100.00 | | Baa1 | | 2,270,420 | |
| | 1,750 | | Martin County Hospital District, Texas, Combination Limited Tax and Revenue Bonds, Series 2011A, 7.250%, 4/01/36 | 4/21 at 100.00 | | BBB | | 1,949,990 | |
| | 5,420 | | North Texas Municipal Water District, Water System Revenue Bonds, Refunding & Improvement Series 2012, 5.000%, 9/01/26 | 3/22 at 100.00 | | AAA | | 6,405,031 | |
| | | | North Texas Tollway Authority, System Revenue Bonds, Refunding First Tier Capital Appreciation Series 2008I: | | | | | | |
| | 30,000 | | 6.200%, 1/01/42 – AGC Insured | 1/25 at 100.00 | | AA | | 38,908,500 | |
| | 5,220 | | 6.500%, 1/01/43 | 1/25 at 100.00 | | A1 | | 6,669,229 | |
| | 765 | | North Texas Tollway Authority, System Revenue Bonds, Refunding First Tier, Series 2008A, 5.750%, 1/01/40 – BHAC Insured | 1/18 at 100.00 | | AA+ | | 803,541 | |
| NUV | Nuveen Municipal Value Fund, Inc. | |
| | Portfolio of Investments (continued) | October 31, 2016 |
| | Principal | | | Optional Call | | | | | |
| | Amount (000) | | Description (1) | Provisions (2) | | Ratings (3) | | Value | |
| | | | Texas (continued) | | | | | | |
| $ | 3,190 | | North Texas Tollway Authority, System Revenue Bonds, Refunding First Tier, Series 2008A, 5.750%, 1/01/40 (Pre-refunded 1/01/18) | 1/18 at 100.00 | | AA+ (4) | $ | 3,372,372 | |
| | 2,365 | | North Texas Tollway Authority, System Revenue Bonds, Refunding First Tier, Series 2008A, 5.750%, 1/01/40 (Pre-refunded 1/01/18) – BHAC Insured | 1/18 at 100.00 | | AA+ (4) | | 2,500,207 | |
| | 15,450 | | North Texas Tollway Authority, System Revenue Bonds, Refunding First Tier, Series 2008D, 0.000%, 1/01/36 – AGC Insured | No Opt. Call | | AA | | 7,601,400 | |
| | 9,020 | | North Texas Tollway Authority, System Revenue Bonds, Refunding First Tier, Series 2015B, 5.000%, 1/01/40 | 1/23 at 100.00 | | A1 | | 10,334,304 | |
| | 9,100 | | North Texas Tollway Authority, System Revenue Bonds, Refunding Second Tier, Series 2015A, 5.000%, 1/01/32 | 1/25 at 100.00 | | A2 | | 10,646,272 | |
| | 2,000 | | Sabine River Authority, Texas, Pollution Control Revenue Refunding Bonds, TXU Electric Company, Series 2003A, 5.800%, 7/01/22 (6) | 1/17 at 100.00 | | N/R | | 68,940 | |
| | 11,585 | | Tarrant County Cultural & Educational Facilities Financing Corporation, Texas, Revenue Bonds, Tender Option Bond Trust 2016-XG0013, 8.611%, 2/15/36 (Pre-refunded 2/15/17) (IF) (7) | 2/17 at 100.00 | | AA (4) | | 11,872,771 | |
| | | | Tarrant County Cultural Education Facilities Finance Corporation, Texas, Hospital Revenue Bonds, Scott & White Healthcare Project, Series 2010: | | | | | | |
| | 355 | | 5.500%, 8/15/45 (Pre-refunded 8/15/20) | 8/20 at 100.00 | | N/R (4) | | 412,915 | |
| | 4,455 | | 5.500%, 8/15/45 (Pre-refunded 8/15/20) | 8/20 at 100.00 | | AA– (4) | | 5,181,789 | |
| | 1,620 | | Tarrant County Cultural Education Facilities Finance Corporation, Texas, Hospital Revenue Bonds, Scott & White Healthcare Project, Series 2016A, 4.000%, 11/15/42 | 5/26 at 100.00 | | AA– | | 1,720,310 | |
| | 3,970 | | Tarrant County Cultural Education Facilities Finance Corporation, Texas, Revenue Bonds, Christus Health, Refunding Series 2008A, 6.500%, 7/01/37 – AGC Insured | 1/19 at 100.00 | | AA | | 4,369,978 | |
| | 1,030 | | Tarrant County Cultural Education Facilities Finance Corporation, Texas, Revenue Bonds, Christus Health, Refunding Series 2008A, 6.500%, 7/01/37 (Pre-refunded 1/01/19) – AGC Insured | 1/19 at 100.00 | | AA (4) | | 1,149,099 | |
| | 6,435 | | Tarrant County Cultural Education Facilities Finance Corporation, Texas, Revenue Bonds, Texas Health Resources, Refunding Series 2007A, 5.000%, 2/15/20 (Pre-refunded 2/15/17) | 2/17 at 100.00 | | AA (4) | | 6,514,923 | |
| | | | Texas Municipal Gas Acquisition and Supply Corporation III, Gas Supply Revenue Bonds, Series 2012: | | | | | | |
| | 2,500 | | 5.000%, 12/15/26 | No Opt. Call | | A3 | | 2,860,325 | |
| | 10,400 | | 5.000%, 12/15/32 | No Opt. Call | | A3 | | 11,604,320 | |
| | 7,180 | | Texas Transportation Commission, Central Texas Turnpike System Revenue Bonds, First Tier Refunding Series 2012A, 5.000%, 8/15/41 | 8/22 at 100.00 | | A– | | 8,137,453 | |
| | 3,000 | | Texas Transportation Commission, Central Texas Turnpike System Revenue Bonds, First Tier Refunding Series 2015B, 5.000%, 8/15/37 | 8/24 at 100.00 | | A– | | 3,452,070 | |
| | 1,750 | | Texas Transportation Commission, Central Texas Turnpike System Revenue Bonds, Second Tier Refunding Series 2015C, 5.000%, 8/15/33 | 8/24 at 100.00 | | BBB+ | | 2,013,708 | |
| | 5,500 | | Texas Turnpike Authority, Central Texas Turnpike System Revenue Bonds, First Tier Series 2002A, 0.000%, 8/15/25 – AMBAC Insured | No Opt. Call | | A– | | 4,391,090 | |
| | 316,295 | | Total Texas | | | | | 295,216,316 | |
| | | | Virginia – 2.4% | | | | | | |
| | 1,500 | | Fairfax County Economic Development Authority, Virginia, Residential Care Facilities Mortgage Revenue Bonds, Goodwin House, Inc., Series 2007A, 5.125%, 10/01/42 (Pre-refunded 10/01/17) | 10/17 at 100.00 | | BBB (4) | | 1,560,465 | |
| | 14,110 | | Metropolitan Washington Airports Authority, Virginia, Dulles Toll Road Revenue Bonds, Dulles Metrorail & Capital Improvement Project, Refunding Second Senior Lien Series 2014A, 5.000%, 10/01/53 | 4/22 at 100.00 | | BBB+ | | 15,688,345 | |
| | 10,000 | | Metropolitan Washington Airports Authority, Virginia, Dulles Toll Road Revenue Bonds, Dulles Metrorail Capital Appreciation, Second Senior Lien Series 2010B, 0.000%, 10/01/44 (5) | 10/28 at 100.00 | | BBB+ | | 11,790,200 | |
| | 870 | | Stafford County and Staunton Industrial Development Authority, Virginia, Revenue Bonds, Virginia Municipal League and Virginia Association of Counties Finance Program, Series 2007C, 5.000%, 2/01/37 – SYNCORA GTY Insured | 2/17 at 100.00 | | N/R | | 873,750 | |
| | Principal | | | Optional Call | | | | | |
| | Amount (000) | | Description (1) | Provisions (2) | | Ratings (3) | | Value | |
| | | | Virginia (continued) | | | | | | |
| $ | 400 | | Stafford County and Staunton Industrial Development Authority, Virginia, Revenue Bonds, Virginia Municipal League and Virginia Association of Counties Finance Program, Series 2007C, 5.000%, 2/01/37 (Pre-refunded 2/01/17) – SYNCORA GTY Insured | 2/17 at 100.00 | | N/R (4) | $ | 404,280 | |
| | | | Stafford County and Staunton Industrial Development Authority, Virginia, Revenue Bonds, Virginia Municipal League and Virginia Association of Counties Finance Program, Series 2007C: | | | | | | |
| | 640 | | 5.000%, 2/01/37 (Pre-refunded 2/01/17) – SYNCORA GTY Insured | 2/17 at 100.00 | | N/R (4) | | 646,848 | |
| | 845 | | 5.000%, 2/01/37 (Pre-refunded 2/01/17) – SYNCORA GTY Insured | 2/17 at 100.00 | | N/R (4) | | 854,042 | |
| | 1,415 | | 5.000%, 2/01/37 (Pre-refunded 2/01/17) – SYNCORA GTY Insured | 2/17 at 100.00 | | N/R (4) | | 1,430,282 | |
| | 2,505 | | 5.000%, 2/01/37 (Pre-refunded 2/01/17) – SYNCORA GTY Insured | 2/17 at 100.00 | | N/R (4) | | 2,531,804 | |
| | 4,355 | | Tobacco Settlement Financing Corporation of Virginia, Tobacco Settlement Asset Backed Bonds, Series 2007B1, 5.000%, 6/01/47 | 6/17 at 100.00 | | B– | | 4,093,569 | |
| | | | Virginia Small Business Financing Authority, Senior Lien Revenue Bonds, Elizabeth River Crossing, Opco LLC Project, Series 2012: | | | | | | |
| | 4,180 | | 5.250%, 1/01/32 (Alternative Minimum Tax) | 7/22 at 100.00 | | BBB | | 4,708,352 | |
| | 1,650 | | 6.000%, 1/01/37 (Alternative Minimum Tax) | 7/22 at 100.00 | | BBB | | 1,925,583 | |
| | 3,770 | | 5.500%, 1/01/42 (Alternative Minimum Tax) | 7/22 at 100.00 | | BBB | | 4,240,081 | |
| | 46,240 | | Total Virginia | | | | | 50,747,601 | |
| | | | Washington – 2.2% | | | | | | |
| | | | Port of Seattle, Washington, Revenue Bonds, Refunding Intermediate Lien Series 2016: | | | | | | |
| | 1,930 | | 5.000%, 2/01/29 | 2/26 at 100.00 | | A+ | | 2,344,989 | |
| | 1,000 | | 5.000%, 2/01/30 | 2/26 at 100.00 | | A+ | | 1,206,200 | |
| | 3,780 | | Washington Health Care Facilities Authority, Revenue Bonds, Fred Hutchinson Cancer Research Center, Series 2011A, 5.625%, 1/01/35 | 1/21 at 100.00 | | A | | 4,215,191 | |
| | 2,400 | | Washington Health Care Facilities Authority, Revenue Bonds, Kadlec Regional Medical Center, Series 2010, 5.375%, 12/01/33 (Pre-refunded 12/01/20) | 12/20 at 100.00 | | N/R (4) | | 2,807,496 | |
| | 12,000 | | Washington Health Care Facilities Authority, Revenue Bonds, Providence Health & Services, Refunding Series 2012A, 5.000%, 10/01/33 | 10/22 at 100.00 | | AA– | | 13,771,800 | |
| | 2,500 | | Washington State Health Care Facilities Authority, Revenue Bonds, Northwest Hospital and Medical Center of Seattle, Series 2007, 5.700%, 12/01/32 (Pre-refunded 12/04/17) | 12/17 at 100.00 | | N/R (4) | | 2,630,875 | |
| | 2,185 | | Washington State Health Care Facilities Authority, Revenue Bonds, Virginia Mason Medical Center, Series 2007B, 5.000%, 2/15/27 – NPFG Insured | 8/17 at 100.00 | | AA– | | 2,244,498 | |
| | | | Washington State, Motor Vehicle Fuel Tax General Obligation Bonds, Series 2002-03C: | | | | | | |
| | 9,100 | | 0.000%, 6/01/29 – NPFG Insured | No Opt. Call | | AA+ | | 6,831,552 | |
| | 16,195 | | 0.000%, 6/01/30 – NPFG Insured | No Opt. Call | | AA+ | | 11,783,320 | |
| | 51,090 | | Total Washington | | | | | 47,835,921 | |
| | | | West Virginia – 0.2% | | | | | | |
| | 3,000 | | West Virginia Hospital Finance Authority, Hospital Revenue Bonds, West Virginia United Health System Obligated Group, Refunding & Improvement Series 2013A, 5.500%, 6/01/44 | 6/23 at 100.00 | | A | | 3,477,000 | |
| | | | Wisconsin – 3.6% | | | | | | |
| | 5,000 | | Wisconsin Health and Educational Facilities Authority, Revenue Bonds, Ascension Health Alliance Senior Credit Group, Series 2012D, 5.000%, 11/15/41 | No Opt. Call | | AA+ | | 5,674,450 | |
| | 10,350 | | Wisconsin Health and Educational Facilities Authority, Revenue Bonds, Ascension Health Alliance Senior Credit Group, Series 2016A, 4.000%, 11/15/46 | 5/26 at 100.00 | | AA+ | | 10,921,320 | |
| | 7,115 | | Wisconsin Health and Educational Facilities Authority, Revenue Bonds, Ascension Health, Senior Credit Group, Series 2010E, 5.000%, 11/15/33 | 11/19 at 100.00 | | AA+ | | 7,892,670 | |
| | 2,375 | | Wisconsin Health and Educational Facilities Authority, Revenue Bonds, Marshfield Clinic, Series 2012B, 5.000%, 2/15/40 | 2/22 at 100.00 | | A– | | 2,622,119 | |
| | 4,410 | | Wisconsin Health and Educational Facilities Authority, Revenue Bonds, Mercy Alliance, Inc., Series 2012, 5.000%, 6/01/39 | 6/22 at 100.00 | | A3 | | 4,885,310 | |
| NUV | Nuveen Municipal Value Fund, Inc. | |
| | Portfolio of Investments (continued) | October 31, 2016 |
| | Principal | | | Optional Call | | | | | |
| | Amount (000) | | Description (1) | Provisions (2) | | Ratings (3) | | Value | |
| | | | Wisconsin (continued) | | | | | | |
| $ | 2,500 | | Wisconsin Health and Educational Facilities Authority, Revenue Bonds, Meriter Hospital, Inc., Series 2009, 6.000%, 12/01/38 (Pre-refunded 12/01/18) | 12/18 at 100.00 | | N/R (4) | $ | 2,765,200 | |
| | | | Wisconsin Health and Educational Facilities Authority, Revenue Bonds, Meriter Hospital, Inc., Series 2011A: | | | | | | |
| | 3,500 | | 5.750%, 5/01/35 (Pre-refunded 5/01/21) | 5/21 at 100.00 | | N/R (4) | | 4,206,685 | |
| | 5,000 | | 6.000%, 5/01/41 (Pre-refunded 5/01/21) | 5/21 at 100.00 | | N/R (4) | | 6,064,250 | |
| | 6,600 | | Wisconsin Health and Educational Facilities Authority, Revenue Bonds, Ministry Health Care, Inc., Refunding 2012C, 5.000%, 8/15/32 (Pre-refunded 8/15/22) | 8/22 at 100.00 | | AA (4) | | 7,977,486 | |
| | 10,000 | | Wisconsin Health and Educational Facilities Authority, Revenue Bonds, SSM Healthcare System, Series 2010A, 5.000%, 6/01/30 | 6/20 at 100.00 | | AA– | | 11,056,000 | |
| | 2,550 | | Wisconsin State, General Fund Annual Appropriation Revenue Bonds, Refunding Series 2009A, 5.750%, 5/01/33 | 5/19 at 100.00 | | AA– | | 2,829,812 | |
| | 8,945 | | Wisconsin State, General Fund Annual Appropriation Revenue Bonds, Refunding Series 2009A, 6.250%, 5/01/37 (Pre-refunded 5/01/19) | 5/19 at 100.00 | | AA– (4) | | 10,109,997 | |
| | 68,345 | | Total Wisconsin | | | | | 77,005,299 | |
| | | | Wyoming – 0.2% | | | | | | |
| | 2,035 | | Campbell County, Wyoming Solid Waste Facilities Revenue Bonds, Basin Electric Power Cooperative – Dry Fork Station Facilities, Series 2009A, 5.750%, 7/15/39 | 7/19 at 100.00 | | A | | 2,257,527 | |
| | 1,850 | | West Park Hospital District, Wyoming, Hospital Revenue Bonds, Series 2011A, 7.000%, 6/01/40 | 6/21 at 100.00 | | BBB | | 2,149,552 | |
| | 3,885 | | Total Wyoming | | | | | 4,407,079 | |
| $ | 2,281,326 | | Total Municipal Bonds (cost $1,905,451,459) | | | | | 2,124,128,110 | |
| | Principal | | | | | | | | | |
| | Amount (000) | | Description (1) | Coupon | Maturity | | Ratings (3) | | Value | |
| | | | CORPORATE BONDS – 0.0% | | | | | | | |
| | | | Transportation – 0.0% | | | | | | | |
| $ | 841 | | Las Vegas Monorail Company, Senior Interest Bonds, PIK, (8), (9) | 5.500% | 7/15/19 | | N/R | $ | 512,915 | |
| | 224 | | Las Vegas Monorail Company, Senior Interest Bonds (8), (9) | 5.500% | 7/15/55 | | N/R | | 111,641 | |
| $ | 1,065 | | Total Corporate Bonds (cost $95,463) | | | | | | 624,556 | |
| | | | Total Long-Term Investments (cost $1,905,546,922) | | | | | | 2,124,752,666 | |
| | | | | | | | | | | |
| | Principal | | | | Optional Call | | | | | |
| | Amount (000) | | Description (1) | | Provisions (2) | | Ratings (3) | | Value | |
| | | | SHORT-TERM INVESTMENTS – 0.9% | | | | | | | |
| | | | MUNICIPAL BONDS – 0.9% | | | | | | | |
| | | | California – 0.1% | | | | | | | |
| $ | 2,000 | | Bay Area Toll Authority, California, Revenue Bonds, San Francisco Bay Area Toll Bridge, Tender Option Bonds Floater 1043, 0.530%, 4/01/39 (10) | | 4/18 at 100.00 | | VMIG-2 | $ | 2,000,000 | |
| | | | Michigan – 0.2% | | | | | | | |
| | 5,000 | | Michigan State Building Authority, Revenue Bonds, Facilities Program, Tender Option Bond Floater 2015-XM0123, 1.030%, 4/15/34 (10) | | 10/25 at 100.00 | | F-1+ | | 5,000,000 | |
| | | | New Jersey – 0.3% | | | | | | | |
| | 6,250 | | New Jersey Transportation Trust Fund Authority, Transportation System Bonds, Tender Option Bond Floater 2012-ZF0468, 0.700%, 6/15/36 (10) | | 6/21 at 100.00 | | F-1+ | | 6,250,000 | |
| | | | New York – 0.0% | | | | | | | |
| | 700 | | New York State Thruway Authority, General Revenue Bonds, Tender Option Bond Floater 2016-ZF0482, 0.510%, 1/01/37 (10) | | 1/18 at 100.00 | | A-1 | | 700,000 | |
| | Principal | | | Optional Call | | | | | |
| | Amount (000) | | Description (1) | Provisions (2) | | Ratings (3) | | Value | |
| | | | Ohio – 0.2% | | | | | | |
| $ | 4,000 | | Ohio State, General Obligation Bonds, Higher Education, Variable Rate Demand Series 2015C, 2.000%, 11/01/16 | No Opt. Call | | AA+ | $ | 4,000,000 | |
| | | | Utah – 0.1% | | | | | | |
| | 1,100 | | Utah Transit Authority, Sales Tax Revenue Bonds, Tender Option Bond Floater 1050, 0.540%, 6/15/36 (10) | 6/18 at 100.00 | | VMIG-2 | | 1,100,000 | |
| $ | 19,050 | | Total Short-Term Investments (cost $19,050,000) | | | | | 19,050,000 | |
| | | | Total Investments (cost $1,924,596,922) – 99.7% | | | | | 2,143,802,666 | |
| | | | Floating Rate Obligations – (0.7)% | | | | | (14,130,000 | ) |
| | | | Other Assets Less Liabilities – 1.0% | | | | | 20,770,895 | |
| | | | Net Assets – 100% | | | | $ | 2,150,443,561 | |
| (1) | All percentages shown in the Portfolio of Investments are based on net assets. |
| (2) | Optional Call Provisions: Dates (month and year) and prices of the earliest optional call or redemption. There may be other call provisions at varying prices at later dates. Certain mortgage-backed securities may be subject to periodic principal paydowns. Optional Call Provisions are not covered by the report of independent registered public accounting firm. |
| (3) | For financial reporting purposes, the ratings disclosed are the highest of Standard & Poor's Group ("Standard & Poor's"), Moody's Investors Service, Inc. ("Moody's") or Fitch, Inc. ("Fitch") rating. This treatment of split-rated securities may differ from that used for other purposes, such as for Fund investment policies. Ratings below BBB by Standard & Poor's, Baa by Moody's or BBB by Fitch are considered to be below investment grade. Holdings designated N/R are not rated by any of these national rating agencies. Ratings are not covered by the report of independent registered public accounting firm. |
| (4) | Backed by an escrow or trust containing sufficient U.S. Government or U.S. Government agency securities, which ensure the timely payment of principal and interest. Certain bonds backed by U.S. Government or agency securities are regarded as having an implied rating equal to the ratings of such securities. |
| (5) | Step-up coupon. The rate shown is the coupon as of the end of the reporting period. |
| (6) | As of, or subsequent to, the end of the reporting period, this security is non-income producing. Non-income producing, in the case of a fixed-income security, generally denotes that the issuer has (1) defaulted on the payment of principal or interest, (2) is under the protection of the Federal Bankruptcy Court or (3) the Fund’s Adviser has concluded that the issue is not likely to meet its future interest payment obligations and has ceased accruing additional income on the Fund’s records. |
| (7) | Investment, or portion of investment, has been pledged to collateralize the net payment obligations for investments in inverse floating rate transactions. |
| (8) | Investment valued at fair value using methods determined in good faith by, or at the discretion of, the Board. For fair value measurement disclosure purposes, investment classified as Level 3. See Notes to Financial Statements, Note 2 – Investment Valuation and Fair Value Measurements for more information. |
| (9) | During January 2010, Las Vegas Monorail Company (“Las Vegas Monorail”) filed for federal bankruptcy protection. During March 2012, Las Vegas Monorail emerged from federal bankruptcy with the acceptance of a reorganization plan assigned by the Federal Bankruptcy Court. Under the reorganization plan, the Fund surrendered its Las Vegas Monorail Project Revenue Bonds, First Tier, Series 2000 and in turn received two senior interest corporate bonds: the first with an annual coupon rate of 5.500% maturing on July 15, 2019 and the second with an annual coupon rate of 3.000% (5.500% after December 31, 2015) maturing on July 15, 2055. The Fund is not accruing income for either senior interest corporate bond. |
| (10) | Investment has a maturity of greater than one year, but has variable rate and/or demand features which qualify it as a short-term investment. The rate disclosed is that in effect as of the end of the reporting period. This rate changes periodically based on market conditions or a specified market index. |
| (ETM) | Escrowed to maturity. |
| (IF) | Inverse floating rate investment. |
| (UB) | Underlying bond of an inverse floating rate trust reflected as a financing transaction. See Notes to Financial Statements, Note 3 – Portfolio Securities and Investments in Derivatives, Inverse Floating Rate Securities for more information. |
| (WI/DD) | Investment, or portion of investment, purchased on a when-issued or delayed delivery basis. |
| 144A | Investment is exempt from registration under Rule 144A of the Securities Act of 1933, as amended. These investments may only be resold in transactions exempt from registration, which are normally those transactions with qualified institutional buyers. |
| PIK | All or portion of this security is payment-in-kind. |
See accompanying notes to financial statements.
| NUW | | |
| | Nuveen AMT-Free Municipal Value Fund | |
| | Portfolio of Investments | October 31, 2016 |
| | | | | | | | | | |
| | Principal | | | Optional Call | | | | | |
| | Amount (000) | | Description (1) | Provisions (2) | | Ratings (3) | | Value | |
| | | | LONG-TERM INVESTMENTS – 99.9% | | | | | | |
| | | | MUNICIPAL BONDS – 99.9% | | | | | | |
| | | | Alaska – 0.4% | | | | | | |
| | | | Northern Tobacco Securitization Corporation, Alaska, Tobacco Settlement Asset-Backed Bonds, Series 2006A: | | | | | | |
| $ | 625 | | 4.625%, 6/01/23 | 1/17 at 100.00 | | Ba1 | $ | 634,806 | |
| | 350 | | 5.000%, 6/01/46 | 1/17 at 100.00 | | B3 | | 332,885 | |
| | 975 | | Total Alaska | | | | | 967,691 | |
| | | | Arizona – 3.3% | | | | | | |
| | 4,000 | | Maricopa County Pollution Control Corporation, Arizona, Pollution Control Revenue Bonds, El Paso Electric Company, Refunding Series 2009A, 7.250%, 2/01/40 | 2/19 at 100.00 | | Baa1 | | 4,503,360 | |
| | 3,045 | | Salt Verde Financial Corporation, Arizona, Senior Gas Revenue Bonds, Citigroup Energy Inc Prepay Contract Obligations, Series 2007, 5.000%, 12/01/37 | No Opt. Call | | BBB+ | | 3,660,882 | |
| | 7,045 | | Total Arizona | | | | | 8,164,242 | |
| | | | California – 13.2% | | | | | | |
| | 1,500 | | Alameda Corridor Transportation Authority, California, Revenue Bonds, Refunding Second Subordinate Lien Series 2016B, 5.000%, 10/01/36 | 10/26 at 100.00 | | BBB+ | | 1,750,035 | |
| | 1,730 | | Anaheim Public Financing Authority, California, Lease Revenue Bonds, Public Improvement Project, Series 1997C, 0.000%, 9/01/30 – AGM Insured | No Opt. Call | | AA | | 1,117,909 | |
| | 2,500 | | California State Public Works Board, Lease Revenue Bonds, Department of General Services Buildings 8 & 9, Series 2009A, 6.250%, 4/01/34 (Pre-refunded 4/01/19) | 4/19 at 100.00 | | A+ (4) | | 2,819,000 | |
| | 500 | | California State, General Obligation Bonds, Tender Option Bond Trust 3162, 18.270%, 3/01/40 – AGM Insured (IF) (5) | 3/20 at 100.00 | | AA | | 772,540 | |
| | 4,235 | | Golden State Tobacco Securitization Corporation, California, Tobacco Settlement Asset-Backed Bonds, Series 2007A-1, 5.000%, 6/01/33 | 6/17 at 100.00 | | B– | | 4,190,617 | |
| | 450 | | M-S-R Energy Authority, California, Gas Revenue Bonds, Citigroup Prepay Contracts, Series 2009A, 6.500%, 11/01/39 | No Opt. Call | | A | | 627,457 | |
| | 10,200 | | Palomar Pomerado Health, California, General Obligation Bonds, Series 2009A, 0.000%, 8/01/38 – AGC Insured (6) | 8/29 at 100.00 | | AA | | 12,079,554 | |
| | 1,030 | | Poway Unified School District, San Diego County, California, General Obligation Bonds, School Facilities Improvement District 2007-1, Series 2011A, 0.000%, 8/01/35 | No Opt. Call | | AA– | | 537,897 | |
| | 12,955 | | San Ysidro School District, San Diego County, California, General Obligation Bonds, 1997 Election Series 2012G, 0.000%, 8/01/35 – AGM Insured | No Opt. Call | | AA | | 6,728,179 | |
| | 5,185 | | San Ysidro School District, San Diego County, California, General Obligation Bonds, Refunding Series 2015, 0.000%, 8/01/44 | No Opt. Call | | AA | | 1,440,186 | |
| | 700 | | Victor Elementary School District, San Bernardino County, California, General Obligation Bonds, Series 2002A, 0.000%, 8/01/24 – FGIC Insured | No Opt. Call | | AA– | | 584,178 | |
| | 40,985 | | Total California | | | | | 32,647,552 | |
| | | | Colorado – 4.7% | | | | | | |
| | 1,400 | | Colorado Health Facilities Authority, Colorado, Revenue Bonds, Sisters of Charity of Leavenworth Health Services Corporation, Refunding Composite Deal Series 2010B, 5.000%, 1/01/21 | 1/20 at 100.00 | | AA– | | 1,570,842 | |
| | 5,885 | | E-470 Public Highway Authority, Colorado, Toll Revenue Bonds, Series 2004A, 0.000%, 9/01/34 – NPFG Insured | No Opt. Call | | AA– | | 3,217,271 | |
| | Principal | | | Optional Call | | | | | |
| | Amount (000) | | Description (1) | Provisions (2) | | Ratings (3) | | Value | |
| | | | Colorado (continued) | | | | | | |
| $ | 3,605 | | E-470 Public Highway Authority, Colorado, Toll Revenue Bonds, Series 2004B, 0.000%, 9/01/27 – NPFG Insured | 9/20 at 67.94 | | AA– | $ | 2,156,619 | |
| | 4,000 | | Park Creek Metropolitan District, Colorado, Senior Property Tax Supported Revenue Bonds, Series 2009, 6.375%, 12/01/37 (Pre-refunded 12/01/19) – AGC Insured | 12/19 at 100.00 | | AA (4) | | 4,645,640 | |
| | 14,890 | | Total Colorado | | | | | 11,590,372 | |
| | | | Florida – 10.0% | | | | | | |
| | 1,605 | | Lakeland, Florida, Hospital System Revenue Bonds, Lakeland Regional Health, Series 2015, 5.000%, 11/15/45 | 11/24 at 100.00 | | A2 | | 1,792,063 | |
| | 535 | | Miami Beach Redevelopment Agency, Florida, Tax Increment Revenue Bonds, City Center/Historic Convention Village, Series 2015A, 5.000%, 2/01/44 – AGM Insured | 2/24 at 100.00 | | AA | | 611,344 | |
| | 9,500 | | Miami-Dade County, Florida, Aviation Revenue Bonds, Miami International Airport, Series 2009A, 5.500%, 10/01/41 (UB) (5) | 10/19 at 100.00 | | A | | 10,623,755 | |
| | | | Miami-Dade County, Florida, General Obligation Bonds, Build Better Communities Program, Series 2009-B1: | | | | | | |
| | 2,500 | | 6.000%, 7/01/38 (Pre-refunded 7/01/18) | 7/18 at 100.00 | | AA (4) | | 2,713,250 | |
| | 2,000 | | 5.625%, 7/01/38 (Pre-refunded 7/01/18) | 7/18 at 100.00 | | AA (4) | | 2,158,200 | |
| | 2,850 | | Miami-Dade County, Florida, Special Obligation Bonds, Capital Asset Acquisition, Series 2007A, 5.000%, 4/01/21 (Pre-refunded 4/01/17) – AMBAC Insured | 4/17 at 100.00 | | AA– (4) | | 2,901,300 | |
| | 660 | | Orange County Health Facilities Authority, Florida, Hospital Revenue Bonds, Orlando Health, Inc., Series 2016B, 4.000%, 10/01/45 | 10/26 at 100.00 | | A | | 687,713 | |
| | 300 | | Tolomato Community Development District, Florida, Special Assessment Bonds, Convertible, Capital Appreciation, Series 2012A-2, 0.000%, 5/01/39 (6) | 5/17 at 100.00 | | N/R | | 242,904 | |
| | 865 | | Tolomato Community Development District, Florida, Special Assessment Bonds, Convertible, Capital Appreciation, Series 2012A-3, 0.000%, 5/01/40 (6) | 5/19 at 100.00 | | N/R | | 524,233 | |
| | 375 | | Tolomato Community Development District, Florida, Special Assessment Bonds, Convertible, Capital Appreciation, Series 2012A-4, 0.000%, 5/01/40 (6) | 5/22 at 100.00 | | N/R | | 168,709 | |
| | 525 | | Tolomato Community Development District, Florida, Special Assessment Bonds, Hope Note, Series 2007-3, 6.450%, 5/01/23 (7) | 5/18 at 100.00 | | N/R | | 5 | |
| | 45 | | Tolomato Community Development District, Florida, Special Assessment Bonds, Non Performing Parcel Series 2007-1. RMKT, 6.450%, 5/01/23 | 5/18 at 100.00 | | N/R | | 45,591 | |
| | 905 | | Tolomato Community Development District, Florida, Special Assessment Bonds, Refunding Series 2012A-1, 6.450%, 5/01/23 | 5/17 at 100.00 | | N/R | | 905,525 | |
| | 1,315 | | Tolomato Community Development District, Florida, Special Assessment Bonds, Refunding Series 2015-1, 0.000%, 5/01/40 | 5/18 at 77.10 | | N/R | | 824,071 | |
| | 805 | | Tolomato Community Development District, Florida, Special Assessment Bonds, Refunding Series 2015-2, 0.000%, 5/01/40 (7) | 5/18 at 100.00 | | N/R | | 427,600 | |
| | 880 | | Tolomato Community Development District, Florida, Special Assessment Bonds, Refunding Series 2015-3, 6.610%, 5/01/40 (7) | 5/18 at 100.00 | | N/R | | 9 | |
| | 25,665 | | Total Florida | | | | | 24,626,272 | |
| | | | Georgia – 0.7% | | | | | | |
| | 430 | | Atlanta, Georgia, Tax Allocation Bonds, Beltline Project Series 2008A. Remarketed, 7.500%, 1/01/31 | 1/19 at 100.00 | | A2 | | 481,445 | |
| | 1,000 | | Clayton County Development Authority, Georgia, Special Facilities Revenue Bonds, Delta Air Lines, Inc. Project, Series 2009A, 8.750%, 6/01/29 | 6/20 at 100.00 | | Baa3 | | 1,210,880 | |
| | 1,430 | | Total Georgia | | | | | 1,692,325 | |
| NUW | Nuveen AMT-Free Municipal Value Fund | |
| | Portfolio of Investments (continued) | October 31, 2016 |
| | Principal | | | Optional Call | | | | | |
| | Amount (000) | | Description (1) | Provisions (2) | | Ratings (3) | | Value | |
| | | | Illinois – 11.7% | | | | | | |
| $ | 1,260 | | Chicago, Illinois, General Airport Revenue Bonds, O’Hare International Airport, Third Lien Series 2008B, 5.000%, 1/01/20 (Pre-refunded 1/01/17) – AGM Insured | 1/17 at 100.00 | | AA (4) | $ | 1,268,505 | |
| | | | Chicago, Illinois, General Obligation Bonds, City Colleges, Series 1999: | | | | | | |
| | 470 | | 0.000%, 1/01/33 – FGIC Insured | No Opt. Call | | AA– | | 221,257 | |
| | 3,000 | | 0.000%, 1/01/37 – FGIC Insured | No Opt. Call | | AA– | | 1,149,240 | |
| | 200 | | Chicago, Illinois, General Obligation Bonds, Refunding Series 2005A, 5.000%, 1/01/17 – AGM Insured | 12/16 at 100.00 | | AA | | 200,702 | |
| | 5,035 | | Illinois Finance Authority, Revenue Bonds, Northwestern Memorial Hospital, Series 2009A, 6.000%, 8/15/39 | 8/19 at 100.00 | | AA+ | | 5,692,823 | |
| | 3,500 | | Illinois Finance Authority, Revenue Bonds, OSF Healthcare System, Series 2009A, 7.125%, 11/15/37 (Pre-refunded 5/15/19) | 5/19 at 100.00 | | A (4) | | 4,039,210 | |
| | 5,000 | | Illinois Finance Authority, Revenue Bonds, Rush University Medical Center Obligated Group, Series 2009A, 7.250%, 11/01/38 (Pre-refunded 11/01/18) | 11/18 at 100.00 | | Aaa | | 5,628,100 | |
| | 3,930 | | Illinois Finance Authority, Student Housing Revenue Bonds, Educational Advancement Fund Inc., Refunding Series 2007A, 5.250%, 5/01/34 | 5/17 at 100.00 | | BBB+ | | 3,967,492 | |
| | 525 | | Illinois State, General Obligation Bonds, October Series 2016, 5.000%, 2/01/29 (WI/DD, Settling 11/02/16) | 2/27 at 100.00 | | BBB+ | | 570,859 | |
| | | | Metropolitan Pier and Exposition Authority, Illinois, Revenue Bonds, McCormick Place Expansion Project, Series 2002A: | | | | | | |
| | 5,000 | | 0.000%, 6/15/33 – NPFG Insured | No Opt. Call | | AA– | | 2,419,450 | |
| | 5,000 | | 0.000%, 12/15/34 – NPFG Insured | No Opt. Call | | AA– | | 2,266,050 | |
| | 615 | | University of Illinois, Health Services Facilities System Revenue Bonds, Series 2013, 6.000%, 10/01/42 | 10/23 at 100.00 | | A | | 726,715 | |
| | 745 | | Will County Community Unit School District 201U, Crete-Monee, Illinois, General Obligation Bonds, Capital Appreciation Series 2004, 0.000%, 11/01/23 – NPFG Insured | No Opt. Call | | AA– | | 618,544 | |
| | 300 | | Will County Community Unit School District 201U, Crete-Monee, Illinois, General Obligation Bonds, Capital Appreciation Series 2004, 0.000%, 11/01/23 – NPFG Insured (ETM) | No Opt. Call | | AA– (4) | | 265,920 | |
| | 34,580 | | Total Illinois | | | | | 29,034,867 | |
| | | | Indiana – 6.7% | | | | | | |
| | 5,000 | | Indiana Finance Authority, Hospital Revenue Bonds, Deaconess Hospital Obligated Group, Series 2009A, 6.750%, 3/01/39 (Pre-refunded 3/01/19) | 3/19 at 100.00 | | A+ (4) | | 5,664,500 | |
| | 3,600 | | Indiana Health and Educational Facilities Financing Authority, Revenue Bonds, Sisters of Saint Francis Health Services Inc, Series 2006E, 5.250%, 5/15/41 (Pre-refunded 5/01/18) – AGM Insured | 5/18 at 100.00 | | Aa3 (4) | | 3,835,872 | |
| | | | Indiana Health Facility Financing Authority, Revenue Bonds, Community Foundation of Northwest Indiana, Series 2007: | | | | | | |
| | 1,880 | | 5.500%, 3/01/37 (Pre-refunded 3/01/17) | 3/17 at 100.00 | | N/R (4) | | 1,910,193 | |
| | 1,770 | | 5.500%, 3/01/37 (Pre-refunded 3/01/17) | 3/17 at 100.00 | | A+ (4) | | 1,791,541 | |
| | 2,000 | | Indiana Municipal Power Agency, Power Supply System Revenue Bonds, Series 2009B, 6.000%, 1/01/39 (Pre-refunded 1/01/19) | 1/19 at 100.00 | | A+ (4) | | 2,215,380 | |
| | 1,500 | | Indianapolis Local Public Improvement Bond Bank, Indiana, Series 1999E, 0.000%, 2/01/25 – AMBAC Insured | No Opt. Call | | AA | | 1,249,020 | |
| | 15,750 | | Total Indiana | | | | | 16,666,506 | |
| | Principal | | | Optional Call | | | | | |
| | Amount (000) | | Description (1) | Provisions (2) | | Ratings (3) | | Value | |
| | | | Iowa – 1.9% | | | | | | |
| $ | 1,545 | | Iowa Finance Authority, Iowa, Midwestern Disaster Area Revenue Bonds, Iowa Fertilizer Company Project, Series 2013, 5.500%, 12/01/22 | 12/18 at 100.00 | | B | $ | 1,567,480 | |
| | 3,075 | | Iowa Tobacco Settlement Authority, Asset Backed Settlement Revenue Bonds, Series 2005C, 5.375%, 6/01/38 | 1/17 at 100.00 | | B+ | | 3,074,754 | |
| | 4,620 | | Total Iowa | | | | | 4,642,234 | |
| | | | Kansas – 0.0% | | | | | | |
| | 5 | | Wyandotte County-Kansas City Unified Government, Kansas, Sales Tax Special Obligation Capital Appreciation Revenue Bonds Redevelopment Project Area B – Major Multi-Sport Athletic Complex Project, Subordinate Lien Series 2010B, 0.000%, 6/01/21 (Pre-refunded 12/01/16) | 12/16 at 76.41 | | A– (4) | | 3,818 | |
| | | | Kentucky – 0.6% | | | | | | |
| | 1,150 | | Kenton County Airport Board, Kentucky, Airport Revenue Bonds, Cincinnati/Northern Kentucky International Airport, Series 2016, 5.000%, 1/01/29 | 1/26 at 100.00 | | A+ | | 1,366,557 | |
| | | | Louisiana – 6.5% | | | | | | |
| | 5,000 | | Louisiana Citizens Property Insurance Corporation, Assessment Revenue Bonds, Series 2006C-3, 6.125%, 6/01/25 (Pre-refunded 6/01/18) – AGC Insured | 6/18 at 100.00 | | AA (4) | | 5,416,800 | |
| | | | Louisiana Public Facilities Authority, Revenue Bonds, Ochsner Clinic Foundation Project, Series 2007A: | | | | | | |
| | 5,075 | | 5.375%, 5/15/43 | 5/17 at 100.00 | | A– | | 5,171,425 | |
| | 200 | | 5.500%, 5/15/47 | 5/17 at 100.00 | | A– | | 203,910 | |
| | | | Louisiana Public Facilities Authority, Revenue Bonds, Ochsner Clinic Foundation Project, Series 2007A: | | | | | | |
| | 1,925 | | 5.375%, 5/15/43 (Pre-refunded 5/15/17) | 5/17 at 100.00 | | N/R (4) | | 1,973,587 | |
| | 75 | | 5.500%, 5/15/47 (Pre-refunded 5/15/17) | 5/17 at 100.00 | | N/R (4) | | 76,943 | |
| | 3,255 | | St John Baptist Parish, Louisiana, Revenue Bonds, Marathon Oil Corporation, Series 2007A, 5.125%, 6/01/37 | 6/17 at 100.00 | | BBB | | 3,299,919 | |
| | 15,530 | | Total Louisiana | | | | | 16,142,584 | |
| | | | Maine – 1.7% | | | | | | |
| | 3,335 | | Maine Health and Higher Educational Facilities Authority, Revenue Bonds, Bowdoin College, Tender Option Bond Trust 2016-XL0014, 12.345%, 7/01/39 (IF) (5) | 7/19 at 100.00 | | Aa2 | | 4,284,975 | |
| | | | Maryland – 0.2% | | | | | | |
| | | | Baltimore, Maryland, Senior Lien Convention Center Hotel Revenue Bonds, Series 2006A: | | | | | | |
| | 180 | | 5.250%, 9/01/26 – SYNCORA GTY Insured | 1/17 at 100.00 | | Ba1 | | 180,484 | |
| | 275 | | 5.250%, 9/01/27 – SYNCORA GTY Insured | 1/17 at 100.00 | | Ba1 | | 275,740 | |
| | 455 | | Total Maryland | | | | | 456,224 | |
| | | | Massachusetts – 0.5% | | | | | | |
| | 1,000 | | Massachusetts Water Pollution Abatement Trust, Pooled Loan Program Bonds, Tender Option Bond Trust 2015-XF2181, 12.279%, 8/01/38 (IF) (5) | 8/19 at 100.00 | | AAA | | 1,311,000 | |
| | | | Nevada – 4.0% | | | | | | |
| | 1,000 | | Clark County Water Reclamation District, Nevada, General Obligation Water Bonds, Series 2009A, 5.250%, 7/01/34 (Pre-refunded 7/01/19) | 7/19 at 100.00 | | AAA | | 1,111,690 | |
| | 5,415 | | Las Vegas Redevelopment Agency, Nevada, Tax Increment Revenue Bonds, Series 2009A, 8.000%, 6/15/30 (Pre-refunded 6/15/19) | 6/19 at 100.00 | | BBB+ (4) | | 6,374,592 | |
| NUW | Nuveen AMT-Free Municipal Value Fund | |
| | Portfolio of Investments (continued) | October 31, 2016 |
| | Principal | | | Optional Call | | | | | |
| | Amount (000) | | Description (1) | Provisions (2) | | Ratings (3) | | Value | |
| | | | Nevada (continued) | | | | | | |
| $ | 2,000 | | Las Vegas Valley Water District, Nevada, General Obligation Bonds, Refunding Series 2015, 5.000%, 6/01/39 | 12/24 at 100.00 | | Aa1 | $ | 2,363,860 | |
| | 8,415 | | Total Nevada | | | | | 9,850,142 | |
| | | | New Jersey – 5.4% | | | | | | |
| | 935 | | New Jersey Economic Development Authority, School Facilities Construction Bonds, Series 2005N-1, 5.500%, 9/01/27 – FGIC Insured | No Opt. Call | | AA– | | 1,152,060 | |
| | 1,000 | | New Jersey Economic Development Authority, School Facilities Construction Financing Program Bonds, Refunding Series 2011GG, 5.000%, 9/01/22 | 3/21 at 100.00 | | A3 | | 1,088,440 | |
| | 1,250 | | New Jersey Economic Development Authority, School Facility Construction Bonds, Series 2005K, 5.500%, 12/15/19 – AMBAC Insured | No Opt. Call | | A3 | | 1,377,050 | |
| | | | New Jersey Educational Facilities Authority, Revenue Bonds, University of Medicine and Dentistry of New Jersey, Refunding Series 2009B: | | | | | | |
| | 2,135 | | 7.125%, 12/01/23 (Pre-refunded 6/01/19) | 6/19 at 100.00 | | N/R (4) | | 2,464,089 | |
| | 3,000 | | 7.500%, 12/01/32 (Pre-refunded 6/01/19) | 6/19 at 100.00 | | N/R (4) | | 3,491,010 | |
| | 5,020 | | New Jersey Transportation Trust Fund Authority, Transportation System Bonds, Capital Appreciation Series 2010A, 0.000%, 12/15/31 | No Opt. Call | | A3 | | 2,574,507 | |
| | 255 | | New Jersey Transportation Trust Fund Authority, Transportation System Bonds, Series 2015AA, 5.250%, 6/15/41 | 6/25 at 100.00 | | A3 | | 284,539 | |
| | 1,000 | | Tobacco Settlement Financing Corporation, New Jersey, Tobacco Settlement Asset-Backed Bonds, Series 2007-1A, 5.000%, 6/01/29 | 6/17 at 100.00 | | B | | 1,000,090 | |
| | 14,595 | | Total New Jersey | | | | | 13,431,785 | |
| | | | New York – 3.6% | | | | | | |
| | 2,845 | | Hudson Yards Infrastructure Corporation, New York, Revenue Bonds, Series 2006A, 5.000%, 2/15/47 | 2/17 at 100.00 | | A | | 2,879,140 | |
| | 1,450 | | New York City Municipal Water Finance Authority, New York, Water and Sewer System Revenue Bonds, Second Generation Resolution, Series 2009EE-2, 5.250%, 6/15/40 | No Opt. Call | | AA+ | | 1,602,467 | |
| | 3,000 | | New York Liberty Development Corporation, Revenue Bonds, Goldman Sachs Headquarters Issue, Series 2007, 5.500%, 10/01/37 | No Opt. Call | | A | | 3,942,810 | |
| | 430 | | Port Authority of New York and New Jersey, Special Project Bonds, JFK International Air Terminal LLC Project, Eighth Series 2010, 6.000%, 12/01/42 | 12/20 at 100.00 | | Baa1 | | 498,946 | |
| | 7,725 | | Total New York | | | | | 8,923,363 | |
| | | | Ohio – 5.4% | | | | | | |
| | 5,000 | | American Municipal Power Ohio Inc., Prairie State Energy Campus Project Revenue Bonds, Series 2009A, 5.750%, 2/15/39 (Pre-refunded 2/15/19) – AGC Insured | 2/19 at 100.00 | | AA (4) | | 5,535,750 | |
| | | | Buckeye Tobacco Settlement Financing Authority, Ohio, Tobacco Settlement Asset-Backed Revenue Bonds, Senior Lien, Series 2007A-2: | | | | | | |
| | 2,115 | | 5.875%, 6/01/30 | 6/17 at 100.00 | | B– | | 2,004,280 | |
| | 5,910 | | 6.500%, 6/01/47 | 6/17 at 100.00 | | B– | | 5,851,491 | |
| | 13,025 | | Total Ohio | | | | | 13,391,521 | |
| | | | Oklahoma – 0.9% | | | | | | |
| | 2,150 | | Norman Regional Hospital Authority, Oklahoma, Hospital Revenue Bonds, Series 2007, 5.125%, 9/01/37 | 9/17 at 100.00 | | BBB+ | | 2,169,952 | |
| | Principal | | | Optional Call | | | | | |
| | Amount (000) | | Description (1) | Provisions (2) | | Ratings (3) | | Value | |
| | | | Rhode Island – 1.4% | | | | | | |
| $ | 3,000 | | Rhode Island Health and Educational Building Corporation, Hospital Financing Revenue Bonds, Lifespan Obligated Group Issue, Series 2009A, 7.000%, 5/15/39 (Pre-refunded 5/15/19) | 5/19 at 100.00 | | Aaa | $ | 3,451,170 | |
| | | | South Carolina – 1.5% | | | | | | |
| | 5,435 | | Piedmont Municipal Power Agency, South Carolina, Electric Revenue Bonds, Series 2004A-2, 0.000%, 1/01/29 – AMBAC Insured | No Opt. Call | | AA | | 3,803,685 | |
| | | | Texas – 5.8% | | | | | | |
| | 1,855 | | Grand Parkway Transportation Corporation, Texas, System Toll Revenue Bonds, First Tier Series 2013A, 5.500%, 4/01/53 | 10/23 at 100.00 | | BBB+ | | 2,103,032 | |
| | 915 | | North Texas Tollway Authority, System Revenue Bonds, Refunding First Tier, Series 2015B, 5.000%, 1/01/45 | 1/25 at 100.00 | | A1 | | 1,056,679 | |
| | 5,435 | | North Texas Tollway Authority, System Revenue Bonds, Refunding Second Tier, Series 2008F, 5.750%, 1/01/38 (Pre-refunded 1/01/18) | 1/18 at 100.00 | | A2 (4) | | 5,745,719 | |
| | 195 | | Tarrant County Cultural Education Facilities Finance Corporation, Texas, Hospital Revenue Bonds, Scott & White Healthcare Project, Series 2016A, 4.000%, 11/15/42 | 5/26 at 100.00 | | AA– | | 207,074 | |
| | 1,500 | | Texas Municipal Gas Acquisition and Supply Corporation III, Gas Supply Revenue Bonds, Series 2012, 5.000%, 12/15/32 | No Opt. Call | | A3 | | 1,673,700 | |
| | 2,000 | | Wichita Falls Independent School District, Wichita County, Texas, General Obligation Bonds, Series 2007, 5.000%, 2/01/23 (Pre-refunded 2/01/17) | 2/17 at 100.00 | | AAA | | 2,021,600 | |
| | | | Wylie Independent School District, Collin County, Texas, General Obligation Bonds, School Building Series 2010: | | | | | | |
| | 2,000 | | 0.000%, 8/15/33 | No Opt. Call | | AAA | | 944,940 | |
| | 1,945 | | 0.000%, 8/15/38 | No Opt. Call | | AAA | | 683,959 | |
| | 15,845 | | Total Texas | | | | | 14,436,703 | |
| | | | Virginia – 2.0% | | | | | | |
| | 1,400 | | Chesapeake, Virginia, Transportation System Senior Toll Road Revenue Bonds, Capital Appreciation Series 2012B, 0.000%, 7/15/40 (6) | 7/28 at 100.00 | | BBB | | 1,125,138 | |
| | 1,500 | | Virginia Housing Development Authority, Rental Housing Bonds, Series 2016B, 3.350%, 5/01/36 | 5/25 at 100.00 | | AA+ | | 1,511,070 | |
| | 2,000 | | Washington County Industrial Development Authority, Virginia, Hospital Revenue Bonds, Mountain States Health Alliance, Series 2009C, 7.750%, 7/01/38 | 1/19 at 100.00 | | BBB+ | | 2,232,380 | |
| | 4,900 | | Total Virginia | | | | | 4,868,588 | |
| | | | Washington – 1.3% | | | | | | |
| | 3,330 | | Chelan County Public Utility District 1, Washington, Columbia River-Rock Island Hydro-Electric System Revenue Refunding Bonds, Series 1997A, 0.000%, 6/01/29 – NPFG Insured | No Opt. Call | | AA+ | | 2,296,268 | |
| | 855 | | Seattle, Washington, Municipal Light and Power Revenue Bonds, Series 2015A, 5.000%, 5/01/17 | No Opt. Call | | AA | | 873,536 | |
| | 4,185 | | Total Washington | | | | | 3,169,804 | |
| | | | West Virginia – 0.7% | | | | | | |
| | 1,500 | | West Virginia Hospital Finance Authority, Hospital Revenue Bonds, West Virginia United Health System Obligated Group, Refunding & Improvement Series 2013A, 5.500%, 6/01/44 | 6/23 at 100.00 | | A | | 1,738,500 | |
| NUW | Nuveen AMT-Free Municipal Value Fund | |
| | Portfolio of Investments (continued) | October 31, 2016 |
| | Principal | | | Optional Call | | | | | |
| | Amount (000) | | Description (1) | Provisions (2) | | Ratings (3) | | Value | |
| | | | Wisconsin – 5.8% | | | | | | |
| $ | 1,250 | | Wisconsin Health and Educational Facilities Authority, Revenue Bonds, Ascension Health Alliance Senior Credit Group, Series 2016A, 4.000%, 11/15/46 | 5/26 at 100.00 | | AA+ | $ | 1,319,000 | |
| | 1,000 | | Wisconsin Health and Educational Facilities Authority, Revenue Bonds, Marshfield Clinic, Series 2012B, 5.000%, 2/15/27 | 2/22 at 100.00 | | A– | | 1,150,170 | |
| | 1,605 | | Wisconsin Health and Educational Facilities Authority, Revenue Bonds, ProHealth Care, Inc. Obligated Group, Series 2009, 6.625%, 2/15/39 (Pre-refunded 2/15/19) | 2/19 at 100.00 | | N/R (4) | | 1,811,018 | |
| | 9,000 | | Wisconsin State, General Fund Annual Appropriation Revenue Bonds, Refunding Series 2009A, 6.000%, 5/01/36 | 5/19 at 100.00 | | AA– | | 10,040,400 | |
| | 12,855 | | Total Wisconsin | | | | | 14,320,588 | |
| $ | 261,045 | | Total Long-Term Investments (cost $210,616,292) | | | | | 247,153,020 | |
| | | | Floating Rate Obligations – (2.9)% | | | | | (7,125,000 | ) |
| | | | Other Assets Less Liabilities – 3.0% | | | | | 7,365,845 | |
| | | | Net Assets – 100% | | | | $ | 247,393,865 | |
| (1) | All percentages shown in the Portfolio of Investments are based on net assets. |
| (2) | Optional Call Provisions: Dates (month and year) and prices of the earliest optional call or redemption. There may be other call provisions at varying prices at later dates. Certain mortgage-backed securities may be subject to periodic principal paydowns. Optional Call Provisions are not covered by the report of independent registered public accounting firm. |
| (3) | For financial reporting purposes, the ratings disclosed are the highest of Standard & Poor’s Group (“Standard & Poor’s”), Moody’s Investors Service, Inc. (“Moody’s”) or Fitch, Inc. (“Fitch”) rating. This treatment of split-rated securities may differ from that used for other purposes, such as for Fund investment policies. Ratings below BBB by Standard & Poor’s, Baa by Moody’s or BBB by Fitch are considered to be below investment grade. Holdings designated N/R are not rated by any of these national rating agencies. Ratings are not covered by the report of independent registered public accounting firm. |
| (4) | Backed by an escrow or trust containing sufficient U.S. Government or U.S. Government agency securities, which ensure the timely payment of principal and interest. Certain bonds backed by U.S. Government or agency securities are regarded as having an implied rating equal to the ratings of such securities. |
| (5) | Investment, or portion of investment, has been pledged to collateralize the net payment obligations for investments in inverse floating rate transactions. |
| (6) | Step-up coupon. The rate shown is the coupon as of the end of the reporting period. |
| (7) | As of, or subsequent to, the end of the reporting period, this security is non-income producing. Non-income producing, in the case of a fixed-income security, generally denotes that the issuer has (1) defaulted on the payment of principal or interest, (2) is under the protection of the Federal Bankruptcy Court or (3) the Fund’s Adviser has concluded that the issue is not likely to meet its future interest payment obligations and has ceased accruing additional income on the Fund’s records. |
| (ETM) | Escrowed to maturity. |
| (IF) | Inverse floating rate investment. |
| (UB) | Underlying bond of an inverse floating rate trust reflected as a financing transaction. See Notes to Financial Statements, Note 3 – Portfolio Securities and Investments in Derivatives, Inverse Floating Rate Securities for more information. |
| (WI/DD) | Investment, or portion of investment, purchased on a when-issued or delayed delivery basis. |
See accompanying notes to financial statements.
| NMI | | |
| | Nuveen Municipal Income Fund, Inc. | |
| | Portfolio of Investments | October 31, 2016 |
| | Principal | | | Optional Call | | | | | |
| | Amount (000) | | Description (1) | Provisions (2) | | Ratings (3) | | Value | |
| | | | LONG-TERM INVESTMENTS – 101.4% | | | | | | |
| | | | MUNICIPAL BONDS – 101.4% | | | | | | |
| | | | Alabama – 0.5% | | | | | | |
| $ | 500 | | Jefferson County, Alabama, Limited Obligation School Warrants, Education Tax Revenue Bonds, Series 2004A, 5.250%, 1/01/23 – AGM Insured | 1/17 at 100.00 | | AA | $ | 502,755 | |
| | | | Arizona – 1.4% | | | | | | |
| | 600 | | Arizona Health Facilities Authority, Revenue Bonds, Scottsdale Lincoln Hospitals Project, Series 2014A, 5.000%, 12/01/39 | 12/24 at 100.00 | | A2 | | 694,644 | |
| | 515 | | Salt Verde Financial Corporation, Arizona, Senior Gas Revenue Bonds, Citigroup Energy Inc Prepay Contract Obligations, Series 2007, 5.250%, 12/01/28 | No Opt. Call | | BBB+ | | 643,580 | |
| | 1,115 | | Total Arizona | | | | | 1,338,224 | |
| | | | California – 17.7% | | | | | | |
| | 5,530 | | Adelanto School District, San Bernardino County, California, General Obligation Bonds, Series 1997A, 0.000%, 9/01/22 – NPFG Insured | No Opt. Call | | AA– | | 4,883,322 | |
| | | | Brea Olinda Unified School District, Orange County, California, General Obligation Bonds, Series 1999A: | | | | | | |
| | 2,000 | | 0.000%, 8/01/21 – FGIC Insured | No Opt. Call | | Aa2 | | 1,845,400 | |
| | 2,070 | | 0.000%, 8/01/22 – FGIC Insured | No Opt. Call | | AA– | | 1,847,848 | |
| | 2,120 | | 0.000%, 8/01/23 – FGIC Insured | No Opt. Call | | AA– | | 1,838,422 | |
| | 325 | | California County Tobacco Securitization Agency, Tobacco Settlement Asset-Backed Bonds, Los Angeles County Securitization Corporation, Series 2006A, 5.250%, 6/01/21 | 12/18 at 100.00 | | B1 | | 330,642 | |
| | 155 | | California Housing Finance Agency, California, Home Mortgage Revenue Bonds, Series 2007E, 4.800%, 8/01/37 (Alternative Minimum Tax) | 2/17 at 100.00 | | AA– | | 156,133 | |
| | 375 | | California Statewide Communities Development Authority, Revenue Bonds, American Baptist Homes of the West, Series 2010, 6.000%, 10/01/29 | 10/19 at 100.00 | | BBB+ | | 418,954 | |
| | 1,000 | | California Statewide Community Development Authority, Revenue Bonds, Daughters of Charity Health System, Series 2005A, 5.250%, 7/01/39 (4) | 1/17 at 100.00 | | CCC | | 993,640 | |
| | | | Golden State Tobacco Securitization Corporation, California, Tobacco Settlement Asset-Backed Bonds, Series 2007A-1: | | | | | | |
| | 540 | | 4.500%, 6/01/27 | 6/17 at 100.00 | | B | | 541,291 | |
| | 1,000 | | 5.750%, 6/01/47 | 6/17 at 100.00 | | B– | | 991,550 | |
| | 250 | | Madera County, California, Certificates of Participation, Children’s Hospital Central California, Series 2010, 5.375%, 3/15/36 | 3/20 at 100.00 | | AA– | | 276,427 | |
| | 300 | | M-S-R Energy Authority, California, Gas Revenue Bonds, Citigroup Prepay Contracts, Series 2009A, 7.000%, 11/01/34 | No Opt. Call | | A | | 439,350 | |
| | 250 | | Ridgecrest Redevelopment Agency, California, Ridgecrest Redevelopment Project Tax Allocation Bonds, Refunding Series 2010, 6.125%, 6/30/37 | 6/20 at 100.00 | | A– | | 289,402 | |
| | 385 | | San Francisco Redevelopment Finance Authority, California, Tax Allocation Revenue Bonds, Mission Bay North Redevelopment Project, Series 2011C, 6.000%, 8/01/24 (Pre-refunded 2/01/21) | 2/21 at 100.00 | | A– (5) | | 463,821 | |
| | 500 | | San Joaquin Hills Transportation Corridor Agency, Orange County, California, Toll Road Revenue Bonds, Refunding Junior Lien Series 2014B, 5.250%, 1/15/44 | 1/25 at 100.00 | | BB+ | | 568,410 | |
| | 1,000 | | Union City Community Redevelopment Agency, California, Tax Allocation Revenue Bonds, Redevelopment Project, Subordinate Lien Series 2011, 6.000%, 12/01/22 | 12/21 at 100.00 | | A+ | | 1,217,570 | |
| | 17,800 | | Total California | | | | | 17,102,182 | |
| NMI | Nuveen Municipal Income Fund, Inc. | |
| | Portfolio of Investments (continued) | October 31, 2016 |
| | Principal | | | Optional Call | | | | | |
| | Amount (000) | | Description (1) | Provisions (2) | | Ratings (3) | | Value | |
| | | | Colorado – 8.1% | | | | | | |
| | | | Central Platte Valley Metropolitan District, Colorado, General Obligation Bonds, Refunding Series 2013A: | | | | | | |
| $ | 150 | | 5.125%, 12/01/29 | 12/23 at 100.00 | | BBB | $ | 171,469 | |
| | 250 | | 5.375%, 12/01/33 | 12/23 at 100.00 | | BBB | | 286,685 | |
| | 1,000 | | Colorado Health Facilities Authority, Colorado, Revenue Bonds, Sisters of Charity of Leavenworth Health Services Corporation, Series 2010A, 5.000%, 1/01/40 | 1/20 at 100.00 | | AA– | | 1,093,190 | |
| | 1,000 | | Colorado Health Facilities Authority, Revenue Bonds, Evangelical Lutheran Good Samaritan Society, Series 2005, 5.000%, 6/01/35 | 1/17 at 100.00 | | BBB+ | | 1,002,120 | |
| | 750 | | Colorado Springs, Colorado, Utilities System Revenue Bonds, Improvement Series 2013B-1, 5.000%, 11/15/38 | 11/23 at 100.00 | | AA | | 884,633 | |
| | 1,000 | | Denver City and County, Colorado, Airport System Revenue Bonds, Series 2012B, 5.000%, 11/15/32 | 11/22 at 100.00 | | A+ | | 1,181,710 | |
| | 110 | | Park Creek Metropolitan District, Colorado, Senior Limited Property Tax Supported Revenue Bonds, Refunding Series 2015A, 5.000%, 12/01/45 | 12/25 at 100.00 | | N/R | | 123,926 | |
| | 1,000 | | Park Creek Metropolitan District, Colorado, Senior Limited Property Tax Supported Revenue Refunding Bonds, Series 2011, 6.125%, 12/01/41 (Pre-refunded 12/01/20) – AGM Insured | 12/20 at 100.00 | | AA (5) | | 1,196,550 | |
| | 815 | | Public Authority for Colorado Energy, Natural Gas Purchase Revenue Bonds, Colorado Springs Utilities, Series 2008, 6.125%, 11/15/23 | No Opt. Call | | A | | 1,017,112 | |
| | 270 | | Southlands Metropolitan District 1, Colorado, Limited Tax General Obligation Bonds, Series 2007, 5.250%, 12/01/34 – RAAI Insured | 12/17 at 100.00 | | AA | | 279,075 | |
| | 500 | | Tallyn’s Reach Metropolitan District 3, Aurora, Colorado, General Obligation Refunding and Improvement Bonds, Limited Tax Convertible to Unlimited Tax, Series 2013, 5.000%, 12/01/33 | 12/23 at 100.00 | | N/R | | 534,720 | |
| | 6,845 | | Total Colorado | | | | | 7,771,190 | |
| | | | Florida – 5.5% | | | | | | |
| | 850 | | Bay County, Florida, Educational Facilities Revenue Refunding Bonds, Bay Haven Charter Academy, Inc. Project, Series 2013A, 5.000%, 9/01/33 | 9/23 at 100.00 | | BBB– | | 893,078 | |
| | 100 | | Dade County Industrial Development Authority, Florida, Revenue Bonds, Miami Cerebral Palsy Residential Services Inc., Series 1995, 8.000%, 6/01/22 | 12/16 at 100.00 | | N/R | | 100,042 | |
| | 500 | | Florida Higher Educational Facilities Financing Authority, Revenue Bonds, Nova Southeastern University, Refunding Series 2011, 6.375%, 4/01/31 | 4/21 at 100.00 | | A– | | 588,545 | |
| | 1,025 | | Miami-Dade County, Florida, Aviation Revenue Bonds, Miami International Airport, Series 2010B, 5.000%, 10/01/35 – AGM Insured | 10/20 at 100.00 | | AA | | 1,147,969 | |
| | 1,000 | | Miami-Dade County, Florida, Water and Sewer System Revenue Bonds, Series 2013A, 5.000%, 10/01/42 | 10/22 at 100.00 | | Aa3 | | 1,147,950 | |
| | 515 | | North Sumter County Utility Dependent District, Florida, Utility Revenue Bonds, Series 2010, 5.375%, 10/01/40 | 10/20 at 100.00 | | AA | | 578,448 | |
| | 310 | | Orange County Health Facilities Authority, Florida, Hospital Revenue Bonds, Orlando Health, Inc., Series 2012A, 5.000%, 10/01/42 | 4/22 at 100.00 | | A | | 332,993 | |
| | 495 | | Tolomato Community Development District, Florida, Special Assessment Bonds, Series 2006, 5.400%, 5/01/37 | 1/17 at 100.00 | | N/R | | 494,951 | |
| | 4,795 | | Total Florida | | | | | 5,283,976 | |
| | | | Georgia – 2.3% | | | | | | |
| | 455 | | Atlanta Development Authority, Georgia, Revenue Bonds, New Downtown Atlanta Stadium Project, Senior Lien Series 2015A-1, 5.250%, 7/01/40 | 7/25 at 100.00 | | Aa3 | | 541,782 | |
| | 655 | | Atlanta Urban Residential Finance Authority, Georgia, Multifamily Housing Revenue Bonds, Trestletree Village Apartments, Series 2013A, 4.000%, 11/01/25 | 11/23 at 100.00 | | BBB+ | | 687,973 | |
| | 500 | | Atlanta, Georgia, Water and Wastewater Revenue Bonds, Refunding Series 2009B, 5.250%, 11/01/34 – AGM Insured | 11/19 at 100.00 | | AA | | 558,290 | |
| | 355 | | Main Street Natural Gas Inc., Georgia, Gas Project Revenue Bonds, Series 2006B, 5.000%, 3/15/22 | No Opt. Call | | A | | 401,828 | |
| | 1,965 | | Total Georgia | | | | | 2,189,873 | |
| | Principal | | | Optional Call | | | | | |
| | Amount (000) | | Description (1) | Provisions (2) | | Ratings (3) | | Value | |
| | | | Hawaii – 0.3% | | | | | | |
| $ | 250 | | Hawaii Department of Budget and Finance, Special Purpose Revenue Bonds, Hawaii Pacific University, Series 2013A, 6.625%, 7/01/33 | 7/23 at 100.00 | | BB+ | $ | 281,857 | |
| | | | Illinois – 10.1% | | | | | | |
| | 650 | | Chicago Board of Education, Illinois, General Obligation Bonds, Dedicated Revenues, Series 2016A, 7.000%, 12/01/44 | 12/25 at 100.00 | | B | | 691,223 | |
| | 640 | | Illinois Educational Facilities Authority, Revenue Bonds, Field Museum of Natural History, Series 2002, 4.500%, 11/01/36 | 11/24 at 100.00 | | A | | 663,942 | |
| | 1,000 | | Illinois Finance Authority, Revenue Bonds, Children’s Memorial Hospital, Tender Option Bond Trust 2016-XG0008, Formerly Tender Option Bond Trust 1098, 16.207%, 8/15/33 – AGC Insured (IF) (6) | 8/18 at 100.00 | | AA | | 1,263,680 | |
| | 280 | | Illinois Finance Authority, Revenue Bonds, Palos Community Hospital, Series 2010C, 5.125%, 5/15/35 | 5/20 at 100.00 | | AA– | | 304,147 | |
| | 80 | | Illinois Finance Authority, Revenue Bonds, Rehabilitation Institute of Chicago, Series 2013A, 5.500%, 7/01/28 | 7/23 at 100.00 | | A– | | 94,141 | |
| | 450 | | Illinois Finance Authority, Revenue Bonds, Rush University Medical Center Obligated Group, Series 2009C, 6.375%, 11/01/29 (Pre-refunded 5/01/19) | 5/19 at 100.00 | | Aaa | | 509,994 | |
| | 200 | | Illinois Finance Authority, Revenue Bonds, Silver Cross Hospital and Medical Centers, Refunding Series 2015C, 5.000%, 8/15/44 | 8/25 at 100.00 | | Baa1 | | 222,598 | |
| | 500 | | Illinois Finance Authority, Revenue Bonds, Silver Cross Hospital and Medical Centers, Series 2009, 7.000%, 8/15/44 (Pre-refunded 8/15/19) | 8/19 at 100.00 | | N/R (5) | | 582,600 | |
| | 250 | | Illinois Finance Authority, Revenue Bonds, Southern Illinois Healthcare Enterprises, Inc., Series 2005 Remarketed, 5.250%, 3/01/30 – AGM Insured | 3/20 at 100.00 | | AA | | 275,472 | |
| | 990 | | Illinois State, General Obligation Bonds, Series 2013, 5.250%, 7/01/31 | 7/23 at 100.00 | | BBB+ | | 1,074,397 | |
| | 220 | | Lombard Public Facilities Corporation, Illinois, Second Tier Conference Center and Hotel Revenue Bonds, Series 2005B, 5.250%, 1/01/36 (7) | 1/17 at 100.00 | | D | | 65,978 | |
| | 1,555 | | Metropolitan Pier and Exposition Authority, Illinois, McCormick Place Expansion Project Bonds, Refunding Series 2012B, 5.000%, 6/15/52 | 6/22 at 100.00 | | BBB | | 1,647,756 | |
| | 450 | | Quad Cities Regional Economic Development Authority, Illinois, Revenue Bonds, Augustana College, Series 2012, 5.000%, 10/01/27 | 10/22 at 100.00 | | Baa1 | | 514,166 | |
| | 800 | | Railsplitter Tobacco Settlement Authority, Illinois, Tobacco Settlement Revenue Bonds, Series 2010, 6.000%, 6/01/28 | 6/21 at 100.00 | | A– | | 940,168 | |
| | 315 | | Springfield, Illinois, Electric Revenue Bonds, Senior Lien Series 2015, 5.000%, 3/01/40 – AGM Insured | 3/25 at 100.00 | | AA | | 359,888 | |
| | 490 | | University of Illinois, Health Services Facilities System Revenue Bonds, Series 2013, 6.000%, 10/01/32 | 10/23 at 100.00 | | A | | 588,475 | |
| | 8,870 | | Total Illinois | | | | | 9,798,625 | |
| | | | Indiana – 2.1% | | | | | | |
| | 525 | | Indiana Finance Authority, Educational Facilities Revenue Bonds, Drexel Foundation For Educational Excellence, Inc., Series 2009A, 7.000%, 10/01/39 | 10/19 at 100.00 | | B– | | 511,534 | |
| | 655 | | Indiana Finance Authority, Private Activity Bonds, Ohio River Bridges East End Crossing Project, Series 2013A, 5.000%, 7/01/44 (Alternative Minimum Tax) | 7/23 at 100.00 | | BBB+ | | 722,354 | |
| | 100 | | Indiana Finance Authority, Tax-Exempt Private Activity Revenue Bonds, I-69 Section 5 Project, Series 2014, 5.250%, 9/01/34 (Alternative Minimum Tax) | 9/24 at 100.00 | | BB– | | 108,064 | |
| | 500 | | Vigo County Hospital Authority, Indiana, Hospital Revenue Bonds, Union Hospital, Inc., Series 2011, 8.000%, 9/01/41 (Pre-refunded 9/01/21) | 9/21 at 100.00 | | N/R (5) | | 655,465 | |
| | 1,780 | | Total Indiana | | | | | 1,997,417 | |
| NMI | Nuveen Municipal Income Fund, Inc. | |
| | Portfolio of Investments (continued) | October 31, 2016 |
| | Principal | | | Optional Call | | | | | |
| | Amount (000) | | Description (1) | Provisions (2) | | Ratings (3) | | Value | |
| | | | Iowa – 1.0% | | | | | | |
| $ | 835 | | Iowa Higher Education Loan Authority, Private College Facility Revenue Bonds, University of Dubuque Project, Refunding Series 2011, 5.625%, 10/01/26 | 10/21 at 100.00 | | BBB | $ | 925,222 | |
| | | | Kansas – 0.4% | | | | | | |
| | 375 | | Overland Park Development Corporation, Kansas, Second Tier Revenue Bonds, Overland Park Convention Center, Series 2007B, 5.125%, 1/01/22 – AMBAC Insured | 1/17 at 100.00 | | BB+ | | 375,626 | |
| | | | Kentucky – 2.2% | | | | | | |
| | 500 | | Kentucky Economic Development Finance Authority, Hospital Facilities Revenue Bonds, Owensboro Medical Health System, Series 2010A, 6.500%, 3/01/45 | 6/20 at 100.00 | | BBB+ | | 565,835 | |
| | 1,500 | | Louisville-Jefferson County Metropolitan Government, Kentucky, Health Facilities Revenue Bonds, Jewish Hospital & Saint Mary’s HealthCare Inc. Project, Series 2008, 6.125%, 2/01/37 (Pre-refunded 2/01/18) | 2/18 at 100.00 | | Aaa | | 1,599,030 | |
| | 2,000 | | Total Kentucky | | | | | 2,164,865 | |
| | | | Louisiana – 0.6% | | | | | | |
| | 500 | | Louisiana Local Government Environmental Facilities and Community Development Authority, Revenue Refunding Bonds, City of Shreveport Airport System Project, Series 2008A, 5.750%, 1/01/28 (Pre-refunded 1/01/19) – AGM Insured (Alternative Minimum Tax) | 1/19 at 100.00 | | AA (5) | | 548,110 | |
| | | | Maryland – 2.0% | | | | | | |
| | 1,000 | | Maryland Economic Development Corporation, Economic Development Revenue Bonds, Transportation Facilities Project, Series 2010A, 5.750%, 6/01/35 | 6/20 at 100.00 | | Baa3 | | 1,102,940 | |
| | 210 | | Maryland Health and Higher Educational Facilities Authority, Revenue Bonds, Patterson Park Public Charter School Issue, Series 2010, 6.000%, 7/01/40 | 7/20 at 100.00 | | BB+ | | 221,109 | |
| | 500 | | Maryland Health and Higher Educational Facilities Authority, Revenue Bonds, Peninsula Regional Medical Center Issue, Refunding Series 2015, 5.000%, 7/01/45 | 7/24 at 100.00 | | A | | 570,035 | |
| | 1,710 | | Total Maryland | | | | | 1,894,084 | |
| | | | Massachusetts – 0.6% | | | | | | |
| | 500 | | Massachusetts Development Finance Agency, Revenue Bonds, UMass Memorial Healthcare, Refunding Series 2016I, 5.000%, 7/01/46 | 7/26 at 100.00 | | BBB+ | | 560,385 | |
| | | | Michigan – 1.6% | | | | | | |
| | 355 | | Detroit Water and Sewerage Department, Michigan, Sewage Disposal System Revenue Bonds, Refunding Senior Lien Series 2012A, 5.250%, 7/01/39 | 7/22 at 100.00 | | A | | 396,915 | |
| | 1,025 | | Michigan State Building Authority, Revenue Bonds, Facilities Program, Refunding Series 2011-II-A, 5.375%, 10/15/36 | 10/21 at 100.00 | | Aa2 | | 1,179,509 | |
| | 1,380 | | Total Michigan | | | | | 1,576,424 | |
| | | | Minnesota – 0.3% | | | | | | |
| | 300 | | City of Minneapolis, Minnesota, Senior Housing and Healthcare Facilities Revenue Bonds, Walker Minneapolis Campus Project, Series 2015, 4.625%, 11/15/31 | 11/22 at 100.00 | | N/R | | 308,427 | |
| | | | Mississippi – 1.5% | | | | | | |
| | 310 | | Mississippi Business Finance Corporation, Pollution Control Revenue Refunding Bonds, System Energy Resources Inc. Project, Series 1998, 5.875%, 4/01/22 | 4/17 at 100.00 | | BBB+ | | 321,076 | |
| | 1,000 | | Mississippi Hospital Equipment and Facilities Authority, Revenue Bonds, Baptist Memorial Healthcare, Series 2016A, 5.000%, 9/01/46 | 9/26 at 100.00 | | A– | | 1,115,470 | |
| | 1,310 | | Total Mississippi | | | | | 1,436,546 | |
| | Principal | | | Optional Call | | | | | |
| | Amount (000) | | Description (1) | Provisions (2) | | Ratings (3) | | Value | |
| | | | Missouri – 8.7% | | | | | | |
| $ | 265 | | Hanley Road Corridor Transportation Development District, Brentwood and Maplewood, Missouri, Transportation Sales Revenue Bonds, Refunding Series 2009A, 5.875%, 10/01/36 | 10/19 at 100.00 | | A– | $ | 290,922 | |
| | 4,450 | | Missouri Environmental Improvement and Energy Resources Authority, Water Facility Revenue Bonds, Missouri-American Water Company, Series 2006, 4.600%, 12/01/36 (Pre-refunded 12/19/16) (WI/DD, Settling 11/01/16) – BHAC Insured (Alternative Minimum Tax) | 12/16 at 100.00 | | AA+ (5) | | 4,457,031 | |
| | 135 | | Missouri Health and Educational Facilities Authority, Educational Facilities Revenue Bonds, Saint Louis College of Pharmacy, Series 2013, 5.250%, 5/01/33 | 5/23 at 100.00 | | BBB+ | | 150,121 | |
| | 1,000 | | Missouri Health and Educational Facilities Authority, Educational Facilities Revenue Bonds, Southwest Baptist University Project, Series 2012, 5.000%, 10/01/33 | 10/22 at 100.00 | | BBB– | | 1,077,420 | |
| | 200 | | Missouri Health and Educational Facilities Authority, Educational Facilities Revenue Bonds, University of Central Missouri, Series 2013C-2, 5.000%, 10/01/34 | 10/23 at 100.00 | | A+ | | 229,384 | |
| | 965 | | Missouri Health and Educational Facilities Authority, Revenue Bonds, Lake Regional Health System, Series 2012, Reg S, 5.000%, 2/15/26 | 2/22 at 100.00 | | BBB+ | | 1,084,052 | |
| | 500 | | Missouri Health and Educational Facilities Authority, Revenue Bonds, Rockhurst University, Series 1999, 6.000%, 10/01/25 | 10/18 at 103.00 | | BBB– | | 550,245 | |
| | 500 | | Missouri Health and Educational Facilities Authority, Revenue Bonds, Rockhurst University, Series 2011A, 5.250%, 10/01/20 | 10/18 at 103.00 | | BBB– | | 546,290 | |
| | 8,015 | | Total Missouri | | | | | 8,385,465 | |
| | | | Nebraska – 0.5% | | | | | | |
| | 400 | | Nebraska Educational Finance Authority, Revenue Bonds, Clarkson College Project, Refunding Series 2011, 5.050%, 9/01/30 | 5/21 at 100.00 | | Aa3 | | 456,528 | |
| | | | New Jersey – 1.6% | | | | | | |
| | 100 | | Gloucester County Pollution Control Financing Authority, New Jersey, Pollution Control Revenue Bonds, Logan Project, Refunding Series 2014A, 5.000%, 12/01/24 (Alternative Minimum Tax) | No Opt. Call | | BBB– | | 113,010 | |
| | 110 | | New Jersey Health Care Facilities Financing Authority, Revenue Bonds, University Hospital Issue, Refunding Series 2015A, 5.000%, 7/01/46 – AGM Insured | 7/25 at 100.00 | | AA | | 124,744 | |
| | 545 | | New Jersey Transportation Trust Fund Authority, Transportation System Bonds, Series 2015AA, 5.000%, 6/15/45 | 6/25 at 100.00 | | A3 | | 591,423 | |
| | | | Tobacco Settlement Financing Corporation, New Jersey, Tobacco Settlement Asset-Backed Bonds, Series 2007-1A: | | | | | | |
| | 250 | | 4.625%, 6/01/26 | 6/17 at 100.00 | | B+ | | 251,175 | |
| | 500 | | 4.750%, 6/01/34 | 6/17 at 100.00 | | B– | | 481,730 | |
| | 1,505 | | Total New Jersey | | | | | 1,562,082 | |
| | | | New York – 3.7% | | | | | | |
| | 630 | | Brooklyn Arena Local Development Corporation, New York, Payment in Lieu of Taxes Revenue Bonds, Barclays Center Project, Series 2009, 6.250%, 7/15/40 (Pre-refunded 1/15/20) | 1/20 at 100.00 | | AA+ (5) | | 732,627 | |
| | 60 | | Buffalo and Erie County Industrial Land Development Corporation, New York, Revenue Bonds, Catholic Health System, Inc. Project, Series 2015, 5.250%, 7/01/35 | 7/25 at 100.00 | | BBB+ | | 69,169 | |
| | 400 | | Hudson Yards Infrastructure Corporation, New York, Revenue Bonds, Senior Fiscal 2012 Series 2011A, 5.750%, 2/15/47 | 2/21 at 100.00 | | A | | 467,716 | |
| | 500 | | New York Liberty Development Corporation, New York, Liberty Revenue Bonds, 3 World Trade Center Project, Class 1 Series 2014, 5.000%, 11/15/44 | 11/24 at 100.00 | | N/R | | 564,325 | |
| | 265 | | Port Authority of New York and New Jersey, Special Project Bonds, JFK International Air Terminal LLC Project, Eighth Series 2010, 6.000%, 12/01/42 | 12/20 at 100.00 | | Baa1 | | 307,490 | |
| | 1,435 | | Yates County Industrial Development Agency, New York, FHA-Insured Civic Facility Mortgage Revenue Bonds, Soldiers and Sailors Memorial Hospital, Series 2000A, 6.000%, 2/01/41 | 2/17 at 100.00 | | N/R | | 1,468,809 | |
| | 3,290 | | Total New York | | | | | 3,610,136 | |
| NMI | Nuveen Municipal Income Fund, Inc. | |
| | Portfolio of Investments (continued) | October 31, 2016 |
| | Principal | | | Optional Call | | | | | |
| | Amount (000) | | Description (1) | Provisions (2) | | Ratings (3) | | Value | |
| | | | North Dakota – 0.6% | | | | | | |
| $ | 200 | | Burleigh County, North Dakota, Health Care Revenue Bonds, Saint Alexius Medical Center Project, Series 2014A, 5.000%, 7/01/35 (Pre-refunded 7/01/21) | 7/21 at 100.00 | | N/R (5) | $ | 234,338 | |
| | 300 | | Fargo, North Dakota, Health System Revenue Bonds, Sanford Health, Refunding Series 2011, 6.250%, 11/01/31 | 11/21 at 100.00 | | A+ | | 360,222 | |
| | 500 | | Total North Dakota | | | | | 594,560 | |
| | | | Ohio – 4.5% | | | | | | |
| | | | Buckeye Tobacco Settlement Financing Authority, Ohio, Tobacco Settlement Asset-Backed Revenue Bonds, Senior Lien, Series 2007A-2: | | | | | | |
| | 300 | | 5.375%, 6/01/24 | 6/17 at 100.00 | | B– | | 296,424 | |
| | 1,020 | | 5.125%, 6/01/24 | 6/17 at 100.00 | | B– | | 966,858 | |
| | 620 | | 6.000%, 6/01/42 | 6/17 at 100.00 | | B– | | 594,803 | |
| | 1,750 | | Middleburg Heights, Ohio, Hospital Facilities Revenue Bonds, Southwest General Health Center Project, Refunding Series 2011, 5.250%, 8/01/36 | 8/21 at 100.00 | | A2 | | 1,940,610 | |
| | 500 | | Montgomery County, Ohio, Health Care and Multifamily Housing Revenue Bonds, Saint Leonard, Refunding & improvement Series 2010, 6.375%, 4/01/30 | 4/20 at 100.00 | | BBB– | | 549,700 | |
| | 4,190 | | Total Ohio | | | | | 4,348,395 | |
| | | | Oregon – 1.4% | | | | | | |
| | 300 | | Forest Grove, Oregon, Campus Improvement Revenue Bonds, Pacific University Project, Refunding Series 2014A, 5.000%, 5/01/40 | 5/22 at 100.00 | | BBB | | 332,136 | |
| | 850 | | Portland, Oregon, River District Urban Renewal and Redevelopment Bonds, Series 2012C, 5.000%, 6/15/29 | 6/22 at 100.00 | | A1 | | 981,393 | |
| | 1,150 | | Total Oregon | | | | | 1,313,529 | |
| | | | Pennsylvania – 3.5% | | | | | | |
| | 1,000 | | Berks County Municipal Authority, Pennsylvania, Revenue Bonds, Reading Hospital and Medical Center Project, Series 2012A, 5.000%, 11/01/40 | 5/22 at 100.00 | | AA– | | 1,107,120 | |
| | 45 | | Cumberland County Municipal Authority Revenue Bonds, Pennsylvania, Diakon Lutheran Social Ministries Project, Series 2009, 6.125%, 1/01/29 | 1/19 at 100.00 | | BBB+ | | 49,440 | |
| | 415 | | Cumberland County Municipal Authority Revenue Bonds, Pennsylvania, Diakon Lutheran Social Ministries Project, Series 2009, 6.125%, 1/01/29 (Pre-refunded 1/01/19) | 1/19 at 100.00 | | N/R (5) | | 460,513 | |
| | 560 | | Montgomery County Industrial Development Authority, Pennsylvania, Health System Revenue Bonds, Albert Einstein Healthcare Network Issue, Series 2015A, 5.250%, 1/15/36 | 1/25 at 100.00 | | Baa2 | | 623,638 | |
| | 1,000 | | Pennsylvania Higher Educational Facilities Authority, Revenue Bonds, Foundation for Student Housing at Indiana University, Project Series 2012A, 5.000%, 7/01/41 | 7/22 at 100.00 | | BBB+ | | 1,108,970 | |
| | 3,020 | | Total Pennsylvania | | | | | 3,349,681 | |
| | | | South Carolina – 0.5% | | | | | | |
| | 475 | | Piedmont Municipal Power Agency, South Carolina, Electric Revenue Bonds, Refunding Series 1991, 6.750%, 1/01/19 – FGIC Insured (ETM) | No Opt. Call | | A3 (5) | | 533,444 | |
| | | | Tennessee – 1.4% | | | | | | |
| | 1,250 | | Chattanooga Health, Educational and Housing Facility Board, Tennessee, Hospital Revenue Bonds, Catholic Health Initiatives, Series 2013A, 5.250%, 1/01/45 | 1/23 at 100.00 | | A– | | 1,394,912 | |
| | | | Texas – 10.3% | | | | | | |
| | 670 | | Central Texas Regional Mobility Authority, Revenue Bonds, Senior Lien, Series 2015A, 5.000%, 1/01/40 | 7/25 at 100.00 | | BBB+ | | 759,539 | |
| | 335 | | Grand Parkway Transportation Corporation, Texas, System Toll Revenue Bonds, First Tier Series 2013A, 5.125%, 10/01/43 | 10/23 at 100.00 | | BBB+ | | 373,180 | |
| | 500 | | Lower Colorado River Authority, Texas, Transmission Contract Revenue Bonds, LCRA Transmission Services Corporation Project, Refunding Series 2015, 5.000%, 5/15/40 | 5/25 at 100.00 | | A+ | | 572,400 | |
| | Principal | | | Optional Call | | | | | |
| | Amount (000) | | Description (1) | Provisions (2) | | Ratings (3) | | Value | |
| | | | Texas (continued) | | | | | | |
| $ | 200 | | North Texas Tollway Authority, Special Projects System Revenue Bonds, Convertible Capital Appreciation Series 2011C, 0.000%, 9/01/43 (8) | 9/31 at 100.00 | | AA+ | $ | 209,322 | |
| | 410 | | North Texas Tollway Authority, System Revenue Bonds, Refunding First Tier, Series 2015B, 5.000%, 1/01/40 | 1/23 at 100.00 | | A1 | | 469,741 | |
| | | | North Texas Tollway Authority, Second Tier System Revenue Refunding Bonds, Tender Option Bond Trust 1015: | | | | | | |
| | 850 | | 18.344%, 1/01/38 (Pre-refunded 1/01/18) (IF) (6) | 1/18 at 100.00 | | A2 (5) | | 1,145,094 | |
| | 150 | | 18.455%, 1/01/38 (Pre-refunded 1/01/18) (IF) (6) | 1/18 at 100.00 | | A2 (5) | | 205,961 | |
| | 500 | | North Texas Tollway Authority, System Revenue Bonds, Refunding Second Tier, Series 2015A, 5.000%, 1/01/38 | 1/25 at 100.00 | | A2 | | 575,455 | |
| | 240 | | Reagan Hospital District of Reagan County, Texas, Limited Tax Revenue Bonds, Series 2014A, 5.000%, 2/01/34 | 2/24 at 100.00 | | Ba2 | | 256,128 | |
| | 295 | | SA Energy Acquisition Public Facilities Corporation, Texas, Gas Supply Revenue Bonds, Series 2007, 5.500%, 8/01/27 | No Opt. Call | | A | | 370,670 | |
| | | | Texas Municipal Gas Acquisition and Supply Corporation III, Gas Supply Revenue Bonds, Series 2012: | | | | | | |
| | 1,165 | | 5.000%, 12/15/27 | No Opt. Call | | A3 | | 1,327,937 | |
| | 505 | | 5.000%, 12/15/28 | No Opt. Call | | A3 | | 570,731 | |
| | 405 | | Texas Private Activity Bond Surface Transportation Corporation, Revenue Bonds, NTE Mobility Partners LLC North Tarrant Express Managed Lanes Project, Senior Lien Series 2009, 6.875%, 12/31/39 | 12/19 at 100.00 | | Baa2 | | 471,108 | |
| | 770 | | Texas Private Activity Bond Surface Transportation Corporation, Senior Lien Revenue Bonds, LBJ Infrastructure Group LLC IH-635 Managed Lanes Project, Series 2010, 7.000%, 6/30/40 | 6/20 at 100.00 | | Baa3 | | 909,778 | |
| | 500 | | Texas Public Finance Authority, Charter School Finance Corporation Revenue Bonds, Idea Public School Project, Series 2007A, 5.000%, 8/15/37 (Pre-refunded 8/15/17) – ACA Insured | 8/17 at 100.00 | | BBB (5) | | 516,880 | |
| | 1,000 | | Texas Transportation Commission, Central Texas Turnpike System Revenue Bonds, Second Tier Refunding Series 2015C, 5.000%, 8/15/32 | 8/24 at 100.00 | | BBB+ | | 1,153,720 | |
| | 45 | | West Texas Independent School District, McLennan and Hill Counties, General Obligation Refunding Bonds, Series 1998, 0.000%, 8/15/25 | 1/17 at 62.42 | | AAA | | 27,918 | |
| | 8,540 | | Total Texas | | | | | 9,915,562 | |
| | | | Virginia – 0.3% | | | | | | |
| | 250 | | Virginia Small Business Financing Authority, Senior Lien Revenue Bonds, Elizabeth River Crossing, Opco LLC Project, Series 2012, 6.000%, 1/01/37 (Alternative Minimum Tax) | 7/22 at 100.00 | | BBB | | 291,755 | |
| | | | Washington – 0.5% | | | | | | |
| | 500 | | Washington State Health Care Facilities Authority, Revenue Bonds, Northwest Hospital and Medical Center of Seattle, Series 2007, 5.700%, 12/01/32 (Pre-refunded 12/04/17) | 12/17 at 100.00 | | N/R (5) | | 526,175 | |
| | | | Wisconsin – 5.7% | | | | | | |
| | 290 | | Wisconsin Health and Educational Facilities Authority, Revenue Bonds, Beloit Health System, Inc., Series 2010B, 5.000%, 4/01/30 | 4/20 at 100.00 | | A– | | 311,477 | |
| | 955 | | Wisconsin Health and Educational Facilities Authority, Revenue Bonds, Gundersen Lutheran, Series 2011A, 5.250%, 10/15/39 | 10/21 at 100.00 | | A+ | | 1,075,970 | |
| | 1,000 | | Wisconsin Health and Educational Facilities Authority, Revenue Bonds, Marquette University, Series 2012, 4.000%, 10/01/32 | 10/22 at 100.00 | | A2 | | 1,068,370 | |
| | 1,000 | | Wisconsin Health and Educational Facilities Authority, Revenue Bonds, Meriter Hospital, Inc., Series 2011A, 5.500%, 5/01/31 (Pre-refunded 5/01/21) | 5/21 at 100.00 | | N/R (5) | | 1,190,970 | |
| | 1,000 | | Wisconsin Health and Educational Facilities Authority, Revenue Bonds, ProHealth Care, Inc. Obligated Group, Refunding Series 2015, 5.000%, 8/15/39 | 8/24 at 100.00 | | A+ | | 1,139,070 | |
| NMI | Nuveen Municipal Income Fund, Inc. | |
| | Portfolio of Investments (continued) | October 31, 2016 |
| | Principal | | | Optional Call | | | | | |
| | Amount (000) | | Description (1) | Provisions (2) | | Ratings (3) | | Value | |
| | | | Wisconsin (continued) | | | | | | |
| $ | 500 | | Wisconsin Health and Educational Facilities Authority, Revenue Bonds, Rogers Memorial Hospital, Inc., Series 2014B, 5.000%, 7/01/44 | 7/24 at 100.00 | | BBB+ | $ | 551,970 | |
| | 200 | | Wisconsin Health and Educational Facilities Authority, Wisconsin, Revenue Bonds, Dickson Hollow Project. Series 2014, 5.125%, 10/01/34 | 10/22 at 102.00 | | N/R | | 210,760 | |
| | 4,945 | | Total Wisconsin | | | | | 5,548,587 | |
| $ | 90,860 | | Total Long-Term Investments (cost $87,060,050) | | | | | 97,886,599 | |
| | | | Other Assets Less Liabilities – (1.4)% | | | | | (1,354,597 | ) |
| | | | Net Assets – 100% | | | | $ | 96,532,002 | |
| (1) | All percentages shown in the Portfolio of Investments are based on net assets. |
| (2) | Optional Call Provisions: Dates (month and year) and prices of the earliest optional call or redemption. There may be other call provisions at varying prices at later dates. Certain mortgage-backed securities may be subject to periodic principal paydowns. Optional Call Provisions are not covered by the report of independent registered public accounting firm. |
| (3) | For financial reporting purposes, the ratings disclosed are the highest of Standard & Poor’s Group (“Standard & Poor’s”), Moody’s Investors Service, Inc. (“Moody’s”) or Fitch, Inc. (“Fitch”) rating. This treatment of split-rated securities may differ from that used for other purposes, such as for Fund investment policies. Ratings below BBB by Standard & Poor’s, Baa by Moody’s or BBB by Fitch are considered to be below investment grade. Holdings designated N/R are not rated by any of these national rating agencies. Ratings are not covered by the report of independent registered public accounting firm. |
| (4) | The coupon for this security increased 0.25% effective January 1, 2016 and will increase an additional 0.25% effective May 11, 2016. |
| (5) | Backed by an escrow or trust containing sufficient U.S. Government or U.S. Government agency securities, which ensure the timely payment of principal and interest. Certain bonds backed by U.S. Government or agency securities are regarded as having an implied rating equal to the ratings of such securities. |
| (6) | Investment, or portion of investment, has been pledged as collateral for the net payment obligations in inverse floating rate transactions. |
| (7) | On May 7, 2015, the Fund’s Adviser determined it was unlikely that this borrower would fulfill its entire obligation on this security, and therefore reduced the security’s interest rate of accrual from 5.250% to 2.100%. |
| (8) | Step-up coupon. The rate shown is the coupon as of the end of the reporting period. |
| (ETM) | Escrowed to maturity. |
| (IF) | Inverse floating rate investment. |
| (WI/DD) | Investment, or portion of investment, purchased on a when-issued or delayed delivery basis. |
| Reg S | Regulation S allows U.S. companies to sell securities to persons or entities located outside of the United States without registering those securities with the Securities and Exchange Commission. Specifically, Regulation S provides a safe harbor from the registration requirements of the Securities Act for the offers and sales of securities by both foreign and domestic issuers that are made outside the United States. |
See accompanying notes to financial statements.
| NEV | | |
| | Nuveen Enhanced Municipal Value Fund | |
| | Portfolio of Investments | October 31, 2016 |
| | Principal | | | Optional Call | | | | | |
| | Amount (000) | | Description (1) | Provisions (2) | | Ratings (3) | | Value | |
| | | | LONG-TERM INVESTMENTS – 111.4% | | | | | | |
| | | | MUNICIPAL BONDS – 110.6% | | | | | | |
| | | | Alabama – 0.9% | | | | | | |
| $ | 2,000 | | Jefferson County, Alabama, Limited Obligation School Warrants, Education Tax Revenue Bonds, Series 2004A, 5.250%, 1/01/23 – AGM Insured | 1/17 at 100.00 | | AA | $ | 2,011,020 | |
| | 1,350 | | Jefferson County, Alabama, Sewer Revenue Warrants, Senior Lien Series 2013A, 5.250%, 10/01/48 – AGM Insured | 10/23 at 102.00 | | AA | | 1,553,971 | |
| | 3,350 | | Total Alabama | | | | | 3,564,991 | |
| | | | Arizona – 3.3% | | | | | | |
| | 1,585 | | Arizona Health Facilities Authority, Hospital Revenue Bonds, Banner Health Systems, Tender Option Bond Trust 2015-XF2046, 16.186%, 1/01/43 (IF) (4) | 1/22 at 100.00 | | AA– | | 2,383,174 | |
| | 2,000 | | Arizona State, Certificates of Participation, Series 2010A, 5.250%, 10/01/28 – AGM Insured | 10/19 at 100.00 | | AA | | 2,221,560 | |
| | 2,500 | | Festival Ranch Community Facilities District, Buckeye, Arizona, General Obligation Bonds, Series 2009, 6.500%, 7/15/31 – BAM Insured | 7/19 at 100.00 | | AA | | 2,761,300 | |
| | 1,030 | | Phoenix Industrial Development Authority, Arizona, Education Facility Revenue Bonds, Great Hearts Academies – Veritas Project, Series 2012, 6.600%, 7/01/47 | 7/21 at 100.00 | | BB | | 1,147,863 | |
| | 320 | | Quechan Indian Tribe of the Fort Yuma Reservation, Arizona, Government Project Bonds, Series 2008, 7.000%, 12/01/27 | 12/17 at 102.00 | | B– | | 311,581 | |
| | 2,000 | | Quechan Indian Tribe of the Fort Yuma Reservation, Arizona, Tribal Economic Development Bonds, Series 2012A, 9.750%, 5/01/25 | 5/22 at 100.00 | | B+ | | 2,233,560 | |
| | 50 | | Salt Verde Financial Corporation, Arizona, Senior Gas Revenue Bonds, Citigroup Energy Inc Prepay Contract Obligations, Series 2007, 5.000%, 12/01/32 | No Opt. Call | | BBB+ | | 60,401 | |
| | 1,719 | | Watson Road Community Facilities District, Arizona, Special Assessment Revenue Bonds, Series 2005, 6.000%, 7/01/30 | 1/17 at 100.00 | | N/R | | 1,716,456 | |
| | 11,204 | | Total Arizona | | | | | 12,835,895 | |
| | | | California – 15.1% | | | | | | |
| | 180 | | Alameda Corridor Transportation Authority, California, Revenue Bonds, Refunding Second Subordinate Lien Series 2016B, 5.000%, 10/01/37 | 10/26 at 100.00 | | BBB+ | | 209,669 | |
| | 5,000 | | Bay Area Toll Authority, California, Revenue Bonds, San Francisco Bay Area Toll Bridge, Series 2009F-1, 5.000%, 4/01/34 (Pre-refunded 4/01/19) | 4/19 at 100.00 | | AA (5) | | 5,490,200 | |
| | 920 | | California Educational Facilities Authority, Revenue Bonds, University of Southern California, Tender Option Bond Trust 2015-XF2188, 17.137%, 10/01/38 (Pre-refunded 10/01/18) (IF) (4) | 10/18 at 100.00 | | Aa1 (5) | | 1,230,058 | |
| | 2,040 | | California Health Facilities Financing Authority, Revenue Bonds, Providence Health & Services, Tender Option Bond Trust 2015-XF0120, 22.320%, 10/01/39 (IF) (4) | 10/19 at 100.00 | | AA– | | 3,217,345 | |
| | | | California Health Facilities Financing Authority, Revenue Bonds, Sutter Health, Tender Option Bond Trust 2016-XG0048: | | | | | | |
| | 300 | | 21.644%, 8/15/26 (IF) (4) | 8/20 at 100.00 | | AA– | | 536,160 | |
| | 1,700 | | 21.644%, 8/15/26 (IF) (4) | 8/20 at 100.00 | | AA– | | 3,038,240 | |
| | 1,000 | | California Municipal Finance Authority, Revenue Bonds, Harbor Regional Center Project, Series 2009, 8.000%, 11/01/29 (Pre-refunded 11/01/19) | 11/19 at 100.00 | | A3 (5) | | 1,204,440 | |
| | 3,450 | | California Statewide Communities Development Authority, California, Revenue Bonds, Loma Linda University Medical Center, Series 2016A, 5.250%, 12/01/56 | 6/26 at 100.00 | | BB | | 3,863,586 | |
| | 500 | | California Statewide Communities Development Authority, Revenue Bonds, American Baptist Homes of the West, Series 2010, 5.750%, 10/01/25 | 10/19 at 100.00 | | BBB+ | | 556,205 | |
| | 400 | | Davis Redevelopment Agency, California, Tax Allocation Bonds, Davis Redevelopment Project, Subordinate Series 2011A, 7.000%, 12/01/36 | 12/21 at 100.00 | | A+ | | 502,224 | |
| NEV | Nuveen Enhanced Municipal Value Fund | |
| | Portfolio of Investments (continued) | October 31, 2016 |
| | Principal | | | Optional Call | | | | | |
| | Amount (000) | | Description (1) | Provisions (2) | | Ratings (3) | | Value | |
| | | | California (continued) | | | | | | |
| $ | 490 | | Etiwanda School District, California, Special Tax Bonds, Coyote Canyon Community Facilities District 2004-1 Improvement Area 2, Series 2009, 6.500%, 9/01/32 (Pre-refunded 9/01/19) | 9/19 at 100.00 | | N/R (5) | $ | 562,834 | |
| | 2,000 | | Golden State Tobacco Securitization Corporation, California, Tobacco Settlement Asset-Backed Bonds, Series 2007A-1, 5.750%, 6/01/47 | 6/17 at 100.00 | | B– | | 1,983,100 | |
| | | | Golden State Tobacco Securitization Corporation, California, Tobacco Settlement Asset-Backed Bonds, Tender Option Bond Trust 2015-XF1038: | | | | | | |
| | 1,250 | | 15.197%, 6/01/40 (IF) (4) | 6/25 at 100.00 | | A+ | | 2,042,375 | |
| | 2,445 | | 15.185%, 6/01/40 (IF) (4) | 6/25 at 100.00 | | A+ | | 3,993,565 | |
| | 2,550 | | Grossmont Healthcare District, California, General Obligation Bonds, Tender Option Bond Trust 3253, 29.962%, 7/15/40 (Pre-refunded 7/15/21) (IF) (4) | 7/21 at 100.00 | | Aaa | | 6,028,327 | |
| | 960 | | Inland Empire Tobacco Securitization Authority, California, Tobacco Settlement Asset-Backed Bonds, Series 2007, 4.625%, 6/01/21 | 6/17 at 100.00 | | N/R | | 962,957 | |
| | 225 | | Long Beach Bond Finance Authority, California, Natural Gas Purchase Revenue Bonds, Series 2007B, 1.997%, 11/15/27 | No Opt. Call | | A | | 214,749 | |
| | 1,710 | | Los Angeles Community College District, California, General Obligation Bonds, Tender Option Bond Trust 2016-XG0045, 21.915%, 8/01/33 (Pre-refunded 8/01/18) (IF) | 8/18 at 100.00 | | AA+ (5) | | 2,397,027 | |
| | 1,600 | | Los Angeles County, California, Community Development Commission Headquarters Office Building, Lease Revenue Bonds, Community Development Properties Los Angeles County Inc., Tender Option Bond Trust 2016-XL0022, 20.527%, 9/01/42 (IF) (4) | 9/21 at 100.00 | | Aa3 | | 2,905,520 | |
| | 525 | | Los Angeles Department of Airports, California, Revenue Bonds, Los Angeles International Airport, Senior Lien Series 2010A, 5.000%, 5/15/31 | 5/20 at 100.00 | | AA | | 595,119 | |
| | 1,080 | | National City Community Development Commission, California, Tax Allocation Bonds, National City Redevelopment Project, Series 2011, 7.000%, 8/01/32 | 8/21 at 100.00 | | A | | 1,339,362 | |
| | 1,165 | | Novato Redevelopment Agency, California, Tax Allocation Bonds, Hamilton Field Redevelopment Project, Series 2011, 6.750%, 9/01/40 | 9/21 at 100.00 | | BBB+ | | 1,410,512 | |
| | 945 | | Palm Drive Health Care District, Sonoma County, California, Certificates of Participation, Parcel Tax Secured Financing Program, Series 2010, 7.000%, 4/01/25 | 1/17 at 102.00 | | CCC+ | | 932,205 | |
| | 265 | | Palomar Pomerado Health Care District, California, Certificates of Participation, Series 2009, 6.750%, 11/01/39 (Pre-refunded 11/01/19) | 11/19 at 100.00 | | Ba1 (5) | | 308,479 | |
| | 250 | | Ridgecrest Redevelopment Agency, California, Ridgecrest Redevelopment Project Tax Allocation Bonds, Refunding Series 2010, 6.125%, 6/30/37 | 6/20 at 100.00 | | A– | | 289,403 | |
| | | | San Francisco Redevelopment Finance Authority, California, Tax Allocation Revenue Bonds, Mission Bay North Redevelopment Project, Series 2011C: | | | | | | |
| | 500 | | 6.500%, 8/01/27 (Pre-refunded 2/01/21) | 2/21 at 100.00 | | A– (5) | | 612,730 | |
| | 700 | | 6.750%, 8/01/33 (Pre-refunded 2/01/21) | 2/21 at 100.00 | | A– (5) | | 865,074 | |
| | 500 | | San Francisco Redevelopment Financing Authority, California, Tax Allocation Revenue Bonds, Mission Bay South Redevelopment Project, Series 2011D, 6.625%, 8/01/27 (Pre-refunded 2/01/21) | 2/21 at 100.00 | | BBB+ (5) | | 615,320 | |
| | 360 | | Santee Community Development Commission, California, Santee Redevelopment Project Tax Allocation Bonds, Series 2011A, 7.000%, 8/01/31 (Pre-refunded 2/01/21) | 2/21 at 100.00 | | A (5) | | 438,008 | |
| | 1,000 | | Semitrophic Improvement District of Semitrophic Water Storage District, Kern County, California, Revenue Bonds, Refunding Series 2009A, 5.000%, 12/01/38 | 12/19 at 100.00 | | A+ | | 1,111,030 | |
| | 2,400 | | Semitrophic Improvement District of Semitrophic Water Storage District, Kern County, California, Revenue Bonds, Tender Option Bond Trust 2015-XF0117, 18.830%, 12/01/34 (IF) (4) | 12/19 at 100.00 | | A+ | | 3,731,784 | |
| | 3,110 | | Stockton Unified School District, San Joaquin County, California, General Obligation Bonds, Election 2005 Series 2007, 5.000%, 8/01/31 (Pre-refunded 8/01/17) – AGM Insured | 8/17 at 100.00 | | AA (5) | | 3,211,386 | |
| | 1,045 | | Ukiah Redevelopment Agency, California, Tax Allocation Bonds, Ukiah Redevelopment Project, Series 2011A, 6.500%, 12/01/28 | 6/21 at 100.00 | | A+ | | 1,253,216 | |
| | 1,020 | | Western Placer Unified School District, Placer County, California, Certificates of Participation, Refunding Series 2009, 5.250%, 8/01/35 – AGM Insured | 8/19 at 100.00 | | AA | | 1,122,163 | |
| | 43,585 | | Total California | | | | | 58,774,372 | |
| | Principal | | | Optional Call | | | | | |
| | Amount (000) | | Description (1) | Provisions (2) | | Ratings (3) | | Value | |
| | | | Colorado – 3.8% | | | | | | |
| $ | 1,902 | | Colorado Educational and Cultural Facilities Authority, Revenue Bonds, Montessori School of Evergreen, Series 2005A, 6.500%, 12/01/35 | 1/17 at 100.00 | | N/R | $ | 1,904,701 | |
| | | | Colorado Housing and Finance Authority, Revenue Bonds, Confluence Energy LLC Project, Series 2007: | | | | | | |
| | 250 | | 6.200%, 4/01/16 (Alternative Minimum Tax) (6) | No Opt. Call | | N/R | | 224,923 | |
| | 26 | | 5.000%, 12/01/16 (Alternative Minimum Tax) (6), (7) | No Opt. Call | | N/R | | 24,577 | |
| | 2,000 | | Conservatory Metropolitan District, Aurora, Arapahoe County, Colorado, General Obligation Bonds, Limited Tax Series 2007, 5.125%, 12/01/37 – RAAI Insured | 12/17 at 100.00 | | AA | | 2,011,480 | |
| | 4,000 | | E-470 Public Highway Authority, Colorado, Toll Revenue Bonds, Refunding Series 2006B, 0.000%, 9/01/39 – NPFG Insured | 9/26 at 52.09 | | AA– | | 1,424,520 | |
| | 2,860 | | E-470 Public Highway Authority, Colorado, Toll Revenue Bonds, Series 2004A, 0.000%, 9/01/27 – NPFG Insured | No Opt. Call | | AA– | | 2,118,002 | |
| | | | Public Authority for Colorado Energy, Natural Gas Purchase Revenue Bonds, Colorado Springs Utilities, Series 2008: | | | | | | |
| | 475 | | 6.250%, 11/15/28 | No Opt. Call | | A | | 616,032 | |
| | 4,030 | | 6.500%, 11/15/38 | No Opt. Call | | A | | 5,659,329 | |
| | 815 | | Three Springs Metropolitan District 3, Durango, La Plata County, Colorado, Property Tax Supported Revenue Bonds, Series 2010, 7.750%, 12/01/39 | 12/20 at 100.00 | | N/R | | 870,876 | |
| | 16,358 | | Total Colorado | | | | | 14,854,440 | |
| | | | Connecticut – 0.3% | | | | | | |
| | 936 | | Harbor Point Infrastructure Improvement District, Connecticut, Special Obligation Revenue Bonds, Harbor Point Project, Series 2010A, 7.000%, 4/01/22 | 4/20 at 100.00 | | N/R | | 1,037,490 | |
| | | | District of Columbia – 0.4% | | | | | | |
| | 1,500 | | District of Columbia, Revenue Bonds, Center for Strategic and International Studies, Inc., Series 2011, 6.375%, 3/01/31 | 3/21 at 100.00 | | BBB– | | 1,670,640 | |
| | | | Florida – 5.7% | | | | | | |
| | 1,740 | | Ave Maria Stewardship Community District, Florida, Capital Improvement Revenue Bonds, Series 2006A, 5.125%, 5/01/38 | 1/17 at 100.00 | | N/R | | 1,739,843 | |
| | 1,000 | | Bonterra Community Development District, Hialeah, Florida, Special Assessment Bonds, Assessment Area 2 Project, Series 2016, 4.500%, 5/01/34 | 5/27 at 100.00 | | N/R | | 1,005,830 | |
| | 2,000 | | Collier County Educational Facilities Authority, Florida, Revenue Bonds, Ave Maria University, Refunding Series 2013A, 5.625%, 6/01/33 | 6/23 at 100.00 | | BBB– | | 2,279,460 | |
| | 975 | | Copperstone Community Development District, Manatee County, Florida, Capital Improvement Revenue Bonds, Series 2007, 5.200%, 5/01/38 | 5/17 at 100.00 | | N/R | | 976,297 | |
| | 1,000 | | Florida Development Finance Corporation, Educational Facilities Revenue Bonds, Renaissance Charter School, Inc. Projects, Series 2011A, 7.500%, 6/15/33 | 6/21 at 100.00 | | BB– | | 1,155,630 | |
| | 1,000 | | Miami-Dade County Health Facility Authority, Florida, Hospital Revenue Bonds, Miami Children’s Hospital, Series 2010A, 6.000%, 8/01/30 | 8/20 at 100.00 | | A+ | | 1,142,030 | |
| | 1,625 | | Miami-Dade County, Florida, Aviation Revenue Bonds, Miami International Airport, Series 2010A-1, 5.375%, 10/01/35 | 10/20 at 100.00 | | A | | 1,842,896 | |
| | 3,660 | | Miami-Dade County, Florida, Special Obligation Bonds, Capital Asset Acquisition Series 2009A, 5.125%, 4/01/34 – AGC Insured | 4/19 at 100.00 | | AA | | 3,932,084 | |
| | 1,500 | | North Sumter County Utility Dependent District, Florida, Utility Revenue Bonds, Series 2010, 5.375%, 10/01/40 | 10/20 at 100.00 | | AA | | 1,684,800 | |
| | | | Palm Beach County Health Facilities Authority, Florida, Revenue Bonds, Jupiter Medical Center, Series 2013A: | | | | | | |
| | 1,000 | | 5.000%, 11/01/33 | 11/22 at 100.00 | | BBB+ | | 1,092,710 | |
| | 2,000 | | 5.000%, 11/01/43 | 11/22 at 100.00 | | BBB+ | | 2,163,900 | |
| NEV | Nuveen Enhanced Municipal Value Fund | |
| | Portfolio of Investments (continued) | October 31, 2016 |
| | Principal | | | Optional Call | | | | | |
| | Amount (000) | | Description (1) | Provisions (2) | | Ratings (3) | | Value | |
| | | | Florida (continued) | | | | | | |
| $ | 425 | | Port Saint Lucie. Florida, Special Assessment Revenue Bonds, Southwest Annexation District 1, Series 2007B, 5.000%, 7/01/33 (Pre-refunded 7/01/17) – NPFG Insured | 7/17 at 100.00 | | AA– (5) | $ | 437,087 | |
| | 80 | | Tolomato Community Development District, Florida, Special Assessment Bonds, Convertible, Capital Appreciation, Series 2012A-2, 0.000%, 5/01/39 (8) | 5/17 at 100.00 | | N/R | | 64,774 | |
| | 230 | | Tolomato Community Development District, Florida, Special Assessment Bonds, Convertible, Capital Appreciation, Series 2012A-3, 0.000%, 5/01/40 (8) | 5/19 at 100.00 | | N/R | | 139,392 | |
| | 95 | | Tolomato Community Development District, Florida, Special Assessment Bonds, Convertible, Capital Appreciation, Series 2012A-4, 0.000%, 5/01/40 (8) | 5/22 at 100.00 | | N/R | | 42,740 | |
| | 135 | | Tolomato Community Development District, Florida, Special Assessment Bonds, Hope Note, Series 2007-3, 6.650%, 5/01/40 (6) | 5/18 at 100.00 | | N/R | | 1 | |
| | 15 | | Tolomato Community Development District, Florida, Special Assessment Bonds, Non Performing Parcel Series 2007-1. RMKT, 6.650%, 5/01/40 | 5/18 at 100.00 | | N/R | | 15,230 | |
| | 235 | | Tolomato Community Development District, Florida, Special Assessment Bonds, Refunding Series 2012A-1, 6.650%, 5/01/40 | 5/17 at 100.00 | | N/R | | 235,928 | |
| | 350 | | Tolomato Community Development District, Florida, Special Assessment Bonds, Refunding Series 2015-1, 0.000%, 5/01/40 | 5/18 at 100.00 | | N/R | | 219,335 | |
| | 215 | | Tolomato Community Development District, Florida, Special Assessment Bonds, Refunding Series 2015-2, 0.000%, 5/01/40 (6) | 5/18 at 100.00 | | N/R | | 114,204 | |
| | 235 | | Tolomato Community Development District, Florida, Special Assessment Bonds, Refunding Series 2015-3, 6.610%, 5/01/40 (6) | 5/18 at 100.00 | | N/R | | 2 | |
| | 845 | | Tolomato Community Development District, Florida, Special Assessment Bonds, Series 2006, 5.400%, 5/01/37 | 1/17 at 100.00 | | N/R | | 844,916 | |
| | 1,080 | | Venetian Community Development District, Sarasota County, Florida, Capital Improvement Revenue Bonds, Series 2012-A2, 5.500%, 5/01/34 | 5/22 at 100.00 | | N/R | | 1,146,928 | |
| | 21,440 | | Total Florida | | | | | 22,276,017 | |
| | | | Georgia – 4.4% | | | | | | |
| | 12,000 | | Atlanta, Georgia, Airport General Revenue Bonds, Refunding Series 2010C, 5.250%, 1/01/30 – AGM Insured (UB) | 1/21 at 100.00 | | AA | | 13,837,080 | |
| | 640 | | Atlanta, Georgia, Tax Allocation Bonds, Beltline Project Series 2008A. Remarketed, 7.500%, 1/01/31 | 1/19 at 100.00 | | A2 | | 716,570 | |
| | 555 | | Atlanta, Georgia, Tax Allocation Bonds, Beltline Project Series 2008B. Remarketed, 6.750%, 1/01/20 | 1/19 at 100.00 | | A2 | | 618,803 | |
| | 1,250 | | Clayton County Development Authority, Georgia, Special Facilities Revenue Bonds, Delta Air Lines, Inc. Project, Series 2009A, 8.750%, 6/01/29 | 6/20 at 100.00 | | Baa3 | | 1,513,600 | |
| | 90 | | Main Street Natural Gas Inc., Georgia, Gas Project Revenue Bonds, Series 2006B, 5.000%, 3/15/22 | No Opt. Call | | A | | 101,872 | |
| | 260 | | Main Street Natural Gas Inc., Georgia, Gas Project Revenue Bonds, Series 2007A, 5.500%, 9/15/26 | No Opt. Call | | A | | 320,427 | |
| | 14,795 | | Total Georgia | | | | | 17,108,352 | |
| | | | Guam – 1.3% | | | | | | |
| | 1,760 | | Government of Guam, Business Privilege Tax Bonds, Series 2012B-1, 5.000%, 1/01/42 | 1/22 at 100.00 | | A | | 1,895,784 | |
| | 1,250 | | Guam Government Waterworks Authority, Water and Wastewater System Revenue Bonds, Series 2013, 5.500%, 7/01/43 | 7/23 at 100.00 | | A– | | 1,421,313 | |
| | 1,500 | | Guam Power Authority, Revenue Bonds, Series 2014A, 5.000%, 10/01/44 | 10/24 at 100.00 | | AA | | 1,713,375 | |
| | 4,510 | | Total Guam | | | | | 5,030,472 | |
| | Principal | | | Optional Call | | | | | |
| | Amount (000) | | Description (1) | Provisions (2) | | Ratings (3) | | Value | |
| | | | Illinois – 12.5% | | | | | | |
| $ | 2,840 | | CenterPoint Intermodal Center Program Trust, Illinois, Class A Certificates, Series 2004, 3.490%, 6/15/23 | 12/17 at 100.00 | | N/R | $ | 2,840,738 | |
| | 1,335 | | Chicago Board of Education, Illinois, General Obligation Bonds, Dedicated Revenues, Series 2016B, 6.500%, 12/01/46 | 12/26 at 100.00 | | B | | 1,371,446 | |
| | | | Chicago Board of Education, Illinois, Unlimited Tax General Obligation Bonds, Dedicated Tax Revenues, Series 1998B-1: | | | | | | |
| | 1,000 | | 0.000%, 12/01/22 – NPFG Insured | No Opt. Call | | AA– | | 803,480 | |
| | 1,000 | | 0.000%, 12/01/27 – NPFG Insured | No Opt. Call | | AA– | | 619,880 | |
| | 1,000 | | Chicago, Illinois, General Obligation Bonds, Neighborhoods Alive 21 Program, Series 2002B, 5.500%, 1/01/33 | 1/25 at 100.00 | | BBB+ | | 1,064,130 | |
| | | | Chicago, Illinois, General Obligation Bonds, Refunding Series 2012C: | | | | | | |
| | 320 | | 5.000%, 1/01/23 | 1/22 at 100.00 | | BBB+ | | 341,104 | |
| | 160 | | 5.000%, 1/01/25 | No Opt. Call | | BBB+ | | 168,853 | |
| | | | Chicago, Illinois, General Obligation Bonds, Refunding Series 2016C: | | | | | | |
| | 3,470 | | 5.000%, 1/01/24 | No Opt. Call | | BBB+ | | 3,710,957 | |
| | 350 | | 5.000%, 1/01/29 | 1/26 at 100.00 | | BBB+ | | 365,411 | |
| | 2,000 | | Grundy County School District 54 Morris, Illinois, General Obligation Bonds, Refunding Series 2005, 6.000%, 12/01/24 – AGM Insured | 12/21 at 100.00 | | AA | | 2,383,640 | |
| | 3,000 | | Illinois Finance Authority, Recovery Zone Facility Revenue Bonds, Navistar International Corporation Project, Series 2010, 6.500%, 10/15/40 | 10/20 at 100.00 | | Caa1 | | 3,130,650 | |
| | | | Illinois Finance Authority, Revenue Bonds, Centegra Health System, Tender Option Bond Trust 2016-XF2339: | | | | | | |
| | 1,605 | | 18.592%, 9/01/38 (IF) (4) | 9/22 at 100.00 | | BBB | | 2,253,805 | |
| | 1,540 | | 15.199%, 9/01/38 (IF) (4) | 9/22 at 100.00 | | BBB | | 2,039,052 | |
| | 645 | | Illinois Finance Authority, Revenue Bonds, Christian Homes Inc., Refunding Series 2010, 6.125%, 5/15/27 | 5/20 at 100.00 | | BBB– | | 716,750 | |
| | 355 | | Illinois Finance Authority, Revenue Bonds, Christian Homes Inc., Refunding Series 2010, 6.125%, 5/15/27 (Pre-refunded 5/15/20) | 5/20 at 100.00 | | N/R (5) | | 416,074 | |
| | 920 | | Illinois Finance Authority, Revenue Bonds, Friendship Village of Schaumburg, Series 2005A, 5.375%, 2/15/25 | 1/17 at 100.00 | | BB– | | 920,552 | |
| | 4,000 | | Illinois Finance Authority, Revenue Bonds, Illinois Institute of Technology, Refunding Series 2006A, 5.000%, 4/01/36 | 1/17 at 100.00 | | Baa3 | | 3,985,080 | |
| | 1,000 | | Illinois Finance Authority, Revenue Bonds, Montgomery Place Project, Series 2006A, 5.500%, 5/15/26 | 5/17 at 100.00 | | N/R | | 1,007,150 | |
| | | | Illinois Finance Authority, Revenue Bonds, Northwestern Memorial Healthcare, Tender Option Bond Trust 2015-XF0076: | | | | | | |
| | 690 | | 15.930%, 8/15/37 (IF) | 8/22 at 100.00 | | AA+ | | 1,015,432 | |
| | 150 | | 15.930%, 8/15/43 (IF) | 8/22 at 100.00 | | AA+ | | 217,692 | |
| | 1,975 | | Illinois Finance Authority, Revenue Bonds, Northwestern Memorial Hospital, Tender Option Bonds Trust 16-XL0021, 24.909%, 8/15/39 (IF) (4) | 8/19 at 100.00 | | AA+ | | 3,265,169 | |
| | 1,000 | | Illinois Finance Authority, Revenue Bonds, Palos Community Hospital, Series 2010C, 5.125%, 5/15/35 | 5/20 at 100.00 | | AA– | | 1,086,240 | |
| | 35 | | Illinois Finance Authority, Revenue Bonds, Resurrection Health Care Corporation, Refunding Series 2009, 6.125%, 5/15/25 (Pre-refunded 5/15/19) | 5/19 at 100.00 | | N/R (5) | | 39,460 | |
| | | | Illinois Finance Authority, Revenue Bonds, Resurrection Health Care Corporation, Refunding Series 2009: | | | | | | |
| | 30 | | 6.125%, 5/15/25 (Pre-refunded 5/15/19) | 5/19 at 100.00 | | N/R (5) | | 33,823 | |
| | 935 | | 6.125%, 5/15/25 (Pre-refunded 5/15/19) | 5/19 at 100.00 | | BBB– (5) | | 1,054,147 | |
| | 500 | | Illinois Finance Authority, Revenue Bonds, Southern Illinois Healthcare Enterprises, Inc., Series 2005 Remarketed, 5.250%, 3/01/30 – AGM Insured | 3/20 at 100.00 | | AA | | 550,945 | |
| NEV | Nuveen Enhanced Municipal Value Fund | |
| | Portfolio of Investments (continued) | October 31, 2016 |
| | Principal | | | Optional Call | | | | | |
| | Amount (000) | | Description (1) | Provisions (2) | | Ratings (3) | | Value | |
| | | | Illinois (continued) | | | | | | |
| $ | 455 | | Illinois Finance Authority, Revenue Bonds, The Carle Foundation, Tender Option Bond Trust 2015-XF0121, 24.082%, 8/15/41 – AGM Insured (IF) (4) | 8/21 at 100.00 | | AA | $ | 847,478 | |
| | 2,235 | | Illinois Finance Authority, Student Housing Revenue Bonds, MJH Education Assistance Illinois IV LLC, Fullerton Village Project, Series 2004A, 5.000%, 6/01/24 (6) | 1/17 at 100.00 | | Caa2 | | 2,011,120 | |
| | 1,000 | | Illinois Toll Highway Authority, Toll Highway Revenue Bonds, Senior Lien Series 2016B, 5.000%, 1/01/41 | 7/26 at 100.00 | | AA– | | 1,161,240 | |
| | | | Lombard Public Facilities Corporation, Illinois, Second Tier Conference Center and Hotel Revenue Bonds, Series 2005B: | | | | | | |
| | 2,685 | | 5.250%, 1/01/30 (9) | 1/17 at 100.00 | | D | | 805,232 | |
| | 1,515 | | 5.250%, 1/01/36 (9) | 1/17 at 100.00 | | D | | 454,349 | |
| | 5,000 | | Metropolitan Pier and Exposition Authority, Illinois, Revenue Bonds, McCormick Place Expansion Project, Series 2002A, 0.000%, 12/15/29 – NPFG Insured | No Opt. Call | | AA– | | 2,867,300 | |
| | 1,000 | | Railsplitter Tobacco Settlement Authority, Illinois, Tobacco Settlement Revenue Bonds, Series 2010, 6.000%, 6/01/28 | 6/21 at 100.00 | | A– | | 1,175,210 | |
| | 1,000 | | Springfield, Sangamon County, Illinois, Special Service Area, Legacy Pointe, Special Assessment Bonds, Series 2009, 7.875%, 3/01/32 | 3/17 at 102.00 | | N/R | | 1,026,500 | |
| | 2,500 | | Wauconda, Illinois, Special Service Area 1 Special Tax Bonds, Liberty Lake Project, Refunding Series 2015, 5.000%, 3/01/33 – BAM Insured | 3/25 at 100.00 | | AA | | 2,846,375 | |
| | 49,245 | | Total Illinois | | | | | 48,596,464 | |
| | | | Indiana – 1.4% | | | | | | |
| | 1,395 | | Indiana Finance Authority, Educational Facilities Revenue Bonds, Drexel Foundation For Educational Excellence, Inc., Series 2009A, 6.625%, 10/01/29 | 10/19 at 100.00 | | B– | | 1,355,494 | |
| | 1,500 | | Indiana Finance Authority, Private Activity Bonds, Ohio River Bridges East End Crossing Project, Series 2013A, 5.000%, 7/01/35 (Alternative Minimum Tax) | 7/23 at 100.00 | | BBB+ | | 1,672,800 | |
| | 2,000 | | Vigo County Hospital Authority, Indiana, Hospital Revenue Bonds, Union Hospital, Inc., Series 2011, 7.750%, 9/01/31 (Pre-refunded 9/01/21) | 9/21 at 100.00 | | N/R (5) | | 2,599,620 | |
| | 4,895 | | Total Indiana | | | | | 5,627,914 | |
| | | | Iowa – 0.0% | | | | | | |
| | 155 | | Iowa Finance Authority, Iowa, Midwestern Disaster Area Revenue Bonds, Iowa Fertilizer Company Project, Series 2013, 5.250%, 12/01/25 | 12/23 at 100.00 | | B | | 162,141 | |
| | | | Kansas – 2.4% | | | | | | |
| | 3,000 | | Kansas Development Finance Authority, Revenue Bonds, Lifespace Communities, Inc., Refunding Series 2010S, 5.000%, 5/15/30 | 5/20 at 100.00 | | A | | 3,323,880 | |
| | 1,130 | | Overland Park Development Corporation, Kansas, Second Tier Revenue Bonds, Overland Park Convention Center, Series 2007B, 5.125%, 1/01/22 – AMBAC Insured | 1/17 at 100.00 | | BB+ | | 1,131,887 | |
| | 3,565 | | Overland Park, Kansas, Sales Tax Special Obligation Revenue Bonds, Prairiefire at Lionsgate Project, Series 2012, 6.000%, 12/15/32 | No Opt. Call | | N/R | | 3,371,563 | |
| | 1,130 | | Washburn University of Topeka, Kansas, Revenue Bonds, Series 2015A, 5.000%, 7/01/35 | 7/25 at 100.00 | | A1 | | 1,306,901 | |
| | 8,825 | | Total Kansas | | | | | 9,134,231 | |
| | | | Kentucky – 0.3% | | | | | | |
| | 1,000 | | Hardin County, Kentucky, Hospital Revenue Bonds, Hardin Memorial Hospital Project, Series 2013, 5.700%, 8/01/39 – AGM Insured | 8/23 at 100.00 | | AA | | 1,173,230 | |
| | | | Louisiana – 3.6% | | | | | | |
| | 1,215 | | Louisiana Local Government Environmental Facilities and Community Development Authority, Revenue Bonds, Louisiana Tech University Student Housing & Recreational Facilities/Innovative Student Facilities Inc. Project, Refunding Series 2015, 5.000%, 10/01/33 | 10/25 at 100.00 | | AA | | 1,408,999 | |
| | Principal | | | Optional Call | | | | | |
| | Amount (000) | | Description (1) | Provisions (2) | | Ratings (3) | | Value | |
| | | | Louisiana (continued) | | | | | | |
| $ | 2,000 | | Louisiana Public Facilities Authority, Hospital Revenue and Refunding Bonds, Lafayette General Medical Center Project, Series 2010, 5.500%, 11/01/40 | 5/20 at 100.00 | | A– | $ | 2,165,300 | |
| | 3,305 | | Louisiana Public Facilities Authority, Revenue Bonds, Cleco Power LLC Project, Series 2008, 4.250%, 12/01/38 | 5/23 at 100.00 | | A3 | | 3,499,830 | |
| | 2,665 | | Louisiana Public Facilities Authority, Revenue Bonds, Lake Charles Charter Academy Foundation Project, Series 2011A, 7.750%, 12/15/31 | 12/21 at 100.00 | | N/R | | 3,010,970 | |
| | 985 | | Louisiana Public Facilities Authority, Revenue Bonds, Loyola University Project, Refunding Series 2011, 5.250%, 10/01/28 | 10/21 at 100.00 | | BBB+ | | 1,117,611 | |
| | 1,165 | | Louisiana State, Gasoline and Fuels Tax Revenue Bonds, Tender Option Bond Trust 2016-XG0035, 16.211%, 5/01/39 (IF) | 5/20 at 100.00 | | AA | | 1,717,676 | |
| | 1,000 | | St John Baptist Parish, Louisiana, Revenue Bonds, Marathon Oil Corporation, Series 2007A, 5.125%, 6/01/37 | 6/17 at 100.00 | | BBB | | 1,013,800 | |
| | 12,335 | | Total Louisiana | | | | | 13,934,186 | |
| | | | Maryland – 0.3% | | | | | | |
| | 875 | | Maryland Economic Development Corporation, Private Activity Revenue Bonds AP, Purple Line Light Rail Project, Green Bonds, Series 2016D, 5.000%, 3/31/41 (Alternative Minimum Tax) | 9/26 at 100.00 | | BBB+ | | 991,200 | |
| | | | Massachusetts – 1.5% | | | | | | |
| | 1,595 | | Massachusetts Development Finance Agency, Revenue Bonds, Boston Medical Center Issue, Series 2016E, 5.000%, 7/01/35 | 7/26 at 100.00 | | BBB | | 1,810,022 | |
| | 1,815 | | Massachusetts Educational Financing Authority, Education Loan Revenue Bonds Issue K Series 2013, 5.000%, 7/01/25 (Alternative Minimum Tax) | 7/22 at 100.00 | | AA | | 1,964,193 | |
| | 625 | | Massachusetts Educational Financing Authority, Student Loan Revenue Bonds, Issue I Series 2010A, 5.500%, 1/01/22 | 1/20 at 100.00 | | AA | | 694,631 | |
| | 445 | | Massachusetts Educational Financing Authority, Student Loan Revenue Bonds, Issue I Series 2010B, 5.500%, 1/01/23 (Alternative Minimum Tax) | 1/20 at 100.00 | | AA | | 477,654 | |
| | 825 | | Massachusetts Housing Finance Agency, Housing Bonds, Series 2010C, 5.000%, 12/01/30 (Alternative Minimum Tax) | 6/20 at 100.00 | | AA– | | 861,077 | |
| | 5,305 | | Total Massachusetts | | | | | 5,807,577 | |
| | | | Michigan – 1.4% | | | | | | |
| | 10 | | Detroit, Michigan, Water Supply System Senior Lien Revenue Bonds, Series 2003A, 5.000%, 7/01/34 – NPFG Insured | 1/17 at 100.00 | | A | | 10,031 | |
| | 2,865 | | Marysville Public School District, Saint Clair County, Michigan, General Obligation Bonds, School Building & Site Series 2007, 5.000%, 5/01/32 (Pre-refunded 5/01/17) – AGM Insured | 5/17 at 100.00 | | Aa1 (5) | | 2,926,168 | |
| | 2,100 | | Michigan State Hospital Finance Authority, Hospital Revenue Bonds, Henry Ford Health System, Refunding Series 2009, 5.750%, 11/15/39 (Pre-refunded 11/15/19) | 11/19 at 100.00 | | A (5) | | 2,395,113 | |
| | 4,975 | | Total Michigan | | | | | 5,331,312 | |
| | | | Mississippi – 0.1% | | | | | | |
| | 310 | | Mississippi Business Finance Corporation, Pollution Control Revenue Refunding Bonds, System Energy Resources Inc. Project, Series 1998, 5.875%, 4/01/22 | 4/17 at 100.00 | | BBB+ | | 321,076 | |
| | | | Missouri – 0.2% | | | | | | |
| | 640 | | St. Louis County Industrial Development Authority, Missouri, Revenue Bonds, Friendship Village of West County, Series 2007A, 5.375%, 9/01/21 | 9/17 at 100.00 | | BBB– | | 651,846 | |
| | | | Nebraska – 0.3% | | | | | | |
| | 1,000 | | Omaha Public Power District, Nebraska, Electric System Revenue Bonds, Series 2007A, 5.000%, 2/01/43 (Pre-refunded 2/01/17) | 2/17 at 100.00 | | AA (5) | | 1,010,800 | |
| NEV | Nuveen Enhanced Municipal Value Fund | |
| | Portfolio of Investments (continued) | October 31, 2016 |
| | Principal | | | Optional Call | | | | | |
| | Amount (000) | | Description (1) | Provisions (2) | | Ratings (3) | | Value | |
| | | | Nevada – 1.3% | | | | | | |
| $ | 2,000 | | Clark County, Nevada, Passenger Facility Charge Revenue Bonds, Las Vegas-McCarran International Airport, Series 2010A, 5.000%, 7/01/30 | 1/20 at 100.00 | | A+ | $ | 2,204,540 | |
| | 1,670 | | Las Vegas, Nevada, General Obligation Bonds, Tender Option Bond Trust 2016-XF2312, 29.552%, 4/01/39 (Pre-refunded 4/01/19) (IF) (4) | 4/19 at 100.00 | | AA (5) | | 2,871,097 | |
| | 3,670 | | Total Nevada | | | | | 5,075,637 | |
| | | | New Jersey – 4.3% | | | | | | |
| | 795 | | New Jersey Economic Development Authority, School Facilities Construction Financing Program Bonds, Refunding Series 2015WW, 5.250%, 6/15/40 (UB) (4) | 6/25 at 100.00 | | A3 | | 885,225 | |
| | | | New Jersey Economic Development Authority, Special Facilities Revenue Bonds, Continental Airlines Inc., Series 1999: | | | | | | |
| | 1,000 | | 5.125%, 9/15/23 (Alternative Minimum Tax) | 3/17 at 100.00 | | BB– | | 1,115,390 | |
| | 1,650 | | 5.250%, 9/15/29 (Alternative Minimum Tax) | 9/22 at 101.00 | | BB– | | 1,839,156 | |
| | 1,460 | | New Jersey Health Care Facilities Financing Authority, Revenue Bonds, Princeton HealthCare System, Series 2016A, 5.000%, 7/01/34 | 7/26 at 100.00 | | Baa2 | | 1,720,157 | |
| | 1,130 | | New Jersey Higher Education Assistance Authority, Student Loan Revenue Bonds, Series 2010-1A, 5.000%, 12/01/26 | 12/19 at 100.00 | | AA | | 1,184,884 | |
| | 20,000 | | New Jersey Transportation Trust Fund Authority, Transportation System Bonds, Refunding Series 2006C, 0.000%, 12/15/36 – AMBAC Insured (UB) (4) | No Opt. Call | | A3 | | 8,504,800 | |
| | 1,500 | | Tobacco Settlement Financing Corporation, New Jersey, Tobacco Settlement Asset-Backed Bonds, Series 2007-1A, 4.625%, 6/01/26 | 6/17 at 100.00 | | B+ | | 1,507,050 | |
| | 27,535 | | Total New Jersey | | | | | 16,756,662 | |
| | | | New York – 4.0% | | | | | | |
| | | | Brooklyn Arena Local Development Corporation, New York, Payment in Lieu of Taxes Revenue Bonds, Barclays Center Project, Series 2009: | | | | | | |
| | 1,100 | | 6.000%, 7/15/30 (Pre-refunded 1/15/20) | 1/20 at 100.00 | | AA+ (5) | | 1,270,555 | |
| | 1,225 | | 6.250%, 7/15/40 (Pre-refunded 1/15/20) | 1/20 at 100.00 | | AA+ (5) | | 1,424,552 | |
| | 2,500 | | 6.375%, 7/15/43 (Pre-refunded 1/15/20) | 1/20 at 100.00 | | AA+ (5) | | 2,917,075 | |
| | 1,000 | | Monroe County Industrial Development Corporation, New York, Revenue Bonds, St. John Fisher College, Series 2011, 6.000%, 6/01/34 | 6/21 at 100.00 | | A– | | 1,150,190 | |
| | 500 | | New York Liberty Development Corporation, New York, Liberty Revenue Bonds, 3 World Trade Center Project, Class 2 Series 2014, 5.150%, 11/15/34 | 11/24 at 100.00 | | N/R | | 570,335 | |
| | 1,000 | | New York Liberty Development Corporation, Revenue Bonds, Goldman Sachs Headquarters Issue, Series 2005, 5.250%, 10/01/35 | No Opt. Call | | A | | 1,267,850 | |
| | 2,105 | | New York Transportation Development Corporation, Special Facilities Bonds, LaGuardia Airport Terminal B Redevelopment Project, Series 2016A, 5.250%, 1/01/50 (Alternative Minimum Tax) | 7/24 at 100.00 | | BBB | | 2,335,940 | |
| | 265 | | Port Authority of New York and New Jersey, Special Project Bonds, JFK International Air Terminal LLC Project, Eighth Series 2010, 6.000%, 12/01/42 | 12/20 at 100.00 | | Baa1 | | 307,490 | |
| | | | TSASC Inc., New York, Tobacco Asset-Backed Bonds, Series 2006: | | | | | | |
| | 2,000 | | 5.000%, 6/01/26 | 1/17 at 100.00 | | BB– | | 1,999,880 | |
| | 2,265 | | 5.125%, 6/01/42 | 1/17 at 100.00 | | B– | | 2,198,930 | |
| | 13,960 | | Total New York | | | | | 15,442,797 | |
| | | | Ohio – 11.0% | | | | | | |
| | | | Buckeye Tobacco Settlement Financing Authority, Ohio, Tobacco Settlement Asset-Backed Revenue Bonds, Senior Lien, Series 2007A-2: | | | | | | |
| | 1,000 | | 5.125%, 6/01/24 | 6/17 at 100.00 | | B– | | 947,900 | |
| | 6,000 | | 5.750%, 6/01/34 | 6/17 at 100.00 | | B– | | 5,623,980 | |
| | 6,500 | | 5.875%, 6/01/47 | 6/17 at 100.00 | | B– | | 6,152,055 | |
| | 760 | | Franklin County, Ohio, Healthcare Facilities Revenue Bonds, Ohio Presbyterian Retirement Services, Improvement Series 2010A, 5.625%, 7/01/26 | 7/21 at 100.00 | | BBB– | | 837,360 | |
| | Principal | | | Optional Call | | | | | |
| | Amount (000) | | Description (1) | Provisions (2) | | Ratings (3) | | Value | |
| | | | Ohio (continued) | | | | | | |
| $ | 10,000 | | Franklin County, Ohio, Hospital Facilities Revenue Bonds, OhioHealth Corporation, Series 2015, 5.000%, 5/15/40 (UB) | 5/25 at 100.00 | | AA+ | $ | 11,586,400 | |
| | 3,000 | | Lucas County, Ohio, Hospital Revenue Bonds, ProMedica Healthcare Obligated Group, Series 2011A, 5.750%, 11/15/31 | 11/21 at 100.00 | | AA | | 3,558,810 | |
| | 1,000 | | Montgomery County, Ohio, Health Care and Multifamily Housing Revenue Bonds, Saint Leonard, Refunding & improvement Series 2010, 6.375%, 4/01/30 | 4/20 at 100.00 | | BBB– | | 1,099,400 | |
| | 1,670 | | Montgomery County, Ohio, Revenue Bonds, Catholic Health Initiatives, Tender Option Bond Trust 2016-XF2311, 24.786%, 5/01/34 (IF) (4) | 5/19 at 100.00 | | A– | | 2,685,193 | |
| | 6,000 | | Ohio Air Quality Development Authority, Ohio, Pollution Control Revenue Bonds, FirstEnergy Generation Project, Refunding Series 2006A, 3.750%, 12/01/23 (Mandatory put 12/03/18) | No Opt. Call | | CCC+ | | 5,604,120 | |
| | 1,200 | | Ohio Air Quality Development Authority, Ohio, Revenue Bonds, Ohio Valley Electric Corporation Project, Series 2009E, 5.625%, 10/01/19 | No Opt. Call | | BBB– | | 1,314,936 | |
| | | | Scioto County, Ohio, Hospital Facilities Revenue Bonds, Southern Ohio Medical Center, Refunding Series 2016: | | | | | | |
| | 1,460 | | 5.000%, 2/15/33 | 2/26 at 100.00 | | A2 | | 1,723,019 | |
| | 1,455 | | 5.000%, 2/15/34 | 2/26 at 100.00 | | A2 | | 1,711,909 | |
| | 40,045 | | Total Ohio | | | | | 42,845,082 | |
| | | | Pennsylvania – 6.9% | | | | | | |
| | 1,337 | | Aliquippa Municipal Water Authority, Pennsylvania, Water and Sewer Revenue Bonds, Subordinated Series 2013, 5.000%, 5/15/26 | No Opt. Call | | N/R | | 1,388,831 | |
| | 1,390 | | Allegheny Country Industrial Development Authority, Pennsylvania, Environmental Improvement Revenue Bonds, United States Steel Corporation Project, Refunding Series 2009, 6.750%, 11/01/24 | 11/19 at 100.00 | | B | | 1,391,557 | |
| | 1,500 | | Allegheny Country Industrial Development Authority, Pennsylvania, Environmental Improvement Revenue Bonds, United States Steel Corporation Project, Refunding Series 2011, 6.550%, 12/01/27 | 12/21 at 100.00 | | B | | 1,459,560 | |
| | 1,335 | | Allegheny County Hospital Development Authority, Pennsylvania, Revenue Bonds, Ohio Valley General Hospital, Series 2005A, 5.125%, 4/01/35 | 1/17 at 100.00 | | B2 | | 1,295,764 | |
| | 1,070 | | Allegheny County Industrial Development Authority, Pennsylvania, Revenue Bonds, United States Steel Corporation, Series 2005, 5.500%, 11/01/16 | No Opt. Call | | B | | 1,070,000 | |
| | 530 | | Beaver County Industrial Development Authority, Pennsylvania, Pollution Control Revenue Refunding Bonds, FirstEnergy Generation Project, Series 2008B, 4.250%, 10/01/47 (Mandatory put 4/01/21) | No Opt. Call | | B | | 522,580 | |
| | | | Beaver County Industrial Development Authority, Pennsylvania, Pollution Control Revenue Refunding Bonds, FirstEnergy Nuclear Generation Project, Series 2006B: | | | | | | |
| | 2,000 | | 3.500%, 12/01/35 (Mandatory put 6/01/20) | No Opt. Call | | CCC+ | | 1,720,260 | |
| | 1,000 | | 2.500%, 12/01/41 (Mandatory put 6/01/17) | No Opt. Call | | BB+ | | 985,730 | |
| | 150 | | Cumberland County Municipal Authority Revenue Bonds, Pennsylvania, Diakon Lutheran Social Ministries Project, Series 2009, 6.125%, 1/01/29 | 1/19 at 100.00 | | BBB+ | | 164,799 | |
| | 1,350 | | Cumberland County Municipal Authority Revenue Bonds, Pennsylvania, Diakon Lutheran Social Ministries Project, Series 2009, 6.125%, 1/01/29 (Pre-refunded 1/01/19) | 1/19 at 100.00 | | N/R (5) | | 1,498,054 | |
| | 2,000 | | Luzerne County Industrial Development Authority, Pennsylvania, Guaranteed Lease Revenue Bonds, Series 2009, 7.750%, 12/15/27 | 12/19 at 100.00 | | N/R | | 2,130,020 | |
| | 1,080 | | Montgomery County Industrial Development Authority, Pennsylvania, FHA Insured Mortgage Revenue Bonds, New Regional Medical Center Project, Tender Option Bond Trust 62B, 16.358%, 8/01/24 (Pre-refunded 8/01/20) (IF) (4) | 8/20 at 100.00 | | N/R (5) | | 1,701,162 | |
| | 1,000 | | Pennsylvania Economic Development Finance Authority, Solid Waste Disposal Revenue Bonds (USG Corporation Project) Series 1999, 6.000%, 6/01/31 (Alternative Minimum Tax) | 12/16 at 100.00 | | BB+ | | 1,000,210 | |
| | 1,000 | | Pennsylvania Economic Development Financing Authority, Sewage Sludge Disposal Revenue Bonds, Philadelphia Biosolids Facility Project, Series 2009, 6.250%, 1/01/32 | 1/20 at 100.00 | | BBB+ | | 1,090,320 | |
| NEV | Nuveen Enhanced Municipal Value Fund | |
| | Portfolio of Investments (continued) | October 31, 2016 |
| | Principal | | | Optional Call | | | | | |
| | Amount (000) | | Description (1) | Provisions (2) | | Ratings (3) | | Value | |
| | | | Pennsylvania (continued) | | | | | | |
| $ | 1,200 | | Pennsylvania Higher Educational Facilities Authority, Revenue Bonds, Edinboro University Foundation Student Housing Project, Series 2010, 5.800%, 7/01/30 (Pre-refunded 7/01/20) | 7/20 at 100.00 | | N/R (5) | $ | 1,396,704 | |
| | 130 | | Pennsylvania Higher Educational Facilities Authority, Revenue Bonds, University Properties Inc. Student Housing Project at East Stroudsburg University of Pennsylvania, Series 2016A, 5.000%, 7/01/31 | 7/26 at 100.00 | | Baa3 | | 146,792 | |
| | 1,000 | | Pennsylvania Public School Building Authority, Lease Revenue Bonds, School District of Philadelphia, Series 2006B, 5.000%, 6/01/27 – AGM Insured | No Opt. Call | | AA | | 1,166,450 | |
| | | | Pennsylvania Turnpike Commission, Turnpike Revenue Bonds, Capital Appreciation Series 2009E: | | | | | | |
| | 3,530 | | 0.000%, 12/01/30 (8) | 12/27 at 100.00 | | A– | | 4,388,637 | |
| | 2,000 | | 0.000%, 12/01/38 (8) | 12/27 at 100.00 | | A– | | 2,474,260 | |
| | 24,602 | | Total Pennsylvania | | | | | 26,991,690 | |
| | | | Puerto Rico – 0.7% | | | | | | |
| | 1,500 | | Puerto Rico Housing Finance Authority, Subordinate Lien Capital Fund Program Revenue Bonds, Modernization Series 2008, 5.125%, 12/01/27 | 12/18 at 100.00 | | A+ | | 1,603,365 | |
| | 1,000 | | Puerto Rico Infrastructure Financing Authority, Special Tax Revenue Bonds, Series 2005C, 5.500%, 7/01/26 – AMBAC Insured | No Opt. Call | | Ca | | 1,069,450 | |
| | 2,500 | | Total Puerto Rico | | | | | 2,672,815 | |
| | | | Rhode Island – 0.3% | | | | | | |
| | 1,110 | | Providence Redevelopment Agency, Rhode Island, Revenue Bonds, Public Safety and Municipal Building Projects, Refunding Series 2015A, 5.000%, 4/01/27 | 4/25 at 100.00 | | Baa2 | | 1,271,594 | |
| | | | South Carolina – 2.2% | | | | | | |
| | 7,500 | | South Carolina Public Service Authority Santee Cooper Revenue Obligations, Refunding Series 2016B, 5.000%, 12/01/41 (UB) | 12/26 at 100.00 | | AA– | | 8,739,825 | |
| | | | Tennessee – 0.0% | | | | | | |
| | 155 | | The Tennessee Energy Acquisition Corporation, Gas Revenue Bonds, Series 2006C, 5.000%, 2/01/24 | No Opt. Call | | A | | 181,328 | |
| | | | Texas – 4.3% | | | | | | |
| | 80 | | Arlington Higher Education Finance Corporation, Texas, Education Revenue Bonds, Leadership Prep School, Series 2016A, 5.000%, 6/15/46 | 6/21 at 100.00 | | BB | | 80,858 | |
| | 3,500 | | Brazos River Authority, Texas, Pollution Control Revenue Refunding Bonds, TXU Electric Company, Series 2001D, 8.250%, 5/01/33 (Alternative Minimum Tax) (6) | 7/18 at 100.00 | | | | 120,645 | |
| | | | Central Texas Regional Mobility Authority, Revenue Bonds, Refunding Subordinate Lien Series 2016: | | | | | | |
| | 1,300 | | 5.000%, 1/01/33 | 1/26 at 100.00 | | BBB | | 1,493,492 | |
| | 1,350 | | 5.000%, 1/01/34 | 1/26 at 100.00 | | BBB | | 1,545,143 | |
| | 2,095 | | 5.000%, 1/01/35 | 1/26 at 100.00 | | BBB | | 2,390,667 | |
| | 150 | | Fort Bend County Industrial Development Corporation, Texas, Revenue Bonds, NRG Energy Inc. Project, Series 2012B, 4.750%, 11/01/42 | 11/22 at 100.00 | | Baa3 | | 159,701 | |
| | 250 | | Mission Economic Development Corporation, Texas, Revenue Bonds, Natgasoline Project, Series 2016B, 5.750%, 10/01/31 (Alternative Minimum Tax) | 10/18 at 103.00 | | BB– | | 264,285 | |
| | 1,800 | | North Texas Tollway Authority, Special Projects System Revenue Bonds, Tender Option Bond Trust 2016-XF2220, 22.614%, 9/01/41 (IF) | 9/21 at 100.00 | | AA+ | | 3,409,200 | |
| | 1,000 | | Red River Health Facilities Development Corporation, Texas, First Mortgage Revenue Bonds, Eden Home Inc., Series 2012, 7.250%, 12/15/47 (6) | 12/21 at 100.00 | | N/R | | 885,720 | |
| | 455 | | Texas Municipal Gas Acquisition and Supply Corporation I, Gas Supply Revenue Bonds, Senior Lien Series 2008D, 6.250%, 12/15/26 | No Opt. Call | | BBB+ | | 559,545 | |
| | | | Texas Private Activity Bond Surface Transportation Corporation, Senior Lien Revenue Bonds, Blueridge Transportation Group, LLC SH 288 Toll Lanes Project, Series 2016: | | | | | | |
| | 1,275 | | 5.000%, 12/31/50 (Alternative Minimum Tax) | 12/25 at 100.00 | | Baa3 | | 1,410,635 | |
| | 805 | | 5.000%, 12/31/55 (Alternative Minimum Tax) | 12/25 at 100.00 | | Baa3 | | 883,455 | |
| | Principal | | | Optional Call | | | | | |
| | Amount (000) | | Description (1) | Provisions (2) | | Ratings (3) | | Value | |
| | | | Texas (continued) | | | | | | |
| $ | 810 | | Texas Private Activity Bond Surface Transportation Corporation, Revenue Bonds, NTE Mobility Partners LLC North Tarrant Express Managed Lanes Project, Senior Lien Series 2009, 6.875%, 12/31/39 | 12/19 at 100.00 | | Baa2 | $ | 942,216 | |
| | 1,000 | | Texas Private Activity Bond Surface Transportation Corporation, Senior Lien Revenue Bonds, LBJ Infrastructure Group LLC IH-635 Managed Lanes Project, Series 2010, 7.000%, 6/30/34 | 6/20 at 100.00 | | Baa3 | | 1,177,830 | |
| | 1,500 | | Texas Public Finance Authority, Charter School Finance Corporation Revenue Bonds, Idea Public School Project, Series 2007A, 5.000%, 8/15/37 (Pre-refunded 8/15/17) – ACA Insured | 8/17 at 100.00 | | BBB (5) | | 1,550,640 | |
| | 17,370 | | Total Texas | | | | | 16,874,032 | |
| | | | Utah – 0.3% | | | | | | |
| | 1,000 | | Utah State Charter School Finance Authority, Charter School Revenue Bonds, Paradigm High School, Series 2010A, 6.250%, 7/15/30 | 7/20 at 100.00 | | BB | | 1,067,120 | |
| | | | Vermont – 0.7% | | | | | | |
| | | | Vermont Educational and Health Buildings Financing Agency, Revenue Bonds, Vermont Law School Project, Series 2011A: | | | | | | |
| | 1,000 | | 6.125%, 1/01/28 | 1/21 at 100.00 | | N/R | | 1,049,560 | |
| | 1,760 | | 6.250%, 1/01/33 | 1/21 at 100.00 | | N/R | | 1,837,898 | |
| | 2,760 | | Total Vermont | | | | | 2,887,458 | |
| | | | Virginia – 0.8% | | | | | | |
| | 2,000 | | Tobacco Settlement Financing Corporation of Virginia, Tobacco Settlement Asset Backed Bonds, Series 2007B1, 5.000%, 6/01/47 | 6/17 at 100.00 | | B– | | 1,879,940 | |
| | 1,010 | | Virginia Small Business Financing Authority, Senior Lien Revenue Bonds, Elizabeth River Crossing, Opco LLC Project, Series 2012, 5.500%, 1/01/42 (Alternative Minimum Tax) | 7/22 at 100.00 | | BBB | | 1,135,937 | |
| | 3,010 | | Total Virginia | | | | | 3,015,877 | |
| | | | Washington – 3.6% | | | | | | |
| | 5,000 | | Port of Seattle, Washington, Revenue Bonds, Refunding First Lien Series 2016B, 5.000%, 10/01/31 (Alternative Minimum Tax) (UB) | 4/26 at 100.00 | | Aa2 | | 5,909,400 | |
| | 240 | | Tacoma Consolidated Local Improvement District 65, Washington, Special Assessment Bonds, Series 2013, 5.750%, 4/01/43 | 4/17 at 100.00 | | N/R | | 239,681 | |
| | 2,000 | | Washington Health Care Facilities Authority, Revenue Bonds, Fred Hutchinson Cancer Research Center, Series 2011A, 5.375%, 1/01/31 | 1/21 at 100.00 | | A | | 2,223,180 | |
| | 2,000 | | Washington State Health Care Facilities Authority, Revenue Bonds, Fred Hutchinson Cancer Research Center, Series 2009A, 6.000%, 1/01/33 (Pre-refunded 7/01/19) | 7/19 at 100.00 | | A (5) | | 2,264,440 | |
| | 1,000 | | Washington State Health Care Facilities Authority, Revenue Bonds, Group Health Cooperative of Puget Sound, Series 2006, 5.000%, 12/01/36 (Pre-refunded 12/01/16) – RAAI Insured | 12/16 at 100.00 | | AA (5) | | 1,003,110 | |
| | 2,000 | | Washington State Higher Education Facilities Authority, Revenue Bonds, Whitworth University, Series 2009, 5.625%, 10/01/40 | 10/19 at 100.00 | | Baa1 | | 2,189,480 | |
| | 12,240 | | Total Washington | | | | | 13,829,291 | |
| | | | West Virginia – 0.2% | | | | | | |
| | 750 | | West Virginia Hospital Finance Authority, Hospital Revenue Bonds, Thomas Health System, Inc., Series 2008, 6.500%, 10/01/38 | 10/18 at 100.00 | | N/R | | 786,780 | |
| | | | Wisconsin – 10.1% | | | | | | |
| | 3,500 | | Oneida Tribe of Indians of Wisconsin, Retail Sales Revenue Bonds, Series 2011-144A, 6.500%, 2/01/31 | 2/19 at 102.00 | | AA– | | 3,916,255 | |
| | 2,905 | | Public Finance Authority of Wisconsin, Student Housing Revenue Bonds, Collegiate Housing Foundation – Cullowhee LLC – Western California University Project, Series 2015A, 5.000%, 7/01/35 | 7/25 at 100.00 | | BBB– | | 3,206,248 | |
| | 1,000 | | Wisconsin Center District, Dedicated Tax Revenue Bonds, Refunding Senior Series 2003A, 0.000%, 12/15/31 | No Opt. Call | | AA | | 656,240 | |
| NEV | Nuveen Enhanced Municipal Value Fund | |
| | Portfolio of Investments (continued) | October 31, 2016 |
| | Principal | | | Optional Call | | | | | |
| | Amount (000) | | Description (1) | Provisions (2) | | Ratings (3) | | Value | |
| | | | Wisconsin (continued) | | | | | | |
| | | | Wisconsin Health and Educational Facilities Authority, Revenue Bonds, Ascension Health Alliance Senior Credit Group, Series 2016A: | | | | | | |
| $ | 10,000 | | 5.000%, 11/15/35 (UB) (4) | 5/26 at 100.00 | | AA+ | $ | 11,885,700 | |
| | 5,000 | | 5.000%, 11/15/36 (UB) (4) | 5/26 at 100.00 | | AA+ | | 5,924,400 | |
| | 3,000 | | 5.000%, 11/15/39 (UB) (4) | 5/26 at 100.00 | | AA+ | | 3,535,380 | |
| | 1,000 | | Wisconsin Health and Educational Facilities Authority, Revenue Bonds, Beloit College, Series 2010A, 6.000%, 6/01/30 (Pre-refunded 6/01/20) | 6/20 at 100.00 | | Baa2 (5) | | 1,171,240 | |
| | 500 | | Wisconsin Health and Educational Facilities Authority, Revenue Bonds, Beloit Health System, Inc., Series 2010B, 5.000%, 4/01/30 | 4/20 at 100.00 | | A– | | 537,030 | |
| | | | Wisconsin Health and Educational Facilities Authority, Revenue Bonds, Froedtert Community Health, Inc. Obligated Group, Tender Option Bond Trust 2015-XF0118: | | | | | | |
| | 1,000 | | 19.840%, 4/01/34 (IF) (4) | 4/19 at 100.00 | | AA– | | 1,330,100 | |
| | 1,290 | | 14.819%, 4/01/42 (IF) (4) | 10/22 at 100.00 | | AA– | | 1,572,639 | |
| | 25 | | Wisconsin Health and Educational Facilities Authority, Revenue Bonds, Monroe Clinic Inc., Refunding Series 2016, 5.000%, 2/15/28 | 8/25 at 100.00 | | A3 | | 29,887 | |
| | 1,090 | | Wisconsin Health and Educational Facilities Authority, Revenue Bonds, Three Pillars Senior Living Communities, Refunding Series 2013, 5.000%, 8/15/43 | 8/23 at 100.00 | | A– | | 1,196,613 | |
| | 2,500 | | Wisconsin State, General Fund Annual Appropriation Revenue Bonds, Tender Option Bond Trust 2016-XL0020, 30.013%, 5/01/36 (IF) (4) | 5/19 at 100.00 | | AA– | | 4,234,000 | |
| | 32,810 | | Total Wisconsin | | | | | 39,195,732 | |
| | | | Wyoming – 0.7% | | | | | | |
| | | | Wyoming Community Development Authority, Student Housing Revenue Bonds, CHF-Wyoming, L.L.C. – University of Wyoming Project, Series 2011: | | | | | | |
| | 710 | | 6.250%, 7/01/31 | 7/21 at 100.00 | | BBB | | 794,469 | |
| | 1,600 | | 6.500%, 7/01/43 | 7/21 at 100.00 | | BBB | | 1,805,248 | |
| | 2,310 | | Total Wyoming | | | | | 2,599,717 | |
| $ | 400,565 | | Total Municipal Bonds (cost $384,235,333) | | | | | 430,128,083 | |
| | | | | | | | | | |
| | Shares | | Description (1) | | | | | Value | |
| | | | COMMON STOCKS – 0.8% | | | | | | |
| | | | Airlines – 0.8% | | | | | | |
| | 75,333 | | American Airlines Group Inc., (10) | | | | $ | 3,058,520 | |
| | | | Total Common Stocks (cost $2,340,765) | | | | | 3,058,520 | |
| | | | Total Long-Term Investments (cost $386,576,098) | | | | | 433,186,603 | |
| | Principal | | | Optional Call | | | | | |
| | Amount (000) | | Description (1) | Provisions (2) | | Ratings (3) | | Value | |
| | | | SHORT-TERM INVESTMENTS – 0.3% | | | | | | |
| | | | MUNICIPAL BONDS – 0.3% | | | | | | |
| | | | Illinois – 0.3% | | | | | | |
| $ | 1,000 | | Chicago Board of Education, Illinois, General Obligation Bonds, Dedicated Revenues Series 2011C-1, 0.960%, 3/01/32 (Mandatory Put 3/01/17) (11) | 1/17 at 100.00 | | B+ | $ | 999,770 | |
| | | | Total Short-Term Investments (cost $996,250) | | | | | 999,770 | |
| | | | Total Investments (cost $387,572,348) – 111.7% | | | | | 434,186,373 | |
| | | | Floating Rate Obligations – (12.5)% | | | | | (48,480,000 | ) |
| | | | Other Assets Less Liabilities – 0.8% | | | | | 3,128,306 | |
| | | | Net Assets – 100% | | | | $ | 388,834,679 | |
| (1) | All percentages shown in the Portfolio of Investments are based on net assets applicable to common shares unless otherwise noted. |
| (2) | Optional Call Provisions: Dates (month and year) and prices of the earliest optional call or redemption. There may be other call provisions at varying prices at later dates. Certain mortgage-backed securities may be subject to periodic principal paydowns. Optional Call Provisions are not covered by the report of independent registered public accounting firm. |
| (3) | For financial reporting purposes, the ratings disclosed are the highest of Standard & Poor’s Group (“Standard & Poor’s”), Moody’s Investors Service, Inc. (“Moody’s”) or Fitch, Inc. (“Fitch”) rating. This treatment of split-rated securities may differ from that used for other purposes, such as for Fund investment policies. Ratings below BBB by Standard & Poor’s, Baa by Moody’s or BBB by Fitch are considered to be below investment grade. Holdings designated N/R are not rated by any of these national rating agencies. Ratings are not covered by the report of independent registered public accounting firm. |
| (4) | Investment, or portion of investment, has been pledged to collateralize the net payment obligations for investments in inverse floating rate transactions. |
| (5) | Backed by an escrow or trust containing sufficient U.S. Government or U.S. Government agency securities, which ensure the timely payment of principal and interest. Certain bonds backed by U.S. Government or agency securities are regarded as having an implied rating equal to the ratings of such securities. |
| (6) | As of, or subsequent to, the end of the reporting period, this security is non-income producing. Non-income producing, in the case of a fixed-income security, generally denotes that the issuer has (1) defaulted on the payment of principal or interest, (2) is under the protection of the Federal Bankruptcy Court or (3) the Fund’s Adviser has concluded that the issue is not likely to meet its future interest payment obligations and has ceased accruing additional income on the Fund’s records. |
| (7) | Investment valued at fair value using methods determined in good faith by, or at the discretion of, the Board. For fair value measurement disclosure purposes, investment classified as Level 3. See Notes to Financial Statements, Note 2 – Investment Valuation and Fair Value Measurements for more information. |
| (8) | Step-up coupon. The rate shown is the coupon as of the end of the reporting period. |
| (9) | On May 7, 2015, the Fund’s Adviser determined it was unlikely that this borrower would fulfill its entire obligation on this security, and therefore reduced the security’s interest rate of accrual from 5.250% to 2.100%. |
| (10) | On November 28, 2011, AMR Corp. (“AMR”), the parent company of American Airlines Group, Inc. (“AAL”) filed for federal bankruptcy protection. On December 9, 2013, AMR emerged from federal bankruptcy with the acceptance of its reorganization plan by the bankruptcy court. Under the settlement agreement established to meet AMR’s unsecured bond obligations, the bondholders, including the Fund, received a distribution of AAL preferred stock which was converted to AAL common stock over a 120– day period. Every 30 days, a quarter of the preferred stock was converted to AAL common stock based on the 5-day volume-weighted average price and the amount of preferred shares tendered during the optional preferred conversion period. |
| (11) | Investment has a maturity of greater than one year, but has variable rate and demand features which qualify it as a short-term investment. The rate disclosed is that in effect at the end of the reporting period. This rate changes periodically based on market conditions or a specified market index. |
| (IF) | Inverse floating rate investment. |
| (UB) | Underlying bond of an inverse floating rate trust reflected as a financing transaction. See Notes to Financial Statements, Note 3 – Portfolio Securities and Investments in Derivatives, Inverse Floating Rate Securities for more information. |
| 144A | Investment is exempt from registration under Rule 144A of the Securities Act of 1933, as amended. These investments may only be resold in transactions exempt from registration, which are normally those transactions with qualified institutional buyers. |
See accompanying notes to financial statements.
| Statement of | | |
| | Assets and Liabilities | October 31, 2016 |
| | | | | AMT-Free | | | | Enhanced | |
| | | Municipal Value | | Municipal Value | | Municipal Income | | Municipal Value | |
| | | (NUV | ) | (NUW | ) | (NMI | ) | (NEV | ) |
| Assets | | | | | | | | | | | | | |
| Long-term investments, at value (cost $1,905,546,922, $210,616,292, $87,060,050 and $386,576,098, respectively) | | $ | 2,124,752,666 | | $ | 247,153,020 | | $ | 97,886,599 | | $ | 433,186,603 | |
| Short-term investments, at value (cost $19,050,000, $—, $— and $996,250, respectively) | | | 19,050,000 | | | — | | | — | | | 999,770 | |
| Cash | | | — | | | 2,094,967 | | | 979,951 | | | — | |
| Receivable for: | | | | | | | | | | | | | |
| Interest | | | 25,719,507 | | | 3,625,635 | | | 1,359,439 | | | 7,712,617 | |
| Investments sold | | | 8,624,279 | | | 3,208,187 | | | 1,259,155 | | | 1,449,778 | |
| Deferred offering costs | | | — | | | 103,793 | | | — | | | — | |
| Other assets | | | 300,229 | | | 1,418 | | | 1,437 | | | 16,608 | |
| Total assets | | | 2,178,446,681 | | | 256,187,020 | | | 101,486,581 | | | 443,365,376 | |
| Liabilities | | | | | | | | | | | | | |
| Cash overdraft | | | 4,538,671 | | | — | | | — | | | 1,941,564 | |
| Floating rate obligations | | | 14,130,000 | | | 7,125,000 | | | — | | | 48,480,000 | |
| Payable for: | | | | | | | | | | | | | |
| Dividends | | | 5,967,707 | | | 803,203 | | | 314,454 | | | 1,790,293 | |
| Investments purchased | | | 1,905,860 | | | 570,129 | | | 4,545,304 | | | 1,936,062 | |
| Accrued expenses: | | | | | | | | | | | | | |
| Management fees | | | 818,598 | | | 124,368 | | | 50,152 | | | 292,108 | |
| Directors/Trustees fees | | | 303,619 | | | 2,203 | | | 862 | | | 17,767 | |
| Other | | | 338,665 | | | 168,252 | | | 43,807 | | | 72,903 | |
| Total liabilities | | | 28,003,120 | | | 8,793,155 | | | 4,954,579 | | | 54,530,697 | |
| Net assets | | $ | 2,150,443,561 | | $ | 247,393,865 | | $ | 96,532,002 | | $ | 388,834,679 | |
| Shares outstanding | | | 206,875,449 | | | 14,369,242 | | | 8,312,299 | | | 24,950,068 | |
| Net asset value ("NAV") per share outstanding | | $ | 10.39 | | $ | 17.22 | | $ | 11.61 | | $ | 15.58 | |
| Net assets consist of: | | | | | | | | | | | | | |
| Shares, $0.01 par value per share | | $ | 2,068,754 | | $ | 143,692 | | $ | 83,123 | | $ | 249,501 | |
| Paid-in surplus | | | 1,956,406,374 | | | 210,510,018 | | | 85,684,951 | | | 366,212,154 | |
| Undistributed (Over-distribution of) net investment income | | | 10,907,476 | | | 727,093 | | | 259,836 | | | 987,103 | |
| Accumulated net realized gain (loss) | | | (38,144,787 | ) | | (523,666 | ) | | (322,457 | ) | | (25,228,104 | ) |
| Net unrealized appreciation (depreciation) | | | 219,205,744 | | | 36,536,728 | | | 10,826,549 | | | 46,614,025 | |
| Net assets | | $ | 2,150,443,561 | | $ | 247,393,865 | | $ | 96,532,002 | | $ | 388,834,679 | |
| Authorized shares | | | 350,000,000 | | | Unlimited | | | 200,000,000 | | | Unlimited | |
See accompanying notes to financial statements.
| Statement of | | |
| | Operations | Year Ended October 31, 2016 |
| | | | | AMT-Free | | | | Enhanced | |
| | | Municipal | | Municipal | | Municipal | | Municipal | |
| | | Value | | Value | | Income | | Value | |
| | | (NUV | ) | (NUW | ) | (NMI | ) | (NEV | ) |
| Investment Income | | $ | 94,377,489 | | $ | 12,359,632 | | $ | 4,939,531 | | $ | 23,357,697 | |
| Expenses | | | | | | | | | | | | | |
| Management fees | | | 9,784,855 | | | 1,447,671 | | | 594,417 | | | 3,195,072 | |
| Interest expense | | | 150,871 | | | 64,013 | | | 28,932 | | | 269,235 | |
| Custodian fees | | | 207,427 | | | 32,819 | | | 23,296 | | | 56,621 | |
| Directors/Trustees fees | | | 60,766 | | | 6,890 | | | 2,776 | | | 10,210 | |
| Professional fees | | | 98,836 | | | 51,714 | | | 24,779 | | | 47,086 | |
| Shareholder reporting expenses | | | 168,676 | | | 51,419 | | | 20,502 | | | 53,851 | |
| Shareholder servicing agent fees | | | 238,676 | | | 365 | | | 12,649 | | | 343 | |
| Stock exchange listing fees | | | 65,949 | | | 7,855 | | | 7,888 | | | 7,855 | |
| Investor relations expenses | | | 221,131 | | | 25,098 | | | 11,570 | | | 33,789 | |
| Other | | | 86,126 | | | 26,679 | | | 12,660 | | | 31,042 | |
| Total expenses | | | 11,083,313 | | | 1,714,523 | | | 739,469 | | | 3,705,104 | |
| Net investment income (loss) | | $ | 83,294,176 | | $ | 10,645,109 | | $ | 4,200,062 | | $ | 19,652,593 | |
| Realized and Unrealized Gain (Loss) | | | | | | | | | | | | | |
| Net realized gain (loss) from investments | | | (9,063,243 | ) | | 767,370 | | | (20,534 | ) | | (537,166 | ) |
| Change in net unrealized appreciation (depreciation) of investments | | | 47,249,567 | | | (193,067 | ) | | 1,237,919 | | | 633,718 | |
| Net realized and unrealized gain (loss) | | | 38,186,324 | | | 574,303 | | | 1,217,385 | | | 96,552 | |
| Net increase (decrease) in net assets from operations | | $ | 121,480,500 | | $ | 11,219,412 | | $ | 5,417,447 | | $ | 19,749,145 | |
See accompanying notes to financial statements.
| Statement of | |
| | Changes in Net Assets |
| | | | | AMT-Free | |
| | | Municipal Value (NUV) | | Municipal Value (NUW) | |
| | | Year Ended | | Year Ended | | Year Ended | | Year Ended | |
| | | 10/31/16 | | 10/31/15 | | 10/31/16 | | 10/31/15 | |
| Operations | | | | | | | | | | | | | |
| Net investment income (loss) | | $ | 83,294,176 | | $ | 85,381,787 | | $ | 10,645,109 | | $ | 10,755,117 | |
| Net realized gain (loss) from: | | | | | | | | | | | | | |
| Investments | | | (9,063,243 | ) | | 11,068,291 | | | 767,370 | | | 1,465,514 | |
| Swaps | | | — | | | — | | | — | | | — | |
| Change in net unrealized appreciation (depreciation) of: | | | | | | | | | | | | | |
| Investments | | | 47,249,567 | | | (15,782,237 | ) | | (193,067 | ) | | (2,129,189 | ) |
| Swaps | | | — | | | — | | | — | | | — | |
| Net increase (decrease) in net assets from operations | | | 121,480,500 | | | 80,667,841 | | | 11,219,412 | | | 10,091,442 | |
| Distributions to Shareholders | | | | | | | | | | | | | |
| From net investment income | | | (80,761,259 | ) | | (83,258,650 | ) | | (10,943,206 | ) | | (10,453,742 | ) |
| Decrease in net assets from distributions to shareholders | | | (80,761,259 | ) | | (83,258,650 | ) | | (10,943,206 | ) | | (10,453,742 | ) |
| Capital Share Transactions | | | | | | | | | | | | | |
| Proceeds from shelf offering, net of offering costs | | | 9,540,333 | | | — | | | 17,451,974 | | | 2,131,586 | |
| Net proceeds from shares issued to shareholders due to reinvestment of distributions | | | 3,676,267 | | | — | | | 713,294 | | | 328,495 | |
| Net increase (decrease) in net assets from capital share transactions | | | 13,216,600 | | | — | | | 18,165,268 | | | 2,460,081 | |
| Net increase (decrease) in net assets | | | 53,935,841 | | | (2,590,809 | ) | | 18,441,474 | | | 2,097,781 | |
| Net assets at the beginning of period | | | 2,096,507,720 | | | 2,099,098,529 | | | 228,952,391 | | | 226,854,610 | |
| Net assets at the end of period | | $ | 2,150,443,561 | | $ | 2,096,507,720 | | $ | 247,393,865 | | $ | 228,952,391 | |
| Undistributed (Over-distribution of) net investment income at the end of period | | $ | 10,907,476 | | $ | 9,191,144 | | $ | 727,093 | | $ | 1,058,569 | |
See accompanying notes to financial statements.
| | | | | Enhanced Municipal | |
| | | Municipal Income (NMI) | | Value (NEV) | |
| | | Year Ended | | Year Ended | | Year Ended | | Year Ended | |
| | | 10/31/16 | | 10/31/15 | | 10/31/16 | | 10/31/15 | |
| Operations | | | | | | | | | | | | | |
| Net investment income (loss) | | $ | 4,200,062 | | $ | 4,209,643 | | $ | 19,652,593 | | $ | 19,547,437 | |
| Net realized gain (loss) from: | | | | | | | | | | | | | |
| Investments | | | (20,534 | ) | | 494,625 | | | (537,166 | ) | | 2,839,424 | |
| Swaps | | | — | | | — | | | — | | | (1,040,000 | ) |
| Change in net unrealized appreciation (depreciation) of: | | | | | | | | | | | | | |
| Investments | | | 1,237,919 | | | (903,386 | ) | | 633,718 | | | (3,616,419 | ) |
| Swaps | | | — | | | — | | | — | | | 588,900 | |
| Net increase (decrease) in net assets from operations | | | 5,417,447 | | | 3,800,882 | | | 19,749,145 | | | 18,319,342 | |
| Distributions to Shareholders | | | | | | | | | | | | | |
| From net investment income | | | (4,216,821 | ) | | (4,231,229 | ) | | (21,633,059 | ) | | (20,379,002 | ) |
| Decrease in net assets from distributions to shareholders | | | (4,216,821 | ) | | (4,231,229 | ) | | (21,633,059 | ) | | (20,379,002 | ) |
| Capital Share Transactions | | | | | | | | | | | | | |
| Proceeds from shelf offering, net of offering costs | | | — | | | — | | | 61,693,894 | | | — | |
| Net proceeds from shares issued to shareholders due to reinvestment of distributions | | | 181,990 | | | 116,109 | | | 168,274 | | | 46,885 | |
| Net increase (decrease) in net assets from capital share transactions | | | 181,990 | | | 116,109 | | | 61,862,168 | | | 46,885 | |
| Net increase (decrease) in net assets | | | 1,382,616 | | | (314,238 | ) | | 59,978,254 | | | (2,012,775 | ) |
| Net assets at the beginning of period | | | 95,149,386 | | | 95,463,624 | | | 328,856,425 | | | 330,869,200 | |
| Net assets at the end of period | | $ | 96,532,002 | | $ | 95,149,386 | | $ | 388,834,679 | | $ | 328,856,425 | |
| Undistributed (Over-distribution of) net investment income at the end of period | | $ | 259,836 | | $ | 333,417 | | $ | 987,103 | | $ | 3,048,734 | |
See accompanying notes to financial statements.
Selected data for a share outstanding throughout each period:
| | | | | Investment Operations | | Less Distributions | | | | | | | | | |
| | | | | | | | | | | | | | | | | | | Premium | | | | | |
| | | | | | | | | | | | | | | | | | | from | | | | | |
| | | | | | | | | | | | | From | | | | | | Shares | | | | | |
| | | | | Net | | Net | | | | From | | Accumu- | | | | | | Sold | | | | | |
| | | | | Investment | | Realized/ | | | | Net | | lated Net | | | | | | through | | | | Ending | |
| | | Beginning | | Income | | Unrealized | | | | Investment | | Realized | | | | Offering | | Shelf | | Ending | | Share | |
| | | NAV | | (Loss | ) | Gain (Loss | ) | Total | | Income | | Gains | | Total | | Costs | | Offering | | NAV | | Price | |
| Municipal Value (NUV) | | | | | | | | | | | | | | | | | | | | | | | | | |
| Year Ended 10/31: | | | | | | | | | | | | | | | | | | | | | | | | | | | | | | |
| 2016 | | $ | 10.20 | | $ | 0.40 | | $ | 0.18 | | $ | 0.58 | | $ | (0.39 | ) | $ | — | | $ | (0.39 | ) | $ | — | | $ | — | * | $ | 10.39 | | $ | 9.98 | |
| 2015 | | | 10.21 | | | 0.42 | | | (0.03 | ) | | 0.39 | | | (0.40 | ) | | — | | | (0.40 | ) | | — | | | — | | | 10.20 | | | 10.07 | |
| 2014 | | | 9.61 | | | 0.43 | | | 0.61 | | | 1.04 | | | (0.44 | ) | | — | | | (0.44 | ) | | — | | | — | | | 10.21 | | | 9.64 | |
| 2013 | | | 10.31 | | | 0.44 | | | (0.70 | ) | | (0.26 | ) | | (0.45 | ) | | — | | | (0.45 | ) | | — | | | 0.01 | | | 9.61 | | | 9.05 | |
| 2012 | | | 9.65 | | | 0.46 | | | 0.71 | | | 1.17 | | | (0.47 | ) | | (0.06 | ) | | (0.53 | ) | | — | * | | 0.02 | | | 10.31 | | | 10.37 | |
| | | | | | | | | | | | | | | | | | | | | | | | | | | | | | | | | | | |
| AMT-Free Municipal Value (NUW) | | | | | | | | | | | | | | | | | | | | | | | | | |
| Year Ended 10/31: | | | | | | | | | | | | | | | | | | | | | | | | | | | | | | |
| 2016 | | | 17.17 | | | 0.76 | | | 0.06 | | | 0.82 | | | (0.79 | ) | | — | | | (0.79 | ) | | (0.01 | ) | | 0.03 | | | 17.22 | | | 16.96 | |
| 2015 | | | 17.19 | | | 0.80 | | | (0.04 | ) | | 0.76 | | | (0.79 | ) | | — | | | (0.79 | ) | | — | | | 0.01 | | | 17.17 | | | 17.22 | |
| 2014 | | | 16.35 | | | 0.82 | | | 0.92 | | | 1.74 | | | (0.81 | ) | | (0.09 | ) | | (0.90 | ) | | — | | | — | | | 17.19 | | | 16.89 | |
| 2013 | | | 17.78 | | | 0.85 | | | (1.48 | ) | | (0.63 | ) | | (0.80 | ) | | (0.01 | ) | | (0.81 | ) | | — | * | | 0.01 | | | 16.35 | | | 15.23 | |
| 2012 | | | 16.47 | | | 0.84 | | | 1.29 | | | 2.13 | | | (0.82 | ) | | — | | | (0.82 | ) | | — | | | — | | | 17.78 | | | 18.66 | |
| (a) | Total Return Based on NAV is the combination of changes in NAV, reinvested dividend income at NAV and reinvested capital gains distributions at NAV, if any. The last dividend declared in the period, which is typically paid on the first business day of the following month, is assumed to be reinvested at the ending NAV. The actual reinvest price for the last dividend declared in the period may often be based on the Fund's market price (and not its NAV), and therefore may be different from the price used in the calculation. Total returns are not annualized. |
| | Total Return Based on Share Price is the combination of changes in the market price per share and the effect of reinvested dividend income and reinvested capital gains distributions, if any, at the average price paid per share at the time of reinvestment. The last dividend declared in the period, which is typically paid on the first business day of the following month, is assumed to be reinvested at the ending market price. The actual reinvestment for the last dividend declared in the period may take place over several days, and in some instances may not be based on the market price, so the actual reinvestment price may be different from the price used in the calculation. Total returns are not annualized. |
| | | | Ratios/Supplemental Data | |
| | Total Returns | | | | Ratios to Average Net Assets | | | |
| | | | | | | | | | | | | |
| | | | Based | | Ending | | | | | | | |
| | Based | | on | | Net | | | | Net | | Portfolio | |
| | on | | Share | | Assets | | | | Investment | | Turnover | |
| | NAV | (a) | Price | (a) | (000 | ) | Expenses | (b) | Income (Loss | ) | Rate | (c) |
| | | | | | | | | | | | | | | | | | |
| | 5.74 | % | | 2.91 | % | $ | 2,150,444 | | | 0.51 | % | | 3.87 | % | | 11 | % |
| | 3.94 | | | 8.86 | | | 2,096,508 | | | 0.53 | | | 4.08 | | | 16 | |
| | 11.04 | | | 11.54 | | | 2,099,099 | | | 0.56 | | | 4.36 | | | 17 | |
| | (2.55 | ) | | (8.67 | ) | | 1,975,227 | | | 0.55 | | | 4.34 | | | 19 | |
| | 12.62 | | | 13.15 | | | 2,105,323 | | | 0.60 | | | 4.63 | | | 14 | |
| | | | | | | | | | | | | | | | | | |
| | | | | | | | | | | | | | | | | | |
| | 4.90 | | | 2.99 | | | 247,394 | | | 0.71 | | | 4.38 | | | 12 | |
| | 4.56 | | | 6.79 | | | 228,952 | | | 0.72 | | | 4.72 | | | 6 | |
| | 10.95 | | | 17.27 | | | 226,855 | | | 0.75 | | | 4.92 | | | 10 | |
| | (3.59 | ) | | (14.31 | ) | | 215,764 | | | 0.72 | | | 4.93 | | | 7 | |
| | 13.23 | | | 14.73 | | | 231,140 | | | 0.68 | | | 4.90 | | | 10 | |
| (b) | The expense ratios reflect, among other things, the interest expense deemed to have been paid by the Fund on the floating rate certificates issued by the special purpose trusts for the self-deposited inverse floaters held by the Fund (as described in Note 3 – Portfolio Securities and Investments in Derivatives, Inverse Floating Rate Securities), where applicable, as follows: |
| Municipal Value (NUV) | | |
| Year Ended 10/31: | | |
| 2016 | 0.01 | % |
| 2015 | 0.00 | ** |
| 2014 | 0.01 | |
| 2013 | 0.00 | ** |
| 2012 | 0.02 | |
| AMT-Free Municipal Value (NUW) | | |
| Year Ended 10/31: | | |
| 2016 | 0.03 | % |
| 2015 | 0.02 | |
| 2014 | 0.02 | |
| 2013 | 0.00 | ** |
| 2012 | — | |
| (c) | Portfolio Turnover Rate is calculated based on the lesser of long-term purchases or sales (as disclosed in Note 5 – Investment Transactions) divided by the average long-term market value during the period. |
| * | Rounds to less than $0.01 per share. |
| ** | Rounds to less than 0.01%. |
See accompanying notes to financial statements.
Financial Highlights (continued)
Selected data for a share outstanding throughout each period:
| | | | | | Investment Operations | | Less Distributions | | | | | | | | | | | | | |
| | | | | | | | | | | | | | | | | | | Premium | | | | | |
| | | | | | | | | | | | | | | | | | | from | | | | | |
| | | | | | | | | | | | | From | | | | | | Shares | | | | | |
| | | | | Net | | Net | | | | From | | Accumu- | | | | | | Sold | | | | | |
| | | | | Investment | | Realized/ | | | | Net | | lated Net | | | | | | through | | Ending | | | |
| | | Beginning | | Income | | Unrealized | | | | Investment | | Realized | | | | Offering | | Shelf | | Ending | | Share | |
| | | NAV | | (Loss | ) | Gain (Loss | ) | Total | | Income | | Gains | | Total | | Costs | | Offering | | NAV | | Price | |
| Municipal Income (NMI) | | | | | | | | | | | | | | | | | | | | | | | | |
| Year Ended 10/31: | | | | | | | | | | | | | | | | | | | | | | | | | | | | | |
| 2016 | | $ | 11.47 | | $ | 0.50 | | $ | 0.15 | | $ | 0.65 | | $ | (0.51 | ) | $ | — | | $ | (0.51 | ) | $ | — | | $ | — | | $ | 11.61 | | $ | 12.20 | |
| 2015 | | | 11.52 | | | 0.51 | | | (0.05 | ) | | 0.46 | | | (0.51 | ) | | — | | | (0.51 | ) | | — | | | — | | | 11.47 | | | 11.05 | |
| 2014 | | | 10.80 | | | 0.50 | | | 0.77 | | | 1.27 | | | (0.55 | ) | | — | | | (0.55 | ) | | — | | | — | | | 11.52 | | | 11.30 | |
| 2013 | | | 11.66 | | | 0.54 | | | (0.83 | ) | | (0.29 | ) | | (0.57 | ) | | — | | | (0.57 | ) | | — | | | — | | | 10.80 | | | 10.11 | |
| 2012 | | | 10.75 | | | 0.57 | | | 0.91 | | | 1.48 | | | (0.57 | ) | | — | | | (0.57 | ) | | — | | | — | | | 11.66 | | | 12.66 | |
| | | | | | | | | | | | | | | | | | | | | | | | | | | | | | | | | | | |
| Enhanced Municipal Value (NEV) | | | | | | | | | | | | | | | | | | | | | | | | |
| Year Ended 10/31: | | | | | | | | | | | | | | | | | | | | | | | | | | | | | | |
| 2016 | | | 15.59 | | | 0.85 | | | 0.04 | | | 0.89 | | | (0.95 | ) | | — | | | (0.95 | ) | | — | | | 0.05 | | | 15.58 | | | 14.75 | |
| 2015 | | | 15.69 | | | 0.93 | | | (0.06 | ) | | 0.87 | | | (0.97 | ) | | — | | | (0.97 | ) | | — | | | — | | | 15.59 | | | 15.38 | |
| 2014 | | | 14.10 | | | 0.96 | | | 1.59 | | | 2.55 | | | (0.96 | ) | | — | | | (0.96 | ) | | — | | | — | | | 15.69 | | | 14.91 | |
| 2013 | | | 15.82 | | | 0.96 | | | (1.80 | ) | | (0.84 | ) | | (0.96 | ) | | — | | | (0.96 | ) | | (0.01 | ) | | 0.09 | | | 14.10 | | | 13.92 | |
| 2012 | | | 13.97 | | | 1.01 | | | 1.80 | | | 2.81 | | | (0.96 | ) | | — | | | (0.96 | ) | | — | | | — | | | 15.82 | | | 16.16 | |
| (a) | Total Return Based on NAV is the combination of changes in NAV, reinvested dividend income at NAV and reinvested capital gains distributions at NAV, if any. The last dividend declared in the period, which is typically paid on the first business day of the following month, is assumed to be reinvested at the ending NAV. The actual reinvest price for the last dividend declared in the period may often be based on the Fund's market price (and not its NAV), and therefore may be different from the price used in the calculation. Total returns are not annualized. |
| | Total Return Based on Share Price is the combination of changes in the market price per share and the effect of reinvested dividend income and reinvested capital gains distributions, if any, at the average price paid per share at the time of reinvestment. The last dividend declared in the period, which is typically paid on the first business day of the following month, is assumed to be reinvested at the ending market price. The actual reinvestment for the last dividend declared in the period may take place over several days, and in some instances may not be based on the market price, so the actual reinvestment price may be different from the price used in the calculation. Total returns are not annualized. |
| | | | Ratios/Supplemental Data | |
| | Total Returns | | | | Ratios to Average Net Assets | | | |
| | | | | | | | | | | | | |
| | | | Based | | Ending | | | | | | | |
| | Based | | on | | Net | | | | Net | | Portfolio | |
| | on | | Share | | Assets | | | | Investment | | Turnover | |
| | NAV | (a) | Price | (a) | (000 | ) | Expenses | (b) | Income (Loss) | | Rate | (d) |
| | | | | | | | | | | | | | | | | | |
| | 5.71 | % | | 15.22 | % | $ | 96,532 | | | 0.76 | % | | 4.33 | % | | 4 | % |
| | 4.08 | | | 2.31 | | | 95,149 | | | 0.74 | | | 4.43 | | | 10 | |
| | 12.06 | | | 17.55 | | | 95,464 | | | 0.76 | | | 4.55 | | | 15 | |
| | (2.58) | | | (15.91 | ) | | 89,384 | | | 0.73 | | | 4.73 | | | 18 | |
| | 14.05 | | | 19.51 | | | 96,298 | | | 0.78 | | | 5.09 | | | 15 | |
| | | | | | | | | | | | | | | | | | |
| | | | | | | | | | | | | | | | | | |
| | 6.10 | | | 1.85 | | | 388,835 | | | 1.03 | | | 5.44 | | | 6 | |
| | 5.68 | | | 9.90 | | | 328,856 | | | 1.05 | (c) | | 5.93 | (c) | | 12 | |
| | 18.67 | | | 14.58 | | | 330,869 | | | 1.08 | | | 6.49 | | | 5 | |
| | (5.02 | )* | | (8.12 | ) | | 297,404 | | | 1.08 | | | 6.44 | | | 12 | |
| | 20.67 | | | 25.68 | | | 305,341 | | | 1.12 | | | 6.73 | | | 11 | |
| (b) | The expense ratios reflect, among other things, the interest expense deemed to have been paid by the Fund on the floating rate certificates issued by the special purpose trusts for the self-deposited inverse floaters held by the Fund (as described in Note 3 – Portfolio Securities and Investments in Derivatives, Inverse Floating Rate Securities), where applicable, as follows: |
| Municipal Income (NMI) | | |
| Year Ended 10/31: | | |
| 2016 | 0.03 | % |
| 2015 | 0.01 | |
| 2014 | 0.01 | |
| 2013 | 0.01 | |
| 2012 | 0.01 | |
| Enhanced Municipal Value (NEV) | | |
| Year Ended 10/31: | | |
| 2016 | 0.07 | % |
| 2015 | 0.07 | |
| 2014 | 0.09 | |
| 2013 | 0.08 | |
| 2012 | 0.09 | |
| (c) | During the fiscal year ended October 31, 2015, the Adviser voluntarily reimbursed the Fund for certain expenses incurred in connection with an equity shelf program. As a result, the Expenses and Net Investment Income (Loss) Ratios to Average Net Assets reflect this voluntary expense reimbursement. The Expenses and Net Investment Income (Loss) Ratios to Average Net Assets excluding this expense reimbursement from Adviser are as follows: |
| | Ratios to Average Net Assets | |
| | | Net Investment | |
| Enhanced Municipal Value (NEV) | Expenses | Income (Loss) | |
| Year Ended 10/31: | | | |
| 2015 | 1.08% | 5.91% | |
| (d) | Portfolio Turnover Rate is calculated based on the lesser of long-term purchases or sales (as disclosed in Note 5 – Investment Transactions) divided by the average long-term market value during the period. |
| * | During the fiscal year ended October 31, 2013, Enhanced Municipal Value (NEV) received payments from the Adviser of $168,146 to offset losses realized on the disposal of investments purchased in violation of the Fund's investment restrictions. This reimbursement did not have an impact on the Fund's Total Return on NAV. |
See accompanying notes to financial statements.
| Notes to Financial Statements | |
1. General Information and Significant Accounting Policies
General Information
Fund Information
The funds covered in this report and their corresponding New York Stock Exchange ("NYSE") symbols are as follows (each a "Fund" and collectively, the "Funds"):
| | • | Nuveen Municipal Value Fund, Inc. (NUV) ("Municipal Value (NUV)") |
| | • | Nuveen AMT-Free Municipal Value Fund (NUW) ("AMT-Free Municipal Value (NUW)") |
| | • | Nuveen Municipal Income Fund, Inc. (NMI) ("Municipal Income (NMI)") |
| | • | Nuveen Enhanced Municipal Value Fund (NEV) ("Enhanced Municipal Value (NEV)") |
The Funds are registered under the Investment Company Act of 1940, as amended, as diversified closed-end management investment companies. Municipal Value (NUV) and Municipal Income (NMI) were incorporated under the state laws of Minnesota on April 8, 1987 and February 26, 1988, respectively. AMT-Free Municipal Value (NUW) and Enhanced Municipal Value (NEV) were organized as Massachusetts business trusts on November 19, 2008 and July 27, 2009, respectively.
The end of the reporting period for the Funds is October 31, 2016, and the period covered by these Notes to Financial Statements is the fiscal year ended October 31, 2016 (the "current fiscal period").
Investment Adviser
The Funds' investment adviser is Nuveen Fund Advisors, LLC (the "Adviser"), a wholly-owned subsidiary of Nuveen Investments, Inc. ("Nuveen"). Nuveen is an operating division of TIAA Global Asset Management. The Adviser has overall responsibility for management of the Funds, oversees the management of the Funds' portfolios, manages the Funds' business affairs and provides certain clerical, bookkeeping and other administrative services, and, if necessary, asset allocation decisions. The Adviser has entered into sub-advisory agreements with Nuveen Asset Management, LLC (the "Sub-Adviser"), a subsidiary of the Adviser, under which the Sub-Adviser manages the investment portfolios of the Funds.
Investment Objectives and Principal Investment Strategies
Each Fund's primary investment objective is to provide current income exempt from regular federal income tax by investing primarily in a portfolio of municipal obligations issued by state and local government authorities or certain U.S. territories.
Effective August 5, 2016, Municipal Value (NUV) and Municipal Income (NMI) have each added an investment policy to limit the amount of securities subject to the alternative minimum tax ("AMT") to no more than 20% of each Fund's managed assets(as defined in Note 7 – Management Fees and Other Transactions with Affiliates). In addition, effective August 5, 2016, Enhanced Municipal Value (NEV) changed its investment policy to limit the amount of securities subject to the AMT to no more than 20% (30% prior to August 5, 2016) of the Fund's managed assets.
Significant Accounting Policies
Each Fund is an investment company and follows accounting and reporting guidance under Financial Accounting Standards Board (FASB) Accounting Standards Codification (ASC) Topic 946 "Financial Services-Investment Companies." The following is a summary of significant accounting policies followed by the Funds in the preparation of their financial statements in accordance with U.S. generally accepted accounting principles ("U.S. GAAP").
Investment Transactions
Investment transactions are recorded on a trade date basis. Realized gains and losses from investment transactions are determined on the specific identification method, which is the same basis used for federal income tax purposes. Investments purchased on a when-issued/delayed delivery basis may have extended settlement periods. Any investments so purchased are subject to market fluctuation during this period. The Funds have earmarked securities in their portfolios with a current value at least equal to the amount of the when-issued/delayed delivery purchase commitments.
As of the end of the reporting period, the following Funds' outstanding when-issued/delayed delivery purchase commitments were as follows:
| | | | | | | AMT-Free | | | | |
| | | | Municipal | | | Municipal | | | Municipal | |
| | | | Value | | | Value | | | Income | |
| | | | (NUV | ) | | (NUW | ) | | (NMI | ) |
| Outstanding when-issued/delayed delivery purchase commitments | | $ | 1,905,860 | | $ | 570,129 | | $ | 4,545,304 | |
Investment Income
Investment income, which reflects the amortization of premiums and includes accretion of discounts for financial reporting purposes, is recorded on an accrual basis. Investment income also reflects paydown gains and losses, if any.
Professional Fees
Professional fees presented on the Statement of Operations consist of legal fees incurred in the normal course of operations, audit fees, tax consulting fees and, in some cases, workout expenditures. Workout expenditures are incurred in an attempt to protect or enhance an investment or to pursue other claims or legal actions on behalf of Fund shareholders. If a refund is received for workout expenditures paid in a prior reporting period, such amounts will be recognized as "Legal fee refund" on the Statement of Operations.
Dividends and Distributions to Shareholders
Dividends from net investment income are declared monthly. Net realized capital gains and/or market discount from investment transactions, if any, are distributed to shareholders at least annually. Furthermore, capital gains are distributed only to the extent they exceed available capital loss carryforwards.
Distributions to shareholders of net investment income, net realized capital gains and/or market discount, if any, are recorded on the ex-dividend date. The amount and timing of distributions are determined in accordance with federal income tax regulations, which may differ from U.S. GAAP.
Indemnifications
Under the Funds' organizational documents, their officers and directors/trustees are indemnified against certain liabilities arising out of the performance of their duties to the Funds. In addition, in the normal course of business, the Funds enter into contracts that provide general indemnifications to other parties. The Funds' maximum exposure under these arrangements is unknown as this would involve future claims that may be made against the Funds that have not yet occurred. However, the Funds have not had prior claims or losses pursuant to these contracts and expect the risk of loss to be remote.
Netting Agreements
In the ordinary course of business, the Funds may enter into transactions subject to enforceable International Swaps and Derivative Association, Inc. ("ISDA") master agreements or other similar arrangements ("netting agreements"). Generally, the right to offset in netting agreements allows each Fund to offset certain securities and derivatives with a specific counterparty, when applicable, as well as any collateral received or delivered to that counterparty based on the terms of the agreements. Generally, each Fund manages its cash collateral and securities collateral on a counterparty basis.
The Funds' investments subject to netting agreements as of the end of the reporting period, if any, are further described in Note 3 – Portfolio Securities and Investments in Derivatives.
Use of Estimates
The preparation of financial statements in conformity with U.S. GAAP requires management to make estimates and assumptions that affect the reported amounts of assets and liabilities at the date of the financial statements and the reported amounts of increases and decreases in net assets from operations during the reporting period. Actual results may differ from those estimates.
2. Investment Valuation and Fair Value Measurements
The fair valuation input levels as described below are for fair value measurement purposes.
Fair value is defined as the price that would be received upon selling an investment or transferring a liability in an orderly transaction to an independent buyer in the principal or most advantageous market for the investment. A three-tier hierarchy is used to maximize the use of observable market data and minimize the use of unobservable inputs and to establish classification of fair value measurements for disclosure purposes. Observable inputs reflect the assumptions market participants would use in pricing the asset or liability. Observable inputs are based on market data obtained from sources independent of the reporting entity. Unobservable inputs reflect the reporting entity's own assumptions about the assumptions market participants would use in pricing the asset or liability. Unobservable inputs are based on the best information available in the circumstances. The following is a summary of the three-tiered hierarchy of valuation input levels.
| Level 1 – | Inputs are unadjusted and prices are determined using quoted prices in active markets for identical securities. |
| Level 2 – | Prices are determined using other significant observable inputs (including quoted prices for similar securities, interest rates, prepayment speeds, credit risk, etc.). |
| Level 3 – | Prices are determined using significant unobservable inputs (including management's assumptions in determining the fair value of investments). |
Prices of fixed income securities are provided by an independent pricing service ("pricing service") approved by the Funds' Board of Directors/Trustees (the "Board"). The pricing service establishes a security's fair value using methods that may include consideration of the following: yields or prices of investments of comparable quality, type of issue, coupon, maturity and rating, market quotes or indications of value from security dealers, evaluations of anticipated cash flows or collateral, general market conditions and other information and analysis, including the obligor's credit characteristics considered relevant. These securities are generally classified as Level 2. In pricing certain securities, particularly less liquid and lower
Notes to Financial Statements (continued)
quality securities, the pricing service may consider information about a security, its issuer or market activity, provided by the Adviser. These securities are generally classified as Level 2 or Level 3 depending on the observability of the significant inputs.
Common stocks and other equity-type securities are valued at the last sales price on the securities exchange on which such securities are primarily traded and are generally classified as Level 1. Securities primarily traded on the NASDAQ National Market ("NASDAQ") are valued at the NASDAQ Official Closing Price and are generally classified as Level 1. However, securities traded on a securities exchange or NASDAQ for which there were no transactions on a given day or securities not listed on a securities exchange or NASDAQ are valued at the quoted bid price and are generally classified as Level 2.
Certain securities may not be able to be priced by the pre-established pricing methods as described above. Such securities may be valued by the Board and/or its appointee at fair value. These securities generally include, but are not limited to, restricted securities (securities which may not be publicly sold without registration under the Securities Act of 1933, as amended) for which a pricing service is unable to provide a market price; securities whose trading has been formally suspended; debt securities that have gone into default and for which there is no current market quotation; a security whose market price is not available from a pre-established pricing source; a security with respect to which an event has occurred that is likely to materially affect the value of the security after the market has closed but before the calculation of a Fund's net asset value ("NAV") (as may be the case in non-U.S. markets on which the security is primarily traded) or make it difficult or impossible to obtain a reliable market quotation; and a security whose price, as provided by the pricing service, is not deemed to reflect the security's fair value. As a general principle, the fair value of a security would appear to be the amount that the owner might reasonably expect to receive for it in a current sale. A variety of factors may be considered in determining the fair value of such securities, which may include consideration of the following: yields or prices of investments of comparable quality, type of issue, coupon, maturity and rating, market quotes or indications of value from security dealers, evaluations of anticipated cash flows or collateral, general market conditions and other information and analysis, including the obligor's credit characteristics considered relevant. These securities are generally classified as Level 2 or Level 3 depending on the observability of the significant inputs. Regardless of the method employed to value a particular security, all valuations are subject to review by the Board and/or its appointee.
The inputs or methodologies used for valuing securities are not an indication of the risks associated with investing in those securities. The following is a summary of each Fund's fair value measurements as of the end of the reporting period:
| Municipal Value (NUV) | | Level 1 | | Level 2 | | Level 3 | | Total | |
| Long-Term Investments: | | | | | | | | | | | | | |
| Municipal Bonds* | | $ | — | | $ | 2,124,128,110 | | $ | — | | $ | 2,124,128,110 | |
| Corporate Bonds** | | | — | | | — | | | 624,556 | *** | | 624,556 | |
| Short-Term Investments*: | | | | | | | | | | | | | |
| Municipal Bonds | | | — | | | 19,050,000 | | | — | | | 19,050,000 | |
| Total | | $ | — | | $ | 2,143,178,110 | | $ | 624,556 | | $ | 2,143,802,666 | |
| AMT-Free Municipal Value (NUW) | | | | | | | | | | | | | |
| Long-Term Investments: | | | | | | | | | | | | | |
| Municipal Bonds* | | $ | — | | $ | 247,153,020 | | $ | — | | $ | 247,153,020 | |
| Municipal Income (NMI) | | | | | | | | | | | | | |
| Long-Term Investments: | | | | | | | | | | | | | |
| Municipal Bonds* | | $ | — | | $ | 97,886,599 | | $ | — | | $ | 97,886,599 | |
| Enhanced Municipal Value (NEV) | | | | | | | | | | | | | |
| Long-Term Investments: | | | | | | | | | | | | | |
| Municipal Bonds* | | $ | — | | $ | 430,103,506 | | $ | 24,577 | *** | $ | 430,128,083 | |
| Common Stocks** | | | 3,058,520 | | | — | | | — | | | 3,058,520 | |
| Short-Term Investments: | | | | | | | | | | | | | |
| Municipal Bonds* | | | — | | | 999,770 | | | — | | | 999,770 | |
| Total | | $ | 3,058,520 | | $ | 431,103,276 | | $ | 24,577 | | $ | 434,186,373 | |
| * | Refer to the Fund's Portfolio of Investments for state classifications. |
| ** | Refer to the Fund's Portfolio of Investments for industry classifications. |
| *** | Refer to the Fund's Portfolio of Investments for securities classified as Level 3. |
The Board is responsible for the valuation process and has appointed the oversight of the daily valuation process to the Adviser's Valuation Committee. The Valuation Committee, pursuant to the valuation policies and procedures adopted by the Board, is responsible for making fair value determinations, evaluating the effectiveness of the Funds' pricing policies and reporting to the Board. The Valuation Committee is aided in its efforts by the Adviser's dedicated Securities Valuation Team, which is responsible for administering the daily valuation process and applying fair value methodologies as approved by the Valuation Committee. When determining the reliability of independent pricing services for investments owned by the Funds, the Valuation Committee, among other things, conducts due diligence reviews of the pricing services and monitors the quality of security prices received through various testing reports conducted by the Securities Valuation Team.
The Valuation Committee will consider pricing methodologies it deems relevant and appropriate when making a fair value determination, based on the facts and circumstances specific to the portfolio instrument. Fair value determinations generally will be derived as follows, using public or private market information:
| (i) | | If available, fair value determinations shall be derived by extrapolating from recent transactions or quoted prices for identical or comparable securities. |
| | | |
| (ii) | | If such information is not available, an analytical valuation methodology may be used based on other available information including, but not limited to: analyst appraisals, research reports, corporate action information, issuer financial statements and shelf registration statements. Such analytical valuation methodologies may include, but are not limited to: multiple of earnings, discount from market value of a similar freely-traded security, discounted cash flow analysis, book value or a multiple thereof, risk premium/yield analysis, yield to maturity and/or fundamental investment analysis. |
The purchase price of a portfolio instrument will be used to fair value the instrument only if no other valuation methodology is available or deemed appropriate, and it is determined that the purchase price fairly reflects the instrument's current value.
For each portfolio security that has been fair valued pursuant to the policies adopted by the Board, the fair value price is compared against the last available and next available market quotations. The Valuation Committee reviews the results of such testing and fair valuation occurrences are reported to the Board.
3. Portfolio Securities and Investments in Derivatives
Portfolio Securities
Inverse Floating Rate Securities
Each Fund is authorized to invest in inverse floating rate securities. An inverse floating rate security is created by depositing a municipal bond (referred to as an "Underlying Bond"), typically with a fixed interest rate, into a special purpose tender option bond ("TOB") trust (referred to as the "TOB Trust") created by or at the direction of one or more Funds. In turn, the TOB Trust issues (a) floating rate certificates (referred to as "Floaters"), in face amounts equal to some fraction of the Underlying Bond's par amount or market value, and (b) an inverse floating rate certificate (referred to as an "Inverse Floater") that represents all remaining or residual interest in the TOB Trust. Floaters typically pay short-term tax-exempt interest rates to third parties who are also provided a right to tender their certificate and receive its par value, which may be paid from the proceeds of a remarketing of the Floaters, by a loan to the TOB Trust from a third party liquidity provider ("Liquidity Provider"), or by the sale of assets from the TOB Trust. The Inverse Floater is issued to a long term investor, such as one or more of the Funds. The income received by the Inverse Floater holder varies inversely with the short-term rate paid to holders of the Floaters, and in most circumstances the Inverse Floater holder bears substantially all of the Underlying Bond's downside investment risk and also benefits disproportionately from any potential appreciation of the Underlying Bond's value. The value of an Inverse Floater will be more volatile than that of the Underlying Bond because the interest rate is dependent on not only the fixed coupon rate of the Underlying Bond but also on the short-term interest paid on the Floaters, and because the Inverse Floater essentially bears the risk of loss (and possible gain) of the greater face value of the Underlying Bond.
The Inverse Floater held by a Fund gives the Fund the right to (a) cause the holders of the Floaters to tender their certificates at par (or slightly more than par in certain circumstances), and (b) have the trustee of the TOB Trust (the "Trustee") transfer the Underlying Bond held by the TOB Trust to the Fund, thereby collapsing the TOB Trust.
The Fund may acquire an Inverse Floater in a transaction where it (a) transfers an Underlying Bond that it owns to a TOB Trust created by a third party or (b) transfers an Underlying Bond that it owns, or that it has purchased in a secondary market transaction for the purpose of creating an Inverse Floater, to a TOB Trust created at its direction, and in return receives the Inverse Floater of the TOB Trust (referred to as a "self-deposited Inverse Floater"). A Fund may also purchase an Inverse Floater in a secondary market transaction from a third party creator of the TOB Trust without first owning the Underlying Bond (referred to as an "externally-deposited Inverse Floater").
An investment in a self-deposited Inverse Floater is accounted for as a "financing" transaction (i.e., a secured borrowing). For a self-deposited Inverse Floater, the Underlying Bond deposited into the TOB Trust is identified in the Fund's Portfolio of Investments as "(UB) – Underlying bond of an inverse floating rate trust reflected as a financing transaction," with the Fund recognizing as liabilities, labeled "Floating rate obligations" on the Statement of Assets and Liabilities, (a) the liquidation value of Floaters issued by the TOB Trust, and (b) the amount of any borrowings by the TOB Trust from a Liquidity Provider to enable the TOB Trust to purchase outstanding Floaters in lieu of a remarketing. In addition, the Fund recognizes in "Investment Income" the entire earnings of the Underlying Bond, and recognizes (a) the interest paid to the holders of the Floaters or on the TOB Trust's borrowings, and (b) other expenses related to remarketing, administration, trustee, liquidity and other services to a TOB Trust, as a component of "Interest expense" on the Statement of Operations.
In contrast, an investment in an externally-deposited Inverse Floater is accounted for as a purchase of the Inverse Floater and is identified in the Fund's Portfolio of Investments as "(IF) – Inverse floating rate investment." For an externally-deposited Inverse Floater, a Fund's Statement of Assets and Liabilities recognizes the Inverse Floater and not the Underlying Bond as an asset, and the Fund does not recognize the Floaters, or any related borrowings from a Liquidity Provider, as a liability. Additionally, the Fund reflects in "Investment Income" only the net amount of earnings on the Inverse Floater (net of the interest paid to the holders of the Floaters or the Liquidity Provider as lender, and the expenses of the Trust), and does not show the amount of that interest paid or the expenses of the TOB Trust as described above as interest expense on the Statement of Operations.
Notes to Financial Statements (continued)
Fees paid upon the creation of a TOB Trust for self-deposited Inverse Floaters and externally-deposited Inverse Floaters are recognized as part of the cost basis of the Inverse Floater and are capitalized over the term of the TOB Trust.
As of the end of the reporting period, the aggregate value of Floaters issued by each Fund's TOB Trust for self-deposited Inverse Floaters and externally-deposited Inverse Floaters was as follows:
| | | | | AMT-Free | | | | Enhanced | |
| | | Municipal | | Municipal | | Municipal | | Municipal | |
| | | Value | | Value | | Income | | Value | |
| Floating Rate Obligations Outstanding | | (NUV | ) | (NUW | ) | (NMI | ) | (NEV | ) |
| Floating rate obligations: self-deposited Inverse Floaters | | $ | 14,130,000 | | $ | 7,125,000 | | $ | — | | $ | 48,480,000 | |
| Floating rate obligations: externally-deposited Inverse Floaters | | | 16,835,000 | | | 10,165,000 | | | 6,005,000 | | | 146,485,000 | |
| Total | | $ | 30,965,000 | | $ | 17,290,000 | | $ | 6,005,000 | | $ | 194,965,000 | |
During the current fiscal period, the average amount of Floaters (including any borrowings from a Liquidity Provider) outstanding, and average annual interest rate and fees related to self-deposited Inverse Floaters, were as follows:
| | | | | AMT-Free | | | | Enhanced | |
| | | Municipal | | Municipal | | Municipal | | Municipal | |
| | | Value | | Value | | Income | | Value | |
| Self-Deposited Inverse Floaters | | (NUV | ) | (NUW | ) | (NMI | ) | (NEV | ) |
| Average floating rate obligations outstanding | | $ | 15,556,230 | | $ | 7,125,000 | | $ | 3,335,000 | | $ | 27,448,934 | |
| Average annual interest rate and fees | | | 0.85% | | | 0.87% | | | 0.84% | | | 0.97% | |
TOB Trusts are supported by a liquidity facility provided by a Liquidity Provider pursuant to which the Liquidity Provider agrees, in the event that Floaters are (a) tendered to the Trustee for remarketing and the remarketing does not occur, or (b) subject to mandatory tender pursuant to the terms of the TOB Trust agreement, to either purchase Floaters or to provide the Trustee with an advance from a loan facility to fund the purchase of Floaters by the TOB Trust. In certain circumstances, the Liquidity Provider may otherwise elect to have the Trustee sell the Underlying Bond to retire the Floaters that were tendered and not remarketed prior to providing such a loan. In these circumstances, the Liquidity Provider remains obligated to provide a loan to the extent that the proceeds of the sale of the Underlying Bond are not sufficient to pay the purchase price of the Floaters.
The size of the commitment under the loan facility for a given TOB Trust is at least equal to the balance of that TOB Trust's outstanding Floaters plus any accrued interest. In consideration of the loan facility, fee schedules are in place and are charged by the Liquidity Provider(s). Any loans made by the Liquidity Provider will be secured by the purchased Floaters held by the TOB Trust. Interest paid on any outstanding loan balances will be effectively borne by the Fund that owns the Inverse Floaters of the TOB Trust that has incurred the borrowing and may be at a rate that is greater than the rate that would have been paid had the Floaters been successfully remarketed.
As described above, any amounts outstanding under a liquidity facility are recognized as a component of "Floating rate obligations" on the Statement of Assets and Liabilities by the Fund holding the corresponding Inverse Floaters issued by the borrowing TOB Trust. As of the end of the reporting period, Enhanced Municipal Value (NEV) had outstanding borrowings under such liquidity facilities in the amount of $5,300,912, which are recognized as a component of "Floating rate obligations" on the Statement of Assets and Liabilities. There were no loans outstanding under such facilities for any of the other Funds as of the end of the reporting period.
Each Fund may also enter into shortfall and forbearance agreements (sometimes referred to as a "recourse arrangement" or "credit recovery swap") (TOB Trusts involving such agreements are referred to herein as "Recourse Trusts"), under which a Fund agrees to reimburse the Liquidity Provider for the Trust's Floaters, in certain circumstances, for the amount (if any) by which the liquidation value of the Underlying Bond held by the TOB Trust may fall short of the sum of the liquidation value of the Floaters issued by the TOB Trust plus any amounts borrowed by the TOB Trust from the Liquidity Provider, plus any shortfalls in interest cash flows. Under these agreements, a Fund's potential exposure to losses related to or on an Inverse Floater may increase beyond the value of the Inverse Floater as a Fund may potentially be liable to fulfill all amounts owed to holders of the Floaters or the Liquidity Provider. Any such shortfall amount in the aggregate is recognized as "Unrealized depreciation on Recourse Trusts" on the Statement of Assets and Liabilities.
As of the end of the reporting period, each Fund's maximum exposure to the Floaters issued by Recourse Trusts for self-deposited Inverse Floaters and externally-deposited Inverse Floaters was as follows:
| | | | | AMT-Free | | | | Enhanced | |
| | | Municipal | | Municipal | | Municipal | | Municipal | |
| | | Value | | Value | | Income | | Value | |
| Floating Rate Obligations - Recourse Trusts | | (NUV | ) | (NUW | ) | (NMI | ) | (NEV | ) |
| Maximum exposure to Recourse Trusts: self-deposited Inverse Floaters | | $ | 14,130,000 | | $ | 7,125,000 | | $ | — | | $ | 34,855,000 | |
| Maximum exposure to Recourse Trusts: externally-deposited Inverse Floaters | | | 16,835,000 | | | 10,165,000 | | | 6,005,000 | | | 136,185,000 | |
| Total | | $ | 30,965,000 | | $ | 17,290,000 | | $ | 6,005,000 | | $ | 171,040,000 | |
Zero Coupon Securities
A zero coupon security does not pay a regular interest coupon to its holders during the life of the security. Income to the holder of the security comes from accretion of the difference between the original purchase price of the security at issuance and the par value of the security at maturity and is effectively paid at maturity. The market prices of zero coupon securities generally are more volatile than the market prices of securities that pay interest periodically.
Investments in Derivatives
In addition to the inverse floating rate securities in which each Fund may invest, which are considered portfolio securities for financial reporting purposes, each Fund is authorized to invest in certain derivative instruments such as futures, options and swap contracts. Each Fund limits its investments in futures, options on futures and swap contracts to the extent necessary for the Adviser to claim the exclusion from registration by the Commodity Futures Trading Commission as a commodity pool operator with respect to the Fund. The Funds record derivative instruments at fair value, with changes in fair value recognized on the Statement of Operations, when applicable. Even though the Funds' investments in derivatives may represent economic hedges, they are not considered to be hedge transactions for financial reporting purposes.
Although the Funds are authorized to invest in derivative instruments and may do so in the future, they did not make any such investments during the current fiscal period.
Market and Counterparty Credit Risk
In the normal course of business each Fund may invest in financial instruments and enter into financial transactions where risk of potential loss exists due to changes in the market (market risk) or failure of the other party to the transaction to perform (counterparty credit risk). The potential loss could exceed the value of the financial assets recorded on the financial statements. Financial assets, which potentially expose each Fund to counterparty credit risk, consist principally of cash due from counterparties on forward, option and swap transactions, when applicable. The extent of each Fund's exposure to counterparty credit risk in respect to these financial assets approximates their carrying value as recorded on the Statement of Assets and Liabilities.
Each Fund helps manage counterparty credit risk by entering into agreements only with counterparties the Adviser believes have the financial resources to honor their obligations and by having the Adviser monitor the financial stability of the counterparties. Additionally, counterparties may be required to pledge collateral daily (based on the daily valuation of the financial asset) on behalf of each Fund with a value approximately equal to the amount of any unrealized gain above a pre-determined threshold. Reciprocally, when each Fund has an unrealized loss, the Funds have instructed the custodian to pledge assets of the Funds as collateral with a value approximately equal to the amount of the unrealized loss above a pre-determined threshold. Collateral pledges are monitored and subsequently adjusted if and when the valuations fluctuate, either up or down, by at least the pre-determined threshold amount.
4. Fund Shares
Equity Shelf Programs and Offering Costs
The following Funds have each filed registration statements with the Securities and Exchange Commission ("SEC") authorizing each Fund to issue additional shares through one or more equity shelf program ("Shelf Offering"), which became effective with the SEC during the current and/or prior fiscal period.
Under these Shelf Offerings, the Funds, subject to market conditions, may raise additional equity capital by issuing additional shares from time to time in varying amounts and by different offering methods at a net price at or above the Fund's NAV per share. In the event a Fund's Shelf Offering registration statement is no longer current, the Fund may not issue additional shares until a post-effective amendment to the registration statement has been filed with the SEC.
Additional authorized shares, shares sold and offering proceeds, net of offering costs under each Fund's Shelf Offering during the Fund's current and/or prior fiscal period (unless otherwise noted), were as follows:
| | | | | AMT-Free | | Enhanced | |
| | | Municipal Value (NUV) | | Municipal Value (NUW) | | Municipal Value (NEV) | |
| | | Year | | Year | | Year | | Year | | Year | | Year | |
| | | Ended | | Ended | | Ended | | Ended | | Ended | | Ended | |
| | | 10/31/16 | * | 10/31/15 | | 10/31/16 | ** | 10/31/15 | *** | 10/31/16 | | 10/31/15 | |
| Additional authorized shares | | | 19,600,000 | | | — | | | 2,600,000 | | | 1,200,000 | | | 5,200,000 | | | 5,200,000 | |
| Shares sold | | | 900,076 | | | — | | | 992,372 | | | 122,737 | | | 3,842,469 | | | — | |
| Offering proceeds, net of offering costs | | $ | 9,540,333 | | $ | — | | $ | 17,451,974 | | $ | 2,131,586 | | $ | 61,693,894 | | $ | — | |
| * | Represents total additional authorized shares for the period March 22, 2016 through October 31, 2016. |
| ** | Represents total additional authorized shares for the period February 26, 2016 through October 31, 2016; and the period November 1, 2015 through November 15, 2015. |
| *** | Represents total additional authorized shares for the period January 27, 2015 through October 31, 2015. |
Notes to Financial Statements (continued)
Costs incurred by the Funds in connection with their Shelf Offerings were recorded as a deferred charge and recognized as a component of "Deferred offering costs" on the Statement of Assets and Liabilities. The deferred assets are reduced during the one-year period that additional shares are sold by reducing the proceeds from such sales and is recognized as a component of "Proceeds from shelf offering, net of offering costs" on the Statement of Changes in Net Assets. Any remaining deferred charges at the end of the one-year life of the Shelf Offering period will be expensed accordingly, as well as any additional Shelf Offering costs the Funds may incur. As Shelf Offering costs are expensed they are recognized as a component of "Other expenses" on the Statement of Operations.
During the current reporting period, AMT- Free Municipal Value (NUW) was authorized to issue an additional 1.4 million shares under a new Shelf Offering. Also during the current reporting period, Municipal Income (NMI) and Enhanced Municipal Value (NEV) each filed an initial registration statement with the SEC to establish new Shelf Offerings, which are not yet effective.
Common Share Transactions
Transactions in common shares during the Funds' current and prior fiscal period, where applicable, were as follows:
| | | | | AMT-Free | |
| | | Municipal Value (NUV) | | Municipal Value (NUW) | |
| | | Year | | Year | | Year | | Year | |
| | | Ended | | Ended | | Ended | | Ended | |
| | | 10/31/16 | | 10/31/15 | | 10/31/16 | | 10/31/15 | |
| Shares sold through shelf offering | | | 900,076 | | | — | | | 992,372 | | | 122,737 | |
| Shares issued to shareholders due to reinvestment of distributions | | | 347,727 | | | — | | | 40,963 | | | 18,995 | |
| Weighted average premium to NAV per shelf offering share sold | | | 1.22 | % | | — | % | | 2.34 | % | | 1.36 | % |
| | | | | Enhanced Municipal | |
| | | Municipal Income (NMI)* | | Value (NEV) | |
| | | Year | | Year | | Year | | Year | |
| | | Ended | | Ended | | Ended | | Ended | |
| | | 10/31/16 | | 10/31/15 | | 10/31/16 | | 10/31/15 | |
| Shares sold through shelf offering | | | — | | | — | | | 3,842,469 | | | — | |
| Shares issued to shareholders due to reinvestment of distributions | | | 15,227 | | | 10,033 | | | 10,581 | | | 2,917 | |
| Weighted average premium to NAV per shelf offering share sold | | | — | % | | — | % | | 1.80 | % | | — | % |
| * | Fund was not authorized to issue additional shares through a Shelf Offering. |
5. Investment Transactions
Long-term purchases and sales (including maturities) during the current fiscal period were as follows:
| | | | | AMT-Free | | | | Enhanced | |
| | | Municipal | | Municipal | | Municipal | | Municipal | |
| | | Value | | Value | | Income | | Value | |
| | | (NUV | ) | (NUW | ) | (NMI | ) | (NEV | ) |
| Purchases | | $ | 236,597,607 | | $ | 41,153,247 | | $ | 4,919,484 | | $ | 119,966,679 | |
| Sales and maturities | | | 242,716,935 | | | 28,453,017 | | | 4,427,611 | | | 25,036,786 | |
6. Income Tax Information
Each Fund is a separate taxpayer for federal income tax purposes. Each Fund intends to distribute substantially all of its net investment income and net capital gains to shareholders and to otherwise comply with the requirements of Subchapter M of the Internal Revenue Code applicable to regulated investment companies. Therefore, no federal income tax provision is required. Furthermore, each Fund intends to satisfy conditions that will enable interest from municipal securities, which is exempt from regular federal income tax, and in the case of AMT-Free Municipal Value (NUW) the alternative minimum tax applicable to individuals, to retain such tax-exempt status when distributed to shareholders of the Funds. Net realized capital gains and ordinary income distributions paid by the Funds are subject to federal taxation.
For all open tax years and all major taxing jurisdictions, management of the Funds has concluded that there are no significant uncertain tax positions that would require recognition in the financial statements. Open tax years are those that are open for examination by taxing authorities (i.e., generally the last four tax year ends and the interim tax period since then). Furthermore, management of the Funds is also not aware of any tax positions for which it is reasonably possible that the total amounts of unrecognized tax benefits will significantly change in the next twelve months.
The following information is presented on an income tax basis. Differences between amounts for financial statement and federal income tax purposes are primarily due to timing differences in recognizing taxable market discount, timing differences in recognizing certain gains and losses on investment transactions and the treatment of investments in inverse floating rate securities reflected as financing transactions, if any. To the extent that differences arise that are permanent in nature, such amounts are reclassified within the capital accounts as detailed below. Temporary differences do not require reclassification. Temporary and permanent differences do not impact the NAVs of the Funds.
As of October 31, 2016, the cost and unrealized appreciation (depreciation) of investments, as determined on a federal income tax basis, were as follows:
| | | | | AMT-Free | | | | Enhanced | |
| | | Municipal | | Municipal | | Municipal | | Municipal | |
| | | Value | | Value | | Income | | Value | |
| | | (NUV | ) | (NUW | ) | (NMI | ) | (NEV | ) |
| Cost of investments | | $ | 1,902,974,321 | | $ | 202,138,634 | | $ | 87,013,055 | | $ | 338,024,459 | |
| Gross unrealized: | | | | | | | | | | | | | |
| Appreciation | | $ | 241,136,439 | | $ | 38,555,588 | | $ | 11,261,418 | | $ | 53,115,455 | |
| Depreciation | | | (14,438,203 | ) | | (666,202 | ) | | (387,874 | ) | | (5,428,796 | ) |
| Net unrealized appreciation (depreciation) of investments | | $ | 226,698,236 | | $ | 37,889,386 | | $ | 10,873,544 | | $ | 47,686,659 | |
Permanent differences, primarily due to taxable market discount, federal taxes paid and nondeductible offering costs resulted in reclassifications among the Funds' components of net assets as of October 31, 2016, the Funds' tax year end, as follows:
| | | | | AMT-Free | | | | Enhanced | |
| | | Municipal | | Municipal | | Municipal | | Municipal | |
| | | Value | | Value | | Income | | Value | |
| | | (NUV | ) | (NUW | ) | (NMI | ) | (NEV | ) |
| Paid-in-surplus | | $ | (61 | ) | $ | 1 | | $ | 1 | | $ | (166 | ) |
| Undistributed (Over-distribution of) net investment income | | | (816,585 | ) | | (33,380 | ) | | (56,822 | ) | | (81,165 | ) |
| Accumulated net realized gain (loss) | | | 816,646 | | | 33,379 | | | 56,821 | | | 81,331 | |
The tax components of undistributed net tax-exempt income, net ordinary income and net long-term capital gains as of October 31, 2016, the Funds' tax year end, were as follows:
| | | | | | | AMT-Free | | | | | | Enhanced | |
| | | | Municipal | | | Municipal | | | Municipal | | | Municipal | |
| | | | Value | | | Value | | | Income | | | Value | |
| | | | (NUV | ) | | (NUW | ) | | (NMI | ) | | (NEV | ) |
Undistributed net tax-exempt income1 | | $ | 6,069,945 | | $ | 331,949 | | $ | 378,414 | | $ | 1,701,271 | |
Undistributed net ordinary income2 | | | 457,488 | | | 103,869 | | | 16,452 | | | 29,263 | |
| Undistributed net long-term capital gains | | | — | | | — | | | — | | | — | |
1 | Undistributed net tax-exempt income (on a tax basis) has not been reduced for the dividend declared on October 3, 2016 and paid on November 1, 2016. |
2 | Net ordinary income consists of taxable market discount income and net short-term capital gains, if any. |
The tax character of distributions paid during the Funds' tax years ended October 31, 2016 and October 31, 2015, was designated for purposes of the dividends paid deduction as follows:
| | | | | | | AMT-Free | | | | | | Enhanced | |
| | | | Municipal | | | Municipal | | | Municipal | | | Municipal | |
| | | | Value | | | Value | | | Income | | | Value | |
| 2016 | | | (NUV | ) | | (NUW | ) | | (NMI | ) | | (NEV | ) |
Distributions from net tax-exempt income3 | | $ | 80,329,085 | | $ | 10,748,111 | | $ | 4,134,879 | | $ | 21,404,317 | |
Distributions from net ordinary income2 | | | 391,620 | | | 202,880 | | | 81,311 | | | 107,623 | |
| Distributions from net long-term capital gains | | | — | | | — | | | — | | | — | |
| | | | | | | AMT-Free | | | | | | Enhanced | |
| | | | Municipal | | | Municipal | | | Municipal | | | Municipal | |
| | | | Value | | | Value | | | Income | | | Value | |
| 2015 | | | (NUV | ) | | (NUW | ) | | (NMI | ) | | (NEV | ) |
| Distributions from net tax-exempt income | | $ | 83,476,720 | | $ | 10,401,699 | | $ | 4,196,006 | | $ | 20,251,258 | |
Distributions from net ordinary income2 | | | 193,185 | | | 69,219 | | | 43,093 | | | 127,511 | |
| Distributions from net long-term capital gains | | | — | | | — | | | — | | | — | |
2 | Net ordinary income consists of taxable market discount income and net short-term capital gains, if any. |
3 | The Funds hereby designate these amounts paid during the fiscal year ended October 31, 2016, as Exempt Interest Dividends. |
As of October 31, 2016, the Funds' tax year end, the Funds had unused capital loss carryforwards available for federal income tax purposes to be applied against future capital gains, if any. If not applied, the carryforwards will expire as shown in the following table. The losses not subject to expiration will be utilized first by a Fund.
Notes to Financial Statements (continued)
| | | | | | | AMT-Free | | | | | | Enhanced | |
| | | | Municipal | | | Municipal | | | Municipal | | | Municipal | |
| | | | Value | | | Value | | | Income | | | Value | |
| | | | (NUV | ) | | (NUW | ) | | (NMI | ) | | (NEV | ) |
| Expiration: | | | | | | | | | | | | | |
| October 31, 2017 | | $ | — | | $ | — | | $ | 159,522 | | $ | — | |
| October 31, 2018 | | | — | | | — | | | — | | | 2,946,811 | |
| October 31, 2019 | | | — | | | — | | | — | | | 16,146,849 | |
| Not subject to expiration | | | 34,533,782 | | | 726,001 | | | — | | | 6,141,628 | |
| Total | | $ | 34,533,782 | | $ | 726,001 | | $ | 159,522 | | $ | 25,235,288 | |
During the Funds' tax year ended October 31, 2016, the following Funds utilized capital loss carryforwards as follows:
| | | | AMT-Free | | | | |
| | | | Municipal | | | Municipal | |
| | | | Value | | | Income | |
| | | | (NUW | ) | | (NMI | ) |
| Utilized capital loss carryforwards | | $ | 800,750 | | $ | 199,223 | |
7. Management Fees and Other Transactions with Affiliates
Management Fees
Each Fund's management fee compensates the Adviser for the overall investment advisory and administrative services and general office facilities. The Sub-Adviser is compensated for its services to the Funds from the management fees paid to the Adviser.
Each Fund's management fee consists of two components – a fund-level fee, based only on the amount of assets within each individual Fund, and a complex-level fee, based on the aggregate amount of all eligible fund assets managed by the Adviser and for Municipal Value (NUV) a gross interest income component. This pricing structure enables Fund shareholders to benefit from growth in the assets within their respective Fund as well as from growth in the amount of complex-wide assets managed by the Adviser.
The annual Fund-level fee, payable monthly, for Municipal Value (NUV) is calculated according to the following schedule:
| | | | Municipal Value (NUV) |
| Average Daily Net Assets | | | Fund-Level Fee |
| For the first $500 million | | | 0.1500 | % |
| For the next $500 million | | | 0.1250 | |
| For net assets over $1 billion | | | 0.1000 | |
In addition, Municipal Value (NUV) pays an annual management fee, payable monthly, based on gross interest income (excluding interest on bonds underlying a "self-deposited inverse floater" trust that is attributed to the Fund over and above the net interest earned on the inverse floater itself) as follows:
| | | | Municipal Value (NUV) |
| Gross Interest Income | | | Gross Income Fee |
| For the first $50 million | | | 4.125 | % |
| For the next $50 million | | | 4.000 | |
| For gross income over $100 million | | | 3.875 | |
For the period November 1, 2015 through July 31, 2016, the annual Fund-level fee, payable monthly, for AMT-Free Municipal Value (NUW), Municipal Income (NMI) and Enhanced Municipal Value (NEV) was calculated according to the following schedules:
| | AMT-Free Municipal Value (NUW) |
| Average Daily Managed Assets* | | | Fund-Level Fee |
| For the first $125 million | | | 0.4000 | % |
| For the next $125 million | | | 0.3875 | |
| For the next $250 million | | | 0.3750 | |
| For the next $500 million | | | 0.3625 | |
| For the next $1 billion | | | 0.3500 | |
| For managed assets over $2 billion | | | 0.3375 | |
| | Municipal Income (NMI) |
| Average Daily Net Assets | | | Fund-Level Fee |
| For the first $125 million | | | 0.4500 | % |
| For the next $125 million | | | 0.4375 | |
| For the next $250 million | | | 0.4250 | |
| For the next $500 million | | | 0.4125 | |
| For the next $1 billion | | | 0.4000 | |
| For the next $3 billion | | | 0.3875 | |
| For net assets over $5 billion | | | 0.3750 | |
| | Enhanced Municipal Value (NEV) |
| Average Daily Managed Assets* | | | Fund-Level Fee |
| For the first $125 million | | | 0.4500 | % |
| For the next $125 million | | | 0.4375 | |
| For the next $250 million | | | 0.4250 | |
| For the next $500 million | | | 0.4125 | |
| For the next $1 billion | | | 0.4000 | |
| For managed assets over $2 billion | | | 0.3875 | |
Effective August 1, 2016, the annual Fund-level fee, payable monthly, for AMT-Free Municipal Value (NUW), Municipal Income (NMI) and Enhanced Municipal Value (NEV) is calculated according to the following schedules:
| | AMT-Free Municipal Value (NUW) |
| Average Daily Managed Assets* | | | Fund-Level Fee |
| For the first $125 million | | | 0.4000 | % |
| For the next $125 million | | | 0.3875 | |
| For the next $250 million | | | 0.3750 | |
| For the next $500 million | | | 0.3625 | |
| For the next $1 billion | | | 0.3500 | |
| For the next $3 billion | | | 0.3250 | |
| For managed assets over $5 billion | | | 0.3125 | |
| | | | Municipal Income (NMI) |
| Average Daily Net Assets | | | Fund-Level Fee |
| For the first $125 million | | | 0.4500 | % |
| For the next $125 million | | | 0.4375 | |
| For the next $250 million | | | 0.4250 | |
| For the next $500 million | | | 0.4125 | |
| For the next $1 billion | | | 0.4000 | |
| For the next $3 billion | | | 0.3750 | |
| For net assets over $5 billion | | | 0.3625 | |
| | Enhanced Municipal Value (NEV) |
| Average Daily Managed Assets* | | | Fund-Level Fee |
| For the first $125 million | | | 0.4500 | % |
| For the next $125 million | | | 0.4375 | |
| For the next $250 million | | | 0.4250 | |
| For the next $500 million | | | 0.4125 | |
| For the next $1 billion | | | 0.4000 | |
| For the next $3 billion | | | 0.3750 | |
| For managed assets over $5 billion | | | 0.3625 | |
Notes to Financial Statements (continued)
The annual complex-level fee, payable monthly, for each Fund is calculated by multiplying the current complex-wide fee rate, determined according to the following schedule by the Fund's daily managed assets (net assets for Municipal Value (NUV) and Municipal Income (NMI)):
| Complex-Level Managed Asset Breakpoint Level* | Effective Rate at Breakpoint Level |
| $55 billion | 0.2000 | % |
| $56 billion | 0.1996 | |
| $57 billion | 0.1989 | |
| $60 billion | 0.1961 | |
| $63 billion | 0.1931 | |
| $66 billion | 0.1900 | |
| $71 billion | 0.1851 | |
| $76 billion | 0.1806 | |
| $80 billion | 0.1773 | |
| $91 billion | 0.1691 | |
| $125 billion | 0.1599 | |
| $200 billion | 0.1505 | |
| $250 billion | 0.1469 | |
| $300 billion | 0.1445 | |
| * | For the complex-level fees, managed assets include closed-end fund assets managed by the Adviser that are attributable to certain types of leverage. For these purposes, leverage includes the funds' use of preferred stock and borrowings and certain investments in the residual interest certificates (also called inverse floating rate securities) in tender option bond (TOB) trusts, including the portion of assets held by the TOB trust that has been effectively financed by the trust's issuance of floating rate securities, subject to an agreement by the Adviser as to certain funds to limit the amount of such assets for determining managed assets in certain circumstances. The complex-level fee is calculated based upon the aggregate daily managed assets of all Nuveen Funds that constitute "eligible assets." Eligible assets do not include assets attributable to investments in other Nuveen Funds or assets in excess of a determined amount (originally $2 billion) added to the Nuveen Fund complex in connection with the Adviser's assumption of the management of the former First American Funds effective January 1, 2011. As of October 31, 2016, the complex-level fee rate for each Fund was 0.1610%. |
Other Transactions with Affiliates
The Funds pay no compensation directly to those of its directors/trustees who are affiliated with the Adviser or to its officers, all of whom receive remuneration for their services to the Funds from the Adviser or its affiliates. The Board has adopted a deferred compensation plan for independent directors/trustees that enables directors/trustees to elect to defer receipt of all or a portion of the annual compensation they are entitled to receive from certain Nuveen-advised funds. Under the plan, deferred amounts are treated as though equal dollar amounts had been invested in shares of select Nuveen-advised funds.
Each Fund is permitted to purchase or sell securities from or to certain other funds managed by the Adviser ("inter-fund trade") under specified conditions outlined in procedures adopted by the Board. These procedures have been designed to ensure that any inter-fund trade of securities by the Fund from or to another fund that is, or could be, considered an affiliate of the Fund under certain limited circumstances by virtue of having a common investment adviser (or affiliated investment adviser), common officer and/or common trustee complies with Rule 17a-7 of the 1940 Act. Further, as defined under these procedures, each inter-fund trade is effected at the current market price as provided by an independent pricing service. Unsettled inter-fund trades as of the end of the reporting period are recognized as a component of "Receivable for investments sold" and/or "Payable for investments purchased" on the Statement of Assets and Liabilities, when applicable.
During the current fiscal period, the following Fund engaged in inter-fund trades pursuant to these procedures as follows:
| Inter-Fund Trades | Municipal Value (NUV | ) |
| Purchases | | $ | 7,029,390 | |
| Sales | | | — | |
8. Borrowing Arrangements
Uncommitted Line of Credit
During the current fiscal period, the Funds participated in an unsecured bank line of credit ("Unsecured Credit Line") under which outstanding balances would bear interest at a variable rate. On December 31, 2015 (the only date utilized during the current fiscal period), the following Fund borrowed the following amount from the Unsecured Credit Line at an annualized interest rate of 1.68% on its outstanding balance.
| | | | | |
| | Municipal Value (NUV | ) |
| Outstanding balance at December 31, 2015 | | $ | 4,687,261 | |
The remaining Funds in this report did not draw on this Unsecured Credit Line during the current fiscal period.
Committed Line of Credit
The Funds, along with certain other funds managed by the Adviser ("Participating Funds"), have established a 364-day, approximately $2.5 billion standby credit facility with a group of lenders, under which the Participating Funds may borrow for various purposes other than leveraging for investment purposes. A large portion of this facility's capacity (and its associated costs as described below) is currently dedicated for use by a small number of Participating Funds, which does not include any of the Funds covered by this shareholder report. The remaining capacity under the facility (and the corresponding portion of the facility's annual costs) is separately dedicated to most of the other open-end funds in the Nuveen fund family, along with a number of Nuveen closed-end funds, including all of the Funds covered by this shareholder report. The credit facility expires in July 2017 unless extended or renewed.
The credit facility has the following terms: a fee of 0.15% per annum on unused commitment amounts, and interest at a rate equal to the higher of (a) one-month LIBOR (London Inter-Bank Offered Rate) plus 1.25% per annum or (b) the Fed Funds rate plus 1.25% per annum on amounts borrowed. Participating Funds paid administration, legal and arrangement fees, which are recognized as a component of "Interest expense and amoritization of offering costs" on the Statement of Operations, and along with commitment fees, have been allocated among such Participating Funds based upon the relative proportions of the facility's aggregate capacity reserved for them and other factors deemed relevant by the Adviser and the Board of each Participating Fund.
During the current fiscal period, none of the Funds utilized this facility.
Additional Fund Information (Unaudited)
| Board of Directors/Trustees |
| William Adams IV* | Margo Cook* | Jack B. Evans | William C. Hunter | David J. Kundert | Albin F. Moschner |
| John K. Nelson | William J. Schneider | Judith M. Stockdale | Carole E. Stone | Terence J. Toth | Margaret L. Wolff |
| | | | | | |
| * Interested Board Member. | | | | |
| | | | | | |
| Fund Manager | Custodian | Legal Counsel | Independent Registered | Transfer Agent and |
| Nuveen Fund Advisors, LLC | State Street Bank | Chapman and Cutler LLP | Public Accounting Firm | Shareholder Services |
| 333 West Wacker Drive | & Trust Company | Chicago, IL 60603 | KPMG LLP | State Street Bank |
| Chicago, IL 60606 | One Lincoln Street | | 200 East Randolph Drive | & Trust Company |
| | Boston, MA 02111 | | Chicago, IL 60601 | Nuveen Funds |
| | | | | P.O. Box 43071 |
| | | | | Providence, RI 02940-3071 |
| | | | | (800) 257-8787 |
| | | | | |
Quarterly Form N-Q Portfolio of Investments Information
Each Fund is required to file its complete schedule of portfolio holdings with the Securities and Exchange Commission (SEC) for the first and third quarters of each fiscal year on Form N-Q. You may obtain this information directly from the SEC. Visit the SEC on-line at http://www.sec.gov or in person at the SEC's Public Reference Room in Washington, D.C. Call the SEC toll-free at (800) SEC-0330 for room hours and operation.
Nuveen Funds' Proxy Voting Information
You may obtain (i) information regarding how each fund voted proxies relating to portfolio securities held during the most recent twelve-month period ended June 30, without charge, upon request, by calling Nuveen toll-free at (800) 257-8787 or on Nuveen's website at www.nuveen.com and (ii) a description of the policies and procedures that each fund used to determine how to vote proxies relating to portfolio securities without charge, upon request, by calling Nuveen toll free at (800) 257-8787. You may also obtain this information directly from the SEC. Visit the SEC on-line at http://www.sec.gov.
CEO Certification Disclosure
Each Fund's Chief Executive Officer (CEO) has submitted to the New York Stock Exchange (NYSE) the annual CEO certification as required by Section 303A.12(a) of the NYSE Listed Company Manual. Each Fund has filed with the SEC the certification of its CEO and Chief Financial Officer required by Section 302 of the Sarbanes-Oxley Act.
Share Repurchases
Each Fund intends to repurchase, through its open-market share repurchase program, shares of its own common stock at such times and in such amounts as is deemed advisable. During the period covered by this report, each Fund repurchased shares of its common stock as shown in the accompanying table. Any future repurchases will be reported to shareholders in the next annual or semi-annual report.
| | NUV | NUW | NMI | NEV | |
| Shares repurchased | — | — | — | — | |
FINRA BrokerCheck
The Financial Industry Regulatory Authority (FINRA) provides information regarding the disciplinary history of FINRA member firms and associated investment professionals. This information as well as an investor brochure describing FINRA BrokerCheck is available to the public by calling the FINRA BrokerCheck Hotline number at (800) 289-9999 or by visiting www.FINRA.org.
Glossary of Terms Used in this Report
| ■ | Average Annual Total Return: This is a commonly used method to express an investment's performance over a particular, usually multi-year time period. It expresses the return that would have been necessary each year to equal the investment's actual cumulative performance (including change in NAV or market price and reinvested dividends and capital gains distributions, if any) over the time period being considered. |
| | |
| ■ | Duration: Duration is a measure of the expected period over which a bond's principal and interest will be paid, and consequently is a measure of the sensitivity of a bond's or bond fund's value to changes when market interest rates change. Generally, the longer a bond's or fund's duration, the more the price of the bond or fund will change as interest rates change. |
| | |
| ■ | Effective Leverage: Effective leverage is a fund's effective economic leverage, and includes both regulatory leverage (see leverage) and the leverage effects of certain derivative investments in the fund's portfolio. Currently, the leverage effects of Tender Option Bond (TOB) inverse floater holdings are included in effective leverage values, in addition to any regulatory leverage. |
| | |
| ■ | Forward Interest Rate Swap: A contractual agreement between two counterparties under which one party agrees to make periodic payments to the other for an agreed period of time based on a fixed rate, while the other party agrees to make periodic payments based on a floating rate of interest based on an underlying index. Alternatively, both series of cash flows to be exchanged could be calculated using floating rates of interest but floating rates that are based upon different underlying indexes. |
| | |
| ■ | Industrial Development Revenue Bond (IDR): A unique type of revenue bond issued by a state or local government agency on behalf of a private sector company and intended to build or acquire factories or other heavy equipment and tools. |
| | |
| ■ | Gross Domestic Product (GDP): The total market value of all final goods and services produced in a country/region in a given year, equal to total consumer, investment and government spending, plus the value of exports, minus the value of imports. |
| | |
| ■ | Inverse Floating Rate Securities: Inverse floating rate securities, also known as inverse floaters or tender option bonds (TOBs), are created by depositing a municipal bond, typically with a fixed interest rate, into a special purpose trust. This trust, in turn, (a) issues floating rate certificates typically paying short-term tax-exempt interest rates to third parties in amounts equal to some fraction of the deposited bond's par amount or market value, and (b) issues an inverse floating rate certificate (sometimes referred to as an "inverse floater") to an investor (such as a fund) interested in gaining investment exposure to a long-term municipal bond. The income received by the holder of the inverse floater varies inversely with the short-term rate paid to the floating rate certificates' holders, and in most circumstances the holder of the inverse floater bears substantially all of the underlying bond's downside investment risk. The holder of the inverse floater typically also benefits disproportionately from any potential appreciation of the underlying bond's value. Hence, an inverse floater essentially represents an investment in the underlying bond on a leveraged basis. |
| | |
| ■ | Leverage: Leverage is created whenever a fund has investment exposure (both reward and/or risk) equivalent to more than 100% of the investment capital. |
| | |
| ■ | Lipper General & Insured Leveraged Municipal Debt Funds Classification Average: Calculated using the returns of all closed-end funds in this category. Lipper returns account for the effects of management fees and assume reinvestment of distributions, but do not reflect any applicable sales charges. |
| | |
| ■ | Lipper General & Insured Unleveraged Municipal Debt Funds Classification Average: Calculated using the returns of all closed-end funds in this category. Lipper returns account for the effects of management fees and assume reinvestment of distributions, but do not reflect any applicable sales charges. |
Glossary of Terms Used in this Report (continued)
| ■ | Net Asset Value (NAV) Per Share: A fund's Net Assets is equal to its total assets (securities, cash, accrued earnings and receivables) less its total liabilities. NAV per share is equal to the fund's Net Assets divided by its number of shares outstanding. |
| | |
| ■ | Pre-Refunding: Pre-Refunding, also known as advanced refundings or refinancings, is a procedure used by state and local governments to refinance municipal bonds to lower interest expenses. The issuer sells new bonds with a lower yield and uses the proceeds to buy U.S. Treasury securities, the interest from which is used to make payments on the higher-yielding bonds. Because of this collateral, pre-refunding generally raises a bond's credit rating and thus its value. |
| | |
| ■ | Regulatory Leverage: Regulatory leverage consists of preferred shares issued by or borrowings of a fund. Both of these are part of a fund's capital structure. Regulatory leverage is subject to asset coverage limits set in the Investment Company Act of 1940. |
| | |
| ■ | S&P Municipal Bond Index: An unleveraged, market value-weighted index designed to measure the performance of the tax-exempt, investment-grade U.S. municipal bond market. Index returns assume reinvestment of distributions, but do not reflect any applicable sales charges or management fees. |
| | |
| ■ | Total Investment Exposure: Total investment exposure is a fund's assets managed by the Adviser that are attributable to financial leverage. For these purposes, financial leverage includes a fund's use of preferred stock and borrowings and investments in the residual interest certificates (also called inverse floating rate securities) in tender option bond (TOB) trusts, including the portion of assets held by a TOB trust that has been effectively financed by the trust's issuance of floating rate securities. |
| | |
| ■ | Zero Coupon Bond: A zero coupon bond does not pay a regular interest coupon to its holders during the life of the bond. Income to the holder of the bond comes from accretion of the difference between the original purchase price of the bond at issuance and the par value of the bond at maturity and is effectively paid at maturity. The market prices of zero coupon bonds generally are more volatile than the market prices of bonds that pay interest periodically. |
Reinvest Automatically, Easily and Conveniently
Nuveen makes reinvesting easy. A phone call is all it takes to set up your reinvestment account.
Nuveen Closed-End Funds Automatic Reinvestment Plan
Nuveen Closed-End Fund allows you to conveniently reinvest distributions in additional Fund shares. By choosing to reinvest, you'll be able to invest money regularly and automatically, and watch your investment grow through the power of compounding. Just like distributions in cash, there may be times when income or capital gains taxes may be payable on distributions that are reinvested. It is important to note that an automatic reinvestment plan does not ensure a profit, nor does it protect you against loss in a declining market.
Easy and convenient
To make recordkeeping easy and convenient, each month you'll receive a statement showing your total distributions, the date of investment, the shares acquired and the price per share, and the total number of shares you own.
How shares are purchased
The shares you acquire by reinvesting will either be purchased on the open market or newly issued by the Fund. If the shares are trading at or above net asset value at the time of valuation, the Fund will issue new shares at the greater of the net asset value or 95% of the then-current market price. If the shares are trading at less than net asset value, shares for your account will be purchased on the open market. If the Plan Agent begins purchasing Fund shares on the open market while shares are trading below net asset value, but the Fund's shares subsequently trade at or above their net asset value before the Plan Agent is able to complete its purchases, the Plan Agent may cease open-market purchases and may invest the uninvested portion of the distribution in newly-issued Fund shares at a price equal to the greater of the shares' net asset value or 95% of the shares' market value on the last business day immediately prior to the purchase date. Distributions received to purchase shares in the open market will normally be invested shortly after the distribution payment date. No interest will be paid on distributions awaiting reinvestment. Because the market price of the shares may increase before purchases are completed, the average purchase price per share may exceed the market price at the time of valuation, resulting in the acquisition of fewer shares than if the distribution had been paid in shares issued by the Fund. A pro rata portion of any applicable brokerage commissions on open market purchases will be paid by Plan participants. These commissions usually will be lower than those charged on individual transactions.
Flexible
You may change your distribution option or withdraw from the Plan at any time, should your needs or situation change. You can reinvest whether your shares are registered in your name, or in the name of a brokerage firm, bank, or other nominee. Ask your investment advisor if his or her firm will participate on your behalf. Participants whose shares are registered in the name of one firm may not be able to transfer the shares to another firm and continue to participate in the Plan. The Fund reserves the right to amend or terminate the Plan at any time. Although the Fund reserves the right to amend the Plan to include a service charge payable by the participants, there is no direct service charge to participants in the Plan at this time.
Call today to start reinvesting distributions
For more information on the Nuveen Automatic Reinvestment Plan or to enroll in or withdraw from the Plan, speak with your financial advisor or call us at (800) 257-8787.
Annual Investment Management Agreement Approval Process (Unaudited) |
The Board of Directors or Trustees (as the case may be) of each Fund (the "Board," and each Director or Trustee a "Board Member"), including the Board Members who are not parties to the Funds' advisory or sub-advisory agreements or "interested persons" of any such parties (the "Independent Board Members"), is responsible for overseeing the performance of the investment adviser and sub-adviser to the respective Fund and determining whether to continue such Fund's advisory agreement (the "Investment Management Agreement") between the Fund and Nuveen Fund Advisors, LLC (the "Adviser") and the sub-advisory agreement (the "Sub-Advisory Agreement" and, together with the Investment Management Agreement, the "Advisory Agreements") between the Adviser and Nuveen Asset Management, LLC (the "Sub-Adviser"). Following an initial term with respect to each Fund upon its commencement of operations, the Board reviews each Investment Management Agreement and Sub-Advisory Agreement on behalf of each Fund and votes to determine whether the respective Advisory Agreement should be renewed. Accordingly, at an in-person meeting held on May 24-26, 2016 (the "May Meeting"), the Board, including a majority of the Independent Board Members, considered and approved the existing Advisory Agreements for the Funds.
During the year, the Board and its Committees met regularly to receive materials and discuss a variety of topics impacting the Funds including, among other things, overall market conditions and market performance, Fund investment performance, brokerage execution, valuation of securities, compliance matters, securities lending, leverage matters, risk management and ongoing initiatives. The Board had established several standing Committees, including the Open-end Fund Committee and Closed-end Fund Committee which permit the Board Members to delve further into the topics particularly relevant to the respective product line and enhance the Board's effectiveness and oversight of the Funds. The Board also seeks to meet with the Sub-Adviser and its investment team at least once over a multiple year rotation through site visits. The information and knowledge the Board gained throughout the year from the Board and Committee meetings, site visits and the related materials were relevant to the Board's evaluation of the Advisory Agreements, and the Board took such information into account in its review of the Advisory Agreements.
In addition to the materials received throughout the year, the Board received additional materials prepared specifically for its annual review of the Advisory Agreements in response to a request by independent legal counsel on behalf of the Independent Board Members. The materials addressed a variety of topics, including a description of the services provided by the Adviser and the Sub-Adviser (each, a "Fund Adviser"); a review of fund performance with a detailed focus on any performance outliers; an analysis of the investment teams; an analysis of the fees and expense ratios of the Funds, including information comparing such fees and expenses to that of peer groups; an assessment of shareholder services for the Funds and of the performance of certain service providers; a review of initiatives instituted or continued during the past year; and a review of premium/discount trends and leverage management as well as information regarding the profitability of the Fund Advisers, the compensation of portfolio managers, and compliance and risk matters.
As part of its annual review, the Board held a separate meeting on April 12-13, 2016 to review the Funds' investment performance and consider an analysis by the Adviser of the Sub-Adviser examining, among other things, the team's assets under management, investment performance, investment approach, and the stability and structure of the Sub-Adviser's organization and investment team. During the review, the Independent Board Members requested and received additional information from management. Throughout the year and throughout their review of the Advisory Agreements, the Independent Board Members were assisted by independent legal counsel. The Independent Board Members met separately with independent legal counsel without management present and received a memorandum from such counsel outlining their fiduciary duties and legal standards in reviewing the Advisory Agreements. The Independent Board Members' review of the Advisory Agreements reflected an ongoing process that incorporated the information and considerations that occurred over the years, including the most recent year, as well as the information specifically furnished for the renewal process. In deciding to renew the Advisory Agreements, the Independent Board
Members did not identify a particular factor as controlling, but rather the decision reflected the comprehensive consideration of all the information presented. The following summarizes the principal factors, but not all the factors, the Board considered in its review of the Advisory Agreements and its conclusions.
| A. | Nature, Extent and Quality of Services |
| | In evaluating the renewal of the Advisory Agreements, the Independent Board Members received and considered information regarding the nature, extent and quality of the applicable Fund Adviser's services provided to the respective Fund and the initiatives undertaken during the past year by the Adviser. The Board recognized the comprehensive set of services the Adviser provided to manage and operate the Nuveen funds, including (a) product management (such as setting dividends, positioning the product in the marketplace, maintaining and enhancing shareholder communications and reporting to the Board); (b) investment services (such as overseeing the Sub-Adviser and other service providers; analyzing investment performance and risks; overseeing risk management and disclosure; developing and interpreting investment policies; assisting in the development of products; helping to prepare financial statements and marketing disclosures; and overseeing trade execution); (c) fund administration (such as helping to prepare fund tax returns and complete other tax compliance matters; and helping to prepare regulatory filings and shareholder reports); (d) fund Board administration (such as preparing Board materials and organizing and providing assistance for Board meetings); (e) compliance (such as helping to devise and maintain the funds' compliance program and related testing); (f) legal support (such as helping to prepare registration statements and proxy statements, interpreting regulations and policies and overseeing fund activities); and (g) providing leverage management. |
| | |
| | The Board reviewed the continued investment the Adviser had made in its business to continue to strengthen the breadth and quality of its services to the benefit of the Nuveen funds. The Board noted the Adviser's additional staffing in key areas that support the funds and the Board, including in investment services, operations, closed-end fund/structured products, fund governance, compliance, fund administration, product management, and information technology. Among the enhancements to its services, the Board recognized the Adviser's (a) expanded activities and support required as a result of regulatory developments, including in areas of compliance and reporting; (b) expanded efforts to support leverage management with a goal of seeking the most effective structure for fund shareholders given appropriate risk levels and regulatory constraints; (c) increased support for dividend management; (d) continued investment in its technical capabilities as the Adviser continued to build out a centralized fund data platform, enhance mobility and remote access capabilities, rationalize and upgrade software platforms, and automate certain regulatory liquidity determinations; (e) continued efforts to rationalize the product line through mergers, liquidations and re-positioning of Nuveen funds with the goal of increasing efficiencies, reducing costs, improving performance and addressing shareholder needs; (f) continued efforts to develop new lines of business designed to enhance the Nuveen product line and meet investor demands; and (g) continued commitment to enhance risk oversight, including the formation of the operational risk group to provide operational risk assessment, the access to platforms which provide better risk reporting to support investment teams, and the development of a new team to initially review new products and major product initiatives. The Board also recognized the Adviser's efforts to renegotiate certain fees of other service providers which culminated in reduced expenses for all funds for custody and accounting services without diminishing the breadth and quality of the services provided. The Board considered the Chief Compliance Officer's report regarding the Adviser's compliance program, the Adviser's continued development, execution and management of its compliance program, and the additions to the compliance team to support the continued growth of the Nuveen fund family and address regulatory developments. |
| | |
| | The Board also considered information highlighting the various initiatives that the Adviser had implemented or continued during the year to enhance or support the closed-end fund product line. The Board noted the Adviser's continued efforts during 2015 (a) to rationalize the product line through mergers designed to help reduce product overlap, offer shareholders the potential for lower fees and enhanced investor acceptance, and address persistent discounts in the secondary market; (b) to oversee and manage leverage as the Adviser facilitated the rollover of existing facilities and conducted negotiations for |
Annual Investment Management Agreement Approval Process (Unaudited) (continued)
| | improved terms and pricing to reduce leverage costs; (c) to conduct capital management services including share repurchases and/or share issuances throughout the year and monitoring market conditions to capitalize on such opportunities for the closed-end funds; and (d) to implement data-driven market analytics which, among other things, provided a better analysis of the shareholder base, enhanced the ability to monitor the closed-end funds versus peers and helped to understand trading discounts. The Board also considered the quality and breadth of Nuveen's investment relations program through which Nuveen seeks to build awareness of, and educate investors and financial advisers with respect to, Nuveen closed-end funds which may help to build an active secondary market for the closed-end fund product line. |
| | |
| | As noted, the Adviser also oversees the Sub-Adviser who primarily provides the portfolio advisory services to the Funds. The Board recognized the skill and competency of the Adviser in monitoring and analyzing the performance of the Sub-Adviser and managing the sub-advisory relationship. The Board noted that the Adviser recommended the renewal of each Sub-Advisory Agreement. |
| | |
| | Based on their review, the Independent Board Members found that, overall, the nature, extent and quality of services provided to the respective Funds under each applicable Advisory Agreement were satisfactory. |
| | |
| B. | The Investment Performance of the Funds and Fund Advisers |
| | The Board considered the long-term and short-term performance history of each Fund. As noted above, the Board reviewed fund performance at its quarterly meetings throughout the year and took into account the information derived from the discussions with representatives of the Adviser about fund performance at these meetings. The Board also considered the Adviser's analysis of fund performance with particular focus on any performance outliers and the factors contributing to such performance and any steps the investment team had taken to address performance concerns. The Board reviewed, among other things, each Fund's investment performance both on an absolute basis and in comparison to peer funds (the "Performance Peer Group") and to recognized and/or customized benchmarks (i.e., generally benchmarks derived from multiple recognized benchmarks) for the quarter, one-, three- and five-year periods ending December 31, 2015, as well as performance information reflecting the first quarter of 2016. |
| | |
| | In evaluating performance information, the Board recognized the following factors may impact the performance data as well as the consideration to be given to particular performance data: |
| | • | The performance data reflected a snapshot in time, in this case as of the end of the most recent calendar year or quarter. A different performance period, however, could generate significantly different results. |
| | | |
| | • | Long-term performance can be adversely affected by even one period of significant underperformance so that a single investment decision or theme had the ability to disproportionately affect long-term performance. |
| | | |
| | • | Shareholders evaluate performance based on their own holding period which may differ from the performance period reviewed by the Board, leading to different performance results. |
| | | |
| | • | The Board recognized the difficulty in establishing appropriate peer groups and benchmarks for certain funds, including Nuveen Municipal Value Fund, Inc. (the "Municipal Value Fund"), Nuveen AMT-Free Municipal Value Fund (the "AMT-Free Fund") and Nuveen Municipal Income Fund, Inc. (the "Municipal Income Fund"). The Board noted that management classified the Performance Peer Groups as low, medium and high in relevancy and took the relevancy of the Performance Peer Group into account when considering the comparative performance data. If the Performance Peer Group differed somewhat from a fund, the Board recognized that the comparative performance data may be of limited value. The Board also recognized that each fund operated pursuant to its own investment objective(s), parameters and restrictions which may differ from that of the Performance Peer Group or benchmark and that these variations lead to differences in performance results. Further, for funds that utilized leverage, the Board understood that leverage during different periods could provide both benefits and risks to a portfolio as compared to an unlevered benchmark. |
| | In addition to the foregoing, the Independent Board Members continued to recognize the importance of secondary market trading for the shares of closed-end funds. At the quarterly meetings as well as the May Meeting, the Independent Board Members (either at the Board level or through the Closed-end Fund Committee) reviewed, among other things, the premium or discount to net asset value of the Nuveen closed-end funds as of a specified date and over various periods as well as in comparison to the premium/discount average in their respective Lipper peer category. At the May Meeting and/or prior meetings, the Independent Board Members (either at the Board level or through the Closed-end Fund Committee) reviewed, among other things, an analysis by the Adviser of the key economic, market and competitive trends that affected the closed-end fund market and Nuveen closed-end funds and considered any actions proposed periodically by the Adviser to address trading discounts of certain closed-end funds, including, among other things, share repurchases, fund reorganizations, adjusting fund investment mandates and strategies, and increasing fund awareness to investors. The Independent Board Members considered the evaluation of the premium and discount levels of the closed-end funds to be a continuing priority in their oversight of the closed-end funds. |
| | |
| | With respect to any Nuveen funds for which the Board has identified performance concerns, the Board monitors such funds closely until performance improves, discusses with the Adviser the reasons for such results, considers those steps necessary or appropriate to address such issues, and reviews the results of any efforts undertaken. The Board was aware, however, that shareholders chose to invest or remain invested in a fund knowing that the Adviser and the applicable sub-adviser manage the fund, knowing the fund's investment strategy and seeking exposure to that strategy (even if the strategy was "out of favor" in the marketplace) and knowing the fund's fee structure. |
| | |
| | For the Municipal Value Fund, the Board noted that the Fund ranked in its Performance Peer Group in the fourth quartile for the one-, three- and five-year periods; however, the Fund outperformed its benchmark in each of such periods. In reviewing the comparative peer information, the Board recognized that the peer group was classified as low relevancy because the Fund is an unlevered fund and the funds in the peer group consist primarily of levered funds. The Board recognized that, as a result, the Fund generally tends to underperform levered funds in up markets and tends to outperform such peer funds in down markets. The Board also recognized the Fund's positive absolute performance for the one-, three- and five-year periods. Given the Fund's investment mandate, the Board was satisfied with the explanation for the variance from peer performance and with the Fund's performance. |
| | |
| | For the AMT-Free Fund, the Board noted that the Fund ranked in its Performance Peer Group in the second quartile in the one-year period, third quartile in the three-year period and first quartile in the five-year period. The Fund also outperformed its benchmark in the one-, three- and five-year periods. The Board determined that the Fund's performance had been satisfactory. |
| | |
| | For the Municipal Income Fund, the Board noted that, although the Fund ranked in its Performance Peer Group in the fourth quartile in the one-, three- and five-year periods, the Fund outperformed its benchmark in each of such periods. In reviewing the comparative peer information, the Board recognized that the peer group was classified as low relevancy because the Fund is an unlevered fund and the funds in the peer group consist primarily of levered funds. The Board recognized that, as a result, the Fund generally tends to underperform levered funds in up markets and tends to outperform such peer funds in down markets. The Board also recognized the Fund's positive absolute performance for the one-, three- and five-year periods. Given the Fund's investment mandate, the Board was satisfied with the explanation for the variance from peer performance and with the Fund's performance. |
| | |
| | For Nuveen Enhanced Municipal Value Fund (the "Enhanced Fund"), the Board noted that the Fund ranked in its Performance Peer Group in the third quartile in the one-year period and the first quartile in the three- and five-year periods. The Fund also outperformed its benchmark in the one-, three- and five-year periods. The Board determined that the Fund's performance over time had been favorable. |
Annual Investment Management Agreement Approval Process (Unaudited) (continued)
| C. | Fees, Expenses and Profitability |
| | |
| | 1. Fees and Expenses |
| | The Board evaluated the management fees and other fees and expenses of each Fund. The Board reviewed, among other things, the gross and net management fees and net total expenses of each Fund (expressed as a percentage of average net assets) in absolute terms and also in comparison to the fee and expense levels of a comparable universe of funds (the "Peer Universe") selected by an independent third-party fund data provider. The Independent Board Members also reviewed the methodology regarding the construction of the applicable Peer Universe. |
| | |
| | In their evaluation of the management fee schedule, the Independent Board Members considered the fund-level and complex-wide breakpoint schedules, as described in further detail below. In this regard, the Board considered that management recently reviewed the breakpoint schedules for the closed-end funds which resulted in reduced breakpoints and/or new breakpoints at certain asset thresholds for numerous closed-end funds, including the AMT-Free Fund, the Municipal Income Fund and the Enhanced Fund. |
| | |
| | In reviewing the comparative fee and expense information, the Independent Board Members recognized that various factors such as the limited size and particular composition of the Peer Universe (including the inclusion of other Nuveen funds in the peer set); expense anomalies; changes in the funds comprising the Peer Universe from year to year; levels of reimbursement or fee waivers; the timing of information used; the differences in the type and use of leverage; and differences in services provided can impact the usefulness of the comparative data in helping to assess the appropriateness of a fund's fees and expenses. In addition, in reviewing a fund's fees and expenses compared to the fees and expenses of its peers (excluding leverage costs and leveraged assets), the Board generally considered a fund's expenses and fees to be higher if they were over 10 basis points higher, slightly higher if they were 6 to 10 basis points higher, in line if they were within approximately 5 basis points higher than the peer average and below if they were below the peer average of the Peer Universe. The Board reviewed the net expense ratio in recognition that the net expense ratio generally best represented the net experience of the shareholders of a fund as it directly reflected the costs of investing in the respective fund. The Board noted that the majority of the Nuveen funds had a net expense ratio near or below the average of the respective peers. For funds with a net expense ratio of 6 basis points or higher than their respective peer average, the Independent Board Members reviewed the reasons for the outlier status and were satisfied with the explanation for the difference or with any steps taken to address the difference. |
| | |
| | The Independent Board Members noted that the Municipal Value Fund, the AMT-Free Fund and the Municipal Income Fund each had a net management fee and net expense ratio below its respective peer average, and the Enhanced Fund had a net management fee and net expense ratio in line with its peer averages. |
| | |
| | Based on their review of the fee and expense information provided, the Independent Board Members determined that each Fund's management fees (as applicable) to a Fund Adviser were reasonable in light of the nature, extent and quality of services provided to the Fund. |
| | |
| | 2. Comparisons with the Fees of Other Clients |
| | The Board also reviewed information regarding the fee rates for other types of clients advised or sub-advised by the respective Fund Adviser. For the Adviser and/or the Sub-Adviser, such other clients may include municipal separately managed accounts and passively managed exchange traded funds (ETFs). |
| | |
| | The Board recognized that each Fund had an affiliated sub-adviser. With respect to affiliated sub-advisers, the Board reviewed, among other things, the range of advisory fee rates and average fee rate assessed for the different types of clients. The Board reviewed information regarding the different types of services provided to the Funds compared to that provided to these other clients which typically did not require the same breadth of day-to-day services required for registered funds. The Board further considered information regarding the differences in, among other things, investment policies, investor profiles, and account |
| | sizes between the Nuveen funds and the other types of clients. In addition, the Independent Board Members also recognized that the management fee rates of the foreign funds advised by the Adviser may also vary due to, among other things, differences in the client base, governing bodies, operational complexities and services covered by the management fee. The Independent Board Members recognized that the foregoing variations resulted in different economics among the product structures and culminated in varying management fees among the types of clients and funds. |
| | |
| | The Board also was aware that, since the Funds had a sub-adviser, each Fund's management fee reflected two components, the fee retained by the Adviser for its services and the fee the Adviser paid to the Sub-Adviser. The Board noted that many of the administrative services provided to support the Funds by the Adviser may not be required to the same extent or at all for the institutional clients or other clients. In general, the Board noted that higher fee levels reflected higher levels of service provided by the Fund Adviser, increased investment management complexity, greater product management requirements and higher levels of business risk or some combination of the foregoing. Given the inherent differences in the various products, particularly the extensive services provided to the Funds, the Independent Board Members concluded such facts justify the different levels of fees. |
| | |
| | 3. Profitability of Fund Advisers |
| | In conjunction with their review of fees, the Independent Board Members also considered the profitability of Nuveen for its advisory activities on an absolute basis and in comparison to other investment advisers. The Independent Board Members reviewed, among other things, Nuveen's adjusted operating margins, the gross and net revenue margins (pre-tax and after-tax) for advisory activities for the Nuveen funds, and the revenues, expenses, and net income (pre-tax and after-tax) of Nuveen for each of the last two calendar years. The Independent Board Members reviewed an analysis of the key drivers behind the changes in revenues and expenses that impacted profitability in 2015. The Independent Board Members also noted that the sub-advisory fees for the Funds are paid by the Adviser, however, the Board recognized that the Sub-Adviser is affiliated with Nuveen. In their review, the Independent Board Members recognized that profitability data is rather subjective as various allocation methodologies may be reasonable to employ but yet yield different results. The Board also reviewed the results of certain alternative methodologies. The Board considered the allocation methodology employed to prepare the profitability data as well as a summary of the refinements to the methodology that had been adopted over the years which may limit some of the comparability of Nuveen's revenue margins over time. Two Independent Board Members also served as point persons for the Board throughout the year to review and discuss the methodology employed to develop the profitability analysis and any proposed changes thereto and to keep the Board apprised of such changes during the year. In reviewing the profitability data, the Independent Board Members noted that Nuveen's operating margin as well as its margins for its advisory activities to the Nuveen funds for 2015 were consistent with such margins for 2014. |
| | |
| | The Board also considered Nuveen's adjusted operating margins compared to that of other comparable investment advisers (based on asset size and composition) with publicly available data. The Independent Board Members recognized, however, the limitations of the comparative data as the other advisers may have a different business mix, employ different allocation methodologies, have different capital structure and costs, may not be representative of the industry or other factors that limit the comparability of the profitability information. Nevertheless, the Independent Board Members noted that Nuveen's adjusted operating margins appeared comparable to the adjusted margins of the peers. |
| | |
| | Further, as the Adviser is a wholly-owned subsidiary of Nuveen which in turn is an operating division of TIAA Global Asset Management, the investment management arm of Teachers Insurance and Annuity Association of America ("TIAA-CREF"), the Board reviewed a balance sheet for TIAA-CREF reflecting its assets, liabilities and capital and contingency reserves for the last two calendar years to have a better understanding of the financial stability and strength of the TIAA-CREF complex, together with Nuveen. |
| | |
| | Based on the information provided, the Independent Board Members noted that the Adviser appeared to be sufficiently profitable to operate as a viable investment management firm and to honor its obligations as a sponsor of the Nuveen funds. |
Annual Investment Management Agreement Approval Process (Unaudited) (continued)
| | With respect to the Sub-Adviser, the Independent Board Members also considered the profitability of the Sub-Adviser from its relationship with the Nuveen funds. The Independent Board Members reviewed the Sub-Adviser's revenues, expenses and revenue margins (pre- and post-tax) for its advisory activities for the calendar year ended December 31, 2015. The Independent Board Members also reviewed profitability analysis reflecting the revenues, expenses and revenue margin (pre- and post-tax) by asset type for the Sub-Adviser for the calendar year ending December 31, 2015. |
| | |
| | In evaluating the reasonableness of the compensation, the Independent Board Members also considered other amounts paid to a Fund Adviser by the Funds as well as indirect benefits (such as soft dollar arrangements), if any, the Fund Adviser and its affiliates received or were expected to receive that were directly attributable to the management of a Fund. See Section E below for additional information on indirect benefits a Fund Adviser may receive as a result of its relationship with the Funds. |
| | |
| | Based on their review, the Independent Board Members determined that the Adviser's and the Sub Adviser's levels of profitability were reasonable in light of the respective services provided. |
| | |
| D. | Economies of Scale and Whether Fee Levels Reflect These Economies of Scale |
| | The Independent Board Members recognized that as the assets of a particular fund or the Nuveen complex in the aggregate increase over time, economies of scale may be realized with respect to the management of the funds, and the Independent Board Members considered the extent to which these economies are shared with the funds and their shareholders. Although the Independent Board Members recognized that economies of scale are difficult to measure with precision, the Board noted that there were several acceptable means to share economies of scale, including through breakpoints in the management fee schedule reducing the fee rates as asset levels grow, fee waiver and expense limitation agreements and the Adviser's investment in its business which can enhance the services provided to the funds. With respect to breakpoints, the Independent Board Members noted that, subject to certain exceptions, the funds in the Nuveen complex pay a management fee to the Adviser which is generally comprised of a fund-level component and complex-level component. The fund-level fee component declines as the assets of the particular fund grow and the complex-level fee component declines when eligible assets of all the funds in the Nuveen complex combined grow. With respect to closed-end funds, the Independent Board Members noted that, although such funds may from time-to-time make additional share offerings, the growth of their assets would occur primarily through the appreciation of such funds' investment portfolios. The complex-wide fee arrangement was designed to capture economies of scale achieved when total fund complex assets increase, even if the assets of a particular fund are unchanged or decrease. The approach reflected the notion that some of Nuveen's costs were attributable to services provided to all its funds in the complex, and therefore all funds should benefit if these costs were spread over a larger asset base. |
| | |
| | The Independent Board Members reviewed the breakpoint and complex-wide schedules and the material savings achieved from fund-level breakpoints and complex-wide fee reductions for the 2015 calendar year. |
| | |
| | In addition, the Independent Board Members recognized the Adviser's ongoing investment in its business to expand or enhance the services provided to the Nuveen funds. The Independent Board Members noted, among other things, the additions to groups who play a key role in supporting the funds including in closed-end funds/structured products, fund administration, operations, fund governance, investment services, compliance, product management, and technology. The Independent Board Members also recognized the investments in systems necessary to manage the funds including in areas of risk oversight, information technology and compliance. |
| | |
| | Based on their review, the Independent Board Members concluded that the current fee structure was acceptable and reflected economies of scale to be shared with shareholders when assets under management increase. |
| E. | Indirect Benefits |
| | The Independent Board Members received and considered information regarding other additional benefits the respective Fund Adviser or its affiliates may receive as a result of their relationship with the Funds, including compensation paid to affiliates and research received in connection with brokerage transactions (i.e., soft dollar arrangements). In this regard, the Independent Board Members noted any revenues received by affiliates of the Adviser for serving as co-manager in initial public offerings of new closed-end funds and as underwriter on shelf offerings for certain existing funds. |
| | |
| | In addition to the above, the Independent Board Members considered that the Funds' portfolio transactions are allocated by the Sub-Adviser and the Sub-Adviser may benefit from research received through soft-dollar arrangements. The Board noted, however, that with respect to transactions in fixed income securities, such securities generally trade on a principal basis and do not generate soft dollar credits. Although the Board recognized the Sub-Adviser may benefit from a soft dollar arrangement if it does not have to pay for this research out of its own assets, the Board also recognized that any such research may benefit the Funds to the extent it enhances the ability of the Sub-Adviser to manage the Funds. |
| | |
| | Based on their review, the Independent Board Members concluded that any indirect benefits received by a Fund Adviser as a result of its relationship with the Funds were reasonable and within acceptable parameters. |
| | |
| F. | Other Considerations |
| | The Independent Board Members did not identify any single factor discussed previously as all-important or controlling. The Board Members, including the Independent Board Members, concluded that the terms of each Advisory Agreement were fair and reasonable, that the respective Fund Adviser's fees were reasonable in light of the services provided to each Fund and that the Advisory Agreements be renewed. |
Board Members & Officers (Unaudited)
| | Name, | | Position(s) Held | | Year First | | Principal | | Number |
| | Year of Birth | | with the Funds | | Elected or | | Occupation(s) | | of Portfolios |
| | & Address | | | | Appointed | | Including other | | in Fund Complex |
| | | | | | and Term(1) | | Directorships | | Overseen by |
| | | | | | | | During Past 5 Years | | Board Member |
| | | | | | | | | | |
| Independent Board Members: |
| | | | | | | | | | |
| ■ | WILLIAM J. SCHNEIDER
1944
333 W. Wacker Drive
Chicago, IL 60606 | |
Chairman and
Board Member
| |
1996
Class III
| | Chairman of Miller-Valentine Partners, a real estate investment company; Board Member of Med-America Health System and WDPR Public Radio station; formerly, Senior Partner and Chief Operating Officer (retired (2004) of Miller-Valentine Group; formerly, Board member, Business Advisory Council of the Cleveland Federal Reserve Bank and University of Dayton Business School Advisory Council; past Chair and Director, Dayton Development Coalition. | |
184
|
| | | | | | | | | | |
| ■ | JACK B. EVANS
1948
333 W. Wacker Drive
Chicago, IL 60606 | |
Board Member
| |
1999
Class III
| | President, The Hall-Perrine Foundation, a private philanthropic corporation (since 1996); Director and Chairman, United Fire Group, a publicly held company; Director, The Gazette Company; Life Trustee of Coe College and the Iowa College Foundation; formerly, President Pro-Tem of the Board of Regents for the State of Iowa University System; formerly, Director, Alliant Energy; formerly, Director, Federal Reserve Bank of Chicago; formerly, President and Chief Operating Officer, SCI Financial Group, Inc., a regional financial services firm. | |
184
|
| | | | | | | | | | |
| ■ | WILLIAM C. HUNTER
1948
333 W. Wacker Drive
Chicago, IL 60606 | |
Board Member
| |
2003
Class I
| | Dean Emeritus, formerly, Dean, Tippie College of Business, University of Iowa (2006-2012); Director (since 2004) of Xerox Corporation; Director (since 2005), and past President (2010-2014) Beta Gamma Sigma, Inc., The International Business Honor Society; Director of Wellmark, Inc. (since 2009); formerly, Dean and Distinguished Professor of Finance, School of Business at the University of Connecticut (2003-2006); previously, Senior Vice President and Director of Research at the Federal Reserve Bank of Chicago (1995-2003); formerly, Director (1997-2007), Credit Research Center at Georgetown University. | |
184
|
| | | | | | | | | | |
| ■ | DAVID J. KUNDERT
1942
333 W. Wacker Drive
Chicago, IL 60606 | |
Board Member
| |
2005
Class II
| | Formerly, Director, Northwestern Mutual Wealth Management Company (2006-2013), retired (since 2004) as Chairman, JPMorgan Fleming Asset Management, President and CEO, Banc One Investment Advisors Corporation, and President, One Group Mutual Funds; prior thereto, Executive Vice President, Banc One Corporation and Chairman and CEO, Banc One Investment Management Group; Regent Emeritus, Member of Investment Committee, Luther College; member of the Wisconsin Bar Association; member of Board of Directors and Chair of Investment Committee, Greater Milwaukee Foundation; member of the Board of Directors (Milwaukee), College Possible; Board member of Milwaukee Repertory Theatre (since 2016). | |
184
|
| | Name, | | Position(s) Held | | Year First | | Principal | | Number |
| | Year of Birth | | with the Funds | | Elected or | | Occupation(s) | | of Portfolios |
| | & Address | | | | Appointed | | Including other | | in Fund Complex |
| | | | | | and Term(1) | | Directorships | | Overseen by |
| | | | | | | | During Past 5 Years | | Board Member |
| | | | | | | | | | |
| Independent Board Members (continued): |
| | | | | | | | | | |
| ■ | ALBIN F. MOSCHNER(2)
1952
333 W. Wacker Drive
Chicago, IL 60606 | |
Board Member
| |
2016
Class III
| | Founder and Chief Executive Officer, Northcroft Partners, LLC, a management consulting firm (since 2012); previously, held positions at Leap Wireless International, Inc., including Consultant (2011-2012), Chief Operating Officer (2008-2011), and Chief Marketing Officer (2004-2008); formerly, President, Verizon Card Services division of Verizon Communications, Inc. (2000-2003); formerly, President, One Point Services at One Point Communications (1999-2000); formerly, Vice Chairman of the Board, Diba, Incorporated (1996-1997); formerly, various executive positions with Zenith Electronics Corporation (1991-1996). Director, USA Technologies, Inc., a provider of solutions and services to facilitate electronic payment transactions (since 2012); formerly, Director, Wintrust Financial Corporation (1996-2016). | |
184
|
| | | | | | | | | | |
| ■ | JOHN K. NELSON
1962
333 W. Wacker Drive
Chicago, IL 60606 | |
Board Member
| |
2013
Class II
| | Member of Board of Directors of Core12 LLC (since 2008), a private firm which develops branding, marketing and communications strategies for clients; Director of The Curran Center for Catholic American Studies (since 2009) and The President's Council, Fordham University (since 2010); formerly, senior external advisor to the financial services practice of Deloitte Consulting LLP (2012- 2014): formerly, Chairman of the Board of Trustees of Marian University (2010 as trustee, 2011-2014 as Chairman); formerly, Chief Executive Officer of ABN AMRO N.V. North America, and Global Head of its Financial Markets Division (2007-2008); prior senior positions held at ABN AMRO include Corporate Executive Vice President and Head of Global Markets-the Americas (2006-2007), CEO of Wholesale Banking North America and Global Head of Foreign Exchange and Futures Markets (2001-2006), and Regional Commercial Treasurer and Senior Vice President Trading – North America (1996-2001); formerly, Trustee at St. Edmund Preparatory School in New York City. | |
184
|
| | | | | | | | | | |
| ■ | JUDITH M. STOCKDALE
1947
333 W. Wacker Drive
Chicago, IL 60606 | |
Board Member
| |
1997
Class I
| | Board Member, Land Trust Alliance (since 2013) and U.S. Endowment for Forestry and Communities (since 2013); formerly, Executive Director (1994-2012), Gaylord and Dorothy Donnelley Foundation; prior thereto, Executive Director, Great Lakes Protection Fund (1990-1994). | |
184
|
| | | | | | | | | | |
| ■ | CAROLE E. STONE
1947
333 W. Wacker Drive
Chicago, IL 60606 | | Board Member | | 2007
Class I | | Director, Chicago Board Options Exchange, Inc. (since 2006); Director, C2 Options Exchange, Incorporated (since 2009); Director, CBOE Holdings, Inc. (since 2010); formerly, Commissioner, New York State Commission on Public Authority Reform (2005-2010). | | 184 |
| | | | | | | | | | |
| ■ | TERENCE J. TOTH
1959
333 W. Wacker Drive
Chicago, IL 60606 | |
Board Member
| |
2008
Class II
| | Managing Partner, Promus Capital (since 2008); Director, Fulcrum IT Service LLC (since 2010) and Quality Control Corporation (since 2012); member: Catalyst Schools of Chicago Board (since 2008) and Mather Foundation Board (since 2012), and chair of its investment committee; formerly, Director, Legal & General Investment Management America, Inc. (2008-2013); formerly, CEO and President, Northern Trust Global Investments (2004-2007): Executive Vice President, Quantitative Management & Securities Lending (2000-2004); prior thereto, various positions with Northern Trust Company (since 1994); formerly, Member, Northern Trust Mutual Funds Board (2005-2007), Northern Trust Global Investments Board (2004-2007), Northern Trust Japan Board (2004-2007), Northern Trust Securities Inc. Board (2003-2007) and Northern Trust Hong Kong Board (1997-2004). | |
184
|
Board Members & Officers (Unaudited) (continued)
| | Name, | | Position(s) Held | | Year First | | Principal | | Number |
| | Year of Birth | | with the Funds | | Elected or | | Occupation(s) | | of Portfolios |
| | & Address | | | | Appointed | | Including other | | in Fund Complex |
| | | | | | and Term(1) | | Directorships | | Overseen by |
| | | | | | | | During Past 5 Years | | Board Member |
| | | | | | | | | | |
| Independent Board Members (continued): |
| | | | | | | | | | |
| ■ | MARGARET L. WOLFF
1955
333 W. Wacker Drive
Chicago, IL 60606 | |
Board Member
| |
2016
Class I
| | Member of the Board of Directors (since 2013) of Travelers Insurance Company of Canada and The Dominion of Canada General Insurance Company (each, a part of Travelers Canada, the Canadian operation of The Travelers Companies, Inc.); formerly, Of Counsel, Skadden, Arps, Slate, Meagher & Flom LLP (Mergers & Acquisitions Group) (2005-2014); Member of the Board of Trustees of New York- Presbyterian Hospital (since 2005); Member (since 2004) and Chair (since 2015) of the Board of Trustees of The John A. Hartford Foundation (a philanthropy dedicated to improving the care of older adults); formerly, Member (2005-2015) and Vice Chair (2011-2015) of the Board of Trustees of Mt. Holyoke College. | |
184
|
| | | | | | | | | | |
| Interested Board Members: |
| | | | | | | | | | |
| ■ | WILLIAM ADAMS IV(3)
1955
333 W. Wacker Drive
Chicago, IL 60606 | |
Board Member
| |
2013
Class II
| | Co-Chief Executive Officer and Co-President (since March 2016), formerly, Senior Executive Vice President, Global Structured Products (2010-2016) of Nuveen Investments, Inc.; Co-President of Nuveen Fund Advisors, LLC (since 2011); Co-Chief Executive Officer (since 2016), formerly, Senior Executive Vice President of Nuveen Securities, LLC; President (since 2011), of Nuveen Commodities Asset Management, LLC; Board Member of the Chicago Symphony Orchestra and of Gilda's Club Chicago; formerly, Executive Vice President, U.S. Structured Products, of Nuveen Investments, Inc. (1999-2010). | |
184
|
| | | | | | | | | | |
| ■ | MARGO L. COOK(2)(3)
1964
333 W. Wacker Drive
Chicago, IL 60606 | |
Board Member
| |
2016
Class III
| | Co-Chief Executive Officer and Co-President (since March 2016), formerly, Senior Executive Vice President of Nuveen Investments, Inc; Co-Chief Executive Officer (since 2015), previously, Executive Vice President (2015-2016) of Nuveen Securities, LLC; Co-President (since October 2016), formerly Senior Executive Vice President of Nuveen Fund Advisors, LLC (Executive Vice President since 2011); formerly, Managing Director of Nuveen Commodities Asset Management, LLC (2011-2016); Chartered Financial Analyst. | |
184
|
| | Name, | | Position(s) Held | | Year First | | Principal | | Number |
| | Year of Birth | | with the Funds | | Elected or | | Occupation(s) | | of Portfolios |
| | & Address | | | | Appointed(4) | | During Past 5 Years | | in Fund Complex |
| | | | | | | | | | Overseen |
| | | | | | | | | | by Officer |
| | | | | | | | | | |
| Officers of the Funds: |
| | | | | | | | | | |
| ■ | CEDRIC H. ANTOSIEWICZ
1962
333 W. Wacker Drive
Chicago, IL 60606 | |
Chief
Administrative
Officer
| |
2007 | | Managing Director of Nuveen Securities, LLC. (since 2004); Managing Director of Nuveen Fund Advisors, LLC (since 2014); Managing Director (since 2010) of Nuveen Investments Holdings, Inc. | |
74 |
| | | | | | | | | | |
| ■ | LORNA C. FERGUSON
1945
333 W. Wacker Drive
Chicago, IL 60606 | |
Vice President
| |
1998
| | Managing Director (since 2004) of Nuveen Investments Holdings, Inc. | |
185
|
| | Name, | | Position(s) Held | | Year First | | Principal | | Number |
| | Year of Birth | | with the Funds | | Elected or | | Occupation(s) | | of Portfolios |
| | & Address | | | | Appointed(4) | | During Past 5 Years | | in Fund Complex |
| | | | | | | | | | Overseen |
| | | | | | | | | | by Officer |
| | | | | | | | | | |
| Officers of the Funds (continued): |
| | | | | | | | | | |
| ■ | STEPHEN D. FOY
1954
333 W. Wacker Drive
Chicago, IL 60606 | |
Vice President
and Controller
| |
1998
| | Managing Director (since 2014), formerly, Senior Vice President (2013-2014) and Vice President (2005-2013) of Nuveen Fund Advisors, LLC; Chief Financial Officer of Nuveen Commodities Asset Management, LLC (since 2010); Managing Director (since 2016) of Nuveen Securities, LLC; Certified Public Accountant. | |
185
|
| | | | | | | | | | |
| ■ | NATHANIEL T. JONES
1979
333 W. Wacker Drive
Chicago, IL 60606 | |
Vice President
and Treasurer
| |
2016
| | Senior Vice President (since 2016), formerly, Vice President (2011-2016) of Nuveen Investments Holdings, Inc.; Chartered Financial Analyst. | |
185
|
| | | | | | | | | | |
| ■ | WALTER M. KELLY
1970
333 W. Wacker Drive
Chicago, IL 60606 | |
Chief Compliance
Officer and
Vice President
| |
2003
| | Senior Vice President (since 2008) of Nuveen Investment Holdings, Inc. | |
185
|
| | | | | | | | | | |
| ■ | DAVID J. LAMB
1963
333 W. Wacker Drive
Chicago, IL 60606 | |
Vice President
| |
2015
| | Senior Vice President of Nuveen Investments Holdings, Inc. (since 2006), Vice President prior to 2006. | |
74
|
| | | | | | | | | | |
| ■ | TINA M. LAZAR
1961
333 W. Wacker Drive
Chicago, IL 60606 | |
Vice President
| |
2002
| | Senior Vice President of Nuveen Investments Holdings, Inc. and Nuveen Securities, LLC. | |
185
|
| | | | | | | | | | |
| ■ | KEVIN J. MCCARTHY
1966
333 W. Wacker Drive
Chicago, IL 60606 | |
Vice President
and Assistant
Secretary
| |
2007
| | Executive Vice President, Secretary and General Counsel (since March 2016), formerly, Managing Director and Assistant Secretary of Nuveen Investments, Inc.; Executive Vice President (since March 2016), formerly, Managing Director, and Assistant Secretary (since 2008) of Nuveen Securities, LLC; Executive Vice President and Secretary (since March 2016), formerly, Managing Director (2008-2016) and Assistant Secretary (2007-2016), and Co-General Counsel (since 2011) of Nuveen Fund Advisors, LLC; Executive Vice President and Secretary (since March 2016), formerly, Managing Director, Assistant Secretary (2011-2016), and Associate General Counsel (since 2011) of Nuveen Asset Management, LLC; Executive Vice President and Secretary of Nuveen Investments Advisers, LLC; Vice President (since 2007) and Secretary (since March 2016) of NWQ Investment Management Company, LLC, Symphony Asset Management LLC, Santa Barbara Asset Management, LLC, Winslow Capital Management, LLC (since 2010) and Tradewinds Global Investors, LLC (since 2016); Vice President (since 2010) and Secretary (since 2016), formerly, Assistant Secretary of Nuveen Commodities Asset Management, LLC. | |
185
|
| | | | | | | | | | |
| ■ | KATHLEEN L. PRUDHOMME
1953
901 Marquette Avenue
Minneapolis, MN 55402 | |
Vice President and
Assistant Secretary
| |
2011
| | Managing Director, Assistant Secretary and Co-General Counsel (since 2011) of Nuveen Fund Advisors, LLC; Managing Director, Assistant Secretary and Associate General Counsel (since 2011) of Nuveen Asset Management, LLC; Managing Director and Assistant Secretary (since 2011) of Nuveen Securities, LLC; formerly, Deputy General Counsel, FAF Advisors, Inc. (2004-2010). | |
185
|
Board Members & Officers (Unaudited) (continued)
| | Name, | | Position(s) Held | | Year First | | Principal | | Number |
| | Year of Birth | | with the Funds | | Elected or | | Occupation(s) | | of Portfolios |
| | & Address | | | | Appointed(4) | | During Past 5 Years | | in Fund Complex |
| | | | | | | | | | Overseen |
| | | | | | | | | | by Officer |
| | | | | | | | | | |
| Officers of the Funds (continued): |
| | | | | | | | | | |
| ■ | CHRISTOPHER M. ROHRBACHER
1971
333 West Wacker Drive
Chicago, IL 60606 | |
Vice President and
Assistant Secretary
| |
2008 | | Senior Vice President (since 2011) formerly, Vice President (2008-2011) and Assistant General Counsel (since 2008) of Nuveen Investments Holdings, Inc.; Senior Vice President and Assistant Secretary (since October 2016) of Nuveen Fund Advisors, LLC; Vice President and Assistant Secretary (since 2010) of Nuveen Commodities Asset Management, LLC. | |
185 |
| | | | | | | | | | |
| ■ | JOEL T. SLAGER
1978
333 W. Wacker Drive
Chicago, IL 60606 | |
Vice President and
Assistant Secretary
| |
2013
| | Fund Tax Director for Nuveen Funds (since 2013); previously, Vice President of Morgan Stanley Investment Management, Inc., Assistant Treasurer of the Morgan Stanley Funds (from 2010 to 2013). | |
185
|
| | | | | | | | | | |
| ■ | GIFFORD R. ZIMMERMAN
1956
333 W. Wacker Drive
Chicago, IL 60606 | |
Vice President
and Secretary
| |
1988
| | Managing Director (since 2002), and Assistant Secretary of Nuveen Securities, LLC; Managing Director (since 2004) and Assistant Secretary (since 1994) of Nuveen Investments, Inc.; Managing Director (since 2002), Assistant Secretary (since 1997) and Co-General Counsel (since 2011) of Nuveen Fund Advisors, LLC; Managing Director, Assistant Secretary and Associate General Counsel of Nuveen Asset Management, LLC (since 2011); Managing Director and Assistant Secretary of Nuveen Investments Advisers, LLC (since 2002) and Symphony Asset Management LLC (since 2003); Vice President and Assistant Secretary of NWQ Investment Management Company, LLC (since 2002), Santa Barbara Asset Management, LLC (since 2006), and of Winslow Capital Management, LLC, (since 2010); Vice President and Assistant Secretary (since 2013), formerly, Chief Administrative Officer and Chief Compliance Officer (2006-2013) of Nuveen Commodities Asset Management, LLC; Chartered Financial Analyst. | |
185
|
| (1) | The Board of Trustees is divided into three classes, Class I, Class II, and Class III, with each being elected to serve until the third succeeding annual shareholders' meeting subsequent to its election or thereafter in each case when its respective successors are duly elected or appointed, except two board members are elected by the holders of Preferred Shares, when applicable, to serve until the next annual shareholders' meeting subsequent to its election or thereafter in each case when its respective successors are duly elected or appointed. The year first elected or appointed represents the year in which the board member was first elected or appointed to any fund in the Nuveen Complex. |
| (2) | On June 22, 2016, Ms. Cook and Mr. Moschner were appointed as Board members, effective July 1, 2016. |
| (3) | "Interested person" as defined in the 1940 Act, by reason of his position with Nuveen Investments, Inc. and certain of its subsidiaries, which are affiliates of the Nuveen Funds. |
| (4) | Officers serve one year terms through August of each year. The year first elected or appointed represents the year in which the Officer was first elected or appointed to any fund in the Nuveen Complex. |
Notes
Notes
Notes
Nuveen:
Serving Investors for Generations
Since 1898, financial advisors and their clients have relied on Nuveen to provide dependable investment solutions through continued adherence to proven, long-term investing principles. Today, we offer a range of high quality equity and fixed-income solutions designed to be integral components of a well-diversified core portfolio.
Focused on meeting investor needs.
Nuveen helps secure the long-term goals of individual investors and the advisors who serve them. As an operating division of TIAA Global Asset Management, Nuveen provides access to investment expertise from leading asset managers and solutions across traditional and alternative asset classes. Built on more than a century of industry leadership, Nuveen's teams of experts align with clients' specific financial needs and goals, demonstrating commitment to advisors and investors through market perspectives and wealth management and portfolio advisory services. Nuveen manages $244 billion in assets as of September 30, 2016.
Find out how we can help you.
To learn more about how the products and services of Nuveen may be able to help you meet your financial goals, talk to your financial advisor, or call us at (800) 257-8787. Please read the information provided carefully before you invest. Investors should consider the investment objective and policies, risk considerations, charges and expenses of any investment carefully. Where applicable, be sure to obtain a prospectus, which contains this and other relevant information. To obtain a prospectus, please contact your securities representative or Nuveen, 333 W. Wacker Dr., Chicago, IL 60606. Please read the prospectus carefully before you invest or send money.
Learn more about Nuveen Funds at: www.nuveen.com/cef
Distributed by Nuveen Investments, LLC | 333 West Wacker Drive | Chicago, IL 60606 | www.nuveen.com | |
EAN-A-1016D 21461-INV-Y-12/17
ITEM 2. CODE OF ETHICS.
As of the end of the period covered by this report, the registrant has adopted a code of ethics that applies to the registrant’s principal executive officer, principal financial officer, principal accounting officer or controller, or persons performing similar functions. There were no amendments to or waivers from the Code during the period covered by this report. The registrant has posted the code of ethics on its website at www.nuveen.com/CEF/Shareholder/FundGovernance.aspx. (To view the code, click on Code of Conduct.)
ITEM 3. AUDIT COMMITTEE FINANCIAL EXPERT.
ITEM 4. PRINCIPAL ACCOUNTANT FEES AND SERVICES.
SERVICES THAT THE FUND’S AUDITOR BILLED TO THE ADVISER AND AFFILIATED FUND SERVICE PROVIDERS
Audit Committee Pre-Approval Policies and Procedures. Generally, the Audit Committee must approve (i) all non-audit services to be performed for the Fund by the Fund’s independent accountants and (ii) all audit and non-audit services to be performed by the Fund’s independent accountants for the Affiliated Fund Service Providers with respect to operations and financial reporting of the Fund. Regarding tax and research projects conducted by the independent accountants for the Fund and Affiliated Fund Service Providers (with respect to operations and financial reports of the Fund) such engagements will be (i) pre-approved by the Audit Committee if they are expected to be for amounts greater than $10,000; (ii) reported to the Audit Committee chairman for his verbal approval prior to engagement if they are expected to be for amounts under $10,000 but greater than $5,000; and (iii) reported to the Audit Committee at the next Audit Committee meeting if they are expected to be for an amount under $5,000.
ITEM 6. SCHEDULE OF INVESTMENTS.
a) See Portfolio of Investments in Item 1.
b) Not applicable.
ITEM 7. DISCLOSURE OF PROXY VOTING POLICIES AND PROCEDURES FOR CLOSED-END MANAGEMENT INVESTMENT COMPANIES.
Not applicable.
ITEM 10. SUBMISSION OF MATTERS TO A VOTE OF SECURITY HOLDERS.
There have been no material changes to the procedures by which shareholders may recommend nominees to the registrant’s Board implemented after the registrant last provided disclosure in response to this Item.
ITEM 11. CONTROLS AND PROCEDURES.
ITEM 12. EXHIBITS.
File the exhibits listed below as part of this Form.
Pursuant to the requirements of the Securities Exchange Act of 1934 and the Investment Company Act of 1940, the registrant has duly caused this report to be signed on its behalf by the undersigned, thereunto duly authorized.
Pursuant to the requirements of the Securities Exchange Act of 1934 and the Investment Company Act of 1940, this report has been signed below by the following persons on behalf of the registrant and in the capacities and on the dates indicated.
Stephen D. Foy