Life is Complex.
Nuveen makes things e-simple.
It only takes a minute to sign up for e-Reports. Once enrolled, you’ll receive an e-mail as soon as your Nuveen Fund information is ready—no more waiting for delivery by regular mail. Just click on the link within the e-mail to see the report and save it on your computer if you wish.
Free e-Reports
right to your e-mail!
www.investordelivery.com
If you receive your Nuveen Fund
dividends and statements from your
financial advisor or brokerage account.
or
www.nuveen.com/client-access
If you receive your Nuveen Fund
dividends and statements directly from
Nuveen.
NOT FDIC INSURED MAY LOSE
VALUE NO BANK GUARANTEE
Table of Contents
| | |
Chair’s Letter to Shareholders | 4 |
| | |
Portfolio Managers’ Comments | 5 |
| | |
Fund Leverage | 10 |
| | |
Common Share Information | 11 |
| | |
Risk Considerations | 14 |
| | |
Performance Overview and Holding Summaries | 15 |
| | |
Shareholder Meeting Report | 23 |
| | |
Report of Independent Registered Public Accounting Firm | 24 |
| | |
Portfolios of Investments | 25 |
| | |
Statement of Assets and Liabilities | 72 |
| | |
Statement of Operations | 73 |
| | |
Statement of Changes in Net Assets | 74 |
| | |
Statement of Cash Flows | 76 |
| | |
Financial Highlights | 78 |
| | |
Notes to Financial Statements | 82 |
| | |
Additional Fund Information | 93 |
| | |
Glossary of Terms Used in this Report | 94 |
| | |
Reinvest Automatically, Easily and Conveniently | 96 |
| | |
Annual Investment Management Agreement Approval Process | 97 |
| | |
Board Members & Officers | 105 |
3
Chair’s Letter
to Shareholders
Dear Shareholders,
Financial markets have been receiving mixed messages over the past year. The global economy has bifurcated, split between a slumping manufacturing sector and a resilient consumer. Confidence has been weakened among corporate managements, who are wary of trade frictions and moderating global growth, but has remained elevated among consumers, who have benefited from tight labor markets and growing wages. As the economic cycle advances toward its later stage, corporate profits are shrinking and earnings forecasts are being downgraded. A waning growth outlook has held interest rates near historically low levels, while stock market indexes have overcome periodic volatility to touch historical highs.
While we continue to anticipate slower economic growth and increased market volatility, we note that recession fears have receded from earlier in the year. The U.S. economy held steady in the third quarter, and nearer-term economic indicators have provided upside surprises. Consumer confidence remains underpinned by low unemployment and modest wage growth. Looser financial conditions, in part driven by the Federal Reserve’s three interest rate cuts in 2019, have revived momentum in the housing market and should continue to encourage borrowing by consumers and businesses. Outside the U.S., Germany avoided a recession in the second half of 2019 and other eurozone economic indicators are pointing to stabilization and improving sentiment. Consumers in Europe and Japan, like those in the U.S., have remained supported by jobs growth and rising wages. Although the outcomes of trade, Brexit and other geopolitical concerns continue to be uncertain, some clarity on these issues could be a potential source of upside.
At Nuveen, we still see investment opportunities in the maturing economic environment, but we are taking a selective approach. If you’re concerned about where the markets are headed from here, we encourage you to work with your financial advisor to review your time horizon, risk tolerance and investment goals. On behalf of the other members of the Nuveen Fund Board, we look forward to continuing to earn your trust in the months and years ahead.
Sincerely,
Terence J. Toth
Chair of the Board
December 23, 2019
4
Portfolio Managers’ Comments
Nuveen Municipal Value Fund, Inc. (NUV)
Nuveen AMT-Free Municipal Value Fund (NUW)
Nuveen Municipal Income Fund, Inc. (NMI)
Nuveen Enhanced Municipal Value Fund (NEV)
These Funds feature portfolio management by Nuveen Asset Management, LLC (NAM), an affiliate of Nuveen, LLC. Portfolio managers Daniel J. Close, CFA, Christopher L. Drahn, CFA, and Steven M. Hlavin discuss U.S. economic and municipal market conditions, key investment strategies and the twelve-month performance of these four national Funds. Dan has managed NUV and NUW since 2016. Chris assumed portfolio management responsibility for NMI in 2011. Steve has been involved in the management of NEV since its inception in 2009, taking on full portfolio management responsibility in 2010.
What factors affected the U.S. economy and the national municipal market during the twelve-month reporting period ended October 31, 2019?
The U.S. economy reached the tenth year of expansion since the previous recession ended in June 2009, marking the longest expansion in U.S. history. In the third quarter of 2019, gross domestic product (GDP) grew at an annualized rate of 2.1%, according to the “second” estimate by the Bureau of Economic Analysis. GDP measures the value of goods and services produced by the nation’s economy less the value of the goods and services used up in production, adjusted for price changes. Growth in consumer spending and the housing sector helped offset a decline in business investment during the July to September 2019 period. By comparison, annualized GDP growth was 2.0% in the second quarter and 3.1% in the first quarter.
Consumer spending, the largest driver of the economy, remained well supported by low unemployment, wage gains and tax cuts. As reported by the Bureau of Labor Statistics, the unemployment rate fell to 3.6% in October 2019 from 3.8% in October 2018 and job gains averaged around 174,000 per month for the past twelve months. As the jobs market has tightened, average hourly earnings grew at an annualized rate of 3.0% in October 2019. However, falling energy prices dampened inflation over the past twelve months. The Bureau of Labor Statistics said the Consumer Price Index (CPI) increased 1.8% over the twelve-month reporting period ended October 31, 2019 before seasonal adjustment.
This material is not intended to be a recommendation or investment advice, does not constitute a solicitation to buy, sell or hold a security or an investment strategy and is not provided in a fiduciary capacity. The information provided does not take into account the specific objectives or circumstances of any particular investor, or suggest any specific course of action. Investment decisions should be made based on an investor’s objectives and circumstances and in consultation with his or her advisors.Certain statements in this report are forward-looking statements. Discussions of specific investments are for illustration only and are not intended as recommendations of individual investments. The forward-looking statements and other views expressed herein are those of the portfolio managers as of the date of this report. Actual future results or occurrences may differ significantly from those anticipated in any forward-looking statements, and the views expressed herein are subject to change at any time, due to numerous market and other factors. The Funds disclaim any obligation to update publicly or revise any forward-looking statements or views expressed herein.
For financial reporting purposes, the ratings disclosed are the highest rating given by one of the following national rating agencies: Standard & Poor’s Group (S&P), Moody’s Investors Service, Inc. (Moody’s) or Fitch, Inc. (Fitch). This treatment of split-rated securities may differ from that used for other purposes, such as for Fund investment policies. Credit ratings are subject to change. AAA, AA, A and BBB are investment grade ratings, while BB, B, CCC, CC, C and D are below investment grade ratings. Holdings designated N/R are not rated by these national rating agencies.
Bond insurance guarantees only the payment of principal and interest on the bond when due, and not the value of the bonds themselves, which will fluctuate with the bond market and the financial success of the issuer and the insurer. Insurance relates specifically to the bonds in the portfolio and not to the share prices of a Fund. No representation is made as to the insurers’ ability to meet their commitments.
Refer to the Glossary of Terms Used in this Report for further definition of the terms used within this section.
5
Portfolio Managers’ Comments (continued)
Low mortgage rates and low inventory drove home prices moderately higher in this reporting period, despite declining new home sales and housing starts. The S&P CoreLogic Case-Shiller U.S. National Home Price Index, which covers all nine U.S. census divisions, was up 3.2% year-over-year in September 2019 (most recent data available at the time this report was prepared). The 10-City and 20-City Composites reported year-over-year increases of 1.5% and 2.1%, respectively.
As data pointed to slower momentum in the overall economy, the Federal Reserve (Fed) notably shifted its stance. Although the Fed had indicated in December 2018 that there could be two more rate hikes in 2019, global growth concerns kept the central bank on the sidelines. As expected by the markets, the Fed left rates unchanged throughout the first half of 2019 while speculation increased that the Fed’s next move would be a rate cut. At the July 2019, September 2019 and October 2019 policy committee meetings, the Fed announced a 0.25% cut to its main policy rate. Markets registered disappointment with the Fed’s explanation that the rate cuts were a “mid-cycle adjustment,” rather than a prolonged easing period, and its signal that there would be no additional rate cuts in 2019. Also in the latter half of 2019, the Fed announced it would stop shrinking its bond portfolio sooner than scheduled, as well as began buying short-term Treasury bills to help money markets operate smoothly and maintain short-term borrowing rates at low levels. Fed Chairman Powell emphasized that the Treasury bill purchases were not a form of quantitative easing.
During the twelve-month reporting period, geopolitical news remained a prominent market driver. Tariff and trade policy topped the list of concerns, most prominently the U.S.-China relations. After several rounds of talks and a series of tariff increases, President Trump and President Xi agreed to another temporary trade truce in late June 2019 that halted additional tariff increases. Tensions increased markedly after the July 2019 negotiations ended without an agreement, with both China and the U.S. increasing import duties. After setting new trade meetings in September and October 2019, tariff waivers were announced on a selected group of U.S. and Chinese goods and the two sides signaled progress toward a partial trade deal. The U.S., Mexico and Canada Agreement (USMCA) trade deal replacing the North American Free Trade Agreement had yet to be ratified by the national congresses (subsequent to the close of the reporting period, the trade deal was passed by the House of Representatives), while President Trump rescinded the threat to impose tariffs on Mexico if the country didn’t take more action to curb illegal immigration. With the U.S. House of Representatives opening an impeachment inquiry into President Trump, ratification of the USMCA deal was expected to be delayed. The Trump administration delayed imposing auto tariffs on the European Union (EU), as it continued to focus more on the China trade negotiations, but duties on $7.5 billion worth of EU goods including wine and cheese went into effect in October 2019 in retaliation for a dispute over aircraft subsidies. Global manufacturing and export data continued to show evidence of trade-related slumps, which increased worries that the slowdown would spread into other segments of the global economy.
In the U.K., Prime Minister Theresa May was unable to secure a Brexit deal before the original March 29, 2019 deadline and resigned as of June 7, 2019. The EU extended the deadline to October 31, 2019, which Prime Minister May’s successor, Boris Johnson, was unable to meet after a series of political maneuvers failed to secure an approval for his exit plan. In October 2019, the EU approved a “flextension” to January 31, 2020 and a U.K. general election was scheduled for December (subsequent to the close of the reporting period, on December 19, 2019, the British Parliament passed the Brexit Bill). In Italy, investors worried about another potential budget clash between the eurosceptic coalition government and the EU. However, following the unexpected resignation of the prime minister in August 2019, the newly formed coalition government appeared to take a less antagonistic stance. Europe also contended with the “yellow vest” protests in France, immigration policy concerns, Russian sanctions and political risk in Turkey.
Elections around the world also remained a source of uncertainty. Markets continued to closely monitor the new administrations in Brazil and Mexico, as well as Argentina’s presidential election. Incumbent candidate President Macri, seen as market-friendly, suffered a surprising defeat in the August 2019 primary, and the Peronist ticket of Alberto Fernandez/Cristina Fernandez de Kirchner won as expected in the October 2019 election. In the U.K., the possibility of a no-deal Brexit initially increased under new Prime Minister Boris Johnson, but Parliament voted for a bill to prevent that outcome. Europe’s traditional centrist parties lost seats in the Parliamentary elections and populist parties saw marginal gains. The ruling parties in India and South Africa maintained their majorities, where slower economic growth could complicate their respective reform mandates.
6
Municipal bonds delivered strong performance over the twelve-month reporting period. The significant decline in interest rates was the main driver of higher municipal bond prices, with positive technical and fundamental conditions also supporting credit spread tightening. At the start of the reporting period, the prevailing economic outlook was generally positive and the Fed had been increasing its main policy interest rate, driving the 10-year U.S. Treasury yield to a high of 3.24% in November 2018. However, sentiment shifted sharply at the end of 2018, causing a reversal in market conditions. Interest rates declined significantly over the remainder of the reporting period on signs of a weaker macroeconomic environment, more dovish central bank policy, geopolitical tensions (especially regarding trade) and bouts of equity market volatility. The U.S. Treasury yield curve flattened overall, with a portion of the curve temporarily inverting from late August 2019 to late September 2019. The municipal yield curve also flattened overall, particularly from the 2-year to 20-year segment. Despite concerns about the broader economic outlook, credit conditions remained favorable for municipal credits. State tax revenues have increased across the 50 states and a healthy housing market added to local government tax revenues. Defaults in 2019 so far have been mainly confined to idiosyncratic situations.
Municipal bond gross issuance nationwide totaled $378.2 billion in this reporting period, a 6.9% decrease from the issuance for the twelve-month reporting period ended October 31, 2018. Nevertheless, the overall low level of interest rates encouraged issuers to continue to actively refund their outstanding debt. In these transactions the issuers are issuing new bonds and taking the bond proceeds and redeeming (calling) old bonds. These refunding transactions have ranged from 30% to 60% of total issuance over the past few years. Thus, the net issuance (all bonds issued less bonds redeemed) is actually much lower than the gross issuance. So, while gross issuance volume has been adequate, the net has not and this was an overall positive technical factor on municipal bond investment performance in recent years. Although the pace of refundings is slowing, net negative issuance is expected to continue. Notably, taxable municipal bond issuance has increased meaningfully in 2019. The Tax Cut and Jobs Act of 2017 prohibits municipal issuers from issuing new tax-exempt bonds to pre-refund existing tax-exempt bonds. However, municipalities have taken advantage of the low interest rate environment and the strong demand for yield to issue taxable municipal debt, enabling them to save on net interest costs.
Demand for municipal bonds has been robust. Cash flows into municipal bond funds have been consistently positive year-to-date in 2019. Low interest rates in the U.S. and globally have continued to drive investors toward higher after-tax yielding assets, including U.S. municipal bonds. Additionally, as tax payers have begun to assess the impact of the 2017 tax law, which caps the state and local tax (SALT) deduction for individuals, there has been increased demand for tax-exempt municipal bonds in 2019 to date, especially in states with high income and/or property taxes.
What key strategies were used to manage these Funds during the twelve-month reporting period ended October 31, 2019?
Each Fund’s primary investment objective is to provide current income exempt from regular federal income tax by investing primarily in a portfolio of municipal obligations issued by state and local government authorities or certain U.S. territories.
Municipal bond performance was strongly positive in the reporting period. Municipal yields fell across all maturities and the yield curve flattened, which resulted in the outperformance of longer maturity bonds over shorter maturity bonds. Positive credit conditions and strong demand for higher yielding assets and tax-exempt income helped credit spreads remain stable to improving.
During this time, we continued to take a bottom-up approach to discovering sectors that appeared undervalued as well as individual credits that we believed had the potential to perform well over the long term. Our trading activity continued to focus on pursuing the Funds’ investment objectives.
NUV and NUW were fairly active during the reporting period. Our purchases continued to emphasize longer maturity structures and intermediate to lower investment grade (i.e., single A to BBB) credit quality. We bought credits across nine different sectors, with an emphasis on health care and dedicated tax bonds. One of the dedicated tax purchases was Puerto Rico sales tax revenue bonds
7
Portfolio Managers’ Comments (continued)
known as COFINAs, which were the first major Puerto Rico credit to emerge from the bankruptcy-like restructuring process. Other additions included utilities (both private and public), local general obligation (GO), toll roads and local appropriation bonds. We also took advantage of a tactical opportunity in the marketplace to buy 4% coupon bonds over 5% coupons for the additional yield opportunity and still reasonable defensiveness offered by the 4% coupon structures. Called and maturing bonds provided most of the proceeds to make new purchases. We also sold some lower embedded book yield paper to reinvest in bonds with higher embedded yields. In the second half of the period, both NUV and NUW collapsed a tender option bond (TOB) trust to help shorten the portfolios’ overall durations.
For NMI, we remained comfortable with the Fund’s positioning, maintaining overweight allocations to lower investment grade credits and longer duration structures. NMI continued to be overweight to the single A, BBB and non-rated categories, while maintaining underweight allocations in the highest grade (AAA and AA) paper. Health care and transportation remained NMI’s largest overweights relative to the general municipal market, while state and local general obligation (GO) bonds remained underweighted. An overweight to the pre-refunded sector increased as existing holdings were advance refunded. We added incrementally to the toll road sector during the reporting period. Like NUV and NUW, NMI also tactically added to 4% coupon bonds over 5% coupon bonds for the additional yield opportunity and still reasonable defensiveness offered by the 4% coupon structures. To fund NMI’s new purchases, we frequently used the proceeds from called or maturing bonds.
Trading activity in NEV was relatively muted in this reporting period. New purchases were mostly driven by reinvesting the proceeds from called and maturing bonds. Among the larger calls during the reporting period were Bay Area Toll Authority (BATA), Fred Hutchinson Cancer Research Center in Washington, Whitworth University in Washington and Providence Health in California. We bought credits across a diverse range of issuers and sectors including tobacco (specifically Buckeye Tobacco) credits, Chicago GOs, COFINAs, single family housing bonds in Nebraska and Texas, New York Liberty 3 World Trade Center, Virgin Trains USA and Big River Steel. We also replaced the BATAs with the new issue from the refunding deal.
As of October 31, 2019, NUV, NUW and NEV continued to use inverse floating rate securities. We employ inverse floaters for a variety of reasons, including duration management, income enhancement and total return enhancement. As part of our duration management strategies, during this reporting period NUW shorted interest rate futures contracts to help manage the duration of its portfolio. These contracts had a negative impact on performance during the reporting period.
How did the Funds perform during the twelve-month reporting period ended October 31, 2019?
The tables in each Fund’s Performance Overview and Holding Summaries section of this report provide the Funds’ total returns for the one-year, five-year and ten-year periods ended October 31, 2019. Each Fund’s total returns at net asset value (NAV) are compared with the performance of a corresponding market index.
For the twelve months ended October 31, 2019, the total returns at NAV for NUV, NUW and NEV outperformed the return for the national S&P Municipal Bond Index and NMI trailed the return for the national index.
The factors affecting performance in this reporting period included yield curve and duration positioning, credit ratings allocation and sector allocation. Given differences in the maturity structures of the four Funds’ portfolios, the performance impact of duration and yield curve positioning varied by Fund. In this reporting period, the overall decline in yields and the flattening of the yield curve helped longer duration bonds outperform shorter duration bonds. For NUV and NUW, duration positioning was a large contributor to relative performance. NUV benefited most from its overweight to 10 years and longer duration and underweight to 0- to 4-year durations. NUW was most helped by its overweight to 8 years and longer durations, although the overweight to 0- to 2-year durations was a detractor. NUW’s exposure to short bonds includes bonds bought when the Fund began operations in 2009, when prevailing interest rates were higher. We have continued to hold legacy bonds for their higher embedded yields, which have benefited the Fund’s income earnings, and now many of those bonds have drifted into the 0- to 2-year duration range.
8
Yield curve and duration positioning had an overall neutral impact on performance for NMI. The Fund held a modest overweight in longer duration bonds, which performed well, but this was counterbalanced by lower duration holdings that underperformed. Similar to NUW, the shorter duration bonds held by NMI were bought when prevailing interest rates were higher and offer higher embedded book yields, which has been favorable for NMI’s income distribution capabilities. NEV’s longer duration target was advantageous in this reporting period, but duration positioning was a lesser contributor to relative outperformance than credit selection.
Credit ratings allocations were beneficial to NUV and NUW. The two Funds’ underweights to AAA rated bonds and overweights to single A and BBB rated bonds were favorable to relative performance. NMI’s overweight allocations in the single A, BBB and non-rated categories contributed to relative outperformance due to their price appreciation and their enhanced income relative to the general market. NEV, which holds a higher weighting in high yield bonds compared to the other three Funds, saw a more modest contribution from ratings allocations, as the rally in high yield bonds was smaller than that of higher grade bonds.
Sector positioning added value in NUV and NUW. The Funds’ overweight allocations to the dedicated tax sector outperformed, which helped offset the overweight to the lagging pre-refunded sector. Pre-refunded bonds underperformed the general market in this reporting period due to their shorter durations and higher credit quality. For NMI, strong performance came from overweight allocations in the health care (particularly hospitals) and toll road sectors. However, NMI’s overweight allocation to pre-refunded bonds was a relative drag on performance, but we continue to hold the bonds for their income generation. Sector performance was mixed across NEV’s portfolio. Overweight allocations to the hospital, tobacco and industrial development revenue sectors were positive contributors to performance. Detractors included an underweight to local GOs (a sector that outperformed in this reporting period) and an overweight to appropriation bonds (a sector that underperformed). NEV’s underweight allocation in the utilities sector was somewhat unfavorable on a relative basis because the sector performed well in the broad market, but our security selection in utilities was advantageous as positions in Santee Community Development Commission, Guam Power Authority and prepaid gas bonds strongly outperformed. Additionally, the senior living facilities sector was among the weakest performing segments in this reporting period, and NEV held minimal exposure there.
We continued to add value through individual credit selection. NUV and NUW benefited from their TOB holdings, as well as selections in longer dated, lower rated bonds. The two Funds’ zero coupon bonds performed especially well, given their long durations, whereas their holdings in shorter dated and high quality bonds tended to underperform. In addition, NUV and NUW’s bonds bought between mid-August and early September 2019, when interest rates were at their low for the year, generally lagged. NUW’s duration shortening futures contracts also hurt performance (as detailed in the key strategies discussion of this report). For NEV, credit selection was the largest contributor to performance in this reporting period. Top performers included FirstEnergy Solutions, Loma Linda University Medical Center and Guam Power Authority, as well as zero coupon bonds issued for the Chicago Board of Education, Chicago GOs, Loyola University and the E-470 tollway in Colorado. There were few meaningful detractors for NEV other than Virgin Trains USA, a high-speed passenger rail system in southeastern Florida formerly known as Brightline. Virgin Trains USA reported a slower than expected ramp-up in initial passenger traffic, in part due to hurricane-related impacts, and issued a large bond offering to finance the second phase extending the line to Orlando. After Virgin Trains USA credits’ recent run of strong outperformance, these events contributed to technical selling pressure toward the end of the reporting period.
In addition, the use of leverage was an important factor affecting performance of the Funds. Leverage is discussed in more detail later in the Fund Leverage section of this report.
9
Fund Leverage
IMPACT OF THE FUNDS’ LEVERAGE STRATEGIES ON PERFORMANCE
One important factor impacting the returns of NEV’s common shares relative to its comparative benchmark was the Fund’s use of leverage through investments in inverse floating rate securities, which represent leveraged investments in underlying bonds. This was also a factor, although less significantly, for NUV and NUW because their use of leverage is more modest. NMI did not invest in inverse floating rate securities during the reporting period. The Funds use leverage because our research has shown that, over time, leveraging provides opportunities for additional income. The opportunity arises when short-term rates that the Fund pays on its leveraging instruments are lower than the interest the Fund earns on its portfolio of long-term bonds that it has bought with the proceeds of that leverage. This has been particularly true in the recent market environment where short-term rates have been low by historical standards.
However, use of leverage can expose Fund common shares to additional price volatility. When a Fund uses leverage, the Fund’s common shares will experience a greater increase in their net asset value if the municipal bonds acquired through the use of leverage increase in value, but will also experience a correspondingly larger decline in their net asset value if the bonds acquired through leverage decline in value, which will make the shares’ net asset value more volatile, and total return performance more variable, over time.
In addition, common share income in levered funds will typically decrease in comparison to unlevered funds when short-term interest rates increase and increase when short-term interest rates decrease. In recent quarters, fund leverage expenses have generally tracked the overall movement of short-term tax-exempt interest rates. While fund leverage expenses are somewhat higher than their all-time lows after the 2007-2009 financial crisis, which has contributed to a reduction in common share net income and long-term total return potential, leverage nevertheless continues to provide the opportunity for incremental common share income. Management believes that the potential benefits from leverage continue to outweigh the associated increase in risk and volatility previously described.
The use of leverage through inverse floating rate securities had a positive impact on the total return performance of NUV, NUW and NEV over the reporting period. NMI did not invest in inverse floating rate securities during the reporting period.
As of October 31, 2019, the Funds’ percentages of leverage are as shown in the accompanying table.
| | | | | | | | | | | | | |
| | NUV | | | NUW | | | NMI | | | NEV | |
Effective Leverage* | | | 1.34 | % | | | 1.32 | % | | | 0.00 | % | | | 35.11 | % |
| |
| * Effective Leverage is a Fund’s effective economic leverage, and includes both regulatory leverage and the leverage effects of certain derivative and other investments in a Fund’s portfolio that increase the Fund’s investment exposure. Currently, the leverage effects of Tender Option Bond (TOB) inverse floater holdings are included in effective leverage values. A Fund, however, may from time to time borrow on a typically transient basis in connection with its day-to-day operations, primarily in connection with the need to settle portfolio trades. Such incidental borrowings are excluded from the calculation of a Fund’s effective leverage ratio. |
10
Common Share Information
COMMON SHARE DISTRIBUTION INFORMATION
The following information regarding the Funds’ distributions is current as of October 31, 2019. Each Fund’s distribution levels may vary over time based on each Fund’s investment activity and portfolio investment value changes.
During the current reporting period, each Fund’s distributions to common shareholders were as shown in the accompanying table.
| | | | | | | | | | | | | |
| | | Per Common Share Amounts | |
| Monthly Distributions (Ex-Dividend Date) | | NUV | | | NUW | | | NMI | | | NEV | |
November 2018 | | $ | 0.0310 | | | $ | 0.0560 | | | $ | 0.0360 | | | $ | 0.0565 | |
December | | | 0.0310 | | | | 0.0560 | | | | 0.0360 | | | | 0.0565 | |
January | | | 0.0310 | | | | 0.0560 | | | | 0.0360 | | | | 0.0565 | |
February | | | 0.0310 | | | | 0.0560 | | | | 0.0360 | | | | 0.0565 | |
March | | | 0.0310 | | | | 0.0560 | | | | 0.0360 | | | | 0.0565 | |
April | | | 0.0310 | | | | 0.0560 | | | | 0.0360 | | | | 0.0565 | |
May | | | 0.0310 | | | | 0.0560 | | | | 0.0360 | | | | 0.0565 | |
June | | | 0.0310 | | | | 0.0560 | | | | 0.0360 | | | | 0.0565 | |
July | | | 0.0310 | | | | 0.0560 | | | | 0.0360 | | | | 0.0565 | |
August | | | 0.0310 | | | | 0.0560 | | | | 0.0360 | | | | 0.0565 | |
September | | | 0.0310 | | | | 0.0470 | | | | 0.0360 | | | | 0.0565 | |
October 2019 | | | 0.0310 | | | | 0.0470 | | | | 0.0360 | | | | 0.0565 | |
| Total Distributions from Net Investment Income | | $ | 0.3720 | | | $ | 0.6540 | | | $ | 0.4320 | | | $ | 0.6780 | |
| Total Distributions from Long Term Capital Gains* | | $ | — | | | $ | 0.0965 | | | $ | 0.0719 | | | $ | — | |
| Total Distributions | | $ | 0.3720 | | | $ | 0.7505 | | | $ | 0.5039 | | | $ | 0.6780 | |
| | |
| Yields | | | | | | | | | | | | | | | | |
Market Yield** | | | 3.57 | % | | | 3.35 | % | | | 3.81 | % | | | 4.64 | % |
Taxable-Equivalent Yield** | | | 5.98 | % | | | 5.51 | % | | | 6.34 | % | | | 7.78 | % |
| | |
* | Distribution paid in December 2018. |
** | Market Yield is based on the Fund’s current annualized monthly dividend divided by the Fund’s current market price as of the end of the reporting period. Taxable-Equivalent Yield represents the yield that must be earned on a fully taxable investment in order to equal the yield of the Fund on an after-tax basis. It is based on a federal income tax rate of 40.8%. Your actual federal income tax rate may differ from the assumed rate. The Taxable-Equivalent Yield also takes into account the percentage of the Fund’s income generated and paid by the Fund (based on payments made during the previous calendar year) that was not exempt from federal income tax. Separately, if the comparison were instead to investments that generate qualified dividend income, which is taxable at a rate lower than an individual’s ordinary graduated tax rate, the fund’s Taxable-Equivalent Yield would be lower. |
11
Common Share Information (continued)
Each Fund seeks to pay regular monthly dividends out of its net investment income at a rate that reflects its past and projected net income performance. To permit each Fund to maintain a more stable monthly dividend, the Fund may pay dividends at a rate that may be more or less than the amount of net income actually earned by the Fund during the period. Distributions to common shareholders are determined on a tax basis, which may differ from amounts recorded in the accounting records. In instances where the monthly dividend exceeds the earned net investment income, the Fund would report a negative undistributed net ordinary income. Refer to Note 6 – Income Tax Information for additional information regarding the amounts of undistributed net ordinary income and undistributed net long-term capital gains and the character of the actual distributions paid by the Fund during the period.
All monthly dividends paid by each Fund during the current reporting period were paid from net investment income. If a portion of the Fund’s monthly distributions is sourced or comprised of elements other than net investment income, including capital gains and/or a return of capital, shareholders will be notified of those sources. For financial reporting purposes, the per share amounts of each Fund’s distributions for the reporting period are presented in this report’s Financial Highlights. For income tax purposes, distribution information for each Fund as of its most recent tax year end is presented in Note 6 – Income Tax Information within the Notes to Financial Statements of this report.
CHANGE IN METHOD OF PUBLISHING NUVEEN CLOSED-END FUND DISTRIBUTION AMOUNTS
Beginning on or about November 1, 2019, the Nuveen Closed-End Funds will be discontinuing the practice of announcing Fund distribution amounts and timing via press release. Instead, information about the Nuveen Closed-End Funds’ monthly and quarterly periodic distributions to shareholders will be posted and can be found on Nuveen’s enhanced closed-end fund resource page, which is at www.nuveen.com/closed-end-fund-distributions, along with other Nuveen closed-end fund product updates. Shareholders can expect regular distribution information to be posted on www.nuveen.com on the first business day of each month. To ensure that our shareholders have timely access to the latest information, a subscribe function can be activated at this link here, or at this web page (www.nuveen.com/en-us/people/about-nuveen/for-the-media).
COMMON SHARE EQUITY SHELF PROGRAM
During the current reporting period, NUW and NMI were authorized by the Securities and Exchange Commission to issue additional common shares through an equity shelf program (Shelf Offering). Under these programs, NUW and NMI, subject to market conditions, may raise additional capital from time to time in varying amounts and offering methods at a net price at or above each Fund’s NAV per common share. The total amount of common shares authorized under these Shelf Offerings are shown in the accompanying table:
| | | |
| NUW | NMI |
Additional authorized common shares | 1,500,000 | 800,000 |
During the current reporting period, NUW and NMI sold common shares through their Shelf Offerings at a weighted average premium to the NAV per common share as shown in the accompanying table.
| | | | | | | |
| | NUW | | | NMI | |
Common shares sold through shelf offering | | | 109,938 | | | | 72,629 | |
Weighted average premium to NAV per common share sold | | | 5.25 | % | | | 1.40 | % |
Refer to the Notes to Financial Statements, Note 5 – Fund Shares, Common Share Equity Shelf Programs and Offering Costs for further details on Shelf Offerings and each Fund’s transactions.
12
COMMON SHARE REPURCHASES
During August 2019, the Funds’ Board of Directors/Trustees reauthorized an open-market share repurchase program, allowing each Fund to repurchase an aggregate of up to approximately 10% of its outstanding shares.
As of October 31, 2019, and since the inception of the Funds’ repurchase programs, the Funds have cumulatively repurchased and retired their outstanding shares as shown in the accompanying table.
| | | | | | | | | | | | | |
| | NUV | | | NUW | | | NMI | | | NEV | |
Common shares cumulatively repurchased and retired | | | — | | | | — | | | | — | | | | — | |
Common shares authorized for repurchase | | | 20,690,000 | | | | 1,550,000 | | | | 875,000 | | | | 2,495,000 | |
During the current reporting period, the Funds did not repurchase any of their outstanding common shares.
OTHER COMMON SHARE INFORMATION
As of October 31, 2019, and during the current reporting period, the Funds’ common share prices were trading at a premium/(discount) to their common share NAVs as shown in the accompanying table.
| | | | | | | | | | | | | |
| | NUV | | | NUW | | | NMI | | | NEV | |
Common share NAV | | $ | 10.57 | | | $ | 16.90 | | | $ | 11.32 | | | $ | 15.23 | |
Common share price | | $ | 10.43 | | | $ | 16.83 | | | $ | 11.33 | | | $ | 14.60 | |
Premium/(Discount) to NAV | | | (1.32 | )% | | | (0.41 | )% | | | 0.09 | % | | | (4.14 | )% |
12-month average premium/(discount) to NAV | | | (3.59 | )% | | | (1.42 | )% | | | (1.89 | )% | | | (6.20 | )% |
13
Risk Considerations
Fund shares are not guaranteed or endorsed by any bank or other insured depository institution, and are not federally insured by the Federal Deposit Insurance Corporation.
Nuveen Municipal Value Fund, Inc. (NUV)
Investing in closed-end funds involves risk; principal loss is possible. There is no guarantee the Fund’s investment objectives will be achieved. Closed-end fund shares may frequently trade at a discount or premium to their net asset value. Debt or fixed income securities such as those held by the Fund, are subject to market risk, credit risk, interest rate risk, derivatives risk, liquidity risk, and income risk. As interest rates rise, bond prices fall. These and other risk considerations such as tax risk are described in more detail on the Fund’s web page at www.nuveen.com/NUV.
Nuveen AMT-Free Municipal Value Fund (NUW)
Investing in closed-end funds involves risk; principal loss is possible. There is no guarantee the Fund’s investment objectives will be achieved. Closed-end fund shares may frequently trade at a discount or premium to their net asset value. Debt or fixed income securities such as those held by the Fund, are subject to market risk, credit risk, interest rate risk, derivatives risk, liquidity risk, and income risk. As interest rates rise, bond prices fall. These and other risk considerations such as tax risk are described in more detail on the Fund’s web page at www.nuveen.com/NUW.
Nuveen Municipal Income Fund, Inc. (NMI)
Investing in closed-end funds involves risk; principal loss is possible. There is no guarantee the Fund’s investment objectives will be achieved. Closed-end fund shares may frequently trade at a discount or premium to their net asset value. Debt or fixed income securities such as those held by the Fund, are subject to market risk, credit risk, interest rate risk, derivatives risk, liquidity risk, and income risk. As interest rates rise, bond prices fall. These and other risk considerations such as tax risk are described in more detail on the Fund’s web page at www.nuveen.com/NMI.
Nuveen Enhanced Municipal Value Fund (NEV)
Investing in closed-end funds involves risk; principal loss is possible. There is no guarantee the Fund’s investment objectives will be achieved. Closed-end fund shares may frequently trade at a discount or premium to their net asset value. Debt or fixed income securities such as those held by the Fund, are subject to market risk, credit risk, interest rate risk, derivatives risk, liquidity risk, and income risk. As interest rates rise, bond prices fall. Leverage increases return volatility and magnifies the Fund’s potential return and its risks; there is no guarantee a fund’s leverage strategy will be successful. The Fund uses only inverse floaters for its leverage, increasing its exposure to interest rate risk and credit risk, including counter-party credit risk. These and other risk considerations such as tax risk are described in more detail on the Fund’s web page at www.nuveen.com/NEV.
Investment Policy Update
While there are no such limits imposed by applicable regulations, certain Nuveen Closed-End Funds formerly had investment policies that placed limits on a Fund’s ability to invest in illiquid securities. All exchange-listed Nuveen Closed-End Funds now have no formal limit on their ability to invest in such illiquid securities, but each Fund’s portfolio management team will monitor such investments in the regular, overall management of the Fund’s portfolio securities.
14
| | |
| NUV | Nuveen Municipal Value Fund, Inc. |
| Performance Overview and Holding Summaries as of October 31, 2019 |
| | | | |
Refer to the Glossary of Terms Used in this Report for further definition of the terms used within this section. |
| |
| Average Annual Total Returns as of October 31, 2019 |
|
| Average Annual |
| 1-Year | 5-Year | 10-Year |
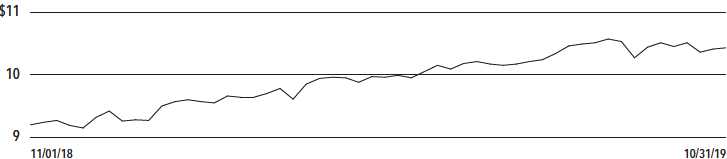
NUV at Common Share NAV | 11.35% | 4.60% | 5.53% |
NUV at Common Share Price | 17.92% | 5.65% | 5.05% |
S&P Municipal Bond Index | 9.07% | 3.55% | 4.49% |
Past performance is not predictive of future results. Current performance may be higher or lower than the data shown. Returns do not reflect the deduction of taxes that shareholders may have to pay on Fund distributions or upon the sale of Fund shares. Returns at NAV are net of Fund expenses, and assume reinvestment of distributions. Comparative index return information is provided for the Fund’s shares at NAV only. Indexes are not available for direct investment.
Common Share Price Performance — Weekly Closing Price
15
| | |
| NUV | Performance Overview and Holding Summaries as of October 31, 2019 (continued) |
This data relates to the securities held in the Fund’s portfolio of investments as of the end of the reporting period. It should not be construed as a measure of performance for the Fund itself. Holdings are subject to change.
For financial reporting purposes, the ratings disclosed are the highest rating given by one of the following national rating agencies: Standard & Poor’s Group, Moody’s Investors Service, Inc. or Fitch, Inc. This treatment of split-rated securities may differ from that used for other purposes, such as for Fund investment policies. Credit ratings are subject to change. AAA, AA, A and BBB are investment grade ratings; BB, B, CCC, CC, C and D are below-investment grade ratings. Holdings designated N/R are not rated by these national rating agencies.
| | |
| Fund Allocation | |
| (% of net assets) | |
Long-Term Municipal Bonds | 100.0% |
Short-Term Municipal Bonds | 0.4% |
Other Assets Less Liabilities | 1.0% |
| Net Assets Plus Floating Rate | |
| Obligations | 101.4% |
Floating Rate Obligations | (1.4)% |
| Net Assets | 100% |
| | |
| Portfolio Credit Quality | |
| (% of total investment exposure) | |
U.S. Guaranteed | 7.5% |
AAA | 6.2% |
AA | 33.3% |
A | 26.1% |
BBB | 17.6% |
BB or Lower | 5.1% |
N/R (not rated) | 4.2% |
| Total | 100% |
| | |
| Portfolio Composition | |
| (% of total investments) | |
Tax Obligation/Limited | 24.7% |
Transportation | 21.6% |
Tax Obligation/General | 12.5% |
Health Care | 10.3% |
Utilities | 8.4% |
U.S. Guaranteed | 7.9% |
Other | 14.6% |
| Total | 100% |
| | |
| States and Territories | |
| (% of total municipal bonds) | |
Texas | 15.2% |
Illinois | 12.5% |
California | 8.8% |
Colorado | 7.0% |
New York | 5.2% |
Florida | 4.8% |
New Jersey | 4.0% |
Ohio | 3.8% |
Washington | 3.2% |
Nevada | 3.1% |
Michigan | 2.7% |
Indiana | 2.3% |
Virginia | 2.3% |
Georgia | 2.3% |
South Carolina | 1.7% |
Wisconsin | 1.7% |
Other | 19.4% |
| Total | 100% |
16
| | |
| NUW | Nuveen AMT-Free Municipal Value Fund |
| Performance Overview and Holding Summaries as of October 31, 2019 |
| | | | |
Refer to the Glossary of Terms Used in this Report for further definition of the terms used within this section. |
| |
| Average Annual Total Returns as of October 31, 2019 |
|
| Average Annual |
| 1-Year | 5-Year | 10-Year |
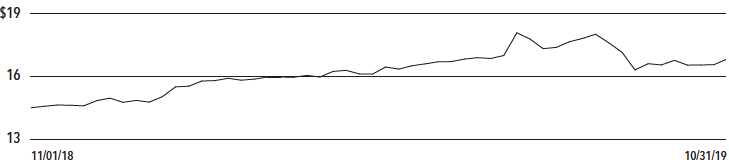
NUW at Common Share NAV | 11.38% | 4.43% | 5.53% |
NUW at Common Share Price | 22.81% | 4.78% | 5.80% |
S&P Municipal Bond Index | 9.07% | 3.55% | 4.49% |
Past performance is not predictive of future results. Current performance may be higher or lower than the data shown. Returns do not reflect the deduction of taxes that shareholders may have to pay on Fund distributions or upon the sale of Fund shares. Returns at NAV are net of Fund expenses, and assume reinvestment of distributions. Comparative index return information is provided for the Fund’s shares at NAV only. Indexes are not available for direct investment.
Common Share Price Performance — Weekly Closing Price
17
| | |
| NUW | Performance Overview and Holding Summaries as of October 31, 2019 (continued) |
This data relates to the securities held in the Fund’s portfolio of investments as of the end of the reporting period. It should not be construed as a measure of performance for the Fund itself. Holdings are subject to change.
For financial reporting purposes, the ratings disclosed are the highest rating given by one of the following national rating agencies: Standard & Poor’s Group, Moody’s Investors Service, Inc. or Fitch, Inc. This treatment of split-rated securities may differ from that used for other purposes, such as for Fund investment policies. Credit ratings are subject to change. AAA, AA, A and BBB are investment grade ratings; BB, B, CCC, CC, C and D are below-investment grade ratings. Holdings designated N/R are not rated by these national rating agencies.
| | |
| Fund Allocation | |
| (% of net assets) | |
Long-Term Municipal Bonds | 99.3% |
Other Assets Less Liabilities | 1.5% |
| Net Assets Plus Floating Rate | |
| Obligations | 100.8% |
Floating Rate Obligations | (0.8)% |
| Net Assets | 100% |
| | |
| Portfolio Credit Quality | |
| (% of total investment exposure) | |
U.S. Guaranteed | 1.6% |
AAA | 6.6% |
AA | 38.1% |
A | 27.9% |
BBB | 17.6% |
BB or Lower | 4.6% |
N/R (not rated) | 3.6% |
| Total | 100% |
| | |
| Portfolio Composition | |
| (% of total investments) | |
Tax Obligation/Limited | 23.2% |
Tax Obligation/General | 16.2% |
Utilities | 15.0% |
Health Care | 12.7% |
Transportation | 11.9% |
Water and Sewer | 8.4% |
Consumer Staples | 4.9% |
Other | 7.7% |
| Total | 100% |
| | |
| States and Territories | |
| (% of total municipal bonds) | |
California | 14.1% |
Texas | 11.2% |
Colorado | 9.4% |
Illinois | 9.0% |
Nevada | 6.5% |
Georgia | 4.3% |
Florida | 4.1% |
New York | 4.1% |
Maryland | 3.7% |
Kentucky | 3.3% |
Washington | 3.2% |
Ohio | 3.1% |
New Jersey | 2.9% |
Puerto Rico | 2.7% |
Other | 18.4% |
| Total | 100% |
18
| | |
| NMI | Nuveen Municipal Income Fund, Inc. |
| Performance Overview and Holding Summaries as of October 31, 2019 |
| | | | |
Refer to the Glossary of Terms Used in this Report for further definition of the terms used within this section. |
| | | |
Average Annual Total Returns as of October 31, 2019
|
|
| Average Annual |
| 1-Year | 5-Year | 10-Year |
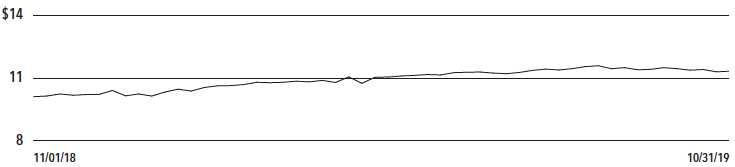
NMI at Common Share NAV | 8.45% | 4.07% | 5.77% |
NMI at Common Share Price | 17.61% | 4.53% | 5.54% |
S&P Municipal Bond Index | 9.07% | 3.55% | 4.49% |
Past performance is not predictive of future results. Current performance may be higher or lower than the data shown. Returns do not reflect the deduction of taxes that shareholders may have to pay on Fund distributions or upon the sale of Fund shares. Returns at NAV are net of Fund expenses, and assume reinvestment of distributions. Comparative index return information is provided for the Fund’s shares at NAV only. Indexes are not available for direct investment.
Common Share Price Performance — Weekly Closing Price
19
| | |
| NMI | Performance Overview and Holding Summaries as of October 31, 2019 (continued) |
This data relates to the securities held in the Fund’s portfolio of investments as of the end of the reporting period. It should not be construed as a measure of performance for the Fund itself. Holdings are subject to change.
For financial reporting purposes, the ratings disclosed are the highest rating given by one of the following national rating agencies: Standard & Poor’s Group, Moody’s Investors Service, Inc. or Fitch, Inc. This treatment of split-rated securities may differ from that used for other purposes, such as for Fund investment policies. Credit ratings are subject to change. AAA, AA, A and BBB are investment grade ratings; BB, B, CCC, CC, C and D are below-investment grade ratings. Holdings designated N/R are not rated by these national rating agencies.
| | |
| Fund Allocation | |
| (% of net assets) | |
Long-Term Municipal Bonds | 98.6% |
Other Assets Less Liabilities | 1.4% |
| Net Assets | 100% |
| | |
| Portfolio Credit Quality | |
| (% of total investment exposure) | |
U.S. Guaranteed | 11.8% |
AAA | 0.6% |
AA | 17.1% |
A | 35.1% |
BBB | 22.4% |
BB or Lower | 6.7% |
N/R (not rated) | 6.3% |
| Total | 100% |
| | |
| Portfolio Composition | |
| (% of total investments) | |
Health Care | 20.1% |
Tax Obligation/General | 14.4% |
Transportation | 14.2% |
Tax Obligation/Limited | 12.1% |
U.S. Guaranteed | 11.6% |
Education and Civic Organizations | 9.1% |
Utilities | 6.7% |
Long-Term Care | 4.9% |
Other | 6.9% |
| Total | 100% |
| | |
| States and Territories | |
| (% of total municipal bonds) | |
California | 17.2% |
Illinois | 10.0% |
Colorado | 9.6% |
Texas | 8.1% |
Wisconsin | 6.4% |
Florida | 5.7% |
Ohio | 3.9% |
Missouri | 3.3% |
Pennsylvania | 3.0% |
New Jersey | 2.9% |
Michigan | 2.7% |
Arizona | 2.5% |
Tennessee | 2.4% |
Minnesota | 2.4% |
Other | 19.9% |
| Total | 100% |
20
| | |
| NEV | Nuveen Enhanced Municipal Value Fund |
| Performance Overview and Holding Summaries as of October 31, 2019 |
| | | | |
Refer to the Glossary of Terms Used in this Report for further definition of the terms used within this section. |
| | | |
Average Annual Total Returns as of October 31, 2019
|
|
| Average Annual |
| 1-Year | 5-Year | 10-Year |
NEV at Common Share NAV | 11.92% | 5.01% | 7.27% |
NEV at Common Share Price | 20.66% | 5.42% | 6.06% |
S&P Municipal Bond Index | 9.07% | 3.55% | 4.49% |
Past performance is not predictive of future results. Current performance may be higher or lower than the data shown. Returns do not reflect the deduction of taxes that shareholders may have to pay on Fund distributions or upon the sale of Fund shares. Returns at NAV are net of Fund expenses, and assume reinvestment of distributions. Comparative index return information is provided for the Fund’s shares at NAV only. Indexes are not available for direct investment.
Common Share Price Performance — Weekly Closing Price
21
| | |
| NEV | Performance Overview and Holding Summaries as of October 31, 2019 (continued) |
This data relates to the securities held in the Fund’s portfolio of investments as of the end of the reporting period. It should not be construed as a measure of performance for the Fund itself. Holdings are subject to change.
For financial reporting purposes, the ratings disclosed are the highest rating given by one of the following national rating agencies: Standard & Poor’s Group, Moody’s Investors Service, Inc. or Fitch, Inc. This treatment of split-rated securities may differ from that used for other purposes, such as for Fund investment policies. Credit ratings are subject to change. AAA, AA, A and BBB are investment grade ratings; BB, B, CCC, CC, C and D are below-investment grade ratings. Holdings designated N/R are not rated by these national rating agencies.
| | |
| Fund Allocation | |
| (% of net assets) | |
Long-Term Municipal Bonds | 126.5% |
Other Assets Less Liabilities | 4.8% |
| Net Assets Plus Floating Rate | |
| Obligations | 131.3% |
Floating Rate Obligations | (31.3)% |
| Net Assets | 100% |
| | |
| Portfolio Credit Quality | |
| (% of total investment exposure) | |
U.S. Guaranteed | 12.9% |
AAA | 4.1% |
AA | 25.3% |
A | 17.9% |
BBB | 19.4% |
BB or Lower | 12.3% |
N/R (not rated) | 8.1% |
| Total | 100% |
| | |
| Portfolio Composition | |
| (% of total investments) | |
Tax Obligation/Limited | 22.4% |
Transportation | 15.2% |
Health Care | 14.2% |
Tax Obligation/General | 12.5% |
Education and Civic Organizations | 7.6% |
U.S. Guaranteed | 7.1% |
Consumer Staples | 6.2% |
Utilities | 6.1% |
Other | 8.7% |
| Total | 100% |
| | |
| States and Territories | |
| (% of total municipal bonds) | |
Illinois | 16.1% |
New Jersey | 10.0% |
Ohio | 8.7% |
California | 8.4% |
Pennsylvania | 6.8% |
Wisconsin | 6.6% |
Louisiana | 4.7% |
Guam | 4.6% |
Florida | 3.9% |
New York | 3.5% |
Georgia | 3.1% |
Washington | 2.5% |
Colorado | 2.4% |
Other | 18.7% |
| Total | 100% |
22
Shareholder Meeting Report
The annual meeting of shareholders was held in the offices of Nuveen on August 7, 2019 for NUV, NUW, NMI and NEV; at this meeting the shareholders were asked to elect Board Members.
| | | | | |
| NUV | NUW | NMI | NEV |
| Common | Common | Common | Common |
| Shares | Shares | Shares | Shares |
| Approval of the Board Members was reached as follows: | | | | |
William C. Hunter | | | | |
| For | 179,127,011 | 14,084,167 | 7,693,870 | 22,312,585 |
| Withhold | 3,726,151 | 548,477 | 358,275 | 1,468,617 |
| Total | 182,853,162 | 14,632,644 | 8,052,145 | 23,781,202 |
Judith M. Stockdale | | | | |
| For | 179,023,228 | 14,080,352 | 7,685,835 | 22,328,943 |
| Withhold | 3,829,934 | 552,292 | 366,310 | 1,452,259 |
| Total | 182,853,162 | 14,632,644 | 8,052,145 | 23,781,202 |
Carole E. Stone | | | | |
| For | 179,198,998 | 14,087,533 | 7,694,498 | 22,336,074 |
| Withhold | 3,654,164 | 545,111 | 357,647 | 1,445,128 |
| Total | 182,853,162 | 14,632,644 | 8,052,145 | 23,781,202 |
Margaret L. Wolff | | | | |
| For | 179,437,892 | 14,101,825 | 7,764,471 | 22,408,935 |
| Withhold | 3,415,270 | 530,819 | 287,674 | 1,372,267 |
| Total | 182,853,162 | 14,632,644 | 8,052,145 | 23,781,202 |
23
Report of Independent Registered Public Accounting Firm
To the Shareholders and Board of Directors/Trustees of
Nuveen Municipal Value Fund, Inc.
Nuveen AMT-Free Municipal Value Fund
Nuveen Municipal Income Fund, Inc.
Nuveen Enhanced Municipal Value Fund:
Opinion on the Financial Statements
We have audited the accompanying statements of assets and liabilities of Nuveen Municipal Value Fund, Inc., Nuveen AMT-Free Municipal Value Fund, Nuveen Municipal Income Fund, Inc., and Nuveen Enhanced Municipal Value Fund (the “Funds”), including the portfolios of investments, as of October 31, 2019, the related statements of operations and cash flows (Nuveen Enhanced Municipal Fund) for the year then ended, the statements of changes in net assets for each of the years in the two-year period then ended, and the related notes (collectively, the “financial statements”) and the financial highlights for each of the years in the five-year period then ended. In our opinion, the financial statements and financial highlights present fairly, in all material respects, the financial position of the Funds as of October 31, 2019, the results of their operations and the cash flows of Nuveen Enhanced Municipal Value Fund for the year then ended, the changes in their net assets for each of the years in the two-year period then ended, and the financial highlights for each of the years in the five-year period then ended, in conformity with U.S. generally accepted accounting principles.
Basis for Opinion
These financial statements and financial highlights are the responsibility of the Funds’ management. Our responsibility is to express an opinion on these financial statements and financial highlights based on our audits. We are a public accounting firm registered with the Public Company Accounting Oversight Board (United States) (PCAOB) and are required to be independent with respect to the Funds in accordance with the U.S. federal securities laws and the applicable rules and regulations of the Securities and Exchange Commission and the PCAOB.
We conducted our audits in accordance with the standards of the PCAOB. Those standards require that we plan and perform the audit to obtain reasonable assurance about whether the financial statements and financial highlights are free of material misstatement, whether due to error or fraud. Our audits included performing procedures to assess the risks of material misstatement of the financial statements and financial highlights, whether due to error or fraud, and performing procedures that respond to those risks. Such procedures included examining, on a test basis, evidence regarding the amounts and disclosures in the financial statements and financial highlights. Such procedures also included confirmation of securities owned as of October 31, 2019, by correspondence with custodians and brokers or other appropriate auditing procedures. Our audits also included evaluating the accounting principles used and significant estimates made by management, as well as evaluating the overall presentation of the financial statements and financial highlights. We believe that our audits provide a reasonable basis for our opinion.
/s/ KPMG LLP
We have served as the auditor of one or more Nuveen investment companies since 2014.
Chicago, Illinois
December 27, 2019
24
| | |
| NUV | Nuveen Municipal Value Fund, Inc. Portfolio of Investments October 31, 2019 |
| | | | | | |
| Principal | | | Optional Call | | |
| Amount (000) | | Description (1) | Provisions (2) | Ratings (3) | Value |
| | LONG-TERM INVESTMENTS – 100.0% | | | |
| | MUNICIPAL BONDS – 100.0% | | | |
| | Alabama – 0.2% | | | |
| $ 3,805 | | Homewood, Alabama, General Obligation Warrants, Refunding Series 2016, 5.000%, 9/01/36 | 9/26 at 100.00 | AA+ | $ 4,536,055 |
| | Alaska – 0.1% | | | |
| 2,710 | | Northern Tobacco Securitization Corporation, Alaska, Tobacco Settlement Asset-Backed Bonds, | 11/19 at 100.00 | B3 | 2,713,686 |
| | Series 2006A, 5.000%, 6/01/32 | | | |
| | Arizona – 1.3% | | | |
| 7,525 | | Chandler Industrial Development Authority, Arizona, Industrial Development Revenue Bonds, | No Opt. Call | A+ | 8,634,411 |
| | Intel Corporation Project, Series 2019, 5.000%, 6/01/49 (AMT) (Mandatory Put 6/03/24) | | | |
| 2,935 | | Phoenix Civic Improvement Corporation, Arizona, Airport Revenue Bonds, Senior Lien | 7/27 at 100.00 | AA– | 3,586,775 |
| | Series 2017A, 5.000%, 7/01/35 | | | |
| 5,600 | | Salt Verde Financial Corporation, Arizona, Senior Gas Revenue Bonds, Citigroup Energy Inc | No Opt. Call | A3 | 7,539,056 |
| | Prepay Contract Obligations, Series 2007, 5.000%, 12/01/37 | | | |
| 4,240 | | Scottsdale Industrial Development Authority, Arizona, Hospital Revenue Bonds, Scottsdale | 9/20 at 100.00 | AA | 4,360,416 |
| | Healthcare, Series 2006C Re-offering, 5.000%, 9/01/35 – AGM Insured | | | |
| | Tucson, Arizona, Water System Revenue Bonds, Refunding Series 2017: | | | |
| 1,000 | | 5.000%, 7/01/32 | 7/27 at 100.00 | AA | 1,236,860 |
| 1,410 | | 5.000%, 7/01/33 | 7/27 at 100.00 | AA | 1,740,025 |
| 1,000 | | 5.000%, 7/01/34 | 7/27 at 100.00 | AA | 1,231,470 |
| 750 | | 5.000%, 7/01/35 | 7/27 at 100.00 | AA | 921,352 |
| 24,460 | | Total Arizona | | | 29,250,365 |
| | California – 8.8% | | | |
| 4,615 | | Anaheim Public Financing Authority, California, Lease Revenue Bonds, Public Improvement | No Opt. Call | AA | 4,346,084 |
| | Project, Series 1997C, 0.000%, 9/01/23 – AGM Insured | | | |
| 5,000 | | Bay Area Toll Authority, California, Revenue Bonds, San Francisco Bay Area Toll Bridge, | 4/23 at 100.00 | AA– (4) | 5,668,500 |
| | Series 2013S-4, 5.000%, 4/01/38 (Pre-refunded 4/01/23) | | | |
| 3,920 | | California County Tobacco Securitization Agency, Tobacco Settlement Asset-Backed Bonds, | 11/19 at 45.94 | CCC– | 1,812,138 |
| | Gold Country Settlement Funding Corporation, Refunding Series 2006, 0.000%, 6/01/33 | | | |
| | California County Tobacco Securitization Agency, Tobacco Settlement Asset-Backed Bonds, | | | |
| | Los Angeles County Securitization Corporation, Series 2006A: | | | |
| 3,275 | | 5.450%, 6/01/28 | 11/19 at 100.00 | B2 | 3,324,878 |
| 4,200 | | 5.600%, 6/01/36 | 11/19 at 100.00 | B2 | 4,230,114 |
| 1,175 | | California Department of Water Resources, Central Valley Project Water System Revenue | 12/26 at 100.00 | AAA | 1,455,708 |
| | Bonds, Refunding Series 2016AW, 5.000%, 12/01/33 | | | |
| 10,000 | | California Health Facilities Financing Authority, California, Revenue Bonds, Sutter Health, | 11/26 at 100.00 | AA– | 11,859,300 |
| | Refunding Series 2016B, 5.000%, 11/15/46 | | | |
| 1,200 | | California Health Facilities Financing Authority, Revenue Bonds, Children’s Hospital Los Angeles, | 8/27 at 100.00 | BBB+ | 1,432,872 |
| | Series 2017A, 5.000%, 8/15/37 | | | |
| 3,850 | | California Health Facilities Financing Authority, Revenue Bonds, Saint Joseph Health System, | 7/23 at 100.00 | AA– | 4,340,606 |
| | Series 2013A, 5.000%, 7/01/33 | | | |
| 2,335 | | California Municipal Finance Authority, Revenue Bonds, Eisenhower Medical Center, | 7/20 at 100.00 | Baa2 (4) | 2,407,081 |
| | Series 5.750%, 7/01/40 (Pre-refunded 7/01/20) | | | |
| 6,130 | | California Municipal Finance Authority, Revenue Bonds, Linxs APM Project, Senior Lien | 6/28 at 100.00 | BBB | 7,177,494 |
| | Series 2018A, 5.000%, 12/31/43 (AMT) | | | |
25
| | | | | |
| NUV | Nuveen Municipal Value Fund, Inc. | | | |
| Portfolio of Investments (continued) | | | |
| October 31, 2019 | | | |
|
|
|
|
| Principal | | | Optional Call | | |
| Amount (000) | | Description (1) | Provisions (2) | Ratings (3) | Value |
| | California (continued) | | | |
| $ 2,725 | | California Pollution Control Financing Authority, Water Furnishing Revenue Bonds, San Diego | 1/29 at 100.00 | BBB | $ 3,262,207 |
| | County Water Authority Desalination Project Pipeline, Refunding Series 2019, | | | |
| | 5.000%, 11/21/45, 144A | | | |
| 1,625 | | California State Public Works Board, Lease Revenue Bonds, Various Capital Projects, | 11/23 at 100.00 | Aa3 | 1,834,544 |
| | Series 2013I, 5.000%, 11/01/38 | | | |
| 5,000 | | California State, General Obligation Bonds, Various Purpose Series 2011, 5.000%, 10/01/41 | 10/21 at 100.00 | Aa2 | 5,356,650 |
| 3,500 | | California Statewide Communities Development Authority, California, Revenue Bonds, Loma | 6/26 at 100.00 | BB | 3,908,695 |
| | Linda University Medical Center, Series 2016A, 5.000%, 12/01/46, 144A | | | |
| 4,505 | | Covina-Valley Unified School District, Los Angeles County, California, General | No Opt. Call | A+ | 3,794,066 |
| | Obligation Bonds, Series 2003B, 0.000%, 6/01/28 – FGIC Insured | | | |
| 5,700 | | East Bay Municipal Utility District, Alameda and Contra Costa Counties, California, | 6/27 at 100.00 | AAA | 6,914,385 |
| | Water System Revenue Bonds, Green Series 2017A, 5.000%, 6/01/45 | | | |
| 2,180 | | Foothill/Eastern Transportation Corridor Agency, California, Toll Road Revenue Bonds, | 1/31 at 100.00 | A– | 2,289,174 |
| | Refunding Series 2013A, 0.000%, 1/15/42 (5) | | | |
| 30,000 | | Foothill/Eastern Transportation Corridor Agency, California, Toll Road Revenue Bonds, | No Opt. Call | AA+ (4) | 29,260,200 |
| | Series 1995A, 0.000%, 1/01/22 (ETM) | | | |
| 14,100 | | Golden State Tobacco Securitization Corporation, California, Tobacco Settlement | 6/22 at 100.00 | N/R | 14,558,109 |
| | Asset-Backed Bonds, Series 2018A-1, 5.250%, 6/01/47 | | | |
| | Merced Union High School District, Merced County, California, General Obligation Bonds, | | | |
| | Series 1999A: | | | |
| 2,500 | | 0.000%, 8/01/23 – FGIC Insured | No Opt. Call | AA– | 2,368,050 |
| 2,555 | | 0.000%, 8/01/24 – FGIC Insured | No Opt. Call | AA– | 2,378,015 |
| 2,365 | | Montebello Unified School District, Los Angeles County, California, General Obligation | No Opt. Call | A– | 2,011,976 |
| | Bonds, Election 1998 Series 2004, 0.000%, 8/01/27 – FGIC Insured | | | |
| | Mount San Antonio Community College District, Los Angeles County, California, General | | | |
| | Obligation Bonds, Election of 2008, Series 2013A: | | | |
| 3,060 | | 0.000%, 8/01/28 (5) | 2/28 at 100.00 | Aa1 | 3,328,178 |
| 2,315 | | 0.000%, 8/01/43 (5) | 8/35 at 100.00 | Aa1 | 2,270,321 |
| 3,550 | | M-S-R Energy Authority, California, Gas Revenue Bonds, Citigroup Prepay Contracts, | No Opt. Call | A | 5,564,305 |
| | Series 2009C, 6.500%, 11/01/39 | | | |
| 10,150 | | Placer Union High School District, Placer County, California, General Obligation Bonds, | No Opt. Call | AA | 7,396,305 |
| | Series 2004C, 0.000%, 8/01/33 – AGM Insured | | | |
| | San Bruno Park School District, San Mateo County, California, General Obligation Bonds, | | | |
| | Series 2000B: | | | |
| 2,575 | | 0.000%, 8/01/24 – FGIC Insured | No Opt. Call | Aa3 | 2,391,016 |
| 2,660 | | 0.000%, 8/01/25 – FGIC Insured | No Opt. Call | Aa3 | 2,416,690 |
| 450 | | San Diego Tobacco Settlement Revenue Funding Corporation, California, Tobacco Settlement | 6/28 at 100.00 | BBB | 482,036 |
| | Bonds, Subordinate Series 2018C, 4.000%, 6/01/32 | | | |
| 10,000 | | San Francisco Airports Commission, California, Revenue Bonds, San Francisco | 5/29 at 100.00 | A+ | 12,528,000 |
| | International Airport, Refunding Second Series 2019D, 5.000%, 5/01/39 | | | |
| 250 | | San Francisco Redevelopment Financing Authority, California, Tax Allocation Revenue | 2/21 at 100.00 | BBB+ (4) | 268,425 |
| | Bonds, Mission Bay South Redevelopment Project, Series 2011D, 7.000%, 8/01/41 | | | |
| | (Pre-refunded 2/01/21) | | | |
| 12,095 | | San Joaquin Hills Transportation Corridor Agency, Orange County, California, Toll Road | No Opt. Call | Baa2 | 10,727,176 |
| | Revenue Bonds, Refunding Series 1997A, 0.000%, 1/15/25 – NPFG Insured | | | |
| 13,220 | | San Mateo County Community College District, California, General Obligation Bonds, | No Opt. Call | AAA | 11,320,286 |
| | Series 2006A, 0.000%, 9/01/28 – NPFG Insured | | | |
| 5,000 | | San Mateo Union High School District, San Mateo County, California, General Obligation | No Opt. Call | Aaa | 4,660,650 |
| | Bonds, Election of 2000, Series 2002B, 0.000%, 9/01/24 – FGIC Insured | | | |
26
| | | | | | |
| Principal | | | Optional Call | | |
| Amount (000) | | Description (1) | Provisions (2) | Ratings (3) | Value |
| | California (continued) | | | |
| $ 5,815 | | San Ysidro School District, San Diego County, California, General Obligation Bonds, | 8/25 at 29.16 | AA | $ 1,438,457 |
| | Refunding Series 2015, 0.000%, 8/01/48 | | | |
| 2,000 | | Tobacco Securitization Authority of Northern California, Tobacco Settlement Asset-Backed | 11/19 at 100.00 | B | 2,007,700 |
| | Bonds, Refunding Series 2005A-2, 5.400%, 6/01/27 | | | |
| 195,595 | | Total California | | | 192,790,391 |
| | Colorado – 7.1% | | | |
| 7,500 | | Arapahoe County School District 6, Littleton, Colorado, General Obligation Bonds, | 12/28 at 100.00 | Aa1 | 9,586,425 |
| | Series 2019A, 5.500%, 12/01/43 | | | |
| 7,105 | | Colorado Health Facilities Authority, Colorado, Revenue Bonds, Catholic Health | 1/23 at 100.00 | BBB+ (4) | 7,977,565 |
| | Initiatives, Series 2013A, 5.250%, 1/01/45 (Pre-refunded 1/01/23) | | | |
| 4,155 | | Colorado Health Facilities Authority, Colorado, Revenue Bonds, CommonSpirit Health, | 8/29 at 100.00 | BBB+ | 4,445,933 |
| | Series 2019A-2, 4.000%, 8/01/49 | | | |
| 15,925 | | Colorado Health Facilities Authority, Colorado, Revenue Bonds, Sisters of Charity of | 1/20 at 100.00 | AA– | 16,020,709 |
| | Leavenworth Health Services Corporation, Series 2010A, 5.000%, 1/01/40 | | | |
| 1,255 | | Colorado High Performance Transportation Enterprise, C-470 Express Lanes Revenue Bonds, | 12/24 at 100.00 | BBB | 1,374,012 |
| | Senior Lien Series 2017, 5.000%, 12/31/51 | | | |
| 2,000 | | Colorado State Board of Governors, Colorado State University Auxiliary Enterprise System | 3/22 at 100.00 | AA (4) | 2,178,060 |
| | Revenue Bonds, Series 2012A, 5.000%, 3/01/41 (Pre-refunded 3/01/22) | | | |
| 4,500 | | Colorado State, Building Excellent Schools Today, Certificates of Participation, Series | 3/28 at 100.00 | Aa2 | 5,522,220 |
| | 2018N, 5.000%, 3/15/37 | | | |
| | Colorado State, Certificates of Participation, Lease Purchase Financing Program, | | | |
| | National Western Center, Series 2018A: | | �� | |
| 1,250 | | 5.000%, 9/01/30 | 3/28 at 100.00 | Aa2 | 1,562,500 |
| 2,000 | | 5.000%, 9/01/31 | 3/28 at 100.00 | Aa2 | 2,492,200 |
| 1,260 | | 5.000%, 9/01/32 | 3/28 at 100.00 | Aa2 | 1,565,222 |
| 620 | | 5.000%, 9/01/33 | 3/28 at 100.00 | Aa2 | 768,471 |
| 3,790 | | Colorado State, Certificates of Participation, Rural Series 2018A, 5.000%, 12/15/37 | 12/28 at 100.00 | Aa2 | 4,714,949 |
| | Denver City and County, Colorado, Airport System Revenue Bonds, Series 2012B: | | | |
| 2,750 | | 5.000%, 11/15/25 | 11/22 at 100.00 | AA– | 3,060,668 |
| 2,200 | | 5.000%, 11/15/29 | 11/22 at 100.00 | AA– | 2,438,128 |
| 5,160 | | Denver City and County, Colorado, Airport System Revenue Bonds, Subordinate Lien Series | 11/23 at 100.00 | A+ | 5,780,026 |
| | 2013B, 5.000%, 11/15/43 | | | |
| 2,000 | | Denver Convention Center Hotel Authority, Colorado, Revenue Bonds, Convention Center | 12/26 at 100.00 | Baa2 | 2,304,220 |
| | Hotel, Refunding Senior Lien Series 2016, 5.000%, 12/01/35 | | | |
| | E-470 Public Highway Authority, Colorado, Senior Revenue Bonds, Series 2000B: | | | |
| 9,660 | | 0.000%, 9/01/29 – NPFG Insured | No Opt. Call | A | 7,690,326 |
| 24,200 | | 0.000%, 9/01/31 – NPFG Insured | No Opt. Call | A | 17,949,382 |
| 17,000 | | 0.000%, 9/01/32 – NPFG Insured | No Opt. Call | A | 12,179,480 |
| 7,600 | | E-470 Public Highway Authority, Colorado, Toll Revenue Bonds, Refunding Series 2006B, | 9/26 at 52.09 | A | 3,344,760 |
| | 0.000%, 9/01/39 – NPFG Insured | | | |
| | E-470 Public Highway Authority, Colorado, Toll Revenue Bonds, Series 2004B: | | | |
| 7,700 | | 0.000%, 9/01/27 – NPFG Insured | 9/20 at 67.94 | A | 5,163,774 |
| 10,075 | | 0.000%, 3/01/36 – NPFG Insured | 9/20 at 41.72 | A | 4,129,339 |
| 8,000 | | Public Authority for Colorado Energy, Natural Gas Purchase Revenue Bonds, Colorado | No Opt. Call | A+ | 12,189,040 |
| | Springs Utilities, Series 2008, 6.500%, 11/15/38 | | | |
| 5,000 | | Rangely Hospital District, Rio Blanco County, Colorado, General Obligation Bonds, | 11/21 at 100.00 | Baa3 | 5,367,650 |
| | Refunding Series 2011, 6.000%, 11/01/26 | | | |
| 3,750 | | Regional Transportation District, Colorado, Denver Transit Partners Eagle P3 Project | 7/20 at 100.00 | BBB | 3,846,863 |
| | Private Activity Bonds, Series 2010, 6.000%, 1/15/41 | | | |
27
| | | | | |
| NUV | Nuveen Municipal Value Fund, Inc. | | | |
| Portfolio of Investments (continued) | | | |
| October 31, 2019 | | | |
|
|
| Principal | | | Optional Call | | |
| Amount (000) | | Description (1) | Provisions (2) | Ratings (3) | Value |
| | Colorado (continued) | | | |
| $ 4,945 | | Regional Transportation District, Colorado, Sales Tax Revenue Bonds, Fastracks Project, | 11/26 at 100.00 | AA+ | $ 5,911,006 |
| | Series 2017A, 5.000%, 11/01/40 | | | |
| 4,250 | | University of Colorado, Enterprise System Revenue Bonds, Series 2018B, 5.000%, 6/01/43 | 6/28 at 100.00 | Aa1 | 5,222,570 |
| 165,650 | | Total Colorado | | | 154,785,498 |
| | Connecticut – 0.8% | | | |
| 1,500 | | Connecticut Health and Educational Facilities Authority, Revenue Bonds, Hartford | 7/21 at 100.00 | A | 1,570,470 |
| | HealthCare, Series 2011A, 5.000%, 7/01/41 | | | |
| 8,440 | | Connecticut State, General Obligation Bonds, Series 2015E, 5.000%, 8/01/29 | 8/25 at 100.00 | A1 | 9,882,480 |
| 5,000 | | Connecticut State, General Obligation Bonds, Series 2015F, 5.000%, 11/15/33 | 11/25 at 100.00 | A1 | 5,834,150 |
| 9,999 | | Mashantucket Western Pequot Tribe, Connecticut, Special Revenue Bonds, Subordinate | No Opt. Call | N/R | 374,964 |
| | Series 2013A, 0.070%, 7/01/31 (cash 4.000%, PIK 2.050%) (6) | | | |
| 24,939 | | Total Connecticut | | | 17,662,064 |
| | District of Columbia – 0.4% | | | |
| 15,000 | | District of Columbia Tobacco Settlement Corporation, Tobacco Settlement Asset-Backed | 12/19 at 19.53 | N/R | 2,865,300 |
| | Bonds, Series 2006A, 0.000%, 6/15/46 | | | |
| 5,390 | | District of Columbia Water and Sewer Authority, Public Utility Revenue Bonds, Senior | 4/28 at 100.00 | AAA | 6,574,452 |
| | Lien Series 2018B, 5.000%, 10/01/43 | | | |
| 20,390 | | Total District of Columbia | | | 9,439,752 |
| | Florida – 4.8% | | | |
| 3,000 | | Cape Coral, Florida, Water and Sewer Revenue Bonds, Refunding Series 2011, 5.000%, | 10/21 at 100.00 | AA (4) | 3,219,720 |
| | 10/01/41 (Pre-refunded 10/01/21) – AGM Insured | | | |
| 565 | | Florida Development Finance Corporation, Educational Facilities Revenue Bonds, Renaissance | 6/25 at 100.00 | N/R | 625,178 |
| | Charter School Income Projects, Series 2015A, 6.000%, 6/15/35, 144A | | | |
| | Florida Development Finance Corporation, Florida, Surface Transportation Facility | | | |
| | Revenue Bonds, Virgin Trains USA Passenger Rail Project , Series 2019A: | | | |
| 3,400 | | 6.250%, 1/01/49 (AMT) (Mandatory Put 1/01/24), 144A | 1/20 at 104.00 | N/R | 3,238,500 |
| 3,400 | | 6.375%, 1/01/49 (AMT) (Mandatory Put 1/01/26), 144A | 1/20 at 105.00 | N/R | 3,216,196 |
| 3,400 | | 6.500%, 1/01/49 (AMT) (Mandatory Put 1/01/29), 144A | 1/20 at 105.00 | N/R | 3,203,514 |
| 4,000 | | Gainesville, Florida, Utilities System Revenue Bonds, Series 2017A, 5.000%, 10/01/37 | 10/27 at 100.00 | AA– | 4,892,720 |
| 3,500 | | Gainesville, Florida, Utilities System Revenue Bonds, Series 2019A, 5.000%, 10/01/44 | 10/29 at 100.00 | AA– | 4,340,700 |
| 2,290 | | Hillsborough County Aviation Authority, Florida, Revenue Bonds, Tampa International | 10/24 at 100.00 | A+ | 2,625,279�� |
| | Airport, Subordinate Lien Series 2015B, 5.000%, 10/01/40 | | | |
| 5,090 | | Miami-Dade County Expressway Authority, Florida, Toll System Revenue Bonds, Series | 7/20 at 100.00 | A | 5,208,139 |
| | 2010A, 5.000%, 7/01/40 | | | |
| 9,500 | | Miami-Dade County Health Facility Authority, Florida, Hospital Revenue Bonds, Miami | 8/21 at 100.00 | A (4) | 10,279,950 |
| | Children’s Hospital, Series 2010A, 6.000%, 8/01/46 (Pre-refunded 8/01/21) | | | |
| 2,000 | | Miami-Dade County, Florida, Aviation Revenue Bonds, Miami International Airport, | 10/24 at 100.00 | A | 2,292,820 |
| | Refunding Series 2014B, 5.000%, 10/01/37 | | | |
| 4,000 | | Miami-Dade County, Florida, Aviation Revenue Bonds, Miami International Airport, Series | 10/20 at 100.00 | A (4) | 4,140,560 |
| | 2010B, 5.000%, 10/01/29 (Pre-refunded 10/01/20) | | | |
| 4,000 | | Miami-Dade County, Florida, Transit System Sales Surtax Revenue Bonds, Refunding Series | 7/22 at 100.00 | AA | 4,337,120 |
| | 2012, 5.000%, 7/01/42 | | | |
| 9,590 | | Miami-Dade County, Florida, Water and Sewer System Revenue Bonds, Series 2010, 5.000%, | 10/20 at 100.00 | AA (4) | 9,926,993 |
| | 10/01/39 (Pre-refunded 10/01/20) – AGM Insured | | | |
| | Orlando Utilities Commission, Florida, Utility System Revenue Bonds, Series 2018A: | | | |
| 3,500 | | 5.000%, 10/01/36 | 10/27 at 100.00 | AA | 4,301,990 |
| 3,780 | | 5.000%, 10/01/37 | 10/27 at 100.00 | AA | 4,626,720 |
| 1,120 | | 5.000%, 10/01/38 | 10/27 at 100.00 | AA | 1,367,733 |
| 10,725 | | Orlando, Florida, Contract Tourist Development Tax Payments Revenue Bonds, Series 2014A, | 5/24 at 100.00 | AA+ (4) | 12,496,770 |
| | 5.000%, 11/01/44 (Pre-refunded 5/01/24) | | | |
28
| | | | | | |
| Principal | | | Optional Call | | |
| Amount (000) | | Description (1) | Provisions (2) | Ratings (3) | Value |
| | Florida (continued) | | | |
| $ 3,250 | | Palm Beach County Health Facilities Authority, Florida, Revenue Bonds, Jupiter Medical | 11/22 at 100.00 | BBB+ | $ 3,452,540 |
| | Center, Series 2013A, 5.000%, 11/01/43 | | | |
| 4,000 | | Pembroke Pines, Florida, Capital Improvement Revenue Bonds, Series 2019A, 4.000%, | 7/29 at 100.00 | AA | 4,523,280 |
| | 7/01/38, (WI/DD, Settling 11/07/19) | | | |
| 1,020 | | Putnam County Development Authority, Florida, Pollution Control Revenue Bonds, Seminole | 5/28 at 100.00 | A– | 1,212,790 |
| | Electric Cooperative, Inc Project, Refunding Series 2018B, 5.000%, 3/15/42 | | | |
| 6,865 | | South Broward Hospital District, Florida, Hospital Revenue Bonds, Refunding Series 2015, | 5/25 at 100.00 | AA | 7,482,163 |
| | 4.000%, 5/01/34 | | | |
| 3,300 | | Tampa, Florida, Health System Revenue Bonds, Baycare Health System, Series 2012A, | 5/22 at 100.00 | Aa2 | 3,572,844 |
| | 5.000%, 11/15/33 | | | |
| 95,295 | | Total Florida | | | 104,584,219 |
| | Georgia – 2.3% | | | |
| 3,325 | | Atlanta, Georgia, Water and Wastewater Revenue Bonds, Refunding Series 2015, | 5/25 at 100.00 | Aa2 | 3,861,455 |
| | 5.000%, 11/01/40 | | | |
| 4,945 | | Burke County Development Authority, Georgia, Pollution Control Revenue Bonds, Georgia | No Opt. Call | A– | 5,027,928 |
| | Power Company, Fourth Series 1994, 2.250%, 10/01/32 (Mandatory Put 5/25/23) | | | |
| 2,290 | | Fulton County Development Authority, Georgia, Hospital Revenue Bonds, Wellstar Health | 4/27 at 100.00 | A | 2,664,965 |
| | System, Inc Project, Series 2017A, 5.000%, 4/01/47 | | | |
| 6,000 | | Gainesville and Hall County Hospital Authority, Georgia, Revenue Anticipation | 2/27 at 100.00 | AA | 7,405,860 |
| | Certificates, Northeast Georgia Health Services Inc, Series 2017B, 5.500%, 2/15/42 | | | |
| 16,145 | | Municipal Electric Authority of Georgia Plant Vogtle Units 3&4 Project J Bonds, Series | 7/28 at 100.00 | A | 18,471,172 |
| | 2019A, 5.000%, 1/01/49 | | | |
| 5,865 | | Municipal Electric Authority of Georgia, General Resolution Projects Subordinated Bonds, | 1/28 at 100.00 | A1 | 6,904,864 |
| | Series 20188HH, 5.000%, 1/01/44 | | | |
| 2,415 | | Municipal Electric Authority of Georgia, Project One Revenue Bonds, Subordinate Lien | 1/25 at 100.00 | A2 | 2,728,636 |
| | Series 2015A, 5.000%, 1/01/35 | | | |
| 2,000 | | Private Colleges and Universities Authority, Georgia, Revenue Bonds, Emory University, | 10/26 at 100.00 | AA | 2,374,580 |
| | Refunding Series 2016A, 5.000%, 10/01/46 | | | |
| 42,985 | | Total Georgia | | | 49,439,460 |
| | Guam – 0.0% | | | |
| 330 | | Guam International Airport Authority, Revenue Bonds, Series 2013C, 6.375%, 10/01/43 (AMT) | 10/23 at 100.00 | BBB+ | 381,972 |
| | Hawaii – 0.4% | | | |
| 4,830 | | Honolulu City and County, Hawaii, General Obligation Bonds, Series 2018A, 5.000%, 9/01/40 | 9/28 at 100.00 | Aa1 | 5,971,426 |
| 3,000 | | Honolulu City and County, Hawaii, Wastewater System Revenue Bonds, First Bond Resolution, | 1/28 at 100.00 | Aa2 | 3,679,770 |
| | Senior Series 2018A, 5.000%, 7/01/37 | | | |
| 7,830 | | Total Hawaii | | | 9,651,196 |
| | Illinois – 12.5% | | | |
| 5,000 | | Chicago Board of Education, Illinois, Dedicated Capital Improvement Tax Revenue Bonds, | 4/27 at 100.00 | A | 5,973,550 |
| | Series 2016, 6.000%, 4/01/46 | | | |
| 5,000 | | Chicago Board of Education, Illinois, General Obligation Bonds, Dedicated Revenues, | 12/25 at 100.00 | BB | 6,081,250 |
| | Series 2016A, 7.000%, 12/01/44 | | | |
| 2,945 | | Chicago Board of Education, Illinois, General Obligation Bonds, Dedicated Revenues, | 12/26 at 100.00 | BB | 3,553,997 |
| | Series 2016B, 6.500%, 12/01/46 | | | |
| 4,710 | | Chicago Board of Education, Illinois, General Obligation Bonds, Dedicated Revenues, | 12/27 at 100.00 | BB– | 5,999,739 |
| | Series 2017A, 7.000%, 12/01/46, 144A | | | |
| 17,725 | | Chicago Board of Education, Illinois, Unlimited Tax General Obligation Bonds, Dedicated | No Opt. Call | Baa2 | 15,594,632 |
| | Tax Revenues, Series 1998B-1, 0.000%, 12/01/24 – FGIC Insured | | | |
| 7,495 | | Chicago Board of Education, Illinois, Unlimited Tax General Obligation Bonds, Dedicated | No Opt. Call | Baa2 | 5,106,568 |
| | Tax Revenues, Series 1999A, 0.000%, 12/01/31 – NPFG Insured | | | |
29
| | | | | |
| NUV | Nuveen Municipal Value Fund, Inc. | | | |
| Portfolio of Investments (continued) | | | |
| October 31, 2019 | | | |
|
|
|
|
| Principal | | | Optional Call | | |
| Amount (000) | | Description (1) | Provisions (2) | Ratings (3) | Value |
| | Illinois (continued) | | | |
| $ 1,500 | | Chicago Park District, Illinois, General Obligation Bonds, Limited Tax Series 2011A, | 1/22 at 100.00 | AA+ | $ 1,573,155 |
| | 5.000%, 1/01/36 | | | |
| | Chicago, Illinois, General Obligation Bonds, Project & Refunding Series 2006A: | | | |
| 1,195 | | 4.750%, 1/01/30 – AGM Insured | 12/19 at 100.00 | AA | 1,197,725 |
| 2,175 | | 4.625%, 1/01/31 – AGM Insured | 12/19 at 100.00 | AA | 2,179,720 |
| 5,000 | | Chicago, Illinois, Motor Fuel Tax Revenue Bonds, Series 2008A, 5.000%, 1/01/38 – | 12/19 at 100.00 | AA | 5,013,300 |
| | AGC Insured | | | |
| 3,320 | | Cook and DuPage Counties Combined School District 113A Lemont, Illinois, General | No Opt. Call | AA | 3,266,083 |
| | Obligation Bonds, Series 2002, 0.000%, 12/01/20 – FGIC Insured | | | |
| 8,875 | | Cook County, Illinois, General Obligation Bonds, Refunding Series 2010A, 5.250%, 11/15/33 | 11/20 at 100.00 | AA– | 9,188,997 |
| 1,000 | | Cook County, Illinois, General Obligation Bonds, Refunding Series 2018, 5.000%, 11/15/35 | 11/26 at 100.00 | AA– | 1,157,560 |
| 3,260 | | Cook County, Illinois, Recovery Zone Facility Revenue Bonds, Navistar International | 10/20 at 100.00 | BB | 3,366,113 |
| | Corporation Project, Series 2010, 6.750%, 10/15/40 | | | |
| 5,000 | | Cook County, Illinois, Sales Tax Revenue Bonds, Series 2012, 5.000%, 11/15/37 | 11/22 at 100.00 | AA | 5,375,100 |
| | Illinois Finance Authority, Revenue Bonds, OSF Healthcare System, Refunding | | | |
| | Series 2010A: | | | |
| 510 | | 6.000%, 5/15/39 | 5/20 at 100.00 | A | 524,326 |
| 3,110 | | 6.000%, 5/15/39 (Pre-refunded 5/15/20) | 5/20 at 100.00 | N/R (4) | 3,188,030 |
| 5,000 | | Illinois Finance Authority, Revenue Bonds, Rush University Medical Center Obligated | 5/25 at 100.00 | AA– | 5,669,450 |
| | Group, Series 2015A, 5.000%, 11/15/38 | | | |
| | Illinois Finance Authority, Revenue Bonds, Silver Cross Hospital and Medical Centers, | | | |
| | Refunding Series 2015C: | | | |
| 560 | | 5.000%, 8/15/35 | 8/25 at 100.00 | Baa1 | 636,244 |
| 825 | | 5.000%, 8/15/44 | 8/25 at 100.00 | Baa1 | 922,804 |
| 2,500 | | Illinois Finance Authority, Revenue Bonds, The University of Chicago Medical Center, | 2/21 at 100.00 | AA– (4) | 2,634,175 |
| | Series 2011C, 5.500%, 8/15/41 (Pre-refunded 2/15/21) | | | |
| 3,000 | | Illinois Finance Authority, Revenue Bonds, University of Chicago, Series 2012A, | 10/21 at 100.00 | AA+ | 3,163,740 |
| | 5.000%, 10/01/51 | | | |
| 5,125 | | Illinois State, General Obligation Bonds, January Series 2016, 5.000%, 1/01/28 | 1/26 at 100.00 | BBB | 5,748,712 |
| 1,755 | | Illinois State, General Obligation Bonds, October Series 2016, 5.000%, 2/01/29 | 2/27 at 100.00 | BBB | 1,997,506 |
| 655 | | Illinois State, General Obligation Bonds, Refunding Series 2012, 5.000%, 8/01/25 | 8/22 at 100.00 | BBB | 698,328 |
| 5,590 | | Illinois Toll Highway Authority, Toll Highway Revenue Bonds, Senior Lien Series 2013A, | 1/23 at 100.00 | AA– | 6,116,522 |
| | 5.000%, 1/01/38 | | | |
| 4,000 | | Illinois Toll Highway Authority, Toll Highway Revenue Bonds, Senior Lien Series 2016B, | 7/26 at 100.00 | AA– | 4,658,160 |
| | 5.000%, 1/01/41 | | | |
| 5,000 | | Lombard Public Facilities Corporation, Illinois, Conference Center and Hotel Revenue | 12/19 at 100.00 | N/R | 4,787,350 |
| | Bonds, First Tier Series 2005A-2, 5.500%, 1/01/36 | | | |
| 16,800 | | Metropolitan Pier and Exposition Authority, Illinois, Revenue Bonds, McCormick Place | No Opt. Call | Baa2 | 16,131,696 |
| | Expansion Project, Refunding Series 1996A, 0.000%, 12/15/21 – NPFG Insured | | | |
| | Metropolitan Pier and Exposition Authority, Illinois, Revenue Bonds, McCormick Place | | | |
| | Expansion Project, Refunding Series 2002B: | | | |
| 495 | | 5.500%, 6/15/20 | 12/19 at 100.00 | BBB | 496,346 |
| 2,380 | | 5.550%, 6/15/21 | 12/19 at 100.00 | BBB | 2,386,545 |
| | Metropolitan Pier and Exposition Authority, Illinois, Revenue Bonds, McCormick Place | | | |
| | Expansion Project, Series 1994B: | | | |
| 3,635 | | 0.000%, 6/15/21 – NPFG Insured | No Opt. Call | BBB | 3,526,786 |
| 5,190 | | 0.000%, 6/15/28 – NPFG Insured | No Opt. Call | BBB | 4,138,714 |
| 11,675 | | 0.000%, 6/15/29 – FGIC Insured | No Opt. Call | BBB | 8,919,933 |
30
| | | | | | |
| Principal | | | Optional Call | | |
| Amount (000) | | Description (1) | Provisions (2) | Ratings (3) | Value |
| | Illinois (continued) | | | |
| | Metropolitan Pier and Exposition Authority, Illinois, Revenue Bonds, McCormick Place | | | |
| | Expansion Project, Series 2002A: | | | |
| $ 2,315 | | 5.700%, 6/15/24 (Pre-refunded 6/15/22) | 6/22 at 101.00 | N/R (4) | $ 2,604,051 |
| 7,685 | | 5.700%, 6/15/24 | 6/22 at 101.00 | BBB | 8,477,170 |
| 4,950 | | 0.000%, 12/15/32 – NPFG Insured | No Opt. Call | BBB | 3,294,770 |
| 21,375 | | 0.000%, 6/15/34 – NPFG Insured | No Opt. Call | BBB | 13,431,409 |
| 21,000 | | 0.000%, 12/15/35 – NPFG Insured | No Opt. Call | BBB | 12,450,060 |
| 21,970 | | 0.000%, 6/15/36 – NPFG Insured | No Opt. Call | BBB | 12,756,880 |
| 10,375 | | 0.000%, 12/15/36 – NPFG Insured | No Opt. Call | BBB | 5,906,384 |
| 10,000 | | 0.000%, 12/15/37 – NPFG Insured | No Opt. Call | BBB | 5,468,300 |
| 25,825 | | 0.000%, 6/15/39 – NPFG Insured | No Opt. Call | BBB | 13,231,180 |
| 6,095 | | Regional Transportation Authority, Cook, DuPage, Kane, Lake, McHenry and Will Counties, | No Opt. Call | AA | 8,717,069 |
| | Illinois, General Obligation Bonds, Series 2002A, 6.000%, 7/01/32 – NPFG Insured | | | |
| 8,000 | | Regional Transportation Authority, Cook, DuPage, Kane, Lake, McHenry and Will Counties, | No Opt. Call | AA | 11,175,200 |
| | Illinois, General Obligation Bonds, Series 2003A, 6.000%, 7/01/33 – NPFG Insured | | | |
| 5,000 | | Regional Transportation Authority, Cook, DuPage, Kane, Lake, McHenry and Will Counties, | 6/24 at 100.00 | AA | 5,568,550 |
| | Illinois, General Obligation Bonds, Series 2014A, 5.000%, 6/01/44 | | | |
| 5,020 | | Southwestern Illinois Development Authority, Local Government Revenue Bonds, Edwardsville | No Opt. Call | AA | 4,612,075 |
| | Community Unit School District 7 Project, Series 2007, 0.000%, 12/01/23 – AGM Insured | | | |
| 10,285 | | Springfield, Illinois, Water Revenue Bonds, Refunding Series 2012, 5.000%, 3/01/37 (UB) (7) | 3/22 at 100.00 | AA– | 11,016,161 |
| 615 | | University of Illinois, Health Services Facilities System Revenue Bonds, Series 2013, | 10/23 at 100.00 | A– | 695,959 |
| | 6.000%, 10/01/42 | | | |
| | Will County Community Unit School District 201U, Crete-Monee, Illinois, General | | | |
| | Obligation Bonds, Capital Appreciation Series 2004: | | | |
| 780 | | 0.000%, 11/01/22 – NPFG Insured (ETM) | No Opt. Call | Baa2 (4) | 745,235 |
| 2,550 | | 0.000%, 11/01/22 – NPFG Insured | No Opt. Call | A+ | 2,408,144 |
| 315,845 | | Total Illinois | | | 273,531,453 |
| | Indiana – 2.3% | | | |
| 5,010 | | Indiana Finance Authority, Hospital Revenue Bonds, Community Health Network Project, | 5/23 at 100.00 | A | 5,455,990 |
| | Series 2012A, 5.000%, 5/01/42 | | | |
| 2,250 | | Indiana Finance Authority, Hospital Revenue Bonds, Indiana University Health Obligation | 6/25 at 100.00 | AA | 2,425,118 |
| | Group, Refunding 2015A, 4.000%, 12/01/40 | | | |
| 5,740 | | Indiana Finance Authority, Private Activity Bonds, Ohio River Bridges East End Crossing | 7/23 at 100.00 | A– | 6,233,812 |
| | Project, Series 2013A, 5.000%, 7/01/48 (AMT) | | | |
| 2,000 | | Indiana Municipal Power Agency Power Supply System Revenue Bonds, Refunding Series | 7/26 at 100.00 | A+ | 2,335,680 |
| | 2016A, 5.000%, 1/01/42 | | | |
| 5,000 | | Indianapolis Local Public Improvement Bond Bank, Indiana, Community Justice Campus | 2/29 at 100.00 | AAA | 6,195,650 |
| | Bonds, Courthouse & Jail Project, Series 2019A, 5.250%, 2/01/54 | | | |
| | Indianapolis Local Public Improvement Bond Bank, Indiana, Series 1999E: | | | |
| 12,550 | | 0.000%, 2/01/21 – AMBAC Insured | No Opt. Call | AA | 12,356,354 |
| 2,400 | | 0.000%, 2/01/25 – AMBAC Insured | No Opt. Call | AA | 2,215,296 |
| 14,595 | | 0.000%, 2/01/27 – AMBAC Insured | No Opt. Call | AA | 12,827,545 |
| 49,545 | | Total Indiana | | | 50,045,445 |
| | Iowa – 0.5% | | | |
| | Iowa Tobacco Settlement Authority, Asset Backed Settlement Revenue Bonds, Series 2005C: | | | |
| 175 | | 5.375%, 6/01/38 | 12/19 at 100.00 | B– | 175,035 |
| 7,000 | | 5.625%, 6/01/46 | 12/19 at 100.00 | B– | 7,001,260 |
| 4,965 | | Iowa Tobacco Settlement Authority, Tobacco Asset-Backed Revenue Bonds, Series 2005B, | 12/19 at 100.00 | B– | 4,971,405 |
| | 5.600%, 6/01/34 | | | |
| 12,140 | | Total Iowa | | | 12,147,700 |
31
| | | | | |
| NUV | Nuveen Municipal Value Fund, Inc. | | | |
| Portfolio of Investments (continued) | | | |
| October 31, 2019 | | | |
|
|
|
|
| Principal | | | Optional Call | | |
| Amount (000) | | Description (1) | Provisions (2) | Ratings (3) | Value |
| | Kentucky – 1.4% | | | |
| $ 440 | | Greater Kentucky Housing Assistance Corporation, FHA-Insured Section 8 Mortgage Revenue | 11/19 at 100.00 | Baa2 | $ 441,434 |
| | Refunding Bonds, Series 1997A, 6.100%, 1/01/24 – NPFG Insured | | | |
| | Kenton County Airport Board, Kentucky, Airport Revenue Bonds, Cincinnati/Northern | | | |
| | Kentucky International Airport, Series 2016: | | | |
| 1,530 | | 5.000%, 1/01/27 | 1/26 at 100.00 | A1 | 1,851,300 |
| 1,600 | | 5.000%, 1/01/28 | 1/26 at 100.00 | A1 | 1,925,920 |
| 2,000 | | Kentucky Bond Development Corporation, Transient Room Tax Revenue Bonds, Lexington | 9/28 at 100.00 | A2 | 2,373,660 |
| | Center Corporation Project, Series 2018A, 5.000%, 9/01/48 | | | |
| 1,000 | | Kentucky Economic Development Finance Authority, Hospital Revenue Bonds, Baptist | 8/21 at 100.00 | A | 1,047,090 |
| | Healthcare System Obligated Group, Series 2011, 5.000%, 8/15/42 | | | |
| | Kentucky Economic Development Finance Authority, Revenue Bonds, Next Generation | | | |
| | Kentucky Information Highway Project, Senior Series 2015A: | | | |
| 2,175 | | 5.000%, 7/01/40 | 7/25 at 100.00 | BBB+ | 2,391,978 |
| 6,760 | | 5.000%, 1/01/45 | 7/25 at 100.00 | BBB+ | 7,404,972 |
| 6,000 | | Kentucky Public Transportation Infrastructure Authority, First Tier Toll Revenue Bonds, Downtown | 7/31 at 100.00 | Baa3 | 6,503,400 |
| | Crossing Project, Convertible Capital Appreciation Series 2013C, 0.000%, 7/01/39 (5) | | | |
| 5,000 | | Kentucky State Property and Buildings Commission, Revenue Bonds, Project 115, Series | 4/27 at 100.00 | A1 | 5,975,750 |
| | 2017, 5.000%, 4/01/30 | | | |
| 26,505 | | Total Kentucky | | | 29,915,504 |
| | Louisiana – 1.2% | | | |
| 1,335 | | East Baton Rouge Sewerage Commission, Louisiana, Revenue Bonds, Refunding Series 2019A, | 2/29 at 100.00 | AA | 1,483,719 |
| | 4.000%, 2/01/45 | | | |
| 2,310 | | Louisiana Local Government Environmental Facilities and Community Development Authority, | 8/20 at 100.00 | BBB | 2,396,232 |
| | Revenue Bonds, Westlake Chemical Corporation Projects, Series 2009A, 6.500%, 8/01/29 | | | |
| 5,450 | | Louisiana Local Government Environmental Facilities and Community Development Authority, | 11/20 at 100.00 | BBB | 5,708,548 |
| | Revenue Bonds, Westlake Chemical Corporation Projects, Series 2010A-1, 6.500%, 11/01/35 | | | |
| 4,420 | | Louisiana Stadium and Exposition District, Revenue Refunding Bonds, Senior Lien Series | 7/23 at 100.00 | AA– | 4,953,980 |
| | 2013A, 5.000%, 7/01/28 | | | |
| 1,470 | | New Orleans Aviation Board, Louisiana, Special Facility Revenue Bonds, Parking Facilities | 10/28 at 100.00 | AA | 1,757,767 |
| | Corporation Consolidated Garage System, Series 2018A, 5.000%, 10/01/43 – AGM Insured | | | |
| 9,040 | | New Orleans Aviation Board, Louisiana, General Airport Revenue Bonds, North Terminal | 1/27 at 100.00 | A– | 10,535,397 |
| | Project, Series 2017A, 5.000%, 1/01/48 | | | |
| 24,025 | | Total Louisiana | | | 26,835,643 |
| | Maine – 0.6% | | | |
| 4,250 | | Maine Health and Higher Educational Facilities Authority Revenue Bonds, Eastern Maine | 7/23 at 100.00 | BBB | 4,609,168 |
| | Medical Center Obligated Group Issue, Series 2013, 5.000%, 7/01/33 | | | |
| | Maine Health and Higher Educational Facilities Authority Revenue Bonds, MaineHealth | | | |
| | Issue, Series 2018A: | | | |
| 1,190 | | 5.000%, 7/01/43 | 7/28 at 100.00 | A+ | 1,417,718 |
| 5,940 | | 5.000%, 7/01/48 | 7/28 at 100.00 | A+ | 7,037,474 |
| 1,050 | | Maine Health and Higher Educational Facilities Authority, Revenue Bonds, Maine General | 7/21 at 100.00 | BB | 1,125,117 |
| | Medical Center, Series 2011, 6.750%, 7/01/41 | | | |
| 12,430 | | Total Maine | | | 14,189,477 |
| | Maryland – 1.5% | | | |
| | Baltimore, Maryland, Convention Center Hotel Revenue Bonds, Refunding Series 2017: | | | |
| 630 | | 5.000%, 9/01/31 | 9/27 at 100.00 | BBB– | 746,556 |
| 2,330 | | 5.000%, 9/01/32 | 9/27 at 100.00 | BBB– | 2,753,035 |
| 3,070 | | 5.000%, 9/01/34 | 9/27 at 100.00 | BBB– | 3,564,546 |
| 1,000 | | 5.000%, 9/01/35 | 9/27 at 100.00 | BBB– | 1,155,880 |
| 1,000 | | 5.000%, 9/01/36 | 9/27 at 100.00 | BBB– | 1,152,350 |
| 4,500 | | 5.000%, 9/01/39 | 9/27 at 100.00 | BBB– | 5,141,745 |
| 3,500 | | 5.000%, 9/01/46 | 9/27 at 100.00 | BBB– | 3,955,140 |
32
| | | | | | |
| Principal | | | Optional Call | | |
| Amount (000) | | Description (1) | Provisions (2) | Ratings (3) | Value |
| | Maryland (continued) | | | |
| $ 2,350 | | Maryland Economic Development Corporation, Private Activity Revenue Bonds AP, Purple | 9/26 at 100.00 | BBB | $ 2,662,033 |
| | Line Light Rail Project, Green Bonds, Series 2016D, 5.000%, 3/31/41 (AMT) | | | |
| 1,050 | | Maryland Health and Higher Educational Facilities Authority, Maryland, Hospital Revenue | 7/25 at 100.00 | A– | 1,203,647 |
| | Bonds, Meritus Medical Center, Series 2015, 5.000%, 7/01/40 | | | |
| 1,500 | | Maryland Health and Higher Educational Facilities Authority, Revenue Bonds, Adventist | 1/22 at 100.00 | Baa3 | 1,633,275 |
| | Healthcare, Series 2011A, 6.125%, 1/01/36 | | | |
| 6,635 | | Maryland Stadium Authority, Lease Revenue Bonds, Baltimore City Public Schools | 5/28 at 100.00 | AA | 7,953,374 |
| | Construction & Revitalization Program, Series 2018A, 5.000%, 5/01/47 | | | |
| 27,565 | | Total Maryland | | | 31,921,581 |
| | Massachusetts – 1.0% | | | |
| 1,000 | | Massachusetts Department of Transportation, Metropolitan Highway System Revenue Bonds, | 1/29 at 100.00 | A+ | 1,235,620 |
| | Refunding Senior Lien Series 2019A, 5.000%, 1/01/37 | | | |
| 2,100 | | Massachusetts Development Finance Agency, Hospital Revenue Bonds, Cape Cod Healthcare | 11/23 at 100.00 | AA– | 2,335,473 |
| | Obligated Group, Series 2013, 5.250%, 11/15/41 | | | |
| 2,905 | | Massachusetts Development Finance Agency, Revenue Bonds, Boston Medical Center Issue, | 7/25 at 100.00 | BBB | 3,268,909 |
| | Green Bonds, Series 2015D, 5.000%, 7/01/44 | | | |
| 1,105 | | Massachusetts Development Finance Agency, Revenue Bonds, Boston Medical Center Issue, | 7/26 at 100.00 | BBB | 1,278,551 |
| | Series 2016E, 5.000%, 7/01/36 | | | |
| 2,765 | | Massachusetts Development Finance Agency, Revenue Bonds, Dana-Farber Cancer Institute | 12/26 at 100.00 | A1 | 3,240,442 |
| | Issue, Series 2016N, 5.000%, 12/01/46 | | | |
| 9,110 | | Massachusetts School Building Authority, Dedicated Sales Tax Revenue Bonds, Senior | 5/23 at 100.00 | AAA | 10,152,093 |
| | Series 2013A, 5.000%, 5/15/43 | | | |
| 980 | | Massachusetts Turnpike Authority, Metropolitan Highway System Revenue Bonds, Senior | No Opt. Call | A+ | 810,362 |
| | Series 1997A, 0.000%, 1/01/29 – NPFG Insured | | | |
| 320 | | Massachusetts Water Pollution Abatement Trust, Pooled Loan Program Bonds, Series 2000-6, | 12/19 at 100.00 | Aaa | 321,047 |
| | 5.500%, 8/01/30 | | | |
| 20,285 | | Total Massachusetts | | | 22,642,497 |
| | Michigan – 2.7% | | | |
| | Detroit Academy of Arts and Sciences, Michigan, Public School Academy Revenue Bonds, | | | |
| | Refunding Series 2013: | | | |
| 1,775 | | 6.000%, 10/01/33 | 10/23 at 100.00 | N/R | 1,807,589 |
| 2,520 | | 6.000%, 10/01/43 | 10/23 at 100.00 | N/R | 2,539,001 |
| 3,090 | | Detroit Local Development Finance Authority, Michigan, Tax Increment Bonds, Series 1998A, | 12/19 at 100.00 | B– | 3,070,255 |
| | 5.500%, 5/01/21 | | | |
| 1,415 | | Detroit Water and Sewerage Department, Michigan, Sewage Disposal System Revenue Bonds, | 7/22 at 100.00 | A+ | 1,535,742 |
| | Refunding Senior Lien Series 2012A, 5.250%, 7/01/39 | | | |
| 15 | | Detroit, Michigan, Second Lien Sewerage Disposal System Revenue Bonds, Series 2005A, | 12/19 at 100.00 | A | 15,033 |
| | 4.500%, 7/01/35 – NPFG Insured | | | |
| 3,000 | | Detroit, Michigan, Senior Lien Sewerage Disposal System Revenue Bonds, Series 2001B, | No Opt. Call | A | 3,764,280 |
| | 5.500%, 7/01/29 – NPFG Insured | | | |
| 5 | | Detroit, Michigan, Water Supply System Revenue Bonds, Second Lien Series 2003B, 5.000%, | 12/19 at 100.00 | A+ | 5,014 |
| | 7/01/34 – NPFG Insured | | | |
| 5 | | Detroit, Michigan, Water Supply System Revenue Bonds, Senior Lien Series 2003A, 5.000%, | 12/19 at 100.00 | A2 | 5,013 |
| | 7/01/34 – NPFG Insured | | | |
| | Kalamazoo Hospital Finance Authority, Michigan, Hospital Revenue Refunding Bonds, | | | |
| | Bronson Methodist Hospital, Remarketed Series 2006: | | | |
| 895 | | 5.250%, 5/15/36 – AGM Insured | 5/20 at 100.00 | A2 | 914,207 |
| 1,105 | | 5.250%, 5/15/36 (Pre-refunded 5/15/20) – AGM Insured | 5/20 at 100.00 | A2 (4) | 1,128,415 |
| 1,950 | | Michigan Finance Authority, Local Government Loan Program Revenue Bonds, Detroit Water & | 7/22 at 100.00 | A+ | 2,093,637 |
| | Sewerage Department Water Supply System Local Project, Series 2014C-1, 5.000%, 7/01/44 | | | |
33
| | | | | |
| NUV | Nuveen Municipal Value Fund, Inc. | | | |
| Portfolio of Investments (continued) | | | |
| October 31, 2019 | | | |
|
|
|
| Principal | | | Optional Call | | |
| Amount (000) | | Description (1) | Provisions (2) | Ratings (3) | Value |
| | Michigan (continued) | | | |
| | Michigan Finance Authority, Revenue Bonds, Trinity Health Credit Group, Refunding
| | | |
| | | Series 2011MI: | | | |
| $ 15 | | 5.000%, 12/01/39 (Pre-refunded 12/01/21) | 12/21 at 100.00 | N/R (4) | $ 16,161 |
| 4,585 | | 5.000%, 12/01/39 | 12/21 at 100.00 | AA– | 4,898,110 |
| 5,000 | | Michigan Finance Authority, Revenue Bonds, Trinity Health Credit Group, Refunding Series | 6/22 at 100.00 | AA– | 5,426,900 |
| | 2015MI, 5.000%, 12/01/35 | | | |
| 3,315 | | Michigan Finance Authority, Senior Lien Distributable State Aid Revenue Bonds, Charter | 11/28 at 100.00 | Aa3 | 4,007,371 |
| | County of Wayne Criminal Justice Center Project, Series 2018, 5.000%, 11/01/43 | | | |
| 6,000 | | Michigan Hospital Finance Authority, Revenue Bonds, Ascension Health Senior Credit | 11/26 at 100.00 | AA+ | 6,511,320 |
| | Group, Refunding and Project Series 2010F-6, 4.000%, 11/15/47 | | | |
| 5,000 | | Michigan State Building Authority, Revenue Bonds, Facilities Program, Refunding Series | 10/21 at 100.00 | Aa2 | 5,366,000 |
| | 2011-II-A, 5.375%, 10/15/41 | | | |
| 10,000 | | Michigan State Building Authority, Revenue Bonds, Facilities Program, Refunding Series | 10/25 at 100.00 | Aa2 | 11,877,400 |
| | 2015-I, 5.000%, 4/15/30 | | | |
| 2,890 | | Oakland University, Michigan, General Revenue Bonds, Series 2012, 5.000%, 3/01/42 | 3/22 at 100.00 | A1 | 3,067,937 |
| 1,100 | | Wayne County Airport Authority, Michigan, Revenue Bonds, Detroit Metropolitan Wayne | 12/25 at 100.00 | A | 1,270,269 |
| | County Airport, Series 2015D, 5.000%, 12/01/45 | | | |
| 53,680 | | Total Michigan | | | 59,319,654 |
| | Minnesota – 0.3% | | | |
| 3,200 | | Rochester, Minnesota, Health Care Facilities Revenue Bonds, Mayo Clinic, Refunding | No Opt. Call | AA | 4,441,440 |
| | Series 2016B, 5.000%, 11/15/34 | | | |
| 1,480 | | University of Minnesota, General Obligation Bonds, Series 2016A, 5.000%, 4/01/41 | 4/26 at 100.00 | Aa1 | 1,751,994 |
| 4,680 | | Total Minnesota | | | 6,193,434 |
| | Missouri – 0.7% | | | |
| 3,465 | | Missouri Health and Educational Facilities Authority, Health Facilities Revenue Bonds, | 11/23 at 100.00 | A2 | 3,778,548 |
| | CoxHealth, Series 2013A, 5.000%, 11/15/48 | | | |
| 12,000 | | Missouri Health and Educational Facilities Authority, Revenue Bonds, SSM Health Care | 6/20 at 100.00 | AA– (4) | 12,261,840 |
| | System, Series 2010B, 5.000%, 6/01/30 (Pre-refunded 6/01/20) | | | |
| 15,465 | | Total Missouri | | | 16,040,388 |
| | Montana – 0.6% | | | |
| 1,115 | | Billings, Montana, Sewer System Revenue Bonds, Series 2017, 5.000%, 7/01/33 | 7/27 at 100.00 | AA+ | 1,367,012 |
| | Montana Facility Finance Authority, Healthcare Facility Revenue Bonds, Kalispell | | | |
| | Regional Medical Center, Series 2018B: | | | |
| 1,340 | | 5.000%, 7/01/30 | 7/28 at 100.00 | BBB | 1,590,593 |
| 1,415 | | 5.000%, 7/01/31 | 7/28 at 100.00 | BBB | 1,673,549 |
| 1,980 | | 5.000%, 7/01/32 | 7/28 at 100.00 | BBB | 2,334,559 |
| 2,135 | | 5.000%, 7/01/33 | 7/28 at 100.00 | BBB | 2,511,080 |
| 3,045 | | Montana Facility Finance Authority, Revenue Bonds, Billings Clinic Obligated Group, | 8/28 at 100.00 | AA– | 3,672,514 |
| | Series 2018A, 5.000%, 8/15/48 | | | |
| 11,030 | | Total Montana | | | 13,149,307 |
| | Nebraska – 0.2% | | | |
| 1,855 | | Central Plains Energy Project, Nebraska, Gas Project 3 Revenue Bonds, Series 2012, | 9/22 at 100.00 | A | 2,014,530 |
| | 5.000%, 9/01/42 | | | |
| 1,400 | | Douglas County Hospital Authority 3, Nebraska, Health Facilities Revenue Bonds, Nebraska | 11/25 at 100.00 | A | 1,588,888 |
| | Methodist Health System, Refunding Series 2015, 5.000%, 11/01/45 | | | |
| 3,255 | | Total Nebraska | | | 3,603,418 |
34
| | | | | | |
| Principal | | | Optional Call | | |
| Amount (000) | | Description (1) | Provisions (2) | Ratings (3) | Value |
| | Nevada – 3.2% | | | |
| $ 5,075 | | Clark County, Nevada, Airport Revenue Bonds, Subordinate Lien Series 2010B, 5.750%, | 1/20 at 100.00 | Aa3 | $ 5,109,662 |
| | 7/01/42 | | | |
| | Clark County, Nevada, General Obligation Bonds, Transportation Improvement, Limited Tax, | | | |
| | Additionally Secured by Pledged Revenue Series 2018B: | | | |
| 2,000 | | 5.000%, 12/01/33 | 12/28 at 100.00 | AA+ | 2,530,440 |
| 5,000 | | 5.000%, 12/01/35 | 12/28 at 100.00 | AA+ | 6,291,400 |
| 5,000 | | Humboldt County, Nevada, Pollution Control Revenue Bonds, Sierra Pacific Power Company | No Opt. Call | A+ | 5,050,500 |
| | Projects, Series 2016B, 1.850%, 10/01/29 (Mandatory Put 4/15/22) | | | |
| 5,000 | | Las Vegas Convention and Visitors Authority, Nevada, Convention Center Expansion Revenue | 7/28 at 100.00 | Aa3 | 5,986,900 |
| | Bonds, Series 2018B, 5.000%, 7/01/43 | | | |
| 8,500 | | Las Vegas Convention and Visitors Authority, Nevada, Revenue Bonds, Series 2018C, | 7/28 at 100.00 | Aa3 | 10,409,440 |
| | 5.250%, 7/01/43 | | | |
| | Las Vegas Valley Water District, Nevada, General Obligation Bonds, Refunding | | | |
| | Series 2015: | | | |
| 5,220 | | 5.000%, 6/01/33 | 12/24 at 100.00 | AA+ | 6,075,767 |
| 10,000 | | 5.000%, 6/01/34 | 12/24 at 100.00 | AA+ | 11,622,600 |
| 9,000 | | 5.000%, 6/01/39 | 12/24 at 100.00 | AA+ | 10,368,270 |
| 1,205 | | Las Vegas Valley Water District, Nevada, General Obligation Bonds, Refunding Water | 6/26 at 100.00 | AA+ | 1,425,696 |
| | Improvement Series 2016A, 5.000%, 6/01/41 | | | |
| 2,000 | | Reno, Nevada, Subordinate Lien Sales Tax Revenue Refunding Bonds, ReTrac-Reno | 12/28 at 100.00 | A3 | 2,396,300 |
| | Transpiration Rail Access Corridor Project, Series 2018A, 5.000%, 6/01/48 | | | |
| 250 | | Reno, Nevada, Subordinate Lien Sales Tax Revenue Refunding Bonds, ReTrac-Reno Transpiration | 12/28 at 100.00 | AA | 306,800 |
| | Rail Access Corridor Project, Series 2018B, 5.000%, 6/01/33 – AGM Insured | | | |
| 1,500 | | Sparks Tourism Improvement District 1, Legends at Sparks Marina, Nevada, Senior Sales | 11/19 at 100.00 | Ba2 | 1,530,300 |
| | Tax Revenue Bonds Series 2008A, 6.750%, 6/15/28 | | | |
| 59,750 | | Total Nevada | | | 69,104,075 |
| | New Jersey – 4.0% | | | |
| 930 | | New Jersey Economic Development Authority, Private Activity Bonds, The Goethals Bridge | 1/24 at 100.00 | AA | 1,039,684 |
| | Replacement Project, Series 2013, 5.125%, 1/01/39 – AGM Insured (AMT) | | | |
| 6,000 | | New Jersey Economic Development Authority, School Facilities Construction Bonds, | 12/26 at 100.00 | A– | 7,146,960 |
| | Refunding Series 2016BBB, 5.500%, 6/15/31 | | | |
| 5,990 | | New Jersey Economic Development Authority, School Facilities Construction Bonds, Series | No Opt. Call | AA | 7,213,937 |
| | 2005N-1, 5.500%, 9/01/25 – AGM Insured | | | |
| 4,000 | | New Jersey Economic Development Authority, School Facilities Construction Financing | 3/23 at 100.00 | A– | 4,387,320 |
| | Program Bonds, Refunding Series 2013NN, 5.000%, 3/01/25 | | | |
| 3,300 | | New Jersey Health Care Facilities Financing Authority, New Jersey, Revenue Bonds, Saint | 12/19 at 100.00 | BB+ | 3,310,461 |
| | Peters University Hospital, Series 2007, 5.750%, 7/01/37 | | | |
| 9,420 | | New Jersey Transportation Trust Fund Authority, Transportation System Bonds, Capital | No Opt. Call | A– | 6,626,593 |
| | Appreciation Series 2010A, 0.000%, 12/15/31 | | | |
| | New Jersey Transportation Trust Fund Authority, Transportation System Bonds, Refunding | | | |
| | Series 2006C: | | | |
| 30,000 | | 0.000%, 12/15/30 – FGIC Insured | No Opt. Call | A– | 22,035,900 |
| 27,000 | | 0.000%, 12/15/32 – AGM Insured | No Opt. Call | AA | 19,097,370 |
| 4,500 | | New Jersey Transportation Trust Fund Authority, Transportation System Bonds, Series | 6/23 at 100.00 | A– | 4,932,135 |
| | 2013AA, 5.000%, 6/15/29 | | | |
| | New Jersey Transportation Trust Fund Authority, Transportation System Bonds, | | | |
| | Series 2015AA: | | | |
| 2,750 | | 5.250%, 6/15/32 | 6/25 at 100.00 | A– | 3,158,100 |
| 2,150 | | 5.250%, 6/15/34 | 6/25 at 100.00 | A– | 2,463,320 |
| 2,000 | | New Jersey Turnpike Authority, Revenue Bonds, Series 2017B, 5.000%, 1/01/40 | 1/28 at 100.00 | A+ | 2,421,680 |
35
| | | | | |
| NUV | Nuveen Municipal Value Fund, Inc. | | | |
| Portfolio of Investments (continued) | | | |
| October 31, 2019 | | | |
|
|
| Principal | | | Optional Call | | |
| Amount (000) | | Description (1) | Provisions (2) | Ratings (3) | Value |
| | New Jersey (continued) | | | |
| $ 1,135 | | Rutgers State University, New Jersey, Revenue Bonds, Refunding Series 2013L, | 5/23 at 100.00 | Aa3 | $ 1,259,805 |
| | 5.000%, 5/01/43 | | | |
| 2,720 | | Tobacco Settlement Financing Corporation, New Jersey, Tobacco Settlement Asset-Backed | 6/28 at 100.00 | BB+ | 2,998,718 |
| | Bonds, Series 2018B, 5.000%, 6/01/46 | | | |
| 101,895 | | Total New Jersey | | | 88,091,983 |
| | New Mexico – 0.0% | | | |
| 245 | | University of New Mexico, Revenue Bonds, Refunding Series 1992A, 6.000%, 6/01/21 | No Opt. Call | AA– | 257,380 |
| | New York – 5.2% | | | |
| 3,750 | | Dormitory Authority of the State of New York, Lease Revenue Bonds, State University | 7/27 at 100.00 | Aa3 | 4,503,487 |
| | Dormitory Facilities, Series 2017A, 5.000%, 7/01/42 | | | |
| 1,950 | | Long Island Power Authority, New York, Electric System General Revenue Bonds, Series | 9/28 at 100.00 | A | 2,384,753 |
| | 2018, 5.000%, 9/01/39 | | | |
| 12,855 | | Long Island Power Authority, New York, Electric System Revenue Bonds, Series 2011A, | 5/21 at 100.00 | A (4) | 13,612,417 |
| | 5.000%, 5/01/38 (Pre-refunded 5/01/21) | | | |
| 9,850 | | New York City Industrial Development Authority, New York, PILOT Revenue Bonds, Yankee | 12/19 at 100.00 | Baa1 | 9,863,888 |
| | Stadium Project, Series 2006, 4.750%, 3/01/46 – NPFG Insured | | | |
| 10,000 | | New York City Transitional Finance Authority, New York, Building Aid Revenue Bonds, | 7/28 at 100.00 | AA | 12,146,700 |
| | Fiscal 2018, Series 2017S-3, 5.000%, 7/15/43 | | | |
| 7,000 | | New York City Transitional Finance Authority, New York, Building Aid Revenue Bonds, | 7/28 at 100.00 | AA | 8,630,510 |
| | Fiscal 2019 Subseries S-3A, 5.000%, 7/15/37 | | | |
| 11,755 | | New York Liberty Development Corporation, New York, Liberty Revenue Bonds, 3 World Trade | 11/24 at 100.00 | N/R | 12,972,113 |
| | Center Project, Class 1 Series 2014, 5.000%, 11/15/44, 144A | | | |
| 5,825 | | New York Liberty Development Corporation, New York, Liberty Revenue Bonds, 4 World Trade | 11/21 at 100.00 | A+ | 6,337,483 |
| | Center Project, Series 2011, 5.750%, 11/15/51 | | | |
| 8,500 | | New York Transportation Development Corporation, New York, Special Facility Revenue | 1/28 at 100.00 | Baa3 | 10,163,535 |
| | Bonds, Delta Air Lines, Inc – LaGuardia Airport Terminals C&D Redevelopment Project, | | | |
| | Series 2018, 5.000%, 1/01/33 (AMT) | | | |
| 8,270 | | New York Transportation Development Corporation, Special Facilities Bonds, LaGuardia | 7/24 at 100.00 | BBB | 9,146,537 |
| | Airport Terminal B Redevelopment Project, Series 2016A, 5.000%, 7/01/46 (AMT) | | | |
| 9,925 | | Port Authority of New York and New Jersey, Special Project Bonds, JFK International Air | 12/20 at 100.00 | BBB+ | 10,398,224 |
| | Terminal LLC Project, Eighth Series 2010, 6.000%, 12/01/42 | | | |
| 7,550 | | Triborough Bridge and Tunnel Authority, New York, General Purpose Revenue Bonds, MTA | 11/27 at 100.00 | AA– | 9,141,691 |
| | Bridges & Tunnels, Series 2017C-2, 5.000%, 11/15/42 | | | |
| 3,000 | | Triborough Bridge and Tunnel Authority, New York, General Purpose Revenue Bonds, | 5/25 at 100.00 | AA– | 3,458,280 |
| | Refunding Series 2015A, 5.000%, 11/15/50 | | | |
| 650 | | TSASC Inc, New York, Tobacco Settlement Asset-Backed Bonds, Fiscal 2017 Series B, | No Opt. Call | B– | 698,263 |
| | 5.000%, 6/01/24 | | | |
| 100,880 | | Total New York | | | 113,457,881 |
| | North Carolina – 1.0% | | | |
| 1,500 | | Charlotte-Mecklenberg Hospital Authority, North Carolina, Health Care Revenue Bonds, DBA | 1/21 at 100.00 | AA– | 1,564,305 |
| | Carolinas HealthCare System, Series 2011A, 5.125%, 1/15/37 | | | |
| 1,520 | | North Carolina Capital Facilities Finance Agency, Revenue Bonds, Duke University | 10/26 at 100.00 | AA+ | 1,818,467 |
| | Project, Refunding Series 2016B, 5.000%, 10/01/44 | | | |
| | North Carolina Department of Transportation, Private Activity Revenue Bonds, I-77 Hot | | | |
| | Lanes Project, Series 2015: | | | |
| 2,155 | | 5.000%, 12/31/37 (AMT) | 6/25 at 100.00 | BBB– | 2,421,487 |
| 4,175 | | 5.000%, 6/30/54 (AMT) | 6/25 at 100.00 | BBB– | 4,620,139 |
| 2,010 | | North Carolina Medical Care Commission, Health Care Facilities Revenue Bonds, Duke | 6/20 at 100.00 | N/R (4) | 2,053,275 |
| | University Health System, Series 2010A, 5.000%, 6/01/42 (Pre-refunded 6/01/20) | | | |
36
| | | | | | |
| Principal | | | Optional Call | | |
| Amount (000) | | Description (1) | Provisions (2) | Ratings (3) | Value |
| | North Carolina (continued) | | | |
| $ 1,000 | | North Carolina Medical Care Commission, Health Care Facilities Revenue Bonds, Novant | 11/20 at 100.00 | AA– | $ 1,027,170 |
| | Health Inc, Series 2010A, 4.750%, 11/01/43 | | | |
| 2,995 | | North Carolina Turnpike Authority, Monroe Expressway Toll Revenue Bonds, Series 2017A, | 7/26 at 100.00 | BBB | 3,400,553 |
| | 5.000%, 7/01/51 | | | |
| | North Carolina Turnpike Authority, Triangle Expressway System Revenue Bonds, Refunding | | | |
| | Senior Lien Series 2017: | | | |
| 1,625 | | 5.000%, 1/01/30 | 1/27 at 100.00 | BBB | 1,955,931 |
| 1,850 | | 5.000%, 1/01/32 | 1/27 at 100.00 | BBB | 2,210,658 |
| 18,830 | | Total North Carolina | | | 21,071,985 |
| | North Dakota – 0.5% | | | |
| 7,820 | | Fargo, North Dakota, Health System Revenue Bonds, Sanford Health, Refunding Series | 11/21 at 100.00 | A+ | 8,589,019 |
| | 2011, 6.250%, 11/01/31 | | | |
| 1,840 | | Grand Forks, North Dakota, Health Care System Revenue Bonds, Altru Health System | 12/27 at 100.00 | A– | 2,102,016 |
| | Obligated Group, Series 2017A, 5.000%, 12/01/42 | | | |
| 9,660 | | Total North Dakota | | | 10,691,035 |
| | Ohio – 3.8% | | | |
| | Buckeye Tobacco Settlement Financing Authority, Ohio, Tobacco Settlement Asset-Backed | | | |
| | Revenue Bonds, Senior Lien, Series 2007A-2: | | | |
| 12,205 | | 5.875%, 6/01/30 | 11/19 at 100.00 | CCC+ | 12,238,442 |
| 4,020 | | 6.000%, 6/01/42 | 11/19 at 100.00 | B– | 4,042,914 |
| 11,940 | | 5.875%, 6/01/47 | 11/19 at 100.00 | B– | 12,016,655 |
| 16,415 | | Buckeye Tobacco Settlement Financing Authority, Ohio, Tobacco Settlement Asset-Backed | 6/22 at 100.00 | CCC+ | 16,815,362 |
| | Revenue Bonds, Senior Lien, Series 2007A-3, 6.250%, 6/01/37 | | | |
| 1,195 | | Franklin County, Ohio, Hospital Revenue Bonds, Nationwide Children’s Hospital Project, | 11/27 at 100.00 | Aa2 | 1,473,997 |
| | Refunding & Improvement Series 2017A, 5.000%, 11/01/32 | | | |
| 3,485 | | Franklin County, Ohio, Revenue Bonds, Trinity Health Credit Group, Series 2017OH, | 6/27 at 100.00 | AA– | 3,771,641 |
| | 4.000%, 12/01/46 | | | |
| 5,000 | | Franklin County, Ohio, Sales Tax Revenue Bonds, Various Purpose Series 2018, | 6/28 at 100.00 | AAA | 6,139,800 |
| | 5.000%, 6/01/43 | | | |
| 1,730 | | Lucas County, Ohio, Hospital Revenue Bonds, ProMedica Healthcare Obligated Group, | 11/21 at 100.00 | BBB (4) | 1,895,353 |
| | Series 2011A, 6.000%, 11/15/41 (Pre-refunded 11/15/21) | | | |
| 13,000 | | Ohio Air Quality Development Authority, Ohio, Pollution Control Revenue Bonds, FirstEnergy | No Opt. Call | N/R | 13,942,500 |
| | Generation Corporation Project, Refunding Series 2009D, 4.250%, 8/01/29 (Mandatory | | | |
| | Put 9/15/21) (6) | | | |
| 4,110 | | Ohio State, Private Activity Bonds, Portsmouth Gateway Group, LLC – Borrower, Portsmouth | 6/25 at 100.00 | AA | 4,656,465 |
| | Bypass Project, Series 2015, 5.000%, 12/31/39 – AGM Insured (AMT) | | | |
| 4,975 | | Ohio Turnpike Commission, Turnpike Revenue Bonds, Infrastructure Project, Junior Lien | 2/23 at 100.00 | Aa3 | 5,476,928 |
| | Series 2013A-1, 5.000%, 2/15/48 | | | |
| 78,075 | | Total Ohio | | | 82,470,057 |
| | Oklahoma – 1.1% | | | |
| 1,225 | | Fort Sill Apache Tribe of Oklahoma Economic Development Authority, Gaming Enterprise | 8/21 at 100.00 | N/R | 1,353,625 |
| | Revenue Bonds, Fort Sill Apache Casino, Series 2011A, 8.500%, 8/25/26, 144A | | | |
| 4,000 | | Oklahoma City Water Utilities Trust, Oklahoma, Water and Sewer Revenue Bonds, Refunding | 7/26 at 100.00 | AAA | 4,799,600 |
| | Series 2016, 5.000%, 7/01/36 | | | |
| | Oklahoma Development Finance Authority, Health System Revenue Bonds, Integris Baptist | | | |
| | Medical Center, Refunding Series 2015A: | | | |
| 1,590 | | 5.000%, 8/15/27 | 8/25 at 100.00 | A+ | 1,887,171 |
| 1,250 | | 5.000%, 8/15/29 | 8/25 at 100.00 | A+ | 1,473,038 |
| 1,935 | | Oklahoma Development Finance Authority, Health System Revenue Bonds, OU Medicine | 8/28 at 100.00 | Baa3 | 2,315,324 |
| | Project, Series 2018B, 5.250%, 8/15/43 | | | |
37
| | | | | |
| NUV | Nuveen Municipal Value Fund, Inc. | | | |
| Portfolio of Investments (continued) | | | |
| October 31, 2019 | | | |
|
|
|
| Principal | | | Optional Call | | |
| Amount (000) | | Description (1) | Provisions (2) | Ratings (3) | Value |
| | Oklahoma (continued) | | | |
| $ 10,000 | | Oklahoma State Turnpike Authority, Turnpike System Revenue Bonds, Second Senior Series | 1/26 at 100.00 | AA– | $ 11,673,500 |
| | 2017A, 5.000%, 1/01/42 | | | |
| 20,000 | | Total Oklahoma | | | 23,502,258 |
| | Oregon – 0.7% | | | |
| 6,585 | | Oregon State Department of Transportation, Highway User Tax Revenue Bonds, Refunding | 5/27 at 100.00 | AAA | 8,259,171 |
| | Senior Lien Series 2017B, 5.000%, 11/15/28 | | | |
| 5,330 | | University of Oregon, General Revenue Bonds, Series 2018A, 5.000%, 4/01/48 | 4/28 at 100.00 | Aa2 | 6,456,815 |
| 11,915 | | Total Oregon | | | 14,715,986 |
| | Pennsylvania – 1.2% | | | |
| 2,500 | | Delaware River Port Authority, New Jersey and Pennsylvania, Revenue Bonds, Series 2018A, | 1/29 at 100.00 | A+ | 3,136,050 |
| | 5.000%, 1/01/36 | | | |
| 3,155 | | Geisinger Authority, Montour County, Pennsylvania, Health System Revenue Bonds, | 2/27 at 100.00 | AA | 3,737,287 |
| | Geisinger Health System, Series 2017A-2, 5.000%, 2/15/39 | | | |
| | Pennsylvania State University, Revenue Bonds, Refunding Series 2016A: | | | |
| 1,325 | | 5.000%, 9/01/35 | 9/26 at 100.00 | Aa1 | 1,603,714 |
| 2,000 | | 5.000%, 9/01/41 | 9/26 at 100.00 | Aa1 | 2,389,400 |
| | Pennsylvania Turnpike Commission, Motor License Fund-Enhanced Turnpike Special Revenue | | | |
| | Bonds, Subordinate Series 2011B: | | | |
| 1,310 | | 5.000%, 12/01/41 | 12/21 at 100.00 | A2 | 1,385,967 |
| 1,405 | | 5.000%, 12/01/41 (Pre-refunded 12/01/21) | 12/21 at 100.00 | N/R (4) | 1,516,796 |
| 7,500 | | Pennsylvania Turnpike Commission, Motor License Fund-Enhanced Turnpike Special Revenue | 12/22 at 100.00 | AA– | 8,103,600 |
| | Bonds, Subordinate Series 2013A, 5.000%, 12/01/43 | | | |
| 1,250 | | Pennsylvania Turnpike Commission, Motor License Fund-Enhanced Turnpike Subordinate | 12/26 at 100.00 | AA– | 1,306,975 |
| | Special Revenue Bonds, Series 2014A, 0.000%, 12/01/37 (5) | | | |
| 570 | | Pittsburgh Water and Sewer Authority, Pennsylvania, Water and Sewer System Revenue | 9/29 at 100.00 | AA | 654,673 |
| | Bonds, Refunding Subordinate Series 2019B, 4.000%, 9/01/34 – AGM Insured | | | |
| 1,350 | | Susquehanna Area Regional Airport Authority, Pennsylvania, Airport System Revenue Bonds, | 1/28 at 100.00 | Baa3 | 1,554,430 |
| | Series 2017, 5.000%, 1/01/38 (AMT) | | | |
| 22,365 | | Total Pennsylvania | | | 25,388,892 |
| | Puerto Rico – 1.2% | | | |
| | Puerto Rico Sales Tax Financing Corporation, Sales Tax Revenue Bonds, Restructured | | | |
| | 2018A-1: | | | |
| 6,031 | | 0.000%, 7/01/33 | 7/28 at 86.06 | N/R | 3,800,012 |
| 12,272 | | 4.500%, 7/01/34 | 7/25 at 100.00 | N/R | 13,114,841 |
| 8,993 | | 4.550%, 7/01/40 | 7/28 at 100.00 | N/R | 9,214,408 |
| 27,296 | | Total Puerto Rico | | | 26,129,261 |
| | South Carolina – 1.7% | | | |
| | Piedmont Municipal Power Agency, South Carolina, Electric Revenue Bonds, Series 2004A-2: | | | |
| 12,760 | | 0.000%, 1/01/28 – AGC Insured | No Opt. Call | AA | 10,828,519 |
| 9,535 | | 0.000%, 1/01/29 – AGC Insured | No Opt. Call | AA | 7,855,982 |
| 8,000 | | South Carolina Public Service Authority Santee Cooper Revenue Obligations, Refunding | 12/26 at 100.00 | A | 9,242,640 |
| | Series 2016B, 5.000%, 12/01/56 | | | |
| 5,500 | | South Carolina Public Service Authority, Santee Cooper Revenue Obligations, Refunding & | 6/25 at 100.00 | A | 6,228,585 |
| | Improvement Series 2015A, 5.000%, 12/01/50 | | | |
| 3,455 | | South Carolina Public Service Authority, Santee Cooper Revenue Obligations, Series | 6/24 at 100.00 | A | 3,922,254 |
| | 2014A, 5.500%, 12/01/54 | | | |
| 39,250 | | Total South Carolina | | | 38,077,980 |
38
| | | | | | |
| Principal | | | Optional Call | | |
| Amount (000) | | Description (1) | Provisions (2) | Ratings (3) | Value |
| | Tennessee – 0.6% | | | |
| $ 2,260 | | Metropolitan Government of Nashville-Davidson County, Tennessee, Water and Sewerage | 7/27 at 100.00 | AA | $ 2,717,628 |
| | Revenue Bonds, Green Series 2017A, 5.000%, 7/01/42 | | | |
| 3,000 | | Tennessee State School Bond Authority, Higher Educational Facilities Second Program | 11/27 at 100.00 | AA+ | 3,661,950 |
| | Bonds, Series 2017A, 5.000%, 11/01/42 | | | |
| 7,245 | | The Tennessee Energy Acquisition Corporation, Gas Revenue Bonds, Series 2006C, 4.000%, | 2/23 at 100.43 | A | 7,726,285 |
| | 5/01/48 (Mandatory Put 5/01/23) | | | |
| 12,505 | | Total Tennessee | | | 14,105,863 |
| | Texas – 15.3% | | | |
| 14,355 | | Bexar County Hospital District, Texas, Certificates of Obligation, Series 2018, 4.000%, | 2/27 at 100.00 | Aa1 | 15,874,333 |
| | 2/15/43 (UB) (7) | | | |
| 2,420 | | Central Texas Regional Mobility Authority, Revenue Bonds, Refunding Senior Lien Series | 1/23 at 100.00 | A– | 2,620,739 |
| | 2013A, 5.000%, 1/01/43 | | | |
| 7,500 | | Dallas-Fort Worth International Airport, Texas, Joint Revenue Bonds, Improvement Series | 11/21 at 100.00 | A+ | 7,961,925 |
| | 2012D, 5.000%, 11/01/38 (AMT) | | | |
| 240 | | Decatur Hospital Authority, Texas, Revenue Bonds, Wise Regional Health System, Series | 9/24 at 100.00 | BBB– | 263,664 |
| | 2014A, 5.250%, 9/01/44 | | | �� |
| 5,000 | | El Paso County Hospital District, Texas, General Obligation Bonds, Certificates of | 8/23 at 100.00 | A– | 5,353,900 |
| | Obligation Series 2013, 5.000%, 8/15/39 | | | |
| | Fort Bend County Municipal Utility District 50, Texas, General Obligation Bonds, | | | |
| | Series 2018A: | | | |
| 2,600 | | 4.000%, 9/01/46 – AGM Insured | 9/23 at 100.00 | AA | 2,699,502 |
| 5,500 | | 4.000%, 9/01/48 – AGM Insured | 9/23 at 100.00 | AA | 5,710,265 |
| 27,340 | | Grand Parkway Transportation Corporation, Texas, System Toll Revenue Bonds, Subordinate | 10/23 at 100.00 | AA+ | 30,400,986 |
| | Lien Series 2013B, 5.000%, 4/01/53 | | | |
| 2,845 | | Harris County Cultural Education Facilities Finance Corporation, Texas, Revenue Bonds, | 6/25 at 100.00 | AA | 3,049,100 |
| | Houston Methodist Hospital System, Series 2015, 4.000%, 12/01/45 | | | |
| 7,295 | | Harris County-Houston Sports Authority, Texas, Revenue Bonds, Capital Appreciation | 11/31 at 39.79 | AA | 2,086,370 |
| | Refunding Senior Lien Series 2014A, 0.000%, 11/15/50 – AGM Insured | | | |
| | Harris County-Houston Sports Authority, Texas, Revenue Bonds, Junior Lien Series 2001H: | | | |
| 845 | | 0.000%, 11/15/27 (ETM) | No Opt. Call | Baa2 (4) | 728,263 |
| 11,055 | | 0.000%, 11/15/27 | No Opt. Call | Baa2 | 9,022,759 |
| | Harris County-Houston Sports Authority, Texas, Revenue Bonds, Refunding Second Lien | | | |
| | Series 2014C: | | | |
| 425 | | 5.000%, 11/15/23 | No Opt. Call | A3 | 478,712 |
| 1,845 | | 5.000%, 11/15/32 | 11/24 at 100.00 | A3 | 2,096,732 |
| 14,905 | | Harris County-Houston Sports Authority, Texas, Revenue Bonds, Third Lien Series 2004A-3, | 11/24 at 59.10 | Baa2 | 7,587,986 |
| | 0.000%, 11/15/33 – NPFG Insured | | | |
| | Houston, Texas, Airport System Revenue Bonds, Refunding & Subordinate Lien Series 2018B: | | | |
| 1,590 | | 5.000%, 7/01/43 | 7/28 at 100.00 | A1 | 1,930,085 |
| 2,290 | | 5.000%, 7/01/48 | 7/28 at 100.00 | A1 | 2,764,351 |
| | Houston, Texas, Hotel Occupancy Tax and Special Revenue Bonds, Convention and | | | |
| | Entertainment Project, Series 2001B: | | | |
| 24,755 | | 0.000%, 9/01/29 – AMBAC Insured | No Opt. Call | A | 19,784,196 |
| 12,940 | | 0.000%, 9/01/30 – AMBAC Insured | No Opt. Call | A | 9,975,317 |
| 10,000 | | 0.000%, 9/01/31 – AMBAC Insured | No Opt. Call | A | 7,425,800 |
| 19,500 | | 0.000%, 9/01/32 – AMBAC Insured | No Opt. Call | A | 13,864,890 |
| 5,120 | | Leander Independent School District, Williamson and Travis Counties, Texas, General | 8/25 at 100.00 | AAA | 5,980,570 |
| | Obligation Bonds, Refunding Series 2015A, 5.000%, 8/15/39 | | | |
| 4,510 | | Leander Independent School District, Williamson and Travis Counties, Texas, General | 8/26 at 100.00 | AAA | 5,304,527 |
| | Obligation Bonds, Refunding Series 2016A, 5.000%, 8/15/49 | | | |
| 2,000 | | Love Field Airport Modernization Corporation, Texas, Special Facilities Revenue Bonds, | 11/22 at 100.00 | A3 | 2,175,580 |
| | Southwest Airlines Company – Love Field Modernization Program Project, Series 2012, | | | |
| | 5.000%, 11/01/28 (AMT) | | | |
39
| | | | | |
| NUV | Nuveen Municipal Value Fund, Inc. | | | |
| Portfolio of Investments (continued) | | | |
| October 31, 2019 | | | |
|
|
|
|
| Principal | | | Optional Call | | |
| Amount (000) | | Description (1) | Provisions (2) | Ratings (3) | Value |
| | Texas (continued) | | | |
| | Lubbock, Texas, Electric Light and Power System Revenue Bonds, Series 2018:
| | | |
| $ 2,170 | | 5.000%, 4/15/40 | 4/28 at 100.00 | AA– | $ 2,625,700 |
| 3,930 | | 5.000%, 4/15/43 | 4/28 at 100.00 | AA– | 4,730,344 |
| 1,750 | | Martin County Hospital District, Texas, Combination Limited Tax and Revenue Bonds, | 4/21 at 100.00 | BBB | 1,847,983 |
| | Series 2011A, 7.250%, 4/01/36 | | | |
| 5,420 | | North Texas Municipal Water District, Water System Revenue Bonds, Refunding & | 3/22 at 100.00 | AAA | 5,887,475 |
| | Improvement Series 2012, 5.000%, 9/01/26 | | | |
| | North Texas Tollway Authority, System Revenue Bonds, Refunding First Tier Capital | | | |
| | Appreciation Series 2008I: | | | |
| 30,000 | | 6.200%, 1/01/42 – AGC Insured | 1/25 at 100.00 | AA | 36,624,000 |
| 5,220 | | 6.500%, 1/01/43 | 1/25 at 100.00 | A+ | 6,466,014 |
| 15,450 | | North Texas Tollway Authority, System Revenue Bonds, Refunding First Tier, Series 2008D, | No Opt. Call | AA | 10,173,825 |
| | 0.000%, 1/01/36 – AGC Insured | | | |
| 9,020 | | North Texas Tollway Authority, System Revenue Bonds, Refunding First Tier, Series 2015B, | 1/23 at 100.00 | A+ | 9,920,737 |
| | 5.000%, 1/01/40 | | | |
| 8,000 | | North Texas Tollway Authority, System Revenue Bonds, Refunding Second Tier Series 2017B, | 1/27 at 100.00 | A | 9,433,600 |
| | 5.000%, 1/01/43 | | | |
| 9,100 | | North Texas Tollway Authority, System Revenue Bonds, Refunding Second Tier, Series | 1/25 at 100.00 | A | 10,544,261 |
| | 2015A, 5.000%, 1/01/32 | | | |
| 2,000 | | San Antonio Convention Center Hotel Finance Corporation, Texas, Contract Revenue | 12/19 at 100.00 | A | 2,001,320 |
| | Empowerment Zone Bonds, Series 2005A, 5.000%, 7/15/39 – AMBAC Insured (AMT) | | | |
| | Tarrant County Cultural Education Facilities Finance Corporation, Texas, Hospital | | | |
| | Revenue Bonds, Scott & White Healthcare Project, Series 2010: | | | |
| 355 | | 5.500%, 8/15/45 (Pre-refunded 8/15/20) | 8/20 at 100.00 | N/R (4) | 366,846 |
| 4,455 | | 5.500%, 8/15/45 (Pre-refunded 8/15/20) | 8/20 at 100.00 | N/R (4) | 4,603,663 |
| 1,750 | | Tarrant County Cultural Education Facilities Finance Corporation, Texas, Revenue Bonds, | 8/26 at 100.00 | AA | 2,060,345 |
| | Texas Health Resources System, Series 2016A, 5.000%, 2/15/41 | | | |
| 6,740 | | Texas Municipal Gas Acquisition and Supply Corporation I, Gas Supply Revenue Bonds, | No Opt. Call | A2 | 7,864,030 |
| | Senior Lien Series 2008D, 6.250%, 12/15/26 | | | |
| | Texas Municipal Gas Acquisition and Supply Corporation III, Gas Supply Revenue Bonds, | | | |
| | Series 2012: | | | |
| 2,500 | | 5.000%, 12/15/26 | 12/22 at 100.00 | A3 | 2,736,925 |
| 10,400 | | 5.000%, 12/15/32 | 12/22 at 100.00 | A3 | 11,275,368 |
| 7,180 | | Texas Transportation Commission, Central Texas Turnpike System Revenue Bonds, First | 8/22 at 100.00 | A | 7,727,475 |
| | Tier Refunding Series 2012A, 5.000%, 8/15/41 | | | |
| 3,000 | | Texas Transportation Commission, Central Texas Turnpike System Revenue Bonds, First | 8/24 at 100.00 | A | 3,422,250 |
| | Tier Refunding Series 2015B, 5.000%, 8/15/37 | | | |
| 1,750 | | Texas Transportation Commission, Central Texas Turnpike System Revenue Bonds, Second | 8/24 at 100.00 | BBB+ | 1,984,098 |
| | Tier Refunding Series 2015C, 5.000%, 8/15/33 | | | |
| 5,500 | | Texas Turnpike Authority, Central Texas Turnpike System Revenue Bonds, First Tier Series | No Opt. Call | A | 4,950,605 |
| | 2002A, 0.000%, 8/15/25 – AMBAC Insured | | | |
| | Texas Water Development Board, State Water Implementation Revenue Fund Bonds, Master | | | |
| | Trust Series 2017A: | | | |
| 12,500 | | 4.000%, 10/15/42 (UB) (7) | 10/27 at 100.00 | AAA | 13,979,625 |
| 6,500 | | 5.000%, 10/15/42 | 10/27 at 100.00 | AAA | 7,890,090 |
| 341,565 | | Total Texas | | | 334,257,131 |
| | Utah – 0.8% | | | |
| 5,345 | | Salt Lake City, Utah, Airport Revenue Bonds, International Airport Series 2017B, | 7/27 at 100.00 | A+ | 6,373,164 |
| | 5.000%, 7/01/42 | | | |
| 3,500 | | Salt Lake City, Utah, Airport Revenue Bonds, International Airport Series 2018B, | 7/28 at 100.00 | A+ | 4,239,445 |
| | 5.000%, 7/01/43 | | | |
40
| | | | | | |
| Principal | | | Optional Call | | |
| Amount (000) | | Description (1) | Provisions (2) | Ratings (3) | Value |
| | Utah (continued) | | | |
| | Salt Lake County, Utah, Sales Tax Revenue Bonds, TRCC Series 2017: | | | |
| $ 695 | | 5.000%, 2/01/36 | 2/27 at 100.00 | AAA | $ 843,487 |
| 1,150 | | 5.000%, 2/01/37 | 2/27 at 100.00 | AAA | 1,389,591 |
| | Utah Associated Municipal Power Systems, Revenue Bonds, Horse Butte Wind Project, | | | |
| | Refunding Series 2017A: | | | |
| 1,250 | | 5.000%, 9/01/29 | 3/28 at 100.00 | AA– | 1,548,725 |
| 1,000 | | 5.000%, 9/01/30 | 3/28 at 100.00 | AA– | 1,232,580 |
| 1,250 | | 5.000%, 9/01/31 | 3/28 at 100.00 | AA– | 1,530,562 |
| 660 | | 5.000%, 9/01/32 | 3/28 at 100.00 | AA– | 805,642 |
| 540 | | Utah Water Finance Agency, Revenue Bonds, Pooled Loan Financing Program, Series 2017A, | 3/27 at 100.00 | AA | 651,478 |
| | 5.000%, 3/01/37 | | | |
| 15,390 | | Total Utah | | | 18,614,674 |
| | Virginia – 2.3% | | | |
| 1,805 | | Chesapeake Bay Bridge and Tunnel District, Virginia, General Resolution Revenue Bonds, | 7/26 at 100.00 | BBB | 2,069,342 |
| | First Tier Series 2016, 5.000%, 7/01/46 | | | |
| 14,110 | | Metropolitan Washington Airports Authority, Virginia, Dulles Toll Road Revenue Bonds, | 4/22 at 100.00 | BBB+ | 15,075,547 |
| | Dulles Metrorail & Capital Improvement Projects, Refunding Second Senior Lien Series, | | | |
| | 2014A 5.000%, 10/01/53 | | | |
| 10,000 | | Metropolitan Washington Airports Authority, Virginia, Dulles Toll Road Revenue Bonds, | 10/28 at 100.00 | BBB+ | 13,329,300 |
| | Dulles Metrorail Capital Appreciation, Second Senior Lien Series 2010B, 6.500%, 10/01/44 | | | |
| 4,355 | | Tobacco Settlement Financing Corporation of Virginia, Tobacco Settlement Asset Backed | 11/19 at 100.00 | B– | 4,366,846 |
| | Bonds, Series 2007B1, 5.000%, 6/01/47 | | | |
| 4,350 | | Virginia Small Business Financing Authority, Private Activity Revenue Bonds, Transform | 6/27 at 100.00 | BBB | 4,985,796 |
| | 66 P3 Project, Senior Lien Series 2017, 5.000%, 12/31/52 (AMT) | | | |
| | Virginia Small Business Financing Authority, Senior Lien Revenue Bonds, Elizabeth River | | | |
| | Crossing, Opco LLC Project, Series 2012: | | | |
| 4,180 | | 5.250%, 1/01/32 (AMT) | 7/22 at 100.00 | BBB | 4,553,734 |
| 1,355 | | 6.000%, 1/01/37 (AMT) | 7/22 at 100.00 | BBB | 1,501,286 |
| 3,770 | | 5.500%, 1/01/42 (AMT) | 7/22 at 100.00 | BBB | 4,104,738 |
| 43,925 | | Total Virginia | | | 49,986,589 |
| | Washington – 3.2% | | | |
| | Port of Seattle, Washington, Revenue Bonds, Refunding Intermediate Lien Series 2016: | | | |
| 1,930 | | 5.000%, 2/01/29 | 2/26 at 100.00 | AA– | 2,312,912 |
| 1,000 | | 5.000%, 2/01/30 | 2/26 at 100.00 | AA– | 1,193,630 |
| | Spokane Public Facilities District, Washington, Hotel, Motel, and Sales Use Tax Revenue | | | |
| | Bonds, Series 2017: | | | |
| 1,175 | | 5.000%, 12/01/38 | 6/27 at 100.00 | A1 | 1,391,552 |
| 5,000 | | 5.000%, 12/01/41 | 6/27 at 100.00 | A1 | 5,885,100 |
| 1,390 | | Washington Health Care Facilities Authority, Revenue Bonds, CommonSpirit Health, Series | 8/29 at 100.00 | BBB+ | 1,504,744 |
| | 2019A-1, 4.000%, 8/01/44 | | | |
| 3,780 | | Washington Health Care Facilities Authority, Revenue Bonds, Fred Hutchinson Cancer | 1/21 at 100.00 | A+ | 3,926,362 |
| | Research Center, Series 2011A, 5.625%, 1/01/35 | | | |
| 2,400 | | Washington Health Care Facilities Authority, Revenue Bonds, Kadlec Regional Medical | 12/20 at 100.00 | N/R (4) | 2,508,000 |
| | Center, Series 2010, 5.375%, 12/01/33 (Pre-refunded 12/01/20) | | | |
| 12,000 | | Washington Health Care Facilities Authority, Revenue Bonds, Providence Health & | 10/22 at 100.00 | AA– | 13,183,320 |
| | Services, Refunding Series 2012A, 5.000%, 10/01/33 | | | |
| 1,310 | | Washington Health Care Facilities Authority, Revenue Bonds, Virginia Mason Medical | 8/27 at 100.00 | BBB | 1,534,639 |
| | Center, Series 2017, 5.000%, 8/15/30 | | | |
| | Washington State Convention Center Public Facilities District, Lodging Tax Revenue | | | |
| | Bonds, Series 2018: | | | |
| 2,715 | | 5.000%, 7/01/36 | 7/28 at 100.00 | A1 | 3,327,966 |
| 7,200 | | 5.000%, 7/01/48 | 7/28 at 100.00 | A1 | 8,518,032 |
| 3,000 | | 5.000%, 7/01/58 | 7/28 at 100.00 | A1 | 3,529,650 |
41
| | | | | |
| NUV | Nuveen Municipal Value Fund, Inc. | | | |
| Portfolio of Investments (continued) | | | |
| October 31, 2019 | | | |
|
|
|
| Principal | | | Optional Call | | |
| Amount (000) | | Description (1) | Provisions (2) | Ratings (3) | Value |
| | Washington (continued) | | | |
| | Washington State, Motor Vehicle Fuel Tax General Obligation Bonds, Series 2002-03C: | | | |
| $ 9,100 | | 0.000%, 6/01/29 – NPFG Insured | No Opt. Call | Aaa | $ 7,624,344 |
| 16,195 | | 0.000%, 6/01/30 – NPFG Insured | No Opt. Call | Aaa | 13,176,900 |
| 68,195 | | Total Washington | | | 69,617,151 |
| | West Virginia – 0.7% | | | |
| 1,830 | | West Virginia Hospital Finance Authority, Hospital Revenue Bonds, Cabell Huntington | 1/29 at 100.00 | BBB+ | 2,193,676 |
| | Hospital, Inc Project, Refunding & Improvement Series 2018A, 5.000%, 1/01/36 | | | |
| 3,750 | | West Virginia Hospital Finance Authority, Hospital Revenue Bonds, Charleston Area | 9/29 at 100.00 | Baa1 | 4,541,888 |
| | Medical Center, Refunding & Improvement Series 2019A, 5.000%, 9/01/39 | | | |
| 3,000 | | West Virginia Hospital Finance Authority, Hospital Revenue Bonds, West Virginia United | 6/23 at 100.00 | A | 3,340,530 |
| | Health System Obligated Group, Refunding & Improvement Series 2013A, 5.500%, 6/01/44 | | | |
| 3,570 | | West Virginia Parkways Authority, Turnpike Toll Revenue Bonds, Senior Lien Series 2018, | 6/28 at 100.00 | AA– | 4,355,614 |
| | 5.000%, 6/01/43 | | | |
| 12,150 | | Total West Virginia | | | 14,431,708 |
| | Wisconsin – 1.7% | | | |
| 2,375 | | Wisconsin Health and Educational Facilities Authority, Revenue Bonds, Marshfield Clinic, | 2/22 at 100.00 | A– | 2,515,838 |
| | Series 2012B, 5.000%, 2/15/40 | | | |
| 4,410 | | Wisconsin Health and Educational Facilities Authority, Revenue Bonds, Mercy Alliance, | 6/22 at 100.00 | A3 | 4,683,023 |
| | Inc, Series 2012, 5.000%, 6/01/39 | | | |
| | Wisconsin Health and Educational Facilities Authority, Revenue Bonds, Meriter Hospital, | | | |
| | Inc, Series 2011A: | | | |
| 3,500 | | 5.750%, 5/01/35 (Pre-refunded 5/01/21) | 5/21 at 100.00 | N/R (4) | 3,734,185 |
| 5,000 | | 6.000%, 5/01/41 (Pre-refunded 5/01/21) | 5/21 at 100.00 | N/R (4) | 5,352,200 |
| 6,600 | | Wisconsin Health and Educational Facilities Authority, Revenue Bonds, Ministry Health | 8/22 at 100.00 | N/R (4) | 7,281,780 |
| | Care, Inc, Refunding 2012C, 5.000%, 8/15/32 (Pre-refunded 8/15/22) | | | |
| 10,000 | | Wisconsin Health and Educational Facilities Authority, Revenue Bonds, SSM Healthcare | 6/20 at 100.00 | AA– (4) | 10,218,200 |
| | System, Series 2010A, 5.000%, 6/01/30 (Pre-refunded 6/01/20) | | | |
| 3,350 | | Wisconsin Health and Educational Facilities Authority, Wisconsin, Revenue Bonds, | 5/26 at 100.00 | AA+ | 3,617,966 |
| | Ascension Health Alliance Senior Credit Group, Series 2016A, 4.000%, 11/15/46 | | | |
| 35,235 | | Total Wisconsin | | | 37,403,192 |
| | Wyoming – 0.1% | | | |
| 1,850 | | West Park Hospital District, Wyoming, Hospital Revenue Bonds, Series 2011A, | 6/21 at 100.00 | BBB | 1,967,382 |
| | 7.000%, 6/01/40 | | | |
| $ 2,181,415 | | Total Long-Term Investments (cost $1,946,181,597) | | | 2,188,112,622 |
42
| | | | | | |
| Principal | | | Optional Call | | |
| Amount (000) | | Description (1) | Provisions (2) | Ratings (3) | Value |
| | SHORT-TERM INVESTMENTS – 0.4% | | | |
| | MUNICIPAL BONDS – 0.4% | | | |
| | National – 0.4% | | | |
| $ 7,920 | | JPMorgan Chase Putters / Drivers Trust Various States, Variable Rate Demand Obligations, | No Opt. Call | F1+ | $ 7,920,000 |
| | Series 2019, 1.470%, 6/01/21, 144A, (AMT) (Mandatory put 12/03/19) (8) | | | |
| $ 7,920 | | Total Short-Term Investments (cost $7,920,000) | | | 7,920,000 |
| | Total Investments (cost $1,954,101,597) – 100.4% | | | 2,196,032,622 |
| | Floating Rate Obligations – (1.4)% | | | (29,705,000) |
| | Other Assets Less Liabilities – 1.0% | | | 20,595,281 |
| | Net Assets Applicable to Common Shares – 100% | | | $ 2,186,922,903 |
| | |
(1) | All percentages shown in the Portfolio of Investments are based on net assets applicable to common shares unless otherwise noted. |
(2) | Optional Call Provisions: Dates (month and year) and prices of the earliest optional call or redemption. There may be other call provisions at varying prices at later dates. Certain mortgage-backed securities may be subject to periodic principal paydowns. Optional Call Provisions are not covered by the report of independent registered public accounting firm. |
(3) | For financial reporting purposes, the ratings disclosed are the highest of Standard & Poor’s Group (“Standard & Poor’s”), Moody’s Investors Service, Inc. (“Moody’s”) or Fitch, Inc. (“Fitch”) rating. This treatment of split-rated securities may differ from that used for other purposes, such as for Fund investment policies. Ratings below BBB by Standard & Poor’s, Baa by Moody’s or BBB by Fitch are considered to be below investment grade. Holdings designated N/R are not rated by any of these national rating agencies. Ratings are not covered by the report of independent registered public accounting firm. |
(4) | Backed by an escrow or trust containing sufficient U.S. Government or U.S. Government agency securities, which ensure the timely payment of principal and interest. |
(5) | Step-up coupon bond, a bond with a coupon that increases (“steps up”), usually at regular intervals, while the bond is outstanding. The rate shown is the coupon as of the end of the reporting period. |
(6) | Defaulted security. A security whose issuer has failed to fully pay principal and/or interest when due, or is under the protection of bankruptcy. |
(7) | Investment, or portion of investment, has been pledged to collateralize the net payment obligations for investments in inverse floating rate transactions. |
(8) | Investment has a maturity of greater than one year, but has variable rate and/or demand features which qualify it as a short-term investment. The rate disclosed, as well as the reference rate and spread, where applicable, is that in effect as of the end of the reporting period. This rate changes periodically based on market conditions or a specified market index. |
144A | Investment is exempt from registration under Rule 144A of the Securities Act of 1933, as amended. These investments may only be resold in transactions exempt from registration, which are normally those transactions with qualified institutional buyers. |
AMT | Alternative Minimum Tax |
ETM | Escrowed to maturity |
PIK | Payment-in-kind (“PIK”) security. Depending on the terms of the security, Income may be received in the form of cash, securities, or a combination of both. The PIK rate shown, where applicable, represents the annualized rate of the last PIK payment made by the issuer as of the end of the reporting period. |
UB | Underlying bond of an inverse floating rate trust reflected as a financing transaction. See Notes to Financial Statements, Note 4 – Portfolio Securities and Investments in Derivatives, Inverse Floating Rate Securities for more information. |
WI/DD | Purchased on a when-issued or delayed delivery basis. |
| See accompanying notes to financial statements. |
43
| | |
| NUW | Nuveen AMT-Free Municipal Value Fund Portfolio of Investments October 31, 2019 |
| | | | | | |
| Principal | | | Optional Call | | |
| Amount (000) | | Description (1) | Provisions (2) | Ratings (3) | Value |
| | LONG-TERM INVESTMENTS – 99.3% | | | |
| | MUNICIPAL BONDS – 99.3% | | | |
| | Alaska – 0.2% | | | |
| | Northern Tobacco Securitization Corporation, Alaska, Tobacco Settlement Asset-Backed | | | |
| | Bonds, Series 2006A: | | | |
| $ 110 | | 4.625%, 6/01/23 | 11/19 at 100.00 | A2 | $ 110,150 |
| 385 | | 5.000%, 6/01/46 | 11/19 at 100.00 | B3 | 385,523 |
| 495 | | Total Alaska | | | 495,673 |
| | Arizona – 1.6% | | | |
| 3,045 | | Salt Verde Financial Corporation, Arizona, Senior Gas Revenue Bonds, Citigroup Energy | No Opt. Call | A3 | 4,099,362 |
| | Inc Prepay Contract Obligations, Series 2007, 5.000%, 12/01/37 | | | |
| | California – 14.0% | | | |
| 1,790 | | Alameda Corridor Transportation Authority, California, Revenue Bonds, Refunding Second | 10/26 at 100.00 | BBB+ | 2,090,595 |
| | Subordinate Lien Series 2016B, 5.000%, 10/01/37 | | | |
| 1,730 | | Anaheim Public Financing Authority, California, Lease Revenue Bonds, Public Improvement | No Opt. Call | AA | 1,346,528 |
| | Project, Series 1997C, 0.000%, 9/01/30 – AGM Insured | | | |
| 340 | | California Pollution Control Financing Authority, Water Furnishing Revenue Bonds, San | 1/29 at 100.00 | BBB | 407,028 |
| | Diego County Water Authority Desalination Project Pipeline, Refunding Series 2019, 5.000%, | | | |
| | 11/21/45, 144A | | | |
| 500 | | California State, General Obligation Bonds, Tender Option Bond Trust 2016-XG0039, 16.320%, | 3/20 at 100.00 | AA | 527,040 |
| | 3/01/40 – AGM Insured, 144A (IF) (4) | | | |
| 540 | | Golden State Tobacco Securitization Corporation, California, Tobacco Settlement | 6/22 at 100.00 | N/R | 557,545 |
| | Asset-Backed Bonds, Series 2018A-1, 5.250%, 6/01/47 | | | |
| 2,040 | | Los Angeles Department of Airports, California, Revenue Bonds, Los Angeles International | 5/29 at 100.00 | AA– | 2,685,293 |
| | Airport, Private Activity/Non AMT Refunding Subordinate Series 2019C, 5.000%, 5/15/30 | | | |
| 450 | | M-S-R Energy Authority, California, Gas Revenue Bonds, Citigroup Prepay Contracts, | No Opt. Call | A | 705,334 |
| | Series 2009A, 6.500%, 11/01/39 | | | |
| 10,200 | | Palomar Pomerado Health, California, General Obligation Bonds, Series 2009A, 7.000%, | 8/29 at 100.00 | AA | 14,113,536 |
| | 8/01/38 – AGC Insured | | | |
| 1,030 | | Poway Unified School District, San Diego County, California, General Obligation Bonds, | No Opt. Call | AA– | 707,888 |
| | School Facilities Improvement District 2007-1, Series 2011A, 0.000%, 8/01/35 | | | |
| 2,470 | | San Francisco Airports Commission, California, Revenue Bonds, San Francisco | 5/27 at 100.00 | A+ | 2,952,885 |
| | International Airport, Governmental Purpose Second Series 2017B, 5.000%, 5/01/47 | | | |
| 12,955 | | San Ysidro School District, San Diego County, California, General Obligation Bonds, 1997 | No Opt. Call | AA | 8,250,910 |
| | Election Series 2012G, 0.000%, 8/01/35 – AGM Insured | | | |
| 5,185 | | San Ysidro School District, San Diego County, California, General Obligation Bonds, | 8/25 at 36.88 | AA | 1,631,045 |
| | Refunding Series 2015, 0.000%, 8/01/44 | | | |
| 700 | | Victor Elementary School District, San Bernardino County, California, General Obligation | No Opt. Call | Aa3 | 651,819 |
| | Bonds, Series 2002A, 0.000%, 8/01/24 – FGIC Insured | | | |
| 39,930 | | Total California | | | 36,627,446 |
| | Colorado – 9.4% | | | |
| 3,025 | | Colorado Health Facilities Authority, Colorado, Revenue Bonds, CommonSpirit Health, | 8/29 at 100.00 | BBB+ | 3,578,938 |
| | Series 2019A-2, 5.000%, 8/01/44 | | | |
| 2,000 | | Colorado Health Facilities Authority, Colorado, Revenue Bonds, SCL Health System, | 1/30 at 100.00 | AA– | 2,260,680 |
| | Refunding Series 2019B, 4.000%, 1/01/40 | | | |
44
| | | | | | |
| Principal | | | Optional Call | | |
| Amount (000) | | Description (1) | Provisions (2) | Ratings (3) | Value |
| | Colorado (continued) | | | |
| | Denver Convention Center Hotel Authority, Colorado, Revenue Bonds, Convention Center | | | |
| | Hotel, Refunding Senior Lien Series 2016: | | | |
| $ 1,000 | | 5.000%, 12/01/30 | 12/26 at 100.00 | Baa2 | $ 1,169,380 |
| 1,500 | | 5.000%, 12/01/36 | 12/26 at 100.00 | Baa2 | 1,724,250 |
| 3,540 | | Denver Health and Hospitals Authority, Colorado, Healthcare Revenue Bonds, Series 2019A, | 12/29 at 100.00 | BBB | 3,937,259 |
| | 4.000%, 12/01/37 | | | |
| 5,885 | | E-470 Public Highway Authority, Colorado, Toll Revenue Bonds, Series 2004A, 0.000%, | No Opt. Call | A | 3,941,773 |
| | 9/01/34 – NPFG Insured | | | |
| 3,605 | | E-470 Public Highway Authority, Colorado, Toll Revenue Bonds, Series 2004B, 0.000%, | 9/20 at 67.94 | A | 2,417,585 |
| | 9/01/27 – NPFG Insured | | | |
| 4,000 | | Park Creek Metropolitan District, Colorado, Senior Limited Property Tax Supported | 12/19 at 100.00 | AA (6) | 4,015,640 |
| | Revenue Bonds, Refunding Series 2009, 6.375%, 12/01/37 (Pre-refunded 12/01/19) – | | | |
| | AGC Insured | | | |
| 1,000 | | Public Authority for Colorado Energy, Natural Gas Purchase Revenue Bonds, Colorado | No Opt. Call | A+ | 1,523,630 |
| | Springs Utilities, Series 2008, 6.500%, 11/15/38 | | | |
| 25,555 | | Total Colorado | | | 24,569,135 |
| | Florida – 4.1% | | | |
| 1,055 | | Fort Myers, Florida, Utility System Revenue Bonds, Refunding Series 2019A, 4.000%, 10/01/44 | 10/28 at 100.00 | Aa3 | 1,184,427 |
| 500 | | Gainesville, Florida, Utilities System Revenue Bonds, Series 2017A, 5.000%, 10/01/37 | 10/27 at 100.00 | AA– | 611,590 |
| 1,605 | | Lakeland, Florida, Hospital System Revenue Bonds, Lakeland Regional Health, Series 2015, | 11/24 at 100.00 | A2 | 1,804,229 |
| | 5.000%, 11/15/45 | | | |
| 535 | | Miami Beach Redevelopment Agency, Florida, Tax Increment Revenue Bonds, City | 2/24 at 100.00 | AA | 603,496 |
| | Center/Historic Convention Village, Series 2015A, 5.000%, 2/01/44 – AGM Insured | | | |
| 3,350 | | Miami-Dade County, Florida, Water and Sewer System Revenue Bonds, Refunding Series | 10/25 at 100.00 | AA– | 3,954,273 |
| | 2017B, 5.000%, 10/01/32 | | | |
| 510 | | Putnam County Development Authority, Florida, Pollution Control Revenue Bonds, Seminole | 5/28 at 100.00 | A– | 606,395 |
| | Electric Cooperative, Inc Project, Refunding Series 2018B, 5.000%, 3/15/42 | | | |
| 375 | | Tolomato Community Development District, Florida, Special Assessment Bonds, Convertible, | 5/22 at 100.00 | N/R | 323,636 |
| | Capital Appreciation, Series 2012A-4, 0.000%, 5/01/40 (5) | | | |
| 525 | | Tolomato Community Development District, Florida, Special Assessment Bonds, Hope Note, | 12/19 at 100.00 | N/R | 5 |
| | Series 2007-3, 6.450%, 5/01/23 (7) | | | |
| 1,315 | | Tolomato Community Development District, Florida, Special Assessment Bonds, Refunding | 12/19 at 100.00 | N/R | 1,127,297 |
| | Series 2015-1, 0.000%, 5/01/40 | | | |
| 805 | | Tolomato Community Development District, Florida, Special Assessment Bonds, Refunding | 12/19 at 100.00 | N/R | 566,632 |
| | Series 2015-2, 0.000%, 5/01/40 | | | |
| 880 | | Tolomato Community Development District, Florida, Special Assessment Bonds, Refunding | 12/19 at 100.00 | N/R | 9 |
| | Series 2015-3, 6.610%, 5/01/40 (7) | | | |
| 11,455 | | Total Florida | | | 10,781,989 |
| | Georgia – 4.3% | | | |
| 2,470 | | Burke County Development Authority, Georgia, Pollution Control Revenue Bonds, Georgia | No Opt. Call | A– | 2,511,422 |
| | Power Company, Fourth Series 1994, 2.250%, 10/01/32 (Mandatory Put 5/25/23) | | | |
| 1,000 | | Clayton County Development Authority, Georgia, Special Facilities Revenue Bonds, Delta | 6/20 at 100.00 | Baa3 | 1,041,180 |
| | Air Lines, Inc Project, Series 2009A, 8.750%, 6/01/29 | | | |
| 2,000 | | Gainesville and Hall County Hospital Authority, Georgia, Revenue Anticipation | 2/27 at 100.00 | AA | 2,468,620 |
| | Certificates, Northeast Georgia Health Services Inc, Series 2017B, 5.500%, 2/15/42 | | | |
| 1,470 | | Municipal Electric Authority of Georgia, General Resolution Projects Subordinated Bonds, | 1/28 at 100.00 | A1 | 1,730,631 |
| | Series 20188HH, 5.000%, 1/01/44 | | | |
| 2,000 | | Municipal Electric Authority of Georgia, Project One Revenue Bonds, Subordinate Lien | 1/25 at 100.00 | A2 | 2,259,740 |
| | Series 2015A, 5.000%, 1/01/35 | | | |
45
| | | | | |
| NUW | Nuveen AMT-Free Municipal Value Fund | | |
| Portfolio of Investments (continued) | | | |
| October 31, 2019 | | | |
|
|
| Principal | | | Optional Call | | |
| Amount (000) | | Description (1) | Provisions (2) | Ratings (3) | Value |
| | Georgia (continued) | | | |
| $ 1,000 | | Private Colleges and Universities Authority, Georgia, Revenue Bonds, Emory University, | 10/26 at 100.00 | AA | $ 1,187,290 |
| | Refunding Series 2016A, 5.000%, 10/01/46 | | | |
| 9,940 | | Total Georgia | | | 11,198,883 |
| | Illinois – 8.9% | | | |
| 2,000 | | Chicago Board of Education, Illinois, Dedicated Capital Improvement Tax Revenue Bonds, | 4/27 at 100.00 | A | 2,389,420 |
| | Series 2016, 6.000%, 4/01/46 | | | |
| | Chicago, Illinois, General Obligation Bonds, City Colleges, Series 1999: | | | |
| 470 | | 0.000%, 1/01/33 – FGIC Insured | No Opt. Call | BBB+ | 307,939 |
| 3,000 | | 0.000%, 1/01/37 – FGIC Insured | No Opt. Call | BBB+ | 1,667,730 |
| 2,000 | | Cook County, Illinois, Sales Tax Revenue Bonds, Series 2017, 5.000%, 11/15/38 | 11/27 at 100.00 | AA | 2,364,900 |
| 1,800 | | Evanston, Cook County, Illinois, General Obligation Bonds, Corporate Purpose Series | 12/29 at 100.00 | AA+ | 2,192,364 |
| | 2019A, 5.000%, 12/01/43 | | | |
| 3,500 | | Illinois Finance Authority, State of Illinois Clean Water Initiative Revolving Fund | 1/27 at 100.00 | AAA | 4,205,145 |
| | Revenue Bonds, Series 2017, 5.000%, 7/01/37 | | | |
| 1,500 | | Illinois State, General Obligation Bonds, November Series 2017D, 5.000%, 11/01/27 | No Opt. Call | BBB | 1,720,545 |
| 525 | | Illinois State, General Obligation Bonds, October Series 2016, 5.000%, 2/01/29 | 2/27 at 100.00 | BBB | 597,544 |
| 11,420 | | Metropolitan Pier and Exposition Authority, Illinois, Revenue Bonds, McCormick Place | No Opt. Call | BBB | 6,244,799 |
| | Expansion Project, Series 2002A, 0.000%, 12/15/37 – NPFG Insured | | | |
| 615 | | University of Illinois, Health Services Facilities System Revenue Bonds, Series 2013, | 10/23 at 100.00 | A– | 695,959 |
| | 6.000%, 10/01/42 | | | |
| | Will County Community Unit School District 201U, Crete-Monee, Illinois, General | | | |
| | Obligation Bonds, Capital Appreciation Series 2004: | | | |
| 300 | | 0.000%, 11/01/23 – NPFG Insured (ETM) | No Opt. Call | Baa2 (6) | 281,622 |
| 745 | | 0.000%, 11/01/23 – FGIC Insured | No Opt. Call | A+ | 686,793 |
| 27,875 | | Total Illinois | | | 23,354,760 |
| | Indiana – 0.5% | | | |
| 1,500 | | Indianapolis Local Public Improvement Bond Bank, Indiana, Series 1999E, 0.000%, 2/01/25 – | No Opt. Call | AA | 1,384,560 |
| | AMBAC Insured | | | |
| | Iowa – 1.2% | | | |
| 3,075 | | Iowa Tobacco Settlement Authority, Asset Backed Settlement Revenue Bonds, Series 2005C, | 12/19 at 100.00 | B– | 3,075,615 |
| | 5.375%, 6/01/38 | | | |
| | Kentucky – 3.3% | | | |
| 1,150 | | Kenton County Airport Board, Kentucky, Airport Revenue Bonds, Cincinnati/Northern | 1/26 at 100.00 | A1 | 1,379,448 |
| | Kentucky International Airport, Series 2016, 5.000%, 1/01/29 | | | |
| 2,500 | | Kentucky Economic Development Finance Authority, Louisville Arena Project Revenue Bonds, | 12/22 at 100.00 | AA | 2,720,750 |
| | Louisville Arena Authority, Inc, Series 2017A, 5.000%, 12/01/47 – AGM Insured | | | |
| 3,750 | | Kentucky Economic Development Finance Authority, Revenue Bonds, Next Generation Kentucky | 7/25 at 100.00 | BBB+ | 4,107,787 |
| | Information Highway Project, Senior Series 2015A, 5.000%, 1/01/45 | | | |
| 325 | | Louisville-Jefferson County Metropolitan Government, Kentucky, Environmental Facilities | No Opt. Call | A1 | 326,970 |
| | Revenue, Louisville Gas & Electric Company Project, Refunding Series 2007A, 1.650%, 6/01/33 | | | |
| | (Mandatory Put 6/01/21) | | | |
| 7,725 | | Total Kentucky | | | 8,534,955 |
| | Maryland – 3.7% | | | |
| | Baltimore, Maryland, Convention Center Hotel Revenue Bonds, Refunding Series 2017: | | | |
| 1,000 | | 5.000%, 9/01/32 | 9/27 at 100.00 | BBB– | 1,181,560 |
| 2,250 | | 5.000%, 9/01/34 | 9/27 at 100.00 | BBB– | 2,612,453 |
| 5,000 | | Maryland Health and Higher Educational Facilities Authority, Revenue Bonds, MedStar | 5/27 at 100.00 | A | 5,880,150 |
| | Health Issue, Series 2017A, 5.000%, 5/15/42 | | | |
| 8,250 | | Total Maryland | | | 9,674,163 |
46
| | | | | | |
| Principal | | | Optional Call | | |
| Amount (000) | | Description (1) | Provisions (2) | Ratings (3) | Value |
| | Michigan – 1.7% | | | |
| $ 3,000 | | Michigan Finance Authority, Michigan, Revenue Bonds, Trinity Health Credit Group, | 12/22 at 100.00 | AA– | $ 3,262,950 |
| | Refunding Series 2017A-MI, 5.000%, 12/01/47 | | | |
| 1,000 | | Michigan Finance Authority, Senior Lien Distributable State Aid Revenue Bonds, Charter | 11/28 at 100.00 | Aa3 | 1,208,860 |
| | County of Wayne Criminal Justice Center Project, Series 2018, 5.000%, 11/01/43 | | | |
| 4,000 | | Total Michigan | | | 4,471,810 |
| | Minnesota – 1.9% | | | |
| 1,145 | | Rochester, Minnesota, Electric Utility Revenue Bonds, Refunding Series 2017A, | 12/26 at 100.00 | Aa3 | 1,353,699 |
| | 5.000%, 12/01/47 | | | |
| | Southern Minnesota Municipal Power Agency, Badger Coulee Project Revenue Bonds, | | | |
| | Series 2019A: | | | |
| 700 | | 5.000%, 1/01/32 | 1/30 at 100.00 | AA– | 903,567 |
| 1,120 | | 5.000%, 1/01/33 | 1/30 at 100.00 | AA– | 1,440,611 |
| 1,000 | | University of Minnesota, General Obligation Bonds, Series 2017A, 5.000%, 9/01/36 | 9/27 at 100.00 | Aa1 | 1,233,680 |
| 3,965 | | Total Minnesota | | | 4,931,557 |
| | Nebraska – 0.2% | | | |
| 500 | | Central Plains Energy Project, Nebraska, Gas Project 3 Revenue Bonds, Series 2012, | 9/22 at 100.00 | A | 543,000 |
| | 5.000%, 9/01/42 | | | |
| | Nevada – 6.4% | | | |
| 3,000 | | Clark County, Nevada, General Obligation Bonds, Transportation Improvement, Limited Tax, | 12/28 at 100.00 | AA+ | 3,795,660 |
| | Additionally Secured by Pledged Revenue Series 2018B, 5.000%, 12/01/33 | | | |
| 4,000 | | Las Vegas Convention and Visitors Authority, Nevada, Revenue Bonds, Series 2018C, | 7/28 at 100.00 | Aa3 | 4,898,560 |
| | 5.250%, 7/01/43 | | | |
| | Las Vegas Convention and Visitors Authority, Nevada, Revenue Bonds, Series 2019B: | | | |
| 3,015 | | 5.000%, 7/01/36 | 7/29 at 100.00 | Aa3 | 3,745,745 |
| 1,665 | | 5.000%, 7/01/37 | 7/29 at 100.00 | Aa3 | 2,062,336 |
| 2,000 | | Las Vegas Valley Water District, Nevada, General Obligation Bonds, Refunding Series | 12/24 at 100.00 | AA+ | 2,304,060 |
| | 2015, 5.000%, 6/01/39 | | | |
| 13,680 | | Total Nevada | | | 16,806,361 |
| | New Jersey – 2.9% | | | |
| 935 | | New Jersey Economic Development Authority, School Facilities Construction Bonds, Series | No Opt. Call | A– | 1,153,846 |
| | 2005N-1, 5.500%, 9/01/27 – NPFG Insured | | | |
| 1,000 | | New Jersey Economic Development Authority, School Facilities Construction Financing | 3/21 at 100.00 | A– | 1,046,130 |
| | Program Bonds, Refunding Series 2011GG, 5.000%, 9/01/22 | | | |
| 1,250 | | New Jersey Economic Development Authority, School Facility Construction Bonds, Series | No Opt. Call | A– | 1,255,663 |
| | 2005K, 5.500%, 12/15/19 – AMBAC Insured | | | |
| 5,020 | | New Jersey Transportation Trust Fund Authority, Transportation System Bonds, Capital | No Opt. Call | A– | 3,531,369 |
| | Appreciation Series 2010A, 0.000%, 12/15/31 | | | |
| 255 | | New Jersey Transportation Trust Fund Authority, Transportation System Bonds, Series | 6/25 at 100.00 | A– | 288,466 |
| | 2015AA, 5.250%, 6/15/41 | | | |
| 355 | | Tobacco Settlement Financing Corporation, New Jersey, Tobacco Settlement Asset-Backed | 6/28 at 100.00 | BB+ | 391,377 |
| | Bonds, Series 2018B, 5.000%, 6/01/46 | | | |
| 8,815 | | Total New Jersey | | | 7,666,851 |
| | New York – 4.1% | | | |
| 3,000 | | Liberty Development Corporation, New York, Goldman Sachs Headquarters Revenue Bonds | No Opt. Call | A | 4,286,430 |
| | Series 2007, 5.500%, 10/01/37 | | | |
| 1,500 | | Long Island Power Authority, New York, Electric System General Revenue Bonds, Series | 9/27 at 100.00 | A | 1,795,005 |
| | 2017, 5.000%, 9/01/42 | | | |
| 2,050 | | Long Island Power Authority, New York, Electric System General Revenue Bonds, Series | 9/28 at 100.00 | A | 2,507,048 |
| | 2018, 5.000%, 9/01/39 | | | |
47
| | | | | |
| NUW | Nuveen AMT-Free Municipal Value Fund | | |
| Portfolio of Investments (continued) | | | |
| October 31, 2019 | | | |
|
|
|
| Principal | | | Optional Call | | |
| Amount (000) | | Description (1) | Provisions (2) | Ratings (3) | Value |
| | New York (continued) | | | |
| $ 1,500 | | New York Liberty Development Corporation, New York, Liberty Revenue Bonds, 4 World Trade | 11/21 at 100.00 | A+ | $ 1,631,970 |
| | Center Project, Series 2011, 5.750%, 11/15/51 | | | |
| 430 | | Port Authority of New York and New Jersey, Special Project Bonds, JFK International Air | 12/20 at 100.00 | BBB+ | 450,502 |
| | Terminal LLC Project, Eighth Series 2010, 6.000%, 12/01/42 | | | |
| 8,480 | | Total New York | | | 10,670,955 |
| | North Carolina – 2.2% | | | |
| 1,000 | | North Carolina Capital Facilities Finance Agency, Revenue Bonds, Duke University | 10/26 at 100.00 | AA+ | 1,199,720 |
| | Project, Refunding Series 2016B, 5.000%, 7/01/42 | | | |
| 2,360 | | North Carolina Medical Care Commission, Health Care Facilities Revenue Bonds, Novant | 11/20 at 100.00 | AA– | 2,424,121 |
| | Health Inc, Series 2010A, 4.750%, 11/01/43 | | | |
| | North Carolina Turnpike Authority, Triangle Expressway System Revenue Bonds, Refunding | | | |
| | Senior Lien Series 2017: | | | |
| 1,095 | | 5.000%, 1/01/31 – AGM Insured | 1/27 at 100.00 | AA | 1,314,909 |
| 700 | | 5.000%, 1/01/32 | 1/27 at 100.00 | BBB | 836,465 |
| 5,155 | | Total North Carolina | | | 5,775,215 |
| | Ohio – 3.1% | | | |
| | Buckeye Tobacco Settlement Financing Authority, Ohio, Tobacco Settlement Asset-Backed | | | |
| | Revenue Bonds, Senior Lien, Series 2007A-2: | | | |
| 2,115 | | 5.875%, 6/01/30 | 11/19 at 100.00 | CCC+ | 2,120,795 |
| 5,910 | | 6.500%, 6/01/47 | 11/19 at 100.00 | B– | 6,044,216 |
| 8,025 | | Total Ohio | | | 8,165,011 |
| | Oklahoma – 0.1% | | | |
| 255 | | Oklahoma Development Finance Authority, Health System Revenue Bonds, OU Medicine | 8/28 at 100.00 | Baa3 | 305,120 |
| | Project, Series 2018B, 5.250%, 8/15/43 | | | |
| | Puerto Rico – 2.6% | | | |
| | Puerto Rico Sales Tax Financing Corporation, Sales Tax Revenue Bonds, Restructured 2018A-1: | | | |
| 2,014 | | 4.500%, 7/01/34 | 7/25 at 100.00 | N/R | 2,152,322 |
| 4,615 | | 4.550%, 7/01/40 | 7/28 at 100.00 | N/R | 4,728,621 |
| 6,629 | | Total Puerto Rico | | | 6,880,943 |
| | South Carolina – 1.7% | | | |
| 5,435 | | Piedmont Municipal Power Agency, South Carolina, Electric Revenue Bonds, Series 2004A-2, | No Opt. Call | AA | 4,477,951 |
| | 0.000%, 1/01/29 – AGC Insured | | | |
| | Tennessee – 2.1% | | | |
| 605 | | Metropolitan Government of Nashville-Davidson County, Tennessee, Water and Sewerage | 7/27 at 100.00 | AA | 727,506 |
| | Revenue Bonds, Green Series 2017A, 5.000%, 7/01/42 | | | |
| 4,000 | | The Tennessee Energy Acquisition Corporation, Gas Revenue Bonds, Series 2006B, | No Opt. Call | BBB | 4,885,160 |
| | 5.625%, 9/01/26 | | | |
| 4,605 | | Total Tennessee | | | 5,612,666 |
| | Texas – 11.1% | | | |
| 1,000 | | Austin Community College District Public Facility Corporation, Texas, Lease Revenue | 8/27 at 100.00 | AA | 1,198,840 |
| | Bonds, Highland Campus – Building 3000 Project, Series 2018A, 5.000%, 8/01/42 | | | |
| 2,000 | | Austin, Texas, Electric Utility System Revenue Bonds, Refunding Series 2017, 5.000%, 11/15/35 | 11/26 at 100.00 | AA | 2,416,760 |
| 1,855 | | Grand Parkway Transportation Corporation, Texas, System Toll Revenue Bonds, First Tier | 10/23 at 100.00 | A+ | 2,086,949 |
| | Series 2013A, 5.500%, 4/01/53 | | | |
| | Houston, Texas, Hotel Occupancy Tax and Special Revenue Bonds, Convention and | | | |
| | Entertainment Project, Series 2001B: | | | |
| 3,000 | | 0.000%, 9/01/32 – AMBAC Insured | No Opt. Call | A | 2,133,060 |
| 7,935 | | 0.000%, 9/01/33 – AMBAC Insured | No Opt. Call | A | 5,395,959 |
48
| | | | | | |
| Principal | | | Optional Call | | |
| Amount (000) | | Description (1) | Provisions (2) | Ratings (3) | Value |
| | Texas (continued) | | | |
| $ 915 | | North Texas Tollway Authority, System Revenue Bonds, Refunding First Tier, Series 2015B, | 1/25 at 100.00 | A+ | $ 1,038,681 |
| | 5.000%, 1/01/45 | | | |
| 250 | | Tarrant County Cultural Education Facilities Finance Corporation, Texas, Revenue Bonds, | 8/26 at 100.00 | AA | 294,335 |
| | Texas Health Resources System, Series 2016A, 5.000%, 2/15/41 | | | |
| 1,500 | | Texas Municipal Gas Acquisition and Supply Corporation III, Gas Supply Revenue Bonds, | 12/22 at 100.00 | A3 | 1,626,255 |
| | Series 2012, 5.000%, 12/15/32 | | | |
| 7,635 | | Texas Water Development Board, State Water Implementation Revenue Fund Bonds, Master | 10/26 at 100.00 | AAA | 8,466,986 |
| | Trust Series 2016, 4.000%, 10/15/41 | | | |
| 2,500 | | Texas Water Development Board, State Water Implementation Revenue Fund Bonds, Master | 10/27 at 100.00 | AAA | 2,795,925 |
| | Trust Series 2017A, 4.000%, 10/15/42 (UB) (4) | | | |
| | Wylie Independent School District, Collin County, Texas, General Obligation Bonds, | | | |
| | School Building Series 2010: | | | |
| 2,000 | | 0.000%, 8/15/33 | 8/20 at 50.47 | AAA | 995,960 |
| 1,945 | | 0.000%, 8/15/38 | 8/20 at 37.79 | AAA | 724,415 |
| 32,535 | | Total Texas | | | 29,174,125 |
| | Utah – 0.6% | | | |
| 1,405 | | Salt Lake City, Utah, Airport Revenue Bonds, International Airport Series 2017B, | 7/27 at 100.00 | A+ | 1,675,266 |
| | 5.000%, 7/01/42 | | | |
| | Virginia – 1.5% | | | |
| 1,160 | | Chesapeake Bay Bridge and Tunnel District, Virginia, General Resolution Revenue Bonds, | 7/26 at 100.00 | BBB | 1,327,701 |
| | First Tier Series 2016, 5.000%, 7/01/51 | | | |
| 1,400 | | Chesapeake, Virginia, Transportation System Senior Toll Road Revenue Bonds, Capital | 7/28 at 100.00 | BBB | 1,387,708 |
| | Appreciation Series 2012B, 0.000%, 7/15/40 (5) | | | |
| 1,000 | | Metropolitan Washington Airports Authority, Virginia, Dulles Toll Road Revenue Bonds, | 4/22 at 100.00 | BBB+ | 1,068,430 |
| | Dulles Metrorail & Capital Improvement Projects, Refunding Second Senior Lien Series 2014A, | | | |
| | 5.000%, 10/01/53 | | | |
| 3,560 | | Total Virginia | | | 3,783,839 |
| | Washington – 3.2% | | | |
| 3,330 | | Chelan County Public Utility District 1, Washington, Columbia River-Rock Island | No Opt. Call | AA+ | 2,750,613 |
| | Hydro-Electric System Revenue Refunding Bonds, Series 1997A, 0.000%, 6/01/29 – | | | |
| | NPFG Insured | | | |
| 690 | | Washington Health Care Facilities Authority, Revenue Bonds, Virginia Mason Medical | 8/27 at 100.00 | BBB | 808,321 |
| | Center, Series 2017, 5.000%, 8/15/30 | | | |
| | Washington State Convention Center Public Facilities District, Lodging Tax Revenue | | | |
| | Bonds, Series 2018: | | | |
| 2,000 | | 5.000%, 7/01/43 | 7/28 at 100.00 | AA– | 2,413,820 |
| 2,015 | | 5.000%, 7/01/48 | 7/28 at 100.00 | A1 | 2,383,866 |
| 8,035 | | Total Washington | | | 8,356,620 |
| | West Virginia – 2.3% | | | |
| 235 | | West Virginia Hospital Finance Authority, Hospital Revenue Bonds, Cabell Huntington | 1/29 at 100.00 | BBB+ | 281,701 |
| | Hospital, Inc Project, Refunding & Improvement Series 2018A, 5.000%, 1/01/36 | | | |
| 2,000 | | West Virginia Hospital Finance Authority, Hospital Revenue Bonds, Charleston Area | 9/29 at 100.00 | Baa1 | 2,422,340 |
| | Medical Center, Refunding & Improvement Series 2019A, 5.000%, 9/01/39 | | | |
| 1,500 | | West Virginia Hospital Finance Authority, Hospital Revenue Bonds, West Virginia United | 6/23 at 100.00 | A | 1,670,265 |
| | Health System Obligated Group, Refunding & Improvement Series 2013A, 5.500%, 6/01/44 | | | |
| 1,430 | | West Virginia Parkways Authority, Turnpike Toll Revenue Bonds, Senior Lien Series 2018, | 6/28 at 100.00 | AA– | 1,744,686 |
| | 5.000%, 6/01/43 | | | |
| 5,165 | | Total West Virginia | | | 6,118,992 |
49
| | | | | |
| NUW | Nuveen AMT-Free Municipal Value Fund | | |
| Portfolio of Investments (continued) | | | |
| October 31, 2019 | | | |
|
|
|
| Principal | | | Optional Call | | |
| Amount (000) | | Description (1) | Provisions (2) | Ratings (3) | Value |
| | Wisconsin – 0.4% | | | |
| $ 1,000 | | Wisconsin Health and Educational Facilities Authority, Revenue Bonds, Marshfield Clinic, | 2/22 at 100.00 | A– | $ 1,076,890 |
| | Series 2012B, 5.000%, 2/15/27 | | | |
| $ 260,089 | | Total Long-Term Investments (cost $228,219,330) | | | 260,289,713 |
| | Floating Rate Obligations – (0.8)% | | | (2,000,000) |
| | Other Assets Less Liabilities – 1.5% (8) | | | 3,900,034 |
| | Net Assets Applicable to Common Shares – 100% | | | $ 262,189,747 |
Investments in Derivatives
Futures contracts
| | | | | | | | |
| | | | | | | Variation |
| | | | | | Unrealized | Margin |
| Contract | Number of | Expiration | Notional | | Appreciation | Receivable/ |
| Description | Position | Contracts | Date | Amount | Value | (Depreciation) | (Payable) |
U.S. Treasury 10-Year Note | Short | (291) | 12/19 | $(38,183,556) | $(37,916,391) | $267,165 | $(236,438) |
| | |
(1) | All percentages shown in the Portfolio of Investments are based on net assets applicable to common shares unless otherwise noted. |
(2) | Optional Call Provisions: Dates (month and year) and prices of the earliest optional call or redemption. There may be other call provisions at varying prices at later dates. Certain mortgage-backed securities may be subject to periodic principal paydowns. Optional Call Provisions are not covered by the report of independent registered public accounting firm. |
(3) | For financial reporting purposes, the ratings disclosed are the highest of Standard & Poor’s Group (“Standard & Poor’s”), Moody’s Investors Service, Inc. (“Moody’s”) or Fitch, Inc. (“Fitch”) rating. This treatment of split-rated securities may differ from that used for other purposes, such as for Fund investment policies. Ratings below BBB by Standard & Poor’s, Baa by Moody’s or BBB by Fitch are considered to be below investment grade. Holdings designated N/R are not rated by any of these national rating agencies. Ratings are not covered by the report of independent registered public accounting firm. |
(4) | Investment, or portion of investment, has been pledged to collateralize the net payment obligations for investments in inverse floating rate transactions. |
(5) | Step-up coupon bond, a bond with a coupon that increases ("steps up"), usually at regular intervals, while the bond is outstanding. The rate shown is the coupon as of the end of the reporting period. |
(6) | Backed by an escrow or trust containing sufficient U.S. Government or U.S. Government agency securities, which ensure the timely payment of principal and interest. |
(7) | Defaulted security. A security whose issuer has failed to fully pay principal and/or interest when due, or is under the protection of bankruptcy. |
(8) | Other assets less liabilities includes the unrealized appreciation (depreciation) of certain over-the-counter (“OTC”) derivatives as presented on the Statement of Assets and Liabilities, when applicable. The unrealized appreciation (depreciation) of OTC cleared and exchange-traded derivatives is recognized as part of the cash collateral at brokers and/or the receivable or payable for variation margin as presented on the Statement of Assets and Liabilities, when applicable. |
144A | Investment is exempt from registration under Rule 144A of the Securities Act of 1933, as amended. These investments may only be resold in transactions exempt from registration, which are normally those transactions with qualified institutional buyers. |
ETM | Escrowed to maturity |
IF | Inverse floating rate security issued by a tender option bond (“TOB”) trust, the interest rate on which varies inversely with the Securities Industry Financial (SIFMA) short-term rate, which resets weekly, or a similar short-term rate, and is reduced by the expenses related to the TOB trust. |
UB | Underlying bond of an inverse floating rate trust reflected as a financing transaction. See Notes to Financial Statements, Note 4 – Portfolio Securities and Investments in Derivatives, Inverse Floating Rate Securities for more information. |
| See accompanying notes to financial statements. |
50
| | |
| NMI | Nuveen Municipal Income Fund, Inc. Portfolio of Investments October 31, 2019 |
| | | | | | |
| Principal | | | Optional Call | | |
| Amount (000) | | Description (1) | Provisions (2) | Ratings (3) | Value |
| | LONG-TERM INVESTMENTS – 98.6% | | | |
| | MUNICIPAL BONDS – 98.6% | | | |
| | Alabama – 0.8% | | | |
| $ 500 | | Lower Alabama Gas District, Alabama, Gas Project Revenue Bonds, Series 2016A, | No Opt. Call | A | $ 707,220 |
| | 5.000%, 9/01/46 | | | |
| 100 | | Tuscaloosa County Industrial Development Authority, Alabama, Gulf Opportunity Zone | 5/29 at 100.00 | N/R | 115,251 |
| | Bonds, Hunt Refining Project, Refunding Series 2019A, 5.250%, 5/01/44, 144A | | | |
| 600 | | Total Alabama | | | 822,471 |
| | Arizona – 2.5% | | | |
| 600 | | Arizona Health Facilities Authority, Revenue Bonds, Scottsdale Lincoln Hospitals | 12/24 at 100.00 | A2 | 684,468 |
| | Project, Refunding Series 2014A, 5.000%, 12/01/39 | | | |
| 1,000 | | Arizona Industrial Development Authority, Arizona, Education Revenue Bonds, Academies of | 1/28 at 100.00 | AA– | 1,160,030 |
| | Math & Science Projects, Series 2018A, 5.000%, 7/01/48 | | | |
| 515 | | Salt Verde Financial Corporation, Arizona, Senior Gas Revenue Bonds, Citigroup Energy | No Opt. Call | A3 | 648,874 |
| | Inc Prepay Contract Obligations, Series 2007, 5.250%, 12/01/28 | | | |
| 2,115 | | Total Arizona | | | 2,493,372 |
| | California – 17.0% | | | |
| 5,000 | | Adelanto School District, San Bernardino County, California, General Obligation Bonds, | No Opt. Call | A+ | 4,812,400 |
| | Series 1997A, 0.000%, 9/01/22 – NPFG Insured | | | |
| | Brea Olinda Unified School District, Orange County, California, General Obligation | | | |
| | Bonds, Series 1999A: | | | |
| 2,000 | | 0.000%, 8/01/21 – FGIC Insured | No Opt. Call | AA– | 1,956,400 |
| 2,070 | | 0.000%, 8/01/22 – FGIC Insured | No Opt. Call | AA– | 1,995,790 |
| 2,120 | | 0.000%, 8/01/23 – FGIC Insured | No Opt. Call | AA– | 2,012,601 |
| 205 | | California County Tobacco Securitization Agency, Tobacco Settlement Asset-Backed Bonds, | 11/19 at 100.00 | A2 | 207,880 |
| | Los Angeles County Securitization Corporation, Series 2006A, 5.250%, 6/01/21 | | | |
| 500 | | California Health Facilities Financing Authority, California, Revenue Bonds, Sutter | 11/27 at 100.00 | AA– | 560,060 |
| | Health, Series 2018A, 4.000%, 11/15/42 | | | |
| 365 | | California Statewide Communities Development Authority, California, Revenue Bonds, Loma | 6/28 at 100.00 | BB | 428,306 |
| | Linda University Medical Center, Series 2018A, 5.500%, 12/01/58, 144A | | | |
| 275 | | California Statewide Communities Development Authority, Revenue Bonds, Front Porch | 4/27 at 100.00 | A | 301,730 |
| | Communities and Services Project, Series 2017A, 4.000%, 4/01/36 | | | |
| 1,000 | | California Statewide Community Development Authority, Revenue Bonds, Daughters of | 12/19 at 100.00 | CC | 979,920 |
| | Charity Health System, Series 2005A, 5.500%, 7/01/39 | | | |
| 600 | | Foothill/Eastern Transportation Corridor Agency, California, Toll Road Revenue Bonds, | 7/29 at 100.00 | A– | 628,944 |
| | Refunding Term Rate Sub-Series 2013B-1, 3.500%, 1/15/53 | | | |
| 250 | | Madera County, California, Certificates of Participation, Children’s Hospital Central | 3/20 at 100.00 | AA– (4) | 253,978 |
| | California, Series 2010, 5.375%, 3/15/36 (Pre-refunded 3/15/20) | | | |
| 300 | | M-S-R Energy Authority, California, Gas Revenue Bonds, Citigroup Prepay Contracts, | No Opt. Call | A | 459,264 |
| | Series 2009A, 7.000%, 11/01/34 | | | |
| 250 | | Ridgecrest Redevelopment Agency, California, Ridgecrest Redevelopment Project Tax | 6/20 at 100.00 | A– (4) | 258,365 |
| | Allocation Bonds, Refunding Series 2010, 6.125%, 6/30/37 (Pre-refunded 6/30/20) | | | |
| 385 | | San Francisco Redevelopment Finance Authority, California, Tax Allocation Revenue Bonds, | 2/21 at 100.00 | A– (4) | 408,885 |
| | Mission Bay North Redevelopment Project, Series 2011C, 6.000%, 8/01/24 (Pre-refunded 2/01/21) | | | |
| 500 | | San Joaquin Hills Transportation Corridor Agency, Orange County, California, Toll Road | 1/25 at 100.00 | BBB+ | 565,650 |
| | Revenue Bonds, Refunding Junior Lien Series 2014B, 5.250%, 1/15/44 | | | |
| 1,000 | | Union City Community Redevelopment Agency, California, Tax Allocation Revenue Bonds, | 12/21 at 100.00 | A+ (4) | 1,103,290 |
| | Redevelopment Project, Subordinate Lien Series 2011, 6.000%, 12/01/22 (Pre-refunded 12/01/21) | | | |
| 16,820 | | Total California | | | 16,933,463 |
51
| | | | | |
| NMI | Nuveen Municipal Income Fund, Inc. | | |
| Portfolio of Investments (continued) | | | |
| October 31, 2019 | | | |
|
|
|
|
| Principal | | | Optional Call | | |
| Amount (000) | | Description (1) | Provisions (2) | Ratings (3) | Value |
| | Colorado – 9.5% | | | |
| | Central Platte Valley Metropolitan District, Colorado, General Obligation Bonds, | | | |
| | Refunding Series 2013A: | | | |
| $ 150 | | 5.125%, 12/01/29 | 12/23 at 100.00 | BBB | $ 169,430 |
| 250 | | 5.375%, 12/01/33 | 12/23 at 100.00 | BBB | 283,523 |
| 350 | | Colorado Health Facilities Authority, Colorado, Health Facilities Revenue Bonds, The | 6/27 at 100.00 | N/R (4) | 436,268 |
| | Evangelical Lutheran Good Samaritan Society Project, Refunding Series 2017, 5.000%, 6/01/42 | | | |
| | (Pre-refunded 6/01/27) | | | |
| 500 | | Colorado Health Facilities Authority, Colorado, Revenue Bonds, Christian Living | 1/24 at 102.00 | N/R | 550,330 |
| | Neighborhoods Project, Refunding Series 2016, 5.000%, 1/01/37 | | | |
| 200 | | Colorado Health Facilities Authority, Colorado, Revenue Bonds, CommonSpirit Health, | 8/29 at 100.00 | BBB+ | 214,004 |
| | Series 2019A-2, 4.000%, 8/01/49 | | | |
| 750 | | Colorado Springs, Colorado, Utilities System Revenue Bonds, Improvement Series 2013B-1, | 11/23 at 100.00 | AA+ | 844,470 |
| | 5.000%, 11/15/38 | | | |
| 1,000 | | Denver City and County, Colorado, Airport System Revenue Bonds, Series 2012B, | 11/22 at 100.00 | AA– | 1,103,520 |
| | 5.000%, 11/15/32 | | | |
| 1,395 | | Denver City and County, Colorado, Airport System Revenue Bonds, Subordinate Lien Series | 12/28 at 100.00 | A+ | 1,651,819 |
| | 2018A, 5.000%, 12/01/48 (AMT) | | | |
| 110 | | Park Creek Metropolitan District, Colorado, Senior Limited Property Tax Supported | 12/25 at 100.00 | A | 124,029 |
| | Revenue Bonds, Refunding Series 2015A, 5.000%, 12/01/45 | | | |
| 650 | | Park Creek Metropolitan District, Colorado, Senior Limited Property Tax Supported | 12/28 at 100.00 | A | 694,180 |
| | Revenue Bonds, Series 2018A, 4.000%, 12/01/51 | | | |
| 1,000 | | Park Creek Metropolitan District, Colorado, Senior Limited Property Tax Supported | 12/20 at 100.00 | AA (4) | 1,052,330 |
| | Revenue Refunding Bonds, Series 2011, 6.125%, 12/01/41 (Pre-refunded 12/01/20) – | | | |
| | AGM Insured | | | |
| 435 | | Public Authority for Colorado Energy, Natural Gas Purchase Revenue Bonds, Colorado | No Opt. Call | A+ | 477,891 |
| | Springs Utilities, Series 2008, 6.125%, 11/15/23 | | | |
| 1,100 | | Rampart Range Metropolitan District 1, Lone Tree, Colorado, Limited Tax Supported and | 12/27 at 100.00 | AA | 1,314,060 |
| | Special Revenue Bonds, Refunding & Improvement Series 2017, 5.000%, 12/01/42 | | | |
| 499 | | Tallyn’s Reach Metropolitan District 3, Aurora, Colorado, General Obligation Bonds, | 12/23 at 100.00 | N/R | 532,658 |
| | Limited Tax Convertible to Unlimited Tax, Refunding & Improvement Series 2013, | | | |
| | 5.000%, 12/01/33 | | | |
| 8,389 | | Total Colorado | | | 9,448,512 |
| | Delaware – 0.1% | | | |
| 100 | | Delaware Health Facilities Authority, Revenue Bonds, Beebe Medical Center Project, | 12/28 at 100.00 | BBB | 117,248 |
| | Series 2018, 5.000%, 6/01/48 | | | |
| | Florida – 5.6% | | | |
| 850 | | Bay County, Florida, Educational Facilities Revenue Refunding Bonds, Bay Haven Charter | 9/23 at 100.00 | BBB | 913,231 |
| | Academy, Inc Project, Series 2013A, 5.000%, 9/01/33 | | | |
| | Florida Development Finance Corporation, Florida, Surface Transportation Facility | | | |
| | Revenue Bonds, Virgin Trains USA Passenger Rail Project , Series 2019A: | | | |
| 350 | | 6.375%, 1/01/49 (AMT) (Mandatory Put 1/01/26), 144A | 1/20 at 105.00 | N/R | 331,079 |
| 450 | | 6.500%, 1/01/49 (AMT) (Mandatory Put 1/01/29), 144A | 1/20 at 105.00 | N/R | 423,994 |
| 500 | | Florida Higher Educational Facilities Financing Authority, Revenue Bonds, Nova | 4/21 at 100.00 | A– | 529,825 |
| | Southeastern University, Refunding Series 2011, 6.375%, 4/01/31 | | | |
| 500 | | Greater Orlando Aviation Authority, Florida, Orlando Airport Facilities Revenue Bonds, | 10/27 at 100.00 | A+ | 586,375 |
| | Priority Subordinated Series 2017, 5.000%, 10/01/47 (AMT) | | | |
| 800 | | Miami-Dade County, Florida, Aviation Revenue Bonds, Miami International Airport, Series | 10/20 at 100.00 | AA | 825,600 |
| | 2010B, 5.000%, 10/01/35 – AGM Insured | | | |
| 1,000 | | Miami-Dade County, Florida, Water and Sewer System Revenue Bonds, Series 2013A, | 10/22 at 100.00 | AA– | 1,095,420 |
| | 5.000%, 10/01/42 | | | |
| 515 | | North Sumter County Utility Dependent District, Florida, Utility Revenue Bonds, Series | 10/20 at 100.00 | AA | 533,834 |
| | 2010, 5.375%, 10/01/40 | | | |
52
| | | | | | |
| Principal | | | Optional Call | | |
| Amount (000) | | Description (1) | Provisions (2) | Ratings (3) | Value |
| | Florida (continued) | | | |
| $ 310 | | Orange County Health Facilities Authority, Florida, Hospital Revenue Bonds, Orlando | 4/22 at 100.00 | A+ | $ 330,944 |
| | Health, Inc, Series 2012A, 5.000%, 10/01/42 | | | |
| 5,275 | | Total Florida | | | 5,570,302 |
| | Georgia – 1.6% | | | |
| 455 | | Atlanta Development Authority, Georgia, Revenue Bonds, New Downtown Atlanta Stadium | 7/25 at 100.00 | Aa3 | 536,336 |
| | Project, Senior Lien Series 2015A-1, 5.250%, 7/01/40 | | | |
| 455 | | Atlanta Urban Residential Finance Authority, Georgia, Multifamily Housing Revenue Bonds, | 11/23 at 100.00 | BBB+ | 474,934 |
| | Testletree Village Apartments, Series 2013A, 4.000%, 11/01/25 | | | |
| 255 | | Georgia Municipal Electric Authority, Plant Vogtle Units 3 & 4 Project M Bonds, Series | 7/28 at 100.00 | A | 294,165 |
| | 2019A, 5.000%, 1/01/56 | | | |
| 300 | | Main Street Natural Gas Inc, Georgia, Gas Project Revenue Bonds, Series 2006B, | No Opt. Call | A+ | 323,229 |
| | 5.000%, 3/15/22 | | | |
| 1,465 | | Total Georgia | | | 1,628,664 |
| | Hawaii – 0.3% | | | |
| 250 | | Hawaii Department of Budget and Finance, Special Purpose Revenue Bonds, Hawaii Pacific | 7/23 at 100.00 | BB | 267,803 |
| | University, Series 2013A, 6.625%, 7/01/33 | | | |
| | Illinois – 9.9% | | | |
| 250 | | Chicago Board of Education, Illinois, Dedicated Capital Improvement Tax Revenue Bonds, | 4/27 at 100.00 | A | 298,678 |
| | Series 2016, 6.000%, 4/01/46 | | | |
| 435 | | Chicago Board of Education, Illinois, General Obligation Bonds, Dedicated Revenues, | 12/28 at 100.00 | BB | 488,927 |
| | Refunding Series 2018D, 5.000%, 12/01/46 | | | |
| 650 | | Chicago Board of Education, Illinois, General Obligation Bonds, Dedicated Revenues, | 12/25 at 100.00 | BB | 790,562 |
| | Series 2016A, 7.000%, 12/01/44 | | | |
| 185 | | Chicago, Illinois, General Obligation Bonds, Series 2019A, 5.500%, 1/01/49 | 1/29 at 100.00 | BBB+ | 215,531 |
| 1,000 | | Illinois Educational Facilities Authority, Revenue Bonds, Field Museum of Natural | 11/24 at 100.00 | A | 1,078,560 |
| | History, Series 2002RMKT, 4.500%, 11/01/36 | | | |
| 280 | | Illinois Finance Authority, Revenue Bonds, Palos Community Hospital, Series 2010C, | 5/20 at 100.00 | AA– | 284,309 |
| | 5.125%, 5/15/35 | | | |
| 80 | | Illinois Finance Authority, Revenue Bonds, Rehabilitation Institute of Chicago, Series | 7/23 at 100.00 | A– | 90,229 |
| | 2013A, 5.500%, 7/01/28 | | | |
| 200 | | Illinois Finance Authority, Revenue Bonds, Silver Cross Hospital and Medical Centers, | 8/25 at 100.00 | Baa1 | 223,710 |
| | Refunding Series 2015C, 5.000%, 8/15/44 | | | |
| 250 | | Illinois Finance Authority, Revenue Bonds, Southern Illinois Healthcare Enterprises, | 3/20 at 100.00 | AA (4) | 253,285 |
| | Inc, Series 2005 Remarketed, 5.250%, 3/01/30 (Pre-refunded 3/01/20) – AGM Insured | | | |
| 990 | | Illinois State, General Obligation Bonds, Series 2013, 5.250%, 7/01/31 | 7/23 at 100.00 | BBB | 1,072,081 |
| 1,555 | | Metropolitan Pier and Exposition Authority, Illinois, McCormick Place Expansion Project | 6/22 at 100.00 | BBB | 1,627,712 |
| | Bonds, Refunding Series 2012B, 5.000%, 6/15/52 | | | |
| 6,000 | | Metropolitan Pier and Exposition Authority, Illinois, McCormick Place Expansion Project | No Opt. Call | BBB | 1,405,620 |
| | Bonds, Series 2017A, 0.000%, 12/15/56 | | | |
| 205 | | Metropolitan Pier and Exposition Authority, Illinois, Revenue Bonds, McCormick Place | No Opt. Call | BBB | 121,536 |
| | Expansion Project, Series 2002A, 0.000%, 12/15/35 – NPFG Insured | | | |
| 450 | | Quad Cities Regional Economic Development Authority, Illinois, Revenue Bonds, Augustana | 10/22 at 100.00 | Baa1 | 492,376 |
| | College, Series 2012, 5.000%, 10/01/27 | | | |
| 800 | | Railsplitter Tobacco Settlement Authority, Illinois, Tobacco Settlement Revenue Bonds, | 6/21 at 100.00 | N/R (4) | 859,464 |
| | Series 2010, 6.000%, 6/01/28 (Pre-refunded 6/01/21) | | | |
| 490 | | University of Illinois, Health Services Facilities System Revenue Bonds, Series 2013, | 10/23 at 100.00 | A– | 558,232 |
| | 6.000%, 10/01/32 | | | |
| 13,820 | | Total Illinois | | | 9,860,812 |
53
| | | | | |
| NMI | Nuveen Municipal Income Fund, Inc. | | |
| Portfolio of Investments (continued) | | | |
| October 31, 2019 | | | |
|
|
| Principal | | | Optional Call | | |
| Amount (000) | | Description (1) | Provisions (2) | Ratings (3) | Value |
| | Indiana – 1.8% | | | |
| $ 525 | | Indiana Finance Authority, Educational Facilities Revenue Bonds, Drexel Foundation For | 12/19 at 100.00 | B | $ 525,777 |
| | Educational Excellence, Inc, Series 2009A, 7.000%, 10/01/39 | | | |
| 655 | | Indiana Finance Authority, Private Activity Bonds, Ohio River Bridges East End Crossing | 7/23 at 100.00 | A– | 712,987 |
| | Project, Series 2013A, 5.000%, 7/01/44 (AMT) | | | |
| 500 | | Vigo County Hospital Authority, Indiana, Hospital Revenue Bonds, Union Hospital, Inc, | 9/21 at 100.00 | N/R (4) | 560,210 |
| | Series 2011, 8.000%, 9/01/41 (Pre-refunded 9/01/21) | | | |
| 1,680 | | Total Indiana | | | 1,798,974 |
| | Iowa – 0.9% | | | |
| 835 | | Iowa Higher Education Loan Authority, Private College Facility Revenue Bonds, University | 10/21 at 100.00 | BBB | 881,702 |
| | of Dubuque Project, Refunding Series 2011, 5.625%, 10/01/26 | | | |
| | Kansas – 0.2% | | | |
| 220 | | Overland Park Development Corporation, Kansas, Revenue Bonds, Overland Park Convention | 12/19 at 100.00 | BB | 220,372 |
| | Center, Second Tier Series 2007B, 5.125%, 1/01/22 – AMBAC Insured | | | |
| | Kentucky – 0.5% | | | |
| 500 | | Kentucky Economic Development Finance Authority, Hospital Revenue Bonds, Owensboro | 6/20 at 100.00 | Baa3 (4) | 514,985 |
| | Medical Health System, Series 2010A, 6.500%, 3/01/45 (Pre-refunded 6/01/20) | | | |
| | Louisiana – 0.2% | | | |
| 200 | | New Orleans Aviation Board, Louisiana, General Airport Revenue Bonds, North Terminal | 1/27 at 100.00 | A– | 229,548 |
| | Project, Series 2017B, 5.000%, 1/01/48 (AMT) | | | |
| | Maine – 0.5% | | | |
| 500 | | Maine Health and Higher Educational Facilities Authority Revenue Bonds, Eastern Maine | 7/23 at 100.00 | BBB | 536,985 |
| | Medical Center Obligated Group Issue, Series 2013, 5.000%, 7/01/43 | | | |
| | Maryland – 1.9% | | | |
| 1,000 | | Maryland Economic Development Corporation, Economic Development Revenue Bonds, | 6/20 at 100.00 | N/R (4) | 1,026,100 |
| | Transportation Facilities Project, Series 2010A, 5.750%, 6/01/35 (Pre-refunded 6/01/20) | | | |
| 250 | | Maryland Health and Higher Educational Facilities Authority, Revenue Bonds, LifeBridge | 7/27 at 100.00 | A+ | 274,137 |
| | Health Issue, Series 2017, 4.000%, 7/01/42 | | | |
| 500 | | Maryland Health and Higher Educational Facilities Authority, Revenue Bonds, Peninsula | 7/24 at 100.00 | A | 562,095 |
| | Regional Medical Center Issue, Refunding Series 2015, 5.000%, 7/01/45 | | | |
| 1,750 | | Total Maryland | | | 1,862,332 |
| | Massachusetts – 0.6% | | | |
| 50 | | Massachusetts Development Finance Agency, Revenue Bonds, Atrius Health Issue, Series | 6/29 at 100.00 | BBB | 53,249 |
| | 2019A, 4.000%, 6/01/49 | | | |
| 500 | | Massachusetts Development Finance Agency, Revenue Bonds, UMass Memorial Health Care, | 7/26 at 100.00 | A– | 572,900 |
| | Series 2016I, 5.000%, 7/01/46 | | | |
| 550 | | Total Massachusetts | | | 626,149 |
| | Michigan – 2.7% | | | |
| 355 | | Detroit Water and Sewerage Department, Michigan, Sewage Disposal System Revenue Bonds, | 7/22 at 100.00 | A+ | 385,292 |
| | Refunding Senior Lien Series 2012A, 5.250%, 7/01/39 | | | |
| 1,100 | | Michigan Finance Authority, Hospital Revenue Bonds, Henry Ford Health System, Series | 11/29 at 100.00 | A | 1,205,028 |
| | 2019A, 4.000%, 11/15/50 | | | |
| 1,000 | | Michigan State Building Authority, Revenue Bonds, Facilities Program, Refunding Series | 10/21 at 100.00 | Aa2 | 1,074,150 |
| | 2011-II-A, 5.375%, 10/15/36 | | | |
| 2,455 | | Total Michigan | | | 2,664,470 |
| | Minnesota – 2.4% | | | |
| 300 | | City of Minneapolis, Minnesota, Senior Housing and Healthcare Facilities Revenue Bonds, | 11/22 at 100.00 | N/R | 304,956 |
| | Walker Minneapolis Campus Project, Series 2015, 4.625%, 11/15/31 | | | |
54
| | | | | | |
| Principal | | | Optional Call | | |
| Amount (000) | | Description (1) | Provisions (2) | Ratings (3) | Value |
| | Minnesota (continued) | | | |
| $ 1,000 | | Duluth Economic Development Authority, Minnesota, Health Care Facilities Revenue Bonds, | 2/28 at 100.00 | A– | $ 1,172,390 |
| | Essentia Health Obligated Group, Series 2018A, 5.000%, 2/15/53 | | | |
| 300 | | Saint Paul Park, Minnesota, Senior Housing and Health Care Revenue Bonds, Presbyterian | 9/24 at 100.00 | N/R | 315,339 |
| | Homes Bloomington Project, Refunding Series 2017, 4.250%, 9/01/37 | | | |
| 500 | | West Saint Paul-Mendota Heights-Eagan Independent School District 197, Dakota County, | 2/27 at 100.00 | AAA | 556,855 |
| | Minnesota, General Obligation Bonds, School Building Series 2018A, 4.000%, 2/01/39 | | | |
| 2,100 | | Total Minnesota | | | 2,349,540 |
| | Mississippi – 1.1% | | | |
| 1,000 | | Mississippi Hospital Equipment and Facilities Authority, Revenue Bonds, Baptist Memorial | 9/26 at 100.00 | BBB+ | 1,148,060 |
| | Healthcare, Series 2016A, 5.000%, 9/01/36 | | | |
| | Missouri – 3.2% | | | |
| 235 | | Hanley Road Corridor Transportation Development District, Brentwood and Maplewood, | 12/19 at 100.00 | A– | 235,611 |
| | Missouri, Transportation Sales Revenue Bonds, Refunding Series 2009A, 5.875%, 10/01/36 | | | |
| 135 | | Missouri Health and Educational Facilities Authority, Educational Facilities Revenue | 5/23 at 100.00 | BBB | 145,793 |
| | Bonds, Saint Louis College of Pharmacy, Series 2013, 5.250%, 5/01/33 | | | |
| 1,000 | | Missouri Health and Educational Facilities Authority, Educational Facilities Revenue | 10/22 at 100.00 | BBB– | 1,051,530 |
| | Bonds, Southwest Baptist University Project, Series 2012, 5.000%, 10/01/33 | | | |
| 125 | | Missouri Health and Educational Facilities Authority, Educational Facilities Revenue | 10/23 at 100.00 | A+ | 140,812 |
| | Bonds, University of Central Missouri, Series 2013C-2, 5.000%, 10/01/34 | | | |
| 965 | | Missouri Health and Educational Facilities Authority, Revenue Bonds, Lake Regional | 2/22 at 100.00 | BBB+ | 1,031,749 |
| | Health System, Series 2012, 5.000%, 2/15/26 | | | |
| 215 | | Saint Louis County Industrial Development Authority, Missouri, Revenue Bonds, Friendship | 9/25 at 103.00 | BB+ | 243,234 |
| | Village Saint Louis Obligated Group, Series 2018A, 5.250%, 9/01/53 | | | |
| 335 | | Saline County Industrial Development Authority, Missouri, First Mortgage Revenue Bonds, | 10/23 at 100.00 | N/R | 346,139 |
| | Missouri Valley College, Series 2017, 4.500%, 10/01/40 | | | |
| 3,010 | | Total Missouri | | | 3,194,868 |
| | Nebraska – 0.4% | | | |
| 400 | | Nebraska Educational Finance Authority, Revenue Bonds, Clarkson College Project, | 5/21 at 100.00 | Aa3 | 422,512 |
| | Refunding Series 2011, 5.050%, 9/01/30 | | | |
| | New Jersey – 2.8% | | | |
| 100 | | Gloucester County Pollution Control Financing Authority, New Jersey, Pollution Control | No Opt. Call | BBB– | 108,759 |
| | Revenue Bonds, Logan Project, Refunding Series 2014A, 5.000%, 12/01/24 (AMT) | | | |
| 110 | | New Jersey Health Care Facilities Financing Authority, Revenue Bonds, University | 7/25 at 100.00 | AA | 124,233 |
| | Hospital Issue, Refunding Series 2015A, 5.000%, 7/01/46 – AGM Insured | | | |
| 545 | | New Jersey Transportation Trust Fund Authority, Transportation System Bonds, Series | 6/25 at 100.00 | A– | 603,876 |
| | 2015AA, 5.000%, 6/15/45 | | | |
| 1,000 | | New Jersey Transportation Trust Fund Authority, Transportation System Bonds, Series | 12/28 at 100.00 | A– | 1,039,580 |
| | 2019BB, 4.000%, 6/15/50 | | | |
| 830 | | Tobacco Settlement Financing Corporation, New Jersey, Tobacco Settlement Asset-Backed | 6/28 at 100.00 | BBB+ | 965,448 |
| | Bonds, Series 2018A, 5.250%, 6/01/46 | | | |
| 2,585 | | Total New Jersey | | | 2,841,896 |
| | New York – 2.0% | | | |
| 630 | | Brooklyn Arena Local Development Corporation, New York, Payment in Lieu of Taxes Revenue | 1/20 at 100.00 | AA+ (4) | 636,344 |
| | Bonds, Barclays Center Project, Series 2009, 6.250%, 7/15/40 (Pre-refunded 1/15/20) | | | |
| 60 | | Buffalo and Erie County Industrial Land Development Corporation, New York, Revenue | 7/25 at 100.00 | BBB+ | 70,229 |
| | Bonds, Catholic Health System, Inc Project, Series 2015, 5.250%, 7/01/35 | | | |
| | Hudson Yards Infrastructure Corporation, New York, Revenue Bonds, Senior Fiscal 2012 | | | |
| | Series 2011A: | | | |
| 155 | | 5.750%, 2/15/47 | 2/21 at 100.00 | Aa2 | 163,513 |
| 245 | | 5.750%, 2/15/47 (Pre-refunded 2/15/21) | 2/21 at 100.00 | Aa2 (4) | 259,411 |
55
| | | | | |
| NMI | Nuveen Municipal Income Fund, Inc. | | |
| Portfolio of Investments (continued) | | | |
| October 31, 2019 | | | |
|
|
|
| Principal | | | Optional Call | | |
| Amount (000) | | Description (1) | Provisions (2) | Ratings (3) | Value |
| | New York (continued) | | | |
| $ 500 | | New York Liberty Development Corporation, New York, Liberty Revenue Bonds, 3 World Trade | 11/24 at 100.00 | N/R | $ 551,770 |
| | Center Project, Class 1 Series 2014, 5.000%, 11/15/44, 144A | | | |
| 265 | | Port Authority of New York and New Jersey, Special Project Bonds, JFK International Air | 12/20 at 100.00 | BBB+ | 277,635 |
| | Terminal LLC Project, Eighth Series 2010, 6.000%, 12/01/42 | | | |
| 1,855 | | Total New York | | | 1,958,902 |
| | North Carolina – 1.2% | | | |
| 1,000 | | North Carolina Turnpike Authority, Triangle Expressway System Revenue Bonds, Refunding | 1/29 at 100.00 | BBB | 1,207,460 |
| | Series 2018, 5.000%, 1/01/40 | | | |
| | North Dakota – 0.6% | | | |
| 200 | | Burleigh County, North Dakota, Health Care Revenue Bonds, Saint Alexius Medical Center | 7/21 at 100.00 | N/R (4) | 212,234 |
| | Project, Series 2014A, 5.000%, 7/01/35 (Pre-refunded 7/01/21) | | | |
| 300 | | Fargo, North Dakota, Health System Revenue Bonds, Sanford Health, Refunding Series | 11/21 at 100.00 | A+ | 329,502 |
| | 2011, 6.250%, 11/01/31 | | | |
| 100 | | Grand Forks, North Dakota, Senior Housing & Nursing Facilities Revenue Bonds, Valley | 12/26 at 100.00 | N/R | 107,252 |
| | Homes and Services Obligated Group, Series 2017, 5.000%, 12/01/36 | | | |
| 600 | | Total North Dakota | | | 648,988 |
| | Ohio – 3.9% | | | |
| | Buckeye Tobacco Settlement Financing Authority, Ohio, Tobacco Settlement Asset-Backed | | | |
| | Revenue Bonds, Senior Lien, Series 2007A-2: | | | |
| 495 | | 5.125%, 6/01/24 | 11/19 at 100.00 | CCC+ | 495,683 |
| 280 | | 5.375%, 6/01/24 | 11/19 at 100.00 | CCC+ | 280,308 |
| 725 | | 6.000%, 6/01/42 | 11/19 at 100.00 | B– | 729,133 |
| 1,750 | | Middleburg Heights, Ohio, Hospital Facilities Revenue Bonds, Southwest General Health | 8/21 at 100.00 | A2 | 1,852,725 |
| | Center Project, Refunding Series 2011, 5.250%, 8/01/36 | | | |
| 500 | | Montgomery County, Ohio, Health Care and Multifamily Housing Revenue Bonds, Saint | 4/20 at 100.00 | BBB– | 507,825 |
| | Leonard, Refunding & improvement Series 2010, 6.375%, 4/01/30 | | | |
| 3,750 | | Total Ohio | | | 3,865,674 |
| | Oklahoma – 0.3% | | | |
| 250 | | Oklahoma Development Finance Authority, Health System Revenue Bonds, OU Medicine | 8/28 at 100.00 | Baa3 | 300,045 |
| | Project, Series 2018B, 5.500%, 8/15/52 | | | |
| | Oregon – 0.3% | | | |
| 300 | | Forest Grove, Oregon, Campus Improvement Revenue Bonds, Pacific University Project, | 5/22 at 100.00 | BBB | 317,658 |
| | Refunding Series 2014A, 5.000%, 5/01/40 | | | |
| | Pennsylvania – 2.9% | | | |
| 1,000 | | Berks County Municipal Authority, Pennsylvania, Revenue Bonds, Reading Hospital & | 5/22 at 100.00 | A | 1,060,290 |
| | Medical Center Project, Series 2012A, 5.000%, 11/01/40 | | | |
| 100 | | Montgomery County Higher Education and Health Authority, Pennsylvania, Revenue Bonds, | 9/29 at 100.00 | A | 108,362 |
| | Thomas Jefferson University, Series 2019, 4.000%, 9/01/49 | | | |
| 560 | | Montgomery County Industrial Development Authority, Pennsylvania, Health System Revenue | 1/25 at 100.00 | Ba1 | 629,255 |
| | Bonds, Albert Einstein Healthcare Network Issue, Series 2015A, 5.250%, 1/15/36 | | | |
| 1,000 | | Pennsylvania Higher Educational Facilities Authority, Revenue Bonds, Foundation for | 7/22 at 100.00 | N/R (4) | 1,100,220 |
| | Student Housing at Indiana University, Project Series 2012A, 5.000%, 7/01/41 | | | |
| | (Pre-refunded 7/01/22) | | | |
| 2,660 | | Total Pennsylvania | | | 2,898,127 |
| | Puerto Rico – 1.2% | | | |
| | Puerto Rico Sales Tax Financing Corporation, Sales Tax Revenue Bonds, | | | |
| | Restructured 2018A-1: | | | |
| 1,760 | | 0.000%, 7/01/51 | 7/28 at 30.01 | N/R | 343,446 |
| 745 | | 5.000%, 7/01/58 | 7/28 at 100.00 | N/R | 783,964 |
56
| | | | | | |
| Principal | | | Optional Call | | |
| Amount (000) | | Description (1) | Provisions (2) | Ratings (3) | Value |
| | Puerto Rico (continued) | | | |
| $ 100 | | Puerto Rico Sales Tax Financing Corporation, Sales Tax Revenue Bonds, Taxable | 7/28 at 100.00 | N/R | $ 101,749 |
| | Restructured Cofina Project Series 2019A-2, 4.329%, 7/01/40 | | | |
| 2,605 | | Total Puerto Rico | | | 1,229,159 |
| | South Dakota – 0.1% | | | |
| 100 | | Sioux Falls, South Dakota, Health Facilities Revenue Bonds, Dow Rummel Village Project, | 11/26 at 100.00 | BB | 105,864 |
| | Series 2017, 5.125%, 11/01/47 | | | |
| | Tennessee – 2.4% | | | |
| 1,250 | | Chattanooga Health, Educational and Housing Facility Board, Tennessee, Revenue Bonds, | 1/23 at 100.00 | BBB+ (4) | 1,401,450 |
| | Catholic Health Initiatives, Series 2013A, 5.250%, 1/01/45 (Pre-refunded 1/01/23) | | | |
| 870 | | Knox County Health, Educational and Housing Facilities Board, Tennessee, Revenue Bonds, | 9/26 at 100.00 | BBB | 987,476 |
| | University Health System, Inc, Series 2016, 5.000%, 9/01/47 | | | |
| 2,120 | | Total Tennessee | | | 2,388,926 |
| | Texas – 8.0% | | | |
| 670 | | Central Texas Regional Mobility Authority, Revenue Bonds, Senior Lien, Series 2015A, | 7/25 at 100.00 | A– | 762,922 |
| | 5.000%, 1/01/40 | | | |
| 335 | | Grand Parkway Transportation Corporation, Texas, System Toll Revenue Bonds, First Tier | 10/23 at 100.00 | A+ | 370,024 |
| | Series 2013A, 5.125%, 10/01/43 | | | |
| 500 | | Lower Colorado River Authority, Texas, Transmission Contract Revenue Bonds, LCRA | 5/25 at 100.00 | A+ | 577,080 |
| | Transmission Services Corporation Project, Refunding Series 2015, 5.000%, 5/15/40 | | | |
| 125 | | Mission Economic Development Corporation, Texas, Revenue Bonds, Natgasoline Project, | 10/21 at 105.00 | BB– | 135,530 |
| | Senior Lien Series 2018, 4.625%, 10/01/31, 144A (AMT) | | | |
| 200 | | North Texas Tollway Authority, Special Projects System Revenue Bonds, Convertible | 9/31 at 100.00 | N/R (4) | 249,664 |
| | Capital Appreciation Series 2011C, 0.000%, 9/01/43 (Pre-refunded 9/01/31) (5) | | | |
| 410 | | North Texas Tollway Authority, System Revenue Bonds, Refunding First Tier, Series 2015B, | 1/23 at 100.00 | A+ | 450,943 |
| | 5.000%, 1/01/40 | | | |
| 500 | | North Texas Tollway Authority, System Revenue Bonds, Refunding Second Tier, Series | 1/25 at 100.00 | A | 572,850 |
| | 2015A, 5.000%, 1/01/38 | | | |
| 240 | | Reagan Hospital District of Reagan County, Texas, Limited Tax Revenue Bonds, Series | 2/24 at 100.00 | Ba1 | 254,431 |
| | 2014A, 5.000%, 2/01/34 | | | |
| 295 | | SA Energy Acquisition Public Facilities Corporation, Texas, Gas Supply Revenue Bonds, | No Opt. Call | A | 365,142 |
| | Series 2007, 5.500%, 8/01/27 | | | |
| | Texas Municipal Gas Acquisition and Supply Corporation III, Gas Supply Revenue Bonds, | | | |
| | Series 2012: | | | |
| 1,165 | | 5.000%, 12/15/27 | 12/22 at 100.00 | A3 | 1,273,683 |
| 505 | | 5.000%, 12/15/28 | 12/22 at 100.00 | A3 | 551,097 |
| 405 | | Texas Private Activity Bond Surface Transpiration Corporation, Revenue Bonds, NTE | 12/19 at 100.00 | Baa2 | 408,661 |
| | Mobility Partners LLC North Tarrant Express Managed Lanes Project, Senior Lien Series 2009, | | | |
| | 6.875%, 12/31/39 | | | |
| 770 | | Texas Private Activity Bond Surface Transportation Corporation, Senior Lien Revenue | 6/20 at 100.00 | Baa3 | 798,837 |
| | Bonds, LBJ Infrastructure Group LLC IH-635 Managed Lanes Project, Series 2010, 7.000%, 6/30/40 | | | |
| 1,000 | | Texas Transportation Commission, Central Texas Turnpike System Revenue Bonds, Second | 8/24 at 100.00 | BBB+ | 1,135,850 |
| | Tier Refunding Series 2015C, 5.000%, 8/15/32 | | | |
| 45 | | West Texas Independent School District, McLennan and Hill Counties, General Obligation | 12/19 at 73.18 | AAA | 32,891 |
| | Refunding Bonds, Series 1998, 0.000%, 8/15/25 | | | |
| 7,165 | | Total Texas | | | 7,939,605 |
| | Virginia – 1.7% | | | |
| 1,265 | | Virginia Small Business Financing Authority, Private Activity Revenue Bonds, Transform | 6/27 at 100.00 | BBB | 1,449,892 |
| | 66 P3 Project, Senior Lien Series 2017, 5.000%, 12/31/52 (AMT) | | | |
| 205 | | Virginia Small Business Financing Authority, Senior Lien Revenue Bonds, Elizabeth River | 7/22 at 100.00 | BBB | 227,132 |
| | Crossing, Opco LLC Project, Series 2012, 6.000%, 1/01/37 (AMT) | | | |
| 1,470 | | Total Virginia | | | 1,677,024 |
57
| | | | | |
| NMI | Nuveen Municipal Income Fund, Inc. | | |
| Portfolio of Investments (continued) | | | |
| October 31, 2019 | | | |
|
|
|
|
| Principal | | | Optional Call | | |
| Amount (000) | | Description (1) | Provisions (2) | Ratings (3) | Value |
| | West Virginia – 1.2% | | | |
| $ 1,000 | | West Virginia Hospital Finance Authority, Hospital Revenue Bonds, West Virginia United | 6/28 at 100.00 | A | $ 1,169,280 |
| | Health System Obligated Group, Series 2018A, 5.000%, 6/01/52 | | | |
| | Wisconsin – 6.3% | | | |
| | Public Finance Authority of Wisconsin, Conference Center and Hotel Revenue Bonds, | | | |
| | Lombard Public Facilities Corporation, Second Tier Series 2018B: | | | |
| 4 | | 0.000%, 1/01/46, 144A | No Opt. Call | N/R | 123 |
| 4 | | 0.000%, 1/01/47, 144A | No Opt. Call | N/R | 119 |
| 4 | | 0.000%, 1/01/48, 144A | No Opt. Call | N/R | 119 |
| 4 | | 0.000%, 1/01/49, 144A | No Opt. Call | N/R | 118 |
| 3 | | 0.000%, 1/01/50, 144A | No Opt. Call | N/R | 113 |
| 4 | | 0.000%, 1/01/51, 144A | No Opt. Call | N/R | 125 |
| 99 | | 3.750%, 7/01/51, 144A | 3/28 at 100.00 | N/R | 88,118 |
| 4 | | 0.000%, 1/01/52, 144A | No Opt. Call | N/R | 121 |
| 4 | | 0.000%, 1/01/53, 144A | No Opt. Call | N/R | 119 |
| 4 | | 0.000%, 1/01/54, 144A | No Opt. Call | N/R | 117 |
| 4 | | 0.000%, 1/01/55, 144A | No Opt. Call | N/R | 115 |
| 4 | | 0.000%, 1/01/56, 144A | No Opt. Call | N/R | 114 |
| 4 | | 0.000%, 1/01/57, 144A | No Opt. Call | N/R | 112 |
| 4 | | 0.000%, 1/01/58, 144A | No Opt. Call | N/R | 110 |
| 3 | | 0.000%, 1/01/59, 144A | No Opt. Call | N/R | 109 |
| 3 | | 0.000%, 1/01/60, 144A | No Opt. Call | N/R | 106 |
| 3 | | 0.000%, 1/01/61, 144A | No Opt. Call | N/R | 103 |
| 3 | | 0.000%, 1/01/62, 144A | No Opt. Call | N/R | 102 |
| 3 | | 0.000%, 1/01/63, 144A | No Opt. Call | N/R | 100 |
| 3 | | 0.000%, 1/01/64, 144A | No Opt. Call | N/R | 99 |
| 3 | | 0.000%, 1/01/65, 144A | No Opt. Call | N/R | 97 |
| 3 | | 0.000%, 1/01/66, 144A | No Opt. Call | N/R | 92 |
| 42 | | 0.000%, 1/01/67, 144A | No Opt. Call | N/R | 1,128 |
| 290 | | Wisconsin Health and Educational Facilities Authority, Revenue Bonds, Beloit Health | 4/20 at 100.00 | A | 293,167 |
| | System, Inc, Series 2010B, 5.000%, 4/01/30 | | | |
| 500 | | Wisconsin Health and Educational Facilities Authority, Revenue Bonds, Marquette | 10/22 at 100.00 | A2 | 529,410 |
| | University, Series 2012, 4.000%, 10/01/32 | | | |
| 1,000 | | Wisconsin Health and Educational Facilities Authority, Revenue Bonds, Meriter Hospital, | 5/21 at 100.00 | N/R (4) | 1,063,230 |
| | Inc, Series 2011A, 5.500%, 5/01/31 (Pre-refunded 5/01/21) | | | |
| 755 | | Wisconsin Health and Educational Facilities Authority, Revenues Bonds, Gundersen | 10/21 at 100.00 | AA– | 800,179 |
| | Lutheran, Series 2011A, 5.250%, 10/15/39 | | | |
| 200 | | Wisconsin Health and Educational Facilities Authority, Wisconsin, Revenue Bonds, Dickson | 10/22 at 102.00 | N/R | 213,558 |
| | Hollow Project Series 2014, 5.125%, 10/01/34 | | | |
| 1,000 | | Wisconsin Health and Educational Facilities Authority, Wisconsin, Revenue Bonds, PHW | 10/23 at 102.00 | N/R | 1,072,880 |
| | Oconomowoc, Inc Project, Series 2018, 5.125%, 10/01/48 | | | |
| 1,000 | | Wisconsin Health and Educational Facilities Authority, Wisconsin, Revenue Bonds, | 8/24 at 100.00 | A+ | 1,111,280 |
| | ProHealth Care, Inc Obligated Group, Refunding Series 2015, 5.000%, 8/15/39 | | | |
| 500 | | Wisconsin Health and Educational Facilities Authority, Wisconsin, Revenue Bonds, Rogers | 7/24 at 100.00 | A | 555,930 |
| | Memorial Hospital, Inc, Series 2014B, 5.000%, 7/01/44 | | | |
| 545 | | Wisconsin Health and Educational Facilities Authority, Wisconsin, Revenue Bonds, Saint | 9/23 at 100.00 | BBB– | 571,067 |
| | John’s Communities Inc, Series 2018A, 5.000%, 9/15/50 | | | |
| 6,006 | | Total Wisconsin | | | 6,302,280 |
| $ 97,500 | | Total Long-Term Investments (cost $90,276,141) | | | 98,444,032 |
| | Other Assets Less Liabilities – 1.4% | | | 1,378,303 |
| | Net Assets Applicable to Common Shares – 100% | | | $ 99,822,335 |
58
| | |
(1) | All percentages shown in the Portfolio of Investments are based on net assets applicable to common shares unless otherwise noted. |
(2) | Optional Call Provisions: Dates (month and year) and prices of the earliest optional call or redemption. There may be other call provisions at varying prices at later dates. Certain mortgage-backed securities may be subject to periodic principal paydowns. Optional Call Provisions are not covered by the report of independent registered public accounting firm. |
(3) | For financial reporting purposes, the ratings disclosed are the highest of Standard & Poor’s Group (“Standard & Poor’s”), Moody’s Investors Service, Inc. (“Moody’s”) or Fitch, Inc. (“Fitch”) rating. This treatment of split-rated securities may differ from that used for other purposes, such as for Fund investment policies. Ratings below BBB by Standard & Poor’s, Baa by Moody’s or BBB by Fitch are considered to be below investment grade. Holdings designated N/R are not rated by any of these national rating agencies. Ratings are not covered by the report of independent registered public accounting firm. |
(4) | Backed by an escrow or trust containing sufficient U.S. Government or U.S. Government agency securities, which ensure the timely payment of principal and interest. |
(5) | Step-up coupon bond, a bond with a coupon that increases (“steps up”), usually at regular intervals, while the bond is outstanding. The rate shown is the coupon as of the end of the reporting period. |
144A | Investment is exempt from registration under Rule 144A of the Securities Act of 1933, as amended. These investments may only be resold in transactions exempt from registration, which are normally those transactions with qualified institutional buyers. |
AMT | Alternative Minimum Tax |
| See accompanying notes to financial statements. |
59
| | |
| NEV | Nuveen Enhanced Municipal Value Fund Portfolio of Investments October 31, 2019 |
| | | | | | |
| Principal | | | Optional Call | | |
| Amount (000) | | Description (1) | Provisions (2) | Ratings (3) | Value |
| | LONG-TERM INVESTMENTS – 126.5% | | | |
| | MUNICIPAL BONDS – 126.5% | | | |
| | Alabama – 0.4% | | | |
| $ 1,350 | | Jefferson County, Alabama, Sewer Revenue Warrants, Senior Lien Series 2013A, 5.250%, | 10/23 at 102.00 | AA | $ 1,540,418 |
| | 10/01/48 – AGM Insured | | | |
| | Arizona – 1.7% | | | |
| 1,585 | | Arizona Health Facilities Authority, Hospital Revenue Bonds, Banner Health Systems, | 1/22 at 100.00 | AA– | 2,025,947 |
| | Tender Option Bond Trust 2015-XF2046, 14.371%, 7/01/36, 144A (IF) (4) | | | |
| 1,030 | | Phoenix Industrial Development Authority, Arizona, Education Facility Revenue Bonds, | 7/21 at 100.00 | N/R (5) | 1,120,496 |
| | Great Hearts Academies – Veritas Project, Series 2012, 6.600%, 7/01/47 (Pre-refunded 7/01/21) | | | |
| 35 | | Pima County Industrial Development Authority, Arizona, Education Facility Revenue Bonds, | 7/25 at 100.00 | N/R | 35,297 |
| | The Paideia Academies Project, 2019, 5.125%, 7/01/39 | | | |
| 1,480 | | Quechan Indian Tribe of the Fort Yuma Reservation, Arizona, Tribal Economic Development | 5/22 at 100.00 | BB– | 1,619,549 |
| | Bonds, Series 2012A, 9.750%, 5/01/25 | | | |
| 50 | | Salt Verde Financial Corporation, Arizona, Senior Gas Revenue Bonds, Citigroup Energy | No Opt. Call | A3 | 64,860 |
| | Inc Prepay Contract Obligations, Series 2007, 5.000%, 12/01/32 | | | |
| 1,447 | | Watson Road Community Facilities District, Arizona, Special Assessment Revenue Bonds, | 12/19 at 100.00 | N/R | 1,443,484 |
| | Series 2005, 6.000%, 7/01/30 | | | |
| 5,627 | | Total Arizona | | | 6,309,633 |
| | Arkansas – 0.6% | | | |
| 2,000 | | Arkansas Development Finance Authority, Industrial Development Revenue Bonds, Big River | 9/26 at 103.00 | B | 2,129,000 |
| | Steel Project, Series 2019, 4.500%, 9/01/49, 144A (AMT) | | | |
| | California – 10.6% | | | |
| 180 | | Alameda Corridor Transportation Authority, California, Revenue Bonds, Refunding Second | 10/26 at 100.00 | BBB+ | 210,227 |
| | Subordinate Lien Series 2016B, 5.000%, 10/01/37 | | | |
| 10,000 | | Bay Area Toll Authority, California, Revenue Bonds, San Francisco Bay Area Toll Bridge, | 10/29 at 100.00 | AA– | 10,028,200 |
| | Subordinate Series 2019S-8, 3.000%, 4/01/54 (UB) (4) | | | |
| | California Health Facilities Financing Authority, Revenue Bonds, Sutter Health, Tender | | | |
| | Option Bond Trust 2016-XG0048: | | | |
| 300 | | 20.550%, 8/15/26 , 144A (Pre-refunded 8/15/20) (IF) (4) | 8/20 at 100.00 | AA– (5) | 353,046 |
| 1,700 | | 20.550%, 8/15/26 , 144A (Pre-refunded 8/15/20) (IF) (4) | 8/20 at 100.00 | AA– (5) | 1,997,194 |
| 3,450 | | California Statewide Communities Development Authority, California, Revenue Bonds, Loma | 6/26 at 100.00 | BB | 3,893,877 |
| | Linda University Medical Center, Series 2016A, 5.250%, 12/01/56, 144A | | | |
| 400 | | Davis Redevelopment Agency, California, Tax Allocation Bonds, Davis Redevelopment | 12/21 at 100.00 | A+ (5) | 449,072 |
| | Project, Subordinate Series 2011A, 7.000%, 12/01/36 (Pre-refunded 12/01/21) | | | |
| | Golden State Tobacco Securitization Corporation, California, Tobacco Settlement | | | |
| | Asset-Backed Bonds, Tender Option Bond Trust 2015-XF1038: | | | |
| 2,445 | | 14.272%, 6/01/40, 144A (IF) (4) | 6/25 at 100.00 | Aa3 | 4,045,424 |
| 1,250 | | 14.283%, 6/01/40, 144A (IF) (4) | 6/25 at 100.00 | Aa3 | 2,068,912 |
| 5,240 | | Golden State Tobacco Securitization Corporation, California, Tobacco Settlement | 11/19 at 20.17 | CCC– | 892,739 |
| | Asset-Backed Revenue Bonds, First Subordinate Series 2007B-1, 0.000%, 6/01/47 | | | |
| 2,550 | | Grossmont Healthcare District, California, General Obligation Bonds, Tender Option Bond | 7/21 at 100.00 | Aaa | 3,850,908 |
| | Trust 2017-XF2453, 27.256%, 7/15/40, 144A (Pre-refunded 7/15/21) (IF) (4) | | | |
| 225 | | Long Beach Bond Finance Authority, California, Natural Gas Purchase Revenue Bonds, | No Opt. Call | A+ | 228,051 |
| | Series 2007B, 2.896%, 11/15/27 (3-Month LIBOR* 67% reference rate + 1.45% Spread) (6) | | | |
| 1,600 | | Los Angeles County, California, Community Development Commission Headquarters Office | 9/21 at 100.00 | Aa3 | 2,150,672 |
| | Building, Lease Revenue Bonds, Community Development Properties Los Angeles County Inc, | | | |
| | Tender Option Bond Trust 2016-XL0022, 18.537%, 9/01/42 , 144A (IF) (4) | | | |
60
| | | | | | |
| Principal | | | Optional Call | | |
| Amount (000) | | Description (1) | Provisions (2) | Ratings (3) | Value |
| | California (continued) | | | |
| $ 525 | | Los Angeles Department of Airports, California, Revenue Bonds, Los Angeles International | 5/20 at 100.00 | AA | $ 535,967 |
| | Airport, Senior Lien Series 2010A, 5.000%, 5/15/31 | | | |
| 1,080 | | National City Community Development Commission, California, Tax Allocation Bonds, | 8/21 at 100.00 | A (5) | 1,191,564 |
| | National City Redevelopment Project, Series 2011, 7.000%, 8/01/32 (Pre-refunded 8/01/21) | | | |
| 1,165 | | Novato Redevelopment Agency, California, Tax Allocation Bonds, Hamilton Field | 9/21 at 100.00 | A– (5) | 1,286,498 |
| | Redevelopment Project, Series 2011, 6.750%, 9/01/40 (Pre-refunded 9/01/21) | | | |
| 250 | | Ridgecrest Redevelopment Agency, California, Ridgecrest Redevelopment Project Tax | 6/20 at 100.00 | A– (5) | 258,365 |
| | Allocation Bonds, Refunding Series 2010, 6.125%, 6/30/37 (Pre-refunded 6/30/20) | | | |
| | San Francisco Redevelopment Finance Authority, California, Tax Allocation Revenue Bonds, | | | |
| | Mission Bay North Redevelopment Project, Series 2011C: | | | |
| 500 | | 6.500%, 8/01/27 (Pre-refunded 2/01/21) | 2/21 at 100.00 | A– (5) | 534,035 |
| 700 | | 6.750%, 8/01/33 (Pre-refunded 2/01/21) | 2/21 at 100.00 | A– (5) | 749,805 |
| 500 | | San Francisco Redevelopment Financing Authority, California, Tax Allocation Revenue | 2/21 at 100.00 | BBB+ (5) | 534,805 |
| | Bonds, Mission Bay South Redevelopment Project, Series 2011D, 6.625%, 8/01/27 | | | |
| | (Pre-refunded 2/01/21) | | | |
| 360 | | Santee Community Development Commission, California, Santee Redevelopment Project Tax | 2/21 at 100.00 | A (5) | 386,532 |
| | Allocation Bonds, Series 2011A, 7.000%, 8/01/31 (Pre-refunded 2/01/21) | | | |
| 1,000 | | Semitrophic Improvement District of Semitrophic Water Storage District, Kern County, | 12/19 at 100.00 | A+ (5) | 1,002,980 |
| | California, Revenue Bonds, Refunding Series 2009A, 5.000%, 12/01/38 (Pre-refunded 12/01/19) | | | |
| 2,400 | | Semitrophic Improvement District of Semitrophic Water Storage District, Kern County, | 12/19 at 100.00 | A+ (5) | 2,435,760 |
| | California, Revenue Bonds, Tender Option Bond Trust 2015-XF0117, 16.991%, 12/01/34 , 144A | | | |
| | (Pre-refunded 12/01/19) (IF) (4) | | | |
| 1,045 | | Ukiah Redevelopment Agency, California, Tax Allocation Bonds, Ukiah Redevelopment | 6/21 at 100.00 | A+ | 1,128,203 |
| | Project, Series 2011A, 6.500%, 12/01/28 | | | |
| 38,865 | | Total California | | | 40,212,836 |
| | Colorado – 3.0% | | | |
| | Colorado Bridge Enterprise, Revenue Bonds, Central 70 Project, Senior Series 2017: | | | |
| 750 | | 4.000%, 12/31/30 (AMT) | 12/27 at 100.00 | A– | 845,700 |
| 250 | | 4.000%, 6/30/31 (AMT) | 12/27 at 100.00 | A– | 281,515 |
| 820 | | Colorado Health Facilities Authority, Colorado, Revenue Bonds, CommonSpirit Health, | 8/29 at 100.00 | BBB+ | 877,416 |
| | Series 2019A-2, 4.000%, 8/01/49 (UB) (4) | | | |
| 26 | | Colorado Housing and Finance Authority, Revenue Bonds, Confluence Energy LLC Project, | No Opt. Call | N/R | – |
| | Series 2007, 5.000%, 6/01/18 (7), (8) | | | |
| 250 | | Colorado Housing and Finance Authority, Revenue Bonds, Confluence Energy LLC Project, | No Opt. Call | N/R | 12,605 |
| | Series 2017, 0.000%, 4/01/22 (AMT) (7), (8) | | | |
| 4,000 | | E-470 Public Highway Authority, Colorado, Toll Revenue Bonds, Refunding Series 2006B, | 9/26 at 52.09 | A | 1,760,400 |
| | 0.000%, 9/01/39 – NPFG Insured | | | |
| | Public Authority for Colorado Energy, Natural Gas Purchase Revenue Bonds, Colorado | | | |
| | Springs Utilities, Series 2008: | | | |
| 475 | | 6.250%, 11/15/28 | No Opt. Call | A+ | 608,874 |
| 4,030 | | 6.500%, 11/15/38 | No Opt. Call | A+ | 6,140,229 |
| 815 | | Three Springs Metropolitan District 3, Durango, La Plata County, Colorado, Property Tax | 12/20 at 100.00 | N/R | 831,528 |
| | Supported Revenue Bonds, Series 2010, 7.750%, 12/01/39 | | | |
| 11,416 | | Total Colorado | | | 11,358,267 |
| | Connecticut – 0.1% | | | |
| 534 | | Harbor Point Infrastructure Improvement District, Connecticut, Special Obligation | 4/20 at 100.00 | N/R (5) | 546,480 |
| | Revenue Bonds, Harbor Point Project, Series 2010A, 7.000%, 4/01/22 (Pre-refunded 4/01/20) | | | |
| | District of Columbia – 0.4% | | | |
| 1,355 | | District of Columbia, Revenue Bonds, Center for Strategic and International Studies, | 3/21 at 100.00 | N/R (5) | 1,442,330 |
| | Inc, Series 2011, 6.375%, 3/01/31 (Pre-refunded 3/01/21) | | | |
61
| | | | | |
| NEV | Nuveen Enhanced Municipal Value Fund | | |
| Portfolio of Investments (continued) | | | |
| October 31, 2019 | | | |
|
|
|
|
| Principal | | | Optional Call | | |
| Amount (000) | | Description (1) | Provisions (2) | Ratings (3) | Value |
| | Florida – 5.0% | | | |
| $ 1,000 | | Bonterra Community Development District, Hialeah, Florida, Special Assessment Bonds, | 5/27 at 100.00 | N/R | $ 1,057,960 |
| | Assessment Area 2 Project, Series 2016, 4.500%, 5/01/34 | | | |
| 325 | | Capital Trust Agency, Florida, Revenue Bonds, Renaissance Charter School Project, Series | 6/26 at 100.00 | N/R | 342,745 |
| | 2019A, 5.000%, 6/15/39, 144A | | | |
| 150 | | Charlotte County Industrial Development Authority, Florida, Utility System Revenue | 10/27 at 100.00 | N/R | 163,353 |
| | Bonds, Town & Country Utilities Project, Series 2019, 5.000%, 10/01/49, 144A (AMT) | | | |
| 2,000 | | Collier County Educational Facilities Authority, Florida, Revenue Bonds, Ave Maria | 6/23 at 100.00 | BBB– | 2,140,780 |
| | University, Refunding Series 2013A, 5.625%, 6/01/33 | | | |
| 1,000 | | Florida Development Finance Corporation, Educational Facilities Revenue Bonds, | 6/21 at 100.00 | B+ | 1,069,680 |
| | Renaissance Charter School, Inc Projects, Series 2011A, 7.500%, 6/15/33 | | | |
| 5,000 | | Florida Development Finance Corporation, Florida, Surface Transportation Facility | 1/20 at 105.00 | N/R | 4,711,050 |
| | Revenue Bonds, Virgin Trains USA Passenger Rail Project, Series 2019A, 6.500%, 1/01/49 (AMT) | | | |
| | (Mandatory Put 1/01/29), 144A | | | |
| | Miami-Dade County Health Facility Authority, Florida, Hospital Revenue Bonds, Miami | | | |
| | Children’s Hospital, Series 2010A: | | | |
| 265 | | 6.000%, 8/01/30 | 8/20 at 100.00 | A | 273,435 |
| 735 | | 6.000%, 8/01/30 (Pre-refunded 8/01/20) | 8/20 at 100.00 | N/R (5) | 760,394 |
| | Miami-Dade County, Florida, Aviation Revenue Bonds, Miami International Airport, | | | |
| | Series 2010A-1: | | | |
| 340 | | 5.375%, 10/01/35 (Pre-refunded 10/01/20) | 10/20 at 100.00 | A (5) | 353,097 |
| 1,285 | | 5.375%, 10/01/35 (Pre-refunded 10/01/20) | 10/20 at 100.00 | N/R (5) | 1,333,907 |
| 1,500 | | North Sumter County Utility Dependent District, Florida, Utility Revenue Bonds, Series | 10/20 at 100.00 | AA | 1,554,855 |
| | 2010, 5.375%, 10/01/40 | | | |
| | Palm Beach County Health Facilities Authority, Florida, Revenue Bonds, Jupiter Medical | | | |
| | Center, Series 2013A: | | | |
| 1,000 | | 5.000%, 11/01/33 | 11/22 at 100.00 | BBB+ | 1,072,410 |
| 2,000 | | 5.000%, 11/01/43 | 11/22 at 100.00 | BBB+ | 2,124,640 |
| 205 | | Palm Beach County, Florida, Revenue Bonds, Provident Group – PBAU Properties LLC – Palm | 4/29 at 100.00 | Ba1 | 229,463 |
| | Beach Atlantic University Housing Project, Series 2019A, 5.000%, 4/01/39, 144A | | | |
| 95 | | Tolomato Community Development District, Florida, Special Assessment Bonds, Convertible, | 5/22 at 100.00 | N/R | 81,988 |
| | Capital Appreciation, Series 2012A-4, 0.000%, 5/01/40 (9) | | | |
| 135 | | Tolomato Community Development District, Florida, Special Assessment Bonds, Hope Note, | 12/19 at 100.00 | N/R | 1 |
| | Series 2007-3, 6.650%, 5/01/40 (8) | | | |
| 350 | | Tolomato Community Development District, Florida, Special Assessment Bonds, Refunding | 12/19 at 100.00 | N/R | 300,041 |
| | Series 2015-1, 0.000%, 5/01/40 | | | |
| 215 | | Tolomato Community Development District, Florida, Special Assessment Bonds, Refunding | 12/19 at 100.00 | N/R | 151,336 |
| | Series 2015-2, 0.000%, 5/01/40 | | | |
| 235 | | Tolomato Community Development District, Florida, Special Assessment Bonds, Refunding | 12/19 at 100.00 | N/R | 2 |
| | Series 2015-3, 6.610%, 5/01/40 (8) | | | |
| 1,080 | | Venetian Community Development District, Sarasota County, Florida, Capital Improvement | 5/22 at 100.00 | N/R | 1,131,041 |
| | Revenue Bonds, Series 2012-A2, 5.500%, 5/01/34 | | | |
| 18,915 | | Total Florida | | | 18,852,178 |
| | Georgia – 3.9% | | | |
| 285 | | Atlanta Development Authority, Georgia, Senior Health Care Facilities Revenue Bonds, | 1/28 at 100.00 | N/R | 304,739 |
| | Georgia Proton Treatment Center Project, Current Interest Series 2017A-1, 6.500%, 1/01/29 | | | |
| 12,000 | | Atlanta, Georgia, Airport General Revenue Bonds, Refunding Series 2010C, 5.250%, 1/01/30 – | 1/21 at 100.00 | AA | 12,551,880 |
| | AGM Insured (UB) | | | |
| 1,250 | | Clayton County Development Authority, Georgia, Special Facilities Revenue Bonds, Delta | 6/20 at 100.00 | Baa3 | 1,301,475 |
| | Air Lines, Inc Project, Series 2009A, 8.750%, 6/01/29 | | | |
| 90 | | Main Street Natural Gas Inc, Georgia, Gas Project Revenue Bonds, Series 2006B, | No Opt. Call | A+ | 96,969 |
| | 5.000%, 3/15/22 | | | |
62
| | | | | | |
| Principal | | | Optional Call | | |
| Amount (000) | | Description (1) | Provisions (2) | Ratings (3) | Value |
| | Georgia (continued) | | | |
| $ 260 | | Main Street Natural Gas Inc, Georgia, Gas Project Revenue Bonds, Series 2007A, | No Opt. Call | A+ | $ 320,013 |
| | 5.500%, 9/15/26 | | | |
| 285 | | Rockdale County Development Authority, Georgia, Revenue Bonds, Pratt Paper, LLC Project, | 1/28 at 100.00 | N/R | 302,510 |
| | Refunding Series 2018, 4.000%, 1/01/38, 144A (AMT) | | | |
| 14,170 | | Total Georgia | | | 14,877,586 |
| | Guam – 5.9% | | | |
| | Government of Guam, Business Privilege Tax Bonds, Refunding Series 2015D: | | | |
| 195 | | 5.000%, 11/15/33 | 11/25 at 100.00 | BB | 219,398 |
| 1,805 | | 5.000%, 11/15/34 | 11/25 at 100.00 | BB | 2,027,232 |
| 1,760 | | Government of Guam, Business Privilege Tax Bonds, Series 2012B-1, 5.000%, 1/01/42 | 1/22 at 100.00 | BB | 1,833,744 |
| 500 | | Guam Government Waterworks Authority, Water and Wastewater System Revenue Bonds, Series | 7/23 at 100.00 | A– | 549,445 |
| | 2013, 5.500%, 7/01/43 | | | |
| | Guam Government, Limited Obligation Section 30 Revenue Bonds, Series 2016A: | | | |
| 2,500 | | 5.000%, 12/01/28 (UB) (4) | 12/26 at 100.00 | BB | 2,913,475 |
| 1,750 | | 5.000%, 12/01/30 (UB) (4) | 12/26 at 100.00 | BB | 2,018,100 |
| 2,500 | | 5.000%, 12/01/32 (UB) (4) | 12/26 at 100.00 | BB | 2,866,800 |
| 1,750 | | 5.000%, 12/01/34 (UB) (4) | 12/26 at 100.00 | BB | 1,999,060 |
| 6,000 | | 5.000%, 12/01/46 (UB) (4) | 12/26 at 100.00 | BB | 6,707,940 |
| 1,000 | | Guam Power Authority, Revenue Bonds, Refunding Series 2017A, 5.000%, 10/01/37 | 10/27 at 100.00 | BBB | 1,148,820 |
| 19,760 | | Total Guam | | | 22,284,014 |
| | Illinois – 20.4% | | | |
| 1,870 | | CenterPoint Intermodal Center Program Trust, Illinois, Series 2004A, 4.000%, 6/15/23 | No Opt. Call | N/R | 1,896,068 |
| | (Mandatory Put 12/15/22), 144A | | | |
| 5,000 | | Chicago Board of Education, Illinois, Dedicated Capital Improvement Tax Revenue Bonds, | 4/27 at 100.00 | A | 5,973,550 |
| | Series 2016, 6.000%, 4/01/46 | | | |
| 2,255 | | Chicago Board of Education, Illinois, General Obligation Bonds, Dedicated Revenues, | 12/24 at 100.00 | BB | 2,495,586 |
| | Project Series 2015C, 5.250%, 12/01/35 | | | |
| 520 | | Chicago Board of Education, Illinois, General Obligation Bonds, Dedicated Revenues, | 12/20 at 100.00 | BB | 531,887 |
| | Refunding Series 2010F, 5.000%, 12/01/31 | | | |
| 1,335 | | Chicago Board of Education, Illinois, General Obligation Bonds, Dedicated Revenues, | 12/26 at 100.00 | BB | 1,611,065 |
| | Series 2016B, 6.500%, 12/01/46 | | | |
| | Chicago Board of Education, Illinois, Unlimited Tax General Obligation Bonds, Dedicated | | | |
| | Tax Revenues, Series 1998B-1: | | | |
| 1,000 | | 0.000%, 12/01/22 – FGIC Insured | No Opt. Call | Baa2 | 927,750 |
| 1,000 | | 0.000%, 12/01/27 – NPFG Insured | No Opt. Call | Baa2 | 796,490 |
| 1,000 | | Chicago, Illinois, General Obligation Bonds, Neighborhoods Alive 21 Program, Series | 1/25 at 100.00 | BBB+ | 1,132,050 |
| | 2002B, 5.500%, 1/01/33 | | | |
| | Chicago, Illinois, General Obligation Bonds, Refunding Series 2012C: | | | |
| 320 | | 5.000%, 1/01/23 | 1/22 at 100.00 | BBB+ | 337,818 |
| 160 | | 5.000%, 1/01/25 | 1/22 at 100.00 | BBB+ | 168,603 |
| | Chicago, Illinois, General Obligation Bonds, Refunding Series 2016C: | | | |
| 3,470 | | 5.000%, 1/01/24 | No Opt. Call | BBB+ | 3,812,871 |
| 350 | | 5.000%, 1/01/29 | 1/26 at 100.00 | BBB+ | 395,069 |
| 770 | | 5.000%, 1/01/38 | 1/26 at 100.00 | BBB+ | 848,294 |
| 10,125 | | Chicago, Illinois, General Obligation Bonds, Series 2019A, 5.000%, 1/01/44 (UB) (4) | 1/29 at 100.00 | BBB+ | 11,407,230 |
| 2,000 | | Grundy County School District 54 Morris, Illinois, General Obligation Bonds, Refunding | 12/21 at 100.00 | AA | 2,184,080 |
| | Series 2005, 6.000%, 12/01/24 – AGM Insured | | | |
| 3,000 | | Illinois Finance Authority, Recovery Zone Facility Revenue Bonds, Navistar International | 10/20 at 100.00 | BB | 3,097,650 |
| | Corporation Project, Series 2010, 6.750%, 10/15/40 | | | |
63
| | | | | |
| NEV | Nuveen Enhanced Municipal Value Fund | | |
| Portfolio of Investments (continued) | | | |
| October 31, 2019 | | | |
|
|
|
| Principal | | | Optional Call | | |
| Amount (000) | | Description (1) | Provisions (2) | Ratings (3) | Value |
| | Illinois (continued) | | | |
| | Illinois Finance Authority, Revenue Bonds, Centegra Health System, Tender Option Bond | | | |
| | Trust 2016-XF2339: | | | |
| $ 1,540 | | 14.432%, 9/01/38, 144A (IF) (4) | 9/22 at 100.00 | AA+ | $ 2,058,934 |
| 1,605 | | 17.566%, 9/01/38, 144A (IF) (4) | 9/22 at 100.00 | AA+ | 2,279,662 |
| | Illinois Finance Authority, Revenue Bonds, Christian Homes Inc, Refunding Series 2010: | | | |
| 355 | | 6.125%, 5/15/27 (Pre-refunded 5/15/20) | 5/20 at 100.00 | N/R (5) | 364,141 |
| 645 | | 6.125%, 5/15/27 | 5/20 at 100.00 | BBB– | 657,100 |
| 4,000 | | Illinois Finance Authority, Revenue Bonds, Illinois Institute of Technology, Refunding | 12/19 at 100.00 | Baa3 | 4,011,600 |
| | Series 2006A, 5.000%, 4/01/36 | | | |
| | Illinois Finance Authority, Revenue Bonds, Northwestern Memorial Healthcare, Tender | | | |
| | Option Bond Trust 2015-XF0076: | | | |
| 150 | | 14.547%, 8/15/37, 144A (IF) | 8/22 at 100.00 | AA+ | 197,464 |
| 690 | | 14.757%, 8/15/37, 144A (IF) | 8/22 at 100.00 | AA+ | 923,165 |
| 1,000 | | Illinois Finance Authority, Revenue Bonds, Palos Community Hospital, Series 2010C, | 5/20 at 100.00 | AA– | 1,015,390 |
| | 5.125%, 5/15/35 | | | |
| 500 | | Illinois Finance Authority, Revenue Bonds, Southern Illinois Healthcare Enterprises, | 3/20 at 100.00 | AA (5) | 506,570 |
| | Inc, Series 2005 Remarketed, 5.250%, 3/01/30 (Pre-refunded 3/01/20) – AGM Insured | | | |
| 455 | | Illinois Finance Authority, Revenue Bonds, The Carle Foundation, Tender Option Bond | 8/21 at 100.00 | AA | 618,859 |
| | Trust 2015-XF0121, 22.303%, 8/15/41, 144A – AGM Insured (IF) (4) | | | |
| 20,830 | | Illinois State, General Obligation Bonds, November Series 2017D, 5.000%, | No Opt. Call | BBB | 23,892,635 |
| | 11/01/27 (UB) (4) | | | |
| 8,000 | | Metropolitan Pier and Exposition Authority, Illinois, McCormick Place Expansion Project | No Opt. Call | AA | 2,105,360 |
| | Bonds, Series 2017B, 0.000%, 12/15/56 – AGM Insured | | | |
| 1,000 | | Railsplitter Tobacco Settlement Authority, Illinois, Tobacco Settlement Revenue Bonds, | 6/21 at 100.00 | N/R (5) | 1,074,330 |
| | Series 2010, 6.000%, 6/01/28 (Pre-refunded 6/01/21) | | | |
| 190 | | Southwestern Illinois Development Authority, Environmental Improvement Revenue Bonds, US | 8/22 at 100.00 | B+ | 196,393 |
| | Steel Corporation Project, Series 2012, 5.750%, 8/01/42 (AMT) | | | |
| 75,135 | | Total Illinois | | | 77,517,664 |
| | Indiana – 2.6% | | | |
| 1,395 | | Indiana Finance Authority, Educational Facilities Revenue Bonds, Drexel Foundation For | 12/19 at 100.00 | B | 1,397,162 |
| | Educational Excellence, Inc, Series 2009A, 6.625%, 10/01/29 | | | |
| 1,500 | | Indiana Finance Authority, Private Activity Bonds, Ohio River Bridges East End Crossing | 7/23 at 100.00 | A– | 1,649,400 |
| | Project, Series 2013A, 5.000%, 7/01/35 (AMT) | | | |
| 4,375 | | Indianapolis Local Public Improvement Bond Bank, Indiana, Community Justice Campus | 2/29 at 100.00 | AAA | 4,631,419 |
| | Bonds, Courthouse & Jail Project, Series 2019A, 3.840%, 2/01/54 (UB) (4) | | | |
| 2,000 | | Vigo County Hospital Authority, Indiana, Hospital Revenue Bonds, Union Hospital, Inc, | 9/21 at 100.00 | N/R (5) | 2,233,020 |
| | Series 2011, 7.750%, 9/01/31 (Pre-refunded 9/01/21) | | | |
| 9,270 | | Total Indiana | | | 9,911,001 |
| | Iowa – 0.3% | | | |
| 155 | | Iowa Finance Authority, Iowa, Midwestern Disaster Area Revenue Bonds, Iowa Fertilizer | 12/23 at 100.00 | B+ | 168,776 |
| | Company Project, Series 2013, 5.250%, 12/01/25 | | | |
| 995 | | Iowa Finance Authority, Iowa, Midwestern Disaster Area Revenue Bonds, Iowa Fertilizer | 12/22 at 103.00 | B+ | 1,063,357 |
| | Company Project, Series 2018A, 5.250%, 12/01/50 (Mandatory Put 12/01/33) | | | |
| 1,150 | | Total Iowa | | | 1,232,133 |
| | Kansas – 1.8% | | | |
| 3,000 | | Kansas Development Finance Authority, Revenue Bonds, Lifespace Communities, Inc, | 5/20 at 100.00 | BBB | 3,043,140 |
| | Refunding Series 2010S, 5.000%, 5/15/30 | | | |
| 665 | | Overland Park Development Corporation, Kansas, Revenue Bonds, Overland Park Convention | 12/19 at 100.00 | BB | 666,124 |
| | Center, Second Tier Series 2007B, 5.125%, 1/01/22 – AMBAC Insured | | | |
| 3,565 | | Overland Park, Kansas, Sales Tax Special Obligation Revenue Bonds, Prairiefire at | 12/22 at 100.00 | N/R | 1,711,200 |
| | Lionsgate Project, Series 2012, 6.000%, 12/15/32 | | | |
64
| | | | | | |
| Principal | | | Optional Call | | |
| Amount (000) | | Description (1) | Provisions (2) | Ratings (3) | Value |
| | Kansas (continued) | | | |
| $ 1,130 | | Washburn University of Topeka, Kansas, Revenue Bonds, Series 2015A, 5.000%, 7/01/35 | 7/25 at 100.00 | A1 | $ 1,314,857 |
| 8,360 | | Total Kansas | | | 6,735,321 |
| | Kentucky – 0.9% | | | |
| 1,000 | | Hardin County, Kentucky, Hospital Revenue Bonds, Hardin Memorial Hospital Project, | 8/23 at 100.00 | AA | 1,119,500 |
| | Series 2013, 5.700%, 8/01/39 – AGM Insured | | | |
| 2,000 | | Kentucky Economic Development Finance Authority, Revenue Bonds, Next Generation Kentucky | 7/25 at 100.00 | BBB+ | 2,190,820 |
| | Information Highway Project, Senior Series 2015A, 5.000%, 1/01/45 | | | |
| 3,000 | | Total Kentucky | | | 3,310,320 |
| | Louisiana – 5.9% | | | |
| 500 | | Jefferson Parish Economic Development and Port District, Louisiana, Kenner Discovery | 6/28 at 100.00 | N/R | 533,525 |
| | Health Sciences Academy Project, Series 2018A, 5.625%, 6/15/48, 144A | | | |
| 2,365 | | Louisiana Public Facilities Authority, Revenue Bonds, Lake Charles Charter Academy | 12/21 at 100.00 | N/R | 2,548,879 |
| | Foundation Project, Series 2011A, 7.750%, 12/15/31 | | | |
| 2,000 | | Louisiana Local Government Environmental Facilities and Community Development Authority, | 2/24 at 100.00 | AA– | 2,158,600 |
| | Revenue Bonds, East Baton Rouge Sewerage Commission Projects, Subordinate Lien Series 2014A, | | | |
| | 4.375%, 2/01/39 | | | |
| 1,215 | | Louisiana Local Government Environmental Facilities and Community Development Authority, | 10/25 at 100.00 | AA | 1,418,525 |
| | Revenue Bonds, Louisiana Tech University Student Housing & Recreational Facilities/Innovative | | | |
| | Student Facilities, 5.000%, 10/01/33 – AGM Insured | | | |
| 1,000 | | Louisiana Public Facilities Authority, Hospital Revenue Bonds, Franciscan Missionaries | 7/27 at 100.00 | A | 1,158,850 |
| | of Our Lady Health System, Series 2017A, 5.000%, 7/01/47 | | | |
| 2,000 | | Louisiana Public Facilities Authority, Hospital Revenue Bonds, Lafayette General Medical | 5/20 at 100.00 | BBB+ | 2,032,980 |
| | Center Project, Refunding Series 2010, 5.500%, 11/01/40 | | | |
| 1,000 | | Louisiana Public Facilities Authority, Lease Revenue Bonds, Provident Group-Flagship | 7/26 at 100.00 | A | 1,139,320 |
| | Properties LLC – Louisiana State University Nicolson Gateway Project, Series 2016A, | | | |
| | 5.000%, 7/01/56 | | | |
| 3,305 | | Louisiana Public Facilities Authority, Revenue Bonds, Cleco Power LLC Project, Series | 5/23 at 100.00 | A3 | 3,436,374 |
| | 2008, 4.250%, 12/01/38 | | | |
| 985 | | Louisiana Public Facilities Authority, Revenue Bonds, Loyola University Project, | 10/21 at 100.00 | N/R (5) | 1,061,781 |
| | Refunding Series 2011, 5.250%, 10/01/28 (Pre-refunded 10/01/21) | | | |
| | Louisiana Public Facilities Authority, Revenue Bonds, Loyola University Project, | | | |
| | Refunding Series 2017: | | | |
| 2,835 | | 0.000%, 10/01/31 (9) | No Opt. Call | Baa1 | 2,895,385 |
| 1,775 | | 0.000%, 10/01/36 | 10/33 at 100.00 | Baa1 | 1,821,753 |
| 1,165 | | Louisiana State, Gasoline and Fuels Tax Revenue Bonds, Tender Option Bond Trust | 5/20 at 100.00 | AA– (5) | 1,253,120 |
| | 2016-XG0035, 14.563%, 5/01/39, 144A (Pre-refunded 5/01/20) (IF) | | | |
| 1,000 | | New Orleans Aviation Board, Louisiana, General Airport Revenue Bonds, North Terminal | 1/27 at 100.00 | A– | 1,147,740 |
| | Project, Series 2017B, 5.000%, 1/01/48 (AMT) | | | |
| 21,145 | | Total Louisiana | | | 22,606,832 |
| | Massachusetts – 1.4% | | | |
| 1,800 | | Massachusetts Development Finance Agency, Revenue Bonds, Emmanuel College, Series 2016A, | 10/26 at 100.00 | Baa2 | 2,089,476 |
| | 5.000%, 10/01/34 | | | |
| 800 | | Massachusetts Development Finance Agency, Revenue Bonds, Merrimack College, Series 2017, | 7/26 at 100.00 | BBB– | 901,008 |
| | 5.000%, 7/01/47 | | | |
| 1,180 | | Massachusetts Educational Financing Authority, Education Loan Revenue Bonds, Issue K, | 7/22 at 100.00 | AA | 1,256,782 |
| | Series 2013, 5.000%, 7/01/25 (AMT) | | | |
| 625 | | Massachusetts Educational Financing Authority, Student Loan Revenue Bonds, Issue I | 1/20 at 100.00 | AA | 629,600 |
| | Series 2010A, 5.500%, 1/01/22 | | | |
| 275 | | Massachusetts Housing Finance Agency, Housing Bonds, Series 2010C, 5.000%, | 6/20 at 100.00 | AA | 279,436 |
| | 12/01/30 (AMT) | | | |
| 4,680 | | Total Massachusetts | | | 5,156,302 |
65
| | | | | |
| NEV | Nuveen Enhanced Municipal Value Fund | | |
| Portfolio of Investments (continued) | | | |
| October 31, 2019 | | | |
|
|
| Principal | | | Optional Call | | |
| Amount (000) | | Description (1) | Provisions (2) | Ratings (3) | Value |
| | Michigan – 0.0% | | | |
| $ 10 | | Detroit, Michigan, Water Supply System Revenue Bonds, Senior Lien Series 2003A, 5.000%, | 12/19 at 100.00 | A2 | $ 10,027 |
| | 7/01/34 – NPFG Insured | | | |
| | Missouri – 0.3% | | | |
| 1,095 | | Branson Industrial Development Authority, Missouri, Tax Increment Revenue Bonds, Branson | 11/25 at 100.00 | N/R | 1,131,058 |
| | Shoppes Redevelopment Project, Refunding Series 2017A, 3.900%, 11/01/29 | | | |
| 55 | | Cape Girardeau County Industrial Development Authority, Missouri, Health Facilities | 3/27 at 100.00 | BBB– | 63,085 |
| | Revenue Bonds, Southeasthealth, Series 2017A, 5.000%, 3/01/36 | | | |
| 1,150 | | Total Missouri | | | 1,194,143 |
| | Nebraska – 0.6% | | | |
| 2,150 | | Nebraska Investment Finance Authority, Single Family Housing Revenue Bonds, Series | 9/27 at 100.00 | AA+ | 2,304,542 |
| | 2018C, 3.750%, 9/01/38 | | | |
| | Nevada – 0.5% | | | |
| 2,000 | | Clark County, Nevada, Passenger Facility Charge Revenue Bonds, Las Vegas-McCarran | 1/20 at 100.00 | Aa3 | 2,011,680 |
| | International Airport, Series 2010A, 5.000%, 7/01/30 | | | |
| | New Jersey – 12.6% | | | |
| 2,500 | | New Jersey Economic Development Authority, Lease Revenue Bonds, State Government | 12/27 at 100.00 | A– | 2,834,525 |
| | Buildings-Health Department & Taxation Division Office Project, Series 2018A, 5.000%, 6/15/42 | | | |
| 795 | | New Jersey Economic Development Authority, School Facilities Construction Bonds, Series | 6/25 at 100.00 | A– | 900,767 |
| | 2015WW, 5.250%, 6/15/40 (UB) (4) | | | |
| 2,000 | | New Jersey Economic Development Authority, School Facilities Construction Bonds, Series | 12/28 at 100.00 | A– | 2,270,920 |
| | 2018EEE, 5.000%, 6/15/43 | | | |
| | New Jersey Economic Development Authority, Special Facilities Revenue Bonds, Continental | | | |
| | Airlines Inc, Series 1999: | | | |
| 1,000 | | 5.125%, 9/15/23 (AMT) | 8/22 at 101.00 | BB | 1,076,170 |
| 1,650 | | 5.250%, 9/15/29 (AMT) | 8/22 at 101.00 | BB | 1,803,615 |
| 2,155 | | New Jersey Economic Development Authority, Special Facility Revenue Bonds, Port Newark | 10/27 at 100.00 | Ba1 | 2,503,808 |
| | Container Terminal LLC Project, Refunding Series 2017, 5.000%, 10/01/37 (AMT) | | | |
| 780 | | New Jersey Higher Education Assistance Authority, Student Loan Revenue Bonds, Series | 12/19 at 100.00 | Aaa | 782,090 |
| | 2010-1A, 5.000%, 12/01/26 | | | |
| 20,000 | | New Jersey Transportation Trust Fund Authority, Transportation System Bonds, Refunding | No Opt. Call | A– | 11,696,800 |
| | Series 2006C, 0.000%, 12/15/36 – AMBAC Insured (UB) (4) | | | |
| 20,000 | | New Jersey Transportation Trust Fund Authority, Transportation System Bonds, Series | 12/28 at 100.00 | A– | 23,338,200 |
| | 2018A, 5.000%, 12/15/34 (UB) (4) | | | |
| 755 | | Tobacco Settlement Financing Corporation, New Jersey, Tobacco Settlement Asset-Backed | 6/28 at 100.00 | BB+ | 832,365 |
| | Bonds, Series 2018B, 5.000%, 6/01/46 | | | |
| 51,635 | | Total New Jersey | | | 48,039,260 |
| | New York – 4.4% | | | |
| | Brooklyn Arena Local Development Corporation, New York, Payment in Lieu of Taxes Revenue | | | |
| | Bonds, Barclays Center Project, Series 2009: | | | |
| 1,100 | | 6.000%, 7/15/30 (Pre-refunded 1/15/20) | 1/20 at 100.00 | AA+ (5) | 1,110,538 |
| 1,225 | | 6.250%, 7/15/40 (Pre-refunded 1/15/20) | 1/20 at 100.00 | AA+ (5) | 1,237,336 |
| 2,000 | | 6.375%, 7/15/43 (Pre-refunded 1/15/20) | 1/20 at 100.00 | AA+ (5) | 2,020,640 |
| 1,000 | | Monroe County Industrial Development Corporation, New York, Revenue Bonds, St John | 6/21 at 100.00 | A– | 1,071,830 |
| | Fisher College, Series 2011, 6.000%, 6/01/34 | | | |
| 1,000 | | New York City Industrial Development Agency, New York, PILOT Revenue Bonds, Queens | 12/19 at 100.00 | BBB | 1,015,360 |
| | Baseball Stadium Project, Series 2006, 5.000%, 1/01/46 – AMBAC Insured | | | |
| 580 | | New York Liberty Development Corporation, New York, Liberty Revenue Bonds, 3 World Trade | 11/24 at 100.00 | N/R | 640,053 |
| | Center Project, Class 1 Series 2014, 5.000%, 11/15/44, 144A | | | |
| 500 | | New York Liberty Development Corporation, New York, Liberty Revenue Bonds, 3 World Trade | 11/24 at 100.00 | N/R | 560,505 |
| | Center Project, Class 2 Series 2014, 5.150%, 11/15/34, 144A | | | |
66
| | | | | | |
| Principal | | | Optional Call | | |
| Amount (000) | | Description (1) | Provisions (2) | Ratings (3) | Value |
| | New York (continued) | | | |
| | New York Transportation Development Corporation, Special Facilities Bonds, LaGuardia | | | |
| | Airport Terminal B Redevelopment Project, Series 2016A: | | | |
| $ 4,000 | | 4.000%, 7/01/33 (AMT) | 7/24 at 100.00 | BBB | $ 4,257,840 |
| 2,105 | | 5.000%, 7/01/46 (AMT) | 7/24 at 100.00 | BBB | 2,328,109 |
| 265 | | Port Authority of New York and New Jersey, Special Project Bonds, JFK International Air | 12/20 at 100.00 | BBB+ | 277,635 |
| | Terminal LLC Project, Eighth Series 2010, 6.000%, 12/01/42 | | | |
| 2,150 | | TSASC Inc, New York, Tobacco Asset-Backed Bonds, Series 2006, 5.000%, 6/01/48 | 6/27 at 100.00 | N/R | 2,140,196 |
| 15,925 | | Total New York | | | 16,660,042 |
| | Ohio – 11.0% | | | |
| 99,235 | | Buckeye Tobacco Settlement Financing Authority, Ohio, Tobacco Settlement Asset-Backed | 11/19 at 14.07 | N/R | 6,068,220 |
| | Revenue Bonds, First Subordinate Capital Appreciation Turbo Term Series 2007B, 0.000%, 6/01/47 | | | |
| | Buckeye Tobacco Settlement Financing Authority, Ohio, Tobacco Settlement Asset-Backed | | | |
| | Revenue Bonds, Senior Lien, Series 2007A-2: | | | |
| 6,000 | | 5.750%, 6/01/34 | 11/19 at 100.00 | CCC+ | 6,007,560 |
| 8,000 | | 5.875%, 6/01/47 | 11/19 at 100.00 | B– | 8,051,360 |
| 760 | | Franklin County, Ohio, Healthcare Facilities Revenue Bonds, Ohio Presbyterian Retirement | 7/20 at 100.00 | BBB | 779,920 |
| | Services, Improvement Series 2010A, 5.625%, 7/01/26 | | | |
| 10,000 | | Franklin County, Ohio, Hospital Facilities Revenue Bonds, OhioHealth Corporation, Series | 5/25 at 100.00 | AA+ | 11,462,700 |
| | 2015, 5.000%, 5/15/40 (UB) (4) | | | |
| 3,000 | | Lucas County, Ohio, Hospital Revenue Bonds, ProMedica Healthcare Obligated Group, Series | 11/21 at 100.00 | BBB (5) | 3,272,370 |
| | 2011A, 5.750%, 11/15/31 (Pre-refunded 11/15/21) | | | |
| 1,000 | | Montgomery County, Ohio, Health Care and Multifamily Housing Revenue Bonds, Saint | 4/20 at 100.00 | BBB– | 1,015,650 |
| | Leonard, Refunding & improvement Series 2010, 6.375%, 4/01/30 | | | |
| 6,000 | | Ohio Air Quality Development Authority, Ohio, Pollution Control Revenue Bonds, | No Opt. Call | N/R | 5,295,000 |
| | FirstEnergy Generation Project, Refunding Series 2006A, 0.000%, 12/01/23 (8) | | | |
| 133,995 | | Total Ohio | | | 41,952,780 |
| | Oklahoma – 0.1% | | | |
| 440 | | Oklahoma Development Finance Authority, Health System Revenue Bonds, OU Medicine | 8/28 at 100.00 | Baa3 | 521,572 |
| | Project, Series 2018B, 5.000%, 8/15/38 | | | |
| | Pennsylvania – 8.6% | | | |
| 1,500 | | Allegheny Country Industrial Development Authority, Pennsylvania, Environmental | 12/21 at 100.00 | B+ | 1,573,545 |
| | Improvement Revenue Bonds, United States Steel Corporation Project, Refunding Series 2011, | | | |
| | 6.550%, 12/01/27 | | | |
| 1,335 | | Allegheny County Hospital Development Authority, Pennsylvania, Revenue Bonds, Ohio | 12/19 at 100.00 | Caa1 | 1,229,882 |
| | Valley General Hospital, Series 2005A, 5.125%, 4/01/35 | | | |
| 530 | | Beaver County Industrial Development Authority, Pennsylvania, Pollution Control Revenue | No Opt. Call | N/R | 568,425 |
| | Refunding Bonds, FirstEnergy Generation Project, Series 2008B, 4.250%, 10/01/47 (Mandatory | | | |
| | Put 4/01/21) (8) | | | |
| 2,000 | | Beaver County Industrial Development Authority, Pennsylvania, Pollution Control Revenue | No Opt. Call | N/R | 1,765,000 |
| | Refunding Bonds, FirstEnergy Nuclear Generation Project, Series 2006B, 3.500%, 12/01/35 | | | |
| | (Mandatory Put 6/01/20) (8) | | | |
| | Commonwealth Financing Authority, Pennsylvania, State Appropriation Lease Bonds, Master | | | |
| | Settlement, Series 2018: | | | |
| 4,000 | | 5.000%, 6/01/32 (UB) (4) | 6/28 at 100.00 | A1 | 4,907,400 |
| 2,260 | | 5.000%, 6/01/33 (UB) (4) | 6/28 at 100.00 | A1 | 2,765,562 |
| 1,275 | | 5.000%, 6/01/34 (UB) (4) | 6/28 at 100.00 | A1 | 1,555,551 |
| 2,000 | | Luzerne County Industrial Development Authority, Pennsylvania, Guaranteed Lease Revenue | 12/19 at 100.00 | N/R (5) | 2,014,620 |
| | Bonds, Series 2009, 7.750%, 12/15/27 (Pre-refunded 12/15/19) | | | |
| 1,080 | | Montgomery County Industrial Development Authority, Pennsylvania, FHA Insured Mortgage | 8/20 at 100.00 | N/R (5) | 1,197,494 |
| | Revenue Bonds, New Regional Medical Center Project, Tender Option Bond Trust 2017-XF2454, | | | |
| | 14.570%, 8/01/24, 144A (Pre-refunded 8/01/20) (IF) (4) | | | |
67
| | | | | |
| NEV | Nuveen Enhanced Municipal Value Fund | | |
| Portfolio of Investments (continued) | | | |
| October 31, 2019 | | | |
|
|
|
| Principal | | | Optional Call | | |
| Amount (000) | | Description (1) | Provisions (2) | Ratings (3) | Value |
| | Pennsylvania (continued) | | | |
| $ 1,000 | | Pennsylvania Economic Development Financing Authority, Sewage Sludge Disposal Revenue | 1/20 at 100.00 | BBB+ | $ 1,006,080 |
| | Bonds, Philadelphia Biosolids Facility Project, Series 2009, 6.250%, 1/01/32 | | | |
| 1,200 | | Pennsylvania Higher Educational Facilities Authority, Revenue Bonds, Edinboro University | 7/20 at 100.00 | N/R (5) | 1,236,636 |
| | Foundation Student Housing Project, Series 2010, 5.800%, 7/01/30 (Pre-refunded 7/01/20) | | | |
| 130 | | Pennsylvania Higher Educational Facilities Authority, Revenue Bonds, University | 7/26 at 100.00 | Baa3 | 150,366 |
| | Properties Inc Student Housing Project at East Stroudsburg University of Pennsylvania, Series | | | |
| | 2016A, 5.000%, 7/01/31 | | | |
| 1,000 | | Pennsylvania Public School Building Authority, Lease Revenue Bonds, School District of | No Opt. Call | AA | 1,224,090 |
| | Philadelphia, Series 2006B, 5.000%, 6/01/27 – AGM Insured | | | |
| | Pennsylvania Turnpike Commission, Turnpike Revenue Bonds, Capital Appreciation | | | |
| | Series 2009E: | | | |
| 3,530 | | 6.000%, 12/01/30 | 12/27 at 100.00 | A | 4,510,246 |
| 2,000 | | 6.375%, 12/01/38 | 12/27 at 100.00 | A | 2,604,060 |
| 4,000 | | Philadelphia Authority for Industrial Development, Pennsylvania, Revenue Bonds, | 5/27 at 100.00 | Baa1 | 4,484,160 |
| | University of the Sciences in Philadelphia, Series 2017, 5.000%, 11/01/47 (UB) (4) | | | |
| 28,840 | | Total Pennsylvania | | | 32,793,117 |
| | Puerto Rico – 2.2% | | | |
| 75,000 | | Children’s Trust Fund, Puerto Rico, Tobacco Settlement Asset-Backed Bonds, Series 2008A, | 12/19 at 6.06 | N/R | 3,703,500 |
| | 0.000%, 5/15/57 | | | |
| 1,000 | | Puerto Rico Highway and Transportation Authority, Highway Revenue Bonds, Series 2007N, | No Opt. Call | C | 930,000 |
| | 2.931%, 7/01/27 | | | |
| 1,500 | | Puerto Rico Housing Finance Authority, Subordinate Lien Capital Fund Program Revenue | 12/19 at 100.00 | A+ | 1,585,215 |
| | Bonds, Modernization Series 2008, 5.125%, 12/01/27 | | | |
| 2,000 | | Puerto Rico Sales Tax Financing Corporation, Sales Tax Revenue Bonds, Taxable | 7/28 at 100.00 | N/R | 2,034,980 |
| | Restructured Cofina Project Series 2019A-2, 4.329%, 7/01/40 | | | |
| 79,500 | | Total Puerto Rico | | | 8,253,695 |
| | South Carolina – 2.3% | | | |
| 7,500 | | South Carolina Public Service Authority Santee Cooper Revenue Obligations, Refunding | 12/26 at 100.00 | A | 8,747,100 |
| | Series 2016B, 5.000%, 12/01/46 (UB) (4) | | | |
| | Tennessee – 0.3% | | | |
| 1,000 | | Bristol Industrial Development Board, Tennessee, State Sales Tax Revenue Bonds, Pinnacle | 12/26 at 100.00 | N/R | 1,027,320 |
| | Project, Series 2016A, 5.125%, 12/01/42, 144A | | | |
| 155 | | The Tennessee Energy Acquisition Corporation, Gas Revenue Bonds, Series 2006C, | No Opt. Call | A | 174,789 |
| | 5.000%, 2/01/24 | | | |
| 1,155 | | Total Tennessee | | | 1,202,109 |
| | Texas – 2.8% | | | |
| 80 | | Arlington Higher Education Finance Corporation, Texas, Education Revenue Bonds, | 6/21 at 100.00 | BB | 81,474 |
| | Leadership Prep School, Series 2016A, 5.000%, 6/15/46 | | | |
| 150 | | Fort Bend County Industrial Development Corporation, Texas, Revenue Bonds, NRG Energy | 11/22 at 100.00 | Baa3 | 158,034 |
| | Inc Project, Series 2012B, 4.750%, 11/01/42 | | | |
| 825 | | New Hope Cultural Education Facilities Finance Corporation, Texas, Student Housing | 7/25 at 100.00 | B3 | 764,676 |
| | Revenue Bonds, NCCD – College Station Properties LLC – Texas A&M University Project, Series | | | |
| | 2015A, 5.000%, 7/01/47 | | | |
| 1,800 | | North Texas Tollway Authority, Special Projects System Revenue Bonds, Tender Option Bond | 9/21 at 100.00 | N/R (5) | 2,494,656 |
| | Trust 2016-XF2220, 20.001%, 9/01/41, 144A (Pre-refunded 9/01/21) (IF) | | | |
| 1,000 | | Red River Health Facilities Development Corporation, Texas, First Mortgage Revenue | 12/21 at 100.00 | N/R | 662,500 |
| | Bonds, Eden Home Inc, Series 2012, 2.576%, 12/15/47 (8) | | | |
| 1,675 | | Texas Department of Housing and Community Affairs, Single Family Mortgage Revenue Bonds, | 9/27 at 100.00 | Aaa | 1,820,608 |
| | Series 2018A, 4.250%, 9/01/48 | | | |
68
| | | | | | |
| Principal | | | Optional Call | | |
| Amount (000) | | Description (1) | Provisions (2) | Ratings (3) | Value |
| | Texas (continued) | | | |
| $ 425 | | Texas Municipal Gas Acquisition and Supply Corporation I, Gas Supply Revenue Bonds, | No Opt. Call | A2 | $ 495,877 |
| | Senior Lien Series 2008D, 6.250%, 12/15/26 | | | |
| 810 | | Texas Private Activity Bond Surface Transportation Corporation, Revenue Bonds, NTE | 12/19 at 100.00 | Baa2 | 817,322 |
| | Mobility Partners LLC North Tarrant Express Managed Lanes Project, Senior Lien Series 2009, | | | |
| | 6.875%, 12/31/39 | | | |
| | Texas Private Activity Bond Surface Transportation Corporation, Senior Lien Revenue | | | |
| | Bonds, Blueridge Transportation Group, LLC SH 288 Toll Lanes Project, Series 2016: | | | |
| 1,275 | | 5.000%, 12/31/50 (AMT) | 12/25 at 100.00 | Baa3 | 1,418,552 |
| 805 | | 5.000%, 12/31/55 (AMT) | 12/25 at 100.00 | Baa3 | 893,244 |
| 1,000 | | Texas Private Activity Bond Surface Transportation Corporation, Senior Lien Revenue | 6/20 at 100.00 | Baa3 | 1,039,160 |
| | Bonds, LBJ Infrastructure Group LLC IH-635 Managed Lanes Project, Series 2010, 7.000%, 6/30/34 | | | |
| 9,845 | | Total Texas | | | 10,646,103 |
| | Utah – 0.3% | | | |
| 1,000 | | Utah Charter School Finance Authority, Charter School Revenue Bonds, Paradigm High | 7/20 at 100.00 | BB | 1,018,710 |
| | School, Series 2010A, 6.250%, 7/15/30 | | | |
| | Vermont – 0.8% | | | |
| | Vermont Educational and Health Buildings Financing Agency, Revenue Bonds, Vermont Law | | | |
| | School Project, Series 2011A: | | | |
| 1,000 | | 6.125%, 1/01/28 (Pre-refunded 1/01/21) | 1/21 at 100.00 | N/R (5) | 1,055,030 |
| 1,760 | | 6.250%, 1/01/33 (Pre-refunded 1/01/21) | 1/21 at 100.00 | N/R (5) | 1,859,370 |
| 2,760 | | Total Vermont | | | 2,914,400 |
| | Virginia – 2.7% | | | |
| 10,000 | | Metropolitan Washington Airports Authority, Virginia, Dulles Toll Road Revenue Bonds, | No Opt. Call | BBB+ | 5,661,800 |
| | Dulles Metrorail & Capital improvement Projects, Second Senior Lien Series 2009B, 0.000%, | | | |
| | 10/01/37 – AGC Insured | | | |
| 2,000 | | Tobacco Settlement Financing Corporation of Virginia, Tobacco Settlement Asset Backed | 11/19 at 100.00 | B– | 2,005,440 |
| | Bonds, Series 2007B1, 5.000%, 6/01/47 | | | |
| 1,155 | | Virginia Small Business Financing Authority, Private Activity Revenue Bonds, Transform | 6/27 at 100.00 | BBB | 1,319,553 |
| | 66 P3 Project, Senior Lien Series 2017, 5.000%, 12/31/56 (AMT) | | | |
| 1,010 | | Virginia Small Business Financing Authority, Senior Lien Revenue Bonds, Elizabeth River | 7/22 at 100.00 | BBB | 1,099,678 |
| | Crossing, Opco LLC Project, Series 2012, 5.500%, 1/01/42 (AMT) | | | |
| 14,165 | | Total Virginia | | | 10,086,471 |
| | Washington – 3.1% | | | |
| 5,000 | | Port of Seattle, Washington, Revenue Bonds, Refunding First Lien Series 2016B, 5.000%, | 4/26 at 100.00 | Aa2 | 5,912,400 |
| | 10/01/31 (AMT) (UB) (4) | | | |
| 3,155 | | Skagit County Public Hospital District 1, Washington, Revenue Bonds, Skagit Valley | 12/26 at 100.00 | Baa2 | 3,713,246 |
| | Hospital, Refunding & Improvement Series 2016, 5.000%, 12/01/27 | | | |
| 155 | | Tacoma Consolidated Local Improvement District 65, Washington, Special Assessment Bonds, | 11/19 at 100.00 | N/R | 155,598 |
| | Series 2013, 5.750%, 4/01/43 | | | |
| 2,000 | | Washington Health Care Facilities Authority, Revenue Bonds, Fred Hutchinson Cancer | 1/21 at 100.00 | A+ | 2,076,680 |
| | Research Center, Series 2011A, 5.375%, 1/01/31 | | | |
| 10,310 | | Total Washington | | | 11,857,924 |
| | West Virginia – 0.1% | | | |
| 750 | | West Virginia Hospital Finance Authority, Hospital Revenue Bonds, Thomas Health System, | 11/19 at 100.00 | N/R | 438,750 |
| | Inc, Series 2008, 6.500%, 10/01/38 (8) | | | |
| | Wisconsin – 8.3% | | | |
| 25 | | Public Finance Authority of Wisconsin, Charter School Revenue Bonds, Corvian Community | 6/24 at 100.00 | N/R | 25,767 |
| | School Bonds, North Carolina, Series 2017A, 5.000%, 6/15/37, 144A | | | |
| 170 | | Public Finance Authority of Wisconsin, Charter School Revenue Bonds, North Carolina | 6/26 at 100.00 | N/R | 171,037 |
| | Charter Educational Foundation Project, Series 2016A, 5.000%, 6/15/36, 144A | | | |
69
| | | | | |
| NEV | Nuveen Enhanced Municipal Value Fund | | |
| Portfolio of Investments (continued) | | | |
| October 31, 2019 | | | |
|
|
|
|
| Principal | | | Optional Call | | |
| Amount (000) | | Description (1) | Provisions (2) | Ratings (3) | Value |
| | Wisconsin (continued) | | | |
| | Public Finance Authority of Wisconsin, Conference Center and Hotel Revenue Bonds, | | | |
| | Lombard Public Facilities Corporation, Second Tier Series 2018B: | | | |
| $ 69 | | 0.000%, 1/01/46, 144A | No Opt. Call | N/R | $ 2,349 |
| 68 | | 0.000%, 1/01/47, 144A | No Opt. Call | N/R | 2,271 |
| 68 | | 0.000%, 1/01/48, 144A | No Opt. Call | N/R | 2,267 |
| 67 | | 0.000%, 1/01/49, 144A | No Opt. Call | N/R | 2,246 |
| 67 | | 0.000%, 1/01/50, 144A | No Opt. Call | N/R | 2,166 |
| 73 | | 0.000%, 1/01/51, 144A | No Opt. Call | N/R | 2,377 |
| 1,896 | | 3.750%, 7/01/51, 144A | 3/28 at 100.00 | N/R | 1,682,258 |
| 72 | | 0.000%, 1/01/52, 144A | No Opt. Call | N/R | 2,311 |
| 71 | | 0.000%, 1/01/53, 144A | No Opt. Call | N/R | 2,279 |
| 71 | | 0.000%, 1/01/54, 144A | No Opt. Call | N/R | 2,242 |
| 70 | | 0.000%, 1/01/55, 144A | No Opt. Call | N/R | 2,202 |
| 69 | | 0.000%, 1/01/56, 144A | No Opt. Call | N/R | 2,174 |
| 68 | | 0.000%, 1/01/57, 144A | No Opt. Call | N/R | 2,136 |
| 67 | | 0.000%, 1/01/58, 144A | No Opt. Call | N/R | 2,094 |
| 67 | | 0.000%, 1/01/59, 144A | No Opt. Call | N/R | 2,077 |
| 67 | | 0.000%, 1/01/60, 144A | No Opt. Call | N/R | 2,029 |
| 66 | | 0.000%, 1/01/61, 144A | No Opt. Call | N/R | 1,975 |
| 65 | | 0.000%, 1/01/62, 144A | No Opt. Call | N/R | 1,944 |
| 64 | | 0.000%, 1/01/63, 144A | No Opt. Call | N/R | 1,907 |
| 64 | | 0.000%, 1/01/64, 144A | No Opt. Call | N/R | 1,890 |
| 63 | | 0.000%, 1/01/65, 144A | No Opt. Call | N/R | 1,843 |
| 62 | | 0.000%, 1/01/66, 144A | No Opt. Call | N/R | 1,754 |
| 808 | | 0.000%, 1/01/67, 144A | No Opt. Call | N/R | 21,539 |
| 160 | | Public Finance Authority of Wisconsin, Revenue Bonds, Prime Healthcare Foundation, Inc, | 12/27 at 100.00 | BBB– | 187,590 |
| | Series 2017A, 5.200%, 12/01/37 | | | |
| 2,905 | | Public Finance Authority of Wisconsin, Student Housing Revenue Bonds, Collegiate Housing | 7/25 at 100.00 | BBB– | 3,204,651 |
| | Foundation – Cullowhee LLC – Western California University Project, Series 2015A, | | | |
| | 5.000%, 7/01/35 | | | |
| 1,000 | | Wisconsin Center District, Dedicated Tax Revenue Bonds, Refunding Senior Series 2003A, | No Opt. Call | AA | 754,870 |
| | 0.000%, 12/15/31 | | | |
| 1,000 | | Wisconsin Health and Educational Facilities Authority, Revenue Bonds, Beloit College, | 6/20 at 100.00 | N/R (5) | 1,027,470 |
| | Series 2010A, 6.000%, 6/01/30 (Pre-refunded 6/01/20) | | | |
| 500 | | Wisconsin Health and Educational Facilities Authority, Revenue Bonds, Beloit Health | 4/20 at 100.00 | A | 505,460 |
| | System, Inc, Series 2010B, 5.000%, 4/01/30 | | | |
| 1,290 | | Wisconsin Health and Educational Facilities Authority, Revenue Bonds, Froedtert | 10/22 at 100.00 | AA | 1,497,871 |
| | Community Health, Inc Obligated Group, Tender Option Bond Trust 2015-XF0118, 12.488%, | | | |
| | 4/01/42, 144A (IF) (4) | | | |
| | Wisconsin Health and Educational Facilities Authority, Wisconsin, Revenue Bonds, | | | |
| | Ascension Health Alliance Senior Credit Group, Series 2016A: | | | |
| 10,000 | | 5.000%, 11/15/35 (UB) (4) | 5/26 at 100.00 | AA+ | 11,863,000 |
| 5,000 | | 5.000%, 11/15/36 (UB) (4) | 5/26 at 100.00 | AA+ | 5,919,150 |
| 3,000 | | 5.000%, 11/15/39 (UB) (4) | 5/26 at 100.00 | AA+ | 3,509,910 |
| 25 | | Wisconsin Health and Educational Facilities Authority, Wisconsin, Revenue Bonds, Monroe | 8/25 at 100.00 | N/R (5) | 29,965 |
| | Clinic Inc, Refunding Series 2016, 5.000%, 2/15/28 (Pre-refunded 8/15/25) | | | |
| 1,090 | | Wisconsin Health and Educational Facilities Authority, Wisconsin, Revenue Bonds, Three | 8/23 at 100.00 | A | 1,183,653 |
| | Pillars Senior Living Communities, Refunding Series 2013, 5.000%, 8/15/43 | | | |
| 30,287 | | Total Wisconsin | | | 31,628,724 |
70
| | | | | | |
| Principal | | | Optional Call | | |
| Amount (000) | | Description (1) | Provisions (2) | Ratings (3) | Value |
| | Wyoming – 0.6% | | | |
| | Wyoming Community Development Authority, Student Housing Revenue Bonds, CHF-Wyoming, LLC – | | | |
| | University of Wyoming Project, Series 2011: | | | |
| $ 710 | | 6.250%, 7/01/31 | 7/21 at 100.00 | BBB | $ 746,828 |
| 1,600 | | 6.500%, 7/01/43 | 7/21 at 100.00 | BBB | 1,677,504 |
| 2,310 | | Total Wyoming | | | 2,424,332 |
| $ 632,459 | | Total Long-Term Investments (cost $444,711,592) | | | 480,727,796 |
| | Floating Rate Obligations – (31.3)% | | | (118,892,000) |
| | Other Assets Less Liabilities – 4.8% | | | 18,124,906 |
| | Net Assets Applicable to Common Shares – 100% | | | $ 379,960,702 |
| | |
(1) | All percentages shown in the Portfolio of Investments are based on net assets applicable to common shares unless otherwise noted. |
(2) | Optional Call Provisions: Dates (month and year) and prices of the earliest optional call or redemption. There may be other call provisions at varying prices at later dates. Certain mortgage-backed securities may be subject to periodic principal paydowns. Optional Call Provisions are not covered by the report of independent registered public accounting firm. |
(3) | For financial reporting purposes, the ratings disclosed are the highest of Standard & Poor’s Group (“Standard & Poor’s”), Moody’s Investors Service, Inc. (“Moody’s”) or Fitch, Inc. (“Fitch”) rating. This treatment of split-rated securities may differ from that used for other purposes, such as for Fund investment policies. Ratings below BBB by Standard & Poor’s, Baa by Moody’s or BBB by Fitch are considered to be below investment grade. Holdings designated N/R are not rated by any of these national rating agencies. Ratings are not covered by the report of independent registered public accounting firm. |
(4) | Investment, or portion of investment, has been pledged to collateralize the net payment obligations for investments in inverse floating rate transactions. |
(5) | Backed by an escrow or trust containing sufficient U.S. Government or U.S. Government agency securities, which ensure the timely payment of principal and interest. |
(6) | Variable rate security. The rate shown is the coupon as of the end of the reporting period. |
(7) | Investment valued at fair value using methods determined in good faith by, or at the discretion of, the Board. For fair value measurement disclosure purposes, investment classified as Level 3. See Notes to Financial Statements, Note 3 - Investment Valuation and Fair Value Measurements for more information. |
(8) | Defaulted security. A security whose issuer has failed to fully pay principal and/or interest when due, or is under the protection of bankruptcy. |
(9) | Step-up coupon bond, a bond with a coupon that increases (“steps up”), usually at regular intervals, while the bond is outstanding. The rate shown is the coupon as of the end of the reporting period. |
144A | Investment is exempt from registration under Rule 144A of the Securities Act of 1933, as amended. These investments may only be resold in transactions exempt from registration, which are normally those transactions with qualified institutional buyers. |
AMT | Alternative Minimum Tax |
IF | Inverse floating rate security issued by a tender option bond (“TOB”) trust, the interest rate on which varies inversely with the Securities Industry Financial Markets Association (SIFMA) short-term rate, which resets weekly, or a similar short-term rate, and is reduced by the expenses related to the TOB trust.
|
LIBOR
| London Inter-Bank Offered Rate
|
| Underlying bond of an inverse floating rate trust reflected as a financing transaction. See Notes to Financial Statements, Note 4 – Portfolio Securities and Investments in Derivatives, Inverse Floating Rate Securities for more information.
|
| See accompanying notes to financial statements. |
71
Statement of Assets and Liabilities
October 31, 2019
| | | | | | | | | | | | | |
| | NUV | | | NUW | | | NMI | | | NEV | |
| Assets | | | | | | | | | | | | |
Long-term investments, at value (cost $1,946,181,597, $228,219,330, | | | | | | | | | | | | |
| $90,276,141 and $444,711,592, respectively) | | $ | 2,188,112,622 | | | $ | 260,289,713 | | | $ | 98,444,032 | | | $ | 480,727,796 | |
Short-term investments, at value (cost approximates value) | | | 7,920,000 | | | | — | | | | — | | | | — | |
Cash | | | — | | | | 1,836,044 | | | | 215,804 | | | | 8,458,474 | |
Cash collateral at brokers for investments in futures contracts(1) | | | — | | | | 383,000 | | | | — | | | | — | |
Receivable for: | | | | | | | | | | | | | | | | |
| Interest | | | 25,761,273 | | | | 2,681,509 | | | | 1,220,332 | | | | 8,241,113 | |
| Investments sold | | | 14,340,000 | | | | 5,000 | | | | 334,585 | | | | 6,417,951 | |
Deferred offering costs | | | — | | | | 160,000 | | | | — | | | | — | |
Other assets | | | 367,358 | | | | 1,405 | | | | 1,411 | | | | 25,373 | |
| Total assets | | | 2,236,501,253 | | | | 265,356,671 | | | | 100,216,164 | | | | 503,870,707 | |
| Liabilities | | | | | | | | | | | | | | | | |
Cash overdraft | | | 7,965,272 | | | | — | | | | — | | | | — | |
Floating rate obligations | | | 29,705,000 | | | | 2,000,000 | | | | — | | | | 118,892,000 | |
Payable for: | | | | | | | | | | | | | | | | |
| Dividends | | | 5,802,253 | | | | 699,188 | | | | 291,185 | | | | 1,400,531 | |
| Interest | | | 77,450 | | | | 2,404 | | | | — | | | | 910,088 | |
| Investments purchased | | | 4,515,160 | | | | — | | | | — | | | | 2,308,698 | |
| Variation margin on futures contracts | | | — | | | | 236,438 | | | | — | | | | — | |
Accrued expenses: | | | | | | | | | | | | | | | | |
| Management fees | | | 805,344 | | | | 124,535 | | | | 51,504 | | | | 292,952 | |
| Directors/Trustees fees | | | 374,047 | | | | 2,377 | | | | 901 | | | | 26,913 | |
| Shelf offering costs | | | — | | | | 41,149 | | | | — | | | | — | |
| Other | | | 333,824 | | | | 60,833 | | | | 50,239 | | | | 78,823 | |
| Total liabilities | | | 49,578,350 | | | | 3,166,924 | | | | 393,829 | | | | 123,910,005 | |
Net assets applicable to common shares | | $ | 2,186,922,903 | | | $ | 262,189,747 | | | $ | 99,822,335 | | | $ | 379,960,702 | |
Common shares outstanding | | | 206,875,449 | | | | 15,516,082 | | | | 8,815,081 | | | | 24,950,068 | |
Net asset value (“NAV”) per common share outstanding | | $ | 10.57 | | | $ | 16.90 | | | $ | 11.32 | | | $ | 15.23 | |
| | |
| Net assets applicable to common shares consist of: | | | | | | | | | | | | | | | | |
Common shares, $0.01 par value per share | | $ | 2,068,754 | | | $ | 155,161 | | | $ | 88,151 | | | $ | 249,501 | |
Paid-in surplus | | | 1,956,383,687 | | | | 229,910,880 | | | | 91,191,187 | | | | 347,118,270 | |
Total distributable earnings | | | 228,470,462 | | | | 32,123,706 | | | | 8,542,997 | | | | 32,592,931 | |
Net assets applicable to common shares | | $ | 2,186,922,903 | | | $ | 262,189,747 | | | $ | 99,822,335 | | | $ | 379,960,702 | |
Authorized common shares | | | 350,000,000 | | | Unlimited | | | | 200,000,000 | | | Unlimited | |
| |
(1) Cash pledged to collateralize the net payment obligations for investments in derivatives. |
See accompanying notes to financial statements.
72
| |
| Statement of Operations |
|
| Year Ended October 31, 2019 |
|
|
|
| | |
| | NUV | | | NUW | | | NMI | | | NEV | |
| Investment Income | | $ | 88,844,695 | | | $ | 11,019,581 | | | $ | 4,508,659 | | | $ | 24,201,645 | |
| Expenses | | | | | | | | | | | | | | | | |
Management fees | | | 9,555,279 | | | | 1,487,923 | | | | 593,560 | | | | 3,488,750 | |
Interest expense | | | 748,000 | | | | 175,215 | | | | — | | | | 2,241,574 | |
Custodian fees | | | 205,864 | | | | 34,422 | | | | 26,351 | | | | 56,607 | |
Directors/Trustees fees | | | 63,549 | | | | 7,581 | | | | 2,909 | | | | 11,063 | |
Professional fees | | | 77,000 | | | | 72,152 | | | | 66,999 | | | | 55,364 | |
Shareholder reporting expenses | | | 209,393 | | | | 29,252 | | | | 45,725 | | | | 35,756 | |
Shareholder servicing agent fees | | | 394,240 | | | | 280 | | | | 7,327 | | | | 224 | |
Stock exchange listing fees | | | 58,072 | | | | 7,873 | | | | 7,496 | | | | 7,002 | |
Investor relations expenses | | | 93,093 | | | | 11,093 | | | | 4,687 | | | | 15,814 | |
Other | | | 134,231 | | | | 21,298 | | | | 16,687 | | | | 60,248 | |
Total expenses | | | 11,538,721 | | | | 1,847,089 | | | | 771,741 | | | | 5,972,402 | |
Net investment income (loss) | | | 77,305,974 | | | | 9,172,492 | | | | 3,736,918 | | | | 18,229,243 | |
| Realized and Unrealized Gain (Loss) | | | | | | | | | | | | | | | | |
Net realized gain (loss) from: | | | | | | | | | | | | | | | | |
| Investments | | | 2,207,524 | | | | 830,880 | | | | 310,265 | | | | 1,410,685 | |
| Futures contracts | | | — | | | | (1,126,291 | ) | | | — | | | | — | |
Change in net unrealized appreciation (depreciation) of: | | | | | | | | | | | | | | | | |
| Investments | | | 149,146,468 | | | | 17,969,895 | | | | 3,889,403 | | | | 21,894,612 | |
| Futures contracts | | | — | | | | 267,165 | | | | — | | | | — | |
Net realized and unrealized gain (loss) | | | 151,353,992 | | | | 17,941,649 | | | | 4,199,668 | | | | 23,305,297 | |
Net increase (decrease) in net assets applicable to common shares | | | | | | | | | | | | | | | | |
| from operations | | $ | 228,659,966 | | | $ | 27,114,141 | | | $ | 7,936,586 | | | $ | 41,534,540 | |
See accompanying notes to financial statements.
73
Statement of Changes in Net Assets
| | | | | | | | | | | | | |
| | NUV | | | NUW | |
| | Year Ended | | | Year Ended | | | Year Ended | | | Year Ended | |
| | 10/31/19 | | | 10/31/18 | | | 10/31/19 | | | 10/31/18 | |
| Operations | | | | | | | | | | | | |
Net investment income (loss) | | $ | 77,305,974 | | | $ | 78,480,821 | | | $ | 9,172,492 | | | $ | 10,739,136 | |
Net realized gain (loss) from: | | | | | | | | | | | | | | | | |
| Investments | | | 2,207,524 | | | | (1,117,529 | ) | | | 830,880 | | | | 1,480,929 | |
| Futures contracts | | | — | | | | — | | | | (1,126,291 | ) | | | — | |
Change in net unrealized appreciation (depreciation) of: | | | | | | | | | | | | | | | | |
| Investments | | | 149,146,468 | | | | (91,610,753 | ) | | | 17,969,895 | | | | (15,564,805 | ) |
| Futures contracts | | | — | | | | — | | | | 267,165 | | | | — | |
Net increase (decrease) in net assets applicable to common shares | | | | | | | | | | | | | | | | |
| from operations | | | 228,659,966 | | | | (14,247,461 | ) | | | 27,114,141 | | | | (3,344,740 | ) |
| Distributions to Common Shareholders | | | | | | | | | | | | | | | | |
Dividends | | | (76,957,670 | ) | | | (80,577,992 | ) | | | (11,574,595 | ) | | | (13,775,655 | ) |
Decrease in net assets applicable to common shares from | | | | | | | | | | | | | | | | |
| distributions to common shareholders | | | (76,957,670 | ) | | | (80,577,992 | ) | | | (11,574,595 | ) | | | (13,775,655 | ) |
| Capital Share Transactions | | | | | | | | | | | | | | | | |
Proceeds from shelf offering, net of offering costs | | | — | | | | — | | | | 1,920,037 | | | | 5,126,753 | |
Net proceeds from common shares issued to common shareholders | | | | | | | | | | | | | | | | |
| due to reinvestment of distributions | | | — | | | | — | | | | 118,439 | | | | 324,271 | |
Net increase (decrease) in net assets applicable to common shares | | | | | | | | | | | | | | | | |
| from capital share transactions | | | — | | | | — | | | | 2,038,476 | | | | 5,451,024 | |
Net increase (decrease) in net assets applicable to common shares | | | 151,702,296 | | | | (94,825,453 | ) | | | 17,578,022 | | | | (11,669,371 | ) |
Net assets applicable to common shares at the beginning of period | | | 2,035,220,607 | | | | 2,130,046,060 | | | | 244,611,725 | | | | 256,281,096 | |
Net assets applicable to common shares at the end of period | | $ | 2,186,922,903 | | | $ | 2,035,220,607 | | | $ | 262,189,747 | | | $ | 244,611,725 | |
See accompanying notes to financial statements.
74
| | | | | | | | | | | | | |
| | NMI | | | NEV
| |
| | Year Ended | | | Year Ended | | | Year Ended | | | Year Ended | |
| | 10/31/19 | | | 10/31/18 | | | 10/31/19 | | | 10/31/18 | |
| Operations | | | | | | | | | | | | |
Net investment income (loss) | | $ | 3,736,918 | | | $ | 3,752,004 | | | $ | 18,229,243 | | | $ | 18,814,566 | |
Net realized gain (loss) from: | | | | | | | | | | | | | | | | |
| Investments | | | 310,265 | | | | 626,362 | | | | 1,410,685 | | | | (814,787 | ) |
| Futures contracts | | | — | | | | — | | | | — | | | | — | |
Change in net unrealized appreciation (depreciation) of: | | | | | | | | | | | | | | | | |
| Investments | | | 3,889,403 | | | | (4,414,017 | ) | | | 21,894,612 | | | | (18,566,356 | ) |
| Futures contracts | | | — | | | | — | | | | — | | | | — | |
Net increase (decrease) in net assets applicable to common shares | | | | | | | | | | | | | | | | |
| from operations | | | 7,936,586 | | | | (35,651 | ) | | | 41,534,540 | | | | (566,577 | ) |
| Distributions to Common Shareholders | | | | | | | | | | | | | | | | |
Dividends | | | (4,407,671 | ) | | | (3,961,991 | ) | | | (16,916,146 | ) | | | (19,171,632 | ) |
Decrease in net assets applicable to common shares from | | | | | | | | | | | | | | | | |
| distributions to common shareholders | | | (4,407,671 | ) | | | (3,961,991 | ) | | | (16,916,146 | ) | | | (19,171,632 | ) |
| Capital Share Transactions | | | | | | | | | | | | | | | | |
Proceeds from shelf offering, net of offering costs | | | 828,032 | | | | 2,135,825 | | | | — | | | | — | |
Net proceeds from common shares issued to common shareholders | | | | | | | | | | | | | | | | |
| due to reinvestment of distributions | | | 69,151 | | | | 120,057 | | | | — | | | | — | |
Net increase (decrease) in net assets applicable to common shares | | | | | | | | | | | | | | | | |
| from capital share transactions | | | 897,183 | | | | 2,255,882 | | | | — | | | | — | |
Net increase (decrease) in net assets applicable to common shares | | | 4,426,098 | | | | (1,741,760 | ) | | | 24,618,394 | | | | (19,738,209 | ) |
Net assets applicable to common shares at the beginning of period | | | 95,396,237 | | | | 97,137,997 | | | | 355,342,308 | | | | 375,080,517 | |
Net assets applicable to common shares at the end of period | | $ | 99,822,335 | | | $ | 95,396,237 | | | $ | 379,960,702 | | | $ | 355,342,308 | |
See accompanying notes to financial statements.
75
| |
| Statement of Cash Flows |
|
| Year Ended October 31, 2019 |
|
|
|
| | |
| | NEV | |
| Cash Flows from Operating Activities: | | | |
| Net Increase (Decrease) in Net Assets Applicable to Common Shares from Operations | | $ | 41,534,540 | |
Adjustments to reconcile the net increase (decrease) in net assets applicable to common shares from | | | | |
| operations to net cash provided by (used in) operating activities: | | | | |
Purchases of investments | | | (64,261,863 | ) |
Proceeds from sales and maturities of investments | | | 52,926,212 | |
Amortization (Accretion) of premiums and discounts, net | | | 838,057 | |
(Increase) Decrease in: | | | | |
| Receivable for interest | | | (543,791 | ) |
| Receivable for investments sold | | | (2,635,998 | ) |
| Other assets | | | 13,327 | |
Increase (Decrease) in: | | | | |
| Payable for interest | | | 910,088 | |
| Payable for investments purchased | | | 2,308,698 | |
| Accrued management fees | | | (945 | ) |
| Accrued Directors/Trustees fees | | | 2,142 | |
| Accrued other expenses | | | 6,964 | |
Net realized (gain) loss from investments | | | (1,410,685 | ) |
Change in net unrealized appreciation (depreciation) of investments | | | (21,894,612 | ) |
Net cash provided by (used in) operating activities | | | 7,792,134 | |
| Cash Flows from Financing Activities: | | | | |
Increase (Decrease) in cash overdraft | | | (5,379,521 | ) |
Proceeds from floating rate obligations | | | 22,962,000 | |
Cash distributions paid to common shareholders | | | (16,916,139 | ) |
Net cash provided by (used in) financing activities | | | 666,340 | |
| Net Increase (Decrease) in Cash and Cash Collateral at Brokers | | | 8,458,474 | |
Cash and Cash Collateral at Brokers at the beginning of period | | | — | |
Cash and Cash Collateral at Brokers at the end of period | | $ | 8,458,474 | |
| | | | | |
| | | | | |
| Supplemental Disclosures of Cash Flow Information | | NEV | |
Cash paid for interest | | $ | 1,331,486 | |
See accompanying notes to financial statements.
76
THIS PAGE INTENTIONALLY LEFT BLANK
77
| |
| Financial Highlights |
|
|
|
|
Selected data for a common share outstanding throughout each period: |
|
|
|
| | |
| | | | | Investment Operations
| | | Less Distributions to Common Shareholders
| | | Common Share | |
| | Beginning Common Share NAV | | | Net Investment Income (Loss) | | | Net Realized/ Unrealized Gain (Loss) | | | Total | | | From Net Investment Income | | | From Accumu- lated Net Realized Gains | | | Total | | | Shelf Offering Costs | | | Premium from Shares Sold through Shelf Offering | | | Ending NAV | | | Ending Share Price | |
| NUV | | | | | | | | | | | | | | | | | | | | | | | | | | | | | | | | | |
Year Ended 10/31:
| | | | | | | | | | | | | | | | | | | | | | | | | | | | |
2019 | | $ | 9.84 | | | $ | 0.37 | | | $ | 0.73 | | | $ | 1.10 | | | $ | (0.37 | ) | | $ | — | | | $ | (0.37 | ) | | $ | — | | | $ | — | | | $ | 10.57 | | | $ | 10.43 | |
2018 | | | 10.30 | | | | 0.38 | | | | (0.45 | ) | | | (0.07 | ) | | | (0.39 | ) | | | — | | | | (0.39 | ) | | | — | | | | — | | | | 9.84 | | | | 9.18 | |
2017 | | | 10.39 | | | | 0.40 | | | | (0.10 | ) | | | 0.30 | | | | (0.39 | ) | | | — | | | | (0.39 | ) | | | — | | | | — | | | | 10.30 | | | | 10.12 | |
2016 | | | 10.20 | | | | 0.40 | | | | 0.18 | | | | 0.58 | | | | (0.39 | ) | | | — | | | | (0.39 | ) | | | — | | | | — | * | | | 10.39 | | | | 9.98 | |
2015 | | | 10.21 | | | | 0.42 | | | | (0.03 | ) | | | 0.39 | | | | (0.40 | ) | | | — | | | | (0.40 | ) | | | — | | | | — | | | | 10.20 | | | | 10.07 | |
| | |
| NUW | | | | | | | | | | | | | | | | | | | | | | | | | | | | | | | | | | | | | | | | | | | | |
Year Ended 10/31:
| | | | | | | | | | | | | | | | | | | | | | | | | | | | | | | | | | | | | |
2019 | | | 15.88 | | | | 0.60 | | | | 1.16 | | | | 1.76 | | | | (0.65 | ) | | | (0.10 | ) | | | (0.75 | ) | | | — | | | | 0.01 | | | | 16.90 | | | | 16.83 | |
2018 | | | 16.99 | | | | 0.70 | | | | (0.92 | ) | | | (0.22 | ) | | | (0.72 | ) | | | (0.18 | ) | | | (0.90 | ) | | | — | | | | 0.01 | | | | 15.88 | | | | 14.36 | |
2017 | | | 17.22 | | | | 0.75 | | | | (0.26 | ) | | | 0.49 | | | | (0.73 | ) | | | — | | | | (0.73 | ) | | | (0.01 | ) | | | 0.02 | | | | 16.99 | | | | 17.17 | |
2016 | | | 17.17 | | | | 0.76 | | | | 0.06 | | | | 0.82 | | | | (0.79 | ) | | | — | | | | (0.79 | ) | | | (0.01 | ) | | | 0.03 | | | | 17.22 | | | | 16.96 | |
2015 | | | 17.19 | | | | 0.80 | | | | (0.04 | ) | | | 0.76 | | | | (0.79 | ) | | | — | | | | (0.79 | ) | | | — | | | | 0.01 | | | | 17.17 | | | | 17.22 | |
| | |
(a) | Total Return Based on Common Shares NAV is the combination of changes in common shares NAV, reinvested dividend income at NAV and reinvested capital gains distributions at NAV, if any. The last dividend declared in the period, which is typically paid on the first business day of the following month, is assumed to be reinvested at the ending NAV. The actual reinvest price for the last dividend declared in the period may often be based on the Fund’s market price (and not its NAV), and therefore may be different from the price used in the calculation. Total returns are not annualized. |
| Total Return Based on Common Share Price is the combination of changes in the market price per share and the effect of reinvested dividend income and reinvested capital gains distributions, if any, at the average price paid per share at the time of reinvestment. The last dividend declared in the period, which is typically paid on the first business day of the following month, is assumed to be reinvested at the ending market price. The actual reinvestment for the last dividend declared in the period may take place over several days, and in some instances may not be based on the market price, so the actual reinvestment price may be different from the price used in the calculation. Total returns are not annualized. |
78
| | | | | | | | | | | | | | | | | |
| | | | | | | Common Share Supplemental Data/ Ratio Applicable to Common Shares
| |
Common Shares Total Returns
| | | | | | Ratios to Average Net Assets | | | | |
| | |
| | |
| | |
Based on NAV(a) | | | Based on Share Price(a) | | | Ending Net Assets (000) | | | Expenses(b) | | | Net Investment Income (Loss) | | | Portfolio Turnover Rate(c) | |
| | |
| | |
| | 11.35 | % | | | 17.92 | % | | $ | 2,186,923 | | | | 0.54 | % | | | 3.63 | % | | | 13 | % |
| | (0.71 | ) | | | (5.55 | ) | | | 2,035,221 | | | | 0.54 | | | | 3.76 | | | | 20 | |
| | 3.03 | | | | 5.48 | | | | 2,130,046 | | | | 0.52 | | | | 3.89 | | | | 17 | |
| | 5.74 | | | | 2.91 | | | | 2,150,444 | | | | 0.51 | | | | 3.87 | | | | 11 | |
| | 3.94 | | | | 8.86 | | | | 2,096,508 | | | | 0.53 | | | | 4.08 | | | | 16 | |
| | |
| | |
| | |
| | 11.38 | | | | 22.81 | | | | 262,190 | | | | 0.73 | | | | 3.61 | | | | 31 | |
| | (1.31 | ) | | | (11.54 | ) | | | 244,612 | | | | 0.80 | | | | 4.26 | | | | 30 | |
| | 3.02 | | | | 5.71 | | | | 256,281 | | | | 0.81 | | | | 4.45 | | | | 16 | |
| | 4.90 | | | | 2.99 | | | | 247,394 | | | | 0.71 | | | | 4.38 | | | | 12 | |
| | 4.56 | | | | 6.79 | | | | 228,952 | | | | 0.72 | | | | 4.72 | | | | 6 | |
| | |
(b) | The expense ratios reflect, among other things, the interest expense deemed to have been paid by the Fund on the floating rate certificates issued by the special purpose trusts for the self-deposited inverse floaters held by the Fund (as described in Note 4 – Portfolio Securities and Investments in Derivatives, Inverse Floating Rate Securities), where applicable, as follows: |
| | | | | |
| NUV | | | NUW | |
Year Ended 10/31: | | | Year Ended 10/31: | |
2019 | 0.04% | | 2019 | 0.07% |
2018 | 0.03 | | 2018 | 0.10 |
2017 | 0.01 | | 2017 | 0.06 |
2016 | 0.01 | | 2016 | 0.03 |
2015 | 0.00** | | 2015 | 0.02 |
| | |
(c) | Portfolio Turnover Rate is calculated based on the lesser of long-term purchases or sales (as disclosed in Note 4 – Portfolio Securities and Investments in Derivatives, Investment Transactions) divided by the average long-term market value during the period. |
* | Rounds to less than $0.01 per share. |
** | Rounds to less than 0.01%. |
See accompanying notes to financial statements.
79
| |
| Financial Highlights (continued) |
|
|
|
|
Selected data for a common share outstanding throughout each period: |
|
|
|
| | |
| | | | | Investment Operations | | | Less Distributions to Common Shareholders
| | | Common Share | |
| | | Beginning Common Share NAV | | | Net Investment Income (Loss) | | | Net Realized/ Unrealized Gain (Loss) | | | Total | | | From Net Investment Income | | | From Accumu- lated Net Realized Gains | | | Total | | | Shelf Offering Costs | | | Premium from Shares Sold through Shelf Offering | | | Ending NAV | | | Ending Share Price | |
| NMI | | | | | | | | | | | | | | | | | | | | | | | | | | | | | | | | | |
Year Ended 10/31:
| | | | | | | | | | | | | | | | | | | | | | | | | | | | |
2019 | | $ | 10.92 | | | $ | 0.43 | | | $ | 0.47 | | | $ | 0.90 | | | $ | (0.43 | ) | | $ | (0.07 | ) | | $ | (0.50 | ) | | $ | — | | | $ | — | * | | $ | 11.32 | | | $ | 11.33 | |
2018 | | | 11.38 | | | | 0.43 | | | | (0.43 | ) | | | — | | | | (0.46 | ) | | | — | | | | (0.46 | ) | | | (0.01 | ) | | | 0.01 | | | | 10.92 | | | | 10.09 | |
2017 | | | 11.61 | | | | 0.48 | | | | (0.22 | ) | | | 0.26 | | | | (0.49 | ) | | | — | | | | (0.49 | ) | | | (0.01 | ) | | | 0.01 | | | | 11.38 | | | | 11.45 | |
2016 | | | 11.47 | | | | 0.50 | | | | 0.15 | | | | 0.65 | | | | (0.51 | ) | | | — | | | | (0.51 | ) | | | — | | | | — | | | | 11.61 | | | | 12.20 | |
2015 | | | 11.52 | | | | 0.51 | | | | (0.05 | ) | | | 0.46 | | | | (0.51 | ) | | | — | | | | (0.51 | ) | | | — | | | | — | | | | 11.47 | | | | 11.05 | |
| | |
| NEV | | | | | | | | | | | | | | | | | | | | | | | | | | | | | | | | | | | | | | | | | | | | |
Year Ended 10/31:
| | | | | | | | | | | | | | | | | | | | | | | | | | | | | | | | | | | | | |
2019 | | | 14.24 | | | | 0.73 | | | | 0.94 | | | | 1.67 | | | | (0.68 | ) | | | — | | | | (0.68 | ) | | | — | | | | — | | | | 15.23 | | | | 14.60 | |
2018 | | | 15.03 | | | | 0.75 | | | | (0.77 | ) | | | (0.02 | ) | | | (0.77 | ) | | | — | | | | (0.77 | ) | | | — | | | | — | | | | 14.24 | | | | 12.70 | |
2017 | | | 15.58 | | | | 0.82 | | | | (0.55 | ) | | | 0.27 | | | | (0.82 | ) | | | — | | | | (0.82 | ) | | | — | | | | — | | | | 15.03 | | | | 14.28 | |
2016 | | | 15.59 | | | | 0.85 | | | | 0.04 | | | | 0.89 | | | | (0.95 | ) | | | — | | | | (0.95 | ) | | | — | | | | 0.05 | | | | 15.58 | | | | 14.75 | |
2015 | | | 15.69 | | | | 0.93 | | | | (0.06 | ) | | | 0.87 | | | | (0.97 | ) | | | — | | | | (0.97 | ) | | | — | | | | — | | | | 15.59 | | | | 15.38 | |
| | |
(a) | Total Return Based on Common Shares NAV is the combination of changes in common shares NAV, reinvested dividend income at NAV and reinvested capital gains distributions at NAV, if any. The last dividend declared in the period, which is typically paid on the first business day of the following month, is assumed to be reinvested at the ending NAV. The actual reinvest price for the last dividend declared in the period may often be based on the Fund’s market price (and not its NAV), and therefore may be different from the price used in the calculation. Total returns are not annualized. |
| Total Return Based on Common Share Price is the combination of changes in the market price per share and the effect of reinvested dividend income and reinvested capital gains distributions, if any, at the average price paid per share at the time of reinvestment. The last dividend declared in the period, which is typically paid on the first business day of the following month, is assumed to be reinvested at the ending market price. The actual reinvestment for the last dividend declared in the period may take place over several days, and in some instances may not be based on the market price, so the actual reinvestment price may be different from the price used in the calculation. Total returns are not annualized. |
80
| | | | | | | | | | | | | | | | | |
| | | | | | | Common Share Supplemental Data/ Ratio Applicable to Common Shares | |
Common Shares Total Returns
| | | | | | Ratios to Average Net Assets | | | | |
| | |
| | |
| | |
Based on NAV(a) | | | Based on Share Price(a) | | | Ending Net Assets (000) | | | Expenses(b) | | | Net Investment Income (Loss) | | | Portfolio Turnover Rate(d) | |
| | |
| | |
| | 8.45 | % | | | 17.61 | % | | $ | 99,822 | | | | 0.79 | % | | | 3.83 | % | | | 10 | % |
| | (0.05 | ) | | | (8.14 | ) | | | 95,396 | | | | 0.89 | | | | 3.87 | | | | 17 | |
| | 2.34 | | | | (2.04 | ) | | | 97,138 | | | | 0.79 | | | | 4.23 | | | | 12 | |
| | 5.71 | | | | 15.22 | | | | 96,532 | | | | 0.76 | | | | 4.33 | | | | 4 | |
| | 4.08 | | | | 2.31 | | | | 95,149 | | | | 0.74 | | | | 4.43 | | | | 10 | |
| | |
| | |
| | |
| | 11.92 | | | | 20.66 | | | | 379,961 | | | | 1.61 | | | | 4.92 | | | | 11 | |
| | (0.17 | ) | | | (5.93 | ) | | | 355,342 | | | | 1.42 | | | | 5.14 | | | | 15 | |
| | 1.93 | | | | 2.50 | | | | 375,081 | | | | 1.14 | | | | 5.47 | | | | 8 | |
| | 6.10 | | | | 1.85 | | | | 388,835 | | | | 1.03 | | | | 5.44 | | | | 6 | |
| | 5.68 | | | | 9.90 | | | | 328,856 | | | | 1.05(c | ) | | | 5.93(c | ) | | | 12 | |
| | |
(b) | The expense ratios reflect, among other things, the interest expense deemed to have been paid by the Fund on the floating rate certificates issued by the special purpose trusts for the self-deposited inverse floaters held by the Fund (as described in Note 4 – Portfolio Securities and Investments in Derivatives, Inverse Floating Rate Securities), where applicable, as follows: |
| | | | | |
| NMI | | | NEV | |
Year Ended 10/31: | | | Year Ended 10/31: | |
2019 | —% | | 2019 | 0.61% |
2018 | — | | 2018 | 0.40 |
2017 | — | | 2017 | 0.17 |
2016 | 0.03 | | 2016 | 0.07 |
2015 | 0.01 | | 2015 | 0.07 |
| | |
(c) | During the fiscal year ended October 31, 2015, the Adviser voluntarily reimbursed the Fund for certain expenses incurred in connection with its common shares equity shelf program. As a result, the Expenses and Net Investment Income (Loss) Ratios to Average Net Assets Applicable to Common Shares reflect this voluntary expense reimbursement from Adviser. The Expenses and Net Investment Income (Loss) Ratios to Average Net Assets Applicable to Common Shares excluding this expense reimbursement from Adviser are as follows: |
| | | |
| Ratios to Average Net Assets |
| | Net Investment |
| NEV | Expenses | Income (Loss) |
Year Ended 10/31: | | |
2015 | 1.08% | 5.91% |
| | |
(d) | Portfolio Turnover Rate is calculated based on the lesser of long-term purchases or sales (as disclosed in Note 4 – Portfolio Securities and Investments in Derivatives, Investment Transactions) divided by the average long-term market value during the period. |
* | Rounds to less than $0.01 per share. |
See accompanying notes to financial statements.
81
Notes to
Financial Statements
1. General Information
Fund Information
The funds covered in this report and their corresponding New York Stock Exchange (“NYSE”) symbols are as follows (each a “Fund” and collectively, the “Funds”):
| ● | Nuveen Municipal Value Fund, Inc. (NUV) |
| ● | Nuveen AMT-Free Municipal Value Fund (NUW) |
| ● | Nuveen Municipal Income Fund, Inc. (NMI) |
| ● | Nuveen Enhanced Municipal Value Fund (NEV) |
The Funds are registered under the Investment Company Act of 1940 (the “1940 Act”), as amended, as diversified closed-end management investment companies. NUV and NMI were incorporated under the state laws of Minnesota on April 8, 1987 and February 26, 1988, respectively. NUW and NEV were organized as Massachusetts business trusts on November 19, 2008 and July 27, 2009, respectively.
The end of the reporting period for the Funds is October 31, 2019, and the period covered by these Notes to Financial Statements is the fiscal year ended October 31, 2019 (the “current fiscal period”).
Investment Adviser
The Funds’ investment adviser is Nuveen Fund Advisors, LLC (the “Adviser”), a subsidiary of Nuveen, LLC (“Nuveen”). Nuveen is the investment management arm of Teachers Insurance and Annuity Association of America (TIAA). The Adviser has overall responsibility for management of the Funds, oversees the management of the Funds’ portfolios, manages the Funds’ business affairs and provides certain clerical, bookkeeping and other administrative services, and, if necessary, asset allocation decisions. The Adviser has entered into sub-advisory agreements with Nuveen Asset Management, LLC (the “Sub-Adviser”), a subsidiary of the Adviser, under which the Sub-Adviser manages the investment portfolios of the Funds.
2. Significant Accounting Policies
The accompanying financial statements were prepared in accordance with accounting principles generally accepted in the United States of America (“U.S. GAAP”), which may require the use of estimates made by management and the evaluation of subsequent events. Actual results may differ from those estimates. Each Fund is an investment company and follows the accounting guidance in the Financial Accounting Standards Board (“FASB”) Accounting Standards Codification 946, Financial Services—Investment Companies. The net asset value (“NAV”) for financial reporting purposes may differ from the NAV for processing security and common share transactions. The NAV for financial reporting purposes includes security and common share transactions through the date of the report. Total return is computed based on the NAV used for processing security and common share transactions. The following is a summary of the significant accounting policies consistently followed by the Funds.
Compensation
The Funds pay no compensation directly to those of its directors/trustees who are affiliated with the Adviser or to its officers, all of whom receive remuneration for their services to the Funds from the Adviser or its affiliates. The Funds’ Board of Directors/Trustees (“the Board”) has adopted a deferred compensation plan for independent directors/trustees that enables directors/trustees to elect to defer receipt of all or a portion of the annual compensation they are entitled to receive from certain Nuveen-advised funds. Under the plan, deferred amounts are treated as though equal dollar amounts had been invested in shares of select Nuveen-advised funds.
Distributions to Common Shareholders
Distributions to common shareholders are recorded on the ex-dividend date. The amount, character and timing of distributions are determined in accordance with federal income tax regulations, which may differ from U.S. GAAP.
Indemnifications
Under the Funds’ organizational documents, their officers and directors/trustees are indemnified against certain liabilities arising out of the performance of their duties to the Funds. In addition, in the normal course of business, the Funds enter into contracts that provide general indemnifications to other parties. The Funds’ maximum exposure under these arrangements is unknown as this would involve future claims that may be made against the Funds that have not yet occurred. However, the Funds have not had prior claims or losses pursuant to these contracts and expect the risk of loss to be remote.
82
Investments and Investment Income
Securities transactions are accounted for as of the trade date for financial reporting purposes. Realized gains and losses on securities transactions are based upon the specific identification method. Investment income is comprised of interest income, which reflects the amortization of premiums and accretion of discounts for financial reporting purposes, and is recorded on an accrual basis. Interest income also reflects payment-in-kind (“PIK”) interest and paydown gains and losses, if any. PIK interest represents income received in the form of securities in lieu of cash.
Netting Agreements
In the ordinary course of business, the Funds may enter into transactions subject to enforceable International Swaps and Derivatives Association, Inc. (ISDA) master agreements or other similar arrangements (“netting agreements”). Generally, the right to offset in netting agreements allows each Fund to offset certain securities and derivatives with a specific counterparty, when applicable, as well as any collateral received or delivered to that counterparty based on the terms of the agreements. Generally, each Fund manages its cash collateral and securities collateral on a counterparty basis.
The Funds’ investments subject to netting agreements as of the end of the reporting period, if any, are further described in Note 4 – Portfolio Securities and Investments in Derivatives.
New Accounting Pronouncements and Rule Issuances
FASB Accounting Standards Update (“ASU”) 2017-08 (“ASU 2017-08”) Premium Amortization on Purchased Callable Debt Securities
The FASB has issued ASU 2017-08, which shortens the premium amortization period for purchased non-contingently callable debt securities. ASU 2017-08 specifies that the premium amortization period ends at the earliest call date, for purchased non-contingently callable debt securities. ASU 2017-08 effective for fiscal years, and interim periods within those fiscal years, beginning after December 15, 2018. Management is currently evaluating the implications of ASU 2018-18, if any.
Fair Value Measurement: Disclosure Framework
During August 2018, the FASB issued ASU 2018-13 (“ASU 2018-13”), Fair Value Measurement: Disclosure Framework – Changes to the Disclosure Requirements for Fair Value Measurements. ASU 2018-13 modifies the disclosures required by Topic 820, Fair Value Measurements. The amendments in ASU 2018-13 are effective for all entities for fiscal years, and interim periods within those fiscal years, beginning after December 15, 2019. Management has early implemented this guidance and it did not have a material impact on the Funds’ financial statements.
3. Investment Valuation and Fair Value Measurements
The fair valuation input levels as described below are for fair value measurement purposes.
The Funds’ investments in securities are recorded at their estimated fair value. Fair value is defined as the price that would be received upon selling an investment or transferring a liability in an orderly transaction to an independent buyer in the principal or most advantageous market for the investment. A three-tier hierarchy is used to maximize the use of observable market data and minimize the use of unobservable inputs and to establish classification of fair value measurements for disclosure purposes. Observable inputs reflect the assumptions market participants would use in pricing the asset or liability. Observable inputs are based on market data obtained from sources independent of the reporting entity. Unobservable inputs reflect the reporting entity’s own assumptions about the assumptions market participants would use in pricing the asset or liability. Unobservable inputs are based on the best information available in the circumstances. The following is a summary of the three-tiered hierarchy of valuation input levels.
Level 1 – Inputs are unadjusted and prices are determined using quoted prices in active markets for identical securities.
Level 2 – Prices are determined using other significant observable inputs (including quoted prices for similar securities, interest rates, credit spreads, etc.).
Level 3 – Prices are determined using significant unobservable inputs (including management’s assumptions in determining the fair value of investments).
Prices of fixed income securities are provided by an independent pricing service (“pricing service”) approved by the Board. The pricing service establishes a security’s fair value using methods that may include consideration of the following: yields or prices of investments of comparable quality, type of issue, coupon, maturity and rating, market quotes or indications of value from security dealers, evaluations of anticipated cash flows or collateral, general market conditions and other information and analysis, including the obligor’s credit characteristics considered relevant. These securities are generally classified as Level 2. In pricing certain securities, particularly less liquid and lower quality securities, the pricing service may consider information about a security, its issuer or market activity, provided by the Adviser. These securities are generally classified as Level 2 or Level 3 depending on the observability of the significant inputs.
Futures contracts are valued using the closing settlement price or, in the absence of such a price, the last traded price and are generally classified as Level 1.
83
Notes to Financial Statements (continued)
Certain securities may not be able to be priced by the pre-established pricing methods as described above. Such securities may be valued by the Board and/or its appointee at fair value. These securities generally include, but are not limited to, restricted securities (securities which may not be publicly sold without registration under the Securities Act of 1933, as amended) for which a pricing service is unable to provide a market price; securities whose trading has been formally suspended; debt securities that have gone into default and for which there is no current market quotation; a security whose market price is not available from a pre-established pricing source; a security with respect to which an event has occurred that is likely to materially affect the value of the security after the market has closed but before the calculation of a Fund’s NAV (as may be the case in non-U.S. markets on which the security is primarily traded) or make it difficult or impossible to obtain a reliable market quotation; and a security whose price, as provided by the pricing service, is not deemed to reflect the security’s fair value. As a general principle, the fair value of a security would appear to be the amount that the owner might reasonably expect to receive for it in a current sale. A variety of factors may be considered in determining the fair value of such securities, which may include consideration of the following: yields or prices of investments of comparable quality, type of issue, coupon, maturity and rating, market quotes or indications of value from security dealers, evaluations of anticipated cash flows or collateral, general market conditions and other information and analysis, including the obligor’s credit characteristics considered relevant. These securities are generally classified as Level 2 or Level 3 depending on the observability of the significant inputs. Regardless of the method employed to value a particular security, all valuations are subject to review by the Board and/or its appointee.
The inputs or methodologies used for valuing securities are not an indication of the risks associated with investing in those securities. The following is a summary of each Fund’s fair value measurements as of the end of the reporting period:
| | | | | | | | | | | | | |
| NUV | | Level 1 | | | Level 2 | | | Level 3 | | | Total | |
Long-Term Investments*: | | | | | | | | | | | | |
| Municipal Bonds | | $ | — | | | $ | 2,188,112,622 | | | $ | — | | | $ | 2,188,112,622 | |
Short-Term Investments*: | | | | | | | | | | | | | | | | |
| Municipal Bonds | | | — | | | | 7,920,000 | | | | — | | | | 7,920,000 | |
Total | | $ | — | | | $ | 2,196,032,622 | | | $ | — | | | $ | 2,196,032,622 | |
| NUW | | | | | | | | | | | | | | | | |
Long-Term Investments*: | | | | | | | | | | | | | | | | |
| Municipal Bonds | | $ | — | | | $ | 260,289,713 | | | $ | — | | | $ | 260,289,713 | |
Investments in Derivatives: | | | | | | | | | | | | | | | | |
| Futures Contracts*** | | | 267,165 | | | | — | | | | — | | | | 267,165 | |
Total | | $ | 267,165 | | | $ | 260,289,713 | | | $ | — | | | $ | 260,556,878 | |
| NMI | | | | | | | | | | | | | | | | |
Long-Term Investments*: | | | | | | | | | | | | | | | | |
| Municipal Bonds | | $ | — | | | $ | 98,444,032 | | | $ | — | | | $ | 98,444,032 | |
| NEV | | | | | | | | | | | | | | | | |
Long-Term Investments*: | | | | | | | | | | | | | | | | |
| Municipal Bonds | | $ | — | | | $ | 480,715,191 | | | $ | 12,605 | ** | | $ | 480,727,796 | |
| | |
* | Refer to the Fund’s Portfolio of Investments for state classifications. |
** | Refer to the Fund’s Portfolio of Investments for securities classified as Level 3. |
*** | Represents net unrealized appreciation (depreciation) as reported in the Fund’s Portfolio of Investments. |
4. Portfolio Securities and Investments in Derivatives
Portfolio Securities
Inverse Floating Rate Securities
Each Fund is authorized to invest in inverse floating rate securities. An inverse floating rate security is created by depositing a municipal bond (referred to as an “Underlying Bond”), typically with a fixed interest rate, into a special purpose tender option bond (“TOB”) trust (referred to as the “TOB Trust”) created by or at the direction of one or more Funds. In turn, the TOB Trust issues (a) floating rate certificates (referred to as “Floaters”), in face amounts equal to some fraction of the Underlying Bond’s par amount or market value, and (b) an inverse floating rate certificate (referred to as an “Inverse Floater”) that represents all remaining or residual interest in the TOB Trust. Floaters typically pay short-term tax-exempt interest rates to third parties who are also provided a right to tender their certificate and receive its par value, which may be paid from the proceeds of a remarketing of the Floaters, by a loan to the TOB Trust from a third party liquidity provider (“Liquidity Provider”), or by the sale of assets from the TOB Trust. The Inverse Floater is issued to a long term investor, such as one or more of the Funds. The income received by the Inverse Floater holder varies inversely with the short-term rate paid to holders of the Floaters, and in most circumstances the Inverse Floater holder bears substantially all of the Underlying Bond’s downside investment risk and also benefits disproportionately from any potential appreciation of the Underlying Bond’s value. The value of an Inverse Floater will be more volatile than that of the Underlying Bond because the interest rate is dependent on not only the fixed coupon rate of the Underlying Bond but also on the short-term interest paid on the Floaters, and because the Inverse Floater essentially bears the risk of loss (and possible gain) of the greater face value of the Underlying Bond.
84
The Inverse Floater held by a Fund gives the Fund the right to (a) cause the holders of the Floaters to tender their certificates at par (or slightly more than par in certain circumstances), and (b) have the trustee of the TOB Trust (the “Trustee”) transfer the Underlying Bond held by the TOB Trust to the Fund, thereby collapsing the TOB Trust.
The Fund may acquire an Inverse Floater in a transaction where it (a) transfers an Underlying Bond that it owns to a TOB Trust created by a third party or (b) transfers an Underlying Bond that it owns, or that it has purchased in a secondary market transaction for the purpose of creating an Inverse Floater, to a TOB Trust created at its direction, and in return receives the Inverse Floater of the TOB Trust (referred to as a “self-deposited Inverse Floater”). A Fund may also purchase an Inverse Floater in a secondary market transaction from a third party creator of the TOB Trust without first owning the Underlying Bond (referred to as an “externally-deposited Inverse Floater”).
An investment in a self-deposited Inverse Floater is accounted for as a “financing” transaction (i.e., a secured borrowing). For a self-deposited Inverse Floater, the Underlying Bond deposited into the TOB Trust is identified in the Fund’s Portfolio of Investments as “(UB) – Underlying bond of an inverse floating rate trust reflected as a financing transaction,” with the Fund recognizing as liabilities, labeled “Floating rate obligations” on the Statement of Assets and Liabilities, (a) the liquidation value of Floaters issued by the TOB Trust, and (b) the amount of any borrowings by the TOB Trust from a Liquidity Provider to enable the TOB Trust to purchase outstanding Floaters in lieu of a remarketing. In addition, the Fund recognizes in “Investment Income” the entire earnings of the Underlying Bond, and recognizes (a) the interest paid to the holders of the Floaters or on the TOB Trust’s borrowings, and (b) other expenses related to remarketing, administration, trustee, liquidity and other services to a TOB Trust, as a component of “Interest expense and amortization of offering costs” on the Statement of Operations. Earnings due from the Underlying Bond and interest due to the holders of the Floaters as of the end of the reporting period are recognized as components of “Receivable for interest” and “Payable for interest” on the Statement of Assets and Liabilities, respectively.
In contrast, an investment in an externally-deposited Inverse Floater is accounted for as a purchase of the Inverse Floater and is identified in the Fund’s Portfolio of Investments as “(IF) – Inverse floating rate investment.” For an externally-deposited Inverse Floater, a Fund’s Statement of Assets and Liabilities recognizes the Inverse Floater and not the Underlying Bond as an asset, and the Fund does not recognize the Floaters, or any related borrowings from a Liquidity Provider, as a liability. Additionally, the Fund reflects in “Investment Income” only the net amount of earnings on the Inverse Floater (net of the interest paid to the holders of the Floaters or the Liquidity Provider as lender, and the expenses of the Trust), and does not show the amount of that interest paid or the expenses of the TOB Trust as described above as interest expense on the Statement of Operations.
Fees paid upon the creation of a TOB Trust for self-deposited Inverse Floaters and externally-deposited Inverse Floaters are recognized as part of the cost basis of the Inverse Floater and are capitalized over the term of the TOB Trust.
As of the end of the reporting period, the aggregate value of Floaters issued by each Fund’s TOB Trust for self-deposited Inverse Floaters and externally-deposited Inverse Floaters was as follows:
| | | | | | | | | | | | | |
| Floating Rate Obligations Outstanding | | NUV | | | NUW | | | NMI | | | NEV | |
Floating rate obligations: self-deposited Inverse Floaters | | $ | 29,705,000 | | | $ | 2,000,000 | | | $ | — | | | $ | 118,892,000 | |
Floating rate obligations: externally-deposited Inverse Floaters | | | — | | | | 1,500,000 | | | | — | | | | 86,730,000 | |
Total | | $ | 29,705,000 | | | $ | 3,500,000 | | | $ | — | | | $ | 205,622,000 | |
During the current fiscal period, the average amount of Floaters (including any borrowings from a Liquidity Provider) outstanding, and average annual interest rate and fees related to self-deposited Inverse Floaters, were as follows:
| | | | | | | | | | | | | |
| Self-Deposited Inverse Floaters | | NUV | | | NUW | | | NMI | | | NEV | |
Average floating rate obligations outstanding | | $ | 37,103,260 | | | $ | 8,544,863 | | | $ | — | | | $ | 103,378,529 | |
Average annual interest rate and fees | | | 2.02 | % | | | 2.05 | % | | | — | % | | | 2.17 | % |
TOB Trusts are supported by a liquidity facility provided by a Liquidity Provider pursuant to which the Liquidity Provider agrees, in the event that Floaters are (a) tendered to the Trustee for remarketing and the remarketing does not occur, or (b) subject to mandatory tender pursuant to the terms of the TOB Trust agreement, to either purchase Floaters or to provide the Trustee with an advance from a loan facility to fund the purchase of Floaters by the TOB Trust. In certain circumstances, the Liquidity Provider may otherwise elect to have the Trustee sell the Underlying Bond to retire the Floaters that were tendered and not remarketed prior to providing such a loan. In these circumstances, the Liquidity Provider remains obligated to provide a loan to the extent that the proceeds of the sale of the Underlying Bond is not sufficient to pay the purchase price of the Floaters.
The size of the commitment under the loan facility for a given TOB Trust is at least equal to the balance of that TOB Trust’s outstanding Floaters plus any accrued interest. In consideration of the loan facility, fee schedules are in place and are charged by the Liquidity Provider(s). Any loans made by the Liquidity Provider will be secured by the purchased Floaters held by the TOB Trust. Interest paid on any outstanding loan balances will be effectively borne by the Fund that owns the Inverse Floaters of the TOB Trust that has incurred the borrowing and may be at a rate that is greater than the rate that would have been paid had the Floaters been successfully remarketed.
85
Notes to Financial Statements (continued)
As described above, any amounts outstanding under a liquidity facility are recognized as a component of “Floating rate obligations” on the Statement of Assets and Liabilities by the Fund holding the corresponding Inverse Floaters issued by the borrowing TOB Trust. As of the end of the reporting period, there were no loans outstanding under any such facility.
Each Fund may also enter into shortfall and forbearance agreements (sometimes referred to as a “recourse arrangement”) (TOB Trusts involving such agreements are referred to herein as “Recourse Trusts”), under which a Fund agrees to reimburse the Liquidity Provider for the Trust’s Floaters, in certain circumstances, for the amount (if any) by which the liquidation value of the Underlying Bond held by the TOB Trust may fall short of the sum of the liquidation value of the Floaters issued by the TOB Trust plus any amounts borrowed by the TOB Trust from the Liquidity Provider, plus any shortfalls in interest cash flows. Under these agreements, a Fund’s potential exposure to losses related to or on an Inverse Floater may increase beyond the value of the Inverse Floater as a Fund may potentially be liable to fulfill all amounts owed to holders of the Floaters or the Liquidity Provider. Any such shortfall amount in the aggregate is recognized as “Unrealized depreciation on Recourse Trusts” on the Statement of Assets and Liabilities.
As of the end of the reporting period, each Fund’s maximum exposure to the Floaters issued by Recourse Trusts for self-deposited Inverse Floaters and externally-deposited Inverse Floaters was as follows:
| | | | | | | | | | | | | |
| Floating Rate Obligations – Recourse Trusts | | NUV | | | NUW | | | NMI | | | NEV | |
Maximum exposure to Recourse Trusts: self-deposited Inverse Floaters | | $ | 29,705,000 | | | $ | 2,000,000 | | | $ | — | | | $ | 110,892,000 | |
Maximum exposure to Recourse Trusts: externally-deposited Inverse Floaters | | | — | | | | 1,500,000 | | | | — | | | | 84,220,000 | |
Total | | $ | 29,705,000 | | | $ | 3,500,000 | | | $ | — | | | $ | 195,112,000 | |
Zero Coupon Securities
A zero coupon security does not pay a regular interest coupon to its holders during the life of the security. Income to the holder of the security comes from accretion of the difference between the original purchase price of the security at issuance and the par value of the security at maturity and is effectively paid at maturity. The market prices of zero coupon securities generally are more volatile than the market prices of securities that pay interest periodically.
Investment Transactions
Long-term purchases and sales (including maturities but excluding derivative transactions, where applicable) during the current fiscal period were as follows:
| | | | | | | | | | | | | |
| | NUV | | | NUW | | | NMI | | | NEV | |
Purchases | | $ | 267,859,867 | | | $ | 79,395,140 | | | $ | 9,938,868 | | | $ | 64,261,863 | |
Sales and maturities | | | 311,627,120 | | | | 89,089,907 | | | | 9,966,667 | | | | 52,926,212 | |
Investments purchased on a when-issued/delayed delivery basis may have extended settlement periods. Any investments so purchased are subject to market fluctuation during this period. The Funds have earmarked securities in their portfolios with a current value at least equal to the amount of the when-issued/delayed delivery purchase commitments.
As of the end of the reporting period, the following Fund’s outstanding when-issued/delayed delivery purchase commitments were as follows:
| | | | |
| | NUV | |
Outstanding when-issued/delayed delivery purchase commitments | | $ | 4,515,160 | |
Investments in Derivatives
In addition to the inverse floating rate securities in which each Fund may invest, which are considered portfolio securities for financial reporting purposes, each Fund is authorized to invest in certain other derivative instruments, such as futures, options and swap contracts. Each Fund limits its investments in futures, options on futures and swap contracts to the extent necessary for the Adviser to claim the exclusion from registration by the Commodity Futures Trading Commission as a commodity pool operator with respect to the Fund. The Funds record derivative instruments at fair value, with changes in fair value recognized on the Statement of Operations, when applicable. Even though the Funds’ investments in derivatives may represent economic hedges, they are not considered to be hedge transactions for financial reporting purposes.
Futures Contracts
Upon execution of a futures contract, a Fund is obligated to deposit cash or eligible securities, also known as “initial margin,” into an account at its clearing broker equal to a specified percentage of the contract amount. Cash held by the broker to cover initial margin requirements on open futures contracts, if any, is recognized as “Cash collateral at brokers for investments in futures contracts” on the Statement of Assets and Liabilities. Investments in futures contracts obligate a Fund and the clearing broker to settle monies on a daily basis representing changes in the prior days “mark-to-market”
86
of the open contracts. If a Fund has unrealized appreciation the clearing broker would credit the Fund’s account with an amount equal to appreciation and conversely if a Fund has unrealized depreciation the clearing broker would debit the Fund’s account with an amount equal to depreciation. These daily cash settlements are also known as “variation margin.” Variation margin is recognized as a receivable and/or payable for “Variation margin on futures contracts” on the Statement of Assets and Liabilities.
During the period the futures contract is open, changes in the value of the contract are recognized as an unrealized gain or loss by “marking-to-market” on a daily basis to reflect the changes in market value of the contract, which is recognized as a component of “Change in net unrealized appreciation (depreciation) of futures contracts” on the Statement of Operations. When the contract is closed or expired, a Fund records a realized gain or loss equal to the difference between the value of the contract on the closing date and value of the contract when originally entered into, which is recognized as a component of “Net realized gain (loss) from futures contracts” on the Statement of Operations.
Risks of investments in futures contracts include the possible adverse movement in the price of the securities or indices underlying the contracts, the possibility that there may not be a liquid secondary market for the contracts and/or that a change in the value of the contract may not correlate with a change in the value of the underlying securities or indices.
During the current reporting period, NUW managed the duration of their respective portfolios by shorting interest rate futures contracts.
The average notional amount of futures contracts outstanding during the current fiscal period was as follows:
| | | | |
| | NUW | |
Average notional amount of futures contracts outstanding* | | $ | (14,777,787 | ) |
| |
| * The average notional amount is calculated based on the absolute aggregate notional amount of contracts outstanding at the beginning of the current fiscal period and at the end of each fiscal quarter within the current fiscal period. |
The following table presents the fair value of all futures contracts held by the Fund as of the end of the reporting period, the location of these instruments on the Statement of Assets and Liabilities and the primary underlying risk exposure.
| | | | | | | |
| | Location on the Statement of Assets and Liabilities |
|
| Underlying | Derivative | Asset Derivatives | | (Liability) Derivatives |
| Risk Exposure | Instrument | Location | |
| Location | Value |
| NUW | | | | | | |
Interest rate | Futures contracts | — | |
| Payable for variation margin | $267,165 |
| | | | | on futures contracts* | |
| |
| * Value represents unrealized appreciation (depreciation) of futures contracts as reported in the Fund’s Portfolio of Investments and not the asset and/or liability derivative location as described in the table above. |
The following table presents the amount of net realized gain (loss) and change in net unrealized appreciation (depreciation) recognized on futures contracts on the Statement of Operations during the current fiscal period, and the primary underlying risk exposure.
| | | | | |
| | | Net Realized | Change in Net Unrealized |
| Underlying Risk | Derivative | Gain (Loss) from | Appreciation (Depreciation) of |
| Fund | Exposure | Instrument | Futures Contracts | Futures Contracts |
| NUW | Interest rate | Futures contracts | $(1,126,291) | $267,165 |
Market and Counterparty Credit Risk
In the normal course of business each Fund may invest in financial instruments and enter into financial transactions where risk of potential loss exists due to changes in the market (market risk) or failure of the other party to the transaction to perform (counterparty credit risk). The potential loss could exceed the value of the financial assets recorded on the financial statements. Financial assets, which potentially expose each Fund to counterparty credit risk, consist principally of cash due from counterparties on forward, option and swap transactions, when applicable. The extent of each Fund’s exposure to counterparty credit risk in respect to these financial assets approximates their carrying value as recorded on the Statement of Assets and Liabilities.
Each Fund helps manage counterparty credit risk by entering into agreements only with counterparties the Adviser believes have the financial resources to honor their obligations and by having the Adviser monitor the financial stability of the counterparties. Additionally, counterparties may be required to pledge collateral daily (based on the daily valuation of the financial asset) on behalf of each Fund with a value approximately equal to the amount of any unrealized gain above a pre-determined threshold. Reciprocally, when each Fund has an unrealized loss, the Funds have instructed the custodian to pledge assets of the Funds as collateral with a value approximately equal to the amount of the unrealized loss above a pre-determined threshold. Collateral pledges are monitored and subsequently adjusted if and when the valuations fluctuate, either up or down, by at least the pre-determined threshold amount.
87
Notes to Financial Statements (continued)
5. Fund Shares
Common Share Equity Shelf Programs and Offering Costs
The following Funds have each filed registration statements with the Securities and Exchange Commission (“SEC”) authorizing each Fund to issue additional common shares through one or more equity shelf program (“Shelf Offering”), which became effective with the SEC during a prior fiscal period.
Under these Shelf Offerings, the Funds, subject to market conditions, may raise additional equity capital by issuing additional common shares from time to time in varying amounts and by different offering methods at a net price at or above each Fund’s NAV common per share. In the event each Fund’s Shelf Offering registration statement is no longer current, the Funds may not issue additional common shares until a post-effective amendment to the registration statement has been filed with the SEC.
Additional authorized common shares, common shares sold and offering proceeds, net of offering costs under each Fund’s Shelf Offering during the Funds’ current and prior fiscal period were as follows:
| | | | | | | | | | | | | |
| | NUW | | | NMI | |
| | Year | | | Year | | | Year | | | Year | |
| | Ended | | | Ended | | | Ended | | | Ended | |
| | 10/31/19 | | | 10/31/18 | | | 10/31/19 | | | 10/31/18 | |
Additional authorized common shares | | | 1,500,000 | | | | 1,400,000 | | | | 800,000 | | | | 800,000 | |
Common shares sold | | | 109,938 | | | | 299,412 | | | | 72,629 | | | | 187,400 | |
Offering proceeds, net of offering costs | | $ | 1,920,037 | | | $ | 5,126,753 | | | $ | 828,032 | | | $ | 2,135,825 | |
Costs incurred by the Funds in connection with their initial shelf registrations are recorded as a prepaid expense and recognized as “Deferred offering costs” on the Statement of Assets and Liabilities. These costs are amortized pro rata as common shares are sold and are recognized as a component of “Proceeds from shelf offering, net of offering costs” on the Statement of Changes in Net Assets. Any deferred offering costs remaining one year after effectiveness of the initial shelf registration will be expensed. Costs incurred by the Funds to keep the shelf registration current are expensed as incurred and recognized as a component of “Other expenses” on the Statement of Operations.
Common Share Transactions
Transactions in common shares during the Funds’ current and prior fiscal period, where applicable, were as follows:
| | | | | | | | | | | | | |
| | NUW | | | NMI | |
| | Year | | | Year | | | Year | | | Year | |
| | Ended | | | Ended | | | Ended | | | Ended | |
| | 10/31/19 | | | 10/31/18 | | | 10/31/19 | | | 10/31/18 | |
Common shares: | | | | | | | | | | | | |
| Issued to shareholders due to reinvestment of distributions | | | 7,010 | | | | 19,194 | | | | 6,120 | | | | 10,654 | |
| Sold through shelf offering | | | 109,938 | | | | 299,412 | | | | 72,629 | | | | 187,400 | |
Weighted average common share: | | | | | | | | | | | | | | | | |
| Premium to NAV per shelf offering common share sold | | | 5.25 | % | | | 2.92 | % | | | 1.40 | % | | | 4.54 | % |
6. Income Tax Information
Each Fund is a separate taxpayer for federal income tax purposes. Each Fund intends to distribute substantially all of its net investment income and net capital gains to shareholders and to otherwise comply with the requirements of Subchapter M of the Internal Revenue Code applicable to regulated investment companies. Therefore, no federal income tax provision is required. Furthermore, each Fund intends to satisfy conditions that will enable interest from municipal securities, which is exempt from regular federal income tax, and in the case of AMT-Free Municipal Value (NUW) the alternative minimum tax applicable to individuals, to retain such tax-exempt status when distributed to shareholders of the Funds. Net realized capital gains and ordinary income distributions paid by the Funds are subject to federal taxation.
For all open tax years and all major taxing jurisdictions, management of the Funds has concluded that there are no significant uncertain tax positions that would require recognition in the financial statements. Open tax years are those that are open for examination by taxing authorities (i.e., generally the last four tax year ends and the interim tax period since then). Furthermore, management of the Funds is also not aware of any tax positions for which it is reasonably possible that the total amounts of unrecognized tax benefits will significantly change in the next twelve months.
88
The following information is presented on an income tax basis. Differences between amounts for financial statement and federal income tax purposes are primarily due to timing differences in recognizing taxable market discount, timing differences in recognizing certain gains and losses on investment transactions and the treatment of investments in inverse floating rate securities reflected as financing transactions, if any. To the extent that differences arise that are permanent in nature, such amounts are reclassified within the capital accounts as detailed below. Temporary differences do not require reclassification. Temporary and permanent differences do not impact the NAVs of the Funds.
The table below presents the cost and unrealized appreciation (depreciation) of each Fund’s investment portfolio, as determined on a federal income tax basis, as of October 31, 2019.
For purposes of this disclosure, derivative tax cost is generally the sum of any upfront fees or premiums exchanged and any amounts unrealized for income statement reporting but realized in income and/or capital gains for tax reporting. If a particular derivative category does not disclose any tax unrealized appreciation or depreciation, the change in value of those derivatives have generally been fully realized for tax purposes.
| | | | | | | | | | | | | |
| | NUV | | | NUW | | | NMI | | | NEV | |
Tax cost of investments | | $ | 1,918,483,699 | | | $ | 225,677,096 | | | $ | 90,127,687 | | | $ | 324,891,312 | |
Gross unrealized: | | | | | | | | | | | | | | | | |
| Appreciation | | $ | 257,196,368 | | | $ | 33,213,516 | | | $ | 8,399,976 | | | $ | 41,172,236 | |
| Depreciation | | | (9,352,374 | ) | | | (333,734 | ) | | | (83,631 | ) | | | (4,226,493 | ) |
Net unrealized appreciation (depreciation) of investments | | $ | 247,843,994 | | | $ | 32,879,782 | | | $ | 8,316,345 | | | $ | 36,945,743 | |
Permanent differences, primarily due to taxable market discount, expiration of capital loss carryforwards and distribution reallocations resulted in reclassifications among the Funds’ components of net assets as of October 31, 2019, the Funds’ tax year end.
The tax components of undistributed net tax-exempt income, net ordinary income and net long-term capital gains as of October 31, 2019, the Funds’ tax year end, were as follows:
| | | | | | | | | | | | | |
| | NUV | | | NUW | | | NMI | | | NEV | |
Undistributed net tax-exempt income1 | | $ | 8,041,006 | | | $ | — | | | $ | 228,467 | | | $ | 2,195,771 | |
Undistributed net ordinary income2 | | | 2,536,534 | | | | — | | | | — | | | | — | |
Undistributed net long-term capital gains | | | — | | | | — | | | | 315,472 | | | | — | |
| |
1 Undistributed net tax-exempt income (on a tax basis) has not been reduced for the dividend declared on October 1, 2019 and paid on November 1, 2019. |
2 Net ordinary income consists of taxable market discount income and net short-term capital gains, if any. |
The tax character of distributions paid during the Funds’ tax years ended October 31, 2019 and October 31, 2018 was designated for purposes of the dividends paid deduction as follows:
| | | | | | | | | | | | | |
| 2019 | | NUV | | | NUW | | | NMI | | | NEV | |
Distributions from net tax-exempt income3 | | $ | 75,629,909 | | | $ | 9,785,093 | | | $ | 3,665,241 | | | $ | 16,589,036 | |
Distributions from net ordinary income2 | | | 1,327,761 | | | | 346,584 | | | | 111,090 | | | | 327,110 | |
Distributions from net long-term capital gains4 | | | — | | | | 1,576,014 | | | | 628,561 | | | | — | |
| 2018 | | NUV | | | NUW | | | NMI | | | NEV | |
Distributions from net tax-exempt income | | $ | 77,578,299 | | | $ | 10,780,837 | | | $ | 3,970,866 | | | $ | 19,174,127 | |
Distributions from net ordinary income2 | | | 3,310,007 | | | | 288,792 | | | | 22,215 | | | | 284,431 | |
Distributions from net long-term capital gains | | | — | | | | 2,745,797 | | | | — | | | | — | |
| |
2 Net ordinary income consists of taxable market discount income and net short-term capital gains, if any. |
3 The Funds hereby designate these amounts paid during the fiscal year ended October 31, 2019, as Exempt Interest Dividends. |
4 The Funds hereby designate as long-term capital gain dividend, pursuant to the Internal Revenue Code Section 852(b)(3), the amount necessary to reduce earnings and profits of the Funds related to net capital gain to zero for the tax year ended October 31, 2019. |
89
Notes to Financial Statements (continued)
As of October 31, 2019, the Funds’ tax year end, the following Funds had unused capital losses carrying forward available for federal income tax purposes to be applied against future capital gains, if any. The capital losses are not subject to expiration.
| | | | | | | | | | |
| | NUV | | | NUW | | | NEV | |
Not subject to expiration: | | | | | | | | | |
| Short-term | | $ | 10,969,504 | | | $ | 26,821 | | | $ | 4,354,156 | |
| Long-term | | | 12,568,429 | | | | — | | | | 784,747 | |
Total | | $ | 23,537,933 | | | $ | 26,821 | | | $ | 5,138,903 | |
As of October 31, 2019, the Funds’ tax year end, $16,146,849 of NEV’s capital loss carryforward expired.
During the Funds’ tax year ended October 31, 2019, the following Funds utilized capital loss carryforwards as follows:
| | | | | | | |
| | NUV | | | NEV | |
Utilized capital loss carryforwards | | $ | 1,619,489 | | | $ | 1,426,087 | |
7. Management Fees and Other Transactions with Affiliates
Management Fees
Each Fund’s management fee compensates the Adviser for the overall investment advisory and administrative services and general office facilities. The Sub-Adviser is compensated for its services to the Funds from the management fees paid to the Adviser.
Each Fund’s management fee consists of two components – a fund-level fee, based only on the amount of assets within each individual Fund, and a complex-level fee, based on the aggregate amount of all eligible fund assets managed by the Adviser and for NUV a gross interest income component. This pricing structure enables Fund shareholders to benefit from growth in the assets within their respective Fund as well as from growth in the amount of complex-wide assets managed by the Adviser.
The annual fund-level fee, payable monthly, for NUV is calculated according to the following schedule:
| | | | |
| | NUV | |
| Average Daily Net Assets | | Fund-Level Fee Rate | |
For the first $500 million | | | 0.1500 | % |
For the next $500 million | | | 0.1250 | |
For net assets over $1 billion | | | 0.1000 | |
In addition, NUV pays an annual management fee, payable monthly, based on gross interest income (excluding interest on bonds underlying a “self-deposited inverse floater” trust that is attributed to the Fund over and above the net interest earned on the inverse floater itself) as follows:
| | | | |
| | NUV | |
| Gross Interest Income | | Gross Income Fee Rate | |
For the first $50 million | | | 4.125 | % |
For the next $50 million | | | 4.000 | |
For gross income over $100 million | | | 3.875 | |
The annual fund-level fee, payable monthly, for NUW, NMI and NEV is calculated according to the following schedules:
| | | | |
| | NUW | |
| Average Daily Managed Assets* | | Fund-Level Fee Rate | |
For the first $125 million | | | 0.4000 | % |
For the next $125 million | | | 0.3875 | |
For the next $250 million | | | 0.3750 | |
For the next $500 million | | | 0.3625 | |
For the next $1 billion | | | 0.3500 | |
For the next $3 billion | | | 0.3250 | |
For managed assets over $5 billion | | | 0.3125 | |
90
| | | | |
| | NMI | |
| Average Daily Net Assets | | Fund-Level Fee Rate | |
For the first $125 million | | | 0.4500 | % |
For the next $125 million | | | 0.4375 | |
For the next $250 million | | | 0.4250 | |
For the next $500 million | | | 0.4125 | |
For the next $1 billion | | | 0.4000 | |
For the next $3 billion | | | 0.3750 | |
For net assets over $5 billion | | | 0.3625 | |
| | |
| | NEV | |
| Average Daily Managed Assets* | | Fund-Level Fee Rate | |
For the first $125 million | | | 0.4500 | % |
For the next $125 million | | | 0.4375 | |
For the next $250 million | | | 0.4250 | |
For the next $500 million | | | 0.4125 | |
For the next $1 billion | | | 0.4000 | |
For the next $3 billion | | | 0.3750 | |
For managed assets over $5 billion | | | 0.3625 | |
The annual complex-level fee, payable monthly, for each Fund is calculated by multiplying the current complex-wide fee rate, determined according to the following schedule by the Fund’s daily managed assets (net assets for NUV and NMI):
| | | | |
| Complex-Level Eligible Asset Breakpoint Level* | | Effective Complex-Level Fee Rate at Breakpoint Level | |
$55 billion | | | 0.2000 | % |
$56 billion | | | 0.1996 | |
$57 billion | | | 0.1989 | |
$60 billion | | | 0.1961 | |
$63 billion | | | 0.1931 | |
$66 billion | | | 0.1900 | |
$71 billion | | | 0.1851 | |
$76 billion | | | 0.1806 | |
$80 billion | | | 0.1773 | |
$91 billion | | | 0.1691 | |
$125 billion | | | 0.1599 | |
$200 billion | | | 0.1505 | |
$250 billion | | | 0.1469 | |
$300 billion | | | 0.1445 | |
| |
| * For the complex-level fees, managed assets include closed-end fund assets managed by the Adviser that are attributable to certain types of leverage. For these purposes, leverage includes the funds’ use of preferred stock and borrowings and certain investments in the residual interest certificates (also called inverse floating rate securities) in tender option bond (TOB) trusts, including the portion of assets held by a TOB trust that has been effectively financed by the trust’s issuance of floating rate securities, subject to an agreement by the Adviser as to certain funds to limit the amount of such assets for determining managed assets in certain circumstances. The complex-level fee is calculated based upon the aggregate daily managed assets of all Nuveen open-end and closed-end funds that constitute “eligible assets.” Eligible assets do not include assets attributable to investments in other Nuveen funds or assets in excess of a determined amount (originally $2 billion) added to the Nuveen fund complex in connection with the Adviser’s assumption of the management of the former First American Funds effective January 1, 2011, but do not include certain assets of certain Nuveen funds that were reorganized into funds advised by an affiliate of the Adviser during the 2019 calendar year. As of October 31, 2019, the complex- level fee rate for each Fund was 0.1566%. |
Other Transactions with Affiliates
Each Fund is permitted to purchase or sell securities from or to certain other funds managed by the Adviser (“inter-fund trade”) under specified conditions outlined in procedures adopted by the Board. These procedures have been designed to ensure that any inter-fund trade of securities by the Fund from or to another fund that is, or could be, considered an affiliate of the Fund under certain limited circumstances by virtue of having a common investment adviser (or affiliated investment adviser), common officer and/or common trustee complies with Rule 17a-7 of the 1940 Act. Further, as defined under these procedures, each inter-fund trade is effected at the current market price as provided by an independent pricing service. Unsettled inter-fund trades as of the end of the reporting period are recognized as a component of “Receivable for investments sold” and/or “Payable for investments purchased” on the Statement of Assets and Liabilities, when applicable.
During the current fiscal period, the Funds did not engage in inter-fund trades pursuant to these procedures.
91
Notes to Financial Statements (continued)
8. Borrowing Arrangements
Committed Line of Credit
The Funds, along with certain other funds managed by the Adviser (“Participating Funds”), have established a 364-day, $2.65 billion standby credit facility with a group of lenders, under which the Participating Funds may borrow for various purposes other than leveraging for investment purposes. Each Participating Fund is allocated a designated proportion of the facility’s capacity (and its associated costs, as described below) based upon a multi-factor assessment of the likelihood and frequency of its need to draw on the facility, the size of the Fund and its anticipated draws, and the potential importance of such draws to the operations and well-being of the Fund, relative to those of the other Funds. A Fund may effect draws on the facility in excess of its designated capacity if and to the extent that other Participating Funds have undrawn capacity. The credit facility expires in June 2020 unless extended or renewed.
The credit facility has the following terms: a fee of 0.15% per annum on unused commitment amounts, and interest at a rate equal to the higher of (a) one-month LIBOR (London Inter-Bank Offered Rate) plus 1.00% per annum or (b) the Fed Funds rate plus 1.00% per annum on amounts borrowed. Participating Funds paid administration, legal and arrangement fees, which are recognized as a component of “Other expenses” on the Statement of Operations, and along with commitment fees, have been allocated among such Participating Funds based upon the relative proportions of the facility’s aggregate capacity reserved for them and other factors deemed relevant by the Adviser and the Board of each Participating Fund.
During the current fiscal period, the following Funds utilized this facility. Each Fund’s maximum outstanding balance during the utilization period was as follows:
| | | | | | | | | | |
| | NUV | | | NUW | | | NMI | |
Maximum outstanding balance | | $ | 18,500,000 | | | $ | 3,782,495 | | | $ | 684,069 | |
During each Fund’s utilization period(s), during the current fiscal period, the average daily balance outstanding and average annual interest rate on the Borrowings were as follows:
| | | | | | | | | | |
| | NUV | | | NUW | | | NMI | |
Utilization period (days outstanding) | | | 64 | | | | 2 | | | | 2 | |
Average daily balance outstanding | | $ | 8,709,562 | | | $ | 3,782,495 | | | $ | 684,069 | |
Average annual interest rate | | | 3.33 | % | | | 3.50 | % | | | 3.50 | % |
Borrowings outstanding as of the end of the reporting period, if any, are recognized as “Borrowings” on the Statement of Assets and Liabilities, where applicable.
Inter-Fund Borrowing and Lending
The SEC has granted an exemptive order permitting registered open-end and closed-end Nuveen funds to participate in an inter-fund lending facility whereby the Nuveen funds may directly lend to and borrow money from each other for temporary purposes (e.g., to satisfy redemption requests or when a sale of securities “fails,” resulting in an unanticipated cash shortfall) (the “Inter-Fund Program”). The closed-end Nuveen funds, including the Funds covered by this shareholder report, will participate only as lenders, and not as borrowers, in the Inter-Fund Program because such closed-end funds rarely, if ever, need to borrow cash to meet redemptions. The Inter-Fund Program is subject to a number of conditions, including, among other things, the requirements that (1) no fund may borrow or lend money through the Inter-Fund Program unless it receives a more favorable interest rate than is typically available from a bank or other financial institution for a comparable transaction; (2) no fund may borrow on an unsecured basis through the Inter-Fund Program unless the fund’s outstanding borrowings from all sources immediately after the inter-fund borrowing total 10% or less of its total assets; provided that if the borrowing fund has a secured borrowing outstanding from any other lender, including but not limited to another fund, the inter-fund loan must be secured on at least an equal priority basis with at least an equivalent percentage of collateral to loan value; (3) if a fund’s total outstanding borrowings immediately after an inter-fund borrowing would be greater than 10% of its total assets, the fund may borrow through the inter-fund loan on a secured basis only; (4) no fund may lend money if the loan would cause its aggregate outstanding loans through the Inter-Fund Program to exceed 15% of its net assets at the time of the loan; (5) a fund’s inter-fund loans to any one fund shall not exceed 5% of the lending fund’s net assets; (6) the duration of inter-fund loans will be limited to the time required to receive payment for securities sold, but in no event more than seven days; and (7) each inter-fund loan may be called on one business day’s notice by a lending fund and may be repaid on any day by a borrowing fund. In addition, a Nuveen fund may participate in the Inter-Fund Program only if and to the extent that such participation is consistent with the fund’s investment objective and investment policies. The Board is responsible for overseeing the Inter-Fund Program.
The limitations detailed above and the other conditions of the SEC exemptive order permitting the Inter-Fund Program are designed to minimize the risks associated with Inter-Fund Program for both the lending fund and the borrowing fund. However, no borrowing or lending activity is without risk. When a fund borrows money from another fund, there is a risk that the loan could be called on one day’s notice or not renewed, in which case the fund may have to borrow from a bank at a higher rate or take other actions to payoff such loan if an inter-fund loan is not available from another fund. Any delay in repayment to a lending fund could result in a lost investment opportunity or additional borrowing costs.
During the current reporting period, none of the Funds covered by this shareholder report have entered into any inter-fund loan activity.
92
Additional Fund Information (Unaudited)
| | | | | | |
| Board of Directors/Trustees | | | | |
Margo Cook* | Jack B. Evans | William C. Hunter | Albin F. Moschner | John K. Nelson | |
Judith M. Stockdale | Carole E. Stone | Terence J. Toth | Margaret L. Wolff | Robert C. Young | |
|
* Interested Board Member.
|
|
|
| Fund Manager | Custodian | Legal Counsel | Independent Registered | Transfer Agent and |
Nuveen Fund Advisors, LLC | State Street Bank | Chapman and Cutler LLP | Public Accounting Firm | Shareholder Services |
333 West Wacker Drive | & Trust Company | Chicago, IL 60603 | KPMG LLP | | Computershare Trust |
Chicago, IL 60606 | One Lincoln Street | | 200 East Randolph Street | Company, N.A. |
| Boston, MA 02111 | | Chicago, IL 60601 | | 250 Royall Street |
| | | | | Canton, MA 02021 |
| | | | | (800) 257-8787 |
Portfolio of Investments Information
Each Fund is required to file its complete schedule of portfolio holdings with the Securities and Exchange Commission (SEC) for the first and third quarters of each fiscal year as an exhibit to its report on Form N-PORT. You may obtain this information on the SEC’s website at http://www.sec.gov.
Nuveen Funds’ Proxy Voting InformationYou may obtain (i) information regarding how each fund voted proxies relating to portfolio securities held during the most recent twelve-month period ended June 30, without charge, upon request, by calling Nuveen toll-free at (800) 257-8787 or on Nuveen’s website at www.nuveen.com and (ii) a description of the policies and procedures that each fund used to determine how to vote proxies relating to portfolio securities without charge, upon request, by calling Nuveen toll free at (800) 257-8787. You may also obtain this information directly from the SEC. Visit the SEC on-line at http://www.sec.gov.
CEO Certification DisclosureEach Fund’s Chief Executive Officer (CEO) has submitted to the New York Stock Exchange (NYSE) the annual CEO certification as required by Section 303A.12(a) of the NYSE Listed Company Manual. Each Fund has filed with the SEC the certification of its CEO and Chief Financial Officer required by Section 302 of the Sarbanes-Oxley Act.
Common Share RepurchasesEach Fund intends to repurchase, through its open-market share repurchase program, shares of its own common stock at such times and in such amounts as is deemed advisable. During the period covered by this report, each Fund repurchased shares of its common stock as shown in the accompanying table. Any future repurchases will be reported to shareholders in the next annual or semi-annual report.
| | | | | |
| NUV | NUW | NMI | NEV |
Common shares repurchased | — | — | — | — |
FINRA BrokerCheck
The Financial Industry Regulatory Authority (FINRA) provides information regarding the disciplinary history of FINRA member firms and associated investment professionals. This information as well as an investor brochure describing FINRA BrokerCheck is available to the public by calling the FINRA BrokerCheck Hotline number at (800) 289-9999 or by visiting www.FINRA.org.
93
Glossary of Terms Used in this Report (Unaudited)
| ■ | Average Annual Total Return: This is a commonly used method to express an investment’s performance over a particular, usually multi-year time period. It expresses the return that would have been necessary each year to equal the investment’s actual cumulative performance (including change in NAV or market price and reinvested dividends and capital gains distributions, if any) over the time period being considered. |
| | |
| ■ | Duration: Duration is a measure of the expected period over which a bond’s principal and interest will be paid, and consequently is a measure of the sensitivity of a bond’s or bond fund’s value to changes when market interest rates change. Generally, the longer a bond’s or fund’s duration, the more the price of the bond or fund will change as interest rates change. |
| | |
| ■ | Effective Leverage: Effective leverage is a fund’s effective economic leverage, and includes both regulatory leverage (see leverage) and the leverage effects of certain derivative investments in the fund’s portfolio. Currently, the leverage effects of Tender Option Bond (TOB) inverse floater holdings are included in effective leverage values, in addition to any regulatory leverage. |
| | |
| ■ | Gross Domestic Product (GDP): The total market value of all final goods and services produced in a country/region in a given year, equal to total consumer, investment and government spending, plus the value of exports, minus the value of imports. |
| | |
| ■ | Industrial Development Revenue Bond (IDR): A unique type of revenue bond issued by a state or local government agency on behalf of a private sector company and intended to build or acquire factories or other heavy equipment and tools. |
| | |
| ■ | Inverse Floating Rate Securities: Inverse floating rate securities, also known as inverse floaters or tender option bonds (TOBs), are created by depositing a municipal bond, typically with a fixed interest rate, into a special purpose trust. This trust, in turn, (a) issues floating rate certificates typically paying short-term tax-exempt interest rates to third parties in amounts equal to some fraction of the deposited bond’s par amount or market value, and (b) issues an inverse floating rate certificate (sometimes referred to as an “inverse floater”) to an investor (such as a fund) interested in gaining investment exposure to a long-term municipal bond. The income received by the holder of the inverse floater varies inversely with the short-term rate paid to the floating rate certificates’ holders, and in most circumstances the holder of the inverse floater bears substantially all of the underlying bond’s downside investment risk. The holder of the inverse floater typically also benefits disproportionately from any potential appreciation of the underlying bond’s value. Hence, an inverse floater essentially represents an investment in the underlying bond on a leveraged basis. |
| | |
| ■ | Leverage: Leverage is created whenever a fund has investment exposure (both reward and/or risk) equivalent to more than 100% of the investment capital. |
| | |
| ■ | Net Asset Value (NAV) Per Share: A fund’s Net Assets is equal to its total assets (securities, cash, accrued earnings and receivables) less its total liabilities. NAV per share is equal to the fund’s Net Assets divided by its number of shares outstanding. |
| | |
| ■ | Pre-Refunding: Pre-Refunding, also known as advanced refundings or refinancings, is a procedure used by state and local governments to refinance municipal bonds to lower interest expenses. The issuer sells new bonds with a lower yield and uses the proceeds to buy U.S. Treasury securities, the interest from which is used to make payments on the higher-yielding bonds. Because of this collateral, pre-refunding generally raises a bond’s credit rating and thus its value. |
94
| ■ | S&P Municipal Bond Index: An unleveraged, market value-weighted index designed to measure the performance of the tax- exempt, investment-grade U.S. municipal bond market. Index returns assume reinvestment of distributions, but do not reflect any applicable sales charges or management fees. |
| ■ | Total Investment Exposure: Total investment exposure is a fund’s assets managed by the Adviser that are attributable to financial leverage. For these purposes, financial leverage includes a fund’s use of preferred stock and borrowings and investments in the residual interest certificates (also called inverse floating rate securities) in tender option bond (TOB) trusts, including the portion of assets held by a TOB trust that has been effectively financed by the trust’s issuance of floating rate securities. |
| ■ | Zero Coupon Bond: A zero coupon bond does not pay a regular interest coupon to its holders during the life of the bond. Income to the holder of the bond comes from accretion of the difference between the original purchase price of the bond at issuance and the par value of the bond at maturity and is effectively paid at maturity. The market prices of zero coupon bonds generally are more volatile than the market prices of bonds that pay interest periodically. |
95
Reinvest Automatically, Easily and Conveniently
Nuveen makes reinvesting easy. A phone call is all it takes to set up your reinvestment account.
Nuveen Closed-End Funds Automatic Reinvestment PlanNuveen Closed-End Fund allows you to conveniently reinvest distributions in additional Fund shares. By choosing to reinvest, you’ll be able to invest money regularly and automatically, and watch your investment grow through the power of compounding. Just like distributions in cash, there may be times when income or capital gains taxes may be payable on distributions that are reinvested. It is important to note that an automatic reinvestment plan does not ensure a profit, nor does it protect you against loss in a declining market.
Easy and convenient
To make recordkeeping easy and convenient, each month you’ll receive a statement showing your total distributions, the date of investment, the shares acquired and the price per share, and the total number of shares you own.
How shares are purchased
The shares you acquire by reinvesting will either be purchased on the open market or newly issued by the Fund. If the shares are trading at or above net asset value at the time of valuation, the Fund will issue new shares at the greater of the net asset value or 95% of the then-current market price. If the shares are trading at less than net asset value, shares for your account will be purchased on the open market. If the Plan Agent begins purchasing Fund shares on the open market while shares are trading below net asset value, but the Fund’s shares subsequently trade at or above their net asset value before the Plan Agent is able to complete its purchases, the Plan Agent may cease open-market purchases and may invest the uninvested portion of the distribution in newly-issued Fund shares at a price equal to the greater of the shares’ net asset value or 95% of the shares’ market value on the last business day immediately prior to the purchase date. Distributions received to purchase shares in the open market will normally be invested shortly after the distribution payment date. No interest will be paid on distributions awaiting reinvestment. Because the market price of the shares may increase before purchases are completed, the average purchase price per share may exceed the market price at the time of valuation, resulting in the acquisition of fewer shares than if the distribution had been paid in shares issued by the Fund. A pro rata portion of any applicable brokerage commissions on open market purchases will be paid by Plan participants. These commissions usually will be lower than those charged on individual transactions.
Flexible
You may change your distribution option or withdraw from the Plan at any time, should your needs or situation change. You can reinvest whether your shares are registered in your name, or in the name of a brokerage firm, bank, or other nominee. Ask your investment advisor if his or her firm will participate on your behalf. Participants whose shares are registered in the name of one firm may not be able to transfer the shares to another firm and continue to participate in the Plan. The Fund reserves the right to amend or terminate the Plan at any time. Although the Fund reserves the right to amend the Plan to include a service charge payable by the participants, there is no direct service charge to participants in the Plan at this time.
Call today to start reinvesting distributions
For more information on the Nuveen Automatic Reinvestment Plan or to enroll in or withdraw from the Plan, speak with your financial advisor or call us at (800) 257-8787.
96
Annual Investment Management Agreement Approval Process (Unaudited)
At a meeting held on May 21-23, 2019 (the “May Meeting”), the Board of Trustees or Directors, as applicable (each, a “Board” and each Trustee or Director, a “Board Member”) of each Fund, including the Board Members who are not “interested persons” (as defined under the Investment Company Act of 1940 (the “1940 Act”)) (the “Independent Board Members”), approved, for its respective Fund, the renewal of the management agreement (each, an “Investment Management Agreement”) with Nuveen Fund Advisors, LLC (the “Adviser”) pursuant to which the Adviser serves as investment adviser to such Fund and the sub-advisory agreement (each, a “Sub-Advisory Agreement”) with Nuveen Asset Management, LLC (the “Sub-Adviser”) pursuant to which the Sub-Adviser serves as the sub-adviser to such Fund. Following an initial two-year period, the Board, including the Independent Board Members, is required under the 1940 Act to review and approve each Investment Management Agreement and Sub-Advisory Agreement on behalf of the applicable Fund on an annual basis. The Investment Management Agreements and Sub-Advisory Agreements are collectively referred to as the “Advisory Agreements” and the Adviser and the Sub-Adviser are collectively, the “Fund Advisers” and each, a “Fund Adviser.”
In response to a request on behalf of the Independent Board Members by independent legal counsel, the Board received and reviewed prior to the May Meeting extensive materials specifically prepared for the annual review of Advisory Agreements by the Adviser as well as by Broadridge Financial Solutions, Inc. (“Broadridge”), an independent provider of investment company data. The materials provided in connection with the annual review covered a breadth of subject matter including, but not limited to, a description of the nature, extent and quality of services provided by the Fund Advisers; a review of the Sub-Adviser and investment team; an analysis of fund performance in absolute terms and as compared to the performance of certain peer funds and benchmarks with a focus on any performance outliers; an analysis of the fees and expense ratios of the Nuveen funds in absolute terms and as compared to those of certain peer funds with a focus on any expense outliers; a description of portfolio manager compensation; a review of the secondary market trading of shares of the Nuveen closed-end funds (including, among other things, an analysis of performance, distribution and valuation and capital raising trends in the broader closed-end fund market and in particular with respect to Nuveen closed-end funds; a review of the leverage management actions taken on behalf of the Nuveen closed-end funds and their resulting impact on performance; and a description of the distribution management process and any capital management activities); a review of the performance of various service providers; a description of various initiatives Nuveen had undertaken or continued during the year for the benefit of particular fund(s) and/or the complex; a description of the profitability or financial data of Nuveen and the Sub-Adviser; and a description of indirect benefits received by the Fund Advisers as a result of their relationships with the Nuveen funds. The Board Members held an in-person meeting on April 17-18, 2019 (the “April Meeting”), in part, to review and discuss the performance of the Nuveen funds and the Adviser’s evaluation of the various sub-advisers to the Nuveen funds. The Independent Board Members asked questions and requested additional information that was provided for the May Meeting.
The information prepared specifically for the annual review of the Advisory Agreements supplemented the information provided to the Board and its committees throughout the year. The Board and its committees met regularly during the year and the information provided and topics discussed were relevant to the review of the Advisory Agreements. Some of these reports and other data included, among other things, materials that outlined the investment performance of the Nuveen funds; strategic plans of the Adviser which may impact the services it provides to the Nuveen funds; the review of the Nuveen funds and applicable investment teams; the management of leverage financing for closed-end funds; the secondary market trading of the closed-end funds and any actions to address discounts; compliance, regulatory and risk management matters; the trading practices of the various sub-advisers; valuation of securities; fund expenses; and overall market and regulatory developments. The Board further continued its practice of seeking to meet periodically with the various sub-advisers to the Nuveen funds and their investment teams, when feasible. The Independent Board Members considered the review of the Advisory Agreements to be an ongoing process and employed
97
Annual Investment Management Agreement Approval Process (Unaudited) (continued)
the accumulated information, knowledge, and experience the Board Members had gained during their tenure on the boards governing the Nuveen funds and working with the Fund Advisers in their review of the Advisory Agreements. The contractual arrangements are a result of multiple years of review, negotiation and information provided in connection with the boards’ annual review of the Nuveen funds’ advisory arrangements and oversight of the Nuveen funds.
The Independent Board Members were advised by independent legal counsel during the annual review process as well as throughout the year, including meeting in executive sessions with such counsel at which no representatives from the Adviser or the Sub-Adviser were present. In connection with their annual review, the Independent Board Members also received a memorandum from independent legal counsel outlining their fiduciary duties and legal standards in reviewing the Advisory Agreements.
In deciding to renew the Advisory Agreements, the Independent Board Members did not identify a particular factor or information as determinative or controlling, but rather the decision reflected the comprehensive consideration of all the information provided, and each Board Member may have attributed different levels of importance to the various factors and information considered in connection with the approval process. The following summarizes the principal factors and information, but not all the factors, the Board considered in deciding to renew the Advisory Agreements and its conclusions.
A. Nature, Extent and Quality of Services
In evaluating the renewal of the Advisory Agreements, the Independent Board Members received and considered information regarding the nature, extent and quality of the applicable Fund Adviser’s services provided to the respective Fund with particular focus on the services and enhancements to such services provided during the last year. The Board recognized that the Adviser provides a comprehensive set of services necessary to operate the Nuveen funds in a highly regulated industry and noted that the scope of such services has expanded over the years as a result of regulatory, market and other developments, such as the development of the liquidity management program and expanded compliance programs. Some of the functions the Adviser is responsible for include, but are not limited to: product management (such as analyzing a fund’s position in the marketplace, setting dividends, preparing shareholder and intermediary communications and other due diligence support); investment oversight (such as analyzing fund performance, sub-advisers and investment teams and analyzing trade executions of portfolio transactions, soft dollar practices and securities lending activities); securities valuation services (such as executing the daily valuation process for portfolio securities and developing and recommending changes to valuation policies and procedures); risk management (such as overseeing operational and investment risks, including stress testing); fund administration (such as preparing fund tax returns and other tax compliance services, overseeing the Nuveen funds’ independent public accountants and other service providers; managing fund budgets and expenses; and helping to fulfill the funds’ regulatory filing requirements); oversight of shareholder services and transfer agency functions (such as oversight and liaison of transfer agent service providers which include registered shareholder customer service and transaction processing); Board relations services (such as organizing and administering Board and committee meetings, preparing various reports to the Board and committees and providing other support services); compliance and regulatory oversight services (such as developing and maintaining a compliance program to ensure compliance with applicable laws and regulations, monitoring compliance with applicable fund policies and procedures and adherence to investment restrictions, and evaluating the compliance programs of the Nuveen fund sub-advisers and certain other service providers); legal support and oversight of outside law firms (such as with respect to filing and updating registration statements; maintaining various regulatory registrations; and providing legal interpretations regarding fund activities, applicable regulations and implementation of policies and procedures); and leverage, capital and distribution management services. In reviewing the scope and quality of services, the Board recognized the continued efforts and resources the Adviser and its affiliates have employed to continue to enhance their services for the benefit of the complex as well as particular Nuveen funds over recent years. Such service enhancements have included, but are not limited to:
| ● | Fund Improvements and Product Management Initiatives – continuing to proactively manage the Nuveen fund complex as a whole and at the individual fund level with an aim to enhance the shareholder outcomes through, among other things, |
98
| repositioning funds, merging funds, reviewing and updating investment policies and benchmarks, modifying the composition of certain portfolio management teams and analyzing various data to help devise such improvements; |
| ● | Capital Initiatives – continuing to invest capital to support new funds with initial capital as well as to facilitate modifications to the strategies or structure of existing funds; |
| ● | Compliance Program Initiatives – continuing efforts to enhance the compliance program through, among other things, internally integrating various portfolio management teams and aligning compliance support accordingly, completing a comprehensive review of existing policies and procedures and revising such policies and procedures as appropriate, enhancing compliance-related technologies and workflows, and optimizing compliance shared services across the organization and affiliates; |
| ● | Risk Management and Valuation Services - continuing efforts to strengthen the risk management functions, including through, among other things, enhancing the interaction and reporting between the investment risk management team and various affiliates, increasing the efficiency of risk monitoring performed on the Nuveen funds through improved reporting, continuing to implement risk programs designed to provide a more disciplined and consistent approach to identifying and mitigating operational risks, continuing progress on implementing a liquidity program that complies with the new liquidity regulatory requirements and continuing to oversee the daily valuation process; |
| ● | Additional Compliance Services – continuing investment of time and resources necessary to develop the compliance policies and procedures and other related tools necessary to meet the various new regulatory requirements affecting the Nuveen funds that have been adopted over recent years; |
| ● | Government Relations – continuing efforts of various Nuveen teams and affiliates to advocate and communicate their positions with lawmakers and other regulatory bodies on issues that will impact the Nuveen funds; |
| ● | Business Continuity, Disaster Recovery and Information Services – establishing an information security program to help identify and manage information security risks, periodically testing disaster recovery plans, maintaining and updating business continuity plans and providing reports to the Board, at least annually, addressing, among other things, management’s security risk assessment, cyber risk profile, incident tracking and other relevant information technology risk-related reports; |
| ● | Expanded Dividend Management Services – continuing to expand the services necessary to manage the dividends among the varying types of Nuveen funds that have developed as the Nuveen complex has grown in size and scope; and |
| ● | with respect specifically to closed-end funds, such initiatives also included: |
| ●● | Leverage Management Services – continuing to actively manage leverage including developing new leverage instruments, refinancing existing leverage and negotiating reductions in associated leverage expenses; |
| ●● | Capital Management Services – ongoing capital management efforts through a share repurchase program as well as a shelf offering program that raises additional equity capital in seeking to enhance shareholder value; |
| ●● | Data and Market Analytics – continuing focus on analyzing data and market analytics to better understand the ownership cycles and secondary market experience of closed-end funds; and |
| ●● | Closed-end Fund Investor Relations Program – maintaining the closed-end fund investor relations program which, among other things, raises awareness, provides educational materials and cultivates advocacy for closed-end funds and the Nuveen closed-end fund product line. |
In addition to the services provided by the Adviser, the Board also considered the risks borne by the Adviser and its affiliates in managing the Nuveen funds, including entrepreneurial, operational, reputational, regulatory and litigation risks.
99
Annual Investment Management Agreement Approval Process (Unaudited) (continued)
The Board further considered the division of responsibilities between the Adviser and the Sub-Adviser and recognized that the Sub-Adviser and its investment personnel generally are responsible for the management of each Fund’s portfolio. The Board noted that the Adviser oversees the Sub-Adviser and considered an analysis of the Sub-Adviser provided by the Adviser which included, among other things, the Sub-Adviser’s assets under management and changes thereto, a summary of the investment team and changes thereto, the investment approach of the team and the performance of the funds sub-advised by the Sub-Adviser over various periods. The Board further considered at the May Meeting or prior meetings evaluations of the Sub-Adviser’s compliance program and trade execution. The Board noted that the Adviser recommended the renewal of the Sub-Advisory Agreements.
Based on its review, the Board determined, in the exercise of its reasonable business judgment, that it was satisfied with the nature, extent and quality of services provided to the respective Funds under each applicable Advisory Agreement.
B. The Investment Performance of the Funds and Fund Advisers
In evaluating the quality of the services provided by the Fund Advisers, the Board also received and considered the investment performance of the Nuveen funds they advise. In this regard, the Board reviewed Fund performance over the quarter, one-, three- and five-year periods ending December 31, 2018 as well as performance data for the first quarter of 2019 ending March 29, 2019. Unless otherwise indicated, the performance data referenced below reflects the periods ended December 31, 2018. The Board considered the Adviser’s analysis of each fund’s performance, with particular focus on funds that were considered performance outliers and the factors contributing to their performance. The Board also noted that it received performance data of the Nuveen funds during its quarterly meetings throughout the year and took into account the discussions that occurred at these Board meetings regarding fund performance. In this regard, in its evaluation of Nuveen fund performance at meetings throughout the year, the Board considered performance information for the funds for different time periods, both absolute and relative to appropriate benchmarks and peers, with particular attention to information indicating underperformance of the respective funds and discussed with the Adviser the reasons for such underperformance.
The Board reviewed both absolute and relative fund performance during the annual review. With respect to the latter, the Board considered fund performance in comparison to the performance of peer funds (the “Performance Peer Group”) and recognized and/or customized benchmarks (i.e., generally benchmarks derived from multiple recognized benchmarks). In considering performance data, the Board is aware of certain inherent limitations with such data, including that differences between the objective(s), strategies and other characteristics of the Nuveen funds compared to the respective Performance Peer Group and/or benchmark(s) (such as differences in the use of leverage) will necessarily contribute to differences in performance results and limit the value of the comparative information. To assist the Board in its review of the comparability of the relative performance, the Adviser has ranked the relevancy of the peer group to the funds as low, medium or high. Depending on the facts and circumstances, however, the Board may be satisfied with a fund’s performance notwithstanding that its performance may be below its benchmark or peer group for certain periods. In addition, the performance data may vary significantly depending on the end date selected, and shareholders may evaluate fund performance based on their own holding period which may differ from the performance periods reviewed by the Board leading to different results. Further, the Board considered a fund’s performance in light of the overall financial market conditions during the respective periods. As noted above, the Board reviewed, among other things, Nuveen fund performance over various periods ended December 31, 2018, and the Board was aware of the market decline in the fourth quarter of 2018 and considered performance from the first quarter of 2019 as well. The Board also noted that a shorter period of underperformance may significantly impact longer term performance.
In addition to the foregoing, the Board recognized the importance of secondary market trading to shareholders and considered the evaluation of premiums and discounts at which the shares of the Nuveen closed-end funds trade to be a continuing priority for the Board. The Board and/or its Closed-end Fund committee consider premium and discount data at each quarterly meeting throughout the year as well as during the annual review.
100
In their review of performance, the Independent Board Members focused, in particular, on the Adviser’s analysis of Nuveen funds determined to be underperforming performance outliers. The Board recognized that some periods of underperformance may only be temporary while other periods of underperformance may indicate a broader issue that may require a corrective action. Accordingly, with respect to any Nuveen funds for which the Board had identified performance issues, the Board monitors such funds closely until performance improves, discusses with the Adviser the reasons for such results, considers whether any steps are necessary or appropriate to address such issues, and reviews the results of any efforts undertaken.
The Board’s determinations with respect to each Fund are summarized below.
For Nuveen Municipal Value Fund, Inc. (the “Municipal Value Fund”), the Board noted that although the Fund ranked in the fourth quartile of its Performance Peer Group for the five-year period, the Fund ranked in the first quartile for the one-year period and second quartile for the three-year period. In its review, the Board, however, noted that the Performance Peer Group was classified as low for relevancy. In addition, although the Fund’s performance was below the performance of its benchmark for the one-year period, the Fund outperformed its benchmark for the three- and five-year periods. The Board was satisfied with the Fund’s overall performance.
For Nuveen AMT-Free Municipal Value Fund (the “AMT-Free Municipal Value Fund”), the Board noted that although the Fund ranked in the fourth quartile of its Performance Peer Group and the Fund’s performance was below the performance of its benchmark for the one-year period, the Fund ranked in the third quartile of its Performance Peer Group and outperformed its benchmark for the three- and five-year periods. In its review, the Board, however, noted that the Performance Peer Group was classified as low for relevancy. The Board was satisfied with the Fund’s overall performance.
For Nuveen Municipal Income Fund, Inc. (the “Municipal Income Fund”), the Board noted that the Fund ranked in the third quartile of its Performance Peer Group for the one-year period and second quartile for the three- and five-year periods. In its review, the Board, however, noted that the Performance Peer Group was classified as low for relevancy. In addition, although the Fund’s performance was below the performance of its benchmark for the one-year period, the Fund outperformed its benchmark for the three- and five-year periods. The Board was satisfied with the Fund’s overall performance.
For Nuveen Enhanced Municipal Value Fund (the “Enhanced Municipal Value Fund”), the Board noted that the Fund ranked in the first quartile of its Performance Peer Group for the one-year period and second quartile for the three- and five-year periods. Although the Fund’s performance was below the performance of its benchmark for the one-year period, the Fund outperformed its benchmark for the three- and five-year periods. The Board was satisfied with the Fund’s overall performance.
C. Fees, Expenses and Profitability
1. Fees and Expenses
In its annual review, the Board considered the fees paid to the Fund Advisers and the total operating expense ratio of each Nuveen fund. More specifically, the Independent Board Members reviewed, among other things, each fund’s gross and net management fee rates and net total expense ratio in relation to those of a comparable universe of funds (the “Peer Universe”) established by Broadridge. The Independent Board Members reviewed the methodology Broadridge employed to establish its Peer Universe and recognized that differences between the applicable fund and its respective Peer Universe as well as changes to the composition of the Peer Universe from year to year may limit some of the value of the comparative data. The Independent Board Members also considered a fund’s operating expense ratio as it more directly reflected the shareholder’s costs in investing in the respective fund.
In their review, the Independent Board Members considered, in particular, each fund with a net expense ratio (excluding investment-related costs of leverage) of six basis points or higher compared to that of its peer average (each, an “Expense Outlier Fund”) and an analysis as to the factors contributing to each such fund’s higher relative net expense ratio. In addition, although the Board reviewed a fund’s total net expenses both including and excluding investment-related expenses (i.e., leverage costs)
101
Annual Investment Management Agreement Approval Process (Unaudited) (continued)
and taxes for certain of the closed-end funds, the Board recognized that leverage expenses will vary across the Nuveen funds and in comparison to peers because of differences in the forms and terms of leverage employed by the respective fund. Accordingly, in reviewing the comparative data between a fund and its peers, the Board generally considered the fund’s net expense ratio and fees (excluding leverage costs and leveraged assets) to be higher if they were over 10 basis points higher, slightly higher if they were 6 to 10 basis points higher, in line if they were within approximately 5 basis points higher than the peer average and below if they were below the peer average of the Peer Universe. The Independent Board Members also considered, in relevant part, a fund’s net management fee and net total expense ratio in light of its performance history.
In their review of the fee arrangements for the Nuveen funds, the Independent Board Members considered the management fee schedules, including the complex-wide and fund-level breakpoint schedules, as applicable. The Board noted that across the Nuveen fund complex, the complex-wide fee breakpoints reduced fees by $51.5 million and fund-level breakpoints reduced fees by $55.1 million in 2018.
With respect to the Sub-Adviser, the Board considered the sub-advisory fee paid to the Sub-Adviser, including any breakpoint schedule, and as described below, comparative data of the fees the Sub-Adviser charges to other clients, if any.
The Independent Board Members noted that: (a) the Municipal Value Fund, AMT-Free Municipal Value Fund and Municipal Income Fund each had a net management fee and a net expense ratio that were below its respective peer averages; and (b) the Enhanced Municipal Value Fund had a net management fee that was slightly higher than its peer average, but a net expense ratio that was in line with its peer average. Based on its review of the information provided, the Board determined that each Fund’s management fees (as applicable) to a Fund Adviser were reasonable in light of the nature, extent and quality of services provided to the Fund.
2. Comparisons with the Fees of Other Clients
In determining the appropriateness of fees, the Board also reviewed information regarding the fee rates the respective Fund Advisers charged to certain other types of clients and the type of services provided to these other clients. With respect to the Adviser and/or the Sub-Adviser, such other clients may include retail and institutional managed accounts, passively managed exchange-traded funds sub-advised by the Sub-Adviser but that are offered by another fund complex and municipal managed accounts offered by an unaffiliated adviser. With respect to the Sub-Adviser, the Board reviewed, among other things, the fee range and average fee of municipal retail wrap accounts and municipal institutional accounts.
In addition to the comparative fee data, the Board also reviewed, among other things, a description of the different levels of services provided to certain other clients compared to the services provided to the Nuveen funds as well as the differences in portfolio investment policies, investor profiles, account sizes and regulatory requirements, all of which contribute to the variations in the fee schedules. The Board noted, among other things, the wide range of services in addition to investment management services provided to the Nuveen funds when the Adviser is principally responsible for all aspects of operating the funds, including the increased regulatory requirements that must be met in managing the funds, the larger account sizes of managed accounts and the increased entrepreneurial, legal and regulatory risks that the Adviser incurs in sponsoring and managing the funds. In general, higher fee levels reflect higher levels of service provided by the Adviser, increased investment management complexity, greater product management requirements, and higher levels of business risk or some combination of these factors. The Board further considered that the Sub-Adviser’s fee is essentially for portfolio management services and therefore more comparable to the fees it receives for retail wrap accounts and other external sub-advisory mandates. The Board concluded the varying levels of fees were justified given, among other things, the inherent differences in the products and the level of services provided to the Nuveen funds versus other clients, the differing regulatory requirements and legal liabilities and the entrepreneurial, legal and regulatory risks incurred in sponsoring and advising a registered investment company.
102
3. Profitability of Fund Advisers
In conjunction with their review of fees, the Independent Board Members considered information regarding Nuveen’s level of profitability for its advisory services to the Nuveen funds for the calendar years 2018 and 2017. The Board reviewed, among other things, Nuveen’s net margins (pre-tax) (both including and excluding distribution expenses); gross and net revenue margins (pre- and post-tax); revenues, expenses, and net income (pre-tax and after-tax and before distribution) of Nuveen for fund advisory services; and comparative profitability data comparing the adjusted margins of Nuveen compared to the adjusted margins of certain peers with publicly available data and with the most comparable assets under management (based on asset size and asset composition) for each of the last two calendar years. The Board also reviewed the revenues and expenses the Adviser derived from its exchange-traded fund product line that was launched in 2016. The Independent Board Members noted that Nuveen’s net margins were higher in 2018 than the previous year and considered the key drivers behind the revenue and expense changes that impacted Nuveen’s net margins between the years. The Board considered the costs of investments in the Nuveen business, including the investment of seed capital in certain Nuveen funds and additional investments in infrastructure and technology. The Independent Board Members also noted that Nuveen’s adjusted margins from its relationships with the Nuveen funds were on the low range compared to the adjusted margins of the peers; however, the Independent Board Members recognized the inherent limitations of the comparative data of other publicly traded peers given that the calculation of profitability is rather subjective and numerous factors (such as types of funds, business mix, cost of capital, methodology to allocate expenses and other factors) can have a significant impact on the results.
The Independent Board Members also reviewed a description of the expense allocation methodology employed to develop the financial information and a summary of the history of changes to the methodology over the ten-year period from 2008 to 2018, and recognized that other reasonable allocation methodologies could be employed and lead to significantly different results. The Board noted that two Independent Board Members, along with independent counsel, serve as the Board’s liaisons to review profitability and discuss any proposed changes to the methodology prior to the full Board’s review.
Aside from Nuveen’s profitability, the Board recognized that the Adviser is a subsidiary of Nuveen, LLC, the investment management arm of Teachers Insurance and Annuity Association of America (“TIAA”). As such, the Board also reviewed a balance sheet for TIAA reflecting its assets, liabilities and capital and contingency reserves for the 2018 and 2017 calendar years to consider the financial strength of TIAA having recognized the importance of having an adviser with significant resources.
In addition to Nuveen, the Independent Board Members also considered the profitability of the Sub-Adviser from its relationships with the Nuveen funds. In this regard, the Independent Board Members reviewed the Sub-Adviser’s revenues, expenses and revenue margins (pre- and post-tax) for its advisory activities for the calendar year ended December 31, 2018. The Independent Board Members also reviewed a profitability analysis reflecting the revenues, expenses and revenue margin (pre-and post-tax) by asset type for the Sub-Adviser for the calendar year ending December 31, 2018 and the pre- and post-tax revenue margin from 2018 and 2017.
In evaluating the reasonableness of the compensation, the Independent Board Members also considered any other ancillary benefits derived by the respective Fund Adviser from its relationship with the Nuveen funds as discussed in further detail below.
Based on a consideration of all the information provided, the Board noted that Nuveen’s and the Sub-Adviser’s level of profitability was acceptable and not unreasonable in light of the services provided.
D. Economies of Scale and Whether Fee Levels Reflect These Economies of Scale
With respect to economies of scale, the Independent Board Members noted that although economies of scale are difficult to measure, the Adviser shares the benefits of economies of scale in various ways including breakpoints in the management fee schedule (subject to limited exceptions), fee waivers and/or expense limitations, the pricing of Nuveen funds at scale at inception and investments in its business which can enhance the services provided to the funds for the fees paid. With respect to
103
Annual Investment Management Agreement Approval Process (Unaudited) (continued)
breakpoint schedules, because the Board had previously recognized that economies of scale may occur not only when the assets of a particular Nuveen fund grow but also when the assets in the complex grow, the Nuveen funds generally pay the Adviser a management fee comprised of a fund-level component and a complex-level component each with its own breakpoint schedule, subject to certain exceptions. In general terms, the breakpoint schedule at the fund level reduces fees as assets in the particular fund pass certain thresholds and the breakpoint schedule at the complex level reduces fees on the Nuveen funds as the eligible assets in the complex pass certain thresholds. The Independent Board Members reviewed, among other things, the fund-level and complex-level fee schedules. In addition, with respect to the Nuveen closed-end funds, the Independent Board Members noted that, although such funds may from time-to-time make additional share offerings, the growth of their assets would occur primarily through the appreciation of such funds’ investment portfolios.
In addition, the Independent Board Members recognized the Adviser’s continued reinvestment in its business through, among other things, investments in its business infrastructure and information technology, portfolio accounting system as well as other systems and platforms that will, among other things, support growth, simplify and enhance information sharing, and enhance the investment process to the benefit of all of the Nuveen funds.
Based on its review, the Board concluded that the current fee arrangements together with the Adviser’s reinvestment in its business appropriately shared any economies of scale with shareholders.
E. Indirect Benefits
The Independent Board Members received and considered information regarding other benefits the respective Fund Adviser or its affiliates may receive as a result of their relationship with the Nuveen funds. The Board considered that an affiliate of the Adviser serves as co-manager in the initial public offerings of new closed-end funds for which it may receive revenue and serves as an underwriter on shelf offerings of existing closed-end funds for which it receives compensation. In addition, the Independent Board Members also noted that the Sub-Adviser engages in soft dollar transactions pursuant to which it may receive the benefit of research products and other services provided by broker-dealers executing portfolio transactions on behalf of the applicable Nuveen funds.
The Board, however, noted that the benefits for the Sub-Adviser when transacting in fixed-income securities may be more limited as such securities generally trade on a principal basis and therefore do not generate brokerage commissions. Further, the Board noted that although the Sub-Adviser may benefit from the receipt of research and other services that it may otherwise have to pay for out of its own resources, the research may also benefit the Nuveen funds to the extent it enhances the ability of the Sub-Adviser to manage such funds or is acquired through the commissions paid on portfolio transactions of other clients.
Based on their review, the Board concluded that any indirect benefits received by a Fund Adviser as a result of its relationship with the Funds were reasonable and within acceptable parameters.
F. Other Considerations
The Board Members did not identify any single factor discussed previously as all-important or controlling. The Board Members, including the Independent Board Members, concluded that the terms of each Advisory Agreement were fair and reasonable, that the respective Fund Adviser’s fees were reasonable in light of the services provided to each Fund and that the Advisory Agreements be renewed.
104
Board Members & Officers (Unaudited)
The management of the Funds, including general supervision of the duties performed for the Funds by the Adviser, is the responsibility of the Board of Trustees of the Funds. The number of trustees of the Funds is set at ten. None of the trustees who are not “interested” persons of the Funds (referred to herein as “independent board members”) has ever been a director or employee of, or consultant to, Nuveen or its affiliates. The names and business addresses of the trustees and officers of the Funds, their principal occupations and other affiliations during the past five years, the number of portfolios each Trustee oversees and other directorships they hold are set forth below.
| | | | | |
| Name, | Position(s) Held | Year First | Principal | Number |
| Year of Birth | with the Funds | Elected or | Occupation(s) | of Portfolios |
| & Address | | Appointed | Including other | in Fund Complex |
| | and Term(1) | Directorships | Overseen by |
| | | During Past 5 Years | Board Member |
|
|
Independent Board Members:
|
|
|
■ TERENCE J. TOTH | | | Formerly, a Co-Founding Partner, Promus Capital (2008-2017); Director, | |
| 1959 | | | Quality Control Corporation (since 2012); member: Catalyst Schools of | |
| 333 W. Wacker Drive | Chairman and | 2008 | Chicago Board (since 2008) and Mather Foundation Board (since 2012), | 159 |
| Chicago, IL 6o6o6 | Board Member | Class II | and chair of its Investment Committee; formerly, Director, Fulcrum IT | |
| | | Services LLC (2010-2019); formerly, Director, Legal & General Investment | |
| | | Management America, Inc. (2008-2013); formerly, CEO and President, | |
| | | Northern Trust Global Investments (2004-2007): Executive Vice | |
| | | President, Quantitative Management & Securities Lending (2000-2004); | |
| | | prior thereto, various positions with Northern Trust Company (since 1994); | |
| | | formerly, Member, Northern Trust Mutual Funds Board (2005-2007), | |
| | | Northern Trust Global Investments Board (2004-2007), Northern Trust | |
| | | Japan Board (2004-2007), Northern Trust Securities Inc. Board | |
| | | (2003-2007) and Northern Trust Hong Kong Board (1997-2004). | |
|
■ JACK B. EVANS | | | Chairman (since 2019), formerly, President (1996-2019), The Hall-Perrine | |
| 1948 | | | Foundation, a private philanthropic corporation; Director and Chairman, | |
| 333 W. Wacker Drive | Board Member | 1999 | United Fire Group, a publicly held company; Director, Public Member, | 159 |
| Chicago, IL 6o6o6 | | Class III | American Board of Orthopaedic Surgery (since 2015); Life Trustee of Coe | |
| | | College and the Iowa College Foundation; formerly, President Pro-Tem of | |
| | | the Board of Regents for the State of Iowa University System; formerly, | |
| | | Director, Alliant Energy and The Gazette Company; formerly, Director, | |
| | | Federal Reserve Bank of Chicago; formerly, President and Chief Operating | |
| | | Officer, SCI Financial Group, Inc., a regional financial services firm. | |
|
■ WILLIAM C. HUNTER | | | Dean Emeritus, formerly, Dean, Tippie College of Business, University of | |
| 1948 | | | Iowa (2006-2012); Director of Wellmark, Inc. (since 2009); past Director | |
| 333 W. Wacker Drive | Board Member | 2003 | (2005-2015), and past President (2010-2014) Beta Gamma Sigma, Inc., | 159 |
| Chicago, IL 6o6o6 | | Class I | The International Business Honor Society; formerly, Director (2004-2018) | |
| | | of Xerox Corporation; Dean and Distinguished Professor of Finance, School | |
| | | of Business at the University of Connecticut (2003-2006); previously, Senior | |
| | | Vice President and Director of Research at the Federal Reserve Bank of | |
| | | Chicago (1995-2003); formerly, Director (1997-2007), Credit Research | |
| | | Center at Georgetown University. | |
|
■ ALBIN F. MOSCHNER | | | Founder and Chief Executive Officer, Northcroft Partners, LLC, a | |
| 1952 | | | management consulting firm (since 2012); formerly, Chairman (2019), | |
| 333 W. Wacker Drive | Board Member | 2016 | and Director (2012-2019), USA Technologies, Inc., a provider of solutions | 159 |
| Chicago, IL 6o6o6 | | Class III | and services to facilitate electronic payment transactions; formerly, | |
| | | Director, Wintrust Financial Corporation (1996-2016); previously, | |
| | | held positions at Leap Wireless International, Inc., including Consultant | |
| | | (2011-2012), Chief Operating Officer (2008-2011), and Chief Marketing | |
| | | Officer (2004-2008); formerly, President, Verizon Card Services division of | |
| | | Verizon Communications, Inc. (2000-2003); formerly, President, One Point | |
| | | Services at One Point Communications (1999-2000); formerly, Vice | |
| | | Chairman of the Board, Diba, Incorporated (1996-1997); formerly, various | |
| | | executive positions (1991-1996) and Chief Executive Officer (1995-1996) of | |
| | | Zenith Electronics Corporation. | |
105
Board Members & Officers (Unaudited) (continued)
| | | | | |
| Name, | Position(s) Held | Year First | Principal | Number |
| Year of Birth | with the Funds | Elected or | Occupation(s) | of Portfolios |
| & Address | | Appointed | Including other | in Fund Complex |
| | and Term(1) | Directorships | Overseen by |
| | | During Past 5 Years | Board Member |
|
Independent Board Members (continued):
|
|
■ JOHN K. NELSON | | | Member of Board of Directors of Core12 LLC (since 2008), a private firm | |
| 1962 | | | which develops branding, marketing and communications strategies for | |
| 333 W. Wacker Drive | Board Member | 2013 | clients; served on The President’s Council, Fordham University (2010- | 159 |
| Chicago, IL 6o6o6 | | Class II | 2018); and previously was a Director of The Curran Center for Catholic | |
| | | American Studies (2009-2018); formerly, senior external advisor to the | |
| | | financial services practice of Deloitte Consulting LLP (2012-2014): | |
| | | formerly, Chairman of the Board of Trustees of Marian University (2010 | |
| | | as trustee, 2011-2014 as Chairman); formerly, Chief Executive Officer of | |
| | | ABN AMRO N.V. North America, and Global Head of its Financial | |
| | | Markets Division (2007-2008); prior senior positions held at ABN AMRO | |
| | | include Corporate Executive Vice President and Head of Global Markets- | |
| | | the Americas (2006-2007), CEO of Wholesale Banking North America and | |
| | | Global Head of Foreign Exchange and Futures Markets (2001-2006), and | |
| | | Regional Commercial Treasurer and Senior Vice President Trading-North | |
| | | America (1996-2001); formerly, Trustee at St. Edmund Preparatory School | |
| | | in New York City. | |
|
■ JUDITH M. STOCKDALE | | | Board Member, Land Trust Alliance (since 2013) and U.S. Endowment for | |
| 1947 | | | Forestry and Communities (since 2013); formerly, Executive Director | |
| 333 W. Wacker Drive | Board Member | 1997 | (1994-2012), Gaylord and Dorothy Donnelley Foundation; prior thereto, | 159 |
| Chicago, IL 6o6o6 | | Class I | Executive Director, Great Lakes Protection Fund (1990-1994). | |
|
■ CAROLE E. STONE | | | Former Director, Chicago Board Options Exchange, Inc. (2006-2017); | |
| 1947 | | | and C2 Options Exchange, Incorporated (2009-2017); Director, Cboe, | |
| 333 W. Wacker Drive | Board Member | 2007 | Global Markets, Inc., formerly, CBOE Holdings, Inc. (since 2010); | 159 |
| Chicago, IL 6o6o6 | | Class I | formerly, Commissioner, New York State Commission on Public Authority | |
| | | Reform (2005-2010). | |
|
■ MARGARET L. WOLFF | | | Formerly, member of the Board of Directors (2013-2017) of Travelers | |
| 1955 | | | Insurance Company of Canada and The Dominion of Canada General | |
| 333 W. Wacker Drive | Board Member | 2016 | Insurance Company (each, a part of Travelers Canada, the Canadian | 159 |
| Chicago, IL 6o6o6 | | Class I | operation of The Travelers Companies, Inc.); formerly, Of Counsel, | |
| | | Skadden, Arps, Slate, Meagher & Flom LLP (Mergers & Acquisitions | |
| | | Group) (2005-2014); Member of the Board of Trustees of New York- | |
| | | Presbyterian Hospital (since 2005); Member (since 2004) and Chair | |
| | | (since 2015) of the Board of Trustees of The John A. Hartford Foundation | |
| | | (a philanthropy dedicated to improving the care of older adults); | |
| | | formerly, Member (2005-2015) and Vice Chair (2011-2015) of the Board of | |
| | | Trustees of Mt. Holyoke College. | |
|
■ ROBERT L. YOUNG(2) | | | Formerly, Chief Operating Officer and Director, J.P.Morgan Investment | |
| 1963 | | | Management Inc. (2010-2016); formerly, President and Principal | |
| 333 W. Wacker Drive | Board Member | 2017 | Executive Officer (2013-2016), and Senior Vice President and Chief | 157 |
| Chicago, IL 6o6o6 | | Class II | Operating Officer (2005-2010), of J.P.Morgan Funds; formerly, Director | |
| | | and various officer positions for J.P.Morgan Investment Management Inc. | |
| | | (formerly, JPMorgan Funds Management, Inc. and formerly, One Group | |
| | | Administrative Services) and JPMorgan Distribution Services, Inc. | |
| | | (formerly, One Group Dealer Services, Inc.) (1999-2017). | |
106
| | | | | |
| Name, | Position(s) Held | Year First | Principal | Number |
| Year of Birth | with the Funds | Elected or | Occupation(s) | of Portfolios |
| & Address | | Appointed | Including other | in Fund Complex |
| | and Term(1) | Directorships | Overseen by |
| | | During Past 5 Years | Board Member |
|
Interested Board Member: |
|
■ MARGO L. COOK(3) | | | President (since 2017), formerly, Co-Chief Executive Officer and | |
| 1964 | | | Co-President (2016-2017), formerly, Senior Executive Vice President of | |
| 333 W. Wacker Drive | Board Member | 2016 | Nuveen Investments, Inc.; President, Global Products and Solutions | 159 |
| Chicago, IL 6o6o6 | | Class III | (since 2017), and, Co-Chief Executive Officer (since 2015), formerly, | |
| | | Executive Vice President (2013-2015), of Nuveen Securities, LLC; Executive | |
| | | Vice President (since 2017) of Nuveen, LLC; President (since August 2017), | |
| | | formerly Co-President (2016- 2017), formerly, Senior Executive Vice | |
| | | President of Nuveen Fund Advisors, LLC (Executive Vice President | |
| | | 2011-2015); President (since 2017), Nuveen Alternative Investments, LLC; | |
| | | Chartered Financial Analyst. | |
| | | | |
| Name, | Position(s) Held | Year First | Principal |
| Year of Birth | with the Funds | Elected or | Occupation(s) |
| & Address | | Appointed(4) | During Past 5 Years |
|
|
Officers of the Funds: | | | |
|
■ CEDRIC H. ANTOSIEWICZ | | | Senior Managing Director (since 2017), formerly, Managing Director |
| 1962 | Chief | | (2004-2017) of Nuveen Securities, LLC; Senior Managing Director |
| 333 W. Wacker Drive | Administrative | 2007 | (since 2017), formerly, Managing Director (2014-2017) of Nuveen Fund |
| Chicago, IL 6o6o6 | Officer | | Advisors, LLC. |
|
■ NATHANIEL T. JONES | | | Managing Director (since 2017), formerly, Senior Vice President |
| 1979 | | | (2016-2017), formerly, Vice President (2011-2016) of Nuveen; Managing |
| 333 W. Wacker Drive | Vice President | 2016 | Director (since 2015) of Nuveen Fund Advisors, LLC; Chartered |
| Chicago, IL 6o6o6 | and Treasurer | | Financial Analyst. |
|
■ WALTER M. KELLY | | | Managing Director (since 2017), formerly, Senior Vice President |
| 1970 | Chief Compliance | | (2008-2017) of Nuveen. |
| 333 W. Wacker Drive | Officer and | 2003 | |
| Chicago, IL 6o6o6 | Vice President | | |
|
■ DAVID J. LAMB | | | Managing Director (since 2017), formerly, Senior Vice President of Nuveen |
| 1963 | | | (since 2006), Vice President prior to 2006. |
| 333 W. Wacker Drive | Vice President | 2015 | |
| Chicago, IL 6o6o6 | | | |
|
■ TINA M. LAZAR | | | Managing Director (since 2017), formerly, Senior Vice President |
| 1961 | | | (2014-2017) of Nuveen Securities, LLC. |
| 333 W. Wacker Drive | Vice President | 2002 | |
| Chicago, IL 6o6o6 | | | |
|
■ BRIAN J. LOCKHART | | | Managing Director (since 2019) of Nuveen Fund Advisors, LLC; Managing |
| 1974 | | | Director (since 2017), formerly, Vice President (2010-2017) of Nuveen; |
| 333 W. Wacker Drive | Vice President | 2019 | Head of Investment Oversight (since 2017), formerly, Team Leader of |
| Chicago, IL 6o6o6 | | | Manager Oversight (2015-2017); Chartered Financial Analyst and |
| | | Certified Financial Risk Manager. |
|
■ JACQUES M. LONGERSTAEY | | | Senior Managing Director, Chief Risk Officer, Nuveen, LLC (since |
| 1963 | | | May 2019); Senior Managing Director (since May 2019) of Nuveen Fund |
| 8500 Andrew Carnegie Blvd. | Vice President | 2019 | Advisors, LLC; formerly, Chief Investment and Model Risk Officer, Wealth |
| Charlotte, NC 28262 | | | & Investment Management Division, Wells Fargo Bank (NA) (from |
| | | 2013-2019). |
107
Board Members & Officers (Unaudited) (continued)
| | | | |
| Name, | Position(s) Held | Year First | Principal |
| Year of Birth | with the Funds | Elected or | Occupation(s) |
| & Address | | Appointed(4) | During Past 5 Years |
|
|
Officers of the Funds (continued):
|
|
■ KEVIN J. MCCARTHY | | | Senior Managing Director (since 2017) and Secretary and General Counsel |
| 1966 | Vice President | | (since 2016) of Nuveen Investments, Inc., formerly, Executive Vice President |
| 333 W. Wacker Drive | and Assistant | 2007 | (2016-2017) and Managing Director and Assistant Secretary (2008-2016); |
| Chicago, IL 6o6o6 | Secretary | | Senior Managing Director (since 2017) and Assistant Secretary (since 2008) of |
| | | Nuveen Securities, LLC, formerly Executive Vice President (2016-2017) and |
| | | Managing Director (2008-2016); Senior Managing Director (since 2017), |
| | | Secretary (since 2016) and Co-General Counsel (since 2011) of Nuveen Fund |
| | | Advisors, LLC, formerly, Executive Vice President (2016-2017), Managing |
| | | Director (2008-2016) and Assistant Secretary (2007-2016); Senior Managing |
| | | Director (since 2017), Secretary (since 2016) and Associate General Counsel |
| | | (since 2011) of Nuveen Asset Management, LLC, formerly Executive Vice |
| | | President (2016-2017) and Managing Director and Assistant Secretary |
| | | (2011-2016); Senior Managing Director (since 2017) and Secretary (since 2016) |
| | | of Nuveen Investments Advisers, LLC, formerly Executive Vice President |
| | | (2016-2017); Vice President (since 2007) and Secretary (since 2016), formerly, |
| | | Assistant Secretary, of NWQ Investment Management Company, LLC, |
| | | Symphony Asset Management LLC, Santa Barbara Asset Management, LLC |
| | | and Winslow Capital Management, LLC (since 2010). Senior Managing Director |
| | | (since 2017) and Secretary (since 2016) of Nuveen Alternative Investments, LLC. |
|
■ JON SCOTT MEISSNER | | | Managing Director of Mutual Fund Tax and Financial Reporting groups at |
| 1973 | | | Nuveen (since 2017); Managing Director of Nuveen Fund Advisors, LLC (since 2019); |
| 8500 Andrew Carnegie Blvd. | Vice President | 2019 | Senior Director of Teachers Advisors, LLC and TIAA-CREF Investment |
| Charlotte, NC 28262 | | | Management, LLC (since 2016); Senior Director (since 2015) Mutual Fund |
| | | Taxation to the TIAA-CREF Funds, the TIAA-CREF Life Funds, the TIAA |
| | | Separate Account VA-1 and the CREF Accounts; has held various positions |
| | | with TIAA since 2004. |
|
■ WILLIAM T. MEYERS | | | Senior Managing Director (since 2017), formerly, Managing Director |
| 1966 | | | (2016-2017), Senior Vice President (2010-2016) of Nuveen Securities, LLC and |
| 333 W. Wacker Drive | Vice President | 2018 | Nuveen Fund Advisors, LLC; Senior Managing Director (since 2017), formerly, |
| Chicago, IL 60606 | | | Managing Director (2016-2017), Senior Vice President (2010-2016) of Nuveen, |
| | | has held various positions with Nuveen since 1991. |
|
■ MICHAEL A. PERRY | | | Executive Vice President (since 2017), previously Managing Director (from |
| 1967 | | | 2016), of Nuveen Fund Advisors, LLC and Nuveen Alternative Investments, |
| 333 W. Wacker Drive | Vice President | 2017 | LLC; Executive Vice President (since 2017), formerly, Managing Director |
| Chicago, IL 6o6o6 | | | (2015-2017), of Nuveen Securities, LLC; formerly, Managing Director |
| | | (2010-2015) of UBS Securities, LLC. |
|
■ CHRISTOPHER M. ROHRBACHER | | | Managing Director (since 2017) and Assistant Secretary of Nuveen Securities, |
| 1971 | Vice President | | LLC; Managing Director (since 2017), formerly, Senior Vice President |
| 333 W. Wacker Drive | and Assistant | 2008 | (2016-2017), Co-General Counsel (since 2019) and Assistant Secretary (since 2016) |
| Chicago, IL 6o6o6 | Secretary | | of Nuveen Fund Advisors, LLC; Managing Director (since 2017), formerly, Senior |
| | | Vice President (2012-2017) and Associate General Counsel (since 2016), formerly, |
| | | Assistant General Counsel (2008-2016) of Nuveen. |
|
■ WILLIAM A. SIFFERMANN | | | Managing Director (since 2017), formerly Senior Vice President (2016-2017) |
| 1975 | | | and Vice President (2011-2016) of Nuveen. |
| 333 W. Wacker Drive | Vice President | 2017 | |
| Chicago, IL 6o6o6 | | | |
|
■ E. SCOTT WICKERHAM | | | Senior Managing Director, Head of Fund Administration at Nuveen, LLC |
| 1973 | Vice President | | (since 2019), formerly, Managing Director; Senior Managing Director |
| TIAA | and Controller | 2019 | (since 2019), Nuveen Fund Advisers, LLC; Principal Financial Officer, Principal |
| 730 Third Avenue | | | Accounting Officer and Treasurer (since 2017) to the TIAA-CREF Funds, the |
| New York, NY 10017 | | | TIAA-CREF Life Funds, the TIAA Separate Account VA-1 and the Treasurer |
| | | (since 2017) to the CREF Accounts; Senior Director, TIAA-CREF Fund |
| | | Administration (2014-2015); has held various positions with TIAA since 2006. |
108
| | | | |
| Name, | Position(s) Held | Year First | Principal |
| Year of Birth | with the Funds | Elected or | Occupation(s) |
| & Address | | Appointed(4) | During Past 5 Years |
|
|
Officers of the Funds (continued): | | |
|
■ MARK L. WINGET | | | Vice President and Assistant Secretary of Nuveen Securities, LLC |
| 1968 | Vice President | | (since 2008); Vice President and Assistant Secretary of Nuveen Fund |
| 333 W. Wacker Drive | and Assistant | 2008 | Advisors, LLC (since 2019); Vice President (since 2010) and Associate |
| Chicago, IL 60606 | Secretary | | General Counsel (since 2016), formerly, Assistant General Counsel |
| | | (2008-2016) of Nuveen. |
|
■ GIFFORD R. ZIMMERMAN | | | Managing Director (since 2002), and Assistant Secretary of Nuveen Securities, |
| 1956 | Vice President | | LLC; Managing Director (since 2004) and Assistant Secretary (since 1994) of |
| 333 W. Wacker Drive | Secretary | 1988 | Nuveen Investments, Inc.; Managing Director (since 2002), Assistant |
| Chicago, IL 60606 | | | Secretary (since 1997) and Co-General Counsel (since |2011) of Nuveen Fund |
| | | Advisors, LLC; Managing Director, Assistant Secretary and Associate General |
| | | Counsel of Nuveen Asset Management, LLC (since 2011); Vice President |
| | | (since 2017), formerly, Managing Director (2003-2017) and Assistant |
| | | Secretary (since 2003) of Symphony Asset Management LLC; Managing |
| | | Director and Assistant Secretary (since 2002) of Nuveen Investments |
| | | Advisers, LLC; Vice President and Assistant Secretary of NWQ Investment |
| | | Management Company, LLC (since 2002), Santa Barbara Asset Management, |
| | | LLC (since 2006), and of Winslow Capital Management, LLC, (since 2010); |
| | | Chartered Financial Analyst. |
| |
|
(1) | The Board of Trustees is divided into three classes, Class I, Class II, and Class III, with each being elected to serve until the third succeeding annual shareholders’ meeting subsequent to its election or thereafter in each case when its respective successors are duly elected or appointed, except two board members are elected by the holders of Preferred Shares, when applicable, to serve until the next annual shareholders’ meeting subsequent to its election or thereafter in each case when its respective successors are duly elected or appointed. The year first elected or appointed represents the year in which the board member was first elected or appointed to any fund in the Nuveen complex. |
(2) | Mr. Young was appointed as a Board Member of each of the Nuveen Funds except Nuveen Diversified Dividend and Income Fund and Nuveen Real Estate Income Fund. |
(3) | “Interested person” as defined in the 1940 Act, by reason of her position with Nuveen, LLC. and certain of its subsidiaries, which are affiliates of the Nuveen Funds. |
(4) | Officers serve one year terms through August of each year. The year first elected or appointed represents the year in which the Officer was first elected or appointed to any fund in the Nuveen complex. |
109
Notes
110
Notes
111
Nuveen:
Serving Investors for Generations
Since 1898, financial advisors and their clients have relied on Nuveen to provide dependable investment solutions through continued adherence to proven, long-term investing principles. Today, we offer a range of high quality solutions designed to be integral components of a well-diversified core portfolio.
Focused on meeting investor needs.
Nuveen is the investment manager of TIAA. We have grown into one of the world’s premier global asset managers, with specialist knowledge across all major asset classes and particular strength in solutions that provide income for investors and that draw on our expertise in alternatives and responsible investing. Nuveen is driven not only by the independent investment processes across the firm, but also the insights, risk management, analytics and other tools and resources that a truly world-class platform provides. As a global asset manager, our mission is to work in partnership with our clients to create solutions which help them secure their financial future.
Find out how we can help you.
To learn more about how the products and services of Nuveen may be able to help you meet your financial goals, talk to your financial advisor, or call us at (800) 257-8787. Please read the information provided carefully before you invest. Investors should consider the investment objective and policies, risk considerations, charges and expenses of any investment carefully. Where applicable, be sure to obtain a prospectus, which contains this and other relevant information. To obtain a prospectus, please contact your securities representative or Nuveen, 333 W. Wacker Dr., Chicago, IL 60606. Please read the prospectus carefully before you invest or send money.
Learn more about Nuveen Funds at: www.nuveen.com/closed-end-funds
| Nuveen Securities, LLC, member FINRA and SIPC | 333 West Wacker Drive Chicago, IL 60606 | www.nuveen.com |  |
EAN-A-1019D 1032014-INV-Y-12/20