Life is Complex.
Nuveen makes things e-simple.
It only takes a minute to sign up for e-Reports. Once enrolled, you’ll receive an e-mail as soon as your Nuveen Fund information is ready—no more waiting for delivery by regular mail. Just click on the link within the e-mail to see the report and save it on your computer if you wish.
Free e-Reports
right to your e-mail!
www.investordelivery.com
If you receive your Nuveen Fund
dividends and statements from your
financial advisor or brokerage account.
or
www.nuveen.com/client-access
If you receive your Nuveen Fund
dividends and statements directly from
Nuveen.
NOT FDIC INSURED MAY LOSE
VALUE NO BANK GUARANTEE
Table of Contents
| | |
| Chairman’s Letter to Shareholders | 4 |
| | |
| Portfolio Managers’ Comments | 5 |
| | |
| Fund Leverage | 8 |
| | |
| Common Share Information | 9 |
| | |
| Risk Considerations | 11 |
| | |
| Performance Overview and Holding Summaries | 12 |
| | |
| Portfolios of Investments | 20 |
| | |
| Statement of Assets and Liabilities | 67 |
| | |
| Statement of Operations | 68 |
| | |
| Statement of Changes in Net Assets | 69 |
| | |
| Statement of Cash Flows | 71 |
| | |
| Financial Highlights | 72 |
| | |
| Notes to Financial Statements | 76 |
| | |
| Additional Fund Information | 87 |
| | |
| Glossary of Terms Used in this Report | 88 |
| | |
| Reinvest Automatically, Easily and Conveniently | 90 |
3
Chairman’s Letter to Shareholders
Dear Shareholders,
The worries weighing on markets at the end of 2018 appeared to dissipate in early 2019 as positive economic and corporate earnings news, more dovish signals from central banks and trade progress boosted investor confidence. However, political noise and trade disputes have resurfaced in the headlines more recently, knocking stock market indexes off their recent highs and rallying U.S. Treasury bonds and other safe-haven assets. Investors are concerned that increased tariffs and a protracted stalemate between the U.S. and China, Mexico and other trading partners could dampen business and consumer sentiment, weakening spending and potentially impacting the global economy. Additionally, political uncertainty and the risk of policy error appear elevated. In the U.S. in particular, low interest rate levels and the widening federal deficit have constrained the available policy tools for countering recessionary pressures. As the current U.S. economic expansion reaches the 10-year mark this summer, it’s important to note that economic expansions don’t die of old age, but mature economic cycles can be more vulnerable to an exogenous shock.
Until a clearer picture on trade emerges, more bouts of market turbulence are likely in the meantime. While the downside risks warrant careful monitoring, we believe the likelihood of a near-term recession remains low. Global economic growth is moderating, with demand driven by the historically low unemployment in the U.S., Japan and across Europe. Central banks across the developed world continue to emphasize their readiness to adjust policy, and China’s authorities remain committed to keeping economic growth rates steady with fiscal and monetary policy.
The opportunity set may be narrower, but there is still scope for gains in this environment. Patience and maintaining perspective can help you weather periodic market volatility. We encourage you to work with your financial advisor to assess short-term market movements in the context of your time horizon, risk tolerance and investment goals. On behalf of the other members of the Nuveen Fund Board, we look forward to continuing to earn your trust in the months and years ahead.
Sincerely,
Terence J. Toth
Chairman of the Board
June 24, 2019
4
Portfolio Managers’ Comments
Nuveen Municipal Value Fund, Inc. (NUV)
Nuveen AMT-Free Municipal Value Fund (NUW)
Nuveen Municipal Income Fund, Inc. (NMI)
Nuveen Enhanced Municipal Value Fund (NEV)
These Funds feature portfolio management by Nuveen Asset Management, LLC (NAM), an affiliate of Nuveen, LLC. Portfolio managers Daniel J. Close, CFA, Christopher L. Drahn, CFA, and Steven M. Hlavin discuss key investment strategies and the six-month performance of these four national Funds. Dan has managed NUV and NUW since 2016. Chris assumed portfolio management responsibility for NMI in 2011. Steve has been involved in the management of NEV since its inception in 2009, taking on full portfolio management responsibility in 2010.
WHAT KEY STRATEGIES WERE USED TO MANAGE THESE FUNDS DURING THE SIX-MONTH REPORTING PERIOD ENDED APRIL 30, 2019?
During the six-month reporting period, a significant decline in interest rates along with a tailwind from technical supply-demand conditions drove strong performance in municipal bonds. After raising its benchmark interest rate in December 2018, the Federal Reserve (Fed) subsequently adopted a more dovish tone and downgraded its economic forecast. As markets repriced the possibility of no rate hikes (or a potential rate cut) in 2019, U.S. Treasury yields declined and municipal market yields fell even further. Demand for municipal bonds rose, shifting municipal bond fund flows from outflows at the end of 2018 to exceptionally strong inflows in the first four months of 2019. Renewed interest in the tax advantages of municipal bond investments also boosted demand in the new year. Under the new tax laws, some taxpayers had smaller refunds or larger tax bills than they expected, particularly in high tax states. However, supply has not kept pace with the elevated demand, as issuance volumes remain lower. The tight supply-demand conditions further supported municipal bond prices in this reporting period.
During this time, we continued to take a bottom-up approach to discovering sectors that appeared undervalued as well as individual credits that we believed had the potential to perform well over the long term. Our trading activity continued to focus on pursuing the Funds’ investment objectives.
Higher prevailing interest rates in November and December 2018 presented favorable conditions to sell some depreciated bonds and buy similarly structured, higher yielding bonds. These bond exchanges helped boost tax efficiencies, as the loss on the depreci-
This material is not intended to be a recommendation or investment advice, does not constitute a solicitation to buy, sell or hold a security or an investment strategy and is not provided in a fiduciary capacity. The information provided does not take into account the specific objectives or circumstances of any particular investor, or suggest any specific course of action. Investment decisions should be made based on an investor’s objectives and circumstances and in consultation with his or her advisors.Certain statements in this report are forward-looking statements. Discussions of specific investments are for illustration only and are not intended as recommendations of individual investments. The forward-looking statements and other views expressed herein are those of the portfolio managers as of the date of this report. Actual future results or occurrences may differ significantly from those anticipated in any forward-looking statements, and the views expressed herein are subject to change at any time, due to numerous market and other factors. The Funds disclaim any obligation to update publicly or revise any forward-looking statements or views expressed herein.
For financial reporting purposes, the ratings disclosed are the highest rating given by one of the following national rating agencies: Standard & Poor’s Group (S&P), Moody’s Investors Service, Inc. (Moody’s) or Fitch, Inc. (Fitch). This treatment of split-rated securities may differ from that used for other purposes, such as for Fund investment policies. Credit ratings are subject to change. AAA, AA, A and BBB are investment grade ratings, while BB, B, CCC, CC, C and D are below investment grade ratings. Holdings designated N/R are not rated by these national rating agencies.
Bond insurance guarantees only the payment of principal and interest on the bond when due, and not the value of the bonds themselves, which will fluctuate with the bond market and the financial success of the issuer and the insurer. Insurance relates specifically to the bonds in the portfolio and not to the share prices of a Fund. No representation is made as to the insurers’ ability to meet their commitments.
Refer to the Glossary of Terms Used in this Report for further definition of the terms used within this section.
5
Portfolio Managers’ Comments (continued)
ated bonds we sold can be used to offset capital gains in the future, and helped increase the Fund’s income distribution capabilities. NUV and NUW were highly active with this trading strategy at the time, while NMI exchanged one sizeable position.
NUV and NUW had an elevated level of bonds maturing during this reporting period. We used the proceeds to buy new bonds from both the new issue and secondary markets across a diverse range of sectors and primarily with single A and BBB credit ratings. We emphasized shorter dated and shorter call structures to help maintain the two Funds’ duration targets. NUV also closed a tender option bond (TOB) trust and sold two long duration positions to help manage overall duration.
For NMI, in addition to bond exchange activity described above, we bought new issues for Virgin Trains USA Passenger Project. The credits were issued after Brightline Passenger Rail Project called some bonds and was subsequently renamed Virgin Trains USA. The Florida rail system is the country’s first privately owned and operated high-speed train, which currently connects Miami, Ft. Lauderdale and West Palm Beach and plans to add Orlando.
NEV’s trading activity was muted in this reporting period. The Fund also bought Virgin Trains USA Passenger Project credits and increased the size of NEV’s exposure from the original Brightline position that was called. We also bought New York Liberty 3 World Trade Center bonds. Additionally, we closed some TOB positions when the underlying bonds were called and established new TOB trusts to maintain consistent leverage levels. Nearly all of the proceeds to fund the new purchases came from called and maturing bonds.
As of April 30, 2019, all of these Funds continued to use inverse floating rate securities. We employ inverse floaters for a variety of reasons, including duration management, income enhancement and total return enhancement. As part of our duration management strategies, during this reporting period NUW entered into interest rate futures contracts to help manage the duration of its portfolio. These contracts had a negligible impact on performance during the reporting period.
HOW DID THE FUNDS PERFORM DURING THE SIX-MONTH REPORTING PERIOD ENDED APRIL 30, 2019?
The tables in each Fund’s Performance Overview and Holding Summaries section of this report provide the Funds’ total returns for the six-month, one-year, five-year, ten-year and since inception periods ended April 30, 2019. Each Fund’s total returns at net asset value (NAV) are compared with the performance of a corresponding market index.
For the six months ended April 30, 2019, the total returns at NAV for NUV, NUW and NEV outperformed the return for the national S&P Municipal Bond Index and NMI trailed the return for the national index.
The factors affecting performance in this reporting period included yield curve and duration positioning, credit ratings allocation and sector allocation. Given differences in the maturity structures of the four Funds’ portfolios, the performance impact of duration and yield curve positioning varied by Fund. For NUV, NUW and NEV, their duration and yield curve positioning were the main positive contributors to relative performance. NUV’s underweight to the shortest duration and overweight to the longest duration segments were advantageous as long duration bonds outperformed in this reporting period. NUW also held a beneficial overweight to long duration bonds, but its overweight to the shortest durations (the 0- to 2-year segment) was a detractor. Because the Fund began operations in 2009, when prevailing interest rates were higher, holdings in the 0- to 2-year segment offer higher embedded yields, which have benefited the Fund’s income earnings. As these shorter bonds roll off, we look to redeploy the proceeds in other longer-term opportunities. NEV’s longer duration profile than the benchmark drove much of the Fund’s relative outperformance. However, NMI was neutrally positioned relative to the benchmark along most of the yield curve. NMI’s modest overweight to 2- to 4-year duration bonds was negative for performance and was the main detractor from relative results in this reporting period. Similar to NUW, the shorter duration bonds held by NMI offer higher embedded book yields, which has been favorable for NMI’s income distribution capabilities.
6
Credit ratings allocations produced mixed results for the Funds in this reporting period. All four Funds continued to emphasize higher yielding, lower rated bonds over lower yielding, high grade bonds. For NUV, credit ratings allocations detracted overall. Although an overweight to single A rated credits aided performance, the gains were offset by an overweight allocation to single B rated bonds, a group which underperformed because of the weak performance of tobacco settlement bonds. Tobacco bonds dominate the single B rated category, and concerns that a new regulatory proposal would dampen cigarette shipments and revenues hurt the tobacco sector in this reporting period. NUW was similarly positioned, with a beneficial overweight to the single A category and a detracting overweight to single B rated credits, but overall credit quality positioning was a positive contributor to performance. For NMI and NEV, credit ratings allocations had a minimal impact on performance.
In terms of sector positioning, NUV and NUW recorded gains, as the negative impact of an overweight to the pre-refunded sector was more than offset by an advantageous overweight to the dedicated tax sector. NMI also held an overweight to the pre-refunded sector, which slightly detracted from performance. Pre-refunded bonds lagged the overall market in this reporting period due to their shorter term, higher quality structures. NEV’s sector allocations were favorable overall. An overweight allocation to the tobacco sector somewhat detracted from performance because of the aforementioned regulatory uncertainty. But, NEV’s overweight allocations to the hospital sector and the industrial development revenue (IDR) sector were the most beneficial, as these sectors outperformed in the reporting period. Within the IDR sector, performance was led by NEV’s holdings in FirstEnergy Solutions, a distressed credit that appreciated on continued progress in its debt restructuring (as described in “An Update on FirstEnergy Solutions Corp.” at the end of this commentary).
In addition, the use of leverage was an important factor affecting performance of the Funds. Leverage is discussed in more detail later in the Fund Leverage section of this report.
AN UPDATE ON FIRSTENERGY SOLUTIONS CORP.
FirstEnergy Solutions Corp. and all of its subsidiaries filed for protection under Chapter 11 of the U.S. Bankruptcy Code on April 1, 2018. FirstEnergy Solutions and its subsidiaries specialize in coal and nuclear energy production. It is one of the main energy producers in the state of Ohio and a major energy provider in Pennsylvania. Because of the challenging market environment for nuclear and coal power in the face of inexpensive natural gas, FirstEnergy Corp., FirstEnergy Solution's parent announced in late 2016 that it would begin a strategic review of its generation assets. FirstEnergy Solutions is a unique corporate issuer in that the majority of its debt was issued in the municipal market to finance pollution control and waste disposal for its coal and nuclear plants. A substantial amount of bondholders, of which Nuveen Funds are included, entered into an “Agreement in Principal” with FirstEnergy Corp., to resolve potential claims that bondholders may have against FirstEnergy Corp. The agreement is subject to the approval of the FirstEnergy Corp. board of directors, FirstEnergy Solutions and the bankruptcy court.
In terms of FirstEnergy holdings, shareholders should note that NUW and NMI had no exposure to FirstEnergy, while NUV had 0.61% and NEV had 2.11%. It should be noted that exposure for NUV was in the secured structure, which continues to track close to par.
7
Fund Leverage
IMPACT OF THE FUNDS’ LEVERAGE STRATEGIES ON PERFORMANCE
One important factor impacting the returns of NEV’s common shares relative to its comparative benchmark was the Fund’s use of leverage through investments in inverse floating rate securities, which represent leveraged investments in underlying bonds. This was also a factor, although less significantly, for NUV and NUW because their use of leverage is more modest. NMI did not invest in inverse floating rate securities during the reporting period. The Funds use leverage because our research has shown that, over time, leveraging provides opportunities for additional income, particularly in the recent market environment where short-term market rates are at or near historical lows, meaning that the short-term rates the Fund has been paying on its leveraging instruments in recent years have been much lower than the interest the Fund has been earning on its portfolio of long-term bonds that it has bought with the proceeds of that leverage.
However, use of leverage can expose Fund common shares to additional price volatility. When a Fund uses leverage, the Fund common shares will experience a greater increase in their net asset value if the municipal bonds acquired through the use of leverage increase in value, but will also experience a correspondingly larger decline in their net asset value if the bonds acquired through leverage decline in value, which will make the shares’ net asset value more volatile, and total return performance more variable, over time.
In addition, common share income in levered funds will typically decrease in comparison to unlevered funds when short-term interest rates increase and increase when short-term interest rates decrease. Over the last few quarters, short-term interest rates have indeed increased from their extended lows after the 2007-09 financial crisis. This increase has reduced common share net income, and also reduced potential for long-term total returns. Nevertheless, the ability to effectively borrow at current short-term rates is still resulting in enhanced common share income, and management believes that the advantages of continuation of leverage outweigh the associated increase in risk and volatility described above.
The use of leverage through inverse floating rate securities had a slightly positive impact on the total return performance of NUV and a positive impact on the total return performance of NUW and NEV over the reporting period. NMI did not invest in inverse floating rate securities during the reporting period.
As of April 30, 2019, the Funds’ percentages of leverage are as shown in the accompanying table.
| | | | | | | | | | | | | |
| | | NUV | | | NUW | | | NMI | | | NEV | |
| Effective Leverage* | | | 1.74 | % | | | 7.07 | % | | | 0.00 | % | | | 36.41 | % |
| |
| * Effective Leverage is a Fund’s effective economic leverage, and includes both regulatory leverage and the leverage effects of certain derivative and other investments in a Fund’s portfolio that increase the Fund’s investment exposure. Currently, the leverage effects of Tender Option Bond (TOB) inverse floater holdings are included in effective leverage values. A Fund, however, may from time to time borrow on a typically transient basis in connection with its day-to-day operations, primarily in connection with the need to settle portfolio trades. Such incidental borrowings are excluded from the calculation of a Fund’s effective leverage ratio. |
8
Common Share Information
COMMON SHARE DISTRIBUTION INFORMATION
The following information regarding the Funds’ distributions is current as of April 30, 2019. Each Fund’s distribution levels may vary over time based on each Fund’s investment activity and portfolio investment value changes.
During the current reporting period, each Fund’s distributions to common shareholders were as shown in the accompanying table.
| | | | | | | | | | | | | |
| | | Per Common Share Amounts |
| Monthly Distributions (Ex-Dividend Date) | | NUV | | | NUW | | | NMI | | | NEV | |
| November 2018 | | $ | 0.0310 | | | $ | 0.0560 | | | $ | 0.0360 | | | $ | 0.0565 | |
| December | | | 0.0310 | | | | 0.0560 | | | | 0.0360 | | | | 0.0565 | |
| January | | | 0.0310 | | | | 0.0560 | | | | 0.0360 | | | | 0.0565 | |
| February | | | 0.0310 | | | | 0.0560 | | | | 0.0360 | | | | 0.0565 | |
| March | | | 0.0310 | | | | 0.0560 | | | | 0.0360 | | | | 0.0565 | |
| April 2019 | | | 0.0310 | | | | 0.0560 | | | | 0.0360 | | | | 0.0565 | |
| Total Distributions from Net Investment Income | | $ | 0.1860 | | | $ | 0.3360 | | | $ | 0.2160 | | | $ | 0.3390 | |
| Total Distributions from Long Term Capital Gains* | | $ | — | | | $ | 0.0965 | | | $ | 0.0719 | | | $ | — | |
| Total Distributions | | $ | 0.1860 | | | $ | 0.4325 | | | $ | 0.2879 | | | $ | 0.3390 | |
| | |
| Yields | | | | | | | | | | | | | | | | |
| Market Yield** | | | 3.73 | % | | | 4.16 | % | | | 3.91 | % | | | 4.86 | % |
| Taxable-Equivalent Yield** | | | 4.88 | % | | | 5.37 | % | | | 5.09 | % | | | 6.35 | % |
| | |
| * | Distribution paid in December 2018. |
| ** | Market Yield is based on the Fund’s current annualized monthly dividend divided by the Fund’s current market price as of the end of the reporting period. Taxable-Equivalent Yield represents the yield that must be earned on a fully taxable investment in order to equal the yield of the Fund on an after-tax basis. It is based on a federal income tax rate of 23.6%, 22.5%, 23.1% and 23.5% for NUV, NUW, NMI and NEV, respectively. Your actual federal income tax rate may differ from the assumed rate. The Taxable-Equivalent Yield also takes into account the percentage of the Fund’s income generated and paid by the Fund (based on payments made during the previous calendar year) that was not exempt from federal income tax. Separately, if the comparison were instead to investments that generate qualified dividend income, which is taxable at a rate lower than an individual’s ordinary graduated tax rate, the fund’s Taxable-Equivalent Yield would be lower. |
Each Fund seeks to pay regular monthly dividends out of its net investment income at a rate that reflects its past and projected net income performance. To permit each Fund to maintain a more stable monthly dividend, the Fund may pay dividends at a rate that may be more or less than the amount of net income actually earned by the Fund during the period. Distributions to common shareholders are determined on a tax basis, which may differ from amounts recorded in the accounting records. In instances where the monthly dividend exceeds the earned net investment income, the Fund would report a negative undistributed net ordinary income. Refer to Note 6 – Income Tax Information for additional information regarding the amounts of undistributed net ordinary income and undistributed net long-term capital gains and the character of the actual distributions paid by the Fund during the period.
All monthly dividends paid by each Fund during the current reporting period were paid from net investment income. If a portion of the Fund’s monthly distributions is sourced or comprised of elements other than net investment income, including capital gains and/or a return of capital, shareholders will be notified of those sources. For financial reporting purposes, the per share amounts of each Fund’s distributions for the reporting period are presented in this report’s Financial Highlights. For income tax purposes, distribution information for each Fund as of its most recent tax year end is presented in Note 6 – Income Tax Information within the Notes to Financial Statements of this report.
9
Common Share Information (continued)
COMMON SHARE EQUITY SHELF PROGRAM
During the current reporting period, NUW and NMI were authorized by the Securities and Exchange Commission to issue additional common shares through an equity shelf program (Shelf Offering). Under these programs, NUW and NMI, subject to market conditions, may raise additional capital from time to time in varying amounts and offering methods at a net price at or above each Fund’s NAV per common share. The total amount of common shares authorized under these Shelf Offerings are shown in the accompanying table:
| | | | | | | |
| | | NUW | | | NMI | |
| Additional authorized common shares | | | 1,400,000 | | | | 800,000 | |
During the current reporting period, NUW and NMI did not sell any common shares through their Shelf Offerings.
Refer to the Notes to Financial Statements, Note 4 – Fund Shares, Common Shares Equity Shelf Program and Offering Costs for further details on Shelf Offerings and each Fund’s transactions.
COMMON SHARE REPURCHASES
During August 2018, the Funds’ Board of Directors/Trustees reauthorized an open-market share repurchase program, allowing each Fund to repurchase an aggregate of up to approximately 10% of its outstanding shares.
As of April 30, 2019, and since the inception of the Funds’ repurchase programs, the Funds have cumulatively repurchased and retired their outstanding shares as shown in the accompanying table.
| | | | | | | | | | | | | |
| | | NUV | | | NUW | | | NMI | | | NEV | |
| Common shares cumulatively repurchased and retired | | | — | | | | — | | | | — | | | | — | |
| Common shares authorized for repurchase | | | 20,690,000 | | | | 1,540,000 | | | | 875,000 | | | | 2,495,000 | |
During the current reporting period, the Funds did not repurchase any of their outstanding common shares.
OTHER COMMON SHARE INFORMATION
As of April 30, 2019, and during the current reporting period, the Funds’ common share prices were trading at a premium/(discount) to their common share NAVs as shown in the accompanying table.
| | | | | | | | | | | | | |
| | | NUV | | | NUW | | | NMI | | | NEV | |
| Common share NAV | | $ | 10.29 | | | $ | 16.45 | | | $ | 11.14 | | | $ | 14.85 | |
| Common share price | | $ | 9.97 | | | $ | 16.17 | | | $ | 11.06 | | | $ | 13.96 | |
| Premium/(Discount) to NAV | | | (3.11 | )% | | | (1.70 | )% | | | (0.72 | )% | | | (5.99 | )% |
| 6-month average premium/(discount) to NAV | | | (4.87 | )% | | | (3.90 | )% | | | (4.06 | )% | | | (7.17 | )% |
10
Risk Considerations
Fund shares are not guaranteed or endorsed by any bank or other insured depository institution, and are not federally insured by the Federal Deposit Insurance Corporation.
Nuveen Municipal Value Fund, Inc. (NUV)
Investing in closed-end funds involves risk; principal loss is possible. There is no guarantee the Fund’s investment objectives will be achieved. Closed-end fund shares may frequently trade at a discount or premium to their net asset value. Debt or fixed income securities such as those held by the Fund, are subject to market risk, credit risk, interest rate risk, derivatives risk, liquidity risk, and income risk. As interest rates rise, bond prices fall. These and other risk considerations such as tax risk are described in more detail on the Fund’s web page at www.nuveen.com/NUV.
Nuveen AMT-Free Municipal Value Fund (NUW)
Investing in closed-end funds involves risk; principal loss is possible. There is no guarantee the Fund’s investment objectives will be achieved. Closed-end fund shares may frequently trade at a discount or premium to their net asset value. Debt or fixed income securities such as those held by the Fund, are subject to market risk, credit risk, interest rate risk, derivatives risk, liquidity risk, and income risk. As interest rates rise, bond prices fall. These and other risk considerations such as tax risk are described in more detail on the Fund’s web page at www.nuveen.com/NUW.
Nuveen Municipal Income Fund, Inc. (NMI)
Investing in closed-end funds involves risk; principal loss is possible. There is no guarantee the Fund’s investment objectives will be achieved. Closed-end fund shares may frequently trade at a discount or premium to their net asset value. Debt or fixed income securities such as those held by the Fund, are subject to market risk, credit risk, interest rate risk, derivatives risk, liquidity risk, and income risk. As interest rates rise, bond prices fall. These and other risk considerations such as tax risk are described in more detail on the Fund’s web page at www.nuveen.com/NMI.
Nuveen Enhanced Municipal Value Fund (NEV)
Investing in closed-end funds involves risk; principal loss is possible. There is no guarantee the Fund’s investment objectives will be achieved. Closed-end fund shares may frequently trade at a discount or premium to their net asset value. Debt or fixed income securities such as those held by the Fund, are subject to market risk, credit risk, interest rate risk, derivatives risk, liquidity risk, and income risk. As interest rates rise, bond prices fall. Leverage increases return volatility and magnifies the Fund’s potential return and its risks; there is no guarantee a fund’s leverage strategy will be successful. The Fund uses only inverse floaters for its leverage, increasing its exposure to interest rate risk and credit risk, including counter-party credit risk. These and other risk considerations such as tax risk are described in more detail on the Fund’s web page at www.nuveen.com/NEV.
11
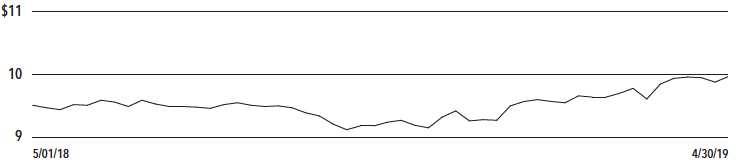
| | |
NUV | Nuveen Municipal Value Fund, Inc. |
| | Performance Overview and Holding Summaries as of April 30, 2019 |
Refer to the Glossary of Terms Used in this Report for further definition of the terms used within this section.
Average Annual Total Returns as of April 30, 2019
| | | | | |
| | Cumulative | Average Annual |
| | 6-Month | 1-Year | 5-Year | 10-Year |
| NUV at Common Share NAV | 6.51% | 6.66% | 4.65% | 5.99% |
| NUV at Common Share Price | 10.71% | 8.87% | 4.67% | 5.47% |
| S&P Municipal Bond Index | 5.36% | 5.84% | 3.55% | 4.74% |
Past performance is not predictive of future results. Current performance may be higher or lower than the data shown. Returns do not reflect the deduction of taxes that shareholders may have to pay on Fund distributions or upon the sale of Fund shares. Returns at NAV are net of Fund expenses, and assume reinvestment of distributions. Comparative index return information is provided for the Fund’s shares at NAV only. Indexes are not available for direct investment.
Common Share Price Performance — Weekly Closing Price
12
This data relates to the securities held in the Fund’s portfolio of investments as of the end of the reporting period. It should not be construed as a measure of performance for the Fund itself. Holdings are subject to change.
For financial reporting purposes, the ratings disclosed are the highest rating given by one of the following national rating agencies: Standard & Poor’s Group, Moody’s Investors Service, Inc. or Fitch, Inc. This treatment of split-rated securities may differ from that used for other purposes, such as for Fund investment policies. Credit ratings are subject to change. AAA, AA, A and BBB are investment grade ratings; BB, B, CCC, CC, C and D are below-investment grade ratings. Holdings designated N/R are not rated by these national rating agencies.
| | |
Fund Allocation | |
(% of net assets) | |
| Long-Term Municipal Bonds | 100.0% |
| Corporate Bonds | 0.0% |
| Other Assets Less Liabilities | 1.8% |
Net Assets Plus Floating Rate | |
Obligations | 101.8% |
| Floating Rate Obligations | (1.8)% |
Net Assets | 100% |
| | |
Portfolio Credit Quality | |
(% of total investment exposure) | |
| U.S. Guaranteed | 8.5% |
| AAA | 5.6% |
| AA | 34.7% |
| A | 25.0% |
| BBB | 17.9% |
| BB or Lower | 5.0% |
| N/R (not rated) | 3.3% |
Total | 100% |
| | |
Portfolio Composition | |
(% of total investments) | |
| Tax Obligation/Limited | 22.9% |
| Transportation | 22.1% |
| Tax Obligation/General | 12.7% |
| Health Care | 11.8% |
| U.S. Guaranteed | 8.6% |
| Utilities | 7.4% |
| Other | 14.5% |
Total | 100% |
| | |
States and Territories | |
(% of total municipal bonds) | |
| Texas | 16.0% |
| Illinois | 12.9% |
| California | 9.1% |
| Colorado | 7.2% |
| New York | 5.4% |
| Florida | 5.1% |
| New Jersey | 3.9% |
| Ohio | 3.7% |
| Nevada | 3.5% |
| Washington | 2.9% |
| Michigan | 2.9% |
| Wisconsin | 2.3% |
| Virginia | 2.3% |
| Indiana | 2.3% |
| South Carolina | 1.7% |
| Other | 18.8% |
Total | 100% |
13
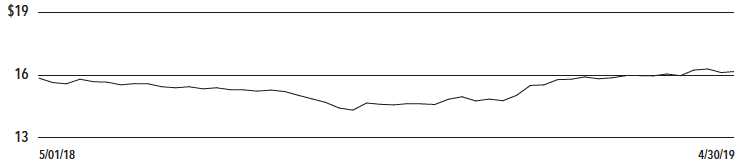
| | |
NUW | Nuveen AMT-Free Municipal Value Fund |
| | Performance Overview and Holding Summaries as of April 30, 2019 |
Refer to the Glossary of Terms Used in this Report for further definition of the terms used within this section.
Average Annual Total Returns as of April 30, 2019
| | | | | |
| | Cumulative | Average Annual |
| | 6-Month | 1-Year | 5-Year | 10-Year |
| NUW at Common Share NAV | 6.39% | 6.04% | 4.50% | 6.33% |
| NUW at Common Share Price | 15.79% | 7.88% | 4.55% | 6.26% |
| S&P Municipal Bond Index | 5.36% | 5.84% | 3.55% | 4.74% |
Past performance is not predictive of future results. Current performance may be higher or lower than the data shown. Returns do not reflect the deduction of taxes that shareholders may have to pay on Fund distributions or upon the sale of Fund shares. Returns at NAV are net of Fund expenses, and assume reinvestment of distributions. Comparative index return information is provided for the Fund’s shares at NAV only. Indexes are not available for direct investment.
Common Share Price Performance — Weekly Closing Price
14
This data relates to the securities held in the Fund’s portfolio of investments as of the end of the reporting period. It should not be construed as a measure of performance for the Fund itself. Holdings are subject to change.
For financial reporting purposes, the ratings disclosed are the highest rating given by one of the following national rating agencies: Standard & Poor’s Group, Moody’s Investors Service, Inc. or Fitch, Inc. This treatment of split-rated securities may differ from that used for other purposes, such as for Fund investment policies. Credit ratings are subject to change. AAA, AA, A and BBB are investment grade ratings; BB, B, CCC, CC, C and D are below-investment grade ratings. Holdings designated N/R are not rated by these national rating agencies.
| | |
Fund Allocation | |
(% of net assets) | |
| Long-Term Municipal Bonds | 96.1% |
| Other Assets Less Liabilities | 7.5% |
Net Assets Plus Floating Rate | |
Obligations | 103.6% |
| Floating Rate Obligations | (3.6)% |
Net Assets | 100% |
| | |
Portfolio Credit Quality | |
(% of total investment exposure) | |
| U.S. Guaranteed | 11.7% |
| AAA | 7.8% |
| AA | 30.0% |
| A | 23.8% |
| BBB | 15.6% |
| BB or Lower | 9.8% |
| N/R (not rated) | 1.3% |
Total | 100% |
| | |
Portfolio Composition | |
(% of total investments) | |
| Tax Obligation/Limited | 17.9% |
| Transportation | 15.8% |
| Tax Obligation/General | 14.8% |
| Utilities | 12.4% |
| Water and Sewer | 9.1% |
| Health Care | 9.0% |
| U.S. Guaranteed | 8.3% |
| Consumer Staples | 5.1% |
| Other | 7.6% |
Total | 100% |
| | |
States and Territories | |
(% of total municipal bonds) | |
| California | 14.2% |
| Texas | 12.4% |
| Illinois | 9.6% |
| Florida | 8.2% |
| Nevada | 6.7% |
| Colorado | 5.9% |
| New Jersey | 5.1% |
| New York | 4.2% |
| Maryland | 3.9% |
| Ohio | 3.8% |
| Georgia | 3.5% |
| Kentucky | 3.3% |
| Other | 19.2% |
Total | 100% |
15
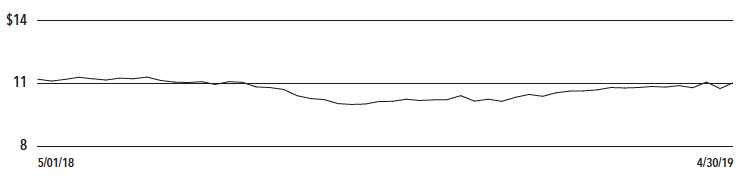
| | |
NMI | Nuveen Municipal Income Fund, Inc. |
| | Performance Overview and Holding Summaries as of April 30, 2019 |
Refer to the Glossary of Terms Used in this Report for further definition of the terms used within this section.
Average Annual Total Returns as of April 30, 2019
| | | | | | |
| | Cumulative | | Average Annual |
| | 6-Month | | 1-Year | 5-Year | 10-Year |
| NMI at Common Share NAV | 4.71% | | 4.87% | 4.46% | 6.37% |
| NMI at Common Share Price | 12.64% | | 3.46% | 3.72% | 5.82% |
| S&P Municipal Bond Index | 5.36% | | 5.84% | 3.55% | 4.74% |
Past performance is not predictive of future results. Current performance may be higher or lower than the data shown. Returns do not reflect the deduction of taxes that shareholders may have to pay on Fund distributions or upon the sale of Fund shares. Returns at NAV are net of Fund expenses, and assume reinvestment of distributions. Comparative index return information is provided for the Fund’s shares at NAV only. Indexes are not available for direct investment.
Common Share Price Performance — Weekly Closing Price
16
This data relates to the securities held in the Fund’s portfolio of investments as of the end of the reporting period. It should not be construed as a measure of performance for the Fund itself. Holdings are subject to change.
For financial reporting purposes, the ratings disclosed are the highest rating given by one of the following national rating agencies: Standard & Poor’s Group, Moody’s Investors Service, Inc. or Fitch, Inc. This treatment of split-rated securities may differ from that used for other purposes, such as for Fund investment policies. Credit ratings are subject to change. AAA, AA, A and BBB are investment grade ratings; BB, B, CCC, CC, C and D are below-investment grade ratings. Holdings designated N/R are not rated by these national rating agencies.
| | |
Fund Allocation | |
(% of net assets) | |
| Long-Term Municipal Bonds | 98.9% |
| Other Assets Less Liabilities | 1.1% |
Net Assets | 100% |
| | |
Portfolio Credit Quality | |
(% of total investment exposure) | |
| U.S. Guaranteed | 11.2% |
| AAA | 0.6% |
| AA | 17.6% |
| A | 30.1% |
| BBB | 27.4% |
| BB or Lower | 7.7% |
| N/R (not rated) | 5.4% |
Total | 100% |
| | |
Portfolio Composition | |
(% of total investments) | |
| Health Care | 22.1% |
| Tax Obligation/General | 14.3% |
| Transportation | 13.7% |
| U.S. Guaranteed | 10.9% |
| Tax Obligation/Limited | 10.3% |
| Education and Civic Organizations | 9.3% |
| Utilities | 6.6% |
| Long-Term Care | 5.7% |
| Other | 7.1% |
Total | 100% |
| | |
States and Territories | |
(% of total municipal bonds) | |
| California | 17.1% |
| Illinois | 10.3% |
| Colorado | 9.9% |
| Texas | 8.2% |
| Wisconsin | 6.5% |
| Florida | 6.2% |
| Ohio | 4.0% |
| Missouri | 3.3% |
| Pennsylvania | 2.9% |
| Michigan | 2.7% |
| Arizona | 2.5% |
| Tennessee | 2.4% |
| Minnesota | 2.3% |
| New York | 2.0% |
| Other | 19.7% |
Total | 100% |
17
| | |
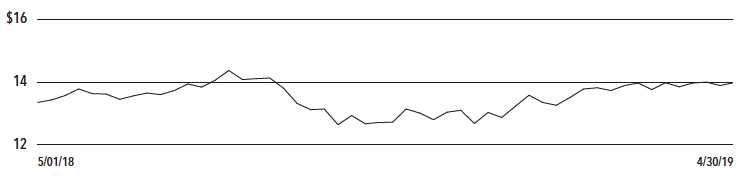
NEV | Nuveen Enhanced Municipal Value Fund |
| | Performance Overview and Holding Summaries as of April 30, 2019 |
Refer to the Glossary of Terms Used in this Report for further definition of the terms used within this section.
Average Annual Total Returns as of April 30, 2019
| | | | | | |
| | Cumulative | | Average Annual |
| | | | | | Since |
| | 6-Month | | 1-Year | 5-Year | Inception |
| NEV at Common Share NAV | 6.73% | | 7.32% | 5.67% | 6.59% |
| NEV at Common Share Price | 12.71% | | 10.30% | 5.60% | 5.57% |
| S&P Municipal Bond Index | 5.36% | | 5.84% | 3.55% | 4.10% |
Since inception returns are from 9/25/09. Past performance is not predictive of future results. Current performance may be higher or lower than the data shown. Returns do not reflect the deduction of taxes that shareholders may have to pay on Fund distributions or upon the sale of Fund shares. Returns at NAV are net of Fund expenses, and assume reinvestment of distributions. Comparative index return information is provided for the Fund’s shares at NAV only. Indexes are not available for direct investment.
Common Share Price Performance — Weekly Closing Price
18
This data relates to the securities held in the Fund’s portfolio of investments as of the end of the reporting period. It should not be construed as a measure of performance for the Fund itself. Holdings are subject to change.
For financial reporting purposes, the ratings disclosed are the highest rating given by one of the following national rating agencies: Standard & Poor’s Group, Moody’s Investors Service, Inc. or Fitch, Inc. This treatment of split-rated securities may differ from that used for other purposes, such as for Fund investment policies. Credit ratings are subject to change. AAA, AA, A and BBB are investment grade ratings; BB, B, CCC, CC, C and D are below-investment grade ratings. Holdings designated N/R are not rated by these national rating agencies.
| | |
Fund Allocation | |
(% of net assets) | |
| Long-Term Municipal Bonds | 124.0% |
| Other Assets Less Liabilities | 4.0% |
Net Assets Plus Floating Rate | |
Obligations | 128.0% |
| Floating Rate Obligations | (28.0)% |
Net Assets | 100% |
| | |
Portfolio Credit Quality | |
(% of total investment exposure) | |
| U.S. Guaranteed | 14.2% |
| AAA | 3.1% |
| AA | 24.4% |
| A | 19.8% |
| BBB | 19.7% |
| BB or Lower | 11.8% |
| N/R (not rated) | 7.0% |
Total | 100% |
| | |
Portfolio Composition | |
(% of total investments) | |
| Tax Obligation/Limited | 23.6% |
| Health Care | 15.5% |
| Transportation | 13.6% |
| Tax Obligation/General | 11.6% |
| U.S. Guaranteed | 9.2% |
| Education and Civic Organizations | 6.8% |
| Utilities | 6.3% |
| Other | 13.4% |
Total | 100% |
| | |
States and Territories | |
(% of total municipal bonds) | |
| Illinois | 16.6% |
| New Jersey | 8.8% |
| California | 8.1% |
| Ohio | 7.9% |
| Wisconsin | 7.8% |
| Pennsylvania | 6.6% |
| Louisiana | 4.8% |
| Florida | 4.8% |
| Guam | 4.7% |
| New York | 3.6% |
| Washington | 3.4% |
| Georgia | 3.2% |
| Other | 19.7% |
Total | 100% |
19
| | |
NUV | Nuveen Municipal Value Fund, Inc. |
| | Portfolio of Investments |
| | April 30, 2019 (Unaudited) |
| | | | | | |
Principal | | | Optional Call | | |
Amount (000) | | Description (1) | Provisions (2) | Ratings (3) | Value |
| | | LONG-TERM INVESTMENTS – 100.0% | | | |
| | | MUNICIPAL BONDS – 100.0% | | | |
| | | Alabama – 0.1% | | | |
| | | Tuscaloosa County Industrial Development Authority, Alabama, Gulf Opportunity Zone | | | |
| | | Bonds, Hunt Refining Project, Refunding Series 2019A: | | | |
| $ 1,140 | | 4.500%, 5/01/32, 144A (WI/DD, Settling 5/16/19) | 5/29 at 100.00 | N/R | $ 1,203,179 |
| 1,015 | | 5.250%, 5/01/44, 144A (WI/DD, Settling 5/16/19) | 5/29 at 100.00 | N/R | 1,089,024 |
| 2,155 | | Total Alabama | | | 2,292,203 |
| | | Alaska – 0.1% | | | |
| 2,710 | | Northern Tobacco Securitization Corporation, Alaska, Tobacco Settlement Asset-Backed | 5/19 at 100.00 | B3 | 2,709,892 |
| | | Bonds, Series 2006A, 5.000%, 6/01/32 | | | |
| | | Arizona – 0.9% | | | |
| 2,935 | | Phoenix Civic Improvement Corporation, Arizona, Airport Revenue Bonds, Senior Lien | 7/27 at 100.00 | AA– | 3,483,757 |
| | | Series 2017A, 5.000%, 7/01/35 | | | |
| 5,600 | | Salt Verde Financial Corporation, Arizona, Senior Gas Revenue Bonds, Citigroup Energy | No Opt. Call | A3 | 7,061,712 |
| | | Inc. Prepay Contract Obligations, Series 2007, 5.000%, 12/01/37 | | | |
| 4,240 | | Scottsdale Industrial Development Authority, Arizona, Hospital Revenue Bonds, Scottsdale | 9/20 at 100.00 | AA | 4,407,904 |
| | | Healthcare, Series 2006C Re-offering, 5.000%, 9/01/35 – AGM Insured | | | |
| | | Tucson, Arizona, Water System Revenue Bonds, Refunding Series 2017: | | | |
| 1,000 | | 5.000%, 7/01/32 | 7/27 at 100.00 | AA | 1,204,780 |
| 1,410 | | 5.000%, 7/01/33 | 7/27 at 100.00 | AA | 1,690,209 |
| 1,000 | | 5.000%, 7/01/34 | 7/27 at 100.00 | AA | 1,195,110 |
| 750 | | 5.000%, 7/01/35 | 7/27 at 100.00 | AA | 893,895 |
| 16,935 | | Total Arizona | | | 19,937,367 |
| | | California – 9.1% | | | |
| 4,615 | | Anaheim Public Financing Authority, California, Lease Revenue Bonds, Public Improvement | No Opt. Call | AA | 4,220,925 |
| | | Project, Series 1997C, 0.000%, 9/01/23 – AGM Insured | | | |
| 5,000 | | Bay Area Toll Authority, California, Revenue Bonds, San Francisco Bay Area Toll Bridge, | 4/23 at 100.00 | AA– (4) | 5,679,050 |
| | | Series 2013S-4, 5.000%, 4/01/38 (Pre-refunded 4/01/23) | | | |
| 4,245 | | California County Tobacco Securitization Agency, Tobacco Settlement Asset-Backed Bonds, | 5/19 at 44.63 | CCC | 1,906,387 |
| | | Gold Country Settlement Funding Corporation, Refunding Series 2006, 0.000%, 6/01/33 | | | |
| | | California County Tobacco Securitization Agency, Tobacco Settlement Asset-Backed Bonds, | | | |
| | | Los Angeles County Securitization Corporation, Series 2006A: | | | |
| 3,275 | | 5.450%, 6/01/28 (5) | 5/19 at 100.00 | B2 | 3,332,738 |
| 4,200 | | 5.600%, 6/01/36 (5) | 5/19 at 100.00 | B2 | 4,202,898 |
| 1,175 | | California Department of Water Resources, Central Valley Project Water System Revenue | 12/26 at 100.00 | AAA | 1,423,360 |
| | | Bonds, Refunding Series 2016AW, 5.000%, 12/01/33 | | | |
| 10,000 | | California Health Facilities Financing Authority, California, Revenue Bonds, Sutter | 11/26 at 100.00 | AA– | 11,492,600 |
| | | Health, Refunding Series 2016B, 5.000%, 11/15/46 | | | |
| 1,200 | | California Health Facilities Financing Authority, Revenue Bonds, Children’s Hospital Los | 8/27 at 100.00 | BBB+ | 1,380,108 |
| | | Angeles, Series 2017A, 5.000%, 8/15/37 | | | |
| 3,850 | | California Health Facilities Financing Authority, Revenue Bonds, Saint Joseph Health | 7/23 at 100.00 | AA– | 4,312,924 |
| | | System, Series 2013A, 5.000%, 7/01/33 | | | |
| 2,335 | | California Municipal Finance Authority, Revenue Bonds, Eisenhower Medical Center, | 7/20 at 100.00 | Baa2 (4) | 2,448,458 |
| | | Series 2010A, 5.750%, 7/01/40 (Pre-refunded 7/01/20) | | | |
| 6,130 | | California Municipal Finance Authority, Revenue Bonds, Linxs APM Project, Senior Lien | 6/28 at 100.00 | BBB+ | 7,003,648 |
| | | Series 2018A, 5.000%, 12/31/43 (AMT) | | | |
20
| | | | | | |
Principal | | | Optional Call | | |
Amount (000) | | Description (1) | Provisions (2) | Ratings (3) | Value |
| | | California (continued) | | | |
| $ 2,725 | | California Pollution Control Financing Authority, Water Furnishing Revenue Bonds, San | 1/29 at 100.00 | Baa3 | $ 3,137,183 |
| | | Diego County Water Authority Desalination Project Pipeline, Refunding Series 2019, 5.000%, | | | |
| | | 11/21/45, 144A | | | |
| 1,625 | | California State Public Works Board, Lease Revenue Bonds, Various Capital Projects, | 11/23 at 100.00 | A+ | 1,802,791 |
| | | Series 2013I, 5.000%, 11/01/38 | | | |
| 5,000 | | California State, General Obligation Bonds, Various Purpose Series 2011, 5.000%, 10/01/41 | 10/21 at 100.00 | AA– | 5,375,450 |
| 3,500 | | California Statewide Communities Development Authority, California, Revenue Bonds, Loma | 6/26 at 100.00 | BB | 3,805,900 |
| | | Linda University Medical Center, Series 2016A, 5.000%, 12/01/46, 144A | | | |
| 3,125 | | California Statewide Community Development Authority, Revenue Bonds, Methodist Hospital | 8/19 at 100.00 | N/R (4) | 3,165,281 |
| | | Project, Series 2009, 6.750%, 2/01/38 (Pre-refunded 8/01/19) | | | |
| 4,505 | | Covina-Valley Unified School District, Los Angeles County, California, General | No Opt. Call | A+ | 3,589,629 |
| | | Obligation Bonds, Series 2003B, 0.000%, 6/01/28 – FGIC Insured | | | |
| 5,700 | | East Bay Municipal Utility District, Alameda and Contra Costa Counties, California, | 6/27 at 100.00 | AAA | 6,752,790 |
| | | Water System Revenue Bonds, Green Series 2017A, 5.000%, 6/01/45 | | | |
| 2,180 | | Foothill/Eastern Transportation Corridor Agency, California, Toll Road Revenue Bonds, | 1/31 at 100.00 | A– | 2,129,991 |
| | | Refunding Series 2013A, 6.850%, 1/15/42 (5) | | | |
| 30,000 | | Foothill/Eastern Transportation Corridor Agency, California, Toll Road Revenue Bonds, | No Opt. Call | AA+ (4) | 28,783,500 |
| | | Series 1995A, 0.000%, 1/01/22 (ETM) | | | |
| 14,100 | | Golden State Tobacco Securitization Corporation, California, Tobacco Settlement | 6/22 at 100.00 | N/R | 14,194,893 |
| | | Asset-Backed Bonds, Series 2018A-1, 5.250%, 6/01/47 | | | |
| | | Merced Union High School District, Merced County, California, General Obligation Bonds, | | | |
| | | Series 1999A: | | | |
| 2,500 | | 0.000%, 8/01/23 – FGIC Insured | No Opt. Call | AA– | 2,305,200 |
| 2,555 | | 0.000%, 8/01/24 – FGIC Insured | No Opt. Call | AA– | 2,303,077 |
| 2,365 | | Montebello Unified School District, Los Angeles County, California, General Obligation | No Opt. Call | A– | 1,886,513 |
| | | Bonds, Election 1998 Series 2004, 0.000%, 8/01/27 – FGIC Insured | | | |
| | | Mount San Antonio Community College District, Los Angeles County, California, General | | | |
| | | Obligation Bonds, Election of 2008, Series 2013A: | | | |
| 3,060 | | 0.000%, 8/01/28 (5) | 2/28 at 100.00 | Aa1 | 3,178,728 |
| 2,315 | | 6.250%, 8/01/43 (5) | 8/35 at 100.00 | Aa1 | 2,103,733 |
| 3,550 | | M-S-R Energy Authority, California, Gas Revenue Bonds, Citigroup Prepay Contracts, | No Opt. Call | A | 5,238,486 |
| | | Series 2009C, 6.500%, 11/01/39 | | | |
| 2,350 | | Palomar Pomerado Health Care District, California, Certificates of Participation, | 11/19 at 100.00 | N/R (4) | 2,410,419 |
| | | Series 2009, 6.750%, 11/01/39 (Pre-refunded 11/01/19) | | | |
| 10,150 | | Placer Union High School District, Placer County, California, General Obligation Bonds, | No Opt. Call | AA | 6,699,000 |
| | | Series 2004C, 0.000%, 8/01/33 – AGM Insured | | | |
| | | San Bruno Park School District, San Mateo County, California, General Obligation Bonds, | | | |
| | | Series 2000B: | | | |
| 2,575 | | 0.000%, 8/01/24 – FGIC Insured | No Opt. Call | Aa3 | 2,315,080 |
| 2,660 | | 0.000%, 8/01/25 – FGIC Insured | No Opt. Call | Aa3 | 2,327,766 |
| 490 | | San Diego Tobacco Settlement Revenue Funding Corporation, California, Tobacco Settlement | 6/28 at 100.00 | BBB | 500,084 |
| | | Bonds, Subordinate Series 2018C, 4.000%, 6/01/32 | | | |
| 10,000 | | San Francisco Airports Commission, California, Revenue Bonds, San Francisco | 5/29 at 100.00 | A+ | 12,096,000 |
| | | International Airport, Refunding Second Series 2019D, 5.000%, 5/01/39 | | | |
| 250 | | San Francisco Redevelopment Financing Authority, California, Tax Allocation Revenue | 2/21 at 100.00 | BBB+ (4) | 273,938 |
| | | Bonds, Mission Bay South Redevelopment Project, Series 2011D, 7.000%, 8/01/41 | | | |
| | | (Pre-refunded 2/01/21) | | | |
| 12,095 | | San Joaquin Hills Transportation Corridor Agency, Orange County, California, Toll Road | No Opt. Call | Baa2 | 10,332,758 |
| | | Revenue Bonds, Refunding Series 1997A, 0.000%, 1/15/25 – NPFG Insured | | | |
| 13,220 | | San Mateo County Community College District, California, General Obligation Bonds, | No Opt. Call | AAA | 10,780,910 |
| | | Series 2006A, 0.000%, 9/01/28 – NPFG Insured | | | |
| 5,000 | | San Mateo Union High School District, San Mateo County, California, General Obligation | No Opt. Call | Aaa | 4,513,300 |
| | | Bonds, Election of 2000, Series 2002B, 0.000%, 9/01/24 – FGIC Insured | | | |
21
| | |
NUV | Nuveen Municipal Value Fund, Inc. |
| | Portfolio of Investments (continued) |
| | April 30, 2019 (Unaudited) |
| | | | | | |
Principal | | | Optional Call | | |
Amount (000) | | Description (1) | Provisions (2) | Ratings (3) | Value |
| | | California (continued) | | | |
| $ 5,815 | | San Ysidro School District, San Diego County, California, General Obligation Bonds, | 8/25 at 29.16 | AA | $ 1,377,399 |
| | | Refunding Series 2015, 0.000%, 8/01/48 | | | |
| 2,000 | | Tobacco Securitization Authority of Northern California, Tobacco Settlement Asset-Backed | 5/19 at 100.00 | BB– | 2,009,940 |
| | | Bonds, Refunding Series 2005A-2, 5.400%, 6/01/27 | | | |
| 201,435 | | Total California | | | 192,792,835 |
| | | Colorado – 7.2% | | | |
| 7,500 | | Arapahoe County School District 6, Littleton, Colorado, General Obligation Bonds, | 12/28 at 100.00 | Aa1 | 9,354,000 |
| | | Series 2019A, 5.500%, 12/01/43 | | | |
| 5,200 | | Colorado Health Facilities Authority, Colorado, Revenue Bonds, Catholic Health | 6/19 at 100.00 | BBB+ | 5,208,476 |
| | | Initiatives, Series 2006A, 4.500%, 9/01/38 | | | |
| 7,105 | | Colorado Health Facilities Authority, Colorado, Revenue Bonds, Catholic Health | 1/23 at 100.00 | BBB+ | 7,639,793 |
| | | Initiatives, Series 2013A, 5.250%, 1/01/45 | | | |
| 2,845 | | Colorado Health Facilities Authority, Colorado, Revenue Bonds, Sisters of Charity of | 1/20 at 100.00 | AA– | 2,906,452 |
| | | Leavenworth Health Services Corporation, Refunding Composite Deal Series 2010B, | | | |
| | | 5.000%, 1/01/21 | | | |
| 15,925 | | Colorado Health Facilities Authority, Colorado, Revenue Bonds, Sisters of Charity of | 1/20 at 100.00 | AA– | 16,217,861 |
| | | Leavenworth Health Services Corporation, Series 2010A, 5.000%, 1/01/40 | | | |
| 1,255 | | Colorado High Performance Transportation Enterprise, C-470 Express Lanes Revenue Bonds, | 12/24 at 100.00 | BBB | 1,359,617 |
| | | Senior Lien Series 2017, 5.000%, 12/31/51 | | | |
| 2,000 | | Colorado State Board of Governors, Colorado State University Auxiliary Enterprise System | 3/22 at 100.00 | AA (4) | 2,188,580 |
| | | Revenue Bonds, Series 2012A, 5.000%, 3/01/41 (Pre-refunded 3/01/22) | | | |
| 4,500 | | Colorado State, Building Excellent Schools Today, Certificates of Participation, Series | 3/28 at 100.00 | Aa2 | 5,347,305 |
| | | 2018N, 5.000%, 3/15/37 | | | |
| | | Colorado State, Certificates of Participation, Lease Purchase Financing Program, | | | |
| | | National Western Center, Series 2018A: | | | |
| 1,250 | | 5.000%, 9/01/30 | 3/28 at 100.00 | Aa2 | 1,523,225 |
| 2,000 | | 5.000%, 9/01/31 | 3/28 at 100.00 | Aa2 | 2,425,720 |
| 1,260 | | 5.000%, 9/01/32 | 3/28 at 100.00 | Aa2 | 1,521,702 |
| 620 | | 5.000%, 9/01/33 | 3/28 at 100.00 | Aa2 | 746,387 |
| 3,790 | | Colorado State, Certificates of Participation, Rural Series 2018A, 5.000%, 12/15/37 | 12/28 at 100.00 | Aa2 | 4,557,134 |
| | | Denver City and County, Colorado, Airport System Revenue Bonds, Series 2012B: | | | |
| 2,750 | | 5.000%, 11/15/25 | 11/22 at 100.00 | AA– | 3,051,427 |
| 2,200 | | 5.000%, 11/15/29 | 11/22 at 100.00 | AA– | 2,422,860 |
| 5,160 | | Denver City and County, Colorado, Airport System Revenue Bonds, Subordinate Lien | 11/23 at 100.00 | A+ | 5,703,400 |
| | | Series 2013B, 5.000%, 11/15/43 | | | |
| 2,000 | | Denver Convention Center Hotel Authority, Colorado, Revenue Bonds, Convention Center | 12/26 at 100.00 | Baa2 | 2,275,180 |
| | | Hotel, Refunding Senior Lien Series 2016, 5.000%, 12/01/35 | | | |
| | | E-470 Public Highway Authority, Colorado, Senior Revenue Bonds, Series 2000B: | | | |
| 9,660 | | 0.000%, 9/01/29 – NPFG Insured | No Opt. Call | A | 7,156,611 |
| 24,200 | | 0.000%, 9/01/31 – NPFG Insured | No Opt. Call | A | 16,361,136 |
| 17,000 | | 0.000%, 9/01/32 – NPFG Insured | No Opt. Call | A | 10,991,860 |
| 7,600 | | E-470 Public Highway Authority, Colorado, Toll Revenue Bonds, Refunding Series 2006B, | 9/26 at 52.09 | A | 3,048,816 |
| | | 0.000%, 9/01/39 – NPFG Insured | | | |
| | | E-470 Public Highway Authority, Colorado, Toll Revenue Bonds, Series 2004B: | | | |
| 7,700 | | 0.000%, 9/01/27 – NPFG Insured | 9/20 at 67.94 | A | 5,063,982 |
| 10,075 | | 0.000%, 3/01/36 – NPFG Insured | 9/20 at 41.72 | A | 4,038,161 |
| 8,000 | | Public Authority for Colorado Energy, Natural Gas Purchase Revenue Bonds, Colorado | No Opt. Call | A+ | 11,934,000 |
| | | Springs Utilities, Series 2008, 6.500%, 11/15/38 | | | |
| 5,000 | | Rangely Hospital District, Rio Blanco County, Colorado, General Obligation Bonds, | 11/21 at 100.00 | Baa3 | 5,405,000 |
| | | Refunding Series 2011, 6.000%, 11/01/26 | | | |
| 3,750 | | Regional Transportation District, Colorado, Denver Transit Partners Eagle P3 Project | 7/20 at 100.00 | BBB+ | 3,892,575 |
| | | Private Activity Bonds, Series 2010, 6.000%, 1/15/41 | | | |
22
| | | | | | |
Principal | | | Optional Call | | |
Amount (000) | | Description (1) | Provisions (2) | Ratings (3) | Value |
| | | Colorado (continued) | | | |
| $ 4,945 | | Regional Transportation District, Colorado, Sales Tax Revenue Bonds, Fastracks Project, | 11/26 at 100.00 | AA+ | $ 5,771,507 |
| | | Series 2017A, 5.000%, 11/01/40 | | | |
| 4,250 | | University of Colorado, Enterprise System Revenue Bonds, Series 2018B, 5.000%, 6/01/43 | 6/28 at 100.00 | Aa1 | 5,067,232 |
| 169,540 | | Total Colorado | | | 153,179,999 |
| | | Connecticut – 0.8% | | | |
| 1,500 | | Connecticut Health and Educational Facilities Authority, Revenue Bonds, Hartford | 7/21 at 100.00 | A | 1,571,505 |
| | | HealthCare, Series 2011A, 5.000%, 7/01/41 | | | |
| 8,440 | | Connecticut State, General Obligation Bonds, Series 2015E, 5.000%, 8/01/29 | 8/25 at 100.00 | A1 | 9,702,033 |
| 5,000 | | Connecticut State, General Obligation Bonds, Series 2015F, 5.000%, 11/15/33 | 11/25 at 100.00 | A1 | 5,694,100 |
| 9,898 | | Mashantucket Western Pequot Tribe, Connecticut, Special Revenue Bonds, Subordinate | No Opt. Call | N/R | 338,992 |
| | | Series 2013A, 0.190%, 7/01/31 (cash 4.000%, PIK 2.050%) | | | |
| 24,838 | | Total Connecticut | | | 17,306,630 |
| | | District of Columbia – 0.4% | | | |
| 15,000 | | District of Columbia Tobacco Settlement Corporation, Tobacco Settlement Asset-Backed | 6/19 at 18.94 | N/R | 2,315,250 |
| | | Bonds, Series 2006A, 0.000%, 6/15/46 | | | |
| 5,390 | | District of Columbia Water and Sewer Authority, Public Utility Revenue Bonds, Senior | 4/28 at 100.00 | AAA | 6,384,671 |
| | | Lien Series 2018B, 5.000%, 10/01/43 | | | |
| 20,390 | | Total District of Columbia | | | 8,699,921 |
| | | Florida – 5.1% | | | |
| 3,000 | | Cape Coral, Florida, Water and Sewer Revenue Bonds, Refunding Series 2011, 5.000%, | 10/21 at 100.00 | AA (4) | 3,244,260 |
| | | 10/01/41 – AGM Insured (Pre-refunded 10/01/21) | | | |
| 565 | | Florida Development Finance Corporation, Educational Facilities Revenue Bonds, | 6/25 at 100.00 | N/R | 604,256 |
| | | Renaissance Charter School Income Projects, Series 2015A, 6.000%, 6/15/35, 144A | | | |
| | | Florida, Development Finance Corporation, Surface Transportation Facility Revenue Bonds, | | | |
| | | Virgin Trains USA Passenger Rail Project , Series 2019A: | | | |
| 3,400 | | 6.250%, 1/01/49, 144A (AMT) (Mandatory Put 1/01/24) | 1/20 at 104.00 | N/R | 3,479,220 |
| 3,400 | | 6.375%, 1/01/49, 144A (AMT) (Mandatory Put 1/01/26) | 1/20 at 105.00 | N/R | 3,492,582 |
| 3,400 | | 6.500%, 1/01/49, 144A (AMT) (Mandatory Put 1/01/29) | 1/20 at 105.00 | N/R | 3,486,802 |
| 4,000 | | Gainesville, Florida, Utilities System Revenue Bonds, Series 2017A, 5.000%, 10/01/37 | 10/27 at 100.00 | AA– | 4,764,680 |
| 3,500 | | Gainesville, Florida, Utilities System Revenue Bonds, Series 2019A, 5.000%, 10/01/44 | 10/29 at 100.00 | AA– | 4,205,600 |
| 2,845 | | Greater Orlando Aviation Authority, Florida, Airport Facilities Revenue Bonds, Refunding | 10/19 at 100.00 | AA– (4) | 2,885,769 |
| | | Series 2009C, 5.000%, 10/01/34 (Pre-refunded 10/01/19) | | | |
| 2,290 | | Hillsborough County Aviation Authority, Florida, Revenue Bonds, Tampa International | 10/24 at 100.00 | A+ | 2,582,777 |
| | | Airport, Subordinate Lien Series 2015B, 5.000%, 10/01/40 | | | |
| 5,090 | | Miami-Dade County Expressway Authority, Florida, Toll System Revenue Bonds, | 7/20 at 100.00 | A+ | 5,264,638 |
| | | Series 2010A, 5.000%, 7/01/40 | | | |
| 9,500 | | Miami-Dade County Health Facility Authority, Florida, Hospital Revenue Bonds, Miami | 8/21 at 100.00 | A+ (4) | 10,407,725 |
| | | Children’s Hospital, Series 2010A, 6.000%, 8/01/46 (Pre-refunded 8/01/21) | | | |
| 2,000 | | Miami-Dade County, Florida, Aviation Revenue Bonds, Miami International Airport, | 10/24 at 100.00 | A | 2,260,040 |
| | | Refunding Series 2014B, 5.000%, 10/01/37 | | | |
| 6,000 | | Miami-Dade County, Florida, Aviation Revenue Bonds, Miami International Airport, | 10/19 at 100.00 | A (4) | 6,097,020 |
| | | Series 2009B, 5.500%, 10/01/36 (Pre-refunded 10/01/19) | | | |
| 4,000 | | Miami-Dade County, Florida, Aviation Revenue Bonds, Miami International Airport, | 10/20 at 100.00 | A | 4,171,560 |
| | | Series 2010B, 5.000%, 10/01/29 | | | |
| 4,000 | | Miami-Dade County, Florida, Transit System Sales Surtax Revenue Bonds, Refunding | 7/22 at 100.00 | AA | 4,326,400 |
| | | Series 2012, 5.000%, 7/01/42 | | | |
| 9,590 | | Miami-Dade County, Florida, Water and Sewer System Revenue Bonds, Series 2010, | 10/20 at 100.00 | AA (4)�� | 10,043,895 |
| | | 5.000%, 10/01/39 – AGM Insured (Pre-refunded 10/01/20) | | | |
23
| | |
NUV | Nuveen Municipal Value Fund, Inc. |
| | Portfolio of Investments (continued) |
| | April 30, 2019 (Unaudited) |
| | | | | | |
Principal | | | Optional Call | | |
Amount (000) | | Description (1) | Provisions (2) | Ratings (3) | Value |
| | | Florida (continued) | | | |
| | | Orlando Utilities Commission, Florida, Utility System Revenue Bonds, Series 2018A: | | | |
| $ 3,500 | | 5.000%, 10/01/36 | 10/27 at 100.00 | AA | $ 4,179,175 |
| 3,780 | | 5.000%, 10/01/37 | 10/27 at 100.00 | AA | 4,496,310 |
| 1,120 | | 5.000%, 10/01/38 | 10/27 at 100.00 | AA | 1,328,914 |
| 10,725 | | Orlando, Florida, Contract Tourist Development Tax Payments Revenue Bonds, Series 2014A, | 5/24 at 100.00 | AA+ (4) | 12,413,758 |
| | | 5.000%, 11/01/44 (Pre-refunded 5/01/24) | | | |
| 3,250 | | Palm Beach County Health Facilities Authority, Florida, Revenue Bonds, Jupiter Medical | 11/22 at 100.00 | BBB+ | 3,426,540 |
| | | Center, Series 2013A, 5.000%, 11/01/43 | | | |
| 1,020 | | Putnam County Development Authority, Florida, Pollution Control Revenue Bonds, Seminole | 5/28 at 100.00 | A– | 1,171,541 |
| | | Electric Cooperative, Inc. Project, Refunding Series 2018B, 5.000%, 3/15/42 | | | |
| 6,865 | | South Broward Hospital District, Florida, Hospital Revenue Bonds, Refunding Series 2015, | 5/25 at 100.00 | AA | 7,285,069 |
| | | 4.000%, 5/01/34 | | | |
| 3,300 | | Tampa, Florida, Health System Revenue Bonds, Baycare Health System, Series 2012A, | 5/22 at 100.00 | Aa2 | 3,577,761 |
| | | 5.000%, 11/15/33 | | | |
| 100,140 | | Total Florida | | | 109,196,292 |
| | | Georgia – 1.2% | | | |
| 3,325 | | Atlanta, Georgia, Water and Wastewater Revenue Bonds, Refunding Series 2015, | 5/25 at 100.00 | Aa2 | 3,795,687 |
| | | 5.000%, 11/01/40 | | | |
| 2,290 | | Fulton County Development Authority, Georgia, Hospital Revenue Bonds, Wellstar Health | 4/27 at 100.00 | A | 2,600,867 |
| | | System, Inc. Project, Series 2017A, 5.000%, 4/01/47 | | | |
| 6,000 | | Gainesville and Hall County Hospital Authority, Georgia, Revenue Anticipation | 2/27 at 100.00 | AA | 7,198,500 |
| | | Certificates, Northeast Georgia Health Services Inc., Series 2017B, 5.500%, 2/15/42 | | | |
| 5,865 | | Municipal Electric Authority of Georgia, General Resolution Projects Subordinated Bonds, | 1/28 at 100.00 | A1 | 6,590,618 |
| | | Series 20188HH, 5.000%, 1/01/44 | | | |
| 2,415 | | Municipal Electric Authority of Georgia, Project One Revenue Bonds, Subordinate Lien | 1/25 at 100.00 | A2 | 2,659,809 |
| | | Series 2015A, 5.000%, 1/01/35 | | | |
| 2,000 | | Private Colleges and Universities Authority, Georgia, Revenue Bonds, Emory University, | 10/26 at 100.00 | AA+ | 2,327,860 |
| | | Refunding Series 2016A, 5.000%, 10/01/46 | | | |
| 21,895 | | Total Georgia | | | 25,173,341 |
| | | Guam – 0.0% | | | |
| 330 | | Guam International Airport Authority, Revenue Bonds, Series 2013C, 6.375%, 10/01/43 (AMT) | 10/23 at 100.00 | BBB+ | 380,870 |
| | | Hawaii – 0.4% | | | |
| 4,830 | | Honolulu City and County, Hawaii, General Obligation Bonds, Series 2018A, | 9/28 at 100.00 | Aa1 | 5,765,233 |
| | | 5.000%, 9/01/40 | | | |
| 3,000 | | Honolulu City and County, Hawaii, Wastewater System Revenue Bonds, First Bond | 1/28 at 100.00 | Aa2 | 3,567,960 |
| | | Resolution, Senior Series 2018A, 5.000%, 7/01/37 | | | |
| 7,830 | | Total Hawaii | | | 9,333,193 |
| | | Illinois – 12.9% | | | |
| 5,000 | | Chicago Board of Education, Illinois, Dedicated Capital Improvement Tax Revenue Bonds, | 4/27 at 100.00 | A | 5,793,700 |
| | | Series 2016, 6.000%, 4/01/46 | | | |
| 5,000 | | Chicago Board of Education, Illinois, General Obligation Bonds, Dedicated Revenues, | 12/25 at 100.00 | BB– | 5,853,850 |
| | | Series 2016A, 7.000%, 12/01/44 | | | |
| 2,945 | | Chicago Board of Education, Illinois, General Obligation Bonds, Dedicated Revenues, | 12/26 at 100.00 | BB– | 3,387,987 |
| | | Series 2016B, 6.500%, 12/01/46 | | | |
| 4,710 | | Chicago Board of Education, Illinois, General Obligation Bonds, Dedicated Revenues, | 12/27 at 100.00 | B+ | 5,709,933 |
| | | Series 2017A, 7.000%, 12/01/46, 144A | | | |
| 17,725 | | Chicago Board of Education, Illinois, Unlimited Tax General Obligation Bonds, Dedicated | No Opt. Call | Baa2 | 14,663,183 |
| | | Tax Revenues, Series 1998B-1, 0.000%, 12/01/24 – FGIC Insured | | | |
| 7,495 | | Chicago Board of Education, Illinois, Unlimited Tax General Obligation Bonds, Dedicated | No Opt. Call | Baa2 | 4,502,172 |
| | | Tax Revenues, Series 1999A, 0.000%, 12/01/31 – NPFG Insured | | | |
24
| | | | | | |
Principal | | | Optional Call | | |
Amount (000) | | Description (1) | Provisions (2) | Ratings (3) | Value |
| | | Illinois (continued) | | | |
| $ 1,500 | | Chicago Park District, Illinois, General Obligation Bonds, Limited Tax Series 2011A, | 1/22 at 100.00 | AA+ | $ 1,562,895 |
| | | 5.000%, 1/01/36 | | | |
| | | Chicago, Illinois, General Obligation Bonds, Project & Refunding Series 2006A: | | | |
| 1,195 | | 4.750%, 1/01/30 – AGM Insured | 6/19 at 100.00 | AA | 1,197,438 |
| 2,175 | | 4.625%, 1/01/31 – AGM Insured | 6/19 at 100.00 | AA | 2,179,154 |
| 5,000 | | Chicago, Illinois, Motor Fuel Tax Revenue Bonds, Series 2008A, 5.000%, 1/01/38 – | 6/19 at 100.00 | AA | 5,012,000 |
| | | AGC Insured | | | |
| 3,320 | | Cook and DuPage Counties Combined School District 113A Lemont, Illinois, General | No Opt. Call | AA | 3,218,010 |
| | | Obligation Bonds, Series 2002, 0.000%, 12/01/20 – FGIC Insured | | | |
| 8,875 | | Cook County, Illinois, General Obligation Bonds, Refunding Series 2010A, 5.250%, 11/15/33 | 11/20 at 100.00 | AA– | 9,232,307 |
| 1,000 | | Cook County, Illinois, General Obligation Bonds, Refunding Series 2018, 5.000%, 11/15/35 | 11/26 at 100.00 | AA– | 1,113,300 |
| 3,260 | | Cook County, Illinois, Recovery Zone Facility Revenue Bonds, Navistar International | 10/20 at 100.00 | BB | 3,388,346 |
| | | Corporation Project, Series 2010, 6.750%, 10/15/40 | | | |
| 5,000 | | Cook County, Illinois, Sales Tax Revenue Bonds, Series 2012, 5.000%, 11/15/37 | 11/22 at 100.00 | AA | 5,337,550 |
| 3,000 | | Illinois Finance Authority, Revenue Bonds, Central DuPage Health, Series 2009, 5.250%, | 11/19 at 100.00 | N/R (4) | 3,053,850 |
| | | 11/01/39 (Pre-refunded 11/01/19) | | | |
| 1,875 | | Illinois Finance Authority, Revenue Bonds, Central DuPage Health, Series 2009B, 5.500%, | 11/19 at 100.00 | N/R (4) | 1,910,981 |
| | | 11/01/39 (Pre-refunded 11/01/19) | | | |
| | | Illinois Finance Authority, Revenue Bonds, OSF Healthcare System, Refunding Series 2010A: | | | |
| 510 | | 6.000%, 5/15/39 | 5/20 at 100.00 | A | 523,586 |
| 3,110 | | 6.000%, 5/15/39 (Pre-refunded 5/15/20) | 5/20 at 100.00 | N/R (4) | 3,247,058 |
| | | Illinois Finance Authority, Revenue Bonds, Provena Health, Series 2009A: | | | |
| 45 | | 7.750%, 8/15/34 (Pre-refunded 8/15/19) | 8/19 at 100.00 | N/R (4) | 45,777 |
| 4,755 | | 7.750%, 8/15/34 (Pre-refunded 8/15/19) | 8/19 at 100.00 | N/R (4) | 4,837,071 |
| 5,000 | | Illinois Finance Authority, Revenue Bonds, Rush University Medical Center Obligated | 5/25 at 100.00 | AA– | 5,510,600 |
| | | Group, Series 2015A, 5.000%, 11/15/38 | | | |
| | | Illinois Finance Authority, Revenue Bonds, Silver Cross Hospital and Medical Centers, | | | |
| | | Refunding Series 2015C: | | | |
| 560 | | 5.000%, 8/15/35 | 8/25 at 100.00 | Baa1 | 622,916 |
| 825 | | 5.000%, 8/15/44 | 8/25 at 100.00 | Baa1 | 904,579 |
| 2,500 | | Illinois Finance Authority, Revenue Bonds, The University of Chicago Medical Center, | 2/21 at 100.00 | AA– (4) | 2,666,375 |
| | | Series 2011C, 5.500%, 8/15/41 (Pre-refunded 2/15/21) | | | |
| 3,000 | | Illinois Finance Authority, Revenue Bonds, University of Chicago, Series 2012A, | 10/21 at 100.00 | AA+ | 3,170,430 |
| | | 5.000%, 10/01/51 | | | |
| 3,750 | | Illinois Sports Facility Authority, State Tax Supported Bonds, Series 2001, 5.500%, | 5/19 at 100.00 | BBB– | 3,759,900 |
| | | 6/15/30 – AMBAC Insured | | | |
| 5,125 | | Illinois State, General Obligation Bonds, January Series 2016, 5.000%, 1/01/28 | 1/26 at 100.00 | BBB | 5,580,664 |
| 1,755 | | Illinois State, General Obligation Bonds, October Series 2016, 5.000%, 2/01/29 | 2/27 at 100.00 | BBB | 1,920,637 |
| 655 | | Illinois State, General Obligation Bonds, Refunding Series 2012, 5.000%, 8/01/25 | 8/22 at 100.00 | BBB | 689,879 |
| 5,590 | | Illinois Toll Highway Authority, Toll Highway Revenue Bonds, Senior Lien Series 2013A, | 1/23 at 100.00 | AA– | 6,088,740 |
| | | 5.000%, 1/01/38 | | | |
| 4,000 | | Illinois Toll Highway Authority, Toll Highway Revenue Bonds, Senior Lien Series 2016B, | 7/26 at 100.00 | AA– | 4,544,920 |
| | | 5.000%, 1/01/41 | | | |
| 5,000 | | Lombard Public Facilities Corporation, Illinois, Conference Center and Hotel Revenue | 6/19 at 100.00 | N/R | 4,626,150 |
| | | Bonds, First Tier Series 2005A-2, 5.500%, 1/01/36 | | | |
| 16,800 | | Metropolitan Pier and Exposition Authority, Illinois, Revenue Bonds, McCormick Place | No Opt. Call | Baa2 | 15,717,576 |
| | | Expansion Project, Refunding Series 1996A, 0.000%, 12/15/21 – NPFG Insured | | | |
| | | Metropolitan Pier and Exposition Authority, Illinois, Revenue Bonds, McCormick Place | | | |
| | | Expansion Project, Refunding Series 2002B: | | | |
| 495 | | 5.500%, 6/15/20 | 6/19 at 100.50 | BBB | 496,876 |
| 2,380 | | 5.550%, 6/15/21 | 6/19 at 100.50 | BBB | 2,389,092 |
25
| | |
NUV | Nuveen Municipal Value Fund, Inc. |
| | Portfolio of Investments (continued) |
| | April 30, 2019 (Unaudited) |
| | | | | | |
Principal | | | Optional Call | | |
Amount (000) | | Description (1) | Provisions (2) | Ratings (3) | Value |
| | | Illinois (continued) | | | |
| | | Metropolitan Pier and Exposition Authority, Illinois, Revenue Bonds, McCormick Place | | | |
| | | Expansion Project, Series 1994B: | | | |
| $ 3,635 | | 0.000%, 6/15/21 – NPFG Insured | No Opt. Call | BBB | $ 3,448,197 |
| 5,190 | | 0.000%, 6/15/28 – NPFG Insured | No Opt. Call | BBB | 3,867,796 |
| 11,675 | | 0.000%, 6/15/29 – FGIC Insured | No Opt. Call | BBB | 8,312,366 |
| | | Metropolitan Pier and Exposition Authority, Illinois, Revenue Bonds, McCormick Place | | | |
| | | Expansion Project, Series 2002A: | | | |
| 2,315 | | 5.700%, 6/15/24 (Pre-refunded 6/15/22) | 6/22 at 101.00 | N/R (4) | 2,618,612 |
| 7,685 | | 5.700%, 6/15/24 | 6/22 at 101.00 | BBB | 8,473,635 |
| 4,950 | | 0.000%, 12/15/32 – NPFG Insured | No Opt. Call | BBB | 3,000,195 |
| 21,375 | | 0.000%, 6/15/34 – NPFG Insured | No Opt. Call | BBB | 12,122,617 |
| 21,000 | | 0.000%, 12/15/35 – NPFG Insured | No Opt. Call | BBB | 11,164,440 |
| 21,970 | | 0.000%, 6/15/36 – NPFG Insured | No Opt. Call | BBB | 11,359,149 |
| 10,375 | | 0.000%, 12/15/36 – NPFG Insured | No Opt. Call | BBB | 5,257,427 |
| 10,000 | | 0.000%, 12/15/37 – NPFG Insured | No Opt. Call | BBB | 4,812,300 |
| 25,825 | | 0.000%, 6/15/39 – NPFG Insured | No Opt. Call | BBB | 11,438,151 |
| 6,095 | | Regional Transportation Authority, Cook, DuPage, Kane, Lake, McHenry and Will Counties, | No Opt. Call | AA | 8,301,817 |
| | | Illinois, General Obligation Bonds, Series 2002A, 6.000%, 7/01/32 – NPFG Insured | | | |
| 8,000 | | Regional Transportation Authority, Cook, DuPage, Kane, Lake, McHenry and Will Counties, | No Opt. Call | AA | 10,549,040 |
| | | Illinois, General Obligation Bonds, Series 2003A, 6.000%, 7/01/33 – NPFG Insured | | | |
| 5,000 | | Regional Transportation Authority, Cook, DuPage, Kane, Lake, McHenry and Will Counties, | 6/24 at 100.00 | AA | 5,515,850 |
| | | Illinois, General Obligation Bonds, Series 2014A, 5.000%, 6/01/44 | | | |
| 5,020 | | Southwestern Illinois Development Authority, Local Government Revenue Bonds, | No Opt. Call | AA | 4,435,873 |
| | | Edwardsville Community Unit School District 7 Project, Series 2007, 0.000%, 12/01/23 – | | | |
| | | AGM Insured | | | |
| 10,285 | | Springfield, Illinois, Water Revenue Bonds, Refunding, Series 2012, 5.000%, 3/01/37 (UB) (6) | 3/22 at 100.00 | AA– | 11,004,641 |
| 615 | | University of Illinois, Health Services Facilities System Revenue Bonds, Series 2013, | 10/23 at 100.00 | A– | 693,050 |
| | | 6.000%, 10/01/42 | | | |
| | | Will County Community Unit School District 201U, Crete-Monee, Illinois, General | | | |
| | | Obligation Bonds, Capital Appreciation Series 2004: | | | |
| 780 | | 0.000%, 11/01/22 – NPFG Insured (ETM) | No Opt. Call | Baa2 (4) | 728,567 |
| 2,550 | | 0.000%, 11/01/22 – NPFG Insured | No Opt. Call | A+ | 2,343,705 |
| 329,270 | | Total Illinois | | | 273,906,910 |
| | | Indiana – 2.3% | | | |
| 5,010 | | Indiana Finance Authority, Hospital Revenue Bonds, Community Health Network Project, | 5/23 at 100.00 | A | 5,425,680 |
| | | Series 2012A, 5.000%, 5/01/42 | | | |
| 2,250 | | Indiana Finance Authority, Hospital Revenue Bonds, Indiana University Health Obligation | 6/25 at 100.00 | AA | 2,367,833 |
| | | Group, Refunding 2015A, 4.000%, 12/01/40 | | | |
| 5,740 | | Indiana Finance Authority, Private Activity Bonds, Ohio River Bridges East End Crossing | 7/23 at 100.00 | A– | 6,182,898 |
| | | Project, Series 2013A, 5.000%, 7/01/48 (AMT) | | | |
| 2,000 | | Indiana Municipal Power Agency Power Supply System Revenue Bonds, Refunding | 7/26 at 100.00 | A+ | 2,287,740 |
| | | Series 2016A, 5.000%, 1/01/42 | | | |
| 5,000 | | Indianapolis Local Public Improvement Bond Bank, Indiana, Community Justice Campus | 2/29 at 100.00 | AAA | 5,993,800 |
| | | Bonds, Courthouse & Jail Project, Series 2019A, 5.250%, 2/01/54 | | | |
| | | Indianapolis Local Public Improvement Bond Bank, Indiana, Series 1999E: | | | |
| 12,550 | | 0.000%, 2/01/21 – AMBAC Insured | No Opt. Call | AA | 12,157,311 |
| 2,400 | | 0.000%, 2/01/25 – AMBAC Insured | No Opt. Call | AA | 2,104,224 |
| 14,595 | | 0.000%, 2/01/27 – AMBAC Insured | No Opt. Call | AA | 12,048,318 |
| 49,545 | | Total Indiana | | | 48,567,804 |
26
| | | | | | |
Principal | | | Optional Call | | |
Amount (000) | | Description (1) | Provisions (2) | Ratings (3) | Value |
| | | Iowa – 0.6% | | | |
| | | Iowa Tobacco Settlement Authority, Asset Backed Settlement Revenue Bonds, Series 2005C: | | | |
| $ 175 | | 5.375%, 6/01/38 | 6/19 at 100.00 | B+ | $ 173,268 |
| 7,000 | | 5.625%, 6/01/46 | 6/19 at 100.00 | B | 6,927,200 |
| 4,965 | | Iowa Tobacco Settlement Authority, Tobacco Asset-Backed Revenue Bonds, Series 2005B, | 6/19 at 100.00 | BB– | 4,937,742 |
| | | 5.600%, 6/01/34 | | | |
| 12,140 | | Total Iowa | | | 12,038,210 |
| | | Kentucky – 1.4% | | | |
| 480 | | Greater Kentucky Housing Assistance Corporation, FHA-Insured Section 8 Mortgage Revenue | 5/19 at 100.00 | Baa2 | 481,474 |
| | | Refunding Bonds, Series 1997A, 6.100%, 1/01/24 – NPFG Insured | | | |
| | | Kenton County Airport Board, Kentucky, Airport Revenue Bonds, Cincinnati/Northern | | | |
| | | Kentucky International Airport, Series 2016: | | | |
| 1,530 | | 5.000%, 1/01/27 | 1/26 at 100.00 | A1 | 1,828,151 |
| 1,600 | | 5.000%, 1/01/28 | 1/26 at 100.00 | A1 | 1,901,088 |
| 2,000 | | Kentucky Bond Development Corporation, Transient Room Tax Revenue Bonds, Lexington | 9/28 at 100.00 | A2 | 2,301,320 |
| | | Center Corporation Project, Series 2018A, 5.000%, 9/01/48 | | | |
| 1,000 | | Kentucky Economic Development Finance Authority, Hospital Revenue Bonds, Baptist | 8/21 at 100.00 | A | 1,054,020 |
| | | Healthcare System Obligated Group, Series 2011, 5.000%, 8/15/42 | | | |
| | | Kentucky Economic Development Finance Authority, Revenue Bonds, Next Generation Kentucky | | | |
| | | Information Highway Project, Senior Series 2015A: | | | |
| 2,175 | | 5.000%, 7/01/40 | 7/25 at 100.00 | BBB+ | 2,337,538 |
| 6,760 | | 5.000%, 1/01/45 | 7/25 at 100.00 | BBB+ | 7,187,975 |
| 6,000 | | Kentucky Public Transportation Infrastructure Authority, First Tier Toll Revenue Bonds, | 7/31 at 100.00 | Baa3 | 6,061,440 |
| | | Downtown Crossing Project, Convertible Capital Appreciation Series 2013C, 0.000%, 7/01/39 (5) | | | |
| 5,000 | | Kentucky State Property and Buildings Commission, Revenue Bonds, Project 115, | 4/27 at 100.00 | A1 | 5,853,500 |
| | | Series 2017, 5.000%, 4/01/30 | | | |
| 26,545 | | Total Kentucky | | | 29,006,506 |
| | | Louisiana – 1.2% | | | |
| 2,310 | | Louisiana Local Government Environmental Facilities and Community Development Authority, | 8/20 at 100.00 | BBB | 2,431,829 |
| | | Revenue Bonds, Westlake Chemical Corporation Projects, Series 2009A, 6.500%, 8/01/29 | | | |
| 5,450 | | Louisiana Local Government Environmental Facilities and Community Development Authority, | 11/20 at 100.00 | BBB | 5,796,402 |
| | | Revenue Bonds, Westlake Chemical Corporation Projects, Series 2010A-1, 6.500%, 11/01/35 | | | |
| 4,420 | | Louisiana Stadium and Exposition District, Revenue Refunding Bonds, Senior Lien | 7/23 at 100.00 | AA– | 4,938,864 |
| | | Series 2013A, 5.000%, 7/01/28 | | | |
| 1,470 | | New Orleans Aviation Board, Louisiana, Special Facility Revenue Bonds, Parking | 10/28 at 100.00 | AA | 1,701,613 |
| | | Facilities Corporation Consolidated Garage System, Series 2018A, 5.000%, 10/01/43 – | | | |
| | | AGM Insured | | | |
| 9,040 | | New Orleans Aviation Board, Louisiana, General Airport Revenue Bonds, North Terminal | 1/27 at 100.00 | A– | 10,291,769 |
| | | Project, Series 2017A, 5.000%, 1/01/48 | | | |
| 22,690 | | Total Louisiana | | | 25,160,477 |
| | | Maine – 0.6% | | | |
| 4,250 | | Maine Health and Higher Educational Facilities Authority Revenue Bonds, Eastern Maine | 7/23 at 100.00 | BBB | 4,550,262 |
| | | Medical Center Obligated Group Issue, Series 2013, 5.000%, 7/01/33 | | | |
| | | Maine Health and Higher Educational Facilities Authority Revenue Bonds, MaineHealth | | | |
| | | Issue, Series 2018A: | | | |
| 1,190 | | 5.000%, 7/01/43 | 7/28 at 100.00 | A+ | 1,369,274 |
| 5,940 | | 5.000%, 7/01/48 | 7/28 at 100.00 | A+ | 6,806,943 |
| 1,050 | | Maine Health and Higher Educational Facilities Authority, Revenue Bonds, Maine General | 7/21 at 100.00 | BB | 1,134,567 |
| | | Medical Center, Series 2011, 6.750%, 7/01/41 | | | |
| 12,430 | | Total Maine | | | 13,861,046 |
27
| | |
NUV | Nuveen Municipal Value Fund, Inc. |
| | Portfolio of Investments (continued) |
| | April 30, 2019 (Unaudited) |
| | | | | | |
Principal | | | Optional Call | | |
Amount (000) | | Description (1) | Provisions (2) | Ratings (3) | Value |
| | | Maryland – 1.5% | | | |
| | | Baltimore, Maryland, Convention Center Hotel Revenue Bonds, Refunding Series 2017: | | | |
| $ 630 | | 5.000%, 9/01/31 | 9/27 at 100.00 | BBB– | $ 725,603 |
| 2,330 | | 5.000%, 9/01/32 | 9/27 at 100.00 | BBB– | 2,679,733 |
| 3,070 | | 5.000%, 9/01/34 | 9/27 at 100.00 | BBB– | 3,500,475 |
| 1,000 | | 5.000%, 9/01/35 | 9/27 at 100.00 | BBB– | 1,132,390 |
| 1,000 | | 5.000%, 9/01/36 | 9/27 at 100.00 | BBB– | 1,125,410 |
| 4,500 | | 5.000%, 9/01/39 | 9/27 at 100.00 | BBB– | 5,042,610 |
| 3,500 | | 5.000%, 9/01/46 | 9/27 at 100.00 | BBB– | 3,863,055 |
| 2,350 | | Maryland Economic Development Corporation, Private Activity Revenue Bonds AP, Purple | 9/26 at 100.00 | BBB+ | 2,569,231 |
| | | Line Light Rail Project, Green Bonds, Series 2016D, 5.000%, 3/31/41 (AMT) | | | |
| 1,050 | | Maryland Health and Higher Educational Facilities Authority, Maryland, Hospital Revenue | 7/25 at 100.00 | BBB+ | 1,155,494 |
| | | Bonds, Meritus Medical Center, Series 2015, 5.000%, 7/01/40 | | | |
| 1,500 | | Maryland Health and Higher Educational Facilities Authority, Revenue Bonds, Adventist | 1/22 at 100.00 | Baa3 | 1,640,460 |
| | | Healthcare, Series 2011A, 6.125%, 1/01/36 | | | |
| 6,635 | | Maryland Stadium Authority, Lease Revenue Bonds, Baltimore City Public Schools | 5/28 at 100.00 | AA | 7,727,585 |
| | | Construction & Revitalization Program, Series 2018A, 5.000%, 5/01/47 | | | |
| 27,565 | | Total Maryland | | | 31,162,046 |
| | | Massachusetts – 1.1% | | | |
| 2,100 | | Massachusetts Development Finance Agency, Hospital Revenue Bonds, Cape Cod Healthcare | 11/23 at 100.00 | A+ | 2,309,454 |
| | | Obligated Group, Series 2013, 5.250%, 11/15/41 | | | |
| 2,905 | | Massachusetts Development Finance Agency, Revenue Bonds, Boston Medical Center Issue, | 7/25 at 100.00 | BBB | 3,173,684 |
| | | Green Bonds, Series 2015D, 5.000%, 7/01/44 | | | |
| 1,105 | | Massachusetts Development Finance Agency, Revenue Bonds, Boston Medical Center Issue, | 7/26 at 100.00 | BBB | 1,240,208 |
| | | Series 2016E, 5.000%, 7/01/36 | | | |
| 2,765 | | Massachusetts Development Finance Agency, Revenue Bonds, Dana-Farber Cancer Institute | 12/26 at 100.00 | A1 | 3,153,372 |
| | | Issue, Series 2016N, 5.000%, 12/01/46 | | | |
| | | Massachusetts Health and Educational Facilities Authority, Revenue Bonds, Suffolk | | | |
| | | University, Refunding Series 2009A: | | | |
| 1,530 | | 5.750%, 7/01/39 (Pre-refunded 7/01/19) | 7/19 at 100.00 | N/R (4) | 1,540,526 |
| 770 | | 5.750%, 7/01/39 | 7/19 at 100.00 | Baa2 | 775,174 |
| 9,110 | | Massachusetts School Building Authority, Dedicated Sales Tax Revenue Bonds, Senior | 5/23 at 100.00 | AAA | 10,014,714 |
| | | Series 2013A, 5.000%, 5/15/43 | | | |
| 980 | | Massachusetts Turnpike Authority, Metropolitan Highway System Revenue Bonds, Senior | No Opt. Call | A+ | 766,723 |
| | | Series 1997A, 0.000%, 1/01/29 – NPFG Insured | | | |
| 320 | | Massachusetts Water Pollution Abatement Trust, Pooled Loan Program Bonds, Series 2000-6, | 6/19 at 100.00 | Aaa | 321,040 |
| | | 5.500%, 8/01/30 | | | |
| 21,585 | | Total Massachusetts | | | 23,294,895 |
| | | Michigan – 2.9% | | | |
| | | Detroit Academy of Arts and Sciences, Michigan, Public School Academy Revenue Bonds, | | | |
| | | Refunding Series 2013: | | | |
| 1,855 | | 6.000%, 10/01/33 | 10/23 at 100.00 | N/R | 1,859,155 |
| 2,520 | | 6.000%, 10/01/43 | 10/23 at 100.00 | N/R | 2,444,526 |
| 3,090 | | Detroit Local Development Finance Authority, Michigan, Tax Increment Bonds, Series | 6/19 at 100.00 | B– | 3,055,392 |
| | | 1998A, 5.500%, 5/01/21 | | | |
| 1,415 | | Detroit Water and Sewerage Department, Michigan, Sewage Disposal System Revenue Bonds, | 7/22 at 100.00 | A+ | 1,532,601 |
| | | Refunding Senior Lien Series 2012A, 5.250%, 7/01/39 | | | |
| 15 | | Detroit, Michigan, Second Lien Sewerage Disposal System Revenue Bonds, Series 2005A, | 6/19 at 100.00 | A | 15,029 |
| | | 4.500%, 7/01/35 – NPFG Insured | | | |
| 3,000 | | Detroit, Michigan, Senior Lien Sewerage Disposal System Revenue Bonds, Series 2001B, | No Opt. Call | A | 3,652,950 |
| | | 5.500%, 7/01/29 – NPFG Insured | | | |
| 5 | | Detroit, Michigan, Water Supply System Revenue Bonds, Second Lien Series 2003B, 5.000%, | 6/19 at 100.00 | A+ | 5,013 |
| | | 7/01/34 – NPFG Insured | | | |
28
| | | | | | |
Principal | | | Optional Call | | |
Amount (000) | | Description (1) | Provisions (2) | Ratings (3) | Value |
| | | Michigan (continued) | | | |
| $ 5 | | Detroit, Michigan, Water Supply System Revenue Bonds, Senior Lien Series 2003A, 5.000%, | 6/19 at 100.00 | A2 | $ 5,013 |
| | | 7/01/34 – NPFG Insured | | | |
| | | Kalamazoo Hospital Finance Authority, Michigan, Hospital Revenue Refunding Bonds, | | | |
| | | Bronson Methodist Hospital, Remarketed Series 2006: | | | |
| 1,105 | | 5.250%, 5/15/36 – AGM Insured (Pre-refunded 5/15/20) | 5/20 at 100.00 | A2 (4) | 1,145,222 |
| 895 | | 5.250%, 5/15/36 – AGM Insured | 5/20 at 100.00 | A2 | 920,561 |
| 1,950 | | Michigan Finance Authority, Local Government Loan Program Revenue Bonds, Detroit Water & | 7/22 at 100.00 | A+ | 2,086,461 |
| | | Sewerage Department Water Supply System Local Project, Series 2014C-1, 5.000%, 7/01/44 | | | |
| | | Michigan Finance Authority, Revenue Bonds, Trinity Health Credit Group, Refunding | | | |
| | | Series 2011MI: | | | |
| 15 | | 5.000%, 12/01/39 (Pre-refunded 12/01/21) | 12/21 at 100.00 | N/R (4) | 16,260 |
| 4,585 | | 5.000%, 12/01/39 | 12/21 at 100.00 | AA– | 4,903,062 |
| 5,000 | | Michigan Finance Authority, Revenue Bonds, Trinity Health Credit Group, Refunding | 6/22 at 100.00 | AA– | 5,391,000 |
| | | Series 2015MI, 5.000%, 12/01/35 | | | |
| 3,315 | | Michigan Finance Authority, Senior Lien Distributable State Aid Revenue Bonds, Charter | 11/28 at 100.00 | Aa3 | 3,885,876 |
| | | County of Wayne Criminal Justice Center Project, Series 2018, 5.000%, 11/01/43 | | | |
| 6,000 | | Michigan Hospital Finance Authority, Revenue Bonds, Ascension Health Senior Credit | 11/26 at 100.00 | AA+ | 6,313,140 |
| | | Group, Refunding and Project Series 2010F-6, 4.000%, 11/15/47 | | | |
| 2,155 | | Michigan Municipal Bond Authority, Clean Water Revolving Fund Revenue Bonds, Series | 10/20 at 100.00 | AAA | 2,256,996 |
| | | 2010, 5.000%, 10/01/29 (Pre-refunded 10/01/20) | | | |
| 5,000 | | Michigan State Building Authority, Revenue Bonds, Facilities Program, Refunding Series | 10/21 at 100.00 | Aa2 | 5,406,000 |
| | | 2011-II-A, 5.375%, 10/15/41 | | | |
| 10,000 | | Michigan State Building Authority, Revenue Bonds, Facilities Program, Refunding Series | 10/25 at 100.00 | Aa2 | 11,705,900 |
| | | 2015-I, 5.000%, 4/15/30 | | | |
| 2,890 | | Oakland University, Michigan, General Revenue Bonds, Series 2012, 5.000%, 3/01/42 | 3/22 at 100.00 | A1 | 3,066,579 |
| 1,100 | | Wayne County Airport Authority, Michigan, Revenue Bonds, Detroit Metropolitan Wayne | 12/25 at 100.00 | A | 1,247,444 |
| | | County Airport, Series 2015D, 5.000%, 12/01/45 | | | |
| 55,915 | | Total Michigan | | | 60,914,180 |
| | | Minnesota – 0.3% | | | |
| 1,400 | | Breckenridge, Minnesota, Revenue Bonds, Catholic Health Initiatives, Series 2004A, | 6/19 at 100.00 | BBB+ | 1,416,548 |
| | | 5.000%, 5/01/30 | | | |
| 3,200 | | Rochester, Minnesota, Health Care Facilities Revenue Bonds, Mayo Clinic, Refunding | No Opt. Call | AA | 4,233,088 |
| | | Series 2016B, 5.000%, 11/15/34 | | | |
| 1,480 | | University of Minnesota, General Obligation Bonds, Series 2016A, 5.000%, 4/01/41 | 4/26 at 100.00 | Aa1 | 1,712,908 |
| 6,080 | | Total Minnesota | | | 7,362,544 |
| | | Missouri – 0.7% | | | |
| 3,465 | | Missouri Health and Educational Facilities Authority, Health Facilities Revenue Bonds, | 11/23 at 100.00 | A2 | 3,743,413 |
| | | CoxHealth, Series 2013A, 5.000%, 11/15/48 | | | |
| 12,000 | | Missouri Health and Educational Facilities Authority, Revenue Bonds, SSM Health Care | 6/20 at 100.00 | AA– (4) | 12,428,640 |
| | | System, Series 2010B, 5.000%, 6/01/30 (Pre-refunded 6/01/20) | | | |
| 15,465 | | Total Missouri | | | 16,172,053 |
| | | Montana – 0.6% | | | |
| 1,115 | | Billings, Montana, Sewer System Revenue Bonds, Series 2017, 5.000%, 7/01/33 | 7/27 at 100.00 | AA+ | 1,332,012 |
| | | Montana Facility Finance Authority, Healthcare Facility Revenue Bonds, Kalispell | | | |
| | | Regional Medical Center, Series 2018B: | | | |
| 1,340 | | 5.000%, 7/01/30 | 7/28 at 100.00 | BBB | 1,543,841 |
| 1,415 | | 5.000%, 7/01/31 | 7/28 at 100.00 | BBB | 1,619,312 |
| 1,980 | | 5.000%, 7/01/32 | 7/28 at 100.00 | BBB | 2,274,485 |
| 2,135 | | 5.000%, 7/01/33 | 7/28 at 100.00 | BBB | 2,440,967 |
| 3,045 | | Montana Facility Finance Authority, Revenue Bonds, Billings Clinic Obligated Group, | 8/28 at 100.00 | AA– | 3,566,274 |
| | | Series 2018A, 5.000%, 8/15/48 | | | |
| 11,030 | | Total Montana | | | 12,776,891 |
29
| | |
NUV | Nuveen Municipal Value Fund, Inc. |
| | Portfolio of Investments (continued) |
| | April 30, 2019 (Unaudited) |
| | | | | | |
Principal | | | Optional Call | | |
Amount (000) | | Description (1) | Provisions (2) | Ratings (3) | Value |
| | | Nebraska – 0.2% | | | |
| $ 1,855 | | Central Plains Energy Project, Nebraska, Gas Project 3 Revenue Bonds, Series 2012, | 9/22 at 100.00 | A | $ 2,009,670 |
| | | 5.000%, 9/01/42 | | | |
| 1,400 | | Douglas County Hospital Authority 3, Nebraska, Health Facilities Revenue Bonds, Nebraska | 11/25 at 100.00 | A | 1,526,574 |
| | | Methodist Health System, Refunding Series 2015, 5.000%, 11/01/45 | | | |
| 3,255 | | Total Nebraska | | | 3,536,244 |
| | | Nevada – 3.4% | | | |
| 5,075 | | Clark County, Nevada, Airport Revenue Bonds, Subordinate Lien Series 2010B, 5.750%, 7/01/42 | 1/20 at 100.00 | Aa3 | 5,201,114 |
| | | Clark County, Nevada, General Obligation Bonds, Limited Tax, Additionally Secured by | | | |
| | | Pledged Revenues, Transportation Improvement Series 2018B: | | | |
| 2,000 | | 5.000%, 12/01/33 | 12/28 at 100.00 | AA+ | 2,445,940 |
| 5,000 | | 5.000%, 12/01/35 | 12/28 at 100.00 | AA+ | 6,075,100 |
| 5,000 | | Humboldt County, Nevada, Pollution Control Revenue Bonds, Sierra Pacific Power Company | No Opt. Call | A+ | 4,998,350 |
| | | Projects, Series 2016B, 1.850%, 10/01/29 (Mandatory Put 4/15/22) | | | |
| 5,000 | | Las Vegas Convention and Visitors Authority, Nevada, Convention Center Expansion Revenue | 7/28 at 100.00 | Aa3 | 5,822,650 |
| | | Bonds, Series 2018B, 5.000%, 7/01/43 | | | |
| 8,500 | | Las Vegas Convention and Visitors Authority, Nevada, Revenue Bonds, Series 2018C, | 7/28 at 100.00 | Aa3 | 10,105,650 |
| | | 5.250%, 7/01/43 | | | |
| | | Las Vegas Valley Water District, Nevada, General Obligation Bonds, Refunding Series 2015: | | | |
| 5,220 | | 5.000%, 6/01/33 | 12/24 at 100.00 | AA+ | 5,995,274 |
| 10,000 | | 5.000%, 6/01/34 | 12/24 at 100.00 | AA+ | 11,459,900 |
| 9,000 | | 5.000%, 6/01/39 | 12/24 at 100.00 | AA+ | 10,282,050 |
| 6,205 | | Las Vegas Valley Water District, Nevada, General Obligation Bonds, Refunding Water | 6/26 at 100.00 | AA+ | 7,145,058 |
| | | Improvement Series 2016A, 5.000%, 6/01/41 | | | |
| 2,000 | | Reno, Nevada, Subordinate Lien Sales Tax Revenue Refunding Bonds, ReTrac-Reno | 12/28 at 100.00 | A3 | 2,323,280 |
| | | Transportation Rail Access Corridor Project, Series 2018A, 5.000%, 6/01/48 | | | |
| 250 | | Reno, Nevada, Subordinate Lien Sales Tax Revenue Refunding Bonds, ReTrac-Reno | 12/28 at 100.00 | AA | 294,545 |
| | | Transportation Rail Access Corridor Project, Series 2018B, 5.000%, 6/01/33 – AGM Insured | | | |
| 1,500 | | Sparks Tourism Improvement District 1, Legends at Sparks Marina, Nevada, Senior Sales | 5/19 at 100.00 | Ba3 | 1,501,545 |
| | | Tax Revenue Bonds Series 2008A, 6.750%, 6/15/28 | | | |
| 64,750 | | Total Nevada | | | 73,650,456 |
| | | New Hampshire – 0.1% | | | |
| 1,500 | | New Hampshire Business Finance Authority, Revenue Bonds, Elliot Hospital Obligated | 10/19 at 100.00 | Baa1 (4) | 1,527,795 |
| | | Group Issue, Series 2009A, 6.125%, 10/01/39 (Pre-refunded 10/01/19) | | | |
| | | New Jersey – 3.9% | | | |
| 930 | | New Jersey Economic Development Authority, Private Activity Bonds, The Goethals Bridge | 1/24 at 100.00 | AA | 1,026,887 |
| | | Replacement Project, Series 2013, 5.125%, 1/01/39 – AGM Insured (AMT) | | | |
| 6,000 | | New Jersey Economic Development Authority, School Facilities Construction Bonds, | 12/26 at 100.00 | A– | 6,896,040 |
| | | Refunding Series 2016BBB, 5.500%, 6/15/31 | | | |
| 5,990 | | New Jersey Economic Development Authority, School Facilities Construction Bonds, | No Opt. Call | AA | 7,093,717 |
| | | Series 2005N-1, 5.500%, 9/01/25 – AGM Insured | | | |
| 4,000 | | New Jersey Economic Development Authority, School Facilities Construction Financing | 3/23 at 100.00 | A– | 4,341,040 |
| | | Program Bonds, Refunding Series 2013NN, 5.000%, 3/01/25 | | | |
| 3,300 | | New Jersey Health Care Facilities Financing Authority, New Jersey, Revenue Bonds, Saint | 6/19 at 100.00 | BB+ | 3,309,702 |
| | | Peters University Hospital, Series 2007, 5.750%, 7/01/37 | | | |
| 9,420 | | New Jersey Transportation Trust Fund Authority, Transportation System Bonds, Capital | No Opt. Call | A– | 5,957,020 |
| | | Appreciation Series 2010A, 0.000%, 12/15/31 | | | |
| | | New Jersey Transportation Trust Fund Authority, Transportation System Bonds, Refunding | | | |
| | | Series 2006C: | | | |
| 30,000 | | 0.000%, 12/15/30 – FGIC Insured | No Opt. Call | A– | 20,298,000 |
| 27,000 | | 0.000%, 12/15/32 – AGM Insured | No Opt. Call | AA | 16,786,170 |
30
| | | | | | |
Principal | | | Optional Call | | |
Amount (000) | | Description (1) | Provisions (2) | Ratings (3) | Value |
| | | New Jersey (continued) | | | |
| $ 4,500 | | New Jersey Transportation Trust Fund Authority, Transportation System Bonds, | 6/23 at 100.00 | A– | $ 4,872,420 |
| | | Series 2013AA, 5.000%, 6/15/29 | | | |
| | | New Jersey Transportation Trust Fund Authority, Transportation System Bonds, Series 2015AA: | | | |
| 2,750 | | 5.250%, 6/15/32 | 6/25 at 100.00 | A– | 3,044,992 |
| 2,150 | | 5.250%, 6/15/34 | 6/25 at 100.00 | A– | 2,368,418 |
| 2,000 | | New Jersey Turnpike Authority, Revenue Bonds, Series 2017B, 5.000%, 1/01/40 | 1/28 at 100.00 | A+ | 2,350,380 |
| 1,135 | | Rutgers State University, New Jersey, Revenue Bonds, Refunding Series 2013L, | 5/23 at 100.00 | Aa3 | 1,255,878 |
| | | 5.000%, 5/01/43 | | | |
| 2,720 | | Tobacco Settlement Financing Corporation, New Jersey, Tobacco Settlement Asset-Backed | 6/28 at 100.00 | BBB | 2,840,986 |
| | | Bonds, Series 2018B, 5.000%, 6/01/46 | | | |
| 101,895 | | Total New Jersey | | | 82,441,650 |
| | | New Mexico – 0.0% | | | |
| 245 | | University of New Mexico, Revenue Bonds, Refunding Series 1992A, 6.000%, 6/01/21 | No Opt. Call | AA | 252,308 |
| | | New York – 5.4% | | | |
| 3,750 | | Dormitory Authority of the State of New York, Lease Revenue Bonds, State University | 7/27 at 100.00 | Aa3 | 4,372,200 |
| | | Dormitory Facilities, Series 2017A, 5.000%, 7/01/42 | | | |
| 1,950 | | Long Island Power Authority, New York, Electric System General Revenue Bonds, | 9/28 at 100.00 | A– | 2,321,963 |
| | | Series 2018, 5.000%, 9/01/39 | | | |
| 12,855 | | Long Island Power Authority, New York, Electric System Revenue Bonds, Series 2011A, | 5/21 at 100.00 | A– (4) | 13,731,711 |
| | | 5.000%, 5/01/38 (Pre-refunded 5/01/21) | | | |
| 9,850 | | New York City Industrial Development Authority, New York, PILOT Revenue Bonds, Yankee | 6/19 at 100.00 | Baa1 | 9,860,835 |
| | | Stadium Project, Series 2006, 4.750%, 3/01/46 – NPFG Insured | | | |
| | | New York City Municipal Water Finance Authority, New York, Water and Sewer System | | | |
| | | Revenue Bonds, Second Generation Resolution, Series 2009EE-2: | | | |
| 3,080 | | 5.250%, 6/15/40 | 6/19 at 100.00 | N/R | 3,093,460 |
| 445 | | 5.250%, 6/15/40 | 6/19 at 100.00 | Aa1 | 446,838 |
| 10,000 | | New York City Transitional Finance Authority, New York, Building Aid Revenue Bonds, | 7/28 at 100.00 | AA | 11,863,800 |
| | | Fiscal 2018, Series 2017S-3, 5.000%, 7/15/43 | | | |
| 7,000 | | New York City Transitional Finance Authority, New York, Building Aid Revenue Bonds, | 7/28 at 100.00 | AA | 8,391,110 |
| | | Fiscal 2019 Subseries S-3A, 5.000%, 7/15/37 | | | |
| 11,755 | | New York Liberty Development Corporation, New York, Liberty Revenue Bonds, 3 World Trade | 11/24 at 100.00 | N/R | 12,659,782 |
| | | Center Project, Class 1 Series 2014, 5.000%, 11/15/44, 144A | | | |
| 5,825 | | New York Liberty Development Corporation, New York, Liberty Revenue Bonds, 4 World Trade | 11/21 at 100.00 | A+ | 6,386,355 |
| | | Center Project, Series 2011, 5.750%, 11/15/51 | | | |
| 8,500 | | New York Transportation Development Corporation, New York, Special Facility Revenue | 1/28 at 100.00 | Baa3 | 9,920,775 |
| | | Bonds, Delta Air Lines, Inc. – LaGuardia Airport Terminals C&D Redevelopment Project, | | | |
| | | Series 2018, 5.000%, 1/01/33 (AMT) | | | |
| 8,270 | | New York Transportation Development Corporation, Special Facilities Bonds, LaGuardia | 7/24 at 100.00 | BBB | 8,975,266 |
| | | Airport Terminal B Redevelopment Project, Series 2016A, 5.000%, 7/01/46 (AMT) | | | |
| 9,925 | | Port Authority of New York and New Jersey, Special Project Bonds, JFK International Air | 12/20 at 100.00 | BBB+ | 10,505,414 |
| | | Terminal LLC Project, Eigth Series 2010, 6.000%, 12/01/42 | | | |
| 7,550 | | Triborough Bridge and Tunnel Authority, New York, General Purpose Revenue Bonds, MTA | 11/27 at 100.00 | AA– | 8,927,195 |
| | | Bridges & Tunnels, Series 2017C-2, 5.000%, 11/15/42 | | | |
| 3,000 | | Triborough Bridge and Tunnel Authority, New York, General Purpose Revenue Bonds, | 5/25 at 100.00 | AA– | 3,406,320 |
| | | Refunding Series 2015A, 5.000%, 11/15/50 | | | |
| 650 | | TSASC Inc., New York, Tobacco Settlement Asset-Backed Bonds, Fiscal 2017 Series B, | No Opt. Call | B+ | 702,858 |
| | | 5.000%, 6/01/24 | | | |
| 104,405 | | Total New York | | | 115,565,882 |
31
| | |
NUV | Nuveen Municipal Value Fund, Inc. |
| | Portfolio of Investments (continued) |
| | April 30, 2019 (Unaudited) |
| | | | | | |
Principal | | | Optional Call | | |
Amount (000) | | Description (1) | Provisions (2) | Ratings (3) | Value |
| | | North Carolina – 1.0% | | | |
| $ 1,500 | | Charlotte-Mecklenberg Hospital Authority, North Carolina, Health Care Revenue Bonds, DBA | 1/21 at 100.00 | AA– | $ 1,579,170 |
| | | Carolinas HealthCare System, Series 2011A, 5.125%, 1/15/37 | | | |
| 1,520 | | North Carolina Capital Facilities Finance Agency, Revenue Bonds, Duke University | 10/26 at 100.00 | AA+ | 1,782,504 |
| | | Project, Refunding Series 2016B, 5.000%, 10/01/44 | | | |
| | | North Carolina Department of Transportation, Private Activity Revenue Bonds, I-77 Hot | | | |
| | | Lanes Project, Series 2015: | | | |
| 2,155 | | 5.000%, 12/31/37 (AMT) | 6/25 at 100.00 | BBB– | 2,356,557 |
| 4,175 | | 5.000%, 6/30/54 (AMT) | 6/25 at 100.00 | BBB– | 4,509,000 |
| 1,000 | | North Carolina Medical Care Commission Health Care Facilities Revenue Bonds Novant | 11/20 at 100.00 | Aa3 | 1,034,030 |
| | | Health Inc., Series 2010A, 4.750%, 11/01/43 | | | |
| 2,010 | | North Carolina Medical Care Commission, Health Care Facilities Revenue Bonds, Duke | 6/20 at 100.00 | N/R (4) | 2,080,692 |
| | | University Health System, Series 2010A, 5.000%, 6/01/42 (Pre-refunded 6/01/20) | | | |
| 2,995 | | North Carolina Turnpike Authority, Monroe Expressway Toll Revenue Bonds, Series 2017A, | 7/26 at 100.00 | BBB– | 3,272,277 |
| | | 5.000%, 7/01/51 | | | |
| | | North Carolina Turnpike Authority, Triangle Expressway System Revenue Bonds, Refunding | | | |
| | | Senior Lien Series 2017: | | | |
| 1,625 | | 5.000%, 1/01/30 | 1/27 at 100.00 | BBB | 1,878,971 |
| 1,850 | | 5.000%, 1/01/32 | 1/27 at 100.00 | BBB | 2,118,361 |
| 18,830 | | Total North Carolina | | | 20,611,562 |
| | | North Dakota – 0.5% | | | |
| 7,820 | | Fargo, North Dakota, Health System Revenue Bonds, Sanford Health, Refunding | 11/21 at 100.00 | A+ | 8,692,868 |
| | | Series 2011, 6.250%, 11/01/31 | | | |
| 1,840 | | Grand Forks, North Dakota, Health Care System Revenue Bonds, Altru Health System | 12/27 at 100.00 | A– | 2,077,434 |
| | | Obligated Group, Series 2017A, 5.000%, 12/01/42 | | | |
| 9,660 | | Total North Dakota | | | 10,770,302 |
| | | Ohio – 3.7% | | | |
| | | Buckeye Tobacco Settlement Financing Authority, Ohio, Tobacco Settlement Asset-Backed | | | |
| | | Revenue Bonds, Senior Lien, Series 2007A-2: | | | |
| 12,205 | | 5.875%, 6/01/30 | 5/19 at 100.00 | B– | 11,686,287 |
| 4,020 | | 6.000%, 6/01/42 | 5/19 at 100.00 | B– | 3,961,710 |
| 11,940 | | 5.875%, 6/01/47 | 5/19 at 100.00 | B– | 11,343,239 |
| 16,415 | | Buckeye Tobacco Settlement Financing Authority, Ohio, Tobacco Settlement Asset-Backed | 6/22 at 100.00 | B– | 16,204,231 |
| | | Revenue Bonds, Senior Lien, Series 2007A-3, 6.250%, 6/01/37 | | | |
| 1,195 | | Franklin County, Ohio, Hospital Revenue Bonds, Nationwide Children’s Hospital Project, | 11/27 at 100.00 | Aa2 | 1,432,028 |
| | | Refunding & Improvement Series 2017A, 5.000%, 11/01/32 | | | |
| 3,485 | | Franklin County, Ohio, Revenue Bonds, Trinity Health Credit Group, Series 2017OH, | 6/27 at 100.00 | AA– | 3,681,903 |
| | | 4.000%, 12/01/46 | | | |
| 5,000 | | Franklin County, Ohio, Sales Tax Revenue Bonds, Various Purpose Series 2018, | 6/28 at 100.00 | AAA | 5,961,450 |
| | | 5.000%, 6/01/43 | | | |
| 1,730 | | Lucas County, Ohio, Hospital Revenue Bonds, ProMedica Healthcare Obligated Group, | 11/21 at 100.00 | Baa1 (4) | 1,916,148 |
| | | Series 2011A, 6.000%, 11/15/41 (Pre-refunded 11/15/21) | | | |
| 13,000 | | Ohio Air Quality Development Authority, Ohio, Pollution Control Revenue Bonds, | No Opt. Call | N/R | 13,000,000 |
| | | FirstEnergy Generation Corporation Project, Refunding Series 2009D, 4.250%, 8/01/29 | | | |
| | | (Mandatory Put 9/15/21) (7) | | | |
| 4,110 | | Ohio State, Private Activity Bonds, Portsmouth Gateway Group, LLC – Borrower, Portsmouth | 6/25 at 100.00 | AA | 4,565,059 |
| | | Bypass Project, Series 2015, 5.000%, 12/31/39 – AGM Insured (AMT) | | | |
| 4,975 | | Ohio Turnpike Commission, Turnpike Revenue Bonds, Infrastructure Project, Junior Lien | 2/23 at 100.00 | Aa3 | 5,408,323 |
| | | Series 2013A-1, 5.000%, 2/15/48 | | | |
| 78,075 | | Total Ohio | | | 79,160,378 |
32
| | | | | | |
Principal | | | Optional Call | | |
Amount (000) | | Description (1) | Provisions (2) | Ratings (3) | Value |
| | | Oklahoma – 1.1% | | | |
| $ 1,350 | | Fort Sill Apache Tribe of Oklahoma Economic Development Authority, Gaming Enterprise | 8/21 at 100.00 | N/R | $ 1,518,561 |
| | | Revenue Bonds, Fort Sill Apache Casino, Series 2011A, 8.500%, 8/25/26, 144A | | | |
| 4,000 | | Oklahoma City Water Utilities Trust, Oklahoma, Water and Sewer Revenue Bonds, Refunding | 7/26 at 100.00 | AAA | 4,691,360 |
| | | Series 2016, 5.000%, 7/01/36 | | | |
| | | Oklahoma Development Finance Authority, Health System Revenue Bonds, Integris Baptist | | | |
| | | Medical Center, Refunding Series 2015A: | | | |
| 1,590 | | 5.000%, 8/15/27 | 8/25 at 100.00 | A+ | 1,867,487 |
| 1,250 | | 5.000%, 8/15/29 | 8/25 at 100.00 | A+ | 1,455,313 |
| 1,935 | | Oklahoma Development Finance Authority, Health System Revenue Bonds, OU Medicine | 8/28 at 100.00 | Baa3 | 2,204,758 |
| | | Project, Series 2018B, 5.250%, 8/15/43 | | | |
| 10,000 | | Oklahoma State Turnpike Authority, Turnpike System Revenue Bonds, Second Senior | 1/26 at 100.00 | AA– | 11,438,800 |
| | | Series 2017A, 5.000%, 1/01/42 | | | |
| 20,125 | | Total Oklahoma | | | 23,176,279 |
| | | Oregon – 0.7% | | | |
| 6,585 | | Oregon State Department of Transportation, Highway User Tax Revenue Bonds, Refunding | 5/27 at 100.00 | AAA | 8,102,250 |
| | | Senior Lien Series 2017B, 5.000%, 11/15/28 | | | |
| 5,330 | | University of Oregon, General Revenue Bonds, Series 2018A, 5.000%, 4/01/48 | 4/28 at 100.00 | Aa2 | 6,258,539 |
| 11,915 | | Total Oregon | | | 14,360,789 |
| | | Pennsylvania – 1.1% | | | |
| 2,500 | | Delaware River Port Authority, New Jersey and Pennsylvania, Revenue Bonds, Series 2018A, | 1/29 at 100.00 | A+ | 3,016,900 |
| | | 5.000%, 1/01/36 | | | |
| 3,155 | | Geisinger Authority, Montour County, Pennsylvania, Health System Revenue Bonds, | 2/27 at 100.00 | AA | 3,623,643 |
| | | Geisinger Health System, Series 2017A-2, 5.000%, 2/15/39 | | | |
| | | Pennsylvania State University, Revenue Bonds, Refunding Series 2016A: | | | |
| 1,325 | | 5.000%, 9/01/35 | 9/26 at 100.00 | Aa1 | 1,566,481 |
| 2,000 | | 5.000%, 9/01/41 | 9/26 at 100.00 | Aa1 | 2,332,240 |
| | | Pennsylvania Turnpike Commission, Motor License Fund-Enhanced Turnpike Special Revenue | | | |
| | | Bonds, Subordinate Series 2011B: | | | |
| 1,405 | | 5.000%, 12/01/41 (Pre-refunded 12/01/21) | 12/21 at 100.00 | N/R (4) | 1,524,903 |
| 1,310 | | 5.000%, 12/01/41 | 12/21 at 100.00 | A2 | 1,383,596 |
| 7,500 | | Pennsylvania Turnpike Commission, Motor License Fund-Enhanced Turnpike Special Revenue | 12/22 at 100.00 | AA– | 8,010,150 |
| | | Bonds, Subordinate Series 2013A, 5.000%, 12/01/43 | | | |
| 1,250 | | Pennsylvania Turnpike Commission, Motor License Fund-Enhanced Turnpike Subordinate | 12/26 at 100.00 | AA– | 1,240,000 |
| | | Special Revenue Bonds, Series 2014A, 0.000%, 12/01/37 (5) | | | |
| 1,350 | | Susquehanna Area Regional Airport Authority, Pennsylvania, Airport System Revenue Bonds, | 1/28 at 100.00 | Baa3 | 1,501,362 |
| | | Series 2017, 5.000%, 1/01/38 (AMT) | | | |
| 21,795 | | Total Pennsylvania | | | 24,199,275 |
| | | South Carolina – 1.7% | | | |
| | | Piedmont Municipal Power Agency, South Carolina, Electric Revenue Bonds, Series 2004A-2: | | | |
| 12,760 | | 0.000%, 1/01/28 – AGC Insured | No Opt. Call | AA | 10,190,646 |
| 9,535 | | 0.000%, 1/01/29 – AGC Insured | No Opt. Call | AA | 7,353,964 |
| 8,000 | | South Carolina Public Service Authority Santee Cooper Revenue Obligations, Refunding | 12/26 at 100.00 | A+ | 8,974,560 |
| | | Series 2016B, 5.000%, 12/01/56 | | | |
| 5,500 | | South Carolina Public Service Authority, Santee Cooper Revenue Obligations, Refunding & | 6/25 at 100.00 | A+ | 6,086,355 |
| | | Improvement Series 2015A, 5.000%, 12/01/50 | | | |
| 3,455 | | South Carolina Public Service Authority, Santee Cooper Revenue Obligations, | 6/24 at 100.00 | A+ | 3,838,436 |
| | | Series 2014A, 5.500%, 12/01/54 | | | |
| 39,250 | | Total South Carolina | | | 36,443,961 |
33
| | |
NUV | Nuveen Municipal Value Fund, Inc. |
| | Portfolio of Investments (continued) |
| | April 30, 2019 (Unaudited) |
| | | | | | |
Principal | | | Optional Call | | |
Amount (000) | | Description (1) | Provisions (2) | Ratings (3) | Value |
| | | Tennessee – 0.6% | | | |
| $ 2,260 | | Metropolitan Government of Nashville-Davidson County, Tennessee, Water and Sewerage | 7/27 at 100.00 | AA | $ 2,651,229 |
| | | Revenue Bonds, Green Series 2017A, 5.000%, 7/01/42 | | | |
| 3,000 | | Tennessee State School Bond Authority, Higher Educational Facilities Second Program | 11/27 at 100.00 | AA+ | 3,562,740 |
| | | Bonds, Series 2017A, 5.000%, 11/01/42 | | | |
| 7,245 | | The Tennessee Energy Acquisition Corporation, Gas Revenue Bonds, Series 2017A, 4.000%, | 5/23 at 100.43 | A3 | 7,681,221 |
| | | 5/01/48 (Mandatory Put 5/01/23) | | | |
| 12,505 | | Total Tennessee | | | 13,895,190 |
| | | Texas – 16.0% | | | |
| 14,355 | | Bexar County Hospital District, Texas, Certificates of Obligation, Series 2018, 4.000%, | 2/27 at 100.00 | Aa1 | 15,359,994 |
| | | 2/15/43, (UB) (6) | | | |
| 2,420 | | Central Texas Regional Mobility Authority, Revenue Bonds, Refunding Senior Lien | 1/23 at 100.00 | A– | 2,605,469 |
| | | Series 2013A, 5.000%, 1/01/43 | | | |
| 7,500 | | Dallas-Fort Worth International Airport, Texas, Joint Revenue Bonds, Improvement | 11/21 at 100.00 | A+ | 7,953,450 |
| | | Series 2012D, 5.000%, 11/01/38 (AMT) | | | |
| 240 | | Decatur Hospital Authority, Texas, Revenue Bonds, Wise Regional Health System, | 9/24 at 100.00 | BBB– | 259,541 |
| | | Series 2014A, 5.250%, 9/01/44 | | | |
| 5,000 | | El Paso County Hospital District, Texas, General Obligation Bonds, Certificates of | 8/23 at 100.00 | A– | 5,284,750 |
| | | Obligation Series 2013, 5.000%, 8/15/39 | | | |
| | | Fort Bend County Municipal Utility District 50, Texas, General Obligation Bonds, Series 2018A: | | | |
| 2,600 | | 4.000%, 9/01/46 – AGM Insured | 9/23 at 100.00 | AA | 2,659,384 |
| 5,500 | | 4.000%, 9/01/48 – AGM Insured | 9/23 at 100.00 | AA | 5,623,750 |
| 27,340 | | Grand Parkway Transportation Corporation, Texas, System Toll Revenue Bonds, Subordinate | 10/23 at 100.00 | AA+ | 29,550,166 |
| | | Lien Series 2013B, 5.000%, 4/01/53 | | | |
| 2,845 | | Harris County Cultural Education Facilities Finance Corporation, Texas, Revenue Bonds, | 6/25 at 100.00 | AA | 2,946,111 |
| | | Houston Methodist Hospital System, Series 2015, 4.000%, 12/01/45 | | | |
| 7,295 | | Harris County-Houston Sports Authority, Texas, Revenue Bonds, Capital Appreciation | 11/31 at 39.79 | AA | 1,875,545 |
| | | Refunding Senior Lien Series 2014A, 0.000%, 11/15/50 – AGM Insured | | | |
| 11,900 | | Harris County-Houston Sports Authority, Texas, Revenue Bonds, Junior Lien Series 2001H, | No Opt. Call | Baa2 | 9,055,900 |
| | | 0.000%, 11/15/27 – NPFG Insured | | | |
| | | Harris County-Houston Sports Authority, Texas, Revenue Bonds, Refunding Second Lien | | | |
| | | Series 2014C: | | | |
| 425 | | 5.000%, 11/15/23 | No Opt. Call | A3 | 475,949 |
| 1,845 | | 5.000%, 11/15/32 | 11/24 at 100.00 | A3 | 2,066,179 |
| 14,905 | | Harris County-Houston Sports Authority, Texas, Revenue Bonds, Third Lien Series 2004A-3, | 11/24 at 59.10 | Baa2 | 7,286,756 |
| | | 0.000%, 11/15/33 – NPFG Insured | | | |
| | | Houston, Texas, Airport System Revenue Bonds, Refunding & Subordinate Lien Series 2018B: | | | |
| 1,590 | | 5.000%, 7/01/43 | 7/28 at 100.00 | A1 | 1,878,203 |
| 2,290 | | 5.000%, 7/01/48 | 7/28 at 100.00 | A1 | 2,694,002 |
| 4,045 | | Houston, Texas, General Obligation Bonds, Refunding Public Improvement Series 2014A, | No Opt. Call | AA | 4,290,531 |
| | | 5.000%, 3/01/21 | | | |
| | | Houston, Texas, Hotel Occupancy Tax and Special Revenue Bonds, Convention and | | | |
| | | Entertainment Project, Series 2001B: | | | |
| 24,755 | | 0.000%, 9/01/29 – AMBAC Insured | No Opt. Call | A | 18,621,949 |
| 12,940 | | 0.000%, 9/01/30 – AMBAC Insured | No Opt. Call | A | 9,321,588 |
| 10,000 | | 0.000%, 9/01/31 – AMBAC Insured | No Opt. Call | A | 6,876,700 |
| 19,500 | | 0.000%, 9/01/32 – AMBAC Insured | No Opt. Call | A | 12,758,070 |
| 5,120 | | Leander Independent School District, Williamson and Travis Counties, Texas, General | 8/25 at 100.00 | AAA | 5,836,339 |
| | | Obligation Bonds, Refunding Series 2015A, 5.000%, 8/15/39 | | | |
| 4,510 | | Leander Independent School District, Williamson and Travis Counties, Texas, General | 8/26 at 100.00 | AAA | 5,195,024 |
| | | Obligation Bonds, Refunding Series 2016A, 5.000%, 8/15/49 | | | |
34
| | | | | | |
Principal | | | Optional Call | | |
Amount (000) | | Description (1) | Provisions (2) | Ratings (3) | Value |
| | | Texas (continued) | | | |
| $ 2,000 | | Love Field Airport Modernization Corporation, Texas, Special Facilities Revenue Bonds, | 11/22 at 100.00 | A3 | $ 2,176,820 |
| | | Southwest Airlines Company – Love Field Modernization Program Project, Series 2012, | | | |
| | | 5.000%, 11/01/28 (AMT) | | | |
| | | Lubbock, Texas, Electric Light and Power System, Revenue Bonds, Series 2018: | | | |
| 2,170 | | 5.000%, 4/15/40 | 4/28 at 100.00 | AA– | 2,542,719 |
| 3,930 | | 5.000%, 4/15/43 | 4/28 at 100.00 | AA– | 4,591,222 |
| 1,750 | | Martin County Hospital District, Texas, Combination Limited Tax and Revenue Bonds, | 4/21 at 100.00 | BBB | 1,862,998 |
| | | Series 2011A, 7.250%, 4/01/36 | | | |
| 5,420 | | North Texas Municipal Water District, Water System Revenue Bonds, Refunding & | 3/22 at 100.00 | AAA | 5,901,025 |
| | | Improvement Series 2012, 5.000%, 9/01/26 | | | |
| | | North Texas Tollway Authority, System Revenue Bonds, Refunding First Tier Capital | | | |
| | | Appreciation Series 2008I: | | | |
| 30,000 | | 6.200%, 1/01/42 – AGC Insured | 1/25 at 100.00 | AA | 36,354,000 |
| 5,220 | | 6.500%, 1/01/43 | 1/25 at 100.00 | A+ | 6,410,839 |
| 15,450 | | North Texas Tollway Authority, System Revenue Bonds, Refunding First Tier, Series 2008D, | No Opt. Call | AA | 9,345,241 |
| | | 0.000%, 1/01/36 – AGC Insured | | | |
| 9,020 | | North Texas Tollway Authority, System Revenue Bonds, Refunding First Tier, Series 2015B, | 1/23 at 100.00 | A+ | 9,848,667 |
| | | 5.000%, 1/01/40 | | | |
| 8,000 | | North Texas Tollway Authority, System Revenue Bonds, Refunding Second Tier Series 2017B, | 1/27 at 100.00 | A | 9,174,000 |
| | | 5.000%, 1/01/43 | | | |
| 9,100 | | North Texas Tollway Authority, System Revenue Bonds, Refunding Second Tier, | 1/25 at 100.00 | A | 10,378,459 |
| | | Series 2015A, 5.000%, 1/01/32 | | | |
| 2,000 | | San Antonio Convention Center Hotel Finance Corporation, Texas, Contract Revenue | 6/19 at 100.00 | A3 | 2,000,400 |
| | | Empowerment Zone Bonds, Series 2005A, 5.000%, 7/15/39 – AMBAC Insured (AMT) | | | |
| | | Tarrant County Cultural Education Facilities Finance Corporation, Texas, Hospital | | | |
| | | Revenue Bonds, Scott & White Healthcare Project, Series 2010: | | | |
| 355 | | 5.500%, 8/15/45 (Pre-refunded 8/15/20) | 8/20 at 100.00 | N/R (4) | 372,313 |
| 4,455 | | 5.500%, 8/15/45 (Pre-refunded 8/15/20) | 8/20 at 100.00 | N/R (4) | 4,672,270 |
| 1,750 | | Tarrant County Cultural Education Facilities Finance Corporation, Texas, Revenue Bonds, | 8/26 at 100.00 | AA | 1,996,663 |
| | | Texas Health Resources System, Series 2016A, 5.000%, 2/15/41 | | | |
| 6,740 | | Texas Municipal Gas Acquisition and Supply Corporation I, Gas Supply Revenue Bonds, | No Opt. Call | A2 | 7,816,243 |
| | | Senior Lien Series 2008D, 6.250%, 12/15/26 | | | |
| | | Texas Municipal Gas Acquisition and Supply Corporation III, Gas Supply Revenue Bonds, | | | |
| | | Series 2012: | | | |
| 2,500 | | 5.000%, 12/15/26 | 12/22 at 100.00 | A3 | 2,741,075 |
| 10,400 | | 5.000%, 12/15/32 | 12/22 at 100.00 | A3 | 11,237,720 |
| 7,180 | | Texas Transportation Commission, Central Texas Turnpike System Revenue Bonds, First | 8/22 at 100.00 | A– | 7,697,104 |
| | | Tier Refunding Series 2012A, 5.000%, 8/15/41 | | | |
| 3,000 | | Texas Transportation Commission, Central Texas Turnpike System Revenue Bonds, First | 8/24 at 100.00 | A– | 3,358,890 |
| | | Tier Refunding Series 2015B, 5.000%, 8/15/37 | | | |
| 1,750 | | Texas Transportation Commission, Central Texas Turnpike System Revenue Bonds, Second | 8/24 at 100.00 | BBB+ | 1,955,240 |
| | | Tier Refunding Series 2015C, 5.000%, 8/15/33 | | | |
| 5,500 | | Texas Turnpike Authority, Central Texas Turnpike System Revenue Bonds, First Tier Series | No Opt. Call | A– | 4,761,075 |
| | | 2002A, 0.000%, 8/15/25 – AMBAC Insured | | | |
| | | Texas Water Development Board, State Water Implementation Revenue Fund Bonds, Master | | | |
| | | Trust Series 2017A: | | | |
| 12,500 | | 4.000%, 10/15/42 (UB) (6) | 10/27 at 100.00 | AAA | 13,561,125 |
| 6,500 | | 5.000%, 10/15/42 | 10/27 at 100.00 | AAA | 7,713,680 |
| 10,000 | | 4.000%, 10/15/47 (UB) (6) | 10/27 at 100.00 | AAA | 10,785,600 |
| 355,610 | | Total Texas | | | 339,730,738 |
35
| | |
NUV | Nuveen Municipal Value Fund, Inc. |
| | Portfolio of Investments (continued) |
| | April 30, 2019 (Unaudited) |
| | | | | | |
Principal | | | Optional Call | | |
Amount (000) | | Description (1) | Provisions (2) | Ratings (3) | Value |
| | | Utah – 0.9% | | | |
| $ 5,345 | | Salt Lake City, Utah, Airport Revenue Bonds, International Airport Series 2017B, 5.000%, 7/01/42 | 7/27 at 100.00 | A+ | $ 6,227,566 |
| 3,500 | | Salt Lake City, Utah, Airport Revenue Bonds, International Airport Series 2018B, 5.000%, 7/01/43 | 7/28 at 100.00 | A+ | 4,134,410 |
| | | Salt Lake County, Utah, Sales Tax Revenue Bonds, TRCC Series 2017: | | | |
| 695 | | 5.000%, 2/01/36 | 2/27 at 100.00 | AAA | 822,387 |
| 1,150 | | 5.000%, 2/01/37 | 2/27 at 100.00 | AAA | 1,353,815 |
| | | Utah Associated Municipal Power Systems, Revenue Bonds, Horse Butte Wind Project, | | | |
| | | Refunding Series 2017A: | | | |
| 1,250 | | 5.000%, 9/01/29 | 3/28 at 100.00 | A | 1,511,087 |
| 1,000 | | 5.000%, 9/01/30 | 3/28 at 100.00 | A | 1,200,840 |
| 1,250 | | 5.000%, 9/01/31 | 3/28 at 100.00 | A | 1,487,488 |
| 660 | | 5.000%, 9/01/32 | 3/28 at 100.00 | A | 782,641 |
| 540 | | Utah Water Finance Agency, Revenue Bonds, Pooled Loan Financing Program, Series 2017A, | 3/27 at 100.00 | AA | 634,365 |
| | | 5.000%, 3/01/37 | | | |
| 15,390 | | Total Utah | | | 18,154,599 |
| | | Virginia – 2.3% | | | |
| 1,805 | | Chesapeake Bay Bridge and Tunnel District, Virginia, General Resolution Revenue Bonds, | 7/26 at 100.00 | BBB | 2,024,398 |
| | | First Tier Series 2016, 5.000%, 7/01/46 | | | |
| 14,110 | | Metropolitan Washington Airports Authority, Virginia, Dulles Toll Road Revenue Bonds, | 4/22 at 100.00 | BBB+ | 14,969,158 |
| | | Dulles Metrorail & Capital Improvement Projects, Refunding Second Senior Lien Series 2014A, | | | |
| | | 5.000%, 10/01/53 | | | |
| 10,000 | | Metropolitan Washington Airports Authority, Virginia, Dulles Toll Road Revenue Bonds, | 10/28 at 100.00 | BBB+ | 13,005,200 |
| | | Dulles Metrorail Capital Appreciation, Second Senior Lien Series 2010B, 6.500%, 10/01/44 | | | |
| 4,355 | | Tobacco Settlement Financing Corporation of Virginia, Tobacco Settlement Asset Backed | 5/19 at 100.00 | B– | 4,233,191 |
| | | Bonds, Series 2007B1, 5.000%, 6/01/47 | | | |
| 4,350 | | Virginia Small Business Financing Authority, Private Activity Revenue Bonds, Transform | 6/27 at 100.00 | BBB | 4,761,031 |
| | | 66 P3 Project, Senior Lien Series 2017, 5.000%, 12/31/52 (AMT) | | | |
| | | Virginia Small Business Financing Authority, Senior Lien Revenue Bonds, Elizabeth River | | | |
| | | Crossing, Opco LLC Project, Series 2012: | | | |
| 4,180 | | 5.250%, 1/01/32 (AMT) | 7/22 at 100.00 | BBB | 4,478,744 |
| 1,355 | | 6.000%, 1/01/37 (AMT) | 7/22 at 100.00 | BBB | 1,495,744 |
| 3,770 | | 5.500%, 1/01/42 (AMT) | 7/22 at 100.00 | BBB | 4,073,636 |
| 43,925 | | Total Virginia | | | 49,041,102 |
| | | Washington – 2.9% | | | |
| | | Port of Seattle, Washington, Revenue Bonds, Refunding Intermediate Lien Series 2016: | | | |
| 1,930 | | 5.000%, 2/01/29 | 2/26 at 100.00 | AA– | 2,278,635 |
| 1,000 | | 5.000%, 2/01/30 | 2/26 at 100.00 | AA– | 1,174,390 |
| | | Spokane Public Facilities District, Washington, Hotel, Motel, and Sales Use Tax Revenue | | | |
| | | Bonds, Series 2017: | | | |
| 1,175 | | 5.000%, 12/01/38 | 6/27 at 100.00 | A+ | 1,352,425 |
| 5,000 | | 5.000%, 12/01/41 | 6/27 at 100.00 | A+ | 5,724,400 |
| 3,780 | | Washington Health Care Facilities Authority, Revenue Bonds, Fred Hutchinson Cancer | 1/21 at 100.00 | A+ | 3,960,079 |
| | | Research Center, Series 2011A, 5.625%, 1/01/35 | | | |
| 2,400 | | Washington Health Care Facilities Authority, Revenue Bonds, Kadlec Regional Medical | 12/20 at 100.00 | N/R (4) | 2,538,864 |
| | | Center, Series 2010, 5.375%, 12/01/33 (Pre-refunded 12/01/20) | | | |
| 12,000 | | Washington Health Care Facilities Authority, Revenue Bonds, Providence Health & | 10/22 at 100.00 | AA– | 13,098,960 |
| | | Services, Refunding Series 2012A, 5.000%, 10/01/33 | | | |
| 1,310 | | Washington Health Care Facilities Authority, Revenue Bonds, Virginia Mason Medical | 8/27 at 100.00 | BBB | 1,497,592 |
| | | Center, Series 2017, 5.000%, 8/15/30 | | | |
36
| | | | | | |
Principal | | | Optional Call | | |
Amount (000) | | Description (1) | Provisions (2) | Ratings (3) | Value |
| | | Washington (continued) | | | |
| | | Washington State Convention Center Public Facilities District, Lodging Tax Revenue | | | |
| | | Bonds, Series 2018: | | | |
| $ 2,715 | | 5.000%, 7/01/36 | 7/28 at 100.00 | A1 | $ 3,191,673 |
| 7,200 | | 5.000%, 7/01/48 | 7/28 at 100.00 | A1 | 8,306,568 |
| | | Washington State, Motor Vehicle Fuel Tax General Obligation Bonds, Series 2002-03C: | | | |
| 9,100 | | 0.000%, 6/01/29 – NPFG Insured | No Opt. Call | AA+ | 7,168,070 |
| 16,195 | | 0.000%, 6/01/30 – NPFG Insured | No Opt. Call | AA+ | 12,278,401 |
| 63,805 | | Total Washington | | | 62,570,057 |
| | | West Virginia – 0.5% | | | |
| 1,830 | | West Virginia Hospital Finance Authority, Hospital Revenue Bonds, Cabell Huntington | 1/29 at 100.00 | BBB+ | 2,105,195 |
| | | Hospital, Inc. Project, Refunding & Improvement Series 2018A, 5.000%, 1/01/36 | | | |
| 3,000 | | West Virginia Hospital Finance Authority, Hospital Revenue Bonds, West Virginia United | 6/23 at 100.00 | A | 3,329,250 |
| | | Health System Obligated Group, Refunding & Improvement Series 2013A, 5.500%, 6/01/44 | | | |
| 3,570 | | West Virginia Parkways Authority, Turnpike Toll Revenue Bonds, Senior Lien Series 2018, | 6/28 at 100.00 | AA– | 4,215,349 |
| | | 5.000%, 6/01/43 | | | |
| 8,400 | | Total West Virginia | | | 9,649,794 |
| | | Wisconsin – 2.4% | | | |
| 5,000 | | Wisconsin Health and Educational Facilities Authority, Revenue Bonds, Ascension Health | 11/21 at 100.00 | AA+ | 5,350,100 |
| | | Alliance Senior Credit Group, Series 2012D, 5.000%, 11/15/41 | | | |
| 3,350 | | Wisconsin Health and Educational Facilities Authority, Revenue Bonds, Ascension Health | 5/26 at 100.00 | AA+ | 3,517,601 |
| | | Alliance Senior Credit Group, Series 2016A, 4.000%, 11/15/46 | | | |
| 7,115 | | Wisconsin Health and Educational Facilities Authority, Revenue Bonds, Ascension Health, | 11/19 at 100.00 | AA+ | 7,230,903 |
| | | Senior Credit Group, Series 2010E, 5.000%, 11/15/33 | | | |
| 2,375 | | Wisconsin Health and Educational Facilities Authority, Revenue Bonds, Marshfield Clinic, | 2/22 at 100.00 | A– | 2,473,776 |
| | | Series 2012B, 5.000%, 2/15/40 | | | |
| 4,410 | | Wisconsin Health and Educational Facilities Authority, Revenue Bonds, Mercy Alliance, | 6/22 at 100.00 | A3 | 4,671,204 |
| | | Inc., Series 2012, 5.000%, 6/01/39 | | | |
| | | Wisconsin Health and Educational Facilities Authority, Revenue Bonds, Meriter Hospital, | | | |
| | | Inc., Series 2011A: | | | |
| 3,500 | | 5.750%, 5/01/35 (Pre-refunded 5/01/21) | 5/21 at 100.00 | N/R (4) | 3,780,805 |
| 5,000 | | 6.000%, 5/01/41 (Pre-refunded 5/01/21) | 5/21 at 100.00 | N/R (4) | 5,425,600 |
| 6,600 | | Wisconsin Health and Educational Facilities Authority, Revenue Bonds, Ministry Health | 8/22 at 100.00 | N/R (4) | 7,297,554 |
| | | Care, Inc., Refunding 2012C, 5.000%, 8/15/32 (Pre-refunded 8/15/22) | | | |
| 10,000 | | Wisconsin Health and Educational Facilities Authority, Revenue Bonds, SSM Healthcare | 6/20 at 100.00 | AA– (4) | 10,357,200 |
| | | System, Series 2010A, 5.000%, 6/01/30 (Pre-refunded 6/01/20) | | | |
| 47,350 | | Total Wisconsin | | | 50,104,743 |
| | | Wyoming – 0.2% | | | |
| 2,035 | | Campbell County, Wyoming Solid Waste Facilities Revenue Bonds, Basin Electric Power | 7/19 at 100.00 | A | 2,050,853 |
| | | Cooperative – Dry Fork Station Facilities, Series 2009A, 5.750%, 7/15/39 | | | |
| 1,850 | | West Park Hospital District, Wyoming, Hospital Revenue Bonds, Series 2011A, 7.000%, 6/01/40 | 6/21 at 100.00 | BBB | 1,981,886 |
| 3,885 | | Total Wyoming | | | 4,032,739 |
| $ 2,185,028 | | Total Municipal Bonds (cost $1,942,362,830) | | | 2,128,101,948 |
37
| | |
NUV | Nuveen Municipal Value Fund, Inc. |
| | Portfolio of Investments (continued) |
| | April 30, 2019 (Unaudited) |
| | | | | | | |
Principal | | | | | | |
Amount (000) | | Description (1) | Coupon | Maturity | Ratings (3) | Value |
| | | CORPORATE BONDS – 0.0% | | | | |
| | | Transportation – 0.0% | | | | |
| $ 782 | | Las Vegas Monorail Company, Senior Interest Bonds (8), (9) | 5.500% | 7/15/19 | N/R | $ 519,995 |
| 224 | | Las Vegas Monorail Company, Senior Interest Bonds (7), (8), (9) | 5.500% | 7/15/55 | N/R | 111,543 |
| $ 1,006 | | Total Corporate Bonds (cost $36,752) | | | | 631,538 |
| | | Total Long-Term Investments (cost $1,942,399,582) | | | | 2,128,733,486 |
| | | Floating Rate Obligations – (1.8)% | | | | (37,705,000) |
| | | Other Assets Less Liabilities – 1.8% | | | | 37,558,881 |
| | | Net Assets Applicable to Common Shares – 100% | | | | $ 2,128,587,367 |
| | |
| (1) | All percentages shown in the Portfolio of Investments are based on net assets applicable to common shares unless otherwise noted. |
| (2) | Optional Call Provisions: Dates (month and year) and prices of the earliest optional call or redemption. There may be other call provisions at varying prices at later dates. Certain mortgage-backed securities may be subject to periodic principal paydowns. |
| (3) | For financial reporting purposes, the ratings disclosed are the highest of Standard & Poor’s Group (“Standard & Poor’s”), Moody’s Investors Service, Inc. (“Moody’s”) or Fitch, Inc. (“Fitch”) rating. This treatment of split-rated securities may differ from that used for other purposes, such as for Fund investment policies. Ratings below BBB by Standard & Poor’s, Baa by Moody’s or BBB by Fitch are considered to be below investment grade. Holdings designated N/R are not rated by any of these national rating agencies. |
| (4) | Backed by an escrow or trust containing sufficient U.S. Government or U.S. Government agency securities, which ensure the timely payment of principal and interest. |
| (5) | Step-up coupon bond, a bond with a coupon that Increases (“steps up”), usually at regular intervals, while the bond is outstanding. The rate shown is the coupon as of the end of the reporting period. |
| (6) | Investment, or portion of investment, has been pledged to collateralize the net payment obligations for investments in inverse floating rate transactions. |
| (7) | Defaulted security. A security whose issuer has failed to fully pay principal and/or interest when due, or is under the protection of bankruptcy. |
| (8) | Investment valued at fair value using methods determined in good faith by, or at the discretion of, the Board. For fair value measurement disclosure purposes, investment classified as Level 3. See Notes to Financial Statements, Note 2 – Investment Valuation and Fair Value Measurements for more information. |
| (9) | The tax-exempt municipal bonds previously held by the Fund were surrendered in conjunction with the issuer’s bankruptcy reorganization plan. In return, the Fund received one or more senior interest corporate bonds. |
| 144A | Investment is exempt from registration under Rule 144A of the Securities Act of 1933, as amended. These investments may only be resold in transactions exempt from registration, which are normally those transactions with qualified institutional buyers. |
| AMT | Alternative Minimum Tax. |
| ETM | Escrowed to maturity. |
| PIK | Payment-in-kind (“PIK”) security. Depending on the terms of the security, Income may be received in the form of cash, securities, or a combination of both. The PIK rate shown, where applicable, represents the annualized rate of the last PIK payment made by the issuer as of the end of the reporting period. |
| UB | Underlying bond of an inverse floating rate trust reflected as a financing transaction. See Notes to Financial Statements, Note 3 – Portfolio Securities and Investments in Derivatives, Inverse Floating Rate Securities for more information. |
| WI/DD | Purchased on a when-issued or delayed delivery basis. |
See accompanying notes to financial statements.
38
| | |
NUW | Nuveen AMT-Free Municipal Value Fund |
| | Portfolio of Investments |
| | April 30, 2019 (Unaudited) |
| | | | | | |
Principal | | | Optional Call | | |
Amount (000) | | Description (1) | Provisions (2) | Ratings (3) | Value |
| | | LONG-TERM INVESTMENTS – 96.1% | | | |
| | | MUNICIPAL BONDS – 96.1% | | | |
| | | Alaska – 0.2% | | | |
| | | Northern Tobacco Securitization Corporation, Alaska, Tobacco Settlement Asset-Backed | | | |
| | | Bonds, Series 2006A: | | | |
| $ 115 | | 4.625%, 6/01/23 | 5/19 at 100.00 | A3 | $ 115,032 |
| 385 | | 5.000%, 6/01/46 | 5/19 at 100.00 | B3 | 376,823 |
| 500 | | Total Alaska | | | 491,855 |
| | | Arizona – 1.5% | | | |
| 3,045 | | Salt Verde Financial Corporation, Arizona, Senior Gas Revenue Bonds, Citigroup Energy | No Opt. Call | BBB+ | 3,839,806 |
| | | Inc Prepay Contract Obligations, Series 2007, 5.000%, 12/01/37 | | | |
| | | California – 13.6% | | | |
| 1,790 | | Alameda Corridor Transportation Authority, California, Revenue Bonds, Refunding Second | 10/26 at 100.00 | BBB+ | 2,015,021 |
| | | Subordinate Lien Series 2016B, 5.000%, 10/01/37 | | | |
| 1,730 | | Anaheim Public Financing Authority, California, Lease Revenue Bonds, Public Improvement | No Opt. Call | AA | 1,258,835 |
| | | Project, Series 1997C, 0.000%, 9/01/30 – AGM Insured | | | |
| 340 | | California Pollution Control Financing Authority, Water Furnishing Revenue Bonds, San | 1/29 at 100.00 | Baa3 | 391,428 |
| | | Diego County Water Authority Desalination Project Pipeline, Refunding Series 2019, 5.000%, | | | |
| | | 11/21/45, 144A | | | |
| 500 | | California State, General Obligation Bonds, Tender Option Bond Trust 2016-XG0039, 12.990%, | 3/20 at 100.00 | AA | 558,455 |
| | | 3/01/40 – AGM Insured, 144A (IF) (4) | | | |
| 540 | | Golden State Tobacco Securitization Corporation, California, Tobacco Settlement | 6/22 at 100.00 | N/R | 543,634 |
| | | Asset-Backed Bonds, Series 2018A-1, 5.250%, 6/01/47 | | | |
| 2,040 | | Los Angeles Department of Airports, California, Revenue Bonds, Los Angeles International | 5/29 at 100.00 | AA– | 2,630,315 |
| | | Airport, Refunding Series 2019C, 5.000%, 5/15/30 | | | |
| 450 | | M-S-R Energy Authority, California, Gas Revenue Bonds, Citigroup Prepay Contracts, | No Opt. Call | A | 664,034 |
| | | Series 2009A, 6.500%, 11/01/39 | | | |
| 10,200 | | Palomar Pomerado Health, California, General Obligation Bonds, Series 2009A, 0.000%, | 8/29 at 100.00 | BB+ | 13,505,922 |
| | | 8/01/38 – AGC Insured (5) | | | |
| 1,030 | | Poway Unified School District, San Diego County, California, General Obligation Bonds, | No Opt. Call | AA– | 633,759 |
| | | School Facilities Improvement District 2007-1, Series 2011A, 0.000%, 8/01/35 | | | |
| 2,470 | | San Francisco Airports Commission, California, Revenue Bonds, San Francisco | 5/27 at 100.00 | A+ | 2,869,078 |
| | | International Airport, Governmental Purpose Second Series 2017B, 5.000%, 5/01/47 | | | |
| 12,955 | | San Ysidro School District, San Diego County, California, General Obligation Bonds, 1997 | No Opt. Call | AA | 7,312,061 |
| | | Election Series 2012G, 0.000%, 8/01/35 – AGM Insured | | | |
| 5,185 | | San Ysidro School District, San Diego County, California, General Obligation Bonds, | 8/25 at 36.88 | AA | 1,562,603 |
| | | Refunding Series 2015, 0.000%, 8/01/44 | | | |
| 700 | | Victor Elementary School District, San Bernardino County, California, General Obligation | No Opt. Call | Aa3 | 625,436 |
| | | Bonds, Series 2002A, 0.000%, 8/01/24 – FGIC Insured | | | |
| 39,930 | | Total California | | | 34,570,581 |
| | | Colorado – 5.6% | | | |
| | | Denver Convention Center Hotel Authority, Colorado, Revenue Bonds, Convention Center | | | |
| | | Hotel, Refunding Senior Lien Series 2016: | | | |
| 1,000 | | 5.000%, 12/01/30 | 12/26 at 100.00 | Baa2 | 1,136,980 |
| 1,500 | | 5.000%, 12/01/36 | 12/26 at 100.00 | Baa2 | 1,699,065 |
| 5,885 | | E-470 Public Highway Authority, Colorado, Toll Revenue Bonds, Series 2004A, 0.000%, | No Opt. Call | BBB+ | 3,491,453 |
| | | 9/01/34 – NPFG Insured | | | |
39
| | |
NUW | Nuveen AMT-Free Municipal Value Fund |
| | Portfolio of Investments (continued) |
| | April 30, 2019 (Unaudited) |
| | | | | | |
Principal | | | Optional Call | | |
Amount (000) | | Description (1) | Provisions (2) | Ratings (3) | Value |
| | | Colorado (continued) | | | |
| $ 3,605 | | E-470 Public Highway Authority, Colorado, Toll Revenue Bonds, Series 2004B, 0.000%, | 9/20 at 67.94 | A | $ 2,370,864 |
| | | 9/01/27 – NPFG Insured | | | |
| 4,000 | | Park Creek Metropolitan District, Colorado, Senior Limited Property Tax Supported Revenue | 12/19 at 100.00 | AA (6) | 4,110,800 |
| | | Bonds, Refunding Series 2009, 6.375%, 12/01/37 (Pre-refunded 12/01/19) – AGC Insured | | | |
| 1,000 | | Public Authority for Colorado Energy, Natural Gas Purchase Revenue Bonds, Colorado | No Opt. Call | A+ | 1,491,750 |
| | | Springs Utilities, Series 2008, 6.500%, 11/15/38 | | | |
| 16,990 | | Total Colorado | | | 14,300,912 |
| | | Florida – 7.9% | | | |
| 500 | | Gainesville, Florida, Utilities System Revenue Bonds, Series 2017A, 5.000%, 10/01/37 | 10/27 at 100.00 | AA– | 595,585 |
| 1,605 | | Lakeland, Florida, Hospital System Revenue Bonds, Lakeland Regional Health, Series 2015, | 11/24 at 100.00 | A2 | 1,767,940 |
| | | 5.000%, 11/15/45 | | | |
| 535 | | Miami Beach Redevelopment Agency, Florida, Tax Increment Revenue Bonds, City | 2/24 at 100.00 | A1 | 597,969 |
| | | Center/Historic Convention Village, Series 2015A, 5.000%, 2/01/44 – AGM Insured | | | |
| 9,500 | | Miami-Dade County, Florida, Aviation Revenue Bonds, Miami International Airport, | 10/19 at 100.00 | A2 (6) | 9,653,615 |
| | | Series 2009A, 5.500%, 10/01/41 (Pre-refunded 10/01/19) (UB) (4) | | | |
| 3,350 | | Miami-Dade County, Florida, Water and Sewer System Revenue Bonds, Refunding | 10/25 at 100.00 | AA– | 3,903,487 |
| | | Series 2017B, 5.000%, 10/01/32 | | | |
| 510 | | Putnam County Development Authority, Florida, Pollution Control Revenue Bonds, Seminole | 5/28 at 100.00 | A– | 585,771 |
| | | Electric Cooperative, Inc Project, Refunding Series 2018B, 5.000%, 3/15/42 | | | |
| 860 | | Tolomato Community Development District, Florida, Special Assessment Bonds, Convertible, | 6/19 at 100.00 | N/R | 860,413 |
| | | Capital Appreciation, Series 2012A-3, 6.610%, 5/01/40 (5) | | | |
| 375 | | Tolomato Community Development District, Florida, Special Assessment Bonds, Convertible, | 5/22 at 100.00 | N/R | 313,012 |
| | | Capital Appreciation, Series 2012A-4, 6.610%, 5/01/40 (5) | | | |
| 525 | | Tolomato Community Development District, Florida, Special Assessment Bonds, Hope Note, | 6/19 at 100.00 | N/R | 5 |
| | | Series 2007-3, 6.450%, 5/01/23 (7) | | | |
| 30 | | Tolomato Community Development District, Florida, Special Assessment Bonds, Non | 6/19 at 100.00 | N/R | 29,997 |
| | | Performing Parcel Series 2007-1 RMKT, 6.450%, 5/01/23 | | | |
| 1,315 | | Tolomato Community Development District, Florida, Special Assessment Bonds, Refunding | 6/19 at 100.00 | N/R | 1,079,720 |
| | | Series 2015-1, 6.610%, 5/01/40 | | | |
| 805 | | Tolomato Community Development District, Florida, Special Assessment Bonds, Refunding | 6/19 at 100.00 | N/R | 543,077 |
| | | Series 2015-2, 6.610%, 5/01/40 | | | |
| 880 | | Tolomato Community Development District, Florida, Special Assessment Bonds, Refunding | 6/19 at 100.00 | N/R | 9 |
| | | Series 2015-3, 6.610%, 5/01/40 (7) | | | |
| 20,790 | | Total Florida | | | 19,930,600 |
| | | Georgia – 3.4% | | | |
| 1,000 | | Clayton County Development Authority, Georgia, Special Facilities Revenue Bonds, Delta | 6/20 at 100.00 | Baa3 | 1,071,640 |
| | | Air Lines, Inc Project, Series 2009A, 8.750%, 6/01/29 | | | |
| 2,000 | | Gainesville and Hall County Hospital Authority, Georgia, Revenue Anticipation | 2/27 at 100.00 | AA | 2,399,500 |
| | | Certificates, Northeast Georgia Health Services Inc, Series 2017B, 5.500%, 2/15/42 | | | |
| 1,470 | | Municipal Electric Authority of Georgia, General Resolution Projects Subordinated Bonds, | 1/28 at 100.00 | A1 | 1,651,868 |
| | | Series 20188HH, 5.000%, 1/01/44 | | | |
| 2,000 | | Municipal Electric Authority of Georgia, Project One Revenue Bonds, Subordinate Lien | 1/25 at 100.00 | A2 | 2,202,740 |
| | | Series 2015A, 5.000%, 1/01/35 | | | |
| 1,000 | | Private Colleges and Universities Authority, Georgia, Revenue Bonds, Emory University, | 10/26 at 100.00 | AA+ | 1,163,930 |
| | | Refunding Series 2016A, 5.000%, 10/01/46 | | | |
| 7,470 | | Total Georgia | | | 8,489,678 |
40
| | | | | | |
Principal | | | Optional Call | | |
Amount (000) | | Description (1) | Provisions (2) | Ratings (3) | Value |
| | | Illinois – 9.2% | | | |
| $ 2,000 | | Chicago Board of Education, Illinois, Dedicated Capital Improvement Tax Revenue Bonds, | 4/27 at 100.00 | A | $ 2,317,480 |
| | | Series 2016, 6.000%, 4/01/46 | | | |
| | | Chicago, Illinois, General Obligation Bonds, City Colleges, Series 1999: | | | |
| 470 | | 0.000%, 1/01/33 – FGIC Insured | No Opt. Call | BBB– | 276,069 |
| 3,000 | | 0.000%, 1/01/37 – FGIC Insured | No Opt. Call | BBB– | 1,452,780 |
| 2,000 | | Cook County, Illinois, Sales Tax Revenue Bonds, Series 2017, 5.000%, 11/15/38 | 11/27 at 100.00 | AA | 2,291,240 |
| 5,035 | | Illinois Finance Authority, Revenue Bonds, Northwestern Memorial Hospital, Series 2009A, | 8/19 at 100.00 | N/R (6) | 5,097,635 |
| | | 6.000%, 8/15/39 (Pre-refunded 8/15/19) | | | |
| 3,500 | | Illinois Finance Authority, State of Illinois Clean Water Initiative Revolving Fund | 1/27 at 100.00 | AAA | 4,095,980 |
| | | Revenue Bonds, Series 2017, 5.000%, 7/01/37 | | | |
| 525 | | Illinois State, General Obligation Bonds, October Series 2016, 5.000%, 2/01/29 | 2/27 at 100.00 | BBB– | 574,549 |
| 11,420 | | Metropolitan Pier and Exposition Authority, Illinois, Revenue Bonds, McCormick Place | No Opt. Call | BBB | 5,495,647 |
| | | Expansion Project, Series 2002A, 0.000%, 12/15/37 – NPFG Insured | | | |
| 615 | | University of Illinois, Health Services Facilities System Revenue Bonds, Series 2013, | 10/23 at 100.00 | Baa1 | 693,050 |
| | | 6.000%, 10/01/42 | | | |
| | | Will County Community Unit School District 201U, Crete-Monee, Illinois, General | | | |
| | | Obligation Bonds, Capital Appreciation Series 2004: | | | |
| 300 | | 0.000%, 11/01/23 – NPFG Insured (ETM) | No Opt. Call | Baa2 (6) | 273,951 |
| 745 | | 0.000%, 11/01/23 – FGIC Insured | No Opt. Call | A+ | 664,860 |
| 29,610 | | Total Illinois | | | 23,233,241 |
| | | Indiana – 0.5% | | | |
| 1,500 | | Indianapolis Local Public Improvement Bond Bank, Indiana, Series 1999E, 0.000%, | No Opt. Call | AA | 1,315,140 |
| | | 2/01/25 – AMBAC Insured | | | |
| | | Iowa – 1.2% | | | |
| 3,075 | | Iowa Tobacco Settlement Authority, Asset Backed Settlement Revenue Bonds, Series 2005C, | 6/19 at 100.00 | B2 | 3,044,557 |
| | | 5.375%, 6/01/38 | | | |
| | | Kentucky – 3.2% | | | |
| 1,150 | | Kenton County Airport Board, Kentucky, Airport Revenue Bonds, Cincinnati/Northern | 1/26 at 100.00 | A1 | 1,359,818 |
| | | Kentucky International Airport, Series 2016, 5.000%, 1/01/29 | | | |
| 2,500 | | Kentucky Economic Development Finance Authority, Louisville Arena Project Revenue Bonds, | 12/22 at 100.00 | AA | 2,710,500 |
| | | Louisville Arena Authority, Inc, Series 2017A, 5.000%, 12/01/47 – AGM Insured | | | |
| 3,750 | | Kentucky Economic Development Finance Authority, Revenue Bonds, Next Generation Kentucky | 7/25 at 100.00 | Baa2 | 3,987,412 |
| | | Information Highway Project, Senior Series 2015A, 5.000%, 1/01/45 | | | |
| 7,400 | | Total Kentucky | | | 8,057,730 |
| | | Maine – 1.3% | | | |
| 3,335 | | Maine Health and Higher Educational Facilities Authority, Revenue Bonds, Bowdoin | No Opt. Call | Aa2 (6) | 3,381,957 |
| | | College, Tender Option Bond Trust 2016-XL0014, 9.209%, 7/01/39, 144A | | | |
| | | (Pre-refunded 7/01/19) (IF) (4) | | | |
| | | Maryland – 3.7% | | | |
| | | Baltimore, Maryland, Convention Center Hotel Revenue Bonds, Refunding Series 2017: | | | |
| 1,000 | | 5.000%, 9/01/32 | 9/27 at 100.00 | BBB– | 1,150,100 |
| 2,250 | | 5.000%, 9/01/34 | 9/27 at 100.00 | BBB– | 2,565,495 |
| 5,000 | | Maryland Health and Higher Educational Facilities Authority, Revenue Bonds, MedStar | 5/27 at 100.00 | A | 5,656,600 |
| | | Health Issue, Series 2017A, 5.000%, 5/15/42 | | | |
| 8,250 | | Total Maryland | | | 9,372,195 |
| | | Massachusetts – 0.4% | | | |
| 1,000 | | Massachusetts Water Pollution Abatement Trust, Pooled Loan Program Bonds, Tender Option | 8/19 at 100.00 | AAA | 1,023,150 |
| | | Bond Trust 2015-XF2186, 9.208%, 8/01/38, 144A (IF) (4) | | | |
41
| | |
NUW | Nuveen AMT-Free Municipal Value Fund |
| | Portfolio of Investments (continued) |
| | April 30, 2019 (Unaudited) |
| | | | | | |
Principal | | | Optional Call | | |
Amount (000) | | Description (1) | Provisions (2) | Ratings (3) | Value |
| | | Michigan – 1.7% | | | |
| $ 3,000 | | Michigan Finance Authority, Michigan, Revenue Bonds, Trinity Health Credit Group, | 12/22 at 100.00 | AA– | $ 3,241,620 |
| | | Refunding Series 2017A-MI, 5.000%, 12/01/47 | | | |
| 1,000 | | Michigan Finance Authority, Senior Lien Distributable State Aid Revenue Bonds, Charter | 11/28 at 100.00 | Aa3 | 1,172,210 |
| | | County of Wayne Criminal Justice Center Project, Series 2018, 5.000%, 11/01/43 | | | |
| 4,000 | | Total Michigan | | | 4,413,830 |
| | | Minnesota – 1.0% | | | |
| 1,145 | | Rochester, Minnesota, Electric Utility Revenue Bonds, Refunding Series 2017A, 5.000%, 12/01/47 | 12/26 at 100.00 | Aa3 | 1,323,986 |
| 1,000 | | University of Minnesota, General Obligation Bonds, Series 2017A, 5.000%, 9/01/36 | 9/27 at 100.00 | Aa1 | 1,199,320 |
| 2,145 | | Total Minnesota | | | 2,523,306 |
| | | Montana – 0.5% | | | |
| | | Missoula City, Montana, Water System Revenue Bonds, Series 2019A: | | | |
| 685 | | 5.000%, 7/01/25 | No Opt. Call | A+ | 812,150 |
| 300 | | 5.000%, 7/01/26 | No Opt. Call | A+ | 362,829 |
| 985 | | Total Montana | | | 1,174,979 |
| | | Nebraska – 0.2% | | | |
| 500 | | Central Plains Energy Project, Nebraska, Gas Project 3 Revenue Bonds, Series 2012, | 9/22 at 100.00 | A | 541,690 |
| | | 5.000%, 9/01/42 | | | |
| | | Nevada – 6.4% | | | |
| 3,000 | | Clark County, Nevada, General Obligation Bonds, Limited Tax, Additionally Secured by | 12/28 at 100.00 | AA+ | 3,668,910 |
| | | Pledged Revenues, Transportation Improvement Series 2018B, 5.000%, 12/01/33 | | | |
| 4,000 | | Las Vegas Convention and Visitors Authority, Nevada, Revenue Bonds, Series 2018C, | 7/28 at 100.00 | Aa3 | 4,755,600 |
| | | 5.250%, 7/01/43 | | | |
| 5,415 | | Las Vegas Redevelopment Agency, Nevada, Tax Increment Revenue Bonds, Series 2009A, | 6/19 at 100.00 | BBB+ (6) | 5,455,342 |
| | | 8.000%, 6/15/30 (Pre-refunded 6/15/19) | | | |
| 2,000 | | Las Vegas Valley Water District, Nevada, General Obligation Bonds, Refunding | 12/24 at 100.00 | AA+ | 2,284,900 |
| | | Series 2015, 5.000%, 6/01/39 | | | |
| 14,415 | | Total Nevada | | | 16,164,752 |
| | | New Jersey – 4.9% | | | |
| 935 | | New Jersey Economic Development Authority, School Facilities Construction Bonds, | No Opt. Call | BBB+ | 1,134,211 |
| | | Series 2005N-1, 5.500%, 9/01/27 – NPFG Insured | | | |
| 1,000 | | New Jersey Economic Development Authority, School Facilities Construction Financing | 3/21 at 100.00 | A– | 1,048,370 |
| | | Program Bonds, Refunding Series 2011GG, 5.000%, 9/01/22 | | | |
| 1,250 | | New Jersey Economic Development Authority, School Facility Construction Bonds, | No Opt. Call | A– | 1,278,025 |
| | | Series 2005K, 5.500%, 12/15/19 – AMBAC Insured | | | |
| | | New Jersey Educational Facilities Authority, Revenue Bonds, University of Medicine and | | | |
| | | Dentistry of New Jersey, Refunding Series 2009B: | | | |
| 2,135 | | 7.125%, 12/01/23 (Pre-refunded 6/01/19) | 6/19 at 100.00 | N/R (6) | 2,144,501 |
| 3,000 | | 7.500%, 12/01/32 (Pre-refunded 6/01/19) | 6/19 at 100.00 | N/R (6) | 3,014,250 |
| 5,020 | | New Jersey Transportation Trust Fund Authority, Transportation System Bonds, Capital | No Opt. Call | A– | 3,174,548 |
| | | Appreciation Series 2010A, 0.000%, 12/15/31 | | | |
| 255 | | New Jersey Transportation Trust Fund Authority, Transportation System Bonds, | 6/25 at 100.00 | BBB+ | 277,320 |
| | | Series 2015AA, 5.250%, 6/15/41 | | | |
| 355 | | Tobacco Settlement Financing Corporation, New Jersey, Tobacco Settlement Asset-Backed | 6/28 at 100.00 | BBB | 370,790 |
| | | Bonds, Series 2018B, 5.000%, 6/01/46 | | | |
| 13,950 | | Total New Jersey | | | 12,442,015 |
42
| | | | | | |
Principal | | | Optional Call | | |
Amount (000) | | Description (1) | Provisions (2) | Ratings (3) | Value |
| | | New York – 4.1% | | | |
| $ 3,000 | | Liberty Development Corporation, New York, Goldman Sachs Headquarters Revenue Bonds | No Opt. Call | A | $ 3,979,530 |
| | | Series 2007, 5.500%, 10/01/37 | | | |
| 1,500 | | Long Island Power Authority, New York, Electric System General Revenue Bonds, | 9/27 at 100.00 | A– | 1,745,940 |
| | | Series 2017, 5.000%, 9/01/42 | | | |
| 2,050 | | Long Island Power Authority, New York, Electric System General Revenue Bonds, | 9/28 at 100.00 | A– | 2,441,038 |
| | | Series 2018, 5.000%, 9/01/39 | | | |
| 1,500 | | New York Liberty Development Corporation, New York, Liberty Revenue Bonds, 4 World | 11/21 at 100.00 | A | 1,644,555 |
| | | Trade Center Project, Series 2011, 5.750%, 11/15/51 | | | |
| 430 | | Port Authority of New York and New Jersey, Special Project Bonds, JFK International Air | 12/20 at 100.00 | BBB+ | 455,146 |
| | | Terminal LLC Project, Eigth Series 2010, 6.000%, 12/01/42 | | | |
| 8,480 | | Total New York | | | 10,266,209 |
| | | North Carolina – 1.7% | | | |
| 1,000 | | North Carolina Capital Facilities Finance Agency, Revenue Bonds, Duke University | 10/26 at 100.00 | AA+ | 1,174,900 |
| | | Project, Refunding Series 2016B, 5.000%, 7/01/42 | | | |
| 2,360 | | North Carolina Medical Care Commission Health Care Facilities Revenue Bonds Novant | 11/20 at 100.00 | Aa3 | 2,440,311 |
| | | Health Inc, Series 2010A, 4.750%, 11/01/43 | | | |
| 700 | | North Carolina Turnpike Authority, Triangle Expressway System Revenue Bonds, Refunding | 1/27 at 100.00 | BBB | 801,542 |
| | | Senior Lien Series 2017, 5.000%, 1/01/32 | | | |
| 4,060 | | Total North Carolina | | | 4,416,753 |
| | | Ohio – 3.7% | | | |
| | | Buckeye Tobacco Settlement Financing Authority, Ohio, Tobacco Settlement Asset-Backed | | | |
| | | Revenue Bonds, Senior Lien, Series 2007A-2: | | | |
| 2,115 | | 5.875%, 6/01/30 | 5/19 at 100.00 | Caa3 | 2,025,112 |
| 5,910 | | 6.500%, 6/01/47 | 5/19 at 100.00 | B– | 5,895,934 |
| 1,305 | | Franklin County, Ohio, Revenue Bonds, Trinity Health Credit Group, Series 2017OH, | 6/27 at 100.00 | AA– | 1,378,733 |
| | | 4.000%, 12/01/46 | | | |
| 9,330 | | Total Ohio | | | 9,299,779 |
| | | Oklahoma – 0.1% | | | |
| 255 | | Oklahoma Development Finance Authority, Health System Revenue Bonds, OU Medicine | 8/28 at 100.00 | Baa3 | 290,550 |
| | | Project, Series 2018B, 5.250%, 8/15/43 | | | |
| | | South Carolina – 1.7% | | | |
| 5,435 | | Piedmont Municipal Power Agency, South Carolina, Electric Revenue Bonds, Series 2004A-2, | No Opt. Call | AA | 4,191,798 |
| | | 0.000%, 1/01/29 – AGC Insured | | | |
| | | Tennessee – 0.3% | | | |
| 605 | | Metropolitan Government of Nashville-Davidson County, Tennessee, Water and Sewerage | 7/27 at 100.00 | AA | 709,731 |
| | | Revenue Bonds, Green Series 2017A, 5.000%, 7/01/42 | | | |
| | | Texas – 12.0% | | | |
| 1,000 | | Austin Community College District Public Facility Corporation, Texas, Lease Revenue | 8/27 at 100.00 | AA | 1,146,680 |
| | | Bonds, Highland Campus – Building 3000 Project, Series 2018A, 5.000%, 8/01/42 | | | |
| 2,000 | | Austin, Texas, Electric Utility System Revenue Bonds, Refunding Series 2017, 5.000%, 11/15/35 | 11/26 at 100.00 | AA | 2,361,900 |
| 1,855 | | Grand Parkway Transportation Corporation, Texas, System Toll Revenue Bonds, First Tier | 10/23 at 100.00 | A+ | 2,069,809 |
| | | Series 2013A, 5.500%, 4/01/53 | | | |
| | | Houston, Texas, Hotel Occupancy Tax and Special Revenue Bonds, Convention and | | | |
| | | Entertainment Project, Series 2001B: | | | |
| 3,000 | | 0.000%, 9/01/32 – AMBAC Insured | No Opt. Call | A | 1,962,780 |
| 7,935 | | 0.000%, 9/01/33 – AMBAC Insured | No Opt. Call | A | 4,928,111 |
| 2,000 | | Lower Colorado River Authority, Texas, Transmission Contract Revenue Bonds, LCRA | No Opt. Call | A+ | 2,254,460 |
| | | Transmission Services Corporation Project, Refunding Series 2019, 5.000%, 5/15/23 | | | |
43
| | |
NUW | Nuveen AMT-Free Municipal Value Fund |
| | Portfolio of Investments (continued) |
| | April 30, 2019 (Unaudited) |
| | | | | | |
Principal | | | Optional Call | | |
Amount (000) | | Description (1) | Provisions (2) | Ratings (3) | Value |
| | | Texas (continued) | | | |
| $ 915 | | North Texas Tollway Authority, System Revenue Bonds, Refunding First Tier, Series 2015B, | 1/25 at 100.00 | A+ | $ 1,023,217 |
| | | 5.000%, 1/01/45 | | | |
| 250 | | Tarrant County Cultural Education Facilities Finance Corporation, Texas, Revenue Bonds, | 8/26 at 100.00 | AA | 285,238 |
| | | Texas Health Resources System, Series 2016A, 5.000%, 2/15/41 | | | |
| 1,500 | | Texas Municipal Gas Acquisition and Supply Corporation III, Gas Supply Revenue Bonds, | 12/22 at 100.00 | BBB | 1,620,825 |
| | | Series 2012, 5.000%, 12/15/32 | | | |
| 7,635 | | Texas Water Development Board, State Water Implementation Revenue Fund Bonds, Master | 10/26 at 100.00 | AAA | 8,232,821 |
| | | Trust Series 2016, 4.000%, 10/15/41 | | | |
| 2,500 | | Texas Water Development Board, State Water Implementation Revenue Fund Bonds, Master | 10/27 at 100.00 | AAA | 2,712,225 |
| | | Trust Series 2017A, 4.000%, 10/15/42 (UB) (4) | | | |
| | | Wylie Independent School District, Collin County, Texas, General Obligation Bonds, | | | |
| | | School Building Series 2010: | | | |
| 2,000 | | 0.000%, 8/15/33 | 8/20 at 50.47 | AAA | 975,920 |
| 1,945 | | 0.000%, 8/15/38 | 8/20 at 37.79 | AAA | 708,777 |
| 34,535 | | Total Texas | | | 30,282,763 |
| | | Utah – 0.7% | | | |
| 1,405 | | Salt Lake City, Utah, Airport Revenue Bonds, International Airport Series 2017B, 5.000%, 7/01/42 | 7/27 at 100.00 | A+ | 1,636,994 |
| | | Virginia – 1.4% | | | |
| 1,160 | | Chesapeake Bay Bridge and Tunnel District, Virginia, General Resolution Revenue Bonds, | 7/26 at 100.00 | BBB | 1,293,029 |
| | | First Tier Series 2016, 5.000%, 7/01/51 | | | |
| 1,400 | | Chesapeake, Virginia, Transportation System Senior Toll Road Revenue Bonds, Capital | 7/28 at 100.00 | BBB | 1,305,556 |
| | | Appreciation Series 2012B, 4.875%, 7/15/40 (5) | | | |
| 1,000 | | Metropolitan Washington Airports Authority, Virginia, Dulles Toll Road Revenue Bonds, | 4/22 at 100.00 | BBB+ | 1,060,890 |
| | | Dulles Metrorail & Capital Improvement Projects, Refunding Second Senior Lien Series 2014A, | | | |
| | | 5.000%, 10/01/53 | | | |
| 3,560 | | Total Virginia | | | 3,659,475 |
| | | Washington – 2.2% | | | |
| 3,330 | | Chelan County Public Utility District 1, Washington, Columbia River-Rock Island | No Opt. Call | AA+ | 2,578,985 |
| | | Hydro-Electric System Revenue Refunding Bonds, Series 1997A, 0.000%, 6/01/29 – NPFG Insured | | | |
| 690 | | Washington Health Care Facilities Authority, Revenue Bonds, Virginia Mason Medical | 8/27 at 100.00 | BBB | 788,808 |
| | | Center, Series 2017, 5.000%, 8/15/30 | | | |
| 2,015 | | Washington State Convention Center Public Facilities District, Lodging Tax Revenue | 7/28 at 100.00 | A1 | 2,324,685 |
| | | Bonds, Series 2018, 5.000%, 7/01/48 | | | |
| 6,035 | | Total Washington | | | 5,692,478 |
| | | West Virginia – 1.4% | | | |
| 235 | | West Virginia Hospital Finance Authority, Hospital Revenue Bonds, Cabell Huntington | 1/29 at 100.00 | BBB+ | 270,339 |
| | | Hospital, Inc Project, Refunding & Improvement Series 2018A, 5.000%, 1/01/36 | | | |
| 1,500 | | West Virginia Hospital Finance Authority, Hospital Revenue Bonds, West Virginia United | 6/23 at 100.00 | A | 1,664,625 |
| | | Health System Obligated Group, Refunding & Improvement Series 2013A, 5.500%, 6/01/44 | | | |
| 1,430 | | West Virginia Parkways Authority, Turnpike Toll Revenue Bonds, Senior Lien Series 2018, | 6/28 at 100.00 | AA– | 1,688,501 |
| | | 5.000%, 6/01/43 | | | |
| 3,165 | | Total West Virginia | | | 3,623,465 |
44
| | | | | | |
Principal | | | Optional Call | | |
Amount (000) | | Description (1) | Provisions (2) | Ratings (3) | Value |
| | | Wisconsin – 0.4% | | | |
| $ 1,000 | | Wisconsin Health and Educational Facilities Authority, Revenue Bonds, Marshfield Clinic, | 2/22 at 100.00 | A– | $ 1,066,840 |
| | | Series 2012B, 5.000%, 2/15/27 | | | |
| $ 256,755 | | Total Long-Term Investments (cost $219,088,442) | | | 243,448,809 |
| | | Floating Rate Obligations – (3.6)% | | | (9,125,000) |
| | | Other Assets Less Liabilities – 7.5% (8) | | | 19,063,634 |
| | | Net Assets Applicable to Common Shares–100% | | | $ 253,387,443 |
Investments in Derivatives
Futures contracts
| | | | | | | | |
| | | | | | | | Variation |
| | | | | | | Unrealized | Margin |
| | Contract | Number of | Expiration | Notional | | Appreciation | Receivable/ |
Description | Position | Contracts | Date | Amount | Value | (Depreciation) | (Payable) |
| U.S. Treasury 10-Year Note | Short | (84) | 6/19 | $(10,338,070) | $(10,388,438) | $(50,368) | $(19,688) |
| | |
| (1) | All percentages shown in the Portfolio of Investments are based on net assets applicable to common shares unless otherwise noted. |
| (2) | Optional Call Provisions: Dates (month and year) and prices of the earliest optional call or redemption. There may be other call provisions at varying prices at later dates. Certain mortgage-backed securities may be subject to periodic principal paydowns. |
| (3) | For financial reporting purposes, the ratings disclosed are the highest of Standard & Poor’s Group (“Standard & Poor’s”), Moody’s Investors Service, Inc. (“Moody’s”) or Fitch, Inc. (“Fitch”) rating. This treatment of split-rated securities may differ from that used for other purposes, such as for Fund investment policies. Ratings below BBB by Standard & Poor’s, Baa by Moody’s or BBB by Fitch are considered to be below investment grade. Holdings designated N/R are not rated by any of these national rating agencies. |
| (4) | Investment, or portion of investment, has been pledged to collateralize the net payment obligations for investments in inverse floating rate transactions. |
| (5) | Step-up coupon bond, a bond with a coupon that increases (“steps up”), usually at regular intervals, while the bond is outstanding. The rate shown is the coupon as of the end of the reporting period. |
| (6) | Backed by an escrow or trust containing sufficient U.S. Government or U.S. Government agency securities, which ensure the timely payment of principal and interest. |
| (7) | Defaulted security. A security whose issuer has failed to fully pay principal and/or interest when due, or is under the protection of bankruptcy. |
| (8) | Other assets less liabilities includes the unrealized appreciation (depreciation) of certain over-the-counter (“OTC”) derivatives as presented on the Statement of Assets and Liabilities, when applicable. The unrealized appreciation (depreciation) of OTC cleared and exchange-traded derivatives is recognized as part of the cash collateral at broker and/or the receivable or payable for variation margin as presented on the Statement of Assets and Liabilities, when applicable. |
| 144A | Investment is exempt from registration under Rule 144A of the Securities Act of 1933, as amended. These investments may only be resold in transactions exempt from registration, which are normally those transactions with qualified institutional buyers. |
| ETM | Escrowed to maturity. |
| IF | Inverse floating rate security issued by a tender option bond (“TOB”) trust, the interest rate on which varies inversely with the Securities Industry Financial (SIFMA) short-term rate, which resets weekly, or a similar short-term rate, and is reduced by the expenses related to the TOB trust. |
| UB | Underlying bond of an inverse floating rate trust reflected as a financing transaction. See Notes to Financial Statements, Note 3 – Portfolio Securities and Investments in Derivatives, Inverse Floating Rate Securities for more information. |
See accompanying notes to financial statements.
45
| | |
NMI | Nuveen Municipal Income Fund, Inc. |
| | Portfolio of Investments |
| | April 30, 2019 (Unaudited) |
| | | | | | |
Principal | | | Optional Call | | |
Amount (000) | | Description (1) | Provisions (2) | Ratings (3) | Value |
| | | LONG-TERM INVESTMENTS – 98.9% | | | |
| | | MUNICIPAL BONDS – 98.9% | | | |
| | | Alabama – 0.8% | | | |
| $ 500 | | Lower Alabama Gas District, Alabama, Gas Project Revenue Bonds, Series 2016A, | No Opt. Call | A3 | $ 643,005 |
| | | 5.000%, 9/01/46 | | | |
| 100 | | Tuscaloosa County Industrial Development Authority, Alabama, Gulf Opportunity Zone | 5/29 at 100.00 | N/R | 107,293 |
| | | Bonds, Hunt Refining Project, Refunding Series 2019A, 5.250%, 5/01/44, 144A | | | |
| | | (WI/DD, Settling 5/16/19) | | | |
| 600 | | Total Alabama | | | 750,298 |
| | | Arizona – 2.5% | | | |
| 600 | | Arizona Health Facilities Authority, Revenue Bonds, Scottsdale Lincoln Hospitals | 12/24 at 100.00 | A2 | 662,940 |
| | | Project, Refunding Series 2014A, 5.000%, 12/01/39 | | | |
| 1,000 | | Arizona Industrial Development Authority, Arizona, Education Revenue Bonds, Academies of | 1/28 at 100.00 | AA– | 1,120,500 |
| | | Math & Science Projects, Series 2018A, 5.000%, 7/01/48 | | | |
| 515 | | Salt Verde Financial Corporation, Arizona, Senior Gas Revenue Bonds, Citigroup Energy | No Opt. Call | A3 | 630,128 |
| | | Inc. Prepay Contract Obligations, Series 2007, 5.250%, 12/01/28 | | | |
| 2,115 | | Total Arizona | | | 2,413,568 |
| | | California – 16.9% | | | |
| 5,000 | | Adelanto School District, San Bernardino County, California, General Obligation Bonds, | No Opt. Call | A+ | 4,692,450 |
| | | Series 1997A, 0.000%, 9/01/22 – NPFG Insured | | | |
| | | Brea Olinda Unified School District, Orange County, California, General Obligation | | | |
| | | Bonds, Series 1999A: | | | |
| 2,000 | | 0.000%, 8/01/21 – FGIC Insured | No Opt. Call | AA | 1,924,240 |
| 2,070 | | 0.000%, 8/01/22 – FGIC Insured | No Opt. Call | AA– | 1,948,946 |
| 2,120 | | 0.000%, 8/01/23 – FGIC Insured | No Opt. Call | AA– | 1,947,411 |
| 255 | | California County Tobacco Securitization Agency, Tobacco Settlement Asset-Backed Bonds, | 5/19 at 100.00 | A3 | 259,146 |
| | | Los Angeles County Securitization Corporation, Series 2006A, 5.250%, 6/01/21 | | | |
| 500 | | California Health Facilities Financing Authority, California, Revenue Bonds, Sutter | 11/27 at 100.00 | AA– | 536,510 |
| | | Health, Series 2018A, 4.000%, 11/15/42 | | | |
| 365 | | California Statewide Communities Development Authority, California, Revenue Bonds, Loma | 6/28 at 100.00 | BB– | 415,049 |
| | | Linda University Medical Center, Series 2018A, 5.500%, 12/01/58, 144A | | | |
| 375 | | California Statewide Communities Development Authority, Revenue Bonds, American Baptist | 10/19 at 100.00 | BBB+ | 381,562 |
| | | Homes of the West, Series 2010, 6.000%, 10/01/29 | | | |
| 275 | | California Statewide Communities Development Authority, Revenue Bonds, Front Porch | 4/27 at 100.00 | A | 292,033 |
| | | Communities and Services Project, Series 2017A, 4.000%, 4/01/36 | | | |
| 1,000 | | California Statewide Community Development Authority, Revenue Bonds, Daughters of | 6/19 at 100.00 | CC | 982,980 |
| | | Charity Health System, Series 2005A, 5.500%, 7/01/39 | | | |
| 250 | | Madera County, California, Certificates of Participation, Children’s Hospital Central | 3/20 at 100.00 | A1 (5) | 258,443 |
| | | California, Series 2010, 5.375%, 3/15/36 (Pre-refunded 3/15/20) | | | |
| 300 | | M-S-R Energy Authority, California, Gas Revenue Bonds, Citigroup Prepay Contracts, | No Opt. Call | BBB+ | 442,119 |
| | | Series 2009A, 7.000%, 11/01/34 | | | |
| 250 | | Ridgecrest Redevelopment Agency, California, Ridgecrest Redevelopment Project Tax | 6/20 at 100.00 | A– (5) | 263,343 |
| | | Allocation Bonds, Refunding Series 2010, 6.125%, 6/30/37 (Pre-refunded 6/30/20) | | | |
| 385 | | San Francisco Redevelopment Finance Authority, California, Tax Allocation Revenue Bonds, | 2/21 at 100.00 | A– (5) | 415,592 |
| | | Mission Bay North Redevelopment Project, Series 2011C, 6.000%, 8/01/24 (Pre-refunded 2/01/21) | | | |
| 500 | | San Joaquin Hills Transportation Corridor Agency, Orange County, California, Toll Road | 1/25 at 100.00 | BBB– | 554,860 |
| | | Revenue Bonds, Refunding Junior Lien Series 2014B, 5.250%, 1/15/44 | | | |
46
| | | | | | |
Principal | | | Optional Call | | |
Amount (000) | | Description (1) | Provisions (2) | Ratings (3) | Value |
| | | California (continued) | | | |
| $ 1,000 | | Union City Community Redevelopment Agency, California, Tax Allocation Revenue Bonds, | 12/21 at 100.00 | A+ (5) | $ 1,116,440 |
| | | Redevelopment Project, Subordinate Lien Series 2011, 6.000%, 12/01/22 (Pre-refunded 12/01/21) | | | |
| 16,645 | | Total California | | | 16,431,124 |
| | | Colorado – 9.8% | | | |
| | | Central Platte Valley Metropolitan District, Colorado, General Obligation Bonds, | | | |
| | | Refunding Series 2013A: | | | |
| 150 | | 5.125%, 12/01/29 | 12/23 at 100.00 | BBB | 168,333 |
| 250 | | 5.375%, 12/01/33 | 12/23 at 100.00 | BBB– | 281,118 |
| 350 | | Colorado Health Facilities Authority, Colorado, Health Facilities Revenue Bonds, The | 6/27 at 100.00 | BBB | 389,827 |
| | | Evangelical Lutheran Good Samaritan Society Project, Refunding Series 2017, 5.000%, 6/01/42 | | | |
| 500 | | Colorado Health Facilities Authority, Colorado, Revenue Bonds, Christian Living | 1/24 at 102.00 | N/R | 535,345 |
| | | Neighborhoods Project, Refunding Series 2016, 5.000%, 1/01/37 | | | |
| 1,000 | | Colorado Health Facilities Authority, Colorado, Revenue Bonds, Sisters of Charity of | 1/20 at 100.00 | AA– | 1,018,390 |
| | | Leavenworth Health Services Corporation, Series 2010A, 5.000%, 1/01/40 | | | |
| 750 | | Colorado Springs, Colorado, Utilities System Revenue Bonds, Improvement Series 2013B-1, | 11/23 at 100.00 | AA | 836,475 |
| | | 5.000%, 11/15/38 | | | |
| 1,000 | | Denver City and County, Colorado, Airport System Revenue Bonds, Series 2012B, | 11/22 at 100.00 | AA– | 1,095,560 |
| | | 5.000%, 11/15/32 | | | |
| 1,395 | | Denver City and County, Colorado, Airport System Revenue Bonds, Subordinate Lien Series | 12/28 at 100.00 | A+ | 1,620,906 |
| | | 2018A, 5.000%, 12/01/48 (AMT) | | | |
| 110 | | Park Creek Metropolitan District, Colorado, Senior Limited Property Tax Supported | 12/25 at 100.00 | A | 121,125 |
| | | Revenue Bonds, Refunding Series 2015A, 5.000%, 12/01/45 | | | |
| 1,000 | | Park Creek Metropolitan District, Colorado, Senior Limited Property Tax Supported | 12/20 at 100.00 | A2 (5) | 1,070,330 |
| | | Revenue Refunding Bonds, Series 2011, 6.125%, 12/01/41 (Pre-refunded 12/01/20) – AGM Insured | | | |
| 520 | | Public Authority for Colorado Energy, Natural Gas Purchase Revenue Bonds, Colorado | No Opt. Call | A+ | 578,620 |
| | | Springs Utilities, Series 2008, 6.125%, 11/15/23 | | | |
| 1,100 | | Rampart Range Metropolitan District 1, Lone Tree, Colorado, Limited Tax Supported and | 12/27 at 100.00 | AA | 1,271,325 |
| | | Special Revenue Bonds, Refunding & Improvement Series 2017, 5.000%, 12/01/42 | | | |
| 499 | | Tallyn’s Reach Metropolitan District 3, Aurora, Colorado, General Obligation Refunding | 12/23 at 100.00 | N/R | 526,305 |
| | | and Improvement Bonds, Limited Tax Convertible to Unlimited Tax, Series 2013, 5.000%, 12/01/33 | | | |
| 8,624 | | Total Colorado | | | 9,513,659 |
| | | Delaware – 0.1% | | | |
| 100 | | Delaware Health Facilities Authority, Revenue Bonds, Beebe Medical Center Project, | 12/28 at 100.00 | BBB | 112,013 |
| | | Series 2018, 5.000%, 6/01/48 | | | |
| | | Florida – 6.1% | | | |
| 850 | | Bay County, Florida, Educational Facilities Revenue Refunding Bonds, Bay Haven Charter | 9/23 at 100.00 | BBB | 898,628 |
| | | Academy, Inc. Project, Series 2013A, 5.000%, 9/01/33 | | | |
| 500 | | Florida Higher Educational Facilities Financing Authority, Revenue Bonds, Nova | 4/21 at 100.00 | Baa1 | 535,765 |
| | | Southeastern University, Refunding Series 2011, 6.375%, 4/01/31 | | | |
| | | Florida, Development Finance Corporation, Surface Transportation Facility Revenue Bonds, | | | |
| | | Virgin Trains USA Passenger Rail Project , Series 2019A: | | | |
| 350 | | 6.375%, 1/01/49, 144A (AMT) (Mandatory Put 1/01/26) | 1/20 at 105.00 | N/R | 359,530 |
| 350 | | 6.500%, 1/01/49, 144A (AMT) (Mandatory Put 1/01/29) | 1/20 at 105.00 | N/R | 358,936 |
| 500 | | Greater Orlando Aviation Authority, Florida, Orlando Airport Facilities Revenue Bonds, | 10/27 at 100.00 | A+ | 575,360 |
| | | Priority Subordinated Series 2017, 5.000%, 10/01/47 (AMT) | | | |
| 800 | | Miami-Dade County, Florida, Aviation Revenue Bonds, Miami International Airport, Series | 10/20 at 100.00 | AA | 835,800 |
| | | 2010B, 5.000%, 10/01/35 – AGM Insured | | | |
| 1,000 | | Miami-Dade County, Florida, Water and Sewer System Revenue Bonds, Series 2013A, | 10/22 at 100.00 | AA– | 1,089,110 |
| | | 5.000%, 10/01/42 | | | |
| 515 | | North Sumter County Utility Dependent District, Florida, Utility Revenue Bonds, Series | 10/20 at 100.00 | AA | 540,436 |
| | | 2010, 5.375%, 10/01/40 | | | |
47
| | |
NMI | Nuveen Municipal Income Fund, Inc. |
| | Portfolio of Investments (continued) |
| | April 30, 2019 (Unaudited) |
| | | | | | |
Principal | | | Optional Call | | |
Amount (000) | | Description (1) | Provisions (2) | Ratings (3) | Value |
| | | Florida (continued) | | | |
| $ 310 | | Orange County Health Facilities Authority, Florida, Hospital Revenue Bonds, Orlando | 4/22 at 100.00 | A+ | $ 328,045 |
| | | Health, Inc., Series 2012A, 5.000%, 10/01/42 | | | |
| 405 | | Tolomato Community Development District, Florida, Special Assessment Bonds, Series 2006, | 6/19 at 100.00 | N/R | 405,470 |
| | | 5.400%, 5/01/37 | | | |
| 5,580 | | Total Florida | | | 5,927,080 |
| | | Georgia – 1.9% | | | |
| 455 | | Atlanta Development Authority, Georgia, Revenue Bonds, New Downtown Atlanta Stadium | 7/25 at 100.00 | Aa3 | 524,065 |
| | | Project, Senior Lien Series 2015A-1, 5.250%, 7/01/40 | | | |
| 490 | | Atlanta Urban Residential Finance Authority, Georgia, Multifamily Housing Revenue Bonds, | 11/23 at 100.00 | BBB+ | 505,690 |
| | | Testletree Village Apartments, Series 2013A, 4.000%, 11/01/25 | | | |
| | | Atlanta, Georgia, Water and Wastewater Revenue Bonds, Refunding Series 2009B: | | | |
| 175 | | 5.250%, 11/01/34 – AGM Insured | 11/19 at 100.00 | AA– | 178,036 |
| 325 | | 5.250%, 11/01/34 (Pre-refunded 11/01/19) – AGM Insured | 11/19 at 100.00 | AA (5) | 330,918 |
| 300 | | Main Street Natural Gas Inc., Georgia, Gas Project Revenue Bonds, Series 2006B, | No Opt. Call | A+ | 323,394 |
| | | 5.000%, 3/15/22 | | | |
| 1,745 | | Total Georgia | | | 1,862,103 |
| | | Hawaii – 0.3% | | | |
| 250 | | Hawaii Department of Budget and Finance, Special Purpose Revenue Bonds, Hawaii Pacific | 7/23 at 100.00 | BB | 265,465 |
| | | University, Series 2013A, 6.625%, 7/01/33 | | | |
| | | Illinois – 10.2% | | | |
| 250 | | Chicago Board of Education, Illinois, Dedicated Capital Improvement Tax Revenue Bonds, | 4/27 at 100.00 | A | 289,685 |
| | | Series 2016, 6.000%, 4/01/46 | | | |
| 435 | | Chicago Board of Education, Illinois, General Obligation Bonds, Dedicated Revenues, | 12/28 at 100.00 | B+ | 456,598 |
| | | Refunding Series 2018D, 5.000%, 12/01/46 | | | |
| 650 | | Chicago Board of Education, Illinois, General Obligation Bonds, Dedicated Revenues, | 12/25 at 100.00 | BB– | 761,000 |
| | | Series 2016A, 7.000%, 12/01/44 | | | |
| 185 | | Chicago, Illinois, General Obligation Bonds, Series 2019A, 5.500%, 1/01/49 | 1/29 at 100.00 | BBB– | 204,395 |
| 1,000 | | Illinois Educational Facilities Authority, Revenue Bonds, Field Museum of Natural | 11/24 at 100.00 | A | 1,056,310 |
| | | History, Series 2002RMKT, 4.500%, 11/01/36 | | | |
| 280 | | Illinois Finance Authority, Revenue Bonds, Palos Community Hospital, Series 2010C, | 5/20 at 100.00 | AA– | 287,090 |
| | | 5.125%, 5/15/35 | | | |
| 80 | | Illinois Finance Authority, Revenue Bonds, Rehabilitation Institute of Chicago, Series | 7/23 at 100.00 | A– | 89,992 |
| | | 2013A, 5.500%, 7/01/28 | | | |
| 200 | | Illinois Finance Authority, Revenue Bonds, Silver Cross Hospital and Medical Centers, | 8/25 at 100.00 | Baa1 | 219,292 |
| | | Refunding Series 2015C, 5.000%, 8/15/44 | | | |
| 500 | | Illinois Finance Authority, Revenue Bonds, Silver Cross Hospital and Medical Centers, | 8/19 at 100.00 | N/R (5) | 507,570 |
| | | Series 2009, 7.000%, 8/15/44 (Pre-refunded 8/15/19) | | | |
| 250 | | Illinois Finance Authority, Revenue Bonds, Southern Illinois Healthcare Enterprises, | 3/20 at 100.00 | A2 (5) | 257,430 |
| | | Inc., Series 2005 Remarketed, 5.250%, 3/01/30 (Pre-refunded 3/01/20) – AGM Insured | | | |
| 990 | | Illinois State, General Obligation Bonds, Series 2013, 5.250%, 7/01/31 | 7/23 at 100.00 | BBB– | 1,047,826 |
| 1,555 | | Metropolitan Pier and Exposition Authority, Illinois, McCormick Place Expansion Project | 6/22 at 100.00 | BBB | 1,604,138 |
| | | Bonds, Refunding Series 2012B, 5.000%, 6/15/52 | | | |
| 6,000 | | Metropolitan Pier and Exposition Authority, Illinois, McCormick Place Expansion Project | No Opt. Call | BBB | 1,085,580 |
| | | Bonds, Series 2017A, 0.000%, 12/15/56 | | | |
| 205 | | Metropolitan Pier and Exposition Authority, Illinois, Revenue Bonds, McCormick Place | No Opt. Call | BBB | 108,986 |
| | | Expansion Project, Series 2002A, 0.000%, 12/15/35 – NPFG Insured | | | |
| 450 | | Quad Cities Regional Economic Development Authority, Illinois, Revenue Bonds, Augustana | 10/22 at 100.00 | Baa1 | 492,475 |
| | | College, Series 2012, 5.000%, 10/01/27 | | | |
| 800 | | Railsplitter Tobacco Settlement Authority, Illinois, Tobacco Settlement Revenue Bonds, | 6/21 at 100.00 | N/R (5) | 870,872 |
| | | Series 2010, 6.000%, 6/01/28 (Pre-refunded 6/01/21) | | | |
48
| | | | | | |
Principal | | | Optional Call | | |
Amount (000) | | Description (1) | Provisions (2) | Ratings (3) | Value |
| | | Illinois (continued) | | | |
| $ 490 | | University of Illinois, Health Services Facilities System Revenue Bonds, Series 2013, | 10/23 at 100.00 | A– | $ 556,317 |
| | | 6.000%, 10/01/32 | | | |
| 14,320 | | Total Illinois | | | 9,895,556 |
| | | Indiana – 1.9% | | | |
| 525 | | Indiana Finance Authority, Educational Facilities Revenue Bonds, Drexel Foundation For | 10/19 at 100.00 | B | 528,439 |
| | | Educational Excellence, Inc., Series 2009A, 7.000%, 10/01/39 | | | |
| 655 | | Indiana Finance Authority, Private Activity Bonds, Ohio River Bridges East End Crossing | 7/23 at 100.00 | BBB+ | 707,040 |
| | | Project, Series 2013A, 5.000%, 7/01/44 (AMT) | | | |
| 500 | | Vigo County Hospital Authority, Indiana, Hospital Revenue Bonds, Union Hospital, Inc., | 9/21 at 100.00 | N/R (5) | 571,040 |
| | | Series 2011, 8.000%, 9/01/41 (Pre-refunded 9/01/21) | | | |
| 1,680 | | Total Indiana | | | 1,806,519 |
| | | Iowa – 0.9% | | | |
| 835 | | Iowa Higher Education Loan Authority, Private College Facility Revenue Bonds, University | 10/21 at 100.00 | BBB | 884,666 |
| | | of Dubuque Project, Refunding Series 2011, 5.625%, 10/01/26 | | | |
| | | Kansas – 0.2% | | | |
| 220 | | Overland Park Development Corporation, Kansas, Second Tier Revenue Bonds, Overland Park | 6/19 at 100.00 | BB+ | 220,359 |
| | | Convention Center, Series 2007B, 5.125%, 1/01/22 – AMBAC Insured | | | |
| | | Kentucky – 0.5% | | | |
| 500 | | Kentucky Economic Development Finance Authority, Hospital Revenue Bonds, Owensboro | 6/20 at 100.00 | Baa3 (5) | 525,800 |
| | | Medical Health System, Series 2010A, 6.500%, 3/01/45 (Pre-refunded 6/01/20) | | | |
| | | Louisiana – 0.2% | | | |
| 200 | | New Orleans Aviation Board, Louisiana, General Airport Revenue Bonds, North Terminal | 1/27 at 100.00 | A– | 224,054 |
| | | Project, Series 2017B, 5.000%, 1/01/48 (AMT) | | | |
| | | Maine – 0.5% | | | |
| 500 | | Maine Health and Higher Educational Facilities Authority Revenue Bonds, Eastern Maine | 7/23 at 100.00 | Ba1 | 530,225 |
| | | Medical Center Obligated Group Issue, Series 2013, 5.000%, 7/01/43 | | | |
| | | Maryland – 1.8% | | | |
| 1,000 | | Maryland Economic Development Corporation, Economic Development Revenue Bonds, | 6/20 at 100.00 | N/R (5) | 1,044,270 |
| | | Transportation Facilities Project, Series 2010A, 5.750%, 6/01/35 (Pre-refunded 6/01/20) | | | |
| 210 | | Maryland Health and Higher Educational Facilities Authority, Revenue Bonds, Patterson | 7/19 at 100.00 | BB+ | 210,531 |
| | | Park Public Charter School Issue, Series 2010, 6.000%, 7/01/40 | | | |
| 500 | | Maryland Health and Higher Educational Facilities Authority, Revenue Bonds, Peninsula | 7/24 at 100.00 | A3 | 549,350 |
| | | Regional Medical Center Issue, Refunding Series 2015, 5.000%, 7/01/45 | | | |
| 1,710 | | Total Maryland | | | 1,804,151 |
| | | Massachusetts – 0.6% | | | |
| 500 | | Massachusetts Development Finance Agency, Revenue Bonds, UMass Memorial Health Care, | 7/26 at 100.00 | A– | 556,700 |
| | | Series 2016I, 5.000%, 7/01/46 | | | |
| | | Michigan – 2.7% | | | |
| 355 | | Detroit Water and Sewerage Department, Michigan, Sewage Disposal System Revenue Bonds, | 7/22 at 100.00 | A2 | 384,504 |
| | | Refunding Senior Lien Series 2012A, 5.250%, 7/01/39 | | | |
| 1,100 | | Michigan Finance Authority, Hospital Revenue Bonds, Henry Ford Health System, Series | 11/29 at 100.00 | A | 1,154,538 |
| | | 2019A, 4.000%, 11/15/50 (WI/DD, Settling 5/02/19) | | | |
| 1,000 | | Michigan State Building Authority, Revenue Bonds, Facilities Program, Refunding Series | 10/21 at 100.00 | AA– | 1,080,200 |
| | | 2011-II-A, 5.375%, 10/15/36 | | | |
| 2,455 | | Total Michigan | | | 2,619,242 |
49
| | |
NMI | Nuveen Municipal Income Fund, Inc. |
| | Portfolio of Investments (continued) |
| | April 30, 2019 (Unaudited) |
| | | | | | |
Principal | | | Optional Call | | |
Amount (000) | | Description (1) | Provisions (2) | Ratings (3) | Value |
| | | Minnesota – 2.3% | | | |
| $ 300 | | City of Minneapolis, Minnesota, Senior Housing and Healthcare Facilities Revenue Bonds, | 11/22 at 100.00 | N/R | $ 297,321 |
| | | Walker Minneapolis Campus Project, Series 2015, 4.625%, 11/15/31 | | | |
| 1,000 | | Duluth Economic Development Authority, Minnesota, Health Care Facilities Revenue Bonds, | 2/28 at 100.00 | A– | 1,125,730 |
| | | Essentia Health Obligated Group, Series 2018A, 5.000%, 2/15/53 | | | |
| 300 | | Saint Paul Park, Minnesota, Senior Housing and Health Care Revenue Bonds, Presbyterian | 9/24 at 100.00 | N/R | 309,957 |
| | | Homes Bloomington Project, Refunding Series 2017, 4.250%, 9/01/37 | | | |
| 500 | | West Saint Paul-Mendota Heights-Eagan Independent School District 197, Dakota County, | 2/27 at 100.00 | AAA | 538,385 |
| | | Minnesota, General Obligation Bonds, School Building Series 2018A, 4.000%, 2/01/39 | | | |
| 2,100 | | Total Minnesota | | | 2,271,393 |
| | | Mississippi – 1.1% | | | |
| 1,000 | | Mississippi Hospital Equipment and Facilities Authority, Revenue Bonds, Baptist Memorial | 9/26 at 100.00 | BBB+ | 1,117,370 |
| | | Healthcare, Series 2016A, 5.000%, 9/01/36 | | | |
| | | Missouri – 3.3% | | | |
| 265 | | Hanley Road Corridor Transportation Development District, Brentwood and Maplewood, | 10/19 at 100.00 | A– | 268,148 |
| | | Missouri, Transportation Sales Revenue Bonds, Refunding Series 2009A, 5.875%, 10/01/36 | | | |
| 135 | | Missouri Health and Educational Facilities Authority, Educational Facilities Revenue | 5/23 at 100.00 | BBB | 145,010 |
| | | Bonds, Saint Louis College of Pharmacy, Series 2013, 5.250%, 5/01/33 | | | |
| 1,000 | | Missouri Health and Educational Facilities Authority, Educational Facilities Revenue | 10/22 at 100.00 | BBB– | 1,046,530 |
| | | Bonds, Southwest Baptist University Project, Series 2012, 5.000%, 10/01/33 | | | |
| 125 | | Missouri Health and Educational Facilities Authority, Educational Facilities Revenue | 10/23 at 100.00 | A+ | 139,655 |
| | | Bonds, University of Central Missouri, Series 2013C-2, 5.000%, 10/01/34 | | | |
| 965 | | Missouri Health and Educational Facilities Authority, Revenue Bonds, Lake Regional | 2/22 at 100.00 | BBB+ | 1,033,390 |
| | | Health System, Series 2012, 5.000%, 2/15/26 | | | |
| 215 | | Saint Louis County Industrial Development Authority, Missouri, Revenue Bonds, Friendship | 9/25 at 103.00 | BB+ | 233,135 |
| | | Village Saint Louis Obligated Group, Series 2018A, 5.250%, 9/01/53 | | | |
| 335 | | Saline County Industrial Development Authority, Missouri, First Mortgage Revenue Bonds, | 10/23 at 100.00 | N/R | 336,186 |
| | | Missouri Valley College, Series 2017, 4.500%, 10/01/40 | | | |
| 3,040 | | Total Missouri | | | 3,202,054 |
| | | Nebraska – 0.4% | | | |
| 400 | | Nebraska Educational Finance Authority, Revenue Bonds, Clarkson College Project, | 5/21 at 100.00 | Aa3 | 425,860 |
| | | Refunding Series 2011, 5.050%, 9/01/30 | | | |
| | | New Jersey – 1.8% | | | |
| 100 | | Gloucester County Pollution Control Financing Authority, New Jersey, Pollution Control | No Opt. Call | BBB– | 107,123 |
| | | Revenue Bonds, Logan Project, Refunding Series 2014A, 5.000%, 12/01/24 (AMT) | | | |
| 110 | | New Jersey Health Care Facilities Financing Authority, Revenue Bonds, University | 7/25 at 100.00 | AA | 121,806 |
| | | Hospital Issue, Refunding Series 2015A, 5.000%, 7/01/46 – AGM Insured | | | |
| 545 | | New Jersey Transportation Trust Fund Authority, Transportation System Bonds, Series | 6/25 at 100.00 | BBB+ | 583,303 |
| | | 2015AA, 5.000%, 6/15/45 | | | |
| 830 | | Tobacco Settlement Financing Corporation, New Jersey, Tobacco Settlement Asset-Backed | 6/28 at 100.00 | BBB+ | 929,791 |
| | | Bonds, Series 2018A, 5.250%, 6/01/46 | | | |
| 1,585 | | Total New Jersey | | | 1,742,023 |
| | | New York – 2.0% | | | |
| 630 | | Brooklyn Arena Local Development Corporation, New York, Payment in Lieu of Taxes Revenue | 1/20 at 100.00 | AA+ (5) | 651,048 |
| | | Bonds, Barclays Center Project, Series 2009, 6.250%, 7/15/40 (Pre-refunded 1/15/20) | | | |
| 60 | | Buffalo and Erie County Industrial Land Development Corporation, New York, Revenue | 7/25 at 100.00 | BBB+ | 69,081 |
| | | Bonds, Catholic Health System, Inc. Project, Series 2015, 5.250%, 7/01/35 | | | |
| | | Hudson Yards Infrastructure Corporation, New York, Revenue Bonds, Senior Fiscal 2012 | | | |
| | | Series 2011A: | | | |
| 155 | | 5.750%, 2/15/47 | 2/21 at 100.00 | AA– | 165,515 |
| 245 | | 5.750%, 2/15/47 (Pre-refunded 2/15/21) | 2/21 at 100.00 | Aa2 (5) | 263,187 |
50
| | | | | | |
Principal | | | Optional Call | | |
Amount (000) | | Description (1) | Provisions (2) | Ratings (3) | Value |
| | | New York (continued) | | | |
| $ 500 | | New York Liberty Development Corporation, New York, Liberty Revenue Bonds, 3 World Trade | 11/24 at 100.00 | N/R | $ 538,485 |
| | | Center Project, Class 1 Series 2014, 5.000%, 11/15/44, 144A | | | |
| 265 | | Port Authority of New York and New Jersey, Special Project Bonds, JFK International Air | 12/20 at 100.00 | BBB+ | 280,497 |
| | | Terminal LLC Project, Eighth Series 2010, 6.000%, 12/01/42 | | | |
| 1,855 | | Total New York | | | 1,967,813 |
| | | North Carolina – 1.2% | | | |
| 1,000 | | North Carolina Turnpike Authority, Triangle Expressway System Revenue Bonds, Refunding | 1/29 at 100.00 | BBB | 1,148,570 |
| | | Series 2018, 5.000%, 1/01/40 | | | |
| | | North Dakota – 0.7% | | | |
| 200 | | Burleigh County, North Dakota, Health Care Revenue Bonds, Saint Alexius Medical Center | 7/21 at 100.00 | N/R (5) | 213,960 |
| | | Project, Series 2014A, 5.000%, 7/01/35 (Pre-refunded 7/01/21) | | | |
| 300 | | Fargo, North Dakota, Health System Revenue Bonds, Sanford Health, Refunding Series | 11/21 at 100.00 | A+ | 333,486 |
| | | 2011, 6.250%, 11/01/31 | | | |
| 100 | | Grand Forks, North Dakota, Senior Housing & Nursing Facilities Revenue Bonds, Valley | 12/26 at 100.00 | N/R | 104,090 |
| | | Homes and Services Obligated Group, Series 2017, 5.000%, 12/01/36 | | | |
| 600 | | Total North Dakota | | | 651,536 |
| | | Ohio – 3.9% | | | |
| | | Buckeye Tobacco Settlement Financing Authority, Ohio, Tobacco Settlement Asset-Backed | | | |
| | | Revenue Bonds, Senior Lien, Series 2007A-2: | | | |
| 500 | | 5.125%, 6/01/24 | 5/19 at 100.00 | Caa3 | 470,015 |
| 285 | | 5.375%, 6/01/24 | 5/19 at 100.00 | Caa3 | 270,354 |
| 725 | | 6.000%, 6/01/42 | 5/19 at 100.00 | B– | 714,487 |
| 1,750 | | Middleburg Heights, Ohio, Hospital Facilities Revenue Bonds, Southwest General Health | 8/21 at 100.00 | A2 | 1,862,945 |
| | | Center Project, Refunding Series 2011, 5.250%, 8/01/36 | | | |
| 500 | | Montgomery County, Ohio, Health Care and Multifamily Housing Revenue Bonds, Saint | 4/20 at 100.00 | BBB– | 515,315 |
| | | Leonard, Refunding & improvement Series 2010, 6.375%, 4/01/30 | | | |
| 3,760 | | Total Ohio | | | 3,833,116 |
| | | Oklahoma – 0.3% | | | |
| 250 | | Oklahoma Development Finance Authority, Health System Revenue Bonds, OU Medicine | 8/28 at 100.00 | BB+ | 287,903 |
| | | Project, Series 2018B, 5.500%, 8/15/52 | | | |
| | | Oregon – 1.3% | | | |
| 300 | | Forest Grove, Oregon, Campus Improvement Revenue Bonds, Pacific University Project, | 5/22 at 100.00 | BBB | 316,218 |
| | | Refunding Series 2014A, 5.000%, 5/01/40 | | | |
| 850 | | Portland, Oregon, River District Urban Renewal and Redevelopment Bonds, Series 2012C, | 6/22 at 100.00 | A1 | 924,758 |
| | | 5.000%, 6/15/29 | | | |
| 1,150 | | Total Oregon | | | 1,240,976 |
| | | Pennsylvania – 2.8% | | | |
| 1,000 | | Berks County Municipal Authority, Pennsylvania, Revenue Bonds, Reading Hospital & | 5/22 at 100.00 | A | 1,058,630 |
| | | Medical Center Project, Series 2012A, 5.000%, 11/01/40 | | | |
| 560 | | Montgomery County Industrial Development Authority, Pennsylvania, Health System Revenue | 1/25 at 100.00 | Ba1 | 615,658 |
| | | Bonds, Albert Einstein Healthcare Network Issue, Series 2015A, 5.250%, 1/15/36 | | | |
| 1,000 | | Pennsylvania Higher Educational Facilities Authority, Revenue Bonds, Foundation for Student | 7/22 at 100.00 | N/R (5) | 1,100,230 |
| | | Housing at Indiana University, Project Series 2012A, 5.000%, 7/01/41 (Pre-refunded 7/01/22) | | | |
| 2,560 | | Total Pennsylvania | | | 2,774,518 |
| | | South Dakota – 0.1% | | | |
| 100 | | Sioux Falls, South Dakota, Health Facilities Revenue Bonds, Dow Rummel Village Project, | 11/26 at 100.00 | BB | 102,914 |
| | | Series 2017, 5.125%, 11/01/47 | | | |
51
| | |
NMI | Nuveen Municipal Income Fund, Inc. |
| | Portfolio of Investments (continued) |
| | April 30, 2019 (Unaudited) |
| | | | | | |
Principal | | | Optional Call | | |
Amount (000) | | Description (1) | Provisions (2) | Ratings (3) | Value |
| | | Tennessee – 2.4% | | | |
| $ 1,250 | | Chattanooga Health, Educational and Housing Facility Board, Tennessee, Revenue Bonds, | 1/23 at 100.00 | BBB+ | $ 1,344,087 |
| | | Catholic Health Initiatives, Series 2013A, 5.250%, 1/01/45 | | | |
| 870 | | Knox County Health, Educational and Housing Facilities Board, Tennessee, Revenue Bonds, | 9/26 at 100.00 | BBB | 959,523 |
| | | University Health System, Inc., Series 2016, 5.000%, 9/01/47 | | | |
| 2,120 | | Total Tennessee | | | 2,303,610 |
| | | Texas – 8.1% | | | |
| 670 | | Central Texas Regional Mobility Authority, Revenue Bonds, Senior Lien, Series 2015A, | 7/25 at 100.00 | A– | 748,202 |
| | | 5.000%, 1/01/40 | | | |
| 335 | | Grand Parkway Transportation Corporation, Texas, System Toll Revenue Bonds, First Tier | 10/23 at 100.00 | BBB | 366,818 |
| | | Series 2013A, 5.125%, 10/01/43 | | | |
| 500 | | Lower Colorado River Authority, Texas, Transmission Contract Revenue Bonds, LCRA | 5/25 at 100.00 | A | 566,685 |
| | | Transmission Services Corporation Project, Refunding Series 2015, 5.000%, 5/15/40 | | | |
| 125 | | Mission Economic Development Corporation, Texas, Revenue Bonds, Natgasoline Project, | 10/21 at 105.00 | BB– | 130,455 |
| | | Senior Lien Series 2018, 4.625%, 10/01/31, 144A (AMT) | | | |
| 200 | | North Texas Tollway Authority, Special Projects System Revenue Bonds, Convertible | 9/31 at 100.00 | N/R (5) | 235,588 |
| | | Capital Appreciation Series 2011C, 7.000%, 9/01/43 (Pre-refunded 9/01/31) (4) | | | |
| 410 | | North Texas Tollway Authority, System Revenue Bonds, Refunding First Tier, Series 2015B, | 1/23 at 100.00 | A+ | 447,667 |
| | | 5.000%, 1/01/40 | | | |
| 500 | | North Texas Tollway Authority, System Revenue Bonds, Refunding Second Tier, Series | 1/25 at 100.00 | A | 562,840 |
| | | 2015A, 5.000%, 1/01/38 | | | |
| 240 | | Reagan Hospital District of Reagan County, Texas, Limited Tax Revenue Bonds, Series | 2/24 at 100.00 | Ba2 | 250,054 |
| | | 2014A, 5.000%, 2/01/34 | | | |
| 295 | | SA Energy Acquisition Public Facilities Corporation, Texas, Gas Supply Revenue Bonds, | No Opt. Call | A | 356,183 |
| | | Series 2007, 5.500%, 8/01/27 | | | |
| | | Texas Municipal Gas Acquisition and Supply Corporation III, Gas Supply Revenue Bonds, | | | |
| | | Series 2012: | | | |
| 1,165 | | 5.000%, 12/15/27 | 12/22 at 100.00 | BBB | 1,274,895 |
| 505 | | 5.000%, 12/15/28 | 12/22 at 100.00 | A3 | 551,303 |
| 405 | | Texas Private Activity Bond Surface Transportation Corporation, Revenue Bonds, NTE | 12/19 at 100.00 | BBB– | 417,968 |
| | | Mobility Partners LLC North Tarrant Express Managed Lanes Project, Senior Lien Series 2009, | | | |
| | | 6.875%, 12/31/39 | | | |
| 770 | | Texas Private Activity Bond Surface Transportation Corporation, Senior Lien Revenue | 6/20 at 100.00 | Baa3 | 813,944 |
| | | Bonds, LBJ Infrastructure Group LLC IH-635 Managed Lanes Project, Series 2010, | | | |
| | | 7.000%, 6/30/40 | | | |
| 1,000 | | Texas Transportation Commission, Central Texas Turnpike System Revenue Bonds, Second | 8/24 at 100.00 | BBB+ | 1,120,080 |
| | | Tier Refunding Series 2015C, 5.000%, 8/15/32 | | | |
| 45 | | West Texas Independent School District, McLennan and Hill Counties, General Obligation | 6/19 at 71.22 | AAA | 31,969 |
| | | Refunding Bonds, Series 1998, 0.000%, 8/15/25 | | | |
| 7,165 | | Total Texas | | | 7,874,651 |
| | | Virginia – 1.7% | | | |
| 1,265 | | Virginia Small Business Financing Authority, Private Activity Revenue Bonds, Transform | 6/27 at 100.00 | BBB | 1,384,530 |
| | | 66 P3 Project, Senior Lien Series 2017, 5.000%, 12/31/52 (AMT) | | | |
| 205 | | Virginia Small Business Financing Authority, Senior Lien Revenue Bonds, Elizabeth River | 7/22 at 100.00 | BBB | 226,293 |
| | | Crossing, Opco LLC Project, Series 2012, 6.000%, 1/01/37 (AMT) | | | |
| 1,470 | | Total Virginia | | | 1,610,823 |
| | | West Virginia – 1.2% | | | |
| 1,000 | | West Virginia Hospital Finance Authority, Hospital Revenue Bonds, West Virginia United | 6/28 at 100.00 | A | 1,125,490 |
| | | Health System Obligated Group, Series 2018A, 5.000%, 6/01/52 | | | |
52
| | | | | | |
Principal | | | Optional Call | | |
Amount (000) | | Description (1) | Provisions (2) | Ratings (3) | Value |
| | | Wisconsin – 6.4% | | | |
| | | Public Finance Authority of Wisconsin, Conference Center and Hotel Revenue Bonds, | | | |
| | | Lombard Public Facilities Corporation, Second Tier Series 2018B: | | | |
| $ 4 | | 0.000%, 1/01/46, 144A | No Opt. Call | N/R | $ 116 |
| 4 | | 0.000%, 1/01/47, 144A | No Opt. Call | N/R | 114 |
| 4 | | 0.000%, 1/01/48, 144A | No Opt. Call | N/R | 112 |
| 4 | | 0.000%, 1/01/49, 144A | No Opt. Call | N/R | 110 |
| 3 | | 0.000%, 1/01/50, 144A | No Opt. Call | N/R | 108 |
| 4 | | 0.000%, 1/01/51, 144A | No Opt. Call | N/R | 117 |
| 99 | | 3.750%, 7/01/51, 144A | 3/28 at 100.00 | N/R | 89,929 |
| 4 | | 0.000%, 1/01/52, 144A | No Opt. Call | N/R | 116 |
| 4 | | 0.000%, 1/01/53, 144A | No Opt. Call | N/R | 114 |
| 4 | | 0.000%, 1/01/54, 144A | No Opt. Call | N/R | 112 |
| 4 | | 0.000%, 1/01/55, 144A | No Opt. Call | N/R | 110 |
| 4 | | 0.000%, 1/01/56, 144A | No Opt. Call | N/R | 108 |
| 4 | | 0.000%, 1/01/57, 144A | No Opt. Call | N/R | 106 |
| 4 | | 0.000%, 1/01/58, 144A | No Opt. Call | N/R | 104 |
| 3 | | 0.000%, 1/01/59, 144A | No Opt. Call | N/R | 103 |
| 3 | | 0.000%, 1/01/60, 144A | No Opt. Call | N/R | 102 |
| 3 | | 0.000%, 1/01/61, 144A | No Opt. Call | N/R | 100 |
| 3 | | 0.000%, 1/01/62, 144A | No Opt. Call | N/R | 98 |
| 3 | | 0.000%, 1/01/63, 144A | No Opt. Call | N/R | 96 |
| 3 | | 0.000%, 1/01/64, 144A | No Opt. Call | N/R | 95 |
| 3 | | 0.000%, 1/01/65, 144A | No Opt. Call | N/R | 94 |
| 3 | | 0.000%, 1/01/66, 144A | No Opt. Call | N/R | 92 |
| 42 | | 0.000%, 1/01/67, 144A | No Opt. Call | N/R | 1,193 |
| 1,000 | | Wisconsin Health and Educational Facilities Authority Revenue Bonds, PHW Oconomowoc, | 10/23 at 102.00 | N/R | 1,039,530 |
| | | Inc. Project, Series 2018, 5.125%, 10/01/48 | | | |
| 290 | | Wisconsin Health and Educational Facilities Authority, Revenue Bonds, Beloit Health | 4/20 at 100.00 | A– | 295,762 |
| | | System, Inc., Series 2010B, 5.000%, 4/01/30 | | | |
| 500 | | Wisconsin Health and Educational Facilities Authority, Revenue Bonds, Marquette | 10/22 at 100.00 | A2 | 525,365 |
| | | University, Series 2012, 4.000%, 10/01/32 | | | |
| 1,000 | | Wisconsin Health and Educational Facilities Authority, Revenue Bonds, Meriter Hospital, | 5/21 at 100.00 | N/R (5) | 1,075,330 |
| | | Inc., Series 2011A, 5.500%, 5/01/31 (Pre-refunded 5/01/21) | | | |
| 1,000 | | Wisconsin Health and Educational Facilities Authority, Revenue Bonds, ProHealth Care, | 8/24 at 100.00 | A+ | 1,097,090 |
| | | Inc. Obligated Group, Refunding Series 2015, 5.000%, 8/15/39 | | | |
| 500 | | Wisconsin Health and Educational Facilities Authority, Revenue Bonds, Rogers Memorial | 7/24 at 100.00 | A | 543,320 |
| | | Hospital, Inc., Series 2014B, 5.000%, 7/01/44 | | | |
| 545 | | Wisconsin Health and Educational Facilities Authority, Revenue Bonds, Saint John’s | 9/23 at 100.00 | BBB– | 563,971 |
| | | Communities Inc., Series 2018A, 5.000%, 9/15/50 | | | |
| 755 | | Wisconsin Health and Educational Facilities Authority, Revenues Bonds, Gundersen | 10/21 at 100.00 | A1 | 802,656 |
| | | Lutheran, Series 2011A, 5.250%, 10/15/39 | | | |
| 200 | | Wisconsin Health and Educational Facilities Authority, Wisconsin, Revenue Bonds, Dickson | 10/22 at 102.00 | N/R | 212,186 |
| | | Hollow Project Series 2014, 5.125%, 10/01/34 | | | |
| 6,006 | | Total Wisconsin | | �� | 6,248,559 |
| $ 95,740 | | Total Long-Term Investments (cost $89,532,568) | | | 96,271,761 |
| | | Other Assets Less Liabilities – 1.1% | | | 1,071,988 |
| | | Net Assets Applicable to Common Shares – 100% | | | $ 97,343,749 |
53
| | |
NMI | Nuveen Municipal Income Fund, Inc. |
| | Portfolio of Investments (continued) |
| | April 30, 2019 (Unaudited) |
| | |
| (1) | All percentages shown in the Portfolio of Investments are based on net assets applicable to common shares unless otherwise noted. |
| (2) | Optional Call Provisions: Dates (month and year) and prices of the earliest optional call or redemption. There may be other call provisions at varying prices at later dates. Certain mortgage-backed securities may be subject to periodic principal paydowns. |
| (3) | For financial reporting purposes, the ratings disclosed are the highest of Standard & Poor’s Group (“Standard & Poor’s”), Moody’s Investors Service, Inc. (“Moody’s”) or Fitch, Inc. (“Fitch”) rating. This treatment of split-rated securities may differ from that used for other purposes, such as for Fund investment policies. Ratings below BBB by Standard & Poor’s, Baa by Moody’s or BBB by Fitch are considered to be below investment grade. Holdings designated N/R are not rated by any of these national rating agencies. |
| (4) | Step-up coupon bond, a bond with a coupon that increases (“steps up”), usually at regular intervals, while the bond is outstanding. The rate shown is the coupon as of the end of the reporting period. |
| (5) | Backed by an escrow or trust containing sufficient U.S. Government or U.S. Government agency securities, which ensure the timely payment of principal and interest. |
| 144A | Investment is exempt from registration under Rule 144A of the Securities Act of 1933, as amended. These investments may only be resold in transactions exempt from registration, which are normally those transactions with qualified institutional buyers. |
| AMT | Alternative Minimum Tax |
| WI/DD | Purchased on a when-issued or delayed delivery basis. |
See accompanying notes to financial statements.
54
| | |
NEV | Nuveen Enhanced Municipal Value Fund |
| | Portfolio of Investments |
| | April 30, 2019 (Unaudited) |
| | | | | | |
Principal | | | Optional Call | | |
Amount (000) | | Description (1) | Provisions (2) | Ratings (3) | Value |
| | | LONG-TERM INVESTMENTS – 124.0% | | | |
| | | MUNICIPAL BONDS – 124.0% | | | |
| | | Alabama – 0.4% | | | |
| $ 1,350 | | Jefferson County, Alabama, Sewer Revenue Warrants, Senior Lien Series 2013A, 5.250%, | 10/23 at 102.00 | AA | $ 1,500,930 |
| | | 10/01/48 – AGM Insured | | | |
| | | Arizona – 2.9% | | | |
| 1,585 | | Arizona Health Facilities Authority, Hospital Revenue Bonds, Banner Health Systems, | 1/22 at 100.00 | AA– | 2,020,764 |
| | | Tender Option Bond Trust 3256 As of 6/4/2015 Converted to Trust 2015-XF2046, 11.330%, | | | |
| | | 7/01/36, 144A (IF) (4) | | | |
| 2,000 | | Arizona State, Certificates of Participation, Series 2010A, 5.250%, 10/01/28 – AGM Insured | 10/19 at 100.00 | Aa3 | 2,030,300 |
| | | Festival Ranch Community Facilities District, Buckeye, Arizona, General Obligation | | | |
| | | Bonds, Series 2009: | | | |
| 1,205 | | 6.500%, 7/15/31 – BAM Insured | 7/19 at 100.00 | AA | 1,216,809 |
| 1,295 | | 6.500%, 7/15/31 – BAM Insured | 7/19 at 100.00 | AA | 1,302,731 |
| 1,030 | | Phoenix Industrial Development Authority, Arizona, Education Facility Revenue Bonds, | 7/21 at 100.00 | N/R (5) | 1,137,676 |
| | | Great Hearts Academies – Veritas Project, Series 2012, 6.600%, 7/01/47 (Pre-refunded 7/01/21) | | | |
| 1,480 | | Quechan Indian Tribe of the Fort Yuma Reservation, Arizona, Tribal Economic Development | 5/22 at 100.00 | BB– | 1,631,049 |
| | | Bonds, Series 2012A, 9.750%, 5/01/25 | | | |
| 50 | | Salt Verde Financial Corporation, Arizona, Senior Gas Revenue Bonds, Citigroup Energy | No Opt. Call | BBB+ | 61,788 |
| | | Inc. Prepay Contract Obligations, Series 2007, 5.000%, 12/01/32 | | | |
| 1,459 | | Watson Road Community Facilities District, Arizona, Special Assessment Revenue Bonds, | 6/19 at 100.00 | N/R | 1,441,361 |
| | | Series 2005, 6.000%, 7/01/30 | | | |
| 10,104 | | Total Arizona | | | 10,842,478 |
| | | California – 10.1% | | | |
| 180 | | Alameda Corridor Transportation Authority, California, Revenue Bonds, Refunding Second | 10/26 at 100.00 | BBB+ | 202,628 |
| | | Subordinate Lien Series 2016B, 5.000%, 10/01/37 | | | |
| 2,040 | | California Health Facilities Financing Authority, Revenue Bonds, Providence Health & | 10/19 at 100.00 | AA– | 2,200,528 |
| | | Services, Tender Option Bond Trust 2015-XF0120, 15.711%, 10/01/39, 144A (IF) (4) | | | |
| | | California Health Facilities Financing Authority, Revenue Bonds, Sutter Health, Tender | | | |
| | | Option Bond Trust 2016-XG0048: | | | |
| 300 | | 16.110%, 8/15/26, 144A (IF) (4) | 8/20 at 100.00 | AA– | 376,698 |
| 1,700 | | 16.110%, 8/15/26, 144A (IF) (4) | 8/20 at 100.00 | AA– | 2,134,622 |
| 1,000 | | California Municipal Finance Authority, Revenue Bonds, Harbor Regional Center Project, | 11/19 at 100.00 | A3 (5) | 1,031,670 |
| | | Series 2009, 8.000%, 11/01/29 (Pre-refunded 11/01/19) | | | |
| 3,450 | | California Statewide Communities Development Authority, California, Revenue Bonds, Loma | 6/26 at 100.00 | BB– | 3,791,929 |
| | | Linda University Medical Center, Series 2016A, 5.250%, 12/01/56, 144A | | | |
| 500 | | California Statewide Communities Development Authority, Revenue Bonds, American Baptist | 10/19 at 100.00 | BBB+ | 508,235 |
| | | Homes of the West, Series 2010, 5.750%, 10/01/25 | | | |
| 400 | | Davis Redevelopment Agency, California, Tax Allocation Bonds, Davis Redevelopment | 12/21 at 100.00 | A+ | 452,444 |
| | | Project, Subordinate Series 2011A, 7.000%, 12/01/36 | | | |
| 490 | | Etiwanda School District, California, Special Tax Bonds, Coyote Canyon Community | 9/19 at 100.00 | N/R (5) | 498,051 |
| | | Facilities District 2004-1 Improvement Area 2, Series 2009, 6.500%, 9/01/32 | | | |
| | | (Pre-refunded 9/01/19) | | | |
| | | Golden State Tobacco Securitization Corporation, California, Tobacco Settlement | | | |
| | | Asset-Backed Bonds, Tender Option Bond Trust 2015-XF1038: | | | |
| 2,445 | | 10.836%, 6/01/40, 144A (IF) (4) | 6/25 at 100.00 | A+ | 3,697,476 |
| 1,250 | | 10.843%, 6/01/40, 144A (IF) (4) | 6/25 at 100.00 | A+ | 1,890,875 |
| 5,240 | | Golden State Tobacco Securitization Corporation, California, Tobacco Settlement | 5/19 at 19.59 | CCC+ | 836,566 |
| | | Asset-Backed Revenue Bonds, First Subordinate Series 2007B-1, 0.000%, 6/01/47 | | | |
55
| | |
NEV | Nuveen Enhanced Municipal Value Fund |
| | Portfolio of Investments (continued) |
| | April 30, 2019 (Unaudited) |
| | | | | | |
Principal | | | Optional Call | | |
Amount (000) | | Description (1) | Provisions (2) | Ratings (3) | Value |
| | | California (continued) | | | |
| $ 2,550 | | Grossmont Healthcare District, California, General Obligation Bonds, Tender Option Bond | 7/21 at 100.00 | AAA | $ 4,087,777 |
| | | Trust 2017-XF2453, 22.387%, 7/15/40, 144A (Pre-refunded 7/15/21) (IF) (4) | | | |
| 770 | | Inland Empire Tobacco Securitization Authority, California, Tobacco Settlement | 5/19 at 100.00 | N/R | 770,008 |
| | | Asset-Backed Bonds, Series 2007A Turbo Current Interest, 4.625%, 6/01/21 | | | |
| 225 | | Long Beach Bond Finance Authority, California, Natural Gas Purchase Revenue Bonds, | No Opt. Call | A+ | 226,501 |
| | | Series 2007B, 3.248%, 11/15/27 (3-month LIBOR* 67% reference rate +1.45% Spread) (6) | | | |
| 1,600 | | Los Angeles County, California, Community Development Commission Headquarters Office | 9/21 at 100.00 | Aa3 | 2,198,240 |
| | | Building, Lease Revenue Bonds, Community Development Properties Los Angeles County Inc., | | | |
| | | Tender Option Bond Trust 2016-XL0022, 14.228%, 9/01/42, 144A (IF) (4) | | | |
| 525 | | Los Angeles Department of Airports, California, Revenue Bonds, Los Angeles International | 5/20 at 100.00 | AA | 544,477 |
| | | Airport, Senior Lien Series 2010A, 5.000%, 5/15/31 | | | |
| 1,080 | | National City Community Development Commission, California, Tax Allocation Bonds, | 8/21 at 100.00 | A (5) | 1,212,700 |
| | | National City Redevelopment Project, Series 2011, 7.000%, 8/01/32 (Pre-refunded 8/01/21) | | | |
| 1,165 | | Novato Redevelopment Agency, California, Tax Allocation Bonds, Hamilton Field | 9/21 at 100.00 | A– | 1,281,814 |
| | | Redevelopment Project, Series 2011, 6.750%, 9/01/40 | | | |
| 675 | | Palm Drive Health Care District, Sonoma County, California, Certificates of | 6/19 at 102.00 | CCC+ | 660,933 |
| | | Participation, Parcel Tax Secured Financing Program, Series 2010, 7.000%, 4/01/25 | | | |
| 265 | | Palomar Pomerado Health Care District, California, Certificates of Participation, Series | 11/19 at 100.00 | N/R (5) | 271,813 |
| | | 2009, 6.750%, 11/01/39 (Pre-refunded 11/01/19) | | | |
| 250 | | Ridgecrest Redevelopment Agency, California, Ridgecrest Redevelopment Project Tax | 6/20 at 100.00 | A– (5) | 263,342 |
| | | Allocation Bonds, Refunding Series 2010, 6.125%, 6/30/37 (Pre-refunded 6/30/20) | | | |
| | | San Francisco Redevelopment Finance Authority, California, Tax Allocation Revenue Bonds, | | | |
| | | Mission Bay North Redevelopment Project, Series 2011C: | | | |
| 500 | | 6.500%, 8/01/27 (Pre-refunded 2/01/21) | 2/21 at 100.00 | A– (5) | 543,940 |
| 700 | | 6.750%, 8/01/33 (Pre-refunded 2/01/21) | 2/21 at 100.00 | A– (5) | 764,526 |
| 500 | | San Francisco Redevelopment Financing Authority, California, Tax Allocation Revenue | 2/21 at 100.00 | BBB+ (5) | 545,015 |
| | | Bonds, Mission Bay South Redevelopment Project, Series 2011D, 6.625%, 8/01/27 | | | |
| | | (Pre-refunded 2/01/21) | | | |
| 360 | | Santee Community Development Commission, California, Santee Redevelopment Project Tax | 2/21 at 100.00 | A (5) | 394,470 |
| | | Allocation Bonds, Series 2011A, 7.000%, 8/01/31 (Pre-refunded 2/01/21) | | | |
| 1,000 | | Semitrophic Improvement District of Semitrophic Water Storage District, Kern County, | 12/19 at 100.00 | A+ (5) | 1,020,260 |
| | | California, Revenue Bonds, Refunding Series 2009A, 5.000%, 12/01/38 (Pre-refunded 12/01/19) | | | |
| 2,400 | | Semitrophic Improvement District of Semitrophic Water Storage District, Kern County, | 12/19 at 100.00 | A+ (5) | 2,643,024 |
| | | California, Revenue Bonds, Tender Option Bond Trust 2015-XF0117, 12.676%, | | | |
| | | 12/01/34, 144A (Pre-refunded 12/01/19) (IF) (4) | | | |
| 1,045 | | Ukiah Redevelopment Agency, California, Tax Allocation Bonds, Ukiah Redevelopment | 6/21 at 100.00 | A+ | 1,143,836 |
| | | Project, Series 2011A, 6.500%, 12/01/28 | | | |
| 1,020 | | Western Placer Unified School District, Placer County, California, Certificates of | 8/19 at 100.00 | AA (5) | 1,029,425 |
| | | Participation, Refunding Series 2009, 5.250%, 8/01/35 (Pre-refunded 8/01/19) – AGM Insured | | | |
| 35,625 | | Total California | | | 37,223,823 |
| | | Colorado – 2.7% | | | |
| | | Colorado Bridge Enterprise, Revenue Bonds, Central 70 Project, Senior Series 2017: | | | |
| 750 | | 4.000%, 12/31/30 (AMT) | 12/27 at 100.00 | A– | 820,942 |
| 250 | | 4.000%, 6/30/31 (AMT) | 12/27 at 100.00 | A– | 272,900 |
| 26 | | Colorado Housing and Finance Authority, Revenue Bonds, Confluence Energy LLC Project, | No Opt. Call | N/R | – |
| | | Series 2007, 5.000%, 6/01/18 (8), (9) | | | |
| 250 | | Colorado Housing and Finance Authority, Revenue Bonds, Confluence Energy LLC Project, | No Opt. Call | N/R | 31,513 |
| | | Series 2017, 0.000%, 4/01/22 (AMT) (8), (9) | | | |
| 4,000 | | E-470 Public Highway Authority, Colorado, Toll Revenue Bonds, Refunding Series 2006B, | 9/26 at 52.09 | A | 1,604,640 |
| | | 0.000%, 9/01/39 – NPFG Insured | | | |
56
| | | | | | |
Principal | | | Optional Call | | |
Amount (000) | | Description (1) | Provisions (2) | Ratings (3) | Value |
| | | Colorado (continued) | | | |
| | | Public Authority for Colorado Energy, Natural Gas Purchase Revenue Bonds, Colorado | | | |
| | | Springs Utilities, Series 2008: | | | |
| $ 475 | | 6.250%, 11/15/28 | No Opt. Call | A+ | $ 602,091 |
| 4,030 | | 6.500%, 11/15/38 | No Opt. Call | A+ | 6,011,752 |
| 815 | | Three Springs Metropolitan District 3, Durango, La Plata County, Colorado, Property Tax | 12/20 at 100.00 | N/R | 832,694 |
| | | Supported Revenue Bonds, Series 2010, 7.750%, 12/01/39 | | | |
| 10,596 | | Total Colorado | | | 10,176,532 |
| | | Connecticut – 0.1% | | | |
| 534 | | Harbor Point Infrastructure Improvement District, Connecticut, Special Obligation | 4/20 at 100.00 | N/R (5) | 559,595 |
| | | Revenue Bonds, Harbor Point Project, Series 2010A, 7.000%, 4/01/22 (Pre-refunded 4/01/20) | | | |
| | | District of Columbia – 0.4% | | | |
| 1,355 | | District of Columbia, Revenue Bonds, Center for Strategic and International Studies, | 3/21 at 100.00 | N/R (5) | 1,466,747 |
| | | Inc., Series 2011, 6.375%, 3/01/31 (Pre-refunded 3/01/21) | | | |
| | | Florida – 5.9% | | | |
| 1,590 | | Ave Maria Stewardship Community District, Florida, Capital Improvement Revenue Bonds, | 6/19 at 100.00 | N/R | 1,590,080 |
| | | Series 2006A, 5.125%, 5/01/38 | | | |
| 1,000 | | Bonterra Community Development District, Hialeah, Florida, Special Assessment Bonds, | 5/27 at 100.00 | N/R | 1,024,300 |
| | | Assessment Area 2 Project, Series 2016, 4.500%, 5/01/34 | | | |
| 2,000 | | Collier County Educational Facilities Authority, Florida, Revenue Bonds, Ave Maria | 6/23 at 100.00 | BBB– | 2,128,140 |
| | | University, Refunding Series 2013A, 5.625%, 6/01/33 | | | |
| 880 | | Copperstone Community Development District, Manatee County, Florida, Capital Improvement | 6/19 at 100.00 | N/R | 880,510 |
| | | Revenue Bonds, Series 2007, 5.200%, 5/01/38 | | | |
| 1,000 | | Florida Development Finance Corporation, Educational Facilities Revenue Bonds, | 6/21 at 100.00 | BB | 1,077,780 |
| | | Renaissance Charter School, Inc. Projects, Series 2011A, 7.500%, 6/15/33 | | | |
| 5,000 | | Florida, Development Finance Corporation, Surface Transportation Facility Revenue Bonds, | 1/20 at 105.00 | N/R | 5,127,650 |
| | | Virgin Trains USA Passenger Rail Project , Series 2019A, 6.500%, 1/01/49, 144A (AMT) | | | |
| | | (Mandatory Put 1/01/29) | | | |
| | | Miami-Dade County Health Facility Authority, Florida, Hospital Revenue Bonds, Miami | | | |
| | | Children’s Hospital, Series 2010A: | | | |
| 265 | | 6.000%, 8/01/30 | 8/20 at 100.00 | A+ | 277,794 |
| 735 | | 6.000%, 8/01/30 (Pre-refunded 8/01/20) | 8/20 at 100.00 | N/R (5) | 773,345 |
| | | Miami-Dade County, Florida, Aviation Revenue Bonds, Miami International Airport, | | | |
| | | Series 2010A-1: | | | |
| 340 | | 5.375%, 10/01/35 | 10/20 at 100.00 | A | 356,497 |
| 1,285 | | 5.375%, 10/01/35 (Pre-refunded 10/01/20) | 10/20 at 100.00 | N/R (5) | 1,352,527 |
| 1,500 | | North Sumter County Utility Dependent District, Florida, Utility Revenue Bonds, Series | 10/20 at 100.00 | AA | 1,574,085 |
| | | 2010, 5.375%, 10/01/40 | | | |
| | | Palm Beach County Health Facilities Authority, Florida, Revenue Bonds, Jupiter Medical | | | |
| | | Center, Series 2013A: | | | |
| 1,000 | | 5.000%, 11/01/33 | 11/22 at 100.00 | BBB+ | 1,064,930 |
| 2,000 | | 5.000%, 11/01/43 | 11/22 at 100.00 | BBB+ | 2,108,640 |
| 230 | | Tolomato Community Development District, Florida, Special Assessment Bonds, Convertible, | 6/19 at 100.00 | N/R | 230,110 |
| | | Capital Appreciation, Series 2012A-3, 6.610%, 5/01/40 (7) | | | |
| 95 | | Tolomato Community Development District, Florida, Special Assessment Bonds, Convertible, | 5/22 at 100.00 | N/R | 79,297 |
| | | Capital Appreciation, Series 2012A-4, 6.610%, 5/01/40 (7) | | | |
| 135 | | Tolomato Community Development District, Florida, Special Assessment Bonds, Hope Note, | 6/19 at 100.00 | N/R | 1 |
| | | Series 2007-3, 6.650%, 5/01/40 (9) | | | |
57
| | |
NEV | Nuveen Enhanced Municipal Value Fund |
| | Portfolio of Investments (continued) |
| | April 30, 2019 (Unaudited) |
| | | | | | |
Principal | | | Optional Call | | |
Amount (000) | | Description (1) | Provisions (2) | Ratings (3) | Value |
| | | Florida (continued) | | | |
| $ 15 | | Tolomato Community Development District, Florida, Special Assessment Bonds, Non | 6/19 at 100.00 | N/R | $ 15,015 |
| | | Performing Parcel Series 2007-1 RMKT, 6.650%, 5/01/40 | | | |
| 350 | | Tolomato Community Development District, Florida, Special Assessment Bonds, Refunding | 6/19 at 100.00 | N/R | 287,378 |
| | | Series 2015-1, 6.610%, 5/01/40 | | | |
| 215 | | Tolomato Community Development District, Florida, Special Assessment Bonds, Refunding | 6/19 at 100.00 | N/R | 145,046 |
| | | Series 2015-2, 6.610%, 5/01/40 | | | |
| 235 | | Tolomato Community Development District, Florida, Special Assessment Bonds, Refunding | 6/19 at 100.00 | N/R | 2 |
| | | Series 2015-3, 6.610%, 5/01/40 (9) | | | |
| 705 | | Tolomato Community Development District, Florida, Special Assessment Bonds, Series 2006, | 6/19 at 100.00 | N/R | 705,818 |
| | | 5.400%, 5/01/37 | | | |
| 1,080 | | Venetian Community Development District, Sarasota County, Florida, Capital Improvement | 5/22 at 100.00 | N/R | 1,123,567 |
| | | Revenue Bonds, Series 2012-A2, 5.500%, 5/01/34 | | | |
| 21,655 | | Total Florida | | | 21,922,512 |
| | | Georgia – 4.0% | | | |
| 12,000 | | Atlanta, Georgia, Airport General Revenue Bonds, Refunding Series 2010C, 5.250%, 1/01/30 (UB) | 1/21 at 100.00 | AA | 12,682,320 |
| 1,250 | | Clayton County Development Authority, Georgia, Special Facilities Revenue Bonds, Delta | 6/20 at 100.00 | Baa3 | 1,339,550 |
| | | Air Lines, Inc. Project, Series 2009A, 8.750%, 6/01/29 | | | |
| 90 | | Main Street Natural Gas Inc., Georgia, Gas Project Revenue Bonds, Series 2006B, | No Opt. Call | A+ | 97,018 |
| | | 5.000%, 3/15/22 | | | |
| 260 | | Main Street Natural Gas Inc., Georgia, Gas Project Revenue Bonds, Series 2007A, | No Opt. Call | A+ | 314,790 |
| | | 5.500%, 9/15/26 | | | |
| 285 | | Rockdale County Development Authority, Georgia, Revenue Bonds, Pratt Paper, LLC Project, | 1/28 at 100.00 | N/R | 289,583 |
| | | Refunding Series 2018, 4.000%, 1/01/38, 144A (AMT) | | | |
| 13,885 | | Total Georgia | | | 14,723,261 |
| | | Guam – 5.8% | | | |
| | | Government of Guam, Business Privilege Tax Bonds, Refunding Series 2015D: | | | |
| 195 | | 5.000%, 11/15/33 | 11/25 at 100.00 | BB | 212,061 |
| 1,805 | | 5.000%, 11/15/34 | 11/25 at 100.00 | BB | 1,955,050 |
| 1,760 | | Government of Guam, Business Privilege Tax Bonds, Series 2012B-1, 5.000%, 1/01/42 | 1/22 at 100.00 | BB | 1,809,720 |
| 500 | | Guam Government Waterworks Authority, Water and Wastewater System Revenue Bonds, | 7/23 at 100.00 | BBB– | 542,475 |
| | | Series 2013, 5.500%, 7/01/43 | | | |
| | | Guam Government, Limited Obligation Section 30 Revenue Bonds, Series 2016A: | | | |
| 2,500 | | 5.000%, 12/01/28 (UB) (4) | 12/26 at 100.00 | BB | 2,829,675 |
| 1,750 | | 5.000%, 12/01/30 (UB) (4) | 12/26 at 100.00 | BB | 1,955,853 |
| 2,500 | | 5.000%, 12/01/32 (UB) (4) | 12/26 at 100.00 | BB | 2,758,450 |
| 1,750 | | 5.000%, 12/01/34 (UB) (4) | 12/26 at 100.00 | BB | 1,915,550 |
| 6,000 | | 5.000%, 12/01/46 (UB) (4) | 12/26 at 100.00 | BB | 6,392,580 |
| 1,000 | | Guam Power Authority, Revenue Bonds, Refunding Series 2017A, 5.000%, 10/01/37 | 10/27 at 100.00 | BBB | 1,111,600 |
| 19,760 | | Total Guam | | | 21,483,014 |
| | | Illinois – 20.6% | | | |
| 2,050 | | CenterPoint Intermodal Center Program Trust, Illinois, Series 2004 Class A Certificates, 4.000%, | 12/22 at 100.00 | N/R | 2,069,270 |
| | | 6/15/23, 144A (Mandatory Put 12/15/22) | | | |
| 5,000 | | Chicago Board of Education, Illinois, Dedicated Capital Improvement Tax Revenue Bonds, | 4/27 at 100.00 | A | 5,793,700 |
| | | Series 2016, 6.000%, 4/01/46 | | | |
| 2,255 | | Chicago Board of Education, Illinois, General Obligation Bonds, Dedicated Revenues, | 12/24 at 100.00 | BB– | 2,394,652 |
| | | Project Series 2015C, 5.250%, 12/01/35 | | | |
| 520 | | Chicago Board of Education, Illinois, General Obligation Bonds, Dedicated Revenues, | 12/20 at 100.00 | B2 | 529,230 |
| | | Refunding Series 2010F, 5.000%, 12/01/31 | | | |
| 1,335 | | Chicago Board of Education, Illinois, General Obligation Bonds, Dedicated Revenues, | 12/26 at 100.00 | B+ | 1,535,811 |
| | | Series 2016B, 6.500%, 12/01/46 | | | |
58
| | | | | | |
Principal | | | Optional Call | | |
Amount (000) | | Description (1) | Provisions (2) | Ratings (3) | Value |
| | | Illinois (continued) | | | |
| | | Chicago Board of Education, Illinois, Unlimited Tax General Obligation Bonds, Dedicated | | | |
| | | Tax Revenues, Series 1998B-1: | | | |
| $ 1,000 | | 0.000%, 12/01/22 – FGIC Insured | No Opt. Call | Baa2 | $ 891,680 |
| 1,000 | | 0.000%, 12/01/27 – NPFG Insured | No Opt. Call | Baa2 | 732,090 |
| 1,000 | | Chicago, Illinois, General Obligation Bonds, Neighborhoods Alive 21 Program, Series | 1/25 at 100.00 | BBB+ | 1,099,020 |
| | | 2002B, 5.500%, 1/01/33 | | | |
| | | Chicago, Illinois, General Obligation Bonds, Refunding Series 2012C: | | | |
| 320 | | 5.000%, 1/01/23 | 1/22 at 100.00 | BBB+ | 335,504 |
| 160 | | 5.000%, 1/01/25 | 1/22 at 100.00 | BBB+ | 167,475 |
| | | Chicago, Illinois, General Obligation Bonds, Refunding Series 2016C: | | | |
| 3,470 | | 5.000%, 1/01/24 | No Opt. Call | BBB+ | 3,755,546 |
| 350 | | 5.000%, 1/01/29 | 1/26 at 100.00 | BBB+ | 382,900 |
| 10,125 | | Chicago, Illinois, General Obligation Bonds, Series 2019A, 5.000%, 1/01/44 (UB) (4) | 1/29 at 100.00 | BBB+ | 10,754,168 |
| 2,000 | | Grundy County School District 54 Morris, Illinois, General Obligation Bonds, Refunding | 12/21 at 100.00 | AA | 2,203,000 |
| | | Series 2005, 6.000%, 12/01/24 – AGM Insured | | | |
| 3,000 | | Illinois Finance Authority, Recovery Zone Facility Revenue Bonds, Navistar International | 10/20 at 100.00 | B1 | 3,128,610 |
| | | Corporation Project, Series 2010, 6.500%, 10/15/40 | | | |
| | | Illinois Finance Authority, Revenue Bonds, Centegra Health System, Tender Option Bond | | | |
| | | Trust 2016-XF2339: | | | |
| 1,540 | | 11.098%, 9/01/38, 144A (IF) (4) | 9/22 at 100.00 | AA+ | 2,022,790 |
| 1,605 | | 13.133%, 9/01/38, 144A (IF) (4) | 9/22 at 100.00 | AA+ | 2,232,667 |
| | | Illinois Finance Authority, Revenue Bonds, Christian Homes Inc., Refunding Series 2010: | | | |
| 355 | | 6.125%, 5/15/27 (Pre-refunded 5/15/20) | 5/20 at 100.00 | N/R (5) | 371,099 |
| 645 | | 6.125%, 5/15/27 | 5/20 at 100.00 | BBB– | 665,401 |
| 4,000 | | Illinois Finance Authority, Revenue Bonds, Illinois Institute of Technology, Refunding | 6/19 at 100.00 | Baa3 | 4,000,240 |
| | | Series 2006A, 5.000%, 4/01/36 | | | |
| | | Illinois Finance Authority, Revenue Bonds, Northwestern Memorial Healthcare, Tender | | | |
| | | Option Bond Trust 2015-XF0076: | | | |
| 150 | | 11.217%, 8/15/37, 144A (IF) | 8/22 at 100.00 | AA+ | 196,529 |
| 690 | | 11.217%, 8/15/37, 144A (IF) | 8/22 at 100.00 | AA+ | 921,288 |
| 1,975 | | Illinois Finance Authority, Revenue Bonds, Northwestern Memorial Hospital, Tender Option | 8/19 at 100.00 | N/R (5) | 2,097,884 |
| | | Bonds Trust 16-XL0021, 18.615%, 8/15/39, 144A (IF) (Pre-refunded 8/15/19) (4) | | | |
| 1,000 | | Illinois Finance Authority, Revenue Bonds, Palos Community Hospital, Series 2010C, | 5/20 at 100.00 | AA– | 1,025,320 |
| | | 5.125%, 5/15/35 | | | |
| 500 | | Illinois Finance Authority, Revenue Bonds, Southern Illinois Healthcare Enterprises, | 3/20 at 100.00 | A2 (5) | 514,860 |
| | | Inc., Series 2005 Remarketed, 5.250%, 3/01/30 (Pre-refunded 3/01/20) – AGM Insured | | | |
| 455 | | Illinois Finance Authority, Revenue Bonds, The Carle Foundation, Tender Option Bond | 8/21 at 100.00 | AA | 639,139 |
| | | Trust 2015-XF0121, 17.887%, 8/15/41, 144A (IF) (4) | | | |
| 20,830 | | Illinois State, General Obligation Bonds, November Series 2017D, 5.000%, 11/01/27 (UB) (4) | No Opt. Call | BBB | 23,039,855 |
| 8,000 | | Metropolitan Pier and Exposition Authority, Illinois, McCormick Place Expansion Project | No Opt. Call | AA | 1,637,600 |
| | | Bonds, Series 2017B, 0.000%, 12/15/56 – AGM Insured | | | |
| 1,000 | | Railsplitter Tobacco Settlement Authority, Illinois, Tobacco Settlement Revenue Bonds, | 6/21 at 100.00 | N/R (5) | 1,088,590 |
| | | Series 2010, 6.000%, 6/01/28 (Pre-refunded 6/01/21) | | | |
| 76,330 | | Total Illinois | | | 76,225,918 |
| | | Indiana – 1.4% | | | |
| 1,395 | | Indiana Finance Authority, Educational Facilities Revenue Bonds, Drexel Foundation For | 10/19 at 100.00 | B | 1,404,723 |
| | | Educational Excellence, Inc., Series 2009A, 6.625%, 10/01/29 | | | |
| 1,500 | | Indiana Finance Authority, Private Activity Bonds, Ohio River Bridges East End Crossing | 7/23 at 100.00 | A– | 1,635,090 |
| | | Project, Series 2013A, 5.000%, 7/01/35 (AMT) | | | |
| 2,000 | | Vigo County Hospital Authority, Indiana, Hospital Revenue Bonds, Union Hospital, Inc., | 9/21 at 100.00 | N/R (5) | 2,275,260 |
| | | Series 2011, 7.750%, 9/01/31 (Pre-refunded 9/01/21) | | | |
| 4,895 | | Total Indiana | | | 5,315,073 |
59
| | |
NEV | Nuveen Enhanced Municipal Value Fund |
| | Portfolio of Investments (continued) |
| | April 30, 2019 (Unaudited) |
| | | | | | |
Principal | | | Optional Call | | |
Amount (000) | | Description (1) | Provisions (2) | Ratings (3) | Value |
| | | Iowa – 0.3% | | | |
| $ 155 | | Iowa Finance Authority, Iowa, Midwestern Disaster Area Revenue Bonds, Iowa Fertilizer | 12/23 at 100.00 | B– | $ 167,132 |
| | | Company Project, Series 2013, 5.250%, 12/01/25 | | | |
| 995 | | Iowa Finance Authority, Iowa, Midwestern Disaster Area Revenue Bonds, Iowa Fertilizer | 12/22 at 103.00 | B+ | 1,050,979 |
| | | Company Project, Series 2018A, 5.250%, 12/01/50 | | | |
| 1,150 | | Total Iowa | | | 1,218,111 |
| | | Kansas – 2.2% | | | |
| 3,000 | | Kansas Development Finance Authority, Revenue Bonds, Lifespace Communities, Inc., | 5/20 at 100.00 | BBB | 3,068,430 |
| | | Refunding Series 2010S, 5.000%, 5/15/30 | | | |
| 665 | | Overland Park Development Corporation, Kansas, Second Tier Revenue Bonds, Overland Park | 6/19 at 100.00 | BB+ | 666,084 |
| | | Convention Center, Series 2007B, 5.125%, 1/01/22 – AMBAC Insured | | | |
| 3,565 | | Overland Park, Kansas, Sales Tax Special Obligation Revenue Bonds, Prairiefire at | 12/22 at 100.00 | N/R | 3,005,687 |
| | | Lionsgate Project, Series 2012, 6.000%, 12/15/32 | | | |
| 1,130 | | Washburn University of Topeka, Kansas, Revenue Bonds, Series 2015A, 5.000%, 7/01/35 | 7/25 at 100.00 | A1 | 1,294,291 |
| 8,360 | | Total Kansas | | | 8,034,492 |
| | | Kentucky – 0.9% | | | |
| 1,000 | | Hardin County, Kentucky, Hospital Revenue Bonds, Hardin Memorial Hospital Project, | 8/23 at 100.00 | AA | 1,114,920 |
| | | Series 2013, 5.700%, 8/01/39 – AGM Insured | | | |
| 2,000 | | Kentucky Economic Development Finance Authority, Revenue Bonds, Next Generation Kentucky | 7/25 at 100.00 | Baa2 | 2,126,620 |
| | | Information Highway Project, Senior Series 2015A, 5.000%, 1/01/45 | | | |
| 3,000 | | Total Kentucky | | | 3,241,540 |
| | | Louisiana – 6.0% | | | |
| 500 | | Jefferson Parish Economic Development and Port District, Louisiana, Kenner Discovery Health | 6/28 at 100.00 | N/R | 517,820 |
| | | Sciences Academy Project, Series 2018A, 5.625%, 6/15/48, 144A | | | |
| 2,420 | | Louisiana Public Facilities Authority, Revenue Bonds, Lake Charles Charter Academy | 12/21 at 100.00 | N/R | 2,622,070 |
| | | Foundation Project, Series 2011A, 7.750%, 12/15/31 | | | |
| 2,000 | | Louisiana Local Government Environmental Facilities and Community Development Authority, | 2/24 at 100.00 | AA– | 2,124,720 |
| | | Revenue Bonds, East Baton Rouge Sewerage Commission Projects, Subordinate Lien | | | |
| | | Series 2014A, 4.375%, 2/01/39 | | | |
| 1,215 | | Louisiana Local Government Environmental Facilities and Community Development Authority, | 10/25 at 100.00 | AA | 1,391,977 |
| | | Revenue Bonds, Louisiana Tech University Student Housing & Recreational Facilities/Innovative | | | |
| | | Student Facilities, 5.000%, 10/01/33 – AGM Insured | | | |
| 1,000 | | Louisiana Public Facilities Authority, Hospital Revenue Bonds, Franciscan Missionaries | 7/27 at 100.00 | A | 1,116,270 |
| | | of Our Lady Health System, Series 2017A, 5.000%, 7/01/47 | | | |
| 2,000 | | Louisiana Public Facilities Authority, Hospital Revenue Bonds, Lafayette General Medical | 5/20 at 100.00 | BBB+ | 2,057,720 |
| | | Center Project, Refunding Series 2010, 5.500%, 11/01/40 | | | |
| 1,000 | | Louisiana Public Facilities Authority, Lease Revenue Bonds, Provident Group-Flagship | 7/26 at 100.00 | A | 1,092,920 |
| | | Properties LLC – Louisiana State University Nicolson Gateway Project, Series 2016A, | | | |
| | | 5.000%, 7/01/56 | | | |
| 3,305 | | Louisiana Public Facilities Authority, Revenue Bonds, Cleco Power LLC Project, Series | 5/23 at 100.00 | A3 | 3,401,704 |
| | | 2008, 4.250%, 12/01/38 | | | |
| 985 | | Louisiana Public Facilities Authority, Revenue Bonds, Loyola University Project, | 10/21 at 100.00 | N/R (5) | 1,071,010 |
| | | Refunding Series 2011, 5.250%, 10/01/28 (Pre-refunded 10/01/21) | | | |
| | | Louisiana Public Facilities Authority, Revenue Bonds, Loyola University Project, | | | |
| | | Refunding Series 2017: | | | |
| 2,835 | | 5.250%, 10/01/31 (7) | No Opt. Call | Baa1 | 2,693,392 |
| 1,775 | | 0.000%, 10/01/36 | 10/33 at 100.00 | Baa1 | 1,673,949 |
| 1,165 | | Louisiana State, Gasoline and Fuels Tax Revenue Bonds, Tender Option Bond Trust | 5/20 at 100.00 | AA– (5) | 1,321,506 |
| | | 2016-XG0035, 11.335%, 5/01/39, 144A (Pre-refunded 5/01/20) (IF) | | | |
| 1,000 | | New Orleans Aviation Board, Louisiana, General Airport Revenue Bonds, North Terminal | 1/27 at 100.00 | A– | 1,120,270 |
| | | Project, Series 2017B, 5.000%, 1/01/48 (AMT) | | | |
| 21,200 | | Total Louisiana | | | 22,205,328 |
60
| | | | | | |
Principal | | | Optional Call | | |
Amount (000) | | Description (1) | Provisions (2) | Ratings (3) | Value |
| | | Massachusetts – 1.4% | | | |
| $ 1,800 | | Massachusetts Development Finance Agency, Revenue Bonds, Emmanuel College, Series 2016A, | 10/26 at 100.00 | Baa2 | $ 2,031,552 |
| | | 5.000%, 10/01/34 | | | |
| 800 | | Massachusetts Development Finance Agency, Revenue Bonds, Merrimack College, Series 2017, | 7/26 at 100.00 | BBB– | 871,712 |
| | | 5.000%, 7/01/47 | | | |
| 1,285 | | Massachusetts Educational Financing Authority, Education Loan Revenue Bonds, Issue K, | 7/22 at 100.00 | AA | 1,368,602 |
| | | Series 2013, 5.000%, 7/01/25 (AMT) | | | |
| 625 | | Massachusetts Educational Financing Authority, Student Loan Revenue Bonds, Issue I | 1/20 at 100.00 | AA | 641,019 |
| | | Series 2010A, 5.500%, 1/01/22 | | | |
| 325 | | Massachusetts Housing Finance Agency, Housing Bonds, Series 2010C, 5.000%, 12/01/30 (AMT) | 6/20 at 100.00 | AA | 325,695 |
| 4,835 | | Total Massachusetts | | | 5,238,580 |
| | | Michigan – 0.6% | | | |
| 10 | | Detroit, Michigan, Water Supply System Revenue Bonds, Senior Lien Series 2003A, 5.000%, | 6/19 at 100.00 | A2 | 10,025 |
| | | 7/01/34 – NPFG Insured | | | |
| 2,100 | | Michigan State Hospital Finance Authority, Hospital Revenue Bonds, Henry Ford Health | 11/19 at 100.00 | N/R (5) | 2,146,200 |
| | | System, Refunding Series 2009, 5.750%, 11/15/39 (Pre-refunded 11/15/19) | | | |
| 2,110 | | Total Michigan | | | 2,156,225 |
| | | Missouri – 0.3% | | | |
| 1,220 | | Branson Industrial Development Authority, Missouri, Tax Increment Revenue Bonds, Branson | 11/25 at 100.00 | N/R | 1,230,467 |
| | | Shoppes Redevelopment Project, Refunding Series 2017A, 3.900%, 11/01/29 | | | |
| 55 | | Cape Girardeau County Industrial Development Authority, Missouri, Health Facilities | 3/27 at 100.00 | BBB– | 61,255 |
| | | Revenue Bonds, Southeasthealth, Series 2017A, 5.000%, 3/01/36 | | | |
| 1,275 | | Total Missouri | | | 1,291,722 |
| | | Nevada – 0.6% | | | |
| 2,000 | | Clark County, Nevada, Passenger Facility Charge Revenue Bonds, Las Vegas-McCarran | 1/20 at 100.00 | Aa3 | 2,042,140 |
| | | International Airport, Series 2010A, 5.000%, 7/01/30 | | | |
| | | New Jersey – 10.9% | | | |
| 795 | | New Jersey Economic Development Authority, School Facilities Construction Bonds, Series | 6/25 at 100.00 | A– | 863,259 |
| | | 2015WW, 5.250%, 6/15/40 (UB) (4) | | | |
| | | New Jersey Economic Development Authority, Special Facilities Revenue Bonds, Continental | | | |
| | | Airlines Inc., Series 1999: | | | |
| 1,000 | | 5.125%, 9/15/23 (AMT) | 8/22 at 101.00 | BB | 1,077,290 |
| 1,650 | | 5.250%, 9/15/29 (AMT) | 8/22 at 101.00 | Ba3 | 1,800,381 |
| 2,155 | | New Jersey Economic Development Authority, Special Facility Revenue Bonds, Port Newark | 10/27 at 100.00 | Ba1 | 2,362,527 |
| | | Container Terminal LLC Project, Refunding Series 2017, 5.000%, 10/01/37 (AMT) | | | |
| 780 | | New Jersey Higher Education Assistance Authority, Student Loan Revenue Bonds, Series | 12/19 at 100.00 | Aaa | 794,336 |
| | | 2010-1A, 5.000%, 12/01/26 | | | |
| 20,000 | | New Jersey Transportation Trust Fund Authority, Transportation System Bonds, Refunding | No Opt. Call | A– | 10,117,200 |
| | | Series 2006C, 0.000%, 12/15/36 – AMBAC Insured (UB) (4) | | | |
| 20,000 | | New Jersey Transportation Trust Fund Authority, Transportation System Bonds, Series | 12/28 at 100.00 | A– | 22,560,600 |
| | | 2018A, 5.000%, 12/15/34 (UB) (4) | | | |
| 755 | | Tobacco Settlement Financing Corporation, New Jersey, Tobacco Settlement Asset-Backed | 6/28 at 100.00 | BBB | 788,582 |
| | | Bonds, Series 2018B, 5.000%, 6/01/46 | | | |
| 47,135 | | Total New Jersey | | | 40,364,175 |
| | | New York – 4.5% | | | |
| | | Brooklyn Arena Local Development Corporation, New York, Payment in Lieu of Taxes Revenue | | | |
| | | Bonds, Barclays Center Project, Series 2009: | | | |
| 1,100 | | 6.000%, 7/15/30 (Pre-refunded 1/15/20) | 1/20 at 100.00 | AA+ (5) | 1,134,837 |
| 1,225 | | 6.250%, 7/15/40 (Pre-refunded 1/15/20) | 1/20 at 100.00 | AA+ (5) | 1,265,927 |
| 2,000 | | 6.375%, 7/15/43 (Pre-refunded 1/15/20) | 1/20 at 100.00 | AA+ (5) | 2,068,560 |
61
| | |
NEV | Nuveen Enhanced Municipal Value Fund |
| | Portfolio of Investments (continued) |
| | April 30, 2019 (Unaudited) |
| | | | | | |
Principal | | | Optional Call | | |
Amount (000) | | Description (1) | Provisions (2) | Ratings (3) | Value |
| | | New York (continued) | | | |
| $ 1,000 | | Monroe County Industrial Development Corporation, New York, Revenue Bonds, St John | 6/21 at 100.00 | A– | $ 1,082,060 |
| | | Fisher College, Series 2011, 6.000%, 6/01/34 | | | |
| 1,000 | | New York City Industrial Development Agency, New York, PILOT Revenue Bonds, Queens | 6/19 at 100.00 | BBB | 1,014,910 |
| | | Baseball Stadium Project, Series 2006, 5.000%, 1/01/46 – AMBAC Insured | | | |
| 580 | | New York Liberty Development Corporation, New York, Liberty Revenue Bonds, 3 World Trade | 11/24 at 100.00 | N/R | 624,643 |
| | | Center Project, Class 1 Series 2014, 5.000%, 11/15/44, 144A | | | |
| 500 | | New York Liberty Development Corporation, New York, Liberty Revenue Bonds, 3 World Trade | 11/24 at 100.00 | N/R | 551,655 |
| | | Center Project, Class 2 Series 2014, 5.150%, 11/15/34, 144A | | | |
| | | New York Transportation Development Corporation, Special Facilities Bonds, LaGuardia | | | |
| | | Airport Terminal B Redevelopment Project, Series 2016A: | | | |
| 4,000 | | 4.000%, 7/01/33 (AMT) | 7/24 at 100.00 | BBB | 4,177,400 |
| 2,105 | | 5.000%, 7/01/46 (AMT) | 7/24 at 100.00 | Baa3 | 2,284,514 |
| 265 | | Port Authority of New York and New Jersey, Special Project Bonds, JFK International Air | 12/20 at 100.00 | BBB+ | 280,497 |
| | | Terminal LLC Project, Eighth Series 2010, 6.000%, 12/01/42 | | | |
| 2,150 | | TSASC Inc., New York, Tobacco Asset-Backed Bonds, Series 2006, 5.000%, 6/01/48 | 6/27 at 100.00 | N/R | 2,104,313 |
| 15,925 | | Total New York | | | 16,589,316 |
| | | Ohio – 9.7% | | | |
| | | Buckeye Tobacco Settlement Financing Authority, Ohio, Tobacco Settlement Asset-Backed | | | |
| | | Revenue Bonds, Senior Lien, Series 2007A-2: | | | |
| 6,000 | | 5.750%, 6/01/34 | 5/19 at 100.00 | Caa3 | 5,695,920 |
| 8,000 | | 5.875%, 6/01/47 | 5/19 at 100.00 | B– | 7,600,160 |
| 760 | | Franklin County, Ohio, Healthcare Facilities Revenue Bonds, Ohio Presbyterian Retirement | 7/20 at 100.00 | BBB | 782,618 |
| | | Services, Improvement Series 2010A, 5.625%, 7/01/26 | | | |
| 10,000 | | Franklin County, Ohio, Hospital Facilities Revenue Bonds, OhioHealth Corporation, Series | 5/25 at 100.00 | AA+ | 11,231,700 |
| | | 2015, 5.000%, 5/15/40 (UB) (4) | | | |
| 3,000 | | Lucas County, Ohio, Hospital Revenue Bonds, ProMedica Healthcare Obligated Group, Series | 11/21 at 100.00 | Baa1 (5) | 3,304,260 |
| | | 2011A, 5.750%, 11/15/31 (Pre-refunded 11/15/21) | | | |
| 1,000 | | Montgomery County, Ohio, Health Care and Multifamily Housing Revenue Bonds, Saint | 4/20 at 100.00 | BBB– | 1,030,630 |
| | | Leonard, Refunding & improvement Series 2010, 6.375%, 4/01/30 | | | |
| 970 | | Montgomery County, Ohio, Revenue Bonds, Catholic Health Initiatives, Tender Option Bond | 6/19 at 100.00 | BBB+ | 981,931 |
| | | Trust 2016-XF2311, 16.429%, 5/01/34, 144A (IF) (4) | | | |
| 6,000 | | Ohio Air Quality Development Authority, Ohio, Pollution Control Revenue Bonds, | No Opt. Call | N/R | 5,475,000 |
| | | FirstEnergy Generation Project, Refunding Series 2006A, 3.750%, 12/01/23 (9) | | | |
| 35,730 | | Total Ohio | | | 36,102,219 |
| | | Pennsylvania – 8.2% | | | |
| 1,390 | | Allegheny Country Industrial Development Authority, Pennsylvania, Environmental | 11/19 at 100.00 | B | 1,408,084 |
| | | Improvement Revenue Bonds, United States Steel Corporation Project, Refunding Series 2009, | | | |
| | | 6.750%, 11/01/24 | | | |
| 1,500 | | Allegheny Country Industrial Development Authority, Pennsylvania, Environmental | 12/21 at 100.00 | BB– | 1,549,695 |
| | | Improvement Revenue Bonds, United States Steel Corporation Project, Refunding Series 2011, | | | |
| | | 6.550%, 12/01/27 | | | |
| 1,335 | | Allegheny County Hospital Development Authority, Pennsylvania, Revenue Bonds, Ohio | 6/19 at 100.00 | Caa1 | 1,212,407 |
| | | Valley General Hospital, Series 2005A, 5.125%, 4/01/35 | | | |
| 530 | | Beaver County Industrial Development Authority, Pennsylvania, Pollution Control Revenue | No Opt. Call | N/R | 530,000 |
| | | Refunding Bonds, FirstEnergy Generation Project, Series 2008B, 4.250%, 10/01/47 (Mandatory | | | |
| | | Put 4/01/21) (9) | | | |
| 2,000 | | Beaver County Industrial Development Authority, Pennsylvania, Pollution Control Revenue | No Opt. Call | N/R | 1,825,000 |
| | | Refunding Bonds, FirstEnergy Nuclear Generation Project, Series 2006B, 3.500%, 12/01/35 | | | |
| | | (Mandatory Put 6/01/20) (9) | | | |
62
| | | | | | |
Principal | | | Optional Call | | |
Amount (000) | | Description (1) | Provisions (2) | Ratings (3) | Value |
| | | Pennsylvania (continued) | | | |
| | | Commonwealth Financing Authority, Pennsylvania, State Appropriation Lease Bonds, Master | | | |
| | | Settlement, Series 2018: | | | |
| $ 4,000 | | 5.000%, 6/01/32 (UB) (4) | 6/28 at 100.00 | A1 | $ 4,737,400 |
| 2,260 | | 5.000%, 6/01/33 (UB) (4) | 6/28 at 100.00 | A1 | 2,666,032 |
| 1,275 | | 5.000%, 6/01/34 (UB) (4) | 6/28 at 100.00 | A1 | 1,499,069 |
| 2,000 | | Luzerne County Industrial Development Authority, Pennsylvania, Guaranteed Lease Revenue | 12/19 at 100.00 | N/R (5) | 2,074,060 |
| | | Bonds, Series 2009, 7.750%, 12/15/27 (Pre-refunded 12/15/19) | | | |
| 1,080 | | Montgomery County Industrial Development Authority, Pennsylvania, FHA Insured Mortgage | 8/20 at 100.00 | N/R (5) | 1,251,256 |
| | | Revenue Bonds, New Regional Medical Center Project, Tender Option Bond Trust 2017-XF2454, | | | |
| | | 11.240%, 8/01/24, 144A (Pre-refunded 8/01/20) (IF) (4) | | | |
| 1,000 | | Pennsylvania Economic Development Financing Authority, Sewage Sludge Disposal Revenue | 1/20 at 100.00 | BBB+ | 1,021,910 |
| | | Bonds, Philadelphia Biosolids Facility Project, Series 2009, 6.250%, 1/01/32 | | | |
| 1,000 | | Pennsylvania Economic Development Financing Authority, Solid Waste Disposal Revenue | 6/19 at 100.00 | BB+ | 1,000,330 |
| | | Bonds, USG Corporation Project, Series 1999, 6.000%, 6/01/31 (AMT) | | | |
| 1,200 | | Pennsylvania Higher Educational Facilities Authority, Revenue Bonds, Edinboro University | 7/20 at 100.00 | N/R (5) | 1,256,436 |
| | | Foundation Student Housing Project, Series 2010, 5.800%, 7/01/30 (Pre-refunded 7/01/20) | | | |
| 130 | | Pennsylvania Higher Educational Facilities Authority, Revenue Bonds, University | 7/26 at 100.00 | Baa3 | 142,601 |
| | | Properties Inc. Student Housing Project at East Stroudsburg University of Pennsylvania, | | | |
| | | Series 2016A, 5.000%, 7/01/31 | | | |
| 1,000 | | Pennsylvania Public School Building Authority, Lease Revenue Bonds, School District of | No Opt. Call | AA | 1,185,830 |
| | | Philadelphia, Series 2006B, 5.000%, 6/01/27 – AGM Insured | | | |
| | | Pennsylvania Turnpike Commission, Turnpike Revenue Bonds, Capital Appreciation Series 2009E: | | | |
| 3,530 | | 6.000%, 12/01/30 | 12/27 at 100.00 | A | 4,495,243 |
| 2,000 | | 6.375%, 12/01/38 | 12/27 at 100.00 | A | 2,536,580 |
| 27,230 | | Total Pennsylvania | | | 30,391,933 |
| | | Puerto Rico – 0.7% | | | |
| 1,000 | | Puerto Rico Highway and Transportation Authority, Highway Revenue Bonds, Series 2007N, | No Opt. Call | C | 916,200 |
| | | 2.671%, 7/01/27 | | | |
| 1,500 | | Puerto Rico Housing Finance Authority, Subordinate Lien Capital Fund Program Revenue | 6/19 at 100.00 | A+ | 1,550,385 |
| | | Bonds, Modernization Series 2008, 5.125%, 12/01/27 | | | |
| 2,500 | | Total Puerto Rico | | | 2,466,585 |
| | | South Carolina – 2.3% | | | |
| 7,500 | | South Carolina Public Service Authority Santee Cooper Revenue Obligations, Refunding | 12/26 at 100.00 | A+ | 8,504,325 |
| | | Series 2016B, 5.000%, 12/01/46 (UB) (4) | | | |
| | | Tennessee – 0.3% | | | |
| 1,000 | | Bristol Industrial Development Board, Tennessee, State Sales Tax Revenue Bonds, Pinnacle | 12/26 at 100.00 | N/R | 1,008,390 |
| | | Project, Series 2016A, 5.125%, 12/01/42, 144A | | | |
| 155 | | The Tennessee Energy Acquisition Corporation, Gas Revenue Bonds, Series 2006C, | No Opt. Call | A | 171,697 |
| | | 5.000%, 2/01/24 | | | |
| 1,155 | | Total Tennessee | | | 1,180,087 |
| | | Texas – 2.4% | | | |
| 80 | | Arlington Higher Education Finance Corporation, Texas, Education Revenue Bonds, | 6/21 at 100.00 | BB | 80,925 |
| | | Leadership Prep School, Series 2016A, 5.000%, 6/15/46 | | | |
| 150 | | Fort Bend County Industrial Development Corporation, Texas, Revenue Bonds, NRG Energy | 11/22 at 100.00 | Baa3 | 154,081 |
| | | Inc. Project, Series 2012B, 4.750%, 11/01/42 | | | |
| 825 | | New Hope Cultural Education Facilities Finance Corporation, Texas, Student Housing | 7/25 at 100.00 | B3 | 763,414 |
| | | Revenue Bonds, NCCD – College Station Properties LLC – Texas A&M University Project, Series | | | |
| | | 2015A, 5.000%, 7/01/47 | | | |
| 1,800 | | North Texas Tollway Authority, Special Projects System Revenue Bonds, Tender Option Bond | 9/21 at 100.00 | N/R (5) | 2,577,996 |
| | | Trust 2016-XF2220, 15.561%, 9/01/41, 144A (Pre-refunded 9/01/21) (IF) | | | |
63
| | |
NEV | Nuveen Enhanced Municipal Value Fund |
| | Portfolio of Investments (continued) |
| | April 30, 2019 (Unaudited) |
| | | | | | |
Principal | | | Optional Call | | |
Amount (000) | | Description (1) | Provisions (2) | Ratings (3) | Value |
| | | Texas (continued) | | | |
| $ 1,000 | | Red River Health Facilities Development Corporation, Texas, First Mortgage Revenue | 12/21 at 100.00 | N/R | $ 622,500 |
| | | Bonds, Eden Home Inc., Series 2012, 7.250%, 12/15/47 (9) | | | |
| 425 | | Texas Municipal Gas Acquisition and Supply Corporation I, Gas Supply Revenue Bonds, | No Opt. Call | A2 | 492,864 |
| | | Senior Lien Series 2008D, 6.250%, 12/15/26 | | | |
| 810 | | Texas Private Activity Bond Surface Transportation Corporation, Revenue Bonds, NTE | 12/19 at 100.00 | BBB– | 835,936 |
| | | Mobility Partners LLC North Tarrant Express Managed Lanes Project, Senior Lien Series 2009, | | | |
| | | 6.875%, 12/31/39 | | | |
| | | Texas Private Activity Bond Surface Transportation Corporation, Senior Lien Revenue | | | |
| | | Bonds, Blueridge Transportation Group, LLC SH 288 Toll Lanes Project, Series 2016: | | | |
| 1,275 | | 5.000%, 12/31/50 (AMT) | 12/25 at 100.00 | Baa3 | 1,389,635 |
| 805 | | 5.000%, 12/31/55 (AMT) | 12/25 at 100.00 | Baa3 | 875,140 |
| 1,000 | | Texas Private Activity Bond Surface Transportation Corporation, Senior Lien Revenue | 6/20 at 100.00 | Baa3 | 1,057,660 |
| | | Bonds, LBJ Infrastructure Group LLC IH-635 Managed Lanes Project, Series 2010, | | | |
| | | 7.000%, 6/30/34 | | | |
| 8,170 | | Total Texas | | | 8,850,151 |
| | | Utah – 0.3% | | | |
| 1,000 | | Utah State Charter School Finance Authority, Charter School Revenue Bonds, Paradigm High | 7/20 at 100.00 | BB | 1,026,690 |
| | | School, Series 2010A, 6.250%, 7/15/30 | | | |
| | | Vermont – 0.8% | | | |
| | | Vermont Educational and Health Buildings Financing Agency, Revenue Bonds, Vermont Law | | | |
| | | School Project, Series 2011A: | | | |
| 1,000 | | 6.125%, 1/01/28 (Pre-refunded 1/01/21) | 1/21 at 100.00 | N/R (5) | 1,071,410 |
| 1,760 | | 6.250%, 1/01/33 (Pre-refunded 1/01/21) | 1/21 at 100.00 | N/R (5) | 1,889,272 |
| 2,760 | | Total Vermont | | | 2,960,682 |
| | | Virginia – 2.5% | | | |
| 10,000 | | Metropolitan Washington Airports Authority, Virginia, Dulles Toll Road Revenue Bonds, | No Opt. Call | BBB+ | 4,875,500 |
| | | Dulles Metrorail & Capital improvement Projects, Second Senior Lien Series 2009B, 0.000%, | | | |
| | | 10/01/37 – AGC Insured | | | |
| 2,000 | | Tobacco Settlement Financing Corporation of Virginia, Tobacco Settlement Asset Backed | 5/19 at 100.00 | B– | 1,944,060 |
| | | Bonds, Series 2007B1, 5.000%, 6/01/47 | | | |
| 1,155 | | Virginia Small Business Financing Authority, Private Activity Revenue Bonds, Transform | 6/27 at 100.00 | BBB | 1,260,729 |
| | | 66 P3 Project, Senior Lien Series 2017, 5.000%, 12/31/56 (AMT) | | | |
| 1,010 | | Virginia Small Business Financing Authority, Senior Lien Revenue Bonds, Elizabeth River | 7/22 at 100.00 | BBB | 1,091,345 |
| | | Crossing, Opco LLC Project, Series 2012, 5.500%, 1/01/42 (AMT) | | | |
| 14,165 | | Total Virginia | | | 9,171,634 |
| | | Washington – 4.2% | | | |
| 5,000 | | Port of Seattle, Washington, Revenue Bonds, Refunding First Lien Series 2016B, 5.000%, | 4/26 at 100.00 | Aa2 | 5,767,050 |
| | | 10/01/31 (AMT) (UB) (4) | | | |
| 3,155 | | Skagit County Public Hospital District 1, Washington, Revenue Bonds, Skagit Valley | 12/26 at 100.00 | Baa2 | 3,640,555 |
| | | Hospital, Refunding & Improvement Series 2016, 5.000%, 12/01/27 | | | |
| 155 | | Tacoma Consolidated Local Improvement District 65, Washington, Special Assessment Bonds, | 5/19 at 100.00 | N/R | 155,750 |
| | | Series 2013, 5.750%, 4/01/43 | | | |
| 2,000 | | Washington Health Care Facilities Authority, Revenue Bonds, Fred Hutchinson Cancer | 1/21 at 100.00 | A+ | 2,094,220 |
| | | Research Center, Series 2011A, 5.375%, 1/01/31 | | | |
| 2,000 | | Washington State Health Care Facilities Authority, Revenue Bonds, Fred Hutchinson Cancer | 7/19 at 100.00 | A+ (5) | 2,014,080 |
| | | Research Center, Series 2009A, 6.000%, 1/01/33 (Pre-refunded 7/01/19) | | | |
| 2,000 | | Washington State Higher Education Facilities Authority, Revenue Bonds, Whitworth | 10/19 at 100.00 | Baa1 (5) | 2,032,540 |
| | | University, Series 2009, 5.625%, 10/01/40 (Pre-refunded 10/01/19) | | | |
| 14,310 | | Total Washington | | | 15,704,195 |
64
| | | | | | |
Principal | | | Optional Call | | |
Amount (000) | | Description (1) | Provisions (2) | Ratings (3) | Value |
| | | West Virginia – 0.2% | | | |
| $ 750 | | West Virginia Hospital Finance Authority, Hospital Revenue Bonds, Thomas Health System, | 5/19 at 100.00 | N/R | $ 566,460 |
| | | Inc., Series 2008, 6.500%, 10/01/38 (9) | | | |
| | | Wisconsin – 9.7% | | | |
| 3,500 | | Oneida Tribe of Indians of Wisconsin, Retail Sales Revenue Bonds, Series 2011-144A, | 6/19 at 102.00 | BBB+ | 3,581,445 |
| | | 6.500%, 2/01/31, 144A | | | |
| 25 | | Public Finance Authority of Wisconsin, Charter School Revenue Bonds, Corvian Community | 6/24 at 100.00 | N/R | 25,314 |
| | | School Bonds, North Carolina, Series 2017A, 5.000%, 6/15/37, 144A | | | |
| 170 | | Public Finance Authority of Wisconsin, Charter School Revenue Bonds, North Carolina | 6/26 at 100.00 | N/R | 162,821 |
| | | Charter Educational Foundation Project, Series 2016A, 5.000%, 6/15/36, 144A | | | |
| | | Public Finance Authority of Wisconsin, Conference Center and Hotel Revenue Bonds, | | | |
| | | Lombard Public Facilities Corporation, Second Tier Series 2018B: | | | |
| 69 | | 0.000%, 1/01/46, 144A | No Opt. Call | N/R | 2,216 |
| 68 | | 0.000%, 1/01/47, 144A | No Opt. Call | N/R | 2,168 |
| 68 | | 0.000%, 1/01/48, 144A | No Opt. Call | N/R | 2,136 |
| 67 | | 0.000%, 1/01/49, 144A | No Opt. Call | N/R | 2,105 |
| 67 | | 0.000%, 1/01/50, 144A | No Opt. Call | N/R | 2,060 |
| 73 | | 0.000%, 1/01/51, 144A | No Opt. Call | N/R | 2,242 |
| 1,896 | | 3.750%, 7/01/51, 144A | 3/28 at 100.00 | N/R | 1,716,839 |
| 72 | | 0.000%, 1/01/52, 144A | No Opt. Call | N/R | 2,212 |
| 71 | | 0.000%, 1/01/53, 144A | No Opt. Call | N/R | 2,168 |
| 71 | | 0.000%, 1/01/54, 144A | No Opt. Call | N/R | 2,140 |
| 70 | | 0.000%, 1/01/55, 144A | No Opt. Call | N/R | 2,098 |
| 69 | | 0.000%, 1/01/56, 144A | No Opt. Call | N/R | 2,056 |
| 68 | | 0.000%, 1/01/57, 144A | No Opt. Call | N/R | 2,030 |
| 67 | | 0.000%, 1/01/58, 144A | No Opt. Call | N/R | 1,990 |
| 67 | | 0.000%, 1/01/59, 144A | No Opt. Call | N/R | 1,964 |
| 67 | | 0.000%, 1/01/60, 144A | No Opt. Call | N/R | 1,940 |
| 66 | | 0.000%, 1/01/61, 144A | No Opt. Call | N/R | 1,901 |
| 65 | | 0.000%, 1/01/62, 144A | No Opt. Call | N/R | 1,877 |
| 64 | | 0.000%, 1/01/63, 144A | No Opt. Call | N/R | 1,840 |
| 64 | | 0.000%, 1/01/64, 144A | No Opt. Call | N/R | 1,816 |
| 63 | | 0.000%, 1/01/65, 144A | No Opt. Call | N/R | 1,793 |
| 62 | | 0.000%, 1/01/66, 144A | No Opt. Call | N/R | 1,757 |
| 808 | | 0.000%, 1/01/67, 144A | No Opt. Call | N/R | 22,775 |
| 1,500 | | Public Finance Authority of Wisconsin, Multifamily Housing Revenue Bonds, Cedar Grove | 12/22 at 105.00 | A– | 1,500,210 |
| | | Portfolio Project, Series 2017A, 4.625%, 12/01/52 | | | |
| 160 | | Public Finance Authority of Wisconsin, Revenue Bonds, Prime Healthcare Foundation, Inc., | 12/27 at 100.00 | BBB– | 178,054 |
| | | Series 2017A, 5.200%, 12/01/37 | | | |
| 2,905 | | Public Finance Authority of Wisconsin, Student Housing Revenue Bonds, Collegiate Housing | 7/25 at 100.00 | BBB– | 3,083,337 |
| | | Foundation – Cullowhee LLC – Western California University Project, Series 2015A, | | | |
| | | 5.000%, 7/01/35 | | | |
| 1,000 | | Wisconsin Center District, Dedicated Tax Revenue Bonds, Refunding Senior Series 2003A, | No Opt. Call | AA | 703,650 |
| | | 0.000%, 12/15/31 | | | |
| | | Wisconsin Health and Educational Facilities Authority, Revenue Bonds, Ascension Health | | | |
| | | Alliance Senior Credit Group, Series 2016A: | | | |
| 10,000 | | 5.000%, 11/15/35 (UB) (4) | 5/26 at 100.00 | AA+ | 11,558,800 |
| 5,000 | | 5.000%, 11/15/36 (UB) (4) | 5/26 at 100.00 | AA+ | 5,763,050 |
| 3,000 | | 5.000%, 11/15/39 (UB) (4) | 5/26 at 100.00 | AA+ | 3,434,790 |
| 1,000 | | Wisconsin Health and Educational Facilities Authority, Revenue Bonds, Beloit College, | 6/20 at 100.00 | N/R (5) | 1,046,380 |
| | | Series 2010A, 6.000%, 6/01/30 (Pre-refunded 6/01/20) | | | |
| 500 | | Wisconsin Health and Educational Facilities Authority, Revenue Bonds, Beloit Health | 4/20 at 100.00 | A– | 509,935 |
| | | System, Inc., Series 2010B, 5.000%, 4/01/30 | | | |
| 1,290 | | Wisconsin Health and Educational Facilities Authority, Revenue Bonds, Froedtert | 6/19 at 100.00 | AA | 1,418,342 |
| | | Community Health, Inc. Obligated Group, Tender Option Bond Trust 2015-XF0118, 8.056%, | | | |
| | | 4/01/42, 144A (IF) (4) | | | |
65
| | |
NEV | Nuveen Enhanced Municipal Value Fund |
| | Portfolio of Investments (continued) |
| | April 30, 2019 (Unaudited) |
| | | | | | |
Principal | | | Optional Call | | |
Amount (000) | | Description (1) | Provisions (2) | Ratings (3) | Value |
| | | Wisconsin (continued) | | | |
| $ 25 | | Wisconsin Health and Educational Facilities Authority, Revenue Bonds, Monroe Clinic | 8/25 at 100.00 | N/R (5) | $ 29,571 |
| | | Inc., Refunding Series 2016, 5.000%, 2/15/28 (Pre-refunded 8/15/25) | | | |
| 1,090 | | Wisconsin Health and Educational Facilities Authority, Revenue Bonds, Three Pillars | 8/23 at 100.00 | A | 1,171,129 |
| | | Senior Living Communities, Refunding Series 2013, 5.000%, 8/15/43 | | | |
| 35,287 | | Total Wisconsin | | | 35,948,951 |
| | | Wyoming – 0.7% | | | |
| | | Wyoming Community Development Authority, Student Housing Revenue Bonds, CHF-Wyoming, | | | |
| | | LLC – University of Wyoming Project, Series 2011: | | | |
| 710 | | 6.250%, 7/01/31 | 7/21 at 100.00 | BBB | 749,831 |
| 1,600 | | 6.500%, 7/01/43 | 7/21 at 100.00 | BBB | 1,682,752 |
| 2,310 | | Total Wyoming | | | 2,432,583 |
| $ 455,946 | | Total Long-Term Investments (cost $430,689,932) | | | 459,128,007 |
| | | Floating Rate Obligations – (28.0)% | | | (103,777,000) |
| | | Other Assets Less Liabilities – 4.0% | | | 15,044,492 |
| | | Net Assets Applicable to Common Shares – 100% | | | $ 370,395,499 |
| | |
| (1) | All percentages shown in the Portfolio of Investments are based on net assets applicable to common shares unless otherwise noted. |
| (2) | Optional Call Provisions: Dates (month and year) and prices of the earliest optional call or redemption. There may be other call provisions at varying prices at later dates. Certain mortgage-backed securities may be subject to periodic principal paydowns. |
| (3) | For financial reporting purposes, the ratings disclosed are the highest of Standard & Poor’s Group (“Standard & Poor’s”), Moody’s Investors Service, Inc. (“Moody’s”) or Fitch, Inc. (“Fitch”) rating. This treatment of split-rated securities may differ from that used for other purposes, such as for Fund investment policies. Ratings below BBB by Standard & Poor’s, Baa by Moody’s or BBB by Fitch are considered to be below investment grade. Holdings designated N/R are not rated by any of these national rating agencies. |
| (4) | Investment, or portion of investment, has been pledged to collateralize the net payment obligations for investments in inverse floating rate transactions. |
| (5) | Backed by an escrow or trust containing sufficient U.S. Government or U.S. Government agency securities, which ensure the timely payment of principal and interest. |
| (6) | Variable rate security. The rate shown is the coupon as of end of the reporting period. |
| (7) | Step-up coupon bond, a bond with a coupon that increases (“steps up”), usually at regular intervals, while the bond is outstanding. The rate shown is the coupon as of the end of the reporting period. |
| (8) | Investment valued at fair value using methods determined in good faith by, or at the discretion of, the Board. For fair value measurement disclosure purposes, investment classified as Level 3. See Notes to Financial Statements, Note 2 – Investment Valuation and Fair Value Measurements for more information. |
| (9) | Defaulted security. A security whose issuer has failed to fully pay principal and/or interest when due, or is under the protection of bankruptcy. |
| 144A | Investment is exempt from registration under Rule 144A of the Securities Act of 1933, as amended. These investments may only be resold in transactions exempt from registration, which are normally those transactions with qualified institutional buyers. |
| AMT | Alternative Minimum Tax |
| LIBOR | London Inter-Bank Offered Rate. |
| IF | Inverse floating rate security issued by a tender option bond (“TOB”) trust, the interest rate on which varies inversely with the Securities Industry Financial Markets Association (SIFMA) short-term rate, which resets weekly, or a similar short-term rate, and is reduced by the expenses related to the TOB trust. |
| UB | Underlying bond of an inverse floating rate trust reflected as a financing transaction. See Notes to Financial Statements, Note 3 – Portfolio Securities and Investments in Derivatives, Inverse Floating Rate Securities for more information. |
See accompanying notes to financial statements.
66
Statement of Assets and Liabilities
April 30, 2019 (Unaudited)
| | | | | | | | | | | | | |
| | | NUV | | | NUW | | | NMI | | | NEV | |
Assets | | | | | | | | | | | | |
| Long-term investments, at value (cost $1,942,399,582, $219,088,442, | | | | | | | | | | | | |
| $89,532,568 and $430,689,932, respectively) | | $ | 2,128,733,486 | | | $ | 243,448,809 | | | $ | 96,271,761 | | | $ | 459,128,007 | |
| Cash | | | 588,442 | | | | 1,295,916 | | | | 101,286 | | | | 4,655,575 | |
Cash collateral at brokers for investments in futures contracts(1) | | | — | | | | 96,600 | | | | — | | | | — | |
| Receivable for: | | | | | | | | | | | | | | | | |
| Interest | | | 25,799,205 | | | | 3,155,210 | | | | 1,218,143 | | | | 7,632,535 | |
| Investments sold | | | 20,245,000 | | | | 15,530,000 | | | | 1,609,882 | | | | 4,504,406 | |
| Other assets | | | 381,815 | | | | 5,446 | | | | 5,245 | | | | 38,074 | |
| Total assets | | | 2,175,747,948 | | | | 263,531,981 | | | | 99,206,317 | | | | 475,958,597 | |
Liabilities | | | | | | | | | | | | | | | | |
| Floating rate obligations | | | 37,705,000 | | | | 9,125,000 | | | | — | | | | 103,777,000 | |
| Payable for: | | | | | | | | | | | | | | | | |
| Dividends | | | 5,784,186 | | | | 820,975 | | | | 287,740 | | | | 1,398,116 | |
| Investments purchased | | | 2,155,000 | | | | — | | | | 1,478,941 | | | | — | |
| Variation margin on futures contracts | | | — | | | | 19,688 | | | | — | | | | — | |
| Accrued expenses: | | | | | | | | | | | | | | | | |
| Management fees | | | 780,793 | | | | 122,837 | | | | 48,533 | | | | 288,697 | |
| Directors/Trustees fees | | | 357,646 | | | | 1,954 | | | | 755 | | | | 24,654 | |
| Other | | | 377,956 | | | | 54,084 | | | | 46,599 | | | | 74,631 | |
| Total liabilities | | | 47,160,581 | | | | 10,144,538 | | | | 1,862,568 | | | | 105,563,098 | |
| Net assets applicable to common shares | | $ | 2,128,587,367 | | | $ | 253,387,443 | | | $ | 97,343,749 | | | $ | 370,395,499 | |
| Common shares outstanding | | | 206,875,449 | | | | 15,399,134 | | | | 8,736,332 | | | | 24,950,068 | |
| Net asset value (“NAV”) per common share outstanding | | $ | 10.29 | | | $ | 16.45 | | | $ | 11.14 | | | $ | 14.85 | |
| | |
Net assets applicable to common shares consist of: | | | | | | | | | | | | | | | | |
| Common shares, $0.01 par value per share | | $ | 2,068,754 | | | $ | 153,991 | | | $ | 87,363 | | | $ | 249,501 | |
| Paid-in surplus | | | 1,956,383,687 | | | | 227,923,703 | | | | 90,294,792 | | | | 363,265,119 | |
| Total distributable earnings | | | 170,134,926 | | | | 25,309,749 | | | | 6,961,594 | | | | 6,880,879 | |
| Net assets applicable to common shares | | $ | 2,128,587,367 | | | $ | 253,387,443 | | | $ | 97,343,749 | | | $ | 370,395,499 | |
| Authorized common shares | | | 350,000,000 | | | Unlimited | | | | 200,000,000 | | | Unlimited | |
| | |
(1) | Cash pledged to collateralize the net payment obligations for investments in derivatives. |
See accompanying notes to financial statements.
67
Statement of Operations
Six Months Ended April 30, 2019 (Unaudited)
| | | | | | | | | | | | | |
| | | NUV | | | NUW | | | NMI | | | NEV | |
Investment Income | | $ | 44,430,205 | | | $ | 5,958,461 | | | $ | 2,256,000 | | | $ | 11,951,052 | |
Expenses | | | | | | | | | | | | | | | | |
| Management fees | | | 4,735,513 | | | | 731,577 | | | | 290,183 | | | | 1,735,544 | |
| Interest expense | | | 458,107 | | | | 98,034 | | | | — | | | | 1,052,468 | |
| Custodian fees | | | 106,772 | | | | 17,907 | | | | 15,086 | | | | 31,327 | |
| Directors/Trustees fees | | | 32,172 | | | | 3,834 | | | | 1,484 | | | | 5,597 | |
| Professional fees | | | 38,593 | | | | 20,783 | | | | 23,103 | | | | 38,389 | |
| Shareholder reporting expenses | | | 113,589 | | | | 16,132 | | | | 11,228 | | | | 19,776 | |
| Shareholder servicing agent fees | | | 246,183 | | | | 125 | | | | 3,762 | | | | 114 | |
| Stock exchange listing fees | | | 28,732 | | | | 4,094 | | | | 3,731 | | | | 3,464 | |
| Investor relations expenses | | | 28,640 | | | | 3,176 | | | | 1,257 | | | | 4,623 | |
| Other | | | 44,394 | | | | 10,989 | | | | 6,782 | | | | 23,843 | |
| Total expenses | | | 5,832,695 | | | | 906,651 | | | | 356,616 | | | | 2,915,145 | |
| Net investment income (loss) | | | 38,597,510 | | | | 5,051,810 | | | | 1,899,384 | | | | 9,035,907 | |
Realized and Unrealized Gain (Loss) | | | | | | | | | | | | | | | | |
| Net realized gain (loss) from investments | | | (301,263 | ) | | | 174,522 | | | | 102,613 | | | | 158,874 | |
| Change in net unrealized appreciation (depreciation) of: | | | | | | | | | | | | | | | | |
| Investments | | | 93,549,347 | | | | 10,259,879 | | | | 2,460,705 | | | | 14,316,483 | |
| Futures contracts | | | — | | | | (50,368 | ) | | | — | | | | — | |
| Net realized and unrealized gain (loss) | | | 93,248,084 | | | | 10,384,033 | | | | 2,563,318 | | | | 14,475,357 | |
| Net increase (decrease) in net assets applicable to common shares | | | | | | | | | | | | | | | | |
| from operations | | $ | 131,845,594 | | | $ | 15,435,843 | | | $ | 4,462,702 | | | $ | 23,511,264 | |
See accompanying notes to financial statements.
68
Statement of Changes in Net Assets
(Unaudited)
| | | | | | | | | | | | | |
| | | NUV | | | NUW | |
| | | Six Months | | | | | | Six Months | | | | |
| | | Ended | | | Year Ended | | | Ended | | | Year Ended | |
| | | 4/30/19 | | | 10/31/18 | | | 4/30/19 | | | 10/31/18 | |
Operations | | | | | | | | | | | | |
| Net investment income (loss) | | $ | 38,597,510 | | | $ | 78,480,821 | | | $ | 5,051,810 | | | $ | 10,739,136 | |
| Net realized gain (loss) from investments | | | (301,263 | ) | | | (1,117,529 | ) | | | 174,522 | | | | 1,480,929 | |
| Change in net unrealized appreciation (depreciation) of: | | | | | | | | | | | | | | | | |
| Investments | | | 93,549,347 | | | | (91,610,753 | ) | | | 10,259,879 | | | | (15,564,805 | ) |
| Futures contracts | | | — | | | | — | | | | (50,368 | ) | | | — | |
| Net increase (decrease) in net assets applicable to common shares | | | | | | | | | | | | | | | | |
| from operations | | | 131,845,594 | | | | (14,247,461 | ) | | | 15,435,843 | | | | (3,344,740 | ) |
Distributions to Common Shareholders | | | | | | | | | | | | | | | | |
| Dividends | | | (38,478,834 | ) | | | (80,577,992 | ) | | | (6,660,125 | ) | | | (13,775,655 | ) |
| Decrease in net assets applicable to common shares from | | | | | | | | | | | | | | | | |
| distributions to common shareholders | | | (38,478,834 | ) | | | (80,577,992 | ) | | | (6,660,125 | ) | | | (13,775,655 | ) |
Capital Share Transactions | | | | | | | | | | | | | | | | |
| Proceeds from shelf offering, net of offering costs | | | — | | | | — | | | | — | | | | 5,126,753 | |
| Net proceeds from common shares issued to common shareholders | | | | | | | | | | | | | | | | |
| due to reinvestment of distributions | | | — | | | | — | | | | — | | | | 324,271 | |
| Net increase (decrease) in net assets applicable to common shares | | | | | | | | | | | | | | | | |
| from capital share transactions | | | — | | | | — | | | | — | | | | 5,451,024 | |
| Net increase (decrease) in net assets applicable to common shares | | | 93,366,760 | | | | (94,825,453 | ) | | | 8,775,718 | | | | (11,669,371 | ) |
| Net assets applicable to common shares at the beginning of period | | | 2,035,220,607 | | | | 2,130,046,060 | | | | 244,611,725 | | | | 256,281,096 | |
| Net assets applicable to common shares at the end of period | | $ | 2,128,587,367 | | | $ | 2,035,220,607 | | | $ | 253,387,443 | | | $ | 244,611,725 | |
See accompanying notes to financial statements.
69
Statement of Changes in Net Assets (Unaudited) (continued)
| | | | | | | | | | | | | |
| | | NMI | | | NEV | |
| | | Six Months | | | | | | Six Months | | | | |
| | | Ended | | | Year Ended | | | Ended | | | Year Ended | |
| | | 4/30/19 | | | 10/31/18 | | | 4/30/19 | | | 10/31/18 | |
Operations | | | | | | | | | | | | |
| Net investment income (loss) | | $ | 1,899,384 | | | $ | 3,752,004 | | | $ | 9,035,907 | | | $ | 18,814,566 | |
| Net realized gain (loss) from investments | | | 102,613 | | | | 626,362 | | | | 158,874 | | | | (814,787 | ) |
| Change in net unrealized appreciation (depreciation) of: | | | | | | | | | | | | | | | | |
| Investments | | | 2,460,705 | | | | (4,414,017 | ) | | | 14,316,483 | | | | (18,566,356 | ) |
| Futures contracts | | | — | | | | — | | | | — | | | | — | |
| Net increase (decrease) in net assets applicable to common shares | | | | | | | | | | | | | | | | |
| from operations | | | 4,462,702 | | | | (35,651 | ) | | | 23,511,264 | | | | (566,577 | ) |
Distributions to Common Shareholders | | | | | | | | | | | | | | | | |
| Dividends | | | (2,515,190 | ) | | | (3,961,991 | ) | | | (8,458,073 | ) | | | (19,171,632 | ) |
| Decrease in net assets applicable to common shares from | | | | | | | | | | | | | | | | |
| distributions to common shareholders | | | (2,515,190 | ) | | | (3,961,991 | ) | | | (8,458,073 | ) | | | (19,171,632 | ) |
Capital Share Transactions | | | | | | | | | | | | | | | | |
| Proceeds from shelf offering, net of offering costs | | | — | | | | 2,135,825 | | | | — | | | | — | |
| Net proceeds from common shares issued to common shareholders | | | | | | | | | | | | | | | | |
| due to reinvestment of distributions | | | — | | | | 120,057 | | | | — | | | | — | |
| Net increase (decrease) in net assets applicable to common shares | | | | | | | | | | | | | | | | |
| from capital share transactions | | | — | | | | 2,255,882 | | | | — | | | | — | |
| Net increase (decrease) in net assets applicable to common shares | | | 1,947,512 | | | | (1,741,760 | ) | | | 15,053,191 | | | | (19,738,209 | ) |
| Net assets applicable to common shares at the beginning of period | | | 95,396,237 | | | | 97,137,997 | | | | 355,342,308 | | | | 375,080,517 | |
| Net assets applicable to common shares at the end of period | | $ | 97,343,749 | | | $ | 95,396,237 | | | $ | 370,395,499 | | | $ | 355,342,308 | |
See accompanying notes to financial statements.
70
Statement of Cash Flows
Six Months Ended April 30, 2019 (Unaudited)
| | | | |
| | | NEV | |
Cash Flows from Operating Activities: | | | |
Net Increase (Decrease) in Net Assets Applicable to Common Shares from Operations | | $ | 23,511,264 | |
| Adjustments to reconcile the net increase (decrease) in net assets applicable to common shares from | | | | |
| operations to net cash provided by (used in) operating activities: | | | | |
| Purchases of investments | | | (19,623,000 | ) |
| Proceeds from sales and maturities of investments | | | 21,140,113 | |
| Amortization (Accretion) of premiums and discounts, net | | | 755,142 | |
| (Increase) Decrease in: | | | | |
| Receivable for interest | | | 64,787 | |
| Receivable for investments sold | | | (722,453 | ) |
| Other assets | | | 626 | |
| Increase (Decrease) in: | | | | |
| Accrued management fees | | | (5,200 | ) |
| Accrued Director/Trustees fees | | | (117 | ) |
| Accrued other expenses | | | 2,772 | |
| Net realized (gain) loss from investments | | | (158,874 | ) |
| Change in net unrealized (appreciation) depreciation of investments | | | (14,316,483 | ) |
| Net cash provided by (used in) operating activities | | | 10,648,577 | |
Cash Flows from Financing Activities: | | | | |
| Increase (Decrease) in cash overdraft | | | (5,379,521 | ) |
| Proceeds from floating rate obligations | | | 7,847,000 | |
| Cash distributions paid to common shareholders | | | (8,460,481 | ) |
| Net cash provided by (used in) financing activities | | | (5,993,002 | ) |
Net Increase (Decrease) in Cash | | | 4,655,575 | |
| Cash at the beginning of period | | | — | |
| Cash at the end of period | | $ | 4,655,575 | |
| | | | | |
| | | | | |
Supplemental Disclosures of Cash Flow Information | | NEV | |
| Cash paid for interest | | $ | 1,052,468 | |
See accompanying notes to financial statements.
71
Financial Highlights (Unaudited)
Selected data for a common share outstanding throughout each period:
| | | | | | | | | | | | | | | | | | | | | | | | | | | | | | | | | | |
| | | | | | Investment Operations | | | Less Distributions to Common Shareholders | | | Common Share | |
| | | Beginning Common Share NAV | | | Net Investment Income (Loss) | | | Net Realized/ Unrealized Gain (Loss) | | | Total | | | From Net Investment Income | | | From Accumu- lated Net Realized Gains | | | Total | | | Shelf Offering Costs | | | Premium from Shares Sold through Shelf Offering | | | Ending NAV | | | Ending Share Price | |
NUV | | | | | | | | | | | | | | | | | | | | | | | | | | | | |
Year Ended 10/31: | | | | | | | | | | | | | | | | | | | | | | | | | |
| 2019(d) | | $ | 9.84 | | | $ | 0.19 | | | $ | 0.45 | | | $ | 0.64 | | | $ | (0.19 | ) | | $ | — | | | $ | (0.19 | ) | | $ | — | | | $ | — | | | $ | 10.29 | | | $ | 9.97 | |
| 2018 | | | 10.30 | | | | 0.38 | | | | (0.45 | ) | | | (0.07 | ) | | | (0.39 | ) | | | — | | | | (0.39 | ) | | | — | | | | — | | | | 9.84 | | | | 9.18 | |
| 2017 | | | 10.39 | | | | 0.40 | | | | (0.10 | ) | | | 0.30 | | | | (0.39 | ) | | | — | | | | (0.39 | ) | | | — | | | | — | | | | 10.30 | | | | 10.12 | |
| 2016 | | | 10.20 | | | | 0.40 | | | | 0.18 | | | | 0.58 | | | | (0.39 | ) | | | — | | | | (0.39 | ) | | | — | | | | — | * | | | 10.39 | | | | 9.98 | |
| 2015 | | | 10.21 | | | | 0.42 | | | | (0.03 | ) | | | 0.39 | | | | (0.40 | ) | | | — | | | | (0.40 | ) | | | — | | | | — | | | | 10.20 | | | | 10.07 | |
| 2014 | | | 9.61 | | | | 0.43 | | | | 0.61 | | | | 1.04 | | | | (0.44 | ) | | | — | | | | (0.44 | ) | | | — | | | | — | | | | 10.21 | | | | 9.64 | |
| | |
NUW | | | | | | | | | | | | | | | | | | | | | | | | | | | | | | | | | |
Year Ended 10/31: | | | | | | | | | | | | | | | | | | | | | | | | | | | | | | | | | |
| 2019(d) | | | 15.88 | | | | 0.33 | | | | 0.68 | | | | 1.01 | | | | (0.34 | ) | | | (0.10 | ) | | | (0.44 | ) | | | — | | | | — | | | | 16.45 | | | | 16.17 | |
| 2018 | | | 16.99 | | | | 0.70 | | | | (0.92 | ) | | | (0.22 | ) | | | (0.72 | ) | | | (0.18 | ) | | | (0.90 | ) | | | — | | | | 0.01 | | | | 15.88 | | | | 14.36 | |
| 2017 | | | 17.22 | | | | 0.75 | | | | (0.26 | ) | | | 0.49 | | | | (0.73 | ) | | | — | | | | (0.73 | ) | | | (0.01 | ) | | | 0.02 | | | | 16.99 | | | | 17.17 | |
| 2016 | | | 17.17 | | | | 0.76 | | | | 0.06 | | | | 0.82 | | | | (0.79 | ) | | | — | | | | (0.79 | ) | | | (0.01 | ) | | | 0.03 | | | | 17.22 | | | | 16.96 | |
| 2015 | | | 17.19 | | | | 0.80 | | | | (0.04 | ) | | | 0.76 | | | | (0.79 | ) | | | — | | | | (0.79 | ) | | | — | | | | 0.01 | | | | 17.17 | | | | 17.22 | |
| 2014 | | | 16.35 | | | | 0.82 | | | | 0.92 | | | | 1.74 | | | | (0.81 | ) | | | (0.09 | ) | | | (0.90 | ) | | | — | | | | — | | | | 17.19 | | | | 16.89 | |
| | |
| (a) | Total Return Based on Common Shares NAV is the combination of changes in common shares NAV, reinvested dividend income at NAV and reinvested capital gains distributions at NAV, if any. The last dividend declared in the period, which is typically paid on the first business day of the following month, is assumed to be reinvested at the ending NAV. The actual reinvest price for the last dividend declared in the period may often be based on the Fund’s market price (and not its NAV), and therefore may be different from the price used in the calculation. Total returns are not annualized. |
| | Total Return Based on Common Share Price is the combination of changes in the market price per share and the effect of reinvested dividend income and reinvested capital gains distributions, if any, at the average price paid per share at the time of reinvestment. The last dividend declared in the period, which is typically paid on the first business day of the following month, is assumed to be reinvested at the ending market price. The actual reinvestment for the last dividend declared in the period may take place over several days, and in some instances may not be based on the market price, so the actual reinvestment price may be different from the price used in the calculation. Total returns are not annualized. |
72
| | | | | | | | | | | | | | | | | |
| | | | | | | Common Share Supplemental Data/ Ratio Applicable to Common Shares | |
Common Shares Total Returns | | | | | | Ratios to Average Net Assets | | | | |
| | |
| | |
| | |
| | | | Based | | | Ending | | | | | | | | | | |
Based | | | on | | | Net | | | | | | Net | | | Portfolio | |
on | | | Share | | | Assets | | | | | | Investment | | | Turnover | |
NAV(a) | | | Price(a) | | | | (000 | ) | | Expenses(b) | | | Income (Loss) | | | Rate(c) | |
| | |
| | |
| | 6.51 | % | | | 10.71 | % | | $ | 2,128,587 | | | | 0.57 | %*** | | | 3.74 | %*** | | | 8 | % |
| | (0.71 | ) | | | (5.55 | ) | | | 2,035,221 | | | | 0.54 | | | | 3.76 | | | | 20 | |
| | 3.03 | | | | 5.48 | | | | 2,130,046 | | | | 0.52 | | | | 3.89 | | | | 17 | |
| | 5.74 | | | | 2.91 | | | | 2,150,444 | | | | 0.51 | | | | 3.87 | | | | 11 | |
| | 3.94 | | | | 8.86 | | | | 2,096,508 | | | | 0.53 | | | | 4.08 | | | | 16 | |
| | 11.04 | | | | 11.54 | | | | 2,099,099 | | | | 0.56 | | | | 4.36 | | | | 17 | |
| | |
| | |
| | |
| | 6.39 | | | | 15.79 | | | | 253,387 | | | | 0.74 | *** | | | 4.11 | *** | | | 10 | |
| | (1.31 | ) | | | (11.54 | ) | | | 244,612 | | | | 0.80 | | | | 4.26 | | | | 30 | |
| | 3.02 | | | | 5.71 | | | | 256,281 | | | | 0.81 | | | | 4.45 | | | | 16 | |
| | 4.90 | | | | 2.99 | | | | 247,394 | | | | 0.71 | | | | 4.38 | | | | 12 | |
| | 4.56 | | | | 6.79 | | | | 228,952 | | | | 0.72 | | | | 4.72 | | | | 6 | |
| | 10.95 | | | | 17.27 | | | | 226,855 | | | | 0.75 | | | | 4.92 | | | | 10 | |
| | |
| (b) | The expense ratios reflect, among other things, the interest expense deemed to have been paid by the Fund on the floating rate certificates issued by the special purpose trusts for the self-deposited inverse floaters held by the Fund (as described in Note 3 – Portfolio Securities and Investments in Derivatives, Inverse Floating Rate Securities), where applicable, as follows: |
| | | | | |
NUV | | | NUW | |
| Year Ended 10/31: | | | Year Ended 10/31: | |
| 2019(d) | 0.04%*** | | 2019(d) | 0.08%*** |
| 2018 | 0.03 | | 2018 | 0.10 |
| 2017 | 0.01 | | 2017 | 0.06 |
| 2016 | 0.01 | | 2016 | 0.03 |
| 2015 | 0.00** | | 2015 | 0.02 |
| 2014 | 0.01 | | 2014 | 0.02 |
| | |
| (c) | Portfolio Turnover Rate is calculated based on the lesser of long-term purchases or sales (as disclosed in Note 5 – Investment Transactions) divided by the average long-term market value during the period. |
| (d) | For the six months ended April 30, 2019. |
| * | Rounds to less than $0.01 per share. |
| ** | Rounds to less than 0.01%. |
| *** | Annualized. |
See accompanying notes to financial statements.
73
Financial Highlights (Unaudited) (continued)
Selected data for a common share outstanding throughout each period:
| | | | | | | | | | | | | | | | | | | | | | | | | | | | | | | | | | |
| | | | | | Investment Operations | | | Less Distributions to Common Shareholders | | | Common Share | |
| | | Beginning Common Share NAV | | | Net Investment Income (Loss) | | | Net Realized/ Unrealized Gain (Loss) | | | Total | | | From Net Investment Income | | | From Accumu- lated Net Realized Gains | | | Total | | | Shelf Offering Costs | | | Premium from Shares Sold through Shelf Offering | | | Ending NAV | | | Ending Share Price | |
NMI | | | | | | | | | | | | | | | | | | | | | | | | | | | | | | | | | |
Year Ended 10/31: | | | | | | | | | | | | | | | | | | | | | | | | | | | | |
| 2019(e) | | $ | 10.92 | | | $ | 0.22 | | | $ | 0.29 | | | $ | 0.51 | | | $ | (0.22 | ) | | $ | (0.07 | ) | | $ | (0.29 | ) | | $ | — | | | $ | — | | | $ | 11.14 | | | $ | 11.06 | |
| 2018 | | | 11.38 | | | | 0.43 | | | | (0.43 | ) | | | — | | | | (0.46 | ) | | | — | | | | (0.46 | ) | | | (0.01 | ) | | | 0.01 | | | | 10.92 | | | | 10.09 | |
| 2017 | | | 11.61 | | | | 0.48 | | | | (0.22 | ) | | | 0.26 | | | | (0.49 | ) | | | — | | | | (0.49 | ) | | | (0.01 | ) | | | 0.01 | | | | 11.38 | | | | 11.45 | |
| 2016 | | | 11.47 | | | | 0.50 | | | | 0.15 | | | | 0.65 | | | | (0.51 | ) | | | — | | | | (0.51 | ) | | | — | | | | — | | | | 11.61 | | | | 12.20 | |
| 2015 | | | 11.52 | | | | 0.51 | | | | (0.05 | ) | | | 0.46 | | | | (0.51 | ) | | | — | | | | (0.51 | ) | | | — | | | | — | | | | 11.47 | | | | 11.05 | |
| 2014 | | | 10.80 | | | | 0.50 | | | | 0.77 | | | | 1.27 | | | | (0.55 | ) | | | — | | | | (0.55 | ) | | | — | | | | — | | | | 11.52 | | | | 11.30 | |
| | |
NEV | | | | | | | | | | | | | | | | | | | | | | | | | | | | | | | | | | | | | | | | | | | | |
Year Ended 10/31: | | | | | | | | | | | | | | | | | | | | | | | | | | | | | | | | | | | | | |
| 2019(e) | | | 14.24 | | | | 0.36 | | | | 0.59 | | | | 0.95 | | | | (0.34 | ) | | | — | | | | (0.34 | ) | | | — | | | | — | | | | 14.85 | | | | 13.96 | |
| 2018 | | | 15.03 | | | | 0.75 | | | | (0.77 | ) | | | (0.02 | ) | | | (0.77 | ) | | | — | | | | (0.77 | ) | | | — | | | | — | | | | 14.24 | | | | 12.70 | |
| 2017 | | | 15.58 | | | | 0.82 | | | | (0.55 | ) | | | 0.27 | | | | (0.82 | ) | | | — | | | | (0.82 | ) | | | — | | | | — | | | | 15.03 | | | | 14.28 | |
| 2016 | | | 15.59 | | | | 0.85 | | | | 0.04 | | | | 0.89 | | | | (0.95 | ) | | | — | | | | (0.95 | ) | | | — | | | | 0.05 | | | | 15.58 | | | | 14.75 | |
| 2015 | | | 15.69 | | | | 0.93 | | | | (0.06 | ) | | | 0.87 | | | | (0.97 | ) | | | — | | | | (0.97 | ) | | | — | | | | — | | | | 15.59 | | | | 15.38 | |
| 2014 | | | 14.10 | | | | 0.96 | | | | 1.59 | | | | 2.55 | | | | (0.96 | ) | | | — | | | | (0.96 | ) | | | — | | | | — | | | | 15.69 | | | | 14.91 | |
| | |
| (a) | Total Return Based on Common Shares NAV is the combination of changes in common shares NAV, reinvested dividend income at NAV and reinvested capital gains distributions at NAV, if any. The last dividend declared in the period, which is typically paid on the first business day of the following month, is assumed to be reinvested at the ending NAV. The actual reinvest price for the last dividend declared in the period may often be based on the Fund’s market price (and not its NAV), and therefore may be different from the price used in the calculation. Total returns are not annualized. |
| | Total Return Based on Common Share Price is the combination of changes in the market price per share and the effect of reinvested dividend income and reinvested capital gains distributions, if any, at the average price paid per share at the time of reinvestment. The last dividend declared in the period, which is typically paid on the first business day of the following month, is assumed to be reinvested at the ending market price. The actual reinvestment for the last dividend declared in the period may take place over several days, and in some instances may not be based on the market price, so the actual reinvestment price may be different from the price used in the calculation. Total returns are not annualized. |
74
| | | | | | | | | | | | | | | | | |
| | | | | | | Common Share Supplemental Data/ Ratio Applicable to Common Shares | |
| | | | | |
Common Shares Total Returns | | | | | | | | | | | | | |
| | | | | Ratios to Average Net Assets | | | | |
| | |
| | |
| | |
| | | | Based | | | Ending | | | | | | | | | | |
Based | | | on | | | Net | | | | | | Net | | | Portfolio | |
on | | | Share | | | Assets | | | | | | Investment | | | Turnover | |
NAV(a) | | | Price(a) | | | | (000 | ) | | Expenses(b) | | | Income (Loss) | | | Rate(d) | |
| | |
| | |
| | 4.71 | % | | | 12.64 | % | | $ | 97,344 | | | | 0.75 | %* | | | 3.99 | %* | | | 6 | % |
| | (0.05 | ) | | | (8.14 | ) | | | 95,396 | | | | 0.89 | | | | 3.87 | | | | 17 | |
| | 2.34 | | | | (2.04 | ) | | | 97,138 | | | | 0.79 | | | | 4.23 | | | | 12 | |
| | 5.71 | | | | 15.22 | | | | 96,532 | | | | 0.76 | | | | 4.33 | | | | 4 | |
| | 4.08 | | | | 2.31 | | | | 95,149 | | | | 0.74 | | | | 4.43 | | | | 10 | |
| | 12.06 | | | | 17.55 | | | | 95,464 | | | | 0.76 | | | | 4.55 | | | | 15 | |
| | |
| | |
| | |
| | 6.73 | | | | 12.71 | | | | 370,395 | | | | 1.63 | * | | | 5.04 | * | | | 4 | |
| | (0.17 | ) | | | (5.93 | ) | | | 355,342 | | | | 1.42 | | | | 5.14 | | | | 15 | |
| | 1.93 | | | | 2.50 | | | | 375,081 | | | | 1.14 | | | | 5.47 | | | | 8 | |
| | 6.10 | | | | 1.85 | | | | 388,835 | | | | 1.03 | | | | 5.44 | | | | 6 | |
| | 5.68 | | | | 9.90 | | | | 328,856 | | | | 1.05(c | ) | | | 5.93(c | ) | | | 12 | |
| | 18.67 | | | | 14.58 | | | | 330,869 | | | | 1.08 | | | | 6.49 | | | | 5 | |
| | |
| (b) | The expense ratios reflect, among other things, the interest expense deemed to have been paid by the Fund on the floating rate certificates issued by the special purpose trusts for the self-deposited inverse floaters held by the Fund (as described in Note 3 – Portfolio Securities and Investments in Derivatives, Inverse Floating Rate Securities), where applicable, as follows: |
| | | | | |
NMI | | | NEV | |
| Year Ended 10/31: | | | Year Ended 10/31: | |
| 2019(e) | —% | | 2019(e) | 0.59%* |
| 2018 | — | | 2018 | 0.40 |
| 2017 | — | | 2017 | 0.17 |
| 2016 | 0.03 | | 2016 | 0.07 |
| 2015 | 0.01 | | 2015 | 0.07 |
| 2014 | 0.01 | | 2014 | 0.09 |
| | |
| (c) | During the fiscal year ended October 31, 2015, the Adviser voluntarily reimbursed the Fund for certain expenses incurred in connection with an equity shelf program. As a result, the Expenses and Net Investment Income (Loss) Ratios to Average Net Assets reflect this voluntary expense reimbursement. The Expenses and Net Investment Income (Loss) Ratios to Average Net Assets excluding this expense reimbursement from Adviser are as follows: |
| | | |
| | Ratios to Average Net Assets |
| | | Net Investment |
NEV | Expenses | Income (Loss) |
| Year Ended 10/31: | | |
| 2015 | 1.08% | 5.91% |
| | |
| (d) | Portfolio Turnover Rate is calculated based on the lesser of long-term purchases or sales (as disclosed in Note 5 – Investment Transactions) divided by the average long-term market value during the period. |
| (e) | For the six months ended April 30, 2019. |
| * | Annualized. |
See accompanying notes to financial statements.
75
Notes to Financial Statements
(Unaudited)
1. General Information and Significant Accounting Policies
General Information
Fund Information
The funds covered in this report and their corresponding New York Stock Exchange (“NYSE”) symbols are as follows (each a “Fund” and collectively, the “Funds”):
| | ● | Nuveen Municipal Value Fund, Inc. (NUV) |
| | ● | Nuveen AMT-Free Municipal Value Fund (NUW) |
| | ● | Nuveen Municipal Income Fund, Inc. (NMI) |
| | ● | Nuveen Enhanced Municipal Value Fund (NEV) |
The Funds are registered under the Investment Company Act of 1940, as amended, as diversified closed-end management investment companies. NUV and NMI were incorporated under the state laws of Minnesota on April 8, 1987 and February 26, 1988, respectively. NUW and NEV were organized as Massachusetts business trusts on November 19, 2008 and July 27, 2009, respectively.
The end of the reporting period for the Funds is April 30, 2019, and the period covered by these Notes to Financial Statements is the six months ended April 30, 2019 (the “current fiscal period”).
Investment Adviser
The Funds’ investment adviser is Nuveen Fund Advisors, LLC (the “Adviser”), a subsidiary of Nuveen, LLC (“Nuveen”). Nuveen is the investment management arm of Teachers Insurance and Annuity Association of America (TIAA). The Adviser has overall responsibility for management of the Funds, oversees the management of the Funds’ portfolios, manages the Funds’ business affairs and provides certain clerical, bookkeeping and other administrative services, and, if necessary, asset allocation decisions. The Adviser has entered into sub-advisory agreements with Nuveen Asset Management, LLC (the “Sub-Adviser”), a subsidiary of the Adviser, under which the Sub-Adviser manages the investment portfolios of the Funds.
Investment Objectives and Principal Investment Strategies
Each Fund’s primary investment objective is to provide current income exempt from regular federal income tax by investing primarily in a portfolio of municipal obligations issued by state and local government authorities or certain U.S. territories.
Significant Accounting Policies
Each Fund is an investment company and follows accounting and reporting guidance under Financial Accounting Standards Board (“FASB”) Accounting Standards Codification (ASC) Topic 946 “Financial Services-Investment Companies.” The following is a summary of significant accounting policies followed by the Funds in the preparation of their financial statements in accordance with U.S. generally accepted accounting principles (“U.S. GAAP”).
Investment Transactions
Investment transactions are recorded on a trade date basis. Realized gains and losses from investment transactions are determined on the specific identification method, which is the same basis used for federal income tax purposes. Investments purchased on a when-issued/delayed delivery basis may have extended settlement periods. Any investments so purchased are subject to market fluctuation during this period. The Funds have earmarked securities in their portfolios with a current value at least equal to the amount of the when-issued/delayed delivery purchase commitments.
As of the end of the reporting period, the following Funds’ outstanding when-issued/delayed delivery purchase commitments were as follows:
| | | | | | | |
| | | NUV | | | NMI | |
| Outstanding when-issued/delayed delivery purchase commitments | | $ | 2,155,000 | | | $ | 1,244,044 | |
Investment Income
Investment income is comprised of interest income, which reflects the amortization of premiums and accretion of discounts for financial reporting purposes, and is recorded on an accrual basis. Investment income also reflects payment-in-kind (“PIK”) interest and paydown gains and losses, if any. PIK interest represents income received in the form of securities in lieu of cash.
76
Professional Fees
Professional fees presented on the Statement of Operations consist of legal fees incurred in the normal course of operations, audit fees, tax consulting fees and, in some cases, workout expenditures. Workout expenditures are incurred in an attempt to protect or enhance an investment or to pursue other claims or legal actions on behalf of Fund shareholders. If a refund is received for workout expenditures paid in a prior reporting period, such amounts will be recognized as “Legal fee refund” on the Statement of Operations.
Dividends and Distributions to Common Shareholders
Dividends from net investment income, if any, are declared monthly. Net realized capital gains and/or market discount from investment transactions, if any, are distributed to shareholders at least annually. Furthermore, capital gains are distributed only to the extent they exceed available capital loss carryforwards.
Distributions to common shareholders of net investment income, net realized capital gains and/or market discount, if any, are recorded on the ex-dividend date. The amount and timing of distributions are determined in accordance with federal income tax regulations, which may differ from U.S. GAAP.
Compensation
The Funds pay no compensation directly to those of its directors/trustees who are affiliated with the Adviser or to its officers, all of whom receive remuneration for their services to the Funds from the Adviser or its affiliates. The Funds’ Board of Directors/Trustees (“the Board”) has adopted a deferred compensation plan for independent directors/trustees that enables directors/trustees to elect to defer receipt of all or a portion of the annual compensation they are entitled to receive from certain Nuveen-advised funds. Under the plan, deferred amounts are treated as though equal dollar amounts had been invested in shares of select Nuveen-advised funds.
Indemnifications
Under the Funds’ organizational documents, their officers and directors/trustees are indemnified against certain liabilities arising out of the performance of their duties to the Funds. In addition, in the normal course of business, the Funds enter into contracts that provide general indemnifications to other parties. The Funds’ maximum exposure under these arrangements is unknown as this would involve future claims that may be made against the Funds that have not yet occurred. However, the Funds have not had prior claims or losses pursuant to these contracts and expect the risk of loss to be remote.
Netting Agreements
In the ordinary course of business, the Funds may enter into transactions subject to enforceable International Swaps and Derivatives Association, Inc. (ISDA) master agreements or other similar arrangements (“netting agreements”). Generally, the right to offset in netting agreements allows each Fund to offset certain securities and derivatives with a specific counterparty, when applicable, as well as any collateral received or delivered to that counterparty based on the terms of the agreements. Generally, each Fund manages its cash collateral and securities collateral on a counterparty basis.
The Funds’ investments subject to netting agreements as of the end of the reporting period, if any, are further described in Note 3 – Portfolio Securities and Investments in Derivatives.
Use of Estimates
The preparation of financial statements in conformity with U.S. GAAP requires management to make estimates and assumptions that affect the reported amounts of assets and liabilities at the date of the financial statements and the reported amounts of increases and decreases in net assets applicable to common shares from operations during the current fiscal period. Actual results may differ from those estimates.
2. Investment Valuation and Fair Value Measurements
The fair valuation input levels as described below are for fair value measurement purposes.
Fair value is defined as the price that would be received upon selling an investment or transferring a liability in an orderly transaction to an independent buyer in the principal or most advantageous market for the investment. A three-tier hierarchy is used to maximize the use of observable market data and minimize the use of unobservable inputs and to establish classification of fair value measurements for disclosure purposes. Observable inputs reflect the assumptions market participants would use in pricing the asset or liability. Observable inputs are based on market data obtained from sources independent of the reporting entity. Unobservable inputs reflect the reporting entity’s own assumptions about the assumptions market participants would use in pricing the asset or liability. Unobservable inputs are based on the best information available in the circumstances. The following is a summary of the three-tiered hierarchy of valuation input levels.
Level 1 – Inputs are unadjusted and prices are determined using quoted prices in active markets for identical securities.
Level 2 – Prices are determined using other significant observable inputs (including quoted prices for similar securities, interest rates, credit spreads, etc.).
Level 3 – Prices are determined using significant unobservable inputs (including management’s assumptions in determining the fair value of investments).
77
Notes to Financial Statements (Unaudited) (continued)
Prices of fixed income securities are provided by an independent pricing service (“pricing service”) approved by the Board. The pricing service establishes a security’s fair value using methods that may include consideration of the following: yields or prices of investments of comparable quality, type of issue, coupon, maturity and rating, market quotes or indications of value from security dealers, evaluations of anticipated cash flows or collateral, general market conditions and other information and analysis, including the obligor’s credit characteristics considered relevant. These securities are generally classified as Level 2. In pricing certain securities, particularly less liquid and lower quality securities, the pricing service may consider information about a security, its issuer or market activity, provided by the Adviser. These securities are generally classified as Level 2 or Level 3 depending on the observability of the significant inputs.
Futures contracts are valued using the closing settlement price or, in the absence of such a price, the last traded price and are generally classified as Level 1.
Certain securities may not be able to be priced by the pre-established pricing methods as described above. Such securities may be valued by the Board and/or its appointee at fair value. These securities generally include, but are not limited to, restricted securities (securities which may not be publicly sold without registration under the Securities Act of 1933, as amended) for which a pricing service is unable to provide a market price; securities whose trading has been formally suspended; debt securities that have gone into default and for which there is no current market quotation; a security whose market price is not available from a pre-established pricing source; a security with respect to which an event has occurred that is likely to materially affect the value of the security after the market has closed but before the calculation of a Fund’s net asset value (“NAV”) (as may be the case in non-U.S. markets on which the security is primarily traded) or make it difficult or impossible to obtain a reliable market quotation; and a security whose price, as provided by the pricing service, is not deemed to reflect the security’s fair value. As a general principle, the fair value of a security would appear to be the amount that the owner might reasonably expect to receive for it in a current sale. A variety of factors may be considered in determining the fair value of such securities, which may include consideration of the following: yields or prices of investments of comparable quality, type of issue, coupon, maturity and rating, market quotes or indications of value from security dealers, evaluations of anticipated cash flows or collateral, general market conditions and other information and analysis, including the obligor’s credit characteristics considered relevant. These securities are generally classified as Level 2 or Level 3 depending on the observability of the significant inputs. Regardless of the method employed to value a particular security, all valuations are subject to review by the Board and/or its appointee.
The inputs or methodologies used for valuing securities are not an indication of the risks associated with investing in those securities. The following is a summary of each Fund’s fair value measurements as of the end of the reporting period:
| | | | | | | | | | | | | |
NUV | | Level 1 | | | Level 2 | | | Level 3 | | | Total | |
| Long-Term Investments: | | | | | | | | | | | | |
| Municipal Bonds* | | $ | — | | | $ | 2,128,101,948 | | | $ | — | | | $ | 2,128,101,948 | |
| Corporate Bonds** | | | — | | | | — | | | | 631,538 | *** | | | 631,538 | |
| Total | | $ | — | | | $ | 2,128,101,948 | | | $ | 631,538 | | | $ | 2,128,733,486 | |
NUW | | | | | | | | | | | | | | | | |
| Long-Term Investments: | | | | | | | | | | | | | | | | |
| Municipal Bonds* | | $ | — | | | $ | 243,448,809 | | | $ | — | | | $ | 243,448,809 | |
| Investments in Derivatives: | | | | | | | | | | | | | | | | |
| Futures Contracts**** | | | (50,368 | ) | | | — | | | | — | | | | (50,368 | ) |
| Total | | $ | (50,368 | ) | | $ | 243,448,809 | | | $ | — | | | $ | 243,398,441 | |
NMI | | | | | | | | | | | | | | | | |
| Long-Term Investments: | | | | | | | | | | | | | | | | |
| Municipal Bonds* | | $ | — | | | $ | 96,271,761 | | | $ | — | | | $ | 96,271,761 | |
NEV | | | | | | | | | | | | | | | | |
| Long-Term Investments: | | | | | | | | | | | | | | | | |
| Municipal Bonds* | | $ | — | | | $ | 459,096,494 | | | $ | 31,513 | *** | | $ | 459,128,007 | |
| | |
| * | Refer to the Fund’s Portfolio of Investments for state classifications. |
| ** | Refer to the Fund’s Portfolio of Investments for industry classifications. |
| *** | Refer to the Fund’s Portfolio of Investments for securities classified as Level 3. |
| **** | Represents net unrealized appreciation (depreciation) as reported in the Fund’s Portfolio of Investments. |
78
3. Portfolio Securities and Investments in Derivatives
Portfolio Securities
Inverse Floating Rate Securities
Each Fund is authorized to invest in inverse floating rate securities. An inverse floating rate security is created by depositing a municipal bond (referred to as an “Underlying Bond”), typically with a fixed interest rate, into a special purpose tender option bond (“TOB”) trust (referred to as the “TOB Trust”) created by or at the direction of one or more Funds. In turn, the TOB Trust issues (a) floating rate certificates (referred to as “Floaters”), in face amounts equal to some fraction of the Underlying Bond’s par amount or market value, and (b) an inverse floating rate certificate (referred to as an “Inverse Floater”) that represents all remaining or residual interest in the TOB Trust. Floaters typically pay short-term tax-exempt interest rates to third parties who are also provided a right to tender their certificate and receive its par value, which may be paid from the proceeds of a remarketing of the Floaters, by a loan to the TOB Trust from a third party liquidity provider (“Liquidity Provider”), or by the sale of assets from the TOB Trust. The Inverse Floater is issued to a long term investor, such as one or more of the Funds. The income received by the Inverse Floater holder varies inversely with the short-term rate paid to holders of the Floaters, and in most circumstances the Inverse Floater holder bears substantially all of the Underlying Bond’s downside investment risk and also benefits disproportionately from any potential appreciation of the Underlying Bond’s value. The value of an Inverse Floater will be more volatile than that of the Underlying Bond because the interest rate is dependent on not only the fixed coupon rate of the Underlying Bond but also on the short-term interest paid on the Floaters, and because the Inverse Floater essentially bears the risk of loss (and possible gain) of the greater face value of the Underlying Bond.
The Inverse Floater held by a Fund gives the Fund the right to (a) cause the holders of the Floaters to tender their certificates at par (or slightly more than par in certain circumstances), and (b) have the trustee of the TOB Trust (the “Trustee”) transfer the Underlying Bond held by the TOB Trust to the Fund, thereby collapsing the TOB Trust.
The Fund may acquire an Inverse Floater in a transaction where it (a) transfers an Underlying Bond that it owns to a TOB Trust created by a third party or (b) transfers an Underlying Bond that it owns, or that it has purchased in a secondary market transaction for the purpose of creating an Inverse Floater, to a TOB Trust created at its direction, and in return receives the Inverse Floater of the TOB Trust (referred to as a “self-deposited Inverse Floater”). A Fund may also purchase an Inverse Floater in a secondary market transaction from a third party creator of the TOB Trust without first owning the Underlying Bond (referred to as an “externally-deposited Inverse Floater”).
An investment in a self-deposited Inverse Floater is accounted for as a “financing” transaction (i.e., a secured borrowing). For a self-deposited Inverse Floater, the Underlying Bond deposited into the TOB Trust is identified in the Fund’s Portfolio of Investments as “(UB) – Underlying bond of an inverse floating rate trust reflected as a financing transaction,” with the Fund recognizing as liabilities, labeled “Floating rate obligations” on the Statement of Assets and Liabilities, (a) the liquidation value of Floaters issued by the TOB Trust, and (b) the amount of any borrowings by the TOB Trust from a Liquidity Provider to enable the TOB Trust to purchase outstanding Floaters in lieu of a remarketing. In addition, the Fund recognizes in “Investment Income” the entire earnings of the Underlying Bond, and recognizes (a) the interest paid to the holders of the Floaters or on the TOB Trust’s borrowings, and (b) other expenses related to remarketing, administration, trustee, liquidity and other services to a TOB Trust, as a component of “Interest expense” on the Statement of Operations.
In contrast, an investment in an externally-deposited Inverse Floater is accounted for as a purchase of the Inverse Floater and is identified in the Fund’s Portfolio of Investments as “(IF) – Inverse floating rate investment.” For an externally-deposited Inverse Floater, a Fund’s Statement of Assets and Liabilities recognizes the Inverse Floater and not the Underlying Bond as an asset, and the Fund does not recognize the Floaters, or any related borrowings from a Liquidity Provider, as a liability. Additionally, the Fund reflects in “Investment Income” only the net amount of earnings on the Inverse Floater (net of the interest paid to the holders of the Floaters or the Liquidity Provider as lender, and the expenses of the Trust), and does not show the amount of that interest paid or the expenses of the TOB Trust as described above as interest expense on the Statement of Operations.
Fees paid upon the creation of a TOB Trust for self-deposited Inverse Floaters and externally-deposited Inverse Floaters are recognized as part of the cost basis of the Inverse Floater and are capitalized over the term of the TOB Trust.
As of the end of the reporting period, the aggregate value of Floaters issued by each Fund’s TOB Trust for self-deposited Inverse Floaters and externally-deposited Inverse Floaters was as follows:
| | | | | | | | | | | | | |
Floating Rate Obligations Outstanding | | NUV | | | NUW | | | NMI | | | NEV | |
| Floating rate obligations: self-deposited Inverse Floaters | | $ | 37,705,000 | | | $ | 9,125,000 | | | $ | — | | | $ | 103,777,000 | |
| Floating rate obligations: externally-deposited Inverse Floaters | | | — | | | | 10,165,000 | | | | — | | | | 108,320,000 | |
| Total | | $ | 37,705,000 | | | $ | 19,290,000 | | | $ | — | | | $ | 212,097,000 | |
During the current fiscal period, the average amount of Floaters (including any borrowings from a Liquidity Provider) outstanding, and average annual interest rate and fees related to self-deposited Inverse Floaters, were as follows:
| | | | | | | | | | | | | |
Self-Deposited Inverse Floaters | | NUV | | | NUW | | | NMI | | | NEV | |
| Average floating rate obligations outstanding | | $ | 44,270,552 | | | $ | 9,136,050 | | | $ | — | | | $ | 97,002,293 | |
| Average annual interest rate and fees | | | 2.09 | % | | | 2.16 | % | | | — | % | | | 2.19 | % |
79
Notes to Financial Statements (Unaudited) (continued)
TOB Trusts are supported by a liquidity facility provided by a Liquidity Provider pursuant to which the Liquidity Provider agrees, in the event that Floaters are (a) tendered to the Trustee for remarketing and the remarketing does not occur, or (b) subject to mandatory tender pursuant to the terms of the TOB Trust agreement, to either purchase Floaters or to provide the Trustee with an advance from a loan facility to fund the purchase of Floaters by the TOB Trust. In certain circumstances, the Liquidity Provider may otherwise elect to have the Trustee sell the Underlying Bond to retire the Floaters that were tendered and not remarketed prior to providing such a loan. In these circumstances, the Liquidity Provider remains obligated to provide a loan to the extent that the proceeds of the sale of the Underlying Bond is not sufficient to pay the purchase price of the Floaters.
The size of the commitment under the loan facility for a given TOB Trust is at least equal to the balance of that TOB Trust’s outstanding Floaters plus any accrued interest. In consideration of the loan facility, fee schedules are in place and are charged by the Liquidity Provider(s). Any loans made by the Liquidity Provider will be secured by the purchased Floaters held by the TOB Trust. Interest paid on any outstanding loan balances will be effectively borne by the Fund that owns the Inverse Floaters of the TOB Trust that has incurred the borrowing and may be at a rate that is greater than the rate that would have been paid had the Floaters been successfully remarketed.
As described above, any amounts outstanding under a liquidity facility are recognized as a component of “Floating rate obligations” on the Statement of Assets and Liabilities by the Fund holding the corresponding Inverse Floaters issued by the borrowing TOB Trust. As of the end of the reporting period, NUW and NEV had outstanding borrowings under such liquidity facilities in the amount of $221,596 and $1,776,795, respectively, which is recognized as a component of “Floating rate obligations” on the Statement of Assets and Liabilities. There were no loans outstanding under any such facility for NUV or NMI as of the end of the reporting period.
Each Fund may also enter into shortfall and forbearance agreements (sometimes referred to as a “recourse arrangement”) (TOB Trusts involving such agreements are referred to herein as “Recourse Trusts”), under which a Fund agrees to reimburse the Liquidity Provider for the Trust’s Floaters, in certain circumstances, for the amount (if any) by which the liquidation value of the Underlying Bond held by the TOB Trust may fall short of the sum of the liquidation value of the Floaters issued by the TOB Trust plus any amounts borrowed by the TOB Trust from the Liquidity Provider, plus any shortfalls in interest cash flows. Under these agreements, a Fund’s potential exposure to losses related to or on an Inverse Floater may increase beyond the value of the Inverse Floater as a Fund may potentially be liable to fulfill all amounts owed to holders of the Floaters or the Liquidity Provider. Any such shortfall amount in the aggregate is recognized as “Unrealized depreciation on Recourse Trusts” on the Statement of Assets and Liabilities.
As of the end of the reporting period, each Fund’s maximum exposure to the Floaters issued by Recourse Trusts for self-deposited Inverse Floaters and externally-deposited Inverse Floaters was as follows:
| | | | | | | | | | | | | |
Floating Rate Obligations – Recourse Trusts | | NUV | | | NUW | | | NMI | | | NEV | |
| Maximum exposure to Recourse Trusts: self-deposited Inverse Floaters | | $ | 37,705,000 | | | $ | 9,125,000 | | | $ | — | | | $ | 95,777,000 | |
| Maximum exposure to Recourse Trusts: externally-deposited Inverse Floaters | | | — | | | | 10,165,000 | | | | — | | | | 105,810,000 | |
| Total | | $ | 37,705,000 | | | $ | 19,290,000 | | | $ | — | | | $ | 201,587,000 | |
Zero Coupon Securities
A zero coupon security does not pay a regular interest coupon to its holders during the life of the security. Income to the holder of the security comes from accretion of the difference between the original purchase price of the security at issuance and the par value of the security at maturity and is effectively paid at maturity. The market prices of zero coupon securities generally are more volatile than the market prices of securities that pay interest periodically.
Investments in Derivatives
In addition to the inverse floating rate securities in which each Fund may invest, which are considered portfolio securities for financial reporting purposes, each Fund is authorized to invest in certain other derivative instruments, such as futures, options and swap contracts. Each Fund limits its investments in futures, options on futures and swap contracts to the extent necessary for the Adviser to claim the exclusion from registration by the Commodity Futures Trading Commission as a commodity pool operator with respect to the Fund. The Funds record derivative instruments at fair value, with changes in fair value recognized on the Statement of Operations, when applicable. Even though the Funds’ investments in derivatives may represent economic hedges, they are not considered to be hedge transactions for financial reporting purposes.
Futures Contracts
Upon execution of a futures contract, a Fund is obligated to deposit cash or eligible securities, also known as “initial margin,” into an account at its clearing broker equal to a specified percentage of the contract amount. Cash held by the broker to cover initial margin requirements on open futures contracts, if any, is recognized as “Cash collateral at brokers for investments in futures contracts” on the Statement of Assets and Liabilities. Investments in futures contracts obligate a Fund and the clearing broker to settle monies on a daily basis representing changes in the prior days “mark-to-market” of the open contracts. If a Fund has unrealized appreciation the clearing broker would credit the Fund’s account with an amount equal to appreciation and conversely if a Fund has unrealized depreciation the clearing broker would debit the Fund’s account with an amount equal to depreciation. These daily cash settlements are also known as “variation margin.” Variation margin is recognized as a receivable and/or payable for “Variation margin on futures contracts” on the Statement of Assets and Liabilities.
80
During the period the futures contract is open, changes in the value of the contract are recognized as an unrealized gain or loss by “marking-to-market” on a daily basis to reflect the changes in market value of the contract, which is recognized as a component of “Change in net unrealized appreciation (depreciation) of futures contracts” on the Statement of Operations. When the contract is closed or expired, a Fund records a realized gain or loss equal to the difference between the value of the contract on the closing date and value of the contract when originally entered into, which is recognized as a component of “Net realized gain (loss) from futures contracts” on the Statement of Operations.
Risks of investments in futures contracts include the possible adverse movement in the price of the securities or indices underlying the contracts, the possibility that there may not be a liquid secondary market for the contracts and/or that a change in the value of the contract may not correlate with a change in the value of the underlying securities or indices.
During the current reporting period, NUW managed the duration of their respective portfolios by shorting interest rate futures contracts.
The average notional amount of futures contracts outstanding during the current fiscal period was as follows:
| | | | |
| | | NUW | |
| Average notional amount of futures contracts outstanding* | | $ | (3,446,023 | ) |
| |
| * The average notional amount is calculated based on the absolute aggregate notional amount of contracts outstanding at the beginning of the current fiscal period and at the end of each fiscal quarter within the current fiscal period. |
The following table presents the fair value of all futures contracts held by the Fund as of the end of the reporting period, the location of these instruments on the Statement of Assets and Liabilities and the primary underlying risk exposure.
| | | | | | | |
| | | Location on the Statement of Assets and Liabilities |
| |
Underlying | Derivative | Asset Derivatives | | (Liability) Derivatives |
Risk Exposure | Instrument | Location | Value | | Location | Value |
NUW | | | | | | |
| Interest rate | Futures contracts | — | — | | Payable for variation margin | $(50,368) |
| | | | | | on futures contracts* | |
| |
| * Value represents unrealized appreciation (depreciation) of futures contracts as reported in the Fund’s Portfolio of Investments and not the asset and/or liability derivative location as described in the table above. |
The following table presents the amount of net realized gain (loss) and change in net unrealized appreciation (depreciation) recognized on futures contracts on the Statement of Operations during the current fiscal period, and the primary underlying risk exposure.
| | | | | |
| | | | Net Realized | Change in Net Unrealized |
| | Underlying Risk | Derivative | Gain (Loss) from | Appreciation (Depreciation) of |
Fund | Exposure | Instrument | Futures Contracts | Futures Contracts |
NUW | Interest rate | Futures contracts | $ — | $(50,368) |
Market and Counterparty Credit Risk
In the normal course of business each Fund may invest in financial instruments and enter into financial transactions where risk of potential loss exists due to changes in the market (market risk) or failure of the other party to the transaction to perform (counterparty credit risk). The potential loss could exceed the value of the financial assets recorded on the financial statements. Financial assets, which potentially expose each Fund to counterparty credit risk, consist principally of cash due from counterparties on forward, option and swap transactions, when applicable. The extent of each Fund’s exposure to counterparty credit risk in respect to these financial assets approximates their carrying value as recorded on the Statement of Assets and Liabilities.
Each Fund helps manage counterparty credit risk by entering into agreements only with counterparties the Adviser believes have the financial resources to honor their obligations and by having the Adviser monitor the financial stability of the counterparties. Additionally, counterparties may be required to pledge collateral daily (based on the daily valuation of the financial asset) on behalf of each Fund with a value approximately equal to the amount of any unrealized gain above a pre-determined threshold. Reciprocally, when each Fund has an unrealized loss, the Funds have instructed the custodian to pledge assets of the Funds as collateral with a value approximately equal to the amount of the unrealized loss above a pre-determined threshold. Collateral pledges are monitored and subsequently adjusted if and when the valuations fluctuate, either up or down, by at least the pre-determined threshold amount.
4. Fund Shares
Common Share Equity Shelf Programs and Offering Costs
The following Funds have each filed registration statements with the Securities and Exchange Commission (“SEC”) authorizing each Fund to issue additional common shares through one or more equity shelf program (“Shelf Offering”), which became effective with the SEC during a prior fiscal period.
81
Notes to Financial Statements (Unaudited) (continued)
Under these Shelf Offerings, the Funds, subject to market conditions, may raise additional equity capital by issuing additional common shares from time to time in varying amounts and by different offering methods at a net price at or above each Fund’s NAV common per share. In the event each Fund’s Shelf Offering registration statement is no longer current, the Funds may not issue additional common shares until a post-effective amendment to the registration statement has been filed with the SEC.
Additional authorized common shares, common shares sold and offering proceeds, net of offering costs under each Fund’s Shelf Offering during the Funds’ current and prior fiscal period were as follows:
| | | | | | | | | | | | | |
| | | NUW | | | NMI | |
| | | Six months | | | Year | | | Six months | | | Year | |
| | | Ended | | | Ended | | | Ended | | | Ended | |
| | | 4/30/19 | | | 10/31/18 | | | 4/30/19 | | | 10/31/18 | |
| Additional authorized common shares | | | 1,400,000 | | | | 1,400,000 | | | | 800,000 | | | | 800,000 | |
| Common shares sold | | | — | | | | 299,412 | | | | — | | | | 187,400 | |
| Offering proceeds, net of offering costs | | $ | — | | | $ | 5,126,753 | | | $ | — | | | $ | 2,135,825 | |
Costs incurred by the Funds in connection with their initial shelf registrations are recorded as a prepaid expense and recognized as “Deferred offering costs” on the Statement of Assets and Liabilities. These costs are amortized pro rata as common shares are sold and are recognized as a component of “Proceeds from shelf offering, net of offering costs” on the Statement of Changes in Net Assets. Any deferred offering costs remaining one year after effectiveness of the initial shelf registration will be expensed. Costs incurred by the Funds to keep the shelf registration current are expensed as incurred and recognized as a component of “Shelf offering expenses” on the Statement of Operations.
Common Share Transactions
Transactions in common shares during the Funds’ current and prior fiscal period, where applicable, were as follows:
| | | | | | | | | | | | | |
| | | NUW | | | NMI | |
| | | Six Months | | | Year | | | Six Months | | | Year | |
| | | Ended | | | Ended | | | Ended | | | Ended | |
| | | 4/30/19 | | | 10/31/18 | | | 4/30/19 | | | 10/31/18 | |
| Common shares: | | | | | | | | | | | | |
| Issued to shareholders due to reinvestment of distributions | | | — | | | | 19,194 | | | | — | | | | 10,654 | |
| Sold through shelf offering | | | — | | | | 299,412 | | | | — | | | | 187,400 | |
| Weighted average common share: | | | | | | | | | | | | | | | | |
| Premium to NAV per shelf offering common share sold | | | — | % | | | 2.92 | % | | | — | % | | | 4.54 | % |
5. Investment Transactions
Long-term purchases and sales (including maturities but excluding derivative transactions, where applicable) during the current fiscal period were as follows:
| | | | | | | | | | | | | |
| | | NUV | | | NUW | | | NMI | | | NEV | |
| Purchases | | $ | 175,712,889 | | | $ | 25,368,465 | | | $ | 5,448,691 | | | $ | 19,623,000 | |
| Sales and maturities | | | 215,644,173 | | | | 43,158,507 | | | | 5,813,471 | | | | 21,140,113 | |
6. Income Tax Information
Each Fund is a separate taxpayer for federal income tax purposes. Each Fund intends to distribute substantially all of its net investment income and net capital gains to shareholders and to otherwise comply with the requirements of Subchapter M of the Internal Revenue Code applicable to regulated investment companies. Therefore, no federal income tax provision is required. Furthermore, each Fund intends to satisfy conditions that will enable interest from municipal securities, which is exempt from regular federal income tax, and in the case of AMT-Free Municipal Value (NUW) the alternative minimum tax applicable to individuals, to retain such tax-exempt status when distributed to shareholders of the Funds. Net realized capital gains and ordinary income distributions paid by the Funds are subject to federal taxation.
For all open tax years and all major taxing jurisdictions, management of the Funds has concluded that there are no significant uncertain tax positions that would require recognition in the financial statements. Open tax years are those that are open for examination by taxing authorities (i.e., generally the last four tax year ends and the interim tax period since then). Furthermore, management of the Funds is also not aware of any tax positions for which it is reasonably possible that the total amounts of unrecognized tax benefits will significantly change in the next twelve months.
The following information is presented on an income tax basis. Differences between amounts for financial statement and federal income tax purposes are primarily due to timing differences in recognizing taxable market discount, timing differences in recognizing certain gains and losses on investment
82
transactions and the treatment of investments in inverse floating rate securities reflected as financing transactions, if any. To the extent that differences arise that are permanent in nature, such amounts are reclassified within the capital accounts as detailed below. Temporary differences do not require reclassification. Temporary and permanent differences do not impact the NAVs of the Funds.
The tables below presents the cost and unrealized appreciation (depreciation) of each Fund’s investment portfolio, as determined on a federal income tax basis, as of April 30, 2019.
For purposes of this disclosure, derivative tax cost is generally the sum of any upfront fees or premiums exchanged and any amounts unrealized for income statement reporting but realized in income and/or capital gains for tax reporting. If a particular derivative category does not disclose any tax unrealized appreciation or depreciation, the change in value of those derivatives have generally been fully realized for tax purposes.
| | | | | | | | | | | | | |
| | | NUV | | | NUW | | | NMI | | | NEV | |
| Tax cost of investments | | $ | 1,898,620,598 | | | $ | 209,211,009 | | | $ | 89,374,646 | | | $ | 326,006,998 | |
| Gross unrealized: | | | | | | | | | | | | | | | | |
| Appreciation | | $ | 201,478,431 | | | $ | 25,363,654 | | | $ | 6,933,050 | | | $ | 31,825,527 | |
| Depreciation | | | (9,070,639 | ) | | | (250,840 | ) | | | (35,935 | ) | | | (2,480,389 | ) |
| Net unrealized appreciation (depreciation) of investments | | $ | 192,407,792 | | | $ | 25,112,814 | | | $ | 6,897,115 | | | $ | 29,345,138 | |
| | | NUW | |
| Tax cost of futures contracts | | $ | (50,368 | ) |
| Net unrealized appreciation (depreciation) of futures contracts | | | — | |
Permanent differences, primarily due to taxable market discount, expiration of capital loss carryforwards and nondeductible offering costs resulted in reclassifications among the Funds’ components of net assets as of October 31, 2018, the Funds’ last tax year end.
The tax components of undistributed net tax-exempt income, net ordinary income and net long-term capital gains as of October 31, 2018, the Funds’ last tax year end, were as follows:
| | | | | | | | | | | | | |
| | | NUV | | | NUW | | | NMI | | | NEV | |
Undistributed net tax-exempt income1 | | $ | 6,423,887 | | | $ | 687,819 | | | $ | 175,743 | | | $ | 784,795 | |
Undistributed net ordinary income2 | | | 659,485 | | | | 339,279 | | | | 72,049 | | | | 198,859 | |
| Undistributed net long-term capital gains | | | — | | | | 1,576,014 | | | | 628,561 | | | | — | |
| |
1 | Undistributed net tax-exempt income (on a tax basis) has not been reduced for the dividend declared on October 1, 2018 and paid on November 1, 2018. |
2 | Net ordinary income consists of taxable market discount income and net short-term capital gains, if any. |
The tax character of distributions paid during the Funds’ last tax year ended October 31, 2018 was designated for purposes of the dividends paid deduction as follows:
| | | | | | | | | | | | | |
| | | NUV | | | NUW | | | NMI | | | NEV | |
| Distributions from net tax-exempt income | | $ | 77,578,299 | | | $ | 10,780,837 | | | $ | 3,970,866 | | | $ | 19,174,127 | |
Distributions from net ordinary income2 | | | 3,310,007 | | | | 288,792 | | | | 22,215 | | | | 284,431 | |
| Distributions from net long-term capital gains | | | — | | | | 2,745,797 | | | | — | | | | — | |
| |
2 | Net ordinary income consists of taxable market discount income and net short-term capital gains, if any. |
As of October 31, 2018, the Funds’ last tax year end, the following Funds had unused capital loss carryforwards available for federal income tax purposes to be applied against future capital gains, if any. If not applied, the carryforwards will expire as shown in the following table. The losses not subject to expiration will be utilized first by a Fund.
| | | | | | | |
| | | NUV | | | NEV | |
| Expiration: | | | | | | |
| October 31, 2019 | | $ | — | | | $ | 16,146,849 | |
| Not subject to expiration: | | | | | | | | |
| Short-term | | | 10,121,262 | | | | 4,386,474 | |
| Long-term | | | 15,036,160 | | | | 2,178,516 | |
| Total | | $ | 25,157,422 | | | $ | 22,711,839 | |
As of October 31, 2018, the Funds’ last tax year end, $2,946,811 of NEV’s capital loss carryforward expired.
83
Notes to Financial Statements (Unaudited) (continued)
7. Management Fees and Other Transactions with Affiliates
Management Fees
Each Fund’s management fee compensates the Adviser for the overall investment advisory and administrative services and general office facilities. The Sub-Adviser is compensated for its services to the Funds from the management fees paid to the Adviser.
Each Fund’s management fee consists of two components – a fund-level fee, based only on the amount of assets within each individual Fund, and a complex-level fee, based on the aggregate amount of all eligible fund assets managed by the Adviser and for NUV a gross interest income component. This pricing structure enables Fund shareholders to benefit from growth in the assets within their respective Fund as well as from growth in the amount of complex-wide assets managed by the Adviser.
The annual fund-level fee, payable monthly, for NUV is calculated according to the following schedule:
| | | | |
| | | NUV | |
Average Daily Net Assets | | Fund-Level Fee Rate | |
| For the first $500 million | | | 0.1500 | % |
| For the next $500 million | | | 0.1250 | |
| For net assets over $1 billion | | | 0.1000 | |
In addition, NUV pays an annual management fee, payable monthly, based on gross interest income (excluding interest on bonds underlying a “self-deposited inverse floater” trust that is attributed to the Fund over and above the net interest earned on the inverse floater itself) as follows:
| | | | |
| | | NUV | |
Gross Interest Income | | Gross Income Fee Rate | |
| For the first $50 million | | | 4.125 | % |
| For the next $50 million | | | 4.000 | |
| For gross income over $100 million | | | 3.875 | |
The annual fund-level fee, payable monthly, for NUW, NMI and NEV is calculated according to the following schedules:
| | | | |
| | | NUW | |
Average Daily Managed Assets* | | Fund-Level Fee Rate | |
| For the first $125 million | | | 0.4000 | % |
| For the next $125 million | | | 0.3875 | |
| For the next $250 million | | | 0.3750 | |
| For the next $500 million | | | 0.3625 | |
| For the next $1 billion | | | 0.3500 | |
| For the next $3 billion | | | 0.3250 | |
| For managed assets over $5 billion | | | 0.3125 | |
| | | | | |
| | | NMI | |
Average Daily Net Assets | | Fund-Level Fee Rate | |
| For the first $125 million | | | 0.4500 | % |
| For the next $125 million | | | 0.4375 | |
| For the next $250 million | | | 0.4250 | |
| For the next $500 million | | | 0.4125 | |
| For the next $1 billion | | | 0.4000 | |
| For the next $3 billion | | | 0.3750 | |
| For net assets over $5 billion | | | 0.3625 | |
84
| | | | |
| | | NEV | |
Average Daily Managed Assets* | | Fund-Level Fee Rate | |
| For the first $125 million | | | 0.4500 | % |
| For the next $125 million | | | 0.4375 | |
| For the next $250 million | | | 0.4250 | |
| For the next $500 million | | | 0.4125 | |
| For the next $1 billion | | | 0.4000 | |
| For the next $3 billion | | | 0.3750 | |
| For managed assets over $5 billion | | | 0.3625 | |
The annual complex-level fee, payable monthly, for each Fund is calculated by multiplying the current complex-wide fee rate, determined according to the following schedule by the Fund’s daily managed assets (net assets for NUV and NMI):
| | | | |
Complex-Level Eligible Asset Breakpoint Level* | | Effective Complex-Level Fee Rate at Breakpoint Level | |
| $55 billion | | | 0.2000 | % |
| $56 billion | | | 0.1996 | |
| $57 billion | | | 0.1989 | |
| $60 billion | | | 0.1961 | |
| $63 billion | | | 0.1931 | |
| $66 billion | | | 0.1900 | |
| $71 billion | | | 0.1851 | |
| $76 billion | | | 0.1806 | |
| $80 billion | | | 0.1773 | |
| $91 billion | | | 0.1691 | |
| $125 billion | | | 0.1599 | |
| $200 billion | | | 0.1505 | |
| $250 billion | | | 0.1469 | |
| $300 billion | | | 0.1445 | |
| |
| * For the complex-level fees, managed assets include closed-end fund assets managed by the Adviser that are attributable to certain types of leverage. For these purposes, leverage includes the funds’ use of preferred stock and borrowings and certain investments in the residual interest certificates (also called inverse floating rate securities) in tender option bond (TOB) trusts, including the portion of assets held by a TOB trust that has been effectively financed by the trust’s issuance of floating rate securities, subject to an agreement by the Adviser as to certain funds to limit the amount of such assets for determining managed assets in certain circumstances. The complex-level fee is calculated based upon the aggregate daily managed assets of all Nuveen open-end and closed-end funds that constitute “eligible assets.” Eligible assets do not include assets attributable to investments in other Nuveen funds or assets in excess of a determined amount (originally $2 billion) added to the Nuveen fund complex in connection with the Adviser’s assumption of the management of the former First American Funds effective January 1, 2011. As of April 30, 2019, the complex-level fee rate for each Fund was 0.1580%. |
Other Transactions with Affiliates
Each Fund is permitted to purchase or sell securities from or to certain other funds managed by the Adviser (“inter-fund trade”) under specified conditions outlined in procedures adopted by the Board. These procedures have been designed to ensure that any inter-fund trade of securities by the Fund from or to another fund that is, or could be, considered an affiliate of the Fund under certain limited circumstances by virtue of having a common investment adviser (or affiliated investment adviser), common officer and/or common trustee complies with Rule 17a-7 of the 1940 Act. Further, as defined under these procedures, each inter-fund trade is effected at the current market price as provided by an independent pricing service. Unsettled inter-fund trades as of the end of the reporting period are recognized as a component of “Receivable for investments sold” and/or “Payable for investments purchased” on the Statement of Assets and Liabilities, when applicable.
During the current fiscal period, the Funds did not engage in inter-fund trades pursuant to these procedures.
8. Borrowing Arrangements
Committed Line of Credit
The Funds, along with certain other funds managed by the Adviser (“Participating Funds”), have established a 364-day, approximately $2.65 billion standby credit facility with a group of lenders, under which the Participating Funds may borrow for various purposes other than leveraging for investment purposes. Each Participating Fund is allocated a designated proportion of the facility’s capacity (and its associated costs, as described below) based upon a multi-factor assessment of the likelihood and frequency of its need to draw on the facility, the size of the Fund and its anticipated draws, and the potential importance of such draws to the operations and well-being of the Fund, relative to those of the other Funds. A Fund may effect draws on the facility in excess of its designated capacity if and to the extent that other Participating Funds have undrawn capacity. The credit facility expires in July 2019 unless extended or renewed.
85
Notes to Financial Statements (Unaudited) (continued)
The credit facility has the following terms: a fee of 0.15% per annum on unused commitment amounts, and interest at a rate equal to the higher of (a) one-month LIBOR (London Inter-Bank Offered Rate) plus 1.00% per annum or (b) the Fed Funds rate plus 1.00% per annum on amounts borrowed. Participating Funds paid administration, legal and arrangement fees, which are recognized as a component of “Other expenses” on the Statement of Operations, and along with commitment fees, have been allocated among such Participating Funds based upon the relative proportions of the facility’s aggregate capacity reserved for them and other factors deemed relevant by the Adviser and the Board of each Participating Fund.
During the current fiscal period, the following Funds utilized this facility. Each Fund’s maximum outstanding balance during the utilization period was as follows:
| | | | | | | | | | |
| | | NUV | | | NUW | | | NMI | |
| Maximum outstanding balance | | $ | 15,605,976 | | | $ | 3,782,495 | | | $ | 684,069 | |
During each Fund’s utilization period(s) during the current fiscal period, the average daily balance outstanding and average annual interest rate on the Borrowings were as follows:
| | | | | | | | | | |
| | | NUV | | | NUW | | | NMI | |
| Average daily balance outstanding | | $ | 15,605,976 | | | $ | 3,782,495 | | | $ | 684,069 | |
| Average annual interest rate | | | 3.50 | % | | | 3.50 | % | | | 3.50 | % |
Borrowings outstanding as of the end of the reporting period are recognized as “Borrowings” on the Statement of Assets and Liabilities, where applicable.
Inter-Fund Borrowing and Lending
The SEC has granted an exemptive order permitting registered open-end and closed-end Nuveen funds to participate in an inter-fund lending facility whereby the Nuveen funds may directly lend to and borrow money from each other for temporary purposes (e.g., to satisfy redemption requests or when a sale of securities “fails,” resulting in an unanticipated cash shortfall) (the “Inter-Fund Program”). The closed-end Nuveen funds, including the Funds covered by this shareholder report, will participate only as lenders, and not as borrowers, in the Inter-Fund Program because such closed-end funds rarely, if ever, need to borrow cash to meet redemptions. The Inter-Fund Program is subject to a number of conditions, including, among other things, the requirements that (1) no fund may borrow or lend money through the Inter-Fund Program unless it receives a more favorable interest rate than is typically available from a bank or other financial institution for a comparable transaction; (2) no fund may borrow on an unsecured basis through the Inter-Fund Program unless the fund’s outstanding borrowings from all sources immediately after the inter-fund borrowing total 10% or less of its total assets; provided that if the borrowing fund has a secured borrowing outstanding from any other lender, including but not limited to another fund, the inter-fund loan must be secured on at least an equal priority basis with at least an equivalent percentage of collateral to loan value; (3) if a fund’s total outstanding borrowings immediately after an inter-fund borrowing would be greater than 10% of its total assets, the fund may borrow through the inter-fund loan on a secured basis only; (4) no fund may lend money if the loan would cause its aggregate outstanding loans through the Inter-Fund Program to exceed 15% of its net assets at the time of the loan; (5) a fund’s inter-fund loans to any one fund shall not exceed 5% of the lending fund’s net assets; (6) the duration of inter-fund loans will be limited to the time required to receive payment for securities sold, but in no event more than seven days; and (7) each inter-fund loan may be called on one business day’s notice by a lending fund and may be repaid on any day by a borrowing fund. In addition, a Nuveen fund may participate in the Inter-Fund Program only if and to the extent that such participation is consistent with the fund’s investment objective and investment policies. The Board is responsible for overseeing the Inter-Fund Program.
The limitations detailed above and the other conditions of the SEC exemptive order permitting the Inter-Fund Program are designed to minimize the risks associated with Inter-Fund Program for both the lending fund and the borrowing fund. However, no borrowing or lending activity is without risk. When a fund borrows money from another fund, there is a risk that the loan could be called on one day’s notice or not renewed, in which case the fund may have to borrow from a bank at a higher rate or take other actions to payoff such loan if an inter-fund loan is not available from another fund. Any delay in repayment to a lending fund could result in a lost investment opportunity or additional borrowing costs.
During the current reporting period, none of the Funds covered by this shareholder report have entered into any inter-fund loan activity.
9. New Accounting Pronouncements
Fair Value Measurement: Disclosure Framework
During August 2018, the FASB issued Accounting Standards Update (“ASU”) 2018-13 (“ASU 2018-13”), Fair Value Measurement: Disclosure Framework –Changes to the Disclosure Requirements for Fair Value Measurements. ASU 2018-13 modifies the disclosures required by Topic 820, Fair Value Measurements. The amendments in ASU 2018-13 are effective for all entities for fiscal years, and interim periods within those fiscal years, beginning after December 15, 2019. During the current reporting period, management early implemented this guidance. This implementation did not have a material impact on the Funds’ financial statements.
86
Additional Fund Information
| | | | | | |
Board of Directors/Trustees | | | | |
| Margo Cook* | Jack B. Evans | William C. Hunter | Albin F. Moschner | John K. Nelson | |
| Judith M. Stockdale | Carole E. Stone | Terence J. Toth | Margaret L. Wolff | Robert L. Young | |
| |
| * Interested Board Member. |
| |
| |
Fund Manager | Custodian | Legal Counsel | Independent Registered | Transfer Agent and |
| Nuveen Fund Advisors, LLC | State Street Bank | Chapman and Cutler LLP | Public Accounting Firm | Shareholder Services |
| 333 West Wacker Drive | & Trust Company | Chicago, IL 60603 | KPMG LLP | | Computershare Trust |
| Chicago, IL 60606 | One Lincoln Street | | 200 East Randolph Street | Company, N.A. |
| | Boston, MA 02111 | | Chicago, IL 60601 | | 250 Royall Street |
| | | | | | Canton, MA 02021 |
| | | | | | (800) 257-8787 |
Portfolio of Investments Information
Each Fund is required to file its complete schedule of portfolio holdings with the Securities and Exchange Commission (SEC) for the first and third quarters of each fiscal year as an exhibit to its report on Form N-PORT. You may obtain this information on the SEC’s website at http://www.sec.gov.
Nuveen Funds’ Proxy Voting Information
You may obtain (i) information regarding how each fund voted proxies relating to portfolio securities held during the most recent twelve-month period ended June 30, without charge, upon request, by calling Nuveen toll-free at (800) 257-8787 or on Nuveen’s website at www.nuveen.com and (ii) a description of the policies and procedures that each fund used to determine how to vote proxies relating to portfolio securities without charge, upon request, by calling Nuveen toll free at (800) 257-8787. You may also obtain this information directly from the SEC. Visit the SEC on-line at http://www.sec.gov.
CEO Certification Disclosure
Each Fund’s Chief Executive Officer (CEO) has submitted to the New York Stock Exchange (NYSE) the annual CEO certification as required by Section 303A.12(a) of the NYSE Listed Company Manual. Each Fund has filed with the SEC the certification of its CEO and Chief Financial Officer required by Section 302 of the Sarbanes-Oxley Act.
Common Share Repurchases
Each Fund intends to repurchase, through its open-market share repurchase program, shares of its own common stock at such times and in such amounts as is deemed advisable. During the period covered by this report, each Fund repurchased shares of its common stock as shown in the accompanying table. Any future repurchases will be reported to shareholders in the next annual or semi-annual report.
| | | | | | | | | | | | | |
| | | NUV | | | NUW | | | NMI | | | NEV | |
| Common shares repurchased | | | — | | | | — | | | | — | | | | — | |
FINRA BrokerCheck
The Financial Industry Regulatory Authority (FINRA) provides information regarding the disciplinary history of FINRA member firms and associated investment professionals. This information as well as an investor brochure describing FINRA BrokerCheck is available to the public by calling the FINRA BrokerCheck Hotline number at (800) 289-9999 or by visiting www.FINRA.org.
87
Glossary of Terms Used in this Report
| · | Average Annual Total Return: This is a commonly used method to express an investment’s performance over a particular, usually multi-year time period. It expresses the return that would have been necessary each year to equal the investment’s actual cumulative performance (including change in NAV or market price and reinvested dividends and capital gains distributions, if any) over the time period being considered. |
| | |
| · | Duration: Duration is a measure of the expected period over which a bond’s principal and interest will be paid, and consequently is a measure of the sensitivity of a bond’s or bond fund’s value to changes when market interest rates change. Generally, the longer a bond’s or fund’s duration, the more the price of the bond or fund will change as interest rates change. |
| | |
| · | Effective Leverage: Effective leverage is a fund’s effective economic leverage, and includes both regulatory leverage (see leverage) and the leverage effects of certain derivative investments in the fund’s portfolio. Currently, the leverage effects of Tender Option Bond (TOB) inverse floater holdings are included in effective leverage values, in addition to any regulatory leverage. |
| | |
| · | Industrial Development Revenue Bond (IDR): A unique type of revenue bond issued by a state or local government agency on behalf of a private sector company and intended to build or acquire factories or other heavy equipment and tools. |
| | |
| · | Inverse Floating Rate Securities: Inverse floating rate securities, also known as inverse floaters or tender option bonds (TOBs), are created by depositing a municipal bond, typically with a fixed interest rate, into a special purpose trust. This trust, in turn, (a) issues floating rate certificates typically paying short-term tax-exempt interest rates to third parties in amounts equal to some fraction of the deposited bond’s par amount or market value, and (b) issues an inverse floating rate certificate (sometimes referred to as an “inverse floater”) to an investor (such as a fund) interested in gaining investment exposure to a long-term municipal bond. The income received by the holder of the inverse floater varies inversely with the short-term rate paid to the floating rate certificates’ holders, and in most circumstances the holder of the inverse floater bears substantially all of the underlying bond’s downside investment risk. The holder of the inverse floater typically also benefits disproportionately from any potential appreciation of the underlying bond’s value. Hence, an inverse floater essentially represents an investment in the underlying bond on a leveraged basis. |
| | |
| · | Leverage: Leverage is created whenever a fund has investment exposure (both reward and/or risk) equivalent to more than 100% of the investment capital. |
| | |
| · | Net Asset Value (NAV) Per Share: A fund’s Net Assets is equal to its total assets (securities, cash, accrued earnings and receivables) less its total liabilities. NAV per share is equal to the fund’s Net Assets divided by its number of shares outstanding. |
| | |
| · | Pre-Refunding: Pre-Refunding, also known as advanced refundings or refinancings, is a procedure used by state and local governments to refinance municipal bonds to lower interest expenses. The issuer sells new bonds with a lower yield and uses the proceeds to buy U.S. Treasury securities, the interest from which is used to make payments on the higher-yielding bonds. Because of this collateral, pre-refunding generally raises a bond’s credit rating and thus its value. |
88
| · | S&P Municipal Bond Index: An unleveraged, market value-weighted index designed to measure the performance of the tax- exempt, investment-grade U.S. municipal bond market. Index returns assume reinvestment of distributions, but do not reflect any applicable sales charges or management fees. |
| · | Total Investment Exposure: Total investment exposure is a fund’s assets managed by the Adviser that are attributable to financial leverage. For these purposes, financial leverage includes a fund’s use of preferred stock and borrowings and investments in the residual interest certificates (also called inverse floating rate securities) in tender option bond (TOB) trusts, including the portion of assets held by a TOB trust that has been effectively financed by the trust’s issuance of floating rate securities. |
| · | Zero Coupon Bond: A zero coupon bond does not pay a regular interest coupon to its holders during the life of the bond. Income to the holder of the bond comes from accretion of the difference between the original purchase price of the bond at issuance and the par value of the bond at maturity and is effectively paid at maturity. The market prices of zero coupon bonds generally are more volatile than the market prices of bonds that pay interest periodically. |
89
Reinvest Automatically, Easily and Conveniently
Nuveen makes reinvesting easy. A phone call is all it takes to set up your reinvestment account.
Nuveen Closed-End Funds Automatic Reinvestment PlanNuveen Closed-End Fund allows you to conveniently reinvest distributions in additional Fund shares. By choosing to reinvest, you’ll be able to invest money regularly and automatically, and watch your investment grow through the power of compounding. Just like distributions in cash, there may be times when income or capital gains taxes may be payable on distributions that are reinvested. It is important to note that an automatic reinvestment plan does not ensure a profit, nor does it protect you against loss in a declining market.
Easy and convenient
To make recordkeeping easy and convenient, each month you’ll receive a statement showing your total distributions, the date of investment, the shares acquired and the price per share, and the total number of shares you own.
How shares are purchased
The shares you acquire by reinvesting will either be purchased on the open market or newly issued by the Fund. If the shares are trading at or above net asset value at the time of valuation, the Fund will issue new shares at the greater of the net asset value or 95% of the then-current market price. If the shares are trading at less than net asset value, shares for your account will be purchased on the open market. If the Plan Agent begins purchasing Fund shares on the open market while shares are trading below net asset value, but the Fund’s shares subsequently trade at or above their net asset value before the Plan Agent is able to complete its purchases, the Plan Agent may cease open-market purchases and may invest the uninvested portion of the distribution in newly-issued Fund shares at a price equal to the greater of the shares’ net asset value or 95% of the shares’ market value on the last business day immediately prior to the purchase date. Distributions received to purchase shares in the open market will normally be invested shortly after the distribution payment date. No interest will be paid on distributions awaiting reinvestment. Because the market price of the shares may increase before purchases are completed, the average purchase price per share may exceed the market price at the time of valuation, resulting in the acquisition of fewer shares than if the distribution had been paid in shares issued by the Fund. A pro rata portion of any applicable brokerage commissions on open market purchases will be paid by Plan participants. These commissions usually will be lower than those charged on individual transactions.
Flexible
You may change your distribution option or withdraw from the Plan at any time, should your needs or situation change. You can reinvest whether your shares are registered in your name, or in the name of a brokerage firm, bank, or other nominee. Ask your investment advisor if his or her firm will participate on your behalf. Participants whose shares are registered in the name of one firm may not be able to transfer the shares to another firm and continue to participate in the Plan. The Fund reserves the right to amend or terminate the Plan at any time. Although the Fund reserves the right to amend the Plan to include a service charge payable by the participants, there is no direct service charge to participants in the Plan at this time.
Call today to start reinvesting distributions
For more information on the Nuveen Automatic Reinvestment Plan or to enroll in or withdraw from the Plan, speak with your financial advisor or call us at (800) 257-8787.
90
Notes
91
Nuveen:
Serving Investors for Generations
Since 1898, financial advisors and their clients have relied on Nuveen to provide dependable investment solutions through continued adherence to proven, long-term investing principles. Today, we offer a range of high quality solutions designed to be integral components of a well-diversified core portfolio.
Focused on meeting investor needs.
Nuveen is the investment manager of TIAA. We have grown into one of the world’s premier global asset managers, with specialist knowledge across all major asset classes and particular strength in solutions that provide income for investors and that draw on our expertise in alternatives and responsible investing. Nuveen is driven not only by the independent investment processes across the firm, but also the insights, risk management, analytics and other tools and resources that a truly world-class platform provides. As a global asset manager, our mission is to work in partnership with our clients to create solutions which help them secure their financial future.
Find out how we can help you.
To learn more about how the products and services of Nuveen may be able to help you meet your financial goals, talk to your financial advisor, or call us at (800) 257-8787. Please read the information provided carefully before you invest. Investors should consider the investment objective and policies, risk considerations, charges and expenses of any investment carefully. Where applicable, be sure to obtain a prospectus, which contains this and other relevant information. To obtain a prospectus, please contact your securities representative or Nuveen, 333 W. Wacker Dr., Chicago, IL 60606. Please read the prospectus carefully before you invest or send money.
Learn more about Nuveen Funds at: www.nuveen.com/closed-end-funds
Nuveen Securities, LLC, member FINRA and SIPC | 333 West Wacker Drive Chicago, IL 60606 | www.nuveen.com | |
ESA-A-0419D 863541-INV-B-06/20