Washington, D.C. 20549
Mark L. Winget
Form N-CSR is to be used by management investment companies to file reports with the Commission not later than 10 days after the transmission to stockholders of any report that is required to be transmitted to stockholders under Rule 30e-1 under the Investment Company Act of 1940 (17 CFR 270.30e-1). The Commission may use the information provided on Form N-CSR in its regulatory, disclosure review, inspection, and policymaking roles.
A registrant is required to disclose the information specified by Form N-CSR, and the Commission will make this information public. A registrant is not required to respond to the collection of information contained in Form N-CSR unless the Form displays a currently valid Office of Management and Budget (“OMB”) control number. Please direct comments concerning the accuracy of the information collection burden estimate and any suggestions for reducing the burden to Secretary, Securities and Exchange Commission, 450 Fifth Street, NW, Washington, DC 20549-0609. The OMB has reviewed this collection of information under the clearance requirements of 44 U.S.C. ss. 3507.
ITEM 1. REPORTS TO STOCKHOLDERS.
Life is
Complex.
Nuveen makes things e-simple.
It only takes a minute to sign up for e-Reports. Once enrolled, you’ll receive an e-mail as soon as your Nuveen Fund information is ready—no more waiting for delivery by regular mail. Just click on the link within the e-mail to see the report and save it on your computer if you wish.
Free e-Reports
right to your e-mail!
www.investordelivery.com
If you receive your Nuveen Fund
dividends and statements from your
financial professional or brokerage account.
or
www.nuveen.com/client-access
If you receive your Nuveen Fund
dividends and statements directly from
Nuveen.
NOT FDIC INSURED MAY LOSE
VALUE NO BANK GUARANTEE
| 4 |
| | |
| 5 |
| | |
| 9 |
| | |
| 10 |
| | |
| 12 |
| | |
| 20 |
| | |
| 78 |
| | |
| 79 |
| | |
| 80 |
| | |
| 82 |
| | |
| 84 |
| | |
| 88 |
| | |
| 102 |
| | |
| 103 |
| | |
| 104 |
| | |
| 105 |
3
Chair’s Letterto Shareholders Dear Shareholders,
More than a year has passed since the World Health Organization declared COVID-19 a global pandemic in March 2020, resulting in a year of global economic recession, financial market turbulence and some immeasurable losses. Although the health crisis persists, with the widespread distribution of vaccines in the U.S. and extraordinary economic interventions by governments and central banks around the world, we collectively look forward to what our “new normal” might be.
With vaccine progress and economic stimulus providing real benefits to the global economy, markets continue to anticipate a strong rebound in growth, especially in the U.S., along with higher inflation. To extend relief programs enacted earlier in the crisis, the U.S. government passed $900 billion in aid to individuals and businesses in late December 2020. Another $1.9 tril-lion relief package was signed into law in March 2021 providing extended unemployment benefits, direct payments to individuals and families, assistance to state and local municipalities, grants to education and public health, and other support. Currently, Congress is working on an infrastructure spending plan, although its final shape and whether it passes remains to be seen. The U.S. Federal Reserve (Fed) and other central banks around the world remain committed to supporting the recovery by maintaining accommodative monetary conditions. However, as economies have reopened, the surge in consumer demand has outpaced supply chain capacity, resulting in a jump in inflation indicators in recent months. Whether inflation persists is a subject of debate by economists and market observers, while the Fed and other central banks believe it to be more transitory.
While the markets’ longer-term outlook has brightened, we expect intermittent bouts of volatility to continue. Markets are closely monitoring central bank signals, particularly if inflation remains elevated, as a sooner-than-expected shift to monetary tightening could slow the economic recovery. Additionally, COVID-19 cases are still elevated in some regions, as more virulent strains have spread and vaccination rollouts have been uneven around the world. The recovery hinges on controlling the virus, and estimates vary considerably on when economic activity might be fully restored and what level of public inoculation would be sufficient to contain the virus spread. On the political front, the Biden administration’s full policy agenda and the potential for Congressional gridlock remain to be seen, either of which could cause investment outlooks to shift. Short-term market fluctuations can provide your Fund opportunities to invest in new ideas as well as upgrade existing positioning while providing long-term value for shareholders. For more than 120 years, the careful consideration of risk and reward has guided Nuveen’s focus on delivering long-term results to our shareholders.
If you have concerns about what’s coming next, it can be an opportune time to assess your portfolio. We encourage you to review your time horizon, risk tolerance and investment goals with your financial professional. On behalf of the other members of the Nuveen Fund Board, we look forward to continuing to earn your trust in the months and years ahead.
Sincerely,
Terence J. Toth
Chair of the Board
June 22, 2021
4
Portfolio Managers’ Comments
Nuveen Municipal Value Fund, Inc. (NUV)
Nuveen AMT-Free Municipal Value Fund (NUW)
Nuveen Municipal Income Fund, Inc. (NMI)
Nuveen Enhanced Municipal Value Fund (NEV)
These Funds feature portfolio management by Nuveen Asset Management, LLC (NAM), an affiliate of Nuveen Fund Advisors, LLC, the Fund’s investment adviser. Portfolio managers Daniel J. Close, CFA, Christopher L. Drahn, CFA, and Steven M. Hlavin discuss key investment strategies and the six-month performance of these four national Funds. Dan has managed NUV and NUW since 2016. Chris assumed portfolio management responsibility for NMI in 2011. Steve has been involved in the management of NEV since its inception in 2009, taking on full portfolio management responsibility in 2010.
An Update on COVID-19 Coronavirus and its Impact on the Securities Markets
Vaccination progress across Western countries has been encouraging for the markets, although the spread of new variants of the COVID-19 coronavirus is being closely watched. Although the pace of vaccinations in the U.S. has recently slowed, half of U.S. states and Washington D.C. have fully vaccinated at least 50% of their adult populations as of May 2021 according to the Centers for Disease Control and Prevention. In other regions of the world, vaccine rollouts have been slower than expected. Nevertheless, there are more vaccines still in development, some of which have announced positive trial results, vaccine trials have begun for children and governments are looking to adjust rollout plans to speed and/or broaden distribution.
After moderating in late 2020, the U.S. economic recovery reaccelerated in early 2021 as vaccinations, reopening and federal stimulus checks encouraged consumer spending. Pledges from central banks and governments to sustain the recovery with policy support are underpinning positive economic outlooks for the full year and beyond. The U.S. government approved a $900 billion relief package in late December 2020 and followed with another $1.9 trillion stimulus plan in March 2021. The Biden administration has proposed a $2 trillion infrastructure improvement plan and a $1.8 trillion families plan investing in education, child care, paid family leave and other support, although the specifics of both proposals are expected to be highly debated in Congress.
This material is not intended to be a recommendation or investment advice, does not constitute a solicitation to buy, sell or hold a security or an investment strategy and is not provided in a fiduciary capacity. The information provided does not take into account the specific objectives or circumstances of any particular investor, or suggest any specific course of action. Investment decisions should be made based on an investor’s objectives and circumstances and in consultation with his or her advisors.
Certain statements in this report are forward-looking statements. Discussions of specific investments are for illustration only and are not intended as recommendations of individual investments. The forward-looking statements and other views expressed herein are those of the portfolio managers as of the date of this report. Actual future results or occurrences may differ significantly from those anticipated in any forward-looking statements, and the views expressed herein are subject to change at any time, due to numerous market and other factors. The Funds disclaim any obligation to update publicly or revise any forward-looking statements or views expressed herein.
For financial reporting purposes, the ratings disclosed are the highest rating given by one of the following national rating agencies: Standard & Poor’s Group (S&P), Moody’s Investors Service, Inc. (Moody’s) or Fitch, Inc. (Fitch). This treatment of split-rated securities may differ from that used for other purposes, such as for Fund investment policies. Credit ratings are subject to change. AAA, AA, A and BBB are investment grade ratings, while BB, B, CCC, CC, C and D are below investment grade ratings. Holdings designated N/R are not rated by these national rating agencies.
Bond insurance guarantees only the payment of principal and interest on the bond when due, and not the value of the bonds themselves, which will fluctuate with the bond market and the financial success of the issuer and the insurer. Insurance relates specifically to the bonds in the portfolio and not to the share prices of a Fund. No representation is made as to the insurers’ ability to meet their commitments.
Refer to the Glossary of Terms Used in this Report for further definition of the terms used within this section.
5
Portfolio Managers’ Comments (continued)
Markets rallied on optimism for normalization in daily life and in the economy, furthering the recovery from the March 2020 sell-off. Although the detection of the virus in China was made public in December 2019, markets did not start to fully acknowledge the risks and potential economic impact until the latter portion of February 2020, when outbreaks outside of China were first reported. Global stock markets sold off severely, with the S&P 500® Index reaching a bear market (a 20% drop from the previous high) within three weeks, the fastest bear market decline in history. Even certain parts of the bond market suffered; below investment grade municipal and corporate bonds generally dropped the furthest, mostly out of concerns for the continued financial stability of lower quality issuers. Demand for safe-haven assets, along with mounting recession fears, drove the yield on the 10-year U.S. Treasury note to 0.5% in March 2020, an all-time low. Additionally, oil prices collapsed to an 18-year low on supply glut concerns, as shut-downs across the global economy sharply reduced oil demand, although oil prices have recovered to well above those lows.
Nuveen Fund Advisors, LLC, and the portfolio management teams are monitoring the situation carefully and managing the Funds to best pursue investment objectives while mitigating risks through all market environments.
What key strategies were used to manage the Funds during the six-month reporting period ended April 30, 2021, and how did these strategies influence performance?
Each Fund’s primary investment objective is to provide current income exempt from regular federal income tax by investing primarily in a portfolio of municipal obligations issued by state and local government authorities or certain U.S. territories. For NUV, NUW and NMI, each Fund may use inverse floating rate securities (or tender option bond financing) to more efficiently implement its investment strategy to create up to 10% effective leverage. NEV also uses inverse floating rate securities to create effective leverage, but to a greater extent than NUV, NUW and NMI. A further discussion on leverage can be found in the Fund Leverage section of this report.
During the six-month reporting period, the municipal bond market continued to recover amid upgraded economic forecasts, additional fiscal stimulus and the Federal Reserve’s commitment to accommodative monetary policy. Municipal yields declined for most longer maturities and the municipal yield curve flattened slightly. Credit spreads narrowed further as the municipal credit outlook improved and investors continued to seek higher yielding investments lower down the credit spectrum. Against this backdrop, municipal bonds had positive performance during the reporting period.
The Funds’ trading activity continued to focus on pursuing their investment objectives. NUV traded actively in this reporting period, adding bonds across a diverse group of sectors, primarily in 4% and 5% coupon structures with longer maturities, and focused on intermediate credit quality (A and low AA rated) paper. NUV tended to buy more new issues than secondary market offerings, due to attractive availability and the relative value on offer in the new issue market. Additions to NUV included seven transportation (toll road) issues, a state general obligation (GO) bond, three local GOs, an “other transportation” bond, four dedicated tax bonds, a public utility credit, an “other revenue” bond, a state appropriation issue, a local appropriation bond and an industrial development revenue (IDR) credit. Most of the purchases were funded with the proceeds from maturing and called bonds, although we sold some lower book yield positions at a loss in December 2020 to reinvest in more attractive, higher book yield opportunities.
NUW was less active, by comparison, buying three transportation (toll roads) bonds, a higher education credit, a health care credit and a dedicated tax bond. These additions were 4% and 5% coupon structures with intermediate maturities (given NUW’s longer duration), and focused on intermediate credit quality (mainly A rated). NUW did not have any material sales during this reporting period, financing new purchases with cash from called and maturing bonds.
6
NMI’s overall sector and credit quality positioning remained stable over the reporting period, although the Fund had marginal increases in health care and some miscellaneous tax-backed sector weightings. NMI continued to utilize more 4% coupon structures than 5% structures for the bonds’ additional advantages and still-reasonable defensiveness if interest rates rise.
Trading activity in NEV was relatively light in this reporting period. NEV reinvested the income from bond calls and maturities into issues for New York MTA (Metropolitan Transportation Authority), a Florida toll road, a Florida hospital, a Louisiana hospital and Puerto Rico sales tax revenue bonds (known as COFINAs). There were no meaningful sales in NEV in this reporting period.
As of April 30, 2021, NUV, NUW and NEV continued to use inverse floating rate securities. The Funds employ inverse floaters for a variety of reasons, including duration management, income enhancement and total return enhancement. As part of our duration management strategies, during this reporting period NUW entered into duration-shortening interest rate futures contracts, which added to performance during the reporting period.
How did the Funds perform during the six-month reporting period ended April 30, 2021?
The tables in each Fund’s Performance Overview and Holding Summaries section of this report provide the Funds’ total returns at net asset value (NAV) for the period ended April 30, 2021. Each Fund’s total returns at NAV are compared with the performance of a corresponding market index.
For the six months ended April 30, 2021, the total returns at NAV for the four Funds outperformed the return for the national S&P Municipal Bond Index.
The factors affecting performance in this reporting period included yield curve and duration positioning, credit ratings allocation and sector allocation. In addition, the use of leverage was an important factor affecting performance of NEV. Leverage is discussed in more detail later in the Fund Leverage section of this report.
In this reporting period, yields fell across the shortest and longest maturities, but rose in the short-intermediate part of the curve. Given this dynamic, longer duration bonds generally performed the best. For NUV and NUW, underweight allocations to the shortest durations (zero to 6 years) and overweight allocations to the longest durations (8 to 12 years) were both beneficial to relative performance. NMI’s yield curve and duration positioning was an overall positive factor, largely due to the overweight in longer duration bonds, which more than offset the overweight in some older, shorter duration positions that detracted. For NEV, duration and yield curve positioning were not a material factor affecting performance in this reporting period.
Looking at credit ratings, lower rated and high yield bonds outperformed high grade (AAA and AA rated) bonds in this reporting period. The four Funds were well positioned for the environment, with overweights to the lower rated, higher yielding credit categories and underweights to the highest credit qualities. NUV and NUW were most helped by overweights to A and BBB bonds and underweights to AAA and AA rated paper. NMI benefited from both an underweight and security selection in high grade paper, strong security selection in A rated debt, an overweight in BBB rated bonds (despite a slightly negative impact from security selection in the BBB category) and an overweight in non-rated bonds. NEV has maintained its 20% maximum allocation to below investment grade and non-rated bonds, and this was highly additive to performance.
7
Portfolio Managers’ Comments (continued)
Sector positioning provided a smaller positive contribution than the other factors. NUV’s overweight to pre-refunded bonds and underweight to the “other transportation” sector detracted, but it was offset by advantageous overweights to the dedicated tax and hospital sectors. NUW was also helped by overweight allocations to the dedicated tax and hospital sectors, although an underweight to “other transportation” modestly hurt performance. NMI’s overweight in the pre-refunded bond sector was a negative influence on performance, whereas overweights in hospitals, senior living and toll roads, underweights in state and local GOs and utilities, and a small overweight in tobacco all added value. NEV benefited from overweights in several sectors that outperformed, including dedicated tax, health care (hospitals), tobacco, transportation and IDR.
Individual credit selection was also favorable to the Funds’ performance. For NUV and NUW, zero coupon bonds with a credit component (i.e., BBB or A rated) were by far the best performers in the two Funds’ portfolios. However, bonds bought early in the reporting period, prior to interest rates rising, tended to underperform when viewing the reporting period as a whole. NUV and NUW’s tender option bond trusts were marginally beneficial to performance. NMI benefited from spread tightening on certain longer duration holdings that had underperformed in previous periods (such as the Metropolitan Pier and Exposition Authority IL McCormick Expansion Project zero coupon bonds). Half of NEV’s relative outperformance came from credit selection. The most notable outperformers for NEV included Illinois and Illinois-related bonds (including Metropolitan Pier bonds), the New Jersey megamall and entertainment complex American Dream, New Jersey appropriation debt, Brightline Passenger Rail Project, Metropolitan Washington DC Airports Authority Dulles Toll Road Revenue Bonds, American Airlines and Big River Steel. NEV’s holding in Energy Harbor common stock, acquired when holdings of certain municipal bonds issued by FirstEnergy Solutions were converted into Energy Harbor equity as part of the company’s emergence from bankruptcy protection, also performed strongly in this reporting period. Over time, we expect to sell these shares and reinvest the proceeds into municipal bonds. NEV’s largest underperforming holding was Puerto Rico Childrens Trust Fund Tobacco Settlement Asset Backed Bonds, but the outperforming positions more than outweighed the negative impact.
8
IMPACT OF THE FUNDS’ LEVERAGE STRATEGIES ON PERFORMANCE
One important factor impacting the returns of NEV’s common shares relative to its comparative benchmark was the Fund’s use of leverage. The Fund obtains leverage through investments in inverse floating rate securities, which represent a leveraged investment in an underlying bond. This was also a factor, although less significantly, for NUV and NUW because their use of leverage is more modest. NMI did not invest in inverse floating rate securities during the reporting period.
The Funds use leverage because our research has shown that, over time, leveraging provides opportunities for additional income. The opportunity arises when short-term rates that a Fund pays on its leveraging instruments are lower than the interest the Fund earns on its portfolio of long-term bonds that it has bought with the proceeds of that leverage. This has been particularly true in the recent market environment where short-term rates have been low by historical standards.
However, use of leverage can expose Fund common shares to additional price volatility. When a Fund uses leverage, the Fund’s common shares will experience a greater increase in their net asset value if the municipal bonds acquired through the use of leverage increase in value, but will also experience a correspondingly larger decline in their net asset value if the bonds acquired through leverage decline in value. All this will make the shares’ total return performance more variable over time.
In addition, common share income in levered funds will typically decrease in comparison to unlevered funds when short-term interest rates increase and increase when short-term interest rates decrease. In recent quarters, fund leverage expenses have generally tracked the overall movement of short-term tax-exempt interest rates. While fund leverage expenses are somewhat higher than their recent lows, leverage nevertheless continues to provide the opportunity for incremental common share income, particularly over longer-term periods.
Leverage had a negligible impact on the performance of NUV and NUW over the reporting period. Leverage had a positive impact on the performance of NEV during the reporting period.
As of April 30, 2021, the Funds’ percentages of leverage are as shown in the accompanying table. | | | |
| NUV | NUW | NMI | NEV |
Effective Leverage* | 1.32% | 1.35% | 0.00% | 33.11% |
* | Effective Leverage is a Fund’s effective economic leverage, and includes both regulatory leverage and the leverage effects of certain derivative and other investments in a Fund’s portfolio that increase the Fund’s investment exposure. Currently, the leverage effects of Tender Option Bond (TOB) inverse floater holdings are included in effective leverage values. A Fund, however, may from time to time borrow on a typically transient basis in connection with its day-to-day operations, primarily in connection with the need to settle portfolio trades. Such incidental borrowings are excluded from the calculation of a Fund’s effective leverage ratio. |
9
COMMON SHARE DISTRIBUTION INFORMATION
The following information regarding the Funds’ distributions is current as of April 30, 2021. Each Fund’s distribution levels may vary over time based on each Fund’s investment activity and portfolio investment value changes.
During the current reporting period, each Fund’s distributions to common shareholders were as shown in the accompanying table.
| | Per Common Share Amounts | |
| Monthly Distributions (Ex-Dividend Date) | NUV | NUW | NMI | NEV |
November 2020 | $0.0310 | $0.0390 | $0.0330 | $0.0610 |
December | 0.0310 | 0.0390 | 0.0330 | 0.0610 |
January | 0.0310 | 0.0390 | 0.0330 | 0.0610 |
February | 0.0310 | 0.0390 | 0.0330 | 0.0610 |
March | 0.0310 | 0.0390 | 0.0330 | 0.0610 |
April 2021 | 0.0310 | 0.0390 | 0.0330 | 0.0610 |
| Total Distributions from Net Investment Income | $0.1860 | $0.2340 | $0.1980 | $0.3660 |
| Total Distributions from Long Term Capital Gains* | $ — | $ — | $ — | $0.2340 |
| Total Distributions | $0.1860 | $0.2340 | $0.1980 | $0.6000 |
|
| Yields | | | | |
Market Yield** | 3.30% | 2.79% | 3.43% | 4.25% |
Taxable-Equivalent Yield** | 5.54% | 4.61% | 5.74% | 7.05% |
* | Distribution paid in December 2020. |
** | Market Yield is based on the Fund’s current annualized monthly dividend divided by the Fund’s current market price as of the end of the reporting period. Taxable-Equivalent Yield represents the yield that must be earned on a fully taxable investment in order to equal the yield of the Fund on an after-tax basis. It is based on a federal income tax rate of 40.8%. Your actual federal income tax rate may differ from the assumed rate. The Taxable-Equivalent Yield also takes into account the percentage of the Fund’s income generated and paid by the Fund (based on payments made during the previous calendar year) that was not exempt from federal income tax. Separately, if the comparison were instead to investments that generate qualified dividend income, which is taxable at a rate lower than an individual’s ordinary graduated tax rate, the fund’s Taxable-Equivalent Yield would be lower. |
Each Fund seeks to pay regular monthly dividends out of its net investment income at a rate that reflects its past and projected net income performance. To permit each Fund to maintain a more stable monthly dividend, the Fund may pay dividends at a rate that may be more or less than the amount of net income actually earned by the Fund during the period. Distributions to common shareholders are determined on a tax basis, which may differ from amounts recorded in the accounting records. In instances where the monthly dividend exceeds the earned net investment income, the Fund would report a negative undistributed net ordinary income. Refer to Note 6 – Income Tax Information for additional information regarding the amounts of undistributed net ordinary income and undistributed net long-term capital gains and the character of the actual distributions paid by the Fund during the period.
All monthly dividends paid by each Fund during the current reporting period were paid from net investment income. If a portion of the Fund’s monthly distributions is sourced or comprised of elements other than net investment income, including capital gains and/or a return of capital, common shareholders will be notified of those sources. For financial reporting purposes, the per share amounts of each Fund’s distributions for the reporting period are presented in this report’s Financial Highlights. For income tax purposes, distribution information for each Fund as of its most recent tax year end is presented in Note 6 – Income Tax Information within the Notes to Financial Statements of this report.
NUVEEN CLOSED-END FUND DISTRIBUTION AMOUNTS
The Nuveen Closed-End Funds’ monthly and quarterly periodic distributions to shareholders are posted on www.nuveen.com and can be found on Nuveen’s enhanced closed-end fund resource page, which is at https://www.nuveen.com/resource-center-closedendfunds, along with other Nuveen closed-end fund product updates. To ensure timely access to the latest information, shareholders may use a subscribe function, which can be activated at this web page (https://www.nuveen.com/subscriptions).
10
COMMON SHARE EQUITY SHELF PROGRAM
During the current reporting period, NUW and NMI were authorized by the Securities and Exchange Commission to issue additional common shares through an equity shelf program (Shelf Offering). Under these programs, NUW and NMI, subject to market conditions, may raise additional capital from time to time in varying amounts and offering methods at a net price at or above each Fund’s NAV per common share. The total amount of common shares authorized under these Shelf Offerings are shown in the accompanying table.
| NUW | NMI |
Additional authorized common shares | 1,500,000 | 2,200,000 |
During the current reporting period, NMI sold common shares through its Shelf Offering at a weighted average premium to the NAV per common share as shown in the accompanying table.
| NMI |
Common shares sold through shelf offering | 256,675 |
Weighted average premium to NAV per common share sold | 1.77% |
Refer to the Notes to Financial Statements, Note 5 – Fund Shares for further details on Shelf Offerings and each Fund’s transactions.
COMMON SHARE REPURCHASES
During August 2020, the Funds’ Board of Directors/Trustees reauthorized an open-market common share repurchase program, allowing each Fund to repurchase an aggregate of up to approximately 10% of its outstanding common shares.
As of April 30, 2021, and since the inception of the Funds’ repurchase programs, the Funds have cumulatively repurchased and retired their outstanding common shares as shown in the accompanying table.
| NUV | NUW | NMI | NEV |
Common shares cumulatively repurchased and retired | — | — | — | — |
Common shares authorized for repurchase | 20,695,000 | 1,550,000 | 915,000 | 2,495,000 |
During the current reporting period, the Funds did not repurchase any of their outstanding common shares. | | |
OTHER COMMON SHARE INFORMATION
As of April 30, 2021, the Funds’ common share prices were trading at a premium/(discount) to their common share NAVs and trading at an average premium/(discount) to NAV during the current reporting period, as follows:
| NUV | NUW | NMI | NEV |
Common share NAV | $10.71 | $17.45 | $11.36 | $15.78 |
Common share price | $11.27 | $16.75 | $11.56 | $17.23 |
Premium/(Discount) to NAV | 5.23% | (4.01)% | 1.76% | 9.19% |
Average premium/(discount) to NAV | 3.98% | (5.00)% | 0.64% | 2.77% |
11
| | |
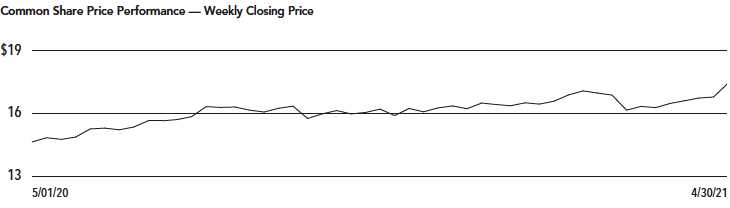
| Nuveen Municipal Value Fund, Inc. |
| Performance Overview and Holding Summaries as of April 30, 2021 |
| | | | | |
Refer to the Glossary of Terms Used in this Report for further definition of the terms used within this section. | | |
| Average Annual Total Returns as of April 30, 2021 | | | | |
|
| Cumulative
| Average Annual |
| 6-Month | 1-Year | 5-Year | 10-Year |
NUV at Common Share NAV | 3.98% | 10.59% | 4.20% | 5.78% |
NUV at Common Share Price | 6.07% | 21.59% | 5.28% | 6.57% |
S&P Municipal Bond Index | 2.42% | 7.40% | 3.46% | 4.51% |
Past performance is not predictive of future results. Current performance may be higher or lower than the data shown. Returns do not reflect the deduction of taxes that shareholders may have to pay on Fund distributions or upon the sale of Fund shares. Returns at NAV are net of Fund expenses, and assume reinvestment of distributions. Comparative index return information is provided for the Fund’s shares at NAV only. Indexes are not available for direct investment.
12
This data relates to the securities held in the Fund’s portfolio of investments as of the end of the reporting period. It should not be construed as a measure of performance for the Fund itself. Holdings are subject to change.
For financial reporting purposes, the ratings disclosed are the highest rating given by one of the following national rating agencies: Standard & Poor’s Group, Moody’s Investors Service, Inc. or Fitch, Inc. This treatment of split-rated securities may differ from that used for other purposes, such as for Fund investment policies. Credit ratings are subject to change. AAA, AA, A and BBB are investment grade ratings; BB, B, CCC, CC, C and D are below-investment grade ratings. Holdings designated N/R are not rated by these national rating agencies.
| Fund Allocation | |
| (% of net assets) | |
Long-Term Municipal Bonds | 100.0% |
Other Assets Less Liabilities | 1.3% |
| Net Assets Plus Floating Rate | |
| Obligations | |
Floating Rate Obligations | (1.3)% |
| Net Assets | 100% |
| Portfolio Credit Quality | |
| (% of total investment exposure) | |
U.S. Guaranteed | 10.7% |
AAA | 5.9% |
AA | 31.8% |
A | 24.7% |
BBB | 19.2% |
BB or Lower | 2.5% |
N/R (not rated) | 5.2% |
| Total | 100% |
| Portfolio Composition | |
| (% of total investments) | |
Tax Obligation/Limited | 26.2% |
Transportation | 21.3% |
Tax Obligation/General | 13.0% |
Utilities | 11.9% |
U.S. Guaranteed | 11.1% |
Health Care | 8.3% |
Other | 8.2% |
| Total | 100% |
| States and Territories | |
| (% of total municipal bonds) | |
Texas | 15.1% |
Illinois | 12.2% |
California | 8.4% |
Colorado | 7.2% |
New York | 6.7% |
New Jersey | 4.7% |
Ohio | 3.7% |
Florida | 3.7% |
Washington | 3.2% |
Nevada | 2.8% |
Michigan | 2.8% |
Georgia | 2.3% |
District of Columbia | 2.2% |
South Carolina | 1.8% |
Kentucky | 1.8% |
Indiana | 1.8% |
Other1 | 19.6% |
| Total | 100% |
1 | See Portfolio of Investments for details on “other” States and Territories. |
13
| | |
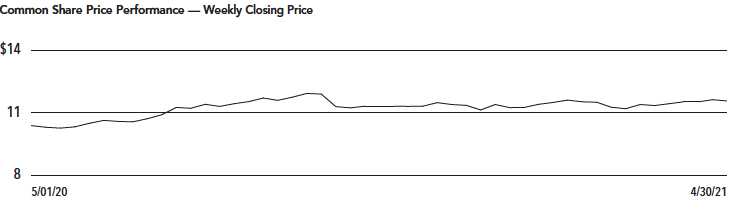
| NUW | Nuveen AMT-Free Municipal Value Fund |
| Performance Overview and Holding Summaries as of April 30, 2021 |
Refer to the Glossary of Terms Used in this Report for further definition of the terms used within this section. | | |
| Average Annual Total Returns as of April 30, 2021 | | | | |
| Cumulative | Average Annual |
| 6-Month | 1-Year | 5-Year | 10-Year |
NUW at Common Share NAV | 5.22% | 13.73% | 4.17% | 5.94% |
NUW at Common Share Price | 4.80% | 18.98% | 3.22% | 5.90% |
S&P Municipal Bond Index | 2.42% | 7.40% | 3.46% | 4.51% |
Past performance is not predictive of future results. Current performance may be higher or lower than the data shown. Returns do not reflect the deduction of taxes that shareholders may have to pay on Fund distributions or upon the sale of Fund shares. Returns at NAV are net of Fund expenses, and assume reinvestment of distributions. Comparative index return information is provided for the Fund’s shares at NAV only. Indexes are not available for direct investment.
14
This data relates to the securities held in the Fund’s portfolio of investments as of the end of the reporting period. It should not be construed as a measure of performance for the Fund itself. Holdings are subject to change.
For financial reporting purposes, the ratings disclosed are the highest rating given by one of the following national rating agencies: Standard & Poor’s Group, Moody’s Investors Service, Inc. or Fitch, Inc. This treatment of split-rated securities may differ from that used for other purposes, such as for Fund investment policies. Credit ratings are subject to change. AAA, AA, A and BBB are investment grade ratings; BB, B, CCC, CC, C and D are below-investment grade ratings. Holdings designated N/R are not rated by these national rating agencies.
| Fund Allocation | |
| (% of net assets) | |
Long-Term Municipal Bonds | 99.3% |
Common Stocks | 0.1% |
Short-Term Municipal Bonds | 0.1% |
Other Assets Less Liabilities | 1.5% |
| Net Assets Plus Floating Rate | |
| Obligations | 101.0% |
Floating Rate Obligations | (1.0)% |
| Net Assets | 100% |
| Portfolio Credit Quality | |
| (% of total investment exposure) | |
U.S. Guaranteed | 2.5% |
AAA | 7.5% |
AA | 35.0% |
A | 25.1% |
BBB | 21.3% |
BB or Lower | 2.3% |
N/R (not rated) | 6.2% |
N/A (not applicable) | 0.1% |
| Total | 100% |
| Portfolio Composition | |
| (% of total investments) | |
Tax Obligation/Limited | 23.9% |
Utilities | 19.9% |
Tax Obligation/General | 15.7% |
Transportation | 13.8% |
Health Care | 10.5% |
Education and Civic Organizations | 5.1% |
Other | 11.1% |
| Total | 100% |
| States and Territories | |
| (% of total municipal bonds) | |
California | 12.4% |
Texas | 10.4% |
New Jersey | 8.8% |
Illinois | 8.2% |
New York | 6.0% |
Colorado | 5.4% |
Pennsylvania | 5.4% |
Nevada | 5.4% |
Washington | 4.4% |
Florida | 3.9% |
Kentucky | 3.5% |
Maryland | 3.1% |
Georgia | 2.9% |
Puerto Rico | 2.8% |
Other1 | 17.4% |
| Total | 100% |
1 | See Portfolio of Investments for details on “other” States and Territories. |
15
| NMI | Nuveen Municipal Income Fund, Inc. |
| Performance Overview and Holding Summaries as of April 30, 2021 |
Refer to the Glossary of Terms Used in this Report for further definition of the terms used within this section. | | |
| Average Annual Total Returns as of April 30, 2021 | | | | |
| Cumulative | Average Annual |
| 6-Month | 1-Year | 5-Year | 10-Year |
NMI at Common Share NAV | 4.34% | 11.55% | 3.61% | 5.70% |
NMI at Common Share Price | 4.01% | 16.73% | 2.94% | 6.33% |
S&P Municipal Bond Index | 2.42% | 7.40% | 3.46% | 4.51% |
Past performance is not predictive of future results. Current performance may be higher or lower than the data shown. Returns do not reflect the deduction of taxes that shareholders may have to pay on Fund distributions or upon the sale of Fund shares. Returns at NAV are net of Fund expenses, and assume reinvestment of distributions. Comparative index return information is provided for the Fund’s shares at NAV only. Indexes are not available for direct investment.
16
This data relates to the securities held in the Fund’s portfolio of investments as of the end of the reporting period. It should not be construed as a measure of performance for the Fund itself. Holdings are subject to change.
For financial reporting purposes, the ratings disclosed are the highest rating given by one of the following national rating agencies: Standard & Poor’s Group, Moody’s Investors Service, Inc. or Fitch, Inc. This treatment of split-rated securities may differ from that used for other purposes, such as for Fund investment policies. Credit ratings are subject to change. AAA, AA, A and BBB are investment grade ratings; BB, B, CCC, CC, C and D are below-investment grade ratings. Holdings designated N/R are not rated by these national rating agencies.
| Fund Allocation | |
| (% of net assets) | |
Long-Term Municipal Bonds | 97.6% |
Other Assets Less Liabilities | 2.4% |
| Net Assets | 100% |
| Portfolio Credit Quality | |
| (% of total investment exposure) | |
U.S. Guaranteed | 10.5% |
AAA | 0.5% |
AA | 20.3% |
A | 35.4% |
BBB | 20.5% |
BB or Lower | 4.5% |
N/R (not rated) | 8.3% |
| Total | 100% |
| Portfolio Composition | |
| (% of total investments) | |
Health Care | 24.0% |
Tax Obligation/General | 15.3% |
Tax Obligation/Limited | 14.4% |
Transportation | 12.4% |
U.S. Guaranteed | 10.5% |
Education and Civic Organizations | 9.4% |
Utilities | 5.7% |
Other | 8.3% |
| Total | 100% |
| States and Territories | |
| (% of total municipal bonds) | |
California | 14.8% |
Illinois | 11.0% |
Colorado | 10.4% |
Texas | 5.3% |
Florida | 5.2% |
Wisconsin | 4.6% |
Missouri | 3.8% |
Michigan | 3.5% |
Ohio | 3.5% |
New Jersey | 3.0% |
Indiana | 3.0% |
Georgia | 2.8% |
Pennsylvania | 2.7% |
Louisiana | 2.4% |
Arizona | 2.4% |
North Carolina | 2.4% |
Other1 | 19.2% |
| Total | 100% |
1 | See Portfolio of Investments for details on “other” States and Territories. |
17
| | |
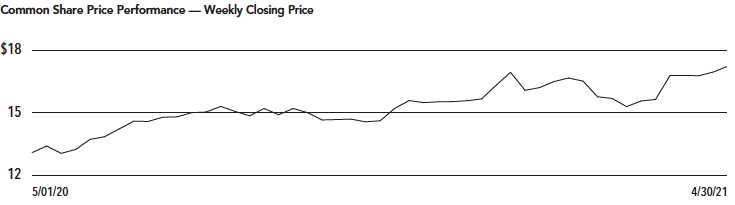
| NEV | Nuveen Enhanced Municipal Value Fund |
| Performance Overview and Holding Summaries as of April 30, 2021 |
Refer to the Glossary of Terms Used in this Report for further definition of the terms used within this section. | | |
| Average Annual Total Returns as of April 30, 2021 | | | | |
| Cumulative | Average Annual |
| 6-Month | 1-Year | 5-Year | 10-Year |
NEV at Common Share NAV | 8.95% | 20.51% | 5.37% | 8.03% |
NEV at Common Share Price | 22.47% | 42.43% | 7.10% | 9.63% |
S&P Municipal Bond Index | 2.42% | 7.40% | 3.46% | 4.51% |
Past performance is not predictive of future results. Current performance may be higher or lower than the data shown. Returns do not reflect the deduction of taxes that shareholders may have to pay on Fund distributions or upon the sale of Fund shares. Returns at NAV are net of Fund expenses, and assume reinvestment of distributions. Comparative index return information is provided for the Fund’s shares at NAV only. Indexes are not available for direct investment.
18
This data relates to the securities held in the Fund’s portfolio of investments as of the end of the reporting period. It should not be construed as a measure of performance for the Fund itself. Holdings are subject to change.
For financial reporting purposes, the ratings disclosed are the highest rating given by one of the following national rating agencies: Standard & Poor’s Group, Moody’s Investors Service, Inc. or Fitch, Inc. This treatment of split-rated securities may differ from that used for other purposes, such as for Fund investment policies. Credit ratings are subject to change. AAA, AA, A and BBB are investment grade ratings; BB, B, CCC, CC, C and D are below-investment grade ratings. Holdings designated N/R are not rated by these national rating agencies.
| Fund Allocation | |
| (% of net assets) | |
Long-Term Municipal Bonds | 129.6% |
Common Stocks | 1.9% |
Other Assets Less Liabilities | 2.1% |
| Net Assets Plus Floating Rate | |
| Obligations | 133.6% |
Floating Rate Obligations | (33.6)% |
| Net Assets | 100% |
| Portfolio Credit Quality | |
| (% of total investment exposure) | |
U.S. Guaranteed | 8.5% |
AAA | 1.2% |
AA | 23.8% |
A | 15.8% |
BBB | 30.8% |
BB or Lower | 9.2% |
N/R (not rated) | 9.4% |
N/A (not applicable) | 1.3% |
| Total | 100% |
| Portfolio Composition | |
| (% of total investments) | |
Tax Obligation/Limited | 24.8% |
Health Care | 19.2% |
Transportation | 16.3% |
Tax Obligation/General | 12.4% |
Utilities | 6.8% |
Education and Civic Organizations | 6.3% |
Other | 14.2% |
| Total | 100% |
| States and Territories | |
| (% of total municipal bonds) | |
Illinois | 15.0% |
New Jersey | 10.8% |
California | 7.8% |
Florida | 7.7% |
New York | 7.5% |
Wisconsin | 6.6% |
Pennsylvania | 5.6% |
Ohio | 5.3% |
Louisiana | 4.8% |
Guam | 4.4% |
Texas | 2.6% |
Puerto Rico | 2.5% |
Other1 | 19.4% |
| Total | 100% |
1 | See Portfolio of Investments for details on “other” States and Territories. |
19
| Nuveen Municipal Value Fund, Inc. Portfolio of Investments April 30, 2021 (Unaudited) |
| | | | | |
| Principal | | Optional Call | | |
| Amount (000) | Description (1) | Provisions (2) | Ratings (3) | Value |
| LONG-TERM INVESTMENTS – 100.0% | | | |
| MUNICIPAL BONDS – 100.0% | | | |
| Alabama – 0.2% | | | |
| Birmingham Airport Authority, Alabama, Airport Revenue Bonds, Series 2020: | | | |
| $ 255 | 4.000%, 7/01/39 – BAM Insured | 7/30 at 100.00 | AA | $ 302,739 |
| 225 | 4.000%, 7/01/40 – BAM Insured | 7/30 at 100.00 | AA | 266,557 |
| 3,805 | Homewood, Alabama, General Obligation Warrants, Series 2016, 5.000%, 9/01/36 | 9/26 at 100.00 | AA+ | 4,611,622 |
| 4,285 | Total Alabama | | | 5,180,918 |
| Alaska – 0.1% | | | |
| 2,710 | Northern Tobacco Securitization Corporation, Alaska, Tobacco Settlement Asset-Backed | 5/21 at 100.00 | B3 | 2,753,983 |
| Bonds, Series 2006A, 5.000%, 6/01/32 | | | |
| Arizona – 1.0% | | | |
| 7,525 | Chandler Industrial Development Authority, Arizona, Industrial Development Revenue | 6/24 at 100.00 | A+ | 8,553,968 |
| Bonds, Intel Corporation Project, Series 2019, 5.000%, 6/01/49 (Mandatory Put 6/03/24) (AMT) | | | |
| 2,935 | Phoenix Civic Improvement Corporation, Arizona, Airport Revenue Bonds, Senior Lien | 7/27 at 100.00 | Aa3 | 3,571,132 |
| Series 2017A, 5.000%, 7/01/35 | | | |
| 780 | Phoenix Civic Improvement Corporation, Arizona, Excise Tax Revenue Bonds, Subordinate | 7/30 at 100.00 | AAA | 936,499 |
| Lien Series 2020A, 4.000%, 7/01/45 | | | |
| 5,600 | Salt Verde Financial Corporation, Arizona, Senior Gas Revenue Bonds, Citigroup Energy | No Opt. Call | A3 | 7,880,768 |
| Inc Prepay Contract Obligations, Series 2007, 5.000%, 12/01/37 | | | |
| Tucson, Arizona, Water System Revenue Bonds, Refunding Series 2017: | | | |
| 1,000 | 5.000%, 7/01/34 | 7/27 at 100.00 | AA | 1,221,960 |
| 750 | 5.000%, 7/01/35 | 7/27 at 100.00 | AA | 915,038 |
| 18,590 | Total Arizona | | | 23,079,365 |
| California – 8.4% | | | |
| 4,615 | Anaheim Public Financing Authority, California, Lease Revenue Bonds, Public Improvement | No Opt. Call | AA | 4,560,266 |
| Project, Series 1997C, 0.000%, 9/01/23 – AGM Insured | | | |
| 5,000 | Bay Area Toll Authority, California, Revenue Bonds, San Francisco Bay Area Toll Bridge, | 4/23 at 100.00 | A1 (4) | 5,467,950 |
| Series 2013S-4, 5.000%, 4/01/38 (Pre-refunded 4/01/23) | | | |
| 405 | California County Tobacco Securitization Agency, Tobacco Settlement Asset-Backed Bonds, | 6/30 at 100.00 | BBB+ | 469,723 |
| Los Angeles County Securitization Corporation, Series 2020A, 4.000%, 6/01/49 | | | |
| 1,250 | California County Tobacco Securitization Agency, Tobacco Settlement Asset-Backed Bonds, | 12/30 at 100.00 | BBB+ | 1,450,962 |
| Sonoma County Tobacco Securitization Corporation, Series 2020A, 4.000%, 6/01/49 | | | |
| 1,175 | California Department of Water Resources, Central Valley Project Water System Revenue | 12/26 at 100.00 | AAA | 1,447,471 |
| Bonds, Refunding Series 2016AW, 5.000%, 12/01/33 | | | |
| California Health Facilities Financing Authority, California, Revenue Bonds, Sutter | | | |
| Health, Refunding Series 2016B: | | | |
| 4,080 | 5.000%, 11/15/46 (Pre-refunded 11/15/26) | 11/26 at 100.00 | N/R (4) | 5,067,646 |
| 5,920 | 5.000%, 11/15/46 | 11/26 at 100.00 | A1 | 7,105,776 |
| 1,200 | California Health Facilities Financing Authority, Revenue Bonds, Children’s Hospital Los | 8/27 at 100.00 | BBB+ | 1,426,152 |
| Angeles, Series 2017A, 5.000%, 8/15/37 | | | |
| 3,850 | California Health Facilities Financing Authority, Revenue Bonds, Saint Joseph Health | 7/23 at 100.00 | AA– | 4,243,354 |
| System, Series 2013A, 5.000%, 7/01/33 | | | |
| 6,130 | California Municipal Finance Authority, Revenue Bonds, Linxs APM Project, Senior Lien | 6/28 at 100.00 | BBB– | 7,410,557 |
| Series 2018A, 5.000%, 12/31/43 (AMT) | | | |
| 2,725 | California Pollution Control Financing Authority, Water Furnishing Revenue Bonds, San | 1/29 at 100.00 | BBB | 3,251,497 |
| Diego County Water Authority Desalination Project Pipeline, Refunding Series 2019, | | | |
| 5.000%, 11/21/45, 144A | | | |
20
| Principal | | Optional Call | | |
| Amount (000) | Description (1) | Provisions (2) | Ratings (3) | Value |
| California (continued) | | | |
| $ 1,625 | California State Public Works Board, Lease Revenue Bonds, Various Capital Projects, | 11/23 at 100.00 | Aa3 | $ 1,807,666 |
| Series 2013I, 5.000%, 11/01/38 | | | |
| 5,000 | California State, General Obligation Bonds, Various Purpose Series 2011, 5.000%, 10/01/41 | 10/21 at 100.00 | Aa2 | 5,097,250 |
| 3,500 | California Statewide Communities Development Authority, California, Revenue Bonds, Loma | 6/26 at 100.00 | BB | 3,926,650 |
| Linda University Medical Center, Series 2016A, 5.000%, 12/01/46, 144A | | | |
| 4,505 | Covina-Valley Unified School District, Los Angeles County, California, General | No Opt. Call | A+ | 4,071,529 |
| Obligation Bonds, Series 2003B, 0.000%, 6/01/28 – FGIC Insured | | | |
| 5,700 | East Bay Municipal Utility District, Alameda and Contra Costa Counties, California, | 6/27 at 100.00 | AAA | 7,066,689 |
| Water System Revenue Bonds, Green Series 2017A, 5.000%, 6/01/45 | | | |
| 2,180 | Foothill/Eastern Transportation Corridor Agency, California, Toll Road Revenue Bonds, | 1/31 at 100.00 | A– | 2,616,414 |
| Refunding Series 2013A, 0.000%, 1/15/42 (5) | | | |
| 30,000 | Foothill/Eastern Transportation Corridor Agency, California, Toll Road Revenue Bonds, | No Opt. Call | AA+ (4) | 29,972,100 |
| Series 1995A, 0.000%, 1/01/22 (ETM) | | | |
| 13,920 | Golden State Tobacco Securitization Corporation, California, Tobacco Settlement | 6/22 at 100.00 | N/R | 14,382,840 |
| Asset-Backed Bonds, Series 2018A-1, 5.000%, 6/01/47 | | | |
| Merced Union High School District, Merced County, California, General Obligation Bonds, | | | |
| Series 1999A: | | | |
| 2,500 | 0.000%, 8/01/23 – FGIC Insured | No Opt. Call | AA– | 2,474,550 |
| 2,555 | 0.000%, 8/01/24 – FGIC Insured | No Opt. Call | AA– | 2,503,491 |
| 2,365 | Montebello Unified School District, Los Angeles County, California, General Obligation | No Opt. Call | A– | 2,177,266 |
| Bonds, Election 1998 Series 2004, 0.000%, 8/01/27 – FGIC Insured | | | |
| Mount San Antonio Community College District, Los Angeles County, California, General | | | |
| Obligation Bonds, Election of 2008, Series 2013A: | | | |
| 3,060 | 0.000%, 8/01/28 (5) | 2/28 at 100.00 | Aa1 | 3,610,066 |
| 2,315 | 0.000%, 8/01/43 (5) | 8/35 at 100.00 | Aa1 | 2,607,176 |
| 3,550 | M-S-R Energy Authority, California, Gas Revenue Bonds, Citigroup Prepay Contracts, | No Opt. Call | A | 5,818,911 |
| Series 2009C, 6.500%, 11/01/39 | | | |
| 80 | Palomar Pomerado Health, California, General Obligation Bonds, Series 2009A, 7.000%, | 8/29 at 100.00 | AA | 114,024 |
| 8/01/38 – AGC Insured | | | |
| 10,150 | Placer Union High School District, Placer County, California, General Obligation Bonds, | No Opt. Call | AA | 7,911,113 |
| Series 2004C, 0.000%, 8/01/33 – AGM Insured | | | |
| San Bruno Park School District, San Mateo County, California, General Obligation Bonds, | | | |
| Series 2000B: | | | |
| 2,575 | 0.000%, 8/01/24 – FGIC Insured | No Opt. Call | Aa2 | 2,512,505 |
| 2,660 | 0.000%, 8/01/25 – FGIC Insured | No Opt. Call | Aa2 | 2,556,340 |
| 415 | San Diego Tobacco Settlement Revenue Funding Corporation, California, Tobacco Settlement | 6/28 at 100.00 | BBB | 455,695 |
| Bonds, Subordinate Series 2018C, 4.000%, 6/01/32 | | | |
| 10,000 | San Francisco Airports Commission, California, Revenue Bonds, San Francisco | 5/29 at 100.00 | A1 | 12,616,700 |
| International Airport, Refunding Second Series 2019D, 5.000%, 5/01/39 | | | |
| 12,095 | San Joaquin Hills Transportation Corridor Agency, Orange County, California, Toll Road | No Opt. Call | Baa2 | 11,565,118 |
| Revenue Bonds, Refunding Series 1997A, 0.000%, 1/15/25 – NPFG Insured | | | |
| 13,220 | San Mateo County Community College District, California, General Obligation Bonds, | No Opt. Call | AAA | 12,229,029 |
| Series 2006A, 0.000%, 9/01/28 – NPFG Insured | | | |
| 5,000 | San Mateo Union High School District, San Mateo County, California, General Obligation | No Opt. Call | Aaa | 4,929,200 |
| Bonds, Election of 2000, Series 2002B, 0.000%, 9/01/24 – FGIC Insured | | | |
| 5,815 | San Ysidro School District, San Diego County, California, General Obligation Bonds, | 8/25 at 29.16 | AA | 1,580,401 |
| Refunding Series 2015, 0.000%, 8/01/48 | | | |
| 755 | Tobacco Securitization Authority of Northern California, Tobacco Settlement Asset-Backed | 12/30 at 100.00 | BBB– | 860,134 |
| Bonds, Refunding Sacramento County Tobacco Securitization Corporation Series 2021B Class 2, | | | |
| 4.000%, 6/01/49 | | | |
| 181,890 | Total California | | | 187,364,211 |
21
| | |
| NUV | Nuveen Municipal Value Fund, Inc. Portfolio of Investments (continued) April 30, 2021 (Unaudited) |
| | | | | |
| Principal | | Optional Call | | |
| Amount (000) | Description (1) | Provisions (2) | Ratings (3) | Value |
| Colorado – 7.2% | | | |
| $ 7,500 | Arapahoe County School District 6, Littleton, Colorado, General Obligation Bonds, Series | 12/28 at 100.00 | Aa1 | $ 9,882,675 |
| 2019A, 5.500%, 12/01/43 | | | |
| 7,105 | Colorado Health Facilities Authority, Colorado, Revenue Bonds, Catholic Health | 1/23 at 100.00 | BBB+ (4) | 7,698,694 |
| Initiatives, Series 2013A, 5.250%, 1/01/45 (Pre-refunded 1/01/23) | | | |
| 4,155 | Colorado Health Facilities Authority, Colorado, Revenue Bonds, CommonSpirit Health, | 8/29 at 100.00 | BBB+ | 4,707,283 |
| Series 2019A-1, 4.000%, 8/01/44 | | | |
| 1,255 | Colorado High Performance Transportation Enterprise, C-470 Express Lanes Revenue Bonds, | 12/24 at 100.00 | BBB | 1,440,087 |
| Senior Lien Series 2017, 5.000%, 12/31/51 | | | |
| 2,000 | Colorado State Board of Governors, Colorado State University Auxiliary Enterprise System | 3/22 at 100.00 | AA (4) | 2,081,120 |
| Revenue Bonds, Series 2012A, 5.000%, 3/01/41 (Pre-refunded 3/01/22) | | | |
| 4,500 | Colorado State, Building Excellent Schools Today, Certificates of Participation, Series | 3/28 at 100.00 | Aa2 | 5,541,525 |
| 2018N, 5.000%, 3/15/37 | | | |
| Colorado State, Certificates of Participation, Lease Purchase Financing Program, | | | |
| National Western Center, Series 2018A: | | | |
| 1,250 | 5.000%, 9/01/30 | 3/28 at 100.00 | Aa2 | 1,574,263 |
| 2,000 | 5.000%, 9/01/31 | 3/28 at 100.00 | Aa2 | 2,509,600 |
| 1,260 | 5.000%, 9/01/32 | 3/28 at 100.00 | Aa2 | 1,576,449 |
| 620 | 5.000%, 9/01/33 | 3/28 at 100.00 | Aa2 | 773,481 |
| 3,790 | Colorado State, Certificates of Participation, Rural Series 2018A, 5.000%, 12/15/37 | 12/28 at 100.00 | Aa2 | 4,780,441 |
| Denver City and County, Colorado, Airport System Revenue Bonds, Series 2012B: | | | |
| 2,750 | 5.000%, 11/15/25 | 11/22 at 100.00 | AA– | 2,948,990 |
| 2,200 | 5.000%, 11/15/29 (Pre-refunded 11/15/22) | 11/22 at 100.00 | AA– (4) | 2,363,042 |
| 5,160 | Denver City and County, Colorado, Airport System Revenue Bonds, Subordinate Lien Series | 11/23 at 100.00 | A+ | 5,686,630 |
| 2013B, 5.000%, 11/15/43 | | | |
| 2,000 | Denver Convention Center Hotel Authority, Colorado, Revenue Bonds, Convention Center | 12/26 at 100.00 | Baa2 | 2,322,980 |
| Hotel, Refunding Senior Lien Series 2016, 5.000%, 12/01/35 | | | |
| E-470 Public Highway Authority, Colorado, Senior Revenue Bonds, Series 2000B: | | | |
| 9,660 | 0.000%, 9/01/29 – NPFG Insured | No Opt. Call | A | 8,508,914 |
| 24,200 | 0.000%, 9/01/31 – NPFG Insured | No Opt. Call | A | 20,127,866 |
| 17,000 | 0.000%, 9/01/32 – NPFG Insured | No Opt. Call | A | 13,766,770 |
| 1,705 | E-470 Public Highway Authority, Colorado, Senior Revenue Bonds, Series 2020A, | 9/24 at 100.00 | A | 1,912,038 |
| 5.000%, 9/01/40 | | | |
| 7,600 | E-470 Public Highway Authority, Colorado, Toll Revenue Bonds, Refunding Series 2006B, | 9/26 at 52.09 | A | 3,620,716 |
| 0.000%, 9/01/39 – NPFG Insured | | | |
| Higher Education, Lease Purchase Financing Program Certificates of Participation, Series 2020: | | | |
| 900 | 4.000%, 9/01/38 | 9/31 at 100.00 | Aa2 | 1,104,003 |
| 4,475 | 4.000%, 9/01/40 | 9/31 at 100.00 | Aa2 | 5,455,875 |
| 2,750 | 4.000%, 9/01/41 | 9/31 at 100.00 | Aa2 | 3,342,377 |
| 8,000 | Public Authority for Colorado Energy, Natural Gas Purchase Revenue Bonds, Colorado | No Opt. Call | A+ | 12,406,480 |
| Springs Utilities, Series 2008, 6.500%, 11/15/38 | | | |
| 5,000 | Rangely Hospital District, Rio Blanco County, Colorado, General Obligation Bonds, | 11/21 at 100.00 | Baa3 | 5,082,600 |
| Refunding Series 2011, 6.000%, 11/01/26 | | | |
| 1,400 | Regional Transportation District, Colorado, Private Activity Bonds, Denver Transit | 1/31 at 100.00 | A– | 1,684,578 |
| Partners Eagle P3 Project, Series 2020A, 4.000%, 7/15/34 | | | |
| 12,500 | Regional Transportation District, Colorado, Sales Tax Revenue Bonds, Fastracks Project, | 5/31 at 100.00 | AA+ | 15,241,125 |
| Refunding Green Series 2021B, 4.000%, 11/01/40 | | | |
| 4,945 | Regional Transportation District, Colorado, Sales Tax Revenue Bonds, Fastracks Project, | 11/26 at 100.00 | AA+ | 5,895,775 |
| Series 2017A, 5.000%, 11/01/40 | | | |
| 4,250 | University of Colorado, Enterprise System Revenue Bonds, Series 2018B, 5.000%, 6/01/43 | 6/28 at 100.00 | Aa1 | 5,261,117 |
| 151,930 | Total Colorado | | | 159,297,494 |
22
| | | | | |
| Principal | | Optional Call | | |
| Amount (000) | Description (1) | Provisions (2) | Ratings (3) | Value |
| Connecticut – 0.8% | | | |
| $ 1,500 | Connecticut Health and Educational Facilities Authority, Revenue Bonds, Hartford | 7/21 at 100.00 | A+ (4) | $ 1,511,670 |
| HealthCare, Series 2011A, 5.000%, 7/01/41 (Pre-refunded 7/01/21) | | | |
| 8,440 | Connecticut State, General Obligation Bonds, Series 2015E, 5.000%, 8/01/29 | 8/25 at 100.00 | Aa3 | 9,938,522 |
| 5,000 | Connecticut State, General Obligation Bonds, Series 2015F, 5.000%, 11/15/33 | 11/25 at 100.00 | Aa3 | 5,903,350 |
| 10,153 | Mashantucket Western Pequot Tribe, Connecticut, Special Revenue Bonds, Subordinate | No Opt. Call | N/R | 863,030 |
| Series 2013A, 6.050%, 7/01/31 (cash 4.000%, PIK 2.050%) (6) | | | |
| 25,093 | Total Connecticut | | | 18,216,572 |
| District of Columbia – 2.2% | | | |
| 15,000 | District of Columbia Tobacco Settlement Corporation, Tobacco Settlement Asset-Backed | 6/21 at 21.42 | N/R | 3,197,850 |
| Bonds, Series 2006A, 0.000%, 6/15/46 | | | |
| 5,390 | District of Columbia Water and Sewer Authority, Public Utility Revenue Bonds, Senior | 4/28 at 100.00 | AAA | 6,679,558 |
| Lien Series 2018B, 5.000%, 10/01/43 | | | |
| 3,865 | Metropolitan Washington Airports Authority, Virginia, Dulles Toll Road Revenue Bonds, | 10/29 at 100.00 | A– | 4,757,622 |
| Dulles Metrorail & Capital improvement Projects, Refunding & Subordinate Lien Series 2019B, | | | |
| 5.000%, 10/01/47 | | | |
| 14,110 | Metropolitan Washington Airports Authority, Virginia, Dulles Toll Road Revenue Bonds, | 4/22 at 100.00 | A– | 14,632,634 |
| Dulles Metrorail & Capital Improvement Projects, Refunding Second Senior Lien Series 2014A, | | | |
| 5.000%, 10/01/53 | | | |
| 10,000 | Metropolitan Washington Airports Authority, Virginia, Dulles Toll Road Revenue Bonds, | 10/28 at 100.00 | A– | 13,409,400 |
| Dulles Metrorail Capital Appreciation, Second Senior Lien Series 2010B, 6.500%, 10/01/44 | | | |
| Washington Convention and Sports Authority, Washington DC, Dedicated Tax Revenue Bonds, | | | |
| Refunding Senior Lien Series 2021A: | | | |
| 670 | 4.000%, 10/01/36 (WI/DD, Settling 5/27/21) | 10/30 at 100.00 | AA | 800,328 |
| 1,000 | 4.000%, 10/01/37 (WI/DD, Settling 5/27/21) | 10/30 at 100.00 | AA | 1,191,660 |
| 1,300 | 4.000%, 10/01/40 (WI/DD, Settling 5/27/21) | 10/30 at 100.00 | AA | 1,534,936 |
| 2,390 | Washington Metropolitan Area Transit Authority, District of Columbia, Dedicated Revenue | 7/30 at 100.00 | AA | 2,826,486 |
| Bonds, Series 2020A, 4.000%, 7/15/45 | | | |
| 53,725 | Total District of Columbia | | | 49,030,474 |
| Florida – 3.7% | | | |
| 1,240 | Broward County, Florida, Half-Cent Sales Tax Revenue Bonds, Refunding Series 2020, | 10/30 at 100.00 | AA+ | 1,502,372 |
| 4.000%, 10/01/40 | | | |
| 3,000 | Cape Coral, Florida, Water and Sewer Revenue Bonds, Refunding Series 2011, 5.000%, | 10/21 at 100.00 | AA (4) | 3,059,610 |
| 10/01/41 – AGM Insured (Pre-refunded 10/01/21) | | | |
| 565 | Florida Development Finance Corporation, Educational Facilities Revenue Bonds, | 6/25 at 100.00 | N/R | 643,015 |
| Renaissance Charter School Income Projects, Series 2015A, 6.000%, 6/15/35, 144A | | | |
| 4,000 | Gainesville, Florida, Utilities System Revenue Bonds, Series 2017A, 5.000%, 10/01/37 | 10/27 at 100.00 | AA– | 4,955,440 |
| 3,500 | Gainesville, Florida, Utilities System Revenue Bonds, Series 2019A, 5.000%, 10/01/44 | 10/29 at 100.00 | AA– | 4,416,685 |
| 2,290 | Hillsborough County Aviation Authority, Florida, Revenue Bonds, Tampa International | 10/24 at 100.00 | A1 | 2,612,752 |
| Airport, Subordinate Lien Series 2015B, 5.000%, 10/01/40 | | | |
| 5,090 | Miami-Dade County Expressway Authority, Florida, Toll System Revenue Bonds, Series | 6/21 at 100.00 | A | 5,104,354 |
| 2010A, 5.000%, 7/01/40 | | | |
| 9,500 | Miami-Dade County Health Facility Authority, Florida, Hospital Revenue Bonds, Miami | 8/21 at 100.00 | A (4) | 9,633,000 |
| Children’s Hospital, Series 2010A, 6.000%, 8/01/46 (Pre-refunded 8/01/21) | | | |
| 2,000 | Miami-Dade County, Florida, Aviation Revenue Bonds, Miami International Airport, | 10/24 at 100.00 | A2 | 2,285,520 |
| Refunding Series 2014B, 5.000%, 10/01/37 | | | |
| 4,000 | Miami-Dade County, Florida, Transit System Sales Surtax Revenue Bonds, Refunding Series | 7/22 at 100.00 | AA (4) | 4,226,840 |
| 2012, 5.000%, 7/01/42 (Pre-refunded 7/01/22) | | | |
| Orlando Utilities Commission, Florida, Utility System Revenue Bonds, Series 2018A: | | | |
| 3,500 | 5.000%, 10/01/36 | 10/27 at 100.00 | AA | 4,350,710 |
| 3,780 | 5.000%, 10/01/37 | 10/27 at 100.00 | AA | 4,696,121 |
| 1,120 | 5.000%, 10/01/38 | 10/27 at 100.00 | AA | 1,390,234 |
23
| | |
| NUV | Nuveen Municipal Value Fund, Inc. Portfolio of Investments (continued) April 30, 2021 (Unaudited) |
| | | | | |
| Principal | | Optional Call | | |
| Amount (000) | Description (1) | Provisions (2) | Ratings (3) | Value |
| Florida (continued) | | | |
| $ 10,725 | Orlando, Florida, Contract Tourist Development Tax Payments Revenue Bonds, Series 2014A, | 5/24 at 100.00 | Aa2 (4) | $ 12,256,208 |
| 5.000%, 11/01/44 (Pre-refunded 5/01/24) | | | |
| 3,250 | Palm Beach County Health Facilities Authority, Florida, Revenue Bonds, Jupiter Medical | 11/22 at 100.00 | BBB+ | 3,382,697 |
| Center, Series 2013A, 5.000%, 11/01/43 | | | |
| 4,000 | Pembroke Pines, Florida, Capital Improvement Revenue Bonds, Series 2019A, 4.000%, 7/01/38 | 7/29 at 100.00 | AA | 4,683,880 |
| 1,020 | Putnam County Development Authority, Florida, Pollution Control Revenue Bonds, Seminole | 5/28 at 100.00 | A– | 1,233,211 |
| Electric Cooperative, Inc Project, Refunding Series 2018B, 5.000%, 3/15/42 | | | |
| 6,865 | South Broward Hospital District, Florida, Hospital Revenue Bonds, Refunding Series 2015, | 5/25 at 100.00 | AA | 7,502,346 |
| 4.000%, 5/01/34 | | | |
| 3,300 | Tampa, Florida, Health System Revenue Bonds, Baycare Health System, Series 2012A, | 5/22 at 100.00 | Aa2 | 3,451,338 |
| 5.000%, 11/15/33 | | | |
| 72,745 | Total Florida | | | 81,386,333 |
| Georgia – 2.3% | | | |
| 3,325 | Atlanta, Georgia, Water and Wastewater Revenue Bonds, Refunding Series 2015, | 5/25 at 100.00 | Aa2 | 3,876,152 |
| 5.000%, 11/01/40 | | | |
| 4,945 | Burke County Development Authority, Georgia, Pollution Control Revenue Bonds, Georgia | No Opt. Call | A– | 5,132,861 |
| Power Company, Fourth Series 1994, 2.250%, 10/01/32 (Mandatory Put 5/25/23) | | | |
| 2,290 | Fulton County Development Authority, Georgia, Hospital Revenue Bonds, Wellstar Health | 4/27 at 100.00 | A | 2,699,498 |
| System, Inc Project, Series 2017A, 5.000%, 4/01/47 | | | |
| 6,000 | Gainesville and Hall County Hospital Authority, Georgia, Revenue Anticipation | 2/27 at 100.00 | AA | 7,249,560 |
| Certificates, Northeast Georgia Health Services Inc, Series 2017B, 5.500%, 2/15/42 | | | |
| 1,500 | Geo L Smith II Georgia World Congress Center Authority, Georgia, Convention Center Hotel | 1/31 at 100.00 | BBB– | 1,706,085 |
| Revenue Bonds, First Tier Series 2021A, 4.000%, 1/01/54 | | | |
| 5,865 | Municipal Electric Authority of Georgia, General Resolution Projects Subordinated Bonds, | 1/28 at 100.00 | A1 | 7,018,352 |
| Series 20188HH, 5.000%, 1/01/44 | | | |
| 16,145 | Municipal Electric Authority of Georgia, Plant Vogtle Units 3 & 4 Project J Bonds, | 7/28 at 100.00 | A | 19,289,077 |
| Series 2019A, 5.000%, 1/01/49 | | | |
| 2,415 | Municipal Electric Authority of Georgia, Project One Revenue Bonds, Subordinate Lien | 1/25 at 100.00 | A2 | 2,752,013 |
| Series 2015A, 5.000%, 1/01/35 | | | |
| 2,000 | Private Colleges and Universities Authority, Georgia, Revenue Bonds, Emory University, | 10/26 at 100.00 | AA | 2,421,920 |
| Refunding Series 2016A, 5.000%, 10/01/46 | | | |
| 44,485 | Total Georgia | | | 52,145,518 |
| Guam – 0.0% | | | |
| 330 | Guam International Airport Authority, Revenue Bonds, Series 2013C, 6.375%, 10/01/43 (AMT) | 10/23 at 100.00 | Baa2 | 354,724 |
| Hawaii – 0.4% | | | |
| 4,830 | Honolulu City and County, Hawaii, General Obligation Bonds, Series 2018A, 5.000%, 9/01/40 | 9/28 at 100.00 | Aa1 | 6,033,105 |
| 3,000 | Honolulu City and County, Hawaii, Wastewater System Revenue Bonds, First Bond | 1/28 at 100.00 | Aa2 | 3,704,250 |
| Resolution, Senior Series 2018A, 5.000%, 7/01/37 | | | |
| 7,830 | Total Hawaii | | | 9,737,355 |
| Idaho – 0.1% | | | |
| University of Idaho, General Revenue Bonds, Refunding Series 2021A: | | | |
| 505 | 5.000%, 4/01/39 – AGM Insured | 4/31 at 100.00 | AA | 664,519 |
| 545 | 5.000%, 4/01/41 – AGM Insured | 4/31 at 100.00 | AA | 713,612 |
| 1,050 | Total Idaho | | | 1,378,131 |
| Illinois – 12.2% | | | |
| 5,000 | Chicago Board of Education, Illinois, Dedicated Capital Improvement Tax Revenue Bonds, | 4/27 at 100.00 | A– | 6,010,350 |
| Series 2016, 6.000%, 4/01/46 | | | |
| 5,000 | Chicago Board of Education, Illinois, General Obligation Bonds, Dedicated Revenues, | 12/25 at 100.00 | BB | 6,034,000 |
| Series 2016A, 7.000%, 12/01/44 | | | |
24
| | | | | |
| Principal | | Optional Call | | |
| Amount (000) | Description (1) | Provisions (2) | Ratings (3) | Value |
| Illinois (continued) | | | |
| $ 2,945 | Chicago Board of Education, Illinois, General Obligation Bonds, Dedicated Revenues, | 12/26 at 100.00 | BB | $ 3,587,216 |
| Series 2016B, 6.500%, 12/01/46 | | | |
| 4,710 | Chicago Board of Education, Illinois, General Obligation Bonds, Dedicated Revenues, | 12/27 at 100.00 | BB | 6,040,763 |
| Series 2017A, 7.000%, 12/01/46, 144A | | | |
| 17,725 | Chicago Board of Education, Illinois, Unlimited Tax General Obligation Bonds, Dedicated | No Opt. Call | Baa2 | 17,000,756 |
| Tax Revenues, Series 1998B-1, 0.000%, 12/01/24 – FGIC Insured | | | |
| 7,495 | Chicago Board of Education, Illinois, Unlimited Tax General Obligation Bonds, Dedicated | No Opt. Call | Baa2 | 5,814,846 |
| Tax Revenues, Series 1999A, 0.000%, 12/01/31 – NPFG Insured | | | |
| 1,500 | Chicago Park District, Illinois, General Obligation Bonds, Limited Tax Series 2011A, | 1/22 at 100.00 | AA– | 1,531,785 |
| 5.000%, 1/01/36 | | | |
| 1,000 | Cook County, Illinois, General Obligation Bonds, Refunding Series 2018, 5.000%, 11/15/35 | 11/26 at 100.00 | A+ | 1,214,760 |
| 1,680 | Cook County, Illinois, General Obligation Bonds, Refunding Series 2021A, 5.000%, 11/15/33 | 11/30 at 100.00 | A+ | 2,205,706 |
| 5,000 | Cook County, Illinois, Sales Tax Revenue Bonds, Series 2012, 5.000%, 11/15/37 | 11/22 at 100.00 | AA– | 5,346,650 |
| 2,040 | Cook County, Illinois, Sales Tax Revenue Bonds, Series 2021A, 4.000%, 11/15/40 | 11/30 at 100.00 | AA– | 2,426,294 |
| 5,000 | Illinois Finance Authority, Revenue Bonds, Rush University Medical Center Obligated | 5/25 at 100.00 | AA– | 5,697,550 |
| Group, Series 2015A, 5.000%, 11/15/38 | | | |
| Illinois Finance Authority, Revenue Bonds, Silver Cross Hospital and Medical Centers, | | | |
| Refunding Series 2015C: | | | |
| 560 | 5.000%, 8/15/35 | 8/25 at 100.00 | A3 | 636,507 |
| 825 | 5.000%, 8/15/44 | 8/25 at 100.00 | A3 | 926,500 |
| 3,000 | Illinois Finance Authority, Revenue Bonds, University of Chicago, Series 2012A, | 10/21 at 100.00 | AA+ | 3,055,230 |
| 5.000%, 10/01/51 | | | |
| 5,125 | Illinois State, General Obligation Bonds, November Series 2017C, 5.000%, 11/01/29 | 11/27 at 100.00 | BBB– | 6,108,180 |
| 1,755 | Illinois State, General Obligation Bonds, October Series 2016, 5.000%, 2/01/27 | No Opt. Call | BBB– | 2,121,461 |
| 655 | Illinois State, General Obligation Bonds, Refunding Series 2012, 5.000%, 8/01/25 | 8/22 at 100.00 | BBB– | 691,012 |
| 5,590 | Illinois Toll Highway Authority, Toll Highway Revenue Bonds, Senior Lien Series 2013A, | 1/23 at 100.00 | AA– | 5,994,772 |
| 5.000%, 1/01/38 | | | |
| 4,000 | Illinois Toll Highway Authority, Toll Highway Revenue Bonds, Senior Lien Series 2016B, | 7/26 at 100.00 | AA– | 4,777,160 |
| 5.000%, 1/01/41 | | | |
| 6,005 | Illinois Toll Highway Authority, Toll Highway Revenue Bonds, Senior Lien Series 2020A, | 1/31 at 100.00 | AA– | 7,647,067 |
| 5.000%, 1/01/45 | | | |
| 5,000 | Lombard Public Facilities Corporation, Illinois, Conference Center and Hotel Revenue | 3/28 at 100.00 | N/R | 4,943,800 |
| Bonds, First Tier Series 2005A-2, 5.500%, 1/01/36, 144A (6) | | | |
| 2,875 | Metropolitan Pier and Exposition Authority, Illinois, McCormick Place Expansion Project | 12/29 at 100.00 | BBB | 3,228,596 |
| Bonds, Refunding Series 2020A, 4.000%, 6/15/50 | | | |
| 16,800 | Metropolitan Pier and Exposition Authority, Illinois, Revenue Bonds, McCormick Place | No Opt. Call | Baa2 | 16,721,880 |
| Expansion Project, Refunding Series 1996A, 0.000%, 12/15/21 – NPFG Insured | | | |
| Metropolitan Pier and Exposition Authority, Illinois, Revenue Bonds, McCormick Place | | | |
| Expansion Project, Series 1994B: | | | |
| 3,635 | 0.000%, 6/15/21 – NPFG Insured (ETM) | No Opt. Call | BBB (4) | 3,633,619 |
| 5,245 | 0.000%, 6/15/28 – NPFG Insured | No Opt. Call | BBB | 4,607,418 |
| 11,675 | 0.000%, 6/15/29 – FGIC Insured | No Opt. Call | BBB | 9,929,938 |
| Metropolitan Pier and Exposition Authority, Illinois, Revenue Bonds, McCormick Place | | | |
| Expansion Project, Series 2002A: | | | |
| 2,315 | 5.700%, 6/15/24 (Pre-refunded 6/15/22) | 6/22 at 101.00 | N/R (4) | 2,476,957 |
| 7,685 | 5.700%, 6/15/24 | 6/22 at 101.00 | BBB | 8,213,344 |
| 4,950 | 0.000%, 12/15/32 – NPFG Insured | No Opt. Call | BBB | 3,749,526 |
| 21,375 | 0.000%, 6/15/34 – NPFG Insured | No Opt. Call | BBB | 15,404,749 |
| 21,000 | 0.000%, 12/15/35 – NPFG Insured | No Opt. Call | BBB | 14,350,980 |
| 21,970 | 0.000%, 6/15/36 – NPFG Insured | No Opt. Call | BBB | 14,707,157 |
| 10,375 | 0.000%, 12/15/36 – NPFG Insured | No Opt. Call | BBB | 6,809,839 |
| 10,000 | 0.000%, 12/15/37 – NPFG Insured | No Opt. Call | BBB | 6,317,800 |
| 25,825 | 0.000%, 6/15/39 – NPFG Insured | No Opt. Call | BBB | 15,371,815 |
25
| | |
| NUV | Nuveen Municipal Value Fund, Inc. Portfolio of Investments (continued) April 30, 2021 (Unaudited) |
| | | | | |
| Principal | | Optional Call | | |
| Amount (000) | Description (1) | Provisions (2) | Ratings (3) | Value |
| Illinois (continued) | | | |
| $ 6,095 | Regional Transportation Authority, Cook, DuPage, Kane, Lake, McHenry and Will Counties, | No Opt. Call | AA+ | $ 8,669,833 |
| Illinois, General Obligation Bonds, Series 2002A, 6.000%, 7/01/32 – NPFG Insured | | | |
| 8,000 | Regional Transportation Authority, Cook, DuPage, Kane, Lake, McHenry and Will Counties, | No Opt. Call | AA+ | 11,356,400 |
| Illinois, General Obligation Bonds, Series 2003A, 6.000%, 7/01/33 – NPFG Insured | | | |
| 5,000 | Regional Transportation Authority, Cook, DuPage, Kane, Lake, McHenry and Will Counties, | 6/24 at 100.00 | AA+ | 5,602,700 |
| Illinois, General Obligation Bonds, Series 2014A, 5.000%, 6/01/44 | | | |
| 5,020 | Southwestern Illinois Development Authority, Local Government Revenue Bonds, | No Opt. Call | AA | 4,905,946 |
| Edwardsville Community Unit School District 7 Project, Series 2007, 0.000%, 12/01/23 – | | | |
| AGM Insured | | | |
| 10,285 | Springfield, Illinois, Water Revenue Bonds, Refunding Series 2012, 5.000%, 3/01/37 | 3/22 at 100.00 | AA– (4) | 10,702,160 |
| (Pre-refunded 3/01/22) (UB) (7) | | | |
| 615 | University of Illinois, Health Services Facilities System Revenue Bonds, Series 2013, | 10/23 at 100.00 | A– | 687,189 |
| 6.000%, 10/01/42 | | | |
| Will County Community Unit School District 201-U Crete-Monee, Illinois, General | | | |
| Obligation Bonds, Capital Appreciation Series 2004: | | | |
| 780 | 0.000%, 11/01/22 – NPFG Insured (ETM) | No Opt. Call | Baa2 (4) | 775,593 |
| 2,550 | 0.000%, 11/01/22 – NPFG Insured | No Opt. Call | A | 2,517,997 |
| 295,680 | Total Illinois | | | 270,553,801 |
| Indiana – 1.8% | | | |
| 5,010 | Indiana Finance Authority, Hospital Revenue Bonds, Community Health Network Project, | 5/23 at 100.00 | A (4) | 5,496,170 |
| Series 2012A, 5.000%, 5/01/42 (Pre-refunded 5/01/23) | | | |
| 2,250 | Indiana Finance Authority, Hospital Revenue Bonds, Indiana University Health Obligation | 6/25 at 100.00 | AA | 2,446,628 |
| Group, Refunding 2015A, 4.000%, 12/01/40 | | | |
| 5,740 | Indiana Finance Authority, Private Activity Bonds, Ohio River Bridges East End Crossing | 7/23 at 100.00 | A– | 6,239,093 |
| Project, Series 2013A, 5.000%, 7/01/48 (AMT) | | | |
| 2,000 | Indiana Municipal Power Agency Power Supply System Revenue Bonds, Refunding Series | 7/26 at 100.00 | A+ | 2,402,680 |
| 2016A, 5.000%, 1/01/42 | | | |
| 5,000 | Indianapolis Local Public Improvement Bond Bank, Indiana, Community Justice Campus | 2/29 at 100.00 | AAA | 6,266,450 |
| Bonds, Courthouse & Jail Project, Series 2019A, 5.250%, 2/01/54 | | | |
| Indianapolis Local Public Improvement Bond Bank, Indiana, Series 1999E: | | | |
| 2,400 | 0.000%, 2/01/25 – AMBAC Insured | No Opt. Call | AA | 2,344,104 |
| 14,595 | 0.000%, 2/01/27 – AMBAC Insured | No Opt. Call | AA | 13,809,059 |
| 36,995 | Total Indiana | | | 39,004,184 |
| Kentucky – 1.8% | | | |
| 300 | Greater Kentucky Housing Assistance Corporation, FHA-Insured Section 8 Mortgage Revenue | 5/21 at 100.00 | Baa2 | 301,149 |
| Refunding Bonds, Series 1997A, 6.100%, 1/01/24 – NPFG Insured | | | |
| Kenton County Airport Board, Kentucky, Airport Revenue Bonds, Cincinnati/Northern | | | |
| Kentucky International Airport, Series 2016: | | | |
| 1,530 | 5.000%, 1/01/27 | 1/26 at 100.00 | A1 | 1,829,758 |
| 1,600 | 5.000%, 1/01/28 | 1/26 at 100.00 | A1 | 1,903,248 |
| Kentucky Bond Development Corporation, Transient Room Tax Revenue Bonds, Lexington | | | |
| Center Corporation Project, Series 2018A: | | | |
| 1,280 | 5.000%, 9/01/37 | 9/28 at 100.00 | A2 | 1,569,446 |
| 1,435 | 5.000%, 9/01/38 | 9/28 at 100.00 | A2 | 1,754,474 |
| 4,000 | 5.000%, 9/01/43 | 9/28 at 100.00 | A2 | 4,854,120 |
| 2,000 | 5.000%, 9/01/48 | 9/28 at 100.00 | A2 | 2,376,300 |
| 1,000 | Kentucky Economic Development Finance Authority, Hospital Revenue Bonds, Baptist | 8/21 at 100.00 | N/R (4) | 1,013,510 |
| Healthcare System Obligated Group, Series 2011, 5.000%, 8/15/42 (Pre-refunded 8/15/21) | | | |
| 1,000 | Kentucky Economic Development Finance Authority, Louisville Arena Project Revenue Bonds, | 12/27 at 100.00 | AA | 1,142,920 |
| Louisville Arena Authority, Inc, Series 2017A, 4.000%, 12/01/41 – AGM Insured | | | |
| 8,935 | Kentucky Economic Development Finance Authority, Revenue Bonds, Next Generation Kentucky | 7/25 at 100.00 | BBB+ | 9,915,527 |
| Information Highway Project, Senior Series 2015A, 5.000%, 1/01/45 | | | |
26
| | | | | |
| Principal | | Optional Call | | |
| Amount (000) | Description (1) | Provisions (2) | Ratings (3) | Value |
| Kentucky (continued) | | | |
| $ 6,000 | Kentucky Public Transportation Infrastructure Authority, First Tier Toll Revenue Bonds, | 7/31 at 100.00 | Baa2 | $ 7,210,860 |
| Downtown Crossing Project, Convertible Capital Appreciation Series 2013C, 0.000%, 7/01/39 (5) | | | |
| 5,000 | Kentucky State Property and Buildings Commission, Revenue Bonds, Project 115, Series | 4/27 at 100.00 | A1 | 6,125,750 |
| 2017, 5.000%, 4/01/30 | | | |
| 34,080 | Total Kentucky | | | 39,997,062 |
| Louisiana – 0.9% | | | |
| 1,335 | East Baton Rouge Sewerage Commission, Louisiana, Revenue Bonds, Refunding Series 2019A, | 2/29 at 100.00 | AA– | 1,569,332 |
| 4.000%, 2/01/45 | | | |
| 4,420 | Louisiana Stadium and Exposition District, Revenue Refunding Bonds, Senior Lien Series | 7/23 at 100.00 | AA– | 4,852,895 |
| 2013A, 5.000%, 7/01/28 | | | |
| 9,040 | New Orleans Aviation Board, Louisiana, General Airport Revenue Bonds, North Terminal | 1/27 at 100.00 | A2 | 10,785,534 |
| Project, Series 2017A, 5.000%, 1/01/48 | | | |
| 1,470 | New Orleans Aviation Board, Louisiana, Special Facility Revenue Bonds, Parking | 10/28 at 100.00 | AA | 1,800,618 |
| Facilities Corporation Consolidated Garage System, Series 2018A, 5.000%, 10/01/43 – | | | |
| AGM Insured | | | |
| 16,265 | Total Louisiana | | | 19,008,379 |
| Maine – 1.2% | | | |
| 4,250 | Maine Health and Higher Educational Facilities Authority Revenue Bonds, Eastern Maine | 7/23 at 100.00 | BBB | 4,468,790 |
| Medical Center Obligated Group Issue, Series 2013, 5.000%, 7/01/33 | | | |
| Maine Health and Higher Educational Facilities Authority Revenue Bonds, MaineHealth | | | |
| Issue, Series 2018A: | | | |
| 1,190 | 5.000%, 7/01/43 | 7/28 at 100.00 | A+ | 1,440,019 |
| 5,940 | 5.000%, 7/01/48 | 7/28 at 100.00 | A+ | 7,144,335 |
| 1,050 | Maine Health and Higher Educational Facilities Authority, Revenue Bonds, Maine General | 7/21 at 100.00 | N/R (4) | 1,061,025 |
| Medical Center, Series 2011, 6.750%, 7/01/41 (Pre-refunded 7/01/21) | | | |
| 10,000 | Maine Turnpike Authority, Turnpike Revenue Bonds, Series 2020, 5.000%, 7/01/50 | 7/30 at 100.00 | AA– | 12,611,600 |
| 22,430 | Total Maine | | | 26,725,769 |
| Maryland – 1.4% | | | |
| Baltimore, Maryland, Convention Center Hotel Revenue Bonds, Refunding Series 2017: | | | |
| 630 | 5.000%, 9/01/31 | 9/27 at 100.00 | CCC | 660,467 |
| 1,945 | 5.000%, 9/01/32 | 9/27 at 100.00 | CCC | 2,039,177 |
| 3,455 | 5.000%, 9/01/34 | 9/27 at 100.00 | CCC | 3,624,779 |
| 2,000 | 5.000%, 9/01/35 | 9/27 at 100.00 | CCC | 2,098,140 |
| 4,500 | 5.000%, 9/01/42 | 9/27 at 100.00 | CCC | 4,723,830 |
| 3,500 | 5.000%, 9/01/46 | 9/27 at 100.00 | CCC | 3,676,015 |
| 2,350 | Maryland Economic Development Corporation, Private Activity Revenue Bonds AP, Purple | 9/26 at 100.00 | BB– | 2,688,235 |
| Line Light Rail Project, Green Bonds, Series 2016D, 5.000%, 3/31/41 (AMT) | | | |
| 1,050 | Maryland Health and Higher Educational Facilities Authority, Maryland, Hospital Revenue | 7/25 at 100.00 | A– | 1,195,183 |
| Bonds, Meritus Medical Center, Series 2015, 5.000%, 7/01/40 | | | |
| 1,500 | Maryland Health and Higher Educational Facilities Authority, Revenue Bonds, Adventist | 1/22 at 100.00 | Baa3 | 1,557,810 |
| Healthcare, Series 2011A, 6.125%, 1/01/36 | | | |
| Maryland Stadium Authority, Revenue Bonds, Baltimore City Public Schools Construction & | | | |
| Revitalization Program, Series 2018A: | | | |
| 2,260 | 5.000%, 5/01/47 (Pre-refunded 5/01/28) | 5/28 at 100.00 | N/R (4) | 2,898,857 |
| 4,375 | 5.000%, 5/01/47 | 5/28 at 100.00 | AA | 5,365,894 |
| 27,565 | Total Maryland | | | 30,528,387 |
| Massachusetts – 1.2% | | | |
| 1,000 | Massachusetts Department of Transportation, Metropolitan Highway System Revenue Bonds, | 1/29 at 100.00 | A+ | 1,250,940 |
| Refunding Senior Lien Series 2019A, 5.000%, 1/01/37 | | | |
| 2,100 | Massachusetts Development Finance Agency, Hospital Revenue Bonds, Cape Cod Healthcare | 11/23 at 100.00 | AA– | 2,319,072 |
| Obligated Group, Series 2013, 5.250%, 11/15/41 | | | |
27
| | |
| NUV | Nuveen Municipal Value Fund, Inc. Portfolio of Investments (continued) April 30, 2021 (Unaudited) |
| | | | | |
| Principal | | Optional Call | | |
| Amount (000) | Description (1) | Provisions (2) | Ratings (3) | Value |
| Massachusetts (continued) | | | |
| $ 2,905 | Massachusetts Development Finance Agency, Revenue Bonds, Boston Medical Center Issue, | 7/25 at 100.00 | BBB | $ 3,277,915 |
| Green Bonds, Series 2015D, 5.000%, 7/01/44 | | | |
| 1,105 | Massachusetts Development Finance Agency, Revenue Bonds, Boston Medical Center Issue, | 7/26 at 100.00 | BBB | 1,290,585 |
| Series 2016E, 5.000%, 7/01/36 | | | |
| 2,765 | Massachusetts Development Finance Agency, Revenue Bonds, Dana-Farber Cancer Institute | 12/26 at 100.00 | A1 | 3,259,327 |
| Issue, Series 2016N, 5.000%, 12/01/46 | | | |
| 9,110 | Massachusetts School Building Authority, Dedicated Sales Tax Revenue Bonds, Senior | 5/23 at 100.00 | AAA | 10,011,344 |
| Series 2013A, 5.000%, 5/15/43 (Pre-refunded 5/15/23) | | | |
| 3,760 | Massachusetts State, General Obligation Bonds, Consolidated Loan Series 2019C, | 5/29 at 100.00 | Aa1 | 4,768,958 |
| 5.000%, 5/01/46 | | | |
| 980 | Massachusetts Turnpike Authority, Metropolitan Highway System Revenue Bonds, Senior | No Opt. Call | A+ | 880,118 |
| Series 1997A, 0.000%, 1/01/29 – NPFG Insured | | | |
| 320 | Massachusetts Water Pollution Abatement Trust, Pooled Loan Program Bonds, Series 2000-6, | 6/21 at 100.00 | Aaa | 321,251 |
| 5.500%, 8/01/30 | | | |
| 24,045 | Total Massachusetts | | | 27,379,510 |
| Michigan – 2.8% | | | |
| Detroit Academy of Arts and Sciences, Michigan, Public School Academy Revenue Bonds, | | | |
| Refunding Series 2013: | | | |
| 1,690 | 6.000%, 10/01/33 | 10/23 at 100.00 | N/R | 1,734,734 |
| 2,520 | 6.000%, 10/01/43 | 10/23 at 100.00 | N/R | 2,563,798 |
| 1,590 | Detroit Local Development Finance Authority, Michigan, Tax Increment Bonds, Series | 3/21 at 100.00 | B– | 1,590,000 |
| 1998A, 5.500%, 5/01/21 | | | |
| 1,415 | Detroit Water and Sewerage Department, Michigan, Sewage Disposal System Revenue Bonds, | 7/22 at 100.00 | AA– (4) | 1,499,334 |
| Refunding Senior Lien Series 2012A, 5.250%, 7/01/39 (Pre-refunded 7/01/22) | | | |
| 15 | Detroit, Michigan, Second Lien Sewerage Disposal System Revenue Bonds, Series 2005A, | 6/21 at 100.00 | A+ | 15,046 |
| 4.500%, 7/01/35 – NPFG Insured | | | |
| 3,000 | Detroit, Michigan, Senior Lien Sewerage Disposal System Revenue Bonds, Series 2001B, | No Opt. Call | A+ | 3,703,980 |
| 5.500%, 7/01/29 – NPFG Insured | | | |
| 5 | Detroit, Michigan, Water Supply System Revenue Bonds, Second Lien Series 2003B, 5.000%, | 6/21 at 100.00 | A+ | 5,018 |
| 7/01/34 – NPFG Insured | | | |
| 5 | Detroit, Michigan, Water Supply System Revenue Bonds, Senior Lien Series 2003A, 5.000%, | 6/21 at 100.00 | A1 | 5,017 |
| 7/01/34 – NPFG Insured | | | |
| 3,315 | Michigan Finance Authority, Distributable State Aid Revenue Bonds, Charter County of | 11/28 at 100.00 | Aa3 | 4,083,516 |
| Wayne Criminal Justice Center Project, Senior Lien Series 2018, 5.000%, 11/01/43 | | | |
| 2,360 | Michigan Finance Authority, Distributable State Aid Revenue Bonds, Charter County of | 11/30 at 100.00 | AA | 2,813,686 |
| Wayne, Second Lien Refunding Series 2020, 4.000%, 11/01/37 | | | |
| 1,950 | Michigan Finance Authority, Local Government Loan Program Revenue Bonds, Detroit Water & | 7/22 at 100.00 | N/R (4) | 2,060,585 |
| Sewerage Department Water Supply System Local Project, Series 2014C-1, 5.000%, 7/01/44 | | | |
| (Pre-refunded 7/01/22) | | | |
| Michigan Finance Authority, Revenue Bonds, Trinity Health Credit Group, Refunding | | | |
| Series 2011MI: | | | |
| 15 | 5.000%, 12/01/39 (Pre-refunded 12/01/21) | 12/21 at 100.00 | N/R (4) | 15,411 |
| 4,585 | 5.000%, 12/01/39 (Pre-refunded 12/01/21) | 12/21 at 100.00 | AA– (4) | 4,714,618 |
| 5,000 | Michigan Finance Authority, Revenue Bonds, Trinity Health Credit Group, Refunding Series | 6/22 at 100.00 | AA– (4) | 5,263,150 |
| 2015MI, 5.000%, 12/01/35 (Pre-refunded 6/01/22) | | | |
| 2,750 | Michigan Finance Authority, Tobacco Settlement Asset- Backed Bonds, 2007 Sold Tobacco | 12/30 at 100.00 | BBB– | 3,298,433 |
| Receipts, Series 2020B-1-CL2, 5.000%, 6/01/49 | | | |
| 6,000 | Michigan Hospital Finance Authority, Revenue Bonds, Ascension Health Senior Credit | 11/26 at 100.00 | AA+ | 6,721,020 |
| Group, Refunding & Project Series 2010F-6, 4.000%, 11/15/47 | | | |
| 5,000 | Michigan State Building Authority, Revenue Bonds, Facilities Program, Refunding Series | 10/21 at 100.00 | Aa2 (4) | 5,118,350 |
| 2011-II-A, 5.375%, 10/15/41 (Pre-refunded 10/15/21) | | | |
28
| Principal | | Optional Call | | |
| Amount (000) | Description (1) | Provisions (2) | Ratings (3) | Value |
| Michigan (continued) | | | |
| Michigan State Building Authority, Revenue Bonds, Facilities Program, Refunding Series 2015-I: | | | |
| $ 435 | 5.000%, 4/15/30 (Pre-refunded 10/15/25) | 10/25 at 100.00 | N/R (4) | $ 522,687 |
| 9,565 | 5.000%, 4/15/30 | 10/25 at 100.00 | Aa2 | 11,417,358 |
| 2,890 | Oakland University, Michigan, General Revenue Bonds, Series 2012, 5.000%, 3/01/42 | 3/22 at 100.00 | A1 | 2,992,508 |
| 1,100 | Wayne County Airport Authority, Michigan, Revenue Bonds, Detroit Metropolitan Wayne | 12/25 at 100.00 | A1 | 1,288,936 |
| County Airport, Series 2015D, 5.000%, 12/01/45 | | | |
| 55,205 | Total Michigan | | | 61,427,185 |
| Minnesota – 0.3% | | | |
| 3,200 | Rochester, Minnesota, Health Care Facilities Revenue Bonds, Mayo Clinic, Refunding | No Opt. Call | AA | 4,682,432 |
| Series 2016B, 5.000%, 11/15/34 | | | |
| 1,480 | University of Minnesota, General Obligation Bonds, Series 2016A, 5.000%, 4/01/41 | 4/26 at 100.00 | Aa1 | 1,768,866 |
| 4,680 | Total Minnesota | | | 6,451,298 |
| Missouri – 0.2% | | | |
| 3,465 | Missouri Health and Educational Facilities Authority, Health Facilities Revenue Bonds, | 11/23 at 100.00 | A2 | 3,795,769 |
| CoxHealth, Series 2013A, 5.000%, 11/15/48 | | | |
| Montana – 0.6% | | | |
| 1,115 | Billings, Montana, Sewer System Revenue Bonds, Series 2017, 5.000%, 7/01/33 | 7/27 at 100.00 | AA+ | 1,365,607 |
| Montana Facility Finance Authority, Healthcare Facility Revenue Bonds, Kalispell | | | |
| Regional Medical Center, Series 2018B: | | | |
| 1,340 | 5.000%, 7/01/30 | 7/28 at 100.00 | BBB | 1,608,844 |
| 1,415 | 5.000%, 7/01/31 | 7/28 at 100.00 | BBB | 1,687,982 |
| 1,980 | 5.000%, 7/01/32 | 7/28 at 100.00 | BBB | 2,354,933 |
| 2,135 | 5.000%, 7/01/33 | 7/28 at 100.00 | BBB | 2,531,619 |
| 3,045 | Montana Facility Finance Authority, Revenue Bonds, Billings Clinic Obligated Group, | 8/28 at 100.00 | AA– | 3,745,959 |
| Series 2018A, 5.000%, 8/15/48 | | | |
| 11,030 | Total Montana | | | 13,294,944 |
| Nebraska – 0.4% | | | |
| Central Plains Energy Project, Nebraska, Gas Project 3 Revenue Bonds, Refunding | | | |
| Crossover Series 2017A: | | | |
| 1,710 | 5.000%, 9/01/37 | No Opt. Call | A | 2,368,521 |
| 1,500 | 5.000%, 9/01/42 | No Opt. Call | A | 2,154,780 |
| 1,855 | Central Plains Energy Project, Nebraska, Gas Project 3 Revenue Bonds, Series 2012, | 9/22 at 100.00 | A2 | 1,971,717 |
| 5.000%, 9/01/42 | | | |
| 1,400 | Douglas County Hospital Authority 3, Nebraska, Health Facilities Revenue Bonds, Nebraska | 11/25 at 100.00 | A | 1,616,216 |
| Methodist Health System, Refunding Series 2015, 5.000%, 11/01/45 | | | |
| 6,465 | Total Nebraska | | | 8,111,234 |
| Nevada – 2.8% | | | |
| 490 | Clark County School District, Nevada, General Obligation Bonds, Limited Tax Building | 6/30 at 100.00 | AA | 582,434 |
| Series 2020A, 4.000%, 6/15/40 – AGM Insured | | | |
| Clark County, Nevada, General Obligation Bonds, Transportation Improvement, Limited Tax, | | | |
| Additionally Secured by Pledged Revenue Series 2018B: | | | |
| 2,000 | 5.000%, 12/01/33 | 12/28 at 100.00 | AA+ | 2,536,920 |
| 5,000 | 5.000%, 12/01/35 | 12/28 at 100.00 | AA+ | 6,313,750 |
| 5,000 | Humboldt County, Nevada, Pollution Control Revenue Bonds, Sierra Pacific Power Company | No Opt. Call | A+ | 5,072,700 |
| Projects, Series 2016B, 1.850%, 10/01/29 (Mandatory Put 4/15/22) | | | |
| 5,000 | Las Vegas Convention and Visitors Authority, Nevada, Convention Center Expansion Revenue | 7/28 at 100.00 | Aa3 | 5,958,150 |
| Bonds, Series 2018B, 5.000%, 7/01/43 | | | |
| 8,500 | Las Vegas Convention and Visitors Authority, Nevada, Revenue Bonds, Series 2018C, | 7/28 at 100.00 | Aa3 | 10,269,360 |
| 5.250%, 7/01/43 | | | |
29
| | |
| NUV | Nuveen Municipal Value Fund, Inc. Portfolio of Investments (continued) April 30, 2021 (Unaudited) |
| | | | | |
| Principal | | Optional Call | | |
| Amount (000) | Description (1) | Provisions (2) | Ratings (3) | Value |
| Nevada (continued) | | | |
| Las Vegas Valley Water District, Nevada, General Obligation Bonds, Refunding Series 2015: | | | |
| $ 5,220 | 5.000%, 6/01/33 | 12/24 at 100.00 | Aa1 | $ 6,015,058 |
| 10,000 | 5.000%, 6/01/34 | 12/24 at 100.00 | Aa1 | 11,523,100 |
| 9,000 | 5.000%, 6/01/39 | 12/24 at 100.00 | Aa1 | 10,336,320 |
| 1,205 | Las Vegas Valley Water District, Nevada, General Obligation Bonds, Refunding Water | 6/26 at 100.00 | Aa1 | 1,440,083 |
| Improvement Series 2016A, 5.000%, 6/01/41 | | | |
| 2,000 | Reno, Nevada, Subordinate Lien Sales Tax Revenue Refunding Bonds, ReTrac-Reno | 12/28 at 100.00 | A3 | 2,262,020 |
| Transportation Rail Access Corridor Project, Series 2018A, 5.000%, 6/01/48 | | | |
| 250 | Reno, Nevada, Subordinate Lien Sales Tax Revenue Refunding Bonds, ReTrac-Reno | 12/28 at 100.00 | AA | 304,463 |
| Transportation Rail Access Corridor Project, Series 2018B, 5.000%, 6/01/33 – AGM Insured | | | |
| 53,665 | Total Nevada | | | 62,614,358 |
| New Jersey – 4.7% | | | |
| 2,500 | Delaware River Port Authority, New Jersey and Pennsylvania, Revenue Bonds, Series 2018A, | 1/29 at 100.00 | A+ | 3,146,425 |
| 5.000%, 1/01/36 | | | |
| 930 | New Jersey Economic Development Authority, Private Activity Bonds, The Goethals Bridge | 1/24 at 100.00 | AA | 1,039,759 |
| Replacement Project, Series 2013, 5.125%, 1/01/39 – AGM Insured (AMT) | | | |
| 6,000 | New Jersey Economic Development Authority, School Facilities Construction Bonds, | 12/26 at 100.00 | Baa1 | 7,345,320 |
| Refunding Series 2016BBB, 5.500%, 6/15/31 | | | |
| 5,990 | New Jersey Economic Development Authority, School Facilities Construction Bonds, Series | No Opt. Call | AA | 7,315,347 |
| 2005N-1, 5.500%, 9/01/25 – AGM Insured | | | |
| 4,000 | New Jersey Economic Development Authority, School Facilities Construction Financing | 3/23 at 100.00 | Baa1 | 4,338,040 |
| Program Bonds, Refunding Series 2013NN, 5.000%, 3/01/26 | | | |
| 3,300 | New Jersey Health Care Facilities Financing Authority, New Jersey, Revenue Bonds, Saint | 6/21 at 100.00 | BB+ | 3,309,966 |
| Peters University Hospital, Series 2007, 5.750%, 7/01/37 | | | |
| 9,420 | New Jersey Transportation Trust Fund Authority, Transportation System Bonds, Capital | No Opt. Call | Baa1 | 7,501,994 |
| Appreciation Series 2010A, 0.000%, 12/15/31 | | | |
| New Jersey Transportation Trust Fund Authority, Transportation System Bonds, Refunding | | | |
| Series 2006C: | | | |
| 30,000 | 0.000%, 12/15/30 – FGIC Insured | No Opt. Call | Baa1 | 25,106,700 |
| 27,000 | 0.000%, 12/15/32 – AGM Insured | No Opt. Call | AA | 21,636,450 |
| 4,500 | New Jersey Transportation Trust Fund Authority, Transportation System Bonds, Series | 6/23 at 100.00 | Baa1 | 4,910,355 |
| 2013AA, 5.000%, 6/15/29 | | | |
| New Jersey Transportation Trust Fund Authority, Transportation System Bonds, Series 2015AA: | | | |
| 2,750 | 5.250%, 6/15/32 | 6/25 at 100.00 | Baa1 | 3,183,565 |
| 2,150 | 5.250%, 6/15/34 | 6/25 at 100.00 | Baa1 | 2,481,723 |
| 2,000 | New Jersey Turnpike Authority, Revenue Bonds, Series 2017B, 5.000%, 1/01/40 | 1/28 at 100.00 | A+ | 2,426,620 |
| 3,760 | New Jersey Turnpike Authority, Turnpike Revenue Bonds, Series 2021A, 4.000%, 1/01/42 | 1/31 at 100.00 | A+ | 4,465,827 |
| 1,135 | Rutgers State University, New Jersey, Revenue Bonds, Refunding Series 2013L, 5.000%, | 5/23 at 100.00 | Aa3 (4) | 1,245,140 |
| 5/01/43 (Pre-refunded 5/01/23) | | | |
| 1,455 | South Jersey Transportation Authority, New Jersey, Transportation System Revenue Bonds, | 11/30 at 100.00 | AA | 1,853,670 |
| Series 2020A, 5.000%, 11/01/41 – BAM Insured | | | |
| 2,720 | Tobacco Settlement Financing Corporation, New Jersey, Tobacco Settlement Asset-Backed | 6/28 at 100.00 | BB+ | 3,187,242 |
| Bonds, Series 2018B, 5.000%, 6/01/46 | | | |
| 109,610 | Total New Jersey | | | 104,494,143 |
| New Mexico – 0.0% | | | |
| 125 | University of New Mexico, Revenue Bonds, Refunding Series 1992A, 6.000%, 6/01/21 | No Opt. Call | AA– | 125,549 |
30
| | | | | |
| Principal | | Optional Call | | |
| Amount (000) | Description (1) | Provisions (2) | Ratings (3) | Value |
| New York – 6.7% | | | |
| $ 3,750 | Dormitory Authority of the State of New York, Lease Revenue Bonds, State University | 7/27 at 100.00 | Aa3 | $ 4,508,587 |
| Dormitory Facilities, Series 2017A, 5.000%, 7/01/42 | | | |
| 5,330 | Dormitory Authority of the State of New York, Revenue Bonds, NYU Langone Hospitals | 7/30 at 100.00 | A | 6,187,597 |
| Obligated Group, Series 2020A, 4.000%, 7/01/53 | | | |
| 2,055 | Long Island Power Authority, New York, Electric System General Revenue Bonds, Notes | 9/23 at 100.00 | A | 2,080,688 |
| Series 2021, 1.000%, 9/01/25 | | | |
| 1,950 | Long Island Power Authority, New York, Electric System General Revenue Bonds, Series | 9/28 at 100.00 | A | 2,443,233 |
| 2018, 5.000%, 9/01/39 | | | |
| 1,500 | Long Island Power Authority, New York, Electric System General Revenue Bonds, Series | 9/30 at 100.00 | A | 1,958,535 |
| 2020A, 5.000%, 9/01/38 | | | |
| 8,325 | Metropolitan Transportation Authority, New York, Transportation Revenue Bonds, Green | 5/30 at 100.00 | A3 | 10,200,872 |
| Climate Bond Certified Series 2020C-1, 5.000%, 11/15/50 | | | |
| 2,500 | Metropolitan Transportation Authority, New York, Transportation Revenue Bonds, Refunding | 11/30 at 100.00 | A3�� | 2,856,675 |
| Green Climate Certified Series 2020E, 4.000%, 11/15/45 | | | |
| MTA Hudson Rail Yards Trust Obligations, New York, MTA Financing Agreement Payable by | | | |
| the Metropolitan Transportation Authority, Series 2016A: | | | |
| 3,135 | 5.000%, 11/15/51 | 11/21 at 100.00 | A3 | 3,202,183 |
| 7,380 | 5.000%, 11/15/56 | 11/23 at 100.00 | A3 | 8,001,544 |
| New York City Industrial Development Agency, New York, PILOT Payment in Lieu of Taxes | | | |
| Revenue Bonds, Queens Baseball Stadium Project, Refunding Series 2021A: | | | |
| 1,750 | 5.000%, 1/01/30 – AGM Insured | No Opt. Call | AA | 2,290,400 |
| 1,250 | 5.000%, 1/01/31 – AGM Insured | No Opt. Call | AA | 1,662,663 |
| 10,000 | New York City Transitional Finance Authority, New York, Building Aid Revenue Bonds, | 7/28 at 100.00 | AA | 12,307,600 |
| Fiscal 2018, Series 2017S-3, 5.000%, 7/15/43 | | | |
| 7,000 | New York City Transitional Finance Authority, New York, Building Aid Revenue Bonds, | 7/28 at 100.00 | AA | 8,731,170 |
| Fiscal 2019 Subseries S-3A, 5.000%, 7/15/37 | | | |
| 3,520 | New York City, New York, General Obligation Bonds, Fiscal 2021 Series C, 5.000%, 8/01/43 | 8/30 at 100.00 | AA | 4,456,250 |
| 5,000 | New York City, New York, General Obligation Bonds, Fiscal 2021 Series F-1, 5.000%, 3/01/44 | 3/31 at 100.00 | AA | 6,392,200 |
| 11,755 | New York Liberty Development Corporation, New York, Liberty Revenue Bonds, 3 World Trade | 11/24 at 100.00 | N/R | 12,867,023 |
| Center Project, Class 1 Series 2014, 5.000%, 11/15/44, 144A | | | |
| 5,825 | New York Liberty Development Corporation, New York, Liberty Revenue Bonds, 4 World Trade | 11/21 at 100.00 | A | 5,987,459 |
| Center Project, Series 2011, 5.750%, 11/15/51 | | | |
| 5,000 | New York State Power Authority, General Revenue Bonds, Series 2020A, 4.000%, 11/15/50 | 5/30 at 100.00 | AA | 5,842,200 |
| 8,270 | New York Transportation Development Corporation, New York, Special Facilities Bonds, | 7/24 at 100.00 | BBB | 9,318,884 |
| LaGuardia Airport Terminal B Redevelopment Project, Series 2016A, 5.000%, 7/01/46 (AMT) | | | |
| New York Transportation Development Corporation, Special Facility Revenue Bonds, Delta | | | |
| Air Lines, Inc – LaGuardia Airport Terminals C&D Redevelopment Project, Series 2018: | | | |
| 3,250 | 5.000%, 1/01/34 (AMT) | 1/28 at 100.00 | Baa3 | 3,939,780 |
| 5,250 | 5.000%, 1/01/36 (AMT) | 1/28 at 100.00 | Baa3 | 6,325,777 |
| 7,550 | Triborough Bridge and Tunnel Authority, New York, General Purpose Revenue Bonds, MTA | 11/27 at 100.00 | AA– | 9,248,976 |
| Bridges & Tunnels, Series 2017C-2, 5.000%, 11/15/42 | | | |
| 4,000 | Triborough Bridge and Tunnel Authority, New York, General Purpose Revenue Bonds, MTA | 11/30 at 100.00 | AA– | 4,765,360 |
| Bridges & Tunnels, Series 2018D, 4.000%, 11/15/38 | | | |
| 3,000 | Triborough Bridge and Tunnel Authority, New York, General Purpose Revenue Bonds, | 5/25 at 100.00 | AA– | 3,446,460 |
| Refunding Series 2015A, 5.000%, 11/15/50 | | | |
| 7,175 | Triborough Bridge and Tunnel Authority, New York, Payroll Mobility Tax Bonds, Senior | 5/31 at 100.00 | AA+ | 9,241,400 |
| Lien Subseries 2021A-1, 5.000%, 5/15/51 (WI/DD, Settling 5/05/21) | | | |
| 650 | TSASC Inc, New York, Tobacco Settlement Asset-Backed Bonds, Fiscal 2017 Series B, | No Opt. Call | B– | 677,918 |
| 5.000%, 6/01/24 | | | |
| 126,170 | Total New York | | | 148,941,434 |
31
| | |
| NUV | Nuveen Municipal Value Fund, Inc. Portfolio of Investments (continued) April 30, 2021 (Unaudited) |
| | | | | |
| Principal | | Optional Call | | |
| Amount (000) | Description (1) | Provisions (2) | Ratings (3) | Value |
| North Carolina – 1.2% | | | |
| $ 1,500 | Charlotte-Mecklenberg Hospital Authority, North Carolina, Health Care Revenue Bonds, DBA | 6/21 at 100.00 | AA– | $ 1,504,875 |
| Carolinas HealthCare System, Series 2011A, 5.125%, 1/15/37 | | | |
| 1,520 | North Carolina Capital Facilities Finance Agency, Revenue Bonds, Duke University | 10/26 at 100.00 | AA+ | 1,840,659 |
| Project, Refunding Series 2016B, 5.000%, 10/01/44 | | | |
| North Carolina Department of Transportation, Private Activity Revenue Bonds, I-77 Hot | | | |
| Lanes Project, Series 2015: | | | |
| 2,155 | 5.000%, 12/31/37 (AMT) | 6/25 at 100.00 | BBB– | 2,403,773 |
| 4,175 | 5.000%, 6/30/54 (AMT) | 6/25 at 100.00 | BBB– | 4,592,583 |
| 2,995 | North Carolina Turnpike Authority, Monroe Expressway Toll Revenue Bonds, Series 2017A, | 7/26 at 100.00 | BBB | 3,415,438 |
| 5.000%, 7/01/51 | | | |
| North Carolina Turnpike Authority, Triangle Expressway System Revenue Bonds, Capital | | | |
| Appreciation Series 2019: | | | |
| 2,000 | 0.000%, 1/01/41 | 1/30 at 71.45 | AA+ | 1,193,460 |
| 1,500 | 0.000%, 1/01/42 | 1/30 at 68.97 | AA+ | 860,655 |
| 14,500 | 0.000%, 1/01/49 | 1/30 at 54.10 | AA+ | 6,402,040 |
| North Carolina Turnpike Authority, Triangle Expressway System Revenue Bonds, Refunding | | | |
| Senior Lien Series 2017: | | | |
| 1,625 | 5.000%, 1/01/30 | 1/27 at 100.00 | BBB | 1,953,998 |
| 1,850 | 5.000%, 1/01/32 | 1/27 at 100.00 | BBB | 2,208,974 |
| 33,820 | Total North Carolina | | | 26,376,455 |
| North Dakota – 0.4% | | | |
| 7,820 | Fargo, North Dakota, Health System Revenue Bonds, Sanford Health, Refunding Series | 11/21 at 100.00 | A+ (4) | 8,050,377 |
| 2011, 6.250%, 11/01/31 (Pre-refunded 11/01/21) | | | |
| 1,840 | Grand Forks, North Dakota, Health Care System Revenue Bonds, Altru Health System | 12/27 at 100.00 | Baa2 | 2,033,182 |
| Obligated Group, Series 2017A, 5.000%, 12/01/42 | | | |
| 9,660 | Total North Dakota | | | 10,083,559 |
| Ohio – 3.7% | | | |
| 4,710 | Buckeye Tobacco Settlement Financing Authority, Ohio, Tobacco Settlement Asset-Backed | 6/30 at 100.00 | BBB+ | 5,325,267 |
| Revenue Bonds, Refunding Senior Lien Series 2020A-2 Class 1, 4.000%, 6/01/48 | | | |
| 20,480 | Buckeye Tobacco Settlement Financing Authority, Ohio, Tobacco Settlement Asset-Backed | 6/30 at 100.00 | N/R | 23,023,002 |
| Revenue Bonds, Refunding Senior Lien Series 2020B-2 Class 2, 5.000%, 6/01/55 | | | |
| 16,415 | Buckeye Tobacco Settlement Financing Authority, Ohio, Tobacco Settlement Asset-Backed | 6/22 at 100.00 | N/R (4) | 17,493,794 |
| Revenue Bonds, Senior Lien Series 2007A-3, 6.250%, 6/01/37 (Pre-refunded 6/01/22) | | | |
| 1,195 | Franklin County, Ohio, Hospital Revenue Bonds, Nationwide Children’s Hospital Project, | 11/27 at 100.00 | Aa2 | 1,464,413 |
| Refunding & Improvement Series 2017A, 5.000%, 11/01/32 | | | |
| 3,485 | Franklin County, Ohio, Revenue Bonds, Trinity Health Credit Group, Series 2017OH, | 6/27 at 100.00 | AA– | 3,913,237 |
| 4.000%, 12/01/46 | | | |
| 5,000 | Franklin County, Ohio, Sales Tax Revenue Bonds, Various Purpose Series 2018, | 6/28 at 100.00 | AAA | 6,189,550 |
| 5.000%, 6/01/43 | | | |
| 1,730 | Lucas County, Ohio, Hospital Revenue Bonds, ProMedica Healthcare Obligated Group, Series | 11/21 at 100.00 | BBB (4) | 1,784,114 |
| 2011A, 6.000%, 11/15/41 (Pre-refunded 11/15/21) | | | |
| 13,000 | Ohio Air Quality Development Authority, Ohio, Pollution Control Revenue Bonds, | No Opt. Call | N/R | 13,200,720 |
| FirstEnergy Generation Corporation Project, Refunding Series 2009D, 4.250%, 8/01/29 | | | |
| (Mandatory Put 9/15/21) | | | |
| 4,110 | Ohio State, Private Activity Bonds, Portsmouth Gateway Group, LLC – Borrower, Portsmouth | 6/25 at 100.00 | AA | 4,678,454 |
| Bypass Project, Series 2015, 5.000%, 12/31/39 – AGM Insured (AMT) | | | |
| 4,975 | Ohio State, Turnpike Revenue Bonds, Ohio Turnpike and Infrastructure Commission | 2/23 at 100.00 | Aa3 (4) | 5,403,845 |
| Infrastructure Projects, Junior Lien, Current Interest Series 2013A-1, 5.000%, 2/15/48 | | | |
| (Pre-refunded 2/15/23) | | | |
| 75,100 | Total Ohio | | | 82,476,396 |
32
| | | | | |
| Principal | | Optional Call | | |
| Amount (000) | Description (1) | Provisions (2) | Ratings (3) | Value |
| Oklahoma – 1.3% | | | |
| $ 1,090 | Fort Sill Apache Tribe of Oklahoma Economic Development Authority, Gaming Enterprise | 8/21 at 100.00 | N/R (4) | $ 1,117,512 |
| Revenue Bonds, Fort Sill Apache Casino, Series 2011A, 8.500%, 8/25/26 (Pre-refunded | | | |
| 8/25/21), 144A | | | |
| 4,000 | Oklahoma City Water Utilities Trust, Oklahoma, Water and Sewer Revenue Bonds, Refunding | 7/26 at 100.00 | AAA | 4,861,960 |
| Series 2016, 5.000%, 7/01/36 | | | |
| Oklahoma Development Finance Authority, Health System Revenue Bonds, Integris Baptist | | | |
| Medical Center, Refunding Series 2015A: | | | |
| 1,590 | 5.000%, 8/15/27 | 8/25 at 100.00 | A | 1,862,844 |
| 1,250 | 5.000%, 8/15/29 | 8/25 at 100.00 | A | 1,459,337 |
| Oklahoma Development Finance Authority, Health System Revenue Bonds, OU Medicine | | | |
| Project, Series 2018B: | | | |
| 1,935 | 5.250%, 8/15/43 | 8/28 at 100.00 | Baa3 | 2,358,204 |
| 5,000 | 5.250%, 8/15/48 | 8/28 at 100.00 | Baa3 | 6,062,900 |
| 10,000 | Oklahoma State Turnpike Authority, Turnpike System Revenue Bonds, Second Senior Series | 1/26 at 100.00 | AA– | 11,737,900 |
| 2017A, 5.000%, 1/01/42 | | | |
| 24,865 | Total Oklahoma | | | 29,460,657 |
| Oregon – 0.7% | | | |
| 6,585 | Oregon State Department of Transportation, Highway User Tax Revenue Bonds, Refunding | 5/27 at 100.00 | AAA | 8,230,855 |
| Senior Lien Series 2017B, 5.000%, 11/15/28 | | | |
| 5,330 | University of Oregon, General Revenue Bonds, Series 2018A, 5.000%, 4/01/48 | 4/28 at 100.00 | Aa2 | 6,492,313 |
| 11,915 | Total Oregon | | | 14,723,168 |
| Pennsylvania – 1.3% | | | |
| 3,155 | Geisinger Authority, Montour County, Pennsylvania, Health System Revenue Bonds, | 2/27 at 100.00 | AA– | 3,782,656 |
| Geisinger Health System, Series 2017A-2, 5.000%, 2/15/39 | | | |
| 2,000 | Pennsylvania State University, Revenue Bonds, Refunding Series 2016A, 5.000%, 9/01/41 | 9/26 at 100.00 | Aa1 | 2,402,940 |
| Pennsylvania Turnpike Commission, Motor License Fund-Enhanced Turnpike Special Revenue | | | |
| Bonds, Subordinate Series 2011B: | | | |
| 1,405 | 5.000%, 12/01/41 (Pre-refunded 12/01/21) | 12/21 at 100.00 | A2 (4) | 1,444,719 |
| 1,310 | 5.000%, 12/01/41 (Pre-refunded 12/01/21) | 12/21 at 100.00 | AA– (4) | 1,346,654 |
| 7,500 | Pennsylvania Turnpike Commission, Motor License Fund-Enhanced Turnpike Special Revenue | 12/22 at 100.00 | AA– (4) | 8,071,950 |
| Bonds, Subordinate Series 2013A, 5.000%, 12/01/43 (Pre-refunded 12/01/22) | | | |
| 1,250 | Pennsylvania Turnpike Commission, Motor License Fund-Enhanced Turnpike Subordinate | 12/26 at 100.00 | AA– | 1,406,538 |
| Special Revenue Bonds, Series 2014A, 0.000%, 12/01/37 (5) | | | |
| 3,000 | Pennsylvania Turnpike Commission, Turnpike Revenue Bonds, Series 2020B, 5.000%, 12/01/50 | 12/30 at 100.00 | A+ | 3,808,680 |
| 3,645 | Pennsylvania Turnpike Commission, Turnpike Revenue Bonds, Subordinate Series 2021A, | 12/30 at 100.00 | A | 4,216,645 |
| 4.000%, 12/01/50 | | | |
| 570 | Pittsburgh Water and Sewer Authority, Pennsylvania, Water and Sewer System Revenue | 9/29 at 100.00 | AA | 686,622 |
| Bonds, Refunding Subordinate Series 2019B, 4.000%, 9/01/34 – AGM Insured | | | |
| 1,350 | Susquehanna Area Regional Airport Authority, Pennsylvania, Airport System Revenue Bonds, | 1/28 at 100.00 | Baa3 | 1,500,201 |
| Series 2017, 5.000%, 1/01/38 (AMT) | | | |
| 25,185 | Total Pennsylvania | | | 28,667,605 |
| Puerto Rico – 1.7% | | | |
| Puerto Rico Sales Tax Financing Corporation, Sales Tax Revenue Bonds, Restructured 2018A-1: | | | |
| 6,031 | 0.000%, 7/01/33 | 7/28 at 86.06 | N/R | 4,369,701 |
| 15,388 | 4.500%, 7/01/34 | 7/25 at 100.00 | N/R | 16,828,625 |
| 9,039 | 4.550%, 7/01/40 | 7/28 at 100.00 | N/R | 10,031,663 |
| 5,320 | Puerto Rico Sales Tax Financing Corporation, Sales Tax Revenue Bonds, Restructured | 7/28 at 100.00 | N/R | 5,904,242 |
| Cofina Project Series 2019A-2A, 4.550%, 7/01/40 | | | |
| 35,778 | Total Puerto Rico | | | 37,134,231 |
33
| | |
| NUV | Nuveen Municipal Value Fund, Inc. Portfolio of Investments (continued) April 30, 2021 (Unaudited) |
| | | | | |
| Principal | | Optional Call | | |
| Amount (000) | Description (1) | Provisions (2) | Ratings (3) | Value |
| South Carolina – 1.8% | | | |
| Piedmont Municipal Power Agency, South Carolina, Electric Revenue Bonds, Series 2004A-2: | | | |
| $ 12,760 | 0.000%, 1/01/28 – AGC Insured | No Opt. Call | AA | $ 11,680,249 |
| 9,535 | 0.000%, 1/01/29 – AGC Insured | No Opt. Call | AA | 8,498,355 |
| 8,000 | South Carolina Public Service Authority Santee Cooper Revenue Obligations, Refunding | 12/26 at 100.00 | A | 9,553,040 |
| Series 2016B, 5.000%, 12/01/56 | | | |
| 5,500 | South Carolina Public Service Authority, Santee Cooper Revenue Obligations, Refunding & | 6/25 at 100.00 | A | 6,350,905 |
| Improvement Series 2015A, 5.000%, 12/01/50 | | | |
| 3,455 | South Carolina Public Service Authority, Santee Cooper Revenue Obligations, Series | 6/24 at 100.00 | A | 3,926,089 |
| 2014A, 5.500%, 12/01/54 | | | |
| 39,250 | Total South Carolina | | | 40,008,638 |
| Tennessee – 0.7% | | | |
| 1,450 | Memphis, Tennessee, Sanitary Sewerage System Revenue Bonds, Refunding Series 2020B, | 10/30 at 100.00 | AA+ | 1,876,677 |
| 5.000%, 10/01/45 | | | |
| 2,260 | Metropolitan Government of Nashville-Davidson County, Tennessee, Water and Sewerage | 7/27 at 100.00 | AA | 2,785,902 |
| Revenue Bonds, Green Series 2017A, 5.000%, 7/01/42 | | | |
| 3,000 | Tennessee State School Bond Authority, Higher Educational Facilities Second Program | 11/27 at 100.00 | AA+ | 3,679,860 |
| Bonds, Series 2017A, 5.000%, 11/01/42 | | | |
| 7,245 | The Tennessee Energy Acquisition Corporation, Gas Revenue Bonds, Series 2006C, 4.000%, | 2/23 at 100.43 | A2 | 7,735,197 |
| 5/01/48 (Mandatory Put 5/01/23) | | | |
| 13,955 | Total Tennessee | | | 16,077,636 |
| Texas – 15.1% | | | |
| 14,355 | Bexar County Hospital District, Texas, Certificates of Obligation, Series 2018, 4.000%, | 2/27 at 100.00 | Aa1 | 16,419,249 |
| 2/15/43 (UB) (7) | | | |
| 2,420 | Central Texas Regional Mobility Authority, Revenue Bonds, Refunding Senior Lien Series | 1/23 at 100.00 | A– (4) | 2,616,407 |
| 2013A, 5.000%, 1/01/43 (Pre-refunded 1/01/23) | | | |
| 2,680 | Central Texas Regional Mobility Authority, Revenue Bonds, Refunding Subordinate Lien | 1/30 at 100.00 | BBB+ | 3,115,902 |
| Series 2020G, 4.000%, 1/01/45 | | | |
| 745 | Central Texas Regional Mobility Authority, Revenue Bonds, Senior Lien Series 2020A, | 1/30 at 100.00 | A– | 940,197 |
| 5.000%, 1/01/40 | | | |
| 7,500 | Dallas-Fort Worth International Airport, Texas, Joint Revenue Bonds, Improvement Series | 11/21 at 100.00 | A1 (4) | 7,677,525 |
| 2012D, 5.000%, 11/01/38 (Pre-refunded 11/01/21) (AMT) | | | |
| 240 | Decatur Hospital Authority, Texas, Revenue Bonds, Wise Regional Health System, Series | 9/24 at 100.00 | BBB– | 267,686 |
| 2014A, 5.250%, 9/01/44 | | | |
| 5,000 | El Paso County Hospital District, Texas, General Obligation Bonds, Certificates of | 8/23 at 100.00 | A– | 5,294,750 |
| Obligation Series 2013, 5.000%, 8/15/39 | | | |
| Fort Bend County Municipal Utility District 50, Texas, General Obligation Bonds, Series 2018A: | | | |
| 2,600 | 4.000%, 9/01/46 – AGM Insured | 9/23 at 100.00 | AA | 2,742,194 |
| 5,500 | 4.000%, 9/01/48 – AGM Insured | 9/23 at 100.00 | AA | 5,723,850 |
| 3,335 | Grand Parkway Transportation Corporation, Texas, System Toll Revenue Bonds, Refunding | 4/30 at 100.00 | A+ | 3,879,239 |
| First Tier Series 2020C, 4.000%, 10/01/49 | | | |
| 27,340 | Grand Parkway Transportation Corporation, Texas, System Toll Revenue Bonds, Subordinate | 10/23 at 100.00 | AA (4) | 30,547,529 |
| Lien Series 2013B, 5.000%, 4/01/53 (Pre-refunded 10/01/23) | | | |
| 2,845 | Harris County Cultural Education Facilities Finance Corporation, Texas, Revenue Bonds, | 6/25 at 100.00 | AA | 3,098,234 |
| Houston Methodist Hospital System, Series 2015, 4.000%, 12/01/45 | | | |
| 4,000 | Harris County, Texas, Toll Road Revenue Bonds, Refunding First Lien Series 2021A, | 8/30 at 100.00 | Aa2 | 4,796,560 |
| 4.000%, 8/15/45 | | | |
| 7,295 | Harris County-Houston Sports Authority, Texas, Revenue Bonds, Capital Appreciation | 11/31 at 39.79 | AA | 2,016,995 |
| Refunding Senior Lien Series 2014A, 0.000%, 11/15/50 – AGM Insured | | | |
| Harris County-Houston Sports Authority, Texas, Revenue Bonds, Junior Lien Series 2001H: | | | |
| 845 | 0.000%, 11/15/27 (ETM) | No Opt. Call | Baa2 (4) | 789,137 |
| 11,055 | 0.000%, 11/15/27 | No Opt. Call | Baa2 | 9,407,473 |
34
| | | | | |
| Principal | | Optional Call | | |
| Amount (000) | Description (1) | Provisions (2) | Ratings (3) | Value |
| Texas (continued) | | | |
| Harris County-Houston Sports Authority, Texas, Revenue Bonds, Refunding Second Lien | | | |
| Series 2014C: | | | |
| $ 425 | 5.000%, 11/15/23 | No Opt. Call | Baa1 | $ 467,249 |
| 1,565 | 5.000%, 11/15/31 | 11/24 at 100.00 | Baa1 | 1,747,933 |
| 14,905 | Harris County-Houston Sports Authority, Texas, Revenue Bonds, Third Lien Series 2004A-3, | 11/24 at 59.10 | Baa2 | 8,008,755 |
| 0.000%, 11/15/33 – NPFG Insured | | | |
| Houston, Texas, Airport System Revenue Bonds, Refunding & Subordinate Lien Series 2018B: | | | |
| 1,590 | 5.000%, 7/01/43 | 7/28 at 100.00 | A1 | 1,951,566 |
| 2,290 | 5.000%, 7/01/48 | 7/28 at 100.00 | A1 | 2,810,929 |
| Houston, Texas, Hotel Occupancy Tax and Special Revenue Bonds, Convention and | | | |
| Entertainment Project, Series 2001B: | | | |
| 24,755 | 0.000%, 9/01/29 – AMBAC Insured | No Opt. Call | A | 20,598,883 |
| 12,940 | 0.000%, 9/01/30 – AMBAC Insured | No Opt. Call | A | 10,386,679 |
| 10,000 | 0.000%, 9/01/31 – AMBAC Insured | No Opt. Call | A | 7,751,200 |
| 19,500 | 0.000%, 9/01/32 – AMBAC Insured | No Opt. Call | A | 14,616,810 |
| 5,120 | Leander Independent School District, Williamson and Travis Counties, Texas, General | 8/25 at 100.00 | AAA | 5,991,526 |
| Obligation Bonds, Refunding Series 2015A, 5.000%, 8/15/39 | | | |
| 4,510 | Leander Independent School District, Williamson and Travis Counties, Texas, General | 8/26 at 100.00 | AAA | 5,323,739 |
| Obligation Bonds, Refunding Series 2016A, 5.000%, 8/15/49 | | | |
| 2,000 | Love Field Airport Modernization Corporation, Texas, Special Facilities Revenue Bonds, | 11/22 at 100.00 | Baa1 | 2,130,020 |
| Southwest Airlines Company – Love Field Modernization Program Project, Series 2012, | | | |
| 5.000%, 11/01/28 (AMT) | | | |
| 3,570 | Lower Colorado River Authority, Texas, Transmission Contract Revenue Bonds, LCRA | 5/30 at 100.00 | A+ | 4,467,355 |
| Transmission Services Corporation Project, Refunding Series 2020A, 5.000%, 5/15/50 | | | |
| Lubbock, Texas, Electric Light and Power System Revenue Bonds, Series 2018: | | | |
| 2,170 | 5.000%, 4/15/40 | 4/28 at 100.00 | A+ | 2,633,230 |
| 3,930 | 5.000%, 4/15/43 | 4/28 at 100.00 | A+ | 4,743,235 |
| 1,750 | Martin County Hospital District, Texas, Combination Limited Tax and Revenue Bonds, | 6/21 at 100.00 | BBB+ | 1,755,495 |
| Series 2011A, 7.250%, 4/01/36 | | | |
| North Texas Tollway Authority, System Revenue Bonds, Refunding First Tier Capital | | | |
| Appreciation Series 2008I: | | | |
| 30,000 | 6.200%, 1/01/42 – AGC Insured | 1/25 at 100.00 | AA | 35,482,200 |
| 5,220 | 6.500%, 1/01/43 | 1/25 at 100.00 | A+ | 6,211,226 |
| 15,450 | North Texas Tollway Authority, System Revenue Bonds, Refunding First Tier, Series 2008D, | No Opt. Call | AA | 11,484,294 |
| 0.000%, 1/01/36 – AGC Insured | | | |
| 9,020 | North Texas Tollway Authority, System Revenue Bonds, Refunding First Tier, Series 2015B, | 1/23 at 100.00 | A+ | 9,632,819 |
| 5.000%, 1/01/40 | | | |
| 8,000 | North Texas Tollway Authority, System Revenue Bonds, Refunding Second Tier Series 2017B, | 1/27 at 100.00 | A | 9,634,960 |
| 5.000%, 1/01/43 | | | |
| 9,100 | North Texas Tollway Authority, System Revenue Bonds, Refunding Second Tier, Series | 1/25 at 100.00 | A | 10,521,329 |
| 2015A, 5.000%, 1/01/32 | | | |
| 2,000 | San Antonio Convention Center Hotel Finance Corporation, Texas, Contract Revenue | 6/21 at 100.00 | A3 | 2,001,220 |
| Empowerment Zone Bonds, Series 2005A, 5.000%, 7/15/39 – AMBAC Insured (AMT) | | | |
| 1,750 | Tarrant County Cultural Education Facilities Finance Corporation, Texas, Revenue Bonds, | 8/26 at 100.00 | AA | 2,068,080 |
| Texas Health Resources System, Series 2016A, 5.000%, 2/15/41 | | | |
| 5,505 | Texas Municipal Gas Acquisition and Supply Corporation I, Gas Supply Revenue Bonds, | No Opt. Call | A2 | 6,468,815 |
| Senior Lien Series 2008D, 6.250%, 12/15/26 | | | |
| Texas Private Activity Bond Surface Transportation Corporation, Revenue Bonds, NTE | | | |
| Mobility Partners LLC North Tarrant Express Managed Lanes Project, Refunding Senior Lien | | | |
| Series 2019A: | | | |
| 1,400 | 5.000%, 12/31/35 | 12/29 at 100.00 | Baa2 | 1,767,402 |
| 3,000 | 5.000%, 12/31/36 | 12/29 at 100.00 | Baa2 | 3,778,290 |
| 7,180 | Texas Transportation Commission, Central Texas Turnpike System Revenue Bonds, Refunding | 8/22 at 100.00 | A (4) | 7,620,493 |
| First Tier Series 2012A, 5.000%, 8/15/41 (Pre-refunded 8/15/22) | | | |
35
| | |
| NUV | Nuveen Municipal Value Fund, Inc. Portfolio of Investments (continued) April 30, 2021 (Unaudited) |
| | | | | |
| Principal | | Optional Call | | |
| Amount (000) | Description (1) | Provisions (2) | Ratings (3) | Value |
| Texas (continued) | | | |
| $ 3,000 | Texas Transportation Commission, Central Texas Turnpike System Revenue Bonds, Refunding | 8/24 at 100.00 | A | $ 3,376,530 |
| First Tier Series 2015B, 5.000%, 8/15/37 | | | |
| 1,750 | Texas Transportation Commission, Central Texas Turnpike System Revenue Bonds, Refunding | 8/24 at 100.00 | A– | 1,968,803 |
| Second Tier Series 2015C, 5.000%, 8/15/33 | | | |
| 5,500 | Texas Turnpike Authority, Central Texas Turnpike System Revenue Bonds, First Tier Series | No Opt. Call | A | 5,271,530 |
| 2002A, 0.000%, 8/15/25 – AMBAC Insured | | | |
| Texas Water Development Board, State Water Implementation Revenue Fund Bonds, Master | | | |
| Trust Series 2017A: | | | |
| 12,500 | 4.000%, 10/15/42 (UB) (7) | 10/27 at 100.00 | AAA | 14,613,000 |
| 6,500 | 5.000%, 10/15/42 | 10/27 at 100.00 | AAA | 8,059,090 |
| 335,650 | Total Texas | | | 334,677,612 |
| Utah – 1.0% | | | |
| 5,345 | Salt Lake City, Utah, Airport Revenue Bonds, International Airport Series 2017B, 5.000%, 7/01/42 | 7/27 at 100.00 | A | 6,436,716 |
| 3,500 | Salt Lake City, Utah, Airport Revenue Bonds, International Airport Series 2018B, 5.000%, 7/01/43 | 7/28 at 100.00 | A | 4,261,565 |
| 2,500 | Salt Lake City, Utah, Public Utilities Revenue Bonds, Series 2020, 4.000%, 2/01/47 | 2/29 at 100.00 | AAA | 2,938,400 |
| Salt Lake County, Utah, Sales Tax Revenue Bonds, TRCC Series 2017: | | | |
| 695 | 5.000%, 2/01/36 | 2/27 at 100.00 | AAA | 841,207 |
| 1,150 | 5.000%, 2/01/37 | 2/27 at 100.00 | AAA | 1,388,890 |
| Utah Associated Municipal Power Systems, Revenue Bonds, Horse Butte Wind Project, | | | |
| Refunding Series 2017A: | | | |
| 1,250 | 5.000%, 9/01/29 | 3/28 at 100.00 | AA– | 1,555,737 |
| 1,000 | 5.000%, 9/01/30 | 3/28 at 100.00 | AA– | 1,237,120 |
| 1,250 | 5.000%, 9/01/31 | 3/28 at 100.00 | AA– | 1,540,763 |
| 660 | 5.000%, 9/01/32 | 3/28 at 100.00 | AA– | 811,166 |
| 540 | Utah Water Finance Agency, Revenue Bonds, Pooled Loan Financing Program, Series 2017A, | 3/27 at 100.00 | AA | 648,578 |
| 5.000%, 3/01/37 | | | |
| 17,890 | Total Utah | | | 21,660,142 |
| Virginia – 0.9% | | | |
| 1,805 | Chesapeake Bay Bridge and Tunnel District, Virginia, General Resolution Revenue Bonds, | 7/26 at 100.00 | BBB | 2,092,482 |
| First Tier Series 2016, 5.000%, 7/01/46 | | | |
| 4,355 | Tobacco Settlement Financing Corporation of Virginia, Tobacco Settlement Asset Backed | 5/21 at 100.00 | B– | 4,379,170 |
| Bonds, Series 2007B1, 5.000%, 6/01/47 | | | |
| 4,100 | Virginia Small Business Financing Authority, Private Activity Revenue Bonds, Transform 66 P3 | 6/27 at 100.00 | BBB | 4,911,308 |
| Project, Senior Lien Series 2017, 5.000%, 12/31/49 (AMT) | | | |
| Virginia Small Business Financing Authority, Senior Lien Revenue Bonds, Elizabeth River | | | |
| Crossing, Opco LLC Project, Series 2012: | | | |
| 4,180 | 5.250%, 1/01/32 (AMT) | 7/22 at 100.00 | BBB | 4,394,978 |
| 1,355 | 6.000%, 1/01/37 (AMT) | 7/22 at 100.00 | BBB | 1,437,194 |
| 3,770 | 5.500%, 1/01/42 (AMT) | 7/22 at 100.00 | BBB | 3,970,225 |
| 19,565 | Total Virginia | | | 21,185,357 |
| Washington – 3.2% | | | |
| Port of Seattle, Washington, Revenue Bonds, Refunding Intermediate Lien Series 2016: | | | |
| 1,930 | 5.000%, 2/01/29 | 2/26 at 100.00 | AA– | 2,318,876 |
| 1,000 | 5.000%, 2/01/30 | 2/26 at 100.00 | AA– | 1,200,460 |
| Spokane Public Facilities District, Washington, Hotel, Motel, and Sales Use Tax Revenue | | | |
| Bonds, Series 2017: | | | |
| 1,175 | 5.000%, 12/01/38 | 6/27 at 100.00 | A1 | 1,353,389 |
| 5,000 | 5.000%, 12/01/41 | 6/27 at 100.00 | A1 | 5,729,600 |
| 1,390 | Washington Health Care Facilities Authority, Revenue Bonds, CommonSpirit Health, Series | 8/29 at 100.00 | BBB+ | 1,574,759 |
| 2019A-1, 4.000%, 8/01/44 | | | |
| 12,000 | Washington Health Care Facilities Authority, Revenue Bonds, Providence Health & | 10/22 at 100.00 | AA– | 12,747,120 |
| Services, Refunding Series 2012A, 5.000%, 10/01/33 | | | |
36
| | | | | |
| Principal | | Optional Call | | |
| Amount (000) | Description (1) | Provisions (2) | Ratings (3) | Value |
| Washington (continued) | | | |
| $ 1,310 | Washington Health Care Facilities Authority, Revenue Bonds, Virginia Mason Medical | 8/27 at 100.00 | BBB– | $ 1,571,803 |
| Center, Series 2017, 5.000%, 8/15/30 | | | |
| Washington State Convention Center Public Facilities District, Lodging Tax Revenue | | | |
| Bonds, Series 2018: | | | |
| 2,715 | 5.000%, 7/01/36 | 7/28 at 100.00 | Baa3 | 3,222,786 |
| 7,200 | 5.000%, 7/01/43 | 7/28 at 100.00 | Baa3 | 8,449,056 |
| 7,000 | 4.000%, 7/01/58 | 7/28 at 100.00 | Baa3 | 7,602,280 |
| 3,000 | 5.000%, 7/01/58 | 7/28 at 100.00 | Baa3 | 3,479,940 |
| Washington State, Motor Vehicle Fuel Tax General Obligation Bonds, Series 2002-03C: | | | |
| 9,100 | 0.000%, 6/01/29 – NPFG Insured | No Opt. Call | Aaa | 8,175,986 |
| 16,195 | 0.000%, 6/01/30 – NPFG Insured | No Opt. Call | Aaa | 14,148,762 |
| 69,015 | Total Washington | | | 71,574,817 |
| West Virginia – 0.7% | | | |
| 1,830 | West Virginia Hospital Finance Authority, Hospital Revenue Bonds, Cabell Huntington | 1/29 at 100.00 | BBB+ | 2,252,437 |
| Hospital, Inc Project, Refunding & Improvement Series 2018A, 5.000%, 1/01/36 | | | |
| 3,750 | West Virginia Hospital Finance Authority, Hospital Revenue Bonds, Charleston Area | 9/29 at 100.00 | Baa1 | 4,566,938 |
| Medical Center, Refunding & Improvement Series 2019A, 5.000%, 9/01/39 | | | |
| 3,000 | West Virginia Hospital Finance Authority, Hospital Revenue Bonds, West Virginia United | 6/23 at 100.00 | A (4) | 3,327,720 |
| Health System Obligated Group, Refunding & Improvement Series 2013A, 5.500%, 6/01/44 | | | |
| (Pre-refunded 6/01/23) | | | |
| 3,570 | West Virginia Parkways Authority, Turnpike Toll Revenue Bonds, Senior Lien Series 2018, | 6/28 at 100.00 | AA– | 4,400,453 |
| 5.000%, 6/01/43 | | | |
| 12,150 | Total West Virginia | | | 14,547,548 |
| Wisconsin – 0.8% | | | |
| 2,375 | Wisconsin Health and Educational Facilities Authority, Revenue Bonds, Marshfield Clinic, | 2/22 at 100.00 | A– | 2,443,353 |
| Series 2012B, 5.000%, 2/15/40 | | | |
| 4,410 | Wisconsin Health and Educational Facilities Authority, Revenue Bonds, Mercy Alliance, | 6/22 at 100.00 | A3 | 4,594,073 |
| Inc, Series 2012, 5.000%, 6/01/39 | | | |
| 6,600 | Wisconsin Health and Educational Facilities Authority, Revenue Bonds, Ministry Health | 8/22 at 100.00 | N/R (4) | 7,009,332 |
| Care, Inc, Refunding 2012C, 5.000%, 8/15/32 (Pre-refunded 8/15/22) | | | |
| Wisconsin Health and Educational Facilities Authority, Wisconsin, Revenue Bonds, | | | |
| Ascension Health Alliance Senior Credit Group, Series 2016A: | | | |
| 935 | 4.000%, 11/15/46 (Pre-refunded 5/15/26) | 5/26 at 100.00 | N/R (4) | 1,091,285 |
| 2,415 | 4.000%, 11/15/46 | 5/26 at 100.00 | AA+ | 2,681,544 |
| 16,735 | Total Wisconsin | | | 17,819,587 |
| Wyoming – 0.1% | | | |
| 1,850 | West Park Hospital District, Wyoming, Hospital Revenue Bonds, Series 2011A, | 6/21 at 100.00 | BBB | 1,859,398 |
| 7.000%, 6/01/40 | | | |
| $ 2,134,521 | Total Long-Term Investments (cost $1,948,432,760) | | | 2,220,710,890 |
| Floating Rate Obligations – (1.3)% | | | (29,705,000) |
| Other Assets Less Liabilities – 1.3% | | | 30,002,729 |
| Net Assets Applicable to Common Shares – 100% | | | $ 2,221,008,619 |
37
| | |
| NUV | Nuveen Municipal Value Fund, Inc. Portfolio of Investments (continued) April 30, 2021 (Unaudited) |
| | |
(1) | All percentages shown in the Portfolio of Investments are based on net assets. |
(2) | Optional Call Provisions: Dates (month and year) and prices of the earliest optional call or redemption. There may be other call provisions at varying prices at later dates. Certain mortgage-backed securities may be subject to periodic principal paydowns.
|
(3) | For financial reporting purposes, the ratings disclosed are the highest of Standard & Poor’s Group (“Standard & Poor’s”), Moody’s Investors Service, Inc. (“Moody’s”) or Fitch, Inc. (“Fitch”) rating. This treatment of split-rated securities may differ from that used for other purposes, such as for Fund investment policies. Ratings below BBB by Standard & Poor’s, Baa by Moody’s or BBB by Fitch are considered to be below investment grade. Holdings designated N/R are not rated by any of these national rating agencies. |
(4) | Backed by an escrow or trust containing sufficient U.S. Government or U.S. Government agency securities, which ensure the timely payment of principal and interest. |
(5) | Step-up coupon bond, a bond with a coupon that increases (“steps up”), usually at regular intervals, while the bond is outstanding. The rate shown is the coupon as of the end of the reporting period.
|
(6) | Defaulted security. A security whose issuer has failed to fully pay principal and/or interest when due, or is under the protection of bankruptcy. |
(7) | Investment, or portion of investment, has been pledged to collateralize the net payment obligations for investments in inverse floating rate transactions. |
144A | Investment is exempt from registration under Rule 144A of the Securities Act of 1933, as amended. These investments may only be resold in transactions exempt from registration, which are normally those transactions with qualified institutional buyers.
|
AMT | Alternative Minimum Tax |
ETM | Escrowed to maturity |
PIK | Payment-in-kind (“PIK”) security. Depending on the terms of the security, income may be received in the form of cash, securities, or a combination of both. The PIK rate shown, where applicable, represents the annualized rate of the last PIK payment made by the issuer as of the end of the reporting period. |
UB | Underlying bond of an inverse floating rate trust reflected as a financing transaction. See Notes to Financial Statements, Note 4 – Portfolio Securities and Investments in Derivatives for more information.
|
WI/DD | Purchased on a when-issued or delayed delivery basis. |
| See accompanying notes to financial statements. |
38
| | |
| NUW | Nuveen AMT-Free Municipal Value Fund Portfolio of Investments April 30, 2021 (Unaudited) |
| | | | | |
| Principal | | Optional Call | | |
| Amount (000) | Description (1) | Provisions (2) | Ratings (3) | Value |
| LONG-TERM INVESTMENTS – 99.4% | | | |
| MUNICIPAL BONDS – 99.3% | | | |
| Alaska – 0.1% | | | |
| Northern Tobacco Securitization Corporation, Alaska, Tobacco Settlement Asset-Backed | | | |
| Bonds, Series 2006A: | | | |
| $ 45 | 4.625%, 6/01/23 | 5/21 at 100.00 | A1 | $ 45,730 |
| 385 | 5.000%, 6/01/46 | 5/21 at 100.00 | B3 | 389,840 |
| 430 | Total Alaska | | | 435,570 |
| Arizona – 1.5% | | | |
| 345 | Phoenix Civic Improvement Corporation, Arizona, Excise Tax Revenue Bonds, Subordinate | 7/30 at 100.00 | AAA | 414,221 |
| Lien Series 2020A, 4.000%, 7/01/45 | | | |
| 3,045 | Salt Verde Financial Corporation, Arizona, Senior Gas Revenue Bonds, Citigroup Energy | No Opt. Call | A3 | 4,285,167 |
| Inc Prepay Contract Obligations, Series 2007, 5.000%, 12/01/37 | | | |
| 3,390 | Total Arizona | | | 4,699,388 |
| California – 12.4% | | | |
| 1,790 | Alameda Corridor Transportation Authority, California, Revenue Bonds, Refunding Second | 10/26 at 100.00 | BBB+ | 2,109,587 |
| Subordinate Lien Series 2016B, 5.000%, 10/01/37 | | | |
| 1,730 | Anaheim Public Financing Authority, California, Lease Revenue Bonds, Public Improvement | No Opt. Call | AA | 1,481,330 |
| Project, Series 1997C, 0.000%, 9/01/30 – AGM Insured | | | |
| 45 | California County Tobacco Securitization Agency, Tobacco Settlement Asset-Backed Bonds, | 6/30 at 100.00 | BBB+ | 52,191 |
| Los Angeles County Securitization Corporation, Series 2020A, 4.000%, 6/01/49 | | | |
| 340 | California Pollution Control Financing Authority, Water Furnishing Revenue Bonds, San | 1/29 at 100.00 | BBB | 405,691 |
| Diego County Water Authority Desalination Project Pipeline, Refunding Series 2019, 5.000%, | | | |
| 11/21/45, 144A | | | |
| 540 | Golden State Tobacco Securitization Corporation, California, Tobacco Settlement | 6/22 at 100.00 | N/R | 557,955 |
| Asset-Backed Bonds, Series 2018A-1, 5.000%, 6/01/47 | | | |
| 2,040 | Los Angeles Department of Airports, California, Revenue Bonds, Los Angeles International | 5/29 at 100.00 | Aa3 | 2,656,978 |
| Airport, Private Activity/Non AMT Refunding Subordinate Series 2019C, 5.000%, 5/15/30 | | | |
| 450 | M-S-R Energy Authority, California, Gas Revenue Bonds, Citigroup Prepay Contracts, | No Opt. Call | A | 737,608 |
| Series 2009A, 6.500%, 11/01/39 | | | |
| 10,200 | Palomar Pomerado Health, California, General Obligation Bonds, Series 2009A, 7.000%, | 8/29 at 100.00 | AA | 14,538,060 |
| 8/01/38 – AGC Insured | | | |
| 1,030 | Poway Unified School District, San Diego County, California, General Obligation Bonds, | No Opt. Call | Aa2 | 779,463 |
| School Facilities Improvement District 2007-1, Series 2011A, 0.000%, 8/01/35 | | | |
| 2,470 | San Francisco Airports Commission, California, Revenue Bonds, San Francisco | 5/27 at 100.00 | A1 | 2,997,172 |
| International Airport, Governmental Purpose Second Series 2017B, 5.000%, 5/01/47 | | | |
| 12,955 | San Ysidro School District, San Diego County, California, General Obligation Bonds, 1997 | No Opt. Call | AA | 9,929,101 |
| Election Series 2012G, 0.000%, 8/01/35 – AGM Insured | | | |
| 5,185 | San Ysidro School District, San Diego County, California, General Obligation Bonds, | 8/25 at 36.88 | AA | 1,789,395 |
| Refunding Series 2015, 0.000%, 8/01/44 | | | |
| 700 | Victor Elementary School District, San Bernardino County, California, General Obligation | No Opt. Call | Aa3 | 684,999 |
| Bonds, Series 2002A, 0.000%, 8/01/24 – FGIC Insured | | | |
| 39,475 | Total California | | | 38,719,530 |
| Colorado – 5.4% | | | |
| 3,025 | Colorado Health Facilities Authority, Colorado, Revenue Bonds, CommonSpirit Health, | 8/29 at 100.00 | BBB+ | 3,727,980 |
| Series 2019A-2, 5.000%, 8/01/44 | | | |
39
| | |
| NUW | Nuveen AMT-Free Municipal Value Fund Portfolio of Investments (continued) April 30, 2021 (Unaudited) |
| | | | | |
| Principal | | Optional Call | | |
| Amount (000) | Description (1) | Provisions (2) | Ratings (3) | Value |
| Colorado (continued) | | | |
| Denver Convention Center Hotel Authority, Colorado, Revenue Bonds, Convention Center | | | |
| Hotel, Refunding Senior Lien Series 2016: | | | |
| $ 1,000 | 5.000%, 12/01/30 | 12/26 at 100.00 | Baa2 | $ 1,176,080 |
| 1,500 | 5.000%, 12/01/36 | 12/26 at 100.00 | Baa2 | 1,738,575 |
| 3,540 | Denver Health and Hospitals Authority, Colorado, Healthcare Revenue Bonds, Series 2019A, | 12/29 at 100.00 | BBB | 4,119,002 |
| 4.000%, 12/01/37 | | | |
| 5,885 | E-470 Public Highway Authority, Colorado, Toll Revenue Bonds, Series 2004A, 0.000%, | No Opt. Call | A | 4,503,026 |
| 9/01/34 – NPFG Insured | | | |
| 1,000 | Public Authority for Colorado Energy, Natural Gas Purchase Revenue Bonds, Colorado | No Opt. Call | A+ | 1,550,810 |
| Springs Utilities, Series 2008, 6.500%, 11/15/38 | | | |
| 15,950 | Total Colorado | | | 16,815,473 |
| Delaware – 0.2% | | | |
| Delaware River and Bay Authority, Delaware and New Jersey, Revenue Bonds, Series 2014A: | | | |
| 150 | 4.125%, 1/01/39 | 1/24 at 100.00 | A1 | 160,587 |
| 200 | 5.000%, 1/01/44 | 1/24 at 100.00 | A1 | 220,704 |
| 130 | Delaware River and Bay Authority, Delaware and New Jersey, Revenue Bonds, Series 2019, | 1/29 at 100.00 | A1 | 148,699 |
| 4.000%, 1/01/44 | | | |
| 480 | Total Delaware | | | 529,990 |
| District of Columbia – 1.1% | | | |
| 315 | District of Columbia Tobacco Settlement Corporation, Tobacco Settlement Asset-Backed | No Opt. Call | A– | 349,745 |
| Bonds, Series 2001, 6.500%, 5/15/33 | | | |
| 1,735 | Metropolitan Washington Airports Authority, Virginia, Dulles Toll Road Revenue Bonds, | 10/29 at 100.00 | A– | 2,135,698 |
| Dulles Metrorail & Capital improvement Projects, Refunding & Subordinate Lien Series 2019B, | | | |
| 5.000%, 10/01/47 | | | |
| 1,000 | Metropolitan Washington Airports Authority, Virginia, Dulles Toll Road Revenue Bonds, | 4/22 at 100.00 | A– | 1,037,040 |
| Dulles Metrorail & Capital Improvement Projects, Refunding Second Senior Lien Series 2014A, | | | |
| 5.000%, 10/01/53 | | | |
| 3,050 | Total District of Columbia | | | 3,522,483 |
| Florida – 3.9% | | | |
| 1,035 | Broward County, Florida, Half-Cent Sales Tax Revenue Bonds, Refunding Series 2020, | 10/30 at 100.00 | AA+ | 1,253,996 |
| 4.000%, 10/01/40 | | | |
| 1,055 | Fort Myers, Florida, Utility System Revenue Bonds, Refunding Series 2019A, 4.000%, 10/01/44 | 10/28 at 100.00 | Aa3 | 1,221,553 |
| 500 | Gainesville, Florida, Utilities System Revenue Bonds, Series 2017A, 5.000%, 10/01/37 | 10/27 at 100.00 | AA– | 619,430 |
| 1,605 | Lakeland, Florida, Hospital System Revenue Bonds, Lakeland Regional Health, Series 2015, | 11/24 at 100.00 | A2 | 1,802,463 |
| 5.000%, 11/15/45 | | | |
| 535 | Miami Beach Redevelopment Agency, Florida, Tax Increment Revenue Bonds, City | 2/24 at 100.00 | AA | 594,604 |
| Center/Historic Convention Village, Series 2015A, 5.000%, 2/01/44 – AGM Insured | | | |
| 3,350 | Miami-Dade County, Florida, Water and Sewer System Revenue Bonds, Refunding Series | 10/25 at 100.00 | AA– | 3,984,222 |
| 2017B, 5.000%, 10/01/32 | | | |
| 510 | Putnam County Development Authority, Florida, Pollution Control Revenue Bonds, Seminole | 5/28 at 100.00 | A– | 616,605 |
| Electric Cooperative, Inc Project, Refunding Series 2018B, 5.000%, 3/15/42 | | | |
| 375 | Tolomato Community Development District, Florida, Special Assessment Bonds, Convertible, | 5/22 at 100.00 | N/R | 326,779 |
| Capital Appreciation, Series 2012A-4, 0.000%, 5/01/40 (4) | | | |
| 525 | Tolomato Community Development District, Florida, Special Assessment Bonds, Hope Note, | 6/21 at 100.00 | N/R | 5 |
| Series 2007-3, 6.450%, 5/01/23 (5) | | | |
| 1,315 | Tolomato Community Development District, Florida, Special Assessment Bonds, Refunding | 6/21 at 100.00 | N/R | 1,262,597 |
| Series 2015-1, 0.000%, 5/01/40 (4) | | | |
40
| | | | | |
| Principal | | Optional Call | | |
| Amount (000) | Description (1) | Provisions (2) | Ratings (3) | Value |
| Florida (continued) | | | |
| $ 805 | Tolomato Community Development District, Florida, Special Assessment Bonds, Refunding | 6/21 at 100.00 | N/R | $ 603,525 |
| Series 2015-2, 0.000%, 5/01/40 (4) | | | |
| 880 | Tolomato Community Development District, Florida, Special Assessment Bonds, Refunding | 6/21 at 100.00 | N/R | 9 |
| Series 2015-3, 6.610%, 5/01/40 (5) | | | |
| 12,490 | Total Florida | | | 12,285,788 |
| Georgia – 2.9% | | | |
| 2,470 | Burke County Development Authority, Georgia, Pollution Control Revenue Bonds, Georgia | No Opt. Call | A– | 2,563,835 |
| Power Company, Fourth Series 1994, 2.250%, 10/01/32 (Mandatory Put 5/25/23) | | | |
| 2,000 | Gainesville and Hall County Hospital Authority, Georgia, Revenue Anticipation | 2/27 at 100.00 | AA | 2,416,520 |
| Certificates, Northeast Georgia Health Services Inc, Series 2017B, 5.500%, 2/15/42 | | | |
| 1,470 | Municipal Electric Authority of Georgia, General Resolution Projects Subordinated Bonds, | 1/28 at 100.00 | A1 | 1,759,076 |
| Series 20188HH, 5.000%, 1/01/44 | | | |
| 2,000 | Municipal Electric Authority of Georgia, Project One Revenue Bonds, Subordinate Lien | 1/25 at 100.00 | A2 | 2,279,100 |
| Series 2015A, 5.000%, 1/01/35 | | | |
| 7,940 | Total Georgia | | | 9,018,531 |
| Guam – 0.0% | | | |
| 120 | Government of Guam, Business Privilege Tax Bonds, Series 2011A, 5.250%, 1/01/36 | 1/22 at 100.00 | BB | 123,542 |
| Illinois – 8.2% | | | |
| 2,000 | Chicago Board of Education, Illinois, Dedicated Capital Improvement Tax Revenue Bonds, | 4/27 at 100.00 | A– | 2,404,140 |
| Series 2016, 6.000%, 4/01/46 | | | |
| Chicago, Illinois, General Obligation Bonds, City Colleges, Series 1999: | | | |
| 470 | 0.000%, 1/01/33 – FGIC Insured | No Opt. Call | BBB+ | 345,464 |
| 3,000 | 0.000%, 1/01/37 – FGIC Insured | No Opt. Call | BBB+ | 1,903,470 |
| 2,000 | Cook County, Illinois, Sales Tax Revenue Bonds, Series 2017, 5.000%, 11/15/38 | 11/27 at 100.00 | AA– | 2,479,460 |
| 1,800 | Evanston, Cook County, Illinois, General Obligation Bonds, Corporate Purpose Series | 12/29 at 100.00 | AA+ | 2,227,590 |
| 2019A, 5.000%, 12/01/43 | | | |
| 3,500 | Illinois Finance Authority, State of Illinois Clean Water Initiative Revolving Fund | 1/27 at 100.00 | AAA | 4,277,560 |
| Revenue Bonds, Series 2017, 5.000%, 7/01/37 | | | |
| 1,500 | Illinois State, General Obligation Bonds, November Series 2017D, 5.000%, 11/01/27 | No Opt. Call | BBB– | 1,819,440 |
| 525 | Illinois State, General Obligation Bonds, October Series 2016, 5.000%, 2/01/27 | No Opt. Call | BBB– | 634,625 |
| 495 | Metropolitan Pier and Exposition Authority, Illinois, McCormick Place Expansion Project | 12/29 at 100.00 | BBB | 555,880 |
| Bonds, Refunding Series 2020A, 4.000%, 6/15/50 | | | |
| 11,420 | Metropolitan Pier and Exposition Authority, Illinois, Revenue Bonds, McCormick Place | No Opt. Call | BBB | 7,214,928 |
| Expansion Project, Series 2002A, 0.000%, 12/15/37 – NPFG Insured | | | |
| 615 | University of Illinois, Health Services Facilities System Revenue Bonds, Series 2013, | 10/23 at 100.00 | A– | 687,189 |
| 6.000%, 10/01/42 | | | |
| Will County Community Unit School District 201-U Crete-Monee, Illinois, General | | | |
| Obligation Bonds, Capital Appreciation Series 2004: | | | |
| 300 | 0.000%, 11/01/23 – NPFG Insured (ETM) | No Opt. Call | Baa2 (6) | 296,805 |
| 745 | 0.000%, 11/01/23 – FGIC Insured | No Opt. Call | A | 726,576 |
| 28,370 | Total Illinois | | | 25,573,127 |
| Indiana – 0.5% | | | |
| 1,500 | Indianapolis Local Public Improvement Bond Bank, Indiana, Series 1999E, 0.000%, 2/01/25 – | No Opt. Call | AA | 1,465,065 |
| AMBAC Insured | | | |
| Kentucky – 3.5% | | | |
| 1,150 | Kenton County Airport Board, Kentucky, Airport Revenue Bonds, Cincinnati/Northern | 1/26 at 100.00 | A1 | 1,369,914 |
| Kentucky International Airport, Series 2016, 5.000%, 1/01/29 | | | |
| 1,000 | Kentucky Bond Development Corporation, Transient Room Tax Revenue Bonds, Lexington | 9/28 at 100.00 | A2 | 1,213,530 |
| Center Corporation Project, Series 2018A, 5.000%, 9/01/43 | | | |
41
| | |
| NUW | Nuveen AMT-Free Municipal Value Fund Portfolio of Investments (continued) April 30, 2021 (Unaudited) |
| | | | | |
| Principal | | Optional Call | | |
| Amount (000) | Description (1) | Provisions (2) | Ratings (3) | Value |
| Kentucky (continued) | | | |
| $ 2,500 | Kentucky Economic Development Finance Authority, Louisville Arena Project Revenue Bonds, | 12/22 at 100.00 | AA | $ 2,667,100 |
| Louisville Arena Authority, Inc, Series 2017A, 5.000%, 12/01/47 – AGM Insured | | | |
| 1,000 | Kentucky Economic Development Finance Authority, Revenue Bonds, CommonSpirit Health, | 8/29 at 100.00 | BBB+ | 1,278,630 |
| Series 2019A-1, 5.000%, 8/01/32 | | | |
| 3,750 | Kentucky Economic Development Finance Authority, Revenue Bonds, Next Generation Kentucky | 7/25 at 100.00 | BBB+ | 4,161,525 |
| Information Highway Project, Senior Series 2015A, 5.000%, 1/01/45 | | | |
| 325 | Louisville-Jefferson County Metropolitan Government, Kentucky, Environmental Facilities | No Opt. Call | A1 | 325,338 |
| Revenue, Louisville Gas & Electric Company Project, Refunding Series 2007A, 1.650%, 6/01/33 | | | |
| (Mandatory Put 6/01/21) | | | |
| 9,725 | Total Kentucky | | | 11,016,037 |
| Maine – 0.6% | | | |
| 1,545 | Maine Turnpike Authority, Turnpike Revenue Bonds, Series 2020, 5.000%, 7/01/36 | 7/30 at 100.00 | AA– | 2,003,788 |
| Maryland – 3.1% | | | |
| Baltimore, Maryland, Convention Center Hotel Revenue Bonds, Refunding Series 2017: | | | |
| 1,150 | 5.000%, 9/01/33 | 9/27 at 100.00 | CCC | 1,205,787 |
| 2,250 | 5.000%, 9/01/34 | 9/27 at 100.00 | CCC | 2,360,565 |
| 5,000 | Maryland Health and Higher Educational Facilities Authority, Revenue Bonds, MedStar | 5/27 at 100.00 | A | 6,024,600 |
| Health Issue, Series 2017A, 5.000%, 5/15/42 | | | |
| 8,400 | Total Maryland | | | 9,590,952 |
| Michigan – 1.1% | | | |
| 1,000 | Michigan Finance Authority, Distributable State Aid Revenue Bonds, Charter County of | 11/28 at 100.00 | Aa3 | 1,231,830 |
| Wayne Criminal Justice Center Project, Senior Lien Series 2018, 5.000%, 11/01/43 | | | |
| 500 | Michigan Finance Authority, Michigan, Revenue Bonds, Trinity Health Credit Group, | 12/22 at 100.00 | AA– (6) | 538,545 |
| Refunding Series 2017A-MI, 5.000%, 12/01/47 (Pre-refunded 12/01/22) | | | |
| 1,500 | Michigan Finance Authority, Tobacco Settlement Asset- Backed Bonds, 2007 Sold Tobacco | 12/30 at 100.00 | BBB– | 1,799,145 |
| Receipts, Series 2020B-1-CL2, 5.000%, 6/01/49 | | | |
| 3,000 | Total Michigan | | | 3,569,520 |
| Minnesota – 1.1% | | | |
| 1,145 | Rochester, Minnesota, Electric Utility Revenue Bonds, Refunding Series 2017A, 5.000%, 12/01/47 | 12/26 at 100.00 | AA | 1,364,932 |
| 700 | Southern Minnesota Municipal Power Agency, Badger Coulee Project Revenue Bonds, Series | 1/30 at 100.00 | AA– | 902,909 |
| 2019A, 5.000%, 1/01/32 | | | |
| 1,000 | University of Minnesota, General Obligation Bonds, Series 2017A, 5.000%, 9/01/36 | 9/27 at 100.00 | Aa1 | 1,231,990 |
| 2,845 | Total Minnesota | | | 3,499,831 |
| Nebraska – 0.2% | | | |
| 500 | Central Plains Energy Project, Nebraska, Gas Project 3 Revenue Bonds, Series 2012, | 9/22 at 100.00 | A2 | 531,460 |
| 5.000%, 9/01/42 | | | |
| Nevada – 5.3% | | | |
| 3,000 | Clark County, Nevada, General Obligation Bonds, Transportation Improvement, Limited Tax, | 12/28 at 100.00 | AA+ | 3,805,380 |
| Additionally Secured by Pledged Revenue Series 2018B, 5.000%, 12/01/33 | | | |
| 4,000 | Las Vegas Convention and Visitors Authority, Nevada, Revenue Bonds, Series 2018C, | 7/28 at 100.00 | Aa3 | 4,832,640 |
| 5.250%, 7/01/43 | | | |
| Las Vegas Convention and Visitors Authority, Nevada, Revenue Bonds, Series 2019B: | | | |
| 3,015 | 5.000%, 7/01/36 | 7/29 at 100.00 | Aa3 | 3,676,189 |
| 1,665 | 5.000%, 7/01/37 | 7/29 at 100.00 | Aa3 | 2,024,290 |
| 2,000 | Las Vegas Valley Water District, Nevada, General Obligation Bonds, Refunding Series | 12/24 at 100.00 | Aa1 | 2,296,960 |
| 2015, 5.000%, 6/01/39 | | | |
| 60 | Sparks, Nevada, Sales Tax Revenue Bonds, Tourism Improvement District 1 Legends at | No Opt. Call | Ba2 | 61,810 |
| Sparks Marina, Refunding Senior Series 2019A, 2.750%, 6/15/28, 144A | | | |
| 13,740 | Total Nevada | | | 16,697,269 |
42
| | | | | |
| Principal | | Optional Call | | |
| Amount (000) | Description (1) | Provisions (2) | Ratings (3) | Value |
| New Jersey – 8.8% | | | |
| Camden County Improvement Authority, New Jersey, Health Care Redevelopment Revenue | | | |
| Bonds, Cooper Health System Obligated Group Issue, Refunding Series 2014A: | | | |
| $ 105 | 5.000%, 2/15/25 | 2/24 at 100.00 | BBB+ | $ 117,701 |
| 100 | 5.000%, 2/15/34 | 2/24 at 100.00 | BBB+ | 109,664 |
| 105 | Camden County Improvement Authority, New Jersey, Health Care Redevelopment Revenue | 2/23 at 100.00 | BBB+ | 112,019 |
| Bonds, Cooper Health System Obligated Group Issue, Series 2013A, 5.750%, 2/15/42 | | | |
| 110 | Camden County Improvement Authority, New Jersey, Lease Revenue Bonds, Rowan University | 12/23 at 100.00 | A | 120,349 |
| School of Osteopathic Medicine Project, Refunding Series 2013A, 5.000%, 12/01/32 | | | |
| 80 | Cumberland County Improvement Authority, New Jersey, Guaranteed Lease Revenue Bonds, | 10/28 at 100.00 | AA | 91,559 |
| County Correctional Facility Project, Series 2018, 4.000%, 10/01/43 – BAM Insured | | | |
| Delaware River Port Authority, New Jersey and Pennsylvania, Revenue Bonds, Series 2018A: | | | |
| 175 | 5.000%, 1/01/37 | 1/29 at 100.00 | A+ | 219,490 |
| 125 | 5.000%, 1/01/38 | 1/29 at 100.00 | A+ | 156,079 |
| 295 | Delaware River Port Authority, Pennsylvania and New Jersey, Revenue Refunding Bonds, | 1/23 at 100.00 | A | 311,263 |
| Port District Project, Series 2012, 5.000%, 1/01/27 | | | |
| 245 | Garden State Preservation Trust, New Jersey, Open Space and Farmland Preservation Bonds, | No Opt. Call | AA | 303,817 |
| Series 2005A, 5.750%, 11/01/28 – AGM Insured | | | |
| Harrison, New Jersey, General Obligation Bonds, Parking Utility Series 2018: | | | |
| 35 | 3.125%, 3/01/31 – BAM Insured | 3/28 at 100.00 | AA | 38,473 |
| 30 | 3.250%, 3/01/32 – BAM Insured | 3/28 at 100.00 | AA | 33,113 |
| 50 | 3.500%, 3/01/36 – BAM Insured | 3/28 at 100.00 | AA | 55,432 |
| 150 | Hudson County Improvement Authority, New Jersey, County Secured Lease Revenue Bonds, | 5/26 at 100.00 | AA | 179,649 |
| Hudson County Vocational Technical Schools Project, Series 2016, 5.250%, 5/01/51 | | | |
| 100 | Jersey City, New Jersey, General Obligation Bonds, Refunding General Improvement Series | 11/27 at 100.00 | AA– | 125,299 |
| 2017A, 5.000%, 11/01/29 | | | |
| 50 | Mercer County, New Jersey, General Obligation Bonds, General Capital Improvement Open | No Opt. Call | N/R | 50,095 |
| Space Farmland NotesSeries 2020A, 2.000%, 6/10/21 | | | |
| 100 | Middlesex County Improvement Authority, New Jersey, Senior Revenue Bonds, Heldrich | 6/21 at 100.00 | Caa3 | 69,925 |
| Center Hotel/Conference Center Project, Series 2005A, 5.000%, 1/01/32 (5) | | | |
| 125 | Middlesex County, New Jersey, General Obligation Bonds, Refunding Redevelopment Series | No Opt. Call | AAA | 155,989 |
| 2017, 5.000%, 1/15/27 | | | |
| 115 | Monmouth County Improvement Authority, New Jersey, Governmental Pooled Loan Revenue | No Opt. Call | N/R | 115,429 |
| Bonds, Series 2020A, 2.000%, 7/12/21 | | | |
| 20 | Montclair Township, Essex County, New Jersey, General Obligation Bonds, Refunding | 1/24 at 100.00 | AAA | 22,373 |
| Parking Utility Series 2014A, 5.000%, 1/01/37 | | | |
| 100 | Montclair Township, Essex County, New Jersey, General Obligation Bonds, Refunding School | No Opt. Call | AAA | 114,016 |
| Series 2017B, 4.000%, 3/01/25 | | | |
| New Brunswick Parking Authority, Middlesex County, New Jersey, Guaranteed Parking | | | |
| Revenue Bonds, Refunding Series 2016A: | | | |
| 300 | 5.000%, 9/01/32 – BAM Insured | 9/26 at 100.00 | AA | 362,865 |
| 140 | 5.000%, 9/01/39 – BAM Insured | 9/26 at 100.00 | AA | 167,327 |
| 25 | New Jersey Economic Development Authority, Charter School Revenue Bonds, Foundation | 1/28 at 100.00 | BBB– | 28,973 |
| Academy Charter School, Series 2018A, 5.000%, 7/01/38 | | | |
| New Jersey Economic Development Authority, Charter School Revenue Bonds, North Star | | | |
| Academy Charter School of Newark, Series 2017: | | | |
| 220 | 4.000%, 7/15/37 | 7/27 at 100.00 | BBB– | 239,908 |
| 25 | 5.000%, 7/15/47 | 7/27 at 100.00 | BBB– | 28,722 |
| 100 | New Jersey Economic Development Authority, Charter School Revenue Bonds, Teaneck | 9/27 at 100.00 | BB | 106,744 |
| Community Charter School, Series 2017A, 5.125%, 9/01/52, 144A | | | |
| New Jersey Economic Development Authority, Cigarette Tax Revenue Refunding Bonds, | | | |
| Series 2012: | | | |
| 250 | 5.000%, 6/15/25 | 6/22 at 100.00 | BBB | 260,575 |
| 400 | 5.000%, 6/15/28 | 6/22 at 100.00 | BBB | 414,764 |
43
| | |
| NUW | Nuveen AMT-Free Municipal Value Fund Portfolio of Investments (continued) April 30, 2021 (Unaudited) |
| | | | | |
| Principal | | Optional Call | | |
| Amount (000) | Description (1) | Provisions (2) | Ratings (3) | Value |
| New Jersey (continued) | | | |
| $ 35 | New Jersey Economic Development Authority, Fixed Rate Revenue Bonds, Lions Gate Project, | 1/24 at 100.00 | N/R | $ 35,334 |
| Series 2014, 5.250%, 1/01/44 | | | |
| 100 | New Jersey Economic Development Authority, Lease Revenue Bonds, State House Project, | 12/28 at 100.00 | Baa1 | 117,177 |
| Series 2017B, 4.500%, 6/15/40 | | | |
| 215 | New Jersey Economic Development Authority, Natural Gas Facilities Revenue Bonds, New | 8/24 at 100.00 | A1 | 217,679 |
| Jersey Natural Gas Company Project, Refunding Series 2011A, 2.750%, 8/01/39 | | | |
| 125 | New Jersey Economic Development Authority, Revenue Bonds, Motor Vehicle Surcharge, | 7/27 at 100.00 | Baa3 | 132,790 |
| Refunding Series 2017A, 3.375%, 7/01/30 | | | |
| 55 | New Jersey Economic Development Authority, Revenue Bonds, Provident Group – Kean | 1/27 at 100.00 | B | 57,660 |
| Properties LLC – Kean University Student Housing Project, Series 2017A, 5.000%, 7/01/47 | | | |
| 100 | New Jersey Economic Development Authority, Revenue Bonds, Provident Group – Rowan | 1/25 at 100.00 | Ba3 | 104,300 |
| Properties LLC – Rowan University Student Housing Project, Series 2015A, 5.000%, 1/01/48 | | | |
| 115 | New Jersey Economic Development Authority, Revenue Bonds, The Seeing Eye Inc, Refunding | No Opt. Call | A | 132,682 |
| Series 2015, 5.000%, 3/01/25 | | | |
| New Jersey Economic Development Authority, Revenue Bonds, The Seeing Eye Inc, Refunding | | | |
| Series 2017: | | | |
| 20 | 3.000%, 6/01/32 | 12/27 at 100.00 | A | 20,543 |
| 15 | 5.000%, 6/01/32 | 12/27 at 100.00 | A | 17,710 |
| 140 | New Jersey Economic Development Authority, Revenue Bonds, United Methodist Homes of New | 7/23 at 100.00 | BBB– | 146,013 |
| Jersey Obligated Group Issue, Refunding Series 2013, 5.000%, 7/01/34 | | | |
| 40 | New Jersey Economic Development Authority, Revenue Bonds, United Methodist Homes of New | 7/24 at 100.00 | BBB– | 43,194 |
| Jersey Obligated Group Issue, Refunding Series 2014A, 5.000%, 7/01/29 | | | |
| 155 | New Jersey Economic Development Authority, Revenue Bonds, West Campus Housing LLC – New | 7/25 at 100.00 | BB– | 159,379 |
| Jersey City University Student Housing Project, Series 2015, 5.000%, 7/01/47 | | | |
| 100 | New Jersey Economic Development Authority, Revenue Bonds, White Horse HMT Urban Renewal | 1/28 at 102.00 | N/R | 100,105 |
| LLC Project, Series 2020, 5.000%, 1/01/40, 144A | | | |
| 45 | New Jersey Economic Development Authority, Rutgers University General Obligation Lease | 6/23 at 100.00 | Aa3 (6) | 63,337 |
| Revenue Bonds, Tender Option Bond Trust 2016-XF2357, 18.143%, 6/15/46 (Pre-refunded | | | |
| 6/15/23), 144A (IF) (7) | | | |
| 935 | New Jersey Economic Development Authority, School Facilities Construction Bonds, Series | No Opt. Call | Baa1 | 1,197,726 |
| 2005N-1, 5.500%, 9/01/27 – NPFG Insured | | | |
| 15 | New Jersey Economic Development Authority, School Facilities Construction Bonds, Social | 12/30 at 100.00 | Baa1 | 17,023 |
| Series 2021QQQ, 4.000%, 6/15/50 | | | |
| 145 | New Jersey Educational Facilities Authority, Revenue Bonds, College of New Jersey, | 7/26 at 100.00 | A | 153,145 |
| Refunding Series 2016F, 3.000%, 7/01/40 | | | |
| 100 | New Jersey Educational Facilities Authority, Revenue Bonds, Kean University, Refunding | 7/25 at 100.00 | AA | 110,143 |
| Series 2015H, 4.000%, 7/01/39 – AGM Insured | | | |
| 50 | New Jersey Educational Facilities Authority, Revenue Bonds, Montclair State University, | 7/24 at 100.00 | A+ | 55,799 |
| Series 2014A, 5.000%, 7/01/44 | | | |
| New Jersey Educational Facilities Authority, Revenue Bonds, Rider University, Series 2012A: | | | |
| 100 | 5.000%, 7/01/32 | 7/21 at 100.00 | BB+ | 100,205 |
| 30 | 5.000%, 7/01/37 | 7/21 at 100.00 | BB+ | 30,049 |
| New Jersey Educational Facilities Authority, Revenue Bonds, Rider University, Series 2017F: | | | |
| 5 | 3.750%, 7/01/37 | 7/27 at 100.00 | BB+ | 4,789 |
| 100 | 4.000%, 7/01/42 | 7/27 at 100.00 | BB+ | 96,800 |
| 100 | 5.000%, 7/01/47 | 7/27 at 100.00 | BB+ | 104,240 |
| 75 | New Jersey Educational Facilities Authority, Revenue Bonds, Seton Hall University, | 7/23 at 100.00 | BBB+ | 79,986 |
| Series 2013D, 5.000%, 7/01/38 | | | |
| New Jersey Educational Facilities Authority, Revenue Bonds, Seton Hall University, | | | |
| Series 2016C: | | | |
| 435 | 3.000%, 7/01/41 | 7/26 at 100.00 | BBB+ | 446,767 |
| 50 | 3.000%, 7/01/46 | 7/26 at 100.00 | BBB+ | 51,016 |
| 25 | 4.000%, 7/01/46 | 7/26 at 100.00 | BBB+ | 26,972 |
44
| | | | | |
| Principal | | Optional Call | | |
| Amount (000) | Description (1) | Provisions (2) | Ratings (3) | Value |
| New Jersey (continued) | | | |
| New Jersey Educational Facilities Authority, Revenue Bonds, Stevens Institute of | | | |
| Technology, Series 2017A: | | | |
| $ 200 | 4.000%, 7/01/47 | 7/27 at 100.00 | BBB+ | $ 218,944 |
| 30 | 5.000%, 7/01/47 | 7/27 at 100.00 | BBB+ | 34,758 |
| 25 | New Jersey Educational Facilities Authority, Revenue Bonds, The College of Saint | 7/26 at 100.00 | BB | 26,272 |
| Elizabeth, Series 2016D, 5.000%, 7/01/46 | | | |
| 200 | New Jersey Health Care Facilities Financing Authority, New Jersey, Revenue Bonds, Saint | 7/21 at 100.00 | BB+ | 201,270 |
| Peters University Hospital, Refunding Series 2011, 6.250%, 7/01/35 | | | |
| 80 | New Jersey Health Care Facilities Financing Authority, Revenue Bonds, AHS Hospital | 1/27 at 100.00 | AA– | 88,933 |
| Corporation, Refunding Series 2016, 4.000%, 7/01/41 | | | |
| 230 | New Jersey Health Care Facilities Financing Authority, Revenue Bonds, Barnabas Health, | 7/24 at 100.00 | AA– | 259,534 |
| Refunding Series 2014A, 5.000%, 7/01/44 | | | |
| New Jersey Health Care Facilities Financing Authority, Revenue Bonds, Hackensack | | | |
| Meridian Health Obligated Group, Refunding Series 2017A: | | | |
| 150 | 5.000%, 7/01/28 | 7/27 at 100.00 | AA– | 186,096 |
| 150 | 5.000%, 7/01/57 | 7/27 at 100.00 | AA– | 174,522 |
| 110 | New Jersey Health Care Facilities Financing Authority, Revenue Bonds, Hunterdon Medical | 7/24 at 100.00 | A+ | 114,936 |
| Center, Refunding Series 2014A, 4.000%, 7/01/45 | | | |
| 50 | New Jersey Health Care Facilities Financing Authority, Revenue Bonds, Inspira Health | 7/26 at 100.00 | AA– | 55,061 |
| Obligated Group Issue, Refunding Series 2016A, 4.000%, 7/01/41 | | | |
| 360 | New Jersey Health Care Facilities Financing Authority, Revenue Bonds, Inspira Health | 7/27 at 100.00 | AA– | 429,790 |
| Obligated Group Issue, Series 2017A, 5.000%, 7/01/42 (UB) (7) | | | |
| 20 | New Jersey Health Care Facilities Financing Authority, Revenue Bonds, Meridian Health | No Opt. Call | AA– | 20,155 |
| System Obligated Group, Refunding Series 2011, 5.000%, 7/01/21 | | | |
| New Jersey Health Care Facilities Financing Authority, Revenue Bonds, Palisades Medical | | | |
| Center Obligated Group Issue, Refunding Series 2013: | | | |
| 20 | 5.250%, 7/01/31 (Pre-refunded 7/01/23) | 7/23 at 100.00 | N/R (6) | 22,028 |
| 85 | 5.250%, 7/01/31 (Pre-refunded 7/01/23) | 7/23 at 100.00 | N/R (6) | 94,298 |
| New Jersey Health Care Facilities Financing Authority, Revenue Bonds, Princeton | | | |
| HealthCare System, Series 2016A: | | | |
| 25 | 5.000%, 7/01/32 | 7/26 at 100.00 | AA | 30,179 |
| 40 | 5.000%, 7/01/33 | 7/26 at 100.00 | AA | 48,220 |
| 30 | 5.000%, 7/01/34 | 7/26 at 100.00 | AA | 36,077 |
| 130 | New Jersey Health Care Facilities Financing Authority, Revenue Bonds, Robert Wood | 7/24 at 100.00 | AA– | 146,955 |
| Johnson University Hospital Issue, Series 2014A, 5.000%, 7/01/39 | | | |
| 110 | New Jersey Health Care Facilities Financing Authority, Revenue Bonds, Robert Wood | 7/23 at 100.00 | AA– | 121,464 |
| Johnson University Hospital, Series 2013A, 5.500%, 7/01/43 | | | |
| 125 | New Jersey Health Care Facilities Financing Authority, Revenue Bonds, RWJ Barnabas | 7/26 at 100.00 | AA– | 149,642 |
| Health Obligated Group, Refunding Series 2016A, 5.000%, 7/01/43 | | | |
| 75 | New Jersey Health Care Facilities Financing Authority, Revenue Bonds, Saint Barnabas | 7/21 at 100.00 | N/R (6) | 75,646 |
| Health Care System, Refunding Series 2011A, 5.625%, 7/01/37 (Pre-refunded 7/01/21) | | | |
| New Jersey Health Care Facilities Financing Authority, Revenue Bonds, Saint Joseph’s | | | |
| Healthcare System Obligated Group Issue, Refunding Series 2016: | | | |
| 10 | 3.000%, 7/01/32 | 7/26 at 100.00 | BBB– | 10,587 |
| 405 | 4.000%, 7/01/48 | 7/26 at 100.00 | BBB– | 446,152 |
| 100 | New Jersey Health Care Facilities Financing Authority, Revenue Bonds, Saint Luke’s | 8/23 at 100.00 | A– | 104,637 |
| Warren Hospital Obligated Group, Series 2013, 4.000%, 8/15/37 | | | |
| New Jersey Health Care Facilities Financing Authority, Revenue Bonds, University | | | |
| Hospital Issue, Refunding Series 2015A: | | | |
| 130 | 4.125%, 7/01/38 – AGM Insured | 7/25 at 100.00 | AA | 142,025 |
| 110 | 5.000%, 7/01/46 – AGM Insured | 7/25 at 100.00 | AA | 126,057 |
45
| | |
| NUW | Nuveen AMT-Free Municipal Value Fund Portfolio of Investments (continued) April 30, 2021 (Unaudited) |
| | | | | |
| Principal | | Optional Call | | |
| Amount (000) | Description (1) | Provisions (2) | Ratings (3) | Value |
| New Jersey (continued) | | | |
| New Jersey Health Care Facilities Financing Authority, Revenue Bonds, Valley Health | | | |
| System Obligated Group, Series 2019: | | | |
| $ 50 | 4.000%, 7/01/44 | 7/29 at 100.00 | A+ | $ 58,093 |
| 205 | 3.000%, 7/01/49 | 7/29 at 100.00 | A+ | 217,689 |
| 50 | New Jersey Health Care Facilities Financing Authority, Revenue Bonds, Village Drive | 10/26 at 102.00 | N/R | 47,775 |
| Healthcare Urban Renewal LLC, Series 2018, 5.750%, 10/01/38, 144A | | | |
| 80 | New Jersey Higher Education Assistance Authority, Student Loan Revenue Bonds, Refunding | 6/28 at 100.00 | Aa1 | 82,777 |
| Senior Series 2019A, 2.375%, 12/01/29 | | | |
| 30 | New Jersey Higher Education Assistance Authority, Student Loan Revenue Bonds, Series | 5/21 at 100.00 | Aaa | 30,022 |
| 2010-2, 5.000%, 12/01/30 | | | |
| 130 | New Jersey Housing & Mortgage Finance Agency, Multifamily Conduit Revenue Bonds, | No Opt. Call | Aaa | 132,244 |
| Riverside Village Family Apartments Phase 1 Project, Series 2019F, 1.350%, 12/01/22 | | | |
| 120 | New Jersey Housing and Mortgage Finance Agency, Multifamily Revenue Bonds, Series 2015A, | 11/24 at 100.00 | AA– | 126,446 |
| 4.000%, 11/01/45 | | | |
| 270 | New Jersey Housing and Mortgage Finance Agency, Multifamily Revenue Bonds, Series 2016B, | 11/25 at 100.00 | AA– | 285,196 |
| 3.600%, 11/01/40 | | | |
| 435 | New Jersey Housing and Mortgage Finance Agency, Multifamily Revenue Bonds, Series 2018A, | 11/27 at 100.00 | AA– | 482,907 |
| 3.875%, 11/01/38 | | | |
| 100 | New Jersey Housing and Mortgage Finance Agency, Multifamily Revenue Bonds, Series 2019A, | 11/28 at 100.00 | AA– | 105,987 |
| 2.900%, 11/01/39 | | | |
| New Jersey Housing and Mortgage Finance Agency, Multifamily Revenue Bonds, Series 2019B: | | | |
| 175 | 1.375%, 11/01/21 | No Opt. Call | AA– | 176,001 |
| 200 | 1.500%, 5/01/23 | No Opt. Call | AA– | 204,132 |
| New Jersey Housing and Mortgage Finance Agency, Single Family Housing Revenue Bonds, | | | |
| Series 2018A: | | | |
| 145 | 3.600%, 4/01/33 | 10/27 at 100.00 | AA | 158,698 |
| 90 | 3.750%, 10/01/35 | 10/27 at 100.00 | AA | 99,350 |
| 700 | New Jersey Housing and Mortgage Finance Agency, Single Family Housing Revenue Bonds, | 4/28 at 100.00 | AA | 763,049 |
| Series 2019C, 3.950%, 10/01/44 (UB) (7) | | | |
| 280 | New Jersey Housing and Mortgage Finance Agency, Single Family Housing Revenue Bonds, | 4/29 at 100.00 | AA | 284,032 |
| Series 2020E, 2.250%, 10/01/40 | | | |
| 200 | New Jersey Institute of Technology, New Jersey, General Obligation Bonds, Series 2015A, | 7/25 at 100.00 | A1 | 231,862 |
| 5.000%, 7/01/45 | | | |
| 70 | New Jersey State, General Obligation Bonds, Covid-19 Emergency Series 2020A, | No Opt. Call | A3 | 87,966 |
| 4.000%, 6/01/32 | | | |
| 100 | New Jersey State, General Obligation Bonds, Various Purpose Series 2020, 2.250%, 6/01/35 | 12/27 at 100.00 | A3 | 100,795 |
| 5,020 | New Jersey Transportation Trust Fund Authority, Transportation System Bonds, Capital | No Opt. Call | Baa1 | 3,997,878 |
| Appreciation Series 2010A, 0.000%, 12/15/31 | | | |
| 2,170 | New Jersey Transportation Trust Fund Authority, Transportation System Bonds, Series | No Opt. Call | Baa1 | 1,310,593 |
| 2009A, 0.000%, 12/15/39 | | | |
| New Jersey Transportation Trust Fund Authority, Transportation System Bonds, Series 2011A: | | | |
| 75 | 6.000%, 6/15/35 (Pre-refunded 6/15/21) | 6/21 at 100.00 | Baa1 (6) | 75,499 |
| 300 | 5.500%, 6/15/41 (Pre-refunded 6/15/21) | 6/21 at 100.00 | Baa1 (6) | 301,833 |
| New Jersey Transportation Trust Fund Authority, Transportation System Bonds, Series 2011B: | | | |
| 180 | 5.500%, 6/15/31 | 6/21 at 100.00 | Baa1 | 181,071 |
| 275 | 5.250%, 6/15/36 | 6/21 at 100.00 | Baa1 | 276,493 |
| 70 | 5.000%, 6/15/37 (Pre-refunded 6/15/21) | 6/21 at 100.00 | Baa1 (6) | 70,388 |
| 450 | 5.000%, 6/15/42 (Pre-refunded 6/15/21) | 6/21 at 100.00 | Baa1 (6) | 452,493 |
| 50 | New Jersey Transportation Trust Fund Authority, Transportation System Bonds, Series | 6/22 at 100.00 | Baa1 | 52,270 |
| 2012A, 5.000%, 6/15/42 | | | |
| 255 | New Jersey Transportation Trust Fund Authority, Transportation System Bonds, Series | 6/25 at 100.00 | Baa1 | 292,459 |
| 2015AA, 5.250%, 6/15/41 | | | |
46
| | | | | |
| Principal | | Optional Call | | |
| Amount (000) | Description (1) | Provisions (2) | Ratings (3) | Value |
| New Jersey (continued) | | | |
| $ 50 | New Jersey Transportation Trust Fund Authority, Transportation System Bonds, Series | 12/29 at 100.00 | Baa1 | $ 57,273 |
| 2019A, 4.000%, 12/15/39 | | | |
| New Jersey Transportation Trust Fund Authority, Transportation System Bonds, Series 2019BB: | | | |
| 225 | 3.500%, 6/15/46 | 12/28 at 100.00 | Baa1 | 239,337 |
| 100 | 4.000%, 6/15/50 | 12/28 at 100.00 | Baa1 | 111,932 |
| New Jersey Transportation Trust Fund Authority, Transportation System Bonds, Series 2020AA: | | | |
| 30 | 4.000%, 6/15/45 | 12/30 at 100.00 | Baa1 | 34,232 |
| 40 | 3.000%, 6/15/50 | 12/30 at 100.00 | Baa1 | 41,159 |
| 70 | 5.000%, 6/15/50 | 12/30 at 100.00 | Baa1 | 86,355 |
| 255 | New Jersey Turnpike Authority, Revenue Bonds, Refunding Series 2015E, 5.000%, 1/01/45 | 1/25 at 100.00 | A+ | 293,031 |
| 1,500 | New Jersey Turnpike Authority, Turnpike Revenue Bonds, Series 2021A, 4.000%, 1/01/42 | 1/31 at 100.00 | A+ | 1,781,580 |
| 200 | Ocean City, New Jersey, General Obligation Bonds, General Improvement Series 2019, | 9/26 at 100.00 | AA | 209,158 |
| 2.250%, 9/15/33 | | | |
| 60 | Rutgers State University, New Jersey, Revenue Bonds, Tender Option Bond Trust | 5/23 at 100.00 | Aa3 (6) | 83,317 |
| 2016-XF2356, 18.183%, 5/01/43 (Pre-refunded 5/01/23), 144A (IF) (7) | | | |
| 300 | Salem County Pollution Control Financing Authority, New Jersey, Revenue Bonds, Atlantic | No Opt. Call | A | 313,083 |
| City Electric Company Project, Refunding Series 2020, 2.250%, 6/01/29 | | | |
| 250 | South Jersey Transportation Authority, New Jersey, Transportation System Revenue Bonds, | 11/29 at 100.00 | AA | 323,892 |
| Refunding Series 2019A, 5.000%, 11/01/31 – AGM Insured | | | |
| 30 | South Jersey Transportation Authority, New Jersey, Transportation System Revenue Bonds, | 11/30 at 100.00 | BBB+ | 37,519 |
| Series 2020A, 5.000%, 11/01/45 | | | |
| 125 | Sussex County, New Jersey, General Obligation Bonds, Series 2019, 3.000%, 6/01/27 | 6/26 at 100.00 | AA+ | 139,387 |
| Tobacco Settlement Financing Corporation, New Jersey, Tobacco Settlement Asset-Backed | | | |
| Bonds, Series 2018A: | | | |
| 215 | 4.000%, 6/01/37 | 6/28 at 100.00 | A– | 247,979 |
| 305 | 5.250%, 6/01/46 | 6/28 at 100.00 | BBB+ | 368,968 |
| 480 | Tobacco Settlement Financing Corporation, New Jersey, Tobacco Settlement Asset-Backed | 6/28 at 100.00 | BB+ | 562,454 |
| Bonds, Series 2018B, 5.000%, 6/01/46 | | | |
| 110 | Union County Improvement Authority, New Jersey, General Obligation Lease Bonds, Juvenile | No Opt. Call | Aaa | 315,518 |
| Detention Center Facility Project, Tender Option Bond Trust 2015-XF1019, 24.463%, | | | |
| 5/01/30, 144A (IF) (7) | | | |
| 170 | Union County Utilities Authority, New Jersey, Solid Waste System County Deficiency | 6/21 at 100.00 | Aaa | 170,848 |
| Revenue Bonds, Series 2011A, 5.000%, 6/15/41 | | | |
| 100 | Union County, New Jersey, General Obligation Bonds, Bond Anticipation Notes Series 2020, | No Opt. Call | N/R | 100,491 |
| 4.000%, 6/18/21 | | | |
| 26,990 | Total New Jersey | | | 27,501,924 |
| New York – 6.0% | | | |
| 3,000 | Liberty Development Corporation, New York, Goldman Sachs Headquarters Revenue Bonds | No Opt. Call | A2 | 4,486,140 |
| Series 2007, 5.500%, 10/01/37 | | | |
| 1,500 | Long Island Power Authority, New York, Electric System General Revenue Bonds, Series | 9/27 at 100.00 | A | 1,840,185 |
| 2017, 5.000%, 9/01/42 | | | |
| 2,050 | Long Island Power Authority, New York, Electric System General Revenue Bonds, Series | 9/28 at 100.00 | A | 2,568,527 |
| 2018, 5.000%, 9/01/39 | | | |
| 1,390 | Metropolitan Transportation Authority, New York, Transportation Revenue Bonds, Green | 5/30 at 100.00 | A3 | 1,703,209 |
| Climate Bond Certified Series 2020C-1, 5.000%, 11/15/50 | | | |
| 750 | Metropolitan Transportation Authority, New York, Transportation Revenue Bonds, Refunding | No Opt. Call | A3 | 988,538 |
| Green Climate Certified Series 2020E, 5.000%, 11/15/30 | | | |
| 1,230 | New York City, New York, General Obligation Bonds, Fiscal 2021 Series C, 5.000%, 8/01/43 | 8/30 at 100.00 | AA | 1,557,155 |
| 1,500 | New York Liberty Development Corporation, New York, Liberty Revenue Bonds, 4 World Trade | 11/21 at 100.00 | A | 1,541,835 |
| Center Project, Series 2011, 5.750%, 11/15/51 | | | |
47
| | |
| NUW | Nuveen AMT-Free Municipal Value Fund Portfolio of Investments (continued) April 30, 2021 (Unaudited) |
| | | | | |
| Principal | | Optional Call | | |
| Amount (000) | Description (1) | Provisions (2) | Ratings (3) | Value |
| New York (continued) | | | |
| $ 315 | Port Authority of New York and New Jersey, Consolidated Revenue Bonds, One Hundred | 12/23 at 100.00 | Aa3 | $ 349,726 |
| Seventy Ninth Series 2013, 5.000%, 12/01/43 | | | |
| 3,345 | Triborough Bridge and Tunnel Authority, New York, Payroll Mobility Tax Bonds, Refunding | No Opt. Call | AA+ | 3,618,654 |
| Senior Lien Subseries 2021A-2, 2.000%, 5/15/45 (Mandatory Put 5/15/28) (DD1, | | | |
| Settling 5/05/21) | | | |
| 15,080 | Total New York | | | 18,653,969 |
| North Carolina – 1.1% | | | |
| 1,000 | North Carolina Capital Facilities Finance Agency, Revenue Bonds, Duke University | 10/26 at 100.00 | AA+ | 1,210,960 |
| Project, Refunding Series 2016B, 5.000%, 7/01/42 | | | |
| North Carolina Turnpike Authority, Triangle Expressway System Revenue Bonds, Refunding | | | |
| Senior Lien Series 2017: | | | |
| 1,095 | 5.000%, 1/01/31 – AGM Insured | 1/27 at 100.00 | AA | 1,327,041 |
| 700 | 5.000%, 1/01/32 | 1/27 at 100.00 | BBB | 835,828 |
| 2,795 | Total North Carolina | | | 3,373,829 |
| Ohio – 2.5% | | | |
| 570 | Buckeye Tobacco Settlement Financing Authority, Ohio, Tobacco Settlement Asset-Backed | 6/30 at 100.00 | BBB+ | 644,459 |
| Revenue Bonds, Refunding Senior Lien Series 2020A-2 Class 1, 4.000%, 6/01/48 | | | |
| 6,360 | Buckeye Tobacco Settlement Financing Authority, Ohio, Tobacco Settlement Asset-Backed | 6/30 at 100.00 | N/R | 7,149,721 |
| Revenue Bonds, Refunding Senior Lien Series 2020B-2 Class 2, 5.000%, 6/01/55 | | | |
| 6,930 | Total Ohio | | | 7,794,180 |
| Oklahoma – 0.1% | | | |
| 255 | Oklahoma Development Finance Authority, Health System Revenue Bonds, OU Medicine | 8/28 at 100.00 | Baa3 | 310,771 |
| Project, Series 2018B, 5.250%, 8/15/43 | | | |
| Pennsylvania – 5.2% | | | |
| 160 | Adams County, Pennsylvania, General Obligation Bonds, Series 2017B, 2.500%, 11/15/29 | 11/25 at 100.00 | Aa2 | 170,278 |
| 50 | Allegheny County Higher Education Building Authority, Pennsylvania, Revenue Bonds, | 10/27 at 100.00 | Baa3 | 57,560 |
| Robert Morris University, Series 2017, 5.000%, 10/15/37 | | | |
| 465 | Allegheny County Hospital Development Authority, Pennsylvania, Revenue Bonds, Allegheny | 4/28 at 100.00 | A | 514,443 |
| Health Network Obligated Group Issue, Series 2018A, 4.000%, 4/01/44 | | | |
| 115 | Allegheny County Hospital Development Authority, Pennsylvania, Revenue Bonds, University | 7/29 at 100.00 | A | 136,366 |
| of Pittsburgh Medical Center, Series 2019A, 4.000%, 7/15/35 | | | |
| 220 | Allegheny County, Pennsylvania, General Obligation Bonds, Series 2013C-72, 5.250%, | 12/23 at 100.00 | AA– (6) | 248,884 |
| 12/01/32 (Pre-refunded 12/01/23) | | | |
| 20 | Allegheny County, Pennsylvania, General Obligation Bonds, Series C69-C70 of 2012, | 12/22 at 100.00 | AA– (6) | 21,542 |
| 5.000%, 12/01/37 (Pre-refunded 12/01/22) | | | |
| 25 | Allentown Neighborhood Improvement Zone Development Authority, Pennsylvania, Tax | 5/22 at 100.00 | Baa3 | 25,917 |
| Revenue Bonds, Series 2012A, 5.000%, 5/01/35 | | | |
| 230 | Allentown Neighborhood Improvement Zone Development Authority, Pennsylvania, Tax Revenue | 5/27 at 100.00 | Baa3 | 265,684 |
| Bonds, City Center Refunding Project, Series 2017, 5.000%, 5/01/42, 144A | | | |
| 105 | Avon Grove School District, Chester County, Pennsylvania, General Obligation Bonds, | 5/29 at 100.00 | AA | 125,400 |
| Series 2021A, 4.000%, 11/15/37 | | | |
| 140 | Beaver County Industrial Development Authority, Pennsylvania, Pollution Control Revenue | No Opt. Call | N/R | 175 |
| Bonds, FirstEnergy Nuclear Generation Project, Refunding Series 2005A, 4.000%, 1/01/35 (5) | | | |
| 10 | Beaver County Industrial Development Authority, Pennsylvania, Pollution Control Revenue | No Opt. Call | N/R | 13 |
| Bonds, FirstEnergy Nuclear Generation Project, Refunding Series 2008A, 2.700%, 4/01/35 (5) | | | |
| 250 | Beaver County Industrial Development Authority, Pennsylvania, Pollution Control Revenue | No Opt. Call | N/R | 313 |
| Bonds, FirstEnergy Nuclear Generation Project, Series 2006B, 3.500%, 12/01/35 (5) | | | |
| 380 | Berks County Industrial Development Authority, Pennsylvania, Health System Revenue | 11/27 at 100.00 | BB– | 384,499 |
| Bonds, Tower Health Project, Series 2017, 5.000%, 11/01/50 | | | |
48
| | | | | |
| Principal | | Optional Call | | |
| Amount (000) | Description (1) | Provisions (2) | Ratings (3) | Value |
| Pennsylvania (continued) | | | |
| $ 155 | Berks County Industrial Development Authority, Pennsylvania, Healthcare Facilities | 5/27 at 100.00 | BBB | $ 175,452 |
| Revenue Bonds, Highlands at Wyomissing, Series 2017A, 5.000%, 5/15/42 | | | |
| 15 | Berks County Municipal Authority, Pennsylvania, Revenue Bonds, Alvernia University | 10/29 at 100.00 | BB+ | 16,352 |
| Project, Series 2020, 5.000%, 10/01/39 | | | |
| 125 | Bethel Park School District, Allegheny County, Pennsylvania, General Obligation Bonds, | 8/26 at 100.00 | Aa2 | 144,752 |
| Refunding Series 2016, 4.000%, 8/01/33 | | | |
| 45 | Boyertown Area School District, Berks and Montgomery Counties, Pennsylvania, General | 4/24 at 100.00 | AA– | 50,517 |
| Obligation Bonds, Series 2015, 5.000%, 10/01/38 | | | |
| 155 | Bucks County Industrial Development Authority, Pennsylvania, Hospital Revenue Bonds, | 8/30 at 100.00 | A– | 160,808 |
| Saint Luke’s University Health Network Project, Series 2021, 3.000%, 8/15/53 | | | |
| 70 | Bucks County Industrial Development Authority, Pennsylvania, Revenue Bonds, School Lane | 3/27 at 100.00 | BBB– | 79,788 |
| Charter School Project, Series 2016, 5.125%, 3/15/36 | | | |
| 175 | Bucks County Water and Sewer Authority, Pennsylvania, Revenue Bonds, Tender Option Bond | 12/21 at 100.00 | AA (6) | 189,845 |
| Trust 2015-XF0123, 13.338%, 12/01/29 (Pre-refunded 12/01/21), 144A (IF) (7) | | | |
| 20 | Bucks County Water and Sewer Authority, Pennsylvania, Water System Revenue Bonds, Series | 12/28 at 100.00 | AA | 19,426 |
| 2020, 2.125%, 12/01/45 | | | |
| 115 | Canon-McMillan School District, Washington County, Pennsylvania, General Obligation | 12/24 at 100.00 | AA | 131,218 |
| Bonds, Series 2014D, 5.000%, 12/15/39 | | | |
| 100 | Centre County Hospital Authority, Pennsylvania, Hospital Revenue Bonds, Mount Nittany | 11/25 at 100.00 | AA– | 115,551 |
| Medical Center Project, Series 2016A, 5.000%, 11/15/46 | | | |
| 75 | Chester County Health and Education Facilities Authority, Pennsylvania, Health System | 10/27 at 100.00 | AA | 86,832 |
| Revenue Bonds, Main Line Health System, Series 2017A, 4.000%, 10/01/37 | | | |
| 190 | Chester County Health and Education Facilities Authority, Pennsylvania, Health System | 9/30 at 100.00 | AA | 221,407 |
| Revenue Bonds, Main Line Health System, Series 2020A, 4.000%, 9/01/50 | | | |
| 35 | Chester County Health and Education Facilities Authority, Pennsylvania, Revenue Bonds, | 12/25 at 103.00 | N/R | 35,284 |
| Simpson Senior Services Project, Series 2019, 5.000%, 12/01/51 | | | |
| 20 | Chester County Industrial Development Authority, Pennsylvania, Avon Grove Charter School | 12/27 at 100.00 | BBB– | 22,493 |
| Revenue Bonds, Series 2017A, 5.000%, 12/15/47 | | | |
| 15 | Chester County Industrial Development Authority, Pennsylvania, Student Housing Revenue | 8/23 at 100.00 | Ba2 | 15,447 |
| Bonds, University Student Housing, LLC Project at West Chester University Series 2013A, | | | |
| 5.000%, 8/01/45 | | | |
| 100 | Chester, Delaware County, Pennsylvania, Tax and Revenue Anticipation Notes, Series 2021, | 7/21 at 100.00 | N/R | 99,998 |
| 4.500%, 11/30/21, 144A | | | |
| 35 | Clarion County Industrial Development Authority, Pennsylvania, Revenue Bonds, Clarion | 7/24 at 100.00 | A1 | 39,549 |
| University Foundation Inc Student Housing Project at Clarion University, Series 2014A, | | | |
| 5.000%, 7/01/45 | | | |
| 100 | Colonial School District, Montgomery County, Pennsylvania, General Obligation Bonds, | 2/27 at 100.00 | Aaa | 121,401 |
| Series 2020, 5.000%, 2/15/44 | | | |
| Commonwealth Financing Authority, Pennsylvania, State Appropriation Lease Bonds, Master | | | |
| Settlement, Series 2018: | | | |
| 40 | 5.000%, 6/01/33 | 6/28 at 100.00 | A1 | 49,278 |
| 155 | 4.000%, 6/01/39 – AGM Insured | 6/28 at 100.00 | AA | 177,182 |
| 200 | 4.000%, 6/01/39 – AGM Insured (UB) (7) | 6/28 at 100.00 | AA | 228,622 |
| 70 | Cumberland County Municipal Authority, Pennsylvania, Revenue Bonds, Asbury Pennsylvania | 1/25 at 104.00 | N/R | 76,627 |
| Obligated Group, Refunding Series 2019, 5.000%, 1/01/45 | | | |
| Cumberland County Municipal Authority, Pennsylvania, Revenue Bonds, Diakon Lutheran | | | |
| Social Ministries Project, Series 2015: | | | |
| 20 | 4.000%, 1/01/33 (Pre-refunded 1/01/25) | 1/25 at 100.00 | N/R (6) | 22,558 |
| 105 | 4.000%, 1/01/33 | 1/25 at 100.00 | BBB+ | 112,063 |
| 15 | 5.000%, 1/01/38 (Pre-refunded 1/01/25) | 1/25 at 100.00 | N/R (6) | 17,462 |
| 120 | 5.000%, 1/01/38 | 1/25 at 100.00 | BBB+ | 132,233 |
| 100 | Cumberland County Municipal Authority, Pennsylvania, Revenue Bonds, Diakon Lutheran | 1/26 at 100.00 | BBB+ | 115,201 |
| Social Ministries Project, Series 2016, 5.000%, 1/01/29 | | | |
49
| | |
| NUW | Nuveen AMT-Free Municipal Value Fund Portfolio of Investments (continued) April 30, 2021 (Unaudited) |
| | | | | |
| Principal | | Optional Call | | |
| Amount (000) | Description (1) | Provisions (2) | Ratings (3) | Value |
| Pennsylvania (continued) | | | |
| Cumberland County Municipal Authority, Pennsylvania, Revenue Bonds, Diakon Lutheran | | | |
| Social Ministries Project, Series 2019A: | | | |
| $ 25 | 4.125%, 1/01/38 | 1/29 at 100.00 | BBB+ | $ 28,412 |
| 30 | 5.000%, 1/01/39 | 1/29 at 100.00 | BBB+ | 35,588 |
| 100 | Cumberland County Municipal Authority, Pennsylvania, Revenue Bonds, Dickinson College | 11/27 at 100.00 | A+ | 121,819 |
| Project, Second Series 2017A, 5.000%, 11/01/39 | | | |
| 200 | Cumberland County Municipal Authority, Pennsylvania, Revenue Bonds, Penn State Health, | 11/29 at 100.00 | A+ | 230,866 |
| Series 2019, 4.000%, 11/01/44 | | | |
| 30 | Dallas Area Municipal Authority, Pennsylvania, Revenue Bonds, Misericordia University | 5/29 at 100.00 | Baa3 | 34,427 |
| Project, Series 2019, 5.000%, 5/01/48 | | | |
| 30 | Dallas Area Municipal Authority, Pennsylvania, Revenue Bonds, Misericordia University, | 5/24 at 100.00 | Baa3 | 32,347 |
| Series 2014, 5.000%, 5/01/37 | | | |
| 55 | Dauphin County General Authority, Pennsylvania, Health System Revenue Bonds, Pinnacle | 6/26 at 100.00 | A | 64,638 |
| Health System Project, Refunding Series 2016A, 5.000%, 6/01/35 | | | |
| 35 | Dauphin County General Authority, Pennsylvania, Health System Revenue Bonds, Pinnacle | 6/22 at 100.00 | A | 36,461 |
| Health System Project, Series 2012A, 5.000%, 6/01/42 | | | |
| Delaware River Joint Toll Bridge Commission, New Jersey and Pennsylvania, Bridge System | | | |
| Revenue Bonds, Series 2017: | | | |
| 245 | 5.000%, 7/01/42 | 7/27 at 100.00 | A1 | 297,450 |
| 540 | 5.000%, 7/01/47 | 7/27 at 100.00 | A1 | 649,750 |
| 295 | Delaware River Joint Toll Bridge Commission, New Jersey and Pennsylvania, Bridge System | No Opt. Call | A1 | 378,535 |
| Revenue Bonds, Series 2019A, 5.000%, 7/01/28 | | | |
| 225 | Doylestown Hospital Authority, Pennsylvania, Hospital Revenue Bonds, Series 2016A, | 7/26 at 100.00 | BBB– | 252,191 |
| 5.000%, 7/01/41 | | | |
| 25 | Doylestown Hospital Authority, Pennsylvania, Hospital Revenue Bonds, Series 2019A, | 7/29 at 100.00 | BBB– | 26,774 |
| 4.000%, 7/01/45 | | | |
| 150 | Dubois Hospital Authority, Pennsylvania, Hospital Revenue Bonds, Penn Highlands | 1/28 at 100.00 | A– | 176,509 |
| Healthcare, Series 2018, 5.000%, 7/15/48 | | | |
| 30 | East Hempfield Township Industrial Development Authority, Pennsylvania, Student Services | 7/24 at 100.00 | BB+ | 31,553 |
| Inc – Student Housing Project at Millersville University, Series 2014, 5.000%, 7/01/46 | | | |
| 100 | East Hempfield Township Industrial Development Authority, Pennsylvania, Student Services | 7/25 at 100.00 | BB+ | 106,671 |
| Inc – Student Housing Project at Millersville University, Series 2015, 5.000%, 7/01/47 | | | |
| 25 | Easton Area School District, Northampton County, Pennsylvania, General Obligation Bonds, | 2/28 at 100.00 | Aa2 | 31,542 |
| Series 2020B, 5.000%, 2/01/31 | | | |
| 60 | Erie Higher Education Building Authority, Pennsylvania, Revenue Bonds, Gannon | 11/26 at 100.00 | BBB+ | 63,974 |
| University, Series 2016, 4.000%, 5/01/46 | | | |
| 75 | General Authority of Southcentral Pennsylvania, Revenue Bonds, AICUP Financing | 10/27 at 100.00 | A– | 79,461 |
| Program-York College of Pennsylvania, Series 2017 PP4, 3.375%, 11/01/37 | | | |
| Huntingdon County General Authority, Pennsylvania, Revenue Bonds, Juniata College, | | | |
| Series 2016OO2: | | | |
| 15 | 3.250%, 5/01/36 | 5/26 at 100.00 | BBB | 15,193 |
| 35 | 3.500%, 5/01/41 | 5/26 at 100.00 | BBB | 35,529 |
| 20 | Lancaster County Hospital Authority, Pennsylvania, Health Center Revenue Bonds, Masonic | 5/25 at 100.00 | A | 22,059 |
| Villages Project, Series 2015, 5.000%, 11/01/35 | | | |
| 40 | Lancaster County Hospital Authority, Pennsylvania, Health Center Revenue Bonds, Saint | 3/27 at 102.00 | BB+ | 43,280 |
| Anne’s Retirement Community, Inc, Series 2020, 5.000%, 3/01/50 | | | |
| 100 | Lancaster County Hospital Authority, Revenue Bonds, University of Pennsylvania Health | 8/26 at 100.00 | AA | 119,284 |
| System, Refunding Series 2016B, 5.000%, 8/15/46 | | | |
| 155 | Lancaster County Hospital Authority, Revenue Bonds, University of Pennsylvania Health | 8/26 at 100.00 | AA | 185,952 |
| System, Series 2016A, 5.000%, 8/15/42 | | | |
| 55 | Lancaster Industrial Development Authority, Pennsylvania, Revenue Bonds, Garden Spot | 5/23 at 100.00 | N/R (6) | 61,099 |
| Village Project, Series 2013, 5.750%, 5/01/35 (Pre-refunded 5/01/23) | | | |
50
| | | | | |
| Principal | | Optional Call | | |
| Amount (000) | Description (1) | Provisions (2) | Ratings (3) | Value |
| Pennsylvania (continued) | | | |
| $ 25 | Lancaster School District, Lancaster County, Pennsylvania, General Obligation Bonds, | 12/28 at 100.00 | AA | $ 29,716 |
| Series 2020, 4.000%, 6/01/35 – AGM Insured | | | |
| Lehigh County Authority, Pennsylvania, Water and Sewer Revenue Bonds, Allentown | | | |
| Concession, Series 2013A: | | | |
| 95 | 5.125%, 12/01/47 | 12/23 at 100.00 | A | 105,131 |
| 105 | 5.125%, 12/01/47 (Pre-refunded 12/01/23) | 12/23 at 100.00 | N/R (6) | 118,159 |
| 100 | Lehigh County General Purpose Authority, Pennsylvania, Revenue Bonds, Good Shepherd | 5/26 at 100.00 | A | 107,873 |
| Group, Refunding Series 2016, 4.000%, 11/01/41 | | | |
| 40 | Lehigh County General Purpose Authority, Pennsylvania, Revenue Bonds, Good Shepherd | 11/22 at 100.00 | A (6) | 42,294 |
| Group, Series 2012, 4.000%, 11/01/32 (Pre-refunded 11/01/22) | | | |
| 195 | Lehighton Area School District, Carbon County, Pennsylvania, General Obligation Bonds, | 11/23 at 100.00 | AA | 215,161 |
| Limited Tax Series 2015A, 5.000%, 11/15/43 – BAM Insured | | | |
| 100 | Monroe County Industrial Development Authority, Pennsylvania, Special Obligation Revenue | 7/24 at 100.00 | N/R | 103,546 |
| Bonds, Tobyhanna Township Project, Series 2014, 6.875%, 7/01/33, 144A | | | |
| 50 | Montgomery County Higher Education and Health Authority, Pennsylvania, Revenue Bonds, | 9/28 at 100.00 | A | 61,033 |
| Thomas Jefferson University, Series 2018A, 5.000%, 9/01/48 | | | |
| Montgomery County Higher Education and Health Authority, Pennsylvania, Revenue Bonds, | | | |
| Thomas Jefferson University, Series 2019: | | | |
| 50 | 4.000%, 9/01/44 | 9/29 at 100.00 | A | 57,351 |
| 25 | 4.000%, 9/01/49 | 9/29 at 100.00 | A | 28,507 |
| 200 | Montgomery County Industrial Development Authority, Pennsylvania, Health System Revenue | 1/25 at 100.00 | Ba1 | 222,288 |
| Bonds, Albert Einstein Healthcare Network Issue, Series 2015A, 5.250%, 1/15/45 | | | |
| 200 | Montgomery County Industrial Development Authority, Pennsylvania, Revenue Bonds, ACTS | 11/26 at 100.00 | A– | 233,202 |
| Retirement-Life Communities, Inc Obligated Group, Series 2016, 5.000%, 11/15/36 | | | |
| 90 | Northampton County General Purpose Authority, Pennsylvania, Revenue Bonds, Lafayette | 11/28 at 100.00 | Aa3 | 103,791 |
| College, Refunding Series 2018, 4.000%, 11/01/38 | | | |
| 55 | Northampton County Industrial Development Authority, Pennsylvania, Revenue Bonds, | 11/26 at 103.00 | BB+ | 59,815 |
| Morningstar Senior Living, Inc, Series 2019, 5.000%, 11/01/44 | | | |
| 55 | Pennsylvania Economic Development Financing Authority, Exempt Facilities Revenue Bonds, | No Opt. Call | N/R | 69 |
| Shippingport Project, First Energy Guarantor, Series 2006A, 2.550%, 11/01/41 (5) | | | |
| 90 | Pennsylvania Economic Development Financing Authority, Exempt Facilities Revenue | 9/25 at 100.00 | B | 81,410 |
| Refunding Bonds, PPL Energy Supply, LLC Project, Series 2009A, 6.400%, 12/01/38 | | | |
| 140 | Pennsylvania Economic Development Financing Authority, Parking System Revenue Bonds, | 1/24 at 100.00 | AA | 152,986 |
| Capitol Region Parking System, Series 2013A, 5.250%, 1/01/44 – AGM Insured | | | |
| 250 | Pennsylvania Economic Development Financing Authority, Revenue Bonds, | 10/29 at 100.00 | A+ | 269,887 |
| Pennsylvania-American Water Company, Refunding Series 2019, 3.000%, 4/01/39 | | | |
| 35 | Pennsylvania Higher Educational Facilities Authority, Revenue Bonds, Holy Family | 9/23 at 100.00 | BBB– | 38,368 |
| University, Series 2013A, 6.500%, 9/01/38 | | | |
| 120 | Pennsylvania Higher Educational Facilities Authority, Revenue Bonds, Philadelphia | 6/23 at 100.00 | N/R (6) | 132,000 |
| University, Refunding Series 2013, 5.000%, 6/01/32 (Pre-refunded 6/01/23) | | | |
| 45 | Pennsylvania Higher Educational Facilities Authority, Revenue Bonds, Thomas Jefferson | 9/22 at 100.00 | A | 47,117 |
| University, Series 2012, 5.000%, 3/01/42 | | | |
| Pennsylvania Higher Educational Facilities Authority, Revenue Bonds, University of the | | | |
| Sciences in Philadelphia, Series 2012: | | | |
| 35 | 4.000%, 11/01/39 | 11/22 at 100.00 | Baa1 | 35,976 |
| 60 | 5.000%, 11/01/42 | 11/22 at 100.00 | Baa1 | 62,920 |
| 300 | Pennsylvania Higher Educational Facilities Authority, Revenue Bonds, University | 7/26 at 100.00 | Baa3 | 330,273 |
| Properties Inc Student Housing Project at East Stroudsburg University of Pennsylvania, Series | | | |
| 2016A, 5.000%, 7/01/35 | | | |
| 95 | Pennsylvania Higher Educational Facilities Authority, Revenue Bonds, Widener University, | 7/23 at 100.00 | A– | 101,130 |
| Series 2013A, 5.500%, 7/15/38 | | | |
51
| | |
| NUW | Nuveen AMT-Free Municipal Value Fund Portfolio of Investments (continued) April 30, 2021 (Unaudited) |
| | | | | |
| Principal | | Optional Call | | |
| Amount (000) | Description (1) | Provisions (2) | Ratings (3) | Value |
| Pennsylvania (continued) | | | |
| Pennsylvania Housing Finance Agency, Single Family Mortgage Revenue Bonds, Series 2012-114: | | | |
| $ 65 | 3.300%, 10/01/32 | 10/21 at 100.00 | AA+ | $ 65,608 |
| 25 | 3.650%, 10/01/37 | 10/21 at 100.00 | AA+ | 25,272 |
| 35 | 3.700%, 10/01/42 | 10/21 at 100.00 | AA+ | 35,319 |
| 50 | Pennsylvania Housing Finance Agency, Single Family Mortgage Revenue Bonds, Series | 4/25 at 100.00 | AA+ | 51,713 |
| 2016-119, 3.500%, 10/01/36 | | | |
| 435 | Pennsylvania Housing Finance Agency, Single Family Mortgage Revenue Bonds, Series | 10/25 at 100.00 | AA+ | 450,821 |
| 2016-120, 3.200%, 4/01/40 | | | |
| Pennsylvania Housing Finance Agency, Single Family Mortgage Revenue Bonds, Series 2016-121: | | | |
| 95 | 3.200%, 10/01/41 | 10/25 at 100.00 | AA+ | 98,655 |
| 380 | 3.200%, 10/01/41 (UB) (7) | 10/25 at 100.00 | AA+ | 394,619 |
| 70 | Pennsylvania Housing Finance Agency, Single Family Mortgage Revenue Bonds, Series | 10/26 at 100.00 | AA+ | 75,380 |
| 2017-123B, 3.450%, 10/01/32 | | | |
| 250 | Pennsylvania Housing Finance Agency, Single Family Mortgage Revenue Bonds, Series | 4/27 at 100.00 | AA+ | 266,212 |
| 2017-125B, 3.700%, 10/01/47 | | | |
| 250 | Pennsylvania Housing Finance Agency, Single Family Mortgage Revenue Bonds, Series | 10/28 at 100.00 | AA+ | 263,492 |
| 2019-129, 3.350%, 10/01/45 | | | |
| 125 | Pennsylvania Housing Finance Agency, Single Family Mortgage Revenue Bonds, Series | 10/28 at 100.00 | AA+ | 129,461 |
| 2019-130A, 3.000%, 10/01/46 | | | |
| 45 | Pennsylvania Housing Finance Agency, Single Family Mortgage Revenue Bonds, Series | 10/29 at 100.00 | AA+ | 46,290 |
| 2020-133, 2.500%, 10/01/45 | | | |
| 100 | Pennsylvania Turnpike Commission, Motor License Fund-Enhanced Turnpike Subordinate | 12/26 at 100.00 | AA– | 112,523 |
| Special Revenue Bonds, Series 2014A, 0.000%, 12/01/37 (4) | | | |
| 100 | Pennsylvania Turnpike Commission, Oil Franchise Tax Revenue Bonds, Subordinate Series | 12/28 at 100.00 | A+ | 121,394 |
| 2018B, 5.000%, 12/01/48 | | | |
| 585 | Pennsylvania Turnpike Commission, Turnpike Revenue Bonds, Series 2015B, 5.000%, 12/01/45 | 12/25 at 100.00 | A1 | 687,141 |
| 50 | Pennsylvania Turnpike Commission, Turnpike Revenue Bonds, Subordinate Series 2021A, | 12/30 at 100.00 | A | 57,841 |
| 4.000%, 12/01/50 | | | |
| 25 | Philadelphia Authority for Industrial Development, Pennsylvania, Charter School Revenue | 6/28 at 100.00 | BB+ | 28,806 |
| Bonds, Philadelphia Performing Arts: A String Theory Charter School, Series 2020, | | | |
| 5.000%, 6/15/50, 144A | | | |
| 70 | Philadelphia Authority for Industrial Development, Pennsylvania, Revenue Bonds, La Salle | 11/27 at 100.00 | BB+ | 70,504 |
| University, Series 2017, 3.625%, 5/01/35 | | | |
| 50 | Philadelphia Authority for Industrial Development, Pennsylvania, Revenue Bonds, | 3/28 at 100.00 | BB | 53,249 |
| University of the Arts, Series 2017, 5.000%, 3/15/45, 144A | | | |
| 105 | Philadelphia Gas Works, Pennsylvania, Revenue Bonds, 1998 General Ordinance, Sixteenth | 8/30 at 100.00 | AA | 131,628 |
| Series 2020A, 5.000%, 8/01/50 – AGM Insured | | | |
| 150 | Philadelphia Gas Works, Pennsylvania, Revenue Bonds, General Ordinance, Fifteenth Series | 8/27 at 100.00 | A | 178,800 |
| 2017, 5.000%, 8/01/47 | | | |
| 125 | Philadelphia Gas Works, Pennsylvania, Revenue Bonds, Refunding Thirteenth Series 2015, | 8/25 at 100.00 | A | 147,084 |
| 5.000%, 8/01/30 | | | |
| 145 | Philadelphia Hospitals and Higher Education Facilities Authority, Pennsylvania, Hospital | 7/22 at 100.00 | BBB– | 152,298 |
| Revenue Bonds, Temple University Health System Obligated Group, Series 2012A, | | | |
| 5.625%, 7/01/42 | | | |
| 100 | Philadelphia Hospitals and Higher Education Facilities Authority, Pennsylvania, Hospital | 7/27 at 100.00 | BBB– | 117,364 |
| Revenue Bonds, Temple University Health System Obligated Group, Series of 2017, | | | |
| 5.000%, 7/01/30 | | | |
| 55 | Philadelphia School District, Pennsylvania, General Obligation Bonds, Tax & Revenue | No Opt. Call | N/R | 55,338 |
| Anticipation Note Series 2020-21A, 4.000%, 6/30/21 | | | |
| 100 | Pittsburgh and Allegheny County Sports and Exhibition Authority, Pennsylvania, Parking | 12/27 at 100.00 | A | 124,837 |
| Revenue Bonds, Series 2017, 5.000%, 12/15/34 | | | |
| 15 | Pittsburgh School District, Allegheny County, Pennsylvania, General Obligation Bonds, | 9/22 at 100.00 | AA | 15,954 |
| Series 2014A, 5.000%, 9/01/25 – BAM Insured | | | |
52
| | | | | |
| Principal | | Optional Call | | |
| Amount (000) | Description (1) | Provisions (2) | Ratings (3) | Value |
| Pennsylvania (continued) | | | |
| $ 20 | Pittsburgh Water and Sewer Authority, Pennsylvania, Water and Sewer System Revenue | 9/30 at 100.00 | AA | $ 23,509 |
| Bonds, First Lien Series 2020B, 4.000%, 9/01/45 – AGM Insured | | | |
| 25 | Pittsburgh Water and Sewer Authority, Pennsylvania, Water and Sewer System Revenue | 9/29 at 100.00 | AA | 30,115 |
| Bonds, Refunding Subordinate Series 2019B, 4.000%, 9/01/34 – AGM Insured | | | |
| 400 | Pittsburgh, Pennsylvania, General Obligation Bonds, Series 2012B, 5.000%, 9/01/26 | 9/22 at 100.00 | AA– (6) | 425,944 |
| (Pre-refunded 9/01/22) | | | |
| 200 | Pottsville Hospital Authority, Pennsylvania, Hospital Revenue Bonds, Lehigh Valley | 1/27 at 100.00 | A+ | 237,090 |
| Health Network, Series 2016B, 5.000%, 7/01/45 | | | |
| 35 | Rostraver Township, Westmoreland County, Pennsylvania, General Obligation Bonds, Series | 9/25 at 100.00 | AA | 37,572 |
| 2018, 3.500%, 9/01/34 – AGM Insured | | | |
| 80 | Scranton, Lackawanna County, Pennsylvania, General Obligation Notes, Series 2016, | 5/24 at 100.00 | BB+ | 85,410 |
| 5.000%, 11/15/32 | | | |
| 100 | Scranton-Lackawanna Health and Welfare Authority, Pennsylvania, University Revenue | 6/26 at 100.00 | BB+ | 106,009 |
| Bonds, Marywood University, Series 2016, 5.000%, 6/01/46 | | | |
| 210 | Southcentral Pennsylvania General Authority, Revenue Bonds, Wellspan Health Obligated | 6/29 at 100.00 | Aa3 | 259,463 |
| Group, Series 2019A, 5.000%, 6/01/49 | | | |
| The Redevelopment Authority of the City of Scranton, Lackawanna county, Pennsylvania, | | | |
| Guaranteed Lease Revenue Bonds, Series 2016A: | | | |
| 5 | 5.000%, 11/15/21 | No Opt. Call | BB+ | 5,035 |
| 10 | 5.000%, 11/15/28 | 5/24 at 100.00 | BB+ | 10,260 |
| 40 | Upper Allegheny Joint Sanitary Authority, Allegheny County, Pennsylvania, Sewer Revenue | 9/29 at 100.00 | AA | 42,931 |
| Bonds, Refunding Series 2019A, 3.000%, 9/01/44 – AGM Insured | | | |
| 100 | Upper Dublin School District, Montgomery County, Pennsylvania, General Obligation Bonds, | 3/29 at 100.00 | Aa3 | 118,235 |
| Series 2021A, 4.000%, 9/15/38 | | | |
| 145 | Washington County Industrial Development Authority, Pennsylvania, College Revenue Bonds, | 11/27 at 100.00 | BBB+ | 150,797 |
| AICUP Financing Program-Washington and Jefferson College Project, Series 2017-PP5, | | | |
| 3.375%, 11/01/36 | | | |
| 15 | Washington County Redevelopment Authority, Pennsylvania, Tanger Outlet Victory Center | 1/28 at 100.00 | BB | 16,316 |
| Tax Increment Bonds, Series 2018, 5.000%, 7/01/35 | | | |
| 100 | West Shore Area Authority, Cumberland County, Pennsylvania, Hospital Revenue Bonds, Holy | 1/22 at 100.00 | A1 (6) | 103,696 |
| Spirit Hospital of the Sisters of Christian Charity, Series 2011B, 5.750%, 1/01/41 | | | |
| (Pre-refunded 1/01/22) | | | |
| 15 | Westmoreland County Industrial Development Authority, Pennsylvania, Revenue Bonds, | 1/31 at 100.00 | Baa1 | 17,187 |
| Excela Health Project, Series 2020A, 4.000%, 7/01/37 | | | |
| Williamsport Sanitary Authority, Lycoming County, Pennsylvania, Sewer Revenue Bonds, | | | |
| Series 2021: | | | |
| 100 | 5.000%, 1/01/25 – BAM Insured | No Opt. Call | AA | 116,727 |
| 25 | 5.000%, 1/01/28 – BAM Insured | No Opt. Call | AA | 31,828 |
| 15,015 | Total Pennsylvania | | | 16,285,514 |
| Puerto Rico – 2.8% | | | |
| Puerto Rico Sales Tax Financing Corporation, Sales Tax Revenue Bonds, Restructured 2018A-1: | | | |
| 3,329 | 4.500%, 7/01/34 | 7/25 at 100.00 | N/R | 3,640,661 |
| 3,740 | 4.550%, 7/01/40 | 7/28 at 100.00 | N/R | 4,150,727 |
| 72 | 5.000%, 7/01/58 | 7/28 at 100.00 | N/R | 81,292 |
| 710 | Puerto Rico Sales Tax Financing Corporation, Sales Tax Revenue Bonds, Restructured | 7/28 at 100.00 | N/R | 787,972 |
| Cofina Project Series 2019A-2A, 4.550%, 7/01/40 | | | |
| Puerto Rico Sales Tax Financing Corporation, Sales Tax Revenue Bonds, Taxable | | | |
| Restructured Cofina Project Series 2019A-2: | | | |
| 10 | 4.329%, 7/01/40 | 7/28 at 100.00 | N/R | 10,956 |
| 10 | 4.329%, 7/01/40 | 7/28 at 100.00 | N/R | 10,956 |
| 49 | 4.784%, 7/01/58 | 7/28 at 100.00 | N/R | 54,645 |
| 7,920 | Total Puerto Rico | | | 8,737,209 |
53
| | |
| NUW | Nuveen AMT-Free Municipal Value Fund Portfolio of Investments (continued) April 30, 2021 (Unaudited) |
| | | | | |
| Principal | | Optional Call | | |
| Amount (000) | Description (1) | Provisions (2) | Ratings (3) | Value |
| South Carolina – 1.5% | | | |
| $ 5,435 | Piedmont Municipal Power Agency, South Carolina, Electric Revenue Bonds, Series 2004A-2, | No Opt. Call | AA | $ 4,844,107 |
| 0.000%, 1/01/29 – AGC Insured | | | |
| Tennessee – 1.9% | | | |
| 135 | Metropolitan Government of Nashville-Davidson County Health and Educational Facilities | 7/26 at 100.00 | Aa1 | 160,537 |
| Board, Tennessee, Revenue Bonds, Vanderbilt University Medical Center, Series 2016A, | | | |
| 5.000%, 7/01/46 | | | |
| 605 | Metropolitan Government of Nashville-Davidson County, Tennessee, Water and Sewerage | 7/27 at 100.00 | AA | 745,783 |
| Revenue Bonds, Green Series 2017A, 5.000%, 7/01/42 | | | |
| 4,000 | The Tennessee Energy Acquisition Corporation, Gas Revenue Bonds, Series 2006B, | No Opt. Call | BBB | 4,916,280 |
| 5.625%, 9/01/26 | | | |
| 4,740 | Total Tennessee | | | 5,822,600 |
| Texas – 10.3% | | | |
| 1,000 | Austin Community College District Public Facility Corporation, Texas, Lease Revenue | 8/27 at 100.00 | AA | 1,206,730 |
| Bonds, Highland Campus – Building 3000 Project, Series 2018A, 5.000%, 8/01/42 | | | |
| 1,000 | Austin, Texas, Electric Utility System Revenue Bonds, Refunding Series 2017, 5.000%, 11/15/35 | 11/26 at 100.00 | AA | 1,224,320 |
| 500 | Bexar County Hospital District, Texas, Certificates of Obligation, Series 2020, 5.000%, 2/15/45 | 2/29 at 100.00 | Aa1 | 624,585 |
| 710 | Central Texas Regional Mobility Authority, Revenue Bonds, Senior Lien Series 2020A, | 1/30 at 100.00 | A– | 897,887 |
| 5.000%, 1/01/39 | | | |
| 1,855 | Grand Parkway Transportation Corporation, Texas, System Toll Revenue Bonds, First Tier | 10/23 at 100.00 | A+ (6) | 2,092,514 |
| Series 2013A, 5.500%, 4/01/53 (Pre-refunded 10/01/23) | | | |
| 1,000 | Harris County, Texas, Toll Road Revenue Bonds, Refunding First Lien Series 2021A, | No Opt. Call | Aa2 | 1,342,320 |
| 5.000%, 8/15/30 | | | |
| Houston, Texas, Hotel Occupancy Tax and Special Revenue Bonds, Convention and | | | |
| Entertainment Project, Series 2001B: | | | |
| 3,000 | 0.000%, 9/01/32 – AMBAC Insured | No Opt. Call | A | 2,248,740 |
| 7,935 | 0.000%, 9/01/33 – AMBAC Insured | No Opt. Call | A | 5,743,353 |
| 1,430 | Lower Colorado River Authority, Texas, Transmission Contract Revenue Bonds, LCRA | 5/30 at 100.00 | A+ | 1,789,445 |
| Transmission Services Corporation Project, Refunding Series 2020A, 5.000%, 5/15/50 | | | |
| 915 | North Texas Tollway Authority, System Revenue Bonds, Refunding First Tier, Series 2015B, | 1/25 at 100.00 | A+ | 1,041,170 |
| 5.000%, 1/01/45 | | | |
| 250 | Tarrant County Cultural Education Facilities Finance Corporation, Texas, Revenue Bonds, | 8/26 at 100.00 | AA | 295,440 |
| Texas Health Resources System, Series 2016A, 5.000%, 2/15/41 | | | |
| 1,600 | Texas Private Activity Bond Surface Transportation Corporation, Revenue Bonds, NTE | 12/29 at 100.00 | Baa2 | 2,019,888 |
| Mobility Partners LLC North Tarrant Express Managed Lanes Project, Refunding Senior Lien | | | |
| Series 2019A, 5.000%, 12/31/35 | | | |
| 7,635 | Texas Water Development Board, State Water Implementation Revenue Fund Bonds, Master | 10/26 at 100.00 | AAA | 8,837,665 |
| Trust Series 2016, 4.000%, 10/15/41 | | | |
| 2,500 | Texas Water Development Board, State Water Implementation Revenue Fund Bonds, Master | 10/27 at 100.00 | AAA | 2,922,600 |
| Trust Series 2017A, 4.000%, 10/15/42 (UB) (7) | | | |
| 31,330 | Total Texas | | | 32,286,657 |
| Utah – 0.5% | | | |
| 1,405 | Salt Lake City, Utah, Airport Revenue Bonds, International Airport Series 2017B, | 7/27 at 100.00 | A | 1,691,971 |
| 5.000%, 7/01/42 | | | |
54
| | | | | |
| Principal | | Optional Call | | |
| Amount (000) | Description (1) | Provisions (2) | Ratings (3) | Value |
| Virginia – 0.9% | | | |
| $ 1,160 | Chesapeake Bay Bridge and Tunnel District, Virginia, General Resolution Revenue Bonds, | 7/26 at 100.00 | BBB | $ 1,340,020 |
| First Tier Series 2016, 5.000%, 7/01/51 | | | |
| 1,400 | Chesapeake, Virginia, Transportation System Senior Toll Road Revenue Bonds, Capital | 7/28 at 100.00 | BBB+ | 1,475,250 |
| Appreciation Series 2012B, 0.000%, 7/15/40 (4) | | | |
| 2,560 | Total Virginia | | | 2,815,270 |
| Washington – 4.3% | | | |
| 3,330 | Chelan County Public Utility District 1, Washington, Columbia River-Rock Island | No Opt. Call | AA+ | 2,958,472 |
| Hydro-Electric System Revenue Refunding Bonds, Series 1997A, 0.000%, 6/01/29 – | | | |
| NPFG Insured | | | |
| 3,890 | University of Washington, General Revenue Bonds, Refunding Series 2021A, 5.000%, 4/01/46 | 4/31 at 100.00 | Aaa | 5,091,971 |
| 690 | Washington Health Care Facilities Authority, Revenue Bonds, Virginia Mason Medical | 8/27 at 100.00 | BBB– | 827,897 |
| Center, Series 2017, 5.000%, 8/15/30 | | | |
| Washington State Convention Center Public Facilities District, Lodging Tax Revenue | | | |
| Bonds, Series 2018: | | | |
| 2,015 | 5.000%, 7/01/43 | 7/28 at 100.00 | Baa3 | 2,364,562 |
| 2,000 | 5.000%, 7/01/43 | 7/28 at 100.00 | Baa1 | 2,368,660 |
| 11,925 | Total Washington | | | 13,611,562 |
| West Virginia – 2.0% | | | |
| 235 | West Virginia Hospital Finance Authority, Hospital Revenue Bonds, Cabell Huntington | 1/29 at 100.00 | BBB+ | 289,247 |
| Hospital, Inc Project, Refunding & Improvement Series 2018A, 5.000%, 1/01/36 | | | |
| 2,000 | West Virginia Hospital Finance Authority, Hospital Revenue Bonds, Charleston Area | 9/29 at 100.00 | Baa1 | 2,435,700 |
| Medical Center, Refunding & Improvement Series 2019A, 5.000%, 9/01/39 | | | |
| 1,500 | West Virginia Hospital Finance Authority, Hospital Revenue Bonds, West Virginia United | 6/23 at 100.00 | A (6) | 1,663,860 |
| Health System Obligated Group, Refunding & Improvement Series 2013A, 5.500%, 6/01/44 | | | |
| (Pre-refunded 6/01/23) | | | |
| 1,430 | West Virginia Parkways Authority, Turnpike Toll Revenue Bonds, Senior Lien Series 2018, | 6/28 at 100.00 | AA– | 1,762,647 |
| 5.000%, 6/01/43 | | | |
| 5,165 | Total West Virginia | | | 6,151,454 |
| Wisconsin – 0.3% | | | |
| 1,000 | Wisconsin Health and Educational Facilities Authority, Revenue Bonds, Marshfield Clinic, | 2/22 at 100.00 | A– | 1,028,780 |
| Series 2012B, 5.000%, 2/15/27 | | | |
| $ 291,495 | Total Municipal Bonds (cost $269,620,762) | | | 311,007,141 |
| Shares | Description (1) | | | Value |
| COMMON STOCKS – 0.1% | | | |
| Electric Utilities – 0.1% | | | |
| 14,686 | Energy Harbor Corp (8), (9), (10) | | | $ 423,148 |
| Total Common Stocks (cost $407,801) | | | 423,148 |
| Total Long-Term Investments (cost $270,028,563) | | | 311,430,289 |
55
| | |
| NUW | Nuveen AMT-Free Municipal Value Fund Portfolio of Investments (continued) April 30, 2021 (Unaudited) |
| Principal | | Optional Call | | |
| Amount (000) | Description (1) | Provisions (2) | Ratings (3) | Value |
| SHORT-TERM INVESTMENTS – 0.1% | | | |
| MUNICIPAL BONDS – 0.1% | | | |
| Pennsylvania – 0.1% | | | |
| $ 450 | Mercer County, Pennsylvania, General Obligation Bonds, Variable Rate Demand Obligation | 4/21 at 100.00 | A-1 | $ 450,000 |
| Series 2011, 0.080%, 10/01/31 – AGM Insured (11) | | | |
| $ 450 | Total Short-Term Investments (cost $450,000) | | | 450,000 |
| Total Investments (cost $270,478,563) – 99.5% | | | 311,880,289 |
| Floating Rate Obligations – (1.0)% | | | (3,230,000) |
| Other Assets Less Liabilities – 1.5% (12) | | | 4,650,809 |
| Net Assets Applicable to Common Shares – 100% | | | $ 313,301,098 |
Investments in Derivatives
Futures Contracts – Short
| | | | | | Variation |
| | | | | Unrealized | Margin |
| Number of | Expiration | Notional | | Appreciation | Receivable/ |
| Description | Contracts | Date | Amount | Value | (Depreciation) | (Payable) |
U.S. Treasury 10-Year Note | (236) | 6/21 | $(31,691,643) | $(31,159,375) | $532,268 | $(11,063) |
| | |
(1) | All percentages shown in the Portfolio of Investments are based on net assets applicable to common shares unless otherwise noted. |
(2) | Optional Call Provisions: Dates (month and year) and prices of the earliest optional call or redemption. There may be other call provisions at varying prices at later dates. Certain |
| mortgage-backed securities may be subject to periodic principal paydowns. |
(3) | For financial reporting purposes, the ratings disclosed are the highest of Standard & Poor’s Group (“Standard & Poor’s”), Moody’s Investors Service, Inc. (“Moody’s”) or Fitch, |
| Inc. (“Fitch”) rating. This treatment of split-rated securities may differ from that used for other purposes, such as for Fund investment policies. Ratings below BBB by Standard & |
| Poor’s, Baa by Moody’s or BBB by Fitch are considered to be below investment grade. Holdings designated N/R are not rated by any of these national rating agencies. |
(4) | Step-up coupon bond, a bond with a coupon that increases (“steps up”), usually at regular intervals, while the bond is outstanding. The rate shown is the coupon as of the end |
| of the reporting period. |
(5) | Defaulted security. A security whose issuer has failed to fully pay principal and/or interest when due, or is under the protection of bankruptcy. |
(6) | Backed by an escrow or trust containing sufficient U.S. Government or U.S. Government agency securities, which ensure the timely payment of principal and interest. |
(7) | Investment, or portion of investment, has been pledged to collateralize the net payment obligations for investments in inverse floating rate transactions. |
(8) | Common Stock received as part of the bankruptcy settlements during February 2020 for Beaver County Industrial Development Authority, Pennsylvania, Pollution Control |
| Revenue Bonds, FirstEnergy Nuclear Generation Project, Refunding Series 2005A, 4.000%, 1/01/35; Beaver County Industrial Development Authority, Pennsylvania, Pollution |
| Control Revenue Refunding Bonds, FirstEnergy Nuclear Generation Project, Series 2006A, 4.375%, 1/01/35; Beaver County Industrial Development Authority, Pennsylvania, |
| Pollution Control Revenue Refunding Bonds, FirstEnergy Nuclear Generation Project, Series 2006B, 3.500%, 12/01/35; and Pennsylvania Economic Development Financing |
| Authority, Exempt Facilities Revenue Bonds, Shippingport Project, First Energy Guarantor, Series 2006A, 2.550%, 11/01/41. |
(9) | For fair value measurement disclosure purposes, investment classified as Level 2. See Notes to Financial Statements, Note 3 - Investment Valuation and Fair Value Measurements for more information.
|
(10) | Non-income producing; issuer has not declared an ex-dividend date within the past twelve months. |
(11) | Investment has a maturity of greater than one year, but has variable rate and/or demand features which qualify it as a short-term investment. The rate disclosed, as well as the |
| reference rate and spread, where applicable, is that in effect as of the end of the reporting period. This rate changes periodically based on market conditions or a specified |
| market index. |
(12) | Other assets less liabilities includes the unrealized appreciation (depreciation) of certain over-the-counter (“OTC”) derivatives as presented on the Statement of Assets and |
| Liabilities, when applicable. The unrealized appreciation (depreciation) of OTC cleared and exchange-traded derivatives is recognized as part of the cash collateral at brokers |
| and/or the receivable or payable for variation margin as presented on the Statement of Assets and Liabilities, when applicable. |
144A | Investment is exempt from registration under Rule 144A of the Securities Act of 1933, as amended. These investments may only be resold in transactions exempt from registration, which are normally those transactions with qualified institutional buyers.
|
DD1 | Portion of investment purchased on a delayed delivery basis. |
ETM | Escrowed to maturity. |
IF | Inverse floating rate security issued by a tender option bond (“TOB”) trust, the interest rate on which varies inversely with the Securities Industry Financial Markets Association |
| (SIFMA) short-term rate, which resets weekly, or a similar short-term rate, and is reduced by the expenses related to the TOB trust. |
UB | Underlying bond of an inverse floating rate trust reflected as a financing transaction. See Notes to Financial Statements, Note 4 – Portfolio Securities and Investments in |
| Derivatives, Inverse Floating Rate Securities for more information. |
| See accompanying notes to financial statements. |
56
| | |
| NMI | Nuveen Municipal Income Fund, Inc. Portfolio of Investments April 30, 2021 (Unaudited) |
| | | | | |
| Principal | | Optional Call | | |
| Amount (000) | Description (1) | Provisions (2) | Ratings (3) | Value |
| LONG-TERM INVESTMENTS – 97.6% | | | |
| MUNICIPAL BONDS – 97.6% | | | |
| Alabama – 0.8% | | | |
| $ 500 | Lower Alabama Gas District, Alabama, Gas Project Revenue Bonds, Series 2016A, | No Opt. Call | A2 | $ 731,260 |
| 5.000%, 9/01/46 | | | |
| 100 | Tuscaloosa County Industrial Development Authority, Alabama, Gulf Opportunity Zone | 5/29 at 100.00 | N/R | 116,423 |
| Bonds, Hunt Refining Project, Refunding Series 2019A, 5.250%, 5/01/44, 144A | | | |
| 600 | Total Alabama | | | 847,683 |
| Arizona – 2.3% | | | |
| 600 | Arizona Health Facilities Authority, Revenue Bonds, Scottsdale Lincoln Hospitals | 12/24 at 100.00 | A+ | 677,514 |
| Project, Refunding Series 2014A, 5.000%, 12/01/39 | | | |
| 1,000 | Arizona Industrial Development Authority, Arizona, Education Revenue Bonds, Academies of | 1/28 at 100.00 | AA– | 1,168,390 |
| Math & Science Projects, Series 2018A, 5.000%, 7/01/48 | | | |
| 515 | Salt Verde Financial Corporation, Arizona, Senior Gas Revenue Bonds, Citigroup Energy | No Opt. Call | A3 | 654,987 |
| Inc Prepay Contract Obligations, Series 2007, 5.250%, 12/01/28 | | | |
| 2,115 | Total Arizona | | | 2,500,891 |
| California – 14.4% | | | |
| 5,000 | Adelanto School District, San Bernardino County, California, General Obligation Bonds, | No Opt. Call | A+ | 4,967,550 |
| Series 1997A, 0.000%, 9/01/22 – NPFG Insured | | | |
| Brea Olinda Unified School District, Orange County, California, General Obligation | | | |
| Bonds, Series 1999A: | | | |
| 2,000 | 0.000%, 8/01/21 – FGIC Insured | No Opt. Call | AA– | 1,999,180 |
| 2,070 | 0.000%, 8/01/22 – FGIC Insured | No Opt. Call | Aa2 | 2,062,838 |
| 2,120 | 0.000%, 8/01/23 – FGIC Insured | No Opt. Call | Aa2 | 2,099,818 |
| 500 | California Health Facilities Financing Authority, California, Revenue Bonds, Sutter | 11/27 at 100.00 | A1 | 572,990 |
| Health, Series 2018A, 4.000%, 11/15/42 | | | |
| 365 | California Statewide Communities Development Authority, California, Revenue Bonds, Loma | 6/28 at 100.00 | BB | 432,707 |
| Linda University Medical Center, Series 2018A, 5.500%, 12/01/58, 144A | | | |
| 275 | California Statewide Communities Development Authority, Revenue Bonds, Front Porch | 4/27 at 100.00 | A | 298,713 |
| Communities and Services Project, Series 2017A, 4.000%, 4/01/36 | | | |
| 330 | California Statewide Community Development Authority, Revenue Bonds, Daughters of | 6/21 at 100.00 | N/R | 314,089 |
| Charity Health System, Series 2005A, 5.500%, 7/01/39 (4) | | | |
| 600 | Foothill/Eastern Transportation Corridor Agency, California, Toll Road Revenue Bonds, | 7/29 at 100.00 | A– | 670,698 |
| Refunding Term Rate Sub-Series 2013B-1, 3.500%, 1/15/53 | | | |
| 300 | M-S-R Energy Authority, California, Gas Revenue Bonds, Citigroup Prepay Contracts, | No Opt. Call | A | 474,111 |
| Series 2009A, 7.000%, 11/01/34 | | | |
| 500 | San Joaquin Hills Transportation Corridor Agency, Orange County, California, Toll Road | 1/25 at 100.00 | BBB+ | 560,495 |
| Revenue Bonds, Refunding Junior Lien Series 2014B, 5.250%, 1/15/44 | | | |
| 1,000 | Union City Community Redevelopment Agency, California, Tax Allocation Revenue Bonds, | 12/21 at 100.00 | A+ (5) | 1,033,720 |
| Redevelopment Project, Subordinate Lien Series 2011, 6.000%, 12/01/22 (Pre-refunded 12/01/21) | | | |
| 15,060 | Total California | | | 15,486,909 |
| Colorado – 10.1% | | | |
| Central Platte Valley Metropolitan District, Colorado, General Obligation Bonds, | | | |
| Refunding Series 2013A: | | | |
| 150 | 5.125%, 12/01/29 | 12/23 at 100.00 | BBB | 162,969 |
| 250 | 5.375%, 12/01/33 | 12/23 at 100.00 | BBB | 271,390 |
| 350 | Colorado Health Facilities Authority, Colorado, Health Facilities Revenue Bonds, The | 6/27 at 100.00 | N/R (5) | 436,993 |
| Evangelical Lutheran Good Samaritan Society Project, Refunding Series 2017, 5.000%, 6/01/42 | | | |
| (Pre-refunded 6/01/27) | | | |
57
| | |
| NMI | Nuveen Municipal Income Fund, Inc. Portfolio of Investments (continued) April 30, 2021 (Unaudited) |
| | | | | |
| Principal | | Optional Call | | |
| Amount (000) | Description (1) | Provisions (2) | Ratings (3) | Value |
| Colorado (continued) | | | |
| $ 500 | Colorado Health Facilities Authority, Colorado, Revenue Bonds, Christian Living | 1/24 at 102.00 | N/R | $ 534,450 |
| Neighborhoods Project, Refunding Series 2016, 5.000%, 1/01/37 | | | |
| 1,140 | Colorado Health Facilities Authority, Colorado, Revenue Bonds, CommonSpirit Health, | 8/29 at 100.00 | BBB+ | 1,286,627 |
| Series 2019A-2, 4.000%, 8/01/49 | | | |
| 750 | Colorado Springs, Colorado, Utilities System Revenue Bonds, Improvement Series 2013B-1, | 11/23 at 100.00 | AA+ | 832,537 |
| 5.000%, 11/15/38 | | | |
| 1,000 | Denver City and County, Colorado, Airport System Revenue Bonds, Series 2012B, 5.000%, | 11/22 at 100.00 | AA– (5) | 1,074,110 |
| 11/15/32 (Pre-refunded 11/15/22) | | | |
| 1,395 | Denver City and County, Colorado, Airport System Revenue Bonds, Subordinate Lien Series | 12/28 at 100.00 | A+ | 1,697,841 |
| 2018A, 5.000%, 12/01/48 (AMT) | | | |
| 110 | Park Creek Metropolitan District, Colorado, Senior Limited Property Tax Supported | 12/25 at 100.00 | A | 126,611 |
| Revenue Bonds, Refunding Series 2015A, 5.000%, 12/01/45 | | | |
| 650 | Park Creek Metropolitan District, Colorado, Senior Limited Property Tax Supported | 12/28 at 100.00 | A | 731,367 |
| Revenue Bonds, Series 2018A, 4.000%, 12/01/51 | | | |
| 340 | Public Authority for Colorado Energy, Natural Gas Purchase Revenue Bonds, Colorado | No Opt. Call | A+ | 369,192 |
| Springs Utilities, Series 2008, 6.125%, 11/15/23 | | | |
| 1,100 | Rampart Range Metropolitan District 1, Lone Tree, Colorado, Limited Tax Supported and | 12/27 at 100.00 | AA | 1,341,318 |
| Special Revenue Bonds, Refunding & Improvement Series 2017, 5.000%, 12/01/42 | | | |
| 1,250 | Southshore Metropolitan District 2 Aurora, Arapahoe County, Colorado, General Obligation | 12/30 at 100.00 | AA | 1,457,162 |
| Bonds, Subordinate Limited Tax Improvement Series 2020A-2, 4.000%, 12/01/46 – BAM Insured | | | |
| 498 | Tallyn’s Reach Metropolitan District 3, Aurora, Colorado, General Obligation Bonds, | 12/23 at 100.00 | N/R (5) | 552,312 |
| Limited Tax Convertible to Unlimited Tax, Refunding & Improvement Series 2013, 5.000%, | | | |
| 12/01/33 (Pre-refunded 12/01/23) | | | |
| 9,483 | Total Colorado | | | 10,874,879 |
| Delaware – 0.1% | | | |
| 100 | Delaware Health Facilities Authority, Revenue Bonds, Beebe Medical Center Project, | 12/28 at 100.00 | BBB | 118,597 |
| Series 2018, 5.000%, 6/01/48 | | | |
| District of Columbia – 0.1% | | | |
| 105 | Metropolitan Washington Airports Authority, Virginia, Dulles Toll Road Revenue Bonds, | 10/29 at 100.00 | A– | 119,767 |
| Dulles Metrorail & Capital improvement Projects, Refunding & Subordinate Lien Series 2019B, | | | |
| 4.000%, 10/01/49 | | | |
| Florida – 5.0% | | | |
| 850 | Bay County, Florida, Educational Facilities Revenue Refunding Bonds, Bay Haven Charter | 9/23 at 100.00 | BBB | 904,825 |
| Academy, Inc Project, Series 2013A, 5.000%, 9/01/33 | | | |
| 200 | Florida Development Finance Corporation, Florida, Surface Transportation Facility | 1/24 at 107.00 | N/R | 208,000 |
| Revenue Bonds, Brightline Passenger Rail Project, Green Series 2019B, 7.375%, | | | |
| 1/01/49 (AMT), 144A | | | |
| Florida Development Finance Corporation, Florida, Surface Transportation Facility | | | |
| Revenue Bonds, Virgin Trains USA Passenger Rail Project , Series 2019A: | | | |
| 350 | 6.375%, 1/01/49 (AMT) (Mandatory Put 1/01/26), 144A | 6/21 at 104.00 | N/R | 350,977 |
| 380 | 6.500%, 1/01/49 (AMT) (Mandatory Put 1/01/29), 144A | 6/21 at 104.00 | N/R | 380,471 |
| 500 | Greater Orlando Aviation Authority, Florida, Orlando Airport Facilities Revenue Bonds, | 10/27 at 100.00 | A1 | 598,370 |
| Priority Subordinated Series 2017, 5.000%, 10/01/47 (AMT) | | | |
| 1,280 | Hillsborough County Industrial Development Authority, Florida, Hospital Revenue Bonds, | 2/31 at 100.00 | A | 1,460,160 |
| Florida Health Sciences Center Inc D/B/A Tampa General Hospital, Series 2020A, 4.000%, 8/01/50 | | | |
| 1,000 | Miami-Dade County, Florida, Water and Sewer System Revenue Bonds, Series 2013A, 5.000%, | 10/22 at 100.00 | AA– (5) | 1,068,940 |
| 10/01/42 (Pre-refunded 10/01/22) | | | |
| 310 | Orange County Health Facilities Authority, Florida, Hospital Revenue Bonds, Orlando | 4/22 at 100.00 | A+ (5) | 323,671 |
| Health, Inc, Series 2012A, 5.000%, 10/01/42 (Pre-refunded 4/01/22) | | | |
| 100 | Tampa, Florida, Revenue Bonds, H Lee Moffitt Cancer Center and Research Institute, | 7/30 at 100.00 | A2 | 115,642 |
| Series 2020B, 4.000%, 7/01/45 | | | |
| 4,970 | Total Florida | | | 5,411,056 |
58
| | | | | |
| Principal | | Optional Call | | |
| Amount (000) | Description (1) | Provisions (2) | Ratings (3) | Value |
| Georgia – 2.7% | | | |
| $ 455 | Atlanta Development Authority, Georgia, Revenue Bonds, New Downtown Atlanta Stadium | 7/25 at 100.00 | A+ | $ 526,453 |
| Project, Senior Lien Series 2015A-1, 5.250%, 7/01/40 | | | |
| 350 | Atlanta Urban Residential Finance Authority, Georgia, Multifamily Housing Revenue Bonds, | 11/23 at 100.00 | BB+ | 349,881 |
| Testletree Village Apartments, Series 2013A, 4.000%, 11/01/25 | | | |
| 370 | Fulton County Development Authority, Georgia, Revenue Bonds, Piedmont Healthcare, Inc | 7/29 at 100.00 | AA– | 426,410 |
| Project, Series 2019A, 4.000%, 7/01/49 | | | |
| 255 | Georgia Municipal Electric Authority, Plant Vogtle Units 3 & 4 Project M Bonds, Series | 7/28 at 100.00 | A | 302,211 |
| 2019A, 5.000%, 1/01/63 | | | |
| 300 | Main Street Natural Gas Inc, Georgia, Gas Project Revenue Bonds, Series 2006B, | No Opt. Call | A+ | 312,129 |
| 5.000%, 3/15/22 | | | |
| 850 | Rockdale County Development Authority, Georgia, Revenue Bonds, Piedmont Healthcare, Inc | 7/29 at 100.00 | AA– | 985,499 |
| Project, Series 2019A, 4.000%, 7/01/44 | | | |
| 2,580 | Total Georgia | | | 2,902,583 |
| Hawaii – 0.3% | | | |
| 250 | Hawaii Department of Budget and Finance, Special Purpose Revenue Bonds, Hawaii Pacific | 7/23 at 100.00 | BB | 272,075 |
| University, Series 2013A, 6.625%, 7/01/33 | | | |
| Illinois – 10.8% | | | |
| 250 | Chicago Board of Education, Illinois, Dedicated Capital Improvement Tax Revenue Bonds, | 4/27 at 100.00 | A– | 300,518 |
| Series 2016, 6.000%, 4/01/46 | | | |
| 435 | Chicago Board of Education, Illinois, General Obligation Bonds, Dedicated Revenues, | 12/28 at 100.00 | BB | 509,341 |
| Refunding Series 2018D, 5.000%, 12/01/46 | | | |
| 650 | Chicago Board of Education, Illinois, General Obligation Bonds, Dedicated Revenues, | 12/25 at 100.00 | BB | 784,420 |
| Series 2016A, 7.000%, 12/01/44 | | | |
| 1,000 | Illinois Educational Facilities Authority, Revenue Bonds, Field Museum of Natural | 11/24 at 100.00 | A | 1,126,070 |
| History, Series 2002RMKT, 4.500%, 11/01/36 | | | |
| 280 | Illinois Finance Authority, Revenue Bonds, Palos Community Hospital, Series 2010C, | 6/21 at 100.00 | AA+ | 280,801 |
| 5.125%, 5/15/35 | | | |
| 80 | Illinois Finance Authority, Revenue Bonds, Rehabilitation Institute of Chicago, Series | 7/23 at 100.00 | A– | 86,404 |
| 2013A, 5.500%, 7/01/28 | | | |
| 200 | Illinois Finance Authority, Revenue Bonds, Silver Cross Hospital and Medical Centers, | 8/25 at 100.00 | A3 | 224,606 |
| Refunding Series 2015C, 5.000%, 8/15/44 | | | |
| 400 | Illinois State, General Obligation Bonds, May Series 2020, 5.500%, 5/01/39 | 5/30 at 100.00 | BBB– | 510,528 |
| 990 | Illinois State, General Obligation Bonds, Series 2013, 5.250%, 7/01/31 | 7/23 at 100.00 | BBB– | 1,074,190 |
| 1,555 | Metropolitan Pier and Exposition Authority, Illinois, McCormick Place Expansion Project | 6/22 at 100.00 | BBB | 1,607,139 |
| Bonds, Refunding Series 2012B, 5.000%, 6/15/52 | | | |
| 200 | Metropolitan Pier and Exposition Authority, Illinois, McCormick Place Expansion Project | 12/25 at 100.00 | BBB | 230,556 |
| Bonds, Series 2015A, 5.500%, 6/15/53 | | | |
| Metropolitan Pier and Exposition Authority, Illinois, McCormick Place Expansion Project | | | |
| Bonds, Series 2017A: | | | |
| 3,000 | 0.000%, 12/15/56 – BAM Insured | No Opt. Call | AA | 1,031,250 |
| 6,000 | 0.000%, 12/15/56 | No Opt. Call | BBB | 1,817,940 |
| 205 | Metropolitan Pier and Exposition Authority, Illinois, Revenue Bonds, McCormick Place | No Opt. Call | BBB | 140,093 |
| Expansion Project, Series 2002A, 0.000%, 12/15/35 – NPFG Insured | | | |
| 450 | Quad Cities Regional Economic Development Authority, Illinois, Revenue Bonds, Augustana | 10/22 at 100.00 | Baa1 | 471,082 |
| College, Series 2012, 5.000%, 10/01/27 | | | |
| 800 | Railsplitter Tobacco Settlement Authority, Illinois, Tobacco Settlement Revenue Bonds, | 6/21 at 100.00 | N/R (5) | 803,536 |
| Series 2010, 6.000%, 6/01/28 (Pre-refunded 6/01/21) | | | |
| 490 | University of Illinois, Health Services Facilities System Revenue Bonds, Series 2013, | 10/23 at 100.00 | A– | 548,202 |
| 6.000%, 10/01/32 | | | |
| 16,985 | Total Illinois | | | 11,546,676 |
59
| | |
| NMI | Nuveen Municipal Income Fund, Inc. Portfolio of Investments (continued) April 30, 2021 (Unaudited) |
| | | | | |
| Principal | | Optional Call | | |
| Amount (000) | Description (1) | Provisions (2) | Ratings (3) | Value |
| Indiana – 2.9% | | | |
| $ 735 | Gary Local Public Improvement Bond Bank, Indiana, Economic Development Revenue Bonds, | 6/30 at 100.00 | N/R | $ 774,021 |
| Drexel Foundation for Educational Excellence Project, Refunding Series 2020A, 5.875%, | | | |
| 6/01/55, 144A | | | |
| 1,000 | Indiana Finance Authority, Hospital Revenue Bonds, Marion General Hospital Project, | 7/30 at 100.00 | A | 1,141,240 |
| Series 2020A, 4.000%, 7/01/50 | | | |
| 655 | Indiana Finance Authority, Private Activity Bonds, Ohio River Bridges East End Crossing | 7/23 at 100.00 | A– | 712,372 |
| Project, Series 2013A, 5.000%, 7/01/44 (AMT) | | | |
| 500 | Vigo County Hospital Authority, Indiana, Hospital Revenue Bonds, Union Hospital, Inc, | 9/21 at 100.00 | N/R (5) | 512,575 |
| Series 2011, 8.000%, 9/01/41 (Pre-refunded 9/01/21) | | | |
| 2,890 | Total Indiana | | | 3,140,208 |
| Iowa – 0.8% | | | |
| 835 | Iowa Higher Education Loan Authority, Private College Facility Revenue Bonds, University | 10/21 at 100.00 | BBB | 851,608 |
| of Dubuque Project, Refunding Series 2011, 5.625%, 10/01/26 | | | |
| Louisiana – 2.4% | | | |
| 1,000 | East Baton Rouge Sewerage Commission, Louisiana, Revenue Bonds, Refunding Series 2019A, | 2/29 at 100.00 | AA– | 1,175,530 |
| 4.000%, 2/01/45 | | | |
| 1,000 | Louisiana Public Facilities Authority, Louisiana, Revenue Bonds, Ochsner Clinic Foundation | 5/30 at 100.00 | A | 1,154,130 |
| Project, Series 2020A, 4.000%, 5/15/49 | | | |
| 200 | New Orleans Aviation Board, Louisiana, General Airport Revenue Bonds, North Terminal | 1/27 at 100.00 | A2 | 235,758 |
| Project, Series 2017B, 5.000%, 1/01/48 (AMT) | | | |
| 2,200 | Total Louisiana | | | 2,565,418 |
| Maine – 0.5% | | | |
| 500 | Maine Health and Higher Educational Facilities Authority Revenue Bonds, Eastern Maine | 7/23 at 100.00 | BBB | 521,985 |
| Medical Center Obligated Group Issue, Series 2013, 5.000%, 7/01/43 | | | |
| Maryland – 0.8% | | | |
| 250 | Maryland Health and Higher Educational Facilities Authority, Revenue Bonds, LifeBridge | 7/27 at 100.00 | A+ | 281,245 |
| Health Issue, Series 2017, 4.000%, 7/01/42 | | | |
| 500 | Maryland Health and Higher Educational Facilities Authority, Revenue Bonds, Peninsula | 7/24 at 100.00 | A (5) | 574,150 |
| Regional Medical Center Issue, Refunding Series 2015, 5.000%, 7/01/45 (Pre-refunded 7/01/24) | | | |
| 750 | Total Maryland | | | 855,395 |
| Massachusetts – 0.6% | | | |
| 50 | Massachusetts Development Finance Agency, Revenue Bonds, Atrius Health Issue, Series | 6/29 at 100.00 | BBB | 56,362 |
| 2019A, 4.000%, 6/01/49 | | | |
| 500 | Massachusetts Development Finance Agency, Revenue Bonds, UMass Memorial Health Care, | 7/26 at 100.00 | A– | 592,925 |
| Series 2016I, 5.000%, 7/01/46 | | | |
| 550 | Total Massachusetts | | | 649,287 |
| Michigan – 3.4% | | | |
| 355 | Detroit Water and Sewerage Department, Michigan, Sewage Disposal System Revenue Bonds, | 7/22 at 100.00 | AA– (5) | 376,158 |
| Refunding Senior Lien Series 2012A, 5.250%, 7/01/39 (Pre-refunded 7/01/22) | | | |
| 1,000 | Michigan Finance Authority, Distributable State Aid Revenue Bonds, Charter County of | 11/30 at 100.00 | AA | 1,162,210 |
| Wayne, Second Lien Refunding Series 2020, 4.000%, 11/01/50 | | | |
| 1,000 | Michigan Finance Authority, Hospital Revenue Bonds, Henry Ford Health System, Series | 11/29 at 100.00 | A | 1,134,950 |
| 2019A, 4.000%, 11/15/50 | | | |
| 1,000 | Michigan State Building Authority, Revenue Bonds, Facilities Program, Refunding Series | 10/21 at 100.00 | Aa2 (5) | 1,023,670 |
| 2011-II-A, 5.375%, 10/15/36 (Pre-refunded 10/15/21) | | | |
| 3,355 | Total Michigan | | | 3,696,988 |
60
| | | | | |
| Principal | | Optional Call | | |
| Amount (000) | Description (1) | Provisions (2) | Ratings (3) | Value |
| Minnesota – 2.2% | | | |
| $ 300 | City of Minneapolis, Minnesota, Senior Housing and Healthcare Facilities Revenue Bonds, | 11/22 at 100.00 | N/R | $ 289,440 |
| Walker Minneapolis Campus Project, Series 2015, 4.625%, 11/15/31 | | | |
| 1,000 | Duluth Economic Development Authority, Minnesota, Health Care Facilities Revenue Bonds, | 2/28 at 100.00 | A– | 1,181,730 |
| Essentia Health Obligated Group, Series 2018A, 5.000%, 2/15/53 | | | |
| 300 | Saint Paul Park, Minnesota, Senior Housing and Health Care Revenue Bonds, Presbyterian | 9/24 at 100.00 | N/R | 309,465 |
| Homes Bloomington Project, Refunding Series 2017, 4.250%, 9/01/37 | | | |
| 500 | West Saint Paul-Mendota Heights-Eagan Independent School District 197, Dakota County, | 2/27 at 100.00 | AAA | 566,660 |
| Minnesota, General Obligation Bonds, School Building Series 2018A, 4.000%, 2/01/39 | | | |
| 2,100 | Total Minnesota | | | 2,347,295 |
| Mississippi – 1.1% | | | |
| 1,000 | Mississippi Hospital Equipment and Facilities Authority, Revenue Bonds, Baptist Memorial | 9/26 at 100.00 | BBB+ | 1,150,670 |
| Healthcare, Series 2016A, 5.000%, 9/01/36 | | | |
| Missouri – 3.8% | | | |
| 135 | Missouri Health and Educational Facilities Authority, Educational Facilities Revenue | 5/23 at 100.00 | BBB | 142,696 |
| Bonds, Saint Louis College of Pharmacy, Series 2013, 5.250%, 5/01/33 | | | |
| 1,000 | Missouri Health and Educational Facilities Authority, Educational Facilities Revenue | 10/22 at 100.00 | BBB– | 1,023,820 |
| Bonds, Southwest Baptist University Project, Series 2012, 5.000%, 10/01/33 | | | |
| 125 | Missouri Health and Educational Facilities Authority, Educational Facilities Revenue | 10/23 at 100.00 | A+ | 138,668 |
| Bonds, University of Central Missouri, Series 2013C-2, 5.000%, 10/01/34 | | | |
| 1,000 | Missouri Health and Educational Facilities Authority, Health Facilities Revenue Bonds, | 6/30 at 100.00 | A+ | 1,151,610 |
| Mercy Health, Series 2020, 4.000%, 6/01/53 | | | |
| 965 | Missouri Health and Educational Facilities Authority, Revenue Bonds, Lake Regional | 2/22 at 100.00 | BBB+ | 990,939 |
| Health System, Series 2012, 5.000%, 2/15/26 | | | |
| 215 | Saint Louis County Industrial Development Authority, Missouri, Revenue Bonds, Friendship | 9/25 at 103.00 | BB+ | 241,084 |
| Village Saint Louis Obligated Group, Series 2018A, 5.250%, 9/01/53 | | | |
| 335 | Saline County Industrial Development Authority, Missouri, First Mortgage Revenue Bonds, | 10/23 at 100.00 | N/R | 341,961 |
| Missouri Valley College, Series 2017, 4.500%, 10/01/40 | | | |
| 3,775 | Total Missouri | | | 4,030,778 |
| Nebraska – 0.4% | | | |
| 400 | Nebraska Educational Finance Authority, Revenue Bonds, Clarkson College Project, | 6/21 at 100.00 | Aa3 | 401,436 |
| Refunding Series 2011, 5.050%, 9/01/30 | | | |
| New Jersey – 2.9% | | | |
| 85 | Gloucester County Pollution Control Financing Authority, New Jersey, Pollution Control | No Opt. Call | BBB– | 89,155 |
| Revenue Bonds, Logan Project, Refunding Series 2014A, 5.000%, 12/01/24 (AMT) | | | |
| 110 | New Jersey Health Care Facilities Financing Authority, Revenue Bonds, University | 7/25 at 100.00 | AA | 126,056 |
| Hospital Issue, Refunding Series 2015A, 5.000%, 7/01/46 – AGM Insured | | | |
| 545 | New Jersey Transportation Trust Fund Authority, Transportation System Bonds, Series | 6/25 at 100.00 | Baa1 | 618,913 |
| 2015AA, 5.000%, 6/15/45 | | | |
| 1,000 | New Jersey Transportation Trust Fund Authority, Transportation System Bonds, Series | 12/28 at 100.00 | Baa1 | 1,127,310 |
| 2019BB, 4.000%, 6/15/44 | | | |
| 1,000 | Tobacco Settlement Financing Corporation, New Jersey, Tobacco Settlement Asset-Backed | 6/28 at 100.00 | BBB+ | 1,186,100 |
| Bonds, Series 2018A, 5.000%, 6/01/46 | | | |
| 2,740 | Total New Jersey | | | 3,147,534 |
61
| | |
| NMI | Nuveen Municipal Income Fund, Inc. Portfolio of Investments (continued) April 30, 2021 (Unaudited) |
| | | | | |
| Principal | | Optional Call | | |
| Amount (000) | Description (1) | Provisions (2) | Ratings (3) | Value |
| New York – 2.3% | | | |
| $ 60 | Buffalo and Erie County Industrial Land Development Corporation, New York, Revenue | 7/25 at 100.00 | BBB | $ 69,211 |
| Bonds, Catholic Health System, Inc Project, Series 2015, 5.250%, 7/01/35 | | | |
| 150 | Hudson Yards Infrastructure Corporation, New York, Revenue Bonds, Senior Fiscal 2012 | 6/21 at 100.00 | AA– | 150,605 |
| Series 2011A, 5.750%, 2/15/47 | | | |
| 315 | Metropolitan Transportation Authority, New York, Transportation Revenue Bonds, Green | 5/30 at 100.00 | A3 | 391,781 |
| Climate Bond Certified Series 2020C-1, 5.250%, 11/15/55 | | | |
| 130 | New York City Industrial Development Agency, New York, PILOT Payment in Lieu of Taxes | 1/31 at 100.00 | AA | 136,235 |
| Revenue Bonds, Queens Baseball Stadium Project, Refunding Series 2021A, 3.000%, | | | |
| 1/01/46 – AGM Insured | | | |
| 500 | New York Liberty Development Corporation, New York, Liberty Revenue Bonds, 3 World Trade | 11/24 at 100.00 | N/R | 547,300 |
| Center Project, Class 1 Series 2014, 5.000%, 11/15/44, 144A | | | |
| 1,000 | New York State Urban Development Corporation, State Personal Income Tax Revenue Bonds, | 9/30 at 100.00 | AA+ | 1,168,520 |
| General Purpose, Series 2020A, 4.000%, 3/15/45 | | | |
| 2,155 | Total New York | | | 2,463,652 |
| North Carolina – 2.3% | | | |
| 1,775 | North Carolina Turnpike Authority, Triangle Expressway System Revenue Bonds, Senior Lien | 1/30 at 100.00 | Aa1 | 2,164,879 |
| Series 2019, 5.000%, 1/01/49 | | | |
| 225 | University of North Carolina, Chapel Hill, Revenue Bonds, Hospital System, Series 2019, | No Opt. Call | AA | 331,348 |
| 5.000%, 2/01/45 | | | |
| 2,000 | Total North Carolina | | | 2,496,227 |
| North Dakota – 0.6% | | | |
| 200 | Burleigh County, North Dakota, Health Care Revenue Bonds, Saint Alexius Medical Center | 7/21 at 100.00 | N/R (5) | 201,426 |
| Project, Series 2014A, 5.000%, 7/01/35 (Pre-refunded 7/01/21) | | | |
| 300 | Fargo, North Dakota, Health System Revenue Bonds, Sanford Health, Refunding Series | 11/21 at 100.00 | A+ (5) | 308,838 |
| 2011, 6.250%, 11/01/31 (Pre-refunded 11/01/21) | | | |
| 100 | Grand Forks, North Dakota, Senior Housing & Nursing Facilities Revenue Bonds, Valley | 12/26 at 100.00 | N/R | 104,340 |
| Homes and Services Obligated Group, Series 2017, 5.000%, 12/01/36 | | | |
| 600 | Total North Dakota | | | 614,604 |
| Ohio – 3.4% | | | |
| 655 | Buckeye Tobacco Settlement Financing Authority, Ohio, Tobacco Settlement Asset-Backed | 6/30 at 100.00 | N/R | 736,331 |
| Revenue Bonds, Refunding Senior Lien Series 2020B-2 Class 2, 5.000%, 6/01/55 | | | |
| 1,000 | Cleveland-Cuyahoga County Port Authority, Ohio, Cultural Facility Revenue Bonds, The | 7/31 at 100.00 | A3 | 1,165,380 |
| Cleveland Museum of Natural History Project, Series 2021, 4.000%, 7/01/46 | | | |
| 1,750 | Middleburg Heights, Ohio, Hospital Facilities Revenue Bonds, Southwest General Health | 8/21 at 100.00 | A2 | 1,771,840 |
| Center Project, Refunding Series 2011, 5.250%, 8/01/36 | | | |
| 3,405 | Total Ohio | | | 3,673,551 |
| Oklahoma – 0.3% | | | |
| 250 | Oklahoma Development Finance Authority, Health System Revenue Bonds, OU Medicine | 8/28 at 100.00 | Baa3 | 306,325 |
| Project, Series 2018B, 5.500%, 8/15/57 | | | |
| Oregon – 0.4% | | | |
| 55 | Clackamas County Hospital Facility Authority, Oregon, Revenue Bonds, Rose Villa Inc, | 11/25 at 102.00 | N/R | 59,217 |
| Series 2020A, 5.250%, 11/15/50 | | | |
| 300 | Forest Grove, Oregon, Campus Improvement Revenue Bonds, Pacific University Project, | 5/22 at 100.00 | BBB | 308,922 |
| Refunding Series 2014A, 5.000%, 5/01/40 | | | |
| 355 | Total Oregon | | | 368,139 |
62
| | | | | |
| Principal | | Optional Call | | |
| Amount (000) | Description (1) | Provisions (2) | Ratings (3) | Value |
| Pennsylvania – 2.6% | | | |
| $ 1,000 | Berks County Municipal Authority, Pennsylvania, Revenue Bonds, Reading Hospital & | 5/22 at 100.00 | BB– | $ 1,003,780 |
| Medical Center Project, Series 2012A, 5.000%, 11/01/40 | | | |
| 100 | Montgomery County Higher Education and Health Authority, Pennsylvania, Revenue Bonds, | 9/29 at 100.00 | A | 114,028 |
| Thomas Jefferson University, Series 2019, 4.000%, 9/01/49 | | | |
| 560 | Montgomery County Industrial Development Authority, Pennsylvania, Health System Revenue | 1/25 at 100.00 | Ba1 | 628,242 |
| Bonds, Albert Einstein Healthcare Network Issue, Series 2015A, 5.250%, 1/15/36 | | | |
| 1,000 | Pennsylvania Higher Educational Facilities Authority, Revenue Bonds, Foundation for | 7/22 at 100.00 | N/R (5) | 1,056,100 |
| Student Housing at Indiana University, Project Series 2012A, 5.000%, 7/01/41 | | | |
| (Pre-refunded 7/01/22) | | | |
| 2,660 | Total Pennsylvania | | | 2,802,150 |
| Puerto Rico – 2.1% | | | |
| Puerto Rico Sales Tax Financing Corporation, Sales Tax Revenue Bonds, Restructured 2018A-1: | | | |
| 200 | 4.550%, 7/01/40 | 7/28 at 100.00 | N/R | 221,964 |
| 1,760 | 0.000%, 7/01/51 | 7/28 at 30.01 | N/R | 404,765 |
| 989 | 5.000%, 7/01/58 | 7/28 at 100.00 | N/R | 1,116,640 |
| 500 | Puerto Rico Sales Tax Financing Corporation, Sales Tax Revenue Bonds, Taxable | 7/28 at 100.00 | N/R | 557,605 |
| Restructured Cofina Project Series 2019A-2, 4.784%, 7/01/58 | | | |
| 3,449 | Total Puerto Rico | | | 2,300,974 |
| South Carolina – 0.6% | | | |
| 620 | South Carolina Jobs-Economic Development Authority, Economic Development Revenue Bonds, | 4/26 at 103.00 | BBB– | 644,279 |
| Bishop Gadsden Episcopal Retirement Community, Series 2019A, 4.000%, 4/01/49 | | | |
| South Dakota – 0.1% | | | |
| 100 | Sioux Falls, South Dakota, Health Facilities Revenue Bonds, Dow Rummel Village Project, | 11/26 at 100.00 | BB | 107,125 |
| Series 2017, 5.125%, 11/01/47 | | | |
| Tennessee – 2.2% | | | |
| 1,250 | Chattanooga Health, Educational and Housing Facility Board, Tennessee, Revenue Bonds, | 1/23 at 100.00 | BBB+ (5) | 1,353,350 |
| Catholic Health Initiatives, Series 2013A, 5.250%, 1/01/45 (Pre-refunded 1/01/23) | | | |
| 870 | Knox County Health, Educational and Housing Facilities Board, Tennessee, Revenue Bonds, | 9/26 at 100.00 | BBB | 988,424 |
| University Health System, Inc, Series 2016, 5.000%, 9/01/47 | | | |
| 2,120 | Total Tennessee | | | 2,341,774 |
| Texas – 5.1% | | | |
| 500 | Central Texas Regional Mobility Authority, Revenue Bonds, Senior Lien Series 2021B, | 1/31 at 100.00 | A– | 633,675 |
| 5.000%, 1/01/46 | | | |
| 670 | Central Texas Regional Mobility Authority, Revenue Bonds, Senior Lien, Series 2015A, | 7/25 at 100.00 | A– | 768,303 |
| 5.000%, 1/01/40 | | | |
| 335 | Grand Parkway Transportation Corporation, Texas, System Toll Revenue Bonds, First Tier | 10/23 at 100.00 | A+ | 356,477 |
| Series 2013A, 5.125%, 10/01/43 | | | |
| 500 | Lower Colorado River Authority, Texas, Transmission Contract Revenue Bonds, LCRA | 5/25 at 100.00 | A+ | 578,045 |
| Transmission Services Corporation Project, Refunding Series 2015, 5.000%, 5/15/40 | | | |
| 125 | Mission Economic Development Corporation, Texas, Revenue Bonds, Natgasoline Project, | 10/21 at 105.00 | BB– | 132,659 |
| Senior Lien Series 2018, 4.625%, 10/01/31 (AMT), 144A | | | |
| 200 | North Texas Tollway Authority, Special Projects System Revenue Bonds, Convertible | 9/31 at 100.00 | N/R (5) | 276,136 |
| Capital Appreciation Series 2011C, 0.000%, 9/01/43 (Pre-refunded 9/01/31) (6) | | | |
| 410 | North Texas Tollway Authority, System Revenue Bonds, Refunding First Tier, Series 2015B, | 1/23 at 100.00 | A+ | 437,855 |
| 5.000%, 1/01/40 | | | |
63
| | |
| NMI | Nuveen Municipal Income Fund, Inc. Portfolio of Investments (continued) April 30, 2021 (Unaudited) |
| | | | | |
| Principal | | Optional Call | | |
| Amount (000) | Description (1) | Provisions (2) | Ratings (3) | Value |
| Texas (continued) | | | |
| $ 500 | North Texas Tollway Authority, System Revenue Bonds, Refunding Second Tier, Series | 1/25 at 100.00 | A | $ 573,400 |
| 2015A, 5.000%, 1/01/38 | | | |
| 240 | Reagan Hospital District of Reagan County, Texas, Limited Tax Revenue Bonds, Series | 2/24 at 100.00 | Ba1 | 256,262 |
| 2014A, 5.000%, 2/01/34 | | | |
| 295 | SA Energy Acquisition Public Facilities Corporation, Texas, Gas Supply Revenue Bonds, | No Opt. Call | A2 | 369,859 |
| Series 2007, 5.500%, 8/01/27 | | | |
| 1,000 | Texas Transportation Commission, Central Texas Turnpike System Revenue Bonds, Refunding | 8/24 at 100.00 | A– | 1,126,710 |
| Second Tier Series 2015C, 5.000%, 8/15/32 | | | |
| 4,775 | Total Texas | | | 5,509,381 |
| Virginia – 1.6% | | | |
| 1,265 | Virginia Small Business Financing Authority, Private Activity Revenue Bonds, Transform 66 P3 | 6/27 at 100.00 | BBB | 1,508,778 |
| Project, Senior Lien Series 2017, 5.000%, 12/31/56 (AMT) | | | |
| 205 | Virginia Small Business Financing Authority, Senior Lien Revenue Bonds, Elizabeth River | 7/22 at 100.00 | BBB | 217,436 |
| Crossing, Opco LLC Project, Series 2012, 6.000%, 1/01/37 (AMT) | | | |
| 1,470 | Total Virginia | | | 1,726,214 |
| West Virginia – 1.1% | | | |
| 1,000 | West Virginia Hospital Finance Authority, Hospital Revenue Bonds, West Virginia United | 6/28 at 100.00 | A | 1,188,860 |
| Health System Obligated Group, Series 2018A, 5.000%, 6/01/52 | | | |
| Wisconsin – 4.5% | | | |
| Public Finance Authority of Wisconsin, Conference Center and Hotel Revenue Bonds, | | | |
| Lombard Public Facilities Corporation, Second Tier Series 2018B: | | | |
| 4 | 0.000%, 1/01/46, 144A (4) | No Opt. Call | N/R | 112 |
| 4 | 0.000%, 1/01/47, 144A (4) | No Opt. Call | N/R | 106 |
| 4 | 0.000%, 1/01/48, 144A (4) | No Opt. Call | N/R | 104 |
| 4 | 0.000%, 1/01/49, 144A (4) | No Opt. Call | N/R | 101 |
| 3 | 0.000%, 1/01/50, 144A (4) | No Opt. Call | N/R | 96 |
| 4 | 0.000%, 1/01/51, 144A (4) | No Opt. Call | N/R | 103 |
| 98 | 0.000%, 7/01/51, 144A (4) | 3/28 at 100.00 | N/R | 67,600 |
| 4 | 0.000%, 1/01/52, 144A (4) | No Opt. Call | N/R | 99 |
| 4 | 0.000%, 1/01/53, 144A (4) | No Opt. Call | N/R | 96 |
| 4 | 0.000%, 1/01/54, 144A (4) | No Opt. Call | N/R | 92 |
| 4 | 0.000%, 1/01/55, 144A (4) | No Opt. Call | N/R | 89 |
| 4 | 0.000%, 1/01/56, 144A (4) | No Opt. Call | N/R | 87 |
| 4 | 0.000%, 1/01/57, 144A (4) | No Opt. Call | N/R | 84 |
| 4 | 0.000%, 1/01/58, 144A (4) | No Opt. Call | N/R | 81 |
| 3 | 0.000%, 1/01/59, 144A (4) | No Opt. Call | N/R | 79 |
| 3 | 0.000%, 1/01/60, 144A (4) | No Opt. Call | N/R | 76 |
| 3 | 0.000%, 1/01/61, 144A (4) | No Opt. Call | N/R | 73 |
| 3 | 0.000%, 1/01/62, 144A (4) | No Opt. Call | N/R | 71 |
| 3 | 0.000%, 1/01/63, 144A (4) | No Opt. Call | N/R | 68 |
| 3 | 0.000%, 1/01/64, 144A (4) | No Opt. Call | N/R | 67 |
| 3 | 0.000%, 1/01/65, 144A (4) | No Opt. Call | N/R | 64 |
| 3 | 0.000%, 1/01/66, 144A (4) | No Opt. Call | N/R | 60 |
| 42 | 0.000%, 1/01/67, 144A (4) | No Opt. Call | N/R | 729 |
| 500 | Wisconsin Health and Educational Facilities Authority, Revenue Bonds, Marquette | 10/22 at 100.00 | A2 | 521,815 |
| University, Series 2012, 4.000%, 10/01/32 | | | |
| 755 | Wisconsin Health and Educational Facilities Authority, Revenue Bonds, Gundersen | 10/21 at 100.00 | AA– | 769,171 |
| Lutheran, Series 2011A, 5.250%, 10/15/39 | | | |
| 200 | Wisconsin Health and Educational Facilities Authority, Wisconsin, Revenue Bonds, Dickson | 10/22 at 102.00 | N/R | 208,400 |
| Hollow Project Series 2014, 5.125%, 10/01/34 | | | |
| 1,000 | Wisconsin Health and Educational Facilities Authority, Wisconsin, Revenue Bonds, PHW | 10/23 at 102.00 | N/R | 1,043,020 |
| Oconomowoc, Inc Project, Series 2018, 5.125%, 10/01/48 | | | |
64
| | | | | |
| Principal | | Optional Call | | |
| Amount (000) | Description (1) | Provisions (2) | Ratings (3) | Value |
| Wisconsin (continued) | | | |
| $ 1,000 | Wisconsin Health and Educational Facilities Authority, Wisconsin, Revenue Bonds, | 8/24 at 100.00 | A+ | $ 1,117,260 |
| ProHealth Care, Inc Obligated Group, Refunding Series 2015, 5.000%, 8/15/39 | | | |
| 500 | Wisconsin Health and Educational Facilities Authority, Wisconsin, Revenue Bonds, Rogers | 7/24 at 100.00 | A | 552,650 |
| Memorial Hospital, Inc, Series 2014B, 5.000%, 7/01/44 | | | |
| 545 | Wisconsin Health and Educational Facilities Authority, Wisconsin, Revenue Bonds, Saint | 9/23 at 100.00 | BBB– | 568,909 |
| John’s Communities Inc, Series 2018A, 5.000%, 9/15/50 | | | |
| 4,715 | Total Wisconsin | | | 4,851,362 |
| $ 103,017 | Total Long-Term Investments (cost $96,034,221) | | | 104,834,335 |
| Other Assets Less Liabilities – 2.4% | | | 2,576,342 |
| Net Assets Applicable to Common Shares – 100% | | | $ 107,410,677 |
| | |
(1) | All percentages shown in the Portfolio of Investments are based on net assets applicable to common shares unless otherwise noted. |
(2) | Optional Call Provisions: Dates (month and year) and prices of the earliest optional call or redemption. There may be other call provisions at varying prices at later dates. Certain |
| mortgage-backed securities may be subject to periodic principal paydowns. |
(3) | For financial reporting purposes, the ratings disclosed are the highest of Standard & Poor’s Group (“Standard & Poor’s”), Moody’s Investors Service, Inc. (“Moody’s”) or Fitch, |
| Inc. (“Fitch”) rating. This treatment of split-rated securities may differ from that used for other purposes, such as for Fund investment policies. Ratings below BBB by Standard & |
| Poor’s, Baa by Moody’s or BBB by Fitch are considered to be below investment grade. Holdings designated N/R are not rated by any of these national rating agencies. |
(4) | Defaulted security. A security whose issuer has failed to fully pay principal and/or interest when due, or is under the protection of bankruptcy. |
(5) | Backed by an escrow or trust containing sufficient U.S. Government or U.S. Government agency securities, which ensure the timely payment of principal and interest. |
(6) | Step-up coupon bond, a bond with a coupon that increases (“steps up”), usually at regular intervals, while the bond is outstanding. The rate shown is the coupon as of the end |
| of the reporting period. |
144A | Investment is exempt from registration under Rule 144A of the Securities Act of 1933, as amended. These investments may only be resold in transactions exempt from registration, which are normally those transactions with qualified institutional buyers.
|
AMT | Alternative Minimum Tax. |
| See accompanying notes to financial statements. |
65
| | |
| NEV | Nuveen Enhanced Municipal Value Fund Portfolio of Investments April 30, 2021 (Unaudited) |
| | | | | |
| Principal | | Optional Call | | |
| Amount (000) | Description (1) | Provisions (2) | Ratings (3) | Value |
| LONG-TERM INVESTMENTS – 131.5% | | | |
| MUNICIPAL BONDS – 129.6% | | | |
| Alabama – 0.5% | | | |
| $ 340 | Hoover Industrial Development Board, Alabama, Environmental Improvement Revenue Bonds, | 10/29 at 100.00 | B– | $ 397,453 |
| United States Steel Corporation Project, Series 2019, 5.750%, 10/01/49 (AMT) | | | |
| 1,350 | Jefferson County, Alabama, Sewer Revenue Warrants, Senior Lien Series 2013A, 5.250%, | 10/23 at 102.00 | AA | 1,514,781 |
| 10/01/48 – AGM Insured | | | |
| 1,690 | Total Alabama | | | 1,912,234 |
| Arizona – 1.0% | | | |
| 1,585 | Arizona Health Facilities Authority, Hospital Revenue Bonds, Banner Health Systems, | 1/22 at 100.00 | AA– (5) | 1,790,733 |
| Tender Option Bond Trust 2015-XF2046, 17.772%, 7/01/36 (Pre-refunded 1/01/22), 144A (IF) (4) | | | |
| 1,030 | Phoenix Industrial Development Authority, Arizona, Education Facility Revenue Bonds, | 7/21 at 100.00 | N/R (5) | 1,040,321 |
| Great Hearts Academies – Veritas Project, Series 2012, 6.600%, 7/01/47 (Pre-refunded 7/01/21) | | | |
| 35 | Pima County Industrial Development Authority, Arizona, Education Facility Revenue Bonds, | 7/25 at 100.00 | N/R | 36,890 |
| The Paideia Academies Project, 2019, 5.125%, 7/01/39 | | | |
| 1,095 | Quechan Indian Tribe of the Fort Yuma Reservation, Arizona, Tribal Economic Development | 5/22 at 100.00 | N/R | 1,139,304 |
| Bonds, Series 2012A, 9.750%, 5/01/25 | | | |
| 50 | Salt Verde Financial Corporation, Arizona, Senior Gas Revenue Bonds, Citigroup Energy | No Opt. Call | A3 | 66,441 |
| Inc Prepay Contract Obligations, Series 2007, 5.000%, 12/01/32 | | | |
| 3,795 | Total Arizona | | | 4,073,689 |
| Arkansas – 0.6% | | | |
| 2,000 | Arkansas Development Finance Authority, Industrial Development Revenue Bonds, Big River | 9/26 at 103.00 | B1 | 2,187,340 |
| Steel Project, Series 2019, 4.500%, 9/01/49 (AMT), 144A | | | |
| California – 10.1% | | | |
| 180 | Alameda Corridor Transportation Authority, California, Revenue Bonds, Refunding Second | 10/26 at 100.00 | BBB+ | 212,137 |
| Subordinate Lien Series 2016B, 5.000%, 10/01/37 | | | |
| 10,000 | Bay Area Toll Authority, California, Revenue Bonds, San Francisco Bay Area Toll Bridge, | 10/29 at 100.00 | AA– | 10,477,400 |
| Subordinate Series 2019S-8, 3.000%, 4/01/54 (UB) (4) | | | |
| 1,510 | California Community Housing Agency, California, Essential Housing Revenue Bonds, | 2/30 at 100.00 | N/R | 1,730,626 |
| Serenity at Larkspur Apartments, Series 2020A, 5.000%, 2/01/50, 144A | | | |
| 60 | California County Tobacco Securitization Agency, Tobacco Settlement Asset-Backed Bonds, | 6/30 at 100.00 | BBB+ | 69,589 |
| Los Angeles County Securitization Corporation, Series 2020A, 4.000%, 6/01/49 | | | |
| California Statewide Communities Development Authority, California, Revenue Bonds, Loma | | | |
| Linda University Medical Center, Series 2014A: | | | |
| 2,500 | 5.250%, 12/01/44 | 12/24 at 100.00 | BB | 2,792,100 |
| 1,712 | 5.500%, 12/01/54 | 12/24 at 100.00 | BB | 1,918,330 |
| 3,450 | California Statewide Communities Development Authority, California, Revenue Bonds, Loma | 6/26 at 100.00 | BB | 3,888,806 |
| Linda University Medical Center, Series 2016A, 5.250%, 12/01/56, 144A | | | |
| 2,760 | California Statewide Community Development Authority, Certificates of Participation, | 1/28 at 100.00 | BBB+ | 3,092,663 |
| Methodist Hospital of Southern California, Series 2018, 4.250%, 1/01/43 | | | |
| 400 | Davis Redevelopment Agency, California, Tax Allocation Bonds, Davis Redevelopment | 12/21 at 100.00 | A+ (5) | 415,740 |
| Project, Subordinate Series 2011A, 7.000%, 12/01/36 (Pre-refunded 12/01/21) | | | |
| 5,240 | Golden State Tobacco Securitization Corporation, California, Tobacco Settlement | 5/21 at 22.00 | CCC– | 1,162,022 |
| Asset-Backed Bonds, First Subordinate Series 2007B-1, 0.000%, 6/01/47 | | | |
| Golden State Tobacco Securitization Corporation, California, Tobacco Settlement | | | |
| Asset-Backed Bonds, Tender Option Bond Trust 2015-XF1038: | | | |
| 2,445 | 17.537%, 6/01/40, 144A (IF) (4) | 6/25 at 100.00 | A+ | 4,065,253 |
| 1,250 | 17.551%, 6/01/40, 144A (IF) (4) | 6/25 at 100.00 | Aa3 | 2,079,063 |
66
| | | | | |
| Principal | | Optional Call | | |
| Amount (000) | Description (1) | Provisions (2) | Ratings (3) | Value |
| California (continued) | | | |
| $ 2,550 | Grossmont Healthcare District, California, General Obligation Bonds, Tender Option Bond | 7/21 at 100.00 | Aaa | $ 2,728,755 |
| Trust 2017-XF2453, 32.773%, 7/15/40 (Pre-refunded 7/15/21), 144A (IF) (4) | | | |
| 225 | Long Beach Bond Finance Authority, California, Natural Gas Purchase Revenue Bonds, | No Opt. Call | A+ | 234,513 |
| Series 2007B, 1.580%, 11/15/27 (3-Month LIBOR reference rate + 1.450% spread) (6) | | | |
| 1,600 | Los Angeles County, California, Community Development Commission Headquarters Office | 9/21 at 100.00 | Aa3 | 1,723,728 |
| Building, Lease Revenue Bonds, Community Development Properties Los Angeles County Inc, | | | |
| Tender Option Bond Trust 2016-XL0022, 23.057%, 9/01/42, 144A (IF) (4) | | | |
| 1,080 | National City Community Development Commission, California, Tax Allocation Bonds, | 8/21 at 100.00 | N/R (5) | 1,097,960 |
| National City Redevelopment Project, Series 2011, 7.000%, 8/01/32 (Pre-refunded 8/01/21) | | | |
| 1,165 | Novato Redevelopment Agency, California, Tax Allocation Bonds, Hamilton Field | 9/21 at 100.00 | N/R (5) | 1,190,001 |
| Redevelopment Project, Series 2011, 6.750%, 9/01/40 (Pre-refunded 9/01/21) | | | |
| 1,045 | Ukiah Redevelopment Agency, California, Tax Allocation Bonds, Ukiah Redevelopment | 6/21 at 100.00 | A+ (5) | 1,049,932 |
| Project, Series 2011A, 6.500%, 12/01/28 (Pre-refunded 6/01/21) | | | |
| 39,172 | Total California | | | 39,928,618 |
| Colorado – 2.8% | | | |
| Colorado Bridge Enterprise, Revenue Bonds, Central 70 Project, Senior Series 2017: | | | |
| 750 | 4.000%, 12/31/30 (AMT) | 12/27 at 100.00 | A– | 839,400 |
| 250 | 4.000%, 6/30/31 (AMT) | 12/27 at 100.00 | A– | 279,293 |
| 820 | Colorado Health Facilities Authority, Colorado, Revenue Bonds, CommonSpirit Health, | 8/29 at 100.00 | BBB+ | 925,468 |
| Series 2019A-2, 4.000%, 8/01/49 (UB) (4) | | | |
| 26 | Colorado Housing and Finance Authority, Revenue Bonds, Confluence Energy LLC Project, | No Opt. Call | N/R | — |
| Series 2007, 5.000%, 9/30/21 (7), (8) | | | |
| 239 | Colorado Housing and Finance Authority, Revenue Bonds, Confluence Energy LLC Project, | No Opt. Call | N/R | 3,304 |
| Series 2017, 5.500%, 4/01/22 (AMT) (7), (8) | | | |
| 4,000 | E-470 Public Highway Authority, Colorado, Toll Revenue Bonds, Refunding Series 2006B, | 9/26 at 52.09 | A | 1,905,640 |
| 0.000%, 9/01/39 – NPFG Insured | | | |
| Public Authority for Colorado Energy, Natural Gas Purchase Revenue Bonds, Colorado | | | |
| Springs Utilities, Series 2008: | | | |
| 475 | 6.250%, 11/15/28 | No Opt. Call | A+ | 597,009 |
| 4,030 | 6.500%, 11/15/38 | No Opt. Call | A+ | 6,249,764 |
| 10,590 | Total Colorado | | | 10,799,878 |
| Connecticut – 0.1% | | | |
| 400 | Connecticut Health and Educational Facilities Authority, Revenue Bonds, Stamford | 7/22 at 100.00 | BBB+ | 416,448 |
| Hospital, Series 2012J, 5.000%, 7/01/37 | | | |
| District of Columbia – 1.7% | | | |
| 10,000 | Metropolitan Washington Airports Authority, Virginia, Dulles Toll Road Revenue Bonds, | No Opt. Call | A– | 6,754,300 |
| Dulles Metrorail & Capital improvement Projects, Second Senior Lien Series 2009B, 0.000%, | | | |
| 10/01/37 – AGC Insured | | | |
| Florida – 10.1% | | | |
| 1,000 | Bonterra Community Development District, Hialeah, Florida, Special Assessment Bonds, | 5/27 at 100.00 | N/R | 1,083,400 |
| Assessment Area 2 Project, Series 2016, 4.500%, 5/01/34 | | | |
| 325 | Capital Trust Agency, Florida, Revenue Bonds, Renaissance Charter School Project, Series | 6/26 at 100.00 | N/R | 355,108 |
| 2019A, 5.000%, 6/15/39, 144A | | | |
| 150 | Charlotte County Industrial Development Authority, Florida, Utility System Revenue | 10/27 at 100.00 | N/R | 166,431 |
| Bonds, Town & Country Utilities Project, Series 2019, 5.000%, 10/01/49 (AMT), 144A | | | |
| 2,000 | Collier County Educational Facilities Authority, Florida, Revenue Bonds, Ave Maria | 6/23 at 100.00 | BBB– | 2,147,020 |
| University, Refunding Series 2013A, 5.625%, 6/01/33 | | | |
| Escambia County Health Facilities Authority, Florida, Health Care Facilities Revenue | | | |
| Bonds, Baptist Health Care Corporation Obligated, Series 2020A: | | | |
| 2,500 | 4.000%, 8/15/45 | 2/30 at 100.00 | BBB+ | 2,854,450 |
| 5,675 | 4.000%, 8/15/45 (UB) (4) | 2/30 at 100.00 | BBB+ | 6,479,602 |
67
| | |
| NEV | Nuveen Enhanced Municipal Value Fund Portfolio of Investments (continued) April 30, 2021 (Unaudited) |
| | | | | |
| Principal | | Optional Call | | |
| Amount (000) | Description (1) | Provisions (2) | Ratings (3) | Value |
| Florida (continued) | | | |
| $ 1,000 | Florida Development Finance Corporation, Educational Facilities Revenue Bonds, | 6/21 at 100.00 | N/R (5) | $ 1,008,410 |
| Renaissance Charter School, Inc Projects, Series 2011A, 7.500%, 6/15/33 (Pre-refunded 6/15/21) | | | |
| 4,500 | Florida Development Finance Corporation, Florida, Surface Transportation Facility Revenue | 1/24 at 107.00 | N/R | 4,680,000 |
| Bonds, Brightline Passenger Rail Project, Green Series 2019B, 7.375%, 1/01/49 (AMT), 144A | | | |
| 4,210 | Florida Development Finance Corporation, Florida, Surface Transportation Facility | 6/21 at 104.00 | N/R | 4,215,220 |
| Revenue Bonds, Virgin Trains USA Passenger Rail Project , Series 2019A, 6.500%, 1/01/49 (AMT) | | | |
| (Mandatory Put 1/01/29), 144A | | | |
| 265 | Miami-Dade County Health Facility Authority, Florida, Hospital Revenue Bonds, Miami | 6/21 at 100.00 | A+ | 266,095 |
| Children’s Hospital, Series 2010A, 6.000%, 8/01/30 | | | |
| Osceola County, Florida, Transportation Revenue Bonds, Osceola Parkway, Refunding & | | | |
| Improvement Capital Appreciation Series 2019A-2: | | | |
| 1,000 | 0.000%, 10/01/44 | 10/29 at 59.08 | BBB+ | 464,110 |
| 4,200 | 0.000%, 10/01/47 | 10/29 at 52.89 | BBB+ | 1,734,642 |
| 1,250 | 0.000%, 10/01/48 | 10/29 at 50.96 | BBB+ | 496,425 |
| 1,000 | 0.000%, 10/01/49 | 10/29 at 49.08 | BBB+ | 381,970 |
| 2,000 | 0.000%, 10/01/50 | 10/29 at 47.17 | BBB+ | 733,060 |
| 7,475 | 0.000%, 10/01/52 | 10/29 at 43.62 | BBB+ | 2,528,568 |
| 2,300 | 0.000%, 10/01/54 | 10/29 at 40.38 | BBB+ | 719,118 |
| Palm Beach County Health Facilities Authority, Florida, Revenue Bonds, Jupiter Medical | | | |
| Center, Series 2013A: | | | |
| 1,000 | 5.000%, 11/01/33 | 11/22 at 100.00 | BBB+ | 1,045,110 |
| 2,000 | 5.000%, 11/01/43 | 11/22 at 100.00 | BBB+ | 2,081,660 |
| 205 | Palm Beach County, Florida, Revenue Bonds, Provident Group – PBAU Properties LLC – Palm | 4/29 at 100.00 | Ba1 | 229,229 |
| Beach Atlantic University Housing Project, Series 2019A, 5.000%, 4/01/39, 144A | | | |
| 720 | Tampa, Florida, Revenue Bonds, H Lee Moffitt Cancer Center and Research Institute, | 7/30 at 100.00 | A2 | 832,622 |
| Series 2020B, 4.000%, 7/01/45 | | | |
| 3,000 | Tampa, Florida, Revenue Bonds, University of Tampa, Refunding Series 2020A, | 4/30 at 100.00 | A– | 3,362,700 |
| 4.000%, 4/01/50 | | | |
| 95 | Tolomato Community Development District, Florida, Special Assessment Bonds, Convertible, | 5/22 at 100.00 | N/R | 82,784 |
| Capital Appreciation, Series 2012A-4, 0.000%, 5/01/40 (9) | | | |
| 135 | Tolomato Community Development District, Florida, Special Assessment Bonds, Hope Note, | 6/21 at 100.00 | N/R | 1 |
| Series 2007-3, 6.650%, 5/01/40 (8) | | | |
| 350 | Tolomato Community Development District, Florida, Special Assessment Bonds, Refunding | 6/21 at 100.00 | N/R | 336,053 |
| Series 2015-1, 0.000%, 5/01/40 (9) | | | |
| 215 | Tolomato Community Development District, Florida, Special Assessment Bonds, Refunding | 6/21 at 100.00 | N/R | 161,190 |
| Series 2015-2, 0.000%, 5/01/40 (9) | | | |
| 235 | Tolomato Community Development District, Florida, Special Assessment Bonds, Refunding | 6/21 at 100.00 | N/R | 2 |
| Series 2015-3, 6.610%, 5/01/40 (8) | | | |
| 1,080 | Venetian Community Development District, Sarasota County, Florida, Capital Improvement | 5/22 at 100.00 | N/R | 1,107,551 |
| Revenue Bonds, Series 2012-A2, 5.500%, 5/01/34 | | | |
| 49,885 | Total Florida | | | 39,552,531 |
| Georgia – 0.2% | | | |
| 285 | Atlanta Development Authority, Georgia, Senior Health Care Facilities Revenue Bonds, | 1/28 at 100.00 | N/R | 184,680 |
| Georgia Proton Treatment Center Project, Current Interest Series 2017A-1, 6.500%, 1/01/29 | | | |
| 90 | Main Street Natural Gas Inc, Georgia, Gas Project Revenue Bonds, Series 2006B, | No Opt. Call | A+ | 93,639 |
| 5.000%, 3/15/22 | | | |
| 260 | Main Street Natural Gas Inc, Georgia, Gas Project Revenue Bonds, Series 2007A, | No Opt. Call | A+ | 321,573 |
| 5.500%, 9/15/26 | | | |
| 635 | Total Georgia | | | 599,892 |
68
| | | | | |
| Principal | | Optional Call | | |
| Amount (000) | Description (1) | Provisions (2) | Ratings (3) | Value |
| Guam – 5.7% | | | |
| Government of Guam, Business Privilege Tax Bonds, Refunding Series 2015D: | | | |
| 195 | 5.000%, 11/15/33 | 11/25 at 100.00 | BB | $ 220,403 |
| 1,805 | 5.000%, 11/15/34 | 11/25 at 100.00 | BB | 2,038,061 |
| 1,760 | Government of Guam, Business Privilege Tax Bonds, Series 2012B-1, 5.000%, 1/01/42 | 1/22 at 100.00 | BB | 1,809,403 |
| 500 | Guam Government Waterworks Authority, Water and Wastewater System Revenue Bonds, Series | 7/23 at 100.00 | A– (5) | 555,660 |
| 2013, 5.500%, 7/01/43 (Pre-refunded 7/01/23) | | | |
| Guam Government, Limited Obligation Section 30 Revenue Bonds, Series 2016A: | | | |
| 2,500 | 5.000%, 12/01/28 (UB) (4) | 12/26 at 100.00 | BB | 2,925,675 |
| 1,750 | 5.000%, 12/01/30 (UB) (4) | 12/26 at 100.00 | BB | 2,029,825 |
| 2,500 | 5.000%, 12/01/32 (UB) (4) | 12/26 at 100.00 | BB | 2,887,475 |
| 1,750 | 5.000%, 12/01/34 (UB) (4) | 12/26 at 100.00 | BB | 2,015,125 |
| 6,000 | 5.000%, 12/01/46 (UB) (4) | 12/26 at 100.00 | BB | 6,782,040 |
| 1,000 | Guam Power Authority, Revenue Bonds, Refunding Series 2017A, 5.000%, 10/01/37 | 10/27 at 100.00 | BBB | 1,162,210 |
| 19,760 | Total Guam | | | 22,425,877 |
| Illinois – 19.3% | | | |
| 1,165 | CenterPoint Intermodal Center Program Trust, Illinois, Series 2004 Class A Certificates, | No Opt. Call | N/R | 1,179,772 |
| 4.000%, 6/15/23 (Mandatory Put 12/15/22), 144A | | | |
| 5,000 | Chicago Board of Education, Illinois, Dedicated Capital Improvement Tax Revenue Bonds, | 4/27 at 100.00 | A– | 6,010,350 |
| Series 2016, 6.000%, 4/01/46 | | | |
| 2,255 | Chicago Board of Education, Illinois, General Obligation Bonds, Dedicated Revenues, | 12/24 at 100.00 | BB | 2,502,937 |
| Project Series 2015C, 5.250%, 12/01/35 | | | |
| 1,335 | Chicago Board of Education, Illinois, General Obligation Bonds, Dedicated Revenues, | 12/26 at 100.00 | BB | 1,626,123 |
| Series 2016B, 6.500%, 12/01/46 | | | |
| Chicago Board of Education, Illinois, Unlimited Tax General Obligation Bonds, Dedicated | | | |
| Tax Revenues, Series 1998B-1: | | | |
| 1,000 | 0.000%, 12/01/22 – FGIC Insured | No Opt. Call | Baa2 | 987,480 |
| 1,000 | 0.000%, 12/01/27 – NPFG Insured | No Opt. Call | Baa2 | 889,340 |
| 1,000 | Chicago, Illinois, General Obligation Bonds, Neighborhoods Alive 21 Program, Series | 1/25 at 100.00 | BBB+ | 1,127,350 |
| 2002B, 5.500%, 1/01/33 | | | |
| Chicago, Illinois, General Obligation Bonds, Refunding Series 2012C: | | | |
| 320 | 5.000%, 1/01/23 | 1/22 at 100.00 | BBB+ | 328,826 |
| 160 | 5.000%, 1/01/25 | 1/22 at 100.00 | BBB+ | 164,197 |
| Chicago, Illinois, General Obligation Bonds, Refunding Series 2016C: | | | |
| 3,470 | 5.000%, 1/01/24 | No Opt. Call | BBB+ | 3,842,782 |
| 350 | 5.000%, 1/01/29 | 1/26 at 100.00 | BBB+ | 402,147 |
| 770 | 5.000%, 1/01/38 | 1/26 at 100.00 | BBB+ | 868,406 |
| 1,150 | Chicago, Illinois, General Obligation Bonds, Series 2015A, 5.500%, 1/01/33 | 1/25 at 100.00 | BBB+ | 1,296,453 |
| 10,125 | Chicago, Illinois, General Obligation Bonds, Series 2019A, 5.000%, 1/01/44 (UB) (4) | 1/29 at 100.00 | BBB+ | 11,933,325 |
| 405 | DuPage County, Illinois, Revenue Bonds, Morton Arboretum Project, Green Series 2020, | 5/30 at 100.00 | A1 | 413,448 |
| 3.000%, 5/15/47 | | | |
| 2,000 | Grundy County School District 54 Morris, Illinois, General Obligation Bonds, Refunding | 12/21 at 100.00 | AA | 2,067,200 |
| Series 2005, 6.000%, 12/01/24 – AGM Insured | | | |
| 1,540 | Illinois Finance Authority, Revenue Bonds, Centegra Health System, Tender Option Bond | 9/22 at 100.00 | AA+ | 1,902,331 |
| Trust 2016-XF2339, 17.825%, 9/01/38, 144A (IF) (4) | | | |
| 1,605 | Illinois Finance Authority, Revenue Bonds, Centegra Health System, Tender Option Bond | 9/22 at 100.00 | AA+ | 2,076,067 |
| Trust 2016-XF2339, 22.079%, 9/01/38, 144A (IF) (4) | | | |
| 600 | Illinois Finance Authority, Revenue Bonds, Christian Homes Inc, Refunding Series 2010, | 6/21 at 100.00 | BBB– | 601,728 |
| 6.125%, 5/15/27 | | | |
| Illinois Finance Authority, Revenue Bonds, Northwestern Memorial Healthcare, Tender | | | |
| Option Bond Trust 2015-XF0076: | | | |
| 150 | 17.937%, 8/15/37, 144A (IF) | 8/22 at 100.00 | AA+ | 183,699 |
| 690 | 17.937%, 8/15/37, 144A (IF) | 8/22 at 100.00 | AA+ | 846,844 |
69
| | |
| NEV | Nuveen Enhanced Municipal Value Fund Portfolio of Investments (continued) April 30, 2021 (Unaudited) |
| | | | | |
| Principal | | Optional Call | | |
| Amount (000) | Description (1) | Provisions (2) | Ratings (3) | Value |
| Illinois (continued) | | | |
| $ 1,000 | Illinois Finance Authority, Revenue Bonds, Palos Community Hospital, Series 2010C, | 6/21 at 100.00 | AA+ | $ 1,002,860 |
| 5.125%, 5/15/35 | | | |
| 455 | Illinois Finance Authority, Revenue Bonds, The Carle Foundation, Tender Option Bond | 8/21 at 100.00 | AA | 492,146 |
| Trust 2015-XF0121, 26.798%, 8/15/41 – AGM Insured, 144A (IF) (4) | | | |
| 20,830 | Illinois State, General Obligation Bonds, November Series 2017D, 5.000%, 11/01/27 (UB) (4) | No Opt. Call | BBB– | 25,265,957 |
| 1,380 | Illinois State, General Obligation Bonds, November Series 2019B, 4.000%, 11/01/34 | 11/29 at 100.00 | BBB– | 1,582,239 |
| 2,125 | Metropolitan Pier and Exposition Authority, Illinois, McCormick Place Expansion Project | 12/29 at 100.00 | BBB | 2,386,354 |
| Bonds, Refunding Series 2020A, 4.000%, 6/15/50 | | | |
| 8,000 | Metropolitan Pier and Exposition Authority, Illinois, McCormick Place Expansion Project | No Opt. Call | AA | 2,750,000 |
| Bonds, Series 2017B, 0.000%, 12/15/56 – AGM Insured | | | |
| 1,000 | Railsplitter Tobacco Settlement Authority, Illinois, Tobacco Settlement Revenue Bonds, | 6/21 at 100.00 | N/R (5) | 1,004,420 |
| Series 2010, 6.000%, 6/01/28 (Pre-refunded 6/01/21) | | | |
| 190 | Southwestern Illinois Development Authority, Environmental Improvement Revenue Bonds, US | 8/22 at 100.00 | B– | 196,831 |
| Steel Corporation Project, Series 2012, 5.750%, 8/01/42 (AMT) | | | |
| 71,070 | Total Illinois | | | 75,931,612 |
| Indiana – 2.8% | | | |
| 2,000 | Gary Local Public Improvement Bond Bank, Indiana, Economic Development Revenue Bonds, | 6/30 at 100.00 | N/R | 2,106,180 |
| Drexel Foundation for Educational Excellence Project, Refunding Series 2020A, 5.875%, | | | |
| 6/01/55, 144A | | | |
| 1,500 | Indiana Finance Authority, Private Activity Bonds, Ohio River Bridges East End Crossing | 7/23 at 100.00 | A– | 1,634,070 |
| Project, Series 2013A, 5.000%, 7/01/35 (AMT) | | | |
| 4,375 | Indianapolis Local Public Improvement Bond Bank, Indiana, Community Justice Campus | 2/29 at 100.00 | AAA | 4,893,437 |
| Bonds, Courthouse & Jail Project, Series 2019A, 3.840%, 2/01/54 (UB) (4) | | | |
| 400 | Valparaiso, Indiana, Exempt Facilities Revenue Bonds, Pratt Paper LLC Project, Series | 1/24 at 100.00 | N/R | 450,180 |
| 2013, 7.000%, 1/01/44 (AMT) | | | |
| 2,000 | Vigo County Hospital Authority, Indiana, Hospital Revenue Bonds, Union Hospital, Inc, | 9/21 at 100.00 | N/R (5) | 2,048,940 |
| Series 2011, 7.750%, 9/01/31 (Pre-refunded 9/01/21) | | | |
| 10,275 | Total Indiana | | | 11,132,807 |
| Iowa – 0.3% | | | |
| 155 | Iowa Finance Authority, Iowa, Midwestern Disaster Area Revenue Bonds, Iowa Fertilizer | 12/23 at 100.00 | BB– | 169,914 |
| Company Project, Series 2013, 5.250%, 12/01/25 | | | |
| 995 | Iowa Finance Authority, Iowa, Midwestern Disaster Area Revenue Bonds, Iowa Fertilizer | 12/22 at 103.00 | BB– | 1,081,505 |
| Company Project, Series 2018A, 5.250%, 12/01/50 (Mandatory Put 12/01/33) | | | |
| 1,150 | Total Iowa | | | 1,251,419 |
| Kansas – 2.3% | | | |
| 3,000 | Kansas Development Finance Authority, Revenue Bonds, Lifespace Communities, Inc, | 6/21 at 100.00 | BBB | 3,007,890 |
| Refunding Series 2010S, 5.000%, 5/15/30 | | | |
| Overland Park Development Corporation, Kansas, Revenue Bonds, Convention Center Hotel, | | | |
| Refunding & improvement Series 2019: | | | |
| 2,085 | 5.000%, 3/01/44 | 3/29 at 100.00 | BB– | 2,152,679 |
| 640 | 5.000%, 3/01/49 | 3/29 at 100.00 | BB– | 659,059 |
| 3,565 | Overland Park, Kansas, Sales Tax Special Obligation Revenue Bonds, Prairiefire at | 12/22 at 100.00 | N/R | 2,014,903 |
| Lionsgate Project, Series 2012, 6.000%, 12/15/32 | | | |
| 1,130 | Washburn University of Topeka, Kansas, Revenue Bonds, Series 2015A, 5.000%, 7/01/35 | 7/25 at 100.00 | A1 | 1,307,975 |
| 10,420 | Total Kansas | | | 9,142,506 |
| Kentucky – 0.8% | | | |
| 1,000 | Hardin County, Kentucky, Hospital Revenue Bonds, Hardin Memorial Hospital Project, | 8/23 at 100.00 | AA (5) | 1,121,260 |
| Series 2013, 5.700%, 8/01/39 (Pre-refunded 8/01/23) – AGM Insured | | | |
| 2,000 | Kentucky Economic Development Finance Authority, Revenue Bonds, Next Generation Kentucky | 7/25 at 100.00 | BBB+ | 2,219,480 |
| Information Highway Project, Senior Series 2015A, 5.000%, 1/01/45 | | | |
| 3,000 | Total Kentucky | | | 3,340,740 |
70
| | | | | |
| Principal | | Optional Call | | |
| Amount (000) | Description (1) | Provisions (2) | Ratings (3) | Value |
| Louisiana – 6.2% | | | |
| $ 500 | Jefferson Parish Economic Development and Port District, Louisiana, Kenner Discovery | 6/28 at 100.00 | N/R | $ 561,355 |
| Health Sciences Academy Project, Series 2018A, 5.625%, 6/15/48, 144A | | | |
| 2,585 | Jefferson Sales Tax District, Jefferson Parish, Louisiana, Special Sales Tax Revenue | 12/29 at 100.00 | AA | 3,110,763 |
| Bonds, Series 2019B, 4.000%, 12/01/38 – AGM Insured | | | |
| 2,000 | Louisiana Local Government Environmental Facilities and Community Development Authority, | 2/24 at 100.00 | A+ (5) | 2,225,840 |
| Revenue Bonds, East Baton Rouge Sewerage Commission Projects, Subordinate Lien Series 2014A, | | | |
| 4.375%, 2/01/39 (Pre-refunded 2/01/24) | | | |
| 1,215 | Louisiana Local Government Environmental Facilities and Community Development Authority, | 10/25 at 100.00 | AA | 1,435,960 |
| Revenue Bonds, Louisiana Tech University Student Housing & Recreational Facilities/Innovative | | | |
| Student Facilities, 5.000%, 10/01/33 – AGM Insured | | | |
| 1,500 | Louisiana Public Facilities Authority, Louisiana, Revenue Bonds, Ochsner Clinic Foundation | 5/30 at 100.00 | A | 1,731,195 |
| Project, Series 2020A, 4.000%, 5/15/49 | | | |
| 1,000 | Louisiana Public Facilities Authority, Hospital Revenue Bonds, Franciscan Missionaries | 7/27 at 100.00 | A | 1,173,680 |
| of Our Lady Health System, Series 2017A, 5.000%, 7/01/47 | | | |
| 1,000 | Louisiana Public Facilities Authority, Lease Revenue Bonds, Provident Group-Flagship | 7/26 at 100.00 | A | 1,137,890 |
| Properties LLC – Louisiana State University Nicolson Gateway Project, Series 2016A, | | | |
| 5.000%, 7/01/56 | | | |
| 3,305 | Louisiana Public Facilities Authority, Revenue Bonds, Cleco Power LLC Project, Series | 5/23 at 100.00 | A3 | 3,461,558 |
| 2008, 4.250%, 12/01/38 | | | |
| 2,180 | Louisiana Public Facilities Authority, Revenue Bonds, Lake Charles Charter Academy | 12/21 at 100.00 | N/R | 2,243,089 |
| Foundation Project, Series 2011A, 7.750%, 12/15/31 | | | |
| 985 | Louisiana Public Facilities Authority, Revenue Bonds, Loyola University Project, | 10/21 at 100.00 | N/R (5) | 1,005,577 |
| Refunding Series 2011, 5.250%, 10/01/28 (Pre-refunded 10/01/21) | | | |
| Louisiana Public Facilities Authority, Revenue Bonds, Loyola University Project, | | | |
| Refunding Series 2017: | | | |
| 2,835 | 0.000%, 10/01/31 (9) | No Opt. Call | Baa1 | 2,948,400 |
| 1,775 | 0.000%, 10/01/36 (9) | 10/33 at 100.00 | Baa1 | 1,851,769 |
| 1,000 | New Orleans Aviation Board, Louisiana, General Airport Revenue Bonds, North Terminal | 1/27 at 100.00 | A2 | 1,178,790 |
| Project, Series 2017B, 5.000%, 1/01/48 (AMT) | | | |
| 330 | Saint John the Baptist Parish, Louisiana, Revenue Bonds, Marathon Oil Corporation | No Opt. Call | BBB– | 337,230 |
| Project, Refunding Series 2017A-1, 2.000%, 6/01/37 (Mandatory Put 4/01/23) | | | |
| 22,210 | Total Louisiana | | | 24,403,096 |
| Massachusetts – 0.9% | | | |
| 1,800 | Massachusetts Development Finance Agency, Revenue Bonds, Emmanuel College, Series 2016A, | 10/26 at 100.00 | Baa2 | 2,111,652 |
| 5.000%, 10/01/34 | | | |
| 860 | Massachusetts Educational Financing Authority, Education Loan Revenue Bonds, Issue K, | 7/22 at 100.00 | AA | 902,785 |
| Series 2013, 5.000%, 7/01/25 (AMT) | | | |
| 625 | Massachusetts Educational Financing Authority, Student Loan Revenue Bonds, Issue I | 5/21 at 100.00 | AA | 626,581 |
| Series 2010A, 5.500%, 1/01/22 | | | |
| 3,285 | Total Massachusetts | | | 3,641,018 |
| Michigan – 0.0% | | | |
| 10 | Detroit, Michigan, Water Supply System Revenue Bonds, Senior Lien Series 2003A, 5.000%, | 6/21 at 100.00 | A1 | 10,035 |
| 7/01/34 – NPFG Insured | | | |
| Missouri – 0.3% | | | |
| 960 | Branson Industrial Development Authority, Missouri, Tax Increment Revenue Bonds, Branson | 11/25 at 100.00 | N/R | 980,237 |
| Shoppes Redevelopment Project, Refunding Series 2017A, 3.900%, 11/01/29 | | | |
| 55 | Cape Girardeau County Industrial Development Authority, Missouri, Health Facilities | 3/27 at 100.00 | BBB– | 61,929 |
| Revenue Bonds, Southeasthealth, Series 2017A, 5.000%, 3/01/36 | | | |
| 1,015 | Total Missouri | | | 1,042,166 |
71
| | |
| NEV | Nuveen Enhanced Municipal Value Fund Portfolio of Investments (continued) April 30, 2021 (Unaudited) |
| | | | | |
| Principal | | Optional Call | | |
| Amount (000) | Description (1) | Provisions (2) | Ratings (3) | Value |
| Montana – 0.8% | | | |
| Montana Facility Finance Authority, Healthcare Facility Revenue Bonds, Kalispell | | | |
| Regional Medical Center, Series 2018B: | | | |
| $ 1,255 | 5.000%, 7/01/29 | 7/28 at 100.00 | BBB | $ 1,518,864 |
| 1,235 | 5.000%, 7/01/30 | 7/28 at 100.00 | BBB | 1,482,778 |
| 2,490 | Total Montana | | | 3,001,642 |
| New Jersey – 14.0% | | | |
| 2,500 | New Jersey Economic Development Authority, Lease Revenue Bonds, State Government | 12/27 at 100.00 | Baa1 | 3,000,850 |
| Buildings-Health Department & Taxation Division Office Project, Series 2018A, 5.000%, 6/15/42 | | | |
| New Jersey Economic Development Authority, School Facilities Construction Bonds, Series | | | |
| 2015WW: | | | |
| 40 | 5.250%, 6/15/40 (Pre-refunded 6/15/25) (UB) (4) | 6/25 at 100.00 | N/R (5) | 48,016 |
| 755 | 5.250%, 6/15/40 (UB) (4) | 6/25 at 100.00 | Baa1 | 867,306 |
| 2,175 | New Jersey Economic Development Authority, School Facilities Construction Bonds, Series | 6/27 at 100.00 | Baa1 | 2,579,528 |
| 2017DDD, 5.000%, 6/15/42 | | | |
| New Jersey Economic Development Authority, Special Facilities Revenue Bonds, Continental | | | |
| Airlines Inc, Series 1999: | | | |
| 775 | 5.125%, 9/15/23 (AMT) | 8/22 at 101.00 | Ba3 | 822,236 |
| 1,650 | 5.250%, 9/15/29 (AMT) | 8/22 at 101.00 | Ba3 | 1,751,426 |
| 2,155 | New Jersey Economic Development Authority, Special Facility Revenue Bonds, Port Newark | 10/27 at 100.00 | Baa3 | 2,523,613 |
| Container Terminal LLC Project, Refunding Series 2017, 5.000%, 10/01/37 (AMT) | | | |
| 9,640 | New Jersey Health Care Facilities Financing Authority, Revenue Bonds, Valley Health | 7/29 at 100.00 | A+ | 10,236,716 |
| System Obligated Group, Series 2019, 3.000%, 7/01/49 (UB) (4) | | | |
| 20,000 | New Jersey Transportation Trust Fund Authority, Transportation System Bonds, Refunding | No Opt. Call | Baa1 | 13,855,400 |
| Series 2006C, 0.000%, 12/15/36 – AMBAC Insured (UB) (4) | | | |
| 15,000 | New Jersey Transportation Trust Fund Authority, Transportation System Bonds, Series | 12/28 at 100.00 | Baa1 | 18,646,200 |
| 2018A, 5.000%, 12/15/34 (UB) (4) | | | |
| 755 | Tobacco Settlement Financing Corporation, New Jersey, Tobacco Settlement Asset-Backed | 6/28 at 100.00 | BB+ | 884,694 |
| Bonds, Series 2018B, 5.000%, 6/01/46 | | | |
| 55,445 | Total New Jersey | | | 55,215,985 |
| New York – 9.7% | | | |
| 510 | Build NYC Resource Corporation, New York, Revenue Bonds, Albert Einstein College of | 9/25 at 100.00 | N/R | 565,697 |
| Medicine, Inc, Series 2015, 5.500%, 9/01/45, 144A | | | |
| 350 | Jefferson County Civic Facility Development Corporation, New York, Revenue Bonds, | 11/27 at 100.00 | BBB– | 371,931 |
| Samaritan Medical Center Project, Series 2017A, 4.000%, 11/01/42 | | | |
| 1,500 | Metropolitan Transportation Authority, New York, Transportation Revenue Bonds, Bond | No Opt. Call | N/R | 1,572,960 |
| Anticipation Note Series 2019B-1, 5.000%, 5/15/22 | | | |
| 1,000 | Monroe County Industrial Development Corporation, New York, Revenue Bonds, St John | 6/21 at 100.00 | A– | 1,003,230 |
| Fisher College, Series 2011, 6.000%, 6/01/34 | | | |
| 2,855 | New York City, New York, General Obligation Bonds, Fiscal 2021 Series C, 4.000%, 8/01/37 | 8/30 at 100.00 | AA | 3,392,854 |
| 500 | New York Liberty Development Corporation, New York, Liberty Revenue Bonds, 3 World Trade | 11/24 at 100.00 | N/R | 558,860 |
| Center Project, Class 2 Series 2014, 5.150%, 11/15/34, 144A | | | |
| 15,000 | New York State Urban Development Corporation, State Sales Tax Revenue Bonds, Series | 9/29 at 100.00 | AA+ | 15,732,450 |
| 2019A, 3.000%, 3/15/49 (UB) (4) | | | |
| New York Transportation Development Corporation, New York, Special Facilities Bonds, | | | |
| LaGuardia Airport Terminal B Redevelopment Project, Series 2016A: | | | |
| 4,000 | 4.000%, 7/01/33 (AMT) | 7/24 at 100.00 | BBB | 4,356,120 |
| 2,105 | 5.000%, 7/01/46 (AMT) | 7/24 at 100.00 | BBB | 2,371,977 |
| 1,100 | New York Transportation Development Corporation, Special Facility Revenue Bonds, Delta | 1/28 at 100.00 | Baa3 | 1,338,194 |
| Air Lines, Inc – LaGuardia Airport Terminals C&D Redevelopment Project, Series 2018, 5.000%, | | | |
| 1/01/33 (AMT) | | | |
| 4,115 | Port Authority of New York and New Jersey, Consolidated Revenue Bonds, Two Hundred | 7/30 at 100.00 | Aa3 | 4,690,935 |
| Twenty-One Series 2020, 4.000%, 7/15/50 (AMT) (UB) (4) | | | |
| 2,150 | TSASC Inc, New York, Tobacco Asset-Backed Bonds, Series 2006, 5.000%, 6/01/48 | 6/27 at 100.00 | N/R | 2,333,632 |
| 35,185 | Total New York | | | 38,288,840 |
72
| | | | | |
| Principal | | Optional Call | | |
| Amount (000) | Description (1) | Provisions (2) | Ratings (3) | Value |
| North Carolina – 0.5% | | | |
| North Carolina Turnpike Authority, Triangle Expressway System Revenue Bonds, Senior Lien | | | |
| Series 2019: | | | |
| $ 875 | 4.000%, 1/01/55 – AGM Insured | 1/30 at 100.00 | AA | $ 996,485 |
| 1,000 | 4.000%, 1/01/55 | 1/30 at 100.00 | Aa1 | 1,128,750 |
| 1,875 | Total North Carolina | | | 2,125,235 |
| Ohio – 6.9% | | | |
| 8,375 | Buckeye Tobacco Settlement Financing Authority, Ohio, Tobacco Settlement Asset-Backed | 6/30 at 22.36 | N/R | 1,307,337 |
| Revenue Bonds, Refunding Senior Lien Capital Appreciation Series 2020B-3 Class 2, | | | |
| 0.000%, 6/01/57 | | | |
| 5,480 | Buckeye Tobacco Settlement Financing Authority, Ohio, Tobacco Settlement Asset-Backed | 6/30 at 100.00 | BBB+ | 5,633,714 |
| Revenue Bonds, Refunding Senior Lien Series 2020A-2 Class 1, 3.000%, 6/01/48 | | | |
| 3,235 | Buckeye Tobacco Settlement Financing Authority, Ohio, Tobacco Settlement Asset-Backed | 6/30 at 100.00 | N/R | 3,636,690 |
| Revenue Bonds, Refunding Senior Lien Series 2020B-2 Class 2, 5.000%, 6/01/55 | | | |
| 310 | Franklin County Convention Facilities Authority, Ohio, Hotel Project Revenue Bonds, | 12/29 at 100.00 | BBB– | 359,693 |
| Greater Columbus Convention Center Hotel Expansion Project, Series 2019, 5.000%, 12/01/51 | | | |
| 10,000 | Franklin County, Ohio, Hospital Facilities Revenue Bonds, OhioHealth Corporation, Series | 5/25 at 100.00 | AA+ | 11,586,600 |
| 2015, 5.000%, 5/15/40 (UB) (4) | | | |
| 3,000 | Lucas County, Ohio, Hospital Revenue Bonds, ProMedica Healthcare Obligated Group, Series | 11/21 at 100.00 | BBB (5) | 3,090,180 |
| 2011A, 5.750%, 11/15/31 (Pre-refunded 11/15/21) | | | |
| 295 | Ohio Air Quality Development Authority, Ohio, Pollution Control Revenue Bonds, | No Opt. Call | N/R | 299,555 |
| FirstEnergy Generation Corporation Project, Refunding Series 2009D, 4.250%, 8/01/29 | | | |
| (Mandatory Put 9/15/21) | | | |
| 6,000 | Ohio Air Quality Development Authority, Ohio, Pollution Control Revenue Bonds, | No Opt. Call | N/R | 7,500 |
| FirstEnergy Generation Project, Refunding Series 2006A, 3.750%, 12/01/23 (8) | | | |
| 860 | Ohio Air Quality Development Authority, Ohio, Pollution Control Revenue Bonds, | No Opt. Call | N/R | 885,370 |
| FirstEnergy Nuclear Generation Project, Refunding Series 2009A, 4.375%, 6/01/33 (Mandatory | | | |
| Put 6/01/22) | | | |
| 375 | Ohio Water Development Authority, Pollution Control Revenue Refunding Bonds, FirstEnergy | No Opt. Call | N/R | 386,063 |
| Nuclear Generating Corporation Project, Series 2009A, 4.375%, 6/01/33 (Mandatory Put 6/01/22) | | | |
| 60 | Ohio Water Development Authority, Pollution Control Revenue Refunding Bonds, FirstEnergy | No Opt. Call | N/R | 61,770 |
| Nuclear Generating Corporation Project, Series 2010B, 4.375%, 6/01/33 (Mandatory Put 6/01/22) | | | |
| 37,990 | Total Ohio | | | 27,254,472 |
| Oklahoma – 2.1% | | | |
| Oklahoma Development Finance Authority, Health System Revenue Bonds, OU Medicine | | | |
| Project, Series 2018B: | | | |
| 440 | 5.000%, 8/15/38 | 8/28 at 100.00 | Baa3 | 530,103 |
| 5,000 | 5.500%, 8/15/52 | 8/28 at 100.00 | Baa3 | 6,140,500 |
| 1,500 | Tulsa Municipal Airport Trust, Oklahoma, Revenue Bonds, American Airlines Inc, Refunding | 6/25 at 100.00 | B– | 1,677,030 |
| Series 2015, 5.000%, 6/01/35 (AMT) (Mandatory Put 6/01/25) | | | |
| 6,940 | Total Oklahoma | | | 8,347,633 |
| Pennsylvania – 7.3% | | | |
| 1,500 | Allegheny Country Industrial Development Authority, Pennsylvania, Environmental | 12/21 at 100.00 | B– | 1,539,570 |
| Improvement Revenue Bonds, United States Steel Corporation Project, Refunding Series 2011, | | | |
| 6.550%, 12/01/27 | | | |
| 1,050 | Beaver County Industrial Development Authority, Pennsylvania, Pollution Control Revenue | No Opt. Call | N/R | 1,081,206 |
| Bonds, FirstEnergy Generation Project, Refunding Series 2006A, 4.375%, 1/01/35 | | | |
| (Mandatory Put 7/01/22) | | | |
| 2,000 | Beaver County Industrial Development Authority, Pennsylvania, Pollution Control Revenue | No Opt. Call | N/R | 2,500 |
| Bonds, FirstEnergy Nuclear Generation Project, Series 2006B, 3.500%, 12/01/35 (8) | | | |
| 1,000 | Beaver County Industrial Development Authority, Pennsylvania, Pollution Control Revenue | 4/31 at 100.00 | N/R | 1,051,020 |
| Refunding Bonds, FirstEnergy Generation Project, Series 2008B, 3.750%, 10/01/47 (Mandatory | | | |
| Put 4/01/21) | | | |
73
| | |
| NEV | Nuveen Enhanced Municipal Value Fund Portfolio of Investments (continued) April 30, 2021 (Unaudited) |
| | | | | |
| Principal | | Optional Call | | |
| Amount (000) | Description (1) | Provisions (2) | Ratings (3) | Value |
| Pennsylvania (continued) | | | |
| Commonwealth Financing Authority, Pennsylvania, State Appropriation Lease Bonds, Master | | | |
| Settlement, Series 2018: | | | |
| $ 4,000 | 5.000%, 6/01/32 (UB) (4) | 6/28 at 100.00 | A1 | $ 4,948,800 |
| 2,260 | 5.000%, 6/01/33 (UB) (4) | 6/28 at 100.00 | A1 | 2,784,184 |
| 1,275 | 5.000%, 6/01/34 (UB) (4) | 6/28 at 100.00 | A1 | 1,565,573 |
| 1,975 | Pennsylvania Higher Educational Facilities Authority, Revenue Bonds, University of | 8/29 at 100.00 | AA | 2,296,333 |
| Pennsylvania Health System, Series 2019, 4.000%, 8/15/49 | | | |
| 130 | Pennsylvania Higher Educational Facilities Authority, Revenue Bonds, University | 7/26 at 100.00 | Baa3 | 144,236 |
| Properties Inc Student Housing Project at East Stroudsburg University of Pennsylvania, Series | | | |
| 2016A, 5.000%, 7/01/31 | | | |
| 1,000 | Pennsylvania Public School Building Authority, Lease Revenue Bonds, School District of | No Opt. Call | AA | 1,226,040 |
| Philadelphia, Series 2006B, 5.000%, 6/01/27 – AGM Insured | | | |
| Pennsylvania Turnpike Commission, Turnpike Revenue Bonds, Capital Appreciation | | | |
| Series 2009E: | | | |
| 3,530 | 6.000%, 12/01/30 | 12/27 at 100.00 | A | 4,632,560 |
| 2,000 | 6.375%, 12/01/38 | 12/27 at 100.00 | A | 2,657,360 |
| 4,000 | Philadelphia Authority for Industrial Development, Pennsylvania, Revenue Bonds, | 5/27 at 100.00 | Baa1 | 4,615,760 |
| University of the Sciences in Philadelphia, Series 2017, 5.000%, 11/01/47 (UB) (4) | | | |
| 25,720 | Total Pennsylvania | | | 28,545,142 |
| Puerto Rico – 3.2% | | | |
| 75,000 | Children’s Trust Fund, Puerto Rico, Tobacco Settlement Asset-Backed Bonds, Series 2008A, | 6/21 at 6.78 | N/R | 4,759,500 |
| 0.000%, 5/15/57 | | | |
| 1,000 | Puerto Rico Aqueduct and Sewerage Authority, Revenue Bonds, Senior Lien Series 2012A, | 7/22 at 100.00 | CCC | 1,064,300 |
| 5.750%, 7/01/37 | | | |
| Puerto Rico Highway and Transportation Authority, Highway Revenue Bonds, Series 2007N: | | | |
| 1,000 | 2.796%, 7/01/27 | No Opt. Call | C | 958,490 |
| 1,000 | 5.250%, 7/01/36 – AGC Insured | No Opt. Call | AA | 1,231,120 |
| Puerto Rico Sales Tax Financing Corporation, Sales Tax Revenue Bonds, Restructured 2018A-1: | | | |
| 565 | 0.000%, 7/01/51 | 7/28 at 30.01 | N/R | 129,939 |
| 2,000 | 4.750%, 7/01/53 | 7/28 at 100.00 | N/R | 2,224,800 |
| 2,000 | Puerto Rico Sales Tax Financing Corporation, Sales Tax Revenue Bonds, Taxable | 7/28 at 100.00 | N/R | 2,191,160 |
| Restructured Cofina Project Series 2019A-2, 4.329%, 7/01/40 | | | |
| 82,565 | Total Puerto Rico | | | 12,559,309 |
| South Carolina – 2.3% | | | |
| 7,500 | South Carolina Public Service Authority Santee Cooper Revenue Obligations, Refunding | 12/26 at 100.00 | A | 9,027,075 |
| Series 2016B, 5.000%, 12/01/46 (UB) (4) | | | |
| Tennessee – 0.3% | | | |
| 1,000 | Bristol Industrial Development Board, Tennessee, State Sales Tax Revenue Bonds, Pinnacle | 12/26 at 100.00 | N/R | 995,430 |
| Project, Series 2016A, 5.125%, 12/01/42, 144A | | | |
| 155 | The Tennessee Energy Acquisition Corporation, Gas Revenue Bonds, Series 2006C, | No Opt. Call | A | 173,256 |
| 5.000%, 2/01/24 | | | |
| 1,155 | Total Tennessee | | | 1,168,686 |
| Texas – 3.4% | | | |
| 80 | Arlington Higher Education Finance Corporation, Texas, Education Revenue Bonds, | 6/21 at 100.00 | BB | 80,263 |
| Leadership Prep School, Series 2016A, 5.000%, 6/15/46 | | | |
| 2,545 | Dallas-Fort Worth International Airport, Texas, Joint Revenue Bonds, Refunding Series | 11/30 at 100.00 | A1 | 3,109,201 |
| 2020A, 4.000%, 11/01/35 | | | |
| 150 | Fort Bend County Industrial Development Corporation, Texas, Revenue Bonds, NRG Energy | 11/22 at 100.00 | Baa2 | 157,842 |
| Inc Project, Series 2012B, 4.750%, 11/01/42 | | | |
74
| | | | | |
| Principal | | Optional Call | | |
| Amount (000) | Description (1) | Provisions (2) | Ratings (3) | Value |
| Texas (continued) | | | |
| $ 825 | New Hope Cultural Education Facilities Finance Corporation, Texas, Student Housing | 7/25 at 100.00 | Caa1 | $ 709,500 |
| Revenue Bonds, NCCD – College Station Properties LLC – Texas A&M University Project, Series | | | |
| 2015A, 5.000%, 7/01/47 | | | |
| 1,800 | North Texas Tollway Authority, Special Projects System Revenue Bonds, Tender Option Bond | 9/21 at 100.00 | N/R (5) | 1,956,960 |
| Trust 2016-XF2220, 24.521%, 9/01/41 (Pre-refunded 9/01/21), 144A (IF) | | | |
| 1,000 | Red River Health Facilities Development Corporation, Texas, First Mortgage Revenue | 12/21 at 100.00 | N/R | 662,500 |
| Bonds, Eden Home Inc, Series 2012, 7.250%, 12/15/47 (8) | | | |
| 1,675 | Texas Department of Housing and Community Affairs, Single Family Mortgage Revenue Bonds, | 9/27 at 100.00 | Aaa | 1,831,713 |
| Series 2018A, 4.250%, 9/01/48 | | | |
| Texas Private Activity Bond Surface Transportation Corporation, Senior Lien Revenue | | | |
| Bonds, Blueridge Transportation Group, LLC SH 288 Toll Lanes Project, Series 2016: | | | |
| 3,600 | 5.000%, 12/31/50 (AMT) | 12/25 at 100.00 | Baa3 | 4,056,228 |
| 805 | 5.000%, 12/31/55 (AMT) | 12/25 at 100.00 | Baa3 | 905,480 |
| 12,480 | Total Texas | | | 13,469,687 |
| Virginia – 1.8% | | | |
| 2,000 | Tobacco Settlement Financing Corporation of Virginia, Tobacco Settlement Asset Backed | 5/21 at 100.00 | B– | 2,011,100 |
| Bonds, Series 2007B1, 5.000%, 6/01/47 | | | |
| 2,500 | Virginia Housing Development Authority, Rental Housing Bonds, Series 2018E, 4.150%, | 12/27 at 100.00 | AA+ | 2,773,600 |
| 12/01/49 (4) | | | |
| 1,155 | Virginia Small Business Financing Authority, Private Activity Revenue Bonds, Transform | 6/27 at 100.00 | BBB | 1,377,580 |
| 66 P3 Project, Senior Lien Series 2017, 5.000%, 12/31/56 (AMT) | | | |
| 1,010 | Virginia Small Business Financing Authority, Senior Lien Revenue Bonds, Elizabeth River | 7/22 at 100.00 | BBB | 1,063,641 |
| Crossing, Opco LLC Project, Series 2012, 5.500%, 1/01/42 (AMT) | | | |
| 6,665 | Total Virginia | | | 7,225,921 |
| Washington – 2.5% | | | |
| 5,000 | Port of Seattle, Washington, Revenue Bonds, Refunding First Lien Series 2016B, 5.000%, | 4/26 at 100.00 | Aa2 | 5,944,150 |
| 10/01/31 (AMT) (UB) (4) | | | |
| 3,155 | Skagit County Public Hospital District 1, Washington, Revenue Bonds, Skagit Valley | 12/26 at 100.00 | Baa2 | 3,756,154 |
| Hospital, Refunding & Improvement Series 2016, 5.000%, 12/01/27 | | | |
| 135 | Tacoma Consolidated Local Improvement District 65, Washington, Special Assessment Bonds, | 5/21 at 100.00 | N/R | 136,348 |
| Series 2013, 5.750%, 4/01/43 | | | |
| 8,290 | Total Washington | | | 9,836,652 |
| Wisconsin – 8.5% | | | |
| 25 | Public Finance Authority of Wisconsin, Charter School Revenue Bonds, Corvian Community | 6/24 at 100.00 | N/R | 26,187 |
| School, North Carolina, Series 2017A, 5.000%, 6/15/37, 144A | | | |
| 170 | Public Finance Authority of Wisconsin, Charter School Revenue Bonds, North Carolina | 6/26 at 100.00 | N/R | 176,747 |
| Charter Educational Foundation Project, Series 2016A, 5.000%, 6/15/36, 144A | | | |
75
| | |
| NEV | Nuveen Enhanced Municipal Value Fund Portfolio of Investments (continued) April 30, 2021 (Unaudited) |
| | | | | |
| Principal | | Optional Call | | |
| Amount (000) | Description (1) | Provisions (2) | Ratings (3) | Value |
| Wisconsin (continued) | | | |
| Public Finance Authority of Wisconsin, Conference Center and Hotel Revenue Bonds, | | | |
| Lombard Public Facilities Corporation, Second Tier Series 2018B: | | | |
| $ 69 | 0.000%, 1/01/46, 144A (8) | No Opt. Call | N/R | $ 2,133 |
| 68 | 0.000%, 1/01/47, 144A (8) | No Opt. Call | N/R | 2,025 |
| 68 | 0.000%, 1/01/48, 144A (8) | No Opt. Call | N/R | 1,981 |
| 68 | 0.000%, 1/01/49, 144A (8) | No Opt. Call | N/R | 1,927 |
| 67 | 0.000%, 1/01/50, 144A (8) | No Opt. Call | N/R | 1,828 |
| 73 | 0.000%, 1/01/51, 144A (8) | No Opt. Call | N/R | 1,969 |
| 1,874 | 3.750%, 7/01/51, 144A (8) | 3/28 at 100.00 | N/R | 1,290,560 |
| 72 | 0.000%, 1/01/52, 144A (8) | No Opt. Call | N/R | 1,883 |
| 71 | 0.000%, 1/01/53, 144A (8) | No Opt. Call | N/R | 1,826 |
| 71 | 0.000%, 1/01/54, 144A (8) | No Opt. Call | N/R | 1,766 |
| 70 | 0.000%, 1/01/55, 144A (8) | No Opt. Call | N/R | 1,706 |
| 69 | 0.000%, 1/01/56, 144A (8) | No Opt. Call | N/R | 1,657 |
| 68 | 0.000%, 1/01/57, 144A (8) | No Opt. Call | N/R | 1,602 |
| 67 | 0.000%, 1/01/58, 144A (8) | No Opt. Call | N/R | 1,546 |
| 67 | 0.000%, 1/01/59, 144A (8) | No Opt. Call | N/R | 1,508 |
| 67 | 0.000%, 1/01/60, 144A (8) | No Opt. Call | N/R | 1,451 |
| 66 | 0.000%, 1/01/61, 144A (8) | No Opt. Call | N/R | 1,392 |
| 65 | 0.000%, 1/01/62, 144A (8) | No Opt. Call | N/R | 1,350 |
| 64 | 0.000%, 1/01/63, 144A (8) | No Opt. Call | N/R | 1,303 |
| 64 | 0.000%, 1/01/64, 144A (8) | No Opt. Call | N/R | 1,272 |
| 63 | 0.000%, 1/01/65, 144A (8) | No Opt. Call | N/R | 1,223 |
| 62 | 0.000%, 1/01/66, 144A (8) | No Opt. Call | N/R | 1,148 |
| 808 | 0.000%, 1/01/67, 144A (8) | No Opt. Call | N/R | 13,917 |
| 1,690 | Public Finance Authority of Wisconsin, Limited Obligation Grant Revenue Bonds, American | No Opt. Call | N/R | 1,837,740 |
| Dream @ Meadowlands Project, Series 2017A, 6.250%, 8/01/27, 144A | | | |
| 1,350 | Public Finance Authority of Wisconsin, Limited Obligation PILOT Revenue Bonds, American | 12/27 at 100.00 | N/R | 1,559,277 |
| Dream @ Meadowlands Project, Series 2017, 7.000%, 12/01/50, 144A | | | |
| 160 | Public Finance Authority of Wisconsin, Revenue Bonds, Prime Healthcare Foundation, Inc, | 12/27 at 100.00 | BBB– | 182,376 |
| Series 2017A, 5.200%, 12/01/37 | | | |
| 2,905 | Public Finance Authority of Wisconsin, Student Housing Revenue Bonds, Collegiate Housing | 7/25 at 100.00 | BBB– | 3,194,861 |
| Foundation – Cullowhee LLC – Western California University Project, Series 2015A, | | | |
| 5.000%, 7/01/35 | | | |
| 1,000 | Wisconsin Center District, Dedicated Tax Revenue Bonds, Refunding Senior Series 2003A, | No Opt. Call | AA | 815,870 |
| 0.000%, 12/15/31 | | | |
| 1,290 | Wisconsin Health and Educational Facilities Authority, Revenue Bonds, Froedtert | 10/22 at 100.00 | AA | 1,488,273 |
| Community Health, Inc Obligated Group, Tender Option Bond Trust 2015-XF0118, 16.999%, | | | |
| 4/01/42, 144A (IF) (4) | | | |
| Wisconsin Health and Educational Facilities Authority, Wisconsin, Revenue Bonds, | | | |
| Ascension Health Alliance Senior Credit Group, Series 2016A: | | | |
| 10,000 | 5.000%, 11/15/35 (UB) (4) | 5/26 at 100.00 | AA+ | 12,012,700 |
| 5,000 | 5.000%, 11/15/36 (UB) (4) | 5/26 at 100.00 | AA+ | 5,994,800 |
| 3,000 | 5.000%, 11/15/39 (UB) (4) | 5/26 at 100.00 | AA+ | 3,581,550 |
| 25 | Wisconsin Health and Educational Facilities Authority, Wisconsin, Revenue Bonds, Monroe | 8/25 at 100.00 | N/R (5) | 29,747 |
| Clinic Inc, Refunding Series 2016, 5.000%, 2/15/28 (Pre-refunded 8/15/25) | | | |
| Wisconsin Health and Educational Facilities Authority, Wisconsin, Revenue Bonds, Three | | | |
| Pillars Senior Living Communities, Refunding Series 2013: | | | |
| 85 | 5.000%, 8/15/43 (Pre-refunded 8/15/23) | 8/23 at 100.00 | A (5) | 94,340 |
| 1,005 | 5.000%, 8/15/43 (Pre-refunded 8/15/23) | 8/23 at 100.00 | BBB+ (5) | 1,115,429 |
| 31,806 | Total Wisconsin | | | 33,448,870 |
76
| | | | | |
| Principal | | Optional Call | | |
| Amount (000) | Description (1) | Provisions (2) | Ratings (3) | Value |
| Wyoming – 0.6% | | | |
| Wyoming Community Development Authority, Student Housing Revenue Bonds, CHF-Wyoming, | | | |
| LLC – University of Wyoming Project, Series 2011: | | | |
| $ 710 | 6.250%, 7/01/31 | 7/21 at 100.00 | BBB | $ 714,714 |
| 1,600 | 6.500%, 7/01/43 | 7/21 at 100.00 | BBB | 1,610,089 |
| 2,310 | Total Wyoming | | | 2,324,803 |
| $ 578,778 | Total Municipal Bonds (cost $466,140,796) | | | 510,386,158 |
| Shares | Description (1) | | | Value |
| COMMON STOCKS – 1.9% | | | |
| Electric Utilities – 1.9% | | | |
| 258,655 | Energy Harbor Corp (10), (11), (12) | | | $ 7,452,626 |
| Total Common Stocks (cost $7,346,611) | | | 7,452,626 |
| Total Long-Term Investments (cost $473,487,407) | | | 517,838,784 |
| Floating Rate Obligations – (33.6)% | | | (132,467,000) |
| Other Assets Less Liabilities – 2.1% | | | 8,321,487 |
| Net Assets Applicable to Common Shares – 100% | | | $ 393,693,271 |
| | |
(1) | All percentages shown in the Portfolio of Investments are based on net assets applicable to common shares unless otherwise noted. |
(2) | Optional Call Provisions: Dates (month and year) and prices of the earliest optional call or redemption. There may be other call provisions at varying prices at later dates. Certain |
| mortgage-backed securities may be subject to periodic principal paydowns. |
(3) | For financial reporting purposes, the ratings disclosed are the highest of Standard & Poor’s Group (“Standard & Poor’s”), Moody’s Investors Service, Inc. (“Moody’s”) or Fitch, |
| Inc. (“Fitch”) rating. This treatment of split-rated securities may differ from that used for other purposes, such as for Fund investment policies. Ratings below BBB by Standard |
| & Poor’s, Baa by Moody’s or BBB by Fitch are considered to be below investment grade. Holdings designated N/R are not rated by any of these national rating agencies. |
(4) | Investment, or portion of investment, has been pledged to collateralize the net payment obligations for investments in inverse floating rate transactions. |
(5) | Backed by an escrow or trust containing sufficient U.S. Government or U.S. Government agency securities, which ensure the timely payment of principal and interest. |
(6) | Variable rate security. The rate shown is the coupon as of the end of the reporting period. |
(7) | Investment valued at fair value using methods determined in good faith by, or at the discretion of, the Board. For fair value measurement disclosure purposes, investment |
| classified as Level 3. See Notes to Financial Statements, Note 3 - Investment Valuation and Fair Value Measurements for more information. |
(8) | Defaulted security. A security whose issuer has failed to fully pay principal and/or interest when due, or is under the protection of bankruptcy. |
(9) | Step-up coupon bond, a bond with a coupon that increases (“steps up”), usually at regular intervals, while the bond is outstanding. The rate shown is the coupon as of the end |
| of the reporting period. |
(10) | Common Stock received as part of the bankruptcy settlements during February 2020 for Beaver County Industrial Development Authority, Pennsylvania, Pollution Control |
| Revenue Refunding Bonds, FirstEnergy Nuclear Generation Project, Series 2006B, 3.500%, 12/01/35; and Ohio Air Quality Development Authority, Ohio, Pollution Control |
| Revenue Bonds, FirstEnergy Generation Project, Refunding Series 2006A, 0.000%, 12/01/23. |
(11) | For fair value measurement disclosure purposes, investment classified as Level 2. See Notes to Financial Statements, Note 3 - Investment Valuation and Fair Value Measurements for more information.
|
(12) | Non-income producing; issuer has not declared an ex-dividend date within the past twelve months. |
144A | Investment is exempt from registration under Rule 144A of the Securities Act of 1933, as amended. These investments may only be resold in transactions exempt from registration, which are normally those transactions with qualified institutional buyers.
|
AMT | Alternative Minimum Tax. |
IF | Inverse floating rate security issued by a tender option bond (“TOB”) trust, the interest rate on which varies inversely with the Securities Industry Financial Markets Association |
| (SIFMA) short-term rate, which resets weekly, or a similar short-term rate, and is reduced by the expenses related to the TOB trust. |
LIBOR | London Inter-Bank Offered Rate. |
UB | Underlying bond of an inverse floating rate trust reflected as a financing transaction. See Notes to Financial Statements, Note 4 – Portfolio Securities and Investments in |
| Derivatives for more information. |
| See accompanying notes to financial statements. |
77
Statement of Assets and Liabilities
April 30, 2021 (Unaudited)
| | | | | | | | | | | | | |
| | NUV | | | NUW | | | NMI | | | NEV | |
| Assets | | | | | | | | | | | | |
Long-term investments, at value (cost $1,948,432,760, $270,028,563, | | | | | | | | | | | | |
| $96,034,221 and $473,487,407, respectively) | | $ | 2,220,710,890 | | | $ | 311,430,289 | | | $ | 104,834,335 | | | $ | 517,838,784 | |
Short-term investments, at value (cost approximates value) | | | — | | | | 450,000 | | | | — | | | | — | |
Cash | | | — | | | | 2,757,219 | | | | 660,876 | | | | 2,452,449 | |
Cash Collateral at brokers for investments in futures(1) | | | — | | | | 364,994 | | | | — | | | | — | |
Receivable for: | | | | | | | | | | | | | | | | |
| Interest | | | 23,437,313 | | | | 3,089,658 | | | | 1,232,870 | | | | 8,227,723 | |
| Investments sold | | | 28,788,293 | | | | 3,181,163 | | | | 1,035,000 | | | | 195,000 | |
| Shares sold | | | — | | | | — | | | | 19,521 | | | | — | |
Deferred offering costs | | | — | | | | — | | | | 160,516 | | | | — | |
Other assets | | | 449,355 | | | | 408 | | | | 4 | | | | 30,302 | |
| Total assets | | | 2,273,385,851 | | | | 321,273,731 | | | | 107,943,122 | | | | 528,744,258 | |
| Liabilities | | | | | | | | | | | | | | | | |
Cash overdraft | | | 2,192,645 | | | | — | | | | — | | | | — | |
Floating rate obligations | | | 29,705,000 | | | | 3,230,000 | | | | — | | | | 132,467,000 | |
Payable for: | | | | | | | | | | | | | | | | |
| Dividends | | | 5,869,237 | | | | 680,841 | | | | 290,414 | | | | 1,513,843 | |
| Interest | | | 42,505 | | | | 3,559 | | | | — | | | | 641,834 | |
| Investments purchased - regular settlement | | | — | | | | 2,169,400 | | | | — | | | | — | |
| Investments purchased - when-issued/delayed-delivery settlement | | | 12,777,366 | | | | 1,455,777 | | | | — | | | | — | |
| Variation margin on futures contracts | | | — | | | | 11,063 | | | | — | | | | — | |
Accrued expenses: | | | | | | | | | | | | | | | | |
| Management fees | | | 772,938 | | | | 141,936 | | | | 52,917 | | | | 282,705 | |
| Directors/Trustees fees | | | 471,591 | | | | 4,935 | | | | 1,512 | | | | 35,146 | |
| Shelf offering costs | | | — | | | | — | | | | 124,015 | | | | — | |
| Other | | | 545,950 | | | | 275,122 | | | | 63,587 | | | | 110,459 | |
| Total liabilities | | | 52,377,232 | | | | 7,972,633 | | | | 532,445 | | | | 135,050,987 | |
| Commitments and contingencies (Note 8) | | | | | | | | | | | | | | | | |
Net Assets applicable to common shares | | $ | 2,221,008,619 | | | $ | 313,301,098 | | | $ | 107,410,677 | | | $ | 393,693,271 | |
Common shares outstanding | | | 207,304,760 | | | | 17,951,336 | | | | 9,459,044 | | | | 24,956,400 | |
Net asset value (“NAV”) per common share outstanding | | $ | 10.71 | | | $ | 17.45 | | | $ | 11.36 | | | $ | 15.78 | |
| Net assets applicable to common shares consist of: | | | | | | | | | | | | | | | | |
Common shares, $0.01 par value per share | | $ | 2,073,048 | | | $ | 179,513 | | | $ | 94,590 | | | $ | 249,564 | |
Paid-in-surplus | | | 1,960,957,922 | | | | 268,863,870 | | | | 98,524,746 | | | | 347,191,386 | |
Total distributable earnings | | | 257,977,649 | | | | 44,257,715 | | | | 8,791,341 | | | | 46,252,321 | |
Net assets applicable to common shares | | $ | 2,221,008,619 | | | $ | 313,301,098 | | | $ | 107,410,677 | | | $ | 393,693,271 | |
Authorized common shares | | | 350,000,000 | | | Unlimited | | | | 200,000,000 | | | Unlimited | |
(1) Cash pledged to collateralize the net payment obligations for investments in derivatives. | | | |
See accompanying notes to financial statements.
78
| | | |
| Six Months Ended April 30, 2021 (Unaudited) | | | |
| | NUV | | | NUW | | | NMI | | | NEV | |
| Investment Income | | $ | 42,503,564 | | | $ | 4,741,786 | | | $ | 2,206,451 | | | $ | 11,124,994 | |
| Expenses | | | | | | | | | | | | | | | | |
Management fees | | | 4,706,559 | | | | 769,976 | | | | 315,111 | | | | 1,685,103 | |
Interest expense | | | 78,115 | | | | 9,678 | | | | — | | | | 444,023 | |
Custodian fees | | | 93,963 | | | | 22,484 | | | | 14,423 | | | | 29,742 | |
Directors/Trustees fees | | | 30,722 | | | | 4,326 | | | | 1,455 | | | | 5,666 | |
Professional fees | | | 73,231 | | | | 27,183 | | | | 19,118 | | | | 30,362 | |
Shareholder reporting expenses | | | 116,387 | | | | 16,364 | | | | 11,950 | | | | 24,529 | |
Shareholder servicing agent fees | | | 140,612 | | | | 106 | | | | 3,349 | | | | 103 | |
Stock exchange listing fees | | | 27,880 | | | | 3,489 | | | | 3,527 | | | | 3,350 | |
Investor relations expenses | | | 38,067 | | | | 4,724 | | | | 1,609 | | | | 6,715 | |
Other | | | 32,869 | | | | 7,166 | | | | 31,012 | | | | 11,526 | |
Total expenses | | | 5,338,405 | | | | 865,496 | | | | 401,554 | | | | 2,241,119 | |
Net investment income (loss) | | | 37,165,159 | | | | 3,876,290 | | | | 1,804,897 | | | | 8,883,875 | |
| Realized and Unrealized Gain (Loss) | | | | | | | | | | | | | | | | |
Net realized gain (loss) from: | | | | | | | | | | | | | | | | |
| Investments | | | 2,151,271 | | | | 1,577,588 | | | | 158,068 | | | | 250,443 | |
| Futures contracts | | | — | | | | 762,147 | | | | — | | | | — | |
Change in net unrealized appreciation (depreciation) of: | | | | | | | | | | | | | | | | |
| Investments | | | 46,680,830 | | | | 7,753,969 | | | | 2,393,069 | | | | 24,019,219 | |
| Futures contracts | | | — | | | | 356,981 | | | | — | | | | — | |
Net realized and unrealized gain (loss) | | | 48,832,101 | | | | 10,450,685 | | | | 2,551,137 | | | | 24,269,662 | |
Net increase (decrease) in net assets applicable to common shares | | | | | | | | | | | | | | | | |
| from operations | | $ | 85,997,260 | | | $ | 14,326,975 | | | $ | 4,356,034 | | | $ | 33,153,537 | |
See accompanying notes to financial statements.
79
Statement of Changes in Net Assets
| | | | | | | | | | | | | |
| | NUV | | | | |
| | Six Months | | | | | | Six Months | | | | |
| | Ended | | | | | | Ended | | | | |
| | 4/30/21 | | | Year Ended | | | 4/30/21 | | | Year Ended | |
| | (Unaudited) | | | 10/31/20 | | | (Unaudited) | | | 10/31/20 | |
| Operations | | | | | | | | | | | | |
Net investment income (loss) | | $ | 37,165,159 | | | $ | 76,473,628 | | | $ | 3,876,290 | | | $ | 7,243,940 | |
Net realized gain (loss) from: | | | | | | | | | | | | | | | | |
| Investments | | | 2,151,271 | | | | (1,093,806 | ) | | | 1,577,588 | | | | 2,179,755 | |
| Futures contracts | | | — | | | | — | | | | 762,147 | | | | (2,192,608 | ) |
Change in net unrealized appreciation (depreciation) of: | | | | | | | | | | | | | | | | |
| Investments | | | 46,680,830 | | | | (16,333,725 | ) | | | 7,753,969 | | | | (1,153,043 | ) |
| Futures contracts | | | — | | | | — | | | | 356,981 | | | | (91,878 | ) |
Net increase (decrease) in net assets applicable to common shares | | | | | | | | | | | | | | | | |
from operations | | | 85,997,260 | | | | 59,046,097 | | | | 14,326,975 | | | | 5,986,166 | |
| Distributions to Common Shareholders | | | | | | | | | | | | | | | | |
Dividends | | | (38,541,019 | ) | | | (76,995,152 | ) | | | (3,813,894 | ) | | | (7,385,655 | ) |
Decrease in net assets applicable to common shares from | | | | | | | | | | | | | | | | |
| distributions to common shareholders | | | (38,541,019 | ) | | | (76,995,152 | ) | | | (3,813,894 | ) | | | (7,385,655 | ) |
| Capital Share Transactions | | | | | | | | | | | | | | | | |
Proceeds from shelf offering, net of offering costs | | | — | | | | — | | | | — | | | | — | |
Net proceeds from common shares issued to common shareholders | | | | | | | | | | | | | | | | |
| due to reinvestment of distributions | | | 2,448,445 | | | | 2,130,085 | | | | — | | | | — | |
Issued in the Reorganizations | | | — | | | | — | | | | 41,997,759 | | | | — | |
Net increase (decrease) in net assets applicable to common shares | | | | | | | | | | | | | | | | |
| from capital share transactions | | | 2,448,445 | | | | 2,130,085 | | | | — | | | | — | |
Net increase (decrease) in net assets applicable to common shares | | | 49,904,686 | | | | (15,818,970 | ) | | | 52,510,840 | | | | (1,399,489 | ) |
Net assets applicable to common shares at the beginning of period | | | 2,171,103,933 | | | | 2,186,922,903 | | | | 260,790,258 | | | | 262,189,747 | |
Net assets applicable to common shares at the end of period | | $ | 2,221,008,619 | | | $ | 2,171,103,933 | | | $ | 313,301,098 | | | $ | 260,790,258 | |
See accompanying notes to financial statements.
80
| | | | | | | | | | | | | |
| | | | | | |
| | Six Months | | | | | | Six Months | | | | |
| | Ended | | | | | | Ended | | | | |
| | 4/30/21 | | | Year Ended | | | 4/30/21 | | | Year Ended | |
| | (Unaudited) | | | 10/31/20 | | | (Unaudited) | | | 10/31/20 | |
| Operations | | | | | | | | | | | | |
Net investment income (loss) | | $ | 1,804,897 | | | $ | 3,723,206 | | | $ | 8,883,875 | | | $ | 17,790,959 | |
Net realized gain (loss) from: | | | | | | | | | | | | | | | | |
| Investments | | | 158,068 | | | | (213,294 | ) | | | 250,443 | | | | 10,934,726 | |
| Futures contracts | | | — | | | | — | | | | — | | | | — | |
Change in net unrealized appreciation (depreciation) of: | | | | | | | | | | | | | | | | |
| Investments | | | 2,393,069 | | | | (1,760,846 | ) | | | 24,019,219 | | | | (15,684,046 | ) |
| Futures contracts | | | — | | | | — | | | | — | | | | — | |
Net increase (decrease) in net assets applicable to common shares | | | | | | | | | | | | | | | | |
| from operations | | | 4,356,034 | | | | 1,749,066 | | | | 33,153,537 | | | | 13,041,639 | |
| Distributions to Common Shareholders | | | | | | | | | | | | | | | | |
Dividends | | | (1,839,325 | ) | | | (4,017,431 | ) | | | (14,971,577 | ) | | | (17,589,798 | ) |
Decrease in net assets applicable to common shares from | | | | | | | | | | | | | | | | |
| distributions to common shareholders | | | (1,839,325 | ) | | | (4,017,431 | ) | | | (14,971,577 | ) | | | (17,589,798 | ) |
| Capital Share Transactions | | | | | | | | | | | | | | | | |
Proceeds from shelf offering, net of offering costs | | | 2,921,015 | | | | 4,240,676 | | | | — | | | | — | |
Net proceeds from common shares issued to common shareholders | | | | | | | | | | | | | | | | |
| due to reinvestment of distributions | | | 48,726 | | | | 129,581 | | | | 98,768 | | | | — | |
Issued in the Reorganizations | | | — | | | | — | | | | — | | | | — | |
Net increase (decrease) in net assets applicable to common shares | | | | | | | | | | | | | | | | |
| from capital share transactions | | | 2,969,741 | | | | 4,370,257 | | | | 98,768 | | | | — | |
Net increase (decrease) in net assets applicable to common shares | | | 5,486,450 | | | | 2,101,892 | | | | 18,280,728 | | | | (4,548,159 | ) |
Net assets applicable to common shares at the beginning of period | | | 101,924,227 | | | | 99,822,335 | | | | 375,412,543 | | | | 379,960,702 | |
Net assets applicable to common shares at the end of period | | $ | 107,410,677 | | | $ | 101,924,227 | | | $ | 393,693,271 | | | $ | 375,412,543 | |
See accompanying notes to financial statements.
81
Six Months Ended April 30, 2021 (Unaudited)
| | NEV | |
| Cash Flows from Operating Activities: | | | |
| Net Increase (Decrease) in Net Assets Applicable to Common Shares from Operations | | $ | 33,153,537 | |
Adjustments to reconcile the net increase (decrease) in net assets applicable to common shares from | | | | |
| operations to net cash provided by (used in) operating activities: | | | | |
Purchases of investments | | | (21,322,276 | ) |
Proceeds from sales and maturities of investments | | | 30,344,634 | |
Amortization (Accretion) of premiums and discounts, net | | | 821,845 | |
(Increase) Decrease in: | | | | |
| Receivable for interest | | | (174,952 | ) |
| Receivable for investments sold | | | (195,000 | ) |
| Other assets | | | (4,072 | ) |
Increase (Decrease) in: | | | | |
| Payable for interest | | | 173,177 | |
| Investments purchased - when-issued/delayed-delivery settlement | | | (2,000,000 | ) |
| Accrued Directors/Trustees fees | | | 9,768 | |
| Accrued management fees | | | (4,671 | ) |
| Accrued other expenses | | | 34,236 | |
Net realized (gain) loss from: | | | | |
| Investments | | | (250,443 | ) |
Change in net unrealized (appreciation) depreciation of investments | | | (24,019,219 | ) |
| Net cash provided by (used in) operating activities | | | 16,566,564 | |
| Cash Flow from Financing Activities: | | | | |
Proceeds from floating rate obligations | | | (5,460,000 | ) |
Cash distributions paid to common shareholders | | | (14,868,197 | ) |
Net cash provided by (used in) financing activities | | | (20,328,197 | ) |
| Net Increase (Decrease) in Cash | | | (3,761,633 | ) |
Cash at the beginning of period | | | 6,214,082 | |
Cash at the end of period | | $ | 2,452,449 | |
| | | | |
| Supplemental Disclosures of Cash Flow Information | | NEV | |
Cash paid for interest | | $ | 270,846 | |
Non-cash financing activities not included herein consists of reinvestments of common share distributions | | | 98,768 | |
See accompanying notes to financial statements.
82
THIS PAGE INTENTIONALLY LEFT BLANK
83
Selected data for a common share outstanding throughout each period:
| | | | | | Less Distributions | | | | | |
| | Investment Operations | | to Common Shareholders | | | Common Share | |
| | | | | | | | | | | Premium | | |
| | | | | | | | | | | from | | |
| | | | | | | From | | | | Shares | | |
| Beginning | Net | Net | | | From | Accumu- | | | | Sold | | |
| Common | Investment | Realized/ | | | Net | lated Net | | | Shelf | through | | Ending |
| Share | Income | Unrealized | | | Investment | Realized | | | Offering | Shelf | Ending | Share |
| NAV | (Loss) | Gain (Loss) | Total | | Income | Gains | Total | | Costs | Offering | NAV | Price |
|
| NUV | | | | | | | | | | | | | |
Year Ended 10/31: | | | | | | | | | | | | | |
2021(e) | $10.48 | $0.18 | $ 0.24 | $ 0.42 | | $(0.19) | $ — | $(0.19) | | $ — | $ — | $10.71 | $11.27 |
2020 | 10.57 | 0.37 | (0.09) | 0.28 | | (0.37) | — | (0.37) | | — | — | 10.48 | 10.81 |
2019 | 9.84 | 0.37 | 0.73 | 1.10 | | (0.37) | — | (0.37) | | — | — | 10.57 | 10.43 |
2018 | 10.30 | 0.38 | (0.45) | (0.07) | | (0.39) | — | (0.39) | | — | — | 9.84 | 9.18 |
2017 | 10.39 | 0.40 | (0.10) | 0.30 | | (0.39) | — | (0.39) | | — | — | 10.30 | 10.12 |
2016 | 10.20 | 0.40 | 0.18 | 0.58 | | (0.39) | — | (0.39) | | — | —* | 10.39 | 9.98 |
|
| NUW | | | | | | | | | | | | | |
Year Ended 10/31: | | | | | | | | | | | | | |
2021(e) | 16.81 | 0.23 | 0.64 | 0.87 | | (0.23) | — | (0.23) | | — | — | 17.45 | 16.75 |
2020 | 16.90 | 0.47 | (0.08) | 0.39 | | (0.48) | — | (0.48) | | — | — | 16.81 | 16.21 |
2019 | 15.88 | 0.60 | 1.16 | 1.76 | | (0.65) | (0.10) | (0.75) | | — | 0.01 | 16.90 | 16.83 |
2018 | 16.99 | 0.70 | (0.92) | (0.22) | | (0.72) | (0.18) | (0.90) | | — | 0.01 | 15.88 | 14.36 |
2017 | 17.22 | 0.75 | (0.26) | 0.49 | | (0.73) | — | (0.73) | | (0.01) | 0.02 | 16.99 | 17.17 |
2016 | 17.17 | 0.76 | 0.06 | 0.82 | | (0.79) | — | (0.79) | | (0.01) | 0.03 | 17.22 | 16.96 |
(a) | Total Return Based on Common Shares NAV is the combination of changes in common share NAV, reinvested dividend income at NAV and reinvested capital gains distributions at NAV, if any. The last dividend declared in the period, which is typically paid on the first business day of the following month, is assumed to be reinvested at the ending NAV. The actual reinvest price for the last dividend declared in the period may often be based on the Fund’s market price (and not its NAV), and therefore may be different from the price used in the calculation. Total returns are not annualized.
|
| Total Return Based on Common Share Price is the combination of changes in the market price per share and the effect of reinvested dividend income and reinvested capital gains distributions, if any, at the average price paid per share at the time of reinvestment. The last dividend declared in the period, which is typically paid on the first business day of the following month, is assumed to be reinvested at the ending market price. The actual reinvestment for the last dividend declared in the period may take place over several days, and in some instances may not be based on the market price, so the actual reinvestment price may be different from the price used in the calculation. Total returns are not annualized. |
84
| | | Common Share Supplemental Data/ | |
| | | Ratio Applicable to Common Shares | |
| | | | |
| | Ratios to Average Net Assets | |
| | Based | Ending | | | |
| Based | on | Net | | Net | Portfolio |
| on | Share | Assets | | Investment | Turnover |
| NAV(a) | Price(a) | (000) | Expenses(b) | Income (Loss) | Rate(c) |
| 3.98% | 6.07% | $2,221,009 | 0.49%*** | 3.38%*** | 5% |
| 2.72 | 7.41 | 2,171,104 | 0.51 | 3.52 | 11 |
| 11.35 | 17.92 | 2,186,923 | 0.54 | 3.63 | 13 |
| (0.71) | (5.55) | 2,035,221 | 0.54 | 3.76 | 20 |
| 3.03 | 5.48 | 2,130,046 | 0.52 | 3.89 | 17 |
| 5.74 | 2.91 | 2,150,444 | 0.51 | 3.87 | 11 |
| 5.22 | 4.80 | 313,301 | 0.62*** | 2.78*** | 4 |
| 2.33 | (0.77) | 260,790 | 0.78(d) | 2.79(d) | 13 |
| 11.38 | 22.81 | 262,190 | 0.73 | 3.61 | 31 |
| (1.31) | (11.54) | 244,612 | 0.80 | 4.26 | 30 |
| 3.02 | 5.71 | 256,281 | 0.81 | 4.45 | 16 |
| 4.90 | 2.99 | 247,394 | 0.71 | 4.38 | 12 |
(b) | The expense ratios reflect, among other things, the interest expense deemed to have been paid by the Fund on the floating rate certificates issued by the special purpose trusts for the self-deposited inverse floaters held by the Fund (as described in Note 4 – Portfolio Securities and Investments in Derivatives), where applicable, as follows: |
| NUV | | | NUW | | |
Year Ended 10/31: | | | Year Ended 10/31: | | |
2021(e) | 0.01%*** | | 2021(e) | 0.01%*** | |
2020 | 0.02 | | 2020 | 0.01 | |
2019 | 0.04 | | 2019 | 0.07 | |
2018 | 0.03 | | 2018 | 0.10 | |
2017 | 0.01 | | 2017 | 0.06 | |
2016 | 0.01 | | 2016 | 0.03 | |
(c) | Portfolio Turnover Rate is calculated based on the lesser of long-term purchases or sales (as disclosed in Note 4 – Portfolio Securities and Investments in Derivatives) divided by the average long-term market value during the period.
|
(d) | During the period ended October 31, 2020, the Adviser voluntarily reimbursed the Fund for certain expenses incurred in connection with a common shares equity shelf program. As a result, the Expenses and Net Investment Income (Loss) Ratios to Average Net Assets reflect the voluntary expense reimbursement from Adviser. The Expenses and Net Investment Income (Loss) Ratios to Average Net Assets excluding this expense reimbursement from Adviser were as follows: |
| Ratios to Average Net Assets |
| | Net |
| | Investment |
| NUW | Expenses | Income (Loss) |
Year Ended 10/31: | | |
2020 | 0.82% | 2.75% |
(e) | Unaudited. For the six months ended April 30, 2021.
|
* | Rounds to less than $0.01 per share.
|
** | Rounds to less than 0.01%
|
*** | Annualized. |
See accompanying notes to financial statements.
85
Financial Highlights (continued)
Selected data for a common share outstanding throughout each period:
| | | | | | | | | | | | | | |
| | | | | | Less Distributions | | | | | |
| | Investment Operations | | to Common Shareholders | | | Common Share | |
| | | | | | | | | | | | Premium | | |
| | | | | | | | | | | | from | | |
| | | | | | | | From | | | | Shares | | |
| | Beginning | Net | Net | | | From | Accumu- | | | | Sold | | |
| | Common | Investment | Realized/ | | | Net | lated Net | | | Shelf | through | | Ending |
| | Share | Income | Unrealized | | | Investment | Realized | | | Offering | Shelf | Ending | Share |
| | NAV | (Loss) | Gain (Loss) | Total | | Income | Gains | Total | | Costs | Offering | NAV | Price |
| |
| NMI | | | | | | | | | | | | | |
Year Ended 10/31: | | | | | | | | | | | | | |
2021(d) | $11.08 | $0.19 | $ 0.29 | $0.48 | | $(0.20) | $ — | $(0.20) | | $ — | $ —* | $11.36 | $11.56 |
2020 | 11.32 | 0.41 | (0.20) | 0.21 | | (0.41) | (0.04) | (0.45) | | — | —* | 11.08 | 11.31 |
2019 | 10.92 | 0.43 | 0.47 | 0.90 | | (0.43) | (0.07) | (0.50) | | — | —* | 11.32 | 11.33 |
2018 | 11.38 | 0.43 | (0.43) | — | | (0.46) | — | (0.46) | | (0.01) | 0.01 | 10.92 | 10.09 |
2017 | 11.61 | 0.48 | (0.22) | 0.26 | | (0.49) | — | (0.49) | | (0.01) | 0.01 | 11.38 | 11.45 |
2016 | 11.47 | 0.50 | 0.15 | 0.65 | | (0.51) | — | (0.51) | | — | — | 11.61 | 12.20 |
|
| NEV | | | | | | | | | | | | | |
Year Ended 10/31: | | | | | | | | | | | | | |
2021(d) | 15.05 | 0.36 | 0.97 | 1.33 | | (0.37) | (0.23) | (0.60) | | — | — | 15.78 | 17.23 |
2020 | 15.23 | 0.71 | (0.18) | 0.53 | | (0.71) | — | (0.71) | | — | — | 15.05 | 14.61 |
2019 | 14.24 | 0.73 | 0.94 | 1.67 | | (0.68) | — | (0.68) | | — | — | 15.23 | 14.60 |
2018 | 15.03 | 0.75 | (0.77) | (0.02) | | (0.77) | — | (0.77) | | — | — | 14.24 | 12.70 |
2017 | 15.58 | 0.82 | (0.55) | 0.27 | | (0.82) | — | (0.82) | | — | — | 15.03 | 14.28 |
2016 | 15.59 | 0.85 | 0.04 | 0.89 | | (0.95) | — | (0.95) | | — | 0.05 | 15.58 | 14.75 |
(a) | Total Return Based on Common Shares NAV is the combination of changes in common share NAV, reinvested dividend income at NAV and reinvested capital gains distributions at NAV, if any. The last dividend declared in the period, which is typically paid on the first business day of the following month, is assumed to be reinvested at the ending NAV. The actual reinvest price for the last dividend declared in the period may often be based on the Fund’s market price (and not its NAV), and therefore may be different from the price used in the calculation. Total returns are not annualized.
|
| Total Return Based on Common Share Price is the combination of changes in the market price per share and the effect of reinvested dividend income and reinvested capital gains distributions, if any, at the average price paid per share at the time of reinvestment. The last dividend declared in the period, which is typically paid on the first business day of the following month, is assumed to be reinvested at the ending market price. The actual reinvestment for the last dividend declared in the period may take place over several days, and in some instances may not be based on the market price, so the actual reinvestment price may be different from the price used in the calculation. Total returns are not annualized. |
86
| | | | | | |
| | | Common Share Supplemental Data/ | |
| | | Ratio Applicable to Common Shares | |
| | | | |
| | Ratios to Average Net Assets | |
| | Based | Ending | | | |
| Based | on | Net | | Net | Portfolio |
| on | Share | Assets | | Investment | Turnover |
| NAV(a) | Price(a) | (000) | Expenses(b) | Income (Loss) | Rate(c) |
| 4.34% | 4.01% | $107,411 | 0.77%** | 3.47%** | 7% |
| 1.86 | 3.87 | 101,924 | 0.74 | 3.70 | 15 |
| 8.45 | 17.61 | 99,822 | 0.79 | 3.83 | 10 |
| (0.05) | (8.14) | 95,396 | 0.89 | 3.87 | 17 |
| 2.34 | (2.04) | 97,138 | 0.79 | 4.23 | 12 |
| 5.71 | 15.22 | 96,532 | 0.76 | 4.33 | 4 |
| 8.95 | 22.47 | 393,693 | 1.16** | 4.61** | 4 |
| 3.55 | 5.03 | 375,413 | 1.41 | 4.73 | 19 |
| 11.92 | 20.66 | 379,961 | 1.61 | 4.92 | 11 |
| (0.17) | (5.93) | 355,342 | 1.42 | 5.14 | 15 |
| 1.93 | 2.50 | 375,081 | 1.14 | 5.47 | 8 |
| 6.10 | 1.85 | 388,835 | 1.03 | 5.44 | 6 |
(b) | The expense ratios reflect, among other things, the interest expense deemed to have been paid by the Fund on the floating rate certificates issued by the special purpose trusts for the self-deposited inverse floaters held by the Fund (as described in Note 4 – Portfolio Securities and Investments in Derivatives), where applicable, as follows: |
| NMI | | | NEV | | |
Year Ended 10/31: | | | Year Ended 10/31: | | |
2021(d) | —%** | | 2021(d) | 0.23%** | |
2020 | — | | 2020 | 0.45 | |
2019 | — | | 2019 | 0.61 | |
2018 | — | | 2018 | 0.40 | |
2017 | — | | 2017 | 0.17 | |
2016 | 0.03 | | 2016 | 0.07 | |
(c) | Portfolio Turnover Rate is calculated based on the lesser of long-term purchases or sales (as disclosed in Note 4 – Portfolio Securities and Investments in Derivatives) divided by the average long-term market value during the period.
|
(d) | Unaudited. For the six months ended April 30, 2021.
|
* | Rounds to less than $0.01 per share.
|
** | Annualized. |
See accompanying notes to financial statements.
87
Notes to
Financial Statements
(Unaudited)
1. General Information
Fund Information
The funds covered in this report and their corresponding New York Stock Exchange (“NYSE”) symbols are as follows (each a “Fund” and collectively, the “Funds”):
• Nuveen Municipal Value Fund, Inc. (NUV)
• Nuveen AMT-Free Municipal Value Fund (NUW)
• Nuveen Municipal Income Fund, Inc. (NMI)
• Nuveen Enhanced Municipal Value Fund (NEV)
The Funds are registered under the Investment Company Act of 1940 (the “1940 Act”), as amended, as diversified closed-end management investment companies. NUV and NMI were incorporated under the state laws of Minnesota on April 8, 1987 and February 26, 1988, respectively. NUW and NEV were organized as Massachusetts business trusts on November 19, 2008 and July 27, 2009, respectively.
The end of the reporting period for the Funds is April 30, 2021, and the period covered by these Notes to Financial Statements is the six months ended April 30, 2021 (the “current fiscal period”).
Investment Adviser and Sub-Adviser
The Funds’ investment adviser is Nuveen Fund Advisors, LLC (the “Adviser”), a subsidiary of Nuveen, LLC (“Nuveen”). Nuveen is the investment management arm of Teachers Insurance and Annuity Association of America (TIAA). The Adviser has overall responsibility for management of the Funds, oversees the management of the Funds’ portfolios, manages the Funds’ business affairs and provides certain clerical, bookkeeping and other administrative services, and, if necessary, asset allocation decisions. The Adviser has entered into sub-advisory agreements with Nuveen Asset Management, LLC (the “Sub-Adviser”), a subsidiary of the Adviser, under which the Sub-Adviser manages the investment portfolios of the Funds.
Fund Reorganizations
Effective prior to the opening of business on March 6, 2021, Nuveen New Jersey Municipal Value Fund (NJV) and Nuveen Pennsylvania Municipal Value Fund (NPN) (the “Target Funds”) were merged into NUW (the “Acquiring Fund”) (the “Reorganizations”).
For accounting and performance reporting purposes, the Acquiring Fund is the survivor.
Upon the closing of the Reorganization, each Target Fund transferred its assets to the Acquiring Fund in exchange for common shares of the Acquiring Fund and the assumption by the Acquiring Fund of the liabilities of the Target Funds. Each Target Fund was then liquidated, dissolved and terminated in accordance with their Declaration of Trust. Shareholders of the Target Funds became shareholders of the Acquiring Fund. Holders of common shares of the Target Funds will receive newly issued common shares of the Acquiring Fund, the aggregate net asset value (“NAV”) of which was equal to the aggregate NAV of the common shares of each Target Funds held immediately prior to the Reorganizations (including for this purpose fractional Acquiring Fund shares to which shareholders would be entitled). Details of the Reorganizations are further described in Note 10 –Fund Reorganizations.
Other Matters
The outbreak of the novel coronavirus (“COVID-19”) and subsequent global pandemic began significantly impacting the U.S. and global financial markets and economies during the calendar quarter ended March 31, 2020. The worldwide spread of COVID-19 has created significant uncertainty in the global economy. The duration and extent of COVID-19 over the long term cannot be reasonably estimated at this time. The ultimate impact of COVID-19 and the extent to which COVID-19 impacts the Funds’ normal course of business, results of operations, investments, and cash flows will depend on future developments, which are highly uncertain and difficult to predict. Management continues to monitor and evaluate this situation.
2. Significant Accounting Policies
The accompanying financial statements were prepared in accordance with accounting principles generally accepted in the United States of America (“U.S. GAAP”), which may require the use of estimates made by management and the evaluation of subsequent events. Actual results may differ from those estimates. Each Fund is an investment company and follows the accounting guidance in the Financial Accounting Standards Board (“FASB”) Accounting Standards Codification 946, Financial Services—Investment Companies. The NAV for financial reporting purposes may differ from the NAV for processing security and common share transactions. The NAV for financial reporting purposes includes security and common share transactions
88
through the date of the report. Total return is computed based on the NAV used for processing security and common share transactions. The following is a summary of the significant accounting policies consistently followed by the Funds.
Compensation
The Funds pay no compensation directly to those of its directors/trustees who are affiliated with the Adviser or to its officers, all of whom receive remuneration for their services to the Funds from the Adviser or its affiliates. The Funds’ Board of Directors/Trustees (the “Board”) has adopted a deferred compensation plan for independent directors/trustees that enables directors/trustees to elect to defer receipt of all or a portion of the annual compensation they are entitled to receive from certain Nuveen-advised funds. Under the plan, deferred amounts are treated as though equal dollar amounts had been invested in shares of select Nuveen-advised funds.
Distributions to Common Shareholders
Distributions to common shareholders are recorded on the ex-dividend date. The amount, character and timing of distributions are determined in accordance with federal income tax regulations, which may differ from U.S. GAAP.
Indemnifications
Under the Funds’ organizational documents, their officers and directors/trustees are indemnified against certain liabilities arising out of the performance of their duties to the Funds. In addition, in the normal course of business, the Funds enter into contracts that provide general indemnifications to other parties. The Funds’ maximum exposure under these arrangements is unknown as this would involve future claims that may be made against the Funds that have not yet occurred. However, the Funds have not had prior claims or losses pursuant to these contracts and expect the risk of loss to be remote.
Investments and Investment Income
Securities transactions are accounted for as of the trade date for financial reporting purposes. Realized gains and losses on securities transactions are based upon the specific identification method. Investment income is comprised of interest income, which is recorded on an accrual basis and includes the accretion of discounts and the amortization of premiums for financial reporting purposes. Investment income also reflects payment-in-kind (“PIK”) interest and paydown gains and losses, if any. PIK interest represents income received in the form of securities in lieu of cash. Investment income also reflects dividend income, which is recorded on the ex-dividend date.
Netting Agreements
In the ordinary course of business, the Funds may enter into transactions subject to enforceable International Swaps and Derivatives Association, Inc. (ISDA) master agreements or other similar arrangements (“netting agreements”). Generally, the right to offset in netting agreements allows each Fund to offset certain securities and derivatives with a specific counterparty, when applicable, as well as any collateral received or delivered to that counterparty based on the terms of the agreements. Generally, each Fund manages its cash collateral and securities collateral on a counterparty basis.
The Funds’ investments subject to netting agreements as of the end of the reporting period, if any, are further described in Note 4 – Portfolio Securities and Investments in Derivatives.
New Accounting Pronouncements and Rule Issuances
Reference Rate Reform
In March 2020, FASB issued Accounting Standards Update (“ASU”) 2020-04, Reference Rate Reform: Facilitation of the Effects of Reference Rate Reform on Financial Reporting. The main objective of the new guidance is to provide relief to companies that will be impacted by the expected change in benchmark interest rates, when participating banks will no longer be required to submit London Interbank Offered Rate (LIBOR) quotes by the UK Financial Conduct Authority (FCA). The new guidance allows companies to, provided the only change to existing contracts are a change to an approved benchmark interest rate, account for modifications as a continuance of the existing contract without additional analysis. For new and existing contracts, the Funds may elect to apply the amendments as of March 12, 2020 through December 31, 2022. Management has not yet elected to apply the amendments, is continuously evaluating the potential effect a discontinuation of LIBOR could have on the Funds’ investments and has currently determined that it is unlikely the ASU’s adoption will have a significant impact on the Funds’ financial statements and various filings.
Securities and Exchange Commission (“SEC”) Adopts New Rules to Modernize Fund Valuation Framework
In December 2020, the SEC voted to adopt a new rule governing fund valuation practices. New Rule 2a-5 under the 1940 Act establishes requirements for determining fair value in good faith for purposes of the 1940 Act. Rule 2a-5 will permit fund boards to designate certain parties to perform fair value determinations, subject to board oversight and certain other conditions. Rule 2a-5 also defines when market quotations are “readily available” for purposes of Section 2(a)(41) of the 1940 Act, which requires a fund to fair value a security when market quotation are not readily available. The SEC also adopted new Rule 31a-4 under the 1940 Act, which sets forth the recordkeeping requirements associated with fair value determinations. Finally, the SEC is rescinding previously issued guidance on related issues, including the role of a board in determining fair value and the accounting and auditing of fund
89
Notes to Financial Statements (Unaudited) (continued)
investments. Rule 2a-5 and Rule 31a-4 became effective on March 8, 2021, with a compliance date of September 8, 2022. A fund may voluntarily comply with the rules after the effective date, and in advance of the compliance date, under certain conditions. Management is currently assessing the impact of these provisions on the Fund’s financial statements.
3. Investment Valuation and Fair Value Measurements
The Funds’ investments in securities are recorded at their estimated fair value utilizing valuation methods approved by the Board. Fair value is defined as the price that would be received upon selling an investment or transferring a liability in an orderly transaction to an independent buyer in the principal or most advantageous market for the investment. U.S. GAAP establishes the three-tier hierarchy which is used to maximize the use of observable market data and minimize the use of unobservable inputs and to establish classification of fair value measurements for disclosure purposes. Observable inputs reflect the assumptions market participants would use in pricing the asset or liability. Observable inputs are based on market data obtained from sources independent of the reporting entity. Unobservable inputs reflect management’s assumptions about the assumptions market participants would use in pricing the asset or liability. Unobservable inputs are based on the best information available in the circumstances. The following is a summary of the three-tiered hierarchy of valuation input levels.
Level 1 – Inputs are unadjusted and prices are determined using quoted prices in active markets for identical securities.
Level 2 – Prices are determined using other significant observable inputs (including quoted prices for similar securities, interest rates, credit spreads, etc.).
Level 3 – Prices are determined using significant unobservable inputs (including management’s assumptions in determining the fair value of investments).
A description of the valuation techniques applied to the Funds’ major classifications of assets and liabilities measured at fair value follows:
Equity securities and exchange-traded funds listed or traded on a national market or exchange are valued based on their sale price at the official close of business of such market or exchange on the valuation date. Foreign equity securities and registered investment companies that trade on a foreign exchange are valued at the last sale price or official closing price reported on the exchange where traded and converted to U.S. dollars at the prevailing rates of exchange on the date of valuation. To the extent these securities are actively traded and that valuation adjustments are not applied, they are generally classified as Level 1. If there is no official close of business, then the latest available sale price is utilized. If no sales are reported, then the mean of the latest available bid and ask prices is utilized and these securities are generally classified as Level 2.
Prices of fixed-income securities are generally provided by an independent pricing service (“pricing service”) approved by the Board. The pricing service establishes a security’s fair value using methods that may include consideration of the following: yields or prices of investments of comparable quality, type of issue, coupon, maturity and rating, market quotes or indications of value from security dealers, evaluations of anticipated cash flows or collateral, general market conditions and other information and analysis, including the obligor’s credit characteristics considered relevant. In pricing certain securities, particularly less liquid and lower quality securities, the pricing service may consider information about a security, its issuer or market activity provided by the Adviser. These securities are generally classified as Level 2.
Futures contracts are valued using the closing settlement price or, in the absence of such a price, the last traded price and are generally classified as Level 1.
Any portfolio security or derivative for which market quotations are not readily available or for which the above valuation procedures are deemed not to reflect fair value are valued at fair value, as determined in good faith using procedures approved by the Board. As a general principle, the fair value of a security would appear to be the amount that the owner might reasonably expect to receive for it in a current sale. A variety of factors may be considered in determining the fair value of such securities, which may include consideration of the following: yields or prices of investments of comparable quality, type of issue, coupon, maturity and rating, market quotes or indications of value from security dealers, evaluations of anticipated cash flows or collateral, general market conditions and other information and analysis, including the obligor’s credit characteristics considered relevant. To the extent the inputs are observable and timely, the values would be classified as Level 2 of the fair value hierarchy; otherwise they would be classified as Level 3.
90
The following table summarizes the market value of the Funds’ investments as of the end of the reporting period, based on the inputs used to value them:
| | | | | | | | | | | | | |
| NUV | | Level 1 | | | Level 2 | | | Level 3 | | | Total | |
Long-Term Investments*: | | | | | | | | | | | | |
| Municipal Bonds | | $ | — | | | $ | 2,220,710,890 | | | $ | — | | | $ | 2,220,710,890 | |
| NUW | | | | | | | | | | | | | | | | |
Long-Term Investments*: | | | | | | | | | | | | | | | | |
| Municipal Bonds | | $ | — | | | $ | 311,007,141 | | | $ | — | | | $ | 311,007,141 | |
| Common Stock | | | — | | | | 423,148 | *** | | | — | | | | 423,148 | |
Short-Term Investments*: | | | | | | | | | | | | | | | | |
| Municipal Bonds | | | — | | | | 450,000 | | | | — | | | | 450,000 | |
Investments in Derivatives: | | | | | | | | | | | | | | | | |
| Futures Contracts**** | | | 532,268 | | | | — | | | | — | | | | 532,268 | |
Total | | $ | 532,268 | | | $ | 311,880,289 | | | $ | — | | | $ | 312,412,557 | |
| NMI | | | | | | | | | | | | | | | | |
Long-Term Investments*: | | | | | | | | | | | | | | | | |
| Municipal Bonds | | $ | — | | | $ | 104,834,335 | | | $ | — | | | $ | 104,834,335 | |
| NEV | | | | | | | | | | | | | | | | |
Long-Term Investments*: | | | | | | | | | | | | | | | | |
| Municipal Bonds | | $ | — | | | $ | 510,382,854 | | | $ | 3,304 | ** | | $ | 510,386,158 | |
| Common Stock | | | — | | | | 7,452,626 | *** | | | — | | | | 7,452,626 | |
Total | | $ | — | | | $ | 517,835,481 | | | $ | 3,304 | | | $ | 517,838,784 | |
* | Refer to the Fund’s Portfolio of Investments for state and/or industry classifications. |
** | Refer to the Fund’s Portfolio of Investments for securities classified as Level 3. |
*** | Refer to the Fund’s Portfolio of Investments for securities classified as Level 2. |
**** | Represents net unrealized appreciation (depreciation) as reported in the Fund’s Portfolio of Investments. |
The Funds hold liabilities in floating rate obligations, where applicable, which are not reflected in the tables above. The fair values of the Funds’ liabilities for floating rate obligations approximate their liquidation values. Floating rate obligations are generally classified as Level 2 and further described in Note 4 - Portfolio Securities and Investments in Derivatives.
4. Portfolio Securities and Investments in Derivatives
Portfolio Securities
Inverse Floating Rate Securities
Each Fund is authorized to invest in inverse floating rate securities. An inverse floating rate security is created by depositing a municipal bond (referred to as an “Underlying Bond”), typically with a fixed interest rate, into a special purpose tender option bond (“TOB”) trust (referred to as the “TOB Trust”) created by or at the direction of one or more Funds. In turn, the TOB Trust issues (a) floating rate certificates (referred to as “Floaters”), in face amounts equal to some fraction of the Underlying Bond’s par amount or market value, and (b) an inverse floating rate certificate (referred to as an “Inverse Floater”) that represents all remaining or residual interest in the TOB Trust. Floaters typically pay short-term tax-exempt interest rates to third parties who are also provided a right to tender their certificate and receive its par value, which may be paid from the proceeds of a remarketing of the Floaters, by a loan to the TOB Trust from a third party liquidity provider (“Liquidity Provider”), or by the sale of assets from the TOB Trust. The Inverse Floater is issued to a long term investor, such as one or more of the Funds. The income received by the Inverse Floater holder varies inversely with the short-term rate paid to holders of the Floaters, and in most circumstances the Inverse Floater holder bears substantially all of the Underlying Bond’s downside investment risk and also benefits disproportionately from any potential appreciation of the Underlying Bond’s value. The value of an Inverse Floater will be more volatile than that of the Underlying Bond because the interest rate is dependent on not only the fixed coupon rate of the Underlying Bond but also on the short-term interest paid on the Floaters, and because the Inverse Floater essentially bears the risk of loss (and possible gain) of the greater face value of the Underlying Bond.
The Inverse Floater held by a Fund gives the Fund the right to (a) cause the holders of the Floaters to tender their certificates at par (or slightly more than par in certain circumstances), and (b) have the trustee of the TOB Trust (the “Trustee”) transfer the Underlying Bond held by the TOB Trust to the Fund, thereby collapsing the TOB Trust.
The Fund may acquire an Inverse Floater in a transaction where it (a) transfers an Underlying Bond that it owns to a TOB Trust created by a third party or (b) transfers an Underlying Bond that it owns, or that it has purchased in a secondary market transaction for the purpose of creating an Inverse Floater, to a TOB Trust created at its direction, and in return receives the Inverse Floater of the TOB Trust (referred to as a “self-deposited Inverse
91
Notes to Financial Statements (Unaudited) (continued)
Floater”). A Fund may also purchase an Inverse Floater in a secondary market transaction from a third party creator of the TOB Trust without first owning the Underlying Bond (referred to as an “externally-deposited Inverse Floater”).
An investment in a self-deposited Inverse Floater is accounted for as a “financing” transaction (i.e., a secured borrowing). For a self-deposited Inverse Floater, the Underlying Bond deposited into the TOB Trust is identified in the Fund’s Portfolio of Investments as “(UB) – Underlying bond of an inverse floating rate trust reflected as a financing transaction,” with the Fund recognizing as liabilities, labeled “Floating rate obligations” on the Statement of Assets and Liabilities, (a) the liquidation value of Floaters issued by the TOB Trust, and (b) the amount of any borrowings by the TOB Trust from a Liquidity Provider to enable the TOB Trust to purchase outstanding Floaters in lieu of a remarketing. In addition, the Fund recognizes in “Investment Income” the entire earnings of the Underlying Bond, and recognizes (a) the interest paid to the holders of the Floaters or on the TOB Trust’s borrowings, and (b) other expenses related to remarketing, administration, trustee, liquidity and other services to a TOB Trust, as a component of “Interest expense and amortization of offering costs” on the Statement of Operations. Earnings due from the Underlying Bond and interest due to the holders of the Floaters as of the end of the reporting period are recognized as components of “Receivable for interest” and “Payable for interest” on the Statement of Assets and Liabilities, respectively.
In contrast, an investment in an externally-deposited Inverse Floater is accounted for as a purchase of the Inverse Floater and is identified in the Fund’s Portfolio of Investments as “(IF) – Inverse floating rate investment.” For an externally-deposited Inverse Floater, a Fund’s Statement of Assets and Liabilities recognizes the Inverse Floater and not the Underlying Bond as an asset, and the Fund does not recognize the Floaters, or any related borrowings from a Liquidity Provider, as a liability. Additionally, the Fund reflects in “Investment Income” only the net amount of earnings on the Inverse Floater (net of the interest paid to the holders of the Floaters or the Liquidity Provider as lender, and the expenses of the Trust), and does not show the amount of that interest paid or the expenses of the TOB Trust as described above as interest expense on the Statement of Operations.
Fees paid upon the creation of a TOB Trust for self-deposited Inverse Floaters and externally-deposited Inverse Floaters are recognized as part of the cost basis of the Inverse Floater and are capitalized over the term of the TOB Trust.
As of the end of the reporting period, the aggregate value of Floaters issued by each Fund’s TOB Trust for self-deposited Inverse Floaters and externally-deposited Inverse Floaters was as follows:
| Floating Rate Obligations Outstanding | | NUV | | | NUW | | | NMI | | | NEV | |
Floating rate obligations: self-deposited Inverse Floaters | | $ | 29,705,000 | | | $ | 3,230,000 | | | $ | — | | | $ | 132,467,000 | |
Floating rate obligations: externally-deposited Inverse Floaters | | | — | | | | 1,070,000 | | | | — | | | | 62,405,000 | |
Total | | $ | 29,705,000 | | | $ | 4,300,000 | | | $ | — | | | $ | 194,872,000 | |
During the current fiscal period, the average amount of Floaters (including any borrowings from a Liquidity Provider) outstanding, and average annual interest rate and fees related to self-deposited Inverse Floaters, were as follows:
| Self-Deposited Inverse Floaters | | NUV | | | NUW | | | NMI | | | NEV | |
Average floating rate obligations outstanding | | $ | 29,705,000 | | | $ | 3,440,082 | | | $ | — | | | $ | 135,118,680 | |
Average annual interest rate and fees | | | 0.53 | % | | | 0.57 | % | | | — | % | | | 0.66 | % |
TOB Trusts are supported by a liquidity facility provided by a Liquidity Provider pursuant to which the Liquidity Provider agrees, in the event that Floaters are (a) tendered to the Trustee for remarketing and the remarketing does not occur, or (b) subject to mandatory tender pursuant to the terms of the TOB Trust agreement, to either purchase Floaters or to provide the Trustee with an advance from a loan facility to fund the purchase of Floaters by the TOB Trust. In certain circumstances, the Liquidity Provider may otherwise elect to have the Trustee sell the Underlying Bond to retire the Floaters that were tendered and not remarketed prior to providing such a loan. In these circumstances, the Liquidity Provider remains obligated to provide a loan to the extent that the proceeds of the sale of the Underlying Bond is not sufficient to pay the purchase price of the Floaters.
The size of the commitment under the loan facility for a given TOB Trust is at least equal to the balance of that TOB Trust’s outstanding Floaters plus any accrued interest. In consideration of the loan facility, fee schedules are in place and are charged by the Liquidity Provider(s). Any loans made by the Liquidity Provider will be secured by the purchased Floaters held by the TOB Trust. Interest paid on any outstanding loan balances will be effectively borne by the Fund that owns the Inverse Floaters of the TOB Trust that has incurred the borrowing and may be at a rate that is greater than the rate that would have been paid had the Floaters been successfully remarketed.
As described above, any amounts outstanding under a liquidity facility are recognized as a component of “Floating rate obligations” on the Statement of Assets and Liabilities by the Fund holding the corresponding Inverse Floaters issued by the borrowing TOB Trust. As of the end of the reporting period, there were no loans outstanding under any such facility for any of the funds.
Each Fund may also enter into shortfall and forbearance agreements (sometimes referred to as a “recourse arrangement”) (TOB Trusts involving such agreements are referred to herein as “Recourse Trusts”), under which a Fund agrees to reimburse the Liquidity Provider for the Trust’s Floaters, in certain circumstances, for the amount (if any) by which the liquidation value of the Underlying Bond held by the TOB Trust may fall short of the sum of
92
the liquidation value of the Floaters issued by the TOB Trust plus any amounts borrowed by the TOB Trust from the Liquidity Provider, plus any shortfalls in interest cash flows. Under these agreements, a Fund’s potential exposure to losses related to or on an Inverse Floater may increase beyond the value of the Inverse Floater as a Fund may potentially be liable to fulfill all amounts owed to holders of the Floaters or the Liquidity Provider. Any such shortfall amount in the aggregate is recognized as “Unrealized depreciation on Recourse Trusts” on the Statement of Assets and Liabilities.
As of the end of the reporting period, each Fund’s maximum exposure to the Floaters issued by Recourse Trusts for self-deposited Inverse Floaters and externally-deposited Inverse Floaters was as follows:
| Floating Rate Obligations – Recourse Trusts | | NUV | | | NUW | | | NMI | | | NEV | |
Maximum exposure to Recourse Trusts: self-deposited Inverse Floaters | | $ | 29,705,000 | | | $ | 3,230,000 | | | $ | — | | | $ | 132,467,000 | |
Maximum exposure to Recourse Trusts: externally-deposited Inverse Floaters | | | — | | | | 1,070,000 | | | | — | | | | 59,895,000 | |
Total | | $ | 29,705,000 | | | $ | 4,300,000 | | | $ | — | | | $ | 192,362,000 | |
Zero Coupon Securities
A zero coupon security does not pay a regular interest coupon to its holders during the life of the security. Income to the holder of the security comes from accretion of the difference between the original purchase price of the security at issuance and the par value of the security at maturity and is effectively paid at maturity. The market prices of zero coupon securities generally are more volatile than the market prices of securities that pay interest periodically.
Investment Transactions
Long-term purchases and sales (including maturities but excluding derivative transactions, where applicable) during the current fiscal period were as follows:
| | NUV | | | NUW | | | NMI | | | NEV | |
Purchases | | $ | 114,966,723 | | | $ | 49,403,800 | | | $ | 7,845,654 | | | $ | 21,322,276 | |
Sales and maturities | | | 131,161,486 | | | | 11,136,351 | | | | 7,038,294 | | | | 30,344,634 | |
The Funds may purchase securities on a when-issued or delayed-delivery basis. Securities purchased on a when-issued or delayed-delivery basis may have extended settlement periods; interest income is not accrued until settlement date. Any securities so purchased are subject to market fluctuation during this period. The Funds have earmarked securities in their portfolios with a current value at least equal to the amount of the when-issued/ delayed-delivery purchase commitments. If a Fund has outstanding when-issued/delayed-delivery purchases commitments as of the end of the reporting period, such amounts are recognized on the Statement of Assets and Liabilities.
Investments in Derivatives
In addition to the inverse floating rate securities in which each Fund may invest, which are considered portfolio securities for financial reporting purposes, each Fund is authorized to invest in certain other derivative instruments, such as futures, options and swap contracts. Each Fund limits its investments in futures, options on futures and swap contracts to the extent necessary for the Adviser to claim the exclusion from registration by the Commodity Futures Trading Commission as a commodity pool operator with respect to the Fund. The Funds record derivative instruments at fair value, with changes in fair value recognized on the Statement of Operations, when applicable. Even though the Funds’ investments in derivatives may represent economic hedges, they are not considered to be hedge transactions for financial reporting purposes.
Futures Contracts
Upon execution of a futures contract, a Fund is obligated to deposit cash or eligible securities, also known as “initial margin,” into an account at its clearing broker equal to a specified percentage of the contract amount. Cash held by the broker to cover initial margin requirements on open futures contracts, if any, is recognized as “Cash collateral at brokers for investments in futures contracts” on the Statement of Assets and Liabilities. Investments in futures contracts obligate a Fund and the clearing broker to settle monies on a daily basis representing changes in the prior days “mark-to-market” of the open contracts. If a Fund has unrealized appreciation the clearing broker would credit the Fund’s account with an amount equal to appreciation and conversely if a Fund has unrealized depreciation the clearing broker would debit the Fund’s account with an amount equal to depreciation. These daily cash settlements are also known as “variation margin.” Variation margin is recognized as a receivable and/or payable for “Variation margin on futures contracts” on the Statement of Assets and Liabilities.
During the period the futures contract is open, changes in the value of the contract are recognized as an unrealized gain or loss by “marking-to-market” on a daily basis to reflect the changes in market value of the contract, which is recognized as a component of “Change in net unrealized appreciation (depreciation) of futures contracts” on the Statement of Operations. When the contract is closed or expired, a Fund records a realized gain or loss equal to the difference between the value of the contract on the closing date and value of the contract when originally entered into, which is recognized as a component of “Net realized gain (loss) from futures contracts” on the Statement of Operations.
93
Notes to Financial Statements (Unaudited) (continued)
Risks of investments in futures contracts include the possible adverse movement in the price of the securities or indices underlying the contracts, the possibility that there may not be a liquid secondary market for the contracts and/or that a change in the value of the contract may not correlate with a change in the value of the underlying securities or indices.
During the current reporting period, NUW managed the duration of its portfolio by shorting interest rate futures contracts.
The average notional amount of futures contracts outstanding during the current fiscal period was as follows:
| NUW |
Average notional amount of futures contracts outstanding* | $33,222,746 |
* | The average notional amount is calculated based on the absolute aggregate notional amount of contracts outstanding at the beginning of the current fiscal period and at the end of each fiscal quarter within the current fiscal period. |
The following table presents the fair value of all futures contracts held by the Fund as of the end of the reporting period, the location of these instruments on the Statement of Assets and Liabilities and the primary underlying risk exposure.
| | | Location on the Statement of Assets and Liabilities | |
| Underlying | Derivative | Asset Derivatives
| (Liability) Derivatives |
| Risk Exposure | Instrument | Location | | Value | Location | Value |
| NUW | | | | | | |
Interest rate | Futures contracts | — | | — | Payable for variation margin | $532,268 |
| | | | | on futures contracts* | |
* | Value represents the cumulative unrealized appreciation (depreciation) of futures contracts as reported in the Fund’s Portfolio of Investments and not the asset and/or liability derivative location as described in the table above. |
The following table presents the amount of net realized gain (loss) and change in net unrealized appreciation (depreciation) recognized on futures contracts on the Statement of Operations during the current fiscal period, and the primary underlying risk exposure.
| | | Net Realized | Change in Net Unrealized |
| Underlying Risk | Derivative | Gain (Loss) from | Appreciation (Depreciation) of |
| Fund | Exposure | Instrument | Futures Contracts | Futures Contracts |
| NUW | Interest rate | Futures contracts | $762,147 | $356,981 |
Market and Counterparty Credit Risk
In the normal course of business each Fund may invest in financial instruments and enter into financial transactions where risk of potential loss exists due to changes in the market (market risk) or failure of the other party to the transaction to perform (counterparty credit risk). The potential loss could exceed the value of the financial assets recorded on the financial statements. Financial assets, which potentially expose each Fund to counterparty credit risk, consist principally of cash due from counterparties on forward, option and swap transactions, when applicable. The extent of each Fund’s exposure to counterparty credit risk in respect to these financial assets approximates their carrying value as recorded on the Statement of Assets and Liabilities.
Each Fund helps manage counterparty credit risk by entering into agreements only with counterparties the Adviser believes have the financial resources to honor their obligations and by having the Adviser monitor the financial stability of the counterparties. Additionally, counterparties may be required to pledge collateral daily (based on the daily valuation of the financial asset) on behalf of each Fund with a value approximately equal to the amount of any unrealized gain above a pre-determined threshold. Reciprocally, when each Fund has an unrealized loss, the Funds have instructed the custodian to pledge assets of the Funds as collateral with a value approximately equal to the amount of the unrealized loss above a pre-determined threshold. Collateral pledges are monitored and subsequently adjusted if and when the valuations fluctuate, either up or down, by at least the pre-determined threshold amount.
5. Fund Shares
Common Share Equity Shelf Programs and Offering Costs
The following Funds have each filed registration statements with the Securities and Exchange Commission (“SEC”) authorizing each Fund to issue additional common shares through one or more equity shelf programs (“Shelf Offering”), which became effective with the SEC during a current and/or prior fiscal period.
Under these Shelf Offerings, the Funds, subject to market conditions, may raise additional equity capital by issuing additional common shares from time to time in varying amounts and by different offering methods at a net price at or above each Fund’s NAV per common share. In the event each Fund’s Shelf Offering registration statement is no longer current, the Funds may not issue additional common shares until a post-effective amendment to the registration statement has been filed with the SEC.
94
Additional authorized common shares, common shares sold and offering proceeds, net of offering costs under each Fund’s Shelf Offering during the Funds’ current and prior fiscal period were as follows:
| | NUW | | | NMI | |
| | Six Months | | | Year | | | Six Month | | | Year | |
| | Ended | | | Ended | | | Ended | | | Ended | |
| | 4/30/21 | | | 10/31/20 | | | 4/30/21 | | | 10/31/20 | |
Additional authorized common shares | | | 1,500,000 | | | | 1,500,000 | | | | 2,200,000 | | | | 2,200,000 | * |
Common shares sold | | | — | | | | — | | | | 256,675 | | | | 371,496 | |
Offering proceeds, net of offering costs | | $ | — | | | $ | — | | | $ | 2,921,015 | | | $ | 4,240,676 | |
* | Represents additional authorized common shares for the period September 23, 2020 through October 31, 2020. An additional 800,000 common shares were authorized for the period November 1, 2019 through March 8, 2020. |
Costs incurred by the Funds in connection with their initial shelf registrations are recorded as a prepaid expense and recognized as “Deferred offering costs” on the Statement of Assets and Liabilities. These costs are amortized pro rata as common shares are sold and are recognized as a component of “Proceeds from shelf offering, net of offering costs” on the Statement of Changes in Net Assets. Any deferred offering costs remaining after the effectiveness of the initial shelf registration will be expensed. Costs incurred by the Funds to keep the shelf registration current are expensed as incurred and recognized as a component of “Other expenses” on the Statement of Operations.
Common Share Transactions
Transactions in common shares during the Funds’ current and prior fiscal period, where applicable, were as follows:
| | | | | | | | | | | | | | | | | | |
| | | | | | | | | | | | | NUW | |
| | | | | | | | | | | | | Six Months | | | Year | |
| | | | | | | | | | | | | Ended | | | Ended | |
| | | | | | | | | | | | | 4/30/21 | | | 10/31/20 | |
Common shares: | | | | | | | | | | | | | | | | | |
Issued in the Merger | | | | | | | | | | | | | | 2,435,254 | | | | — | |
| | |
| | |
| NUV | | | NMI | | | NEV | |
| Six Months | | | Year | | | Six Months | | | Year | | | Six Months | | | Year | |
| Ended | | | Ended | | | Ended | | | Ended | | | Ended | | | Ended | |
| 4/30/21 | | | 10/31/20 | | | 4/30/21 | | | 10/31/20 | | | 4/30/21 | | | 10/31/20 | |
Common shares: | | | | | | | | | | | | | | | | | | | |
| Issued to shareholders due to reinvestment of distributions | | 229,746 | | | | 199,565 | | | | 4,328 | | | | 11,464 | | | | 6,332 | | | | — | |
| Sold through shelf offering | | — | | | | — | | | | 256,675 | | | | 371,496 | | | | — | | | | — | |
Weighted average common share: | | | | | | | | | | | | | | | | | | | | | | | |
| Premium to NAV per shelf offering common share sold | | — | % | | | — | % | | | 1.77 | % | | | 1.73 | % | | | — | % | | | — | % |
6. Income Tax Information
Each Fund is a separate taxpayer for federal income tax purposes. Each Fund intends to distribute substantially all of its net investment income and net capital gains to shareholders and to otherwise comply with the requirements of Subchapter M of the Internal Revenue Code applicable to regulated investment companies. Therefore, no federal income tax provision is required. Furthermore, each Fund intends to satisfy conditions that will enable interest from municipal securities, which is exempt from regular federal income tax, and in the case of NUW the alternative minimum tax applicable to individuals, to retain such tax-exempt status when distributed to shareholders of the Funds. Net realized capital gains and ordinary income distributions paid by the Funds are subject to federal taxation.
For all open tax years and all major taxing jurisdictions, management of the Funds has concluded that there are no significant uncertain tax positions that would require recognition in the financial statements. Open tax years are those that are open for examination by taxing authorities (i.e., generally the last four tax year ends and the interim tax period since then). Furthermore, management of the Funds is also not aware of any tax positions for which it is reasonably possible that the total amounts of unrecognized tax benefits will significantly change in the next twelve months.
The following information is presented on an income tax basis. Differences between amounts for financial statement and federal income tax purposes are primarily due to timing differences in recognizing taxable market discount, timing differences in recognizing certain gains and losses on investment transactions and the treatment of investments in inverse floating rate securities reflected as financing transactions, if any. To the extent that differences arise that are permanent in nature, such amounts are reclassified within the capital accounts as detailed below. Temporary differences do not require reclassification. Temporary and permanent differences do not impact the NAVs of the Funds.
95
Notes to Financial Statements (Unaudited) (continued)
The table below presents the cost and unrealized appreciation (depreciation) of each Fund’s investment portfolio, as determined on a federal income tax basis, as of April 30, 2021.
For purposes of this disclosure, derivative tax cost is generally the sum of any upfront fees or premiums exchanged and any amounts unrealized for income statement reporting but realized in income and/or capital gains for tax reporting. If a particular derivative category does not disclose any tax unrealized appreciation or depreciation, the change in value of those derivatives have generally been fully realized for tax purposes.
| | NUV | | | NUW | | | NMI | | | NEV | |
Tax cost of investments | | $ | 1,913,653,210 | | | $ | 267,547,941 | | | $ | 95,954,565 | | | $ | 340,758,737 | |
Gross unrealized: | | | | | | | | | | | | | | | | |
| Appreciation | | $ | 286,736,000 | | | $ | 42,076,786 | | | $ | 8,973,564 | | | $ | 47,734,348 | |
| Depreciation | | | (9,383,217 | ) | | | (442,164 | ) | | | (93,794 | ) | | | (3,116,548 | ) |
Net unrealized appreciation (depreciation) of investments | | $ | 277,352,783 | | | $ | 41,634,622 | | | $ | 8,879,770 | | | $ | 44,617,800 | |
Permanent differences, primarily due to taxable market discount, paydowns, nondeductible reorganization expenses, and distribution reallocations resulted in reclassifications among the Funds’ components of net assets as of October 31, 2020, the Funds’ last tax year end.
The tax components of undistributed net tax-exempt income, net ordinary income and net long-term capital gains as of October 31, 2020, the Funds’ last tax year end, were as follows:
| | NUV | | | NUW | | | NMI | | | NEV | |
Undistributed net tax-exempt income1 | | $ | 9,806,945 | | | $ | — | | | $ | 235,850 | | | $ | 2,486,029 | |
Undistributed net ordinary income2 | | | 1,190,676 | | | | 400,577 | | | | 65,337 | | | | 2,945,917 | |
Undistributed net long-term capital gains | | | — | | | | — | | | | — | | | | 3,579,574 | |
1 | Undistributed net tax-exempt income (on a tax basis) has not been reduced for the dividend declared on October 1, 2020 and paid on November 2, 2020. |
2 | Net ordinary income consists of taxable market discount income and net short-term capital gains, if any. |
The tax character of distributions paid during the Funds’ last tax year end October 31, 2020 and was designated for purposes of the dividends paid deduction as follows:
| | NUV | | | NUW | | | NMI | | | NEV | |
Distributions from net tax-exempt income | | $ | 74,458,618 | | | $ | 7,373,541 | | | $ | 3,701,146 | | | $ | 17,589,798 | |
Distributions from net ordinary income2 | | | 2,536,534 | | | | 12,114 | | | | 813 | | | | — | |
Distributions from net long-term capital gains | | | — | | | | — | | | | 315,472 | | | | — | |
2 Net ordinary income consists of taxable market discount income and net short-term capital gains, if any. | | | | |
As of October 31, 2020, the Funds’ last tax year end, the following Funds had unused capital losses carrying forward available for federal income tax purposes to be applied against future capital gains, if any. The capital losses are not subject to expiration.
| | NUV | | | NUW | | | NMI | |
Not subject to expiration: | | | | | | | | | |
| Short-term | | $ | 12,720,858 | | | $ | 79,531 | | | $ | 212,201 | |
| Long-term | | | 11,849,530 | | | | — | | | | 823 | |
Total | | $ | 24,570,388 | | | $ | 79,531 | | | $ | 213,024 | |
During the Funds’ last tax year ended October 31, 2020, the following Fund utilized capital loss carryforwards as follows:
| NEV |
Utilized capital loss carryforwards | $5,138,903 |
7. Management Fees and Other Transactions with Affiliates
Management Fees
Each Fund’s management fee compensates the Adviser for the overall investment advisory and administrative services and general office facilities. The Sub-Adviser is compensated for its services to the Funds from the management fees paid to the Adviser.
Each Fund’s management fee consists of two components – a fund-level fee, based only on the amount of assets within each individual Fund, and a complex-level fee, based on the aggregate amount of all eligible fund assets managed by the Adviser and for NUV a gross interest income component.
96
This pricing structure enables Fund shareholders to benefit from growth in the assets within their respective Fund as well as from growth in the amount of complex-wide assets managed by the Adviser.
The annual fund-level fee, payable monthly, for NUV is calculated according to the following schedule: | |
| NUV |
| Average Daily Net Assets | Fund-Level Fee Rate |
For the first $500 million | 0.1500% |
For the next $500 million | 0.1250
|
For net assets over $1 billion | 0.1000
|
In addition, NUV pays an annual management fee, payable monthly, based on gross interest income (excluding interest on bonds underlying a “self-deposited inverse floater” trust that is attributed to the Fund over and above the net interest earned on the inverse floater itself) as follows:
| NUV |
| Gross Interest Income | Gross Income Fee Rate |
For the first $50 million | 4.125% |
For the next $50 million | 4.000 |
For gross income over $100 million | 3.875 |
The annual fund-level fee, payable monthly, for NUW, NMI and NEV is calculated according to the following schedules: | |
| NUW |
| Average Daily Managed Assets* | Fund-Level Fee Rate |
For the first $125 million | 0.4000% |
For the next $125 million | 0.3875
|
For the next $250 million | 0.3750
|
For the next $500 million | 0.3625
|
For the next $1 billion | 0.3500
|
For the next $3 billion | 0.3250
|
For managed assets over $5 billion | 0.3125
|
| NMI |
| Average Daily Net Assets | Fund-Level Fee Rate |
For the first $125 million | 0.4500% |
For the next $125 million | 0.4375
|
For the next $250 million | 0.4250
|
For the next $500 million | 0.4125
|
For the next $1 billion | 0.4000
|
For the next $3 billion | 0.3750
|
For net assets over $5 billion | 0.3625
|
| NEV |
| Average Daily Managed Assets* | Fund-Level Fee Rate |
For the first $125 million | 0.4500% |
For the next $125 million | 0.4375
|
For the next $250 million | 0.4250
|
For the next $500 million | 0.4125
|
For the next $1 billion | 0.4000
|
For the next $3 billion | 0.3750
|
For managed assets over $5 billion | 0.3625
|
97
Notes to Financial Statements (Unaudited) (continued)
The annual complex-level fee, payable monthly, for each Fund is calculated by multiplying the current complex-wide fee rate, determined according to the following schedule by the Fund’s daily managed assets (net assets for NUV and NMI):
| Complex-Level Eligible Asset Breakpoint Level* | Effective Complex-Level Fee Rate at Breakpoint Level |
$55 billion | 0.2000% |
$56 billion | 0.1996
|
$57 billion | 0.1989
|
$60 billion | 0.1961
|
$63 billion | 0.1931
|
$66 billion | 0.1900
|
$71 billion | 0.1851
|
$76 billion | 0.1806
|
$80 billion | 0.1773
|
$91 billion | 0.1691
|
$125 billion | 0.1599
|
$200 billion | 0.1505
|
$250 billion | 0.1469
|
$300 billion | 0.1445
|
* | For the complex-level fees, managed assets include closed-end fund assets managed by the Adviser that are attributable to certain types of leverage. For these purposes, leverage includes the funds’ use of preferred stock and borrowings and certain investments in the residual interest certificates (also called inverse floating rate securities) in tender option bond (TOB) trusts, including the portion of assets held by a TOB trust that has been effectively financed by the trust’s issuance of floating rate securities, subject to an agreement by the Adviser as to certain funds to limit the amount of such assets for determining managed assets in certain circumstances. The complex-level fee is calculated based upon the aggregate daily managed assets of all Nuveen open-end and closed-end funds that constitute “eligible assets.” Eligible assets do not include assets attributable to investments in other Nuveen funds or assets in excess of a determined amount (originally $2 billion) added to the Nuveen fund complex in connection with the Adviser’s assumption of the management of the former First American Funds effective January 1, 2011, but do not include certain assets of certain Nuveen funds that were reorganized into funds advised by an affiliate of the Adviser during the 2019 calendar year. As of April 30, 2021, the complex-level fee rate for each Fund was 0.1544%. |
Other Transactions with Affiliates
Each Fund is permitted to purchase or sell securities from or to certain other funds or accounts managed by the Sub-Adviser (“Affiliated Entity”) under specified conditions outlined in procedures adopted by the Board (“cross-trade”). These procedures have been designed to ensure that any cross-trade of securities by the Fund from or to an Affiliated Entity by virtue of having a common investment adviser (or affiliated investment adviser), common officer and/or common trustee complies with Rule 17a-7 under the 1940 Act. These transactions are effected at the current market price (as provided by an independent pricing service) without incurring broker commissions.
During the current fiscal period, the Funds did not engage in inter-fund trades pursuant to these procedures.
8. Commitments and Contingencies
In the normal course of business, each Fund enters into a variety of agreements that may expose the Fund to some risk of loss. These could include recourse arrangements for certain TOB Trusts, which are described elsewhere in these Notes to Financial Statements. The risk of future loss arising from such agreements, while not quantifiable, is expected to be remote. As of the end of the reporting period, the Funds did not have any unfunded commitments.
From time to time, the Funds may be a party to certain legal proceedings in the ordinary course of business, including proceedings relating to the enforcement of the Funds’ rights under contracts. As of the end of the reporting period, the Funds are not subject to any material legal proceedings.
9. Borrowing Arrangements
Committed Line of Credit
The Funds, along with certain other funds managed by the Adviser (“Participating Funds”), have established a 364-day, $2.405 billion standby credit facility with a group of lenders, under which the Participating Funds may borrow for various purposes other than leveraging for investment purposes. Each Participating Fund is allocated a designated proportion of the facility’s capacity (and its associated costs, as described below) based upon a multi-factor assessment of the likelihood and frequency of its need to draw on the facility, the size of the Fund and its anticipated draws, and the potential importance of such draws to the operations and well-being of the Fund, relative to those of the other Funds. A Fund may effect draws on the facility in excess of its designated capacity if and to the extent that other Participating Funds have undrawn capacity. The credit facility expires in June 2021 unless extended or renewed.
98
The credit facility has the following terms: a 0.10% upfront fee, 0.15% per annum on unused commitment amounts and a drawn interest rate equal to the higher of (a) one-month LIBOR (London Inter-Bank Offered Rate) plus 1.25% per annum or (b) the Fed Funds rate plus 1.25% per annum on amounts borrowed. Interest expense incurred by the Participating Funds, when applicable, is recognized as a component of “Other expenses” on the Statement of Operations. Participating Funds paid administration, legal and arrangement fees, which are recognized as a component of “Other expenses” on the Statement of Operations, and along with commitment fees, have been allocated among such Participating Funds based upon the relative proportions of the facility’s aggregate capacity reserved for them and other factors deemed relevant by the Adviser and the Board of each Participating Fund.
During the current fiscal period, the following Funds utilized this facility. Each Fund’s maximum outstanding balance during the utilization period was as follows:
| | NUV | | | NUW | | | NEV | |
Maximum outstanding balance | | $ | 9,337,627 | | | $ | 118,287 | | | $ | 6,482,092 | |
During each Fund’s utilization period(s), during the current fiscal period, the average daily balance outstanding and average annual interest rate on the Borrowings were as follows:
| | NUV | | | NUW | | | NEV | |
Utilization period (days outstanding) | | | 4 | | | | 4 | | | | 4 | |
Average daily balance outstanding | | $ | 9,337,627 | | | $ | 118,287 | | | $ | 6,482,092 | |
Average annual interest rate | | | 1.39 | % | | | 1.39 | % | | | 1.39 | % |
Borrowings outstanding as of the end of the reporting period, if any, are recognized as “Borrowings” on the Statement of Assets and Liabilities, where applicable.
Inter-Fund Borrowing and Lending
The SEC has granted an exemptive order permitting registered open-end and closed-end Nuveen funds to participate in an inter-fund lending facility whereby the Nuveen funds may directly lend to and borrow money from each other for temporary purposes (e.g., to satisfy redemption requests or when a sale of securities “fails,” resulting in an unanticipated cash shortfall) (the “Inter-Fund Program”). The closed-end Nuveen funds, including the Funds covered by this shareholder report, will participate only as lenders, and not as borrowers, in the Inter-Fund Program because such closed-end funds rarely, if ever, need to borrow cash to meet redemptions. The Inter-Fund Program is subject to a number of conditions, including, among other things, the requirements that (1) no fund may borrow or lend money through the Inter-Fund Program unless it receives a more favorable interest rate than is typically available from a bank or other financial institution for a comparable transaction; (2) no fund may borrow on an unsecured basis through the Inter-Fund Program unless the fund’s outstanding borrowings from all sources immediately after the inter-fund borrowing total 10% or less of its total assets; provided that if the borrowing fund has a secured borrowing outstanding from any other lender, including but not limited to another fund, the inter-fund loan must be secured on at least an equal priority basis with at least an equivalent percentage of collateral to loan value; (3) if a fund’s total outstanding borrowings immediately after an inter-fund borrowing would be greater than 10% of its total assets, the fund may borrow through the inter-fund loan on a secured basis only; (4) no fund may lend money if the loan would cause its aggregate outstanding loans through the Inter-Fund Program to exceed 15% of its net assets at the time of the loan; (5) a fund’s inter-fund loans to any one fund shall not exceed 5% of the lending fund’s net assets; (6) the duration of inter-fund loans will be limited to the time required to receive payment for securities sold, but in no event more than seven days; and (7) each inter-fund loan may be called on one business day’s notice by a lending fund and may be repaid on any day by a borrowing fund. In addition, a Nuveen fund may participate in the Inter-Fund Program only if and to the extent that such participation is consistent with the fund’s investment objective and investment policies. The Board is responsible for overseeing the Inter-Fund Program.
The limitations detailed above and the other conditions of the SEC exemptive order permitting the Inter-Fund Program are designed to minimize the risks associated with Inter-Fund Program for both the lending fund and the borrowing fund. However, no borrowing or lending activity is without risk. When a fund borrows money from another fund, there is a risk that the loan could be called on one day’s notice or not renewed, in which case the fund may have to borrow from a bank at a higher rate or take other actions to payoff such loan if an inter-fund loan is not available from another fund. Any delay in repayment to a lending fund could result in a lost investment opportunity or additional borrowing costs.
During the current reporting period, none of the Funds covered by this shareholder report have entered into any inter-fund loan activity.
99
Notes to Financial Statements (Unaudited) (continued)
10. Fund Reorganizations
The Reorganizations as previously described in Note 1 — General Information were structured to qualify as tax-free reorganizations under the Internal Revenue Code for federal income tax purposes, and the Target Funds’ shareholders recognized no gain or loss for federal income tax purposes as a result. Prior to the closing of the Reorganizations, the Target Funds distributed all of its net investment income and capital gains, if any. Such a distribution may be taxable to the Target Funds’ shareholders for federal income tax purposes.
Investments
The cost, fair value and net unrealized appreciation (depreciation) of the investments (including investments in derivatives) of the Target Funds as of the date of the Reorganizations, were as follows:
| | NJV | | | NPN | |
Cost of investments | | $ | 15,136,850 | | | $ | 19,331,322 | |
Fair value of investments | | | 20,676,952 | | | | 16,541,215 | |
Net unrealized appreciation (depreciation) of investments | | | 5,540,102 | | | | (2,790,107 | ) |
For financial reporting purposes, assets received and shares issued by the Acquiring Funds were recorded at fair value; however, the cost basis of the investments received from the Target Funds were carried forward to align ongoing reporting of the Acquiring Funds’ realized and unrealized gains and losses with amounts distributable to shareholders for tax purposes.
Common Shares
The common shares outstanding, net assets applicable to common shares and NAV per common share outstanding immediately before and after the Mergers were as follows:
| Target Fund - Prior to Merger | | NJV | |
Common shares outstanding | | | 1,524,357 | |
Net assets applicable to common shares | | $ | 23,600,163 | |
NAV per common share outstanding | | $ | 15.48 | |
| Target Fund - Prior to Merger | | NPN | |
Common shares outstanding | | | 1,219,222 | |
Net assets applicable to common shares | | $ | 18,397,596 | |
NAV per common share outstanding | | $ | 15.09 | |
| Acquiring Fund - Prior to Merger | | NUW | |
Common shares outstanding | | | 15,516,082 | |
Net assets applicable to common shares | | $ | 267,585,890 | |
NAV per common share outstanding | | $ | 17.25 | |
| Acquiring Fund - Post to Merger | | NUW | |
Common shares outstanding | | | 17,951,336 | |
Net assets applicable to common shares | | $ | 309,583,649 | |
NAV per common share outstanding | | $ | 17.25 | |
100
Pro Forma Results of Operations
The beginning of the Target Funds’ current fiscal period were March 1, 2021. Assuming the Reorganizations had been completed on November 1, 2020, the beginning of the Acquiring Fund’s current fiscal period, the pro forma results of operations for each Fund’s current fiscal period, are as follows:
| Acquiring Fund - Pro Forma Results from Operations | | NUW | |
Net investment income (loss) | | $ | 4,176,275 | |
Net realized and unrealized gains (losses) | | | 10,874,424 | |
Change in net assets resulting from operations | | | 15,050,699 | |
Because the combined investment portfolios of each Acquiring Fund have been managed as a single integrated portfolio since Reorganizations were was completed, it is not practicable to separate the amounts of revenue and earnings of the Target Funds that have been included in the Statement of Operations of their respective Acquiring Fund since the Reorganizations were consummated.
Cost and Expenses
In connection with the Reorganizations, the Acquiring Fund incurred certain associated costs and expenses. Such amounts were included as components of “Accrued other expenses” on the Statement of Assets and Liabilities and “Other expenses” on the Statement of Operations.
11. Subsequent Events
Committed Line of Credit
During June 2021, the Participating Funds renewed the standby credit facility through June 2022. In conjunction with this renewal the commitment amount increased from $2.405 billion to $2.635 billion and the interest rate changed from the higher of a) LIBOR plus 1.25% or b) the Fed Funds rate plus 1.25% to the higher of a) OBFR (Overnight Bank Funding Rate) plus 1.20% or b) the Fed Funds Rate plus 1.20%. The Participating Funds also incurred a 0.05% upfront fee on the increase of the commitment amount. All other terms remain relatively unchanged.
101
Shareholder Update
(Unaudited)
CHANGES OCCURRING DURING THE FISCAL YEAR
The following information in this semi-annual report is a summary of certain changes during the most recent fiscal year. This information may not reflect all of the changes that have occurred since you purchased shares of a Fund.
Nuveen AMT-Municipal Value Fund (NUW)
Fund Reorganization
As noted in the Notes to Financial Statements of this report, effective March 8, 2021 Nuveen New Jersey Municipal Value Fund (“NJV”) and Nuveen Pennsylvania Municipal Value Fund (“NPN”) were reorganized into NUW. Holders of common shares of NJV and NPN received newly issued common shares of NUW, with cash being distributed in lieu of fractional common shares.
102
Fund shares are not guaranteed or endorsed by any bank or other insured depository institution, and are not federally insured by the Federal Deposit Insurance Corporation.
Nuveen Municipal Value Fund, Inc. (NUV)
Investing in closed-end funds involves risk; principal loss is possible. There is no guarantee the Fund’s investment objectives will be achieved. Closed-end fund shares may frequently trade at a discount or premium to their net asset value. Debt or fixed income securities such as those held by the Fund, are subject to market risk, credit risk, interest rate risk, derivatives risk, liquidity risk, and income risk. As interest rates rise, bond prices fall. These and other risk considerations such as tax risk are described in more detail on the Fund’s web page at www.nuveen.com/NUV.
Nuveen AMT-Free Municipal Value Fund (NUW)
Investing in closed-end funds involves risk; principal loss is possible. There is no guarantee the Fund’s investment objectives will be achieved. Closed-end fund shares may frequently trade at a discount or premium to their net asset value. Debt or fixed income securities such as those held by the Fund, are subject to market risk, credit risk, interest rate risk, derivatives risk, liquidity risk, and income risk. As interest rates rise, bond prices fall. These and other risk considerations such as tax risk are described in more detail on the Fund’s web page at www.nuveen.com/NUW.
Nuveen Municipal Income Fund, Inc. (NMI)
Investing in closed-end funds involves risk; principal loss is possible. There is no guarantee the Fund’s investment objectives will be achieved. Closed-end fund shares may frequently trade at a discount or premium to their net asset value. Debt or fixed income securities such as those held by the Fund, are subject to market risk, credit risk, interest rate risk, derivatives risk, liquidity risk, and income risk. As interest rates rise, bond prices fall. These and other risk considerations such as tax risk are described in more detail on the Fund’s web page at www.nuveen.com/NMI.
Nuveen Enhanced Municipal Value Fund (NEV)
Investing in closed-end funds involves risk; principal loss is possible. There is no guarantee the Fund’s investment objectives will be achieved. Closed-end fund shares may frequently trade at a discount or premium to their net asset value. Debt or fixed income securities such as those held by the Fund, are subject to market risk, credit risk, interest rate risk, derivatives risk, liquidity risk, and income risk. As interest rates rise, bond prices fall. Leverage increases return volatility and magnifies the Fund’s potential return and its risks; there is no guarantee a fund’s leverage strategy will be successful. The Fund uses only inverse floaters for its leverage, increasing its exposure to interest rate risk and credit risk, including counter-party credit risk. These and other risk considerations such as tax risk are described in more detail on the Fund’s web page at www.nuveen.com/NEV.
103
Additional Fund
| | | | | | |
| Board of Directors/Trustees | | | | |
Jack B. Evans | William C. Hunter | Amy B. R. Lancellotta* | Joanne T. Medero* | Albin F. Moschner | John K. Nelson |
Judith M. Stockdale | Carole E. Stone | Mathew Thornton III | Terence J. Toth | Margaret L. Wolff | Robert L. Young |
|
* Effective June 1, 2021.
| | | | | |
|
| Investment Adviser | Custodian | Legal Counsel | Independent Registered | Transfer Agent and |
Nuveen Fund Advisors, LLC | State Street Bank | Chapman and Cutler LLP | Public Accounting Firm | Shareholder Services |
333 West Wacker Drive | & Trust Company | Chicago, IL 60603 | KPMG LLP | | Computershare Trust |
Chicago, IL 60606 | One Lincoln Street | | 200 East Randolph Street | Company, N.A. |
| Boston, MA 02111 | | Chicago, IL 60601 | | 150 Royall Street |
| | | | | Canton, MA 02021 |
| | | | | (800) 257-8787 |
Portfolio of Investments Information
Each Fund is required to file its complete schedule of portfolio holdings with the Securities and Exchange Commission (SEC) for the first and third quarters of each fiscal year as an exhibit to its report on Form N-PORT. You may obtain this information on the SEC’s website at http://www.sec.gov.
Nuveen Funds’ Proxy Voting Information
You may obtain (i) information regarding how each fund voted proxies relating to portfolio securities held during the most recent twelve-month period ended June 30, without charge, upon request, by calling Nuveen toll-free at (800) 257-8787 or on Nuveen’s website at www.nuveen.com and (ii) a description of the policies and procedures that each fund used to determine how to vote proxies relating to portfolio securities without charge, upon request, by calling Nuveen toll free at (800) 257-8787. You may also obtain this information directly from the SEC. Visit the SEC on-line at http://www.sec.gov.
CEO Certification Disclosure
Each Fund’s Chief Executive Officer (CEO) has submitted to the New York Stock Exchange (NYSE) the annual CEO certification as required by Section 303A.12(a) of the NYSE Listed Company Manual. Each Fund has filed with the SEC the certification of its CEO and Chief Financial Officer required by Section 302 of the Sarbanes-Oxley Act.
Common Share Repurchases
Each Fund intends to repurchase, through its open-market share repurchase program, shares of its own common stock at such times and in such amounts as is deemed advisable. During the period covered by this report, each Fund repurchased shares of its common stock as shown in the accompanying table. Any future repurchases will be reported to shareholders in the next annual or semi-annual report.
| NUV | NUW | NMI | NEV |
Common shares repurchased | — | — | — | — |
FINRA BrokerCheck
The Financial Industry Regulatory Authority (FINRA) provides information regarding the disciplinary history of FINRA member firms and associated investment professionals. This information as well as an investor brochure describing FINRA BrokerCheck is available to the public by calling the FINRA BrokerCheck Hotline number at (800) 289-9999 or by visiting www.FINRA.org.
104
Glossary of Terms Used in this Report
(Unaudited)
■ Average Annual Total Return: This is a commonly used method to express an investment’s performance over a particular, usually multi-year time period. It expresses the return that would have been necessary each year to equal the investment’s actual cumulative performance (including change in NAV or market price and reinvested dividends and capital gains distributions, if any) over the time period being considered.
■ Duration: Duration is a measure of the expected period over which a bond’s principal and interest will be paid, and consequently is a measure of the sensitivity of a bond’s or bond fund’s value to changes when market interest rates change. Generally, the longer a bond’s or fund’s duration, the more the price of the bond or fund will change as interest rates change.
■ Effective Leverage: Effective leverage is a fund’s effective economic leverage, and includes both regulatory leverage (see leverage) and the leverage effects of certain derivative investments in the fund’s portfolio. Currently, the leverage effects of Tender Option Bond (TOB) inverse floater holdings are included in effective leverage values, in addition to any regulatory leverage.
■ Industrial Development Revenue Bond (IDR): A unique type of revenue bond issued by a state or local government agency on behalf of a private sector company and intended to build or acquire factories or other heavy equipment and tools.
■ Inverse Floating Rate Securities: Inverse floating rate securities, also known as inverse floaters or tender option bonds (TOBs), are created by depositing a municipal bond, typically with a fixed interest rate, into a special purpose trust. This trust, in turn, (a) issues floating rate certificates typically paying short-term tax-exempt interest rates to third parties in amounts equal to some fraction of the deposited bond’s par amount or market value, and (b) issues an inverse floating rate certificate (sometimes referred to as an “inverse floater”) to an investor (such as a fund) interested in gaining investment exposure to a long-term municipal bond. The income received by the holder of the inverse floater varies inversely with the short-term rate paid to the floating rate certificates’ holders, and in most circumstances the holder of the inverse floater bears substantially all of the underlying bond’s downside investment risk. The holder of the inverse floater typically also benefits disproportionately from any potential appreciation of the underlying bond’s value. Hence, an inverse floater essentially represents an investment in the underlying bond on a leveraged basis.
■ Leverage: Leverage is created whenever a fund has investment exposure (both reward and/or risk) equivalent to more than 100% of the investment capital.
■ Net Asset Value (NAV) Per Share: A fund’s Net Assets is equal to its total assets (securities, cash, accrued earnings and receivables) less its total liabilities. NAV per share is equal to the fund’s Net Assets divided by its number of shares outstanding.
■ Pre-Refunding: Pre-Refunding, also known as advanced refundings or refinancings, is a procedure used by state and local governments to refinance municipal bonds to lower interest expenses. The issuer sells new bonds with a lower yield and uses the proceeds to buy U.S. Treasury securities, the interest from which is used to make payments on the higher-yielding bonds. Because of this collateral, pre-refunding generally raises a bond’s credit rating and thus its value.
105
Glossary of Terms Used in this Report (Unaudited) (continued)
■ S&P Municipal Bond Index: An unleveraged, market value-weighted index designed to measure the performance of the tax-exempt, investment-grade U.S. municipal bond market. Index returns assume reinvestment of distributions, but do not reflect any applicable sales charges or management fees.
■ Total Investment Exposure: Total investment exposure is a fund’s assets managed by the Adviser that are attributable to financial leverage. For these purposes, financial leverage includes a fund’s use of preferred stock and borrowings and investments in the residual interest certificates (also called inverse floating rate securities) in tender option bond (TOB) trusts, including the portion of assets held by a TOB trust that has been effectively financed by the trust’s issuance of floating rate securities.
■ Zero Coupon Bond: A zero coupon bond does not pay a regular interest coupon to its holders during the life of the bond. Income to the holder of the bond comes from accretion of the difference between the original purchase price of the bond at issuance and the par value of the bond at maturity and is effectively paid at maturity. The market prices of zero coupon bonds generally are more volatile than the market prices of bonds that pay interest periodically.
106
Notes
107
Nuveen:
Serving Investors for Generations
Since 1898, financial professionals and their clients have relied on Nuveen to provide dependable investment solutions through continued adherence to proven, long-term investing principles. Today, we offer a range of high quality solutions designed to be integral components of a well-diversified core portfolio.
Focused on meeting investor needs.
Nuveen is the investment manager of TIAA. We have grown into one of the world’s premier global asset managers, with specialist knowledge across all major asset classes and particular strength in solutions that provide income for investors and that draw on our expertise in alternatives and responsible investing. Nuveen is driven not only by the independent investment processes across the firm, but also the insights, risk management, analytics and other tools and resources that a truly world-class platform provides. As a global asset manager, our mission is to work in partnership with our clients to create solutions which help them secure their financial future.
Find out how we can help you.
To learn more about how the products and services of Nuveen may be able to help you meet your financial goals, talk to your financial professional, or call us at (800) 257-8787. Please read the information provided carefully before you invest. Investors should consider the investment objective and policies, risk considerations, charges and expenses of any investment carefully. Where applicable, be sure to obtain a prospectus, which contains this and other relevant information. To obtain a prospectus, please contact your securities representative or Nuveen, 333 W. Wacker Dr., Chicago, IL 60606. Please read the prospectus carefully before you invest or send money.
Learn more about Nuveen Funds at: www.nuveen.com/closed-end-funds
Nuveen Securities, LLC, member FINRA and SIPC | 333 West Wacker Drive Chicago, IL 60606 | www.nuveen.com
ESA-A-0421D 1668431-INV-B-06/22
ITEM 2. CODE OF ETHICS.
Not applicable to this filing.
ITEM 3. AUDIT COMMITTEE FINANCIAL EXPERT.
Not applicable to this filing.
ITEM 4. PRINCIPAL ACCOUNTANT FEES AND SERVICES.
Not applicable to this filing.
ITEM 5. AUDIT COMMITTEE OF LISTED REGISTRANTS.
Not applicable to this filing.
ITEM 6. SCHEDULE OF INVESTMENTS.
(a) See Portfolio of Investments in Item 1.
(b) Not applicable.
ITEM 7. DISCLOSURE OF PROXY VOTING POLICIES AND PROCEDURES FOR CLOSED-END MANAGEMENT INVESTMENT COMPANIES.
Not applicable to this filing.
ITEM 8. PORTFOLIO MANAGERS OF CLOSED-END MANAGEMENT INVESTMENT COMPANIES.
Not applicable to this filing.
ITEM 9. PURCHASES OF EQUITY SECURITIES BY CLOSED-END MANAGEMENT INVESTMENT COMPANY AND AFFILIATED PURCHASERS.
Not applicable.
ITEM 10. SUBMISSION OF MATTERS TO A VOTE OF SECURITY HOLDERS.
There have been no material changes to the procedures by which shareholders may recommend nominees to the registrant’s Board implemented after the registrant last provided disclosure in response to this Item.
ITEM 11. CONTROLS AND PROCEDURES.
Pursuant to the requirements of the Securities Exchange Act of 1934 and the Investment Company Act of 1940, the registrant has duly caused this report to be signed on its behalf by the undersigned, thereunto duly authorized.
Mark L. Winget
Pursuant to the requirements of the Securities Exchange Act of 1934 and the Investment Company Act of 1940, this report has been signed below by the following persons on behalf of the registrant and in the capacities and on the dates indicated.
David J. Lamb