UNITED STATES
SECURITIES AND EXCHANGE COMMISSION
Washington, D.C. 20549
FORM 6-K
REPORT OF FOREIGN PRIVATE ISSUER PURSUANT TO RULE 13a-16 OR 15d-16 UNDER THE
SECURITIES EXCHANGE ACT OF 1934
For the month of July, 2016
Commission File Number: 001-34476
BANCO SANTANDER (BRASIL) S.A.
(Exact name of registrant as specified in its charter)
Avenida Presidente Juscelino Kubitschek, 2041 and 2235
Bloco A – Vila Olimpia
São Paulo, SP 04543-011
Federative Republic of Brazil
(Address of principal executive office)
Indicate by check mark whether the registrant files or will file annual reports under cover of Form 20-F or Form 40-F:Form 20-F ___X___ Form 40-F _______ Indicate by check mark if the registrant is submitting the Form 6-K in paper as permitted by Regulation S-T Rule 101(b)(1):
Yes _______ No ___X____
Indicate by check mark if the registrant is submitting the Form 6-K in paper as permitted by Regulation S-T Rule 101(b)(7):
Yes _______ No ___X____
Indicate by check mark whether by furnishing the information contained in this Form, the Registrant is also thereby furnishing the information to the Commission pursuant to Rule 12g3-2(b) under the Securities Exchange Act of 1934:
Yes _______ No ___X____
If “Yes” is marked, indicate below the file number assigned to the registrant in connection with Rule 12g3-2(b): N/A

 | CONTENTS |
CONTENTS
MANAGERIAL ANALYSIS OF RESULTS – BR GAAP
| |
KEY CONSOLIDATED DATA | 03 |
| |
sTRATEGY | 04 |
| |
EXECUTIVE SUMMARY | 05 |
| |
SANTANDER BRASIL RESULTS | |
MANAGERIAL INCOME STATEMENT | 06 |
BALANCE SHEET | 10 |
| |
OUR SHARES | 19 |
| |
RATINGS | 20 |
| |
ADDITIONAL INFORMATION – BALANCE SHEET AND MANAGERIAL FINANCIAL STATEMENTS | 21 |
| |
ACCOUNTING AND MANAGERIAL RESULTS RECONCILIANTION | 24 |
| |
| KEY CONSOLIDATED DATA |
|
KEY CONSOLIDATED DATA
All information, indicators and comments relating to the Income Statement in this report consider the managerial results, except where indicated otherwise.The reconciliation with the accounting results can be found on pages 24 and 25.
| | | | | | | | |
MANAGERIAL¹ ANALYSIS - BR GAAP | | 1H16 | 1H15 | Var. | 2Q16 | 1Q16 | Var. |
| | | 1H16x1H15 | | | 2Q16x1Q16 |
| | | | | | | |
RESULTS (R$ million) | | | | | | | |
Net interest income | | 15,408 | 14,620 | 5.4% | 7,808 | 7,599 | 2.8% |
Fee and commission income | | 6,419 | 5,738 | 11.9% | 3,328 | 3,090 | 7.7% |
Allowance for loan losses | | (4,940) | (4,450) | 11.0% | (2,515) | (2,424) | 3.7% |
General Expenses² | | (8,834) | (8,403) | 5.1% | (4,424) | (4,410) | 0.3% |
Managerial net profit³ | | 3,466 | 3,308 | 4.8% | 1,806 | 1,660 | 8.8% |
Accounting net profit | | 2,560 | 4,565 | -43.9% | 1,347 | 1,213 | 11.1% |
| | | | | | | |
BALANCE SHEET (R$ million) | | | | | | | |
Total assets | | 655,194 | 605,290 | 8.2% | 655,194 | 668,750 | -2.0% |
Securities | | 149,988 | 145,900 | 2.8% | 149,988 | 151,377 | -0.9% |
Loan portfolio | | 244,284 | 254,402 | -4.0% | 244,284 | 248,271 | -1.6% |
Individuals | | 86,826 | 81,534 | 6.5% | 86,826 | 85,593 | 1.4% |
Consumer finance | | 31,961 | 35,338 | -9.6% | 31,961 | 32,708 | -2.3% |
Small and Medium Enterprises | | 32,274 | 35,396 | -8.8% | 32,274 | 33,837 | -4.6% |
Corporate | | 93,222 | 102,135 | -8.7% | 93,222 | 96,133 | -3.0% |
Expanded Credit Portfolio4 | | 308,377 | 321,174 | -4.0% | 308,377 | 312,018 | -1.2% |
Funding from Clients5 | | 287,840 | 275,524 | 4.5% | 287,840 | 283,141 | 1.7% |
Equity6 | | 56,779 | 56,665 | 0.2% | 56,779 | 54,428 | 4.3% |
| | | | | | | |
PERFORMANCE INDICATORS (%) | | | | | | | |
Return on average equity excluding goodwill6 - annualized | | 12.8% | 12.8% | 0.1 p.p. | 13.0% | 12.6% | 0.4 p.p. |
Return on average asset excluding goodwill6 - annualized | | 1.0% | 1.1% | -0.1 p.p. | 1.1% | 1.0% | 0.1 p.p. |
Efficiency Ratio7 | | 49.6% | 50.0% | -0.4 p.p. | 48.5% | 50.8% | -2.4 p.p. |
Recurrence Ratio8 | | 72.7% | 68.3% | 4.4 p.p. | 75.2% | 70.1% | 5.2 p.p. |
BIS ratio9 | | 17.7% | 18.1% | -0.4 p.p. | 17.7% | 16.4% | 1.3 p.p. |
| | | | | | | |
PORTFOLIO QUALITY INDICATORS (%) | | | | | | | |
Delinquency ratio (over 90 days) | | 3.2% | 3.2% | 0.0 p.p. | 3.2% | 3.3% | -0.1 p.p. |
Delinquency ratio (over 60 days) | | 4.8% | 4.1% | 0.6 p.p. | 4.8% | 4.2% | 0.6 p.p. |
Coverage ratio (over 90 days) | | 209.3% | 184.7% | 24.6 p.p. | 209.3% | 200.1% | 9.2 p.p. |
| | | | | | | |
OTHER DATA | | | | | | | |
Assets under management - AUM (R$ million)10 | | 223,903 | 178,318 | 25.6% | 223,903 | 213,191 | 5.0% |
Branches | | 2,266 | 2,262 | 4 | 2,266 | 2,263 | 3 |
PABs (mini branches) | | 1,173 | 1,181 | (8) | 1,173 | 1,176 | (3) |
Own ATMs | | 14,127 | 14,338 | (211) | 14,127 | 14,165 | (38) |
Shared ATMs | | 18,935 | 17,539 | 1,396 | 18,935 | 18,504 | 431 |
Total Customers (thousand) | | 33,371 | 31,798 | 1,573 | 33,371 | 32,899 | 473 |
Employees | | 48,877 | 50,245 | (1,368) | 48,877 | 50,142 | (1,265) |
| | | | | | | |
| | | | | | | | |
1. Excludes 100% of the goodwill amortization expense, the tax hedge effect and others as mentioned on pages 24 and 25. |
2. Administrative Expenses exclude 100% of the goodwill amortization expense and personnel expenses include profit sharing. |
3. Managerial net profit corresponds to the accounting net profit, excluding extraordinary results and considering 100% of reversal of goodwill amortization expense ocurred in the period. The goodwill amortization expense in 1H16 was R$ 906 million, R$ 1,900 million in 1H15, R$ 459 million in 2Q16 and R$ 447 million in 1Q16. |
4. Includes other credit risk transactions with clients ("debenture", FIDC, CRI, floating rate notes, promissory notes, acquiring activities related assets and guarantees). |
5. Includes savings, demand deposits, time deposits, debenture, LCA, LCI, Treasury Notes (Letras Financeiras - LFT) and Certificates of Structured Operations (COE). |
6. Excludes 100% of the goodwill (net of amortization) that in 2Q16 was R$ 3,071 million, R$ 3,625 million in 1Q16 and R$ 5,067 million in 2Q15. |
7. Efficiency Ratio: General Expenses / (Net Interest Income + Fee and Commission Income + Tax Expenses + Other Operating Income/Expense). |
8. Recurrence: Fee and Commission Income / General expenses. |
9. BIS Ratio as per Brazilian Central Bank criterion. From 2015 on, considers the prudential conglomerate. |
10. According to Anbima (Associação Brasileira das Entidades dos Mercados Financeiro e de Capitais) criterion. |
| STRATEGY |
STRATEGY
Banco Santander Brasil is a universal bank focused on retail services. We are certain that the only way to grow in a recurring and sustainable manner is to provide outstanding services that increase the level of satisfaction and attract more loyal customers. To accomplish this, our priority is to be a simple, personal and fair bank. Our strategy is based on a long-term outlook, focusing on the efficient execution of the following priorities: ● Increase customer preference and loyalty through targeted products and services that are simple, modern and efficient through a multi-channel platform. ● Improve recurrence and sustainability by growing business with more diversified revenue, seeking a balance between lending, funding and services, while at the same time maintaining efficient cost management and rigorous control over risks. ● Capital and liquidity discipline in order to maintain strength, adapt to regulatory changes and take advantage of opportunities for growth. ● Increase productivity through an intense agenda of transformation that allows us to offer a complete portfolio of services. Our strategy prioritizes growth, close and long-lasting relations with our stakeholders, and alignment with the country’s social and economic development agenda. We are currently undergoing a commercial transformation focused on customer satisfaction and profitability, which includes modernizing, simplifying and improving the offer of products, services and processes. In 2Q16, we highlight the following advances: ● We accelerated Customer biometric registration, with more than 2.4 million Customers registered in June. Moreover, we kept growing on transactions through digital channels, accounting for 73% of the total. We also launched new features on our app, strengthening our digital strategy; ● We strengthened our business model through the new incentive tool CERTO (CRM) and with Clique Único (simplified sales tool). We continued improving our customer experience and in June we achieved our best ever position in the Central Bank’s complaints ranking; ● According to ANBIMA, until May 2016, we recorded the highest relative growth in assets under management (+14.4%) among the ten leading asset managers and more than double the industry | | average, increasing our market share by 44 bps to 6.1% at the end of May. The bank also did exceptionally well in the retail segment, posting the year’s biggest increase in market share (+62 bps), closing May at 12.3%; ● We launched Olé Consignado, matching the experience of Banco Bonsucesso and Banco Santander Brasil, improving the product to expand our range in payroll credit market; ● We strengthened and repositioned our presence in the Agribusiness segment, expanding our team and offering differentiated services to rural producers, as well as a diversified portfolio of products and important agreements and partnerships; ● In Global Corporate Banking (GCB), we are the current leader in Financial Advisory for Project Finance in Brazil, according to ANBIMA’s latest consolidated ranking.We are also ranked first in foreign exchange; ● In the SME segment, Santander was elected the best bank in the world for small and medium enterprises by Euromoney in 2016; ● We launched “Santander Select International Services”, an important competitive advantage which reinforces our position as the only international bank with scale in Brazil; ● We announced a new partnership betweenSantander Financiamentos and Hyundai, creating Banco Hyundai Capital Brasil S.A. to offer products and financial services; and ● We are the bank that had most invested in renewable energy in Brazil, with market share exceeding 40% in some sectors. Santander is also active on the Sustainability front. Its Microcredit program occupies a prominent position among private banks and through its Universities program it helps the advance of high-quality education in Brazil by distributing scholarships. In 1H16, the Bank granted R$ 7.8 million to finance photovoltaic systems (which directly convert solar energy into electricity). The Agribusiness area also expanded its sustainability initiatives by engaging customers, employees and outsourced offices in the CAR (Rural Environmental Registry), as well as other issues associated with low-carbon agriculture. |
| EXECUTIVE SUMMARY |
|
EXECUTIVE SUMMARY
Managerial net profit¹ totaled R$ 3,466 million in the first half of 2016, up 4.8% in twelve months and 8.8% in three months. Total revenues reached R$ 21,826 million in 1H16, an increase of 7.2% in twelve months (or R$ 1,468 million) and 4.2% in threemonths. This performance was due to healthy net interest income and commissions growth, in line with our strategy of strengthening commercial activities and increasing loyal customers. The allowance for loan losses amounted to R$ 4,940 million, growth of 11.0% in twelve months (or R$ 489 million) and 3.7% in three months. Revenues net of the allowance for loan losses moved up by 6.2% in twelve months and 4.3% in three months. General expenses totaled R$ 8,834 million in 1H16, up 5.1% in twelve months (or R$ 431 million), lagging period inflation, and stable in three months, underlining our discipline and efficiency in cost management. The efficiency ratio reached 49.6% in 1H16, down 0.4 p.p. in twelve months and 2.4 p.p. in three months. The healthy quarterly improvement reflected the acceleration in total revenue growth, thanks to increased customer transactionality. The total credit portfolio came to R$ 244,284 million in June 2016, a decrease of 4.0%in twelve months (or R$ 10,119 million) and 1.6% in three months. Excluding the effect of the foreign exchange variation, the portfolio would have dropped by 4.4% in twelve months and remained stable in three months.The expanded credit portfolio totaledR$ 308,377 million, down 4.0% intwelve months (or R$ 12,798 million) and 1.2% in three months. Excluding the effect of the exchange rate variation, the expanded credit portfolio would have fallen by 4.3% in twelve months and remained stable in three months. The portfolio highlight wasloans toindividuals, whichended June 2016 atR$ 86,826 million, up 6.5% in twelve months (or R$ 5,292 million) mainly due tomortgage and payroll loans.In the quarter, growth came to 1.4%. The consumer finance portfolio totaledR$ 31,961 million in June 2016,down9.6% in twelve months (or R$ 3,377 million) and 2.3% in threemonths, still with a better performance than sector dynamics. The SME portfolio ended June 2016 atR$ 32,274 million, down 8.8% in twelve months (or R$ 3,121 million) and 4.6% in threemonths, reflecting the economic scenario. The corporate portfolio came toR$ 93,222 million, down 8.7% in twelve months (or R$ 8,913 million) and 3.0% in three months. The annual variation was positively affected | | by the exchange rate variation. Excluding this effect,the corporate portfolio would have fallen by9.7% in twelve months.The foreign exchange variation impact was negative in three months. Therefore, excluding thiseffect, the corporate portfolio would have grown 0.5% in the period. Total funding from clients reached R$ 287,840 million in 1H16, up 4.5% in twelve months and 1.7% in three months.Total funding and assets under management came toR$ 518,418 million, 5.0%higher than1H15 and 1.1% in the quarter. Total equity, excluding R$ 3,071 million related to goodwill, came to R$ 56,779 million in the end of June. Return on Average Equity (ROAE), adjusted for goodwill, reached 12.8% in 1H16, remaining stable in twelve months. In the quarter, the ratio reached 13.0%, up 0.4 p.p. in the period. The BIS ratio reached 17.7% inend of June, while Tier I capital came to 16.5% and 1.2% for Tier II capital. The coverage ratio (over 90 days) ended June 2016 at 209.3%. RECENT EVENT On April 28, 2016, Banco Santander entered into agreements for setting up a partnership with Hyundai in order to constitute Banco Hyundai Capital Brasil S.A. and an insurance broker. (For more details, see note 37 in the Financial Statements – Corporate Restructuring).
1. Accounting net profit excluding extraordinary events and considering 100% of the reversal of goodwill amortization expenses. |
| SANTANDER BRASIL RESULTS |
MANAGERIAL ANALYSIS OF RESULTS
Next, we will present the analysis of the managerial results.
MANAGERIAL FINANCIAL STATEMENTS¹ (R$ million) | | | | | | | |
| 1H16 | 1H15 | Var. | 2Q16 | 1Q16 | Var. |
| | | 1H16x1H15 | | | 2Q16x1Q16 |
| | | | | | | |
Net Interest Income | | 15,408 | 14,620 | 5.4% | 7,808 | 7,599 | 2.8% |
Allowance for Loan Losses | | (4,940) | (4,450) | 11.0% | (2,515) | (2,424) | 3.7% |
Net Interest Income after Loan Losses | | 10,468 | 10,170 | 2.9% | 5,293 | 5,175 | 2.3% |
Fee and commission income | | 6,419 | 5,738 | 11.9% | 3,328 | 3,090 | 7.7% |
General Expenses | | (8,834) | (8,403) | 5.1% | (4,424) | (4,410) | 0.3% |
Personnel Expenses + Profit Sharing | | (4,214) | (3,823) | 10.2% | (2,082) | (2,132) | -2.3% |
Administrative Expenses2 | | (4,620) | (4,580) | 0.9% | (2,341) | (2,278) | 2.8% |
Tax Expenses | | (1,640) | (1,818) | -9.8% | (823) | (817) | 0.7% |
Investments in Affiliates and Subsidiaries | | 1 | 1 | n.a | 0 | 0 | n.a |
Other Operating Income/Expenses | | (2,383) | (1,727) | 38.0% | (1,185) | (1,197) | -1.0% |
Operating Income | | 4,031 | 3,960 | 1.8% | 2,190 | 1,841 | 19.0% |
Non Operating Income | | 21 | 117 | -82.4% | (5) | 25 | -118.8% |
Net Profit before Tax | | 4,052 | 4,078 | -0.6% | 2,186 | 1,866 | 17.1% |
Income Tax and Social Contribution | | (527) | (701) | -24.7% | (323) | (204) | 58.6% |
Minority Interest | | (58) | (69) | -15.3% | (56) | (2) | n.a. |
Net Profit | | 3,466 | 3,308 | 4.8% | 1,806 | 1,660 | 8.8% |
| | | | | | | | |
1. Excludes 100% of the goodwill amortization expense, the tax hedge effect and others as mentioned on pages 24 and 25. |
2. Administrative Expenses exclude 100% of the goodwill amortization expense. |
NET INTEREST INCOME
Net interest income, including income from financial operations, totaled R$ 15,408 millionin the first half of 2016, up 5.4% year-on-year and 2.8% quarter-on-quarter. The increase in both periods of comparison was due to the healthy performance of operations with clients, exemplified by the Loans and Funding lines, and with the market, in the Others line. Revenues from loan operations grew 2.8% in twelve months and 1.4% in three months.Both upturns reflect the increasein average spread, which exceeded the reduction in the average loan portfolio. In the quarter, there was also the effect of the segment mix, with a higher share of the Individuals segment. | |  |
Revenues from funding increased by 21.3% in twelve months and 11.4% in three months. The quarterly performance already reflects the first signs of the more active, liability-focused management.
The “others” line, which includes the result of the structural interest rate gap, revenue from customers in treasury activities and others, moved up by 8.5% in twelve months and 3.8% in three months.
SANTANDER BRASIL RESULTS |
|
| | | | | | | | |
NET INTEREST INCOME | | 1H16 | 1H15 | Var. | 2Q16 | 1Q16 | Var. |
(R$ million) | | | | 1H16x1H15 | | | 2Q16x1Q16 |
| | | | | | | |
Net Interest Income | | 15,408 | 14,620 | 5.4% | 7,808 | 7,599 | 2.8% |
Loan | | 10,659 | 10,374 | 2.8% | 5,366 | 5,293 | 1.4% |
Average volume | | 247,622 | 250,051 | -1.0% | 243,772 | 251,473 | -3.1% |
Spread (Annualized) | | 8.6% | 8.4% | 0.27 p.p. | 8.8% | 8.4% | 0.39 p.p. |
Funding | | 1,338 | 1,103 | 21.3% | 705 | 633 | 11.4% |
Average volume | | 218,266 | 213,739 | 2.1% | 218,380 | 218,153 | 0.1% |
Spread (Annualized) | | 1.2% | 1.0% | 0.19 p.p. | 1.3% | 1.2% | 0.13 p.p. |
Others¹ | | 3,411 | 3,143 | 8.5% | 1,737 | 1,674 | 3.8% |
| | | | | | | | |
1. Includes Gains (Losses) on financial transactions and other net interest income. |
FEE AND COMMISSION INCOME
Revenues from fee and commission income amounted to R$ 6,419 million in the first half of 2016, up 11.9% in twelve months (R$ 681 million) and 7.7% in three months,reflecting the efforts to improve our products and services, with a focus on ensuring customer satisfaction and increasing profitability. In both periods of comparison, basically all the lines recorded growth, led by “Cards”, “Insurance Fees” and “Current Account Services”.
Commissions from credit cards totaled R$ 1.860 million, up 11.8% in twelve months (or R$ 196 million) and 5.7% in three months,primarily due to higher interchange fees driven by the upturn in revenue.
Insurance fees totaled R$ 1.030 million, up 6.4% in twelve months (or R$ 62 million) and 12.4% in three months. The quarterly improvement was due to higher sales, fueled by the sales campaigns.
Current account services fees totaled R$ 1.207 million, up 24.9% in twelve months (or R$ 241 million) and 8.6% in three months, reflecting the improvement in customer loyalty and higher transactionality.
Asset management fees totaled R$ 519 million in the same period, up 1.5% in twelve months (or R$ 8 million) and 9.0% in threemonths. The evolution, in twelve months, reflects, mainly, the sale of the custody business occurred in 3Q15. Excluding this effect, this line would have grown 12.7% in twelve months. Meanwhile, the quarterly increase was due to the growth in fund sales volume.
Additionally, income from lending operations came to R$ 699 million, up 2.6% in twelve months (or R$ 18 million) and 6.8% in three months.
| | | | | | | | |
FEE AND COMMISSION INCOME | | 1H16 | 1H15 | Var. | 2Q16 | 1Q16 | Var. |
(R$ million) | | | | 1H16x1H15 | | | 2Q16x1Q16 |
| | | | | | | |
Cards | | 1,860 | 1,664 | 11.8% | 956 | 904 | 5.7% |
Insurance fees | | 1,030 | 968 | 6.4% | 545 | 485 | 12.4% |
Current Account Services | | 1,207 | 966 | 24.9% | 629 | 579 | 8.6% |
Asset Management | | 519 | 511 | 1.5% | 271 | 248 | 9.0% |
Lending Operations | | 699 | 681 | 2.6% | 361 | 338 | 6.8% |
Collection Services | | 580 | 486 | 19.4% | 301 | 279 | 7.7% |
Securities Brokerage and Placement Services | | 284 | 286 | -0.6% | 141 | 143 | -1.6% |
Others | | 239 | 175 | 36.5% | 126 | 114 | 10.5% |
Total | | 6,419 | 5,738 | 11.9% | 3,328 | 3,090 | 7.7% |
| SANTANDER BRASIL RESULTS |
GENERAL EXPENSES (ADMINISTRATIVE + PERSONNEL) General expenses, including depreciation and amortization, totaled R$ 8,834 million in the first half of 2016, an increase of 5.1% in twelve months (or R$ 431 million), substantially below the inflation rate in the same period, thanks to the efforts in last years.It is worth noting that the association with Bonsucesso impacted the twelve-month figures. Excluding this effect,the increase in twelve months would have been 4.2%. In three months, the expenses remained stable, reflecting our discipline in efficient management of expenses. | |  |
Administrative and personnel expenses, excluding depreciation and amortization, totaled R$ 7,970 million in 1H16, an increase of 9.1% in twelve months (or R$ 666 million) and a decline of 0.2% over the previous quarter.
Personnel expenses, including profit sharing, came to R$ 4,214 million, an increase of 10.2% year-on-year (or R$ 391 million) and a fall of 2.3% quarter-on-quarter. The twelve-month upturn mainly reflected the impact of the annual collective bargaining agreement in the “compensation” line.
Administrative expenses, excluding depreciation and amortization, amounted to R$ 3,755 million in 1H16, up 7.9% (or R$ 275 million) in twelve months. In the quarter, there was an increase of 2.2%, chiefly due to higher expenses with “Advertising, promotions andpublicity”, as a result of the current commercial strategy. Depreciation and amortization totaled R$ 864 million, down 21.4% in twelve months (or R$ 235 million) and up 5.3% in three months.
The efficiency ratio reached 48.5% this quarter, down 1.7 p.p. in twelvemonths and 2.4 p.p. in three months. This healthy performance was due to the increase in revenues and excellent control over expenses.
| | | | | | | | |
EXPENSES' BREAKDOWN (R$ million) | | 1H16 | 1H15 | Var. | 2Q16 | 1Q16 | Var. |
| | | 1H16x1H15 | | | 2Q16x1Q16 |
| | | | | | | |
Outsourced and Specialized Services | | 1,068 | 1,056 | 1.2% | 525 | 543 | -3.2% |
Advertising, promotions and publicity | | 172 | 143 | 20.2% | 110 | 62 | 76.0% |
Data processing | | 777 | 686 | 13.3% | 392 | 385 | 2.0% |
Communications | | 247 | 255 | -2.9% | 125 | 122 | 2.0% |
Rentals | | 367 | 363 | 1.0% | 188 | 179 | 4.9% |
Transport and Travel | | 109 | 101 | 7.7% | 49 | 59 | -16.6% |
Security and Surveillance | | 352 | 312 | 12.9% | 175 | 177 | -1.2% |
Maintenance | | 128 | 114 | 11.9% | 65 | 63 | 4.2% |
Financial System Services | | 121 | 113 | 7.0% | 61 | 61 | 0.3% |
Water, Electricity and Gas | | 118 | 105 | 11.8% | 55 | 63 | -12.0% |
Material | | 35 | 40 | -12.7% | 17 | 18 | -4.3% |
Others | | 262 | 192 | 36.3% | 136 | 126 | 7.2% |
Subtotal | | 3,755 | 3,480 | 7.9% | 1,898 | 1,857 | 2.2% |
Depreciation and Amortization1 | | 864 | 1,099 | -21.4% | 443 | 421 | 5.3% |
Total Administrative Expenses | | 4,620 | 4,580 | 0.9% | 2,341 | 2,278 | 2.8% |
| | | | | | | |
Compensation² | | 2,682 | 2,378 | 12.8% | 1,324 | 1,358 | -2.5% |
Charges | | 751 | 740 | 1.4% | 371 | 380 | -2.3% |
Benefits | | 729 | 642 | 13.6% | 361 | 368 | -2.0% |
Training | | 33 | 44 | -24.8% | 18 | 15 | 16.3% |
Others | | 19 | 19 | -1.7% | 8 | 11 | -24.1% |
Total Personnel Expenses | | 4,214 | 3,823 | 10.2% | 2,082 | 2,132 | -2.3% |
| | | | | | | |
ADMINISTRATIVE + PERSONNEL EXPENSES (excludes deprec. and amortization) | | 7,970 | 7,304 | 9.1% | 3,980 | 3,989 | -0.2% |
| | | | | | | |
TOTAL GENERAL EXPENSES | | 8,834 | 8,403 | 5.1% | 4,424 | 4,410 | 0.3% |
| | | | | | | | |
1. Excludes 100% of the expenses of goodwill amortization, which in 1H16 was R$ 906 million, R$ 1,900 million in 1H15, R$ 459 million in 2Q16 and R$ 447 million in 1Q16. |
2. Includes Profit Sharing. |
SANTANDER BRASIL RESULTS |
|
ALLOWANCE FOR LOAN LOSSES
The allowance for loan losses totaled R$ 4,940 million in the first half of 2016, up 11.0% intwelve months(or R$ 489 million)and 3.7% in threemonths. The allowance for loan losses and credit quality performance, both in absolute and relative terms, are due to our solid risk management culture, improved our portfolio monitoring models and deeper knowledge of our customer’s life cycle.
| | | | | | | | |
ALLOWANCE FOR LOAN LOSSES | | 1H16 | 1H15 | Var. | 2Q16 | 1Q16 | Var. |
(R$ million) | | | | 1H16x1H15 | | | 2Q16x1Q16 |
| | | | | | | |
Gross allowance for loan losses | (6,341) | (5,535) | 14.6% | (3,312) | (3,028) | 9.4% |
Income from recovery of written off loans | 1,401 | 1,085 | 29.1% | 797 | 604 | 32.0% |
Total | | (4,940) | (4,450) | 11.0% | (2,515) | (2,424) | 3.7% |
| | | | | | | | |
OtHER OPERATING INCOME (EXPENSES)
Other net operating expenses came to R$ 2,383 million in 1H16, an increase of 38.0% in twelve months (or R$ 656 million) and down 1.0% in three months.
| | | | | | | | |
OTHER OPERATING INCOME (EXPENSES) (R$ million) | | 1H16 | 1H15 | Var. | 2Q16 | 1Q16 | Var. |
| | | 1H16x1H15 | | | 2Q16x1Q16 |
| | | | | | | |
Other operating income (expenses) | | (2,383) | (1,727) | 38.0% | (1,185) | (1,197) | -1.0% |
Expenses from cards | | (611) | (704) | -13.2% | (277) | (335) | -17.4% |
Net Income from Capitalization | | 151 | 121 | 24.5% | 81 | 70 | 14.5% |
Provisions for contingencies¹ | | (940) | (912) | 3.1% | (480) | (460) | 4.4% |
Others | | (982) | (232) | n.a | (509) | (473) | 7.6% |
| | | | | | | | |
1. Includes fiscal, civil and labor provisions. |
INCOME TAX expenses
Taxes totaled R$ 527 million in the first half of 2016, reaching an effective rate of 13.0%. There was a twelve-month decrease of 4.2 p.p., explained by Interest on Capital (IOC) and the use of tax credits. In the quarter,the 3.9 p.p. increase in the effective rate was due to the natural upturn in the taxable base and the reduced use of tax credits.
| SANTANDER BRASIL RESULTS |
balance sheet
At the end of June 2016, total assets reached R$ 655,194 million, up 8.2% in twelve months and down 2.0% in three months. In the same period, total equity came to R$ 59,850 million or R$ 56,779 million excluding goodwill.
| | | | | | | |
ASSETS (R$ million) | | Jun/16 | Jun/15 | Var. | Mar/16 | Var. |
| | | Jun/16xJun/15 | | Jun/16xMar/16 |
| | | | | | |
Current Assets and Long Term Assets | | 642,337 | 591,269 | 8.6% | 655,329 | -2.0% |
Cash and Cash Equivalents | | 5,209 | 5,525 | -5.7% | 5,463 | -4.6% |
Interbank Investments | | 64,278 | 56,850 | 13.1% | 51,481 | 24.9% |
Money Market Investments | | 47,349 | 32,452 | 45.9% | 31,838 | 48.7% |
Interbank Deposits | | 2,446 | 2,270 | 7.8% | 2,248 | 8.8% |
Foreign Currency Investments | | 14,482 | 22,129 | -34.6% | 17,395 | -16.7% |
Securities and Derivative Financial Instruments | | 149,988 | 145,900 | 2.8% | 151,377 | -0.9% |
Own Portfolio | | 42,820 | 38,403 | 11.5% | 30,072 | 42.4% |
Subject to Repurchase Commitments | | 65,301 | 70,536 | -7.4% | 82,498 | -20.8% |
Posted to Central Bank of Brazil | | 4,432 | 9,991 | -55.6% | 6,712 | -34.0% |
Pledged in Guarantees | | 14,032 | 13,930 | 0.7% | 15,036 | -6.7% |
Others | | 23,402 | 13,039 | 79.5% | 17,059 | 37.2% |
Interbank Accounts | | 61,478 | 34,689 | 77.2% | 57,101 | 7.7% |
Interbranch Accounts | | - | - | - | - | - |
Lending Operations | | 227,906 | 239,445 | -4.8% | 232,145 | -1.8% |
Lending Operations | | 244,290 | 254,523 | -4.0% | 248,360 | -1.6% |
Lending Operations Related to Assignment | | 162 | 2 | n.a | 181 | -10.5% |
(Allowance for Loan Losses) | | (16,546) | (15,080) | 9.7% | (16,396) | 0.9% |
Others Receivables | | 130,637 | 106,410 | 22.8% | 154,830 | -15.6% |
Others Assets | | 2,842 | 2,449 | 16.0% | 2,932 | -3.1% |
Permanent Assets | | 12,857 | 14,021 | -8.3% | 13,420 | -4.2% |
Investments | | 164 | 38 | n.a. | 164 | -0.4% |
Fixed Assets | | 6,825 | 6,707 | 1.8% | 6,915 | -1.3% |
Intangibles | | 5,868 | 7,276 | -19.4% | 6,341 | -7.5% |
Goodwill | | 27,475 | 27,527 | -0.2% | 27,490 | -0.1% |
Intangible Assets | | 8,207 | 6,940 | 18.3% | 7,960 | 3.1% |
(Accumulated Amortization) | | (29,815) | (27,192) | 9.6% | (29,109) | 2.4% |
Total Assets | | 655,194 | 605,290 | 8.2% | 668,750 | -2.0% |
| | | | | | | |
| | | | | | | |
Goodwill (net of the amortization) | | 3,071 | 5,067 | -39.4% | 3,625 | -15.3% |
Total Assets (excluding goodwill) | | 652,123 | 600,223 | 8.6% | 665,125 | -2.0% |
| | | | | | | |
SANTANDER BRASIL RESULTS |
|
| | | | | | | |
LIABILITIES (R$ million) | | Jun/16 | Jun/15 | Var. | Mar/16 | Var. |
| | | Jun/16xJun/15 | | Jun/16xMar/16 |
| | | | | | |
Current Liabilities and Long Term Liabilities | | 593,035 | 541,233 | 9.6% | 608,360 | -2.5% |
Deposits | | 134,548 | 143,787 | -6.4% | 136,947 | -1.8% |
Demand Deposits | | 14,917 | 14,842 | 0.5% | 14,491 | 2.9% |
Savings Deposits | | 34,517 | 36,595 | -5.7% | 34,964 | -1.3% |
Interbank Deposits | | 2,601 | 3,008 | -13.5% | 2,444 | 6.4% |
Time Deposits | | 82,513 | 89,342 | -7.6% | 85,048 | -3.0% |
Money Market Funding | | 152,759 | 126,218 | 21.0% | 148,702 | 2.7% |
Own Portfolio | | 120,342 | 104,145 | 15.6% | 121,355 | -0.8% |
Third Parties | | 6,424 | 6,300 | 2.0% | 5,672 | 13.3% |
Free Portfolio | | 25,992 | 15,774 | 64.8% | 21,675 | 19.9% |
Funds from Acceptance and Issuance of Securities | | 100,247 | 90,496 | 10.8% | 96,863 | 3.5% |
Resources from Real Estate Credit Notes, Mortgage Notes, Credit and Similar | | 92,611 | 77,129 | 20.1% | 88,553 | 4.6% |
Funding from Certificates of Structured Operations | | 980 | 470 | 108.7% | 899 | 9.0% |
Securities Issued Abroad | | 5,732 | 11,910 | -51.9% | 6,443 | -11.0% |
Others | | 1,904 | 1,457 | 30.6% | 1,867 | 2.0% |
Interbank Accounts | | 1,651 | 1,573 | 4.9% | 1,276 | n.a. |
Interbranch Accounts | | 2,443 | 2,229 | 9.6% | 2,397 | 1.9% |
Borrowings | | 27,645 | 29,567 | -6.5% | 32,127 | -14.0% |
Domestic Onlendings - Official Institutions | | 15,934 | 15,737 | 1.3% | 16,082 | -0.9% |
Foreign Onlendings | | - | - | n.a. | - | n.a. |
Derivative Financial Instruments | | 18,049 | 12,676 | 42.4% | 14,297 | 26.2% |
Other Payables | | 139,760 | 118,948 | 17.5% | 159,669 | -12.5% |
Deferred Income | | 372 | 419 | -11.2% | 409 | -9.1% |
Minority Interest | | 1,938 | 1,906 | 1.6% | 1,928 | 0.5% |
Equity | | 59,850 | 61,732 | -3.0% | 58,053 | 3.1% |
Total Liabilities | | 655,194 | 605,290 | 8.2% | 668,750 | -2.0% |
| | | | | | | |
| | | | | | | |
Equity (excluding goodwill) | | 56,779 | 56,665 | 0.2% | 54,428 | 4.3% |
SECURITIES
Securities totaled R$ 149,988 million in June 2016, up 2.8% in twelve months and down 0.9% in three months.
| | | | | | | |
SECURITIES (R$ million) | | Jun/16 | Jun/15 | Var. | Mar/16 | Var. |
| | | Jun/16xJun/15 | | Jun/16xMar/16 |
| | | | | | |
Public securities | | 108,253 | 114,062 | -5.1% | 116,536 | -7.1% |
Private securities | | 18,336 | 18,802 | -2.5% | 17,785 | 3.1% |
Financial instruments | | 23,399 | 13,036 | 79.5% | 17,056 | 37.2% |
Total | | 149,988 | 145,900 | 2.8% | 151,377 | -0.9% |
| | | | | | | |
| SANTANDER BRASIL RESULTS |
CREDIT PORTFOLIO
The credit portfolio totaled R$ 244,284 million in June 2016, down 4.0% in twelve months (or R$ 10,119 million) and 1.6% in three months. In both comparisons, the variation of the Real against the Dollar impacted the foreign currency credit portfolio. Excluding the exchange rate variation impact, the credit portfolio would have decreased by 4.4% in twelve months and would have been stable in three months, a positive trend facing the actual macroeconomic environment..
The foreign currency credit portfolio, including dollar-indexed loans, totaled R$ 33,331 million in June 2016, down 15.3% on the R$ 39,354 million recorded in June 2015 and 18.1% lower on the R$ 40,711 million recorded in March 2016.
The expanded credit portfolio, which includes other credit risk transactions, acquiring activities and guarantees, ended June 2016 at R$ 308,377 million, down 4.0% in twelve months (or R$ 12,798 million) and 1.2% in three months. Excluding the exchange rate variation impact, the expanded credit portfolio would have decreased by 4.3% in twelve months and would have remained flat in three months.
As of 1Q16, aiming to further strengthen Santander’s commercial model, the segmentation of the corporate loan portfolio was altered with no impact, however, on the total credit portfolio. The new segmentation includes altering the SME and corporate segments, which now comprise, respectively, companies with annual revenues of up to R$ 200 million (previously up to R$ 80 million) and those with annual revenues of more than R$ 200 million (previously more than R$ 80 million). For comparison purposes, on April 11, 2016, we published the historical series of the loan portfolio including said change.
| | | | | | | |
MANAGERIAL BREAKDOWN OF CREDIT BY SEGMENT | | Jun/16 | Jun/15 | Var. | Mar/16 | Var. |
(R$ million) | | | | Jun/16xJun/15 | | Jun/16xMar/16 |
| | | | | | |
Individuals | | 86,826 | 81,534 | 6.5% | 85,593 | 1.4% |
Consumer Finance | | 31,961 | 35,338 | -9.6% | 32,708 | -2.3% |
SMEs | | 32,274 | 35,396 | -8.8% | 33,837 | -4.6% |
Corporate | | 93,222 | 102,135 | -8.7% | 96,133 | -3.0% |
Total portfolio | | 244,284 | 254,402 | -4.0% | 248,271 | -1.6% |
Other credit related transactions¹ | | 64,093 | 66,772 | -4.0% | 63,747 | 0.5% |
Total expanded credit portfolio | | 308,377 | 321,174 | -4.0% | 312,018 | -1.2% |
| | | | | | | |
1 - Includes Debenture, FIDC, CRI , Floating Rate Notes, Promissory Notes, acquiring activities related assets and guarantees. |
LOANS TO INDIVIDUALS Loans to individuals ended June 2016 at R$ 86,826 million, up 6.5% in twelve months (or R$ 5,292 million) and 1.4% in three months. The annual increase was driven by mortgage and payroll loans. The balance of mortgages reached R$ 26,970 million, up 11.3% intwelve months (or R$ 2,735 million) and 1.7% in three months. Payroll loans totaled R$ 16,654 million, up 26.2% intwelve months (or R$ 3,461 million) and 7.2% in three months. | | 
|
SANTANDER BRASIL RESULTS |
|
CONSUMER FINANCE
The consumer finance portfolio, which is originated outside the branch network, ended June 2016 at R$ 31,961 million, down 9.6% intwelvemonths (or R$ 3,377 million) and 2.3% in three months. Of this total, R$ 26,663 million refers to vehicle financing for individuals. Therefore, the total vehicle portfolio for individuals, including operations originated through car dealers and Santander’s branch network, amounted to R$ 28,750 million in June 2016, a decline of 10.3% in twelve months and 2.7% in three months, reflecting the macroeconomic scenario. However, it is worth noting that we had a better performance than the vehicle sector | |  |
CORPORATE AND SMEs
Corporate and SME loans ended June 2016at R$ 125,496 million, down 8.8% in twelve months (or R$ 12,034 million) and 3.4% in three months. The corporate loan portfolio came toR$ 93,222 million, down 8.7% in twelve months (or R$ 8,913 million) and 3.0% in three months.It is worth noting that the twelve-month drop was positively impacted by the exchange rate variation, while in the quarter the impact was negative. Excluding this effect, the portfolio would have fallen by 9.7% in twelve months and would have grown 0.5% in three months. Loans to SMEs totaled R$ 32,274 million in 2Q16, down 8.8% in twelve months (or R$ 3,121 million) and 4.6% in threemonths. Due to the new segmentation mentioned previously, this portfolio was also affected by the foreign exchange variation. Thus, excluding this effect, loans to SMEs fell by 9.0% and 3.9% in twelve and three months, respectively. | |  |
| SANTANDER BRASIL RESULTS |
INDIVIDUALS AND CORPORATE LOAN PORTFOLIO BY PRODUCT
| | | | | | | |
MANAGERIAL BREAKDOWN OF CREDIT | | Jun/16 | Jun/15 | Var. | Mar/16 | Var. |
PORTFOLIO BY PRODUCT (R$ million) | | | | Jun/16xJun/15 | | Jun/16xMar/16 |
| | | | | | |
Individuals | | | | | | |
Leasing / Auto Loans¹ | | 2,087 | 2,942 | -29.1% | 2,280 | -8.5% |
Credit Card | | 18,485 | 17,339 | 6.6% | 18,187 | 1.6% |
Payroll Loans | | 16,654 | 13,193 | 26.2% | 15,537 | 7.2% |
Mortgages | | 26,970 | 24,235 | 11.3% | 26,527 | 1.7% |
Agricultural Loans | | 3,258 | 3,423 | -4.8% | 3,593 | -9.3% |
Personal Loans / Others | | 19,372 | 20,402 | -5.0% | 19,469 | -0.5% |
Total Individuals | | 86,826 | 81,534 | 6.5% | 85,593 | 1.4% |
| | | | | | | |
Consumer Finance | | 31,961 | 35,338 | -9.6% | 32,708 | -2.3% |
| | | | | | | |
Corporate and SMEs | | | | | | |
Leasing / Auto Loans | | 2,794 | 3,060 | -8.7% | 2,833 | -1.4% |
Real Estate | | 10,585 | 10,531 | 0.5% | 10,605 | -0.2% |
Trade Finance | | 18,333 | 19,249 | -4.8% | 18,917 | -3.1% |
On-lending | | 14,702 | 12,711 | 15.7% | 16,615 | -11.5% |
Agricultural Loans | | 3,245 | 2,042 | 58.9% | 2,761 | 17.5% |
Working capital / Others | | 75,838 | 89,938 | -15.7% | 78,239 | -3.1% |
Total Corporate and SMEs | | 125,496 | 137,530 | -8.8% | 129,969 | -3.4% |
| | | | | | | |
Total Credit | | 244,284 | 254,402 | -4.0% | 248,271 | -1.6% |
Other Credit Risk Transactions with clients2 | | 64,093 | 66,772 | -4.0% | 63,747 | 0.5% |
| | | | | | | |
Total Expanded Credit Portfolio | | 308,377 | 321,174 | -4.0% | 312,018 | -1.2% |
| | | | | | | |
1. Including loans to individual in the consumer finance segment, auto loan portfolio totaled R$ 28,750 million in Jun/16, R$ 32,039 million in Jun/15 and R$ 29,543 million in Mar/16. |
2. Includes "debenture", FIDC, CRI, floating rate notes, promissory notes, acquiring activities related assets and guarantees. |
SANTANDER BRASIL RESULTS |
|
BALANCE OF ALLOWANCE FOR LOAN LOSSES / COVERAGE RATIO The balance of the allowance for loan losses totaled R$ 16,546 million in 2Q16, up 9.7% in twelve months and 0.9% in three months. In June 2016,the coverage ratio reached 209.3%., up 24.6 p.p. in twelve months and 9.2 p.p. in three months, showing a solid and comfortable position. | |  |
RENEGOTIATED PORTFOLIO
Credit renegotiations came to R$ 13,386 million in 1H16, up 4.8% intwelve months. These operations include loan agreements that were extended and/or amended to enable their receipt under conditions agreed upon with the customers, including the renegotiation of previously written-off loans. In the quarter, this portfolio grew by 3.4%.
In June 2016, 55.7% of the portfolio wasprovisioned, a level considered appropriate for these operations.
| | | | | | | |
RENEGOTIATED PORTFOLIO | | Jun/16 | Jun/15 | Var. | Mar/16 | Var. |
(R$ million) | | | | Jun/16xJun/15 | | Jun/16xMar/16 |
| | | | | | |
Renegotiated Portfolio | 13,386 | 12,775 | 4.8% | 12,946 | 3.4% |
Allowance for loan losses over renegotiated portfolio | (7,455) | (6,976) | 6.9% | (7,234) | 3.1% |
Coverage | | 55.7% | 54.6% | 1.1 p.p. | 55.9% | -0.2 p.p. |
| | | | | | | |
| SANTANDER BRASIL RESULTS |
DELINQUENCY RATIO (OVER 90 DAYS)
The over-90-day delinquency ratio reached 3.2% of the total credit portfolio, stable in twelve months and down 0.1 p.p. in three months. The delinquency ratio of the individual segment came to 4.4%, stable in twelve months and down 0.3 p.p. in three months. Delinquency in the corporate and SME segments was 2.2%, showing a decrease of 0.1 p.p. year-on-year and up 0.1 p.p. quarter-on-quarter. | |  |
DELINQUENCY RATIO (15-90 DAYS)
The 15-90 day delinquency ratio came to 5.5% in June 2016, up 1.0 p.p. in twelve months and 0.6 p.p. in three months. The quarterly increase was mainly due to one specific case in the largecorporate segment and does not reflect a general worsening of the segment. Asa result, the corporate segment grew 1.6 p.p. in twelve months and 1.2 p.p. in three months, totaling 4.2%. Meanwhile, individual delinquency was up 0.1 p.p. in twelve months and down 0.1 p.p. in three months. | |  |
SANTANDER BRASIL RESULTS |
|
FUNDING
Funding from clients ended June 2016 at R$ 287,840 million, up 4.5% intwelve months (or R$ 12,317 million) and 1.7% in three months. In both periods of comparison, the highlights were Debentures, Real Estate Credit Notes (LCI), Agribusiness Credit Notes (LCA) and Treasury Notes.
| | | | | | | |
FUNDING (R$ million) | | Jun/16 | Jun/15 | Var. | Mar/16 | Var. |
| | | Jun/16xJun/15 | | Jun/16xMar/16 |
| | | | | | |
Demand deposits | | 14,917 | 14,842 | 0.5% | 14,491 | 2.9% |
Saving deposits | | 34,517 | 36,595 | -5.7% | 34,964 | -1.3% |
Time deposits | | 82,513 | 89,342 | -7.6% | 85,048 | -3.0% |
Debenture/LCI/LCA¹ | | 90,584 | 83,729 | 8.2% | 86,486 | 4.7% |
Treasury Notes (Letras Financeiras)² | | 65,310 | 51,015 | 28.0% | 62,152 | 5.1% |
Funding from clients | | 287,840 | 275,524 | 4.5% | 283,141 | 1.7% |
| | | | | | | |
1. Debentures repurchase agreement, Real Estate Credit Notes (LCI) and Agribusiness Credit Notes (LCA). |
2. Includes Certificates of Structured Operations. |
CREDIT/FUNDING RATIO
The credit/funding ratio reached 84.9% in June 2016, down 7.5 p.p. in twelve months and 2.8 p.p. in three months.
The liquidity metric adjusted for the reserve requirements and medium/long term funding remained at 82.9% in June 2016.
The bank has a comfortable liquidity position and a stable and adequate funding structure.
| | | | | | |
FUNDING VS. CREDIT (R$ million) | | Jun/16 | Jun/15 | Var. | Mar/16 | Var. |
| | | Jun/16xJun/15 | | Jun/16xMar/16 |
| | | | | | |
Funding from clients (A) | | 287,840 | 275,524 | 4.5% | 283,141 | 1.7% |
(-) Reserve Requirements | | (59,499) | (32,687) | 82.0% | (55,555) | 7.1% |
Funding Net of Reserve Requirements | | 228,341 | 242,837 | -6.0% | 227,586 | 0.3% |
Borrowing and Onlendings | | 16,001 | 15,826 | 1.1% | 16,154 | -1.0% |
Subordinated Debts | | 16,863 | 15,460 | 9.1% | 17,380 | -3.0% |
Offshore Funding | | 33,310 | 41,387 | -19.5% | 38,498 | -13.5% |
Total Funding (B) | | 294,515 | 315,510 | -6.7% | 299,618 | -1.7% |
Assets under management¹ | | 223,903 | 178,318 | 25.6% | 213,191 | 5.0% |
Total Funding and Asset under management | | 518,418 | 493,828 | 5.0% | 512,809 | 1.1% |
Total Credit (C) | | 244,284 | 254,402 | -4.0% | 248,271 | -1.6% |
C / B (%) | | 82.9% | 80.6% | | 82.9% | |
| | | | | | | |
C / A (%) | | 84.9% | 92.3% | | 87.7% | |
| | | | | | | |
1 - According to Anbima criterion. |
| SANTANDER BRASIL RESULTS |
BIS RATIO
The BIS ratio reached 17.7% in 1H16, down 0.4 p.p. in twelve months and up 1.3 p.p. in three months. CET1 came to 15.3%, down 0.2 p.p. in twelve months and up 1.5 p.p. in three months. The three-month upturn in the ratio was mainly due to: (i) the increase in equity, chiefly due to period profits, the improved unrealized result of securities available for sale and reduced tax credits and (ii) the reduction in market risk RWA due to lower foreign exchange exposure. | | 
1From 2015 on, considers the prudential conglomerate. |
It is important to note that as of January 2016, as per National Monetary Council Resolution 4,193/2013, capital requirement was altered from 11% to 9.875% + capital conservation of 0.625%, totalling 10.5%. For Tier I Capital, it comes to 6% and for CET1, 4.5%.
| | | | | | | |
OWN RESOURCES AND BIS (R$ million) | | Jun/16 | Jun/15 | Var. | Mar/16 | Var. |
| | | Jun/16xJun/15 | | Jun/16xMar/16 |
| | | | | | |
Tier I Regulatory Capital | | 57,317 | 61,411 | -6.7% | 54,005 | 6.1% |
CET1 | | 53,252 | 57,483 | -7.4% | 49,498 | 7.6% |
Additional Tier I | | 4,065 | 3,928 | 3.5% | 4,507 | -9.8% |
Tier II Regulatory Capital | | 4,215 | 5,573 | -24.4% | 4,667 | -9.7% |
Adjusted Regulatory Capital (Tier I and II) | | 61,532 | 66,984 | -8.1% | 58,672 | 4.9% |
Risk Weighted Assets (RWA) | | 347,476 | 370,864 | -6.3% | 357,112 | -2.7% |
Required Regulatory Capital | | 34,313 | 40,795 | -15.9% | 35,265 | -2.7% |
Adjusted Credit Risk Capital requirement | | 30,370 | 35,517 | -14.5% | 30,566 | -0.6% |
Market Risk Capital requirement | | 2,286 | 3,229 | -29.2% | 3,042 | -24.8% |
Operational Risk Capital requirement | | 1,657 | 2,049 | -19.1% | 1,657 | 0.0% |
Basel Ratio | | 17.7% | 18.1% | -0.4 p.p. | 16.4% | 1.3 p.p. |
Tier I | | 16.5% | 16.6% | -0.1 p.p. | 15.1% | 1.4 p.p. |
CET1 | | 15.3% | 15.5% | -0.2 p.p. | 13.9% | 1.5 p.p. |
Tier II | | 1.2% | 1.5% | -0.3 p.p. | 1.3% | -0.1 p.p. |
| | | | | | | |
OUR SHARES |
|
CORPORATE GOVERNANCE With a free float of 10.5%, Santander Brasil is listed on the traditional trading segment of the Bolsa de Valores, Mercadorias e Futuros S.A. (BM&FBovespa). Despite the lower level of requirements of this segment, the Bank maintains bestcorporate governance practices such as the holding of periodic meetings with the market, the disclosure of information on its Investor Relations website, a level of 20% of independent members on the Board of Directors, among others. | | 
|
SIMPLIFIED OWNERSHIP STRUCTURE
Santander’s ownership structure in June 30th, 2016 was as follows:
| | | | | | | | |
OWNERSHIP STRUCTURE | Common shares | % | Preferred shares | % | Total share capital (thousand) | Total % | |
(thousand) | (thousand) | |
| | | | | | | | |
Santander Group ¹ | 3,442,657 | 89.4% | 3,275,993 | 88.3% | 6,718,650 | 88.8% | |
Treasury Shares | 24,506 | 0.6% | 24,506 | 0.7% | 49,012 | 0.6% | |
Free Float | 383,808 | 10.0% | 411,612 | 11.1% | 795,420 | 10.5% | |
Total | 3,850,971 | 100.0% | 3,712,112 | 100.0% | 7,563,082 | 100.0% | |
| | | | | | | |
1- Includes shareholding of Grupo Empresarial Santander, S.L. ; Sterrebeeck B.V. and Santander Insurance Holding, S.L., as well the administrators. |
PERFORMANCE
In the second quarter of 2016, Santander Brasil declared IOC of R$500 million, which will be paid as of August 26th, 2016.
| | | | | | | |
SANB11 | | 1H16 | 1H15 | Var. 1H16x1H15 | 2Q16 | 1Q16 | Var. 2Q16x1Q16 |
| | | | | | | |
Earnings (annualized) per unit (R$) | | 1.85 | 1.75 | 5.2% | 1.92 | 1.77 | 8.9% |
Dividend + Interest on capital per unit¹ (R$) | | 0.13 | 0.04 | n.a. | 0.13 | 0.00 | n.a |
Closing price (R$)1 | | 18.2 | 16.9 | 7.4% | 18.2 | 17.0 | 7.3% |
Book Value per unit (R$)2 | | 15.1 | 14.2 | 6.5% | 15.1 | 14.5 | 4.4% |
Market Capitalization(R$ bi)3 | | 68.3 | 63.8 | 7.1% | 68.3 | 63.7 | 7.2% |
1 - Closing price refers to historical serie. |
2 - Book Value calculation excludes the goodwill. |
3 - Market capitalization: total Units (Unit = 1 ON + 1 PN) x last Unit's price. |
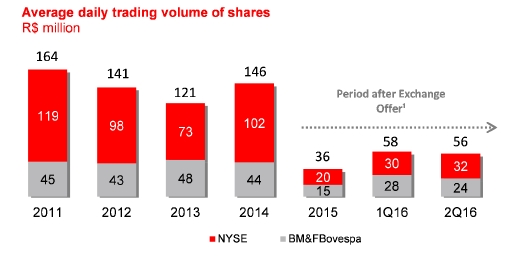
 ¹ Voluntary tender offer concluded on October 30, 2014.
| RATINGS |
RATINGS AGENCIES
Santander is rated by international rating agencies and the ratings it receives reflect several factors, including the quality of its management, its operating performance and financial strength, and other factors related to the financial sector and the economic environment in which the company is inserted, with the long-term foreign currency rating limited to the sovereign rating.The table below presents the ratings assigned by the main rating agencies.
| | | Global Scale | | National Scale |
| RATINGS | | |
| | | | | | | | | |
| | | | Local Currency | Foreign Currency | | National |
| Rating Agency | | Long Term | Short Term | Long Term | Short Term | | Long Term | Short Term |
| | | | | | | | | |
| Fitch Ratings (outlook) | | BBB- (negative) | F3 | BB+ (negative) | B | | AAA (bra) (stable) | F1+ (bra) |
| | |
| | |
| | | | | | | | | |
| Standard & Poor’s (outlook) | | BB (negative) | B | BB (negative) | B | | brAA- (negative) | brA-1 |
| | |
| | |
| | | | | | | | | |
| Moody's (outlook) | | Ba1 (negative) | NP | Ba3 (negative) | NP | | Aaa.br (negative) | BR-1 |
| | |
| | |
| | | | | | | | | | |
Ratings assigned according published reports by Rating Agencies. |
ADDITIONAL INFORMATION – BALANCE SHEET AND MANAGERIAL INCOME STATEMENTS |
|
BALANCE SHEET
| | | | | | | |
ASSETS (R$ million) | | Jun/16 | Mar/16 | Dec/15 | Sep/15 | Jun/15 |
| | | | | |
| | | | | | |
Current Assets and Long Term Assets | | 642,337 | 655,329 | 663,809 | 689,054 | 591,269 |
Cash and Cash Equivalents | | 5,209 | 5,463 | 6,864 | 6,928 | 5,525 |
Interbank Investments | | 64,278 | 51,481 | 55,810 | 59,264 | 56,850 |
Money Market Investments | | 47,349 | 31,838 | 31,990 | 29,933 | 32,452 |
Interbank Deposits | | 2,446 | 2,248 | 1,989 | 2,341 | 2,270 |
Foreign Currency Investments | | 14,482 | 17,395 | 21,831 | 26,989 | 22,129 |
Securities and Derivative Financial Instrument | | 149,988 | 151,377 | 142,892 | 154,262 | 145,900 |
Own Portfolio | | 42,820 | 30,072 | 36,311 | 29,891 | 38,403 |
Subject to Repurchase Commitments | | 65,301 | 82,498 | 58,961 | 72,895 | 70,536 |
Posted to Central Bank of Brazil | | 4,432 | 6,712 | 6,216 | 8,541 | 9,991 |
Pledged in Guarantees | | 14,032 | 15,036 | 15,390 | 16,330 | 13,930 |
Others | | 23,402 | 17,059 | 26,013 | 26,604 | 13,039 |
Interbank Accounts | | 61,478 | 57,101 | 55,303 | 52,224 | 34,689 |
Restricted Deposits: | | 59,667 | 55,724 | 55,266 | 50,392 | 32,856 |
-Central Bank of Brazil | | 59,499 | 55,555 | 55,096 | 50,221 | 32,687 |
-National Housing System | | 168 | 169 | 170 | 171 | 169 |
Others | | 1,810 | 1,376 | 37 | 1,832 | 1,833 |
Interbranch Accounts | | - | - | - | - | - |
Lending Operations | | 227,906 | 232,145 | 244,460 | 246,648 | 239,445 |
Lending Operations | | 244,290 | 248,360 | 261,083 | 262,050 | 254,523 |
Lending Operations Related to Assignment | | 162 | 181 | 209 | 203 | 2 |
(Allowance for Loan Losses) | | (16,546) | (16,396) | (16,832) | (15,605) | (15,080) |
Other Receivables | | 130,637 | 154,830 | 155,993 | 167,419 | 106,410 |
Foreign Exchange Portfolio | | 70,859 | 93,784 | 91,855 | 101,360 | 55,772 |
Tax Credits | | 26,701 | 30,085 | 33,988 | 32,457 | 23,308 |
Others | | 33,077 | 30,961 | 30,150 | 33,601 | 27,330 |
Others Assets | | 2,842 | 2,932 | 2,486 | 2,310 | 2,449 |
Permanent Assets | | 12,857 | 13,420 | 13,645 | 13,353 | 14,021 |
Investments | | 164 | 164 | 68 | 38 | 38 |
Fixed Assets | | 6,825 | 6,915 | 6,986 | 6,733 | 6,707 |
Intangibles | | 5,868 | 6,341 | 6,591 | 6,581 | 7,276 |
Goodwill | | 27,475 | 27,490 | 27,490 | 27,527 | 27,527 |
Intangible Assets | | 8,207 | 7,960 | 7,751 | 6,934 | 6,940 |
(Accumulated Amortization) | | (29,815) | (29,109) | (28,649) | (27,881) | (27,192) |
Total Assets | | 655,194 | 668,750 | 677,454 | 702,407 | 605,290 |
| | | | | | | |
| ADDITIONAL INFORMATION – BALANCE SHEET AND MANAGERIAL INCOME STATEMENTS |
| | | | | | | |
LIABILITIES (R$ million) | | Jun/16 | Mar/16 | Dec/15 | Sep/15 | Jun/15 |
| | | | | |
| | | | | | |
Current Liabilities and Long Term Liabilities | | 593,035 | 608,360 | 620,293 | 642,458 | 541,233 |
Deposits | | 134,548 | 136,947 | 141,886 | 145,585 | 143,787 |
Demand Deposits | | 14,917 | 14,491 | 15,698 | 18,521 | 14,842 |
Savings Deposits | | 34,517 | 34,964 | 35,985 | 35,540 | 36,595 |
Interbank Deposits | | 2,601 | 2,444 | 3,675 | 3,402 | 3,008 |
Time Deposits | | 82,513 | 85,048 | 86,528 | 88,121 | 89,342 |
Money Market Funding | | 152,759 | 148,702 | 134,960 | 138,758 | 126,218 |
Own Portfolio | | 120,342 | 121,355 | 104,218 | 110,909 | 104,145 |
Third Parties | | 6,424 | 5,672 | 10,828 | 11,605 | 6,300 |
Free Portfolio | | 25,992 | 21,675 | 19,915 | 16,243 | 15,774 |
Funds from Acceptance and Issuance of Securities | | 100,247 | 96,863 | 99,848 | 99,202 | 90,496 |
Resources from Real Estate Credit Notes, Mortgage Notes, Credit and Similar | | 92,611 | 88,553 | 84,607 | 81,786 | 77,129 |
Securities Issued Abroad | | 5,732 | 6,443 | 13,472 | 15,778 | 11,910 |
Others | | 1,904 | 1,867 | 1,769 | 1,639 | 1,457 |
Interbank Accounts | | 1,651 | 1,276 | 14 | 1,626 | 1,573 |
Interbranch Accounts | | 2,443 | 2,397 | 3,818 | 2,617 | 2,229 |
Borrowings | | 27,645 | 32,127 | 36,762 | 39,384 | 29,567 |
Domestic Onlendings - Official Institutions | | 15,934 | 16,082 | 16,263 | 14,767 | 15,737 |
National Economic and Social Development Bank (BNDES) | | 8,129 | 7,900 | 7,886 | 6,367 | 6,817 |
National Equipment Financing Authority (FINAME) | | 7,543 | 7,892 | 8,045 | 8,064 | 8,646 |
Other Institutions | | 262 | 289 | 332 | 337 | 274 |
Foreign Onlendings | | - | - | - | - | - |
Derivative Financial Instruments | | 18,049 | 14,297 | 22,883 | 29,870 | 12,676 |
Other Payables | | 139,760 | 159,669 | 163,859 | 170,650 | 118,948 |
Foreign Exchange Portfolio | | 66,533 | 88,552 | 89,330 | 99,537 | 54,993 |
Tax and Social Security | | 11,863 | 11,705 | 10,537 | 10,695 | 10,776 |
Subordinated Debts | | 8,675 | 8,379 | 8,097 | 7,818 | 7,546 |
Debt Instruments Eligible to Compose Capital | | 8,188 | 9,001 | 9,962 | 10,046 | 7,914 |
Others | | 44,502 | 42,032 | 45,932 | 42,552 | 37,718 |
Deferred Income | | 372 | 409 | 385 | 396 | 419 |
Minority Interest | | 1,938 | 1,928 | 1,956 | 1,951 | 1,906 |
Equity | | 59,850 | 58,053 | 54,819 | 57,602 | 61,732 |
Total Liabilities | | 655,194 | 668,750 | 677,454 | 702,407 | 605,290 |
| | | | | | | |
ADDITIONAL INFORMATION – BALANCE SHEET AND MANAGERIAL INCOME STATEMENTS |
|
SUMMARIZED MANAGERIAL FINANCIAL STATEMENT
MANAGERIAL FINANCIAL STATEMENT¹ (R$ million) | | | | | | | |
| 2Q16 | 1Q16 | 4Q15 | 3Q15 | 2Q15 | 1Q15 |
| | | | | | |
| | | | | | | |
Net Interest Income | | 7,808 | 7,599 | 7,384 | 7,631 | 7,480 | 7,140 |
Allowance for Loan Losses | | (2,515) | (2,424) | (2,762) | (2,448) | (2,338) | (2,112) |
Net Interest Income after Loan Losses | | 5,293 | 5,175 | 4,622 | 5,183 | 5,142 | 5,028 |
Fee and commission income | | 3,328 | 3,090 | 3,210 | 2,919 | 2,910 | 2,828 |
General Expenses | | (4,424) | (4,410) | (4,632) | (4,288) | (4,300) | (4,103) |
Personnel Expenses + Profit Sharing | | (2,082) | (2,132) | (2,202) | (2,054) | (1,962) | (1,861) |
Administrative Expenses² | | (2,341) | (2,278) | (2,430) | (2,234) | (2,337) | (2,242) |
Tax Expenses | | (823) | (817) | (784) | (770) | (889) | (929) |
Investments in Affiliates and Subsidiaries | | 0 | 0 | 0 | 0 | 0 | 1 |
Other Operating Income/Expenses | | (1,185) | (1,197) | (802) | (844) | (925) | (802) |
Operating Profit | | 2,190 | 1,841 | 1,614 | 2,201 | 1,938 | 2,022 |
Non Operating Income | | (5) | 25 | (21) | 21 | 39 | 78 |
Net Profit before Tax | | 2,186 | 1,866 | 1,593 | 2,222 | 1,977 | 2,100 |
Income Tax and Social Contribution | | (323) | (204) | 55 | (431) | (293) | (408) |
Minority Interest | | (56) | (2) | (40) | (82) | (9) | (60) |
Net Profit | | 1,806 | 1,660 | 1,607 | 1,708 | 1,675 | 1,633 |
| | | | | | | | |
1. Excludes 100% of the goodwill amortization expense, the tax hedge effect and others as mentioned on pages 24 and 25. |
2. Administrative Expenses exclude 100% of the goodwill amortization expense. |
Under Brazilian income tax rules, gains (losses) resulting from the exchange rate variation on foreign currency investments are not taxable (tax deductible). This tax treatment leads to foreign exchange rate exposure in the tax line. A hedge position was set up in order to immunize the net profit from the impact of the foreign exchange variation on the income tax and tax expenses lines.
| | | | | | | | |
EXCHANGE HEDGE (R$ million) | | 2Q16 | 1Q16 | 4Q15 | 3Q15 | 2Q15 | 1Q15 |
| | | | | | |
| | | | | | | |
Net Interest Income | | 3,648 | 3,434 | 665 | (8,358) | 882 | (4,721) |
Tax Expenses | | (357) | (336) | (65) | 871 | (96) | 513 |
Income Tax | | (3,292) | (3,098) | (600) | 7,487 | (786) | 4,208 |
| ACCOUNTING AND MANAGERIAL RESULTS RECONCILIATION |
ACCOUNTING AND MANAGERIAL RESULTS RECONCILIATION
In order to ensure a better understanding of the results in BR GAAP, we present below the reconciliation of the managerial result with the accounting result. It is worth noting that these adjustments, with the exception of the amortization of goodwill and the non-recurring items,have no effect on net profit.
| | | | | | | | | | |
| | 6M16 | Reclassifications | Others Events5 | 6M16 |
ACCOUNTING AND MANAGERIAL RESULTS RECONCILIATION (R$ million) | | Accounting | Exchange Hedge¹ | Credit Recovery² | Amortization of goodwill³ | Profit Sharing | Foreign exchange variation/Others4 | Managerial |
| | | | | | | | | |
NET INTEREST INCOME | | 23,108 | 7,082 | 1,401 | - | - | (782) | | 15,408 |
Allowance for Loan Losses | | (5,753) | - | (1,401) | - | - | 587 | | (4,940) |
NET INTEREST INCOME AFTER LOAN LOSSES | | 17,355 | 7,082 | - | - | - | (195) | | 10,468 |
Fee and commission income | | 6,419 | - | - | - | - | - | | 6,419 |
General Expenses | | (9,126) | - | - | (906) | 614 | - | | (8,834) |
Personnel Expenses + Profit Sharing | | (3,600) | - | - | - | 614 | - | | (4,214) |
Administrative Expenses | | (5,526) | - | - | (906) | - | - | | (4,620) |
Tax Expenses | | (2,332) | (692) | - | - | - | - | | (1,640) |
Investments in Affiliates and Subsidiaries | | 1 | - | - | - | - | - | | 1 |
Other Operating Income/Expenses | | (2,188) | - | - | - | - | 195 | | (2,383) |
OPERATING INCOME | | 10,129 | 6,390 | - | (906) | 614 | 0 | | 4,031 |
Non Operating Income | | 21 | - | - | - | - | - | | 21 |
NET PROFIT BEFORE TAX | | 10,150 | 6,390 | - | (906) | 614 | 0 | | 4,052 |
Income Tax | | (6,917) | (6,390) | - | - | - | - | | (527) |
Profit Sharing | | (614) | - | - | - | (614) | - | | - |
Minority Interest | | (58) | - | - | - | - | - | | (58) |
NET PROFIT | | 2,560 | - | - | (906) | - | 0 | | 3,466 |
| | | | | | | | | |
| | | | | | | | | | |
| | 6M15 | Reclassifications | Others Events5 | 6M15 |
ACCOUNTING AND MANAGERIAL RESULTS RECONCILIATION (R$ million) | | Accounting | Exchange Hedge¹ | Credit Recovery² | Amortization of goodwill³ | Profit Sharing | Foreign exchange variation | Managerial |
| | | | | | | |
| |
NET INTEREST INCOME | | 12,030 | (3,838) | 1,085 | - | - | 575 | (411) | 14,620 |
Allowance for Loan Losses | | (6,324) | - | (1,085) | - | - | (237) | (552) | (4,450) |
NET INTEREST INCOME AFTER LOAN LOSSES | | 5,705 | (3,838) | - | - | - | 338 | (963) | 10,170 |
Fee and commission income | | 5,738 | - | - | - | - | - | - | 5,738 |
General Expenses | | (9,770) | - | - | (1,900) | 533 | - | - | (8,403) |
Personnel Expenses + Profit Sharing | | (3,291) | - | - | - | 533 | - | - | (3,823) |
Administrative Expenses | | (6,479) | - | - | (1,900) | - | - | - | (4,580) |
Tax Expenses | | (1,123) | 417 | - | - | - | - | 278 | (1,818) |
Investments in Affiliates and Subsidiaries | | 1 | - | - | - | - | - | - | 1 |
Other Operating Income/Expenses | | 3,974 | - | - | - | - | (338) | 6,039 | (1,727) |
OPERATING INCOME | | 4,525 | (3,421) | - | (1,900) | 533 | - | 5,354 | 3,960 |
Non Operating Income | | 117 | - | - | - | - | - | - | 117 |
NET PROFIT BEFORE TAX | | 4,643 | - 3,421 | - | (1,900) | 533 | - | 5,354 | 4,078 |
Income Tax | | 523 | 3,421 | - | - | - | - | (2,197) | (701) |
Profit Sharing | | (533) | - | - | - | (533) | - | - | 0 |
Minority Interest | | (69) | - | - | - | - | - | - | (69) |
NET PROFIT | | 4,565 | - | - | (1,900) | - | - | 3,157 | 3,308 |
| | | | | | | | | |
| ACCOUNTING AND MANAGERIAL RESULTS RECONCILIATION |
|
| | | | | | | | | | |
| | 2Q16 | Reclassifications | Others Events5 | 2Q16 |
ACCOUNTING AND MANAGERIAL RESULTS RECONCILIATION (R$ million) | | Accounting | Exchange Hedge¹ | Credit Recovery² | Amortization of goodwill³ | Profit Sharing | Foreign exchange variation | Managerial |
| | | | | | | | | |
NET INTEREST INCOME | | 11,973 | 3,648 | 797 | - | - | (281) | | 7,808 |
Allowance for Loan Losses | | (3,136) | - | (797) | - | - | 176 | | (2,515) |
NET INTEREST INCOME AFTER LOAN LOSSES | | 8,837 | 3,648 | - | - | - | (105) | | 5,293 |
Fee and commission income | | 3,328 | - | - | - | - | - | | 3,328 |
General Expenses | | (4,586) | - | - | (459) | 296 | - | | (4,424) |
Personnel Expenses + Profit Sharing | | (1,787) | - | - | - | 296 | - | | (2,082) |
Administrative Expenses | | (2,800) | - | - | (459) | - | - | | (2,341) |
Tax Expenses | | (1,179) | (357) | - | - | - | - | | (823) |
Investments in Affiliates and Subsidiaries | | 0 | - | - | - | - | - | | 0 |
Other Operating Income/Expenses | | (1,080) | - | - | - | - | 105 | | (1,185) |
OPERATING INCOME | | 5,319 | 3,292 | - | (459) | 296 | - | | 2,190 |
Non Operating Income | | (5) | - | - | - | - | - | | (5) |
NET PROFIT BEFORE TAX | | 5,314 | 3,292 | - | (459) | 296 | - | | 2,186 |
Income Tax | | (3,615) | (3,292) | - | - | - | - | | (323) |
Profit Sharing | | (296) | - | - | - | (296) | - | | - |
Minority Interest | | (56) | - | - | - | - | - | | (56) |
NET PROFIT | | 1,347 | - | - | (459) | - | - | | 1,806 |
| | | | | | | | | |
| | | | | | | | | | |
| | 1Q16 | Reclassifications | Others Events5 | 1Q16 |
ACCOUNTING AND MANAGERIAL RESULTS RECONCILIATION (R$ million) | | Accounting | Exchange Hedge¹ | Credit Recovery² | Amortization of goodwill³ | Profit Sharing | Foreign exchange variation/Others4 | Managerial |
| | | | | | | | | |
NET INTEREST INCOME | | 11,135 | 3,434 | 604 | - | - | (501) | | 7,599 |
Allowance for Loan Losses | | (2,617) | - | (604) | - | - | 411 | | (2,424) |
NET INTEREST INCOME AFTER LOAN LOSSES | | 8,518 | 3,434 | - | - | - | (90) | | 5,175 |
Fee and commission income | | 3,090 | - | - | - | - | - | | 3,090 |
General Expenses | | (4,539) | - | - | (447) | 318 | - | | (4,410) |
Personnel Expenses + Profit Sharing | | (1,813) | - | - | - | 318 | - | | (2,132) |
Administrative Expenses | | (2,726) | - | - | (447) | - | - | | (2,278) |
Tax Expenses | | (1,153) | (336) | - | - | - | - | | (817) |
Investments in Affiliates and Subsidiaries | | 0 | - | - | - | - | - | | 0 |
Other Operating Income/Expenses | | (1,107) | - | - | - | - | 90 | | (1,197) |
OPERATING INCOME | | 4,810 | 3,098 | - | (447) | 318 | 0 | | 1,841 |
Non Operating Income | | 25 | - | - | - | - | - | | 25 |
NET PROFIT BEFORE TAX | | 4,835 | 3,098 | - | (447) | 318 | 0 | | 1,866 |
Income Tax | | (3,302) | (3,098) | - | - | - | - | | (204) |
Profit Sharing | | (318) | - | - | - | (318) | - | | 0 |
Minority Interest | | (2) | - | - | - | - | - | | (2) |
NET PROFIT | | 1,213 | - | - | (447) | - | 0 | | 1,660 |
| | | | | | | | | |
1.Exchange Hedge: For more details, see page 23.
2.Credit Recovery:Reclassified from revenue from loan operations to the allowance for loan losses.
3.Amortization of Goodwill:Reversal of goodwill amortization expenses.
| ACCOUNTING AND MANAGERIAL RESULTS RECONCILIATION |
4.Exchange rate variation/other:This also includes, in addition to the effect of exchange rate changes, reclassifications between results lines (net interest income, income from the allowance for loan losses, other operating income/expenses and non-operating income) for better comparability with previous quarters.
5.Others:
a) Net interest income: adjustment to the appreciation of assets corresponding to the impairment of securities.
b) Allowance for loan losses: complementary provisions recorded and isolated impacts from large companies.
c) Tax Expenses: reversal of the upgrade of the Cofins provision for the year 2015.
d) Other operating income/expenses: reversal of Cofins tax provisions totaling R$7.7 billion; the impairment of software, amounting to R$363 million, due to systems obsolescence and discontinuity; the impairment of payroll assets totaling R$534 million; and provisions for civil and tax contingencies amounting to R$735 million.

SIGNATURE
Pursuant to the requirements of the Securities Exchange Act of 1934, the Registrant has duly caused this report to be signed on its behalf by the undersigned, thereto duly authorized.
Date: July 27, 2016
Banco Santander (Brasil) S.A. |
| | |
| By: | /S/ Amancio Acurcio Gouveia
| |
| | Amancio Acurcio Gouveia
Officer Without Specific Designation
| |
| | |
|
| | |
| By: | /S/ Angel Santodomingo Martell
| |
| | Angel Santodomingo Martell
Vice - President Executive Officer
| |