SECURITIES AND EXCHANGE COMMISSION
Commission File Number: 001-34476
Bloco A – Vila Olimpia
São Paulo, SP 04543-011
Federative Republic of Brazil
Indicate by check mark if the registrant is submitting the Form 6-K in paper as permitted by Regulation S-T Rule 101(b)(1):
Yes _______ No ___X____
Indicate by check mark if the registrant is submitting the Form 6-K in paper as permitted by Regulation S-T Rule 101(b)(7):
Yes _______ No ___X____
Indicate by check mark whether by furnishing the information contained in this Form, the Registrant is also thereby furnishing the information to the Commission pursuant to Rule 12g3-2(b) under the Securities Exchange Act of 1934:
Yes _______ No ___X____
If “Yes” is marked, indicate below the file number assigned to the registrant in connection with Rule 12g3-2(b): N/A
(Free Translation into English from the Original Previously Issued in Portuguese) | |||
| BANCO SANTANDER (BRASIL) S.A. AND SUBSIDIARIES SUMMARY OF FINANCIAL STATEMENTS | |||
(Free Translation into English from the Original Previously Issued in Portuguese) | |||
| BANCO SANTANDER (BRASIL) S.A. AND SUBSIDIARIES | |||
| MANAGEMENT REPORT | |||
Dear Stockholders: | ||||||||||||||||
We present the Management Report to Individual and Consolidated Financial Statements of Banco Santander (Brasil) S.A. (Banco Santander or Bank) related to the fiscal year ended December 31, 2016, prepared in accordance with accounting practices set by Brazilian Corporate Law, the standards of the National Monetary Council (CMN), the Central Bank of Brazil (Bacen) and document template provided in the Accounting National Financial System Institutions (Cosif) and the Exchange Commission (CVM), that does not conflict with the rules of Bacen. | ||||||||||||||||
The consolidated financial statements in accordance with the International Accounting Standards Board (IASB) for the fiscal year ended December 31, 2016, will be disclosed within the legal deadline, on the website www.santander.com.br/ri. | ||||||||||||||||
1) Macroeconomic Environment | ||||||||||||||||
In the last three months of the year 2016, the relationship between the Real and the Dollar hovered around the level of BRL 3.30/USD, without indicating a clear trend. After a clear appreciation movement during the first half of 2016, the exchange rate closed December at BRL 3.26/USD, near to the value of BRL 3.25/USD registered in the third quarter. The optimistic view regarding the domestic economic and the decrease of risk perception, which favored the BRL appreciation, lost momentum in the last quarter of 2016. This was mainly due to the interest rate increase in the United States (and the expectation of further increases) and the recent economic indicators in Brazil, which suggested that the beginning of economic activity rebound will be postponed to later in 2017. | ||||||||||||||||
With this context, the environment for banking activity in Brazil remains challenging. The labor market, for example, is still deteriorating and precarious, a fact that can be verified by the fast rise in the unemployment rate, which reached 12.4% in November in the seasonally adjusted series, according to Banco Santander estimates. | ||||||||||||||||
Further relief should come from monetary policy. After a further cut (0.75%) in the Selic rate in January 2017 (which was reduced to 13.0%), the Bank expects that the Bank will continue the process of monetary easing in the coming years, with a view to improving the inflationary situation, the anchoring of inflation expectations and the evolution of the approval of fiscal adjustment measures by the government. Signs of Bacen in recent official documents reinforce this perception. Regarding fiscal policy, despite the positive effects that the recovery of the activity should exert on the tax collection in 2017, the results should continue to be deficient in the coming years. The reforms already proposed by the government and those expected for the coming months are aimed at stabilizing debt in the long term. | ||||||||||||||||
In this scenario, in November 2016 the total credit portfolio intensified the decline in the YoY comparison, decreasing 2.3% compared to the same month of the previous year. This decrease was mainly due to non-earmarked credit, which declined by 4.1%, while credit with directed resources also contracted in the same period, but with less intensity (approximately 0.4%). Even the portfolio of public banks, which grew at a rate above 10% in 2015, showed a YoY comparison in November (1.5%). Conservative concessions on the part of public and private banks, caution in consumer borrowing and high indebtedness of households and companies are factors that must maintain this downward trend in credit over the coming months. However, if the fall expected by the Bank in the course of 2017 to take place (Banco Santander's projection is that the benchmark interest rate will decline to 9.75% by the end of 2017), and consumer confidence will resume Its recovery trajectory (interrupted by the increase in the volatility of the external scenario and some disappointment with the economic indicators for the third quarter), the Bank believes that credit should accelerate again in 2017. | ||||||||||||||||
2) Performance | ||||||||||||||||
2.1) Net Income | ||||||||||||||||
2.1.1) Corporate Net Income | ||||||||||||||||
|
|
|
|
|
|
|
|
|
|
|
|
|
|
|
|
|
CONSOLIDATED INCOME STATEMENTS |
| 12M16 |
| 12M15 |
| annual |
| 4Q16 |
| 3Q16 |
| 4Q16 vs. 3Q16 | ||||
Financial Income |
|
|
| 85,909.6 |
| 80,766.2 |
| 6.4 |
| 20,319.6 |
| 22,195.1 |
| -8.5 | ||
Financial Expenses | (59,111.7) | (74,729.0) | 20.9 | (15,953.1) | (17,118.9) | 6.8 | ||||||||||
Gross Profit From Financial Operations(1) | 26,797.9 | 6,037.2 | 343.9 | 4,366.5 | 5,076.2 | -14.0 | ||||||||||
Other Operating (Expenses) Income(1) (3) | (13,018.9) | (6,414.6) | -103.0 | (2,666.8) | (3,125.9) | 14.7 | ||||||||||
|
| |||||||||||||||
Operating Income | 13,778.9 | (377.4) | 3,751.0 | 1,699.7 | 1,950.3 | -12.8 | ||||||||||
|
| |||||||||||||||
Non-Operating Income | (415.6) | 566.4 | -173.4 | (455.3) | 19.1 | -2483.8 | ||||||||||
|
| |||||||||||||||
Income Before Taxes on Income and Profit Sharing | 13,363.3 | 189.0 | 6,970.5 | 1,244.4 | 1,969.4 | -36.8 | ||||||||||
|
| |||||||||||||||
Income Tax and Social Contribution(3) | (6,496.7) | 8,261.1 | -178.6 | 537.9 | (117.4) | 558.2 | ||||||||||
Profit Sharing | (1,208.8) | (1,260.4) | 4.1 | (261.8) | (332.9) | 21.4 | ||||||||||
Minority Interest | (124.8) | (191.4) | 34.8 | 17.0 | (83.6) | 120.3 | ||||||||||
|
| |||||||||||||||
CONSOLIDATED NET INCOME | 5,533.0 | 6,998.3 | -20.9 | 1,537.5 | 1,435.5 | 7.1 | ||||||||||
|
| |||||||||||||||
Excludes goodwill amortizations expenses(2) | 1,805.6 | 2,782.1 | -35.1 | 451.4 | 448.1 | 0.7 | ||||||||||
|
| |||||||||||||||
NET INCOME EXCLUDING GOODWILL AMORTIZATION | 7,338.6 |
| 9,780.4 |
| -25.0 |
| 1,988.9 |
| 1,883.6 |
| 5.6 | |||||
1
Main events of the Statement of Income between the year of 2016 and 2015: | |||||||||||
1)Hedge of the foreign investments - The Bank operates a branch in the Cayman Islands and Santander EFC which are used primarily for sourcing funds in the international banking and capital markets to provide credit lines, which are extended to our customers for working capital and trade-related financings. To protect the exposures in exchange rate variations, the Bank uses derivatives. Under Brazilian income tax rules, the gains or losses resulting from the impact of appreciation or devaluation for the real in foreign investments is nontaxable for PIS/COFINS/IR/CSLL purposes, while gains or losses from derivatives used as hedges are taxable. The purpose of these derivatives is to protect the after-tax results. | |||||||||||
The different tax treatment of such foreign exchange rate differences results in volatility of operational earnings or losses and gross revenue tax expense (PIS/Cofins) and income taxes (IR/CSLL). Exchange rate variations arising from foreign investments recorded for the accumulated fiscal year ended on December 31, 2016 a loss of R$7,408 million (2015 - gains of R$14,779 million). On the other hand, the derivatives contracted to cover these positions generated a gain in "Derivatives Transaction" of R$14,123 million (2015 - loss of R$26,311 million). The tax effect of these derivatives impacted the Tax Expenses line generating a tax loss of R$6,715 million (2015 - income of R$11,532 million) represented by R$657 million (2015 - R$1,223 million) of PIS/Cofins and R$6,058 million (2015 - R$10,309 million) of IR/CSLL. | |||||||||||
Excluding the tax effects related of hedge of the foreign investments, the operating result would be the following: | |||||||||||
| |||||||||||
ADJUSTED OPERATING INCOME | 12M16 |
| 12M15 |
| annual |
| 4Q16 |
| 3Q16 |
| 4Q16 vs. 3Q16 changes % |
Operating Income | 13,778.9 |
| (377.4) |
| 3,751.0 |
| 1,699.7 |
| 1,950.3 |
| -12.8 |
IR/CSLL | (6,058.0) | 10,309.0 | -158.8 | (37.0) | 369.0 | -110.0 | |||||
Adjusted Operating Income | 7,720.9 |
| 9,931.6 |
| -22.3 |
| 1,662.7 |
| 1,581.3 |
| 5.1 |
2) Goodwill Amortization - In July 2015 the Bank revised the amortization curve rate of the acquisition goodwill of Banco Real to adjust the originally established curve for the term, extension and proportion.The goodwill amortization will be concluded in 2017 (originally in 2016). | |||||||||||
3) In the first half 2015 a reversal of legal obligations was recorded in the amount of R$7,950 million related to Cofins, under Other Operating Income - R$7,672 million and Tax Expenses - R$278 million. The respective tax effect was recorded as income tax and social contribution in the amount of R$3,180 million. | |||||||||||
General Expenses | |||||||||||
The total of general expenses, including personnel expenses, other administrative expenses and profit sharing expenses, excluding the effects of goodwill amortization, increased 5.7% in December 2016, compared with the fiscal year of 2015, with lower annual increase for inflation in the period, a result of the discipline and efficiency of cost management ,while personnel and profit sharing expenses increased 9.0% and other administrative expenses increased 2.8% YoY. | |||||||||||
2.2) Assets and Liabilities | |||||||||||
CONSOLIDATED BALANCE SHEETS (R$Millions) |
|
| Dec/16 |
| Dec/15 |
| annual |
| Sep/16 |
| Dec/16 vs. Sep/16 |
Current and Long-Term Assets |
|
| 688,673.4 |
| 663,804.5 |
| 3.7 |
| 647,837.0 |
| 6.3 |
Permanent Assets | 13,031.1 | 13,645.3 | -4.5 | 13,348.8 | -2.4 | ||||||
TOTAL ASSETS | 701,704.5 | 677,449.7 | 3.6 | 661,185.8 | 6.1 | ||||||
|
| ||||||||||
Current and Long-Term Liabilities | 640,842.7 | 620,289.1 | 3.3 | 597,106.1 | 7.3 | ||||||
Deferred Income | 564.6 | 385.5 | 46.5 | 565.0 | -0.1 | ||||||
Minority Interest | 2,525.7 | 1,956.1 | 29.1 | 2,194.1 | 15.1 | ||||||
|
| ||||||||||
Stockholders' Equity | 57,771.5 | 54,819.1 | 5.4 | 61,320.6 | -5.8 | ||||||
|
| ||||||||||
TOTAL LIABILITIES |
|
| 701,704.5 |
| 677,449.7 |
| 3.6 |
| 661,185.8 |
| 6.1 |
Total assets are mainly represented: | |||||||||||
(R$Millions) |
|
| Dec/16 |
| Dec/15 |
| annual |
| Sep/16 |
| Dec/16 vs. Sep/16 |
Loan Portfolio |
|
| 256,882.9 |
| 260,988.6 |
| -1.6 |
| 247,324.4 |
| 3.9 |
Securities and Derivative Financial Instruments(1) | 169,589.7 | 142,892.0 | 18.7 | 153,134.7 | 10.7 | ||||||
Interbank Investments | 59,669.2 | 55,810.1 | 6.9 | 63,960.5 | -6.7 | ||||||
Interbank Accounts |
|
| 62,900.2 |
| 55,303.4 |
| 13.7 |
| 64,573.4 |
| -2.6 |
(1) Given the provisions of Circular Bacen 3,068/2001, Banco Santander has the financial capacity and intention to hold to maturity securities classified as held-to-maturity, in the amount of R$9,388 million. | |||||||||||
2.3) Loan Portfolio | |||||||||||
MANAGEMENT DISCLOSURE OF LOAN PORTFOLIO BY SEGMENT |
|
| Dec/16 |
| Dec/15 |
| annual |
| Sep/16 |
| Dec/16 vs. Sep/16 |
Individuals(1) |
|
| 91,414.3 |
| 84,804.7 |
| 7.8 |
| 88,440.2 |
| 3.4 |
Consumer Finance | 34,777.0 | 33,930.9 | 2.5 | 33,868.0 | 2.7 | ||||||
Small and Medium-sized Entities | 32,683.5 | 35,387.4 | -7.6 | 32,075.9 | 1.9 | ||||||
Large-sized Entity | 98,008.1 | 106,865.6 | -8.3 | 92,940.2 | 5.5 | ||||||
Total Loan portfolio (gross) | 256,882.9 | 260,988.6 | -1.6 | 247,324.3 | 3.9 | ||||||
|
| ||||||||||
Allowance for Loan Losses | (18,333.0) | (16,832.0) | 8.9 | (17,280.0) | 6.1 | ||||||
|
| ||||||||||
Total Loan portfolio (net) |
|
| 238,549.9 |
| 244,156.6 |
| -2.3 |
| 230,044.3 |
| 3.7 |
(1) Including the loans to individual in the consumer finance segment, the individual portfolio reached R$122,287 on December 31, 2016 and R$114,774 on December 31, 2015. | |||||||||||
2
On Dec 31, 2016, the loan portfolio (gross) presented a reduction of 1.6% compared to December, 2015 and increased 3.9% compared to September, 2016. The individuals segment showed a growth in both periods, being 7.8% YoY and 3.4% compared to September, 2016. | ||||||||||||||||
Delinquency | ||||||||||||||||
The over-90-day delinquency ratio reached 3.4% of the total credit portfolio in December 2016, up 0.2% over December 2015 (3.2%) and down 0.1% over September 2016 (3.5%). | ||||||||||||||||
Allowance for loan losses represents 7.1% of the loan portfolio in December 2016, 6.4% in December 2015 and 7.0% in September 2016. | ||||||||||||||||
The allowance for loan losses, net of revenues with recovery of loans previously written off in the fiscal year ended December 31, 2016 is R$10,404.8 million and R$12,426.9 million in 2015, YoY, reducing 16.3%. | ||||||||||||||||
2.4) Funding by Customers | ||||||||||||||||
FUNDING BY CUSTOMERS |
|
|
|
|
| Dec/16 |
| Dec/15 |
| annual |
| Sep/16 |
| Dec/16 vs. Sep/16 | ||
Demand Deposits |
|
|
|
|
| 16,006.3 |
| 15,698.2 |
| 2.0 |
| 15,452.3 |
| 3.6 | ||
Saving Deposits | 36,051.5 | 35,984.8 | 0.2 | 34,764.1 | 3.7 | |||||||||||
Time Deposits | 90,524.8 | 86,527.7 | 4.6 | 87,483.2 | 3.5 | |||||||||||
Debentures/LCI/LCA(1) | 90,426.3 | 90,226.2 | 0.2 | 87,282.2 | 3.6 | |||||||||||
Treasury Bills/Structured Operations Certificates(2) | 65,393.3 | 59,498.7 | 9.9 | 66,744.0 | -2.0 | |||||||||||
|
| |||||||||||||||
Total Funding |
|
|
|
|
|
|
| 298,402.3 |
| 287,935.6 |
| 3.6 |
| 291,725.8 |
| 2.3 |
(1) Debentures repurchase agreement, Real Estate Credit Notes (LCI) and Agribusiness Credit Notes (LCA). | ||||||||||||||||
(2) Includes Certificates of Structured Operations. | ||||||||||||||||
The total of funding resources increased 3.6%, compared with December, 2015. The highlight was the growth of 9.9% on Treasury Bills/Structured Operations Certificates. | ||||||||||||||||
2.5) Stockholders’ Equity | ||||||||||||||||
In December 2016, Banco Santander consolidated stockholders’ equity presented an increase of 5.4% YoY and a reduction of 5.8% compared to September, 2016. | ||||||||||||||||
The variation in Shareholders' Equity between December 2016 and 2015 was, mainly, due to the negative variation of the equity valuation adjustment (securities and derivative financial instruments) in the amount of R$2,818 million, for the net income for the year in the amount of R$5,533 million and reduced by the highlight of Dividends and Interest on Own Capital in the amount of R$4,550 million. | ||||||||||||||||
In the meeting held on November 3, 2016, the Bank’s Board of Directors approved, in continuation of the buyback program that expired on November 4, 2016, the buyback program of its Units and ADRs, by the Bank or its agency in Cayman, to be held in treasury or subsequently sold. | ||||||||||||||||
The Buyback Program will cover the acquisition up to 38,402,972 Units, representing 38,402,972 common shares and 38,402,972 preferred shares, or the ADRs, which, on September 30, 2016, corresponded to approximately 1.02% of the Bank’s share capital. On September 30, 2016, the Bank held 384,029,725 common shares and 411,834,140 preferred shares being traded. | ||||||||||||||||
The Buyback has the purpose to (1) maximize the value creation to shareholders by means of an efficient capital structure management; and (2) enable the payment of officers, management level employees and other Bank employees and companies under its control, according to the Long Term Incentive Plans. | ||||||||||||||||
The term of the Buyback Program is 365 days as from November 4, 2016, and will expire on November 3, 2017. | ||||||||||||||||
TREASURY SHARES |
|
|
|
|
|
|
|
|
| Dec/16 |
|
|
| Dec/15 | ||
|
|
|
|
|
|
|
|
|
|
|
| Quantity |
|
|
| Quantity |
| Units |
| ADRs |
| Units |
| ADRs | |||||||||
Treasury shares at beginning of the fiscal year | 7,080,068 | 13,137,665 | 16,531,177 | 13,080,565 | ||||||||||||
Cancellation of ADRs (1) | 13,137,665 | (13,137,665) | - | - | ||||||||||||
Cancellation of Shares (2) | - | - | (18,878,954) | - | ||||||||||||
Shares Acquisitions | 14,284,400 | - | 13,873,413 | 57,100 | ||||||||||||
Payment - Share-based compensation | (8,716,213) | - | (4,445,568) | - | ||||||||||||
Treasury shares at end of the fiscal year | 25,785,920 | - | 7,080,068 | 13,137,665 | ||||||||||||
Balance of Treasury Shares in thousands of reais(2)(3) | R$ 513,889 | R$ - | R$ 106,764 | R$ 317,094 | ||||||||||||
|
| |||||||||||||||
Cost/market Value | Units | ADRs | Units | ADRs | ||||||||||||
Minimum cost | R$ 7.55 | US$ 4.37 | R$ 11.01 | US$ 4.37 | ||||||||||||
Weighted average cost | R$ 16.43 | US$ 6.17 | R$ 14.28 | US$ 6.17 | ||||||||||||
Maximum cost | R$ 26.81 | US$ 10.21 | R$ 18.51 | US$ 10.21 | ||||||||||||
market value |
|
|
|
|
|
|
|
|
| R$ 28.32 |
| US$ 8.58 |
| R$ 16.04 |
| US$ 3.89 |
(1) In January 2016 was the transformation of all ADRs that were held in treasury for UNIT's. | ||||||||||||||||
(2) Extraordinary General Meeting held on December 14, 2015 the cancellation of 18,878,954 Units was approved (18,878,954 ON and 18,878,954 PN totaling 37,757,908 treasury shares) equivalent to R$269 million. | ||||||||||||||||
(3) The total number of treasury shares on December 31, 2016 is R$514 million (12/31/2015 - R$424 million) and includes issuance costs amounting to R$145 thousand (12/31/2015 - R$95 thousand). | ||||||||||||||||
3
In the fiscal year of 2016 there were highlights of Dividends and Interest on Capital. | ||||||||||||||||
|
|
|
|
|
|
|
|
|
|
|
|
|
|
|
|
|
DIVIDENDS AND INTEREST ON CAPITAL |
|
|
|
|
| Dec/16 |
| Sep/16 |
| Dec/15 | ||||||
Interest on capital |
|
|
|
|
|
|
|
|
| 3,850.0 |
| 500.0 |
| 1,400.0 | ||
Interim Dividends | 700.0 | 0.0 | 3,050.0 | |||||||||||||
Intercalary Dividends | 700.0 | 0.0 | 1,750.0 | |||||||||||||
Total |
|
|
|
|
|
|
|
|
|
|
| 5,250.0 |
| 500.0 |
| 6,200.0 |
2.6) Basel Index | ||||||||||||||||
Financial institutions are required by Bacen to maintain Regulatory Capital (PR), Tier I and Principal Capital consistent with their risk activities, higher to the minimum requirement of the Regulatory Capital Requirement, represented by the sum of the partial credit risk, market risk and operational risk. | ||||||||||||||||
As established by CMN Resolution 4,193/2013 the requirement for PR is 11% until December 31, 2015, from January 2016 the requirement is 9.875% plus 0.625% of conservation of capital, totaling 10.5% until December 2016, of which Tier I is 6% and the Main Capital is 4.5%. | ||||||||||||||||
The index is calculated on a consolidated basis, as shown below: | ||||||||||||||||
BASEL INDEX % |
|
|
| Dec/16 |
| Sep/16 |
| Jun/16 |
| Dec/15 | ||||||
Basel Index - consolidated |
|
|
|
|
|
|
| 16.30 |
| 17.60 |
| 17.71 |
| 15.72 | ||
2.7) Main Subsidiaries | ||||||||||||||||
The table below presents the balances of total assets, net assets, net income and credit operations for the fiscal year ended December 31, 2016 the principal subsidiaries of Banco Santander portfolio: | ||||||||||||||||
SUBSIDIARIES |
|
|
| Total Assets |
| Stockholders' Equity |
| Net Income (Loss) |
| Loan Portfolio (1) | ||||||
Santander Leasing S.A. Arrendamento Mercantil |
|
|
| 74,916.8 |
| 5,699.3 |
| 527.1 |
| 2,093.0 | ||||||
Aymoré Crédito, Financiamento e Investimento S.A. | 31,179.9 | 1,364.5 | 52.5 | 25,557.3 | ||||||||||||
Santander Brasil, Establecimiento Financiero de Crédito, S.A. | 2,810.2 | 2,552.6 | (142.4) | 1,269.6 | ||||||||||||
Banco Olé Bonsucesso Consignado S.A. (Olé Consignado) (Current Corporate Name of Banco Bonsucesso Consignado S.A.) | 7,665.0 | 676.1 | 13.6 | 7,354.3 | ||||||||||||
Getnet Adquirência e Serviços para Meios de Pagamento S.A. | 17,337.4 | 1,468.4 | 282.6 | 0.0 | ||||||||||||
Banco PSA Finance Brasil S.A. | 2,011.0 | 276.1 | 5.8 | 1,827.2 | ||||||||||||
Santander Corretora de Câmbio e Valores Mobiliários S.A. |
|
|
| 929.1 |
| 557.7 |
| 106.1 |
| 0.0 | ||||||
(1) Includes Leasing portfolio and other credits. | ||||||||||||||||
(2) In the third quarter of 2016, after Getnet got from the Bacen approval to act as a payment institution, the activities of acquiring, as well as their related assets and liabilities are now recorded in this entity. | ||||||||||||||||
3) Other Significant Events | ||||||||||||||||
3.1) Corporate Restructuring | ||||||||||||||||
The Bank implemented various social movements in order to reorganize the operations and activities of entities according to the business plan of the Banco Santander: | ||||||||||||||||
a) Partnership Formation with the Hyundai Group in Brazil | ||||||||||||||||
On April 28, 2016, the Aymoré CFI and Banco Santander entered into a transaction for the formation of a partnership with Hyundai Motor Brasil Montadora de Automóveis Ltda. (Hyundai Motor Brazil) and Hyundai Capital Services, Inc. (Hyundai Capital) for the constitution of Banco Hyundai Capital Brasil S.A. and an insurance brokerage company to provide, respectively, auto finance and insurance brokerage services and products to consumers and Hyundai dealerships in Brazil. The partnership capital structure will have a shareholding of 50% (fifty percent) of Aymoré, 25% (twenty five percent) of Hyundai Capital and 25% (twenty five percent) of Hyundai Motor Brazil. The closing of the transaction shall be subject to the fulfillment of certain conditions precedent usual in similar transactions, including obtaining the applicable regulatory approvals. | ||||||||||||||||
b) Agreement on the Acquisition, of part of the Financial Operation of PSA Group in Brazil and a Consequent Creation of a Joint Venture | ||||||||||||||||
On August 1, 2016, after the fulfillment of the applicable conditions precedent, including obtaining the appropriate regulatory approvals, Aymoré CFI and Banco Santander, in the context of a partnership between the Banque PSA Finance ("Banque PSA") and Santander Consumer Finance in Europe for joint operation of the vehicle financing business of PSA brands (Peugeot, Citroën and DS), signed definitive documents for the formation of a financial cooperation with Banque PSA for offering a range of financial and insurance products to consumers and dealers of PSA in Brazil. | ||||||||||||||||
The main vehicle of financial cooperation is Banco PSA Finance Brasil S.A. who is being held in the proportion of 50% by Aymoré CFI, a subsidiary of Banco Santander, and 50% by Banque PSA. The purchase price was equal to the book value (proportional) on the closing date (08/01/2016). The operation also included the acquisition by Banco Santander subsidiary, 100% of PSA Finance Arrendamento Mercantil S.A., whose price was equivalent to 74% of the equity value on the closing date, and also 50% of PSA Corretora de Seguros e Serviços Ltda., whose price was equal to the book value (proportional) on the closing date. | ||||||||||||||||
Banco Santander started to consolidate these entities from August 1, 2016 | ||||||||||||||||
4
c) Investment in the Company Super Pagamentos e Administração de Meios Eletrônicos LTDA. (“Super”) | ||||||||||||||||
On October 3, 2014, Aymoré CFI signed an investment agreement ("Agreement") with a view to make an investment in Super, which shall result in the subscription and payment of new shares issued by Super, representing 50% of its total and voting capital. | ||||||||||||||||
The closing of the operation held on December 12, 2014 and was subject to completion of certain conditions precedent set forth in the Agreement, including the prior approval of the Bacen (obtained on December 2, 2014). Aymoré CFI subscribed and paid share capital of Super in R$31 million, through the issuance of 20 million new common shares. Santander Conglomerate controls such company. | ||||||||||||||||
On January 4, 2016, Aymoré CFI informed the owners of the shares representing the remaining 50% of Super´s total voting capital its Decision to exercise the call option for the acquisition of such shares, for a value of approximately R$113 million.The transaction was concluded on March 10, 2016. | ||||||||||||||||
d) Investment Agreement between Banco Santander and Banco Bonsucesso S.A. (Banco Bonsucesso) | ||||||||||||||||
On July 30, 2014 Banco Santander, through its controlled company Aymoré CFI, and Banco Bonsucesso entered into an Investment Agreement whereby agreed to form an association in payroll credit card loan segment and payroll loans (Olé Consignado). | ||||||||||||||||
On February 10, 2015, with the approval of the Bacen, the transaction was completed and Banco Santander, through Aymoré CFI, became the controlling shareholder of Olé Consignado, with 60% of the total and voting capital through an investment of R$460 million. Banco Bonsucesso remained with the remaining portion of the share capital (40%). | ||||||||||||||||
Olé Consignado became the exclusive vehicle of Banco Bonsucesso and its subsidiaries for the offer of payroll loans in Brazil. Banco Santander will continue to originate payroll loan transactions independently through its own channels. | ||||||||||||||||
The EGM of March 3, 2016 approved the change of name to Banco Olé Bonsucesso Consignado S.A., the change process has been approved by the Bacen on September 1, 2016 . | ||||||||||||||||
e) Sale of Santander Securities Services Brasil DTVM S.A. | ||||||||||||||||
On June 19, 2014, preliminary documents were executed containing the main terms and conditions related to the sale of the operation of qualified custody business, currently performed by Banco Santander, and all of the shares issued by Santander Securities Services Brasil DTVM S.A. | ||||||||||||||||
On August 31, 2015 the sales transaction of the qualified custody business, with the sale of all shares of Santander Securities Services Brasil Distribuidora de Títulos e Valores Mobiliários S.A. to Santander Securities Services Brasil Participações S.A., indirectly controlled by Banco Santander, S.A. was concluded at the amount of R$859 million. | ||||||||||||||||
The transaction generated a gain of R$751 before taxes recorded in the Non-Operating Income item. | ||||||||||||||||
The operation fits into the context of a global negotiation of the custody business, which involves, in addition to Brazil, the qualified custodian activity in Spain and Mexico. | ||||||||||||||||
i) Others Corporate Movements | ||||||||||||||||
We also performed the following corporate actions: | ||||||||||||||||
• On December 30, 2016, at the EGM of Webmotors S.A., the merger and the Private Instrument of Protocol and Justification of Incorporation of Virtual Motors by Webmotors S.A. were approved, so that Webmotors S.A. received, for its accounting value, based on the balance sheet drawn up on November 30, 2016, all of the assets, rights and obligations of Virtual Motors, with the extinction of Virtual Motors that will be succeeded by Webmotors S.A. in all its rights and obligations. | ||||||||||||||||
• On July 14, 2016, was concluded the sale of 100% of the shares representing the capital stock of Mantiq held by Banco Santander and Santander Participações to Angra Ventures Participações Ltda. | ||||||||||||||||
• In June 2016 the holding in the iZettle S.A. Brazil was sold in its entirety. | ||||||||||||||||
• On April 30, 2015, the merger and consequent extinction of the company Go Pay by Getnet it were formalized. | ||||||||||||||||
• On April 30, 2015 the merger and the consequent extinction of the companies KM Locanet Ltda. and Ideia Produções e Design Ltda. by Webmotors S.A it were formalized. | ||||||||||||||||
• On March 23, 2015, Santander Participações S.A. sold all of its interest in the Special Purpose Companies Gestamp Eólica Serra de Santana S.A., Gestamp Eólica Paraíso S.A., Gestamp Eólica Lanchinha S.A., Gestamp Eólica Seridó S.A. e Gestamp Eólica Lagoa Nova S.A. to ICG do Brazil S.A., a company indirectly controlled by Santander Spain, in the total amount of R$120 million. | ||||||||||||||||
• On March 23, 2015, Santander Participações S.A. sold its entire stake in Santos Energy Participações S.A. to Inversiones Global Capital, S.A., a company indirectly controlled by Santander Spain, in the total amount of R$127 million. | ||||||||||||||||
5
4) Strategy | ||||||||||||||||
Banco Santander is the only international bank with scale in the country. The Bank is convinced that the best way to grow in a recurring and sustainable manner is by providing excellent services to enhance the level of satisfaction and attract more customers, making them more engaged. The performance of Banco Santander is based on a close and lasting relationship with customers, suppliers and shareholders. To achieve that goal, the Bank strives to help people and businesses to prosper by being a Simple, Personal and Fair Bank, which is embodied by the following strategic priorities: | ||||||||||||||||
• Increase customer preference and engagement by offering targeted, simple, digital, innovative and efficient products and services through a multi-channel platform; | ||||||||||||||||
• Improve the recurrence and sustainability of results by growing in businesses with greater revenue diversification, aiming to strike a balance between credit, funding and services. At the same time, maintaining risk management and strict expenses control; | ||||||||||||||||
• Be discipline with capital and liquidity to preserve solidity, face regulatory changes and seize growth opportunities; and | ||||||||||||||||
• Increase productivity through an intense agenda of commercial improvements that enable the Bank to offer a complete portfolio of services | ||||||||||||||||
In 2016, the highlight is the following advances: | ||||||||||||||||
• Acceleration in the business transformation agenda: | ||||||||||||||||
Digital Advances: New mobile banking functionalities have been implemented for individuals, with improved application evaluation (4.5 stars in the Apple Store and 4.2 in Google Play). A digital service channel for Van Gogh and Empresas I clients and expanded remote customer service for all Corporate and Global Corporate Banking (GCB) customers. The Banco Santander ends of the year with 6.3 million registrations in biometrics and an increase in digital transactions that went from 66% in 2015 to 73% of total bank transactions.Through e-commerce, product sales in digital channels tripled; | ||||||||||||||||
Simplification of processes: through the "Certo" and "Clique Único" model, Bando Santander increased efficiency and commercial productivity, which enabled on the one hand, commercial managers to increase contact time with customers and, on the other hand, Experience in hiring some products. | ||||||||||||||||
Retail innovations: "Santander Way", an application for card management, was developed and Banco Santander pioneered the provision of Samsung Pay customers. In addition, a business agreement with American Airlines was announced for card issuance and mileage accrual in order to provide customers with a better experience through one of the most recognized mileage programs on the market. On the acquiring side, Getnet's revenue continues with a strong growth pace, with a performance superior to that of the market. In 2016 Banco Santander increased the acceptance of flags and launched to the individual clients the "Account Connects with the Red", a current account option with a low cost POS. | ||||||||||||||||
Actions to increase the presence of Banco Santander in the market: after one year of the acquisition of Banco Bonsucesso, the Olé Consignado brand was launched and the acquisition of 100% of the Super Account was completed. Banco Santander repositioned itself in the agribusiness segment, inaugurated the first agency focused on the segment and was recognized for the "Lide Agronegócios 2016" award. With the "Avançar" program, one of the offers of "Santander Negócios & Empresas", supported small and medium-sized clients in the pillars of development, internationalization and people management. In 2016 it had more than 338 thousand accesses in the program portal and was recognized by Euromoney as the best bank for this segment. | ||||||||||||||||
• Strengthening performance in leading businesses: | ||||||||||||||||
| ||||||||||||||||
At Santander Financiamentos, Banco Santander remains the leader in vehicle financing, with a market share of 20%, according to data released by the Bacen. To strengthen its operations, a joint venture with Hyundai was created, the association with the PSA Bank was concluded and the new digital platform "+ negócios" was launched, a tool developed based on the best global practices, which digitalizes the entire customer experience, Strong business growth potential. | ||||||||||||||||
| ||||||||||||||||
In Global Corporate Banking, Banco Santander was recognized as the leader in financial advisory services for financing projects in Brazil, by ANBIMA and continues as a leader in the foreign exchange market, by the Bacen. In the ranking of M & A operations, it moved from 5th position in 2015 to 1 in 2016, according to Thomson Reuters. | ||||||||||||||||
| ||||||||||||||||
• Customer bonding: | ||||||||||||||||
| ||||||||||||||||
All of these factors were fundamental to a more positive momentum in our business and a 16.1% increase in the tied customer base, which totaled 3.7 million. | ||||||||||||||||
• People: | ||||||||||||||||
With the purpose of supporting people to prosper, the Santander Academy, a new training concept, was launched for employees. Also in 2016, Banco Santander was included in the ranking of "Best Companies to Work For", according to Great Place to Work (GPTW). | ||||||||||||||||
• Sustainability: | ||||||||||||||||
In 2016, Santander contributed significantly to the Santander Group's integration into the Dow Jones Sustainability Index (DJSI), reaching 6th place (11th in 2015) among the banks of a total of 316 Integrate the index. | ||||||||||||||||
| ||||||||||||||||
In terms of sustainability, Santander maintains a leading position among private banks in the Microcredit program. And in the segment of Universities, through the distribution of scholarships, contributes actively to the process of advancement of education in the Country. | ||||||||||||||||
6
5) Rating Agencies | ||||||||||||||||
Banco Santander is rated by international ratings agencies and the ratings assigned reflect many factors including management quality, operating performance and financial strength, as well as other factors related to the financial sector and economic environment in which the Bank is inserted, having the long-term foreign currency rating limited to the sovereign rating. The table below presents the ratings assigned by the rating agencies Standard & Poor's and Moody's: | ||||||||||||||||
| ||||||||||||||||
6) Corporate Governance | ||||||||||||||||
The Board of Directors approved, in a meeting held on January 24, 2017, the Banco Santander's Consolidated Financial Statements for fiscal year ended December 31, 2016, prepared in accordance with the Brazilian accounting practices, applicable to financial institutions authorized to operate by Bacen. | ||||||||||||||||
The Board of Directors approved, in a meeting held on December 29th, 2016, the proposal for declaration and payment of (I) Dividends in the total amount of R$1,400 million, of which: (i) Interim amount of R$700 million, calculated based on the balance sheet of November 30th, 2016; and (ii) Intermediary amount of R$700 million, based on the dividend equalization reserve, and (II) Interest on Capital, in the gross amount of R$ 3,350 million. | ||||||||||||||||
The Board of Directors, in a meeting held on December 15th, 2016: (i) knew the resignation of Mr. Eduardo Nunes Gianini, of his position as member of the Remuneration Committee of the Banco Santander, according to the letter of resignation submitted to the Board of Directors; (ii) approved the appointment of Mr. Luiz Fernando Sanzogo Giorgi, as a member of the Remuneration Committee of the Company, for a complementary term of office, which shall be valid until the first Board of Directors’ Meeting after the 2017 Ordinary Shareholders’ Meeting take office; and (iii) knew the resignation of Mr. Mario Roberto Opice Leão of his position as officer without specific designation of the Banco Santander, in accordance with the letter of resignation presented to the Board of Directors. | ||||||||||||||||
The Board of Directors approved, in a meeting held on November 3rd, 2016: (I) the election of Mr. Igor Mario Puga to compose the Banco Santander's Executive Board, for a complementary term of office, which shall be valid until the officers elected in the first Board of Directors’ Meeting after the 2017 Ordinary Shareholders’ Meeting take office, as Officer without specific designation and (II) the new buyback program of (i) Units, each representing one (1) common share and one (1) preferred share issued by the Banco Santander, or (ii) ADRs, by the Banco Santander or by its branch in Cayman, to be held in treasury or subsequently sold, pursuant to CVM Normative Instruction No. 567 of September 17th, 2015 (“CVM Instruction 567”). | ||||||||||||||||
The Board of Directors approved, in a meeting held on October 25th, 2016, the Banco Santander’s Consolidated Interim Financial Statements regarding the 3rd quarter ended September 30th, 2016, prepared in accordance with the Brazilian accounting practices, applicable to financial institutions authorized to operate by Bacen, as well as the Consolidated Interim Financial Statements prepared in accordance with the International Financial Reporting Standards (IFRS). | ||||||||||||||||
The Board of Directors knew, in a meeting held on August 24, 2016, the resignation of Ms. Marília Artimonte Rocca as the Director member function of Board of Directors, the Compensation Committee and the Nominating Committee, Governance and Compliance of Banco Santander. | ||||||||||||||||
The Board of Directors approved, in a meeting held on July 26, 2016, the Banco Santander's Consolidated Interim Financial Statements regarding the second quarter ended June 30th, 2016, prepared in accordance with the Brazilian accounting practices, applicable to financial institutions authorized to operate by Bacen, and the Consolidated Interim Financial Statements prepared in accordance with the International Financial Reporting Standards (IFRS) and the Consolidated Financial Statements of the Conglomerate Prudential. | ||||||||||||||||
The Board of Directors approved, in a meeting held on June 29, 2016, the Declaration and payment of Interest on Equity, in the gross amount of R$500 million, which was paid on August 26, 2016, with no compensation of monetary restatement. | ||||||||||||||||
The Board of Directors approved, in a meeting held on May 2, 2016, the election of Mr. Alexandre Silva D'Ambrósio to compose the Banco Santander's Board of Directors, to the position of Executive Vice President for a complementary term of office, which shall be valid until the officers elected in the first Board of Directors’ Meeting after the 2017 Ordinary Shareholders’ Meeting take office. | ||||||||||||||||

7
The Board of Directors approved, in a meeting held on April 25, 2016, the Banco Santander's Consolidated Interim Financial Statements regarding the 1st quarter ended March 31, 2016, prepared in accordance with the Brazilian accounting practices, applicable to financial institutions authorized to operate by Bacen, as well as the Consolidated Interim Financial Statements prepared in accordance with the International Financial Reporting Standards (IFRS). | ||||||||||||||||
The Board of Directors approved in a meeting held on March 22, 2016: (i) the election of the Banco Santander's Audit Committee members, for a one (1) year term, which shall be postponed until the investiture of the members that shall be elected on the First Board of Directors’ meeting to be held after the Ordinary General Meeting of 2017, as follows: René Luiz Grande, reappointed as Coordinator; Luiz Carlos Nannini, as technical qualified member; and Elidie Palma Bifano, as member; and (ii) ratified (a) the current composition of the Nomination, Governance and Compliance Committee, as follows: Jesús Maria Zabalza Lotina, as Coordinator; Celso Clemente Giacometti and Marília Artimonte Rocca; and (b) the current composition of the Sustainability and Society Committee, as follows: Jesús Maria Zabalza Lotina, as Coordinator; José Luciano Duarte Penido, Gilberto Mifano and Viviane Senna Lalli. | ||||||||||||||||
The Board of Directors approved in a meeting held on March 18, 2016, the hiring by Santander of the company PricewaterhouseCoopers Auditores Independentes, enrolled with Corporate Taxpayer Registry (CNPJ) 61.562.112/0001-20, and under Local Accounting Council Registry (ACR) 2SP000160/O-5 and registered with the CVM under Declaratory act 5.038 of September 8th, 1998, with headquarters at Av. Francisco Matarazzo, 1400, 9th, 10th and 13th to 17th floor, Torre Torino, Água Branca, São Paulo/SP, to act as independent audit company of Santander and of the companies part of Santander Conglomerate in Brazil, for 2016, 2017 and 2018 fiscal years, in replacement of Deloitte Touche Tohmatsu Auditores Independentes. | ||||||||||||||||
The Board of Directors approved in a meeting held on February 26, 2016: (i) the Financial Statements by standard under International Accounting Standards (IFRS), issued by the International Accounting Standards Board (IASB) and interpretations of the IFRS Interpretations Committee (IFRS), referred to the fiscal year ended on December 31, 2015; and (ii) the Ombudsman Office Report regarding the second semester of 2015 and the corrective measures taken due to the complaints received, in order to comply with Resolution No. 4,433, of July 23, 2015, of the National Monetary Council. | ||||||||||||||||
The Board of Directors approved, in a meeting held on January 26, 2016, the election of Mr. Marino Alexandre Calheiros Aguiar and Mario Roberto Opice Leão to compose the Banco Santander's Board of Directors, to the position of Officer without specific designation for a complementary term of office, which shall be valid until the officers elected in the first Board of Directors’ Meeting after the 2017 Ordinary Shareholders’ Meeting take office. | ||||||||||||||||
7) Risk Management | ||||||||||||||||
7.1) Corporate Governance of the Risk Function | ||||||||||||||||
The organizational structure of the Executive Vice President of Risks, which is independent from commercial areas, is composed by areas responsible for the management of the financial and non-financial risks, with management segregated by segments (individuals retail, companies retail and wholesale). | ||||||||||||||||
A specific Control and Risks Consolidation department has the mission to report a consolidated view of all risks to the local management and to the Group’s governance, as well as to improve risk appetite and risk assessment exercise (Risk Identification & Assessment). It is also responsible for developing the relationship with supervisors and regulators on risks subjects, altogether with Santander Risk Group, in Spain. It is supported by: Enterprise Risk Management, Credit Consolidation and control, model risks, non-financial risks and associate companies risk control. | ||||||||||||||||
Another department includes a set of transverse functions (Governance, Policy, Risk Culture, Methodology, Stress Test, Capital and Risk MI) necessary for an advanced risk management model. | ||||||||||||||||
The governance model is structured both in a vision of Decision, focusing on examination and approval of credit proposals and limits, as in the Control, aiming the full control of risks | ||||||||||||||||
The fundamental principles that rule the risk governance model are: | ||||||||||||||||
• Independence of the risks in relation to business area; | ||||||||||||||||
• Involvement of management in Decision making; | ||||||||||||||||
• Collegiate Decisions and consensus on credit operations; | ||||||||||||||||
The ERC - Executive Risk Committee is the local Decision-making forum with representatives of the Bank's management, including the CEO, Vice President and the other members of the Executive Board. | ||||||||||||||||
The CCR - Risk Control Committee is the control and monitoring local forum with representatives of the Bank's management, including the VPE of risks and the Vice President of finance. | ||||||||||||||||
The relevant issues of risk management or those that exceed the jurisdiction of these committees are forward and Decided by the Board of Directors. | ||||||||||||||||
Further details of the structure, methodologies and control system related to risk management is described in the report available on the website www.santander.com.br. | ||||||||||||||||
7.2) Structure of Capital Management | ||||||||||||||||
The goal is to achieve an efficient capital structure, meeting the regulatory requirements and contributing to reach the goals regarding the classification of rating branches. The capital management including securitization, sale of assets, raising capital through shares issues, subordinated debt and hybrid instruments. | ||||||||||||||||
8
The capital management seeks to optimize value creation in the Banco Santander and the different business units. To this end, capital management, Return on Risk Adjusted Capital (RORAC) and the creation of data values for each business unit are generated. The Banco Santander uses a measurement model of economic capital in order to ensure it has enough capital available to support the risks of economic activity in different scenarios, with solvency levels agreed by the Group. | ||||||||||||||||
Projections of economic and regulatory capital are made based on financial projections (Balance Sheet, Income Statements, etc.) and macroeconomic scenarios estimated by the economic research service of the Financial Management area. The economic capital models are essentially designed to generate risk-sensitive estimates with two goals in mind: more precision in risk management and allocation of economic capital to various units of Banco Santander. | ||||||||||||||||
7.3) Credit Risk | ||||||||||||||||
The Credit Risk Management aims to supply subsidies to the definition of strategies, according to the risk appetite, in addition to setting limits, spanning the analysis and control of exposure and trends as well as the effectiveness of credit policies. The objective is to keep an appropriate risk profile and a minimum profitability that compensates the estimated default, both the client and the portfolio as defined the Executive Committee and Management Board. | ||||||||||||||||
Risk Management specializes in the characteristics of the customers, as well as the process of risk management is segregated between individual customers (with monitoring of dedicated analysts) and customers with similar characteristics (standardized). | ||||||||||||||||
7.4) Market Risk | ||||||||||||||||
Market risk is exposure to risk factors including interest rates, exchange rates, commodities prices, stock market prices and other values, according to the type of product, the volume of operations, terms and conditions of the agreement and underlying volatility. market risk management includes practices of measuring and monitoring the use of limits that are pre-set by internal committees, of the value at risk of the portfolios, of sensitivity to fluctuating interest rates, of exposure to foreign exchange rates, of liquidity gaps, among other practices which the control and monitoring of the risks which might affect the position of Banco Santander portfolios in the different markets in which the Bank operates. | ||||||||||||||||
For this the Bank, it has developed its own Risk Management model, the following principles: | ||||||||||||||||
• Functional independence; | ||||||||||||||||
• Executive capacity sustained by knowledge and customer proximity; | ||||||||||||||||
• Global scope (different types of risk); | ||||||||||||||||
• Collective Decisions that evaluate all possible scenarios and not compromise the results of individual Decisions, including Executive Risk Committee (ERC), which sets limits and approves the transactions and the Executive Committee of Assets and Liabilities, which is responsible for the management of capital and structural risks, which includes country risk, liquidity and interest rates; | ||||||||||||||||
• Management and optimization of the risk / return; and | ||||||||||||||||
• Advanced methodologies for risk management, such as Value at Risk (VaR) (historical simulation of 521 days, with a confidence level of 99% and a time horizon of one day), scenarios, sensitivity of net interest income, asset value and sensitivity contingency plan. | ||||||||||||||||
The structure of market Risk is part of the Vice President of Risks, which implements the policies of risk. | ||||||||||||||||
7.5) Environmental and Social Risk | ||||||||||||||||
Social and environmental risk management for the wholesale banking customers is accomplished through a management system for customers who have credit limits or credit risk above R$1 million, which considers aspects such as contaminated land, deforestation, working conditions and other social and environmental points of attention in which there is possibility of penalties. A specialized team, with background in Biology, Geology, Health and Safety Engineering and Chemical Engineering, monitors the environmental practices of our wholesale clients. The financial analysis team studies the potential damage and impacts that adverse social and environmental situations may cause to the financial condition of customers and their guarantees. The analysis focuses on preserving capital and market reputation, and the dissemination of this practice is achieved by constant training of both commercial and risk areas on the application of social and environmental risk standards in the credit approval process for corporate client. | ||||||||||||||||
The Bank's Social and Environmental Risk Policy is included under the Social and Environmental Responsibility Policy of the Bank, in accordance with Resolution 4,327 of CMN. | ||||||||||||||||
7.6) Operational Risk Management, Internal Controls, Sarbanes-Oxley Act and Internal Audit | ||||||||||||||||
The local corporative area, Non-Financial Risks, is responsible for implementing the Operational Risks and Internal Controls management of Banco Santander. It is subordinated to unit Control and Risk Consolidation and count with people, structure, standards, methodologies and tools for ensuring adequacy of the management and control model. | ||||||||||||||||
Acts in preventing the operational risk and supports for the continued strengthening of the internal control system, attending the requirements of regulatory agencies, New Basel Agreement – BIS II and Sarbanes Oxley requirements and resolutions of the National Monetary Council. This model also follows the guidelines established by the Santander Spain based on COSO-Committee of Sponsoring Organizations of the Treadway Commission-Internal Control – Integrated Framework 2013. | ||||||||||||||||
The management plays an active part, aligned with the mission of the areas, recognizing, participating and sharing responsibility for: the continuous improvements of the operational and technological risk management culture and structure; improvements in the internal control environment, in order to ensure compliance with the established objectives and goals and also the security and quality of the products and services provided. | ||||||||||||||||
9
Banco Santander’s Board of Directors opted to adopt the Alternative Standardized Approach (ASA) to calculate the installment of Required Notional Equity related to operational risk. | ||||||||||||||||
Additional information on the management models can be found in the annual and social reports on www.santander.com.br/ri. | ||||||||||||||||
Internal Audit reports directly to the Board of Directors, whose activities are supervised by the Audit Committee. | ||||||||||||||||
Internal Audit’s objective is to supervise the compliance, efficiency and effectiveness of internal control systems, as well as the reliability and quality of accounting information. Thus, all Banco Santander’s companies, business units, departments and core services are under its scope of application. The Internal Audit has quality certificate issued by the Institute of Internal Auditors (IIA). | ||||||||||||||||
The Audit Committee and the Board of Directors were informed on Internal Audit’s works to be done during the year 2016, according to its annual plan. | ||||||||||||||||
The Audit Committee favorably reviewed the annual work plan of the Internal Audit and approved of the activity report for the year 2016. | ||||||||||||||||
In order to perform its duties and reduce coverage risks inherent to Conglomerate's activities, the Internal Audit area has internally-developed tools updated whenever necessary. | ||||||||||||||||
Among these tools, it is worth mentioning the risk matrix, for it is used as a planning tool, prioritizing each unit’s risk level, based on, among others, its inherent risks, audit’s last rating, level of compliance with recommendations and size. | ||||||||||||||||
Throughout the twelve months of 2016, internal control procedures and controls on information systems pertaining to units under analysis were assessed according to the work plan for 2016, taking into account their design and operating effectiveness. | ||||||||||||||||
8) People | ||||||||||||||||
When the discussion is about the growth and development of Banco Santander, a force stands out: the People. Having a motivated and dedicated employees is a Decisive factor in making the Bank in the best bank for customers and the best company for professionals. | ||||||||||||||||
Professionals are the strongest link between the Bank and customers and so, day after day, Banco Santander enhances their management practices because knows only with engaged professional, motivated, well trained and with full professional development, the Bank will manage to get more and better customers, satisfied , proud to do business with us and the Santander brand. | ||||||||||||||||
The daily performance of the Banco Santander with customers, employees, shareholders and society is guided by the purpose of the Bank to contribute to people and businesses to prosper and the way you act. | ||||||||||||||||
The Bank has a talented and dedicated team of about 47,000 employees only in Brazil. The Bank seeks professionals who identify with the Corporate Culture, to be a Simple Bank (with uncomplicated and easy services to operate), Personal (with solutions and channels that meet costumers needs and preferences) and Fair (promoting business and relationships that are good for customers, shareholders and employees). In addition to identifying with the culture, our professionals act in their day to day aligned to it. | ||||||||||||||||
9) Sustainable Development | ||||||||||||||||
Sustainability is a strategic part of business, in Santander. It is a commitment that seeks results for business and society in a simple, personal and fair way, which is concretized through a strategy based in three pillars: Social and Financial Inclusion, Education and Social and Environmental Business and Management. Among the fourth quarter highlights of Social and Financial Inclusion are: Santander Microcredit, currently the largest productive and oriented microcredit operation among private banks in Brazil, offering credit and financial advice to low-income micro entrepreneurs and since 2002, it disbursed approximately R$3.8 billion for more than 394,000 customers, the 2016 edition of the "Parceiros em Ação" Program was launched, it promotes financial education and empowers entrepreneurs in the communities where Santander Microcredit operates. This year, 81 entrepreneurs were trained The "Amigo de Valor", program, which allows the Bank, as well as its employees and clients to direct part of their due income tax to the Funds for the Rights of Children and Adolescents, in 2016 directed R$10,583 million for 38 projects distributed in Brazil. Through the corporate program of Volunteer "Escola Brasil" Program 6,049 employees acted as volunteers mobilizing 95,746 people in 438 actions carried out supporting 183 public schools. In relation to the second pillar, Education, the Bank has partnerships with 389 higher education institutions, since 2005 Santander Universidades Brazil has granted over 148,000 scholarships. In the third Pillar, Social and environmental business and management, since 2013, Santander Financiamentos through the CDC Energy Efficiency of Equipment, finances photovoltaic solar energy systems (direct conversion of solar energy into electricity). In 2016, 149 partners with a business turnover above R$19,7 million were accredited. In the “Agro Sustentável” program, Santander currently increased 1,000 customers, more than 220 employers and outsourced firms were trained or sensitized in relation to ERR (Environmental Rural Register) and other socio and environmental issues and 251 customers agreed to participate in the agreement with Coopercitrus and Bayer (Cooperatives). | ||||||||||||||||
10) Independent Audit | ||||||||||||||||
It is part of Banco Santander´s policy to restrict the services provided by the independent auditors, so as to preserve the auditor’s independence and objectivity, in accordance with Brazilian and international standards, which provides the necessity of approval of any services by the Audit Committee of the Bank. | ||||||||||||||||
10
In compliance with CVM Instruction 381/2003, we hereby inform that in the fiscal year ended on December 31, 2016, were provided non-audit services of the financial statements by PricewaterhouseCoopers, which cumulatively represent more than 5% of the related overall audit fee consideration, are these: | ||||||||||||||||
|
|
|
|
|
|
|
|
|
|
|
|
|
|
|
|
|
Description of services | ||||||||||||||||
Review of the Debt Program Global Medium Term Notes. | ||||||||||||||||
Financial and Fiscal Due Diligence. | ||||||||||||||||
*Additional services totaled R$736 thousand reais, representing 6.15% of total remuneration. | ||||||||||||||||
In addition, the Bank confirms that PricewaterhouseCoopers has procedures, policies and controls to ensure its independence, including the review of work performed, including any services other than external audit. This evaluation is based on the applicable regulations and accepted principles that preserve the independence of the auditor: (i) the auditor should not audit their own work; (ii) the auditor should not perform management functions; and (iii) the auditor should not promote the interests of his client. Acceptance and professional services not related to external audit for the period ended December 31, 2016 did not affect the independence and objectivity in the conduct of external audit examinations of the Banco Santander and other Group entities, since the principles above were observed. | ||||||||||||||||
The Board of Directors | ||||||||||||||||
(Authorized at the Meeting of the Board of January 24, 2017). | ||||||||||||||||
*** | ||||||||||||||||
11
(Free Translation into English from the Original Previously Issued in Portuguese) | |||
| BANCO SANTANDER (BRASIL) S.A. E EMPRESAS CONTROLADAS | |||
| Summary of the Report of the Audit Committee - Fiscal Year Endet December, 31 2016 | |||
12

(A free translation of the original in Portuguese)
Independent auditor's report
To the Board of Directors and Stockholders
Banco Santander (Brasil) S.A.
Opinion
We have audited the accompanying parent company financial statements of Banco Santander (Brasil) S.A. ("Bank"), which comprise the balance sheet as at December 31, 2016 and the statements of income, changes in equity and cash flows for the six-month period and year then ended, as well as the accompanying consolidated financial statements of Banco Santander (Brasil) S.A. and its subsidiaries ("Consolidated"), which comprise the consolidated balance sheet as at December 31, 2016 and the consolidated statements of income, changes in equity and cash flows for the six-month period and year then ended, and a summary of significant accounting policies and other explanatory information.
In our opinion, the parent company and consolidated financial statements referred to above present fairly, in all material respects, the financial position of Banco Santander (Brasil) S.A. and of Banco Santander (Brasil) S.A. and its subsidiaries as at December 31, 2016, and their financial performance and cash flows for the six-month period and year then ended, in accordance with accounting practices adopted in Brazil, applicable to institutions authorized to operate by the Brazilian Central Bank (BACEN).
PricewaterhouseCoopers, Av. Francisco Matarazzo 14oo, Torre Torino, São Paulo, SP, Brasil, 05oo1-903,
Caixa Postal 61005 T: (11) 3674-2000, www.pwc.com/br
(DC1) Uso Interno na PwC - Confidencial
13
Banco Santander (Brasil) S.A.
Basis for opinion
We conducted our audit in accordance with Brazilian and International Standards on Auditing. Our responsibilities under those standards are further described in the Auditor's Responsibilities for the Audit of the Parent Company and Consolidated Financial Statements section of our report. We are independent of the Bank and its subsidiaries in accordance with the ethical requirements established in the Code of Professional Ethics and Professional Standards issued by the Brazilian Federal Accounting Council, and we have fulfilled our other ethical responsibilities in accordance with these requirements. We believe that the audit evidence we have obtained is sufficient and appropriate to provide a basis for our audit opinion.
Key audit matters
Key audit matters are those matters that, in our professional judgment, were of most significance in our audit of the financial statements of the current period. These matters were addressed in the context of ouraudit of the parent company and consolidated financialstatements as a whole, and in forming our opinion thereon, and we do not provide a separate opinion on these matters. | 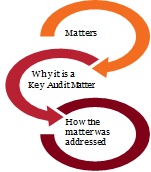 |
Why it is a Key Audit Matter | How the matter was addressed in the audit |
| |
Allowance for loan losses (Notes 3i and 8) |
|
| |
The estimation of the allowance for loan losses involves a high level of judgment by Management. The establishment of the allowance for loan losses involves the assessment of several assumptions and internal and external factors, including default levels and guarantees of the portfolios, renegotiation policy, and the current and prospective economic scenarios. Accordingly, this area was defined as an area of focus in our evaluation. This judgment considers several assumptions in the determination of the allowances. The allowances for loan losses are recorded in accordance with the regulatory requirements of the Brazilian Central Bank, especially Resolution 2,682 of the National Monetary Council (CMN), and are based on the analyses of outstanding receivables (overdue and not yet due), according to the internal policies that consider the establishment of credit ratings (risk classification). Likewise, they consider the expectation of realization of the loan portfolio, in addition to the requirement of current legislation, based on past experience, current scenario and future expectations, specific portfolio risks and Management's assessment of risks in the recording of the allowances. | We carried out procedures to understand and test the internal controls that are significant in the calculation and recognition of the allowance for loan losses, mainly including the following processes: approval of the credit policy; credit analysis; credit granting and renegotiated transactions; attribution of rating considering the risk of the recoverable value of transactions; processing and recording of provisions; reconciliation of accounting balances with the analytical position; and preparation of the notes to the financial statements. We have also conducted tests to verify the integrity and completeness of the database used to calculate the allowance for loan losses, in addition to tests to verify the application of the calculation methodology for these allowances in relation to the ratings attributed, as well as the comparison of the account balances with the analytical reports. We consider that the criteria and assumptions adopted by Management to determine the allowance for loan losses are reasonable, in all material respects, in the context of the financial statements. |
|
|
14
Banco Santander (Brasil) S.A.
Why it is a Key Audit Matter | How the matter was addressed in the audit |
| |
Recognition and recoverable value of tax credits (Notes 3s, 3t and 11) |
|
| |
Tax credits arising from temporary differences in the calculation basis of taxes, as well as tax losses, are recognized in the books based on the expectation that future taxable profits will be available for their realization. The expectation of tax credit realization is based on projections of future results that require judgment by Management, including the use of assumptions. Considering the subjectivity in to this process, this was considered an area of focus in our audit. | We carried out procedures to understand and test the significant internal controls that involve the calculation of tax credits arising from temporary differences and tax losses, as well as the estimates of the recoverable value of these tax credits, in accordance with the applicable standards of the National Monetary Council (CMN) and the Brazilian Central Bank. We obtained an understanding of the critical assumptions included in result projections, and, with the assistance of our experts in company evaluations, we compared them with available macroeconomic data and the Bank's historical andprospective information with regard to their most significant aspects. We performed tests to confirm the nature and amounts of the temporary differences and tax losses that could be deducted from the future tax bases with the assistance of our experts in the tax area. We discussed with Management and the Audit Committee, and confirmed the approval of the technical study that supports the realization of the tax credits by the proper management bodies. We consider that the criteria and assumptions adopted by Management to determine tax credits are reasonable, in all material respects, in the context of the financial statements. |
|
|
15
Banco Santander (Brasil) S.A.
Why it is a Key Audit Matter | How the matter was addressed in the audit |
|
|
Provisions for contingent liabilities (Notes 3q and 23) |
|
|
|
Banco Santander and its subsidiaries are parties to tax, labor and civil proceedings, at the administrative and judicial levels, resulting from the normal course of their business. In general, these proceedings are terminated after a long period and involve not only discussions on merits, but also complex procedural aspects, in accordance with applicable legislation. The decision to recognize a contingent liability and the measurement bases require the judgment of the Bank's Management. In the circumstances, this was considered an area of focus in our audit. | We obtained an understanding and tested the significant internal controls that involve the identification and recording of liabilities, and the disclosures in the notes to the financial statements, which, among others, also considered the internal controls related to the calculation model adopted for the establishment of provisions for labor and civil contingencies, which are recorded under the average historical losses criterion. We tested the application of the mathematical models for the calculation of the average historical losses related to the labor and civil contingencies. We also tested the quantity of outstanding proceedings at the base date of the financial statements. We performed confirmation procedures with the law firms responsible for the significant administrative and judicial proceedings to confirm the assessment of the prognosis, the completeness of the information and the correct amount of the provisions. With the support of our experts, we analyzed the reasonableness of the estimate of loss in the mostsignificant tax, labor and civil proceedings. We consider that the criteria and assumptions adopted by Management to determine the provision for contingent liabilities are reasonable, in all material respects, in the context of the financial statements. |
|
|
16
Banco Santander (Brasil) S.A.
Why it is a Key Audit Matter | How the matter was addressed in the audit |
|
|
Post-employment benefit plans (Notes 3n and 35) |
|
|
|
The Bank has post-employment benefit plans with characteristics of defined benefit, arising from existing plans in institutions acquired in former years, whose amounts are significant in the context of the financial statements, and involve the need to use an adequate database, and the establishment of assumptions with a high degree of subjectivity, such as: discount, inflation and mortality rates. This was an area of focus in our audit, since changes in assumptions may result in significant impacts on the obligations related to defined benefit plans. In addition, the establishment of assumptions involves a significant degree of judgment by Management. | We carried out procedures to understand and test the significant internal controls that involve the recording and measurement of liabilities arising from post-employment benefit plans. Among others, we considered the controls related to the completeness and adequacy of the databases, the existence and correct amount of the assets of the benefit plans, and the approval of assumptions considered in the actuarial calculations. With the assistance of our actuarial experts, we obtained an understanding of the methodologies and judgments used by Management to determine the assumptions applied in the calculation of the obligations in comparison with market parameters. On a sample basis, we re-performed the actuarial calculations carried out by the external actuaries, taking into consideration the assumptions adopted in the calculations. Also, on a sample basis, we tested the existence and the recalculation of the fair value of the plan assets. We consider that the criteria and assumptions adopted by Management to determine the provision for post-employment benefit plans are reasonable, in all material respects, in the context of the financial statements. |
|
|
|
|
|
|
Measurement of the fair value of certain financial instruments and derivatives with low liquidity and without an active market (Notes 3g, 3h and 6) |
|
|
|
The measurement of the fair value of financial instruments was an area of focus of our audit due toits significance in the context of the financial statements, and the involvement of a high level of judgment by Management, since the measurement depend on valuation techniques carried out through internal models, which are based on certain assumptions for the valuation of instruments with low liquidity and without an active market and/or observable data. These financial instruments mostly comprise investments in securities issued by companies and derivative contracts. | We carried out procedures to understand and test the significant internal controls that involve themeasurement, recognition and disclosure of the fair value of financial instruments and derivatives. With the assistance of our experts in the pricing of financial instruments, we obtained an understanding of the pricing calculation methodologies, analyzed the reasonableness of the assumptions used by Management to prepare pricing curves and internal models, and also verified the alignment of these assumptions and models with the practices adopted in the market. We performed independent valuation tests of certain transactions, selected on sampling basis. We consider that the criteria and assumptions adopted by Management to measure the fair value of these financial instruments and derivatives are reasonable, in all material respects, in the context of the financial statements. |
|
|
17
Banco Santander (Brasil) S.A.
Why it is a Key Audit Matter | How the matter was addressed in the audit |
|
|
|
|
Information technology environment |
|
|
|
Banco Santander (Brasil) S.A. has a business environment that is highly dependent on technology, requiring a complex infrastructure to support the high volume of transactions processed daily in its several systems. The risks inherent to information technology, associated with deficiencies in processes and controls that support the processing of the technology systems, considering the legacy systems and existing technology environments, could result in the incorrect processing of critical information, including those used in the preparation of the financial statements. Therefore, this was considered an area of focus in our audit. | With the assistance of our system experts, we evaluated the design and tested the operating effectiveness of the controls related to the management of the information technology environment, including the compensating controls established. The procedures carried out involved the combination of the control tests, and, when applicable, the testing of compensating controls, as well as the conduction of tests regarding the key processes related to information security, the development and maintenance of systems, and the operation of computers related to the infrastructure that supports the Bank's business, including the management of accesses, treatment of incidents, segregation of duties, and cyber security aspects. As a result of this work, we determined the nature and extent of our auditing procedures, and considered that the technology environment processes and controls, associated with the compensating controls and tests conducted, provided a reasonable basis for the result of our audit of the financial statements. |
|
|
|
|
Other matters
Statements of value added
The parent company and consolidated Statements of Value Added for the year ended December 31, 2016, prepared under the responsibility of the Bank's management, and whose presentation is required by the Brazilian corporate legislation for listed companies, but is considered supplementary information for BACEN purposes, were submitted to audit procedures performed in conjunction with the audit of the financial statements. For the purposes of forming our opinion, we evaluated whether these statements are reconciled with the financial statements and accounting records, as applicable, and if their form and content are in accordance with the criteria defined in Technical Pronouncement CPC 09 - "Statement of Added Value". In our opinion, these Statements of Value Added have been properly prepared in all material respects, in accordance with the criteria established in the Technical Pronouncement and are consistent with the parent company and consolidated financial statements taken as a whole.
Audit of comparative figures
The parent company and consolidated financial statements mentioned in the first paragraph include, for comparison purposes, accounting information corresponding to the balance sheet as at December 31, 2015, and the statements of income, changes in equity, cash flows and value added for the year then ended, obtained from the parent company and consolidated financial statements for that year, reclassified by the adjustment described in Note 3(d). The parent company and consolidated financial statements for the year ended December 31, 2015 were audited by another firm of independent auditors whose report, dated January 24, 2017, expressed an unqualified opinion on those statements.
18
Banco Santander (Brasil) S.A.
Other information accompanying the parent company and consolidated financial statements and the independent auditor's report
The Bank's managementis responsible for the other information that comprises the Management Report.
Our opinion on the parent company and consolidated financial statements does not cover the Management Report, and we do not express any form of audit conclusion thereon.
In connection with the audit of the parent company and consolidated financial statements, our responsibility is to read the Management Report and, in doing so, consider whether this report is materially inconsistent with the financial statements or our knowledge obtained in the audit or otherwise appears to be materially misstated. If, based on the work we have performed, we conclude that there is a material misstatement in the Management Report, we are required to report that fact. We have nothing to report in this regard.
Responsibilities of management and those charged with governance for the parent company and consolidated financial statements
Managementis responsible for the preparation and fair presentation of the parent company and consolidated financial statements in accordance with accounting practices adopted in Brazil, applicable toinstitutions authorized to operate by the Brazilian Central Bank (BACEN), and for such internal control as management determines is necessary to enable the preparation of financial statements that are free from material misstatement, whether due to fraud or error.
In preparing the parent company and consolidated financial statements, management is responsible for assessing the ability of the Bank and its subsidiaries to continue as a going concern, disclosing, as applicable, matters related to going concern and using the going concern basis of accounting unless management either intends to liquidate the Bank and its subsidiaries or to cease operations, or has no realistic alternative but to do so.
Those charged with governance are responsible for overseeing the Bank and its subsidiaries' financial reporting process.
Auditor's responsibilities for the audit of the parent company and consolidated financial statements
Our objectives are to obtain reasonable assurance about whether the parent company and consolidated financial statements as a whole are free from material misstatement, whether due to fraud or error, and to issue an auditor's report that includes our opinion. Reasonable assurance is a high level of assurance, but is not a guarantee that an audit conducted in accordance with Brazilian and International Standards on Auditing will always detect a material misstatement when it exists. Misstatements can arise from fraud or error and are considered material if, individually or in the aggregate, they could reasonably be expected to influence the economic decisions of users taken on the basis of these financial statements.
As part of an audit in accordance with Brazilian and International Standards on Auditing, we exercise professional judgment and maintain professional skepticism throughout the audit. We also:
• Identify and assess the risks of material misstatement of the parent company and consolidated financial statements, whether due to fraud or error, design and perform audit procedures responsive to those risks, and obtain audit evidence that is sufficient and appropriate to provide a basis for our opinion. The risk of not detecting a material misstatement resulting from fraud is higher than for one resulting from error, as fraud may involve collusion, forgery, intentional omissions, misrepresentations, or the override of internal control.
19
Banco Santander (Brasil) S.A.
• Obtain an understanding of internal control relevant to the audit in order to design audit procedures that are appropriate in the circumstances, but not for the purpose of expressing an opinion on the effectiveness of the internal control of the Bank and its subsidiaries.
• Evaluate the appropriateness of accounting policies used and the reasonableness of accounting estimates and related disclosures made by management.
• Conclude on the appropriateness of management's use of the going concern basis of accounting and, based on the audit evidence obtained, whether a material uncertainty exists related to events or conditions that may cast significant doubt on the ability of the Bank and its subsidiaries to continue as a going concern. If we conclude that a material uncertainty exists, we are required to draw attention in our auditor's report to the related disclosures in the parent company and consolidated financial statements or, if such disclosures are inadequate, to modify our opinion. Our conclusions are based on the audit evidence obtained up to the date of our auditor's report. However, future events or conditions may cause the Bank and its subsidiaries to cease to continue as a going concern.
• Evaluate the overall presentation, structure and content of the parent company and consolidated financial statements, including the disclosures, and whether the financial statements represent the underlying transactions and events in a manner that achieves fair presentation.
• Obtain sufficient appropriate audit evidence regarding the financial information of the entities or business activities within the Group to express an opinion on the consolidated financial statements. We are responsible for the direction, supervision and performance of the group audit. We remain solely responsible for our audit opinion.
We communicate with those charged with governance regarding, among other matters, the planned scope and timing of the audit and significant audit findings, including any significant deficiencies in internal control that we identify during our audit.
We also provide those charged with governance with a statement that we have complied with relevant ethical requirements regarding independence, and to communicate with them all relationships and other matters that may reasonably be thought to bear on our independence, and where applicable, related safeguards.
From the matters communicated with those charged with governance, we determine those matters that were of most significance in the audit of the financial statements of the current period and are therefore the key audit matters. We describe these matters in our auditor's report unless law or regulation precludes public disclosure about the matter or when, in extremely rare circumstances, we determine that a matter should not be communicated in our report because the adverse consequences of doing so would reasonably be expected to outweigh the public interest benefits of such communication.
São Paulo, January 25, 2017
PricewaterhouseCoopers | Edison Arisa Pereira |
20
(Free Translation into English from the Original Previously Issued in Portuguese) | |||
BANCO SANTANDER (BRASIL) S.A. AND SUBSIDIARIES | |||
BALANCE SHEETS | |||
| In thousands of Brazilian Real - R$, unless otherwise stated | |||
Bank | Consolidated | |||||||||
|
| Notes |
| 12/31/2016 |
| 12/31/2015 |
| 12/31/2016 |
| 12/31/2015 |
Current Assets |
|
|
| 451,755,119 |
| 412,689,314 |
| 451,815,929 |
| 426,064,803 |
Cash |
| 4 |
| 5,513,365 |
| 5,231,627 |
| 5,723,084 |
| 6,863,856 |
Interbank Investments |
| 5 |
| 80,312,979 |
| 74,010,064 |
| 59,513,115 |
| 55,443,206 |
Money Market Investments |
|
|
| 47,405,162 |
| 31,837,273 |
| 47,479,196 |
| 31,990,143 |
Interbank Deposits |
|
|
| 21,909,362 |
| 20,342,010 |
| 1,034,414 |
| 1,622,282 |
Foreign Currency Investments |
|
|
| 10,998,455 |
| 21,830,781 |
| 10,999,505 |
| 21,830,781 |
Securities and Derivative Financial |
|
|
|
|
|
|
|
|
|
|
Instruments |
| 6 |
| 97,187,849 |
| 50,644,888 |
| 90,341,153 |
| 55,477,103 |
Own Portfolio |
|
|
| 40,300,328 |
| 15,371,552 |
| 40,293,749 |
| 12,960,963 |
Subject to Repurchase Commitments |
|
|
| 45,744,640 |
| 26,353,218 |
| 29,724,515 |
| 26,355,623 |
Derivative Financial Instruments |
|
|
| 11,087,166 |
| 6,939,495 |
| 17,307,264 |
| 11,931,802 |
Linked to Central Bank of Brazil |
|
|
| 12,379 |
| 537,278 |
| 12,378 |
| 537,278 |
Privatization Certificates |
|
|
| 927 |
| 819 |
| 927 |
| 819 |
Linked to Guarantees |
|
|
| 42,409 |
| 1,442,526 |
| 3,002,320 |
| 3,690,618 |
Interbank Accounts |
| 7 |
| 62,355,313 |
| 54,869,025 |
| 62,732,413 |
| 55,135,620 |
Payments and Receipts Pending Settlement |
|
|
| 1,179 |
| 1,778 |
| 1,179 |
| 1,778 |
Restricted Deposits: |
|
|
| 60,823,290 |
| 54,831,669 |
| 61,200,390 |
| 55,098,264 |
Central Bank Deposits |
|
|
| 60,821,548 |
| 54,829,213 |
| 61,198,648 |
| 55,095,808 |
National Housing System |
|
|
| 1,742 |
| 2,456 |
| 1,742 |
| 2,456 |
Interbank Transfers |
|
|
| 1,507,241 |
| - |
| 1,507,241 |
| - |
Correspondents |
|
|
| 23,603 |
| 35,578 |
| 23,603 |
| 35,578 |
Lending Operations |
| 8 |
| 72,774,540 |
| 83,380,887 |
| 93,929,025 |
| 102,557,195 |
Public Sector |
|
|
| 3,024 |
| 56,406 |
| 3,024 |
| 56,406 |
Private Sector |
|
|
| 76,601,989 |
| 86,512,527 |
| 97,941,488 |
| 106,176,703 |
Lending Operations Assignment |
|
|
| - |
| 204 |
| 460,090 |
| 204 |
(Allowance for Loan Losses) |
| 8.f |
| (3,830,473) |
| (3,188,250) |
| (4,475,577) |
| (3,676,118) |
Leasing Operations |
| 8 |
| 4 |
| 1 |
| 1,492,080 |
| 1,585,580 |
Public Sector |
|
|
| - |
| - |
| - |
| 131 |
Private Sector |
|
|
| 5 |
| 6 |
| 1,518,203 |
| 1,610,498 |
(Allowance for Lease Losses) |
| 8.f |
| (1) |
| (5) |
| (26,123) |
| (25,049) |
Other Receivables |
|
|
| 132,633,521 |
| 143,631,937 |
| 136,311,891 |
| 147,398,541 |
Credits for Guarantees Honored |
|
|
| 1,062 |
| 844 |
| 1,062 |
| 844 |
Foreign Exchange Portfolio |
| 9 |
| 89,829,757 |
| 94,642,636 |
| 89,829,757 |
| 94,642,636 |
Income Receivable |
|
|
| 1,459,653 |
| 745,898 |
| 747,168 |
| 601,763 |
Trading Account |
| 10 |
| 1,527,178 |
| 1,587,363 |
| 1,695,397 |
| 1,697,899 |
Tax Credits |
| 11 |
| 8,234,581 |
| 8,063,063 |
| 9,102,267 |
| 8,786,456 |
Others |
| 12 |
| 31,949,644 |
| 38,919,702 |
| 35,349,654 |
| 42,030,853 |
(Allowance for Other Receivables Losses) |
| 8.f |
| (368,354) |
| (327,569) |
| (413,414) |
| (361,910) |
Other Assets |
|
|
| 977,548 |
| 920,885 |
| 1,773,168 |
| 1,603,702 |
Non-Current Assets Held for Sale |
| 13 |
| - |
| - |
| - |
| 487,386 |
Other Assets |
|
|
| 740,639 |
| 721,710 |
| 1,317,152 |
| 723,830 |
(Allowance for Valuation) |
|
|
| (78,412) |
| (73,736) |
| (78,413) |
| (73,748) |
Prepaid Expenses |
|
|
| 315,321 |
| 272,911 |
| 534,429 |
| 466,234 |
21
|
|
|
|
|
|
|
|
|
|
|
Long-Term Assets |
|
|
| 274,424,155 |
| 286,568,316 |
| 236,857,511 |
| 237,739,651 |
Interbank Investments |
| 5 |
| 14,812,506 |
| 13,497,719 |
| 156,126 |
| 366,922 |
Interbank Deposits |
|
|
| 14,812,506 |
| 13,497,719 |
| 156,126 |
| 366,922 |
Securities and Derivative Financial |
|
|
|
|
|
|
|
|
|
|
Instruments |
| 6 |
| 126,433,127 |
| 146,319,775 |
| 79,248,514 |
| 87,414,879 |
Own Portfolio |
|
|
| 28,560,600 |
| 26,292,498 |
| 19,747,415 |
| 23,350,447 |
Subject to Repurchase Commitments |
|
|
| 80,468,239 |
| 91,063,021 |
| 40,450,482 |
| 32,605,138 |
Derivative Financial Instruments |
|
|
| 6,763,824 |
| 13,237,376 |
| 6,768,692 |
| 14,078,407 |
Linked to Central Bank of Brazil |
|
|
| 3,032,518 |
| 5,679,037 |
| 3,032,518 |
| 5,679,037 |
Privatization Certificates |
|
|
| 1,846 |
| 2,387 |
| 1,846 |
| 2,387 |
Linked to Guarantees |
|
|
| 7,606,100 |
| 10,045,456 |
| 9,247,561 |
| 11,699,463 |
Interbank Accounts |
| 7 |
| 167,818 |
| 167,818 |
| 167,818 |
| 167,818 |
Restricted Deposits: |
|
|
| 167,818 |
| 167,818 |
| 167,818 |
| 167,818 |
National Housing System |
|
|
| 167,818 |
| 167,818 |
| 167,818 |
| 167,818 |
Lending Operations |
| 8 |
| 84,068,998 |
| 85,225,495 |
| 101,366,048 |
| 101,762,256 |
Public Sector |
|
|
| 63,205 |
| 62,014 |
| 63,205 |
| 62,014 |
Private Sector |
|
|
| 96,120,967 |
| 96,773,748 |
| 114,148,328 |
| 113,895,402 |
Lending Operations Related to Assignment |
|
|
| 164,402 |
| 196,634 |
| 164,402 |
| 196,634 |
(Allowance for Loan Losses) |
| 8.f |
| (12,279,576) |
| (11,806,901) |
| (13,009,887) |
| (12,391,794) |
Leasing Operations |
| 8 |
| 2 |
| 14 |
| 1,332,698 |
| 1,374,449 |
Private Sector |
|
|
| 2 |
| 20 |
| 1,363,828 |
| 1,412,834 |
(Allowance for Lease Losses) |
| 8.f |
| - |
| (6) |
| (31,130) |
| (38,385) |
Other Receivables |
|
|
| 48,306,300 |
| 40,692,028 |
| 53,750,238 |
| 45,753,072 |
Receivables for Guarantees Honored |
|
|
| 53,524 |
| 26,851 |
| 53,524 |
| 26,851 |
Foreign Exchange Portfolio |
| 9 |
| 2,316,371 |
| 1,764,903 |
| 2,316,371 |
| 1,764,903 |
Income Receivable |
|
|
| 213,362 |
| 216,852 |
| 213,362 |
| 216,852 |
Tax Credits |
| 11 |
| 15,548,383 |
| 23,067,813 |
| 17,664,421 |
| 25,201,969 |
Others |
| 12 |
| 30,476,712 |
| 15,886,443 |
| 33,879,141 |
| 18,881,467 |
(Allowance for Other Receivables Losses) |
| 8.f |
| (302,052) |
| (270,834) |
| (376,581) |
| (338,970) |
Other Assets |
|
|
| 635,404 |
| 665,467 |
| 836,069 |
| 900,255 |
Temporary Assets |
|
|
| 101,801 |
| 101,801 |
| 101,809 |
| 101,809 |
(Allowance for Losses) |
|
|
| (1,765) |
| (1,765) |
| (1,773) |
| (1,773) |
Prepaid Expenses |
|
|
| 535,368 |
| 565,431 |
| 736,033 |
| 800,219 |
|
|
|
|
|
|
|
|
|
|
|
Permanent Assets |
|
|
| 26,807,262 |
| 29,030,820 |
| 13,031,097 |
| 13,645,283 |
Investments |
|
|
| 16,500,112 |
| 17,170,957 |
| 177,813 |
| 67,560 |
Investments in Affiliates and Subsidiaries: |
| 15 |
| 16,480,840 |
| 17,152,711 |
| 158,548 |
| 51,747 |
Domestic |
|
|
| 13,928,244 |
| 13,843,934 |
| 158,548 |
| 51,747 |
Foreign |
|
|
| 2,552,596 |
| 3,308,777 |
| - |
| - |
Other Investments |
|
|
| 51,830 |
| 51,446 |
| 62,879 |
| 57,295 |
(Allowance for Losses) |
|
|
| (32,558) |
| (33,200) |
| (43,614) |
| (41,482) |
Fixed Assets |
| 16 |
| 6,043,158 |
| 6,466,313 |
| 7,550,743 |
| 6,986,250 |
Real Estate |
|
|
| 2,538,788 |
| 2,541,302 |
| 2,857,794 |
| 2,648,353 |
Others |
|
|
| 10,923,912 |
| 10,566,480 |
| 12,932,316 |
| 11,723,760 |
(Accumulated Depreciation) |
|
|
| (7,419,542) |
| (6,641,469) |
| (8,239,367) |
| (7,385,863) |
Intangibles |
| 17 |
| 4,263,992 |
| 5,393,550 |
| 5,302,541 |
| 6,591,473 |
Goodwill |
|
|
| 26,120,037 |
| 26,120,037 |
| 27,474,881 |
| 27,490,243 |
Intangible Assets |
|
|
| 8,590,069 |
| 7,321,258 |
| 9,142,961 |
| 7,750,690 |
(Accumulated Amortization) |
|
|
| (30,446,114) |
| (28,047,745) |
| (31,315,301) |
| (28,649,460) |
Total Assets |
|
|
| 752,986,536 |
| 728,288,450 |
| 701,704,537 |
| 677,449,737 |
22
|
|
|
|
|
|
|
|
|
|
|
Current Liabilities |
|
|
| 542,620,235 |
| 474,842,549 |
| 483,912,382 |
| 418,097,819 |
Deposits |
| 18.a |
| 158,705,975 |
| 152,344,715 |
| 97,394,726 |
| 95,684,682 |
Demand Deposits |
|
|
| 16,016,316 |
| 15,775,566 |
| 16,006,319 |
| 15,698,171 |
Savings Deposits |
|
|
| 36,051,476 |
| 35,984,837 |
| 36,051,476 |
| 35,984,837 |
Interbank Deposits |
|
|
| 62,843,599 |
| 59,608,550 |
| 2,240,291 |
| 3,132,439 |
Time Deposits |
|
|
| 43,794,584 |
| 40,975,762 |
| 43,096,551 |
| 40,869,235 |
Other Deposits |
|
|
| - |
| - |
| 89 |
| - |
Money Market Funding |
| 18.b |
| 132,400,766 |
| 99,365,655 |
| 121,760,781 |
| 86,627,754 |
Own Portfolio |
|
|
| 114,772,683 |
| 85,673,417 |
| 113,137,300 |
| 72,935,516 |
Third Parties |
|
|
| 14,799,595 |
| 10,827,806 |
| 5,794,993 |
| 10,827,806 |
Linked to Trading Portfolio Operations |
|
|
| 2,828,488 |
| 2,864,432 |
| 2,828,488 |
| 2,864,432 |
Funds from Acceptance and Issuance of |
|
|
|
|
|
|
|
|
|
|
Securities |
| 18.c |
| 79,435,491 |
| 44,201,390 |
| 81,262,272 |
| 46,814,955 |
Exchange Acceptances |
|
|
| - |
| - |
| 553,811 |
| 504,578 |
Real Estate Credit Notes, Mortgage Notes, |
|
|
|
|
|
|
|
|
|
|
Credit and Similar Notes |
|
|
| 70,650,037 |
| 34,941,349 |
| 71,923,007 |
| 37,050,336 |
Securities Issued Abroad |
|
|
| 7,673,171 |
| 8,478,381 |
| 7,673,171 |
| 8,478,381 |
Funding by Structured Operations Certificates |
| 1,112,283 |
| 781,660 |
| 1,112,283 |
| 781,660 | ||
Interbank Accounts |
| 7 |
| 43,995 |
| 14,405 |
| 43,995 |
| 14,405 |
Correspondents |
|
|
| 43,995 |
| 14,405 |
| 43,995 |
| 14,405 |
Interbranch Accounts |
|
|
| 3,886,513 |
| 3,817,511 |
| 3,886,557 |
| 3,817,555 |
Third-Party Funds in Transit |
|
|
| 3,886,121 |
| 3,817,117 |
| 3,886,121 |
| 3,817,117 |
Internal Transfers of Assets |
|
|
| 392 |
| 394 |
| 436 |
| 438 |
Borrowings |
| 18.e |
| 29,839,343 |
| 33,378,891 |
| 28,557,611 |
| 33,453,687 |
Local Borrowings - Other Institutions |
|
|
| - |
| 4,333 |
| 41,667 |
| 78,917 |
Foreign Borrowings |
|
|
| 29,839,343 |
| 33,374,558 |
| 28,515,944 |
| 33,374,770 |
Domestic Onlendings - Official Institutions | 18.e |
| 4,981,107 |
| 5,137,083 |
| 4,981,107 |
| 5,137,083 | |
National Treasury |
|
|
| - |
| 105 |
| - |
| 105 |
National Economic and Social Development |
|
|
|
|
|
|
|
|
|
|
Bank (BNDES) |
|
|
| 2,422,382 |
| 2,351,174 |
| 2,422,382 |
| 2,351,174 |
Federal Savings and Loan Bank (CEF) |
|
|
| 4,023 |
| 4,373 |
| 4,023 |
| 4,373 |
National Equipment Financing Authority (FINAME) |
| 2,321,457 |
| 2,564,993 |
| 2,321,457 |
| 2,564,993 | ||
Other Institutions |
|
|
| 233,245 |
| 216,438 |
| 233,245 |
| 216,438 |
Derivative Financial Instruments |
| 6 |
| 8,442,552 |
| 6,759,506 |
| 14,585,133 |
| 11,604,277 |
Derivative Financial Instruments |
|
|
| 8,442,552 |
| 6,759,506 |
| 14,585,133 |
| 11,604,277 |
Other Payables |
|
|
| 124,884,493 |
| 129,823,393 |
| 131,440,200 |
| 134,943,421 |
Collected Taxes and Other |
|
|
| 136,701 |
| 137,250 |
| 165,173 |
| 156,399 |
Foreign Exchange Portfolio |
| 9 |
| 84,631,442 |
| 84,694,924 |
| 84,631,442 |
| 84,694,924 |
Social and Statutory |
|
|
| 4,591,369 |
| 2,974,963 |
| 4,707,285 |
| 3,038,619 |
Tax and Social Security |
| 19 |
| 1,891,028 |
| 2,120,847 |
| 2,442,614 |
| 2,724,378 |
Trading Account |
| 10 |
| 971,989 |
| 2,340,787 |
| 1,236,059 |
| 2,544,961 |
Subordinated Debt |
| 20 |
| - |
| 7,685,328 |
| - |
| 7,685,328 |
Debt Instruments Eligible to Compose Capital |
| 21 |
| 114,104 |
| 218,009 |
| 114,104 |
| 218,009 |
Others |
| 22 |
| 32,547,860 |
| 29,651,285 |
| 38,143,523 |
| 33,880,803 |
23
|
|
|
|
|
|
|
|
|
|
|
Long-Term Liabilities |
|
|
| 152,246,637 |
| 198,260,440 |
| 156,930,276 |
| 202,191,249 |
Deposits |
| 18.a |
| 50,153,678 |
| 48,758,538 |
| 48,310,437 |
| 46,201,330 |
Interbank Deposits |
|
|
| 2,253,495 |
| 2,301,113 |
| 882,147 |
| 542,833 |
Time Deposits |
|
|
| 47,900,183 |
| 46,457,425 |
| 47,428,290 |
| 45,658,497 |
Money Market Funding |
| 18.b |
| 39,162,956 |
| 48,333,077 |
| 39,162,956 |
| 48,332,677 |
Own Portfolio |
|
|
| 10,440,823 |
| 31,282,876 |
| 10,440,823 |
| 31,282,476 |
Linked to Trading Portfolio Operations |
|
|
| 28,722,133 |
| 17,050,201 |
| 28,722,133 |
| 17,050,201 |
Funds from Acceptance and Issuance of |
|
|
|
|
|
|
|
|
|
|
Securities |
| 18.c |
| 21,626,157 |
| 51,224,195 |
| 23,907,802 |
| 53,033,159 |
Exchange Acceptances |
|
|
| - |
| - |
| 536,444 |
| 479,684 |
Real Estate Credit Notes, Mortgage Notes, |
|
|
|
|
|
|
|
|
|
|
Credit and Similar Notes |
|
|
| 21,453,818 |
| 46,226,988 |
| 23,199,019 |
| 47,556,268 |
Securities Issued Abroad |
|
|
| 49,031 |
| 4,993,915 |
| 49,031 |
| 4,993,915 |
Funding by Structured Operations Certificates |
| 123,308 |
| 3,292 |
| 123,308 |
| 3,292 | ||
Borrowings |
| 18.e |
| 1,638,173 |
| 3,308,742 |
| 2,042,406 |
| 3,308,742 |
Local Borrowings - Other Institutions |
|
|
| - |
| - |
| 404,233 |
| - |
Foreign Borrowings |
|
|
| 1,638,173 |
| 3,308,742 |
| 1,638,173 |
| 3,308,742 |
Domestic Onlendings - Official Institutions | 18.e |
| 11,821,538 |
| 11,125,808 |
| 11,821,538 |
| 11,125,808 | |
National Treasury |
|
|
| - |
| 313 |
| - |
| 313 |
National Economic and Social Development |
|
|
|
|
|
|
|
|
|
|
Bank (BNDES) |
|
|
| 7,000,580 |
| 5,534,930 |
| 7,000,580 |
| 5,534,930 |
Federal Savings and Loan Bank (CEF) |
|
|
| 95,720 |
| 103,906 |
| 95,720 |
| 103,906 |
National Equipment Financing Authority (FINAME) |
| 4,719,077 |
| 5,479,554 |
| 4,719,077 |
| 5,479,554 | ||
Other Institutions |
|
|
| 6,161 |
| 7,105 |
| 6,161 |
| 7,105 |
Derivative Financial Instruments |
| 6 |
| 5,185,103 |
| 10,271,926 |
| 5,359,381 |
| 11,278,682 |
Derivative Financial Instruments |
|
|
| 5,185,103 |
| 10,271,926 |
| 5,359,381 |
| 11,278,682 |
Other Payables |
|
|
| 22,659,032 |
| 25,238,154 |
| 26,325,756 |
| 28,910,851 |
Foreign Exchange Portfolio |
| 9 |
| 2,121,659 |
| 4,635,141 |
| 2,121,659 |
| 4,635,141 |
Tax and Social Security |
| 19 |
| 6,224,868 |
| 4,868,560 |
| 9,150,993 |
| 7,819,728 |
Negotiation and Intermediation of Securities |
| 10 |
| 1,386 |
| 57,560 |
| 1,386 |
| 57,560 |
Subordinated Debts |
| 20 |
| 466,246 |
| 411,976 |
| 466,246 |
| 411,976 |
Debt Instruments Eligible to Compose Capital |
| 21 |
| 8,200,695 |
| 9,744,136 |
| 8,200,695 |
| 9,744,136 |
Others |
| 22 |
| 5,644,178 |
| 5,520,781 |
| 6,384,777 |
| 6,242,310 |
|
|
|
|
|
|
|
|
|
|
|
Deferred Income |
|
|
| 365,087 |
| 364,172 |
| 564,609 |
| 385,466 |
Deferred Income |
|
|
| 365,087 |
| 364,172 |
| 564,609 |
| 385,466 |
|
|
|
|
|
|
|
|
|
|
|
Stockholders' Equity |
| 24 |
| 57,754,577 |
| 54,821,289 |
| 57,771,524 |
| 54,819,073 |
Capital: |
|
|
| 57,000,000 |
| 57,000,000 |
| 57,000,000 |
| 57,000,000 |
Brazilian Residents |
|
|
| 4,808,186 |
| 4,808,186 |
| 4,808,186 |
| 4,808,186 |
Foreign Residents |
|
|
| 52,191,814 |
| 52,191,814 |
| 52,191,814 |
| 52,191,814 |
Capital Reserves |
|
|
| 395,925 |
| 433,473 |
| 396,951 |
| 436,389 |
Profit Reserves |
|
|
| 3,024,381 |
| 2,752,744 |
| 3,039,459 |
| 2,775,120 |
Adjustment to Fair Value |
|
|
| (2,151,695) |
| (4,940,975) |
| (2,150,852) |
| (4,968,483) |
(-) Treasury Shares | (514,034) |
| (423,953) |
| (514,034) |
| (423,953) | |||
|
|
|
|
|
|
|
|
|
|
|
Non Controlling Interest |
|
|
| - |
| - |
| 2,525,746 |
| 1,956,130 |
Total Stockholders' Equity |
|
|
| 57,754,577 |
| 54,821,289 |
| 60,297,270 |
| 56,775,203 |
|
|
|
|
|
|
|
|
|
|
|
Total Liabilities |
|
|
| 752,986,536 |
| 728,288,450 |
| 701,704,537 |
| 677,449,737 |
The accompanying notes from Management are an integral part of these financial statements. | ||||||||||
24
(Free Translation into English from the Original Previously Issued in Portuguese) | |||
BANCO SANTANDER (BRASIL) S.A. AND SUBSIDIARIES | |||
INCOME STATEMENTS | |||
| In thousands of Brazilian Real - R$, unless otherwise stated | |||
Bank | Consolidated | |||||||||||||
07/01 to | 01/01 to | 01/01 to | 07/01 to | 01/01 to | 01/01 to | |||||||||
|
| Notes |
| 12/31/2016 |
| 12/31/2016 |
| 12/31/2015 |
| 12/31/2016 |
| 12/31/2016 |
| 12/31/2015 |
Financial Income |
|
|
| 45,299,082 |
| 90,968,893 |
| 82,686,192 |
| 42,514,704 |
| 85,909,559 |
| 80,766,166 |
Lending Operations |
|
|
| 19,255,714 |
| 31,641,657 |
| 48,912,998 |
| 23,754,795 |
| 40,296,634 |
| 56,603,630 |
Leasing Operations |
|
|
| - |
| - |
| - |
| 229,258 |
| 453,092 |
| 468,117 |
Securities Transactions |
| 6.a |
| 19,163,130 |
| 36,831,272 |
| 39,774,246 |
| 12,225,024 |
| 23,466,402 |
| 29,486,609 |
Derivatives Transactions |
|
|
| 1,764,390 |
| 6,833,349 |
| (8,937,641) |
| 1,077,227 |
| 5,853,244 |
| (8,784,625) |
Foreign Exchange Operations |
|
|
| 1,392,147 |
| 8,597,403 |
| (1,372,913) |
| 1,479,881 |
| 8,730,862 |
| (1,346,240) |
Operations of Sale or Transfer of Financial Assets |
|
|
| - |
| 626 |
| 21,475 |
| 3,500 |
| 6,057 |
| 23,140 |
Compulsory Deposits |
|
|
| 3,723,701 |
| 7,064,586 |
| 4,288,027 |
| 3,745,019 |
| 7,103,268 |
| 4,315,535 |
|
|
|
|
|
|
|
|
|
|
|
|
|
| |
Financial Expenses |
|
|
| (37,595,296) |
| (67,657,273) |
| (79,437,205) |
| (33,071,983) |
| (59,111,741) |
| (74,729,038) |
Funding Operations Market |
| 18.d |
| (29,725,952) |
| (61,042,902) |
| (55,783,751) |
| (24,188,423) |
| (50,546,182) |
| (49,361,184) |
Borrowings and Onlendings Operations |
|
|
| (1,251,768) |
| 5,002,138 |
| (10,142,947) |
| (1,396,856) |
| 4,674,222 |
| (10,594,873) |
Leasing Operations |
|
|
| (84) |
| (161) |
| (72) |
| - |
| - |
| - |
Allowance for Loan Losses |
| 8.f |
| (6,617,492) |
| (11,616,348) |
| (13,510,435) |
| (7,486,704) |
| (13,239,781) |
| (14,772,981) |
|
|
|
|
|
|
|
|
|
|
|
|
|
|
|
Gross Profit From Financial Operations |
|
|
| 7,703,786 |
| 23,311,620 |
| 3,248,987 |
| 9,442,721 |
| 26,797,818 |
| 6,037,128 |
|
|
|
|
|
|
|
|
|
|
|
|
|
|
|
Other Operating (Expenses) Income |
|
|
| (4,203,956) |
| (10,249,408) |
| (4,280,262) |
| (5,792,747) |
| (13,018,924) |
| (6,414,626) |
Income from Services Rendered |
| 27 |
| 4,222,580 |
| 8,516,904 |
| 7,881,770 |
| 5,458,787 |
| 10,307,587 |
| 8,974,839 |
Income from Banking Fees |
| 27 |
| 1,499,738 |
| 2,791,600 |
| 2,355,612 |
| 1,840,759 |
| 3,410,665 |
| 2,892,602 |
Personnel Expenses |
| 28 |
| (3,619,780) |
| (6,882,891) |
| (6,153,328) |
| (3,994,604) |
| (7,594,675) |
| (6,818,868) |
Other Administrative Expenses |
| 29 |
| (4,943,753) |
| (9,742,549) |
| (10,776,635) |
| (5,783,273) |
| (11,309,008) |
| (12,025,992) |
Tax Expenses |
| 30 |
| (1,324,015) |
| (3,326,637) |
| (1,252,950) |
| (1,711,890) |
| (4,043,926) |
| (1,870,911) |
Investments in Affiliates and Subsidiaries |
| 15 |
| 932,124 |
| 1,418,525 |
| 1,453,252 |
| 807 |
| 1,477 |
| 1,505 |
Other Operating Income |
| 31 |
| 1,722,475 |
| 3,438,806 |
| 10,840,169 |
| 1,975,920 |
| 4,202,967 |
| 11,098,990 |
Other Operating Expenses |
| 32 |
| (2,693,325) |
| (6,463,166) |
| (8,628,152) |
| (3,579,253) |
| (7,994,011) |
| (8,666,791) |
|
|
|
|
|
|
|
|
|
|
|
|
|
|
|
Operating Income |
|
|
| 3,499,830 |
| 13,062,212 |
| (1,031,275) |
| 3,649,974 |
| 13,778,894 |
| (377,498) |
|
|
|
|
|
|
|
|
|
|
|
|
|
|
|
Non-Operating Income |
| 33 |
| (455,198) |
| (431,997) |
| 537,034 |
| (436,227) |
| (415,601) |
| 566,407 |
|
|
|
|
|
|
|
|
|
|
|
|
|
|
|
Income Before Taxes on Income and Profit Sharing |
| 3,044,632 |
| 12,630,215 |
| (494,241) |
| 3,213,747 |
| 13,363,293 |
| 188,909 | ||
|
|
|
|
|
|
|
|
|
|
|
|
|
|
|
Income Tax and Social Contribution |
| 34 |
| 483,430 |
| (5,972,044) |
| 8,657,287 |
| 420,454 |
| (6,496,717) |
| 8,261,064 |
Provision for Income Tax |
|
|
| 615,122 |
| (234,779) |
| (191,819) |
| 526,153 |
| (595,075) |
| (709,636) |
Provision for Social Contribution Tax |
|
|
| 434,720 |
| (364,910) |
| (92,692) |
| 380,788 |
| (641,669) |
| (436,217) |
Deferred Tax Credits |
|
|
| (566,412) |
| (5,372,355) |
| 8,941,798 |
| (486,487) |
| (5,259,973) |
| 9,406,917 |
|
|
|
|
|
|
|
|
|
|
|
|
|
|
|
Profit Sharing |
|
|
| (561,646) |
| (1,136,534) |
| (1,180,148) |
| (594,711) |
| (1,208,821) |
| (1,260,368) |
|
|
|
|
|
|
|
|
|
|
|
|
|
|
|
Non Controlling Interest |
|
|
| - |
| - |
| - |
| (66,634) |
| (124,793) |
| (191,409) |
|
|
|
|
|
|
|
|
|
|
|
|
|
|
|
Net Income |
|
|
| 2,966,416 |
| 5,521,637 |
| 6,982,898 |
| 2,972,856 |
| 5,532,962 |
| 6,998,196 |
|
|
|
|
|
|
|
|
|
|
|
|
|
|
|
Number of Shares (Thousands) |
| 24.a |
| 7,511,511 |
| 7,511,511 |
| 7,522,647 |
|
|
|
|
|
|
Net Income per Thousand Shares (R$) |
|
|
| 394.92 |
| 735.09 |
| 928.25 |
|
|
|
|
|
|
The accompanying notes from Management are an integral part of these financial statements. | ||||||||||||||
25
(Free Translation into English from the Original Previously Issued in Portuguese) | |||
BANCO SANTANDER (BRASIL) S.A. AND SUBSIDIARIES | |||
STATEMENTS OF CHANGES IN STOCKHOLDERS' EQUITY - BANK | |||
| In thousands of Brazilian Real - R$, unless otherwise stated | |||
Profit Reserves | Adjustment to Fair Value | ||||||||||||||||||||
Reserve for | Others | ||||||||||||||||||||
Capital | Legal | Dividend | Own | Affiliates and | Adjustment | Retained | (-)Treasury | ||||||||||||||
| Notes |
| Capital |
| Reserves |
| Reserve |
| Equalization |
| Position |
| Subsidiaries |
| to Fair Value |
| Earnings |
| Shares |
| Total |
|
|
|
|
|
|
|
|
|
|
|
|
|
|
|
|
|
|
|
|
|
|
Balances as of December 31, 2014 |
|
| 57,000,000 |
| 548,164 |
| 1,489,139 |
| 615,066 |
| 117,875 |
| (118,161) |
| (1,881,352) |
| - |
| (445,501) |
| 57,325,230 |
Employee Benefit Plan |
|
| - |
| - |
| - |
| - |
| - |
| - |
| 739,706 |
| - |
| - |
| 739,706 |
Treasury Shares | 24.d |
| - |
| - |
| - |
| - |
| - |
| - |
| - |
| - |
| (246,975) |
| (246,975) |
Result of Treasury Shares | 24.d |
| - |
| (3,918) |
| - |
| - |
| - |
| - |
| - |
| - |
| - |
| (3,918) |
Reservations for Share - Based Payment |
|
| - |
| 157,800 |
| - |
| - |
| - |
| - |
| - |
| - |
| - |
| 157,800 |
Adjustment to Fair Value - Securities and | |||||||||||||||||||||
Derivative Financial Instruments |
|
| - |
| - |
| - |
| - |
| (3,775,291) |
| (23,752) |
| - |
| - |
| - |
| (3,799,043) |
Restructuring of Capital | 24.d |
| - |
| - |
| - |
| - |
| - |
| - |
| - |
| - |
| (50) |
| (50) |
Cancellation of Shares | 24.d |
| - |
| (268,573) |
| - |
| - |
| - |
| - |
| - |
| - |
| 268,573 |
| - |
Net Income |
|
| - |
| - |
| - |
| - |
| - |
| - |
| - |
| 6,982,898 |
| - |
| 6,982,898 |
Allocations: |
|
|
|
|
|
|
|
|
|
|
|
|
|
|
|
|
|
|
|
|
|
Legal Reserve | 24.c |
| - |
| - |
| 349,235 |
| - |
| - |
| - |
| - |
| (349,235) |
| - |
| - |
Dividends | 24.b |
| - |
| - |
| - |
| (3,050,000) |
| - |
| - |
| - |
| (1,750,000) |
| - |
| (4,800,000) |
Interest on Capital | 24.b |
| - |
| - |
| - |
| - |
| - |
| - |
| - |
| (1,400,000) |
| - |
| (1,400,000) |
Reserve for Dividend Equalization | 24.c |
| - |
| - |
| - |
| 3,483,663 |
| - |
| - |
| - |
| (3,483,663) |
| - |
| - |
Others |
|
| - |
| - |
| - |
| (134,359) |
| - |
| - |
| - |
| - |
| - |
| (134,359) |
Balances as of December 31, 2015 |
|
| 57,000,000 |
| 433,473 |
| 1,838,374 |
| 914,370 |
| (3,657,416) |
| (141,913) |
| (1,141,646) |
| - |
| (423,953) |
| 54,821,289 |
Employee Benefit Plan |
|
| - |
| - |
| - |
| - |
| - |
| - |
| (941,834) |
| - |
| - |
| (941,834) |
Treasury Shares | 24.d |
| - |
| - |
| - |
| - |
| - |
| - |
| - |
| - |
| (90,031) |
| (90,031) |
Result of Treasury Shares | 24.d |
| - |
| (11,574) |
| - |
| - |
| - |
| - |
| - |
| - |
| - |
| (11,574) |
Reservations for Share - Based Payment |
|
| - |
| (33,130) |
| - |
| - |
| - |
| - |
| - |
| - |
| - |
| (33,130) |
Adjustment to Fair Value - Securities and | |||||||||||||||||||||
Derivative Financial Instruments |
|
| - |
| - |
| - |
| - |
| 3,520,603 |
| 210,511 |
| - |
| - |
| - |
| 3,731,114 |
Restructuring of Capital | 24.d |
| - |
| - |
| - |
| - |
| - |
| - |
| - |
| - |
| (50) |
| (50) |
Dividends based on the dividend equalization reserve | 24.b |
| - |
| - |
| - |
| (700,000) |
| - |
| - |
| - |
| - |
| - |
| (700,000) |
Net Income |
|
| - |
| - |
| - |
| - |
| - |
| - |
| - |
| 5,521,637 |
| - |
| 5,521,637 |
Allocations: |
|
|
|
|
|
|
|
|
|
|
|
|
|
|
|
|
|
|
|
|
|
Legal Reserve | 24.c |
| - |
| - |
| 276,082 |
| - |
| - |
| - |
| - |
| (276,082) |
| - |
| - |
Dividends | 24.b |
| - |
| - |
| - |
| - |
| - |
| - |
| - |
| (700,000) |
| - |
| (700,000) |
Interest on Capital | 24.b |
| - |
| - |
| - |
| - |
| - | �� | - |
| - |
| (3,850,000) |
| - |
| (3,850,000) |
Reserve for Dividend Equalization | 24.c |
| - |
| - |
| - |
| 695,555 |
| - |
| - |
| - |
| (695,555) |
| - |
| - |
Others |
|
| - |
| 7,156 |
| - |
| - |
| - |
| - |
| - |
| - |
| - |
| 7,156 |
Balances as of December 31, 2016 |
|
| 57,000,000 |
| 395,925 |
| 2,114,456 |
| 909,925 |
| (136,813) |
| 68,598 |
| (2,083,480) |
| - |
| (514,034) |
| 57,754,577 |
|
|
|
|
|
|
|
|
|
|
|
|
|
|
|
|
|
|
|
|
|
|
Balances as of June 30, 2016 |
|
| 57,000,000 |
| 412,934 |
| 1,966,135 |
| 2,841,830 |
| (681,022) |
| 68,201 |
| (1,312,216) |
| - |
| (449,086) |
| 59,846,776 |
Employee Benefit Plan |
|
| - |
| - |
| - |
| - |
| - |
| - |
| (771,264) |
| - |
| - |
| (771,264) |
Treasury Shares | 24.d |
| - |
| - |
| - |
| - |
| - |
| - |
| - |
| - |
| (64,923) |
| (64,923) |
Result of Treasury Shares | 24.d |
| - |
| (5,610) |
| - |
| - |
| - |
| - |
| - |
| - |
| - |
| (5,610) |
Reservations for Share - Based Payment |
|
| - |
| (18,555) |
| - |
| - |
| - |
| - |
| - |
| - |
| - |
| (18,555) |
Adjustment to Fair Value - Securities and | |||||||||||||||||||||
Derivative Financial Instruments |
|
| - |
| - |
| - |
| - |
| 544,209 |
| 397 |
| - |
| - |
| - |
| 544,606 |
Restructuring of Capital | 24.d |
| - |
| - |
| - |
| - |
| - |
| - |
| - |
| - |
| (25) |
| (25) |
Dividends based on the dividend equalization reserve | 24.b |
| - |
| - |
| - |
| (700,000) |
| - |
| - |
| - |
| - |
| - |
| (700,000) |
Net Income |
|
| - |
| - |
| - |
| - |
| - |
| - |
| - |
| 2,966,416 |
| - |
| 2,966,416 |
Allocations: |
|
|
|
|
|
|
|
|
|
|
|
|
|
|
|
|
|
|
|
|
|
Legal Reserve | 24.c |
| - |
| - |
| 148,321 |
| - |
| - |
| - |
| - |
| (148,321) |
| - |
| - |
Dividends | 24.b |
| - |
| - |
| - |
| - |
| - |
| - |
| - |
| (700,000) |
| - |
| (700,000) |
Interest on Capital | 24.b |
| - |
| - |
| - |
| - |
| - |
| - |
| - |
| (3,350,000) |
| - |
| (3,350,000) |
Reserve for Dividend Equalization | 24.c |
| - |
| - |
| - |
| (1,231,905) |
| - |
| - |
| - |
| 1,231,905 |
| - |
| - |
Others |
|
| - |
| 7,156 |
| - |
| - |
| - |
| - |
| - |
| - |
| - |
| 7,156 |
Balances as of December 31, 2016 |
|
| 57,000,000 |
| 395,925 |
| 2,114,456 |
| 909,925 |
| (136,813) |
| 68,598 |
| (2,083,480) |
| - |
| (514,034) |
| 57,754,577 |
The accompanying notes from Management are an integral part of these financial statements. | |||||||||||||||||||||
26
(Free Translation into English from the Original Previously Issued in Portuguese) | |||
BANCO SANTANDER (BRASIL) S.A. AND SUBSIDIARIES | |||
STATEMENTS OF CHANGES IN STOCKHOLDERS' EQUITY - CONSOLIDATED | |||
| In thousands of Brazilian Real - R$, unless otherwise stated | |||
Profit Reserves | Adjustment to Fair Value | ||||||||||||||||||||||||
Reserve for | Others | Total | |||||||||||||||||||||||
Capital | Legal | Dividend | Own | Affiliates and | Adjustment | Retained | (-)Treasury | Stockholders' | Minority | Stockholders' | |||||||||||||||
| Notes |
| Capital |
| Reserves |
| Reserve |
| Equalization |
| Position |
| Subsidiaries |
| to Fair Value |
| Earnings |
| Shares |
| Equity |
| Interest |
| Equity |
|
|
|
|
|
|
|
|
|
|
|
|
|
|
|
|
|
|
|
|
|
|
|
|
| |
Balances as of December 31, 2014 |
|
| 57,000,000 |
| 548,641 |
| 1,489,139 |
| 608,434 |
| 119,485 |
| (118,161) |
| (1,881,352) |
| - |
| (445,501) |
| 57,320,685 |
| 1,141,420 |
| 58,462,105 |
Employee Benefit Plan |
|
| - |
| - |
| - |
| - |
| - |
| - |
| 739,706 |
| - |
| - |
| 739,706 |
| - |
| 739,706 |
Treasury Shares | 24.d |
| - |
| - |
| - |
| - |
| - |
| - |
| - |
| - |
| (246,975) |
| (246,975) |
| - |
| (246,975) |
Result of Treasury Shares | 24.d |
| - |
| (3,918) |
| - |
| - |
| - |
| - |
| - |
| - |
| - |
| (3,918) |
| - |
| (3,918) |
Reservations for Share - Based Payment |
|
| - |
| 160,239 |
| - |
| - |
| - |
| - |
| - |
| - |
| - |
| 160,239 |
| - |
| 160,239 |
Adjustment to Fair Value - Securities and | |||||||||||||||||||||||||
Derivative Financial Instruments |
|
| - |
| - |
| - |
| - |
| (3,775,291) |
| (23,752) |
| - |
| - |
| - |
| (3,799,043) |
| - |
| (3,799,043) |
Restructuring of Capital | 24.d |
| - |
| - |
| - |
| - |
| - |
| - |
| - |
| - |
| (50) |
| (50) |
| - |
| (50) |
Cancellation of Shares | 24.d |
| - |
| (268,573) |
| - |
| - |
| - |
| - |
| - |
| - |
| 268,573 |
| - |
| - |
| - |
Net Income |
|
| - |
| - |
| - |
| - |
| - |
| - |
| - |
| 6,998,196 |
| - |
| 6,998,196 |
| - |
| 6,998,196 |
Allocations: |
|
|
|
|
|
|
|
|
|
|
|
|
|
|
|
|
|
|
|
|
|
|
|
|
|
Legal Reserve | 24.c |
| - |
| - |
| 349,235 |
| - |
| - |
| - |
| - |
| (349,235) |
| - |
| - |
| - |
| - |
Dividends | 24.b |
| - |
| - |
| - |
| (3,050,000) |
| - |
| - |
| - |
| (1,750,000) |
| - |
| (4,800,000) |
| - |
| (4,800,000) |
Interest on Capital | 24.b |
| - |
| - |
| - |
| - |
| - |
| - |
| - |
| (1,400,000) |
| - |
| (1,400,000) |
| - |
| (1,400,000) |
Reserve for Dividend Equalization | 24.c |
| - |
| - |
| - |
| 3,512,672 |
| (29,118) |
| - |
| - |
| (3,498,961) |
| - |
| (15,407) |
| - |
| (15,407) |
Non Controlling Interest Results |
|
| - |
| - |
| - |
| - |
| - |
| - |
| - |
| - |
| - |
| - |
| 191,409 |
| 191,409 |
Others |
|
| - |
| - |
| - |
| (134,360) |
| - |
| - |
| - |
| - |
| - |
| (134,360) |
| 623,301 |
| 488,941 |
Balances as of December 31, 2015 |
|
| 57,000,000 |
| 436,389 |
| 1,838,374 |
| 936,746 |
| (3,684,924) |
| (141,913) |
| (1,141,646) |
| - |
| (423,953) |
| 54,819,073 |
| 1,956,130 |
| 56,775,203 |
Employee Benefit Plan |
|
| - |
| - |
| - |
| - |
| - |
| - |
| (941,834) |
| - |
| - |
| (941,834) |
| - |
| (941,834) |
Treasury Shares | 24.d |
| - |
| - |
| - |
| - |
| - |
| - |
| - |
| - |
| (90,031) |
| (90,031) |
| - |
| (90,031) |
Result of Treasury Shares | 24.d |
| - |
| (11,574) |
| - |
| - |
| - |
| - |
| - |
| - |
| - |
| (11,574) |
| - |
| (11,574) |
Reservations for Share - Based Payment |
|
| - |
| (35,020) |
| - |
| - |
| - |
| - |
| - |
| - |
| - |
| (35,020) |
| - |
| (35,020) |
Adjustment to Fair Value - Securities and | |||||||||||||||||||||||||
Derivative Financial Instruments |
|
| - |
| - |
| - |
| - |
| 3,520,603 |
| 210,511 |
| - |
| - |
| - |
| 3,731,114 |
| - |
| 3,731,114 |
Restructuring of Capital | 24.d |
| - |
| - |
| - |
| - |
| - |
| - |
| - |
| - |
| (50) |
| (50) |
| - |
| (50) |
Dividends based on the Dividend Equalization Reserve | 24.b |
| - |
| - |
| - |
| (700,000) |
| - |
| - |
| - |
| - |
| - |
| (700,000) |
| - |
| (700,000) |
Net Income |
|
| - |
| - |
| - |
| - |
| - |
| - |
| - |
| 5,532,962 |
| - |
| 5,532,962 |
| - |
| 5,532,962 |
Allocations: |
|
|
|
|
|
|
|
|
|
|
|
|
|
|
|
|
|
|
|
|
|
|
|
|
|
Legal Reserve | 24.c |
| - |
| - |
| 276,082 |
| - |
| - |
| - |
| - |
| (276,082) |
| - |
| - |
| - |
| - |
Dividends | 24.b |
| - |
| - |
| - |
| - |
| - |
| - |
| - |
| (700,000) |
| - |
| (700,000) |
| - |
| (700,000) |
Interest on Capital | 24.b |
| - |
| - |
| - |
| - |
| - |
| - |
| - |
| (3,850,000) |
| - |
| (3,850,000) |
| - |
| (3,850,000) |
Reserve for Dividend Equalization | 24.c |
| - |
| - |
| - |
| 688,257 |
| 28,351 |
| - |
| - |
| (706,880) |
| - |
| 9,728 |
| - |
| 9,728 |
Non Controlling Interest Results |
|
| - |
| - |
| - |
| - |
| - |
| - |
| - |
| - |
| - |
| - |
| 124,793 |
| 124,793 |
Others |
|
| - |
| 7,156 |
| - |
| - |
| - |
| - |
| - |
| - |
| - |
| 7,156 |
| 444,823 |
| 451,979 |
Balances as of December 31, 2016 |
|
| 57,000,000 |
| 396,951 |
| 2,114,456 |
| 925,003 |
| (135,970) |
| 68,598 |
| (2,083,480) |
| - |
| (514,034) |
| 57,771,524 |
| 2,525,746 |
| 60,297,270 |
|
|
|
|
|
|
|
|
|
|
|
|
|
|
|
|
|
|
|
|
|
|
|
|
| |
Balances as of June 30, 2016 |
|
| 57,000,000 |
| 416,086 |
| 1,966,135 |
| 2,841,830 |
| (703,200) |
| 68,201 |
| (1,312,216) |
| 21,942 |
| (449,086) |
| 59,849,692 |
| 1,937,612 |
| 61,787,304 |
Employee Benefit Plan |
|
| - |
| - |
| - |
| - |
| - |
| - |
| (771,264) |
| - |
| - |
| (771,264) |
| - |
| (771,264) |
Treasury Shares | 24.d |
| - |
| - |
| - |
| - |
| - |
| - |
| - |
| - |
| (64,923) |
| (64,923) |
| - |
| (64,923) |
Result of Treasury Shares | 24.d |
| - |
| (5,610) |
| - |
| - |
| - |
| - |
| - |
| - |
| - |
| (5,610) |
| - |
| (5,610) |
Reservations for Share - Based Payment |
|
| - |
| (20,681) |
| - |
| - |
| - |
| - |
| - |
| - |
| - |
| (20,681) |
| - |
| (20,681) |
Adjustment to Fair Value - Securities and | |||||||||||||||||||||||||
Derivative Financial Instruments |
|
| - |
| - |
| - |
| - |
| 544,209 |
| 397 |
| - |
| - |
| - |
| 544,606 |
| - |
| 544,606 |
Restructuring of Capital | 24.d |
| - |
| - |
| - |
| - |
| - |
| - |
| - |
| - |
| (25) |
| (25) |
| - |
| (25) |
Dividends based on the Dividend Equalization Reserve | 24.b |
| - |
| - |
| - |
| (700,000) |
| - |
| - |
| - |
| - |
| - |
| (700,000) |
| - |
| (700,000) |
Net Income |
|
| - |
| - |
| - |
| - |
| - |
| - |
| - |
| 2,972,856 |
| - |
| 2,972,856 |
| - |
| 2,972,856 |
Allocations: |
|
|
|
|
|
|
|
|
|
|
|
|
|
|
|
|
|
|
|
|
|
|
|
|
|
Legal Reserve | 24.c |
| - |
| - |
| 148,321 |
| - |
| - |
| - |
| - |
| (148,321) |
| - |
| - |
| - |
| - |
Dividends | 24.b |
| - |
| - |
| - |
| - |
| - |
| - |
| - |
| (700,000) |
| - |
| (700,000) |
| - |
| (700,000) |
Interest on Capital | 24.b |
| - |
| - |
| - |
| - |
| - |
| - |
| - |
| (3,350,000) |
| - |
| (3,350,000) |
| - |
| (3,350,000) |
Reserve for Dividend Equalization | 24.c |
| - |
| - |
| - |
| (1,216,827) |
| 23,021 |
| - |
| - |
| 1,203,523 |
| - |
| 9,717 |
| - |
| 9,717 |
Non Controlling Interest Results |
|
| - |
| - |
| - |
| - |
| - |
| - |
| - |
| - |
| - |
| - |
| 66,634 |
| 66,634 |
Others |
|
| - |
| 7,156 |
| - |
| - |
| - |
| - |
| - |
| - |
| - |
| 7,156 |
| 521,500 |
| 528,656 |
Balances as of December 31, 2016 |
|
| 57,000,000 |
| 396,951 |
| 2,114,456 |
| 925,003 |
| (135,970) |
| 68,598 |
| (2,083,480) |
| - |
| (514,034) |
| 57,771,524 |
| 2,525,746 |
| 60,297,270 |
The accompanying notes from Management are an integral part of these financial statements. | |||||||||||||||||||||||||
27
(Free Translation into English from the Original Previously Issued in Portuguese) | |||
BANCO SANTANDER (BRASIL) S.A. AND SUBSIDIARIES | |||
STATEMENTS OF CASH FLOWS | |||
| In thousands of Brazilian Real - R$, unless otherwise stated | |||
Bank | Consolidated | ||||||||||||
07/01 to | 01/01 to | 01/01 to | 01/01 to | 01/01 to | 01/01 to | ||||||||
| Notes |
| 12/31/2016 |
| 12/31/2016 | 12/31/2015 | 09/30/2016 | 09/30/2016 | 09/30/2015 | ||||
Operational Activities |
|
|
|
|
|
|
|
|
|
|
|
|
|
Net Income |
|
| 2,966,416 |
| 5,521,637 |
| 6,982,898 |
| 2,972,856 |
| 5,532,962 |
| 6,998,196 |
Adjustment to Net Income |
|
| 7,789,643 |
| 23,185,796 |
| (10,323) |
| 9,514,944 |
| 25,880,155 |
| 2,754,350 |
Allowance for Loan Losses | 8.f |
| 6,617,492 |
| 11,616,348 |
| 13,510,435 |
| 7,486,704 |
| 13,239,781 |
| 14,772,981 |
Provision for Legal Proceedings and Administrative |
|
| 1,041,455 |
| 2,277,960 |
| (4,110,754) |
| 1,193,679 |
| 2,621,775 |
| (3,566,230) |
Deferred Tax Credits |
|
| 197,041 |
| 5,348,341 |
| (9,220,404) |
| (11,636) |
| 5,083,310 |
| (9,724,307) |
Equity in Affiliates and Subsidiaries | 15 |
| (932,124) |
| (1,418,525) |
| (1,453,252) |
| (807) |
| (1,477) |
| (1,505) |
Depreciation and Amortization | 29 |
| 1,605,141 |
| 3,170,728 |
| 4,325,941 |
| 1,856,559 |
| 3,626,805 |
| 4,673,817 |
Recognition (Reversal) Allowance for Other Assets | 33 |
| (6,700) |
| 4,731 |
| 24,269 |
| (5,997) |
| 5,361 |
| 24,113 |
Result on Sale of Other Assets | 33 |
| 11,296 |
| (1,492) |
| (43,747) |
| 10,720 |
| (2,203) |
| (45,009) |
Result on Impairment of Assets | 32 |
| 142 |
| 142 |
| 1,184,881 |
| 141 |
| 147 |
| 1,186,434 |
Result on Sale of Investments | 33 |
| - |
| - |
| (778,442) |
| 960 |
| 1,631 |
| (803,251) |
Monetary Adjustment of Escrow Deposits | 31 |
| (278,043) |
| (560,860) |
| (486,300) |
| (374,390) |
| (764,020) |
| (663,233) |
Recoverable Taxes | 31 |
| (53,815) |
| (136,115) |
| (905,081) |
| (98,550) |
| (220,487) |
| (989,972) |
Effects of Changes in Foreign Exchange Rates on | 3.d |
| (491,092) |
| 2,252,382 |
| (2,032,294) |
| (542,782) |
| 2,289,849 |
| (2,106,652) |
Others |
|
| 78,850 |
| 632,156 |
| (25,575) |
| 343 |
| (317) |
| (2,836) |
Changes on Assets and Liabilities |
|
| (7,648,125) |
| (19,476,324) |
| (5,009,575) |
| (9,447,241) |
| (21,740,568) |
| (5,623,742) |
Decrease (Increase) in Interbank Investments |
|
| (5,780,742) |
| (21,399,845) |
| (11,402,314) |
| (3,499,107) |
| (17,868,579) |
| (8,168,567) |
Decrease (Increase) in Securities and Derivative |
|
| (1,612,352) |
| (24,976,662) |
| (18,636,990) |
| (17,741,509) |
| (24,169,485) |
| (1,588,376) |
Decrease (Increase) in Lending and Leasing Operations |
|
| (7,440,165) |
| 183,934 |
| (23,298,083) |
| (10,356,112) |
| (2,863,519) |
| (23,941,184) |
Decrease (Increase) in Deposits on Central Bank of Brazil |
| (1,668,168) |
| (5,992,335) |
| (24,924,309) |
| (1,699,154) |
| (6,102,840) |
| (24,994,502) | |
Decrease (Increase) in Other Receivables |
|
| (24,715,371) |
| (2,914,214) |
| (14,609,829) |
| (25,159,754) |
| (3,395,391) |
| (14,038,800) |
Decrease (Increase) in Other Assets |
|
| 334,808 |
| (12,347) |
| 17,505 |
| 325,725 |
| (6,471) |
| (197,529) |
Net Change on Other Interbank and Interbranch Accounts |
| 113,063 |
| (1,395,361) |
| 1,139,778 |
| 113,063 |
| (1,395,361) |
| 1,139,777 | |
Increase (Decrease) in Deposits |
|
| 5,116,917 |
| 7,756,400 |
| 42,057,055 |
| 10,962,423 |
| 3,624,105 |
| (2,640,891) |
Increase (Decrease) in Money Market Funding |
|
| (1,877,073) |
| 23,864,990 |
| 1,152,034 |
| 8,165,210 |
| 25,963,306 |
| 24,607,683 |
Increase (Decrease) in Borrowings |
|
| 3,810,498 |
| (4,670,363) |
| 13,104,602 |
| 3,443,407 |
| (6,003,151) |
| 12,967,977 |
Increase (Decrease) in Other Liabilities |
|
| 27,330,463 |
| 11,536,142 |
| 30,421,296 |
| 27,618,151 |
| 12,742,926 |
| 31,823,641 |
Increase (Decrease) in Change in Deferred Income |
|
| 11,357 |
| 915 |
| (30,320) |
| 3,834 |
| (9,831) |
| (23,460) |
Tax Paid |
|
| (1,271,360) |
| (1,457,578) |
| - |
| (1,623,418) |
| (2,256,277) |
| (569,511) |
Net Cash Provided by (Used in) Operational Activities |
| 3,107,934 |
| 9,231,109 |
| 1,963,000 |
| 3,040,559 |
| 9,672,549 |
| 4,128,804 | |
Investing Activities |
|
|
|
|
|
|
|
|
|
|
|
|
|
Acquisition of Investment |
|
| (291) |
| (902) |
| (215,292) |
| 332 |
| (113,912) |
| (3,995) |
Acquisition of Fixed Assets |
|
| (284,411) |
| (589,384) |
| (823,065) |
| (455,060) |
| (934,403) |
| (1,164,444) |
Acquisition of Intangible Assets |
|
| (426,396) |
| (1,132,379) |
| (1,110,063) |
| (494,395) |
| (1,219,427) |
| (1,293,891) |
Net Cash Received on Sale/Reduction of Investments |
|
| 146 |
| 379 |
| 858,081 |
| 169 |
| 403 |
| 860,782 |
Acquisition of Subsidiary, Unless Net Cash on | 15 |
| - |
| - |
| - |
| (393,102) |
| (393,102) |
| 443 |
Proceeds from Assets not in Use |
|
| 121,286 |
| 226,033 |
| 89,651 |
| 122,513 |
| 227,590 |
| 93,223 |
Proceeds from Property for Own Use |
|
| 21,841 |
| 28,152 |
| 51,659 |
| 37,118 |
| 79,883 |
| 75,534 |
Proceeds from Non-Current Assets Held for Sale |
|
| - |
| - |
| - |
| - |
| - |
| 246,074 |
Dividends and Interest on Capital Received |
|
| 201,853 |
| 1,239,825 |
| 741,733 |
| 212,388 |
| 249,393 |
| 18,111 |
Change in the Scope of Consolidation | 13 |
| - |
| - |
| - |
| 4,909 |
| 4,909 |
| - |
Net Cash Provided by (Used in) Investing Activities |
|
| (365,972) |
| (228,276) |
| (407,296) |
| (965,128) |
| (2,098,666) |
| (1,168,163) |
Financing Activities |
|
|
|
|
|
|
|
|
|
|
|
|
|
Acquisition of Own Share | 24.d |
| (64,923) |
| (90,031) |
| (247,024) |
| (64,923) |
| (90,031) |
| (247,024) |
Issuance of Long - Term Emissions |
|
| 21,446,108 |
| 50,313,469 |
| 72,936,057 |
| 22,944,238 |
| 52,971,066 |
| 74,658,184 |
Long - Term Payments |
|
| (22,688,320) |
| (56,164,769) |
| (63,516,234) |
| (24,333,698) |
| (59,345,386) |
| (65,741,874) |
Subordinated Debts - Payments |
|
| (8,362,652) |
| (8,362,652) |
| (216,075) |
| (8,362,652) |
| (8,362,652) |
| (216,075) |
Debt Instruments Eligible to Compose Capital - Payments |
|
| (318,225) |
| (2,724,511) |
| (612,369) |
| (318,225) |
| (2,724,511) |
| (612,369) |
Dividends and Interest on Capital Paid |
|
| (434,903) |
| (3,222,362) |
| (3,996,294) |
| (446,467) |
| (3,234,086) |
| (3,991,396) |
Increase (Decrease) on Non Controlling Interest |
|
| - |
| - |
| - |
| 520,079 |
| 501,561 |
| 814,710 |
Net Cash Provided by (Used in) Financing Activities |
|
| (10,422,915) |
| (20,250,856) |
| 4,348,061 |
| (10,061,648) |
| (20,284,039) |
| 4,664,156 |
Exchange Variation on Cash and Cash Equivalents | 3.d |
| 491,092 |
| (2,252,382) |
| 2,032,294 |
| 542,782 |
| (2,289,849) |
| 2,106,652 |
Increase (Decrease) in Cash and Cash Equivalents |
|
| (7,189,861) |
| (13,500,405) |
| 7,936,059 |
| (7,443,435) |
| (15,000,005) |
| 9,731,449 |
Cash and Cash Equivalents at the Beginning of Exercise | 4 |
| 25,037,539 |
| 31,348,083 |
| 23,412,024 |
| 25,576,612 |
| 33,133,182 |
| 23,401,733 |
Cash and Cash Equivalents at the End of Exercise | 4 |
| 17,847,678 |
| 17,847,678 |
| 31,348,083 |
| 18,133,177 |
| 18,133,177 |
| 33,133,182 |
The accompanying notes from Management are an integral part of these financial statements. | |||||||||||||
28
(Free Translation into English from the Original Previously Issued in Portuguese) | |||
BANCO SANTANDER (BRASIL) S.A. AND SUBSIDIARIES | |||
STATEMENTS OF VALUE ADDED | |||
| In thousands of Brazilian Real - R$, unless otherwise stated | |||
Bank | Consolidated | ||||||||||||||||
01/01 to | 01/01 to | 01/01 to | 01/01 to | ||||||||||||||
| Notes |
| 12/31/2016 |
|
|
| 12/31/2015 |
|
|
| 12/31/2016 |
|
|
| 12/31/2015 |
|
|
Financial Income |
|
| 90,968,893 |
|
|
| 82,686,192 |
|
|
| 85,909,559 |
|
|
| 80,766,166 |
|
|
Income from Services Rendered and Banking Fees | 27 |
| 11,308,504 |
|
|
| 10,237,382 |
|
|
| 13,718,252 |
|
|
| 11,867,441 |
|
|
Allowance for Loans Losses | 8.f |
| (11,616,348) |
|
|
| (13,510,435) |
|
|
| (13,239,781) |
|
|
| (14,772,981) |
|
|
Other Income and Expenses |
|
| (3,456,215) |
|
|
| 12,875,730 |
|
|
| (4,206,498) |
|
|
| 13,591,957 |
|
|
Financial Expenses |
|
| (56,040,925) |
|
|
| (65,926,770) |
|
|
| (45,871,960) |
|
|
| (59,956,057) |
|
|
Third-party Input |
|
| (5,877,888) |
|
|
| (6,957,748) |
|
|
| (6,934,353) |
|
|
| (7,813,746) |
|
|
Materials, Energy and Others |
|
| (264,138) |
|
|
| (283,165) |
|
|
| (274,651) |
|
|
| (292,592) |
|
|
Third-Party Services | 29 |
| (1,808,057) |
|
|
| (1,854,932) |
|
|
| (2,179,100) |
|
|
| (2,177,667) |
|
|
Impairment of Assets | 32 |
| (142) |
|
|
| (1,184,881) |
|
|
| (147) |
|
|
| (1,186,434) |
|
|
Others |
|
| (3,805,551) |
|
|
| (3,634,770) |
|
|
| (4,480,455) |
|
|
| (4,157,053) |
|
|
Gross Added Value |
|
| 25,286,021 |
|
|
| 19,404,351 |
|
|
| 29,375,219 |
|
|
| 23,682,780 |
|
|
Retentions |
|
|
|
|
|
|
|
|
|
|
|
|
|
|
|
|
|
Depreciation and Amortization | 29 |
| (3,170,728) |
|
|
| (4,325,941) |
|
|
| (3,626,805) |
|
|
| (4,673,817) |
|
|
Added Value Produced Net |
|
| 22,115,293 |
|
|
| 15,078,410 |
|
|
| 25,748,414 |
|
|
| 19,008,963 |
|
|
Added Value Received from Transfer |
|
|
|
|
|
|
|
|
|
|
|
|
|
|
|
|
|
Investments in Affiliates and Subsidiaries | 15 |
| 1,418,525 |
|
|
| 1,453,252 |
|
|
| 1,477 |
|
|
| 1,505 |
|
|
Added Value to Distribute |
|
| 23,533,818 |
|
|
| 16,531,662 |
|
|
| 25,749,891 |
|
|
| 19,010,468 |
|
|
Added Value Distribution |
|
|
|
|
|
|
|
|
|
|
|
|
|
|
|
|
|
Employee |
|
| 7,103,148 |
| 30.2% |
| 6,443,552 |
| 38.9% |
| 7,784,119 |
| 30.2% |
| 7,095,572 |
| 37.4% |
Compensation | 28 |
| 4,019,028 |
|
|
| 3,372,864 |
|
|
| 4,445,079 |
|
|
| 3,784,553 |
|
|
Benefits | 28 |
| 1,354,269 |
|
|
| 1,216,373 |
|
|
| 1,467,289 |
|
|
| 1,324,495 |
|
|
Government Severance Indemnity Funds for |
| 319,540 |
|
|
| 362,026 |
|
|
| 359,557 |
|
|
| 397,372 |
|
| |
Others |
|
| 1,410,311 |
|
|
| 1,492,289 |
|
|
| 1,512,194 |
|
|
| 1,589,152 |
|
|
Taxes and Contributions |
|
| 10,214,958 |
| 43.4% |
| 2,427,385 |
| 14.8% |
| 11,560,020 |
| 44.9% |
| 4,000,428 |
| 21.0% |
Federal |
|
| 9,721,225 |
|
|
| 1,986,808 |
|
|
| 10,983,045 |
|
|
| 3,485,967 |
|
|
State |
|
| 627 |
|
|
| 524 |
|
|
| 717 |
|
|
| 896 |
|
|
Municipal |
|
| 493,106 |
|
|
| 440,053 |
|
|
| 576,258 |
|
|
| 513,565 |
|
|
Compensation of Third-Party Capital - Rental | 29 |
| 694,075 |
| 2.9% |
| 677,827 |
| 4.1% |
| 747,997 |
| 2.9% |
| 724,863 |
| 3.8% |
Remuneration of Interest on Capital |
|
| 5,521,637 |
| 23.5% |
| 6,982,898 |
| 42.2% |
| 5,657,755 |
| 22.0% |
| 7,189,605 |
| 37.8% |
Dividends | 24.b |
| 700,000 |
|
|
| 4,800,000 |
|
|
| 700,000 |
|
|
| 4,800,000 |
|
|
Interest on Capital | 24.b |
| 3,850,000 |
|
|
| 1,400,000 |
|
|
| 3,850,000 |
|
|
| 1,400,000 |
|
|
Profit Reinvestment |
|
| 971,637 |
|
|
| 782,898 |
|
|
| 982,962 |
|
|
| 798,196 |
|
|
Participation Results of Non-Controlling Shareholders |
|
| - |
|
|
| - |
|
|
| 124,793 |
|
|
| 191,409 |
|
|
Total |
|
| 23,533,818 |
| 100% |
| 16,531,662 |
| 100% |
| 25,749,891 |
| 100% |
| 19,010,468 |
| 100% |
The accompanying notes from Management are an integral part of these financial statements. | |||||||||||||||||
29
(Free Translation into English from the Original Previously Issued in Portuguese) | |||
BANCO SANTANDER (BRASIL) S.A. AND SUBSIDIARIES | |||
NOTES TO THE FINANCIAL STATEMENTS | |||
| In thousands of Brazilian Real - R$, unless otherwise stated | |||
1. General Information | ||||||||||||||
Banco Santander (Brasil) S.A. (Banco Santander or Bank), directly and indirectly controlled by Banco Santander, S.A., based in Spain (Banco Santander Spain), is the lead institution of the Financial and Prudential Group (Conglomerate Santander) towards the Central Bank of Brazil (Bacen), established as a corporation, with headquarters at Avenida Presidente Juscelino Kubitschek, 2041 and 2235 - A Block - Vila Olímpia - São Paulo - SP. Banco Santander operates as a multiple service bank, conducting its operations by means of portfolios such as commercial, investment, lending and financing, mortgage lending, leasing, credit card operations and foreign exchange. Through its subsidiaries, the Bank also operates in the payment institution, leasing, buying club management and securities, insurance brokerage operations, capitalization and pension plan. The Bank's activities are conducted within the context of a group of institutions that operate on an integrated basis in the financial market. The corresponding benefits and costs of providing services are absorbed between them, they are conducted in the normal course of business and under commutative conditions. | ||||||||||||||
2. Presentation of Financial Statements | ||||||||||||||
Banco Santander's financial statements, which include its foreign branches (Bank) and the consolidated financial statements (Consolidated) have been prepared in accordance with accounting practices, established by Brazilian Corporate Law, in conjunction with standards set forth by the National Monetary Council (CMN), the Bacen, and the standard chart of Accounts for Financial Institutions (COSIF) and the Brazilian Securities and Exchange Commission (CVM), which do not conflict with the rules issued by Bacen and show all relevant information concerned to the financial statements, which are consistent with those used by Management in its management. The consolidated financial statements include the Bank and its affiliates and subsidiaries listed in Note 15 and investment funds, where the Santander Group companies are the main beneficiaries or holders the main obligations. The portfolios of these investment funds are classified by type of operation and are distributed in the same categories that were originally allocated. | ||||||||||||||
All the relevant information related to Banco Santander's financial statements, and only them, are being evidenced, and correspond to those used by Banco Santander in its management. | ||||||||||||||
Investment Funds Consolidated | ||||||||||||||
Ÿ Santander Fundo de Investimento Amazonas Multimercado Crédito Privado de Investimento no Exterior (Santander FI Amazonas); | ||||||||||||||
Ÿ Santander Fundo de Investimento Diamantina Multimercado Crédito Privado de Investimento no Exterior (Santander FI Diamantina); | ||||||||||||||
Ÿ Santander Fundo de Investimento Guarujá Multimercado Crédito Privado de Investimento no Exterior (Santander FI Guarujá); | ||||||||||||||
Ÿ Santander Fundo de Investimento Unix Multimercado Crédito Privado (Santander FI Unix); | ||||||||||||||
Ÿ Santander Fundo de Investimento Capitalization Renda Fixa (Santander FI Capitalization); | ||||||||||||||
Ÿ Santander Fundo de Investimento SBAC Referenciado DI Crédito Privado (Santander FI SBAC); | ||||||||||||||
Ÿ Santander FIC FI Contract I Referenciado DI (Santander FIC FI Contract); | ||||||||||||||
Ÿ Santander Paraty QIF PLC (Santander Paraty)(5); | ||||||||||||||
Ÿ Santander Fundo de Investimento Financial Curto Prazo (Santander FI Financial); | ||||||||||||||
Ÿ Venda de Veículos Fundo de Investimento em Direitos Creditórios (Venda de Veículos FIDC);(1) | ||||||||||||||
Ÿ Fundo de Investimento em Direitos Creditórios RCI Brasil I - Financiamento de Veículos (FI Direitos Creditórios RCI Brasil I)(2); | ||||||||||||||
Ÿ Fundo de Investimento em Direitos Creditórios RN Brasil - Financiamento de Veículos (FI RN Brasil - Financiamento de Veículos)(3); | ||||||||||||||
Ÿ BRL V - Fundo de Investimento Imobiliário - FII (Fundo de Investimento Imobiliário)(4); and | ||||||||||||||
ŸSantander FI Hedge Strategies Fund (Santander FI Hedge Strategies)(5). | ||||||||||||||
|
| |||||||||||||
(1) The carmaker Renault (not belonging to the Conglomerate Santander) sell its duplicates (receivables related to vehicles invoiced to dealers the automaker) to the Fund. This Fund buys only duplicates from Renault carmaker. In turn, the Banco RCI Brasil S.A. (Note 15) owns 100% of its subordinated quotas. | ||||||||||||||
(2) The Banco RCI Brasil S.A. (company belonging to the Conglomerate Santander) sell its product portfolio "floorplan" to the Fund, and holds 100% of its subordinated quotas. This Fund buys exclusively credit operations from Banco RCI Brasil S.A. | ||||||||||||||
(3) The Banco RCI Brasil S.A. sold receivables (CDC portfolio) to FI RN Brasil – Financiamento de Veículos.The sênior shares will have only an investor, the Credit Agricole. The Banco RCI Brasil S.A. holds 100% of subordinated shares.This fund was established and became consolidated in September 2016. | ||||||||||||||
(4) This fund was established and became consolidated in August 2016. It is a structure where the Banco Santander figured as lender of certain debts (loans). The real object guarantee of said operations were converted into capital contributions by the Real Estate Fund in conjunction concomitant transfer of the same shares to Banco Santander through dation process of payment of the above credit operations payments. | ||||||||||||||
30
(5) Banco Santander, through its subsidiaries, holds the risks and benefits of the Santander Paraty and the Sub-fund Santander FI Hedge Strategies, based in Ireland, and both are fully consolidated in its financial statements. The Irish market, an investment fund cannot act directly and, therefore, there was the need to create another structure (a sub-fund), Santander FI Hedge Strategies. The Santander Paraty has no equity position, and all derived position of the balance sheet of Santander FI Hedge Strategies. | ||||||||||||||
During preparation of the consolidated financial statements were removed the equity in subsidiaries, significant balances receivable and payable, and revenues and expenses arising from transactions between domestic branches, foreign branches and subsidiaries, and unrealized profits between these entities have been eliminated, and non-controlling interests are stated separately in stockholders’ equity and in the income statements. The balance sheet and income statement components of jointly-controlled subsidiaries have been consolidated proportionately to the equity interest held in the subsidiary. | ||||||||||||||
Leasing operations have been reclassified, in order to reflect its financial position in conformity with the financial method of accounting. | ||||||||||||||
The preparation of financial statements requires Management estimates and assumptions that affect the reported amounts of assets and liabilities, disclosure of provision and contingent liabilities and the reported amounts of revenues and expenses for the reporting periods. Since Management’s judgment involves making estimates concerning the probability of future events, actual amounts could differ from those estimates, the main as follow: provision of allowance for loan losses, realization of the tax credit, contingent liabilities, pension plan and the fair value of financial assets. | ||||||||||||||
The Board of Directors authorized the issuance of the Financial Statements of the year ended on December 31, 2016 and 2015 approved at the meeting held on January 24, 2017. | ||||||||||||||
The consolidated financial statements based on international accounting standards issued by the International Accounting Standards Board (IASB) for the year ended December 31, 2016 will be disclosed legal deadline, on the website www.santander.com.br/ri. | ||||||||||||||
3. Significant Accounting Practices | ||||||||||||||
a) Results of Operations | ||||||||||||||
Determined on the accrual basis of accounting and includes income, charges, inflation adjustment and exchange rate changes earned or incurred through the balance sheet date, on a daily pro rata basis. | ||||||||||||||
b) Functional Currency | ||||||||||||||
Functional Currency and Presentation Currency | ||||||||||||||
The financial statements are presented in Brazilian Real (R$), which is the functional and presentation currency of Banco Santander. | ||||||||||||||
Assets and liabilities of foreign branch and subsidiary are converted inreal as follows: | ||||||||||||||
Ÿ Assets and liabilities are converted at the exchange rate on the balance sheet date; and | ||||||||||||||
Ÿ Revenues and expenses are converted at the monthly average exchange rates. | ||||||||||||||
c) Current and Long-Term Assets and Liabilities | ||||||||||||||
Stated at their realizable or settlement amounts and include income, charges, inflation adjustments or changes in exchange rates earned and/or incurred through the end of the reporting period, calculated on a daily pro rata basis and, when applicable, the effect of adjustments to write down the cost of assets to their fair or realizable values. | ||||||||||||||
Receivables and payables up to 12 months are classified in current assets and liabilities, respectively. Trading securities that, regardless of their maturity, are classified in short-term, in conformity with Bacen Letter 3,068/2001. | ||||||||||||||
d) Cash and Cash Equivalents | ||||||||||||||
For purposes of the statements of cash flows, cash and cash equivalents correspond to the balances of cash and interbank investments immediately convertible into cash or with original maturity equal to ninety days or less. The effects of exchange rate changes on cash and cash equivalents are now highlighted in the statement of cash flows as of 2016. The figures for the year 2015 have been reclassified for comparability purposes. | ||||||||||||||
e) Interbank Investments and Credits Related to Bacen | ||||||||||||||
Stated at their realizable or settlement amounts and include income, charges, inflation adjustments or changes in exchange rates earned or incurred through the end of the reporting period, calculated on a daily pro rata basis. | ||||||||||||||
e.1) Repurchase Agreement | ||||||||||||||
Repurchase Agreement (Repo) | ||||||||||||||
The bank’s own fixed income securities employed in a repurchasing agreement are highlighted in specific accounts of the asset (linked securities), on transaction date, by the updated accounting average, by type and maturity of the security. The difference between the repurchase value and the sale is the expense of the operation. | ||||||||||||||
31
The Bank also employs third-party securities to perform sales transactions with repurchase agreements. | ||||||||||||||
Reverse Repurchase Agreement (Reverse Repo) | ||||||||||||||
The financing granted by ballast with fixed-income securities (third-parties) are recorded on the counter position at liquidation value. The difference between the resale value and the purchase is recognized as the income of the operation. The securities acquired as collateral in a reverse repurchase agreement are transferred to the funded status when used for ballast sale transactions with repurchase agreements. | ||||||||||||||
32
Repurchasing Performed With Free Movement Agreements | ||||||||||||||
For “reverse repo and sale” operations, when Bank assumes the short position selling the securities on the open market, the liability created is measured at its fair value. | ||||||||||||||
f) Securities | ||||||||||||||
Securities are stated and classified into the following categories and accounting evaluation: | ||||||||||||||
I - Trading securities; | ||||||||||||||
II - Available-for-sale securities; and | ||||||||||||||
III - Held-to-maturity securities. | ||||||||||||||
Trading securities include securities purchased for the purpose of being actively and frequently traded while held-to-maturity securities include those for which the Bank has intention and financial capacity to hold to maturity. Available-for-sale securities include those which cannot be classified in categories I (trading) and III (held-to-maturity). Securities classified into categories I and II are stated at acquisition cost plus income earned through the balance sheet date, calculated on a daily pro rata basis, and adjusted to fair value, with gains or losses on such adjustment being recorded against: | ||||||||||||||
(1) The corresponding income or expense account, net of tax effects, in profit or losses for the period, when relating to securities classified into the trading category; and | ||||||||||||||
(2) A separated account in stockholders’ equity, net of taxes effects, when related to securities classified into the available-for-sale category. The adjustments to fair value recorded on sale of these securities are transferred to income for the period. | ||||||||||||||
Securities classified into the held-to-maturity category are stated at acquisition cost plus income earned through the balance sheet, calculated on a daily pro rata basis. | ||||||||||||||
Any permanent losses recorded on the realizable value of securities classified into available-for-sale and held-to-maturity are recognized in the income of the period. | ||||||||||||||
g) Derivatives Financial Instruments | ||||||||||||||
Derivatives are classified according to Management's intent to use them for hedging purposes or not. Transactions made at customers' request, on own account, or that do not qualify as hedge accounting, especially derivatives used to manage the global risk exposure, are reported at fair value, with realized and unrealized gains and losses recorded in income for the period. | ||||||||||||||
Derivative financial instruments designated as part of a framework of protection against risks ("hedge") can be classified as: | ||||||||||||||
I - Fair value hedge; and | ||||||||||||||
II - Cash flow hedge. | ||||||||||||||
Derivatives designated as hedge and the respective hedged items are adjusted to fair value, considering the following: | ||||||||||||||
(1) For those classified in category I, the increase or decrease is recorded in income or expense for the period, net of tax effects; and | ||||||||||||||
(2) For those classified in category II, the increase or decrease of the effective portion is recorded against a separated caption in stockholders’ equity, net of tax effects. | ||||||||||||||
Some hybrid financial instruments contain both a derivative financial instrument and a non-derivative asset or liability. In these cases, the derivative financial instrument represents an embedded derivative. Embedded derivatives are recorded separately from the host contracts they are related to. | ||||||||||||||
h) Minimum Requirements in the Process of Valuation Financial Instruments (Securities and Derivatives Financial Instruments) | ||||||||||||||
The CMN Resolution 4,277 issued on October 31, 2013 (entered into force on June 30, 2015) provides for minimum requirements to be observed in the pricing process of financial instruments measured at fair value and on the adoption of prudential adjustments by financial institutions.The financial instruments mentioned in the Resolution include: | ||||||||||||||
a) Securities classified as "trading" and "available for sale", according to the Central Bank Letter 3,068; of November 8, 2001; | ||||||||||||||
b) Derivatives Financial Instruments, according to the Central Bank Letter 3,082; of January 30, 2002; and | ||||||||||||||
c) Other financial instruments at fair value, regardless of their classification in the trading portfolio, established in CMN Resolution 3,464 of June 26, 2007. | ||||||||||||||
According to this resolution, the Bank has established procedures to assess the need for adjustments in the value of financial instruments mentioned above, watching the prudential criteria, relevance and reliability. This review includes, among other factors, the credit risk spread in the market value of the registration of these instruments. | ||||||||||||||
33
i) Loan Portfolio and Allowance for Losses | ||||||||||||||
The loan portfolio includes lending operations, leasing operations, advances on exchange contracts and other loans with credit characteristics. It is stated at present value, considering the indexes, interest rates and charges agreed, calculated "pro rata" days until the balance sheet date. For lending operations overdue 60 days from the recognition of revenue only occur when its actually received. | ||||||||||||||
Normally, the Bank writes off loans as losses when they have overdue for 360 days. In the case of long-term credit operations (over 3 years) are written off when they complete 540 days late. Credit operations dropped to loss is recorded in a compensation account for a minimum of five years and while not exhausted all procedures for collection. | ||||||||||||||
The credit assignments without risk retention result in lower financial assets involved in the transaction, which are now kept in a compensation account. The result of the assignment of credit is fully recognized when they are realized. | ||||||||||||||
Since January 2012, as determined by CMN Resolution 3,533/2008 and Resolution 3,895/2010, all credit assignments with risk retention will have their results recognized by the remaining terms of operations, and financial assets subject to the assignment shall remain registered as lending operations and the amount received as obligations for sale operations or transfer of financial assets. | ||||||||||||||
Allowances for loan losses are recognized based on analysis of outstanding lending operations (past-due and current), past experience, future expectations, specific portfolio risks, and Management risk assessment policy for recognizing allowances, as established by CMN Resolution 2,682/1999. | ||||||||||||||
j) Non-Current Assets Held for Sale and Other Assets | ||||||||||||||
Non-current assets held for sale includes the carrying amount of individual items, disposal groups, or items forming part of a business unit earmarked for disposal (“discontinued operations”), whose sale in their present condition is highly probable and is expected to occur within one year. | ||||||||||||||
Other assets refer mainly to assets not for own use, consisting basically of properties and vehicles received as payment in kind. | ||||||||||||||
Non-current assets held for sale andassets not for own use are generally recorded at the lower between value less costs to sell and their carrying amount at the date of classification in this category, and are not depreciated. | ||||||||||||||
k) Prepaid Expenses | ||||||||||||||
Funds used in advance payments, whose benefits will be derived or services will be provided in future years, are allocated to profit or loss over the term of the related agreements. | ||||||||||||||
k.1) Commissions Paid to Banking Correspondents | ||||||||||||||
In accordance with CMN Resolution 4,294 and Central Bank Latter 3,693 issued in December 2013, from January 2015 the commissions paid to intermediate agents as a result of the origination of new credit operations are limited to maximum percentages of: (i) 6% of the value of new operation originated and (ii) 3% of the value of portability object operation. | ||||||||||||||
Such commissions must be fully recognized as expenses when it is incurred. | ||||||||||||||
The Central Bank Latter 3,738 issued on December 2014 has allowed the possibility of staggered implementation of the aforementioned accounting procedure, as follows: | ||||||||||||||
a) 2015: Fully recognize as an expense the value of 1/3 of the commission paid, the difference being recognized as an asset and allocated to income for the period of 36 months or the term of the contract, whichever is lower; | ||||||||||||||
b) 2016: Fully recognize as an expense the value of 2/3 of the commission paid, the difference being recognized as an asset and allocated to income for the period of 36 months or the term of the contract, whichever is lower; and | ||||||||||||||
c) 2017: Recognize the full amount of commission paid as an expense. | ||||||||||||||
The Bank is using this prerogative. | ||||||||||||||
In accordance with Central Bank Latter 3,722 issued on October 2014, the accounting procedures previously described should be applied prospectively from January 2015, without impacting the records of commissions paid until December 2014. | ||||||||||||||
From January 2020, if stills exists in assets of the entity unamortized balance of sales commission paid to the correspondent, this amount must be fully written off against income (expense). | ||||||||||||||
l) Permanent Assets | ||||||||||||||
Stated at acquisition cost, are tested for impairment annually or more frequently or circumstances indicate that assets may be impaired, and valued considering the following aspects: | ||||||||||||||
l.1) Investments | ||||||||||||||
Adjustments to investments in affiliates and subsidiaries are measured under the equity method of accounting and recorded as investments in affiliates and subsidiaries. Other investments are stated at cost, reduced to fair value, when applicable. | ||||||||||||||
34
l.2) Fixed Assets | ||||||||||||||
Depreciation of fixed assets is determined under the straight-line method at the following annual rates: buildings - 4%, facilities, furniture, equipment in use, security systems and communications - 10%, data processing systems and vehicles - 20%, and leasehold improvements - 10% or through the maturity of the rental contracts. | ||||||||||||||
l.3) Intangible Assets | ||||||||||||||
Goodwill on acquisition of subsidiaries is amortized over 10 years, based on expected future earnings and is tested for impairment annually or more frequently if conditions or circumstances indicate that the asset may be impaired. | ||||||||||||||
On July 2015 the Bank revised the goodwill amortization rate related to Banco Real´s acquisition, this measure aims to suit original amortization rate on term, extension and proportion of future income. The amortization of this goodwill will be completed in 2017 (originally 2016). For the year ended December 31, 2016, there was no change in the amortization curve of Banco Real's acquisition goodwill. | ||||||||||||||
Exclusivity contracts for provision of banking services are accounted the payments related to the commercial partnership contracts with the private and public sectors to assure exclusivity for banking services of payroll credit processing and payroll loans, maintenance of collection portfolio, supplier payment services and other banking services, are allocated to income over the term of the respective agreements. | ||||||||||||||
Software acquisition and development expenses are amortized over a maximum of 5 years. | ||||||||||||||
m) Technical Reserves Related the Activities to Pensions and Capitalization | ||||||||||||||
Technical reserves are recognized and calculated in accordance with the provisions and criteria established in the National Council of Private Insurance (CNSP) and Superintendence of Private Insurance (Susep). | ||||||||||||||
Technical Reserves to Pensions | ||||||||||||||
Technical provisions are recognized in accordance with the criteria below: | ||||||||||||||
• Provision for Unearned Premiums (PPNG) | ||||||||||||||
The PPNG consists of the portions of the net premiums of ceded coinsurance, corresponding to the periods of risks after policy conditions, calculated "pro rata" day as Circulating Susep 517/2015 and subsequent changes in the period between the issue and the beginning of the calculation of the provision is made considering the duration equal to the duration of the risk. | ||||||||||||||
• Provision for Unearned Premiums-Current Risks but not Issued (PPNG-RVNE) | ||||||||||||||
The PPNG-RVNE aims to estimate the share of unearned premiums relating to the risk already taken but that still do not have their insurance policies issued. This provision is estimated based on historical emissions behavior in delays, according to Actuarial Technical Note (NTA). | ||||||||||||||
• Mathematical Provisions for Benefits Granted and Granted (PMBaC and PMBC) | ||||||||||||||
The PMBaC are formed from the contributions collected through the financial regime of capitalization. The PMBC represent obligations in the form of continued income plans, being constituted by actuarial calculation for traditional types of plans. | ||||||||||||||
• Provisions for Unsettled Claims (PSL) | ||||||||||||||
The PSL is recognized based on notices received by Evidence Previdência S.A. (Evidence), related the single payments and accrued rent, of the claims reported until the base date of calculation, including coinsurance accepted, gross of reinsurance and net of coinsurance ceded. The triggering event of the release of the provision due to payment, is characterized upon the financial settlement, of the receipt of the compensation payment receipt, annuity or losing income, or as other cases provided by law. | ||||||||||||||
• PSL Lawsuit | ||||||||||||||
Is constituted for all notices of claims in the lawsuit, based on the probability of loss and classified as probable, possible and remote. | ||||||||||||||
The claims in the lawsuit are reviewed individually by the Legal Department to be sorted among these odds of loss, being updated whenever there is need. | ||||||||||||||
In the PSL still monetary restatement and deals with legal fees of collapsing, as indexer and interest of 1% percent a month. | ||||||||||||||
• Provision for Claims Incurred But not Reported (IBNR) | ||||||||||||||
The IBNR should be made to cover claims incurred but not yet reported until the base date of calculation. For purposes of description of the methodology, we have adopted the term "claim" to set all claims and benefits of security risk plans. The Evidence does not have enough database to prepare its own methodology in this way is used technical procedures defined in Circulating Susep 517/2015 and subsequent changes. | ||||||||||||||
• Provision of Related Expenses (PDR) | ||||||||||||||
The PDR is constituted for the coverage of expected values relating to expenses related to claims. For structured plans in the financial scheme of simple sharing and allocation of capital, the provision covers the cost, alcoves and alcoves, not related to the settlement of claims or benefits, on the basis of claims incurred, warned or not. | ||||||||||||||
35
• Provision of Financial Surplus (PEF) | ||||||||||||||
The PEF covers the financial surplus values provisioned, to be used in accordance with the rules of the plan. This provision is calculated considering the return on investments held versus the guaranteed profitability in each plan. | ||||||||||||||
• Provision for Redemptions and/or Other Amounts to Regulate (PVR) | ||||||||||||||
Covers the values relating to redemption to regulate, the returns of contributions or awards or the requested portability issues and that for whatever reason, have not yet been made. | ||||||||||||||
• Provision of Supplementary Coverage (PCC) | ||||||||||||||
The PCC shall be constituted when failure is observed in the technical provisions resulting from the Test of Adequacy of Liabilities (TAP). | ||||||||||||||
Technical Provisions for Capitalization | ||||||||||||||
Technical provisions are recognized in accordance with the criteria below: | ||||||||||||||
Ÿ Technical provisions mathematical for redemption results from accumulation of percentages applicable on payments made, capitalized with the interest rate provided for in the plan and update through the basic remuneration rate of savings account-Basic Reference Rate (TR); | ||||||||||||||
Ÿ Provision for redemption of anticipated titles is constituted from the cancellation for non-payment or redemption request, based on the value of the mathematical provision of rescue formed at the time of cancellation of the title and the provision for redemption of the matured bonds is formed after the end of the title; | ||||||||||||||
Ÿ Provision for raffles to be held is made based on a percentage of pay portion and aims to cover draws the titles will compete, but that have not yet been carried out and the provision of raffles payable consists of titles drawn, but which have not yet been paid; and | ||||||||||||||
Ÿ Administrative provision aims to reflect the present value of future expenses of savings bonds whose duration extends from the date of its constitution. | ||||||||||||||
n) Employees Benefit Plans | ||||||||||||||
Post-employment benefit plans include the commitments of the Bank: (i) addition to the benefits of public pension plan; and (ii) medical assistance in case of retirement, permanent disability or death for that employees, and their direct beneficiaries. | ||||||||||||||
Defined Contribution Plans | ||||||||||||||
Defined benefit plans is the post-employment benefit plan which the Bank, and its subsidiaries, as the sponsoring entity pays fixed contributions into a pension fund, not having a legal or constructive obligation to pay further contributions if the fund does not hold sufficient assets to pay all benefits relating to services provided in the current and in previous periods. | ||||||||||||||
The contributions made in this connection are recognized under personnel expenses in the income statement. | ||||||||||||||
Defined Benefit Plans | ||||||||||||||
Defined benefit plan is the post-employment benefit plan which is not a defined contribution plan and is showed in Note 35. For this type of plan, the sponsoring entity's obligation is to provide the agreed benefits with employees, assuming the potential actuarial risk that benefits will cost more than expected. | ||||||||||||||
Since January 2013, Banco Santander apply CPC 33 (R1) that provides substantially the full recognition of liabilities when on account actuarial losses (actuarial deficit) recognized will not occur, in contrast to the equity (other valuation adjustments). | ||||||||||||||
Main Definitions | ||||||||||||||
- The present value of the defined benefit obligation is the present value of expected future payments required to settle the obligation resulting from employee service in the current and past periods, without deducting any plan assets. | ||||||||||||||
- Deficit or surplus is: (a) the present value of the defined benefit obligation, less (b) the fair value of plan assets. | ||||||||||||||
- The sponsoring entity may recognize the plan's assets in the balance sheet when they meet the following characteristics: (i) the assets of the fund are sufficient to meet all employee benefit plan or a sponsor obligations; or (ii) the assets are returned to the sponsoring entity in order to reimburse it for employee benefits already paid. | ||||||||||||||
- Actuarial gains and losses are changes in present value of defined benefit obligation resulting from: (a) adjustments by experience (the effects of differences between the actuarial assumptions adopted and what has actually occurred); and (b) effects of changes in actuarial assumptions. | ||||||||||||||
- Current service cost is the increase in the present value of the defined benefit obligation resulting from employee service in the current period. | ||||||||||||||
-The past service cost is the change in present value of defined benefit obligation for employee service in prior periods resulting from a change in the plan or reductions in the number of employees covered. | ||||||||||||||
Post-employment benefits are recognized in income in the lines of other operating expenses - actuarial losses - retirement plans (Note 32) and personnel expenses (Note 28). | ||||||||||||||
36
The defined benefit plans are recorded based on an actuarial study, conducted annually by an external consultant, specialized consulting and approved by management at the end of each year to be effective for the subsequent period. | ||||||||||||||
o) Share Based Compensation | ||||||||||||||
The Bank has compensation plans with long-term conditions for acquisition. The main conditions for acquisition are: (1) conditions of service, provided if the participant remains employed during the period of the Plan to acquire a position to exercise their rights; (2) performance conditions, the amount of investment in Certificates of Deposit Shares (Units) exercisable by the participants will be determined according to the result of a performance measurement parameter of the Bank: Total Shareholder Return (TSR) may be reduced, if not achieved the goals of the modifier Return on Risk Weighted Assets (RoRWA), comparison between realized and budgeted in each year, as determined by the Board of Directors and (3) market conditions, since some parameters are conditioned to the value of the shares of the Bank. The Bank measures the fair value of the services rendered by reference to the fair value of the equity instruments granted at the grant date, taking into account market conditions for each plan at the estimated fair value. | ||||||||||||||
Settlement in Share | ||||||||||||||
The fair value of services is measured by reference to the fair value of the equity instruments granted at the grant date, taking into account market conditions for each plan at the estimated fair value. In order to recognize the staff costs in contrast with the capital reserves during the period covered, as the services are received, it is considered the treatment of conditions of service and the amount recognized for services received over the period of assessment based on the best estimative for the number of equity instruments expected to vest. | ||||||||||||||
| ||||||||||||||
Settlement in Cash | ||||||||||||||
For share-based payments settled in cash (in the form of share valuation), the services provided are measured and the corresponding liabilities incurred in the fair value valuation of the shares at grant date and until the liability is settled, the fair value of liability is revaluated at the end of each reporting period and the date of settlement, with any changes in fair value recognized in the income. In order to recognize the staff costs in contrast with the provisions in "wages payable" throughout the term, reflecting the period in which services are received, the total liability is based on the best estimative of the amount of right of recovery of shares that will be acquired at the end of the exercise of validity and recognizes the value of the services received during the period of validity based on the best available estimative. Periodically, analysis is performed of the estimated number of stock appreciation rights to be acquired at the end of the grace exercise. | ||||||||||||||
p) Funding, Notes Issued and Other Liabilities | ||||||||||||||
Financial liabilities instruments are recognized initially at fair value, considered as the transaction price. They are subsequently measured at amortized cost with expenses recognized as a financial cost (Note 18.d). | ||||||||||||||
Among the liabilities initial recognition methods of, it is important to emphasize those compound financial instruments which are classified as such due to the fact that the instrument contain both a debt instrument (liability), and an embedded equity component (derivative). | ||||||||||||||
The recognition of a compound instrument consists of a combination of (i) a main instrument, which is recognized as an entity’s genuine liability (debt) and (ii) an equity net component (derivative convertible into ordinary shares). | ||||||||||||||
In accordance to the COSIF, the hybrid capital instruments and debt represents obligations of financial institutions and should be recorded in specific accounts of the valued liabilities adjusted according for the effect of exchange rate variation, when denominated in currency foreign. All the remunerations related to these instruments, such as interest and exchange variation (difference between the functional currency and the currency in which the instrument was called) shall be accounted expenses in the period in compliance the accrual basis method. | ||||||||||||||
In relation the stockholders' equity component, your registration occurs at the initial moment on grounds of their fair value, if different from zero. | ||||||||||||||
The relevant details of these issued instruments composed nature are described in Note 21. | ||||||||||||||
q) Provisions, Contingent Assets and Liabilities | ||||||||||||||
Banco Santander and its subsidiaries are involved in judicial and administrative proceedings related to tax, labor and civil, in the normal course of their activities. | ||||||||||||||
The provisions include legal obligations, judicial and administrative proceedings related to tax and social security obligations, whose object is to challenge their legality or constitutionality, regardless of the assessment that the probability of success, the amounts are fully recognized in the financial statements. | ||||||||||||||
Provisions are reviewed at each balance sheet date and adjusted to reflect the current best estimate and may be fully or partially reversed or reduced when the outflows of resources and obligations relevant to the process are no longer probable, including decay of legal deadlines, among others. | ||||||||||||||
Provisions for the judicial and administrative proceedings are recorded when the risk of loss of administrative or judicial proceeding is considered probable and the amounts can be reliably measured, based on the nature, complexity and history of lawsuits, the legal opinion of the internal and external advisors, based on the best available information. For those which the risk of loss is possible, the provisions are not recorded and the information is disclosed in the financial statements (Note 23.h) and for the provisions for which the risk of loss is remote, no disclosure is required. | ||||||||||||||
37
Contingent assets are not recognized, except when there are guarantees or favorable judicial decisions, about which features no longer fit, characterizing the gain as practically certain. Assets with probable success, if any, are only disclosed in the financial statements. | ||||||||||||||
On the favorable decisions to Santander, the counterparty has the right, in the event of specific legal requirements attended, to file a rescission action within a period determined by current legislation. Rescission actions are considered as new events and will be evaluated for contingent liability purposes if and when they are filed. | ||||||||||||||
r) Social Integration Program (PIS) and Contribution for the Financing of Social Security (Cofins) | ||||||||||||||
The PIS (0.65%) and Cofins (4.00%) are calculated under gross revenue and expenses. Financial institutions may deduct financial expenses in the establishment of this base.PIS and Cofins expenses are recorded in tax expenses. | ||||||||||||||
s) Income Tax (IRPJ) and Social Contribution on Net Income (CSLL) | ||||||||||||||
IRPJ is calculated at the rate of 15% plus a surtax of 10% applied on income, after adjustments determined by tax legislation. The Social Contribution Tax on Net Profit (CSLL) is calculated at the rate of 20% to financial institutions, insurance companies and capitalization (15% until August/2015) and 9% for other companies, levied on profit, after adjustments required by tax legislation. The CSLL rate applicable to financial institutions, insurance companies and capitalization was raised from 15% to 20% for the period between September,1st 2015 and December, 31 2018, in the terms of the current law 13,169/2015 (result of the conversion into law of Provisory Measure 675/2015). | ||||||||||||||
The Tax credits and liabilities are computed, basically, on certain temporary differences between accounting value and tax, over the tax losses, negative base and adjustments to fair value of securities note and derivative financial instruments. The recognition of tax credits and deferred liabilities are made by rates applicable in the period which is estimated the realization of the assets or the settlement of the liabilities. | ||||||||||||||
In accordance with the current regulation, the tax credits are recognized to the extent that it is probable recovery in base to the generation of future taxable income. The expected realization of the tax credits according to Note 11.b is based on the projections of future earnings supported by a technical study. | ||||||||||||||
t) Recovery of Impairment Assets | ||||||||||||||
The financial and non-financial assets are measured at the end of each reporting period in order to identify evidence of impairment in its accounting value. If there is any indication, the entity shall estimate the recoverable amount of the asset and that loss shall be recognized immediately in the income statement. The recoverable amount of an asset is defined as the highest amount between its fair value net of selling expenses and its value in use. | ||||||||||||||
u) Deferred Income | ||||||||||||||
Refers to income received before the maturity of the underlying obligation and include non-refundable income, primarily related to guarantees and sureties given and credit card annual fees. The allocation to income is made in accordance with the terms of the agreements. | ||||||||||||||
v) Non-Controlling Interest - Consolidated Stockholders' Equity | ||||||||||||||
The non-controlling interests (minority interests) are reported in a separate shareholders' equity of the parent entity for purpose of presentation of the consolidated financial statements. | ||||||||||||||
38
4. Cash and Cash Equivalents | ||||||||||||
|
|
|
|
|
|
|
|
|
|
|
|
|
Bank | Consolidated | |||||||||||
|
| 12/31/2016 | 12/31/2015 | 12/31/2014 | 12/31/2016 | 12/31/2015 | 12/31/2014 | |||||
Cash |
| 5,513,365 |
| 5,231,627 |
| 4,697,744 |
| 5,723,084 |
| 6,863,856 |
| 5,074,698 |
Interbank Investments |
| 12,334,313 |
| 26,116,456 |
| 18,714,280 |
| 12,410,093 |
| 26,269,326 |
| 18,327,035 |
Money Market Investments |
| 1,053,105 |
| 3,993,155 |
| 6,260,149 |
| 1,129,140 |
| 4,146,025 |
| 6,260,149 |
Interbank Deposits |
| 282,753 |
| 292,520 |
| 998,397 |
| 282,753 |
| 292,520 |
| 998,397 |
Foreign Currency Investments |
| 10,998,455 |
| 21,830,781 |
| 11,455,734 |
| 10,998,200 |
| 21,830,781 |
| 11,068,489 |
Total |
| 17,847,678 |
| 31,348,083 |
| 23,412,024 |
| 18,133,177 |
| 33,133,182 |
| 23,401,733 |
5. Interbank Investments | ||||||||||||
|
|
|
|
|
|
|
|
|
|
|
|
|
Bank | ||||||||||||
|
|
|
|
|
|
|
|
|
| 12/31/2016 |
| 12/31/2015 |
Up to | From 3 to | Over | ||||||||||
|
|
|
| 3 Months |
| 12 Months |
| 12 Months |
| Total |
| Total |
Money Market Investments |
|
|
| 43,526,974 |
| 3,878,188 |
| - |
| 47,405,162 |
| 31,837,273 |
Own Portfolio |
|
|
| 1,049,511 |
| - |
| - |
| 1,049,511 |
| 517,536 |
Treasury Bills - LFT |
|
|
| 546,618 |
| - |
| - |
| 546,618 |
| - |
National Treasury Bills - LTN |
|
|
| 281,870 |
| - |
| - |
| 281,870 |
| 87,459 |
National Treasury Notes - NTN |
|
|
| 221,023 |
| - |
| - |
| 221,023 |
| 430,077 |
Third-party Portfolio |
|
|
| 14,286,623 |
| 803,101 |
| - |
| 15,089,724 |
| 11,185,515 |
National Treasury Bills - LTN |
|
|
| 2,484,986 |
| 207,153 |
| - |
| 2,692,139 |
| 3,935,100 |
National Treasury Notes - NTN |
|
|
| 11,801,637 |
| 595,948 |
| - |
| 12,397,585 |
| 7,250,415 |
Sold Position |
|
|
| 28,190,840 |
| 3,075,087 |
| - |
| 31,265,927 |
| 20,134,222 |
National Treasury Bills - LTN |
|
|
| 4,374,806 |
| 416,978 |
| - |
| 4,791,784 |
| 9,548,665 |
National Treasury Notes - NTN |
|
|
| 23,816,034 |
| 2,658,109 |
| - |
| 26,474,143 |
| 10,585,557 |
Interbank Deposits |
|
|
| 4,656,124 |
| 17,253,238 |
| 14,812,506 |
| 36,721,868 |
| 33,839,729 |
Foreign Currency Investments |
|
|
| 10,998,455 |
| - |
| - |
| 10,998,455 |
| 21,830,781 |
Total |
|
|
| 59,181,553 |
| 21,131,426 |
| 14,812,506 |
| 95,125,485 |
| 87,507,783 |
Current |
|
|
|
|
|
|
|
|
| 80,312,979 |
| 74,010,064 |
Long-term |
|
|
|
|
|
|
|
|
| 14,812,506 |
| 13,497,719 |
|
|
|
|
|
|
|
|
|
|
|
|
|
Consolidated | ||||||||||||
|
|
|
|
|
|
|
|
|
| 12/31/2016 |
| 12/31/2015 |
Up to | From 3 to | Over | ||||||||||
|
|
|
| 3 Months |
| 12 Months |
| 12 Months |
| Total |
| Total |
Money Market Investments |
|
|
| 43,802,059 |
| 3,677,137 |
| - |
| 47,479,196 |
| 31,990,143 |
Own Portfolio |
|
|
| 10,128,147 |
| - |
| - |
| 10,128,147 |
| 670,406 |
Treasury Bills - LFT |
|
|
| 546,619 |
| - |
| - |
| 546,619 |
| 22,802 |
National Treasury Bills - LTN |
|
|
| 3,041,941 |
| - |
| - |
| 3,041,941 |
| 217,527 |
National Treasury Notes - NTN |
|
|
| 6,539,587 |
| - |
| - |
| 6,539,587 |
| 430,077 |
Third-party Portfolio |
|
|
| 5,483,072 |
| 602,050 |
| - |
| 6,085,122 |
| 11,185,515 |
National Treasury Bills - LTN |
|
|
| - |
| 6,102 |
| - |
| 6,102 |
| 3,935,100 |
National Treasury Notes - NTN |
|
|
| 5,483,072 |
| 595,948 |
| - |
| 6,079,020 |
| 7,250,415 |
Sold Position |
|
|
| 28,190,840 |
| 3,075,087 |
| - |
| 31,265,927 |
| 20,134,222 |
National Treasury Bills - LTN |
|
|
| 4,374,806 |
| 416,978 |
| - |
| 4,791,784 |
| 9,548,665 |
National Treasury Notes - NTN |
|
|
| 23,816,034 |
| 2,658,109 |
| - |
| 26,474,143 |
| 10,585,557 |
Interbank Deposits |
|
|
| 499,734 |
| 534,680 |
| 156,126 |
| 1,190,540 |
| 1,989,204 |
Foreign Currency Investments |
|
|
| 10,998,840 |
| 665 |
| - |
| 10,999,505 |
| 21,830,781 |
Total |
|
|
| 55,300,633 |
| 4,212,482 |
| 156,126 |
| 59,669,241 |
| 55,810,128 |
Current |
|
|
|
|
|
|
|
|
| 59,513,115 |
| 55,443,206 |
Long-term |
|
|
|
|
|
|
|
|
| 156,126 |
| 366,922 |
39
6. Securities and Derivatives Financial Instruments | ||||||||||
a) Securities | ||||||||||
I) By Category | ||||||||||
|
|
|
|
|
|
|
|
|
| Bank |
|
|
|
|
|
|
|
| 12/31/2016 |
| 12/31/2015 |
Cost | Effect of Adjustment to | Carrying | Carrying | |||||||
|
| Amortized |
| Income |
| Equity |
| Amount |
| Amount |
Trading Securities |
| 61,866,860 |
| 438,260 |
| - |
| 62,305,120 |
| 27,442,387 |
Government Securities |
| 57,621,866 |
| 434,335 |
| - |
| 58,056,201 |
| 23,925,508 |
Private Securities |
| 4,244,994 |
| 3,925 |
| - |
| 4,248,919 |
| 3,516,879 |
Available-for-Sale Securities |
| 133,606,790 |
| 13,058 |
| 456,576 |
| 134,076,424 |
| 140,087,886 |
Government Securities |
| 50,013,123 |
| - |
| 952,471 |
| 50,965,594 |
| 58,013,126 |
Private Securities |
| 83,593,667 |
| 13,058 |
| (495,895) |
| 83,110,830 |
| 82,074,760 |
Held-to-Maturity Securities |
| 9,388,442 |
| - |
| - |
| 9,388,442 |
| 9,257,519 |
Government Securities |
| 9,388,442 |
| - |
| - |
| 9,388,442 |
| 9,257,519 |
Total Securities |
| 204,862,092 |
| 451,318 |
| 456,576 |
| 205,769,986 |
| 176,787,792 |
Derivatives (Assets) |
| 24,964,001 |
| (7,197,757) |
| 84,746 |
| 17,850,990 |
| 20,176,871 |
Total Securities and Derivatives |
| 229,826,093 |
| (6,746,439) |
| 541,322 |
| 223,620,976 |
| 196,964,663 |
Current |
|
|
|
|
|
|
| 97,187,849 |
| 50,644,888 |
Long-term |
|
|
|
|
|
|
| 126,433,127 |
| 146,319,775 |
Derivatives (Liabilities) |
| (19,060,284) |
| 5,537,910 |
| (105,281) |
| (13,627,655) |
| (17,031,432) |
Current |
|
|
|
|
|
|
| (8,442,552) |
| (6,759,506) |
Long-term |
|
|
|
|
|
|
| (5,185,103) |
| (10,271,926) |
|
|
|
|
|
|
|
|
|
| Consolidated |
|
|
|
|
|
|
|
| 12/31/2016 |
| 12/31/2015 |
Cost | Effect of Adjustment to | Carrying | Carrying | |||||||
|
| Amortized |
| Income |
| Equity |
| Amount |
| Amount |
Trading Securities |
| 62,301,973 |
| 437,049 |
| - |
| 62,739,022 |
| 27,227,796 |
Government Securities |
| 60,558,053 |
| 426,901 |
| - |
| 60,984,954 |
| 26,472,010 |
Private Securities |
| 1,743,920 |
| 10,148 |
| - |
| 1,754,068 |
| 755,786 |
Available-for-Sale Securities |
| 72,875,745 |
| (64,273) |
| 574,775 |
| 73,386,247 |
| 80,396,458 |
Government Securities |
| 53,551,033 |
| - |
| 1,040,396 |
| 54,591,429 |
| 61,649,908 |
Private Securities |
| 19,324,712 |
| (64,273) |
| (465,621) |
| 18,794,818 |
| 18,746,550 |
Held-to-Maturity Securities |
| 9,388,442 |
| - |
| - |
| 9,388,442 |
| 9,257,519 |
Government Securities |
| 9,388,442 |
| - |
| - |
| 9,388,442 |
| 9,257,519 |
Total Securities |
| 144,566,160 |
| 372,776 |
| 574,775 |
| 145,513,711 |
| 116,881,773 |
Derivatives (Assets) |
| 27,698,208 |
| (3,798,308) |
| 176,056 |
| 24,075,956 |
| 26,010,209 |
Total Securities and Derivatives |
| 172,264,368 |
| (3,425,532) |
| 750,831 |
| 169,589,667 |
| 142,891,982 |
Current |
|
|
|
|
|
|
| 90,341,153 |
| 55,477,103 |
Long-term |
|
|
|
|
|
|
| 79,248,514 |
| 87,414,879 |
Derivatives (Liabilities) |
| (14,586,777) |
| (5,096,628) |
| (261,109) |
| (19,944,514) |
| (22,882,959) |
Current |
|
|
|
|
|
|
| (14,585,133) |
| (11,604,277) |
Long-term |
|
|
|
|
|
|
| (5,359,381) |
| (11,278,682) |
40
II) Trading Securities | ||||||||||||||||
| ||||||||||||||||
|
|
|
|
|
|
|
| Bank |
|
|
|
|
|
|
| Consolidated |
|
|
|
|
|
| 12/31/2016 |
| 12/31/2015 |
|
|
|
|
| 12/31/2016 |
| 12/31/2015 |
Adjustment | Adjustment | |||||||||||||||
Cost | to Fair Value - | Carrying | Carrying | Cost | to Fair Value - | Carrying | Carrying | |||||||||
Trading Securities |
| Amortized |
| Income |
| Amount |
| Amount |
| Amortized |
| Income |
| Amount |
| Amount |
Government Securities |
| 57,621,866 |
| 434,335 |
| 58,056,201 |
| 23,925,508 |
| 60,558,053 |
| 426,901 |
| 60,984,954 |
| 26,472,010 |
Treasury Bills - LFT |
| 3,352,071 |
| (4,141) |
| 3,347,930 |
| 1,713,535 |
| 4,718,295 |
| (4,588) |
| 4,713,707 |
| 2,737,197 |
National Treasury Bills - LTN |
| 10,198,859 |
| 33,773 |
| 10,232,632 |
| 6,427,586 |
| 10,198,859 |
| 33,773 |
| 10,232,632 |
| 6,605,092 |
National Treasury Notes - NTN A |
| 208,786 |
| (9,591) |
| 199,195 |
| 225,792 |
| 208,786 |
| (9,591) |
| 199,195 |
| 225,792 |
National Treasury Notes - NTN B |
| 18,557,302 |
| 236,172 |
| 18,793,474 |
| 12,238,392 |
| 18,945,024 |
| 239,545 |
| 19,184,569 |
| 12,534,049 |
National Treasury Notes - NTN C |
| 53,650 |
| (117) |
| 53,533 |
| 49,831 |
| 1,235,891 |
| (10,477) |
| 1,225,414 |
| 1,099,508 |
National Treasury Notes - NTN F |
| 25,125,449 |
| 175,016 |
| 25,300,465 |
| 3,137,876 |
| 25,125,449 |
| 175,016 |
| 25,300,465 |
| 3,137,876 |
Agricultural Debt Securities - TDA |
| 125,061 |
| 3,207 |
| 128,268 |
| 130,534 |
| 125,061 |
| 3,207 |
| 128,268 |
| 130,534 |
Brazilian Foreign Debt Notes |
| 688 |
| 16 |
| 704 |
| 1,962 |
| 688 |
| 16 |
| 704 |
| 1,962 |
Private Securities |
| 4,244,994 |
| 3,925 |
| 4,248,919 |
| 3,516,879 |
| 1,743,920 |
| 10,148 |
| 1,754,068 |
| 755,786 |
Shares |
| 470 |
| (213) |
| 257 |
| 7,865 |
| 118,987 |
| 6,010 |
| 124,997 |
| 106,084 |
Receivables Investment Fund - FIDC(1) |
| 1,330 |
| 666 |
| 1,996 |
| 7,429 |
| 1,330 |
| 666 |
| 1,996 |
| 7,429 |
Investment Fund Shares in Participation - FIP | - | - | - | - | 21,313 | - | 21,313 | 31,328 | ||||||||
Investment Fund Shares |
| - |
| - |
| - |
| 2,908 |
| 1,083,298 |
| - |
| 1,083,298 |
| 325,126 |
Investment Fund Real Estate |
| - |
| - |
| - |
| - |
| 24,032 |
| - |
| 24,032 |
| 578 |
Debentures(3) |
| 4,065,174 |
| 3,115 |
| 4,068,289 |
| 3,498,449 |
| 265,366 |
| 3,115 |
| 268,481 |
| 168,264 |
Financial Bills - LF |
| - |
| - |
| - |
| - |
| 48,600 |
| - |
| 48,600 |
| 114,786 |
Certificates of Real Estate Receivables - CRI |
| 30,262 |
| 18 |
| 30,280 |
| 228 |
| 30,307 |
| 18 |
| 30,325 |
| 301 |
Certificates of Agribusiness Receivables - CRA | 147,758 |
| 339 |
| 148,097 |
| - |
| 147,758 |
| 339 |
| 148,097 |
| - | |
Bank Deposits Certificates - CDB |
| - |
| - |
| - |
| - |
| 2,929 |
| - |
| 2,929 |
| 1,890 |
Total |
| 61,866,860 |
| 438,260 |
| 62,305,120 |
| 27,442,387 |
| 62,301,973 |
| 437,049 |
| 62,739,022 |
| 27,227,796 |
41
|
|
|
|
|
|
|
|
|
|
|
| Bank |
12/31/2016 | ||||||||||||
Trading Securities |
| Without |
| Up to |
| From 3 to |
| From 1 to |
| Over |
| |
by Maturity | Maturity |
| 3 Months |
| 12 Months |
| 3 Years |
| 3 Years |
| Total | |
Government Securities |
| - |
| 20,823,458 |
| 3,547,913 |
| 9,964,501 |
| 23,720,329 |
| 58,056,201 |
Treasury Bills - LFT |
| - |
| 28,053 |
| 31,151 |
| 383,128 |
| 2,905,598 |
| 3,347,930 |
National Treasury Bills - LTN |
| - |
| 5,531,995 |
| 1,638,683 |
| 1,817,772 |
| 1,244,182 |
| 10,232,632 |
National Treasury Notes - NTN A |
| - |
| - |
| 793 |
| - |
| 198,402 |
| 199,195 |
National Treasury Notes - NTN B |
| - |
| 67,560 |
| 1,777,947 |
| 6,316,092 |
| 10,631,875 |
| 18,793,474 |
National Treasury Notes - NTN C |
| - |
| 416 |
| 51,525 |
| - |
| 1,592 |
| 53,533 |
National Treasury Notes - NTN F |
| - |
| 15,192,914 |
| - |
| 1,380,916 |
| 8,726,635 |
| 25,300,465 |
Agricultural Debt Securities - TDA |
| - |
| 2,491 |
| 47,814 |
| 66,593 |
| 11,370 |
| 128,268 |
Brazilian Foreign Debt Securities |
| - |
| 29 |
| - |
| - |
| 675 |
| 704 |
Private Securities |
| 257 |
| 105 |
| 2,538 |
| 25,218 |
| 4,220,801 |
| 4,248,919 |
Shares |
| 257 |
| - |
| - |
| - |
| - |
| 257 |
Receivables Investment Fund - FIDC(1) |
| - |
| - |
| 1,996 |
| - |
| - |
| 1,996 |
Debentures(3) |
| - |
| 105 |
| 523 |
| 15,621 |
| 4,052,040 |
| 4,068,289 |
Certificates of Real Estate Receivables - CRI |
| - |
| - |
| 19 |
| 251 |
| 30,010 |
| 30,280 |
Certificates of Agribusiness Receivables - CRA |
| - |
| - |
| - |
| 9,346 |
| 138,751 |
| 148,097 |
Total |
| 257 |
| 20,823,563 |
| 3,550,451 |
| 9,989,719 |
| 27,941,130 |
| 62,305,120 |
42
|
|
|
|
|
|
|
|
|
|
|
| Consolidated |
12/31/2016 | ||||||||||||
Trading Securities |
| Without |
| Up to |
| From 3 to |
| From 1 to |
| Over |
|
|
by Maturity |
| Maturity |
| 3 Months |
| 12 Months |
| 3 Years |
| 3 Years |
| Total |
Government Securities |
| - |
| 20,869,184 |
| 3,553,280 |
| 10,291,431 |
| 26,271,059 |
| 60,984,954 |
Treasury Bills - LFT |
| - |
| 28,053 |
| 34,700 |
| 685,170 |
| 3,965,784 |
| 4,713,707 |
National Treasury Bills - LTN |
| - |
| 5,531,995 |
| 1,638,683 |
| 1,817,772 |
| 1,244,182 |
| 10,232,632 |
National Treasury Notes - NTN A |
| - |
| - |
| 793 |
| - |
| 198,402 |
| 199,195 |
National Treasury Notes - NTN B |
| - |
| 75,070 |
| 1,778,219 |
| 6,340,980 |
| 10,990,300 |
| 19,184,569 |
National Treasury Notes - NTN C |
| - |
| 38,632 |
| 53,071 |
| - |
| 1,133,711 |
| 1,225,414 |
National Treasury Notes - NTN F |
| - |
| 15,192,914 |
| - |
| 1,380,916 |
| 8,726,635 |
| 25,300,465 |
Agricultural Debt Securities - TDA |
| - |
| 2,491 |
| 47,814 |
| 66,593 |
| 11,370 |
| 128,268 |
Brazilian Foreign Debt Notes |
| - |
| 29 |
| - |
| - |
| 675 |
| 704 |
Private Securities |
| 1,232,318 |
| 3,372 |
| 51,315 |
| 25,218 |
| 441,845 |
| 1,754,068 |
Shares |
| 124,997 |
| - |
| - |
| - |
| - |
| 124,997 |
Receivables Investment Fund - FIDC(1) |
| - |
| - |
| 1,996 |
| - |
| - |
| 1,996 |
Investment Fund Shares in Participation - FIP |
| - |
| - |
| - |
| - |
| 21,313 |
| 21,313 |
Investment Fund Shares |
| 1,083,289 |
| 9 |
| - |
| - |
| - |
| 1,083,298 |
Investment Fund Real Estate |
| 24,032 |
| - |
| - |
| - |
| - |
| 24,032 |
Debentures(3) |
| - |
| 566 |
| 523 |
| 15,621 |
| 251,771 |
| 268,481 |
Financial Bills - LF |
| - |
| - |
| 48,600 |
| - |
| - |
| 48,600 |
Certificates of Real Estate Receivables - CRI |
| - |
| 45 |
| 19 |
| 251 |
| 30,010 |
| 30,325 |
Certificates of Agribusiness Receivables - CRA |
| - |
| - |
| - |
| 9,346 |
| 138,751 |
| 148,097 |
Bank Deposits Certificates - CDB |
| - |
| 2,752 |
| 177 |
| - |
| - |
| 2,929 |
Total |
| 1,232,318 |
| 20,872,556 |
| 3,604,595 |
| 10,316,649 |
| 26,712,904 |
| 62,739,022 |
43
III) Available-for-Sale Securities | ||||||||||
| ||||||||||
|
|
|
|
|
|
|
|
|
| Bank |
|
|
|
|
|
|
|
| 12/31/2016 |
| 12/31/2015 |
Adjustment to Market | ||||||||||
Cost | Fair Value - | Carrying | Carrying | |||||||
Available-for-Sale Securities |
| Amortized |
| Result | Equity |
| Amount |
| Amount | |
Government Securities |
| 50,013,123 |
| - |
| 952,471 |
| 50,965,594 |
| 58,013,126 |
Treasury Certificates - CFT |
| 604 |
| - |
| 188 |
| 792 |
| 650 |
Securitized Credit |
| 2,520 |
| - |
| 254 |
| 2,774 |
| 3,206 |
Treasury Bills - LFT |
| 13,033,951 |
| - |
| (24,413) |
| 13,009,538 |
| 11,432,222 |
National Treasury Bills - LTN |
| 15,177,670 |
| - |
| 249,596 |
| 15,427,266 |
| 24,172,709 |
National Treasury Notes - NTN A |
| 1,159,608 |
| - |
| (61,232) |
| 1,098,376 |
| 1,329,024 |
National Treasury Notes - NTN B |
| 6,296,307 |
| - |
| 380,310 |
| 6,676,617 |
| 5,096,646 |
National Treasury Notes - NTN C(2) |
| 1,488,657 |
| - |
| (31,354) |
| 1,457,303 |
| 1,248,664 |
National Treasury Notes - NTN F(2) (6) |
| 9,650,245 |
| - |
| 453,598 |
| 10,103,843 |
| 10,687,322 |
Spanish Foreign Debt Bonds |
| 3,203,561 |
| - |
| (14,476) |
| 3,189,085 |
| 2,438,200 |
Debentures(3) |
| - |
| - |
| - |
| - |
| 1,604,483 |
Private Securities |
| 83,593,667 |
| 13,058 |
| (495,895) |
| 83,110,830 |
| 82,074,760 |
Shares |
| 575,789 |
| - |
| (4,871) |
| 570,918 |
| 760,362 |
Receivables Investment Fund - FIDC(1) |
| - |
| - |
| - |
| - |
| 223,001 |
Investment Fund Shares in Participation - FIP(7) |
| 109,668 |
| (72,158) |
| - |
| 37,510 |
| 612,081 |
Investment Fund Shares |
| 553,360 |
| 84,880 |
| - |
| 638,240 |
| 554,363 |
Investment Fund Real Estate |
| 595,100 |
| (7,542) |
| - |
| 587,558 |
| - |
Debentures (3) (4) |
| 75,992,809 |
| - |
| (458,200) |
| 75,534,609 |
| 73,039,930 |
Eurobonds |
| 219,306 |
| - |
| (61,249) |
| 158,057 |
| 212,910 |
Promissory Notes - NP (5) |
| 3,746,375 |
| 7,878 |
| 40,508 |
| 3,794,761 |
| 4,944,704 |
Real Estate Credit Notes - CCI |
| - |
| - |
| - |
| - |
| 14,972 |
Financial Bills - LF |
| 1,258,871 |
| - |
| 1,424 |
| 1,260,295 |
| 1,220,822 |
Certificates of Real Estate Receivables - CRI |
| 410,577 |
| - |
| (12,142) |
| 398,435 |
| 491,615 |
Rural Product Note - CPR |
| 131,812 |
| - |
| (1,365) |
| 130,447 |
| - |
Total |
| 133,606,790 |
| 13,058 |
| 456,576 |
| 134,076,424 |
| 140,087,886 |
44
|
|
|
|
|
|
|
|
|
| Consolidated |
|
|
|
|
|
|
|
| 12/31/2016 |
| 12/31/2015 |
Adjustment to Market | ||||||||||
Cost | Fair Value - | Carrying | Carrying | |||||||
Available-for-Sale Securities |
| Amortized |
| Result | Equity |
| Amount |
| Amount | |
Government Securities |
| 53,551,033 |
| - |
| 1,040,396 |
| 54,591,429 |
| 61,649,908 |
Treasury Certificates - CFT |
| 604 |
| - |
| 188 |
| 792 |
| 650 |
Securitized Credit |
| 2,520 |
| - |
| 254 |
| 2,774 |
| 3,206 |
Treasury Bills - LFT |
| 13,884,393 |
| - |
| (24,832) |
| 13,859,561 |
| 11,876,143 |
National Treasury Bills - LTN |
| 16,239,034 |
| - |
| 261,352 |
| 16,500,386 |
| 25,048,673 |
National Treasury Notes - NTN A |
| 1,159,608 |
| - |
| (61,232) |
| 1,098,376 |
| 1,328,863 |
National Treasury Notes - NTN B |
| 6,296,307 |
| - |
| 380,310 |
| 6,676,617 |
| 5,096,646 |
National Treasury Notes - NTN C(2) |
| 1,488,657 |
| - |
| (31,354) |
| 1,457,303 |
| 1,248,664 |
National Treasury Notes - NTN F(2) (6) |
| 11,276,349 |
| - |
| 530,186 |
| 11,806,535 |
| 13,004,380 |
Spanish Foreign Debt Bonds |
| 3,203,561 |
| - |
| (14,476) |
| 3,189,085 |
| 2,438,200 |
Debentures (3) |
| - |
| - |
| - |
| - |
| 1,604,483 |
Private Securities |
| 19,324,712 |
| (64,273) |
| (465,621) |
| 18,794,818 |
| 18,746,550 |
Shares |
| 893,880 |
| - |
| 31,340 |
| 925,220 |
| 793,557 |
Receivables Investment Fund - FIDC(1) |
| - |
| - |
| - |
| - |
| 230,310 |
Investment Fund Shares in Participation - FIP (7) |
| 114,614 |
| (72,158) |
| - |
| 42,456 |
| 626,426 |
Investment Fund Shares |
| 151,195 |
| 7 |
| - |
| 151,202 |
| 195,846 |
Investment Fund Real Estate |
| 62,859 |
| - |
| (52) |
| 62,807 |
| 56,204 |
Debentures (3) (4) |
| 12,048,125 |
| - |
| (458,200) |
| 11,589,925 |
| 9,683,147 |
Eurobonds |
| 219,306 |
| - |
| (61,249) |
| 158,057 |
| 212,910 |
Promissory Notes - NP (5) |
| 3,755,447 |
| 7,878 |
| 34,294 |
| 3,797,619 |
| 4,944,704 |
Real Estate Credit Notes - CCI |
| - |
| - |
| - |
| - |
| 14,972 |
Foreign Exchange Bills |
| 20,594 |
| - |
| - |
| 20,594 |
| - |
Financial Bills - LF |
| 1,487,515 |
| - |
| 1,753 |
| 1,489,268 |
| 1,446,465 |
Certificates of Real Estate Receivables - CRI |
| 410,577 |
| - |
| (12,142) |
| 398,435 |
| 491,615 |
Certificates of Bank Deposit - CDB |
| 28,788 |
| - |
| - |
| 28,788 |
| 50,394 |
Rural Product Note - CPR |
| 131,812 |
| - |
| (1,365) |
| 130,447 |
| - |
Total |
| 72,875,745 |
| (64,273) |
| 574,775 |
| 73,386,247 |
| 80,396,458 |
45
|
|
|
|
|
|
|
|
|
|
|
| Bank |
|
|
|
|
|
|
|
|
|
|
|
| 12/31/2016 |
Available-for-Sale Securities |
| Without |
| Up to |
| From 3 to |
| From 1 to |
| Over |
|
|
by Maturity |
| Maturity |
| 3 Months |
| 12 Months |
| 3 Years |
| 3 Years |
| Total |
Government Securities |
| - |
| 556,922 |
| 3,203,788 |
| 14,129,239 |
| 33,075,645 |
| 50,965,594 |
Treasury Certificates - CFT |
| - |
| - |
| - |
| - |
| 792 |
| 792 |
Securitized Credit |
| - |
| 228 |
| 700 |
| 1,225 |
| 621 |
| 2,774 |
Treasury Bills - LFT |
| - |
| - |
| - |
| 84,408 |
| 12,925,130 |
| 13,009,538 |
National Treasury Bills - LTN |
| - |
| - |
| 8,495 |
| 14,043,606 |
| 1,375,165 |
| 15,427,266 |
National Treasury Notes - NTN A |
| - |
| - |
| 4,632 |
| - |
| 1,093,744 |
| 1,098,376 |
National Treasury Notes - NTN B |
| - |
| 44,289 |
| 876 |
| - |
| 6,631,452 |
| 6,676,617 |
National Treasury Notes - NTN C(2) |
| - |
| 14,780 |
| - |
| - |
| 1,442,523 |
| 1,457,303 |
National Treasury Notes - NTN F(2) (6) |
| - |
| 497,625 |
| - |
| - |
| 9,606,218 |
| 10,103,843 |
Spanish Foreign Debt Bonds |
| - |
| - |
| 3,189,085 |
| - |
| - |
| 3,189,085 |
Private Securities |
| 1,257,030 |
| 2,036,300 |
| 16,603,239 |
| 5,451,293 |
| 57,762,968 |
| 83,110,830 |
Shares |
| 31,232 |
| - |
| 124,549 |
| 415,137 |
| - |
| 570,918 |
Investment Fund Shares in Participation - FIP (7) |
| - |
| - |
| - |
| 7,720 |
| 29,790 |
| 37,510 |
Investment Fund Shares |
| 638,240 |
| - |
| - |
| - |
| - |
| 638,240 |
Investment Fund Real Estate |
| 587,558 |
| - |
| - |
| - |
| - |
| 587,558 |
Debentures (3) (4) |
| - |
| 680,059 |
| 14,346,916 |
| 3,272,282 |
| 57,235,352 |
| 75,534,609 |
Eurobonds |
| - |
| 5,988 |
| - |
| - |
| 152,069 |
| 158,057 |
Promissory Notes - NP(5) |
| - |
| 592,102 |
| 1,525,845 |
| 1,550,956 |
| 125,858 |
| 3,794,761 |
Financial Bills - LF |
| - |
| 717,299 |
| 455,292 |
| 87,704 |
| - |
| 1,260,295 |
Certificates of Real Estate Receivables - CRI |
| - |
| 33,058 |
| 90,173 |
| 55,305 |
| 219,899 |
| 398,435 |
Rural Product Note - CPR |
| - |
| 7,794 |
| 60,464 |
| 62,189 |
| - |
| 130,447 |
Total |
| 1,257,030 |
| 2,593,222 |
| 19,807,027 |
| 19,580,532 |
| 90,838,613 |
| 134,076,424 |
46
|
|
|
|
|
|
|
|
|
|
|
| Consolidated |
|
|
|
|
|
|
|
|
|
|
|
| 12/31/2016 |
Available-for-Sale Securities |
| Without |
| Up to |
| From 3 to |
| From 1 to |
| Over |
|
|
by Maturity |
| Maturity |
| 3 Months |
| 12 Months |
| 3 Years |
| 3 Years |
| Total |
Government Securities |
| - |
| 638,912 |
| 3,576,768 |
| 15,072,819 |
| 35,302,930 |
| 54,591,429 |
Treasury Certificates - CFT |
| - |
| - |
| - |
| - |
| 792 |
| 792 |
Securitized Credit |
| - |
| 228 |
| 700 |
| 1,225 |
| 621 |
| 2,774 |
Treasury Bills - LFT |
| - |
| - |
| 117,074 |
| 159,700 |
| 13,582,787 |
| 13,859,561 |
National Treasury Bills - LTN |
| - |
| - |
| 264,401 |
| 14,799,297 |
| 1,436,688 |
| 16,500,386 |
National Treasury Notes - NTN A |
| - |
| - |
| 4,632 |
| - |
| 1,093,744 |
| 1,098,376 |
National Treasury Notes - NTN B |
| - |
| 44,289 |
| 876 |
| - |
| 6,631,452 |
| 6,676,617 |
National Treasury Notes - NTN C(2) |
| - |
| 14,780 |
| - |
| - |
| 1,442,523 |
| 1,457,303 |
National Treasury Notes - NTN F(2) (6) |
| - |
| 579,615 |
| - |
| 112,597 |
| 11,114,323 |
| 11,806,535 |
Spanish Foreign Debt Bonds |
| - |
| - |
| 3,189,085 |
| - |
| - |
| 3,189,085 |
Private Securities |
| 250,442 |
| 2,076,305 |
| 3,614,156 |
| 5,555,680 |
| 7,298,235 |
| 18,794,818 |
Shares |
| 36,579 |
| 1,274 |
| 124,549 |
| 415,137 |
| 347,681 |
| 925,220 |
Investment Fund Shares in Participation - FIP(7) |
| - |
| - |
| - |
| 12,666 |
| 29,790 |
| 42,456 |
Investment Fund Shares |
| 151,056 |
| 146 |
| - |
| - |
| - |
| 151,202 |
Investment Fund Real Estate |
| 62,807 |
| - |
| - |
| - |
| - |
| 62,807 |
Debentures(3)(4) |
| - |
| 680,059 |
| 1,243,409 |
| 3,272,282 |
| 6,394,175 |
| 11,589,925 |
Eurobonds |
| - |
| 5,988 |
| - |
| - |
| 152,069 |
| 158,057 |
Promissory Notes - NP(5) |
| - |
| 592,102 |
| 1,528,703 |
| 1,550,956 |
| 125,858 |
| 3,797,619 |
Foreign Exchange Bills |
| - |
| - |
| - |
| 20,594 |
| - |
| 20,594 |
Financial Bills - LF |
| - |
| 755,884 |
| 566,833 |
| 166,551 |
| - |
| 1,489,268 |
Certificates of Real Estate Receivables - CRI |
| - |
| 33,058 |
| 90,173 |
| 55,305 |
| 219,899 |
| 398,435 |
Certificates of Bank Deposit - CDB |
| - |
| - |
| 25 |
| - |
| 28,763 |
| 28,788 |
Rural Product Note - CPR |
| - |
| 7,794 |
| 60,464 |
| 62,189 |
| - |
| 130,447 |
Total |
| 250,442 |
| 2,715,217 |
| 7,190,924 |
| 20,628,499 |
| 42,601,165 |
| 73,386,247 |
(1) Receivables Investment Fund (FIDC) shares are calculated based on the value of the receivables and other financial assets in the respective portfolios, less respective provisions that take into consideration aspects related to the debtors, their guarantors and the corresponding transaction’s characteristics, according to accounting standards and practices for evaluating credits. | ||||||||||||
(2) During the year ended December 31, 2016 there was realized the value of R$25,027 (2015 - R$14,053) result, net of tax, in the Consolidated income from the sale of NTN-C and NTN-F part to the market (Note 24.e). | ||||||||||||
(3) Includes issues of mixed capital company. | ||||||||||||
(4) On December 31, 2015, includes R$503,415 of hedge objects market risks (Note 6.b.V.a). | ||||||||||||
(5) Includes R$146,392 (12/31/2015 - R$381,641) of hedge objects market risks (Note 6.b.V.a) and R$1,939,949 of hedge objects cash flow hedge (Nota 6.b.v.b). | ||||||||||||
(6) On December 31, 2016 and 2015, the amount of 1,040,000 Notes National Treasury (NTN-F), with maturity on January 1, 2025 are bound by the obligation assumed by Banco Santander to hedging of unamortized reserves Plan V of the Social Security Fund (Banesprev). | ||||||||||||
47
(7) The assets of the invested companies are measured using the methodology of: (i) the fair value of a financial instrument, interpreted as the price paid in an active, transparent and significant market. If there is no market price for a given financial instrument, its fair value is estimated based on valuation techniques normally adopted by the financial market, taking into account the specific characteristics of the instrument to be measured and, above all, the different types of risks associated to it; (ii) the cost of acquisition of financial assets. If there is no quotation available on the stock exchange or organized over-the-counter market, they are valued at acquisition cost or at amortized cost, adjusted by provision for impairment, when applicable. | ||||||||||||||||||||
IV) Held-to-Maturity Securities | ||||||||||||||||||||
Bank/Consolidated | ||||||||||||||||||||
12/31/2016 | ||||||||||||||||||||
|
|
|
|
|
|
|
|
|
|
|
|
|
|
|
|
|
|
|
| By Maturity |
Cost |
|
|
|
|
|
|
| |||||||||||||
Amortized /Accounting | Up to | From 3 to | From 1 to | Over | ||||||||||||||||
Held-to-Maturity Securities(1) | 12/31/2016 | 12/31/2015 | 3 Months |
| 12 Months |
| 3 Years |
| 3 Years | Total | ||||||||||
Government Securities |
| 9,388,442 |
| 9,257,519 |
| 98,451 |
| 39,833 |
| 346,245 |
| 8,903,913 |
| 9,388,442 | ||||||
National Treasury Notes - NTN A |
| 2,921,564 |
| 3,559,308 |
| - |
| 11,714 |
| - |
| 2,909,850 |
| 2,921,564 | ||||||
Brazilian Foreign Debt Bonds(2) |
| 6,466,878 |
| 5,698,211 |
| 98,451 |
| 28,119 |
| 346,245 |
| 5,994,063 |
| 6,466,878 | ||||||
Total |
| 9,388,442 |
| 9,257,519 |
| 98,451 |
| 39,833 |
| 346,245 |
| 8,903,913 |
| 9,388,442 | ||||||
(1) The fair value of held to maturity securities is R$10,555,437 (12/31/2015 - R$9,257,519). | ||||||||||||||||||||
(2) Includes the amount of R$701,300 (12/31/2015 - R$866,554) of cash flow object hedge (Note 6.b.V.b). | ||||||||||||||||||||
In January 2014, Bank issued of bonds eligible to compose the capital of Level I and Level II Reference Equity (RE), amounting to USD2.5 billion (equivalent to R$ 6 billion) (Note 21). In order to mitigate the risk of interest rates in US dollars, was made the purchase of assets indexed in this currency: NTN-A and Eurobonds issued by the federal government of Brazil and Banco Nacional de Desenvolvimento Econômico e Social (BNDES) (acquired via foreign branche Grand Cayman Branch). Initially, these securities were classified as "available for sale" and at December 31, 2015 were reclassified to "held to maturity". | ||||||||||||||||||||
Given the provisions of Article 5 of Circular Bacen 3,068/2001, Banco Santander has the financial capacity and intention to hold to maturity securities classified as held-to-maturity. | ||||||||||||||||||||
The market value of securities is computed based on the average quotation on organized markets and their estimated cash flows, discounted to present value using the applicable interest rate curves, representative of market conditions at the end of balance. | ||||||||||||||||||||
48
V) Financial Income - Securities Transactions | ||||||||
|
|
|
| Bank |
|
|
| Consolidated |
01/01 to | 01/01 to | 01/01 to | 01/01 to | |||||
|
| 12/31/2016 |
| 12/31/2015 |
| 12/31/2016 |
| 12/31/2015 |
Income From Fixed-Income Securities |
| 25,757,275 |
| 30,951,727 |
| 15,021,542 |
| 24,559,318 |
Income From Interbank Investments |
| 11,277,121 |
| 8,994,819 |
| 6,838,364 |
| 5,414,238 |
Income From Variable-Income Securities |
| 88,674 |
| (288,854) |
| 222,744 |
| (213,813) |
Financial Income of Pension and Capitalization |
| - |
| - |
| 150,233 |
| 158,304 |
Provision for Impairment losses(1) |
| (390,036) |
| (58,409) |
| (443,045) |
| (772,241) |
Others(2) |
| 98,238 |
| 174,963 |
| 1,676,564 |
| 340,803 |
Total |
| 36,831,272 |
| 39,774,246 |
| 23,466,402 |
| 29,486,609 |
(1) Corresponds to the permanent loss record, referring to securities classified as available for sale. | ||||||||
(2) Corresponds, mainly, to income from investment funds and participations. | ||||||||
49
b) Derivatives Financial Instruments | ||||||||||||
I) Derivatives Recorded in Memorandum and Balance Sheets | ||||||||||||
|
|
|
|
|
|
|
| Bank | ||||
12/31/2016 | 12/31/2015 | |||||||||||
|
|
|
|
|
| Trading |
|
|
|
|
| Trading |
|
| Notional |
| Cost |
| Fair Value |
| Notional |
| Cost |
| Fair Value |
Swap |
|
|
| 5,417,902 |
| 3,138,044 |
|
|
| 19,258,839 |
| 3,101,501 |
Asset |
| 118,076,726 |
| 23,171,475 |
| 24,315,423 |
| 245,461,855 |
| 38,126,434 |
| 38,852,905 |
CDI (Interbank Deposit Rates) |
| 44,868,680 |
| 21,689,958 |
| 22,763,760 |
| 38,673,202 |
| 6,955,903 |
| 9,233,799 |
Fixed Interest Rate - Real |
| 47,732,950 |
| - |
| - |
| 131,559,811 |
| - |
| - |
Indexed to Price and Interest Rates |
| 9,225,789 |
| - |
| - |
| 15,491,510 |
| 8,449,407 |
| 6,421,311 |
Foreign Currency |
| 16,249,307 |
| 1,481,517 |
| 1,551,663 |
| 59,725,687 |
| 22,709,479 |
| 23,207,542 |
Others |
| - |
| - |
| - |
| 11,645 |
| 11,645 |
| (9,747) |
Liabilities |
| 112,658,824 |
| (17,753,573) |
| (21,177,379) |
| 226,203,016 |
| (18,867,595) |
| (35,751,404) |
CDI (Interbank Deposit Rates) |
| 23,178,722 |
| - |
| - |
| 31,717,299 |
| - |
| - |
Fixed Interest Rate - Real |
| 61,775,580 |
| (14,042,630) |
| (17,461,002) |
| 150,427,406 |
| (18,867,595) |
| (35,751,404) |
Indexed to Price and Interest Rates |
| 12,767,212 |
| (3,541,423) |
| (3,518,297) |
| 7,042,103 |
| - |
| - |
Foreign Currency |
| 14,767,790 |
| - |
| - |
| 37,016,208 |
| - |
| - |
Others |
| 169,520 |
| (169,520) |
| (198,080) |
| - |
| - |
| - |
Options |
| 169,608,057 |
| 449,906 |
| 154,967 |
| 90,948,495 |
| (15,877) |
| 20,417 |
Purchased Position |
| 80,830,149 |
| 1,076,380 |
| 883,474 |
| 45,423,462 |
| 405,013 |
| 814,423 |
Call Option - US Dollar |
| 12,693,748 |
| 215,095 |
| 181,463 |
| 5,018,650 |
| 225,226 |
| 604,629 |
Put Option - US Dollar |
| 3,788,161 |
| 352,584 |
| 392,048 |
| 2,735,626 |
| 58,884 |
| 31,521 |
Call Option - Other |
| 17,492,141 |
| 16,939 |
| 15,914 |
| 13,803,789 |
| 77,341 |
| 167,851 |
Interbank Market |
| 17,391,500 |
| 7,152 |
| 7,062 |
| 13,114,822 |
| 18,736 |
| 93,435 |
Others(1) |
| 100,641 |
| 9,787 |
| 8,852 |
| 688,967 |
| 58,605 |
| 74,416 |
Put Option - Other |
| 46,856,099 |
| 491,762 |
| 294,049 |
| 23,865,397 |
| 43,562 |
| 10,422 |
Interbank Market |
| 46,106,600 |
| 13,968 |
| 18,029 |
| 23,350,994 |
| 27,761 |
| 4,558 |
Others(1) |
| 749,499 |
| 477,794 |
| 276,020 |
| 514,403 |
| 15,801 |
| 5,864 |
Sold Position |
| 88,777,908 |
| (626,474) |
| (728,507) |
| 45,525,033 |
| (420,890) |
| (794,006) |
Call Option - US Dollar |
| 4,314,988 |
| (121,751) |
| (141,172) |
| 3,331,244 |
| (184,273) |
| (535,702) |
Put Option - US Dollar |
| 7,390,733 |
| (470,629) |
| (553,458) |
| 4,402,203 |
| (125,172) |
| (73,815) |
Call Option - Other |
| 27,784,459 |
| (15,425) |
| (13,957) |
| 14,515,876 |
| (72,923) |
| (179,402) |
Interbank Market |
| 27,597,764 |
| (5,891) |
| (4,087) |
| 13,730,262 |
| (21,932) |
| (112,707) |
Others(1) |
| 186,695 |
| (9,534) |
| (9,870) |
| 785,614 |
| (50,991) |
| (66,695) |
Put Option - Other |
| 49,287,728 |
| (18,669) |
| (19,920) |
| 23,275,710 |
| (38,522) |
| (5,087) |
Interbank Market |
| 49,245,495 |
| (9,225) |
| (5,793) |
| 23,218,228 |
| (26,315) |
| (1,615) |
Others(1) |
| 42,233 |
| (9,444) |
| (14,127) |
| 57,482 |
| (12,207) |
| (3,472) |
Futures Contracts |
| 104,348,970 |
| - |
| - |
| 183,592,248 |
| - |
| - |
Purchased Position |
| 40,286,253 |
| - |
| - |
| 41,136,899 |
| - |
| - |
Exchange Coupon (DDI) |
| 14,473,180 |
| - |
| - |
| 4,274,347 |
| - |
| - |
Interest Rates (DI1 and DIA) |
| 23,694,707 |
| - |
| - |
| 22,721,816 |
| - |
| - |
Foreign Currency |
| 1,393,538 |
| - |
| - |
| 11,710,935 |
| - |
| - |
Indexes(2) |
| 146,773 |
| - |
| - |
| 566,378 |
| - |
| - |
Treasury Bonds/Notes |
| 578,055 |
| - |
| - |
| - |
| - |
| - |
Average Rate of Repo Operations (OC1) |
| - |
| - |
| - |
| 1,863,423 |
| - |
| - |
Sold Position |
| 64,062,717 |
| - |
| - |
| 142,455,349 |
| - |
| - |
Exchange Coupon (DDI) |
| 15,048,490 |
| - |
| - |
| 58,499,504 |
| - |
| - |
Interest Rates (DI1 and DIA) |
| 28,942,103 |
| - |
| - |
| 20,304,192 |
| - |
| - |
Foreign Currency |
| 17,384,256 |
| - |
| - |
| 35,463,589 |
| - |
| - |
Indexes(2) |
| 99,074 |
| - |
| - |
| 483,599 |
| - |
| - |
Treasury Bonds/Notes |
| 2,588,794 |
| - |
| - |
| 49,164 |
| - |
| - |
Average Rate of Repo Operations (OC1) |
| - |
| - |
| - |
| 27,655,301 |
| - |
| - |
50
|
|
|
|
|
|
|
| Bank | ||||
12/31/2016 | 12/31/2015 | |||||||||||
|
|
|
|
|
| Trading |
|
|
|
|
| Trading |
|
| Notional |
| Cost |
| Fair Value |
| Notional |
| Cost |
| Fair Value |
Forward Contracts and Others |
| 50,775,576 |
| 66,994 |
| 907,377 |
| 51,047,964 |
| 1,019,191 |
| 921,676 |
Purchased Commitment |
| 20,864,170 |
| 724,000 |
| 2,734,342 |
| 21,570,405 |
| 2,914,197 |
| 2,690,632 |
Currencies |
| 19,951,984 |
| 724,000 |
| 2,738,737 |
| 21,570,405 |
| 2,914,197 |
| 2,690,632 |
Others |
| 912,186 |
| - |
| (4,395) |
| - |
| - |
| - |
Sell Commitment |
| 29,911,406 |
| (657,006) |
| (1,826,965) |
| 29,477,559 |
| (1,895,006) |
| (1,768,956) |
Currencies |
| 29,911,406 |
| (657,006) |
| (1,826,965) |
| 29,140,219 |
| (1,895,006) |
| (1,754,301) |
Others |
| - |
| - |
| - |
| 337,340 |
| - |
| (14,655) |
|
|
|
|
|
|
|
|
|
|
|
| Consolidated |
12/31/2016 | 12/31/2015 | |||||||||||
|
|
|
|
|
| Trading |
|
|
|
|
| Trading |
|
| Notional |
| Cost |
| Fair Value |
| Notional |
| Cost |
| Fair Value |
Swap |
|
|
| 12,544,823 |
| 3,110,732 |
|
|
| 19,767,937 |
| 3,158,175 |
Asset |
| 199,767,970 |
| 25,813,018 |
| 26,962,872 |
| 321,353,805 |
| 43,700,717 |
| 44,411,308 |
CDI (Interbank Deposit Rates) |
| 47,649,278 |
| 24,370,336 |
| 25,450,045 |
| 44,696,063 |
| 12,695,478 |
| 15,008,061 |
Fixed Interest Rate - Real |
| 126,400,445 |
| - |
| - |
| 200,528,046 |
| - |
| - |
Indexed to Price and Interest Rates |
| 9,225,789 |
| - |
| - |
| 15,491,510 |
| 8,561,407 |
| 6,421,311 |
Foreign Currency |
| 16,492,458 |
| 1,442,682 |
| 1,512,827 |
| 60,626,541 |
| 22,432,187 |
| 22,991,683 |
Others |
| - |
| - |
| - |
| 11,645 |
| 11,645 |
| (9,747) |
Liabilities |
| 187,223,147 |
| (13,268,195) |
| (23,852,140) |
| 301,585,868 |
| (23,932,780) |
| (41,253,133) |
CDI (Interbank Deposit Rates) |
| 23,278,942 |
| - |
| - |
| 32,000,585 |
| - |
| - |
Fixed Interest Rate - Real |
| 135,957,697 |
| (9,557,252) |
| (20,135,763) |
| 224,460,826 |
| (23,932,780) |
| (41,253,133) |
Indexed to Price and Interest Rates |
| 12,767,212 |
| (3,541,423) |
| (3,518,297) |
| 6,930,103 |
| - |
| - |
Foreign Currency |
| 15,049,776 |
| - |
| - |
| 38,194,354 |
| - |
| - |
Others |
| 169,520 |
| (169,520) |
| (198,080) |
| - |
| - |
| - |
Options |
| 175,841,405 |
| 448,739 |
| 168,467 |
| 91,877,353 |
| (32,566) |
| 97,707 |
Purchased Position |
| 83,883,966 |
| 1,149,704 |
| 935,520 |
| 46,024,648 |
| 357,644 |
| 862,972 |
Call Option - US Dollar |
| 12,693,748 |
| 215,095 |
| 181,463 |
| 5,018,650 |
| 225,226 |
| 604,629 |
Put Option - US Dollar |
| 3,788,161 |
| 352,584 |
| 392,048 |
| 2,735,626 |
| 58,884 |
| 31,521 |
Call Option - Other |
| 20,115,932 |
| 60,830 |
| 62,517 |
| 14,106,701 |
| 31,405 |
| 142,121 |
Interbank Market |
| 17,391,500 |
| 7,152 |
| 7,062 |
| 13,114,822 |
| - |
| 74,699 |
Others(1) |
| 2,724,432 |
| 53,678 |
| 55,455 |
| 991,879 |
| 31,405 |
| 67,422 |
Put Option - Other |
| 47,286,125 |
| 521,195 |
| 299,492 |
| 24,163,671 |
| 42,129 |
| 84,701 |
Interbank Market |
| 46,106,600 |
| 13,968 |
| 18,029 |
| 23,350,994 |
| 27,761 |
| 4,558 |
Others(1) |
| 1,179,525 |
| 507,227 |
| 281,463 |
| 812,677 |
| 14,368 |
| 80,143 |
Sold Position |
| 91,957,439 |
| (700,965) |
| (767,053) |
| 45,852,705 |
| (390,210) |
| (765,265) |
Call Option - US Dollar |
| 4,314,988 |
| (121,751) |
| (141,172) |
| 3,331,244 |
| (184,273) |
| (535,702) |
Put Option - US Dollar |
| 7,390,733 |
| (470,629) |
| (553,458) |
| 4,402,203 |
| (125,172) |
| (73,815) |
Call Option - Other |
| 30,441,646 |
| (75,754) |
| (46,940) |
| 14,567,407 |
| (41,848) |
| (121,217) |
Interbank Market |
| 27,597,764 |
| (5,891) |
| (4,087) |
| 13,730,262 |
| (21,932) |
| (112,707) |
Others(1) |
| 2,843,882 |
| (69,863) |
| (42,853) |
| 837,145 |
| (19,916) |
| (8,510) |
Put Option - Other |
| 49,810,072 |
| (32,831) |
| (25,483) |
| 23,551,851 |
| (38,917) |
| (34,531) |
Interbank Market |
| 49,245,495 |
| (9,225) |
| (5,793) |
| 23,218,228 |
| (26,315) |
| (1,615) |
Others(1) |
| 564,577 |
| (23,606) |
| (19,690) |
| 333,623 |
| (12,602) |
| (32,916) |
Futures Contracts |
| 104,651,180 |
| - |
| - |
| 184,191,203 |
| - |
| - |
Purchased Position |
| 40,396,456 |
| - |
| - |
| 41,186,338 |
| - |
| - |
Exchange Coupon (DDI) |
| 14,473,180 |
| - |
| - |
| 4,274,347 |
| - |
| - |
Interest Rates (DI1 and DIA) |
| 23,756,523 |
| - |
| - |
| 22,760,484 |
| - |
| - |
Foreign Currency |
| 1,393,538 |
| - |
| - |
| 11,710,935 |
| - |
| - |
Indexes(2) |
| 195,160 |
| - |
| - |
| 577,149 |
| - |
| - |
Treasury Bonds/Notes |
| 578,055 |
| - |
| - |
| - |
| - |
| - |
Average Rate of Repo Operations (OC1) |
| - |
| - |
| - |
| 1,863,423 |
| - |
| - |
51
|
|
|
|
|
|
|
|
|
|
|
| Consolidated |
12/31/2016 | 12/31/2015 | |||||||||||
|
|
|
|
|
| Trading |
|
|
|
|
| Trading |
|
| Notional |
| Cost |
| Fair Value |
| Notional |
| Cost |
| Fair Value |
Sold Position |
| 64,254,724 |
| - |
| - |
| 143,004,865 |
| - |
| - |
Exchange Coupon (DDI) |
| 15,048,490 |
| - |
| - |
| 58,499,504 |
| - |
| - |
Interest Rates (DI1 and DIA) |
| 29,047,678 |
| - |
| - |
| 20,836,314 |
| - |
| - |
Foreign Currency |
| 17,384,256 |
| - |
| - |
| 35,463,589 |
| - |
| - |
Indexes(2) |
| 185,506 |
| - |
| - |
| 500,993 |
| - |
| - |
Treasury Bonds/Notes |
| 2,588,794 |
| - |
| - |
| 49,164 |
| - |
| - |
Average Rate of Repo Operations (OC1) |
| - |
| - |
| - |
| 27,655,301 |
| - |
| - |
Forward Contracts and Others |
| 50,853,154 |
| 144,572 |
| 990,702 |
| 51,058,023 |
| 1,005,428 |
| 935,988 |
Purchased Commitment |
| 20,864,170 |
| 724,000 |
| 2,734,342 |
| 21,577,414 |
| 2,917,270 |
| 2,693,587 |
Currencies |
| 19,951,984 |
| 724,000 |
| 2,738,737 |
| 21,577,414 |
| 2,917,270 |
| 2,693,587 |
Others |
| 912,186 |
| - |
| (4,395) |
| - |
| - |
| - |
Sell Commitment |
| 29,988,984 |
| (579,428) |
| (1,743,640) |
| 29,480,609 |
| (1,911,842) |
| (1,757,599) |
Currencies |
| 29,911,406 |
| (657,006) |
| (1,826,965) |
| 29,140,219 |
| (1,898,297) |
| (1,757,592) |
Others |
| 77,578 |
| 77,578 |
| 83,325 |
| 340,390 |
| (13,545) |
| (7) |
(1) Includes share options and indexes. | ||||||||||||
(2) Includes Bovespa and S&P indexes. | ||||||||||||
II) Derivatives Financial Instruments by Counterparty | ||||||||||||
|
|
|
|
|
|
|
|
|
|
|
| Bank |
Notional | ||||||||||||
|
|
|
|
|
|
|
|
|
| 12/31/2016 |
| 12/31/2015 |
Related | Financial | |||||||||||
|
|
|
| Customers |
| Parties |
| Institutions(1) |
| Total |
| Total |
Swap |
|
|
| 43,082,605 |
| 15,577,348 |
| 59,416,773 |
| 118,076,726 |
| 245,461,855 |
Options |
|
|
| 5,915,980 |
| 839,182 |
| 162,852,895 |
| 169,608,057 |
| 90,948,495 |
Futures Contracts |
|
|
| - |
| - |
| 104,348,970 |
| 104,348,970 |
| 183,592,248 |
Forward Contracts and Others |
|
|
| 29,044,676 |
| 17,563,319 |
| 4,167,581 |
| 50,775,576 |
| 51,047,964 |
|
|
|
|
|
|
|
|
|
|
|
| Consolidated |
Notional | ||||||||||||
|
|
|
|
|
|
|
|
|
| 12/31/2016 |
| 12/31/2015 |
Related | Financial | |||||||||||
|
|
|
| Customers |
| Parties |
| Institutions(1) |
| Total |
| Total |
Swap |
|
|
| 43,082,605 |
| 15,910,871 |
| 140,774,494 |
| 199,767,970 |
| 321,353,805 |
Options |
|
|
| 5,916,105 |
| 839,182 |
| 169,086,118 |
| 175,841,405 |
| 91,877,353 |
Futures Contracts |
|
|
| - |
| - |
| 104,651,180 |
| 104,651,180 |
| 184,191,203 |
Forward Contracts and Others |
|
|
| 29,044,676 |
| 17,563,319 |
| 4,245,159 |
| 50,853,154 |
| 51,058,023 |
(1) Includes trades with the BM&FBovespa - Bolsa de Valores, Mercadorias e Futuros (BM&FBovespa) and other securities and commodities exchanges. | ||||||||||||
III) Derivatives Financial Instruments by Maturity | ||||||||||||
|
|
|
|
|
|
|
|
|
|
|
| Bank |
Notional | ||||||||||||
|
|
|
|
|
|
|
|
|
| 12/31/2016 |
| 12/31/2015 |
Up to | From 3 to | Over | ||||||||||
|
|
|
| 3 Months |
| 12 Months |
| 12 Months |
| Total |
| Total |
Swap |
|
|
| 17,443,714 |
| 26,556,059 |
| 74,076,953 |
| 118,076,726 |
| 245,461,855 |
Options |
|
|
| 9,642,584 |
| 5,586,018 |
| 154,379,455 |
| 169,608,057 |
| 90,948,495 |
Futures Contracts |
|
|
| 66,203,765 |
| 15,859,026 |
| 22,286,179 |
| 104,348,970 |
| 183,592,248 |
Forward Contracts and Others |
|
|
| 28,205,746 |
| 17,778,590 |
| 4,791,240 |
| 50,775,576 |
| 51,047,964 |
52
|
|
|
|
|
|
|
|
|
|
|
|
|
|
|
|
|
|
|
|
| Consolidated |
Notional | ||||||||||
|
|
|
|
|
|
|
| 12/31/2016 |
| 12/31/2015 |
Up to | From 3 to | Over | ||||||||
|
| 3 Months |
| 12 Months |
| 12 Months |
| Total |
| Total |
Swap |
| 18,508,691 |
| 28,235,383 |
| 153,023,896 |
| 199,767,970 |
| 321,353,805 |
Options |
| 10,785,982 |
| 10,624,762 |
| 154,430,661 |
| 175,841,405 |
| 91,877,353 |
Futures Contracts |
| 66,298,799 |
| 16,041,642 |
| 22,310,739 |
| 104,651,180 |
| 184,191,203 |
Forward Contracts and Others |
| 28,235,187 |
| 17,826,727 |
| 4,791,240 |
| 50,853,154 |
| 51,058,023 |
IV) Derivatives Financial Instruments by Trade Market | ||||||||||
|
|
|
|
|
|
|
|
|
|
|
Bank | ||||||||||
Notional | ||||||||||
|
|
|
|
|
|
|
| 12/31/2016 |
| 12/31/2015 |
|
| Exchange(1) |
| Cetip(2) |
| Over the |
| Total |
| Total |
Swap |
| 55,282,503 |
| 61,856,098 |
| 938,125 |
| 118,076,726 |
| 245,461,855 |
Options |
| 160,666,645 |
| 8,234,147 |
| 707,265 |
| 169,608,057 |
| 90,948,495 |
Futures Contracts |
| 104,348,970 |
| - |
| - |
| 104,348,970 |
| 183,592,248 |
Forward Contracts and Others |
| - |
| 35,349,996 |
| 15,425,580 |
| 50,775,576 |
| 51,047,964 |
|
|
|
|
|
|
|
|
|
| Consolidated |
Notional | ||||||||||
|
|
|
|
|
|
|
| 12/31/2016 |
| 12/31/2015 |
|
| Exchange(1) |
| Cetip(2) |
| Over the |
| Total |
| Total |
Swap |
| 133,759,441 |
| 64,736,881 |
| 1,271,648 |
| 199,767,970 |
| 321,353,805 |
Options |
| 166,899,868 |
| 8,234,147 |
| 707,390 |
| 175,841,405 |
| 91,877,353 |
Futures Contracts |
| 104,651,180 |
| - |
| - |
| 104,651,180 |
| 184,191,203 |
Forward Contracts and Others |
| - |
| 35,427,574 |
| 15,425,580 |
| 50,853,154 |
| 51,058,023 |
(1) Includes amount traded with the BM&FBovespa and other securities and commodities exchanges. | ||||||||||
(2) Includes amount traded on other clearinghouses. | ||||||||||
(3) Composed of operations that are included in registration chambers, according to the regulation of the Bacen. | ||||||||||
53
V) Derivatives Used as Hedge Instruments | ||||||||||||
Derivatives used as hedge by index are as follows: | ||||||||||||
a) Market Risk Hedge | ||||||||||||
|
|
|
|
|
|
|
|
|
|
|
| Bank |
|
|
|
|
|
| 12/31/2016 |
|
|
|
|
| 12/31/2015 |
Adjustment | Adjustment | |||||||||||
|
| Cost |
| to Fair Value |
| Fair Value |
| Cost |
| to Fair Value |
| Fair Value |
Hedge Instruments | ||||||||||||
Swap Contracts |
| (66,261) |
| (31,085) |
| (97,346) |
| 238,955 |
| (60,579) |
| 178,376 |
Asset |
| 769,792 |
| (7,854) |
| 761,938 |
| 6,717,115 |
| 23,482 |
| 6,740,597 |
CDI (Interbank Deposit Rates)(1) (2) (5) (7) |
| - |
| - |
| - |
| 1,778,699 |
| 4,376 |
| 1,783,075 |
Fixed Interest Rate - Real(2) (7) |
| - |
| - |
| - |
| 3,522,475 |
| 27,184 |
| 3,549,659 |
Indexed to Foreign Currency - Fixed Interest - US Dollar(5) |
| 16,575 |
| 1,103 |
| 17,678 |
| 93,682 |
| 790 |
| 94,472 |
Indexed to Foreign Currency - USD/BRL US Dollar(5) |
| 753,217 |
| (8,957) |
| 744,260 |
| 675,929 |
| (10,904) |
| 665,025 |
Indexed to Foreign Currency - Libor - US Dollar(2) (4) (5) (7) |
| - |
| - |
| - |
| 610,661 |
| 1,962 |
| 612,623 |
Indexed to Foreign Currency - Fixed Interest - YEN(3) |
| - |
| - |
| - |
| 35,669 |
| 74 |
| 35,743 |
Liabilities |
| (836,053) |
| (23,231) |
| (859,284) |
| (6,478,160) |
| (84,061) |
| (6,562,221) |
Indexed to Foreign Currency - US Dollar (1) (7) |
| - |
| - |
| - |
| (585,659) |
| (15,134) |
| (600,793) |
Indexed to Price and Interest Rates Interest(2) (7) |
| - |
| - |
| - |
| (800,174) |
| (30,982) |
| (831,156) |
Indexed to Foreign Currency - Fixed Interest - US Dollar (4)(6) |
| (16,575) |
| (1,103) |
| (17,678) |
| - |
| - |
| - |
CDI (Interbank Deposit Rates) (3) (4) (6) |
| (785,664) |
| (18,395) |
| (804,059) |
| (3,267,140) |
| (12,298) |
| (3,279,438) |
Indexed to Foreign Currency - Libor - US Dollar(3) (4) |
| - |
| - |
| - |
| (41,452) |
| (61) |
| (41,513) |
Fixed Interest Rate - Real(5) (7) |
| (33,814) |
| (3,733) |
| (37,547) |
| (1,783,735) |
| (25,586) |
| (1,809,321) |
Hedge Object |
|
|
|
|
|
|
|
|
|
|
|
|
Asset |
| 350,995 |
| 18,354 |
| 369,349 |
| 2,471,649 |
| 102,993 |
| 2,574,642 |
Lending Operation (Note 8.a and e) |
| 212,480 |
| 10,477 |
| 222,957 |
| 1,602,492 |
| 87,094 |
| 1,689,586 |
Indexed to Foreign Currency - US Dollar(7) |
| - |
| - |
| - |
| 730,904 |
| 35,338 |
| 766,242 |
Indexed Indices of Prices and Interest (7) |
| - |
| - |
| - |
| 863,781 |
| 52,984 |
| 916,765 |
Fixed Interest Rate - Real(7) |
| - |
| - |
| - |
| 7,807 |
| (1,228) |
| 6,579 |
CDI (Interbank Deposit Rates) |
| 212,480 |
| 10,477 |
| 222,957 |
| - |
| - |
| - |
Available-for-Sale Securities (Note 6.a.III) |
| 138,515 |
| 7,877 |
| 146,392 |
| 869,157 |
| 15,899 |
| 885,056 |
Debentures (7) |
| - |
| - |
| - |
| 492,837 |
| 10,578 |
| 503,415 |
Promissory Notes - PN |
| 138,515 |
| 7,877 |
| 146,392 |
| 376,320 |
| 5,321 |
| 381,641 |
Liabilities |
| (816,759) |
| 12,830 |
| (803,929) |
| (3,512,568) |
| (8,383) |
| (3,520,951) |
Loans Issued Abroad (Note 18.e) |
| (816,759) |
| 12,830 |
| (803,929) |
| (3,476,825) |
| (8,342) |
| (3,485,167) |
Indexed to Foreign Currency - US Dollar |
| (816,759) |
| 12,830 |
| (803,929) |
| (3,476,825) |
| (8,342) |
| (3,485,167) |
Securities Issued Abroad (Note 18.c) |
| - |
| - |
| - |
| (35,743) |
| (41) |
| (35,784) |
Eurobonds |
| - |
| - |
| - |
| (35,743) |
| (41) |
| (35,784) |
54
Consolidated | ||||||||||||
|
|
|
|
|
| 12/31/2016 |
|
|
|
|
| 12/31/2015 |
Adjustment | Adjustment | |||||||||||
Cost |
| to Fair Value |
| Fair Value |
| Cost |
| to Fair Value |
| Fair Value | ||
Hedge Instruments | ||||||||||||
Swap Contracts |
| (109,766) |
| (26,703) |
| (136,469) |
| 153,812 |
| (66,990) |
| 86,822 |
Asset |
| 1,034,526 |
| 11,486 |
| 1,046,012 |
| 7,072,924 |
| 57,829 |
| 7,130,753 |
CDI (Interbank Deposit Rates)(1) (2) (5) (7) |
| - |
| - |
| - |
| 1,778,699 |
| 4,376 |
| 1,783,075 |
Fixed Interest Rate - Real(2) (7) |
| - |
| - |
| - |
| 3,522,475 |
| 27,184 |
| 3,549,659 |
Indexed to Foreign Currency - Fixed Interest - US Dollar(5) |
| 16,575 |
| 1,103 |
| 17,678 |
| 93,682 |
| 790 |
| 94,472 |
Indexed to Foreign Currency - USD/BRL US Dollar(5) |
| 753,217 |
| (8,957) |
| 744,260 |
| 675,929 |
| (10,904) |
| 665,025 |
Indexed to Foreign Currency - Libor - US Dollar(2) (4) (5) (7) |
| - |
| - |
| - |
| 610,661 |
| 1,962 |
| 612,623 |
Indexed to Foreign Currency - Euro(5) |
| 264,734 |
| 19,340 |
| 284,074 |
| 355,809 |
| 34,347 |
| 390,156 |
Indexed to Foreign Currency - Fixed Interest - YEN(3) |
| - |
| - |
| - |
| 35,669 |
| 74 |
| 35,743 |
Liabilities |
| (1,144,292) |
| (38,189) |
| (1,182,481) |
| (6,919,112) |
| (124,819) |
| (7,043,931) |
Indexed to Foreign Currency - US Dollar (1) (5) (7) |
| (308,239) |
| (14,958) |
| (323,197) |
| (1,026,611) |
| (55,892) |
| (1,082,503) |
Indexed to Price and Interest Rates Interest(2) (7) |
| - |
| - |
| - |
| (800,174) |
| (30,982) |
| (831,156) |
Indexed to Foreign Currency - Fixed Interest - US Dollar (4)(6) |
| (16,575) |
| (1,103) |
| (17,678) |
| - |
| - |
| - |
CDI (Interbank Deposit Rates) (3) (4) (6) |
| (785,664) |
| (18,395) |
| (804,059) |
| (3,267,140) |
| (12,298) |
| (3,279,438) |
Indexed to Foreign Currency - Libor - US Dollar(3) (4) |
| - |
| - |
| - |
| (41,452) |
| (61) |
| (41,513) |
Fixed Interest Rate - Real(5) (7) |
| (33,814) |
| (3,733) |
| (37,547) |
| (1,783,735) |
| (25,586) |
| (1,809,321) |
Hedge Object |
|
|
|
|
|
|
|
|
|
|
|
|
Asset |
| 669,966 |
| 23,165 |
| 693,131 |
| 2,993,780 |
| 110,003 |
| 3,103,783 |
Lending Operation (Note 8.a and e) |
| 531,451 |
| 15,288 |
| 546,739 |
| 2,124,623 |
| 94,104 |
| 2,218,727 |
Indexed to Foreign Currency - US Dollar(7) |
| 318,971 |
| 4,811 |
| 323,782 |
| 1,253,035 |
| 42,348 |
| 1,295,383 |
Indexed Indices of Prices and Interest(7) |
| - |
| - |
| - |
| 863,781 |
| 52,984 |
| 916,765 |
Fixed Interest Rate - Real(7) |
| - |
| - |
| - |
| 7,807 |
| (1,228) |
| 6,579 |
CDI (Interbank Deposit Rates) |
| 212,480 |
| 10,477 |
| 222,957 |
| - |
| - |
| - |
Available-for-Sale Securities (Note 3.a.III) |
| 138,515 |
| 7,877 |
| 146,392 |
| 869,157 |
| 15,899 |
| 885,056 |
Debentures (7) |
| - |
| - |
| - |
| 492,837 |
| 10,578 |
| 503,415 |
Promissory Notes - PN |
| 138,515 |
| 7,877 |
| 146,392 |
| 376,320 |
| 5,321 |
| 381,641 |
Liabilities |
| (816,759) |
| 12,830 |
| (803,929) |
| (3,512,568) |
| (8,383) |
| (3,520,951) |
Money Market Funding and Borrowings and Onlendings |
|
|
|
|
|
|
|
|
|
|
|
|
Foreign Borrowings (Note 18.e) |
| (816,759) |
| 12,830 |
| (803,929) |
| (3,476,825) |
| (8,342) |
| (3,485,167) |
Indexed to Foreign Currency - US Dollar |
| (816,759) |
| 12,830 |
| (803,929) |
| (3,476,825) |
| (8,342) |
| (3,485,167) |
Securities Issued Abroad (Note 18.c) |
| - |
| - |
| - |
| (35,743) |
| (41) |
| (35,784) |
Eurobonds |
| - |
| - |
| - |
| (35,743) |
| (41) |
| (35,784) |
(1) On December 31, 2015, instruments whose hedge object are loan operations indexed in foreign currency - Dollar with market value R$766,242 Bank and December 31, 2016, R$323,782 (12/31/2015 - R$1,295,383) Consolidated and December 31, 2015, bonds and securities represented by debentures with fair value R$59,615 Bank and Consolidated. | ||||||||||||
(2) On December 31, 2015, instruments whose hedge objects are indexed loans in price indices and interest amounting R$916,765 and securities represented by debentures with a market value R$443,800 Bank and Consolidated. | ||||||||||||
(3) On December 31, 2015, instruments whose hedge objects are obligations for securities abroad - Eurobonds with fair value R$35,743 Bank and Consolidated. | ||||||||||||
(4) On December 31, 2015, instruments whose hedge objects are lending operations indexed pre fixed interest - Real with a market value of R$6,579 Bank and Consolidated. | ||||||||||||
(5) Instruments asset whose hedge objects are obligations for foreign borrowings indexed in foreign currency - US Dollar with fair value R$803,929 (12/31/2015 - R$3,485,167) Bank and Consolidated, and instruments liabilities whose hedge objects are securities represented by promissory notes indexed to fixed interest rates - Real with market value of R$146,392 (12/31/2015 - R$381,641) Bank and Consolidated. | ||||||||||||
(6) Instruments whose objects of "hedge" are indexed loans certificates of interbank deposits with a market value of R$222,957 in the Bank and Consolidated. | ||||||||||||
(7) In June of 2016, the Management decided to change the strategic position of the hedged items relating to loans and debentures operations: Indexed to Foreign Currency-Dollar, Indexed Foreign Currency Pre-Dollar, Indexed Price Indexes and Indexed Pre-Real Interest Rate that no longer have hedge accounting and remained economic hedge, with effect on the Bank and Consolidated income statements for the period an expense of R$12,102 net of tax. | ||||||||||||
The effectiveness of these operations were in accordance with the Bacen rule 3,082/2002. | ||||||||||||
55
b) Cash Flow Hedge | ||||||||||||
|
|
|
|
|
|
|
|
|
|
|
| Bank |
|
|
|
|
|
| 12/31/2016 |
|
|
|
|
| 12/31/2015 |
Adjustment | Adjustment | |||||||||||
|
| Cost |
| to Fair Value |
| Fair Value |
| Cost |
| to Fair Value |
| Fair Value |
Hedge Instruments | ||||||||||||
Swap Contracts |
| 140,828 |
| (20,535) |
| 120,293 |
| (1,046,782) |
| (29,749) |
| (1,076,531) |
Asset |
| 1,382,765 |
| 84,746 |
| 1,467,511 |
| 7,274,825 |
| 121,414 |
| 7,396,239 |
Indexed to Foreign Currency - Swiss Franc (1) |
| - |
| - |
| - |
| 1,237,987 |
| 6,998 |
| 1,244,985 |
Indexed to Foreign Currency - Chile (2) |
| - |
| - |
| - |
| 301,285 |
| 1,622 |
| 302,907 |
Indexed to Interest Rate - Real(3) |
| - |
| - |
| - |
| 3,746,785 |
| (13,670) |
| 3,733,115 |
Indexed to Foreign Currency - Fixed Interest - US Dollar(4) |
| 1,382,765 |
| 84,746 |
| 1,467,511 |
| 1,988,768 |
| 126,464 |
| 2,115,232 |
Liabilities |
| (1,241,937) |
| (105,281) |
| (1,347,218) |
| (8,321,607) |
| (151,163) |
| (8,472,770) |
CDI (Interbank Deposit Rates)(4) |
| (340,943) |
| (995) |
| (341,938) |
| - |
| - |
| - |
Indexed to Foreign Currency - Fixed Interest - US Dollar(1) (2) (3) (4) |
| - |
| - |
| - |
| (6,580,306) |
| (17,767) |
| (6,598,073) |
Fixed Interest Rate - Real(4) |
| (198,666) |
| (1,288) |
| (199,954) |
| (22,855) |
| (20) |
| (22,875) |
Indexed to Foreign Currency - Fixed Interest Euro (4) |
| (702,328) |
| (102,998) |
| (805,326) |
| (1,718,446) |
| (133,376) |
| (1,851,822) |
|
|
|
|
|
|
|
|
|
|
|
| Consolidated |
|
|
|
|
|
| 12/31/2016 |
|
|
|
|
| 12/31/2015 |
Adjustment | Adjustment | |||||||||||
|
| Cost |
| to Fair Value |
| Fair Value |
| Cost |
| to Fair Value |
| Fair Value |
Hedge Instruments | ||||||||||||
Swap Contracts |
| 83,063 |
| (85,053) |
| (1,990) |
| (1,115,948) |
| (35,494) |
| (1,151,442) |
Asset |
| 4,364,638 |
| 176,056 |
| 4,540,694 |
| 7,779,309 |
| 151,811 |
| 7,931,120 |
Indexed to Foreign Currency - Swiss Franc (1) |
| - |
| - |
| - |
| 1,237,987 |
| 6,998 |
| 1,244,985 |
Indexed to Foreign Currency - Chile (2) |
| - |
| - |
| - |
| 301,285 |
| 1,622 |
| 302,907 |
Indexed to Interest Rate - Real(3) |
| - |
| - |
| - |
| 3,746,785 |
| (13,670) |
| 3,733,115 |
Indexed to Foreign Currency - Pre Dolar(4) (5) |
| 1,393,009 |
| 84,811 |
| 1,477,820 |
| 2,042,940 |
| 127,632 |
| 2,170,572 |
Indexed to Foreign Currency - Pre Euro(5) | 421,516 |
| 52,852 |
| 474,368 |
| 450,312 |
| 29,229 |
| 479,541 | |
CDI (Interbank Deposit Rates) (7) |
| 2,550,113 |
| 38,393 |
| 2,588,506 |
| - |
| - |
| - |
Liabilities |
| (4,281,575) |
| (261,109) |
| (4,542,684) |
| (8,895,257) |
| (187,305) |
| (9,082,562) |
CDI (Interbank Deposit Rates) (4) |
| (340,943) |
| (995) |
| (341,938) |
| - |
| - |
| - |
Indexed to Foreign Currency - Pre Dolar(1) (2) (3) (4) |
| - |
| - |
| - |
| (6,580,306) |
| (17,767) |
| (6,598,073) |
Indexed to Interest Rate - Pré Real (4) (7) |
| (2,741,145) |
| (97,473) |
| (2,838,618) |
| (22,855) |
| (20) |
| (22,875) |
Indexed to Foreign Currency - Pre Euro (4) |
| (702,328) |
| (102,998) |
| (805,326) |
| (1,718,446) |
| (133,376) |
| (1,851,822) |
Indexed to Foreign Currency - Dolar(5) |
| (489,318) |
| (59,366) |
| (548,684) |
| (509,960) |
| (34,379) |
| (544,339) |
Indexed to Foreign Currency - Real (5) |
| (7,841) |
| (277) |
| (8,118) |
| (63,690) |
| (1,763) |
| (65,453) |
|
|
|
|
|
|
|
|
|
| Bank/Consolidated | ||
|
|
|
|
|
|
|
|
|
| 12/31/2016 |
| 12/31/2015 |
|
|
|
|
|
|
|
|
|
| Notional |
| Notional |
Hedge Instruments | ||||||||||||
Future Contracts |
|
|
|
|
|
|
|
|
| 80,149,530 |
| 72,798,063 |
Trade Finance(6) |
|
|
|
|
|
|
|
|
| 80,149,530 |
| 72,798,063 |
Foreign Currency - Dollar |
|
|
|
|
|
|
|
|
| 450,571 |
| 72,798,063 |
Interest Rates (DI1 and DIA) |
|
|
|
|
|
|
|
|
| 46,314,644 |
| - |
Interest Rates DDI1 |
|
|
|
|
|
|
|
|
| 33,384,315 |
| - |
56
Bank | Consolidated | |||||||
|
| 12/31/2016 |
| 12/31/2015 |
| 12/31/2016 |
| 12/31/2015 |
Hedge Object - Cost | ||||||||
Asset |
| 27,362,050 |
| 37,217,417 |
| 27,858,924 |
| 37,251,860 |
Lending Operations (Note 8.a) |
|
|
|
|
|
|
|
|
Import and Export Credit and Financing |
| 10,558,755 |
| 35,743,885 |
| 10,816,781 |
| 35,743,885 |
Lending Operations |
| 13,632,049 |
| 606,978 |
| 13,870,897 |
| 641,421 |
Lending Operations |
| 529,997 |
| - |
| 529,997 |
| - |
Securities |
|
|
|
|
|
|
| |
Available-for-Sale Securities - Promissory Notes - NP (Note 6.a.III) |
| 1,939,949 |
| - |
| 1,939,949 |
| - |
Held to Maturity - Securities Foreign Debt Bonds (Note 6.a IV) |
| 701,300 |
| 866,554 |
| 701,300 |
| 866,554 |
Liabilities |
| (1,332,972) |
| (1,995,118) |
| (4,223,472) |
| (1,995,118) |
Money Market Funding and Borrowings and Onlendings | ||||||||
Deposits (Note 18.a) |
|
|
|
|
|
|
|
|
Certificates of Interbank Deposit - CDI |
| - |
| - |
| (547,556) |
| - |
Real Estate Credit, Mortgage, Credit and Similar (Note 18.c) |
|
|
|
|
|
|
|
|
Exchange Acceptances | ||||||||
Exchange Treasury Bills |
| - |
| - |
| (573,596) |
| - |
Real Estate Credit, Mortgage, Credit and Similar | ||||||||
Financial Treasury Bills |
| - |
| - |
| (1,769,348) |
| - |
Securities Issued Abroad (Note 18.c) | ||||||||
Eurobonds |
| - |
| (1,995,118) |
| - |
| (1,995,118) |
Borrowings and Onlendings (Note 18.e) | ||||||||
Certificates of Bank Deposit - CDB |
| (1,332,972) |
| - |
| (1,332,972) |
| - |
(1) On December 31, 2015, operation due April 12, 2016, which object of "hedge" is an operation of Eurobonds. | ||||||||
(2) On December 31, 2015, operation due April 13, 2016, which object of "hedge" is an operation of Eurobonds. | ||||||||
(3) On December 31, 2015, operation due March 18, 2016, which object of "hedge" is an operation of Eurobonds. | ||||||||
(4) Operations due April 1, 2021 (12/31/2015 - operations due March 18, 2016 and April 1, 2021) which hedge objects its securities operation represented by title Brazilian External Debt Bonds and a credit operation. | ||||||||
(5) Operations maturing between March, 2017 and June, 2021 (12/31/2015 - operations maturing between August, 2016 to June, 2021), which objects "hedge" contracts are loans from lending institutions. | ||||||||
(6) Operations maturing between January, 2017 to January, 2018 (12/31/2015 - operations maturing due January, 2016 to December, 2024) and updated value of the instruments of R$29,164,917 where operations are futures and dollar futures DI and DDI when used together the exchange coupon makes the hedge Loan Portfolio (31/12/2015 - R$35,743,844), whose purpose of "hedge" are loans - financing agreements and export and import credit, loan operations, other credits, securities represented by promissory notes and foreign loan obligations. | ||||||||
|
|
|
|
|
|
|
|
|
(7) Operations maturing between May, 2017 and November, 2019, which objects of "hedge" are Deposits with Interbank Deposit Certificate (CDI), Exchange Treasury Bills and Financial Treasury Bills. | ||||||||
In the Bank and Consolidated, between July and September 2014 operations were contracted to hedge accounting of cash flow with the object of hedge bank deposit certificates (CDB). In October, 2014 this structure was discontinued. The effect of marking to market the future contracts net of tax effects that was recognized in income in the first quarter of 2016 and that was highlighted in equity corresponds to a credit of R$904. | ||||||||
In the Bank and Consolidated, the effect of marking to market of contracts swap and future corresponds to a credit of R$69,489 (12/31/2015 - corresponds a debt of R$345,373) and is recorded in equity, net of tax effects. | ||||||||
The effectiveness of these operations were in accordance with the Bacen rule 3,082/2002 and no ineffective portions were found in the period to be accounted for. | ||||||||
VI) Derivatives Pledged as Guarantee | ||||||||
The guarantee margin transactions traded on the BM&FBovespa derivative financial instruments themselves and others is composed of government securities. | ||||||||
|
|
|
| Bank |
|
|
| Consolidated |
|
| 12/31/2016 |
| 12/31/2015 |
| 12/31/2016 |
| 12/31/2015 |
Financial Treasury Bill - LFT |
| 714,031 |
| 110,490 |
| 1,556,804 |
| 330,605 |
National Treasury Bill - LTN |
| 4,636,644 |
| 8,757,097 |
| 4,636,644 |
| 8,757,097 |
National Treasury Notes - NTN |
| 27,598 |
| 757,969 |
| 27,598 |
| 757,969 |
Total |
| 5,378,273 |
| 9,625,556 |
| 6,221,046 |
| 9,845,671 |
57
VII) Derivatives Recorded in Assets and Liabilities | ||||||||||||
|
|
|
|
|
|
|
| Bank |
|
|
| Consolidated |
|
|
|
|
|
| 12/31/2016 |
| 12/31/2015 |
| 12/31/2016 |
| 12/31/2015 |
Assets |
|
|
|
|
|
|
|
|
|
| ||
Swap Differentials Receivable(1) |
|
|
| 9,258,813 |
| 16,334,414 |
| 15,348,102 |
| 22,101,593 | ||
Option Premiums to Exercise |
|
|
| 883,474 |
| 814,423 |
| 935,520 |
| 862,972 | ||
Forward Contracts and Others |
|
|
| 7,708,703 |
| 3,028,034 |
| 7,792,334 |
| 3,045,644 | ||
Total |
|
|
| 17,850,990 |
| 20,176,871 |
| 24,075,956 |
| 26,010,209 | ||
Liabilities | ||||||||||||
Swap Differentials Payable(1) |
|
|
| 6,097,822 |
| 14,131,068 |
| 12,375,829 |
| 20,008,038 | ||
Option Premiums Launched |
|
|
| 728,507 |
| 794,006 |
| 767,053 |
| 765,265 | ||
Forward Contracts and Others |
|
|
| 6,801,326 |
| 2,106,358 |
| 6,801,632 |
| 2,109,656 | ||
Total |
|
|
| 13,627,655 |
| 17,031,432 |
| 19,944,514 |
| 22,882,959 | ||
(1) Includes swaption operations. | ||||||||||||
c) Financial Instruments - Sensitivity Analysis | ||||||||||||
The risk management is focused on portfolios and risk factors pursuant to Bacen’s regulations and good international practices. | ||||||||||||
The new rules of Basel III, disclosed on March 1, 2013; and in October, 2013 was the publication of new rules and revise launched in March 2013. The Implementation of the new rules follow a schedule in phase; thus allowing the application of the rules gradually until 2019. The new rules have been applied in October 2013 and remainder of January 1, 2014 .. | ||||||||||||
Financial instruments are segregated into trading and banking portfolios, as in the management of market risk exposure, according to the best market practices and the transaction classification and capital management criteria of the Basileia New Standardized Approach of Bacen. The trading portfolio consists of all transactions with financial instruments and products, including derivatives, held for trading, and the banking portfolio consists of core business transactions arising from the different Banco Santander business lines and their possible hedges. Accordingly, based on the nature of Banco Santander’s activities, the sensitivity analysis was presented for trading and banking portfolios. | ||||||||||||
Banco Santander performs the sensitivity analysis of the financial instruments in accordance with requirements of CVM Instruction 475/2008, considering the market information and scenarios that would adversely affect the positions of the Bank. | ||||||||||||
The table below summarizes the stress amounts generated by Banco Santander’s corporate systems, related to the trading and banking portfolio, for each one of the portfolio scenarios as of December 31, 2016. | ||||||||||||
Trading Portfolio |
|
|
|
|
|
|
|
|
| |||
Risk Factor |
| Description |
|
|
|
|
| Scenario 1 |
| Scenario 2 |
| Scenario 3 |
Interest Rate - Real |
| Exposures subject to Changes in Interest Fixed Rate |
| (6,274) |
| (242,001) |
| (484,003) | ||||
Coupon Interest Rate |
| Exposures subject to Changes in Coupon Rate of Interest Rate |
| (3,458) |
| (39,970) |
| (79,939) | ||||
Coupon - US Dollar |
| Exposures subject to Changes in Coupon US Dollar Rate |
| (21) |
| (5,106) |
| (10,212) | ||||
Coupon - Other Currencies |
| Exposures subject to Changes in Coupon Foreign Currency Rate |
| (357) |
| (6,048) |
| (12,097) | ||||
Foreign Currency |
| Exposures subject to Foreign Exchange |
| (6,547) |
| (163,687) |
| (327,373) | ||||
Eurobond/Treasury/Global |
| Exposures subject to Changes in Interest Rate Negotiated Roles in International Market |
| (2) |
| (90) |
| (179) | ||||
Inflation |
| Exposures subject to Change in Coupon Rates of Price Indexes |
| (5,428) |
| (88,258) |
| (176,515) | ||||
Shares and Indexes |
| Exposures subject to Change in Shares Price |
| (618) |
| (15,458) |
| (30,915) | ||||
Others |
| Exposures not Meeting the Previous Settings |
| (17,786) |
| (2,276) |
| (4,551) | ||||
Total(1) |
|
|
|
|
|
|
| (40,491) |
| (562,894) |
| (1,125,784) |
(1) Amounts net of taxes. | ||||||||||||
Scenario 1: a shock of +10 base points on the interest curves and 1% to price changes (currency and share). | ||||||||||||
Scenario 2: a shock of +25% and -25% in all risk factors, are considered the greatest losses per risk factor. | ||||||||||||
Scenario 3:a shock of +50% and -50% in all risk factors, are considered the greatest losses per risk factor. | ||||||||||||
58
Banking Portfolio | ||||||||||||||
Risk Factor |
| Description |
|
|
|
|
| Scenario 1 |
| Scenario 2 |
| Scenario 3 | ||
Interest Rate - Real |
| Exposures subject to Changes in Interest Fixed Rate |
| (54,102) |
| (1,388,594) |
| (2,641,304) | ||||||
TR and Long-Term Interest Rate - (TJLP) | Exposures subject to Change in Exchange TR and TJLP |
| (3,128) |
| (82,938) |
| (177,829) | |||||||
Inflation |
| Exposures subject to Change in Coupon Rates of Price Indexes |
| (11,552) |
| (206,947) |
| (354,111) | ||||||
Coupon - US Dollar |
| Exposures subject to Changes in Coupon US Dollar Rate |
| (412) |
| (57,174) |
| (103,108) | ||||||
Coupon - Other Currencies |
| Exposures subject to Changes in Coupon Foreign Currency Rate |
| (7,224) |
| (45,407) |
| (91,225) | ||||||
Interest Rate Markets International |
| Exposures subject to Changes in Interest Rate Negotiated Roles in International Market |
| (13,143) |
| (190,043) |
| (352,433) | ||||||
Foreign Currency |
| Exposures subject to Foreign Exchange |
| (722) |
| (18,048) |
| (36,097) | ||||||
Total(1) |
|
|
|
|
|
|
| (90,283) |
| (1,989,151) |
| (3,756,107) | ||
(1) Amounts net of taxes. | ||||||||||||||
Scenario 1: a shock of +10 base points on the interest curves and 1% to price changes(currency). | ||||||||||||||
Scenario 2: a shock of +25% and -25% in all risk factors, are considered the greatest losses per risk factor. | ||||||||||||||
Scenario 3:a shock of +50% and -50% in all risk factors, are considered the greatest losses per risk factor. | ||||||||||||||
7. Interbank Accounts | ||||||||||||||
The amount of interbank accounts are composed of restricted deposits with the Bacen to meet compulsory obligations for demand deposits, savings deposits and time deposits, and payments and receipts pending settlement, represented by checks and other documents sent to clearinghouses (assets and liabilities position). | ||||||||||||||
8. Loan Portfolio and Allowance for Loan Losses | ||||||||||||||
a) Loan Portfolio | ||||||||||||||
|
|
|
|
|
|
|
|
|
| Bank |
|
|
| Consolidated |
|
|
|
|
|
|
|
| 12/31/2016 |
| 12/31/2015 |
| 12/31/2016 |
| 12/31/2015 |
Lending Operations |
| 172,953,587 |
| 183,601,533 |
| 212,780,537 |
| 220,387,363 | ||||||
Loans and Discounted Receivables (3) |
| 90,658,938 |
| 99,603,331 |
| 98,581,263 |
| 105,216,623 | ||||||
Financing(4) |
| 36,631,187 |
| 41,028,183 |
| 68,075,722 |
| 72,200,721 | ||||||
Rural, Agricultural and Industrial Financing |
| 8,958,221 |
| 6,064,652 |
| 8,958,221 |
| 6,064,652 | ||||||
Real Estate Financing |
| 36,490,536 |
| 36,649,633 |
| 36,490,536 |
| 36,649,633 | ||||||
Securities Financing |
| 50,303 |
| 58,896 |
| 50,303 |
| 58,896 | ||||||
Lending Operations Related to Assignment |
| 164,402 |
| 196,838 |
| 624,492 |
| 196,838 | ||||||
Leasing Operations |
| 7 |
| 26 |
| 2,882,031 |
| 3,023,463 | ||||||
Advances on Foreign Exchange Contracts(1) (Note 9) |
| 5,101,851 |
| 4,552,495 |
| 5,101,851 |
| 4,552,495 | ||||||
Other Receivables(2) (5) |
| 33,344,087 |
| 30,826,630 |
| 36,133,837 |
| 33,119,414 | ||||||
Total |
| 211,399,532 |
| 218,980,684 |
| 256,898,256 |
| 261,082,735 | ||||||
Current |
| 108,886,706 |
| 116,270,117 |
| 133,425,588 |
| 139,493,848 | ||||||
Long-term |
| 102,512,826 |
| 102,710,567 |
| 123,472,668 |
| 121,588,887 | ||||||
(1) Advance on foreign exchange contracts are classified as a reduction of other obligations. | ||||||||||||||
(2) Comprise receivables for guarantees honored other receivables - others (granted to borrowers to purchase securities, assets, notes and receivable - Note 12) and income receivable on foreign exchange contracts (Note 9). | ||||||||||||||
(3) Includes the amount of R$81,697 (12/31/2015 - R$772,821) Bank and R$405,479 (12/31/2015 - R$1,056,439) Consolidated contracts objects loans of "hedge" market risk (Note 6.b.V.a) and the amount of R$13,632,049 (12/31/2015 - 479,400) in the Bank and R$13,870,897 (12/31/2015 - R$479,400) in the Consolidated, contracts of loan object "hedge" cash flow (Note 6.b.V.b). | ||||||||||||||
(4) Included the amount of R$141,260 (12/31/2015 - R$340,110) Bank and R$141,260 (12/31/2015 - R$585,633) Consolidated of financing "hedge" contracts objects of market risk (Note 6.b.V.a), and includes the amount of R$10,558,755 (12/31/2015 - R$35,871,463) Bank and R$10,816,781 (12/31/2015 - R$35,905,906) Consolidated of financing "hedge" contracts objects cash flow (Note 6.b.V.b.). | ||||||||||||||
(5) In December 31, 2015, in the Bank and Consolidated, includes the amount of R$576,655 of credit "hedge" contracts objects of market risk (Note 6.b.V.a) and in December 31, 2016 the value of R$529,997 of contracts of credit objects of cash flow "hedge". | ||||||||||||||
Sale or Transfer Operations of Financial Assets | ||||||||||||||
According to Resolution CMN 3,533/2008 updated with later norms, the lending operations with substantial retention of risks and benefits, started from January 1, 2012 to remain registered in the loan portfolio. For lending operations made until December 31, 2011, regardless of the retention or transfer of substantial risks and benefits, financial assets were written off from the record of the original operation and the result recorded in the transfer to the appropriate result. | ||||||||||||||
59
(i) With Substantial Transfer of Risks and Benefits | ||||||||
During the exercise 2016, operations were carried out credit assignment without recourse in the amount of R$267,770 (2015 - R$1,316,027) Bank and Consolidated and were recorded substantially in loans and discounted securities, classified as H risk level. | ||||||||
(ii) With Substantial Retention of Risks and Benefits | ||||||||
Since August 2016, in the Consolidated, the amount referring to the loan portfolio assigned with co-obligation started to include the operations coming from Banco PSA Finance Brasil S.A. (Banco PSA), (Note 37.b). On December 31, 2016, the present value of the operations assigned to Banco PSA is R$460,090. | ||||||||
On September, 2015 the Bank made assignment of receivables with recourse related to the Funded Participation operations (Export) in the amount of R$201,706 with maturity on April, 2019. On December 31, 2016 the present value of the divested operations is R$164,402 (12/31/2015 - R$196,631). | ||||||||
On March 2013, the Bank made the assignment of receivables with recourse relating to real estate financing in the amount of R$47,485. On December 31, 2015, the present value of the divested operations was R$207 (Note 26.e). | ||||||||
On December 2011, the Bank made the assignment of receivables with recourse relating to real estate financing in the amount of R$688,821, which fall due until October 2041. On December 31, 2016, the present value of the divested operations is R$159,745 (12/31/2015 - R$202,114). | ||||||||
The assignment operation was carried out with recourse clause, provided the buyback is compulsory in the following situations: | ||||||||
- Contracts in default for a period exceeding 90 consecutive days; | ||||||||
- Contracts subject to renegotiation; | ||||||||
- Contracts subject to portability in accordance with CMN Resolution 3,401/2006; and | ||||||||
- Contracts subject to intervention. | ||||||||
The compulsory repurchase price will be calculated by unpaid balance of the loan due date at the time of its repurchase. | ||||||||
From the date of transfer cash flows from operations will be paid directly to the assignee entity. | ||||||||
b) Loan Portfolio by Maturity | ||||||||
|
|
|
|
|
|
|
|
|
Bank | Consolidated | |||||||
|
| 12/31/2016 |
| 12/31/2015 |
| 12/31/2016 |
| 12/31/2015 |
Overdue |
| 7,054,119 |
| 8,950,031 |
| 8,084,332 |
| 9,704,502 |
Due to: |
|
|
|
|
|
|
|
|
Up to 3 Months |
| 61,524,849 |
| 68,809,115 |
| 70,650,136 |
| 77,747,183 |
From 3 to 12 Months |
| 47,361,857 |
| 47,461,002 |
| 62,775,452 |
| 61,746,665 |
Over 12 Months |
| 95,458,707 |
| 93,760,536 |
| 115,388,336 |
| 111,884,385 |
Total |
| 211,399,532 |
| 218,980,684 |
| 256,898,256 |
| 261,082,735 |
c) Lease Portfolio Operations | ||||||||
|
|
|
| Bank |
|
|
| Consolidated |
|
| 12/31/2016 |
| 12/31/2015 |
| 12/31/2016 |
| 12/31/2015 |
Gross Investment in Leasing Operations |
| 7 |
| 30 |
| 3,455,534 |
| 3,608,045 |
Lease Receivables |
| 4 |
| 17 |
| 2,339,735 |
| 2,341,921 |
Unrealized Residual Values(1) |
| 3 |
| 13 |
| 1,115,799 |
| 1,266,124 |
Unearned Income on Lease |
| (3) |
| (15) |
| (2,316,599) |
| (2,316,861) |
Offsetting Residual Values |
| (3) |
| (13) |
| (1,115,799) |
| (1,266,124) |
Leased Assets |
| 68,451 |
| 71,196 |
| 7,390,260 |
| 7,930,428 |
Accumulated Depreciation |
| (68,451) |
| (71,196) |
| (3,949,169) |
| (4,314,034) |
Excess Depreciation |
| 27,109 |
| 28,754 |
| 1,517,892 |
| 1,941,186 |
Losses on Unamortized Lease |
| - |
| - |
| 247,375 |
| 198,044 |
Advances for Guaranteed Residual Value |
| (27,103) |
| (28,730) |
| (2,349,857) |
| (2,761,002) |
Other Assets |
| - |
| - |
| 2,394 |
| 3,781 |
Total of Lease Portfolio at Present Value |
| 7 |
| 26 |
| 2,882,031 |
| 3,023,463 |
(1) Guaranteed residual value of lease agreements, net of advances. | ||||||||
Leasing unrealized financial income (lease income to appropriate related to minimum payments to receive) is R$0 (12/31/2015 - R$4) Bank and R$573,503 (12/31/2015 - R$584,582) Consolidated. | ||||||||
On December 31, 2016 and 2015, there were no individually material agreements or commitments for lease contracts. | ||||||||
60
Report per Lease Portfolio Maturity of Gross Investment | ||||||||||||||
|
|
|
|
|
|
|
|
|
| Bank |
|
|
| Consolidated |
|
|
|
|
|
|
|
| 12/31/2016 |
| 12/31/2015 |
| 12/31/2016 |
| 12/31/2015 |
Overdue |
|
|
|
|
|
|
| 2 |
| 5 |
| 27,105 |
| 34,430 |
Due to: |
|
|
|
|
|
|
|
|
|
|
|
|
|
|
Up to 1 Year |
|
|
|
|
|
|
| 5 |
| 17 |
| 1,625,438 |
| 1,735,087 |
From 1 to 5 Years |
|
|
|
|
| - |
| 8 |
| 1,794,786 |
| 1,829,120 | ||
Over 5 Years |
|
|
|
|
|
|
| - |
| - |
| 8,205 |
| 9,408 |
Total |
|
|
|
|
|
|
| 7 |
| 30 |
| 3,455,534 |
| 3,608,045 |
Report per Lease Portfolio Maturity at Present Value | ||||||||||||||
|
|
|
|
|
|
|
|
|
| Bank |
|
|
| Consolidated |
|
|
|
|
|
|
|
| 12/31/2016 |
| 12/31/2015 |
| 12/31/2016 |
| 12/31/2015 |
Overdue |
|
|
|
|
|
|
| 2 |
| 4 |
| 24,117 |
| 31,250 |
Due to: |
|
|
|
|
|
|
|
|
|
|
|
|
|
|
Up to 1 Year |
|
|
|
|
|
|
| 5 |
| 16 |
| 1,518,203 |
| 1,621,055 |
From 1 to 5 Years |
|
|
|
|
| - |
| 6 |
| 1,335,895 |
| 1,365,893 | ||
Over 5 Years |
|
|
|
|
|
|
| - |
| - |
| 3,816 |
| 5,265 |
Total |
|
|
|
|
|
|
| 7 |
| 26 |
| 2,882,031 |
| 3,023,463 |
d) Loan Portfolio by Business Sector | ||||||||||||||
|
|
|
|
|
|
|
|
|
| Bank |
|
|
| Consolidated |
|
|
|
|
|
|
|
| 12/31/2016 |
| 12/31/2015 |
| 12/31/2016 |
| 12/31/2015 |
Private Sector |
|
|
|
|
|
|
| 211,333,303 |
| 218,862,264 |
| 256,832,027 |
| 260,963,648 |
Industry |
|
|
|
|
|
|
| 62,455,022 |
| 69,411,282 |
| 63,829,839 |
| 70,804,585 |
Commercial |
|
|
|
|
|
|
| 26,864,271 |
| 24,983,818 |
| 30,357,498 |
| 28,223,339 |
Financial Institutions |
|
|
|
|
| 1,111,393 |
| 2,278,592 |
| 1,116,062 |
| 2,285,315 | ||
Services and Other(1) |
|
|
|
|
| 33,607,965 |
| 39,207,497 |
| 36,071,493 |
| 41,964,420 | ||
Individuals |
|
|
|
|
|
|
| 84,422,338 |
| 80,533,024 |
| 122,286,564 |
| 114,773,641 |
Credit Cards |
|
|
|
|
|
|
| 20,676,801 |
| 19,133,657 |
| 20,676,801 |
| 19,133,657 |
Mortgage Loans |
|
|
|
|
|
|
| 27,153,241 |
| 25,931,863 |
| 27,153,241 |
| 25,931,863 |
Payroll Loans |
|
|
|
|
|
|
| 11,632,735 |
| 10,313,617 |
| 18,987,060 |
| 14,656,085 |
Financing and Vehicles Lease |
|
|
|
|
| 1,859,677 |
| 2,463,824 |
| 30,194,853 |
| 30,314,531 | ||
Others (2) |
|
|
|
|
|
|
| 23,099,884 |
| 22,690,063 |
| 25,274,609 |
| 24,737,505 |
Agricultural |
|
|
|
|
|
|
| 2,872,314 |
| 2,448,051 |
| 3,170,571 |
| 2,912,348 |
Public Sector |
|
|
|
|
|
|
| 66,229 |
| 118,420 |
| 66,229 |
| 119,087 |
Federal |
|
|
|
|
|
|
| - |
| 4,373 |
| - |
| 4,373 |
State |
|
|
|
|
|
|
| 50,647 |
| 82,428 |
| 50,647 |
| 82,964 |
Municipal |
|
|
|
|
|
|
| 15,582 |
| 31,619 |
| 15,582 |
| 31,750 |
Total |
|
|
|
|
|
|
| 211,399,532 |
| 218,980,684 |
| 256,898,256 |
| 261,082,735 |
|
|
|
|
|
|
|
|
|
|
|
|
|
|
|
(1) Includes the activities of mortgage companies - business plan, transportation services, health, personal and others. | ||||||||||||||
(2) Includes personal loans, overdraft among others. | ||||||||||||||
e) Classification of Loan Portfolio and Respective Allowance for Loan Losses by Risk Level | ||||||||||||||
|
|
|
|
|
|
|
|
|
|
|
|
|
| Bank |
12/31/2016 | ||||||||||||||
Minimum Allowance | Loan Portfolio | Allowance | ||||||||||||
Risk Level |
| Required (%) |
| Current |
| Past Due(1) |
| Total(3) |
| Required |
| Additional(2) |
| Total |
AA |
| - |
| 83,304,514 |
| - |
| 83,304,514 |
| - |
| - |
| - |
A |
| 0.5% |
| 73,169,632 |
| - |
| 73,169,632 |
| 365,848 |
| 275,044 |
| 640,892 |
B |
| 1% |
| 14,214,859 |
| 1,097,714 |
| 15,312,573 |
| 153,126 |
| 248,731 |
| 401,857 |
C |
| 3% |
| 9,333,702 |
| 2,139,320 |
| 11,473,022 |
| 344,191 |
| 744,383 |
| 1,088,574 |
D |
| 10% |
| 8,000,687 |
| 2,482,841 |
| 10,483,528 |
| 1,048,353 |
| 577,450 |
| 1,625,803 |
E |
| 30% |
| 2,009,675 |
| 1,451,340 |
| 3,461,015 |
| 1,038,304 |
| - |
| 1,038,304 |
F |
| 50% |
| 1,859,835 |
| 1,201,808 |
| 3,061,643 |
| 1,530,821 |
| - |
| 1,530,821 |
G |
| 70% |
| 1,273,196 |
| 956,548 |
| 2,229,744 |
| 1,560,821 |
| - |
| 1,560,821 |
H |
| 100% |
| 3,122,836 |
| 5,770,548 |
| 8,893,384 |
| 8,893,384 |
| - |
| 8,893,384 |
Total |
|
|
| 196,288,936 |
| 15,100,119 |
| 211,389,055 |
| 14,934,848 |
| 1,845,608 |
| 16,780,456 |
61
|
|
|
|
|
|
|
|
|
|
|
|
|
| Bank |
12/31/2015 | ||||||||||||||
Minimum Allowance | Loan Portfolio | Allowance | ||||||||||||
Risk Level |
| Required (%) |
| Current |
| Past Due(1) |
| Total(3) |
| Required |
| Additional(2) |
| Total |
AA |
| - |
| 92,900,935 |
| - |
| 92,900,935 |
| - |
| - |
| - |
A |
| 0.5% |
| 75,092,017 |
| - |
| 75,092,017 |
| 375,460 |
| 275,777 |
| 651,237 |
B |
| 1% |
| 13,307,782 |
| 1,141,351 |
| 14,449,133 |
| 144,491 |
| 246,136 |
| 390,627 |
C |
| 3% |
| 8,543,221 |
| 2,370,428 |
| 10,913,649 |
| 327,410 |
| 708,080 |
| 1,035,490 |
D |
| 10% |
| 5,742,592 |
| 2,376,036 |
| 8,118,628 |
| 811,863 |
| 701,023 |
| 1,512,886 |
E |
| 30% |
| 1,518,582 |
| 3,607,332 |
| 5,125,914 |
| 1,537,774 |
| - |
| 1,537,774 |
F |
| 50% |
| 1,505,097 |
| 1,235,998 |
| 2,741,095 |
| 1,370,548 |
| - |
| 1,370,548 |
G |
| 70% |
| 641,647 |
| 882,406 |
| 1,524,053 |
| 1,066,837 |
| - |
| 1,066,837 |
H |
| 100% |
| 2,779,290 |
| 5,248,876 |
| 8,028,166 |
| 8,028,166 |
| - |
| 8,028,166 |
Total |
|
|
| 202,031,163 |
| 16,862,427 |
| 218,893,590 |
| 13,662,549 |
| 1,931,016 |
| 15,593,565 |
|
|
|
|
|
|
|
|
|
|
|
|
|
| Consolidated |
12/31/2016 | ||||||||||||||
Minimum Allowance | Loan Portfolio | Allowance | ||||||||||||
Risk Level |
| Required (%) |
| Current |
| Past Due(1) |
| Total(3) |
| Required |
| Additional(2) |
| Total |
AA |
| - |
| 97,759,855 |
| - |
| 97,759,855 |
| - |
| - |
| - |
A |
| 0.5% |
| 95,665,266 |
| - |
| 95,665,266 |
| 478,326 |
| 296,236 |
| 753,799 |
B |
| 1% |
| 17,462,836 |
| 2,328,983 |
| 19,791,819 |
| 197,918 |
| 248,732 |
| 467,413 |
C |
| 3% |
| 10,160,710 |
| 3,188,136 |
| 13,348,846 |
| 400,465 |
| 744,383 |
| 1,144,848 |
D |
| 10% |
| 8,128,531 |
| 2,873,991 |
| 11,002,522 |
| 1,100,252 |
| 577,450 |
| 1,677,702 |
E |
| 30% |
| 2,066,273 |
| 1,696,249 |
| 3,762,522 |
| 1,128,757 |
| - |
| 1,128,757 |
F |
| 50% |
| 1,877,166 |
| 1,407,104 |
| 3,284,270 |
| 1,642,135 |
| - |
| 1,642,135 |
G |
| 70% |
| 1,392,106 |
| 1,107,260 |
| 2,499,366 |
| 1,749,556 |
| - |
| 1,749,556 |
H |
| 100% |
| 3,240,086 |
| 6,528,416 |
| 9,768,502 |
| 9,768,502 |
| - |
| 9,768,502 |
Total |
|
|
| 237,752,829 |
| 19,130,139 |
| 256,882,968 |
| 16,465,911 |
| 1,866,801 |
| 18,332,712 |
|
|
|
|
|
|
|
|
|
|
|
|
|
| Consolidated |
12/31/2015 | ||||||||||||||
Minimum Allowance | Loan Portfolio | Allowance | ||||||||||||
Risk Level |
| Required (%) |
| Current |
| Past Due(1) |
| Total(3) |
| Required |
| Additional(2) |
| Total |
AA |
| - |
| 104,292,741 |
| - |
| 104,292,741 |
| - |
| - |
| - |
A |
| 0.5% |
| 98,552,525 |
| - |
| 98,552,525 |
| 492,765 |
| 305,782 |
| 798,547 |
B |
| 1% |
| 15,480,989 |
| 2,339,538 |
| 17,820,527 |
| 178,205 |
| 246,136 |
| 424,341 |
C |
| 3% |
| 9,548,811 |
| 3,374,325 |
| 12,923,136 |
| 387,694 |
| 708,080 |
| 1,095,774 |
D |
| 10% |
| 5,972,894 |
| 2,750,043 |
| 8,722,937 |
| 872,294 |
| 702,279 |
| 1,574,573 |
E |
| 30% |
| 1,552,423 |
| 3,839,656 |
| 5,392,079 |
| 1,617,624 |
| - |
| 1,617,624 |
F |
| 50% |
| 1,523,346 |
| 1,402,487 |
| 2,925,833 |
| 1,462,916 |
| - |
| 1,462,916 |
G |
| 70% |
| 651,083 |
| 1,016,922 |
| 1,668,005 |
| 1,167,603 |
| - |
| 1,167,603 |
H |
| 100% |
| 2,820,000 |
| 5,870,848 |
| 8,690,848 |
| 8,690,848 |
| - |
| 8,690,848 |
Total |
|
|
| 240,394,812 |
| 20,593,819 |
| 260,988,631 |
| 14,869,949 |
| 1,962,277 |
| 16,832,226 |
(1) Includes current and past-due operations. | ||||||||||||||
(2) The additional allowance is recognized based mainly on the expected realization of the loan portfolio, in addition to the current regulatory requirements. | ||||||||||||||
(3) The total loan portfolio includes the value of a credit of R$10,477 (31/12/2015 - debit of R$87,094) in the Bank and R$15,288(31/12/2015 - debt of R$94,104) Consolidated, related to the adjustment to fair value of loans that are being hedged, recorded in accordance with Article 5 of Circular Letter 3,624 of the Bacen of December 26, 2013 and are not included in the note of the risk levels (Note 6.b.V.a). | ||||||||||||||
62
f) Changes in Allowance for Loan Losses | ||||||||
|
|
|
| Bank |
|
|
| Consolidated |
01/01 to | 01/01 to | 01/01 to | 01/01 to | |||||
|
| 12/31/2016 |
| 12/31/2015 |
| 12/31/2016 |
| 12/31/2015 |
Balance at Beginning |
| 15,593,565 |
| 13,539,025 |
| 16,832,226 |
| 14,581,964 |
Allowances Recognized |
| 11,616,348 |
| 13,510,435 |
| 13,239,781 |
| 14,772,981 |
Write-offs |
| (10,429,457) |
| (11,455,895) |
| (11,739,295) |
| (12,522,719) |
Balance at End(1) |
| 16,780,456 |
| 15,593,565 |
| 18,332,712 |
| 16,832,226 |
Current |
| 4,198,828 |
| 3,515,824 |
| 4,915,114 |
| 4,063,077 |
Long-term |
| 12,581,628 |
| 12,077,741 |
| 13,417,598 |
| 12,769,149 |
Recoveries Credits(2) |
| 2,645,366 |
| 2,120,937 |
| 2,834,935 |
| 2,346,053 |
(1) Includes R$1 (12/31/2015 - R$11) Bank and R$57,253 (12/31/2015 - R$63,434) Consolidated provision recorded for the leasing portfolio. | ||||||||
(2) It is recorded as financial income in the items: lending operations and leasing operations. Includes results of assignment without recourse, related to the prior operations written off, as losses amounting the value to R$162,496 (2015 - R$104,491) Bank and R$183,663 (2015 - R$120,522) Consolidated. | ||||||||
g) Renegotiated Credits | ||||||||
|
|
|
|
|
|
|
|
|
Bank | Consolidated | |||||||
12/31/2016 |
| 12/31/2015 |
| 12/31/2016 |
| 12/31/2015 | ||
Renegotiated Credits |
| 13,327,164 |
| 12,655,907 |
| 13,497,388 |
| 12,720,615 |
Allowance for Loan Losses |
| (7,785,193) |
| (7,049,119) |
| (7,851,068) |
| (7,065,760) |
Percentage of Coverage on Renegotiated Credits |
| 58.4% |
| 55.7% |
| 58.2% |
| 55.5% |
h) Loan Portfolio Concentration | ||||||||
|
|
|
|
|
|
|
| Consolidated |
Loan Portfolio and Credit Guarantees(1), Securities(2) | 12/31/2016 | 12/31/2015 | ||||||
and Derivatives Financial Instruments(3) |
| Risk |
| % |
| Risk |
| % |
Biggest Debtor |
| 6,446,102 |
| 1.9% |
| 8,013,400 |
| 2.3% |
10 Biggest |
| 31,490,745 |
| 9.5% |
| 38,590,250 |
| 11.0% |
20 Biggest |
| 45,622,490 |
| 13.8% |
| 54,852,488 |
| 15.7% |
50 Biggest |
| 71,551,505 |
| 21.6% |
| 82,548,719 |
| 23.6% |
100 Biggest |
| 93,949,486 |
| 28.4% |
| 106,546,440 |
| 30.4% |
(1) Includes portions of loans to release the business plan. | ||||||||
(2) Refers to debentures, promissory notes and certificates of real estate receivables - CRI. | ||||||||
(3) Refers to credit of derivatives risk. | ||||||||
9. Foreign Exchange Portfolio | ||||||||
|
|
|
|
|
|
|
|
|
Bank/Consolidated | ||||||||
|
|
|
|
|
| 12/31/2016 |
| 12/31/2015 |
Assets | ||||||||
Rights to Foreign Exchange Sold |
|
|
|
|
| 53,657,710 |
| 67,518,760 |
Exchange Purchased Pending Settlement |
|
|
|
|
| 38,480,488 |
| 28,933,498 |
Advances in Local Currency |
|
|
|
|
| (123,953) |
| (184,119) |
Income Receivable from Advances and Importing Financing (Note 8.a) |
|
|
|
|
| 100,205 |
| 92,177 |
Currency and Documents Term Foreign Currency |
|
|
|
|
| 31,678 |
| 47,223 |
Total |
|
|
|
|
| 92,146,128 |
| 96,407,539 |
Current |
|
|
|
|
| 89,829,757 |
| 94,642,636 |
Long-term |
|
|
|
|
| 2,316,371 |
| 1,764,903 |
Liabilities | ||||||||
Exchange Sold Pending Settlement |
|
|
|
|
| 54,316,838 |
| 67,416,998 |
Foreign Exchange Purchased |
|
|
|
|
| 37,538,056 |
| 26,465,492 |
Advances on Foreign Exchange Contracts (Note 8.a) |
|
|
|
|
| (5,101,851) |
| (4,552,495) |
Others |
|
|
|
|
| 58 |
| 70 |
Total |
|
|
|
|
| 86,753,101 |
| 89,330,065 |
Current |
|
|
|
|
| 84,631,442 |
| 84,694,924 |
Long-term |
|
|
|
|
| 2,121,659 |
| 4,635,141 |
Memorandum Accounts | ||||||||
Open Import Credits |
|
|
|
|
| 635,055 |
| 774,383 |
Confirmed Export Credits |
|
|
|
|
| 498,197 |
| 356,824 |
63
10. Trading Account | ||||||||
|
|
|
| Bank |
|
|
| Consolidated |
|
| 12/31/2016 |
| 12/31/2015 |
| 12/31/2016 |
| 12/31/2015 |
Assets |
|
|
|
|
|
|
|
|
Financial Assets and Pending Settlement Transactions |
| 1,350,035 |
| 209,087 |
| 1,350,344 |
| 242,612 |
Clearinghouse Transactions |
| 196 |
| - |
| 26,296 |
| 742 |
Debtors Pending Settlement |
| 13,296 |
| 4,166 |
| 155,106 |
| 80,435 |
Stock Exchanges - Guarantee Deposits |
| 14,145 |
| 402,323 |
| 14,145 |
| 402,323 |
Others (1) |
| 149,506 |
| 971,787 |
| 149,506 |
| 971,787 |
Total |
| 1,527,178 |
| 1,587,363 |
| 1,695,397 |
| 1,697,899 |
Current |
| 1,527,178 |
| 1,587,363 |
| 1,695,397 |
| 1,697,899 |
Liabilities | ||||||||
Financial Assets and Pending Settlement Transactions |
| 902,393 |
| 2,316,183 |
| 920,248 |
| 2,316,252 |
Creditors Pending Settlement |
| 4,392 |
| 7,656 |
| 137,986 |
| 112,945 |
Creditors for Loan of Shares |
| 61,845 |
| 58,942 |
| 168,013 |
| 152,114 |
Clearinghouse Transactions |
| - |
| 13,078 |
| 3,708 |
| 16,439 |
Records and Settlement |
| 2,594 |
| 2,488 |
| 3,928 |
| 3,305 |
Acquisition and Subscription of Securities Arising Release |
| - |
| - |
| 1,274 |
| 1,274 |
Others |
| 2,151 |
| - |
| 2,288 |
| 192 |
Total |
| 973,375 |
| 2,398,347 |
| 1,237,445 |
| 2,602,521 |
Current |
| 971,989 |
| 2,340,787 |
| 1,236,059 |
| 2,544,961 |
Long-term |
| 1,386 |
| 57,560 |
| 1,386 |
| 57,560 |
|
|
|
|
|
|
|
|
|
(1) Refers to guarantee the deposits made in derivative transactions with customers in the market. | ||||||||
11. Tax Credits | ||||||||
a) Nature and Origin of Recorded Tax Credits | ||||||||
|
|
|
|
|
|
|
| Bank |
|
| 12/31/2015 |
| Recognition |
| Realization |
| 12/31/2016 |
Allowance for Loan Losses |
| 11,129,702 |
| 4,530,738 |
| (4,434,288) |
| 11,226,152 |
Reserve for Legal and Administrative Proceedings - Civil |
| 777,079 |
| 449,209 |
| (443,012) |
| 783,276 |
Reserve for Tax Risks and Legal Obligations |
| 1,627,384 |
| 334,083 |
| (580,681) |
| 1,380,786 |
Reserve for Legal and Administrative Proceedings - Labor |
| 875,489 |
| 1,486,262 |
| (1,301,140) |
| 1,060,611 |
Adjustment to Fair Value of Trading Securities and Derivatives(1) |
| 9,913,918 |
| 2,878,328 |
| (9,073,009) |
| 3,719,237 |
Adjustment to Fair Value of Available-for-sale Securities and Cash Flow Hedge(1) |
| 2,486,103 |
| - |
| (1,940,984) |
| 545,119 |
Accrual for Pension Plan(2) |
| 874,253 |
| 559,526 |
| (549,236) |
| 884,543 |
Profit Sharing, Bonuses and Personnel Gratuities |
| 373,329 |
| 511,440 |
| (521,569) |
| 363,200 |
Other Temporary Provisions(3) |
| 2,432,406 |
| 812,785 |
| (66,364) |
| 3,178,827 |
Total Tax Credits on Temporary Differences |
| 30,489,663 |
| 11,562,371 |
| (18,910,283) |
| 23,141,751 |
Social Contribution Tax - Executive Act 2,158/2001 |
| 641,213 |
| - |
| - |
| 641,213 |
Balance of Recorded Tax Credits |
| 31,130,876 |
| 11,562,371 |
| (18,910,283) |
| 23,782,964 |
Current |
| 8,063,063 |
|
|
|
|
| 8,234,581 |
Long-term |
| 23,067,813 |
|
|
|
|
| 15,548,383 |
64
|
|
|
|
|
|
|
|
|
| Bank |
|
|
|
| 12/31/2014 |
| Recognition |
| Realization |
| 12/31/2015 |
Allowance for Loan Losses |
|
|
| 7,321,677 |
| 5,659,073 |
| (1,851,048) |
| 11,129,702 |
Reserve for Legal and Administrative Proceedings - Civil |
|
|
| 721,246 |
| 130,031 |
| (74,198) |
| 777,079 |
Reserve for Tax Risks and Legal Obligations |
|
|
| 4,225,376 |
| 1,160,787 |
| (3,758,779) |
| 1,627,384 |
Reserve for Legal and Administrative Proceedings - Labor |
|
|
| 704,246 |
| 364,125 |
| (192,882) |
| 875,489 |
Adjustment to Fair Value of Trading Securities and Derivatives(1) |
| 1,583,126 |
| 14,180,654 |
| (5,849,862) |
| 9,913,918 | ||
Adjustment to Fair Value of Available-for-sale Securities and Cash Flow Hedge(1) |
| 321,075 |
| 2,165,028 |
| - |
| 2,486,103 | ||
Accrual for Pension Plan(2) |
|
|
| 1,300,921 |
| - |
| (426,668) |
| 874,253 |
Profit Sharing, Bonuses and Personnel Gratuities |
|
|
| 268,733 |
| 565,388 |
| (460,792) |
| 373,329 |
Other Temporary Provisions(3) |
|
|
| 1,894,287 |
| 538,119 |
| - |
| 2,432,406 |
Total Tax Credits on Temporary Differences |
|
|
| 18,340,687 |
| 24,763,205 |
| (12,614,229) |
| 30,489,663 |
Tax Loss Carryforwards(4) |
|
|
| 658,417 |
| - |
| (658,417) |
| - |
Social Contribution Tax - Executive Act 2,158/2001 |
|
|
| 641,213 |
| - |
| - |
| 641,213 |
Balance of Recorded Tax Credits |
|
|
| 19,640,317 |
| 24,763,205 |
| (13,272,646) |
| 31,130,876 |
Current |
|
|
| 5,708,490 |
|
|
|
|
| 8,063,063 |
Long-term |
|
|
| 13,931,827 |
|
|
|
|
| 23,067,813 |
|
|
|
|
|
|
|
|
|
| Consolidated |
Acquisition/ | ||||||||||
|
| 12/31/2015 |
| Investment(5) |
| Recognition |
| Realization |
| 12/31/2016 |
Allowance for Loan Losses |
| 12,013,011 |
| - |
| 5,175,082 |
| (4,867,003) |
| 12,321,090 |
Reserve for Legal and Administrative Proceedings - Civil |
| 847,544 |
| - |
| 504,224 |
| (483,495) |
| 868,273 |
Reserve for Tax Risks and Legal Obligations |
| 2,500,587 |
| - |
| 467,456 |
| (701,688) |
| 2,266,355 |
Reserve for Legal and Administrative Proceedings - Labor |
| 909,010 |
| - |
| 1,541,362 |
| (1,325,380) |
| 1,124,992 |
Adjustment to Fair Value of Trading Securities and Derivatives(1) | 10,006,970 |
| (1,547) |
| 2,906,024 |
| (9,165,567) |
| 3,745,880 | |
Adjustment to Fair Value of Available-for-sale Securities and Cash Flow Hedge(1) |
| 2,609,682 |
| - |
| 21,787 |
| (2,062,275) |
| 569,194 |
Accrual for Pension Plan(2) |
| 874,347 |
| - |
| 561,423 |
| (549,235) |
| 886,535 |
Profit Sharing, Bonuses and Personnel Gratuities |
| 399,358 |
| - |
| 540,232 |
| (553,107) |
| 386,483 |
Other Temporary Provisions(3) |
| 2,635,520 |
| 108,867 |
| 885,434 |
| (195,339) |
| 3,434,482 |
Total Tax Credits on Temporary Differences |
| 32,796,029 |
| 107,320 |
| 12,603,024 |
| (19,903,089) |
| 25,603,284 |
Tax Loss Carryforwards |
| 537,037 |
| - |
| 162,362 |
| (191,354) |
| 508,045 |
Social Contribution Tax - Executive Act 2,158/2001 |
| 655,359 |
| - |
| - |
| - |
| 655,359 |
Balance ofRecorded Tax Credits |
| 33,988,425 |
| 107,320 |
| 12,765,386 |
| (20,094,443) |
| 26,766,688 |
Current |
| 8,786,456 |
| - |
|
|
|
|
| 9,102,267 |
Long-term |
| 25,201,969 |
| - |
|
|
|
|
| 17,664,421 |
|
|
|
|
|
|
|
|
|
| Consolidated |
Acquisition/ | ||||||||||
|
| 12/31/2014 |
| Investment(5) |
| Recognition |
| Realization |
| 12/31/2015 |
Allowance for Loan Losses |
| 8,029,815 |
| 1,758 |
| 6,328,031 |
| (2,346,593) |
| 12,013,011 |
Reserve for Legal and Administrative Proceedings - Civil |
| 786,921 |
| - |
| 150,832 |
| (90,209) |
| 847,544 |
Reserve for Tax Risks and Legal Obligations |
| 4,974,728 |
| (451) |
| 1,357,701 |
| (3,831,391) |
| 2,500,587 |
Reserve for Legal and Administrative Proceedings - Labor |
| 731,247 |
| - |
| 378,865 |
| (201,102) |
| 909,010 |
Adjustment to Fair Value of Trading Securities and Derivatives(1) | 1,583,691 |
| - |
| 14,352,901 |
| (5,929,622) |
| 10,006,970 | |
Adjustment to Fair Value of Available-for-sale Securities and Cash Flow Hedge(1) |
| 359,008 |
| 8 |
| 2,250,688 |
| (22) |
| 2,609,682 |
Accrual for Pension Plan(2) |
| 1,310,410 |
| - |
| - |
| (436,063) |
| 874,347 |
Profit Sharing, Bonuses and Personnel Gratuities |
| 288,939 |
| (1,310) |
| 595,066 |
| (483,337) |
| 399,358 |
Other Temporary Provisions(3) |
| 2,024,410 |
| (939) |
| 658,521 |
| (46,472) |
| 2,635,520 |
Total Tax Credits on Temporary Differences |
| 20,089,169 |
| (934) |
| 26,072,605 |
| (13,364,811) |
| 32,796,029 |
Tax Loss Carryforwards (4) |
| 1,227,845 |
| - |
| 72,871 |
| (763,679) |
| 537,037 |
Social Contribution Tax - Executive Act 2,158/2001 |
| 655,359 |
| - |
| - |
| - |
| 655,359 |
Balance ofRecorded Tax Credits |
| 21,972,373 |
| (934) |
| 26,145,476 |
| (14,128,490) |
| 33,988,425 |
Current |
| 6,324,664 |
|
|
|
|
|
|
| 8,786,456 |
Long-term |
| 15,647,709 |
|
|
|
|
|
|
| 25,201,969 |
(1) Includes tax credits IRPJ, CSLL, PIS and Cofins. | ||||||||||
(2) Includes tax credits IRPJ and CSLL, adjustments on plan benefits to employees as mentioned Note 3.n. | ||||||||||
(3) Composed mainly by administrative provisions nature and escrow deposits. | ||||||||||
65
(4) Provision for loss (Note 3.s). | ||||||||||||
(5) Acquisition and merger of equity interest (Note 15). | ||||||||||||
Banco Santander has tax credits not activated in the amount of R$1,084,230 (12/31/2015 - R$1,340,072) and R$1,085,272 (12/31/2015 - R$1,438,349) Consolidated. | ||||||||||||
As established by CMN Resolution 3,059/2002, with the changes introduced by CMN Resolution 4,441/2015, Santander Brasil presented the reasons and rationales to support the accounting of deferred tax assets on its financial statements. On February 22, 2016, the request for maintenance and the procedures for registration of the Bank's tax credit was approved by the Bacen. | ||||||||||||
b) Expected Realization of Recorded Tax Credits | ||||||||||||
|
|
|
|
|
|
|
|
|
|
|
| Bank |
|
|
|
|
|
|
|
|
|
|
|
| 12/31/2016 |
Temporary Differences | Total | |||||||||||
Year |
|
|
| IRPJ |
| CSLL |
| PIS/Cofins |
| CSLL 18% |
| Recorded |
2017 |
|
|
| 4,456,169 |
| 3,565,683 |
| 194,621 |
| 18,108 |
| 8,234,581 |
2018 |
|
|
| 2,664,915 |
| 2,108,538 |
| 77,580 |
| 537 |
| 4,851,570 |
2019 |
|
|
| 3,437,949 |
| 2,051,962 |
| 82,008 |
| 18,999 |
| 5,590,918 |
2020 |
|
|
| 1,821,170 |
| 1,110,773 |
| 35,044 |
| 103,069 |
| 3,070,056 |
2021 |
|
|
| 154,374 |
| 97,234 |
| 10,948 |
| 451,685 |
| 714,241 |
2022 to 2024 |
|
|
| 342,776 |
| 205,666 |
| 13,227 |
| 48,815 |
| 610,484 |
2025 to 2026 |
|
|
| 426,163 |
| 280,542 |
| 4,409 |
| - |
| 711,114 |
Total |
|
|
| 13,303,516 |
| 9,420,398 |
| 417,837 |
| 641,213 |
| 23,782,964 |
|
|
|
|
|
|
|
|
|
|
|
| Consolidated |
|
|
|
|
|
|
|
|
|
|
|
| 12/31/2016 |
| Temporary Differences | Tax Loss | Total | |||||||||
Year |
| IRPJ |
| CSLL |
| PIS/Cofins |
| Carryforwards |
| CSLL 18% |
| Recorded |
2017 |
| 4,894,633 |
| 3,873,775 |
| 196,005 |
| 105,600 |
| 32,254 |
| 9,102,267 |
2018 |
| 3,035,578 |
| 2,406,196 |
| 78,964 |
| 67,820 |
| 537 |
| 5,589,095 |
2019 |
| 4,071,307 |
| 2,411,451 |
| 82,435 |
| 55,854 |
| 18,999 |
| 6,640,046 |
2020 |
| 1,829,181 |
| 1,114,359 |
| 35,464 |
| 106,361 |
| 103,069 |
| 3,188,434 |
2021 |
| 165,018 |
| 103,098 |
| 11,368 |
| 71,118 |
| 451,685 |
| 802,287 |
2022 to 2024 |
| 345,106 |
| 206,776 |
| 13,269 |
| 89,832 |
| 48,815 |
| 703,798 |
2025 to 2026 |
| 437,679 |
| 287,199 |
| 4,423 |
| 11,460 |
| - |
| 740,761 |
Total |
| 14,778,502 |
| 10,402,854 |
| 421,928 |
| 508,045 |
| 655,359 |
| 26,766,688 |
Due to differences between accounting, tax and corporate, expected realization of tax credits should not be taken as indicative of future net income. | ||||||||||||
c) Present Value of Tax Credits | ||||||||||||
The present value of recorded tax credits is R$20,525,234 (12/31/2015 - R$25,698,102) Bank and R$23,117,101 (12/31/2015 - R$27,995,682) Consolidated, the present value was calculated taking into account the expected realization of temporary differences, tax losses carryforwards, negative CSLL bases, Social Contribution tax at the rate of 18% (Provisional Act 2,158/2001) and the average funding rate, projected for the corresponding periods. | ||||||||||||
66
12. Other Receivables - Others | ||||||||
|
|
|
| Bank |
|
|
| Consolidated |
|
| 12/31/2016 |
| 12/31/2015 |
| 12/31/2016 |
| 12/31/2015 |
Notes and Credits Receivable (Note 8.a) |
|
|
|
|
|
|
|
|
Credit Cards |
| 16,757,154 |
| 14,912,110 |
| 16,809,107 |
| 14,945,844 |
Receivables(1) |
| 16,305,283 |
| 15,547,177 |
| 18,801,078 |
| 17,805,112 |
Rural Product (CPR) |
| 42,793 |
| 175,258 |
| 42,793 |
| 175,258 |
Others |
| - |
| - |
| 241,758 |
| - |
Escrow Deposits for |
|
|
|
|
|
|
|
|
Tax Claims |
| 4,721,942 |
| 4,654,395 |
| 6,894,499 |
| 6,618,394 |
Labor Claims |
| 1,643,978 |
| 1,619,546 |
| 1,707,724 |
| 1,672,187 |
Others |
| 1,050,112 |
| 950,784 |
| 1,427,416 |
| 1,336,112 |
Contract Guarantees - Former Controlling Stockholders (Note 23.i) |
| 724,116 |
| 702,758 |
| 814,925 |
| 789,973 |
Recoverable Taxes |
| 3,684,562 |
| 2,281,218 |
| 4,332,304 |
| 2,831,148 |
Receivables - Buyer Services |
| 15,258,438 |
| 11,788,451 |
| 15,152,967 |
| 11,788,451 |
Reimbursable Payments |
| 146,131 |
| 157,099 |
| 167,429 |
| 163,820 |
Salary Advances/Others |
| 64,883 |
| 70,033 |
| 111,513 |
| 99,794 |
Employee Benefit Plan (Note 35) |
| 130,462 |
| - |
| 153,661 |
| - |
Debtors for Purchase of Assets (Note 8.a) |
| 84,066 |
| 72,213 |
| 84,310 |
| 73,328 |
Receivable from Affiliates (Note 26.e) |
| 853,930 |
| 756,216 |
| 862,893 |
| 753,767 |
Others |
| 958,506 |
| 1,118,887 |
| 1,624,418 |
| 1,859,132 |
Total |
| 62,426,356 |
| 54,806,145 |
| 69,228,795 |
| 60,912,320 |
Current |
| 31,949,644 |
| 38,919,702 |
| 35,349,654 |
| 42,030,853 |
Long-term |
| 30,476,712 |
| 15,886,443 |
| 33,879,141 |
| 18,881,467 |
(1) It consists of operations with credit assignment characteristics substantially composed of "Confirming" operations with companies subject to credit risk and analysis of loan losses by segment in accordance with the Bank risk policies. | ||||||||
13. Non-Current Assets Held for Sale | ||||||||
On September 30, 2014 based on the sale plan, investments in Wind Energy entities recorded in investments in subsidiaries and affiliates were transferred for this heading, whose current condition is highly likely; as approved by the Directors of Banco Santander, in compliance with required by CPC 31. | ||||||||
On March 23, 2015, Santander Participações S.A. (Santander Participações) sold its entire stake in Santos Energy Participações S.A. (Santos Energia) to Inversiones Global Capital, S.A., a company indirectly controlled by Santander Spain, in the total amount of R$127,012. On the same date, Santander Participações sold all of its interest in the Special Purpose Companies Gestamp Eólica Serra de Santana S.A., Gestamp Eólica Paraíso S.A., Gestamp Eólica Lanchinha S.A., Gestamp Eólica Seridó S.A. and Gestamp Eólica Lagoa Nova S.A. to ICG do Brazil S.A., a company indirectly controlled by Santander Spain, in the total amount of R$120,000. | ||||||||
On September 30, 2016, due to no expectation of sale of this investment by the current market situation, management decided to transfer the total of this balance, the value of R$457,705 to caption investments in affiliates and subsidiaries in the country (Note 15). | ||||||||
On December 31, 2015, in the Consolidated, these investments totaled R$488,583, and liabilities values directly associated with non-current assets held for sale totaled R$1,197. | ||||||||
14. Dependence Information and Foreign Subsidiary | ||||||||
Branch: | ||||||||
The Grand Cayman Agency is a branch of Banco Santander, and is not a legal company incorporated separately. It operates in the Cayman Islands under the Category "B" banking license. In the normal course of business, the branch has significant transactions with the parent and its affiliates. All transactions are made and recorded under the direction of Head Office in which the branch is economically dependent. | ||||||||
The Grand Cayman branch is licensed by the Law of Banks and Trust Companies, or "Law of Banks and Trust Companies" as a Bank of Category "B" and is duly registered as a Foreign Company by the Officer Societies Registration in Grand Cayman in the Cayman Islands. The branch therefore is duly authorized to perform banking business in the Cayman Islands and are currently involved in the funding business in the banking market and the international capital to provide credit lines to us, which are then extended to our customers for financing working capital and foreign trade. Its also receives foreign currency deposits of corporate clients and individuals and grants credit to brazilian and foreign clients, mainly to support trade with Brazil. | ||||||||
67
Subsidiary: | ||||||||
Banco Santander has a independent subsidiary in Spain, Santander Brasil, Establecimiento Financiero de Credito, S.A. (Santander Brasil EFC), to complement the foreign trade strategy for corporate clients - large brazilian companies and their operations abroad - and offer products and financial services through an offshore entity that is not established in a jurisdiction with favored taxation. | ||||||||
The summarized financial position of dependency and foreign subsidiary, converted at the exchange rate prevailing at balance sheet date in the financial statements include: | ||||||||
|
|
|
|
|
|
|
|
|
Grand Cayman Branch | Santander Brasil EFC | |||||||
12/31/2016 |
| 12/31/2015 |
| 12/31/2016 |
| 12/31/2015 | ||
Assets |
| 81,192,782 |
| 98,673,203 |
| 2,810,242 |
| 4,368,077 |
Current and Long-term Assets |
| 81,192,780 |
| 98,673,182 |
| 2,810,164 |
| 4,367,630 |
Cash |
| 544,468 |
| 462,232 |
| 182,366 |
| 1,622,751 |
Interbank Investments |
| 13,467,647 |
| 18,918,580 |
| 1,323,784 |
| - |
Securities and Derivatives Financial Instruments |
| 34,721,940 |
| 38,475,623 |
| 4,606 |
| 789,572 |
Lending Operations(1) |
| 22,770,598 |
| 32,655,152 |
| 1,094,243 |
| 1,713,434 |
Foreign Exchange Portfolio |
| 8,466,560 |
| 6,428,499 |
| - |
| - |
Others |
| 1,221,567 |
| 1,733,096 |
| 205,165 |
| 241,873 |
Permanent Assets |
| 2 |
| 21 |
| 78 |
| 447 |
Liabilities |
| 81,192,782 |
| 98,673,203 |
| 2,810,242 |
| 4,368,077 |
Current and Long-term Liabilities |
| 44,495,525 |
| 56,293,137 |
| 240,053 |
| 1,038,284 |
Deposits and Money Market Funding |
| 5,026,564 |
| 10,074,180 |
| - |
| - |
Funds from Acceptance and Issuance of Securities(2) |
| 7,434,693 |
| 12,981,206 |
| - |
| - |
Borrowings(3) |
| 21,081,194 |
| 23,744,735 |
| - |
| - |
Foreign Exchange Portfolio |
| 8,351,718 |
| 6,467,055 |
| - |
| - |
Others |
| 2,601,356 |
| 3,025,961 |
| 240,053 |
| 1,038,284 |
Deferred Income |
| 107 |
| 491 |
| 17,563 |
| 20,997 |
Stockholders' Equity |
| 36,697,150 |
| 42,379,575 |
| 2,552,626 |
| 3,308,796 |
Result of Exercise |
| 874,548 |
| 1,029,851 |
| (142,398) |
| 7,289 |
(1) Refers mainly to export financing operations. | ||||||||
(2) The variation mainly refers to liquidations of Eurobonds during the first quarter 2016. | ||||||||
(3) Borrowings abroad regarding financing lines to exports and imports and other lines of credit. | ||||||||
(4) At a meeting of the Executive Board of Banco Santander on August, 31 2015, was approved the repatriation of funds of Grand Cayman Agency to be considered excessive to maintain its activities, in the amount of US$1,000,000, and the capital stock highlighted of the aforementioned Agency from US$11,114,267 to US$10,114,267. | ||||||||
68
15. Investments in Affiliates and Subsidiaries | ||||||||||
|
|
|
|
|
|
|
|
|
| 12/31/2016 |
Quantity of Shares or Quotas Owned | ||||||||||
Directly or Indirectly (in Thousands) | Direct | |||||||||
Common Shares | Preferred | Direct | and Indirect | |||||||
Investments |
| Activity |
| and Quotas |
| Shares |
| Participation |
| Participation |
Controlled by Banco Santander | ||||||||||
Santander Leasing S.A. Arrendamento Mercantil (Santander Leasing) (9) |
| Leasing |
| 11,043,798 |
| - |
| 78.57% |
| 99.99% |
Santander Brasil Administradora de Consórcio Ltda. (Santander Brasil Consórcio) |
| Buying Club |
| 95,349 |
| - |
| 100.00% |
| 100.00% |
Banco Bandepe S.A. (Banco Bandepe) |
| Bank |
| 2,184 |
| - |
| 100.00% |
| 100.00% |
Banco RCI Brasil S.A.(10) |
| Bank |
| 81 |
| 81 |
| 39.89% |
| 39.89% |
Aymoré Crédito, Financiamento e Investimento S.A. (Aymoré CFI) |
| Financial |
| 287,706,670 |
| - |
| 100.00% |
| 100.00% |
Santander Corretora de Câmbio e Valores Mobiliários S.A. (Santander CCVM) |
| Broker |
| 14,067,673 |
| 14,067,673 |
| 99.99% |
| 100.00% |
Santander Microcrédito Assessoria Financeira S.A (Santander Microcrédito) |
| Microcredit |
| 43,129,918 |
| - |
| 100.00% |
| 100.00% |
Santander Brasil Advisory Services S.A. (Santander Brasil Advisory) (14) |
| Other Activities |
| 1,324 |
| - |
| 96.58% |
| 96.58% |
Santander Participações |
| Holding |
| 4,597 |
| - |
| 100.00% |
| 100.00% |
Getnet Adquirencia e Serviços para Meios de Pagamento S.A. (Getnet S.A.)(6)(12) |
| Payment Institution |
| 61,565 |
| - |
| 88.50% |
| 88.50% |
Sancap Investimentos e Participações S.A. (Sancap) |
| Holding |
| 12,728,211 |
| - |
| 100.00% |
| 100.00% |
Santander S.A. Serviços Técnicos, Administrativos e de Corretagem de Seguros (Santander Serviços) |
| Insurance Broker |
| 174,360,451 |
| - |
| 60.65% |
| 60.65% |
Santander Brasil EFC |
| Financial |
| 75 |
| - |
| 100.00% |
| 100.00% |
Atual Companhia Securitizadora de Créditos Financeiros (4) |
| Securitization |
| - |
| - |
| 100.00% |
| 100.00% |
Controlled by Aymoré CFI |
|
|
|
|
|
|
|
|
|
|
Super Pagamentos e Administração de Meios Eletrônicos S.A. (Super Pagamentos)(3) |
| Other Activities |
| 40,000 |
| - |
| - |
| 100.00% |
Banco Olé Bonsucesso Consignado S.A. (Olé Consignado)(Current Corporate Name of Banco Bonsucesso Consignado S.A.)(13) |
| Bank |
| 227,106 |
| - |
| - |
| 60.00% |
Banco PSA Finance Brasil S.A. (Banco PSA)(17) |
| Bank |
| 105 |
| - |
| - |
| 50.00% |
Controlled by Santander Leasing | ||||||||||
Santander Finance Arrendamento Mercantil S.A. (Current Corporate Name of PSA Finance Arrendamento Mercantil S.A. (Santander Finance Arrendamento Mercantil)(17) (18) |
| Leasing |
| 182 |
| - |
| - |
| 100.00% |
Controlled by Sancap | ||||||||||
Santander Capitalização S.A. (Santander Capitalização) |
| Capitalization |
| 64,615 |
| - |
| - |
| 100.00% |
Evidence |
| Private Pension |
| 12,591,172 |
| - |
| - |
| 100.00% |
Controlled by Santander Participações | ||||||||||
BW Guirapá I S.A.(19) (22) |
| Holding |
| 848 |
| - |
| - |
| 86.81% |
69
|
|
|
|
|
|
|
|
|
| 12/31/2016 |
Quantity of Shares or Quotas Owned | ||||||||||
Directly or Indirectly (in Thousands) | Direct | |||||||||
Common Shares | Preferred | Direct | and Indirect | |||||||
Investments |
| Activity |
| and Quotas |
| Shares |
| Participation |
| Participation |
Controlled by Santander Serviços |
|
|
|
|
|
|
|
| ||
Webcasas S.A. |
| Other Activities |
| 24,500 |
| - |
| - |
| 100.00% |
Jointly Controlled Companies by Banco Santander |
|
|
|
|
|
|
|
|
|
|
Cibrasec Companhia Brasileira de Securitização (Cibrasec)(1) (15) |
| Securitization |
| 4 |
| - |
| 9.72% |
| 9.72% |
Norchem Participações e Consultoria S.A. (Norchem Participações) |
| Other Activities |
| 950 |
| - |
| 50.00% |
| 50.00% |
Estruturadora Brasileira de Projetos S.A. - EBP (EBP)(1) |
| Other Activities |
| 3,859 |
| 2,953 |
| 11.11% |
| 11.11% |
Campo Grande Empreendimentos |
| Other Activities |
| 255 |
| - |
| 25.32% |
| 25.32% |
Jointly Controlled Companies by Santander Serviços |
|
|
|
|
|
|
|
|
|
|
Webmotors S.A.(2) (20) (23) |
| Other Activities |
| 366,182,676 |
| - |
| - |
| 70.00% |
TecBan - Tecnologia Bancária S.A. (TecBan) |
| Other Activities |
| 743,944 |
| - |
| - |
| 19.81% |
Jointly Controlled Companies by Santander Participações |
|
|
|
|
|
|
|
|
|
|
PSA Corretora de Seguros e Serviços Ltda. (PSA Corretora de Seguros)(17) (21) |
| Other Activities |
| 250 |
| - |
| - |
| 50.00% |
Controlled by Getnet S.A(6) (12) | ||||||||||
Auttar HUT Processamento de Dados Ltda. (Auttar HUT) |
| Other Activities |
| 3,865 |
| - |
| - |
| 100.00% |
Integry Tecnologia e Serviços A.H.U Ltda. (Integry Tecnologia) |
| Other Activities |
| 1,276 |
| - |
| - |
| 100.00% |
Toque Fale Serviços de Telemarketing Ltda. (Toque Fale) |
| Other Activities |
| 6,050 |
| - |
| - |
| 100.00% |
Controlled by TecBan | ||||||||||
Tbnet Comércio Locação e Administração Ltda. (Tbnet) (7) |
| Other Activities |
| 142,095 |
| - |
| - |
| 100.00% |
Controlled by Tebnet | ||||||||||
Tbforte Segurança e Transporte de Valores Ltda. (Tbfort) (11) |
| Other Activities |
| 136,266 |
| - |
| - |
| 100.00% |
Controlled by Olé Consignado (Current Corporate Name of Banco Bonsucesso Consignado S.A.)(13) | ||||||||||
BPV Promotora de Vendas e Cobrança Ltda. |
| Other Activities |
| 6,950 |
| - |
| - |
| 100.00% |
Bonsucesso Tecnologia Ltda. (Current Corporate Name of BSI Informática Ltda.) (10) |
| Other Activities |
| 450 |
| - |
| - |
| 100.00% |
Controladas da BW Guirapá I S.A.(19) (22) | ||||||||||
Central Eólica Angical S.A. (Angical) (19) (22) |
| Wind Energy |
| 717 |
| - |
| - |
| 100.00% |
Central Eólica Caititu S.A. (Caititu)(19) |
| Wind Energy |
| 935 |
| - |
| - |
| 100.00% |
Central Eólica Coqueirinho S.A. (Coqueirinho)(19) |
| Wind Energy |
| 943 |
| - |
| - |
| 100.00% |
Central Eólica Corrupião S.A. (Corrupião)(19) (22) |
| Wind Energy |
| 712 |
| - |
| - |
| 100.00% |
Central Eólica Inhambu S.A. (Inhambu)(19) (22) |
| Wind Energy |
| 918 |
| - |
| - |
| 100.00% |
Central Eólica Tamanduá Mirim S.A. (Tamanduá Mirim)(19) (22) |
| Wind Energy |
| 1,001 |
| - |
| - |
| 100.00% |
Central Eólica Teiu S.A. (Teiu)(19) (22) |
| Wind Energy |
| 746 |
| - |
| - |
| 100.00% |
Affiliate | ||||||||||
Norchem Holdings e Negócios S.A. (Norchem Holdings) |
| Other Activities |
| 1,679 |
| - |
| 21.75% |
| 21.75% |
70
|
|
|
|
|
|
|
|
|
|
|
|
|
| Adjusted |
|
|
|
|
|
|
|
|
| ||
Stockholders' | Net Income (Loss) | |||||||||||
Equity | Adjusted | Investments Value | Equity Accounting Results | |||||||||
01/01 to | 01/01 to | 01/01 to | ||||||||||
|
| 12/31/2016 |
| 12/31/2016 |
| 12/31/2016 |
| 12/31/2015 |
| 12/31/2016 |
| 12/31/2015 |
Controlled by Banco Santander | ||||||||||||
Santander Leasing(9) |
| 5,699,279 |
| 527,108 |
| 4,478,155 |
| 4,269,099 |
| 414,170 |
| 391,320 |
Santander Brasil Consórcio |
| 136,615 |
| 30,799 |
| 136,615 |
| 169,816 |
| 30,799 |
| 22,902 |
Banco Bandepe |
| 3,086,221 |
| 260,182 |
| 3,086,221 |
| 3,195,872 |
| 260,182 |
| 255,300 |
Banco RCI Brasil S.A.(10) |
| 1,327,524 |
| 79,223 |
| 529,562 |
| - |
| 31,602 |
| - |
Aymoré CFI |
| 1,364,514 |
| 52,538 |
| 1,364,514 |
| 1,801,193 |
| 52,538 |
| 661,404 |
Companhia de Crédito, Financiamento e Investimento RCI Brasil (CFI RCI Brasil)(10) | - |
| - |
| - |
| 539,083 |
| - |
| 94,951 | |
Santander Securities Services Brasil DTVM S.A. (5) |
| - |
| - |
| - |
| - |
| - |
| 105,288 |
Santander CCVM |
| 557,738 |
| 106,085 |
| 557,736 |
| 485,913 |
| 106,085 |
| 101,610 |
Santander Microcrédito |
| 17,317 |
| (17) |
| 17,317 |
| 23,834 |
| (17) |
| 1,740 |
Santander Brasil Advisory(14) |
| 15,228 |
| 987 |
| 14,698 |
| 13,976 |
| 953 |
| 1,356 |
Santander Participações |
| 1,542,425 |
| 157,560 |
| 1,542,410 |
| 1,398,518 |
| 157,545 |
| (503,594) |
Getnet S.A. (6) (12) |
| 1,468,370 |
| 282,564 |
| 1,299,508 |
| 1,178,586 |
| 250,069 |
| 143,132 |
Sancap |
| 362,233 |
| 102,176 |
| 362,233 |
| 336,013 |
| 102,176 |
| 150,746 |
Santander Serviços |
| 788,148 |
| 242,307 |
| 478,039 |
| 363,989 |
| 146,968 |
| 14,938 |
Mantiq Investimentos Ltda. (Mantiq) (16) |
| - |
| 3,276 |
| - |
| 7,596 |
| 3,276 |
| 3,222 |
Santander Brasil EFC |
| 2,552,626 |
| (142,398) |
| 2,552,626 |
| 3,308,796 |
| (142,398) |
| 7,289 |
Controlled by Aymoré CFI |
|
|
|
|
|
|
|
|
|
|
|
|
Super Pagamentos (3) |
| 21,048 |
| (8,897) |
| - |
| - |
| - |
| - |
Olé Consignado(Current Corporate Name of Banco Bonsucesso Consignado S.A.)(13) |
| 676,062 |
| 13,580 |
| - |
| - |
| - |
| - |
Banco PSA(17) |
| 276,113 |
| 5,766 |
| - |
| - |
| - |
| - |
Controlled by Santander Leasing |
|
|
|
|
|
|
|
|
|
|
|
|
Santander Finance Arrendamento Mercantil(17) (18) |
| 372,174 |
| 3,739 |
| - |
| - |
| - |
| - |
Controlled by Sancap |
|
|
|
|
|
|
|
|
|
|
|
|
Santander Capitalização |
| 175,792 |
| 124,412 |
| - |
| - |
| - |
| - |
Evidence(3) |
| 280,004 |
| (21,531) |
| - |
| - |
| - |
| - |
Controlled by Santander Participações |
|
|
|
|
|
|
|
|
|
|
|
|
BW Guirapá I S.A.(19) (22) |
| 520,745 |
| (29,226) |
| - |
| - |
| - |
| - |
71
|
|
|
|
|
|
|
|
|
|
|
|
|
| Adjusted |
|
|
|
|
|
|
|
|
| ||
Stockholders' | Net Income (Loss) | |||||||||||
Equity | Adjusted | Investments Value | Equity Accounting Results | |||||||||
01/01 to | 01/01 to | 01/01 to | ||||||||||
|
| 12/31/2016 |
| 12/31/2016 |
| 12/31/2016 |
| 12/31/2015 |
| 12/31/2016 |
| 12/31/2015 |
Controlled by Santander Serviços |
|
|
|
|
|
|
|
|
|
|
|
|
Webcasas S.A. |
| 22,651 |
| 682 |
| - |
| - |
| - |
| - |
Jointly Controlled Companies by Banco Santander |
|
|
|
|
|
|
|
|
|
|
|
|
Cibrasec(1) (15) |
| 76,424 |
| 7,011 |
| 7,432 |
| 10,325 |
| 892 |
| 818 |
Norchem Participações |
| 52,605 |
| 5,274 |
| 26,302 |
| 23,665 |
| 2,637 |
| 1,977 |
EBP (1) |
| 56,402 |
| (1,964) |
| 6,266 |
| 6,697 |
| (429) |
| (1,544) |
Jointly Controlled Companies by Santander Serviços |
|
|
|
|
|
|
|
|
|
|
|
|
Webmotors S.A.(2) (20) (23) |
| 102,976 |
| 29,934 |
| - |
| - |
| - |
| - |
TecBan |
| 405,214 |
| 27,568 |
| - |
| - |
| - |
| - |
Jointly Controlled Companies by Santander Participações |
|
|
|
|
|
|
|
|
|
|
|
|
PSA Corretora de Seguros(17) (21) |
| 1,316 |
| 1,093 |
| - |
| - |
| - |
| - |
Controlled by Getnet S.A. (6) (12) |
|
|
|
|
|
|
|
|
|
|
|
|
Auttar HUT |
| 12,430 |
| 1,936 |
| - |
| - |
| - |
| - |
Integry Tecnologia |
| (325) |
| (227) |
| - |
| - |
| - |
| - |
Toque Fale |
| 2,202 |
| 1,231 |
| - |
| - |
| - |
| - |
Controlled by TecBan | ||||||||||||
Tbnet(7) |
| 63,107 |
| (55,238) |
| - |
| - |
| - |
| - |
Controlled by Tebnet | ||||||||||||
Tbforte(11) |
| 59,319 |
| (55,343) |
| - |
| - |
| - |
| - |
Controlled by Olé Consignado (Current Corporate Name of Banco Bonsucesso Consignado S.A.)(13) |
|
|
|
|
|
|
|
|
|
|
|
|
BPV Promotora de Vendas e Cobrança Ltda. |
| 15,006 |
| 4,753 |
| - |
| - |
| - |
| - |
Bonsucesso Tecnologia Ltda. (Current Corporate Name of BSI Informática Ltda.) (10) |
| 16,319 |
| 6,281 |
| - |
| - |
| - |
| - |
Controladas da BW Guirapá I S.A.(19) (22) | ||||||||||||
Angical (19) (22) |
| 39,986 |
| (1,720) |
| - |
| - |
| - |
| - |
Caititu(19) |
| 64,918 |
| (3,236) |
| - |
| - |
| - |
| - |
Coqueirinho(19) (22) |
| 80,747 |
| (5,435) |
| - |
| - |
| - |
| - |
Corrupião(19) (22) |
| 75,084 |
| (3,096) |
| - |
| - |
| - |
| - |
Inhambu(19) (22) |
| 91,982 |
| (6,395) |
| - |
| - |
| - |
| - |
Tamanduá Mirim(19) (22) |
| 86,849 |
| (5,301) |
| - |
| - |
| - |
| - |
Teiu(19) (22) |
| 50,892 |
| (1,610) |
| - |
| - |
| - |
| - |
72
|
|
|
|
|
|
|
|
|
|
|
|
|
|
|
|
|
|
|
|
|
|
|
|
| Adjusted |
|
|
|
|
|
|
|
|
| |||||||
Stockholders' | Net Income (Loss) | |||||||||||||||||||
Equity | Adjusted | Investments Value | Equity Accounting Results | |||||||||||||||||
01/01 to | 01/01 to | 01/01 to | ||||||||||||||||||
|
|
|
|
|
|
|
|
|
| 12/31/2016 |
| 12/31/2016 |
| 12/31/2016 |
| 12/31/2015 |
| 12/31/2016 |
| 12/31/2015 |
Affiliate |
|
|
| |||||||||||||||||
Norchem Holdings |
|
|
|
|
|
|
|
|
| 96,462 |
| 6,792 |
| 20,981 |
| 19,503 |
| 1,477 |
| 1,501 |
Others |
|
|
|
|
|
|
|
|
| - |
| - |
| 225 |
| 237 |
| - |
| (1,104) |
Total Bank |
|
|
|
|
|
|
|
|
|
|
|
|
| 16,480,840 |
| 17,152,711 |
| 1,418,525 |
| 1,453,252 |
Affiliate |
|
|
| |||||||||||||||||
Norchem Holdings |
|
|
|
|
|
|
|
|
| - |
| - |
| 20,981 |
| 19,503 |
| 1,477 |
| 1,501 |
Others(8) |
|
|
|
|
|
|
|
|
| - |
| - |
| 137,567 |
| 32,244 |
| - |
| 4 |
Total Consolidated |
|
|
|
|
|
|
|
|
| - |
| - |
| 158,548 |
| 51,747 |
| 1,477 |
| 1,505 |
(1) Although the participations was less than 20%, the Bank exercises control over the entity together with other major stockholders' through a stockholders' agreement where no business decision can be taken by a single shareholder. | ||||||||||||||||||||
(2) Although participation exceeds 50%, in accordance with the shareholders' agreement, the control is shared by Santander Serviços and Carsales.com.Investments PTY LTD (Carsales). | ||||||||||||||||||||
(3) On January 4, 2016, Aymoré CFI informed the owners of the shares representing the remaining 50% of Super Pagamentos total voting capital its decision to exercise the call option for the acquisition of such shares, for a value of approximately R$113 million.The transaction was concluded on March 10, 2016 (Note 37.c). | ||||||||||||||||||||
(4)The capital of the Company is R$100.00 composed of one hundred (100) common shares with no par value. | ||||||||||||||||||||
(5) Investment sold in August, 2015 (Note 37.d). | ||||||||||||||||||||
(6) The participation held by Getnet S.A. at Pos Móvil was dissolved because the end of its duration term, as published note in the Diário Oficial De La Republica de Chile on August, 21, 2015, and in June 2016 the interest held in Brazil S.A iZetlle was sold. | ||||||||||||||||||||
(7) At ESM held in the period from January to December 2016, capital increases were approved in the amount of R$104,708, with the capital stock increasing from R$37,387 to R$142,095, with the issue of 104,708 thousand new shares Nominal value of R$1.00 (one Real) each, whose increases were paid in the currency of the country on the same date as the approval of the partners. | ||||||||||||||||||||
(8) Includes the net value of the goodwill of R$25,735 (12/31/2015 - R$31,988) referred to the conclusion of the Purchase Price Allocation (PPA) on the acquisition of Bonsucesso by Aymoré CFI, R$90,094 referred to the goodwill on the acquisition of the shares representing the remaining 50% of the voting share capital of Super Pagamentos (Note 37.c) and R$21,762 related to goodwill on BW Guirapá I S.A concerning acquisition of Societies of Specific Purpose (SPEs - Windfarms). | ||||||||||||||||||||
(9) The Banco Santander repurchased 1,639 minority shares as the sale agreement of purchase and sale shares on March, 2016. | ||||||||||||||||||||
(10) The ESM of January 29, 2016 approved the merger of RCI Brasil by the Banco RCI Brasil S.A., under "Private Instrument of Protocol and Justification of Merger of Companhia de Crédito, Financiamento e Investimento RCI Brasil by Banco RCI Brasil S.A." celebrated on the same date. The merger resulted in the increase of the capital of Banco RCI Brasil S.A. in the amount of R$537,073 through the issuance of 160 thousand new registered shares (39 thousand common shares and 121 thousand preferred shares), increasing the capital of R$448,152 to R$985,225. The 243 thousand shares of capital stock of the Banco RCI Brasil S.A. held by RCI Brasil and the new shares issued attributed to its current shareholders in proportion to their current share. With this process the interest previously held by RCI Brasil went to Banco Santander. | ||||||||||||||||||||
(11) At a Shareholders Meeting held on the period January-December 2016, was approved the capital increase in the amount of R$128,449, from the current R$7,817 to R$136,266, with the issuance of 128,449 thousand new shares with a nominal value of R$1.00 (one Real) each, whose increase was paid on the same date in the currency of the country. | ||||||||||||||||||||
(12) In May, 2016, was approved by Bacen the authorization process to operation of the Company as a Payment Institution. | ||||||||||||||||||||
73
(13) At the ESM of March 3, 2016 was approved the change from the name of Banco Bonsucesso Consignado S.A. for Banco Olé Bonsucesso Consignado S.A., the change process has been approved by the Bacen on June 1, 2016. At the ESM of November 1, 2016, was approved the capital increase of Olé Consignado in the amount of R$50,000, from the current R$350,000 to R$400,000, throught the insuance of 28,509,708 new nominated ordinary shares, without nominal value. The process of the increase was approved by the Bacen in November 22, 2016. | ||||||||||||||||||||
(14) Banco Santander repurchased 767 minority shares as Purchase and Sale Agreement in April 2016. | ||||||||||||||||||||
(15) At the ESM held on April 29, 2016 was approved the reform in the distribution structure of the capital of Cibrasec through the creation of preferred shares issued by the Company with voting rights and the share conversion of the common shares of Company into preferred shares, this reform was ratified at the ESM held on May 30, 2016. Banco Santander became part of their ordinary shares held in the capital of Cibrasec, the corresponding amount to five thousand (5,000) common shares issued by Cibrasec 50 (fifty) preferred shares in the proportion of 100 (one hundred) common shares for each one (1) preferred share, and still held 4,000 (four thousand) common shares in the capital of Cibrasec. Each preferred share entitles the holder the right to one hundred (100) times the right to dividends of the common shares, so that the economic rights were maintained, however, the conversion resulted in reduction in the percentage shareholding in Cibrasec. | ||||||||||||||||||||
(16) Investment sold in July 14, 2016 (Note 37.e). | ||||||||||||||||||||
(17) Investment acquired on August 1, 2016 (Note 37.b). | ||||||||||||||||||||
(18) At the ESM held on August 1, 2016, approved the change of the name of PSA Finance Arrendamento Mercantil S.A. to Santander Finance Arrendamento Mercantil S.A., which was approved by the Bacen in December 12, 2016. | ||||||||||||||||||||
(19) Investments transferred from the non-current assets item held for sale (Note 13) in September 2016. | ||||||||||||||||||||
(20) At the ESM realized in September 26, 2016, was approved the reduction of the capital of Webmotors S.A. without cancellation of shares in the amount of R$109,800 to be considered excessive to maintain its activities, and the capital of R$194,580 to R$84,780. | ||||||||||||||||||||
(21) Pursuant to the shareholders' agreement, the control is shared by Santander Participações and PSA Services LTD. | ||||||||||||||||||||
(22) At AGEs held on October 31, 2016, a capital increase was approved by BW Guirapá I SA for Winds: Angical in the amount of R$600, through the issuance of 10,200 new common shares, Coqueirinho in the amount of R$1,300 , Through the issuance of 13,900 new common shares, Corrupião in the amount of R$2,501, through the issuance of 22,125 new common shares, Inhambu in the amount of R$2,102 through the issuance of 19,175 new common shares, Tamanduá Mirim in the amount of R$306, through The issue of 3,300 new common shares and for Teiu in the amount of R$1,405, through the issuance of 19,600 new common shares, the shares subscribed by BW Guirapá I SA, will be paid in national currency in up to 365 days, November 2017. | ||||||||||||||||||||
(23) On December 30, 2016, Virtual Motors Páginas Eletrônicas Ltda. - ME (Virtual Motors) was merged into Webmotors S.A (Note 37.e). | ||||||||||||||||||||
74
16. Fixed Assets | ||||||||||||||
|
|
|
|
|
|
|
|
|
|
|
|
|
| Bank |
12/31/2016 | 12/31/2015 | |||||||||||||
|
|
|
|
|
|
|
| Cost |
| Depreciation |
| Net |
| Net |
Real Estate |
|
|
|
|
| 2,538,788 |
| (644,943) |
| 1,893,845 |
| 1,953,964 | ||
Land |
|
|
|
|
| 668,141 |
| - |
| 668,141 |
| 664,289 | ||
Buildings |
|
|
|
|
| 1,870,647 |
| (644,943) |
| 1,225,704 |
| 1,289,675 | ||
Others Fixed Assets |
|
|
|
|
| 10,923,912 |
| (6,774,599) |
| 4,149,313 |
| 4,512,349 | ||
Installations, Furniture and Equipment |
|
|
| 3,012,984 |
| (1,563,715) |
| 1,449,269 |
| 1,395,153 | ||||
Data Processing Equipment |
|
|
|
|
| 3,287,127 |
| (2,538,309) |
| 748,818 |
| 912,654 | ||
Leasehold Improvements |
|
|
|
|
| 3,584,703 |
| (1,960,426) |
| 1,624,277 |
| 1,723,530 | ||
Security and Communication Equipment |
|
|
| 731,711 |
| (454,104) |
| 277,607 |
| 273,954 | ||||
Others |
|
|
|
|
| 307,387 |
| (258,045) |
| 49,342 |
| 207,058 | ||
Total |
|
|
|
|
| 13,462,700 |
| (7,419,542) |
| 6,043,158 |
| 6,466,313 | ||
|
|
|
|
|
|
|
|
|
|
|
|
|
| Consolidated |
12/31/2016 | 12/31/2015 | |||||||||||||
|
|
|
|
|
|
|
| Cost |
| Depreciation |
| Net |
| Net |
Real Estate |
|
|
|
|
| 2,857,794 |
| (670,658) |
| 2,187,136 |
| 2,052,547 | ||
Land |
|
|
|
|
| 702,032 |
| - |
| 702,032 |
| 697,579 | ||
Buildings |
|
|
|
|
| 2,155,762 |
| (670,658) |
| 1,485,104 |
| 1,354,968 | ||
Others Fixed Assets |
|
|
|
|
| 12,932,316 |
| (7,568,709) |
| 5,363,607 |
| 4,933,703 | ||
Installations, Furniture and Equipment |
|
|
| 3,814,777 |
| (1,646,535) |
| 2,168,242 |
| 1,505,780 | ||||
Data Processing Equipment |
|
|
|
|
| 3,660,391 |
| (2,702,177) |
| 958,214 |
| 1,053,017 | ||
Leasehold Improvements |
|
|
|
|
| 3,650,046 |
| (1,998,260) |
| 1,651,786 |
| 1,753,658 | ||
Security and Communication Equipment |
|
|
| 1,444,335 |
| (957,538) |
| 486,797 |
| 361,247 | ||||
Others |
|
|
|
|
| 362,767 |
| (264,199) |
| 98,568 |
| 260,001 | ||
Total |
|
|
|
|
| 15,790,110 |
| (8,239,367) |
| 7,550,743 |
| 6,986,250 | ||
17. Intangibles | ||||||||||||||
|
|
|
|
|
|
|
|
|
|
|
|
|
| Bank |
12/31/2016 | 12/31/2015 | |||||||||||||
|
|
|
|
|
|
|
| Cost |
| Amortization |
| Net |
| Net |
Goodwill on Acquired Companies |
|
|
| 26,120,037 |
| (24,751,860) |
| 1,368,177 |
| 2,990,567 | ||||
Other Intangible Assets |
|
|
|
|
| 8,590,069 |
| (5,694,254) |
| 2,895,815 |
| 2,402,983 | ||
Acquisition and Development of Software (1) |
|
|
| 5,627,437 |
| (3,993,994) |
| 1,633,443 |
| 1,299,918 | ||||
Exclusivity Contracts for Provision of Banking Services(1) |
| 2,641,152 |
| (1,443,874) |
| 1,197,278 |
| 966,759 | ||||||
Others |
|
|
|
|
| 321,480 |
| (256,386) |
| 65,094 |
| 136,306 | ||
Total |
|
|
|
|
| 34,710,106 |
| (30,446,114) |
| 4,263,992 |
| 5,393,550 | ||
|
|
|
|
|
|
|
|
|
|
|
|
|
| Consolidated |
12/31/2016 | 12/31/2015 | |||||||||||||
|
|
|
|
|
|
|
| Cost |
| Amortization |
| Net |
| Net |
Goodwill on Acquired Companies |
|
|
| 27,474,881 |
| (25,300,980) |
| 2,173,901 |
| 4,012,214 | ||||
Other Intangible Assets |
|
|
|
|
| 9,142,961 |
| (6,014,321) |
| 3,128,640 |
| 2,579,259 | ||
Acquisition and Development of Software (1) |
|
|
| 6,131,705 |
| (4,291,416) |
| 1,840,289 |
| 1,470,427 | ||||
Exclusivity Contracts for Provision of Banking Services(1) |
| 2,641,151 |
| (1,443,874) |
| 1,197,277 |
| 966,759 | ||||||
Others |
|
|
|
|
| 370,105 |
| (279,031) |
| 91,074 |
| 142,073 | ||
Total |
|
|
|
|
| 36,617,842 |
| (31,315,301) |
| 5,302,541 |
| 6,591,473 | ||
(1) In 2015, in the Bank and Consolidated, includes impairment losses (Note 32). | ||||||||||||||
Value in use is used as the base to evaluate goodwill on acquired companies with the impairment test. For this purpose, we estimate cash flow for a period of 5 years. We prepare cash flows considering several factors, including: (i) macro-economic projections, such as interest rates, inflation and exchange rates, among others, (ii) the performance and growth estimates of the Brazilian financial system, (iii) increased costs, returns, synergies and investment plans, (iv) the behavior of customers, and (v) the growth rate and long-term adjustments to cash flows on a continuous basis, as showed in the table below. These estimates rely on assumptions regarding the likelihood of future events, and changing certain factors could result in differing outcomes. The estimate of cash flows is based on valuations prepared by independent research company, which is reviewed annually or whenever there is an evidence of reduction on its recoverable value and approved by the Executive Board. | ||||||||||||||
75
|
|
|
|
|
|
|
|
|
| Commercial Bank | ||||
12/31/2016 | 12/31/2015 | |||||||||||||
Main Assumptions: |
|
|
|
|
|
|
|
| ||||||
Basis of Valuation |
|
|
|
|
| Value in Use: Cash Flows | ||||||||
Period of the Projections of Cash Flows(1) |
|
|
|
|
| 5 Years |
| 5 Years | ||||||
Growth Rate |
|
|
|
|
| 8.0% |
| 7.5% | ||||||
Discount Rate(2) |
|
|
|
|
| 15.2% |
| 15.2% | ||||||
|
|
|
|
|
|
|
|
|
|
|
|
|
|
|
(1) The projections of cash flow are prepared using internal budget and growth plans of the administration, based on historical data, market expectations and conditions such as industry growth, interest hate and inflation. | ||||||||||||||
(2) The discount rate is calculated based on the capital asset pricing model (CAPM).The discount rate before tax is 20.23 (12/31/2015 - 20.11%). | ||||||||||||||
Based on the assumptions described above, was not identified any impairment of goodwill. | ||||||||||||||
18. Money Market Funding and Borrowings and Onlendings | ||||||||||||||
a) Deposits | ||||||||||||||
|
|
|
|
|
|
|
|
|
|
|
|
|
| Bank |
|
|
|
|
|
|
|
|
|
|
|
| 12/31/2016 |
| 12/31/2015 |
Without | Up to 3 | From 3 to | Over 12 | |||||||||||
|
|
|
| Maturity |
| Months |
| 12 Months |
| Months |
| Total |
| Total |
Demand Deposits |
| 16,016,316 |
| - |
| - |
| - |
| 16,016,316 |
| 15,775,566 | ||
Savings Deposits |
| 36,051,476 |
| - |
| - |
| - |
| 36,051,476 |
| 35,984,837 | ||
Interbank Deposits |
| - |
| 11,183,904 |
| 51,659,695 |
| 2,253,495 |
| 65,097,094 |
| 61,909,663 | ||
Time Deposits |
| 97,421 |
| 24,754,854 |
| 18,942,309 |
| 47,900,183 |
| 91,694,767 |
| 87,433,187 | ||
Total |
| 52,165,213 |
| 35,938,758 |
| 70,602,004 |
| 50,153,678 |
| 208,859,653 |
| 201,103,253 | ||
Current |
|
|
|
|
|
|
|
|
| 158,705,975 |
| 152,344,715 | ||
Long-term |
|
|
|
|
|
|
|
|
| 50,153,678 |
| 48,758,538 | ||
|
|
|
|
|
|
|
|
|
|
|
|
|
| Consolidated |
|
|
|
|
|
|
|
|
|
|
|
| 12/31/2016 |
| 12/31/2015 |
Without | Up to 3 | From 3 to | Over 12 | |||||||||||
|
|
|
| Maturity |
| Months |
| 12 Months |
| Months |
| Total |
| Total |
Demand Deposits |
| 16,006,319 |
| - |
| - |
| - |
| 16,006,319 |
| 15,698,171 | ||
Savings Deposits |
| 36,051,476 |
| - |
| - |
| - |
| 36,051,476 |
| 35,984,837 | ||
Interbank Deposits(1) |
| - |
| 2,141,800 |
| 98,491 |
| 882,147 |
| 3,122,438 |
| 3,675,272 | ||
Time Deposits |
| 97,421 |
| 24,705,907 |
| 18,293,223 |
| 47,428,290 |
| 90,524,841 |
| 86,527,732 | ||
Other Deposits |
| 89 |
| - |
| - |
| - |
| 89 |
| - | ||
Total |
| 52,155,305 |
| 26,847,707 |
| 18,391,714 |
| 48,310,437 |
| 145,705,163 |
| 141,886,012 | ||
Current |
|
|
|
|
|
|
|
|
| 97,394,726 |
| 95,684,682 | ||
Long-term |
|
|
|
|
|
|
|
|
| 48,310,437 |
| 46,201,330 | ||
(1) On December 31, 2016, includes R$547,556 of Certificates of Interbank Deposit - CDI of hedge objects cash flow hedges (Note 6.b.V.b). | ||||||||||||||
b) Money Market Funding | ||||||||||||||
|
|
|
|
|
|
|
|
|
|
|
|
|
| Bank |
|
|
|
|
|
|
|
|
|
|
|
| 12/31/2016 |
| 12/31/2015 |
Up to 3 | From 3 to | Over 12 | ||||||||||||
|
|
|
|
|
| Months |
| 12 Months |
| Months |
| Total |
| Total |
Own Portfolio |
| 77,287,686 |
| 37,484,997 |
| 10,440,823 |
| 125,213,506 |
| 116,956,293 | ||||
Government Securities |
| 65,372,584 |
| 47,165 |
| - |
| 65,419,749 |
| 48,842,324 | ||||
Others |
| 11,915,102 |
| 37,437,832 |
| 10,440,823 |
| 59,793,757 |
| 68,113,969 | ||||
Third Parties |
| 14,799,595 |
| - |
| - |
| 14,799,595 |
| 10,827,806 | ||||
Linked to Trading Portfolio Operations |
| - |
| 2,828,488 |
| 28,722,133 |
| 31,550,621 |
| 19,914,633 | ||||
Total |
| 92,087,281 |
| 40,313,485 |
| 39,162,956 |
| 171,563,722 |
| 147,698,732 | ||||
Current |
|
|
|
|
|
|
| 132,400,766 |
| 99,365,655 | ||||
Long-term |
|
|
|
|
|
|
| 39,162,956 |
| 48,333,077 | ||||
76
|
|
|
|
|
|
|
|
|
| Consolidated |
|
|
|
|
|
|
|
| 12/31/2016 |
| 12/31/2015 |
Up to 3 | From 3 to | Over 12 | ||||||||
|
| Months |
| 12 Months |
| Months |
| Total |
| Total |
Own Portfolio |
| 75,984,031 |
| 37,153,269 |
| 10,440,823 |
| 123,578,123 |
| 104,217,992 |
Government Securities |
| 64,068,929 |
| 47,165 |
| - |
| 64,116,094 |
| 39,884,611 |
Debt Securities in Issue |
| 6,729,411 |
| 37,010,963 |
| 10,385,403 |
| 54,125,777 |
| 58,978,887 |
Others |
| 5,185,691 |
| 95,141 |
| 55,420 |
| 5,336,252 |
| 5,354,494 |
Third Parties |
| 5,794,993 |
| - |
| - |
| 5,794,993 |
| 10,827,806 |
Linked to Trading Portfolio Operations |
| - |
| 2,828,488 |
| 28,722,133 |
| 31,550,621 |
| 19,914,633 |
Total |
| 81,779,024 |
| 39,981,757 |
| 39,162,956 |
| 160,923,737 |
| 134,960,431 |
Current |
|
|
|
|
|
|
| 121,760,781 |
| 86,627,754 |
Long-term |
|
|
|
|
|
|
| 39,162,956 |
| 48,332,677 |
c) Funds from Acceptance and Issuance of Securities | ||||||||||
|
|
|
|
|
|
|
|
|
| Bank |
|
|
|
|
|
|
|
| 12/31/2016 |
| 12/31/2015 |
Up to 3 | From 3 to | Over 12 | ||||||||
|
| Months |
| 12 Months |
| Months |
| Total |
| Total |
Real Estate Credit Notes, Mortgage Notes, Credit and Similar Notes |
| 17,250,014 |
| 53,400,023 |
| 21,453,818 |
| 92,103,855 |
| 81,168,337 |
Real Estate Credit Notes - LCI(1) |
| 7,258,633 |
| 15,140,896 |
| 1,583,900 |
| 23,983,429 |
| 23,795,322 |
Agribusiness Credit Notes - LCA (2) |
| 1,712,823 |
| 4,776,436 |
| 491,585 |
| 6,980,844 |
| 2,096,616 |
Treasury Bills(3) |
| 8,278,558 |
| 33,482,691 |
| 19,378,333 |
| 61,139,582 |
| 55,276,399 |
Securities Issued Abroad |
| 4,613,287 |
| 3,059,884 |
| 49,031 |
| 7,722,202 |
| 13,472,296 |
Eurobonds |
| 4,613,287 |
| 3,059,884 |
| 49,031 |
| 7,722,202 |
| 13,472,296 |
Funding by Structured Operations Certificates |
| 340,035 |
| 772,248 |
| 123,308 |
| 1,235,591 |
| 784,952 |
Total |
| 22,203,336 |
| 57,232,155 |
| 21,626,157 |
| 101,061,648 |
| 95,425,585 |
Current |
|
|
|
|
|
|
| 79,435,491 |
| 44,201,390 |
Long-term |
|
|
|
|
|
|
| 21,626,157 |
| 51,224,195 |
|
|
|
|
|
|
|
|
|
| Consolidated |
|
|
|
|
|
|
|
| 12/31/2016 |
| 12/31/2015 |
Up to 3 | From 3 to | Over 12 | ||||||||
|
| Months |
| 12 Months |
| Months |
| Total |
| Total |
Exchange Acceptances |
| 422,734 |
| 131,077 |
| 536,444 |
| 1,090,255 |
| 984,262 |
Real Estate Credit Notes, Mortgage Notes, | ||||||||||
Credit and Similar Notes |
| 17,511,958 |
| 54,411,049 |
| 23,199,019 |
| 95,122,026 |
| 84,606,604 |
Real Estate Credit Notes - LCI(1) |
| 7,258,633 |
| 15,140,896 |
| 1,583,900 |
| 23,983,429 |
| 23,796,209 |
Agribusiness Credit Notes - LCA(2) |
| 1,712,823 |
| 4,776,436 |
| 491,585 |
| 6,980,844 |
| 2,096,616 |
Treasury Bills(3) (4) |
| 8,540,502 |
| 34,493,717 |
| 21,123,534 |
| 64,157,753 |
| 58,713,779 |
Securities Issued Abroad |
| 4,613,287 |
| 3,059,884 |
| 49,031 |
| 7,722,202 |
| 13,472,296 |
Eurobonds |
| 4,613,287 |
| 3,059,884 |
| 49,031 |
| 7,722,202 |
| 13,472,296 |
Funding by Structured Operations Certificates |
| 340,035 |
| 772,248 |
| 123,308 |
| 1,235,591 |
| 784,952 |
Total |
| 22,888,014 |
| 58,374,258 |
| 23,907,802 |
| 105,170,074 |
| 99,848,114 |
Current |
|
|
|
|
|
|
| 81,262,272 |
| 46,814,955 |
Long-term |
|
|
|
|
|
|
| 23,907,802 |
| 53,033,159 |
|
|
|
|
|
|
|
|
|
|
|
(1) Real Estate Credit Notes are fixed income securities guaranteed by mortgages and mortgage-backed securities or liens on property. On December 31, 2016, has maturities between 2017 to 2026 (On December 31, 2015 - maturities between 2016 to 2020). | ||||||||||
(2) Agribusiness credit notes are fixed income securities which resources are allocated to the promotion of agribusiness, indexed between 87.0% to 94.0% of CDI. On December 31, 2016, has maturities between 2017 to 2018 (On December 31, 2015 - maturities between 2016 to 2018). | ||||||||||
(3) The main features of the Treasury Bills are the minimum period of two years, minimum notional of R$300 and permission for early redemption of only 5% of the issued amount. On December 31, 2016, has maturities between 2017 to 2025 (On December 31, 2015 - maturities between 2016 to 2025). | ||||||||||
(4) On December 31, 2016, includes the value of R$1,769,348 of Financial Bills cash flow "hedge" object (Note 6.b.V.b) | ||||||||||
77
|
|
|
|
|
|
|
|
|
|
|
|
|
| Bank/Consolidated |
12/31/2016 | 12/31/2015 | |||||||||||||
Eurobonds |
| Issuance |
| Maturity |
| Currency |
| Interest Rate (p.a) |
| Total |
| Total | ||
Eurobonds |
| February and |
| February-17 |
| US$ |
| 4.6% |
| 4,116,309 |
| 5,025,982 | ||
Eurobonds(1) |
| September-14 |
| September-16 |
| JPY |
| 1.8% |
| - |
| 35,743 | ||
Eurobonds |
| December-15 |
| July-16 |
| US$ |
| 2.7% |
| - |
| 195,254 | ||
Eurobonds |
| January and June-11 |
| January-16 |
| US$ |
| 4.3% |
| - |
| 3,268,431 | ||
Eurobonds(1) |
| March and May-13 | March-16 | R$ | 8.0% |
| - |
| 1,255,841 | |||||
Eurobonds(1) |
| April-12 | April-16 | CHF | 3.3% |
| - |
| 603,889 | |||||
Eurobonds(1) |
| April-12 | April-16 | CLP | 4.6% |
| - |
| 135,388 | |||||
Eurobonds |
| June-15 | January-16 | US$ | 1.1% |
| - |
| 173,487 | |||||
Eurobonds |
| July-15 | January-16 | US$ | 1.1% |
| - |
| 839,956 | |||||
Eurobonds |
| August-15 | february-16 | US$ | 1.2% |
| - |
| 510,082 | |||||
Eurobonds |
| August-15 | february-16 | US$ | 1.1% |
| - |
| 291,345 | |||||
Eurobonds |
| December-15 |
| June-16 |
| EUR |
| 1.0% |
| - |
| 170,053 | ||
Eurobonds |
| February-15 |
| February-18 |
| US$ |
| 2.2% |
| 39,727 |
| 47,598 | ||
Eurobonds |
| July-15 |
| July-20 |
| US$ |
| 3.0% |
| 10,206 |
| 11,877 | ||
Eurobonds |
| February-16 |
| March-17 |
| US$ |
| 2.5% |
| 39,940 |
| - | ||
Eurobonds |
| June-16 |
| July-17 |
| US$ |
| 1.0% |
| 475,424 |
| - | ||
Eurobonds |
| April-16 |
| April-17 |
| US$ |
| 1.0% |
| 111,059 |
| - | ||
Eurobonds |
| July-16 |
| July-17 |
| US$ |
| 2.0% |
| 761,129 |
| - | ||
Eurobonds |
| August-16 |
| August-17 |
| US$ |
| 2.0% |
| 185,533 |
| - | ||
Eurobonds |
| September-16 |
| September-17 |
| US$ |
| 2.0% |
| 195,206 |
| - | ||
Eurobonds |
| September-16 |
| March-17 |
| US$ |
| 1.4% |
| 50,045 |
| - | ||
Eurobonds |
| September-16 |
| September-17 |
| US$ |
| 2.1% |
| 35,562 |
| - | ||
Eurobonds |
| October-16 |
| January-17 |
| US$ |
| 0.9% |
| 32,422 |
| - | ||
Eurobonds |
| November-16 |
| February-17 |
| US$ |
| 0.9% |
| 93,498 |
| - | ||
Eurobonds |
| December-16 |
| March-17 |
| US$ |
| 0.9% |
| 62,219 |
| - | ||
Eurobonds |
| November-16 |
| May-17 |
| US$ |
| 1.4% |
| 34,720 |
| - | ||
Eurobonds |
| December-16 |
| June-17 |
| US$ |
| 1.4% |
| 62,105 |
| - | ||
Eurobonds |
| October-16 |
| October-17 |
| US$ |
| 2.2% |
| 249,214 |
| - | ||
Eurobonds |
| October-16 |
| October-17 |
| EUR |
| 0.4% |
| 37,507 |
| - | ||
Eurobonds |
| November-16 |
| November-17 |
| US$ |
| 2.0% |
| 130,791 |
| - | ||
Eurobonds |
| November-16 |
| November-17 |
| US$ |
| 1.8% |
| 138,605 |
| - | ||
Eurobonds |
| December-16 |
| December-17 |
| US$ |
| 1.8% |
| 48,448 |
| - | ||
Others |
|
|
|
|
|
|
|
|
| 812,533 |
| 907,370 | ||
Total |
|
|
|
|
|
|
|
|
|
| 7,722,202 |
| 13,472,296 | |
|
|
|
|
|
|
|
|
|
|
|
|
|
|
|
(1) On December 31, 2015, includes R$1,995,118 in cash flow hedge operations, being R$603,889 indexed on foreign currency - Swiss Franc, R$135,388 in Chilean Peso and of R$1,255,841 indexed in Real (Note 6.b.V.b); and the amount of R$35,743 for market risk hedge operations indexed to foreign currency - YEN (Note 6.b.V.a). | ||||||||||||||
d) Money Market Funding Expenses | ||||||||||||||
|
|
|
|
|
|
|
|
|
| Bank |
|
|
| Consolidated |
01/01 to | 0/01 to | 01/01 to | 0/01 to | |||||||||||
|
|
|
|
|
|
|
| 12/31/2016 |
| 12/31/2015 |
| 12/31/2016 |
| 12/31/2015 |
Time Deposits(1) |
| 7,363,350 |
| 16,056,205 |
| 7,262,634 |
| 16,025,894 | ||||||
Savings Deposits |
| 2,726,421 |
| 2,745,514 |
| 2,726,421 |
| 2,745,514 | ||||||
Interbank Deposits |
| 9,006,721 |
| 4,230,068 |
| 393,412 |
| 402,769 | ||||||
Money Market Funding |
| 24,170,391 |
| 18,833,392 |
| 21,646,664 |
| 15,562,251 | ||||||
Upgrade and Provisions Interest and Pension Plans and Capitalization |
| - |
| - |
| 129,576 |
| 121,833 | ||||||
Others(2) |
| 17,776,019 |
| 13,918,572 |
| 18,387,475 |
| 14,502,923 | ||||||
Total |
| 61,042,902 |
| 55,783,751 |
| 50,546,182 |
| 49,361,184 | ||||||
|
|
|
|
|
|
|
|
|
|
|
|
|
|
|
(1) In the Bank and Consolidated, includes the record of interest in the amount of R$501,748 (2015 - R$503,290) related to the issuance of the Debt Instrument Eligible Tier I and II Capital (Note 21). | ||||||||||||||
(2) Includes, mainly, expense funds from acceptance and issuance of securities. | ||||||||||||||
78
e) Borrowings and Onlendings | ||||||||||||||
|
|
|
|
|
|
|
|
|
|
|
|
|
| Bank |
|
|
|
|
|
|
|
|
|
|
|
| 12/31/2016 |
| 12/31/2015 |
Up to 3 | From 3 to | Over 12 | ||||||||||||
|
|
|
|
|
| Months |
| 12 Months |
| Months |
| Total |
| Total |
Domestic Borrowings |
|
|
|
|
| - |
| - |
| - |
| - |
| 4,333 |
Foreign Borrowings |
|
|
| 10,741,630 |
| 19,097,713 |
| 1,638,173 |
| 31,477,516 |
| 36,683,300 | ||
Import and Export Financing Lines(1) |
| 10,741,630 |
| 19,097,713 |
| 1,638,173 |
| 31,477,516 |
| 35,792,969 | ||||
Other Credit Lines |
|
|
| - |
| - |
| - |
| - |
| 890,331 | ||
Domestic Onlendings |
|
|
| 1,214,728 |
| 3,766,379 |
| 11,821,538 |
| 16,802,645 |
| 16,262,891 | ||
Total |
|
|
| 11,956,358 |
| 22,864,092 |
| 13,459,711 |
| 48,280,161 |
| 52,950,524 | ||
Current |
|
|
|
|
|
|
|
|
| 34,820,450 |
| 38,515,974 | ||
Long-term |
|
|
|
|
|
|
|
|
| 13,459,711 |
| 14,434,550 | ||
|
|
|
|
|
|
|
|
|
|
|
|
|
| Consolidated |
|
|
|
|
|
|
|
|
|
|
|
| 12/31/2016 |
| 12/31/2015 |
Up to 3 | From 3 to | Over 12 | ||||||||||||
|
|
|
|
|
| Months |
| 12 Months |
| Months |
| Total |
| Total |
Domestic Borrowings |
|
|
|
|
| 10,989 |
| 30,678 |
| 404,233 |
| 445,900 |
| 78,917 |
Foreign Borrowings |
|
|
| 9,418,231 |
| 19,097,713 |
| 1,638,173 |
| 30,154,117 |
| 36,683,512 | ||
Import and Export Financing Lines(1) |
| 9,418,231 |
| 19,097,713 |
| 1,638,173 |
| 30,154,117 |
| 35,793,181 | ||||
Other Credit Lines |
|
|
| - |
| - |
| - |
| - |
| 890,331 | ||
Domestic Onlendings |
|
|
| 1,214,728 |
| 3,766,379 |
| 11,821,538 |
| 16,802,645 |
| 16,262,891 | ||
Total |
|
|
| 10,643,948 |
| 22,894,770 |
| 13,863,944 |
| 47,402,662 |
| 53,025,320 | ||
Current |
|
|
|
|
|
|
|
|
| 33,538,718 |
| 38,590,770 | ||
Long-term |
|
|
|
|
|
|
|
|
| 13,863,944 |
| 14,434,550 | ||
(1) Includes the amount of R$816,759 (On December 31, 2015 - R$3,476,825), object obligations by "hedge" of market risk (Note 6.b.V.a ) and R$1,332,972 of obligations objects of cash flow "hedge" (Note 6.b.V.b.) | ||||||||||||||
Bank and Consolidated, export and import financing lines are funds raised from foreign banks, for use in commercial foreign exchange transactions, related to the discounting of export bills and export and import pre-financing, falling due through 2019 (12/31/15 - through 2019) and subject to financial charges corresponding to exchange rate changes plus interest ranging from 0.6% p.a. to 32.44% p.a. (12/31/15 - 0.3% p.a. to 7.4% p.a.). | ||||||||||||||
Domestic onlendings - official institutions are subject to financial charges corresponding to the TJLP, exchange variation of the currency basket of the BNDES, or US dollar exchange variation, plus interest rate in accordance with the operating policies of the BNDES System. | ||||||||||||||
19. Tax and Social Security | ||||||||||||||
Tax and social security payables comprise taxes payable and amounts being challenged in the courts. | ||||||||||||||
|
|
|
|
|
|
|
|
|
| Bank |
|
|
| Consolidated |
|
|
|
|
|
|
|
| 12/31/2016 |
| 12/31/2015 |
| 12/31/2016 |
| 12/31/2015 |
Provision for Tax Risks and Legal Obligations (Note 23.b) |
| 4,522,224 |
| 4,475,644 |
| 7,080,310 |
| 6,973,763 | ||||||
Reserve for Tax Contingencies - Responsibility of Former Controlling (Note 23.i) |
| 719,574 |
| 698,622 |
| 810,383 |
| 785,837 | ||||||
Deferred Tax Liabilities |
| 1,809,299 |
| 1,092,959 |
| 2,265,591 |
| 1,642,819 | ||||||
Provision for Taxes and Contributions on Income |
| - |
| - |
| 33,113 |
| 104,667 | ||||||
Taxes Payable |
| 1,064,799 |
| 722,182 |
| 1,404,210 |
| 1,037,020 | ||||||
Total |
| 8,115,896 |
| 6,989,407 |
| 11,593,607 |
| 10,544,106 | ||||||
Current |
|
|
|
|
| 1,891,028 |
| 2,120,847 |
| 2,442,614 |
| 2,724,378 | ||
Long-term |
|
|
|
|
| 6,224,868 |
| 4,868,560 |
| 9,150,993 |
| 7,819,728 | ||
a) Nature and Origin of Deferred Tax Liabilities | ||||||||||||||
|
|
|
|
|
|
|
|
|
|
|
|
|
| Bank |
|
|
|
|
|
|
|
| 12/31/2015 |
| Recognition |
| Realization |
| 12/31/2016 |
Adjustment to Fair Value of Trading Securities and Derivatives(1) |
| 999,137 |
| - |
| (33,387) |
| 965,750 | ||||||
Adjustment to Fair Value of Available-for-Sale Securities and Cash Flow Hedge(1) |
| 61,270 |
| 774,927 |
| - |
| 836,197 | ||||||
Excess Depreciation of Leased Assets |
| 7,188 |
| - |
| (411) |
| 6,777 | ||||||
Others |
|
|
|
|
| 25,364 |
| - |
| (24,789) |
| 575 | ||
Total |
|
|
|
|
| 1,092,959 |
| 774,927 |
| (58,587) |
| 1,809,299 | ||
79
|
|
|
|
|
|
|
|
|
|
|
|
|
| Bank |
|
|
|
|
|
|
|
| 12/31/2014 |
| Recognition |
| Realization |
| 12/31/2015 |
Adjustment to Fair Value of Trading Securities and Derivatives(1) |
| 900,251 |
| 99,046 |
| (160) |
| 999,137 | ||||||
Adjustment to Fair Value of Available-for-Sale Securities and Cash Flow Hedge(1) |
| 263,742 |
| - |
| (202,472) |
| 61,270 | ||||||
Excess Depreciation of Leased Assets |
|
|
| 7,864 |
| - |
| (676) |
| 7,188 | ||||
Others |
|
|
|
|
| 18,447 |
| 6,917 |
| - |
| 25,364 | ||
Total |
|
|
|
|
| 1,190,304 |
| 105,963 |
| (203,308) |
| 1,092,959 | ||
|
|
|
|
|
|
|
| Acquisition/ |
|
|
|
|
| Consolidated |
|
|
|
|
|
| 12/31/2015 |
| Investment(2) |
| Recognition |
| Realization |
| 12/31/2016 |
Adjustment to Fair Value of Trading Securities and Derivatives(1) |
| 1,057,929 |
| - |
| 3,134 |
| (91,742) |
| 969,321 | ||||
Adjustment to Fair Value of Available-for-Sale Securities and Cash Flow Hedge(1) |
| 65,740 |
| - |
| 846,364 |
| (19,133) |
| 892,971 | ||||
Excess Depreciation of Leased Assets |
| 485,278 |
| 800 |
| - |
| (100,951) |
| 385,127 | ||||
Others |
|
|
| 33,872 |
| - |
| 9,868 |
| (25,568) |
| 18,172 | ||
Total |
|
|
| 1,642,819 |
| 800 |
| 859,366 |
| (237,394) |
| 2,265,591 | ||
|
|
|
|
|
|
|
|
|
|
|
|
|
| Consolidated |
|
|
|
|
|
|
|
| 12/31/2015 |
| Recognition |
| Realization |
| 12/31/2016 |
Adjustment to Fair Value of Trading Securities and Derivatives(1) |
| 925,433 |
| 133,656 |
| (1,160) |
| 1,057,929 | ||||||
Adjustment to Fair Value of Available-for-Sale Securities and Cash Flow Hedge(1) |
| 267,350 |
| 937 |
| (202,547) |
| 65,740 | ||||||
Excess Depreciation of Leased Assets |
|
|
| 588,035 |
| - |
| (102,757) |
| 485,278 | ||||
Others |
|
|
|
|
| 21,598 |
| 15,351 |
| (3,077) |
| 33,872 | ||
Total |
|
|
|
|
| 1,802,416 |
| 149,944 |
| (309,541) |
| 1,642,819 | ||
(1) Includes tax credits IRPJ, CSLL, PIS and Cofins. | ||||||||||||||
(2) Acquisition and merger of equity interest (Note 15). | ||||||||||||||
b) Expected Realization of Deferred Tax Liabilities | ||||||||||||||
|
|
|
|
|
|
|
|
|
|
|
|
|
| Bank |
|
|
|
|
|
|
|
|
|
|
|
|
|
| 12/31/2016 |
Temporary Differences | ||||||||||||||
Year |
|
|
|
|
|
|
| IRPJ |
| CSLL |
| PIS/Cofins |
| Total |
2017 |
|
|
|
|
| 333,324 |
| 264,666 |
| 64,499 |
| 662,489 | ||
2018 |
|
|
|
|
| 204,191 |
| 161,546 |
| 39,391 |
| 405,128 | ||
2019 |
|
|
|
|
| 204,191 |
| 121,159 |
| 39,391 |
| 364,741 | ||
2020 |
|
|
|
|
| 34,998 |
| 20,999 |
| 6,827 |
| 62,824 | ||
2021 |
|
|
|
|
| 34,998 |
| 20,999 |
| 6,827 |
| 62,824 | ||
2022 to 2024 |
|
|
|
|
| 104,993 |
| 62,996 |
| 20,481 |
| 188,470 | ||
2025 to 2026 |
|
|
|
|
| 34,998 |
| 20,999 |
| 6,826 |
| 62,823 | ||
Total |
|
|
|
|
| 951,693 |
| 673,364 |
| 184,242 |
| 1,809,299 | ||
|
|
|
|
|
|
|
|
|
|
|
|
|
| Consolidated |
|
|
|
|
|
|
|
|
|
|
|
|
|
| 12/31/2016 |
Temporary Differences | ||||||||||||||
Year |
|
|
|
|
|
|
| IRPJ |
| CSLL |
| PIS/Cofins |
| Total |
2017 |
|
|
|
|
| 413,357 |
| 271,000 |
| 65,195 |
| 749,552 | ||
2018 |
|
|
|
|
| 278,556 |
| 165,637 |
| 40,088 |
| 484,281 | ||
2019 |
|
|
|
|
| 257,698 |
| 124,206 |
| 40,067 |
| 421,971 | ||
2020 |
|
|
|
|
| 86,954 |
| 23,244 |
| 7,503 |
| 117,701 | ||
2021 |
|
|
|
|
| 86,954 |
| 23,244 |
| 7,503 |
| 117,701 | ||
2022 to 2024 |
|
|
|
|
| 212,444 |
| 69,543 |
| 22,446 |
| 304,433 | ||
2025 to 2026 |
|
|
|
|
| 39,128 |
| 23,342 |
| 7,482 |
| 69,952 | ||
Total |
|
|
|
|
| 1,375,091 |
| 700,216 |
| 190,284 |
| 2,265,591 | ||
80
20. Subordinated Debts | ||||||||||||||
Consist of securities issued according to Bacen. Rules, which are used as Tier II Regulatory Capital for calculating operating limits, according to the proportion defined by CMN Resolution 4,192 of March 1, 2013, and the amendments introduced by Resolution 4,278 of October 31, 2013. | ||||||||||||||
|
|
|
|
|
|
|
|
|
|
|
|
|
| Bank/Consolidated |
|
|
|
|
|
|
|
|
|
|
|
| 12/31/2016 |
| 12/31/2015 |
Subordinated Deposit Certificates |
| Issuance |
| Maturity(1) |
| Amount (Million) |
| Interest Rate (p.a.) |
| Total |
| Total | ||
Subordinated Deposit Certificates |
| June-06 |
| July-16 |
| R$1,500 |
| 105.0% CDI |
| - |
| 4,196,347 | ||
Subordinated Deposit Certificates |
| October-06 |
| September-16 |
| R$850 |
| 104.5% CDI |
| - |
| 2,266,789 | ||
Subordinated Deposit Certificates |
| July-06 to October-06 |
| July-16 |
| R$447 |
| 104.5% CDI |
| - |
| 1,230,505 | ||
Subordinated Deposit Certificates |
| May-08 |
| May-15 to May-18 |
| R$283 |
| CDI (2) |
| 98,378 |
| 114,467 | ||
Subordinated Deposit Certificates |
| May-08 to June-08 |
| May-15 to June-18 |
| R$268 |
| IPCA(3) |
| 367,868 |
| 289,196 | ||
Total |
|
|
|
|
|
|
|
|
|
| 466,246 |
| 8,097,304 | |
Current |
|
|
|
|
|
|
|
|
| - |
| 7,685,328 | ||
Long Term |
|
|
|
|
|
|
|
|
| 466,246 |
| 411,976 | ||
|
|
|
|
|
|
|
|
|
|
|
|
|
|
|
(1) Subordinated deposit certificates issued with yield paid at the end of the term together with the principal. | ||||||||||||||
(2) Indexed between 100% and 112% of CDI. | ||||||||||||||
(3) Indexed to the IPCA plus interest of 8.3% p.a. to 8.4% p.a. | ||||||||||||||
21. Debt Instruments Eligible to Compose Capital | ||||||||||||||
Details of the balance of Debt Instruments Eligible to Compose Capital for the issuance of equity instruments to compose the Tier I and Tier II of Regulatory Capital due to the Capital Optimization Plan, are as follows: | ||||||||||||||
|
|
|
|
|
|
|
|
|
|
|
|
|
| Bank/Consolidated |
|
|
|
|
|
|
|
|
|
|
|
| 12/31/2016 |
| 12/31/2015 |
Debt Instruments Eligible to Compose Capital |
| Issuance |
| Maturity |
| Amount (Million) |
| Interest Rate (p.a.)(3) |
| Total |
| Total | ||
Tier I(1) |
| January - 14 |
| No Maturity (Perpetual) |
| R$3,000 |
| 7.375% |
| 4,127,184 |
| 4,944,625 | ||
Tier II(2) |
| January - 14 |
| January - 24 |
| R$3,000 |
| 6.000% |
| 4,187,615 |
| 5,017,520 | ||
Total |
|
|
|
|
|
|
|
|
| 8,314,799 |
| 9,962,145 | ||
Current |
|
|
|
|
|
|
|
|
| 114,104 |
| 218,009 | ||
Long-term |
|
|
|
|
|
|
|
|
| 8,200,695 |
| 9,744,136 | ||
(1) Interest rate paid quarterly from April 29, 2014. | ||||||||||||||
(2) Interest rate paid semiannually from July 29, 2014. | ||||||||||||||
(3) The effective interest rate, considering the Taxes (IR) made by the issuer, is 8.676% and 7.059% for instruments Tier I and Tier II, respectively. | ||||||||||||||
81
22. Other Payables - Others | ||||||||||||||
|
|
|
|
|
|
|
|
|
|
|
|
|
|
|
Bank | Consolidated | |||||||||||||
|
|
|
|
|
|
|
| 12/31/2016 |
| 12/31/2015 |
| 12/31/2016 |
| 12/31/2015 |
Provision Technical for Pension and Capitalization Operations |
| - |
| - |
| 1,681,252 |
| 1,606,820 | ||||||
Payables for Credit Cards |
|
|
|
|
|
| 24,446,860 |
| 21,161,942 |
| 24,651,578 |
| 21,161,945 | |
Provision for Legal and Administrative Proceedings - Labor and Civil (Note 23.b) |
| 4,653,511 |
| 4,261,045 |
| 5,014,004 |
| 4,514,269 | ||||||
Employee Benefit Plans (Note 35) |
|
|
|
|
|
| 2,696,848 |
| 2,696,653 |
| 2,710,626 |
| 2,696,653 | |
Payables for Acquisition of Assets and Rights |
|
|
| 22,588 |
| 21,521 |
| 22,588 |
| 21,521 | ||||
Reserve for Legal and Administrative Proceedings -Responsibility of Former Controlling Stockholders (Note 23.i) |
| 4,542 |
| 4,136 |
| 4,542 |
| 4,136 | ||||||
Accrued Liabilities |
|
|
|
|
|
|
|
|
|
|
|
|
| |
Personnel Expenses |
|
|
|
|
|
| 1,432,366 |
| 1,545,400 |
| 1,564,155 |
| 1,676,134 | |
Administrative Expenses |
|
|
|
|
|
| 301,877 |
| 242,810 |
| 422,133 |
| 263,383 | |
Others Payments |
|
|
|
|
|
| 35,135 |
| 62,414 |
| 159,652 |
| 159,425 | |
Creditors for Unreleased Funds |
|
|
|
|
| 482,091 |
| 573,869 |
| 482,091 |
| 573,869 | ||
Provision of Payment Services |
|
|
|
|
| 460,432 |
| 357,001 |
| 460,432 |
| 357,001 | ||
Suppliers |
|
|
|
|
| 290,281 |
| 318,148 |
| 922,082 |
| 847,439 | ||
Others(1) |
|
|
|
|
|
| 3,365,507 |
| 3,927,127 |
| 6,433,165 |
| 6,240,518 | |
Total |
|
|
|
|
| 38,192,038 |
| 35,172,066 |
| 44,528,300 |
| 40,123,113 | ||
Current |
|
|
|
|
| 32,547,860 |
| 29,651,285 |
| 38,143,523 |
| 33,880,803 | ||
Long-term |
|
|
|
|
| 5,644,178 |
| 5,520,781 |
| 6,384,777 |
| 6,242,310 | ||
(1) At the consolidated, includes the obligation concerning the transfer of the FGB's Portfolio from Zurich Santander Brasil Seguros e Previdência S.A. for Evidence, the assets and reserves of that portfolio now being managed by Evidence from February 2, 2015 (Note 15). | ||||||||||||||
23. Provisions, Contingent Assets and Liabilities and Legal Obligations - Tax and Social Security | ||||||||||||||
a) Contingent Assets | ||||||||||||||
Bank and Consolidated, on December 31, 2016 and 2015, no contingent assets were accounted (Note 3.q). | ||||||||||||||
b) Balance Sheet of Provisions for Judicial and Administrative Proceedings and Legal Obligations by Nature | ||||||||||||||
|
|
|
|
|
|
|
|
|
| Bank |
|
|
| Consolidated |
|
|
|
|
|
|
|
| 12/31/2016 |
| 12/31/2015 |
| 12/31/2016 |
| 12/31/2015 |
Reserve for Tax Contingencies and Legal Obligations (Note 19) |
| 4,522,224 |
| 4,475,644 |
| 7,080,310 |
| 6,973,763 | ||||||
Accrual for Legal and Administrative Proceedings - Labor and Civil (Note 22) |
| 4,653,511 |
| 4,261,045 |
| 5,014,004 |
| 4,514,269 | ||||||
Labor |
| 2,988,869 |
| 2,422,387 |
| 3,146,383 |
| 2,505,553 | ||||||
Civil |
| 1,664,642 |
| 1,838,658 |
| 1,867,621 |
| 2,008,716 | ||||||
Total |
|
|
|
|
| 9,175,735 |
| 8,736,689 |
| 12,094,314 |
| 11,488,032 | ||
c) Change in Accrual for Judicial and Administrative Proceedings and Legal Obligations | ||||||||||||||
|
|
|
|
|
|
|
|
|
|
|
|
|
| Bank |
01/01 to | 01/01 to | |||||||||||||
|
|
|
|
|
|
|
| 12/31/2016 |
|
|
|
|
| 12/31/2015 |
|
| Tax |
| Labor |
| Civil |
| Tax |
| Labor |
| Civil | ||
Balance at Beginning | 4,475,644 |
| 2,422,387 |
| 1,838,658 |
| 11,383,052 |
| 1,914,476 |
| 1,612,518 | |||
Recognition Net of Reversal(1) (2) | (140,897) |
| 1,224,189 |
| 368,919 |
| (6,897,586) |
| 1,260,233 |
| 716,872 | |||
Inflation Adjustment |
| 361,752 |
| 296,241 |
| 167,757 |
| 385,032 |
| 262,234 |
| 162,461 | ||
Write-offs Due to Payment (2) (3) |
| (172,776) |
| (1,122,652) |
| (710,692) |
| (365,230) |
| (1,101,029) |
| (653,193) | ||
Others |
| (1,499) |
| 168,704 |
| - |
| (29,624) |
| 86,473 |
| - | ||
Balance at End |
| 4,522,224 |
| 2,988,869 |
| 1,664,642 |
| 4,475,644 |
| 2,422,387 |
| 1,838,658 | ||
Escrow Deposits - Other Receivables |
| 1,155,001 |
| 543,795 |
| 442,330 |
| 1,701,013 |
| 323,878 |
| 361,268 | ||
Escrow Deposits - Securities |
| 13,584 |
| 16,944 |
| 9,479 |
| 29,479 |
| 6,182 |
| 5,159 | ||
Total Escrow Deposits(4) |
| 1,168,585 |
| 560,739 |
| 451,809 |
| 1,730,492 |
| 330,060 |
| 366,427 | ||
82
|
|
|
|
|
|
|
|
|
|
|
|
|
| Consolidated |
01/01 to | 01/01 to | |||||||||||||
|
|
|
|
|
|
|
| 12/31/2016 |
|
|
|
|
| 12/31/2015 |
| Tax |
| Labor |
| Civil |
| Tax |
| Labor |
| Civil | |||
Balance at Beginning |
| 6,973,763 |
| 2,505,553 |
| 2,008,716 |
| 14,205,897 |
| 1,984,590 |
| 1,776,857 | ||
Recognition Net of Reversal(1) (2) | (255,470) |
| 1,318,798 |
| 512,798 |
| (6,808,554) |
| 1,301,818 |
| 851,342 | |||
Inflation Adjustment |
| 550,272 |
| 308,401 |
| 186,976 |
| 624,487 |
| 274,021 |
| 190,656 | ||
Write-offs Due to Payment (2) (3) |
| (190,093) |
| (1,159,944) |
| (850,988) |
| (1,004,503) |
| (1,142,738) |
| (810,140) | ||
Acquisitions/Merger/Reclassification of Societary Equity (Note 15) |
| - |
| 3,934 |
| 6,692 |
| (13,939) |
| 349 |
| 1 | ||
Others |
| 1,838 |
| 169,641 |
| 3,427 |
| (29,625) |
| 87,513 |
| - | ||
Balance at End |
| 7,080,310 |
| 3,146,383 |
| 1,867,621 |
| 6,973,763 |
| 2,505,553 |
| 2,008,716 | ||
Escrow Deposits - Other Receivables | 2,511,454 |
| 564,605 |
| 451,990 |
| 3,120,773 |
| 328,361 |
| 368,596 | |||
Escrow Deposits - Securities |
| 14,439 |
| 16,944 |
| 9,503 |
| 30,816 |
| 6,182 |
| 5,166 | ||
Total Escrow Deposits(4) |
| 2,525,893 |
| 581,549 |
| 461,493 |
| 3,151,589 |
| 334,543 |
| 373,762 | ||
|
|
|
|
|
|
|
|
|
|
|
|
|
|
|
(1)Tax risks include the constitutions of tax provisions related to judicial and administrative proceedings and legal obligations, recorded tax expenses, other operating income and other operating expenses IR and CSLL. | ||||||||||||||
(2) In 2015, includes the effects of the reversal of the provision for Cofins (Note 23.e). | ||||||||||||||
(3) In 2015, included the amount for anticipations of CSLL that reduces the value of the tax provision due to the questioning of the increase in the CSLL rate imposed by MP 413/2008, converted into Law 11,727 / 2008 (Note 23.e). | ||||||||||||||
(4) Refers to the values of escrow deposits, limited to the amount of the provision for contingency and don't include the escrow deposit, for possible contingencies and/or remote and appeal deposits. | ||||||||||||||
d) Provisions for Contingent Civil, Labor, Tax and Social Security | ||||||||||||||
Banco Santander and its subsidiaries are involved in litigation and administrative tax, labor and civil proceedings arising in the normal course of its activities. | ||||||||||||||
The provisions were constituted based on the nature, complexity and history of actions and evaluation loss of company stock businesses based on the opinions of internal and external legal advisors. The Santander has the policy to accrue the full amount of lawsuits whose loss valuation is probable. The legal obligation statutory tax and social security were fully recognized in the financial statements. | ||||||||||||||
Management understands that the provisions recorded are sufficient to meet legal obligations and losses from lawsuits and administrative proceedings as follows: | ||||||||||||||
e) Lawsuits and Administrative Tax and Social Security | ||||||||||||||
The main lawsuits related to tax legal obligations, recorded in the line "Tax Liabilities - Current", fully registered as obligation, are described below: | ||||||||||||||
PIS and Cofins - R$1,669,219 Bank and R$3,303,368 Consolidated (12/31/2015 - R$1,530,261 Bank and R$3,026,674 Consolidated): Banco Santander and its companies filed lawsuits seeking to invalidate the provisions of Law 9,718/1998, pursuant to which PIS and Cofins taxes must be levied on all revenues of legal entities. Prior to the enactment of such provisions, which have been overruled by "Superior Tribunal Federal" - "STF" "Supreme Court" decisions for nonfinancial institutions, PIS and Cofins were levied only on revenues from services and sale of goods. On April 23, 2015, Supreme Court decision was published admitting the extraordinary resort interposed by the Union related to PIS and denying the proceed for the extraordinary resort interposed by Public Ministry concerning to the Cofins, in this case, been exclusively applicable to Banco Santander suit. On May 28, 2015 in Supreme Court’s plenary session, the inadmissibility of extraordinary resort related to Cofins was confirmed in a unanimous decision, that denied the provision of Special Resort interposed by Public Ministry. With this decision, the Cofins plea is decided, prevailing the Fourth Area Federal Regional Court’s judgment, from August 2007, propitiousness for Banco Santander. On August 19, 2015, the declaration of embargoes presented by Public Ministry were rejected unanimously at the plenary session of the Supreme Court. According to the legal advisor’s evaluation, the appreciation of Ban’s Resolution is very far for happen to change the decision’s content, handed down by the Supreme Court’s plenary. There are still pending of final judgment by the Supreme Court the Banco Santander PIS chargeability, as well as the PIS and Cofins chargeability’s from other controlled subsidiaries. In 2015, based on STF's decision, Banco Santander recorded the reversal of provisions made to cover the legal liabilities related to Cofins, amounting R$7,950 million (R$4,770 million, after tax effects). | ||||||||||||||
Increase in CSLL Tax Rate - R$345,202 Bank and R$948,968 Consolidated (12/31/2015 - R$317,963 Bank and R$883,234 Consolidated): the Bank Santander and its subsidiaries are discussing the increase in the CSLL tax rate, from 9% to 15%, established by Executive Act 413/2008, subsequently converted into Law 11,727/2008, as from April 2008.Judicial proceedings are pending of judgment. | ||||||||||||||
Banco Santander and its subsidiaries are parties to judicial and administrative proceedings related to tax and social security matters, which are classified based on the opinion of legal counsel as probable loss risk. | ||||||||||||||
The main topics discussed in these lawsuits are: | ||||||||||||||
83
CSLL - Equal Tax Treatment - R$0 Bank and R$54,245 Consolidated (12/31/2015 - R$0 Bank and R$52,268 Consolidated): its subsidiaries filed a lawsuit challenging the application of an increased CSLL rate of 18% for financial companies, applicable until 1998, compared to the CSLL rate of 8% for non-financial companies on the basis of the constitutional principle of equal tax treatment. | ||||||||||||||
Tax on Services for Financial Institutions (ISS) - R$607,882 Bank and R$621,586 Consolidated (12/31/2015 - R$739,004 Bank and R$755,440 Consolidated): the Banco Santander and its subsidiaries filed lawsuits, in administrative and judicial proceedings, some municipalities collection of ISS on certain revenues derived from transactions not usually classified as services. | ||||||||||||||
Social Security Contribution (INSS) - R$259,845 Bank and R$266,391 Consolidated (12/31/2015 - R$507,836 Bank and R$527,111 Consolidated): Banco Santander and its subsidiaries are involved in administrative and judicial proceedings regarding the collection of income tax on social security and education allowance contributions over several funds that, according to the evaluation of legal advisors, do not have nature of salary. | ||||||||||||||
Provisional Contribution on Financial Transactions (CPMF) on Customer Operations - R$689,987 Bank and Consolidated (12/31/2015 - R$657,750 Bank and Consolidated): in May 2003, the Federal Revenue Service issued a tax assessment against Santander Distribuidora de Títulos e Valores Mobiliários Ltda. (Santander DTVM) and another tax assessment against Banco Santander Brasil S.A. The tax assessments refer to the collection of CPMF tax on transactions conducted by Santander DTVM in the cash management of its customers’ funds and clearing services provided by Banco to Santander DTVM in 2000, 2001 and the first two months of 2002. Based on the risk assessment of legal counsel, the tax treatment was accurate. Santander DTVM had a favorable decision at the Board of Tax Appeals (CARF). Banco Santander had a unfavorable decision and was considered responsible for the collection of the CPMF tax. Both decisions were appealed by the respective losing party to the highest jurisdiction of CARF. In June 2015 , Bank and DTVM had obtained a non favorable decision at CARF. On July 3rd , 2015 Bank and Produban Serviços de Informática S.A. (actual Santander DTVM company name) filed lawsuit aiming to cancel both tax charges on the exercise ended December 31, 2016 amounting R$1,382 million. Based on the evaluation of legal advisors, were consisted provision to the probable loss. | ||||||||||||||
f) Lawsuits and Administrative Proceedings of Labor | ||||||||||||||
These are lawsuits brought by labor Unions, Associations, Public Prosecutors and former employees claiming labor rights they believe are due, especially payment for overtime and other labor rights, including retirement benefit lawsuits. | ||||||||||||||
For claims considered to be similar and usual, provisions are recognized based on the history of payments and successes. Claims that do not fit the previous criteria are accrued according to individual assessment performed, and provisions are based on the probable loss, the law and jurisprudence according to the assessment of loss made by legal counsel. | ||||||||||||||
g) Lawsuits and Administrative Proceedings of Civil | ||||||||||||||
These contingencies are generally caused by: (1) Action with a request for revision of contractual terms and conditions or requests for monetary adjustments, including supposed effects of the implementation of various government economic plans, (2) action deriving of financing agreements, (3) execution action; and (4) action indemnity by loss and damage. For civil actions considered common and similar in nature, provisions are recorded based on the average of cases closed. Claims that do not fit the previous criteria are accrued according to individual assessment performed, and provisions are based on the probable loss, the law and jurisprudence according to the assessment of loss made by legal counsel. | ||||||||||||||
The main processes classified as risk of loss likely are described below: | ||||||||||||||
Lawsuits for Indemnity - seeking indemnity for property damage and/or emotional distress, regarding the consumer relationship on matters related to credit cards, consumer credit, bank accounts, collection and loans and other operations. In the civil lawsuits considered to be similar and usual, provisions are recorded based on the average of cases closed. Civil lawsuits that do not fit into the previous criterion are accrued according to the individual assessment made, and provisions are recognized based on the probable loss, the law and jurisprudence according to the assessment of loss made by legal counsel. | ||||||||||||||
Economic Plans - efforts to recover actions with collective the deficient inflation adjustments in savings accounts arising from the Economic Plans (Bresser, Verão, Collor I and II). These refer to the lawsuits filed by savings accountholders disputing the interest credited by the Banco Santander under such plans as they considered that such legal amendments infringed on the rights acquired with regard to the application of the inflation indexes. Provisions are recorded based on the average losses of cases closed. | ||||||||||||||
Civil lawsuits that do not fit into the previous criterion are accrued according to the individual assessment made, and provisions are recognized based on the probable loss, the law and jurisprudence according to the assessment of loss made by legal counsel. The Banco Santander is also a party in public class action suits on the same issue filed by consumer rights organizations, Public Prosecutor’s Offices and Public Defender’s Offices. In these cases, the provision is made only after the final unappealable sentence is handed down on the lawsuits, based on the individual execution orders. The Superior Tribunal da Justiça (STJ - Justice Superior Court) decided against the bank’s. The STF is still analyzing the subject and has already ordered the suspension of all the procedures except those that were not already decided in trial courts and those who have a final decision. However, the assessment of this question is paralyzed in the Supreme Court for lack of quorum, considering that some of his ministers declared themselves unable to judge the matter and therefore is likely to judgment remains paralyzed for several years yet. There are decisions favorable to banks at the STF with regard to the economic phenomenon similar to that of savings accounts, as in the case of monetary restatement of time deposits - CDB and agreements (present value table). | ||||||||||||||
84
Moreover, there are precedents at the Supreme Court regarding the constitutionality of the norms that changed Brazil’s monetary standard. On April 14, 2010, the STJ was recently decided that the deadline for the filing of civil lawsuits that argue the government's purge of five years, but this decision has not been handed down on the lawsuits yet. Thus, with this decision, a majority stake, as was proposed after the period of five years is likely to be rejected, reducing the values involved. Still, the STF decided that the deadline for individual savers to qualify in the public civil litigations, also is five years, counted from the final judgment of their sentence. Banco Santander believes in the success of the arguments defended in these courts based on their content and the sound legal basis. | ||||||||||||||
h) Civil, Labor, Tax, and Security Social Liabilities Contingent Classified as Possible Loss Risk | ||||||||||||||
Refer to judicial and administrative proceedings involving tax, labor and civil matters assessed by legal counsels, as possible losses, which were not accounted for. | ||||||||||||||
The shares tax classification with possible loss, totaling R$18,652 million, main processes being: | ||||||||||||||
Credit Losses - Bank and its subsidiaries challenged the tax assessments issued by the Federal Revenue Services challenging the deduction for credit losses because they fail to meet the relevant requirements under applicable law. As of December 31, 2016 the amount related to this challenge is approximately R$730 million. | ||||||||||||||
INSS on Profits or Results (PLR) - Bank and the subsidiaries are involved in several legal and administrative proceedings against the tax authorities in connection with the taxation for social security purposes of certain items which are not considered to be employee remuneration. As of December 31, 2016 the amounts related to these proceedings totaled approximately R$2,978 million. | ||||||||||||||
IRPJ and CSLL - Capital Gain - the Brazilian Federal Revenue Service issued infraction notices against Zurich Santander Brasil Seguros e Previdência S.A., successor company of ABN AMRO Brasil Dois Participações S.A. (AAB Dois Par), charging income Tax and Social Contribution to related to 2005 tax, claiming that capital gain in sales shares of Real Seguros S.A and Real Vida Previdência S.A. by AAB Dois Par should be taxed an rate of 34% instead 15%. The assessment was contested administratively based on understanding tax treatment adopted at the transaction was in compliance and capital gain tax paid was in compliance with the legislation. We had a partial favorable the decision on CARF, that disregard the fine and interest on this fine. Currently awaiting the assessment of a Amendment of Judgment by Zurich and the judgment of the Extraordinary Appeal filed by the Federal Government . The Banco Santander is responsible for any adverse outcome in this process as former controlling of Zurich Santander Brasil Seguros e Previdência S.A. As of December, 31, 2016 the amount related to this proceeding is approximately R$279 million. | ||||||||||||||
Goodwill Amortization of Banco Real - The Brazilian Federal Revenue issued infraction notices against the Bank to require the income tax and social payments, including late charges, for the base period of 2009. The Tax Authorities considered that the goodwill related to acquisition of Banco Real, amortized for accounting purposes prior to the merger, could not be deduced by Banco Santander for tax purposes. The infraction notices was contested. On July 14, 2015, the Police Judging RFB decided favorably to Banco Santander, fully canceling the tax debt. This decision will craft appealed before the CARF. On December 31, 2016, the figure was approximately R$1,259 million. | ||||||||||||||
Goodwill Amortization of Banco Sudameris- The Tax Authorities have issued infraction notices to require the income tax and social contribution payments, including late charges, relating to tax deduction of amortization of goodwill from the acquisition of Banco Sudameris, related to the period of 2007 to 2012. Banco Santander timely presented their appeals, which are pending. On December 31, 2016, the figure was R$568 million. | ||||||||||||||
The labor claims with classification of possible loss totaled R$17 million, excluding the processes below: | ||||||||||||||
Semiannual Bonus or PLR -a labor lawsuit relating to the payment of a semiannual bonus or, alternatively, profit sharing, to retired employees from the former Banco do Estado de São Paulo S.A. - Banespa, that had been hired up to May 22, 1975, filed as Banespa’s Retirees Association. This lawsuit was dismissed against the Bank by the Superior Labor Court. The STF rejected the extraordinary appeal of the Bank by a monocratic decision maintaining the earlier condemnation. Santander brought Regimental Appeal which awaits decision by the STF. The Regimental Appeal is an internal appeal filed in the STF itself, in order to refer the monocratic decision to a group of five ministers. The 1st Class of the Supreme Court upheld the appeal by the Bank and denied the Afabesp. The materials of the extraordinary appeal of the Bank now proceed to the Supreme Court for decision on overall impact and judgment. The amount related to this claim is not disclosed due to the current stage of the lawsuit and the possible impact such disclosure may have on the progress of the claim. | ||||||||||||||
Readjustment of Banesprev retirement complements by the IGPDI -lawsuit filed in 2002 in Federal Court by the Association of Retired Employees of the Bank of the State of São Paulo requesting the readjustment of the supplementation of retirement by the IGPDI for Banespa retirees who have been admitted until May 22 Of 1975. The judgment granted the correction but only in the periods in which no other form of adjustment was applied. The Bank and Banesprev have appealed this decision and although the appeals have not yet been judged, the Bank's success rate in this regard in the High Courts is around 90%. In Provisional Execution, calculations were presented by the Bank and Banesprev with "zero" result due to the exclusion of participants who, among other reasons, are listed as authors in other actions or have already had some type of adjustment. The amount related to this action is not disclosed due to the current stage of the process and the possible impact that such disclosure may generate on the progress of the action. | ||||||||||||||
The liabilities related to civil lawsuits with possible loss totaled R$1,211 million, the main processes as follows: | ||||||||||||||
Indemnity Lawsuit Arising of the Banco Bandepe - related to mutual agreement on appeal to the Justice Superior Court (STJ - Superior Tribunal de Justiça). | ||||||||||||||
Indemnity Lawsuit Related to Custody Services - provided by Banco Santander at an early stage and still not handed down. | ||||||||||||||
85
Lawsuit Arising out of a Contractual Dispute - the acquisition of Banco Geral do Comércio S.A. on appeal to the Court of the State of São Paulo (TJSP - Tribunal de Justiça do Estado de São Paulo). | ||||||||||||||
i) Other Lawsuits Under the Responsibility of Former Controlling Stockholders | ||||||||||||||
Refer to actions of tax, labor and civil, in the amounts of R$719,574, R$712 and R$3,830 (On December 31, 2015 - R$698,622, R$890 and R$3,246) Bank and R$810,383, R$712 and R$3,830 (On December 31, 2015 - R$785,837, R$890 and R$3,246) Consolidated, respectively, recorded in other liabilities - tax and social security contributions (Note 19) and other liabilities - others (Note 22) the responsibility of the former controlling Banks and acquired companies. Based on contracts signed, these actions have guaranteed reimbursement for part of former controllers, whose respective duties were recorded in other receivables - others (Note 12). | ||||||||||||||
86
24. Stockholders’ Equity | ||||||||||||||
a) Capital | ||||||||||||||
According to the by-laws, Banco Santander's capital stock may be increased up to the limit of its authorized capital, regardless of statutory reform, by resolution of the Board of Directors and through the issuance of up to 9,090,909,090 (nine billion, ninety million, nine hundred and nine thousand and ninety) shares, subject to the established legal limits on the number of preferred shares. Any capital increase that exceeds this limit will require shareholders` approval. | ||||||||||||||
The capital stock, fully subscribed and paid, is divided into registered book-entry shares with no par value. | ||||||||||||||
|
|
|
|
|
|
|
|
|
|
|
|
|
| Shares in Thousands |
|
|
|
|
|
|
|
| 12/31/2016 |
|
|
|
|
| 12/31/2015 |
|
|
|
| Common |
| Preferred |
| Total |
| Common |
| Preferred |
| Total |
Brazilian Residents |
| 67,497 |
| 92,949 |
| 160,446 |
| 56,305 |
| 81,279 |
| 137,584 | ||
Foreign Residents |
| 3,783,474 |
| 3,619,163 |
| 7,402,637 |
| 3,794,666 |
| 3,630,833 |
| 7,425,499 | ||
Total |
| 3,850,971 |
| 3,712,112 |
| 7,563,083 |
| 3,850,971 |
| 3,712,112 |
| 7,563,083 | ||
(-) Treasury Shares |
| (25,786) |
| (25,786) |
| (51,572) |
| (20,218) |
| (20,218) |
| (40,436) | ||
Total Outstanding |
| 3,825,185 |
| 3,686,326 |
| 7,511,511 |
| 3,830,753 |
| 3,691,894 |
| 7,522,647 | ||
b) Dividends and Interest on Capital | ||||||||||||||
According to the Bank’s bylaws, shareholders are entitled to a minimum dividend equivalent to 25% of net income for the year, adjusted according to legislation. Preferred shares are nonvoting and nonconvertible, but have the same rights and advantages granted to common shares, in addition to priority in the payment of dividends at a rate that is 10% higher than those paid on common shares, and in the capital reimbursement, without premium, in the event of liquidation of the Bank. | ||||||||||||||
Dividend payments have been and will continue to be calculated and paid in accordance with Brazilian Corporate Law. | ||||||||||||||
Prior to the Annual Shareholders Meeting, the Board of Directors may resolve on the declaration and payment of dividends on earnings based on (i) balance sheets or earning reserves showed in the last balance sheet; or (ii) balance sheets issued in the period shorter than 6 months, provided that the total dividends paid in each half of the fiscal year shall not exceed the amount of capital reserves.These dividends are fully attributed to the mandatory dividend. | ||||||||||||||
|
|
|
|
|
|
|
|
|
|
|
|
|
| 12/31/2016 |
In Thousands | Brazilian Real per Thousand Shares/Units | |||||||||||||
|
|
|
|
| of Brazilian Real |
| Common |
| Preferred |
| Units | |||
Interest on Capital(1) (4) |
|
|
|
|
|
|
| 500,000 |
| 63.4290 |
| 69.7719 |
| 133.2009 |
Intermediate Dividends(2) (5) |
|
|
|
|
|
|
| 700,000 |
| 88.8309 |
| 97.7140 |
| 186.5448 |
Intercalary Dividends(2) (5) |
|
|
|
|
|
|
| 700,000 |
| 88.8309 |
| 97.7140 |
| 186.5448 |
Interest on Capital(3) (5) |
|
|
|
|
|
|
| 3,350,000 |
| 425.1192 |
| 467.6311 |
| 892.7503 |
Total |
|
|
|
|
| 5,250,000 |
|
|
|
|
|
| ||
|
|
|
|
|
|
|
|
|
|
|
|
|
|
|
(1) Established by the Board of Directors in June 2016, Common Shares- R$53.9146, preferred - R$59.3061 and Units - R$113.2207 net of taxes. | ||||||||||||||
(2) Established by the Board of Directors in December 2016. | ||||||||||||||
(3) Established by the Board of Directors in December 2016, Common Shares- R$361.3513, preferred - R$397.4864 and Units - R$758.8377 net of taxes. | ||||||||||||||
(4) The amount of the interest on capital will be fully input into the mandatory dividends for the year 2016 and were be paid from August 26, 2016 without any compensation as monetary correction. | ||||||||||||||
(5) The amount of intermediate, intercalary dividends and interest on capital will be fully attributed to supplementary and mandatory dividends for the year 2016 and will be paid from February 23, 2017, without any compensation to the restatement. | ||||||||||||||
|
|
|
|
|
|
|
|
|
|
|
|
|
| 12/31/2015 |
In Thousands | Brazilian Real per Thousand Shares/Units | |||||||||||||
|
|
|
|
| of Brazilian Real |
| Common |
| Preferred |
| Units | |||
Intercalary Dividends(1) (5) |
|
|
|
|
|
|
| 150,000 |
| 18.9474 |
| 20.8421 |
| 39.7895 |
Intermediate Dividends(2) (6) |
|
|
|
|
|
|
| 3,050,000 |
| 385.8116 |
| 424.3927 |
| 810.2043 |
Intercalary Dividends(3) (7) |
|
|
|
|
|
|
| 1,600,000 |
| 202.7412 |
| 223.0153 |
| 425.7564 |
Interest on Capital(4) (7) |
|
|
|
|
|
|
| 1,400,000 |
| 177.3985 |
| 195.1384 |
| 372.5369 |
Total |
|
|
|
|
| 6,200,000 |
|
|
|
|
|
| ||
|
|
|
|
|
|
|
|
|
|
|
|
|
|
|
(1) Established by the Board of Directors in March 2015. | ||||||||||||||
(2) Established by the Board of Directors in September 2015. | ||||||||||||||
(3) Established by the Board of Directors in December 2015. | ||||||||||||||
(4) Established by the Board of Directors in December 2015, common R$150.7887, preferred - R$165.8676 and units - R$316.6563, net of taxes. | ||||||||||||||
(5) The amount of the intercalary dividends were fully attributed to mandatory dividends for the year 2015 and were paid from August 28, 2015, without any compensation to the restatement. | ||||||||||||||
(6) The amount of the intermediate dividends were fully attributed to mandatory dividends for the year 2015 and were paid from October 5, 2015, without any compensation to the restatement. | ||||||||||||||
(7) The amount of intercalary dividends and interest on capital were fully attributed to supplementary and mandatory dividends for the year 2015 and were paid from February 25, 2016, without any compensation to the restatement. | ||||||||||||||
87
c) Reserves | ||||||||||||||
Net income, after deductions and statutory provisions, will be allocated as follows: | ||||||||||||||
Legal Reserve | ||||||||||||||
According to Brazilian corporate law, 5% to the legal reserve, until it reaches 20% of the share capital. This reserve is intended to ensure the integrity of capital and can only be used to offset losses or increase capital. | ||||||||||||||
Capital Reserve | ||||||||||||||
The Bank´s capital reserve consists of: goodwill reserve for subscription of shares and other capital reserves, and can only be used to absorb losses that exceed retained earnings and profit reserves, redemption, reimbursement or acquisition of shares of our own issue; capital increase, or payment of dividends to preferred shares under certain circumstances. | ||||||||||||||
Reserve for Equalization Dividend | ||||||||||||||
After the allocation of dividends, the remaining balance if any, may, upon proposal of the Executive Board and approved by the Board of Directors, be allocated to reserve for equalization of dividends, which will be limited to 50% of the share capital. This reserve aims to ensure funds for the payment of dividends, including as interest on own capital, or any interim payment to maintain the flow of shareholders remuneration. | ||||||||||||||
d) Treasury Shares | ||||||||||||||
In the meeting held on November 3, 2016, the Bank’s Board of Directors approved, in continuation of the buyback program that expired on November 4, 2016, the buyback program of its Units and ADRs, by the Bank or its agency in Cayman, to be held in treasury or subsequently sold. | ||||||||||||||
The Buyback Program will cover the acquisition up to 38,402,972 Units, representing 38,402,972common shares and 38,402,972 preferred shares, or the ADRs, which, on September 30, 2016, corresponded to approximately 1.02% of the Bank’s share capital. On September 30, 2016, the Bank held 384,029,725 common shares and 411,834,140 preferred shares being traded. | ||||||||||||||
The Buyback has the purpose to (1) maximize the value creation to shareholders by means of an efficient capital structure management; and (2) enable the payment of officers, management level employees and others Bank’s employees and companies under its control, according to the Long Term Incentive Plans. | ||||||||||||||
The term of the Buyback Program is 365 days counted from November 4, 2016, and will expire on November 3, 2017. | ||||||||||||||
|
|
|
|
|
|
|
|
|
|
|
|
|
| Bank/Consolidated |
Shares in Thousands | ||||||||||||||
|
|
|
|
|
|
|
|
|
| 12/31/2016 |
|
|
| 12/31/2015 |
|
| Quantity |
|
| Quantity | |||||||||
|
|
|
|
|
|
|
| Units |
| ADRs |
| Units |
| ADRs |
Treasury Shares at Beginning of the Exercise |
|
|
| 7,080,068 |
| 13,137,665 |
| 16,531,177 |
| 13,080,565 | ||||
Cancellation of ADRs(1) |
|
|
|
|
| 13,137,665 |
| (13,137,665) |
| - |
| - | ||
Cancellation of Shares(2) |
|
|
|
|
| - |
| - |
| (18,878,954) |
| - | ||
Shares Acquisitions |
|
|
|
|
| 14,284,400 |
| - |
| 13,873,413 |
| 57,100 | ||
Payment - Share-Based Compensation |
|
|
| (8,716,213) |
| - |
| (4,445,568) |
| - | ||||
Treasury Shares at End of Exercise |
|
|
| 25,785,920 |
| - |
| 7,080,068 |
| 13,137,665 | ||||
Balance of Treasury Shares in Thousands of Reais(2) (3) |
| 513,889 |
| - |
| 106,764 |
| 317,094 | ||||||
|
|
|
|
|
|
|
|
|
|
|
|
|
|
|
Cost/Market Value |
|
|
|
|
| Units |
| ADRs |
| Units |
| ADRs | ||
Minimum Cost |
|
|
|
|
| R$ 7.55 |
| US$ 4,37 |
| R$ 11.01 |
| US$ 4,37 | ||
Weighted Average Cost |
|
|
|
|
| R$ 16.43 |
| US$ 6,17 |
| R$ 14.28 |
| US$ 6,17 | ||
Maximum Cost |
|
|
|
|
| R$ 26.81 |
| US$ 10,21 |
| R$ 18.51 |
| US$ 10,21 | ||
Market Value |
|
|
|
|
| R$ 28.32 |
| US$ 8,58 |
| R$ 16.04 |
| US$ 3,89 | ||
(1) In January 2016 was the transformation of all ADRs that were held in treasury for UNIT's. | ||||||||||||||
(2) Extraordinary General Meeting held on December 14, 2015 the cancellation of 18,878,954 Units was approved (18,878,954 ON and 18,878,954 PN totaling 37,757,908 treasury shares) equivalent to R$268,573. | ||||||||||||||
(3) The total number of treasury shares on December 31, 2016 is R$514,034 (12/31/2015 - R$423,953) and includes issuance costs amounting to R$145 (12/31/2015 - R$95). | ||||||||||||||
Additionally, in the period ended at December 31, 2016, treasury shares were traded, that resulted in a gain of R$11,574 (2015 - loss of R$3,918) recorded directly in equity in capital reserves. | ||||||||||||||
e) Consolidated Stockholders’ Equity - Unrealized Results | ||||||||||||||
The consolidated stockholders’ equity is reduced mainly to unrealized results of R$16,947 (12/31/2015 - R$2,216). In 2016, were realized results in the amount of R$11,325 (2015 - R$15,298), includes values referred to trading with third parties NTN-C and part of NTN-F, related to the sale made by Banco Santander to Santander Leasing (Note 6. a III) recorded previously as unrealized results (2012 - R$514,532). | ||||||||||||||
88
25. Operational Ratios | ||||||||||||||
In July 2008 came into force the rules on regulatory capital measurement by the Standardized Approach of Basel II. On 2013 was issued a set of Resolutions and Circulars, aligned with the recommendations of the Basel Committee on Banking Supervision. These rules were repealed by CMN Resolution 4,192 and 4,193 which took effect from October 2013, establishing the model for calculating the minimum Regulatory Capital requirements, Tier I and Common Equity Tier I. These Resolutions states that the composition of the Regulatory Capital is done through equity, subordinated debt and hybrid capital instruments. | ||||||||||||||
As established by CMN Resolution 4,193/2013, requirement for PR is 11% until December 31, 2015, from January 2016 the requirement is to 9.875% plus 0.625% of conservation of capital, totaling 10.5% until December 2016, for the Tier I is 6% and the Main Capital is 4.5%. | ||||||||||||||
As a continuation the adoption of the rules established by CMN Resolution 4,192/2013, as of January 2015, came into force the Prudential Conglomerate, defined by CMN Resolution 4,280/2013. | ||||||||||||||
Index is calculated on a consolidated basis, as showed below: | ||||||||||||||
|
|
|
|
|
|
|
|
|
|
|
|
| ||
|
|
|
|
|
|
|
|
|
|
|
| 12/31/2016 (1) |
| 12/31/2015 (1) |
Tier I Regulatory Capital |
|
|
|
|
|
|
|
|
| 56,264,021 |
| 52,976,575 | ||
Principal Capital |
|
|
|
|
|
|
|
|
| 52,136,837 |
| 48,031,704 | ||
Supplementary Capital |
|
|
|
|
|
|
|
|
| 4,127,184 |
| 4,944,870 | ||
Tier II Regulatory Capital |
|
|
|
|
|
|
|
|
| 4,280,864 |
| 5,182,065 | ||
Regulatory Capital (Tier I and II) |
|
|
|
|
|
|
| 60,544,885 |
| 58,158,640 | ||||
Regulatory Capital Required |
|
|
|
|
|
|
|
|
| 36,669,570 |
| 40,683,466 | ||
Credit Risk(2) |
|
|
|
|
|
|
|
|
| 31,309,944 |
| 36,508,169 | ||
Market Risk(3) |
|
|
|
|
|
|
|
|
| 2,388,626 |
| 2,300,969 | ||
Operational Risk |
|
|
|
|
|
|
|
|
| 2,971,000 |
| 1,874,328 | ||
Basel I Ratio |
|
|
|
|
|
|
|
|
|
|
| 15.15 |
| 14.3 |
Basel Principal Capital |
|
|
|
|
|
|
|
|
|
|
| 14.04 |
| 13.0 |
Basel Regulatory Capital |
|
|
|
|
|
|
|
|
|
|
| 16.30 |
| 15.7 |
| ||||||||||||||
(1) Amounts calculated based on the consolidated information provided by the Consolidated Prudential. | ||||||||||||||
(2) To calculate the capital allocation for credit risk were considered modifications and inclusions of Bacen Circular 3,714 of August 20, 2014, which amending Bacen Circular 3,644 of March 4, 2013. | ||||||||||||||
(3) Includes portions for market risk exposures subject to variations in rates of foreign currency coupons (PJUR2), price indexes (PJUR3) and interest rate (PJUR1/PJUR4), the price of commodities (PCOM), the price of shares classified as trading portfolios (PACS), and portions for gold exposure and foreign currency transactions subject to foreign exchange (PCAM). | ||||||||||||||
Banco Santander, quarterly discloses Pillar III information relating to risk management, Regulatory Capital and Required Regulatory Capital. A report with further details of the structure and methodology will be disclosed at the website www.ri.santander.com.br/ri. | ||||||||||||||
Financial institutions are required to maintain investments in permanent assets compatible with adjusted regulatory capital. Funds invested in permanent assets, calculated on a consolidated basis, are limited to 50% of adjusted regulatory capital, as per prevailing regulation.Banco Santander classifies for said index. | ||||||||||||||
26. Related Parties | ||||||||||||||
a) Key Management Personnel Compensation | ||||||||||||||
The Board of Directors' meeting held on March 22, 2016 approved, in accordance with the favorable opinion of the Compensation Committee, the global maximum compensation proposal for managers (Board of Directors and Executive Officers) for the 2016 financial year, in the overall amount of R$300,000, covering fixed, variable and share-based compensation and other benefits. The proposal was approved by the Ordinary General Meeting (OGM) held on April 29, 2016. | ||||||||||||||
a.1) Long Term Benefits | ||||||||||||||
The Bank, likewise Banco Santander Spain and other companies controlled by Santander Group, develops long-term compensation programs-tied to the performance of the market price of its shares, based on the achievement of certain goals (Note 35.f). | ||||||||||||||
a.2) Short Term Benefits | ||||||||||||||
The table below shows the salary of Board of Directors and Executive Board: | ||||||||||||||
|
|
|
|
|
|
|
|
|
|
|
|
|
|
|
01/01 to | 01/01 to | |||||||||||||
|
|
|
|
|
|
|
|
|
|
|
| 12/31/2016 |
| 12/31/2015 |
Fixed Compensation |
|
|
|
|
|
|
|
|
| 91,115 |
| 69,891 | ||
Variable Compensation |
|
|
|
|
|
|
|
|
| 120,632 |
| 108,087 | ||
Others |
|
|
|
|
|
|
|
|
| 15,555 |
| 15,353 | ||
Total Short-Term Benefits |
|
|
|
|
|
|
|
|
| 227,301 |
| 193,331 | ||
Shares Based Payments |
|
|
|
|
|
|
|
|
| 49,488 |
| 11,777 | ||
Total Long-Term Benefits |
|
|
|
|
|
|
|
|
| 49,488 |
| 11,777 | ||
Total(1) |
|
|
|
|
|
|
|
|
| 276,789 |
| 205,108 | ||
(1) Refers to the amount paid by Banco Santander to its Managers for positions they hold at Banco Santander and other companies in the Conglomerate Santander. | ||||||||||||||
89
Additionally, in 2016, charges were collected on Management compensation in the amount of R$30,823 (2016 - R$28,096). | ||||||||||||
b) Contract Termination | ||||||||||||
The termination of the employment relationship of managers for non-fulfillment of obligations or voluntarily by the employee does not give right to any financial compensation. | ||||||||||||
c) Lending Operations | ||||||||||||
The current law prevents the Bank to grant loans or advances to: | ||||||||||||
I - officers, members of the Board of Directors and Audit Committee as well as their spouses and relatives up to the second degree; | ||||||||||||
II - individuals or legal entities that holds more than 10% of Banco Santander´s share capital; | ||||||||||||
III - legal entities in which Banco Santander holds more than 10% of its share capital; | ||||||||||||
IV - legal entities in which any of the officers, members of the Board of Directors and Audit Committee, as well as their spouses or relatives up to the second degree, hold more than 10% of the share capital. | ||||||||||||
d) Ownership Interest | ||||||||||||
The table below shows the direct interest (common and preferred shares): | ||||||||||||
| ||||||||||||
|
|
|
|
|
|
|
|
|
|
|
| Shares in Thousands |
12/31/2016 | ||||||||||||
Preferred | Total | |||||||||||
Common Shares | Preferred | Shares | Total | Shares | ||||||||
Stockholders' |
| Common Shares |
| (%) |
| Shares |
| (%) |
| Shares |
| (%) |
Sterrebeeck B.V.(1) |
| 1,809,583 |
| 47.0% |
| 1,733,644 |
| 46.7% |
| 3,543,227 |
| 46.9% |
Grupo Empresarial Santander, | 1,107,673 |
| 28.8% |
| 1,019,645 |
| 27.5% |
| 2,127,318 |
| 28.1% | |
Banco Santander, S.A.(1) |
| 518,207 |
| 13.5% |
| 519,089 |
| 14.0% |
| 1,037,296 |
| 13.7% |
Santander Insurance Holding, |
| 3,758 |
| 0.1% |
| 179 |
| 0.0% |
| 3,937 |
| 0.1% |
Qatar Holding, LLC (Qatar |
| 207,812 |
| 5.4% |
| 207,812 |
| 5.6% |
| 415,624 |
| 5.5% |
Employees |
| 3,914 |
| 0.1% |
| 3,929 |
| 0.1% |
| 7,843 |
| 0.1% |
Members of the Board of Directors | (*) |
| (*) |
| (*) |
| (*) |
| (*) |
| (*) | |
Members of the Executive Board | (*) |
| (*) |
| (*) |
| (*) |
| (*) |
| (*) | |
Others |
| 174,238 |
| 4.5% |
| 202,028 |
| 5.5% |
| 376,266 |
| 5.0% |
Total Outstanding |
| 3,825,185 |
| 99.4% |
| 3,686,326 |
| 99.4% |
| 7,511,511 |
| 99.4% |
Treasury Shares |
| 25,786 |
| 0.6% |
| 25,786 |
| 0.6% |
| 51,572 |
| 0.6% |
Total |
| 3,850,971 |
| 100.0% |
| 3,712,112 |
| 100.0% |
| 7,563,083 |
| 100.0% |
Free Float (2) |
| 385,964 |
| 10.0% |
| 413,769 |
| 11.1% |
| 799,733 |
| 10.6% |
| ||||||||||||
|
|
|
|
|
|
|
|
|
|
|
| Shares in Thousands |
12/31/2015 | ||||||||||||
Preferred | Total | |||||||||||
Common Shares | Preferred | Shares | Total | Shares | ||||||||
Stockholders' |
| Common Shares |
| (%) |
| Shares |
| (%) |
| Shares |
| (%) |
Sterrebeeck B.V.(1) |
| 1,809,583 |
| 47.0% |
| 1,733,644 |
| 46.7% |
| 3,543,227 |
| 46.9% |
GES(1) | 1,107,673 |
| 28.8% |
| 1,019,645 |
| 27.5% |
| 2,127,318 |
| 28.1% | |
Banco Santander, S.A.(1) |
| 518,207 |
| 13.5% |
| 519,089 |
| 14.0% |
| 1,037,296 |
| 13.7% |
SIH(1) |
| 3,758 |
| 0.1% |
| 179 |
| 0.0% |
| 3,937 |
| 0.1% |
Qatar Holding |
| 207,812 |
| 5.4% |
| 207,812 |
| 5.6% |
| 415,624 |
| 5.5% |
Employees |
| 3,066 |
| 0.1% |
| 3,088 |
| 0.1% |
| 6,154 |
| 0.1% |
Members of the Board of Directors | (*) |
| (*) |
| (*) |
| (*) |
| (*) |
| (*) | |
Members of the Executive Board | (*) |
| (*) |
| (*) |
| (*) |
| (*) |
| (*) | |
Others |
| 180,654 |
| 4.6% |
| 208,437 |
| 5.6% |
| 389,091 |
| 5.1% |
Total Outstanding |
| 3,830,753 |
| 99.5% |
| 3,691,894 |
| 99.5% |
| 7,522,647 |
| 99.5% |
Treasury Shares |
| 20,218 |
| 0.5% |
| 20,218 |
| 0.5% |
| 40,436 |
| 0.5% |
Total |
| 3,850,971 |
| 100.0% |
| 3,712,112 |
| 100.0% |
| 7,563,083 |
| 100.0% |
Free Float (2) |
| 391,532 |
| 10.2% |
| 419,337 |
| 11.3% |
| 810,869 |
| 10.7% |
| ||||||||||||
(1)Companies of the Santander Spain Group. | ||||||||||||
(2) Composed of Employees, Qatar Holding and Others. | ||||||||||||
(*) None of the members of the Board of Directors and the Executive Board holds 1.0% or more of any class of shares. | ||||||||||||
90
e) Related-Party Transactions | ||||||||
Santander has a Policy for Related Party Transactions approved by the Board of Directors, which aims to ensure that all transactions typified by the policy to take effect in view of the interests of Banco Santander and its shareholders. The policy defines the power to approve certain transactions by the Board of Directors. The planned rules also apply to all employees and officers of Banco Santander and its subsidiaries. | ||||||||
Operations and charges for services with related parties are carried out in the ordinary course of business and under reciprocal conditions, including interest rates, terms and guarantees, and do not entail greater risk than the normal collection or have other disadvantages. | ||||||||
The main transactions and balance are as follows: | ||||||||
|
|
|
|
|
|
|
|
|
|
|
|
|
|
| Bank | ||
Assets | Income | Assets | Income | |||||
(Liabilities) |
| (Expenses) | (Liabilities) |
| (Expenses) | |||
01/01 to | 01/01 to | |||||||
|
| 12/31/2016 |
| 12/31/2016 |
| 12/31/2015 |
| 12/31/2015 |
Cash |
| 402,617 |
| - |
| 245,412 |
| - |
Banco Santander Espanha(2) |
| 400,205 |
| - |
| 243,943 |
| - |
Banco Santander (México), S.A.(4) |
| 1,034 |
| - |
| 65 |
| - |
Banco Santander Totta, S.A.(4) |
| 1,261 |
| - |
| 1,303 |
| - |
Others |
| 117 |
| - |
| 101 |
| - |
Interbank Investments |
| 45,801,141 |
| 4,535,632 |
| 52,550,064 |
| 3,540,799 |
Aymoré CFI(3) |
| 27,473,607 |
| 3,588,665 |
| 26,952,013 |
| 3,076,677 |
Banco Santander Espanha(1) (2) |
| 10,269,812 |
| 37,381 |
| 20,699,539 |
| 31,374 |
CFI RCI Brasil (3) |
| - |
| - |
| 923,412 |
| 163,684 |
Banco PSA(3) |
| 832,849 |
| 40,355 |
| - |
| - |
Banco RCI Brasil S.A. (Current Corporate Name of RCI Brasil Leasing) (3) |
| 589,376 |
| 114,909 |
| - |
| - |
Olé Consignado (Current Corporate Name of Banco Bonsucesso Consignado S.A.)(3) (10) |
| 6,635,497 |
| 754,322 |
| 3,975,100 |
| 269,064 |
Securities |
| 67,744,952 |
| 10,492,182 |
| 66,689,757 |
| 7,134,794 |
Santander Leasing(3) |
| 67,744,952 |
| 10,492,182 |
| 66,689,757 |
| 7,134,794 |
Derivatives Financial Instruments - Net |
| (170,020) |
| 553,129 |
| (724,100) |
| 677,093 |
Santander Benelux, S.A., N.V. (Santander Benelux) (4) |
| - |
| - |
| - |
| 407,395 |
Real Fundo de Investimento Multimercado Santillana Crédito Privado (Fundo de Investimento Santillana) (4) |
| (155,095) |
| 257,475 |
| (379,239) |
| 602,557 |
Abbey National Treasury Services Plc (Abbey National Treasury)(4) |
| (91,828) |
| 38,274 |
| (156,976) |
| (88,881) |
Banco Santander Espanha(2) |
| 70,020 |
| (74,877) |
| (178,841) |
| (240,598) |
Santander FI Amazonas(3) |
| 2,738 |
| 487,690 |
| (44,814) |
| 2,928 |
Santander Paraty(3) (Nota 2) |
| - |
| - |
| 2,804 |
| (1,521) |
Santander FI Hedge Strategies (3)(Note 2) |
| (109,760) |
| (282,845) |
| - |
| - |
Santander FI Diamantina(3) |
| 113,905 |
| 127,412 |
| 32,966 |
| (4,850) |
Banco Bandepe(3) |
| - |
| - |
| - |
| 63 |
Loan Operations |
| - |
| 1,443 |
| 207 |
| 1,261 |
Cibrasec(5) |
| - |
| 1,443 |
| 207 |
| 1,261 |
Dividends and Bonuses Receivables |
| 717,619 |
| 932,964 |
| 152,389 |
| 335,265 |
Aymoré CFI (3) |
| 93,133 |
| 384,536 |
| 107,926 |
| 50,000 |
Santander Leasing(3) |
| 272,703 |
| 320,826 |
| - |
| 200,364 |
Santander Securities Services Brasil DTVM S.A.(4) (9) |
| - |
| - |
| - |
| 34,000 |
CFI RCI Brasil (3) |
| - |
| - |
| 7,480 |
| 30,899 |
Banco RCI Brasil S.A. (Current name of RCI Brasil Leasing)(3) |
| 33,171 |
| 39,024 |
| - |
| - |
Santander Participações(3) |
| 2,194 |
| - |
| 795 |
| - |
Sancap(3) |
| 122,467 |
| 12,000 |
| 35,832 |
| - |
Santander CCVM(3) |
| 30,969 |
| 36,434 |
| - |
| 20,000 |
Banco Bandepe(3) |
| 95,142 |
| 111,932 |
| - |
| - |
Santander Serviços(3) |
| 31,197 |
| 27,962 |
| - |
| - |
Getnet S.A.(3) |
| 35,130 |
| - |
| - |
| - |
Others |
| 1,513 |
| 250 |
| 356 |
| 2 |
Trading Account |
| 154,823 |
| 1,329 |
| 831,967 |
| 1,548 |
Abbey National Treasury(4) |
| 92,118 |
| 396 |
| 135,165 |
| 104 |
Banco Santander Espanha(2) |
| 62,705 |
| 933 |
| 696,802 |
| 1,444 |
Foreign Exchange Portfolio - Net |
| (104,243) |
| 15,300 |
| 142,919 |
| (695,477) |
Banco Santander Espanha(2) |
| (104,243) |
| 15,300 |
| 142,919 |
| (712,263) |
Santander Benelux(4) |
| - |
| - |
| - |
| 16,786 |
91
Receivables from Affiliates |
|
|
|
|
| 16,099,938 |
| 2,553,630 |
| 756,216 |
| 2,479,102 |
Zurich Santander Brasil Seguros e Previdência S.A.(6) |
| 834,736 |
| 1,548,974 |
| 738,006 |
| 1,521,470 | ||||
Zurich Santander Brasil Seguros S.A.(6) |
|
|
| - |
| 220,869 |
| - |
| 202,946 | ||
Santander Capitalização S.A. (3) |
|
|
|
|
| 18,831 |
| 221,373 |
| 18,024 |
| 192,826 |
Aymoré CFI (3) |
|
|
|
|
| - |
| 416,012 |
| - |
| 427,559 |
Santander CCVM(3) |
|
|
|
|
| - |
| 95,766 |
| - |
| 80,935 |
Santander Leasing(3) |
|
|
|
|
| - |
| 3,640 |
| - |
| 9,529 |
Santander Brasil Asset(6) |
|
|
|
|
| - |
| - |
| - |
| 1,243 |
Santander Serviços (3) |
|
|
|
|
| - |
| 19,047 |
| - |
| 15,091 |
Santander Microcrédito(3) |
|
|
|
|
| - |
| 7,628 |
| - |
| 6,712 |
Santander Brasil Consórcio (3) |
|
|
|
|
| - |
| 3,714 |
| - |
| 5,598 |
Santander Participações (3) |
|
|
|
|
| - |
| 2,999 |
| - |
| 4,985 |
Getnet S.A.(3) (11) |
|
|
|
|
| 15,246,008 |
| 2,007 |
| - |
| - |
Webmotors S.A.(7) |
|
|
|
|
| - |
| 300 |
| - |
| 371 |
Others |
|
|
|
|
| 363 |
| 11,301 |
| 186 |
| 9,837 |
Non-Operating Result |
|
|
|
|
| - |
| - |
| - |
| 784,954 |
Capital Riesgo Global(4) |
|
|
|
|
| - |
| - |
| - |
| 34,404 |
Santander Securities Services Brasil Participações S.A. (4) (Nota 33) |
| - |
| - |
| - |
| 750,550 | ||||
Other Receivables - Others |
|
|
|
|
| 15,887 |
| 45,341 |
| 13,052 |
| 30,608 |
Banco Santander Espanha(2) |
|
|
|
|
| 12,089 |
| 8,363 |
| 12,468 |
| 7,637 |
Santander Capitalização S.A. (3) |
|
|
|
|
| 3,462 |
| 9,452 |
| 326 |
| 3,968 |
Santander Paraty (3) (Note 2) |
|
|
|
|
| - |
| - |
| - |
| 1,792 |
Banco Santander International(4) |
|
|
| - |
| 20,959 |
| - |
| 8,804 | ||
Santander Securities Services Brasil DTVM S.A.(4) (9) |
|
| - |
| 1,896 |
| - |
| 2,346 | |||
Others |
|
|
|
|
| 336 |
| 4,671 |
| 258 |
| 6,061 |
Deposits |
|
|
|
|
| (66,972,258) |
| (8,991,876) |
| (61,414,166) |
| (4,064,392) |
Santander Leasing(3) |
|
|
|
|
| (59,211,733) |
| (8,138,709) |
| (54,773,424) |
| (3,474,874) |
Banco Santander Espanha(2) |
|
|
|
|
| (1,556) |
| - |
| (1,360) |
| - |
Aymoré CFI(3) |
|
|
|
|
| (2,938,745) |
| (423,953) |
| (3,149,573) |
| (314,730) |
Banco Bandepe(3) |
|
|
|
|
| (763,992) |
| (142,205) |
| (1,320,479) |
| (152,256) |
Zurich Santander Brasil Seguros e Previdência S.A.(6) |
| (44,840) |
| - |
| (95,537) |
| - | ||||
Zurich Santander Brasil Seguros S.A.(6) |
|
|
| (8,725) |
| - |
| (23,878) |
| - | ||
Santander Brasil Gestão de Recursos Ltda.(6) |
|
|
| (39,361) |
| (12,417) |
| (30,990) |
| (2,467) | ||
Sancap(3) |
|
|
|
|
| (19,998) |
| (2,224) |
| (8,014) |
| (53) |
Santander Brasil Asset(6) |
|
|
|
|
| (12,079) |
| (1,760) |
| (12,360) |
| (2,113) |
Webmotors S.A. (7) |
|
|
|
|
| (66,325) |
| (26,996) |
| (217,534) |
| (22,747) |
Fundo de Investimento Santillana (4) |
|
|
| (757,874) |
| (88,467) |
| (616,399) |
| (15,584) | ||
Isban Brasil S.A.(4) |
|
|
|
|
| (22,232) |
| (3,560) |
| (43,842) |
| (1,914) |
Produban Serviços de Informática S.A. (4) |
|
|
| (19,653) |
| (2,117) |
| (29,993) |
| (1,484) | ||
CFI RCI Brasil (3) |
|
|
|
|
| - |
| - |
| (31,656) |
| 1,447 |
Banco RCI Brasil S.A. (Current Corporate Name of RCI Brasil Leasing) (3) |
| (40,202) |
| (10,959) |
| (6,140) |
| - | ||||
Santander Microcrédito (3) |
|
|
|
|
| (6,420) |
| (1,152) |
| (10,425) |
| (548) |
Santander Participações (3) |
|
|
|
|
| (736,921) |
| (85,189) |
| (582,370) |
| (14,579) |
Santander Securities Services Brasil DTVM S.A. (4) (9) |
|
| (208,059) |
| (20,979) |
| (147,627) |
| (46,430) | |||
Santander Brasil Consórcio (3) |
|
|
|
|
| (99,402) |
| (9,755) |
| (67,831) |
| (3,049) |
Santander Paraty(3)(Note 2) |
|
|
|
|
| - |
| - |
| (74,765) |
| - |
Santander FI Hedge Strategies (3) (Note 2) |
|
|
| (462,928) |
| - |
| - |
| - | ||
Santander Capitalização S.A.(3) |
|
|
|
| (3,836) |
| - |
| (8,024) |
| - | |
Santander CCVM(3) |
|
|
|
|
| (41,595) |
| (7,375) |
| (76,689) |
| (11,476) |
Santander FI SBAC(3) |
|
|
|
|
| - |
| - |
| (15,726) |
| (175) |
Santander Securities Services Brasil Participações S.A. (4) |
| (52,484) |
| (4,119) |
| - |
| - | ||||
Super Pagamentos(3) |
|
|
|
|
| (28,891) |
| (2,723) |
| - |
| - |
Webcasas S.A. (3) |
|
|
|
|
| (22,366) |
| (2,790) |
| (20,224) |
| (499) |
Santander Brasil EFC(3) |
|
|
|
|
| (1,323,399) |
| - |
| - |
| - |
Others |
|
|
|
|
| (38,642) |
| (4,427) |
| (49,306) |
| (861) |
92
Repurchase Commitments |
|
|
|
|
| (10,793,632) |
| (2,555,686) |
| (12,780,319) |
| (3,377,145) |
Fundo de Investimento Santillana(4) |
|
|
| (153,647) |
| (31,097) |
| - |
| - | ||
Getnet S.A.(3) |
|
|
|
|
| (331,729) |
| (21,050) |
| (104,485) |
| (10,135) |
Santander FI Amazonas(3) |
|
|
|
|
| (54,197) |
| (21,790) |
| (176,971) |
| (21,631) |
Santander FI Financial (3) |
|
|
|
|
| (9,840,206) |
| (1,210,228) |
| (8,634,290) |
| (1,000,634) |
Santander Leasing(3) |
|
|
|
|
| - |
| (1,236,426) |
| (3,664,176) |
| (2,166,363) |
Banco Bandepe(3) |
|
|
|
|
| (740) |
| (5,102) |
| (54,239) |
| (1,353) |
Olé Consignado (Atual Denominação Social do Banco Bonsucesso Consignado S.A.)(3) (10) |
| (6,000) |
| (151) |
| - |
| - | ||||
Santander CCVM(3) |
|
|
|
|
| (6,904) |
| (1,404) |
| (9,055) |
| (1,741) |
Santander FI SBAC(3) |
|
|
|
|
| (3,296) |
| (37) |
| (22,858) |
| (262) |
Santander FI Guarujá(3) |
|
|
|
|
| (68,334) |
| (4,091) |
| - |
| - |
Santander Brasil Gestão de Recursos Ltda. (6) |
|
|
| - |
| - |
| (41,192) |
| (11,835) | ||
SAM Brasil Participações S.A. (3) |
|
|
| - |
| (3) |
| (825) |
| (218) | ||
Santander Securities Services Brasil Participações S.A. (4) |
| - |
| - |
| - |
| (71,925) | ||||
Santander FI Diamantina (3) |
|
|
|
|
| (6,503) |
| (6,782) |
| (60,300) |
| (6,522) |
Super Pagamentos(3) |
|
|
|
|
| - |
| - |
| (11,928) |
| (2,973) |
Santander Brasil Advisory(3) |
|
|
|
|
| - |
| - |
| - |
| (1,414) |
Webmotors S.A.(7) |
|
|
|
|
| - |
| - |
| - |
| (2,584) |
Santander Brasil Consórcio(3) |
|
|
|
|
| - |
| - |
| - |
| (5,408) |
Isban Brasil S.A.(4) |
|
|
|
|
| - |
| - |
| - |
| (5,927) |
Produban Serviços de Informática S.A. (4) |
|
|
| - |
| - |
| - |
| (2,268) | ||
Webcasas S.A.(3) |
|
|
|
|
| - |
| - |
| - |
| (1,954) |
Santander Participações(3) |
|
|
|
|
| - |
| - |
| - |
| (60,193) |
Santander Microcrédito(3) |
|
|
|
|
| - |
| - |
| - |
| (1,028) |
Banco PSA (3) |
|
|
|
|
| (321,700) |
| (16,689) |
| - |
| - |
Others |
|
|
|
|
| (376) |
| (836) |
| - |
| (777) |
Funds from Acceptance and Issuance of Securities |
| (10,886) |
| (860) |
| - |
| - | ||||
Super Pagamentos (3) |
|
|
|
|
| (10,886) |
| (860) |
| - |
| - |
Borrowings and Onlendings |
|
|
|
|
| (183,741) |
| - |
| (239,538) |
| - |
Banco Santander Espanha(2) |
|
|
|
|
| (181,051) |
| - |
| (217,677) |
| - |
Banco Santander S.A. (Uruguay)(4) |
|
|
| (2,158) |
| - |
| (20,533) |
| - | ||
Banco Santander Río S.A.(4) |
|
|
|
|
| (532) |
| - |
| - |
| - |
Santander Trade Services, Ltd. (4) |
|
|
| - |
| - |
| (1,328) |
| - | ||
Dividends and Bonuses Payables |
|
|
| (3,795,205) |
| - |
| (2,488,913) |
| - | ||
Banco Santander Espanha(2) |
|
|
|
|
| (589,227) |
| - |
| (385,067) |
| - |
Sterrebeeck B.V.(2) |
|
|
|
|
| (2,003,291) |
| - |
| (1,313,926) |
| - |
GES (2) (4) |
|
|
|
|
| (1,201,612) |
| - |
| (788,118) |
| - |
SIH (4) |
|
|
|
|
| - |
| - |
| (1,398) |
| - |
Banco Madesant - Sociedade Unipessoal, S.A.(Banco Madesant) (4) |
| (1,075) |
| - |
| (404) |
| - | ||||
Payables from Affiliates |
|
|
|
|
| (7,374) |
| (442,414) |
| (8,631) |
| (602,859) |
Produban Servicios Informáticos Generales, S.L. (Produban Servicios) (4) |
| - |
| (18,099) |
| - |
| - | ||||
Isban Brasil S.A.(4) |
|
|
|
|
| (339) |
| (121,977) |
| - |
| (95,736) |
Produban Serviços de Informática S.A. (4) |
|
|
| - |
| (190,862) |
| - |
| (148,412) | ||
Konecta Brazil Outsourcing Ltda.(4) |
|
|
| - |
| - |
| - |
| (98,492) | ||
Ingenieria de Software Bancário, S.L. (Ingeniería) (4) |
|
|
| - |
| (16,634) |
| - |
| - | ||
Santander Microcrédito(3) |
|
|
|
|
| (3,595) |
| (39,151) |
| (6,903) |
| (36,719) |
Banco Santander Espanha(2) |
|
|
|
|
| (372) |
| - |
| - |
| (511) |
Santander Leasing(3) |
|
|
|
|
| - |
| - |
| - |
| (187,177) |
Getnet S.A.(3) |
|
|
|
|
| (1,820) |
| (17,973) |
| (753) |
| (7,983) |
Universia Brasil, S.A.(4) |
|
|
|
|
| - |
| - |
| - |
| (3,000) |
Santander Securities Services Brasil DTVM S.A.(4) (9) |
|
| (1,179) |
| (35,882) |
| (899) |
| (21,754) | |||
Others |
|
|
|
|
| (69) |
| (1,836) |
| (76) |
| (3,075) |
Debt Instruments Eligible to Compose Capital |
|
|
| (7,859,649) |
| (225,161) |
| (9,435,823) |
| (424,529) | ||
Banco Santander Espanha(2) (8) |
|
|
|
| (7,859,649) |
| (225,161) |
| (9,435,823) |
| (424,529) | |
Donations |
|
|
|
|
| - |
| (13,400) |
| - |
| (10,200) |
Fundação Sudameris |
|
|
|
|
| - |
| (13,400) |
| - |
| (10,200) |
93
Other Payables - Others |
|
|
|
|
| (34,969) |
| (1,167,366) |
| (68,944) |
| (1,222,553) | ||
Banco Santander Espanha(2) |
|
|
|
|
| - |
| (3,250) |
| - |
| (16,564) | ||
Isban Brasil S.A. (4) |
|
|
|
|
| - |
| (296,651) |
| - |
| (298,604) | ||
TecBan(7) |
|
|
|
|
| - |
| (213,194) |
| - |
| (160,563) | ||
Ingeniería(4) |
|
|
|
|
| - |
| (37,253) |
| - |
| (56,441) | ||
Produban Serviços de Informática S.A. (4) |
|
|
| - |
| (51,371) |
| - |
| (57,507) | ||||
Produban Servicios(4) |
|
|
|
|
| - |
| (1,540) |
| - |
| (21,438) | ||
Aquanima Brasil Ltda.(4) |
|
|
|
|
| - |
| (24,557) |
| - |
| (24,075) | ||
Zurich Santander Brasil Seguros e Previdência S.A.(6) |
| (18,680) |
| (18,680) |
| - |
| - | ||||||
Getnet S.A.(3) |
|
|
|
|
| (13,038) |
| (496,357) |
| (66,367) |
| (584,642) | ||
Santander Securities Services Brasil DTVM S.A. (4) (9) |
|
| (3,251) |
| (18,926) |
| (2,577) |
| (899) | |||||
Others |
|
|
|
|
| - |
| (5,587) |
| - |
| (1,820) | ||
|
|
|
|
|
|
|
|
|
|
|
|
|
|
|
|
|
|
|
|
|
|
|
|
|
|
| Consolidated | ||
Assets | Income | Assets | Income | |||||||||||
(Liabilities) |
| (Expenses) | (Liabilities) |
| (Expenses) | |||||||||
01/01 to | 01/01 to | |||||||||||||
|
|
|
|
|
|
|
| 12/31/2016 |
| 12/31/2016 |
| 12/31/2015 |
| 12/31/2015 |
Cash |
|
|
|
|
| 584,983 |
| - |
| 1,868,163 |
| - | ||
Banco Santander Espanha(2) |
|
|
|
|
| 582,571 |
| - |
| 1,866,694 |
| - | ||
Banco Santander (México), S.A.(4) |
|
|
| 1,034 |
| - |
| 65 |
| - | ||||
Banco Santander Totta, S.A.(4) |
|
|
|
|
| 1,261 |
| - |
| 1,303 |
| - | ||
Others |
|
|
|
|
| 117 |
| - |
| 101 |
| - | ||
Interbank Investments |
|
|
|
|
| 10,269,812 |
| 37,381 |
| 20,699,539 |
| 31,374 | ||
Banco Santander Espanha(1) (2) |
|
|
| 10,269,812 |
| 37,381 |
| 20,699,539 |
| 31,374 | ||||
Derivatives Financial Instruments - Net |
|
|
| (326,986) |
| 84,249 |
| (944,627) |
| 691,806 | ||||
Santander Benelux(4) |
|
|
|
|
| - |
| - |
| - |
| 407,395 | ||
Fundo de Investimento Santillana (4) |
|
|
| (155,095) |
| 257,475 |
| (379,239) |
| 602,557 | ||||
Abbey National Treasury(4) |
|
|
|
|
| (91,828) |
| 38,274 |
| (156,976) |
| (88,881) | ||
Banco Santander Espanha(2) |
|
|
|
|
| (80,063) |
| (211,500) |
| (408,412) |
| (229,265) | ||
Trading Account |
|
|
|
|
| 154,823 |
| 7,949 |
| 831,967 |
| 649,645 | ||
Banco Santander Espanha(2) |
|
|
|
|
| 62,705 |
| 7,949 |
| 696,802 |
| 649,541 | ||
Abbey National Treasury (4) |
|
|
|
|
| 92,118 |
| - |
| 135,165 |
| 104 | ||
Foreign Exchange Portfolio - Net |
|
|
| (104,243) |
| 15,300 |
| 142,919 |
| (695,477) | ||||
Banco Santander Espanha(2) |
|
|
|
|
| (104,243) |
| 15,300 |
| 142,919 |
| (712,263) | ||
Santander Benelux(4) |
|
|
|
|
| - |
| - |
| - |
| 16,786 | ||
Receivables from Affiliates |
|
|
|
|
| 862,893 |
| 1,954,866 |
| 753,767 |
| 1,889,846 | ||
Zurich Santander Brasil Seguros e Previdência S.A.(6) |
| 862,553 |
| 1,730,006 |
| 753,581 |
| 1,637,438 | ||||||
Zurich Santander Brasil Seguros S.A.(6) |
|
|
| - |
| 220,869 |
| - |
| 250,063 | ||||
Santander Brasil Asset (6) |
|
|
|
|
| - |
| - |
| - |
| 1,243 | ||
Others |
|
|
|
|
| 340 |
| 3,991 |
| 186 |
| 1,102 | ||
Non-Operating Result |
|
|
|
|
| - |
| - |
| - |
| 784,954 | ||
Capital Riesgo Global(4) |
|
|
|
|
| - |
| - |
| - |
| 34,404 | ||
Santander Securities Services Brasil Participações S.A. (4)(Nota 33) |
| - |
| - |
| - |
| 750,550 | ||||||
Other Receivables - Others |
|
|
|
|
| 188,337 |
| 34,692 |
| 247,744 |
| 21,240 | ||
Banco Santander Espanha(2) |
|
|
|
|
| 188,337 |
| 8,531 |
| 247,744 |
| 7,651 | ||
Banco Santander International(4) |
|
|
| - |
| 20,959 |
| - |
| 8,804 | ||||
Others |
|
|
|
|
|
|
| - |
| 5,202 |
| - |
| 4,785 |
Non - Current Assets Held for Sale (Note 13) |
|
|
| - |
| - |
| 487,386 |
| - | ||||
BW Guirapá I S.A. (3) |
|
|
|
|
|
|
| - |
| - |
| 487,386 |
| - |
94
Deposits |
|
|
|
|
| (1,169,362) |
| (133,762) |
| (857,383) |
| (23,962) | ||
Banco Santander Espanha(2) |
|
|
|
|
| (1,556) |
| - |
| (1,360) |
| - | ||
Zurich Santander Brasil Seguros S.A.(6) |
|
|
| (8,725) |
| - |
| (23,878) |
| - | ||||
Zurich Santander Brasil Seguros e Previdência S.A.(6) |
| (44,840) |
| - |
| (95,537) |
| - | ||||||
Isban Brasil S.A. (4) |
|
|
|
|
| (22,232) |
| (3,560) |
| (43,842) |
| (1,914) | ||
Produban Serviços de Informática S.A. (4) |
|
|
| (19,653) |
| (2,117) |
| (29,993) |
| (1,484) | ||||
Santander Brasil Gestão de Recursos Ltda. (6) |
|
|
| (39,361) |
| (12,417) |
| (30,990) |
| (2,467) | ||||
Fundo de Investimento Santillana (4) |
|
|
| (757,874) |
| (88,467) |
| (616,399) |
| (15,584) | ||||
Santander Brasil Asset(6) |
|
|
|
|
| (12,079) |
| (1,760) |
| (12,360) |
| (2,113) | ||
Santander Securities Services Brasil DTVM S.A.(4) (9) |
|
| (208,059) |
| (20,979) |
| - |
| - | |||||
Santander Securities Services Brasil Participações S.A. (4) |
| (52,484) |
| (4,119) |
| - |
| - | ||||||
Others |
|
|
|
|
| (2,499) |
| (343) |
| (3,024) |
| (400) | ||
Repurchase Commitments |
|
|
|
|
| (153,647) |
| (31,100) |
| (42,017) |
| (92,307) | ||
Produban Serviços de Informática S.A. (4) |
|
|
| - |
| - |
| - |
| (2,268) | ||||
Isban Brasil S.A.(4) |
|
|
|
|
| - |
| - |
| - |
| (5,927) | ||
Santander Brasil Gestão de Recursos Ltda. (6) |
|
|
| - |
| - |
| (41,192) |
| (11,835) | ||||
SAM Brasil Participações S.A. (6) |
|
|
| - |
| (3) |
| (825) |
| (218) | ||||
Santander Securities Services Brasil Participações S.A. (4) |
| - |
| - |
| - |
| (71,925) | ||||||
Fundo de Investimento Santillana(4) |
|
|
| (153,647) |
| (31,097) |
| - |
| - | ||||
Universia Brasil, S.A.(4) |
|
|
|
|
| - |
| - |
| - |
| (134) | ||
Borrowings and Onlendings |
|
|
|
|
| (183,741) |
| - |
| (239,538) |
| - | ||
Banco Santander Espanha (2) |
|
|
|
|
| (181,051) |
| - |
| (217,677) |
| - | ||
Banco Santander S.A. (Uruguay)(4) |
|
|
| (2,158) |
| - |
| (20,533) |
| - | ||||
Banco Santander Río S.A. (4) |
|
|
|
|
| (532) |
| - |
| - |
| - | ||
Santander Trade Services, Ltd. (4) |
|
|
| - |
| - |
| (1,328) |
| - | ||||
Dividends and Bonuses Payables |
|
|
| (3,810,624) |
| - |
| (2,488,509) |
| - | ||||
Sterrebeeck B.V.(2) |
|
|
|
|
| (2,003,291) |
| - |
| (1,313,926) |
| - | ||
GES (2)(4) |
|
|
|
|
| (1,201,612) |
| - |
| (788,118) |
| - | ||
SIH(4) |
|
|
|
|
| (15,419) |
| - |
| (1,398) |
| - | ||
Banco Santander Espanha(2) |
|
|
|
|
| (589,227) |
| - |
| (385,067) |
| - | ||
Banco Madesant (4) |
|
|
|
|
| (1,075) |
| - |
| - |
| - | ||
Payables from Affiliates |
|
|
|
|
| (4,542) |
| (394,684) |
| (443) |
| (364,086) | ||
Banco Santander Espanha(2) |
|
|
|
|
| (2,954) |
| (547) |
| - |
| (783) | ||
Produban Servicios(4) |
|
|
|
|
| - |
| (19,729) |
| - |
| (1,083) | ||
Isban Brasil S.A.(4) |
|
|
|
|
| (339) |
| (127,187) |
| (375) |
| (105,508) | ||
Produban Serviços de Informática S.A. (4) |
|
|
| - |
| (191,095) |
| - |
| (149,098) | ||||
Ingeniería(4) |
|
|
|
|
| - |
| (16,634) |
| - |
| - | ||
Konecta Brazil Outsourcing Ltda.(4) |
|
|
| - |
| - |
| - |
| (98,492) | ||||
Santander Brasil Asset(6) |
|
|
|
|
| (70) |
| (2,604) |
| (68) |
| (2,033) | ||
Zurich Santander Brasil Seguros e Previdência S.A.(6) |
| - |
| - |
| - |
| (2,329) | ||||||
Santander Securities Services Brasil DTVM S.A.(4) (9) |
|
| (1,179) |
| (35,882) |
| - |
| - | |||||
Others |
|
|
|
|
| - |
| (1,006) |
| - |
| (4,760) | ||
Debt Instruments Eligible to Compose Capital |
|
|
| (7,859,649) |
| (225,161) |
| (9,435,823) |
| (424,529) | ||||
Banco Santander Espanha(2) (8) |
|
|
|
| (7,859,649) |
| (225,161) |
| (9,435,823) |
| (424,529) | |||
Donations |
|
|
|
|
| - |
| (20,528) |
| - |
| (17,618) | ||
Santander Cultural |
|
|
|
|
| - |
| (2,737) |
| - |
| (2,778) | ||
Fundação Sudameris |
|
|
|
|
| - |
| (13,400) |
| - |
| (10,200) | ||
Fundação Santander |
|
|
|
|
| - |
| (3,452) |
| - |
| (3,500) | ||
Instituto Escola Brasil |
|
|
|
|
| - |
| (939) |
| - |
| (1,140) | ||
Other Payables - Other |
|
|
|
|
| (30,684) |
| (468,936) |
| (16,589) |
| (495,323) | ||
Banco Santander Espanha(2) |
|
|
|
|
| - |
| (3,256) |
| - |
| (16,564) | ||
Isban Brasil S.A.(4) |
|
|
|
|
| - |
| (310,863) |
| - |
| (313,271) | ||
Produban Serviços de Informática S.A. (4) |
|
|
| - |
| (52,754) |
| - |
| (58,795) | ||||
Ingeniería(4) |
|
|
|
|
| - |
| (37,571) |
| - |
| (57,375) | ||
Produban Servicios(4) |
|
|
|
|
| - |
| (1,540) |
| - |
| (21,766) | ||
Aquanima Brasil Ltda.(4) |
|
|
|
|
| - |
| (24,557) |
| - |
| (24,075) | ||
Zurich Santander Brasil Seguros e Previdência S.A.(6) |
| (30,684) |
| (18,680) |
| (13,969) |
| (1,815) | ||||||
Santander Securities Services Brasil DTVM S.A.(4) (9) |
|
| - |
| (18,926) |
| - |
| - | |||||
Others |
|
|
|
|
| - |
| (789) |
| (2,620) |
| (1,662) | ||
(1) Refers to investments in foreign currency (overnight) with maturity on January 3, 2017 and interest rates of 0.68% p.a. (12/31/2015 - with maturity on January 4, 2016 and interest rates of 0.17% p.a.) maintained by the Bank's Santander Brasil and its Grand Cayman Branch. | ||||||||||||||
(2) Controller - Banco Santander is indirectly controlled by Banco Santander Spain (Note 1 and 26.d), through its subsidiary GES and Sterrebeeck B.V. | ||||||||||||||
95
(3) Controlled - Banco Santander. | ||||||||||||||
(4) Controlled - Banco Santander Spain. | ||||||||||||||
(5) Jointly Controlled - Banco Santander. | ||||||||||||||
(6) Affiliate - Banco Santander Spain. | ||||||||||||||
(7) Jointly Controlled - Santander Serviços. | ||||||||||||||
(8)Refers to the portion acquired by the Parent Due to Regulatory Capital Optimization Plan held in the first half of 2014. | ||||||||||||||
(9) On August 31, 2015 it was sold all shares of Santander Securities Services Brasil DTVM S.A. to Santander Securities Services Brasil Participações S.A., indirectly controlled by Banco Santander Espanha (Note 15 and 37.d). | ||||||||||||||
(10) At the ESM of March 3, 2016 was approved the change from the name of Banco Bonsucesso Consignado S.A. for Banco Olé Bonsucesso Consignado S.A., the change process has been approved by the Bacen on June 1, 2016 (Note 15). | ||||||||||||||
(11) Corresponds to receivable values related to the Acquiring business. | ||||||||||||||
27. Income from Services Rendered and Banking Fees | ||||||||||||||
| ||||||||||||||
|
|
|
|
|
|
|
|
|
| Bank |
|
|
| Consolidated |
01/01 to | 01/01 to | 01/01 to | 01/01 to | |||||||||||
|
|
|
|
|
|
|
| 12/31/2016 |
| 12/31/2015 |
| 12/31/2016 |
| 12/31/2015 |
Asset Management |
|
|
|
|
| 1,036,175 |
| 925,562 |
| 1,077,052 |
| 1,027,554 | ||
Checking Account Services |
|
|
|
|
| 2,222,159 |
| 1,768,576 |
| 2,589,892 |
| 2,052,365 | ||
Lending Operations and Income from Guarantees Provided |
| 1,103,111 |
| 1,087,760 |
| 1,426,724 |
| 1,380,484 | ||||||
Lending Operations |
|
|
|
|
| 526,779 |
| 578,140 |
| 850,392 |
| 872,656 | ||
Income Guarantees Provided |
|
|
|
|
| 576,332 |
| 509,620 |
| 576,332 |
| 507,828 | ||
Insurance Fees |
|
|
|
|
| 1,994,293 |
| 1,929,034 |
| 2,210,551 |
| 1,986,909 | ||
Cards (Debit and Credit) and Acquiring Services |
|
|
| 3,149,818 |
| 3,007,569 |
| 4,038,494 |
| 3,412,127 | ||||
Collection |
|
|
|
|
|
|
| 1,219,081 |
| 1,024,827 |
| 1,223,895 |
| 1,024,827 |
Brokerage, Custody and Placement of Securities |
|
|
|
|
|
|
| 411,484 |
| 357,686 |
| 544,785 |
| 515,768 |
Others |
|
|
|
|
| 172,383 |
| 136,368 |
| 606,859 |
| 467,407 | ||
Total |
|
|
|
|
| 11,308,504 |
| 10,237,382 |
| 13,718,252 |
| 11,867,441 | ||
28. Personnel Expenses | ||||||||||||||
|
|
|
|
|
|
|
|
|
|
|
|
|
|
|
|
|
|
|
|
|
|
|
|
| Bank |
|
|
| Consolidated |
01/01 to | 01/01 to | 01/01 to | 01/01 to | |||||||||||
|
|
|
|
|
|
|
| 12/31/2016 |
| 12/31/2015 |
| 12/31/2016 |
| 12/31/2015 |
Compensation |
|
|
|
|
| 4,019,028 |
| 3,372,864 |
| 4,445,079 |
| 3,784,553 | ||
Charges |
|
|
|
|
| 1,420,702 |
| 1,432,448 |
| 1,571,139 |
| 1,568,637 | ||
Benefits |
|
|
|
|
| 1,354,269 |
| 1,216,373 |
| 1,467,289 |
| 1,324,495 | ||
Training |
|
|
|
|
| 59,812 |
| 90,165 |
| 70,292 |
| 99,120 | ||
Others |
|
|
|
|
| 29,080 |
| 41,478 |
| 40,876 |
| 42,063 | ||
Total |
|
|
|
|
| 6,882,891 |
| 6,153,328 |
| 7,594,675 |
| 6,818,868 | ||
29. Other Administrative Expenses | ||||||||||||||
| ||||||||||||||
|
|
|
|
|
|
|
|
|
| Bank |
|
|
| Consolidated |
01/01 to | 01/01 to | 01/01 to | 01/01 to | |||||||||||
|
|
|
|
|
|
|
| 12/31/2016 |
| 12/31/2015 |
| 12/31/2016 |
| 12/31/2015 |
Depreciation and Amortization(1) |
|
|
| 3,170,728 |
| 4,325,941 |
| 3,626,805 |
| 4,673,817 | ||||
Outsourced and Specialized Services |
|
|
| 1,808,057 |
| 1,854,932 |
| 2,179,100 |
| 2,177,667 | ||||
Communications |
|
|
|
|
| 435,854 |
| 469,955 |
| 489,645 |
| 518,110 | ||
Data Processing |
|
|
|
|
| 1,468,375 |
| 1,336,467 |
| 1,595,749 |
| 1,428,903 | ||
Advertising, Promotions and Publicity |
|
|
| 354,821 |
| 364,534 |
| 436,283 |
| 430,800 | ||||
Rentals |
|
|
|
|
| 694,075 |
| 677,827 |
| 747,997 |
| 724,863 | ||
Transportation and Travel |
|
|
|
|
| 160,297 |
| 175,065 |
| 209,903 |
| 222,556 | ||
Financial System Services |
|
|
|
|
| 191,066 |
| 173,686 |
| 250,671 |
| 230,548 | ||
Security and Money Transport |
|
|
|
|
| 623,405 |
| 616,497 |
| 690,522 |
| 661,815 | ||
Asset Maintenance and Upkeep |
|
|
|
|
| 216,115 |
| 201,120 |
| 252,869 |
| 227,754 | ||
Water, Electricity and Gas |
|
|
|
|
| 200,726 |
| 209,286 |
| 206,536 |
| 214,267 | ||
Materials |
|
|
|
|
| 63,412 |
| 73,879 |
| 68,115 |
| 78,325 | ||
Others |
|
|
|
|
| 355,618 |
| 297,446 |
| 554,813 |
| 436,567 | ||
Total |
|
|
|
|
| 9,742,549 |
| 10,776,635 |
| 11,309,008 |
| 12,025,992 | ||
|
|
|
|
|
|
|
|
|
|
|
|
|
|
|
(1) Includes goodwill amortization of R$1,618,857 (2015 - R$2,752,279) Bank and R$1,805,572 (2015 - R$2,782,098) Consolidated, held on time, length and proportion of the projected results which are subject to annual verification (Note 17). | ||||||||||||||
96
30. Tax Expenses | ||||||||||||||
| ||||||||||||||
|
|
|
|
|
|
|
|
|
| Bank |
|
|
| Consolidated |
01/01 to | 01/01 to | 01/01 to | 01/01 to | |||||||||||
|
|
|
|
|
|
|
| 12/31/2016 |
| 12/31/2015 |
| 12/31/2016 |
| 12/31/2015 |
Cofins (Contribution for Social Security Financing) (1) |
|
|
| 2,176,536 |
| 428,583 |
| 2,562,229 |
| 749,121 | ||||
ISS (Tax on Services) |
|
|
|
|
| 420,975 |
| 370,977 |
| 502,873 |
| 443,594 | ||
PIS/Pasep (Tax on Revenue)(1) |
|
|
|
|
| 353,687 |
| 69,645 |
| 445,787 |
| 151,324 | ||
Others(2) |
|
|
|
|
| 375,439 |
| 383,745 |
| 533,037 |
| 526,872 | ||
Total |
|
|
|
|
| 3,326,637 |
| 1,252,950 |
| 4,043,926 |
| 1,870,911 | ||
(1) Includes the constitution of deferred taxes assets PIS and Cofins on adjustment to market value of securities and derivative financial instruments. | ||||||||||||||
(2) Includes provisions updates for PIS and Cofins of Law 9,718/1998. | ||||||||||||||
31. Other Operating Income | ||||||||||||||
|
|
|
|
|
|
|
|
|
|
|
|
|
|
|
|
|
|
|
|
|
|
|
|
| Bank |
|
|
| Consolidated |
01/01 to | 01/01 to | 01/01 to | 01/01 to | |||||||||||
|
|
|
|
|
|
|
| 12/31/2016 |
| 12/31/2015 |
| 12/31/2016 |
| 12/31/2015 |
Net Income Pension and Capitalization |
| - |
| - |
| 319,559 |
| 261,487 | ||||||
Reversal of Operational Provisions - Tax (Note 23.c)(1) |
| 149,719 |
| 6,889,622 |
| 216,366 |
| 6,869,987 | ||||||
Monetary Adjustment of Escrow Deposits |
|
|
| 560,860 |
| 486,300 |
| 764,020 |
| 663,233 | ||||
Recoverable Taxes (2) |
|
|
|
|
| 136,115 |
| 905,081 |
| 220,487 |
| 989,972 | ||
Recovery of Charges and Expenses |
|
|
| 1,221,824 |
| 1,169,644 |
| 921,784 |
| 927,041 | ||||
Monetary Variation |
|
|
|
|
| 1,252,906 |
| 1,000,571 |
| 1,254,415 |
| 1,002,475 | ||
Others (2) |
|
|
|
|
| 117,382 |
| 388,951 |
| 506,336 |
| 384,795 | ||
Total |
|
|
|
|
| 3,438,806 |
| 10,840,169 |
| 4,202,967 |
| 11,098,990 | ||
(1) In 2015, Bank and Consolidated, includes the reversal of the provisions for Cofins (Note 23.e). | ||||||||||||||
(2) In 2015, Bank and Consolidated, includes the amount of R$381,598, related to Cofins asset, released under the item "Others" and the amount of R$383,561 related to Cofins asset interests released under "Recoverable Taxes" as a result of a favorable decision obtained by Banco Santander on the injunction that removed the applicability of Law 9,718/1998, paid from 1999 to 2006 (Note 23.e). | ||||||||||||||
32. Other Operating Expenses | ||||||||||||||
|
|
|
|
|
|
|
|
|
|
|
|
|
|
|
|
| Bank |
|
|
| Consolidated | ||||||||
01/01 to | 01/01 to | 01/01 to | 01/01 to | |||||||||||
|
|
|
|
|
|
|
| 12/31/2016 |
| 12/31/2015 |
| 12/31/2016 |
| 12/31/2015 |
Operating Provisions |
|
|
|
|
|
|
|
|
|
|
|
| ||
Labor (Note 23.c) |
|
|
|
|
| 1,224,189 |
| 1,260,233 |
| 1,318,798 |
| 1,301,818 | ||
Civil (Note 23.c) |
|
|
|
|
| 368,919 |
| 716,872 |
| 512,798 |
| 851,342 | ||
Credit Cards |
|
|
|
|
| 1,589,299 |
| 2,005,353 |
| 1,204,040 |
| 1,458,418 | ||
Actuarial Losses - Pension Plan (Note 35.a) |
|
|
| 258,226 |
| 301,353 |
| 258,275 |
| 301,369 | ||||
Monetary Losses |
|
|
|
|
| 5,281 |
| 54,171 |
| 10,799 |
| 55,289 | ||
Legal Fees and Costs |
|
|
|
|
| 116,686 |
| 97,533 |
| 144,664 |
| 124,241 | ||
Serasa and SPC (Credit Reporting Agency) |
|
|
| 73,860 |
| 79,193 |
| 83,780 |
| 91,975 | ||||
Brokerage Fees |
|
|
|
|
| 64,362 |
| 77,489 |
| 70,051 |
| 78,231 | ||
Commissions |
|
|
|
|
| 44,038 |
| 69,873 |
| 506,740 |
| 274,084 | ||
Impairment (1) |
|
|
|
|
| 142 |
| 1,184,881 |
| 147 |
| 1,186,434 | ||
Others (2) |
|
|
|
|
| 2,718,164 |
| 2,781,201 |
| 3,883,919 |
| 2,943,590 | ||
Total |
|
|
|
|
| 6,463,166 |
| 8,628,152 |
| 7,994,011 |
| 8,666,791 | ||
(1) In 2015, Bank and Consolidated, includes impairment losses recorded by the purchase of rights on the provision of payroll services in the amount of R$534,281, and by assets in the acquisition and development of software in the amount of R$674,780. The loss on the rights in the acquisition of payrolls was recorded especially the consolidation of portability rules, consequently was recorded the reduction of return value expected in the management of payrolls and the historic of breach of contract. The loss in the acquisition and development of software was recorded due to the obsolescence and discontinuity of such softwares (Note 17). | ||||||||||||||
(2) Includes, mainly, inflation adjustment of provisions for legal and administrative proceedings and legal obligations, provisions for the guarantee fund benefits and other provisions. | ||||||||||||||
97
33. Non-Operating Result | ||||||||||||||
| ||||||||||||||
|
| Bank |
|
|
| Consolidated | ||||||||
01/01 to | 01/01 to | 01/01 to | 01/01 to | |||||||||||
|
|
|
|
|
|
|
| 12/31/2016 |
| 12/31/2015 |
| 12/31/2016 |
| 12/31/2015 |
Result of Investments(1) |
|
|
|
|
| - |
| 778,442 |
| (1,631) |
| 803,251 | ||
Result on Sale of Other Assets |
|
|
|
|
| 1,492 |
| 43,747 |
| 2,203 |
| 45,009 | ||
Reversal (Recognition) of Allowance for Losses on Other Assets |
|
| (4,731) |
| (24,269) |
| (5,361) |
| (24,113) | |||||
Expense on Assets Not in Use |
|
|
|
|
| (12,538) |
| (9,411) |
| (16,012) |
| (12,767) | ||
Gains (Losses) of Capital |
|
|
|
|
| (3,325) |
| 5,536 |
| (10,819) |
| 4,750 | ||
Other Income (Expenses) (2) |
|
|
|
|
| (412,895) |
| (257,011) |
| (383,981) |
| (249,723) | ||
Total |
|
|
|
|
| (431,997) |
| 537,034 |
| (415,601) |
| 566,407 | ||
(1) In 2015, includes the amount of R$34,503 Bank and R$60,203 Consolidated, profit on disposal of non-current assets held for sale (Note 13) and Bank and Consolidated the amount of R$750,550 related due to the gain on the sale of Santander Securities Services Brasil DTVM S.A. (Note 37.d). | ||||||||||||||
(2) In the Bank and Consolidated, includes the amount of R$450,284 (2015 - 301,447), related to the establishment of the Efficiency and Productivity Fund. | ||||||||||||||
34. Income Tax and Social Contribution | ||||||||||||||
| ||||||||||||||
|
| Bank |
|
|
| Consolidated | ||||||||
01/01 to | 01/01 to | 01/01 to | 01/01 to | |||||||||||
|
|
|
|
|
|
|
| 12/31/2016 |
| 12/31/2015 |
| 12/31/2016 |
| 12/31/2015 |
Income Before Taxes on Income and Profit Sharing |
| 12,630,215 |
| (494,241) |
| 13,363,293 |
| 188,909 | ||||||
Profit Sharing (1) |
|
|
|
|
| (1,136,534) |
| (1,180,148) |
| (1,208,821) |
| (1,260,368) | ||
Interest on Capital |
|
|
|
|
| (3,850,000) |
| (1,400,000) |
| (3,926,943) |
| (1,446,580) | ||
Unrealized Results |
|
|
|
|
| - |
| - |
| (71) |
| (142) | ||
Income Before Taxes |
|
| 7,643,681 |
| (3,074,389) |
| 8,227,458 |
| (2,518,181) | |||||
Total Income and Social Contribution Tax at the Rates of 25% and 20%, Respectively(4) |
| (3,439,656) |
| 1,383,475 |
| (3,702,356) |
| 1,133,182 | ||||||
Equity in Subsidiaries(2) |
|
| 341,438 |
| 640,449 |
| 665 |
| 677 | |||||
Nondeductible Expenses, Net of Non-Taxable Income |
|
| 264,017 |
| 141,776 |
| 348,533 |
| 268,724 | |||||
Exchange Variation - Foreign Branches |
|
| (3,561,133) |
| 5,913,741 |
| (3,561,133) |
| 5,913,741 | |||||
Income and Social Contribution Taxes on Temporary Differences and Tax Losses from Previous Exercises |
| 511,083 |
| 881,706 |
| 606,593 |
| 883,857 | ||||||
Effects of Change in Rate of CSLL(3) |
| - |
| - |
| 65,893 |
| 23,519 | ||||||
Other Adjustments Social Contribution Taxes 5%(4) |
| (548,195) |
| (84,980) |
| (660,605) |
| 189,319 | ||||||
Other Adjustments, Including Profits Provided Abroad |
|
| 460,402 |
| (218,880) |
| 405,693 |
| (151,955) | |||||
Income and Social Contribution Taxes |
| (5,972,044) |
| 8,657,287 |
| (6,496,717) |
| 8,261,064 | ||||||
|
|
|
|
|
|
|
|
|
|
|
|
|
|
|
(1) The basis of calculation is the net income, after IR and CSLL. | ||||||||||||||
(2) As a result of equity in subsidiaries are not included interest on capital received and receivable. | ||||||||||||||
(3) Effect of rate differences for the other non-financial companies, which the social contribution tax rate is 9%. | ||||||||||||||
(4) Temporary rate increase of CSLL from September 2015 to December 2018 (Note 3.s). | ||||||||||||||
Fiscal Hedge Grand Cayman Branch and the Subsidiary Santander Brasil EFC | ||||||||||||||
Banco Santander operate a branch in the Cayman Islands and a subsidiary called Santander Brazil Establecimiento Financiero de Credito, EFC, or “Santander Brasil EFC” (independent subsidiary in Spain) which are used mainly to raise funds in the capital and financial markets, providing credit lines that are extended to customers for trade-related financings and working capital (Note 14). | ||||||||||||||
To protect the exposures to foreign exchange rate variations, the Bank uses derivatives. According to Brazilian tax rules, the gains or losses resulting from the impact of appreciation or devaluation of the local currency (real) in foreign investments are nontaxable to PIS/Cofins/IR/CSLL, while gains or losses from derivatives used as hedges are taxable or deductible. The purpose of these derivatives are to protect the after-tax results. | ||||||||||||||
The different tax treatment of such foreign exchange rate differences results in a volatility on the operational earnings or losses and on the gross revenue tax expense (PIS/Cofins) and income taxes (IR/CSLL). Exchange rate variations arising from foreign investments recorded for the accumulated of period ended on December 31, 2016 an loss of R$7,408 million (2015 - gains of R$14,779 million). On the other hand, the derivatives contracted to cover these positions generated a gain in "Derivatives Transaction" of R$14,123 million (2015 - loss of R$26,311 million). The tax effect of these derivatives impacted the Tax Expenses line generating a tax loss of R$6,715 million (2015 - income of R$11,532 million) represented by R$657 million (2015 - R$1,223 million) of PIS/Cofins and R$6,058 million (2015 - R$10,309 million) IR/CSLL. | ||||||||||||||
98
35. Employee Benefit Plans - Post-Employment Benefits | ||||||||||||||
a) Supplemental Pension Plan | ||||||||||||||
Banco Santander and its subsidiaries sponsor the closed pension entities for the purpose of granting pensions and supplementary pensions granted by the Social Security, as defined in the basic regulations of each plan. | ||||||||||||||
I) Banesprev | ||||||||||||||
Plan I: defined benefit plan fully defrayed by Banco Santander, covers employees hired after May 22, 1975 called Participants Recipients, and those hired until May 22, 1975 called Participants Aggregates, who are also entitled to death benefits.Plan is closed to new entrants since March 28, 2005. | ||||||||||||||
Plan II: defined benefit plan, constituted from July 27, 1994, effective of the new text of the Statute and Regulations of the Basic Plan II, Plan I participants who chose the new plan began to contribute to the rate of 44.9% stipulated by the actuary for funding each year, introduced in April 2012 extraordinary cost to the sponsor and participants, as agreed with the PREVIC - Superintendence of Pension Funds, due to deficit in the plan.Plan is closed to new entrants since June 3, 2005. | ||||||||||||||
Plan V: defined benefit plan fully defrayed by Banco Santander, covers employees hired until May 22, 1975, closed and paid off. | ||||||||||||||
Supplemental Pension Plan Pré 75: defined benefit plan was created in view of the privatization of Banespa and is managed by Banesprev and offered only to employees hired before May 22, 1975, this Plan effective January 1, 2000.Plan is closed to new entrants since April 28, 2000. | ||||||||||||||
Plan III: variable contribution plan, for employees hired after May 22,1975, previously served by the Plans I and II. Under this plan contributions are made by the sponsor and the participants. The benefits are in the form of defined contribution during the period of contribution and defined benefit during the receipt of benefit, if paid as monthly income for life.Plan is closed to new entrants since September 1, 2005. | ||||||||||||||
Plan IV:variable contribution plan, designed for employees hired as of November 27, 2000, in which the sponsor only contributes to the risk benefits and administrative expenses. In this plan the benefit is set in the form of defined contribution during the period of contribution and defined benefit during the receipt of benefits in the form of monthly income for life, in whole or in part of the benefit. The risk benefits of the plan are in defined benefit.Plan is closed to new entrants since July 23, 2010. | ||||||||||||||
Three plans(DCA, DAB and CACIBAN): additional retirement and former employees associated pension, arising from the process of acquisition of the former Banco Meridional, established under the defined benefit plan.The plans are closed to new participants. | ||||||||||||||
II) Sanprev - Santander Associação de Previdência (Sanprev) | ||||||||||||||
Plan I:defined benefit plan, established on September 27, 1979, covering employees enrolled in the plan sponsor and is in process of extinction since June 30, 1996. | ||||||||||||||
Plan II: plan that provides insurance risk, pension supplement temporary, disability retirement annuity and the supplemental death and sickness allowance and birth, including employees enrolled in the plan sponsor and is funded solely by sponsors through monthly contributions, as indicated by the actuary.Plan is closed to new entrants since March 10, 2010. | ||||||||||||||
Plan III: variable contribution plan covering employees of the sponsors who made the choice to contribute, by contributing freely chosen by participants from 2% of salary contribution. That the benefit plan is a defined contribution during the contribution and defined benefit during the receipt of the benefit, being in the form of monthly income for life, in whole or in part of the benefit.Plan is closed to new entrants since March 10, 2010. | ||||||||||||||
III) Bandeprev - Bandepe Previdência Social (Bandeprev) | ||||||||||||||
Defined benefit plan, sponsored by Banco Bandepe and Banco Santander, managed by Bandeprev. The plans are divided into basic plan and special retirement supplement plan, with different eligibility requirements, contributions and benefits by subgroups of participants. The plans are closed to new entrants since 1999 for Banco Bandepe’s employees and for others since 2011. | ||||||||||||||
IV) Other Plans | ||||||||||||||
SantanderPrevi - Sociedade de Previdência Privada (SantanderPrevi): it´s a closed pension entity, which aims at setting up and implementation of benefit plans pension character, complementary to the general welfare, in the form of actual legislation. | ||||||||||||||
The Retirement Plan of SantanderPrevi is the only structured as Defined Contribution and open to new members, with contributions shared between sponsors and plan participants. The appropriate values by the sponsors in the year of 2016 was R$84,532 (2015 - R$76,537) Bank and R$87,603 (2015 - R$79,365) Consolidated. | ||||||||||||||
It has 10 cases of lifetime income with benefits arising from the previous plan. | ||||||||||||||
99
Determination of Liabilities (Assets) Net Actuarial | ||||||||||||||
|
|
|
|
|
|
|
|
|
|
|
|
|
|
|
Bank | ||||||||||||||
12/31/2016 | ||||||||||||||
Santander- | ||||||||||||||
|
|
|
|
|
|
|
| Banesprev(1) (2) |
| Sanprev |
| previ(1) |
| Bandeprev |
Conciliation of Assets and Liabilities |
|
|
|
|
|
|
|
|
|
|
|
| ||
Present Value of Actuarial Obligations |
|
|
|
|
| (18,800,949) |
| (470,844) |
| (3,300) |
| (1,255,406) | ||
Fair Value of Plan Assets |
|
|
|
|
| 17,202,141 |
| 797,480 |
| 4,473 |
| 1,662,153 | ||
|
|
|
|
|
|
|
| (1,598,808) |
| 326,636 |
| 1,173 |
| 406,747 |
Being: | ||||||||||||||
Superavit |
|
|
|
|
|
|
| 176,224 |
| 326,636 |
| 1,173 |
| 406,747 |
Deficit |
|
|
|
|
|
|
| (1,775,032) |
| - |
| - |
| - |
Amount not Recognized as Assets |
|
|
|
|
|
|
| 66,026 |
| 306,372 |
| 1,173 |
| 406,747 |
Net Actuarial Asset (Note 12) |
|
|
|
|
| 110,198 |
| 20,264 |
| - |
| - | ||
Net Actuarial Liability (Note 22) |
|
|
|
| (1,775,032) |
| - |
| - |
| - | |||
Payments Made(1) (2) |
|
|
|
|
| 1,989,176 |
| - |
| - |
| 457 | ||
Revenues (Expenses) Recorded (Note 32) |
|
|
|
| (255,720) |
| (2,049) |
| - |
| (457) | |||
Other Equity Valuation Adjustments |
|
|
|
| (3,091,368) |
| 11,323 |
| 488 |
| (672) | |||
Actual Return on Plan Assets |
|
|
|
|
| 2,914,934 |
| 151,690 |
| 995 |
| 361,089 | ||
|
|
|
|
|
|
|
|
|
|
|
|
|
|
|
Bank | ||||||||||||||
12/31/2015 | ||||||||||||||
Other | ||||||||||||||
|
|
|
|
|
|
|
| Banesprev(1) |
| Sanprev |
| Plans(1) |
| Bandeprev |
Conciliation of Assets and Liabilities |
|
|
|
|
|
|
|
|
|
|
|
| ||
Present Value of Actuarial Obligations |
|
|
|
|
| (15,510,009) |
| (371,542) |
| (347,248) |
| (1,097,263) | ||
Fair Value of Plan Assets |
|
|
|
|
| 13,776,984 |
| 695,021 |
| 3,938 |
| 1,416,380 | ||
|
|
|
|
|
|
|
| (1,733,025) |
| 323,479 |
| (343,310) |
| 319,117 |
Being: | ||||||||||||||
Superavit |
|
|
|
|
|
|
| 136,666 |
| 323,479 |
| 561 |
| 319,117 |
Deficit |
|
|
|
|
|
|
| (1,869,690) |
| - |
| (343,871) |
| - |
Amount not Recognized as Assets |
|
|
|
|
|
|
| 136,666 |
| 323,479 |
| 561 |
| 319,117 |
Net Actuarial Asset (Note 12) |
|
|
|
|
| - |
| - |
| - |
| - | ||
Net Actuarial Liability (Note 22) |
|
|
|
| (1,869,690) |
| - |
| (343,871) |
| - | |||
Payments Made |
|
|
|
|
| 277,505 |
| - |
| 47,683 |
| 6 | ||
Revenues (Expenses) Recorded (Note 32) |
|
|
|
| (265,028) |
| - |
| (35,756) |
| (569) | |||
Other Equity Valuation Adjustments |
|
|
|
| (1,623,643) |
| (10,989) |
| (278,910) |
| (672) | |||
Actual Return on Plan Assets |
|
|
|
|
| 1,150,251 |
| 118,029 |
| 490 |
| 104,068 | ||
|
|
|
|
|
|
|
|
|
|
|
|
|
|
|
Consolidated | ||||||||||||||
12/31/2016 | ||||||||||||||
Santander- | ||||||||||||||
|
|
|
|
|
|
|
| Banesprev(1) (2) |
| Sanprev |
| previ(1) |
| Bandeprev |
Conciliation of Assets and Liabilities |
|
|
|
|
|
|
|
|
|
|
|
| ||
Present Value of Actuarial Obligations |
|
|
|
|
| (19,039,252) |
| (471,168) |
| (3,300) |
| (1,255,406) | ||
Fair Value of Plan Assets |
|
|
|
|
| 17,652,316 |
| 797,974 |
| 4,473 |
| 1,662,153 | ||
|
|
|
|
|
|
|
| (1,386,936) |
| 326,806 |
| 1,173 |
| 406,747 |
Being: | ||||||||||||||
Superavit |
|
|
|
|
|
|
| 388,096 |
| 326,806 |
| 1,173 |
| 406,747 |
Deficit |
|
|
|
|
|
|
| (1,775,032) |
| - |
| - |
| - |
Value Unrecognized as Asset |
|
| 254,869 |
| 306,372 |
| 1,173 |
| 406,747 | |||||
Net Actuarial Asset (Note 12) |
|
|
|
|
| 133,227 |
| 20,434 |
| - |
| - | ||
Net Actuarial Liability (Note 22) |
|
|
|
| (1,775,032) |
| - |
| - |
| - | |||
Payments Made (1) (2) |
|
|
|
|
| 1,989,190 |
| - |
| - |
| 457 | ||
Revenues (Expenses) Recorded (Note 32) |
|
|
|
| (255,739) |
| (2,079) |
| - |
| (457) | |||
Other Equity Valuation Adjustments |
|
|
|
| (3,084,466) |
| 11,371 |
| 488 |
| (672) | |||
Actual Return on Plan Assets |
|
|
|
|
| 3,002,177 |
| 151,680 |
| 995 |
| 361,089 | ||
100
|
|
|
|
|
|
|
|
|
|
|
|
|
|
|
Consolidated | ||||||||||||||
12/31/2015 | ||||||||||||||
Other | ||||||||||||||
|
|
|
|
|
|
|
| Banesprev(1) |
| Sanprev |
| Plans(1) |
| Bandeprev |
Conciliation of Assets and Liabilities |
|
|
|
|
|
|
|
|
|
|
|
| ||
Present Value of Actuarial Obligations |
|
|
|
|
| (15,709,342) |
| (371,885) |
| (347,248) |
| (1,097,263) | ||
Fair Value of Plan Assets |
|
|
|
|
| 14,159,443 |
| 695,523 |
| 3,938 |
| 1,416,380 | ||
|
|
|
|
|
|
|
| (1,549,899) |
| 323,638 |
| (343,310) |
| 319,117 |
Being: | ||||||||||||||
Superavit |
|
|
|
|
|
|
| 319,791 |
| 323,638 |
| 561 |
| 319,117 |
Deficit |
|
|
|
|
|
|
| (1,869,690) |
| - |
| (343,871) |
| - |
Value Unrecognized as Asset |
|
| 319,791 |
| 323,638 |
| 561 |
| 319,117 | |||||
Net Actuarial Asset (Note 12) |
|
|
|
|
| - |
| - |
| - |
| - | ||
Net Actuarial Liability (Note 22) |
|
|
|
| (1,869,690) |
| - |
| (343,871) |
| - | |||
Payments Made |
|
|
|
|
| 277,521 |
| - |
| 47,683 |
| 6 | ||
Revenues (Expenses) Recorded (Note 32) |
|
|
|
| (265,044) |
| - |
| (35,756) |
| (569) | |||
Other Equity Valuation Adjustments |
|
|
|
| (1,623,643) |
| (10,989) |
| (278,910) |
| (672) | |||
Actual Return on Plan Assets |
|
|
|
|
| 1,170,637 |
| 117,923 |
| 490 |
| 104,068 | ||
(1) In the first quarter of 2016, as expected, has been concluded the transfer process to Banesprev, of care boxes, supplementary retirement and pension plan of former staff members arising from the process of acquisition of the former Banco Meridional, established under the defined benefit plan. In the contributions made line the increasing the amount of contribution/payments had the extraordinary event the contribution of R$170 million. | ||||||||||||||
(2) In the fourth quarter of 2016, the Management partially settle, on an extraordinary basis, the debt balance included in the financing agreements for the actuarial deficits of the plans administered by Banesprev, under the following conditions: Plan II R$250 million , Plan VR$700 million, Plan Pre-75 R$370 million and Meridional R$180 million. | ||||||||||||||
Opening of gains (losses) actuarial from experience, financial assumptions and demographic hypotheses: | ||||||||||||||
|
|
|
|
|
|
|
|
|
|
|
|
|
| Bank |
12/31/2016 | ||||||||||||||
Santander- | ||||||||||||||
|
|
|
|
|
|
|
| Banesprev(1) |
| Sanprev |
| previ(1) |
| Bandeprev |
Experience Plan |
|
|
|
|
| (602,042) |
| (68,022) |
| 240 |
| (15,871) | ||
Changes in Demographic Assumptions |
|
|
| (1,944,759) |
| (43,885) |
| (241) |
| (122,567) | ||||
Changes in Financial Assumptions |
|
|
| (13,211) |
| 8,553 |
| - |
| (7,761) | ||||
Gain (Loss) Actuarial - Obligation |
|
|
| (2,560,012) |
| (103,354) |
| (1) |
| (146,199) | ||||
Return on Investment, Return Unlike Implied Discount Rate |
| 1,284,302 |
| 68,933 |
| 545 |
| 194,225 | ||||||
Gain (Loss) Actuarial - Asset |
|
|
|
|
| 1,284,302 |
| 68,933 |
| 545 |
| 194,225 | ||
Chance in Irrecoverable Surplus |
|
|
| 87,831 |
| 56,733 |
| (543) |
| (48,539) | ||||
|
|
|
|
|
|
|
|
|
|
|
|
|
| Bank |
12/31/2015 | ||||||||||||||
Other | ||||||||||||||
|
|
|
|
|
|
|
| Banesprev(1) |
| Sanprev |
| Plans(1) |
| Bandeprev |
Experience Plan |
|
|
|
|
| (1,124,303) |
| (53,232) |
| (33,757) |
| (75,419) | ||
Changes in Financial Assumptions |
|
|
| 1,842,482 |
| 40,029 |
| 26,277 |
| 117,864 | ||||
Gain (Loss) Actuarial - Obligation |
|
|
| 718,179 |
| (13,203) |
| (7,480) |
| 42,445 | ||||
Return on Investment, Return Unlike Implied Discount Rate |
| (284,131) |
| 52,458 |
| 89 |
| (45,454) | ||||||
Chance in Irrecoverable Surplus |
|
|
|
| 30,937 |
| (36,737) |
| (2) |
| 2,931 | |||
|
|
|
|
|
|
|
|
|
|
|
|
|
| Consolidated |
12/31/2016 | ||||||||||||||
Santander- | ||||||||||||||
|
|
|
|
|
|
|
| Banesprev(1) |
| Sanprev |
| previ(1) |
| Bandeprev |
Experience Plan |
|
|
|
|
| (613,273) |
| (68,005) |
| 240 |
| (15,871) | ||
Changes in Demographic Assumptions |
|
|
| (1,968,465) |
| (43,916) |
| (241) |
| (122,567) | ||||
Changes in Financial Assumptions |
|
|
| (13,671) |
| 8,660 |
| - |
| (7,761) | ||||
Gain (Loss) Actuarial - Obligation |
|
|
| (2,595,409) |
| (103,261) |
| (1) |
| (146,199) | ||||
Return on Investment, Return Unlike Implied Discount Rate |
| 1,325,813 |
| 68,863 |
| 545 |
| 194,225 | ||||||
Gain (Loss) Actuarial - Asset |
|
|
|
|
| 1,325,813 |
| 68,863 |
| 545 |
| 194,225 | ||
Chance in Irrecoverable Surplus |
|
|
| 104,096 |
| 56,912 |
| (543) |
| (48,539) | ||||
101
|
|
|
|
|
|
|
|
|
|
|
|
|
| Consolidated |
12/31/2015 | ||||||||||||||
Other | ||||||||||||||
|
|
|
|
|
|
|
| Banesprev(1) |
| Sanprev |
| Plans(1) |
| Bandeprev |
Experience Plan |
|
|
|
|
| (1,137,425) |
| (53,078) |
| (33,757) |
| (75,419) | ||
Changes in Financial Assumptions |
|
|
| 1,864,840 |
| 40,064 |
| 26,277 |
| 117,864 | ||||
Gain (Loss) Actuarial - Obligation |
|
|
| 727,415 |
| (13,014) |
| (7,480) |
| 42,445 | ||||
Return on Investment, Return Unlike Implied Discount Rate |
| (304,174) |
| 52,286 |
| 89 |
| (45,454) | ||||||
Chance in Irrecoverable Surplus |
|
|
|
| 40,737 |
| (36,737) |
| (2) |
| 2,931 | |||
(1) In the first quarter of 2016, as expected, has been concluded the transfer process to Banesprev, of care boxes, supplementary retirement and pension plan of former staff members arising from the process of acquisition of the former Banco Meridional, established under the defined benefit plan. | ||||||||||||||
The following table shows the duration of the actuarial liabilities of the plans sponsored by Banco Santander: | ||||||||||||||
|
|
|
|
|
|
|
|
|
|
|
|
|
| Duration (in Years) |
|
|
|
|
|
|
|
|
|
|
|
| 12/31/2016 |
| 12/31/2015 |
Banesprev | ||||||||||||||
Plan I |
|
|
|
|
|
|
|
|
| 11.47 |
| 11.44 | ||
Plan II |
|
|
|
|
|
|
|
|
| 11.42 |
| 10.71 | ||
Plan III |
|
|
|
|
|
|
|
|
| 8.44 |
| 8.33 | ||
Plan IV |
|
|
|
|
|
|
|
|
| 16.34 |
| 16.38 | ||
Plan V |
|
|
|
|
|
|
|
|
| 8.57 |
| 8.66 | ||
Pré-75 |
|
|
|
|
|
|
|
|
| 9.29 |
| 9.27 | ||
Meridional DCA, DAB e CACIBAN |
|
|
|
|
|
|
| 6.22/5.56/6.58 |
| 6.62 | ||||
Sanprev |
|
|
|
|
|
|
|
|
|
|
|
| ||
Plan I |
|
|
|
|
|
|
|
|
| 6.29 |
| 6.62 | ||
Plan II |
|
|
|
|
|
|
|
|
| 12.87 |
| 15.85 | ||
Plan III |
|
|
|
|
|
|
|
|
| 9.12 |
| 9.03 | ||
Bandeprev |
|
|
|
|
|
|
|
|
|
|
|
| ||
Plan Básico |
|
|
|
|
|
|
|
|
| 9.11 |
| 9.03 | ||
Plan Especial I |
|
|
|
|
|
|
|
|
| 6.54 |
| 6.86 | ||
Plan Especial II |
|
|
|
|
|
|
|
|
| 6.48 |
| 6.75 | ||
SantanderPrevi |
|
|
|
|
|
|
|
|
|
|
|
| ||
SantanderPrevi |
|
|
|
|
|
|
|
|
| 6.59 |
| 6.95 | ||
b) Health and Dental Care Plan | ||||||||||||||
Cabesp - Caixa Beneficente dos Funcionários do Banco do Estado de São Paulo: entity that covers health and dental care expenses of employees hired until Banespa privatization in 2000,as defined in the entity's bylaws. | ||||||||||||||
HolandaPrevi’s Retirees (current corporate name of SantanderPrevi): for the health care plan Retirement has lifelong nature and is a closed group. In shutdown the employee should have completed 10 years of employment with Banco Real and 55 years of age. In this case it was offered continuity of health care plan where the employee bears 70% of the monthly and Bank subsidizes 30%. This rule lasted until December, 2002 and after this period that the employee was off like status Retired Holandaprevi, bears 100% of the monthly health plan. | ||||||||||||||
Former Employees of Banco Real (Retiree by Circulares): it granting entitlement to healthcare former employee of Banco Real, with lifetime benefit was granted in the same condition the active employee, in this case, with the same coverage and plan design. | ||||||||||||||
Eligible only to plans basic and standard first apartment, opting for apartment he takes the difference between the plans more co-participation in the basic plan. Not allowed new additions of dependents. It has subsidizes of 90% of the plan. | ||||||||||||||
Bandeprev’s Retirees: health care plan retirees of Bandeprev’s pension plan beneficiaries is a lifetime benefit, for which Banco Santander is responsible for defraying 50% of the benefits of employees retired until November 27, 1998.For who retired after this date, the subsidy is 30%. | ||||||||||||||
Officer with Lifetime Benefits (Lifetime Officers): lifetime health care benefit granted to only a small closed group of former directors coming from the Banco Sudameris, being 100% funded by the Bank. | ||||||||||||||
Free Clinic: health care plan (free clinic) is offered for life to retirees who have contributed to the Foundation Sudameris for at least 25 years and has difference in default if the user chooses apartment. The plan is only offered in standard ward where the cost is 100% of the Foundation Sudameris. | ||||||||||||||
Life Insurance for Banco Real Retirees (Life Insurance): granted for Retirees Circulars: indemnity in case of Natural Death, Disease Disability, Accidental Death. The subsidy is 45.28% of the value. This benefit is also granted to retirees from Foundation Sudameris and the cost is 100% of the retired.It is a closed group. | ||||||||||||||
102
Additionally, it is assured to retired employees, since they meet to certain legal requirements and full pays their respective contributions, the right to be maintaining as a beneficiary of the Banco Santander health plan, in the same conditions for healthcare coverage, taken place during their employment contract. Banco Santander provisions related to this retired employees are accrued using actuarial calculations based in the present value of the current cost. | ||||||||||||||
|
|
|
|
|
|
|
|
|
|
|
|
|
| Bank |
12/31/2016 | 12/31/2015 | |||||||||||||
|
|
|
|
|
|
|
| Cabesp |
| Other Plans |
| Cabesp |
| Other Plans |
Conciliation of Assets and Liabilities |
|
|
|
|
|
|
|
|
|
|
|
| ||
Present Value of Actuarial Obligations |
|
|
|
|
| (3,557,640) |
| (555,160) |
| (5,347,007) |
| (483,092) | ||
Fair Value of Plan Assets |
|
|
|
|
| 3,190,984 |
| - |
| 5,463,960 |
| - | ||
|
|
| (366,656) |
| (555,160) |
| 116,953 |
| (483,092) | |||||
Being: | ||||||||||||||
Superavit |
|
|
|
|
|
|
| - |
| - |
| 116,953 |
| - |
Deficit |
|
|
|
|
|
|
| (366,656) |
| (555,160) |
| - |
| (483,092) |
Value Unrecognized as Asset |
|
| - |
| - |
| 116,953 |
| - | |||||
Net Actuarial Asset (Note 12) |
|
|
|
|
|
|
| - |
| - |
| - |
| - |
Net Actuarial Liability (Note 22) |
|
|
|
|
|
|
| (366,656) |
| (555,160) |
| - |
| (483,092) |
Payments Made |
|
|
|
|
| 54,754 |
| 29,345 |
| 51,914 |
| 24,045 | ||
Revenues (Expenses) Recorded |
|
|
|
|
| (59,703) |
| (56,367) |
| (74,866) |
| (57,101) | ||
Other Equity Valuation Adjustments |
|
|
|
|
|
|
| (340,049) |
| (89,635) |
| 21,658 |
| (44,588) |
Actual Return on Plan Assets |
|
|
|
|
|
|
| 1,337,948 |
| - |
| 1,071,664 |
| - |
|
|
|
|
|
|
|
|
|
|
|
|
|
| Consolidated |
12/31/2016 | 12/31/2015 | |||||||||||||
|
|
|
|
|
|
|
| Cabesp |
| Other Plans |
| Cabesp |
| Other Plans |
Conciliation of Assets and Liabilities |
|
|
|
|
|
|
|
|
|
|
|
| ||
Present Value of Actuarial Obligations |
|
|
|
|
| (3,691,329) |
| (555,160) |
| (5,551,642) |
| (483,092) | ||
Fair Value of Plan Assets |
|
|
|
|
| 3,310,895 |
| - |
| 5,673,071 |
| - | ||
|
|
| (380,434) |
| (555,160) |
| 121,429 |
| (483,092) | |||||
Being: | ||||||||||||||
Superavit |
|
|
|
|
|
|
| - |
| - |
| 121,429 |
| - |
Deficit |
|
|
|
|
|
|
| (380,434) |
| (555,160) |
| - |
| (483,092) |
Value Unrecognized as Asset |
|
| - |
| - |
| 121,429 |
| - | |||||
Net Actuarial Asset (Note 12) |
|
|
|
|
|
|
| - |
| - |
| - |
| - |
Net Actuarial Liability (Note 22) |
|
|
|
|
|
|
| (380,434) |
| (555,160) |
| - |
| (483,092) |
Payments Made |
|
|
|
|
| 55,907 |
| 29,345 |
| 52,962 |
| 24,045 | ||
Revenues (Expenses) Recorded |
|
|
|
|
| (61,311) |
| (56,367) |
| (78,084) |
| (57,101) | ||
Other Equity Valuation Adjustments |
|
|
|
|
|
|
| (342,555) |
| (89,635) |
| 27,008 |
| (44,588) |
Actual Return on Plan Assets |
|
|
|
|
|
|
| 1,384,439 |
| - |
| 1,110,492 |
| - |
Opening of gains (losses) actuarial from experience, financial assumptions and demographic hypotheses: | ||||||||||||||
|
|
|
|
|
|
|
|
|
|
|
|
|
| Bank |
12/31/2016 | 12/31/2015 | |||||||||||||
|
|
|
|
|
|
|
| Cabesp |
| Other Plans |
| Cabesp |
| Others Plans |
Experience Plan |
|
|
|
|
| (1,115,634) |
| 36,566 |
| (439,599) |
| 18,461 | ||
Changes in Financial Assumptions |
|
|
| (440,340) |
| (81,233) |
| 633,225 |
| 61,650 | ||||
Changes in Demographic Assumptions |
|
|
| - |
| (379) |
| - |
| - | ||||
Gain (Loss) Actuarial - Obligation |
|
|
| (1,555,974) |
| (45,046) |
| 193,626 |
| 80,111 | ||||
Return on Investment, Return Unlike Implied Discount Rate |
| 696,589 |
| - |
| 562,670 |
| - | ||||||
Gain (Loss) Actuarial - Assets |
|
|
|
| 696,589 |
| - |
| 562,670 |
| - | |||
Chance in Irrecoverable Surplus |
|
|
| 366,656 |
| - |
| (116,953) |
| - | ||||
|
|
|
|
|
|
|
|
|
|
|
|
|
| Consolidated |
12/31/2016 | 12/31/2015 | |||||||||||||
|
|
|
|
|
|
|
| Cabesp |
| Other Plans |
| Cabesp |
| Others Plans |
Experience Plan |
|
|
|
|
| (1,153,410) |
| 36,566 |
| (452,011) |
| 18,461 | ||
Changes in Financial Assumptions |
|
|
| (456,719) |
| (81,233) |
| 657,204 |
| 61,650 | ||||
Changes in Demographic Assumptions |
|
|
| - |
| (379) |
| - |
| - | ||||
Gain (Loss) Actuarial - Obligation |
|
|
| (1,610,129) |
| (45,046) |
| 205,193 |
| 80,111 | ||||
Return on Investment, Return Unlike Implied Discount Rate |
| 718,628 |
| - |
| 581,755 |
| - | ||||||
Gain (Loss) Actuarial - Obligation |
|
|
| 718,628 |
| - |
| 581,755 |
| - | ||||
Chance in Irrecoverable Surplus |
|
|
|
| 380,434 |
| - |
| (121,429) |
| - | |||
103
The following table shows the duration of the actuarial liabilities of the plans sponsored by Banco Santander: | ||||||||||||||
|
|
|
|
|
|
|
|
|
|
|
|
|
| Duration (in Years) |
Plans |
|
|
|
|
|
|
|
|
| 12/31/2016 |
| 12/31/2015 | ||
Cabesp |
|
|
|
|
|
|
|
|
| 12.93 |
| 12.84 | ||
Law 9,656 /1998 |
|
|
|
|
|
|
|
|
| - |
| 27.69 | ||
Bandepe |
|
|
|
|
|
|
|
|
| 14.57 |
| 12.68 | ||
Free Clinic |
|
|
|
|
|
|
|
|
| 11.03 |
| 10.90 | ||
Lifelong Directors |
|
|
|
|
|
|
|
|
| 9.12 |
| 8.90 | ||
Circular(1) |
|
|
|
|
|
|
|
|
| 12.91 e 10.05 |
| 13.16 and 9.94 | ||
Life Insurance |
|
|
|
|
|
|
|
|
| 7.68 |
| 8.14 | ||
|
|
|
|
|
|
|
|
|
|
|
|
|
|
|
(1) The duration 12.91 (12/31/2015 - 13.16) refers to the plan of Former Employees of Banco ABN Amro and 10.05 (12/31/2015 - 9.94) to the plane of Former Employees of Banco Real. | ||||||||||||||
c) Management of Plan Assets | ||||||||||||||
The main categories of assets as a percentage of total assets of the plan are as follows: | ||||||||||||||
|
|
|
|
|
|
|
|
|
|
|
|
|
| Bank/Consolidated |
|
|
|
|
|
|
|
|
|
|
|
| 12/31/2016 |
| 12/31/2015 |
Equity Instruments |
|
|
|
|
|
|
|
|
| 1.0% |
| 0.5% | ||
Debt Instruments |
|
|
|
|
|
|
|
|
| 98.2% |
| 98.5% | ||
Real Estate |
|
|
|
|
|
|
|
|
| 0.3% |
| 0.3% | ||
Others |
|
|
|
|
|
|
|
|
| 0.5% |
| 0.7% | ||
d) Actuarial Assumptions Adopted in Calculations | ||||||||||||||
|
|
|
|
|
|
|
|
|
|
|
|
|
| Bank/Consolidated |
|
|
|
|
|
|
|
|
|
| 12/31/2016 |
|
|
| 12/31/2015 |
|
| Pension | Health | Pension | Health | |||||||||
Nominal Discount Rate for Actuarial Obligation |
|
|
|
| 10.9% |
| 10.8% |
| 12.3% |
| 12.00% | |||
Rate Calculation of Interest Under Assets to the Next Year |
|
|
|
| 10.9% |
| 10.8% |
| 12.3% |
| 12.00% | |||
Estimated Long-term Inflation Rate |
|
|
|
| 4.5% |
| 4.5% |
| 4.5% |
| 4.5% | |||
Estimated Salary Increase Rate |
|
|
|
| 5.0% |
| 5.0% |
| 5.0% |
| 5.0% | |||
Boards of Mortality |
|
|
|
|
| AT2000 |
| AT2000 |
| AT2000 |
| AT2000 | ||
(1) Banesprev II, V and Pré 75 and (2) Cabesp. | ||||||||||||||
e) Sensitivity Analysis | ||||||||||||||
The assumptions about the rates related to the cost of medical care have a significant effect on the amounts recognized in income. The change of one percentage point in the rate of health care cost would have the following effects: | ||||||||||||||
|
|
|
|
|
|
|
|
|
|
|
|
|
|
|
Sensibility | ||||||||||||||
12/31/2016 | 12/31/2015 | |||||||||||||
|
|
|
|
|
|
|
| (+) 1.0% |
| (-) 1.0% |
| (+) 1.0% |
| (-) 1.0% |
Effect on Current Service Cost and Interest on the Actuarial Liabilities |
| 58,416 |
| (24,839) |
| 88,469 |
| (150,372) | ||||||
Effect on the Present Value of Obligations |
| 527,586 |
| (451,242) |
| 719,789 |
| (615,320) | ||||||
f) Share-Based Compensation | ||||||||||||||
Banco Santander has long-terms compensation plans linked to the market price of the shares. The members of the Executive Board of Banco Santander are eligible for these plans, as well as other members selected by the Board of Directors and informed to the Human Resources, whose selection will take into account seniority of the group. For the Board of Directors members in order to be eligible, it is necessary to exercise Executive Board functions. | ||||||||||||||
f.1) Local Program | ||||||||||||||
The Local Program of Banco Santander is divided into two types of independent plans: (i) share purchase plans and (ii) Delivery Plans actions. | ||||||||||||||
On October 25, 2011, Banco Santander held the Extraordinary Shareholders’ Meeting, which approved the grant of the Stock Option Plan for Share Deposit Certificates Units (SOP 2014) - to certain directors and Management-level employees of the Bank and companies under its control. | ||||||||||||||
On April 29, 2013, Banco Santander held an Extraordinary General Meeting, which approved the grant of two Banco Santander’s share-based compensation programs - Stock Option Plan for Share Deposit Certificates - Units (SOP 2013) and the Long-Term Incentive Plan - Investment in Share Deposit Certificates Units (PSP 2013). | ||||||||||||||
104
(i) Share Purchase Plans | ||||||||||||||
The purchasing action plans consist of the Option Plans of Purchase Share Deposit Certificates - Units (SOP). | ||||||||||||||
The characteristics of each plan are: | ||||||||||||||
Stock Option Plan for Share Deposit Certificates Units (SOP 2014): it was a 3 year Stock Option Plan. The period for exercising was from June 30, 2014 to June 30, 2016. The number of Units exercisable by the participants will be determined according to the result of a performance measurement parameter of the Bank: Total Shareholder Return (TSR) and adjusted by indicator Return on Risk Adjusted Capital (RORAC), comparison made between realized and budgeted in each year, as determined by the Board of Directors. The final result of the plan was 15%. | ||||||||||||||
Stock Option Plan for Share Deposit Certificates Units (SOP 2013): it is a stock option plan with 3 years of duration. The period for exercising comprises June 30, 2016 until June 30, 2018. The number of Units exercisable by the participants will be determined according to the result of a performance measurement parameter of the Bank: Total Shareholder Return (TSR) and adjusted by indicator Return on Risk Weighted Assets (RoRWA), comparison between realized and budgeted in each year, as determined by the Board of Directors.The final result of the plan was 89.61%. | ||||||||||||||
(ii) Stock Delivery Plans | ||||||||||||||
The stock delivery plans consists of the Long-Term Incentive Plan - Investment in Share Deposits Certificates - Units (PSP). | ||||||||||||||
Long-Term Incentive Plan - PSP 2013: Compensation Plan based on shares, promoting a commitment of executives with the long-term results. The Plan had as its object the payment of variable compensation by the Bank to Participants under the Variable Compensation 100% (one hundred percent) in "Units". The number of shares delivered to the participants was determined according to the result of a performance measurement parameter of the Bank: Total Shareholder Return (TSR) and adjusted by indicator Return on Risk Weighted Assets (RoRWA), comparison between realized and budgeted in each year, as determined by the Board of Directors.The final result of the plan was 89.61%. | ||||||||||||||
a.1) Fair Value and Plans Performance Parameters | ||||||||||||||
For accounting of the Local Program plans, an independent consultant promoted simulations based on Monte Carlo methodology's, as presented the performance parameters used to calculate the shares to be granted. Such parameters are associated with their respective probabilities of occurrence, which are updated at the close of each exercise. | ||||||||||||||
|
|
|
|
|
|
|
|
|
|
|
|
|
|
|
|
| PSP2013/SOP2013 (1) | ||||||||||||
TSR Position |
|
|
|
|
|
|
|
|
| % of Shares Exercisable | ||||
1° |
|
|
|
|
|
|
|
|
|
|
| 100% | ||
2° |
|
|
|
|
|
|
|
|
|
|
| 75% | ||
3° |
|
|
|
|
|
|
|
|
|
|
| 50% | ||
(1) The percentage of shares determined at the position of TSR is subject to a penalty according to the implementation of Return on Risk Weighted Assets (RoRWA). | ||||||||||||||
|
|
|
|
|
|
|
|
|
|
|
|
|
|
|
|
| SOP2014 (1) | ||||||||||||
TSR Position |
|
|
|
|
|
|
|
|
| % of Shares Exercisable | ||||
1° |
|
|
|
|
|
|
|
|
|
|
| 100% | ||
2° |
|
|
|
|
|
|
|
|
|
|
| 70% | ||
3° |
|
|
|
|
|
|
|
|
|
|
| 50% | ||
4° |
|
|
|
|
|
|
|
|
|
|
| 25% | ||
(1) The percentage of shares determined at the position of TSR is subject to a penalty according to the implementation of the Return on Risk Adjusted Capital (RORAC). | ||||||||||||||
For measurement of the fair value of the options in the plans based the following premises: | ||||||||||||||
|
|
|
|
|
|
|
|
|
|
|
|
|
|
|
|
|
|
|
|
|
|
|
|
|
|
|
|
| PSP - 2013 |
Method of Assessment |
|
|
|
|
|
|
|
|
|
|
| Binomial | ||
Volatility |
|
|
|
|
|
|
|
|
|
|
| 40.00% | ||
Probability of Occurrence |
|
|
|
|
|
|
|
|
|
|
| 60.27% | ||
Risk-Free Rate |
|
|
|
|
|
|
|
|
|
|
| 11.80% | ||
|
|
|
|
|
|
|
|
|
|
|
|
|
|
|
|
|
|
|
|
|
|
|
|
|
|
| SOP 2013 |
| SOP 2014 |
Method of Assessment |
|
|
|
|
|
|
|
|
| Black&Scholes |
| Black&Scholes | ||
Volatility |
|
|
|
|
|
|
| 40.00% |
| 40.00% | ||||
Rate of Dividends |
|
|
|
|
|
|
|
|
| 3.00% |
| 3.00% | ||
Vesting Period |
|
|
|
|
|
|
|
| 3 Years |
| 3 Years | |||
Average Exercise Time |
|
|
|
|
|
|
|
|
| 5 Years |
| 5 Years | ||
Risk-Free Rate |
|
|
|
|
|
|
|
|
| 11.80% |
| 10.50% | ||
Probability of Occurrence |
|
|
|
|
|
|
|
|
| 60.27% |
| 71.26% | ||
Fair Value for Shares |
|
|
|
|
|
|
|
|
| R$5.96 |
| R$6.45 | ||
The average value of shares SANB11 (Shares of the Bank in BM&FBovespa) on December 31, 2016 was R$19.94 (12/31/2015 - R$16.05). | ||||||||||||||
105
On 2016, daily pro-rata expenses amounting of the R$15,710 (2015 - R$11,427) Bank and R$15,789 (2015 - R$11,642) Consolidated, relating to the plan of Stock Option Plan for Share Deposit Certificates Units (SOP) and expenses of R$9,506 (2015 - R$7,646) Bank and R$9,798 (2015 - R$7,775) Consolidated, relating to plan for the Long-Term Incentive Plan - Investment in Share Deposit Certificates Units (PSP). Expenses related to the SOP plans and PSP are recognized in respect of stockholders' equity and other obligations, respectively. | ||||||||||||||
|
|
|
|
|
|
|
|
|
|
|
| Date of |
| Date of Expiry |
Number of | Concession | Employees | Commencement | of Exercise | ||||||||||
|
|
|
| Units |
| Exercise Price |
| Year |
| Group |
| Exercise Period |
| Period |
Balance Plans on Dec/31/2014 |
| 13,830,464 |
|
|
|
|
|
|
|
|
|
| ||
Cancelled Options (SOP 2013) |
| (748,408) |
| 14.43 |
| 2013 |
| Executives |
| 05/02/2013 |
| 06/30/2018 | ||
Cancelled Options (PSP 2013) |
| (117,453) |
|
|
| 2013 |
| Executives |
| 08/13/2013 |
| 06/30/2016 | ||
Cancelled Options (SOP 2014) | (52,500) |
| 14.31 |
| 2011 |
| Executives |
| 10/26/2011 |
| 06/30/2016 | |||
Exercised Options (SOP 2014) | (248,499) |
|
|
| 2011 |
| Executives |
| 10/26/2011 |
| 06/30/2016 | |||
Balance Plans on Dec/31/2015 |
| 12,663,604 |
|
|
|
|
|
|
|
|
|
| ||
Cancelled Options (SOP 2013) |
| (1,346,779) |
| 12.84 |
| 2013 |
| Executives |
| 05/02/2013 |
| 06/30/2018 | ||
Exercised Options (SOP 2013) |
| (6,377,786) |
| 12.84 |
| 2013 |
| Executives |
| 05/02/2013 |
| 06/30/2018 | ||
Granted Options (SOP 2013) |
| 220,606 |
| 12.84 |
| 2013 |
| Executives |
| 05/02/2013 |
| 06/30/2018 | ||
Cancelled Options (PSP 2013) |
| (298,446) |
|
|
| 2013 |
| Executives |
| 08/13/2013 |
| 06/30/2016 | ||
Exercised Options (PSP 2013) |
| (2,147,515) |
|
|
| 2013 |
| Executives |
| 08/13/2013 |
| 06/30/2016 | ||
Canceled Options (SOP 2014) |
| (34,196) |
| 14.31 |
| 2011 |
| Executives |
| 10/26/2011 |
| 06/30/2016 | ||
Exercised Options (SOP 2014) | (693,230) |
| 12.72 |
| 2011 |
| Executives |
| 10/26/2011 |
| 06/30/2016 | |||
Balance Plans on Dec/31/2016 |
| 1,986,258 |
|
|
|
|
|
|
|
|
|
| ||
SOP 2014 |
| - |
| 12.72 |
| 2011 |
| Executives |
| 10/26/2011 |
| 06/30/2016 | ||
SOP 2013 |
| 1,986,258 |
| 12.84 |
| 2013 |
| Executives |
| 05/02/2013 |
| 06/30/2018 | ||
PSP 2013 |
| - |
|
|
| 2013 |
| Executives |
| 08/13/2013 |
| 06/30/2016 | ||
Total |
|
| 1,986,258 |
|
|
|
|
|
|
|
|
|
| |
f.2) Global Program | ||||||||||||||
Long-Term Incentive Policy | ||||||||||||||
In 2014, it was released a share delivery plan called Long-Term Incentive Global Plan CRDIV - Grant 2014. This plan is subject to achievement of performance indicator Total Shareholder Return (TSR) of the Santander Group, comparing the evolution of the Group in this indicator for the main global competitors and the settlement will be in the World Group Santander shares. | ||||||||||||||
In 2016 was launched a stock delivery plan called 2nd Long-Term Incentive Global Plan CRDIV – Grant 2015. | ||||||||||||||
Global Plan Fair Value | ||||||||||||||
1st Long-Term Incentive Global Plan CRDIV – Grant 2014 | ||||||||||||||
The plan assumes that the beneficiaries will not leave Banco Santander during the term of each plan. The fair value of the 50% linked to Banco Santander’s relative TSR position was calculated, on the grant date, on the basis of the report provided by external valuators whose assessment was carried out using a Monte Carlo valuation model, performing 10 thousands simulations to determine the TSR of each of the companies in the Benchmark Group, taking into account the variables set forth below. The results (each of which represents the delivery of a number of shares) are classified in decreasing order by calculating the weighted average and discounting the amount at the risk-free interest rate. | ||||||||||||||
In view of the high correlation between RTA and LPA, it can be considered (in a high percentage of cases) feasible to extrapolate that the RTA value is also valid for LPA. Therefore, it was initially determined that the fair value of the portion of the plans linked to the Bank’s relative LPA position, of the remaining 50% of the options granted, was the same as that of the 50% corresponding to the TSR. This valuation is reviewed and adjusted on a yearly basis, since its refers to a non-market condition. | ||||||||||||||
|
|
|
|
|
|
|
|
|
|
|
|
|
|
|
Long-Term Incentive Global Plan CRDIV - Grant 2014 |
|
|
|
|
|
|
|
| ||||||
2 Years | 3 Years | 4 Years | ||||||||||||
Future Income Dividend |
|
|
|
|
|
|
| 11.10% |
| 10.80% |
| 9.50% | ||
Expected Volatility |
|
|
|
|
|
|
| 32.70% |
| 34.70% |
| 36.90% | ||
Volatility Comparator |
|
|
|
|
|
|
| 12% -52% |
| 16% - 56% |
| 16% - 52% | ||
Risk-Free Interest Rate |
|
|
|
|
|
|
| 1.70% |
| 2.10% |
| 2.50% | ||
Correlation |
|
|
|
|
|
|
| 0.55 |
| 0.55 |
| 0.55 | ||
The indicator will be used to measure the achievement of targets will be the comparison of the Total Shareholder Return (RTA) of the Santander Group with the RTA of fifteen (15) leading the Group's global competitors. | ||||||||||||||
The indicator is calculated in two stages: initially for program verification in 2014 and a second time in the annual payment of each installment (2015, 2016 and 2017). | ||||||||||||||
106
Each executive has a target in Reais, that was converted to Group's (SAN) by the cotation of R$19.2893, that will be delivered in shares awarded in installments in the years 2016, 2017 and 2018, with sale restriction of one (1) year after each delivery. | ||||||||||||||
2nd Long-Term Incentive Global Plan CRDIV - Grant 2015 | ||||||||||||||
The targets of shares agreed to each participant will be obtained through the application of the coefficients in two stages: initially for eligibility verification (2015-2016) and a second time to calculate the due number of shares (2016, 2017 e 2018). | ||||||||||||||
Indicators - Stage 1 | ||||||||||||||
• RTA vs Competitors | ||||||||||||||
•ROTE Bank vs Budget | ||||||||||||||
Indicators - Stage 2 | ||||||||||||||
• RTA vs Competitors | ||||||||||||||
•ROTE Bank vs Budget | ||||||||||||||
• Employee Satisfaction | ||||||||||||||
• Customer Satisfaction | ||||||||||||||
• Corporate Entailment vs Budget | ||||||||||||||
The indicators will be established in two phases: the first phase for program verification in 2015 and the second phase until 2017. | ||||||||||||||
Each executive has a target in Reais. If the indicators are reached, the target will be converted to Group's shares (the shares will be paid by Banco Santander Spain) awarded in 2019. | ||||||||||||||
|
|
|
|
|
|
|
|
|
|
|
|
|
|
|
Number of Shares | Date of Commencement of the Period | Date of Expiry of Period | ||||||||||||
|
|
|
|
| Granted | Employees | ||||||||
1st Long-Term Incentive Global Plan CRDIV - Grant 2014 |
| 1,613,057 |
| 2014 |
| Executives |
| Jan/2014 |
| Dec/2017 | ||||
2nd Long -Term Incentive Global Plan CRDIV - Grant 2015 |
| 1,775,049 |
| 2016 |
| Executives |
| Jan/2015 |
| Dec/2018 | ||||
Balance Plans on December 31, 2016 |
| 3,388,106 |
|
|
|
|
|
|
|
| ||||
On 2016, pro-rata expenses were not registered, in the same period of 2015 were registered in the amount of R$6,507 Bank and R$6,760 Consolidated, related to the costs of the cycles mentioned, for the totaling of the Global Program. | ||||||||||||||
Plans do not cause dilution of the capital of the Bank, since they are paid in shares of Banco Santander Spain. | ||||||||||||||
f.3) Referenced Variable Remuneration in Shares | ||||||||||||||
Banco Santander Spain's General Shareholders Meeting, held on June 11, 2010, approved the new policy relating to executive compensation through the payment plan referenced in variable compensation shares to the Group companies, including Banco Santander. This new policy, with adjustments applicable to Banco Santander, was approved by the Compensation Committee and the Board of Directors on February 2, 2011. | ||||||||||||||
The plan's objectives are: (i) to align the compensation program with the principles of the Financial Stability Board (FSB) agreed at G20; (ii) to align Banco Santander’s interests with those of the plan’s participants (to achieve the sustainable and recurring growth and profitability of Banco Santander’s businesses and to recognize the participants’ contributions); (iii) to allow the retention of participants; and (iv) to improve Banco Santander’s performance and defend the interests of shareholders through a long-term commitment. | ||||||||||||||
The purpose of the plan is the cash or shares payment, as showed below, owed by Banco Santander to the plan’s participants pursuant to the bank’s compensation policy, based on the future performance of the bank’s shares. | ||||||||||||||
The payment of share-based variable compensation is with in the limits of the overall management compensation approved by Banco Santander's General Ordinary Meeting. | ||||||||||||||
The total number of shares on which the compensation plan is based will be settled in three installments and equally allocated to each of the three following years to the reference year. | ||||||||||||||
On December 19, 2012, the Board of Directors approved the proposed new incentive plan (deferral) for payment of the variable compensation of directors and certain employees, which will be subject to resolution of the Extraordinary General Meeting (EGM) on February 15, 2013. | ||||||||||||||
On April 24, 2013, the Board of Directors approved the proposed new incentive plan (deferral) for payment of the variable compensation of directors and certain employees, which was approved in EGM of June 3, 2013. | ||||||||||||||
On March 18, 2015, the Board of Directors approved the proposed new incentive plan (deferral) for payment of the variable compensation of directors and certain employees, which was approved in EGM of April 30, 2015. | ||||||||||||||
On September 29, 2015, the Board of Directors approved the proposed new incentive plan (deferral) for payment of the variable compensation of directors and certain employees, which was approved in EGM of December 14, 2015. | ||||||||||||||
On October 25, 2016, the Board of Director approved the proposed new incentive plan (deferral) for payment of the variable compensation of directors and certain employees, which was approved in EGM of December 21, 2016. | ||||||||||||||
107
This proposal includes certain requirements for deferred payment of part of the future variable compensation due to its managers and other employees, given the financial basis for sustainable long-term adjustments in future payments due to the risks assumed and fluctuations in cost of capital. | ||||||||||||||
The variable Banco Santander compensation plan is divided into two programs: (i) Collective Identified and (ii) Collective Unidentified. | ||||||||||||||
i) Collective Identified - Participants of the Executive Committee, Statutory Officers and other executives who take significant risks in the Bank and are responsible for the control areas. The deferral will be half in cash, indexed to 100% of CDI and half in shares (SANB11). On the year ended on December 31, 2016, we recorded revenues in the amount of R$51,982 (2015 - expenses in the amount of R$87,995) Bank and R$52,500 (2015 - expenses in the amount of R$89,961) Consolidated, regarding the provision of the deferral plan in shares. | ||||||||||||||
ii) Collective Unidentified - managerial employees and other employees of the organization that will be benefited from the deferral plan. The deferred amount will be paid 100% cash, indexed to 100% of CDI. On the year ended on December 31, 2016, there were recorded expenses of R$79,344 (2015 - R$59,417) Bank and R$79,794 (2015 - R$59,797) Consolidated. | ||||||||||||||
36. Risk Management Structure | ||||||||||||||
Banco Santander in Brazil follows the model of the Banco Santander Spain, which is based on a prudent risk management and the definition of risk appetite on the part of senior management in view of the local regulator and international good practices, aiming to protect the capital and ensuring the profitability of business. The Bank is exposed to the following main risks in its operations: | ||||||||||||||
- Credit risk and exposure to loss in the case of total or partial default by customers or counterparties in the fulfillment of their financial obligations to the Banco Santander. Credit risk management seeks to establish strategies, besides setting limits, including the analysis of exposure and trends and the effectiveness of credit policies. The aim is to maintain a risk profile and adequate minimum profitability which compensates for the estimated default risk of customers and portfolios, as established by the Executive Committee. | ||||||||||||||
- Market risk is exposure to risk factors including interest rates, exchange rates, commodities prices, stock market prices and other values, according to the type of product, the volume of operations, terms and conditions of the agreement and underlying volatility. Market risk management includes practices of measuring and monitoring the use of limits that are pre-set by internal committees, of the value at risk of the portfolios, of sensitivity to fluctuating interest rates, of exposure to foreign exchange rates, of liquidity gaps, among other practices which the control and monitoring of the risks which might affect the position of Banco Santander portfolios in the different markets in which the Bank operates. | ||||||||||||||
- Operational risk is the possibility of loss resulting from inadequate or failed processes, people and systems or from external events. This definition includes the legal risk associated with inadequacy or deficiency in contracts, as well as penalties due to noncompliance with legal provisions and compensation for damages to third parties arising from activities performed by the Organization, but excluded strategic risk and reputational risk. The management and control of operational risks aims to strength the business environment and internal control factors and so to enhance the making decision process and fulfill the requirements from Regulators, Basel Capital Accord and Sarbanes-Oxley. The model also follows the guidelines established by Banco Santander Spain which is based on the COSO - Committee of Sponsoring Organizations of the Treadway Commission - Enterprise Risk Management - Integrated Framework 2013, the Information about the risk of information technology environment is presented at the "Reference Form, item 4.1 - Description of Risk Factors", disclosed at the electronic address www.santander.com.br/ri. | ||||||||||||||
- Compliance risk is the legal risk or regulatory sanctions, financial loss, or damages to the Bank reputation as a result of failure to comply with laws, regulations, codes of conduct and good banking practice. Compliance risk management has a proactive focus on this risk, policies, implementation of process, including monitoring, training, and appropriate communication of rules and laws to be applied to each businesses area of the Banco Santander. | ||||||||||||||
The inherent risk of Money Laundering is associated with the possibility of the Bank be used by your costumers for Money Laundering through the hiring of products, services and realization of common or structured transactions involving funds earned from illicit businesses in Brazil and abroad, such as drug trafficking, public corruption, tax evasion and others. | ||||||||||||||
In the case of Terrorism Financing, the risk is related to the performance of transactions or in support of individuals and companies listed on international lists published by the FATF - Financial Action Task Force on Money Laundering, United Nations Organization (UN), European Union, among others, or funds of those people who identify themselves as supporters of extremist groups and for this reason, perform contributions, donations and work in a structured way in order to financially assist the terrorism. | ||||||||||||||
As a Financial Institution that recognizes the threats and issues involving money laundering and terrorism financing, as well as the effects these practices have on our society and financial market, Banco Santander (Brasil) S.A. maintains a legal and regulatory compliance program which seeks the prevention and combat of these illegal activities. | ||||||||||||||
- Reputational Risk is the risk of the Bank suffer damages and significant financial losses caused by the opinion that its customers, investor and public have about the Bank's relationship with all elements that compose the society. | ||||||||||||||
Management and control of risks in the Conglomerate Santander is structured into three lines of defense, which develop three different functions. | ||||||||||||||
i. Management of risks from their generation; | ||||||||||||||
ii. Control and consolidation of risks, overseeing their management; and | ||||||||||||||
iii. Independent review of the risk activity. | ||||||||||||||
The three lines of defense should have sufficient separation and independence to not compromise the effectiveness of the general scheme. | ||||||||||||||
108
Without prejudice to the above indicated independence, the three lines of defense should act in unison to maximize their efficiency and boost their effectiveness. | ||||||||||||||
First Line of Defense: Generation and Risk Management | ||||||||||||||
Lines of business or activities that create exposure to a risk are the first line of defense. The generation of risk in the first line of defense should be adjusted to appetite and the limits defined. In order to carry out its role, the first line of defense should be equipped with resources in order to be able to identify measure, manage and report the risks assumed. | ||||||||||||||
Second Line of Defense: Control and Supervision of Risks | ||||||||||||||
The second line of Defense, represented by the Executive Vice Presidency of Risks (from now, VPE of Risks), is composed of specialized teams in risk control and supervision of their management. This second line of defense should safeguard the effective control of risks and ensure that they are managed in accordance with the risk appetite defined by the Conglomerate Santander. | ||||||||||||||
Third Line of Defense: Internal Audit | ||||||||||||||
Internal Auditing, acting as the last layer of control in the Conglomerate Santander, should regularly evaluate that policies, methods and procedures are adequate, and check that they are effectively implemented in the management. | ||||||||||||||
Corporate Governance Risk Function | ||||||||||||||
The governance model is structured in a vision of decision, focusing on examination and approval of proposals and credit limits, and in a vision of control, with a focus on full control of risks. | ||||||||||||||
The fundamental principles that rule the risk governance model are: | ||||||||||||||
• Independence of the risks in relation to business area; | ||||||||||||||
• Involvement of the management in decision making; and | ||||||||||||||
• Collegiate Decisions and consensus on credit operations. | ||||||||||||||
The CER-Executive Committee of Risks is the local decision-making forum with representatives of the Bank's management, including the President, Vice President and the other members of the Executive Board.The main tasks of this Committee are: | ||||||||||||||
• Monitor the development of credit cards market; | ||||||||||||||
• Decide on proposals for credit; | ||||||||||||||
• Define and monitor compliance with risk appetite; | ||||||||||||||
• Define the actions with regard to the recommendations made by the local regulator and by Internal Audit; | ||||||||||||||
• Approve and authorize the management tools, improvement initiatives, the follow-up of projects and any other relevant activities related to the management of risks; and | ||||||||||||||
• Approve risk policies as well as changes in risk policies with impact on revenue, margin or costs of provision. | ||||||||||||||
The CCR-Risk Control Committee is the control and monitoring local forum with representatives of the Bank's management, including the VPE of Risks and the Vice President of Finance.The main tasks of this Committee are: | ||||||||||||||
• Conduct a comprehensive and periodic follow-up of all risk, if your profile is within the established in the risk appetite, Business Strategic Planning and in the budget approved by the Board of Directors; | ||||||||||||||
• Conduct a periodic and independent control of risk management activities; | ||||||||||||||
• Supervise the measures adopted with regard to risks, to comply with the recommendations and directions made by the regulatory body and local audit; and | ||||||||||||||
• Provide to the Board of Directors and the Executive Commission the information and assistance they need in terms of risks. | ||||||||||||||
The relevant issues of risk management or those that exceed the jurisdiction of these committees will be forwarded and decided by the Board of Directors. | ||||||||||||||
| ||||||||||||||
| ||||||||||||||
Credit Risk Management | ||||||||||||||
The credit risk management provides subsidies to the development of strategies as risk appetite, beyond boundaries, covering the exposure analysis and trends, as well as the effectiveness of the credit policy. The goal is to keep a risk profile and a minimum appropriate return to compensate for the estimated default rates, both the client and the wallet, as defined by the Executive Committee and Board of Directors. | ||||||||||||||
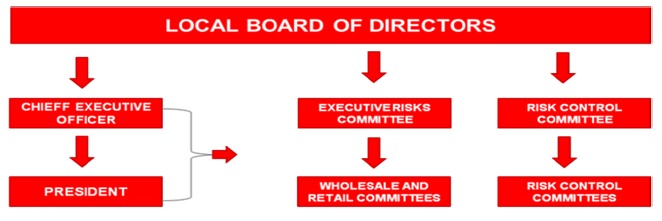
109
Credit risk management is specialized in function of the characteristics of customers, being segregated between individual clients (with dedicated analysts tracking) and customers with similar characteristics (standardized): | ||||||||||||||
• Individualized Management – is performed by a risk analyst set, which prepares analyses, forwards to the Committee and monitories the risk evolution of the client. Also covers customers of the wholesale segment: Corporate and Global Corporate Banking (from now GCB), financial institutions and certain enterprises; and | ||||||||||||||
•Standardized Management - dedicated to individuals and companies not framed as individual customers. It is based on automated decision-making models and internal risk assessment, supplemented by commercial competence and specialized analysts teams to handle exceptions. | ||||||||||||||
The profile of credit risk assumed by the Bank is characterized by a diverse geographic distribution and prevalence of retail banking operations. Macroeconomic aspects and market conditions, as well as the sectorial and geographical concentration, the profile of the customers and the economic perspectives are also evaluated and found to be adequate in measuring credit risk. | ||||||||||||||
The risk involved in the loan, the borrower, counterparty identification, risk classification in different categories, the granting of credit and periodic assessments of the levels of risk are procedures that corroborate for the determination of volumes of guarantees and provisions necessary for credit operations that are carried out in accordance with the regulations in force and with the proper security. | ||||||||||||||
The policies, systems and procedures used are reassessed annually to be always according to the needs of the risk management and to the current market scenarios. | ||||||||||||||
a) Rating Models | ||||||||||||||
The Bank uses its own models score/rating, to measure the quality of a customer's credit or an operation. Each rating is related to a probability of default or non-payment, determined from the historical experience of the institution, with the exception of a few regarded portfolios as Low Default Portfolios using market data to predict defaults. The scores/ratings are used in the process of approval and monitoring of risk. | ||||||||||||||
The ratings assigned to customers are reviewed periodically, incorporating the new information available and the experience developed in the banking relationship. The frequency of these new reviews is greater for customers who reach certain levels in the automatic systems and to those classified as special monitoring. | ||||||||||||||
The Global qualification tools are those applied to segments of sovereign risk, financial institutions and global customers of wholesale (GCB), with centralized management in the Bank. These tools generate the rating of each client, which is obtained from an automatic module or quantitative, based on coefficients of balance sheets or macro-economic variables, complemented by the analyst's judgment and are reviewed to ensure that the qualifications for those assigned are progressively improved. | ||||||||||||||
In the case of companies and private institutions, a single methodology was set to develop a rating in each country, based on the same modules that previous ratings: quantity or automatic (in this case, analyzing the credit behavior of a sample of clients in relation to their financial States), qualitative or revision made by the analyst with final adjustments. | ||||||||||||||
For customers with standardized management, both legal persons as individuals, there are scoring tools that automatically assign a note to client. | ||||||||||||||
These tools are complemented with performance models, which allow a greater predictability of risk taken and which are used for preventive activities and marketing. | ||||||||||||||
b) Credit Risk Cycle | ||||||||||||||
The process of credit risk management is to identify, measure, analyze, manage, negotiate and decide about the exhibitions which Conglomerate Santander companies are subject. The cycle of credit risk management has different functions to each of the three phases: | ||||||||||||||
• Pre-sale: includes the processes of planning, goal setting, risk analysis, risk appetite definition, approval of new products and processes of credit rating; | ||||||||||||||
• Sale: decision making for pre-ranking and specific operations; and | ||||||||||||||
• Post Sale: covers the processes of monitoring, measurement and control, in addition to the management of the process and recovery. | ||||||||||||||
This process is followed by the Board of Directors and the Executive Board of the Bank that approves the policies and procedures of risks, the limits, the delegations of jurisdictions in addition to supervise the activities of the Vice Presidency. | ||||||||||||||
| ||||||||||||||
| ||||||||||||||
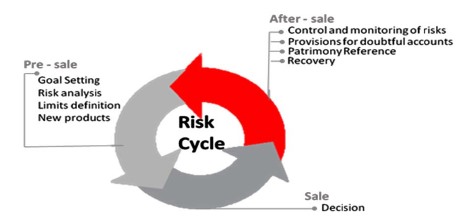
110
Planning and Risk Limits | ||||||||||||||
The risk limit establishes the Bank's interest by evaluating business proposals and the risk position. It is defined through risk appetite approved by the management of the Conglomerate and of the units. | ||||||||||||||
As a pre requirement for the Bank’s strategic planning it’s defined, risk appetite limits are defined. Metrics and limits are approved by the Executive risk committee, by de board of directors, according to the governance stablished in the Banco Santander Risk Corporative framework. | ||||||||||||||
The limits are based on two basic structures: clients/segments and products. | ||||||||||||||
In the case of individual risks, the most basic level is the client, for which are established individual limits. | ||||||||||||||
For GCB customers is used a pre-ranking model based on a measurement and monitoring system of economic capital. Regarding the Corporate segment, a operational limits model simplified for clients who meet certain requirements (high knowledge, rating, among others). | ||||||||||||||
In the case of standardized risks, risk limits are set by automatic tools (massive approval), that different rules apply according to the product, credit profile and risk of the customer and are described in the Commercial Strategic Planning (PEC), which is a document previously agreed by the Commercial area and contains the expected results in terms of risk/return. | ||||||||||||||
Risk Analysis | ||||||||||||||
Consists in examine the capacity of the counterpart in stand up to their contractual obligations with the Bank and/or Companies of the Conglomerate Santander. | ||||||||||||||
Through expert analysis or statistical models, is assigned a rating that reflects the probability of occurrence of default. | ||||||||||||||
This analysis is carried out at least annually, and may be viewed with greater frequency if the risk profile of the customer requests (due to centralized alert systems or visits of the Manager or credit analyst) or if there are specific operations outside the stablished credit limits. | ||||||||||||||
Decision-Making About Proposals | ||||||||||||||
Aims to analyze and adopt resolutions, according to pre-established policies, taking into consideration the risk appetite and any important operation elements to evaluate the risk and return. | ||||||||||||||
The Bank Santander uses, among others, the Risk Adjusted to the Return on Capital (RORAC) methodology for the analysis and pricing in decision-making on operations and business, especially in the largest Conglomerates (wholesale segment). | ||||||||||||||
Retail operations are released from approved limits via standardized form or through exception procedures, using judgmental elements as preset jurisdiction. | ||||||||||||||
Risk Monitoring | ||||||||||||||
Preventive detection of deterioration in the credit quality of the operation is the responsibility of the business manager in conjunction with the risk analyst. Additionally, risk monitoring is carried out through a process of permanent observation for early identification of incidents that may arise in the development of operations, clients and your environment. | ||||||||||||||
This monitoring can result in customer classification in FEVE (Special Surveillance Firms), which is a system that allows differentiation of the management level and the action to be taken on a case by case basis. | ||||||||||||||
These customers are reviewed every six months or every quarter for cases of more severe categories. The classification FEVE can also arise from the review carried out by the internal audit. | ||||||||||||||
Daily routines extracted from specific systems are used, at the individual level, with the aim of controlling the proper use of granted limits. In this same level, is done fill control guarantees, for centralized management area. | ||||||||||||||
In the case of the risks in the standardized level, the key indicators (concentration, loss of credit and fulfillment of budget) are monitored in order to detect variations in the performance of the portfolio compared to projections carried out in PEC. | ||||||||||||||
The reassessment of risk in the client level occurs from the monthly calculation of risk through behavioral models, you might consider, for example, variables relating to late payment and external constraints. | ||||||||||||||
Indicators are analyzed to measure performance and adherence of decisions taken, in order to determine possible adjustments in the levels of delegated jurisdiction. | ||||||||||||||
Provisions | ||||||||||||||
The Banco Santander constitutes provision in accordance with the current legislation of the Central Bank, in accordance with CMN Resolutions 2,682/1999, 2,697/2000 and Circular letter of Bacen 2,899/2000, sorting by rating credit operations and determines the minimum percentage of required provision (Note 8.e). | ||||||||||||||
Credit Recovery | ||||||||||||||
The Recovery business area is responsible for managing the non-performing portfolio. The area has the role to define, implement and monitor strategies and performances related to the delinquent customer portfolios, seeking to ensure maximum efficiency in the recovery and considering all legal requirements. The area uses statistical tools to study the behavior of customers by drawing more assertive strategies for recovery. | ||||||||||||||
One of the tools used is the behavioral score used to study the performance of different groups, seeking recovery of business, cost reduction and achieve pre-established goals. Customers most likely to pay are classified as low-risk customers with low probability of payment are classified as high risk, determining the intensity of the charge. | ||||||||||||||
The performances of the collection channels are defined by the "Map of Responsibility", a document that uses the time of default versus the risk of value, and other characteristics used to compose the definition of strategies. | ||||||||||||||
111
The Bank use some specific charges according to the public as detailed below: | ||||||||||||||
• Internal teams specialized in restructuring and credit recovery with direct management of delinquent customers with overdue more than 60 days and higher values; and | ||||||||||||||
• Specialized external offices to collect, report and assess high-risk customers. These offices are commissioned according to pre-established percentages applied to the amounts recovered. | ||||||||||||||
Sale of non-performing loans portfolio is a recurrent part of the recovery strategy, in which case only the credit rights are sold, all relationship and transactional means remain in the Bank. | ||||||||||||||
Sales Portfolio of Defaulted Loans | ||||||||||||||
Focusing on operations in injury situation, the sales are held periodically through competitive or bilateral auction processes, in which it evaluates the conditions, characteristics and selling price of the portfolios that will be offered to potential investors. | ||||||||||||||
Structure of Capital Management | ||||||||||||||
The implemented capital management model has an adequate and well defined structure and the actions taken are planned and effective, allowing a safe control and an efficient use of the capital. | ||||||||||||||
The established structure has a segregation of duties by specialized area, as follows: | ||||||||||||||
i) Risk Area – responsible for identifying, modeling and controlling of the risks; | ||||||||||||||
ii) Financial Area – responsible for the control, the assessment and the reports of the capital consumption; and | ||||||||||||||
iii) Capital Management Area - responsible for the planning and the capital management. | ||||||||||||||
All the processes, calculations and models involved in capital management are audited and validated internally, having the results reported to the Management. | ||||||||||||||
As the structure of risk management, it is based on three basic principles: | ||||||||||||||
1. Segregation of Duties: a proper management and control of Capital requires a clear allocation of responsibilities among the different duties and areas involved in both local and corporate levels, as well as the coordination and cooperation among them to achieve the unit and the Group's objectives. | ||||||||||||||
2. Organizational Structure: the local organizational structure involved in Capital management should be consistent with the corporate structure, without prejudice to the application of the proportionality principle. | ||||||||||||||
3. Decisions by Collegiate Bodies: the establishment of collegiate bodies in the Capital Area ensures the contrast of opinions, preventing decisions taken individually, in local or corporate level. | ||||||||||||||
Santander Brasil has a director responsible for capital management, appointed by the Board of Directors. Furthermore, we have an institutional policy of capital management that serves as a guideline for the calculation, management, control and reporting of the Capital, fulfilling all the defined requirements for a capital management structure established in the Resolution CMN 3,988/2011. | ||||||||||||||
Other Information | ||||||||||||||
(i) The process of management, monitoring and capital control is carried out for both regulatory capital and economic. The management of regulatory capital is based on the analysis of the adequacy of capital through the Basel index using the criteria defined by the Central Bank. The goal is to achieve efficient capital structure considering capital costs, regulatory requirements, goals of rating and return to investors. | ||||||||||||||
(ii) In operations involving the sale or transfer of financial assets, the conditions and characteristics of the same are analyzed for the appropriate assessment and classification with regard to risk management and retention of profit. | ||||||||||||||
(iii) Further details of the credit risk management structure may be found in the report available on the site www.santander.com.br/ri. | ||||||||||||||
Regulatory Capital | ||||||||||||||
The capital management of Banco Santander is performed for both regulatory capital and for economic capital. The management of regulatory capital is based on the analysis of "ratios" of capital, using criteria defined by the Central Bank. Banco Santander presents an active capital management including securitizations, sale of assets and portfolios, emissions of preferred shares and hybrid instrument. The evaluation model of economic capital is to ensure the availability of capital to support all risks of their economic activity in the various business units, in different scenarios, with the solvency levels agreed by the Banco Santander. | ||||||||||||||
Social and Environmental Risk | ||||||||||||||
In order to be the best commercial bank and gain the trust of the main stakeholders, employees, customers, shareholders and society, it is also indispensable to have a solid risk culture. Santander risks culture has principles that are translated into a priority, supporting business development from the promotion of sustainability. | ||||||||||||||
• Responsibility: everybody is responsible for risk management; | ||||||||||||||
• Resilience: the Bank must have the necessary resilience (prudence and flexibility) to ensure sustainability in different scenarios; | ||||||||||||||
• Challenge: the Bank must question itself daily on everything its employees do, asking itself if that is the best way to manage risks; | ||||||||||||||
• Simplicity: when the Bank talk about risks, it talks about simplicity and clarity; and | ||||||||||||||
• Guidance to the customer: all risk management must be customer-oriented. | ||||||||||||||
112
For Santander, the Social and Environmental Risks associated with the responsible granting of credit and proper management of the impacts caused by the organization activities. Likewise, it is understood that social and environmental risk is transversal to other risks and should be managed effectively and systematically. The non-compliance with this approach may result on potential direct and indirect consequences such as reduction of cash flow, loss of assets, image risk, public health risk, loss of natural ecosystems, among others. | ||
Within the context of a responsible national financial system, the Central Bank of Brazil launched in 2014 a Resolution which asking for each Brazilian banks to develop a Social and Environmental Responsibility Policy (PRSA), this way advancing guidance for several practices including Social Environmental Risk Management. | ||
Governance of Social and Environmental Responsibility Policy (PRSA) | ||
The PRSA establishes the core elements of Bank's governance for the proper treatment of environmental issues: the appointment of a Director responsible for the compliance with the policy, monitoring of the policy by a Committee appointed by the Board of Directors and the establishment of a process that encourages continuous improvement and promotes adherence to check the guidelines established in the PRSA. | ||
In 2016, Santander implemented a set of instruments, information fluxes and decision instances that promote the fulfilment of its PRSA.Therefore, it is possible to: | ||
• Ensure the engagement of senior management in decision-making involving social and environmental aspects deemed as critical (high level of exposure to social and environmental risk, according to proportionality and relevance); | ||
• Ensure the flow of relevant information between the interface areas with the PRSA topics; and | ||
• Define roles and responsibilities regarding monitoring, analysis and continuous improvement of actions. | ||
The commitments stablished in the PRSA are complemented by others presented in policies such as Anticorruption Policy, Supplier Relation Policy, Human Rights policy, Social and Environmental Risk Policies. Among those, the Social Private Investment Policy aims to drive Santander Social Private Investment strategy, defining the guidelines for the creation and maintenance of the banks social programs that strengthen that strategy, and therefore consolidating its contribution to the prosperity of people and businesses. | ||
Social and Environmental Risk Policy | ||
Social and Environmental aspects are considered within the risk analysis conducted for doing business with clients. This way, the Social and Environmental Risk Policy is applied for Wholesale with credit limits and/or risk greater than BRL 1 million and that operate in economic activities considered sensitive by Santander (see table below). The policy establishes guidelines for analyzing social and environmental business risks and opportunities, this way promoting alignment between Santander businesses and its principles and values of corporative responsibility. | ||
Table: 14 sensitive sector subject to social and environmental risk analysis. | ||
1 |
| Oil and Gas, including distribution and fuel service stations |
2 |
| Mining |
3 |
| Metallurgy, steel, pig iron and electroplating |
4 |
| Wood extraction, processing and commerce |
5 |
| Power generation, transmission and distribution |
6 |
| Industries in general |
7 |
| Agriculture and Cattle ranching |
8 |
| Hospitals and laboratories |
9 |
| Industrial, residential and health solid waste collection, treatment deposition and recycling |
10 |
| Transportation, terminals and deposits |
11 |
| Civil construction in general |
12 |
| Contractors and real estate developers |
13 |
| Fishing and aquiculture |
14 |
| Use of biodiversity, Forestry and forest products |
In order to manage such risks, the bank has developed a proprietary methodology that includes: | ||
• Environmental and social aspects are analyzed by the compliance department during acceptance of new wholesale clients; | ||
• Wholesale clients with credit limits and/or risk greater than R$1.0 million and that are part of the sensitive sectors are screened and must answer to the social and environmental questionnaire (QSA), which analyses the clients practices related to solid waste management, effluents treatment, air pollution, Occupational safety and health, labor violations, among others; | ||
• Santander Brasil applies the Equator Principles, which establishes social and environmental criteria for Project Finance; and | ||
• Santander Brasil goes beyond the Equator Principles requirements and analyses social and environmental aspects of Projects that are not usually eligible to such procedures. In 2015 the bank has analyzed Eolic farms, Hydro power plants, energy transmission lines, sewerage systems etc. For those projects, the risk team has considered social and environmental licenses, authorizations and impact assessments, as well as management procedures regarding environment, health and safety. From such assessment, we propose contractual conditions to mitigate such social and environmental risks. | ||
When social and environmental problems are detected, we suggest solutions and incentivize attitude change by the clients. The decision to refuse a deal of terminate a relationship is only taken when all possibilities of problem resolution are over. This is good for the clients, for society and for the Bank. | ||
Social and Environmental Risk in Retail | ||
At the end of 2014, the Social and Environmental Risk office has defined a process to apply social and environmental criteria in the risk analysis in of the retail segment, with focus in focusing on customers considered critical.The experience is in implementation process. | ||
113
Social and Environmental Risk Management in Bank’s Activities | ||||||||||||||
Water Stress | ||||||||||||||
In 2016, we have developed a methodology to analyze our branches vulnerability to water scarcity. From all Brazilian branches, 13% were considered critical, that is, subject to business continuity risks when facing extreme water scarcity situations. We have used this data to inform our strategic management and contingency plans. | ||||||||||||||
Social and Environmental Management of Suppliers | ||||||||||||||
The relationship between Santander and its suppliers considers the Global Compact guidelines, initiative of the UN to adopt practices worldwide accepted on topics such as human rights, labor relations, environment and combat to corruption, which is a signatory since 2007. These guidelines are used for the negotiation, homologation and contract agreement procedures. | ||||||||||||||
During the approval process, suppliers are evaluated on technical, administrative, legal and environmental aspects, and for 100% of critical suppliers, the Bank also has a Supplier Qualification Index (IQF). When formalizing the acquisition of goods and services, the Bank requests contracts with clauses about social and environmental responsibility aligned with Global Compact guidelines. | ||||||||||||||
In 2016, Santander has implemented the Corporate Policy on suppliers and third parties agreements, which establishes guidelines for the relation of all group entities with its suppliers, in order to mitigate business risks since the quotation procedures and during all the validity of the contracts. This considers, among others, technological, operational, reputational, legal, compliance and sustainability risks. | ||||||||||||||
Financial Education | ||||||||||||||
The Bank has specific financial education initiatives to employees, customers, shareholders and society, with the purpose of increasing our stakeholders knowledge on Bank products, so that they can make safe decisions. These actions also contribute to improve our customer portfolio, and comply with the National Strategy of Financial Education (ENEF). | ||||||||||||||
Risk Control Function | ||||||||||||||
Both in the Corporation, as in all unit, there is an area responsible for risk control, which will provide a consolidated view of the risks of the entity and present the required critical analysis. | ||||||||||||||
Provides control function to ensure that the entity does not expose itself to losses that may harm their solvency. For this, in addition to ensure effective control of risks and ensure that the same are managed according to the level of risk appetite set by management of the Conglomerate Santander and of the units, it should conduct a systematic review of exposures to different risks, proving that the levels of risks taken comply with the objectives and limits set. | ||||||||||||||
Within the institution there is an area responsible for monitoring the metrics that delimit the risk appetite, providing a consolidate view of the entity’s risk. | ||||||||||||||
The area has the function to ensure that the entity is not expose your losses that could impair its solvency. The Risk’s appetite controls are done and these controls are aligned and approved according to the established governance, thereby complying with the objectives and limits settled. | ||||||||||||||
37. Corporate Restructuring | ||||||||||||||
We implemented several social movements in order to reorganize the operations and activities of entities according to the business plan of the Conglomerate Santander. | ||||||||||||||
a) Partnership Formation with the Hyundai Group in Brazil | ||||||||||||||
On April 28, 2016, the Aymoré CFI and Banco Santander entered into a transaction for the formation of a partnership with Hyundai Motor Brasil Mondadori de Automóveis Ltda. (Hyundai Motor Brazil) and Hyundai Capital Services, Inc. (Hyundai Capital) for the constitution of Banco Hyundai Capital Brasil S.A. and an insurance brokerage company to provide, respectively, auto finance and insurance brokerage services and products to consumers and Hyundai dealerships in Brazil. The partnership capital structure will have a shareholding of 50% (fifty percent) of the Aymoré CFI, 25% (twenty five percent) of Hyundai Capital and 25% (twenty five percent) of Hyundai Motor Brazil. The execution of the operation shall be subject to the fulfillment of certain conditions precedent usual in similar transactions, including obtaining the applicable regulatory approvals. | ||||||||||||||
b) Agreement on the Acquisition, of part of the Financial Operation of PSA Group in Brazil and a Consequent Creation of a Joint Venture | ||||||||||||||
On August 1, 2016, after the fulfillment of the applicable conditions precedent, including obtaining the appropriate regulatory approvals, the Aymoré CFI and Banco Santander, in the context of a partnership between the Banque PSA Finance ( "Banque PSA") and Santander Consumer Finance in Europe for joint operation of the vehicle financing business of PSA brands (Peugeot, Citroën and DS), signed definitive documents for the formation of a financial cooperation with Banque PSA for offering a range of financial and insurance products to consumers and dealers of PSA in Brazil. | ||||||||||||||
The main vehicle of financial cooperation is Banco PSA Finance Brasil S.A. who is being held in the proportion of 50% by Aymoré CFI, a subsidiary of Banco Santander, and 50% by Banque PSA. The purchase price was equal to the book value (proportional) on the closing date (08/01/2016). The operation also included the acquisition by Banco Santander subsidiary, 100% of Santander Finance Arrendamento Mercantil S.A. (actual name of PSA Finance Arrendamento Mercantil S.A.), whose price was equivalent to 74% of the equity value on the closing date, and also 50% of PSA Corretora de Seguros e Serviços Ltda., whose price was equal to the book value (proportional) on the closing date. | ||||||||||||||
114
The Bank began to consolidate these companies from August 1, 2016 | ||||||||||||||
c) Investment in Super Pagamentos e Administração de Meios Eletrônicos Ltda. (“Super Pagamentos”) | ||||||||||||||
On October 3, 2014, Aymoré CFI signed an investment agreement ("Agreement") with a view to make an investment in Super Pagamentos, which shall result in the subscription and payment of new shares issued by Super Pagamentos, representing 50% of its total and voting capital. | ||||||||||||||
The closing of the operation held on December 12, 2014 and was subject to completion of certain conditions precedent set forth in the Agreement, including the prior approval of the Central Bank (obtained on December 2, 2014). Aymoré CFI subscribed and paid share capital of Super Pagamentos in R$31,128, through the issuance of 20 million new common shares. | ||||||||||||||
On January 4, 2016, Aymoré CFI informed the owners of the shares representing the remaining 50% of Super Pagamento total voting capital its decision to exercise the call option for the acquisition of such shares, for a value of approximately R$113 million.The transaction was concluded on March 10, 2016. | ||||||||||||||
d) Sale of Santander Securities Services Brasil DTVM S.A. | ||||||||||||||
On June 19, 2014, preliminary documents were executed containing the main terms and conditions related to the sale of the operation of qualified custody business, currently performed by Banco Santander, and all of the shares issued by Santander Securities Services Brasil DTVM S.A. | ||||||||||||||
On August 31, 2015 the sales transaction of the qualified custody business, with the sale of all shares of Santander Securities Services Brasil DTVM S.A. to Santander Securities Services Brasil Participações S.A., indirectly controlled by Banco Santander Spain, was concluded at the amount of R$859 million. | ||||||||||||||
The transaction generated a gain of R$750,550 before taxes recorded in the Non-Operating Income item. | ||||||||||||||
The operation fits into the context of a global negotiation of the custody business, which involves, in addition to Brazil, the qualified custodian activity in Spain and Mexico. | ||||||||||||||
e) Other Corporate Movements | ||||||||||||||
The following corporate acts were also carried out: | ||||||||||||||
• On December 30, 2016, at the EGM of Webmotors S.A., the merger and the Private Instrument of Protocol and Justification of Incorporation of Virtual Motors by Webmotors S.A. were approved, so that Webmotors S.A. received, for its accounting value, based on the balance sheet drawn up on November 30, 2016, all of the assets, rights and obligations of Virtual Motors, with the extinction of Virtual Motors that will be succeeded by Webmotors S.A. in all its rights and obligations. | ||||||||||||||
• On July 14, 2016, was concluded the sale of 100% of the shares representing the capital stock of Mantiq held by Banco Santander and Santander Participações to Angra Ventures Participações Ltda. | ||||||||||||||
38. Other Information | ||||||||||||||
a) The co-obligations and risks on guarantees provided on behalf of customers, recorded in off balance accounts, amounted to R$34,251,930 (12/31/2015 - R$39,899,151) Bank and R$35,063,909 (12/31/2015 - R$40,408,776) Consolidated. | ||||||||||||||
b) The total amount of Santander Conglomerate investment funds and assets under management is R$1,533,620(12/31/2015 - R$2,542,286) and the total amount of investment funds and assets managed is R$158,734,033 (12/31/2015 - R$130,345,248) recorded as off balance accounts. | ||||||||||||||
c) The insurance contracted in effect on December 31, 2016, the global bank, fires, vehicles and other, have coverage amount of R$876,519 (12/31/2015 - R$998,255) Bank and R$885,043 (12/31/2015 - R$1,004,750) Consolidated and global bank, was hired insurance with coverage amount of R$148,499 (12/31/2015 - R$296,999) Bank and Consolidated, may be used alone or together, provided they do not exceed the contracted amount. | ||||||||||||||
d) Restricted operations were as follows: | ||||||||||||||
|
|
|
|
|
|
|
|
|
|
|
|
|
| Bank/Consolidated |
Assets | Income | Assets | Income | |||||||||||
(Liabilities) |
| (Expenses) | (Liabilities) |
| (Expenses) | |||||||||
01/01 to | 01/01 to | |||||||||||||
|
|
|
|
|
|
|
| 12/31/2016 |
| 12/31/2016 |
| 12/31/2015 |
| 12/31/2015 |
Restricted Operations on Assets |
|
|
|
|
|
|
|
|
|
| ||||
Lending Operations |
|
|
|
|
| - |
| 170 |
| 10,156 |
| 1,332 | ||
Liabilities Restricted Operations on Assets |
|
|
|
|
|
|
|
|
|
| ||||
Deposits |
|
|
|
|
| - |
| (170) |
| (10,156) |
| (1,332) | ||
Net Income |
|
|
|
|
|
|
| - |
|
|
| - | ||
e) Obligation Offset and Settlement Agreements - CMN Resolution 3,263/2005 - Banco Santander has an obligation offset and settlement agreement within the ambit of National Financial Institutions (SFN), entered into with individuals and legal entities which may or may not be members of SFN, resulting in improved assurance of financial settlement, with the parties with which it has this type of agreement. These agreements establish that payment obligations with Banco Santander, arising from loans and derivative transactions, in case of default of the counterparty, will be offset against payment obligations of Banco Santander with the counterparty. | ||||||||||||||
115
f) Other Obligations - Banco Santander rents properties, mainly used for branches, based on a standard contract which may be cancelled at its own criterion and includes the right to opt for renewals and adjustment clauses, classified as operating lease. | ||||||||||||||
Total future minimum payments of non-cancelable operating leases: | ||||||||||||||
|
|
|
|
|
|
|
|
|
|
|
|
|
|
|
|
|
|
|
|
|
|
|
|
|
|
|
|
|
|
|
|
|
|
|
|
|
|
|
|
|
| 31/12/2016 |
| 31/12/2015 |
Up to 1 Year |
|
|
|
|
|
|
|
|
|
|
| 646,804 |
| 640,132 |
Between1 to 5 Years |
|
|
|
|
|
|
|
|
|
|
| 1,789,670 |
| 1,873,889 |
More than 5 Years |
|
|
|
|
|
|
|
|
|
|
| 496,802 |
| 685,090 |
Total |
|
|
|
|
|
|
|
|
|
| 2,933,276 |
| 3,199,111 | |
Additionally, Banco Santander has contracts for a matures indeterminate, totaling R$1,013 (12/31/2015 - R$696) monthly rent corresponding to the contracts with this feature. Payment of operating leases recognized as expenses in the year of 2016, were valued at R$663,801 (2015 - R$659,332). | ||||||||||||||
Monthly rental contracts will be adjusted on an annual basis, as per prevailing legislation, at Market General Price Index (IGPM) variation. The lessee is entitled to unilaterally rescind the agreement, at any time, accordance with contractual clauses and legislation. | ||||||||||||||
g) In the context of the merger transaction of Getnet Tecnologia em Captura e Processamento de Transações H.U.A.H. S.A. (Getnet H.U.A.H. S.A.) into Getnet Adquirencia e Serviços para Meios de Pagamento S.A. (Getnet S.A.), Banco Santander has granted to members of the Getnet H.U.A.H. S.A. a put option whose purpose all shares of Getnet H.U.A.H. S.A. held by them, equivalent to 11.5% of the total capital of the company. Considering the conditions for the exercise of the put option, was not registered any corresponding obligation. | ||||||||||||||
h) In the context of the operation, were granted between Banco Santander e Banco Bonsucesso S.A. (Banco Bonsucesso) the institutions a put option (Banco Bonsucesso right of sale) and purchase (Banco Santander right to acquire), relating to all shares issued by the Banco Bonsucesso held by them, representing to 40.0% of the total capital of the company. Considering the conditions for the exercise of the put option, no corresponding obligation was not recorded. | ||||||||||||||
**** | ||||||||||||||
116
(Free Translation into English from the Original Previously Issued in Portuguese) | |||
BANCO SANTANDER (BRASIL) S.A. AND SUBSIDIARIES | |||
Officers´ Stament on the Financial Statements |
In order to comply with article 25, § 1, item VI, of the Brazilian Securities an Exchange Commission (CVM) Instruction nº 480, of December 7, 2009, members of the Executive Board of Banco Santander (Brasil) S.A. (Banco Santander or Company) declare that discussed, reviewed and agreed with Financial Statements prepared in accordance with BRGAAP of Banco Santander,for the exercise ended December 31, 2016 and the documents that compose them, as follows: Management Report, balance sheet, income statement, statement of changes in equity, cash flows statement, statement of added value and explanatory notes, which were prepared in accordance with the accounting practices adopted in Brazil, according to the Brazilian Corporations Law, the rules of the National Monetary Council (CMN), the Central Bank of Brazil, in accordance with the Accounting Plan of National Financial System Institutions (COSIF) and other regulations and legislation applicable. These financial statements and the documents that compose them were the subject of unqualified opinions by the Independent Auditors and the Company´s Audit Committee. |
Members of Banco Santander´s Executive Board on December 31, 2016: |
CEO |
Sergio Agapito Lires Rial |
Senior Vice-President Executive Officers |
Conrado Engel |
José de Paiva Ferreira |
Vice-President Executive Officer and Investor Relations Officer |
Angel Santodomingo Martell |
Vice-President Executive Officers |
Alexandre Silva D'Ambrósio |
Antonio Pardo de Santayana Montes |
Carlos Rey de Vicente |
Jean Pierre Dupui |
João Guilherme de Andrade So Consiglio |
Juan Sebastian Moreno Blanco |
Manoel Marcos Madureira |
Vanessa de Souza Lobato Barbosa |
Executive Officers |
Jose Alberto Zamorano Hernandez |
José Roberto Machado Filho |
Maria Eugênia Andrade Lopez Santos |
Officers Without Designation |
Alexandre Grossmann Zancani |
Amancio Acúrcio Gouveia |
Ana Paula Nader Alfaya |
André de Carvalho Novaes |
Cassio Schmitt |
Cassius Schymura |
Ede Ilson Viani |
Felipe Pires Guerra de Carvalho |
Flávio Tavares Valadão |
Gilberto Duarte de Abreu Filho |
Igor Mario Puga (*) |
Luis Guilherme Mattos de Oliem Bittencourt |
Luiz Masagão Ribeiro Filho |
Marcelo Malanga |
Marcelo Zerbinatti |
Marcio Aurelio de Nobrega |
Marino Alexandre Calheiros Aguiar |
Mário Adolfo Libert Westphalen |
Nilton Sergio Silveira Carvalho |
Rafael Bello Noya |
Ramón Sanchez Díez |
Reginaldo Antonio Ribeiro |
Roberto de Oliveira Campos Neto |
Robson de Souza Rezende |
Ronaldo Wagner Rondinelli |
Sérgio Gonçalves |
Thomas Gregor Ilg |
Ulisses Gomes Guimarães |
(*) Pending approval by Bacen. |
117
(Free Translation into English from the Original Previously Issued in Portuguese) | |||
BANCO SANTANDER (BRASIL) S.A. AND SUBSIDIARIES | |||
Officers´ Statement on Independent Auditors' Report |
In order to comply with article 25, § 1, item V, of the Brazilian Securities an Exchange Commission (CVM) Instruction nº 480, of December 7, 2009, members of the Executive Board of Banco Santander (Brasil) S.A. (Banco Santander or Company) declare that discussed, reviewed and agreed with Financial Statements prepared in accordance with BRGAAP of Banco Santander which includes the 's Independent Auditors´ Reportforthe exercise ended December 31, 2016 and the documents that compose them, as follows: Management Report, balance sheet, income statement, statement of changes in equity, cash flows statement, statement of added value and explanatory notes, which were prepared in accordance with the accounting practices adopted in Brazil, according to the Brazilian Corporations Law, the rules of the National Monetary Council (CMN), the Central Bank of Brazil, in accordance with the Accounting Plan of National Financial System Institutions (COSIF) and other regulations and legislation applicable. These financial statements and the documents that compose them were the subject of unqualified opinions by the Independent Auditors and the Company´s Audit Committee. |
Members of Banco Santander´s Executive Board on December 31, 2016: |
CEO |
Sergio Agapito Lires Rial |
Senior Vice-President Executive Officers |
Conrado Engel |
José de Paiva Ferreira |
Vice-President Executive Officer and Investor Relations Officer |
Angel Santodomingo Martell |
Vice-President Executive Officers |
Alexandre Silva D'Ambrósio |
Antonio Pardo de Santayana Montes |
Carlos Rey de Vicente |
Jean Pierre Dupui |
João Guilherme de Andrade So Consiglio |
Juan Sebastian Moreno Blanco |
Manoel Marcos Madureira |
Vanessa de Souza Lobato Barbosa |
Executive Officers |
Jose Alberto Zamorano Hernandez |
José Roberto Machado Filho |
Maria Eugênia Andrade Lopez Santos |
Officers Without Designation |
Alexandre Grossmann Zancani |
Amancio Acúrcio Gouveia |
Ana Paula Nader Alfaya |
André de Carvalho Novaes |
Cassio Schmitt |
Cassius Schymura |
Ede Ilson Viani |
Felipe Pires Guerra de Carvalho |
Flávio Tavares Valadão |
Gilberto Duarte de Abreu Filho |
Igor Mario Puga (*) |
Luis Guilherme Mattos de Oliem Bittencourt |
Luiz Masagão Ribeiro Filho |
Marcelo Malanga |
Marcelo Zerbinatti |
Marcio Aurelio de Nobrega |
Marino Alexandre Calheiros Aguiar |
Mário Adolfo Libert Westphalen |
Nilton Sergio Silveira Carvalho |
Rafael Bello Noya |
Ramón Sanchez Díez |
Reginaldo Antonio Ribeiro |
Roberto de Oliveira Campos Neto |
Robson de Souza Rezende |
Ronaldo Wagner Rondinelli |
Sérgio Gonçalves |
Thomas Gregor Ilg |
Ulisses Gomes Guimarães |
(*) Pending approval by Bacen. |
118
(Convenience Translation into English from the Original Previously Issued in Portuguese) | |||
BANCO SANTANDER (BRASIL) S.A. AND SUBSIDIARIES | |||
| |||
Summary of the Report of the Audit Committee Six-month period and Fiscal Year ended December 31, 2016 | |||
The Audit Committee of the Santander Economic and Financial Conglomerate ("Conglomerate”), a statutory advisory body of the Board of Directors, acts as single entity through the leading institution, which is Banco Santander (Brasil) S.A. for all the institutions in the Conglomerate, including the capitalization and the open-ended private pension entity.
According to its Internal Charter (available at www.ri.santander.com.br), the Audit Committee advises the Board of Directors in the overview of the quality of the financial statements, its compliance with rules and legislation, the effectiveness and independence of the work performed by the internal and independent auditors, and the effectiveness of the internal control system and operational risk management. The Audit Committee also recommends amendments or improvements of policies, practices and procedures identified during the course of the performance of its duties, whenever deemed necessary.
The Audit Committee is composed by three independent members, all of which were appointed by the Board of Directors in a meeting held on March 22, 2016. Its Coordinator participates as a member of the Board of Directors’ Risk Committee and as an invitee in the Approval Products and Ethic and Compliance Committees.
The assessments made by the Audit Committee are based primarily on information received from executive officers, the internal and independent auditors and the areas responsible for the corporate monitoring of internal controls and operational risks. The Audit Committee performs its duties by holding meetings with management, auditors and specialists and conducts the analysis of documents and information submitted by it, as well as takes measures concerning other matters it deems necessary. The Audit Committee six-month activities report and the minutes of its meetings are regularly sent to the Board of Directors, with which it met on several occasions in the second half of 2016.
The Audit Committee also monitors the results of inspections and recommendations made by regulatory and self-regulating bodies and the respective action plans, holding specific meetings with representatives of the Central Bank of Brazil.
With regard to its attributions, the Audit Committee developed the following activities:
I. Financial Statements
BrGaap – The Audit Committee analyzed the financial statements of the institutions, the capitalization and private pension companies as the Conglomerate and confirmed their compliance. In this regard, it became aware of the results for the year ended December 31, 2016 by meeting with the independent auditors and with the professionals responsible for Controlling and for preparing the financial statements prior to their disclosure.
It also followed the preparation of the Management Report and the related notes to the Conglomerate for the six-month period and the fiscal the year ended December 31, 2016.
II. Internal Control and Operational Risk Management –The Audit Committee received information and held meetings with representatives of the Executive Vice Presidency of Risks, the Compliance Director, the Executive Vice Presidency of Technology and Operations, the main bodies responsible for the management, implementation and dissemination of the culture and infrastructure of internal controls and management of the Conglomerate. It also verified the cases under follow-up regarding the complaints received by the Canal Aberto (former Canal de Denuncias) and by the Superintendence of Special Occurrences. These verifications were conducted in accordance with Resolutions 2.554 / 98, 3.198/2004 and 3.380 / 06 of the National Monetary Council (CMN), the Sarbanes Oxley-SOX Act and Circular 249/04 of the Superintendence of Private Insurance (Susep). This
119
last one, related to the effective management of the system of internal controls directed at the prevention and reduction of operational risk and loss events for the Santander Capitalização S.A. and Evidence Previdência Privada.
III. Internal Audit -Concerning the internal audit work, the Audit Committee received information andmet formally with the Director responsible for the area and with other representatives of Internal Audit on several occasions during the second half of 2016. At these meetings, the Audit Committee appreciated the planning and work program of the Internal Audit for 2016, verified the work performed, the reports issued, conclusions and recommendations, highlighting compliance with recommendations for improvements in the areas where controls were considered as "Improve" or "Unsatisfactory". On several other occasions, Internal Audit professionals participated in the meetings of the Audit Committee. On December 14, 2016, the Audit Committee conducted the six-month performance evaluation of the Internal Audit, the result of which was presented and discussed with the Internal Audit Executive Director.
IV.Independent Audit -With respect to the work performed by the independent audit firm, PricewaterhouseCoopers Auditores Independentes (PwC), the Audit Committee met with the company formally on several occasions in the second half of 2016. At these meetings, the discussions involving the financial statements financial statements of the six-month period and fiscal year ended on December 31, 2016, accounting practices, business continuity plan and any deficiencies and recommendations for improvement that are part of the internal control report. The Audit Committee also evaluated the proposals presented by the "PwC" for the rendering of other services, in relation to the verification of the absence of conflicts of interest or risk of loss of independence.
V. Ombudsman - As a result of Resolution CMN 4.433 /15 and Resolution 279/13 of SUSEP, which provide for Ombudsman Offices in financial institutions, capitalization and private pension companies, specific work was executed in the second half of 2016, which was presented to the Audit Committee who discussed and evaluated it. The corresponding report required by Resolution CMN 3.849 / 10, to be sent to the Central Bank of Brazil, will be evaluated in a meeting scheduled for February 2017 .
VI. Other Activities - Besides the activities above described, as part of the work inherent in its duties, the Audit Committee met with members of the management and several areas of the Conglomerate, for additional analysis, especially the meetings with the following areas:
· With Legal Executives for updating on the evolution and treatment given to labor, civil and fiscal contingency liabilities and the corresponding accounting entries;
· With Compliance Executives about the Code of Ethic, the internal controls over transactions with related parties, anti-money laundering procedures, anticorruption;
· With the Vice Presidency of Finance, Strategy and Quality: implementation process of Basel requirements, Investor Relations, as well as analysis and monitoring of the financial statements and explanatory notes;
· With Executive Vice President of Risk: update of credit risk management processes focusing on evaluation criteria, monitoring and provisioning and updating of risk indicators generally, liquidity risk management, interest, foreign exchange and capital;
· Information Technology: monitoring of audit notes;
· Private Pension Plans: update on the financial situation of the Funds and follow up on legal proceedings;
· Agribusiness: follow-up of assessment made by IBAMA;
· Fiscal Board and Standards: periodic review of negotiation processes with related parties.
120
During the second half of 2016, period, members of the Audit Committee also participated in training, discussions and update programs on topics related to its activities and normative acts of interest and impact to the Conglomerate.
Conclusion
Based on the work and evaluations carried out and considering the context and scope in which it realize its activities, the Audit Committee concluded that the work carried out is adequate and provides transparency and quality to the Financial Statements of the Santander Economic and Financial Conglomerate for the six-month period and the fiscal year ended on December 31, 2016.
The Audit Committee recommends its approval by the Board of Directors of Banco Santander (Brasil) S.A.
Audit Committee
São Paulo, January,24, 2017
René Luiz Grande - Coordinator
Elidie Palma Bifano
Luiz Carlos Nannini – Financial Expert
121

Banco Santander (Brasil) S.A. | ||
| By: | /S/ Amancio Acurcio Gouveia | |
Amancio Acurcio Gouveia Officer Without Specific Designation | ||
| By: | /S/ Carlos Rey de Vicenti | |
Carlos Rey de Vicenti Vice - President Executive Officer | ||
122