SECURITIES AND EXCHANGE COMMISSION
Commission File Number: 001-34476
Bloco A – Vila Olimpia
São Paulo, SP 04543-011
Federative Republic of Brazil
Indicate by check mark if the registrant is submitting the Form 6-K in paper as permitted by Regulation S-T Rule 101(b)(1):
Yes _______ No ___X____
Indicate by check mark if the registrant is submitting the Form 6-K in paper as permitted by Regulation S-T Rule 101(b)(7):
Yes _______ No ___X____
Indicate by check mark whether by furnishing the information contained in this Form, the Registrant is also thereby furnishing the information to the Commission pursuant to Rule 12g3-2(b) under the Securities Exchange Act of 1934:
Yes _______ No ___X____
If “Yes” is marked, indicate below the file number assigned to the registrant in connection with Rule 12g3-2(b): N/A
BANCO SANTANDER (BRASIL) S.A. | ||||
CONSOLIDATED FINANCIAL STATEMENTS | ||||
INDEX | Page | |||
Independent Auditors' Report | F-1 | |||
Consolidated Statement of Financial Position | F-3 | |||
Consolidated Income Statements | F-5 | |||
Consolidated Statements of Profit or Loss and Other Comprehensive Income | F-6 | |||
Consolidated Statements of Changes in Equity | F-7 | |||
Consolidated Statement of Cash Flows | F-8 | |||
Notes to the Consolidated Financial Statements | F-9 | |||
Note | 1 | Introduction, basis of presentation of the consolidated financial statements and other information | F-10 | |
Note | 2 | Accounting policies and method of measurement | F-14 | |
Note | 3 | Basis of consolidation | F-26 | |
Note | 4 | Change in the scope of consolidation | F-27 | |
Note | 5 | Cash and balances with the Brazilian Central Bank | F-29 | |
Note | 6 | Loans and amounts due from credit institutions | F-29 | |
Note | 7 | Debt instruments | F-30 | |
Note | 8 | Equity instruments | F-31 | |
Note | 9 | Derivative financial instruments and Short positions | F-31 | |
Note | 10 | Loans and advances to customers | F-38 | |
Note | 11 | Non-current assets held for sale | F-41 | |
Note | 12 | Investments in associates and joint ventures | F-41 | |
Note | 13 | Tangible assets | F-45 | |
Note | 14 | Intangible assets - Goodwill | F-46 | |
Note | 15 | Intangible assets - Other intangible assets | F-46 | |
Note | 16 | Other assets | F-47 | |
Note | 17 | Deposits from the Brazilian Central Bank and Deposits from credit institutions | F-48 | |
Note | 18 | Customer deposits | F-48 | |
Note | 19 | Marketable debt securities | F-48 | |
Note | 20 | Subordinated liabilities | F-50 | |
Note | 21 | Debt Instruments Eligible to Compose Capital | F-51 | |
Note | 22 | Other financial liabilities | F-51 | |
Note | 23 | Provisions for pensions and similar obligations | F-52 | |
Note | 24 | Provisions for judicial and administrative proceedings, commitments and other provisions | F-56 | |
Note | 25 | Tax assets and liabilities | F-60 | |
Note | 26 | Other liabilities | F-63 | |
Note | 27 | Other Comprehensive Income | F-63 | |
Note | 28 | Non-controlling interests | F-64 | |
Note | 30 | Earnings per share | F-68 | |
Note | 31 | Fair value of financial assets and liabilities | F-69 | |
Note | 32 | Operational Ratios | F-72 | |
Note | 33 | Interest and similar income | F-73 | |
Note | 34 | Interest expense and similar charges | F-74 | |
Note | 35 | Income from equity instruments | F-74 | |
Note | 36 | Fee and commission income | F-74 | |
Note | 37 | Fee and commission expense | F-75 | |
Note | 38 | Gains (losses) on financial assets and liabilities (net) | F-75 | |
Note | 39 | Exchange differences (net) | F-75 | |
Note | 40 | Other operating expense (net) | F-75 | |
Note | 41 | Personnel expenses | F-75 | |
Note | 42 | Other administrative expenses | F-78 | |
Note | 43 | Gains (losses) on disposal of assets not classified as non-current assets held for sale | F-79 | |
Note | 44 | Gains (losses) on disposal and expenses of non-current assets held for sale not classified as discontinued operations | F-79 | |
Note | 45 | Other disclosures | F-79 | |
Note | 46 | Business segment reporting | F-84 | |
Note | 47 | Related party transactions | F-86 | |
Note | 48 | Risk management | F-94 | |
APPENDIX I | RECONCILIATION OF SHAREHOLDERS’ EQUITY AND NET INCOME - BRGAAP vs IFRS | F- 119 | ||
APPENDIX II | STATEMENTS OF VALUE ADDED | F- 119 | ||
Management Reports | F-120 | |||
Executive’s Report of Financial Statements | ||||
| - | - | |||
(A free translation of the original in Portuguese)
www.pwc.com.br
Banco Santander (Brasil) S.A.
Consolidated financial statements at December 31, 2016 and independent auditor's report

(A free translation of the original in Portuguese)
Independent auditor's report
To the Board of Directors and Stockholders
Banco Santander (Brasil) S.A.
| Opinion | ||
| We have audited the accompanying consolidated financial statements of Banco Santander (Brasil) S.A.(the "Bank") and its subsidiaries, which comprise the consolidated statement of financial position as at December 31, 2016 and the consolidated statements of income, other comprehensive income, changes in equity and cash flows for the year then ended, and notes to the financial statements, including a summary of significant accounting policies. | ||
| In our opinion, the consolidated financial statements present fairly, in all material respects, the financial position of Banco Santander (Brasil) S.A. and its subsidiaries as at December 31, 2016, and their financial performance and their cash flows for the year then ended, in accordance with the International Financial Reporting Standards (IFRS) issued by the International Accounting Standards Board (IASB). | ||
| Basis for opinion | ||
| We conducted our audit in accordance with Brazilian and International Standards on Auditing. Our responsibilities under those standards are further described in the "Auditor's responsibilities for the audit of the consolidated financial statements" section of our report. We are independent of the Bank and its subsidiaries in accordance with the ethical requirements established in the Code of Professional Ethics and Professional Standards issued by the Brazilian Federal Accounting Council, and we have fulfilled our other ethical responsibilities in accordance with these requirements. We believe that the audit evidence we have obtained is sufficient and appropriate to provide a basis for our audit opinion. | ||
| Key audit matters | ||
| Key audit matters are those matters that, in our professional judgment, were of most significance in our audit of the financial statements of the current period. These matters were addressed in the context of our audit of the consolidated financial statements as a whole, and in forming our opinion thereon, and we do not provide a separate opinion on these matters. |
| |
SANT-IFRS-PA16VH-NOVAVERSAO.DOCX
| Banco Santander (Brasil) S.A. | ||
| Why it is a Key Audit Matter | How the matter was addressed in the audit | |
| Allowance for loan losses (Notes 1.c1.i, 2.i and 48.b) | ||
The estimation of the allowance for loan losses involves a high level of judgment by Management. The establishment of this allowance considers the existence of objective evidence of impairment loss and involves the definition of several assumptions, considering internal and external factors, including default levels and guarantees of the portfolios, renegotiation policy, and the current and prospective economic scenarios. Accordingly, this area was defined as an area of focus in our audit. | We carried out procedures to understand and test the internal controls that are significant in the calculation and recognition of the allowance for loan losses, mainly including the following processes: i) validation of the models and assumptions adopted by Management to determine the recoverable value of the loan; ii) adequate measurement of the guarantees in the determination of the recoverable value; iii) approval and records for renegotiated operations; iv) processing and recognition of provisions; v) reconciliation of accounting balances with the analytical support; vi) preparation of the notes to the financial statements. | |
| The Bank assesses whether there is objective evidence of impairment loss individually or collectively, if applicable. | ||
| For the provisions calculated considering the individual assessment, we assessed and tested the assumptions used to determine the recoverable value based on the credit risk. | ||
| In the individual assessment, the impairment loss considers the conditions of the borrower, such as their economic and financial position, the level of indebtedness, capacity to generate income, cash flow, among others, as well as the history of losses and other known circumstances at the time of the assessment. | ||
| For the provisions calculated considering the collective assessment, we tested, on a sample basis, the statistical models applied in the determination of the recoverable value of the loan, testing the integrity of the database, and we also assessed the process of approval of these models. | ||
| In the collective assessment, the impairment loss is calculated using statistical models that take into account historical factors such as: EAD (default exposure), PD (probability of default) and LGD (default loss). | ||
| We consider that the criteria and assumptions adopted by Management to determine the allowance for loan losses are reasonable in the context of the financial statements. | ||
Banco Santander (Brasil) S.A.
| Why it is a Key Audit Matter | How the matter was addressed in the audit | |
| Recognition and recoverable value of tax | ||
| credits (Notes 1.c1.ii, 2.aa and 25.d) | ||
| Tax credits arising from temporary differences in the calculation basis of taxes, as well as tax losses, are recognized in the books based on the expectation that future taxable profits will be available for their realization. | We carried out procedures to understand and test the significant internal controls that involve the calculation of tax credits arising from temporary differences and tax losses, as well as the estimates of the recoverable value of these tax credits, in accordance with the applicable standards. | |
| The expectation of tax credit realization is based on projections of future results that require judgment by Management, including the use of assumptions. | ||
| We obtained an understanding of the critical assumptions included in the respective projections, and, with the assistance of our experts in company evaluations, we compared them with available macroeconomic data and the Bank's historical and prospective information for the most significant assumptions. | ||
| Considering the subjectivity in to this process, this was considered an area of focus in our audit. | ||
| We performed tests to confirm the nature andamounts of the temporary differences and tax lossesthat could be deducted from the future tax baseswith the assistance of our experts in the tax area. | ||
| We discussed with Management and the AuditCommittee, and confirmed the approval of thetechnical study that supports the realization of thetax credits by the proper management bodies. | ||
| We consider that the criteria and assumptionsadopted by Management to determine tax creditsare reasonable, in all material respects, in thecontext of the financial statements. | ||
| Provisions for contingent liabilities (Notes | ||
| 1.c1.v, 2.r and 24.c) | ||
| The Bank and its subsidiaries are parties to tax, labor and civil proceedings, at the administrative and judicial levels, resulting from the normal course of their business. | We obtained an understanding and tested the significant internal controls that involve the identification and recognition of liabilities, and the disclosures in the notes to the financial statements, which, among others, also considered the internal controls related to the calculation model adopted for the establishment of provisions for labor and civil contingencies, which are recorded under the average historical loss criterion. | |
| In general, these proceedings are terminated after a long period and involve not only discussions on merits, but also complex procedural aspects, in accordance with applicable legislation. | ||
| The decision to recognize a contingent liability and the measurement bases require the judgment by the Bank's Management. In the circumstances, this was considered an area of focus in our audit. | We tested the application of the mathematical models for the calculation of the average historical losses related to the labor and civil contingencies. We also tested the quantity of outstanding | |
Banco Santander (Brasil) S.A.
| Why it is a Key Audit Matter | How the matter was addressed in the audit | |
| proceedings at the base date of the financial statements. | ||
| We performed confirmation procedures with the law firms responsible for the significant administrative and judicial proceedings to confirm the assessment of the prognosis, the completeness of the information and the correct amount of the provisions. | ||
| With the support of our experts, we analyzed the reasonableness of the estimate of loss in the most significant tax, labor and civil proceedings. | ||
| We consider that the criteria and assumptions adopted by Management to determine the provision for contingent liabilities are reasonable, in all material respects, in the context of the financial statements. | ||
| Post-employment benefit plans (Notes 1.c.iv, | ||
| 2.x and 23) | ||
| The Bank has post-employment benefit plans with characteristics of defined benefit of defined benefit, arising from existing plans in institutions acquired in former years, whose amounts are significant in the context of the financial statements, and involve the need to use an adequate database, and the establishment of assumptions with a high degree of subjectivity, such as: discount, inflation and mortality rates. | We carried out procedures to understand and test the significant internal controls that involve the recording and measurement of liabilities arising from post-employment benefit plans. Among others, we considered the controls related to the completeness and adequacy of the databases, the existence and correct amount of the assets of the benefit plans, and the approval of assumptions considered in the actuarial calculations. | |
| This was an area of focus in our audit, since changes in assumptions may result in significant impacts on the obligations related to defined benefit plans. In addition, the establishment of assumptions involves a significant degree of judgment by Management. | With the assistance of our actuarial experts, we obtained an understanding of the methodologies and judgments used by Management to determine the assumptions applied in the calculation of the obligations in comparison with market parameters. | |
| On a sample basis, we re-performed the actuarial calculations carried out by the external actuaries, taking into consideration the assumptions adopted in the calculations. Also, on a sample basis, we tested the existence and the recalculation of the fair value of the plan assets. | ||
| We consider that the criteria and assumptions adopted by Management to determine the provision for post-employment benefit plans are reasonable, | ||
SANT-IFRS-PA16VH-NOVAVERSAO.DOCX
| 5 |
Banco Santander (Brasil) S.A.
| Why it is a Key Audit Matter | How the matter was addressed in the audit | |
| in all material respects, in the context of the financial statements. | ||
| Measurement of the fair value of certain financial assets with low liquidity and without an active market (Notes 1.c.iii, 2.e, 7, 8, 9 and 31) | ||
| The measurement of the fair value of financial instruments was an area of focus of our audit due to its significance in the context of the financial statements and the involvement of a high level of judgment by Management, since the measurement depends on valuation techniques carried out through internal models, which are based on certain assumptions for the valuation of instruments with low liquidity and without an active market and/or observable data. These financial instruments mostly comprise investments in securities issued by companies and derivative contracts. | We carried out procedures to understand and test the significant internal controls that involve the measurement, recognition and disclosure of the fair value of financial instruments and derivatives. | |
| With the assistance of our experts in the pricing of financial instruments, we obtained an understanding of the pricing calculation methodologies, analyzed the reasonableness of the assumptions used by Management to prepare pricing curves and internal models, and also verified the alignment of these assumptions and models with the practices adopted in the market. | ||
| We performed independent valuation tests of certain transactions, selected on sampling basis. | ||
| We consider that the criteria and assumptions adopted by Management to measure the fair value of these financial instruments and derivatives are reasonable, in all material respects, in the context of the financial statements. | ||
| Impairment testing: Intangible assets - Goodwill (Notes 2.o.i and 14) | ||
| The Bank and its subsidiaries have recorded goodwill related to acquisitions made in prior years whose amount is material in relation to the financial statements. | We carried out procedures to understand and test the significant internal controls related to the goodwill impairment test performed by Management. | |
| Management prepares on an annual basis a test to assess the need for impairment of goodwill. This test involves significant estimates and judgments. | With the assistance of our experts, we carried out procedures to understand the assumptions and projections adopted by Management and its external consultants. | |
| For these reasons, we considered this as an area of audit focus, since different assumptions used by Management in the projection of future results may significantly change the assessment of goodwill | ||
| We also evaluated the methodology for determining the recoverable value of goodwill, considering the adequacy of various assumptions, among which, the | ||
SANT-IFRS-PA16VH-NOVAVERSAO.DOCX
6
Banco Santander (Brasil) S.A.
| Why it is a Key Audit Matter | How the matter was addressed in the audit | |
| impairment and consequently affect the financial statements. | growth rate, the discount rate and the projections made. We compared the projections with the historical results in order to assess the consistency, as well as the macroeconomic data with the market projections. We also recalculated the discount rate and present value of the future cash flows used by Management. | |
| We consider that the criteria and assumptions adopted by Management to test loan losses are reasonable in the context of the financial statements. | ||
| Information technology environment | ||
| (Note 48.d.4) | ||
| The Bank and its subsidiaries have a business environment that is highly dependent on technology, requiring a complex infrastructure to support the high volume of transactions processed daily in its several systems. | With the assistance of our system experts, we evaluated the design and tested the operating effectiveness of the controls related to the management of the information technology environment, including the compensating controls established. | |
| The risks inherent to information technology, associated with deficiencies in processes and controls that support the processing of the technology systems, considering the legacy systems and existing technology environments, could result in the incorrect processing of critical information, including those used in the preparation of the financial statements. Therefore, this was considered an area of focus in our audit. | ||
| The procedures carried out involved the combination of the control tests, and, when applicable, the testing of compensating controls, as well as the conduction of tests regarding the key processes related to information security, the development and maintenance of systems, and the operation of computers related to the infrastructure that supports the business of the Bank and its subsidiaries, including the management of accesses, treatment of incidents, segregation of duties, and cyber security aspects. | ||
| As a result of this work, we determined the nature and extent of our auditing procedures, and considered that the technology environment processes and controls, associated with the compensating controls and tests conducted, provided a reasonable basis for the result of our audit of the financial statements. | ||
SANT-IFRS-PA16VH-NOVAVERSAO.DOCX
7
Banco Santander (Brasil) S.A.
| Other matters |
| Audit of comparative figures |
| The consolidated financial statements mentioned in the first paragraph include, for comparison purposes, accounting information corresponding to the balance sheet as at December 31, 2015, and the statements of income, changes in equity and cash flows for the year then ended, obtained from the consolidated financial statements for that year, reclassified as described on Notes 2.u.ii and 31. The consolidated financial statements of the Company for the year ended December 31, 2015 were audited by another firm of independent auditors whose report, dated February 24, 2017, expressed an unqualified opinion on those statements. |
| Other information accompanying the consolidated financial statements and the independent auditor's report |
| he Bank's management is responsible for the other information that comprises the Management Report. |
| Our opinion on the consolidated financial statements does not cover the Management Report, and we do not express any form of audit conclusion thereon. |
| In connection with the audit of the financial statements, our responsibility is to read the Management Report and, in doing so, consider whether this report is materially inconsistent with the financial statements or with our knowledge obtained in the audit or otherwise appears to be materially misstated. If, based on the work we have performed, we conclude that there is a material misstatement in the Management Report, we are required to report that fact. We have nothing to report in this regard. |
| Responsibilities of management and those charged with governance for the consolidated financial statements |
| Management is responsible for the preparation and fair presentation of these consolidated financial statements in accordance with the International Financial Reporting Standards (IFRS), issued by the International Accounting Standards Board (IASB), and for such internal control as management determines is necessary to enable the preparation of financial statements that are free from material misstatement, whether due to fraud or error. |
SANT-IFRS-PA16VH-NOVAVERSAO.DOCX
8
Banco Santander (Brasil) S.A.
In preparing the consolidated financial statements, management is responsible for assessing the ability of the Bank and its subsidiaries to continue as a going concern, disclosing, as applicable, matters related to going concern and using the going concern basis of accounting unless management either intends to liquidate the Bank and its subsidiaries or to cease operations, or has no realistic alternative but to do so.
Those charged with governance are responsible for overseeing the financial reporting process of the Bank and its subsidiaries.
Auditor's responsibilities for the audit of the consolidated financial statements |
Our objectives are to obtain reasonable assurance about whether the consolidated financial statements as a whole are free from material misstatement, whether due to fraud or error, and to issue an auditor's report that includes our opinion. Reasonable assurance is a high level of assurance, but is not a guarantee that an audit conducted in accordance with Brazilian and International Standards on Auditing will always detect a material misstatement when it exists. Misstatements can arise from fraud or error and are considered material if, individually or in the aggregate, they could reasonably be expected to influence the economic decisions of users taken on the basis of these financial statements.
As part of an audit in accordance with Brazilian and International Standards on Auditing, we exercise professional judgment and maintain professional skepticism throughout the audit. We also:
•Identify and assess the risks of material misstatement of the consolidated financial statements, whether due to fraud or error, design and perform audit procedures responsive to those risks, and obtain audit evidence that is sufficient and appropriate to provide a basis for our opinion. The risk of not detecting a material misstatement resulting from fraud is higher than for one resulting from error, as fraud may involve collusion, forgery, intentional omissions, misrepresentations, or the override of internal control.
•Obtain an understanding of internal control relevant to the audit in order to design audit procedures that are appropriate in the circumstances, but not for the purpose of expressing an opinion on the effectiveness of the internal control of the Bank and its subsidiaries.
•Evaluate the appropriateness of accounting policies used and the reasonableness of accounting estimates and related disclosures made by management.
•Conclude on the appropriateness of management's use of the going concern basis of accounting and, based on the audit evidence obtained, whether a material uncertainty exists related to events or conditions that may cast significant doubt on the ability of the Bank and its subsidiaries to continue as a going concern. If we conclude that a material uncertainty exists, we are required to draw attention in our auditor's report to the related disclosures in the consolidated financial statements or, if such disclosures are inadequate, to modify our opinion. Our conclusions are based on the audit evidence obtained up to the date of our auditor's report. However, future events or conditions may cause the Bank and its subsidiaries to cease to continue as a going concern.
•Evaluate the overall presentation, structure and content of the consolidated financial statements, including the disclosures, and whether these financial statements represent the underlying transactions and events in a manner that achieves fair presentation.
SANT-IFRS-PA16VH-NOVAVERSAO.DOCX
9
Banco Santander (Brasil) S.A.
•Obtain sufficient appropriate audit evidence regarding the financial information of the entities or business activities within the Group to express an opinion on the consolidated financial statements. We are responsible for the direction, supervision and performance of the group audit. We remain solely responsible for our audit opinion.
We communicate with those charged with governance regarding, among other matters, the planned scope and timing of the audit and significant audit findings, including any significant deficiencies in internal control that we identify during our audit.
We also provide those charged with governance with a statement that we have complied with relevant ethical requirements regarding independence, and to communicate with them all relationships and other matters that may reasonably be thought to bear on our independence, and where applicable, related safeguards.
From the matters communicated with those charged with governance, we determine those matters that were of most significance in the audit of the financial statements of the current period and are therefore the key audit matters. We describe these matters in our auditor's report unless law or regulation precludes public disclosure about the matter or when, in extremely rare circumstances, we determine that a matter should not be communicated in our report because the adverse consequences of doing so would reasonably be expected to outweigh the public interest benefits of such communication.
São Paulo, February 24, 2017
PricewaterhouseCoopers
Auditores Independentes
CRC 2SP000160/O-5
Edison Arisa Pereira
Contador CRC 1SP127241/O-0
SANT-IFRS-PA16VH-NOVAVERSAO.DOCX
10
BANCO SANTANDER (BRASIL) S.A. |
CONSOLIDATED STATEMENT OF FINANCIAL POSITION |
(Thousands of Brazilian Reais - R$) |
Assets | Note | 2016 | 2015 | 2014 | ||||
Cash and Balances With The Brazilian Central Bank | 5 | 110,604,911 | 89,143,353 | 55,903,848 | ||||
|
|
|
|
|
|
|
|
|
Financial Assets Held For Trading |
|
|
| 84,873,663 |
| 50,536,731 |
| 56,013,603 |
Debt instruments |
| 7 |
| 59,994,946 |
| 25,193,598 |
| 47,106,811 |
Equity instruments |
| 8 |
| 398,461 |
| 404,973 |
| 391,656 |
Trading derivatives |
| 9 |
| 24,480,256 |
| 24,938,160 |
| 8,515,136 |
|
|
|
|
|
|
| ||
Other Financial Assets At Fair Value Through Profit Or Loss |
|
|
| 1,711,204 |
| 2,080,234 |
| 996,694 |
Debt instruments |
| 7 |
| 1,668,749 |
| 1,506,570 |
| 93,900 |
Equity instruments |
| 8 |
| 42,455 |
| 573,664 |
| 902,794 |
|
|
|
|
|
|
|
| |
Available-For-Sale Financial Assets |
|
|
| 57,815,045 |
| 68,265,606 |
| 75,164,342 |
Debt instruments |
| 7 |
| 55,829,572 |
| 67,103,274 |
| 73,510,698 |
Equity instruments |
| 8 |
| 1,985,473 |
| 1,162,332 |
| 1,653,644 |
|
|
|
|
|
|
|
|
|
Held to maturity investments |
| 7 |
| 10,048,761 |
| 10,097,836 |
| - |
|
|
|
|
|
|
| ||
Loans and Receivables |
|
|
| 296,048,506 |
| 306,268,788 |
| 264,607,746 |
Loans and amounts due from credit institutions |
| 6 |
| 27,762,473 |
| 42,422,638 |
| 28,917,397 |
Loans and advances to customers |
| 10 |
| 252,002,774 |
| 252,033,449 |
| 235,690,349 |
Debt instruments |
| 7 |
| 16,283,259 |
| 11,812,701 |
| - |
|
|
|
|
|
|
|
| |
Hedging Derivatives |
| 9 |
| 222,717 |
| 1,312,202 |
| 212,552 |
|
|
|
|
|
|
| ||
Non-Current Assets Held For Sale |
| 11 |
| 1,337,885 |
| 1,237,493 |
| 929,948 |
|
|
|
|
|
|
| ||
Investments in Associates and Joint Ventures |
| 12 |
| 990,077 |
| 1,060,743 |
| 1,023,461 |
Tax Assets |
| 25 |
| 28,753,184 |
| 34,769,848 |
| 23,019,696 |
Current |
|
|
| 4,316,072 |
| 4,194,344 |
| 2,981,696 |
Deferred |
|
|
| 24,437,112 |
| 30,575,504 |
| 20,038,000 |
|
|
|
|
|
|
|
| |
Other Assets |
| 16 |
| 5,104,012 |
| 3,802,118 |
| 5,066,726 |
|
|
|
|
|
|
| ||
Tangible Assets |
| 13 |
| 6,646,433 |
| 7,005,914 |
| 7,071,036 |
|
|
|
|
|
|
| ||
Intangible Assets |
|
|
| 30,236,842 |
| 29,813,662 |
| 30,221,258 |
Goodwill |
| 14 |
| 28,355,039 |
| 28,332,719 |
| 28,270,955 |
Other intangible assets |
| 15 |
| 1,881,803 |
| 1,480,943 |
| 1,950,303 |
|
|
|
|
|
|
| ||
TOTAL ASSETS |
|
|
| 634,393,240 |
| 605,394,528 |
| 520,230,910 |
The accompanying Notes are an integral part of these consolidated financial statements. | ||||||||
Liabilities and Stockholders' Equity | Note | 2016 | 2015 | 2014 | ||||
Financial Liabilities Held For Trading |
|
|
| 51,619,869 |
| 42,387,768 |
| 19,569,791 |
Trading derivatives |
| 9.a |
| 19,925,600 |
| 22,340,137 |
| 8,284,360 |
Short positions |
| 9.b |
| 31,694,269 |
| 20,047,631 |
| 11,285,431 |
|
|
|
|
|
|
|
| |
Financial Liabilities at Amortized Cost |
|
|
| 471,579,467 |
| 457,281,656 |
| 392,186,593 |
Deposits from Brazilian Central Bank and deposits from credit institutions |
| 17 |
| 78,634,072 |
| 69,451,498 |
| 63,674,201 |
Customer deposits |
| 18 |
| 247,445,177 |
| 243,042,872 |
| 220,644,019 |
Marketable debt securities |
| 19 |
| 99,842,955 |
| 94,658,300 |
| 70,355,249 |
Subordinated debts |
| 20 |
| 466,246 |
| 8,097,304 |
| 7,294,077 |
Debt Instruments Eligible to Compose Capital |
| 21 |
| 8,311,918 |
| 9,959,037 |
| 6,773,312 |
Other financial liabilities |
| 22 |
| 36,879,099 |
| 32,072,645 |
| 23,445,735 |
|
|
|
|
|
|
| ||
Hedging Derivatives |
| 9 |
| 311,015 |
| 2,376,822 |
| 893,902 |
|
|
|
|
|
|
|
| |
Provisions |
|
|
| 11,776,491 |
| 11,409,677 |
| 11,127,444 |
Provisions for pensions funds and similar obligations |
| 23 |
| 2,710,627 |
| 2,696,653 |
| 3,869,728 |
Provisions for judicial and administrative proceedings, commitments and other provisions |
| 24 |
| 9,065,864 |
| 8,713,024 |
| 7,257,716 |
|
|
|
|
|
|
|
| |
Tax Liabilities |
| 25 |
| 6,094,740 |
| 5,253,125 |
| 12,423,002 |
Current |
|
|
| 4,826,703 |
| 4,436,000 |
| 12,110,582 |
Deferred |
|
|
| 1,268,037 |
| 817,125 |
| 312,420 |
|
|
|
|
|
|
|
| |
Other Liabilities |
| 26 |
| 8,199,099 |
| 6,850,196 |
| 5,346,885 |
|
|
|
|
|
|
| ||
Total Liabilities |
|
|
| 549,580,681 |
| 525,559,244 |
| 441,547,617 |
|
|
|
|
|
|
|
| |
Stockholders' Equity |
| 29 |
| 85,434,855 |
| 83,531,754 |
| 80,105,041 |
Share capital |
|
|
| 57,000,000 |
| 57,000,000 |
| 56,806,384 |
Reserves |
|
|
| 27,881,326 |
| 24,388,967 |
| 20,594,135 |
Treasury shares |
|
|
| (514,034) |
| (423,953) |
| (445,501) |
Option for Acquisition of Equity Instrument |
|
|
| (1,017,000) |
| (1,017,000) |
| (950,000) |
Profit for the year attributable to the Parent |
|
|
| 7,334,563 |
| 9,783,740 |
| 5,630,023 |
Less: dividends and remuneration |
|
|
| (5,250,000) |
| (6,200,000) |
| (1,530,000) |
|
|
|
|
|
|
| ||
Other Comprehensive Income |
|
|
| (1,347,800) |
| (4,131,532) |
| (1,801,921) |
|
|
|
|
|
|
| ||
Stockholders' Equity Attributable to the Parent |
|
|
| 84,087,055 |
| 79,400,222 |
| 78,303,120 |
|
|
|
|
|
|
|
|
|
Non - Controlling Interests |
| 28 |
| 725,504 |
| 435,062 |
| 380,173 |
|
|
|
|
|
|
| ||
Total Stockholders' Equity |
|
|
| 84,812,559 |
| 79,835,284 |
| 78,683,293 |
Total Liabilities and Stockholders' Equity |
|
|
| 634,393,240 |
| 605,394,528 |
| 520,230,910 |
The accompanying Notes are an integral part of these consolidated financial statements. | ||||||||
BANCO SANTANDER (BRASIL) S.A. |
CONSOLIDATED INCOME STATEMENTS |
(Thousands of Brazilian Reais - R$, except for per share data) |
Note | 2016 | 2015 | 2014 | |||||
Interest and similar income |
| 33 |
| 77,146,077 |
| 69,870,200 |
| 58,923,916 |
Interest expense and similar charges |
| 34 |
| (46,559,584) |
| (38,533,089) |
| (31,695,404) |
Net Interest Income |
|
|
| 30,586,493 |
| 31,337,111 |
| 27,228,512 |
Income from equity instruments |
| 35 |
| 258,545 |
| 142,881 |
| 222,302 |
Income from companies accounted for by the equity method |
| 12 |
| 47,537 |
| 116,312 |
| 91,096 |
Fee and commission income |
| 36 |
| 13,548,481 |
| 11,797,191 |
| 11,368,098 |
Fee and commission expense |
| 37 |
| (2,570,885) |
| (2,313,682) |
| (2,602,212) |
Gains (losses) on financial assets and liabilities (net) |
| 38 |
| 3,016,156 |
| (20,002,859) |
| 2,748,163 |
Financial assets held for trading |
|
|
| 3,166,399 |
| (19,936,801) |
| 2,270,059 |
Other financial instruments at fair value through profit or loss |
|
|
| 82,638 |
| 46,859 |
| (77,624) |
Financial instruments not measured at fair value through profit or loss |
|
|
| (115,202) |
| (120,523) |
| 512,190 |
Other |
|
|
| (117,679) |
| 7,606 |
| 43,538 |
Exchange differences (net) |
| 39 |
| 4,574,814 |
| 10,084,420 |
| (3,635,599) |
Other operating expense (net) |
| 40 |
| (624,571) |
| (347,123) |
| (470,477) |
Total Income |
|
|
| 48,836,570 |
| 30,814,251 |
| 34,949,883 |
Administrative expenses |
|
|
| (14,920,410) |
| (14,515,132) |
| (13,941,816) |
Personnel expenses |
| 41 |
| (8,377,265) |
| (7,798,792) |
| (7,203,442) |
Other administrative expenses |
| 42 |
| (6,543,145) |
| (6,716,340) |
| (6,738,374) |
Depreciation and amortization |
|
|
| (1,482,639) |
| (1,490,017) |
| (1,362,129) |
Tangible assets |
| 13 |
| (1,154,588) |
| (1,029,706) |
| (872,749) |
Intangible assets |
| 15 |
| (328,051) |
| (460,311) |
| (489,380) |
Provisions (net) |
|
|
| (2,724,742) |
| (4,001,294) |
| (2,036,237) |
Impairment losses on financial assets (net) |
|
|
| (13,301,445) |
| (13,633,989) |
| (11,271,605) |
Loans and receivables |
| 6&10.c |
| (13,389,834) |
| (13,110,319) |
| (11,193,571) |
Other financial instruments not measured at fair value through profit or loss |
|
|
| 88,389 |
| (523,670) |
| (78,034) |
Impairment losses on other assets (net) |
|
|
| (114,321) |
| (1,220,645) |
| 3,751 |
Other intangible assets |
| 15 |
| (5,838) |
| (679,254) |
| (5,123) |
Other assets |
|
|
| (108,483) |
| (541,391) |
| 8,874 |
Gains (losses) on disposal of assets not classified as non-current assets held for sale |
| 43 |
| 3,816 |
| 780,615 |
| 86,846 |
Gains (losses) on non-current assets held for sale not classified as discontinued operations |
| 44 |
| 87,073 |
| 50,493 |
| 14,636 |
Operating Profit Before Tax |
|
|
| 16,383,902 |
| (3,215,718) |
| 6,443,329 |
Income taxes |
| 25 |
| (8,918,984) |
| 13,049,544 |
| (735,553) |
Consolidated Profit for the Year |
|
|
| 7,464,918 |
| 9,833,826 |
| 5,707,776 |
Profit attributable to the Parent |
|
|
| 7,334,563 |
| 9,783,740 |
| 5,630,023 |
Profit attributable to non-controlling interests |
| 28 |
| 130,355 |
| 50,086 |
| 77,753 |
Earnings Per Share (Brazilian Reais) |
| 30 |
|
|
|
|
|
|
Basic earnings per 1,000 shares (Brazilian Reais) |
|
|
|
|
|
|
|
|
Common shares |
|
|
| 929.93 |
| 1,236.96 |
| 709.69 |
Preferred shares |
|
|
| 1,022.92 |
| 1,360.66 |
| 780.66 |
Diluted earnings per 1,000 shares (Brazilian Reais) |
|
|
|
|
|
|
|
|
Common shares |
|
|
| 929.03 |
| 1,235.79 |
| 709.40 |
Preferred shares |
|
|
| 1,021.93 |
| 1,359.36 |
| 780.34 |
Net Profit attributable - Basic (Brazilian Reais) |
|
|
|
|
|
|
|
|
Common shares |
|
|
| 3,560,288 |
| 4,748,896 |
| 2,733,205 |
Preferred shares |
|
|
| 3,774,275 |
| 5,034,844 |
| 2,896,818 |
Net Profit attributable - Diluted (Brazilian Reais) |
|
|
|
|
|
|
|
|
Common shares |
|
|
| 3,560,222 |
| 4,748,810 |
| 2,733,184 |
Preferred shares |
|
|
| 3,774,341 |
| 5,034,930 |
| 2,896,839 |
Weighted average shares outstanding (in thousands) - Basic | ||||||||
Common shares |
|
|
| 3,828,555 |
| 3,839,159 |
| 3,851,278 |
Preferred shares |
|
|
| 3,689,696 |
| 3,700,299 |
| 3,710,746 |
Weighted average shares outstanding (in thousands) - Diluted |
|
|
|
|
|
|
|
|
Common shares |
|
|
| 3,832,211 |
| 3,842,744 |
| 3,852,823 |
Preferred shares |
|
|
| 3,693,352 |
| 3,703,884 |
| 3,712,291 |
The accompanying Notes are an integral part of these consolidated financial statements. | ||||||||
BANCO SANTANDER (BRASIL) S.A. |
CONSOLIDATED STATEMENT OF PROFIT OR LOSS AND OTHER COMPREHENSIVE INCOME |
(Thousands of Brazilian Reais - R$) |
2016 | 2015 | 2014 | ||||
Consolidated Profit for the Year |
| 7,464,918 |
| 9,833,826 |
| 5,707,776 |
|
|
|
|
|
| |
Other Comprehensive Income that will be reclassified subsequently to profit or loss when specific conditions are met: |
| 3,725,565 |
| (3,069,317) |
| 720,473 |
Available-for-sale financial assets |
| 3,311,607 |
| (2,718,709) |
| 545,239 |
Valuation adjustments - Gains / (Losses) |
| 5,458,735 |
| (4,155,414) |
| 841,725 |
Amounts transferred to income statement |
| 82,638 |
| 46,859 |
| (39,746) |
Income taxes |
| (2,229,766) |
| 1,389,846 |
| (256,740) |
Cash flow hedges |
| 413,958 |
| (350,608) |
| 175,234 |
Valuation adjustments |
| 761,423 |
| (842,073) |
| 278,645 |
Amounts transferred to income statement |
| 1,580 |
| 144,196 |
| 26,597 |
Income taxes |
| (349,045) |
| 347,269 |
| (130,008) |
Net investment hedge |
| 634,207 |
| (791,228) |
| (181) |
Net investment hedge |
| 1,209,338 |
| (1,460,720) |
| (301) |
Income taxes |
| (575,131) |
| 669,492 |
| 120 |
Exchange on investments Abroad |
| (634,207) |
| 791,228 |
| 181 |
Exchange on investments Abroad |
| (634,207) |
| 791,228 |
| 181 |
| ||||||
Other Comprehensive Income that will not be Reclassified to net Income: |
| (941,833) |
| 739,706 |
| (549,089) |
Defined benefits plan |
| (941,833) |
| 739,706 |
| (549,089) |
Defined benefits plan |
| (1,568,122) |
| 1,186,862 |
| (912,636) |
Income taxes |
| 626,289 |
| (447,156) |
| 363,547 |
Total Comprehensive Income |
| 10,248,650 |
| 7,504,215 |
| 5,879,160 |
|
|
|
|
|
| |
Attributable to the parent |
| 10,118,295 |
| 7,454,129 |
| 5,801,407 |
Attributable to non-controlling interests |
| 130,355 |
| 50,086 |
| 77,753 |
Total Comprehensive Income |
| 10,248,650 |
| 7,504,215 |
| 5,879,160 |
The accompanying Notes are an integral part of these consolidated financial statements. | ||||||
BANCO SANTANDER (BRASIL) S.A. |
CONSOLIDATED STATEMENT OF CHANGES IN EQUITY |
(Thousands of Brazilian Reais - R$) |
Stockholders´ Equity Attributable to the Parent | Non-controlling | Total | ||||||||||||||||||||||||||
Other Comprehensive Income | ||||||||||||||||||||||||||||
Note | Share | Reserves | Treasury | Option for Acquisition of Equity Instrument | Profit | Dividends and | Total | Available-for-sale Financial Assets | Defined Benefit Plans | Translation adjustments investment abroad | Gains and losses - Cash flow hedge and Investment | Total | ||||||||||||||||
Balances at December 31, 2013 |
| 62,634,585 |
| 17,673,134 |
| (291,707) |
| - |
| 5,723,494 |
| (2,400,000) |
| 83,339,506 |
| (471,947) |
| (1,332,261) |
| 702,168 |
| (871,265) |
| 81,366,201 |
| 289,101 |
| 81,655,302 |
|
|
|
|
|
|
|
|
|
|
|
|
|
|
|
|
|
|
|
|
|
|
|
|
|
|
|
|
|
Total comprehensive income |
| - |
| - |
| - |
| - |
| 5,630,023 |
| - |
| 5,630,023 |
| 545,239 |
| (549,089) |
| 181 |
| 175,053 |
| 5,801,407 |
| 77,753 |
| 5,879,160 |
Appropriation of net profit for the year |
| - |
| 5,723,494 |
| - |
| - |
| (5,723,494) |
| - |
| - |
| - |
| - |
| - |
| - |
| - |
| - |
| - |
Dividends and interest on capital | 29.b | - |
| (2,400,000) |
| - |
| - |
| - |
| 870,000 |
| (1,530,000) |
| - |
| - |
| - |
| - |
| (1,530,000) |
| - |
| (1,530,000) |
Share based payments | 41.b | - |
| (89,339) |
| - |
| - |
| - |
| - |
| (89,339) |
| - |
| - |
| - |
| - |
| (89,339) |
| - |
| (89,339) |
Treasury shares | 29.d | - |
| - |
| (153,748) |
| - |
| - |
| - |
| (153,748) |
| - |
| - |
| - |
| - |
| (153,748) |
| - |
| (153,748) |
Capital restructuring |
| (5,828,201) |
| (185,312) |
| (46) |
| - |
| - |
| - |
| (6,013,559) |
| - |
| - |
| - |
| - |
| (6,013,559) |
| - |
| (6,013,559) |
Results of treasury shares | 29.d | - |
| (4,926) |
| - |
| - |
| - |
| - |
| (4,926) |
| - |
| - |
| - |
| - |
| (4,926) |
| - |
| (4,926) |
Option for Acquisition of Equity Instrument |
| - |
| - |
| - |
| (950,000) |
| - |
| - |
| (950,000) |
| - |
| - |
| - |
| - |
| (950,000) |
| - |
| (950,000) |
Other |
| - |
| (122,916) |
| - |
| - |
| - |
| - |
| (122,916) |
| - |
| - |
| - |
| - |
| (122,916) |
| 13,319 |
| (109,597) |
Balances at December 31, 2014 |
| 56,806,384 |
| 20,594,135 |
| (445,501) |
| (950,000) |
| 5,630,023 |
| (1,530,000) |
| 80,105,041 |
| 73,292 |
| (1,881,350) |
| 702,349 |
| (696,212) |
| 78,303,120 |
| 380,173 |
| 78,683,293 |
Total comprehensive income |
| - |
| - |
| - |
| - |
| 9,783,740 |
| - |
| 9,783,740 |
| (2,718,709) |
| 739,706 |
| 791,228 |
| (1,141,836) |
| 7,454,129 |
| 50,086 |
| 7,504,215 |
Appropriation of net profit for the year |
| - |
| 5,630,023 |
| - |
| - |
| (5,630,023) |
| - |
| - |
| - |
| - |
| - |
| - |
| - |
| - |
| - |
Dividends and interest on capital | 29.b | - |
| (1,530,000) |
| - |
| - |
| - |
| (4,670,000) |
| (6,200,000) |
| - |
| - |
| - |
| - |
| (6,200,000) |
| - |
| (6,200,000) |
Share based payments | 41.b | - |
| 160,916 |
| - |
| - |
| - |
| - |
| 160,916 |
| - |
| - |
| - |
| - |
| 160,916 |
| - |
| 160,916 |
Treasury shares | 29.d | - |
| - |
| (246,975) |
| - |
| - |
| - |
| (246,975) |
| - |
| - |
| - |
| - |
| (246,975) |
| - |
| (246,975) |
Capital restructuring |
| - |
| - |
| (50) |
| - |
| - |
| - |
| (50) |
| - |
| - |
| - |
| - |
| (50) |
| - |
| (50) |
Treasury shares income | 29.d | - |
| (3,918) |
| - |
| - |
| - |
| - |
| (3,918) |
| - |
| - |
| - |
| - |
| (3,918) |
| - |
| (3,918) |
Option for Acquisition of Equity Instrument | 4.c | - |
| - |
| - |
| (67,000) |
| - |
| - |
| (67,000) |
| - |
| - |
| - |
| - |
| (67,000) |
| (240,000) |
| (307,000) |
Cancellation of Shares |
| - |
| (268,573) |
| 268,573 |
| - |
| - |
| - |
| - |
| - |
| - |
| - |
| - |
| - |
| - |
| - |
Other | 29.a | 193,616 |
| (193,616) |
| - |
| - |
| - |
| - |
| - |
| - |
| - |
| - |
| - |
| - |
| 244,803 |
| 244,803 |
Balances at December 31, 2015 |
| 57,000,000 |
| 24,388,967 |
| (423,953) |
| (1,017,000) |
| 9,783,740 |
| (6,200,000) |
| 83,531,754 |
| (2,645,417) |
| (1,141,644) |
| 1,493,577 |
| (1,838,048) |
| 79,400,222 |
| 435,062 |
| 79,835,284 |
|
|
|
|
|
|
|
|
|
|
|
|
|
|
|
|
|
|
|
|
|
|
|
|
|
|
|
|
|
Total comprehensive income |
| - |
| - |
| - |
| - |
| 7,334,563 |
| - |
| 7,334,563 |
| 3,311,607 |
| (941,833) |
| (634,207) |
| 1,048,165 |
| 10,118,295 |
| 130,355 |
| 10,248,650 |
Appropriation of net profit for the year |
| - |
| 9,783,740 |
| - |
| - |
| (9,783,740) |
| - |
| - |
| - |
| - |
| - |
| - |
| - |
| - |
| - |
Dividends and interest on capital | 29.b | - |
| (6,200,000) |
| - |
| - |
| - |
| 950,000 |
| (5,250,000) |
| - |
| - |
| - |
| - |
| (5,250,000) |
| - |
| (5,250,000) |
Share based payments |
| - |
| (35,463) |
| - |
| - |
| - |
| - |
| (35,463) |
| - |
| - |
| - |
| - |
| (35,463) |
| - |
| (35,463) |
Treasury shares | 29.d | - |
| - |
| (90,031) |
| - |
| - |
| - |
| (90,031) |
| - |
| - |
| - |
| - |
| (90,031) |
| - |
| (90,031) |
Capital restructuring |
| - |
| - |
| (50) |
| - |
| - |
| - |
| (50) |
| - |
| - |
| - |
| - |
| (50) |
| - |
| (50) |
Treasury shares income | 29.d | - |
| (11,574) |
| - |
| - |
| - |
| - |
| (11,574) |
| - |
| - |
| - |
| - |
| (11,574) |
| - |
| (11,574) |
Other | 29.a | - |
| (44,344) |
| - |
| - |
| - |
| - |
| (44,344) |
| - |
| - |
| - |
| - |
| (44,344) |
| 160,087 |
| 115,743 |
Balances at December 31, 2016 |
| 57,000,000 |
| 27,881,326 |
| (514,034) |
| (1,017,000) |
| 7,334,563 |
| (5,250,000) |
| 85,434,855 |
| 666,190 |
| (2,083,477) |
| 859,370 |
| (789,883) |
| 84,087,055 |
| 725,504 |
| 84,812,559 |
|
|
|
|
|
|
|
|
|
|
|
|
|
|
|
|
|
|
|
|
|
|
|
|
|
|
|
|
|
The accompanying Notes are an integral part of these consolidated financial statements. | ||||||||||||||||||||||||||||
BANCO SANTANDER (BRASIL) S.A. |
CONSOLIDATED STATEMENT OF CASH FLOWS |
(Thousands of Brazilian Reais - R$) |
Note | 2016 | 2015 | 2014 | |||||
1. Cash Flows From Operating Activities | ||||||||
Consolidated profit for the year |
|
|
| 7,464,918 |
| 9,833,826 |
| 5,707,776 |
Adjustments to profit |
|
|
| 24,068,364 |
| (1,555,376) |
| 11,036,674 |
Depreciation of tangible assets |
| 13 |
| 1,154,588 |
| 1,029,706 |
| 872,749 |
Amortization of intangible assets |
| 15 |
| 328,051 |
| 460,311 |
| 489,380 |
Impairment losses on other assets (net) |
|
|
| 114,321 |
| 1,220,645 |
| (3,751) |
Provisions and Impairment losses on financial assets (net) |
|
|
| 16,026,187 |
| 17,635,283 |
| 13,307,842 |
Net Gains (losses) on disposal of tangible assets, investments and non-current assets held for sale |
|
|
| (90,889) |
| (831,108) |
| (101,482) |
Share of results of entities accounted for using the equity method |
| 12 |
| (47,537) |
| (116,312) |
| (91,096) |
Changes in deferred tax assets and liabilities |
| 25.d |
| 5,343,885 |
| (9,417,913) |
| (2,055,872) |
Monetary Adjustment of Escrow Deposits |
|
|
| (749,040) |
| (650,314) |
| (433,296) |
Recoverable Taxes |
|
|
| (215,228) |
| (985,776) |
| (332,265) |
Effects of Changes in Foreign Exchange Rates on Cash and Cash Equivalents |
|
|
| 2,289,849 |
| (2,106,652) |
| (521,270) |
Others(1) |
|
|
| (85,823) |
| (7,793,246) |
| (94,265) |
Net (increase) decrease in operating assets |
|
|
| (56,779,768) |
| (79,770,025) |
| (89,899,611) |
Balance with the Brazilian Central Bank |
|
|
| (24,156,755) |
| (35,884,381) |
| 2,063,056 |
Financial assets held for trading |
|
|
| (34,320,260) |
| 5,476,872 |
| (25,794,816) |
Other financial assets at fair value through profit or loss |
|
|
| 457,419 |
| (1,607,210) |
| 223,568 |
Available-for-sale financial assets |
|
|
| 10,127,344 |
| (16,354,040) |
| (29,116,008) |
Loans and receivables |
|
|
| (10,121,085) |
| (30,420,173) |
| (38,070,720) |
Held to maturity investments |
|
|
| 49,075 |
| 318,169 |
| - |
Other assets |
|
|
| 1,184,494 |
| (1,299,262) |
| 795,309 |
Net increase (decrease) in operating liabilities |
|
|
| 36,235,208 |
| 76,687,887 |
| 69,113,699 |
Financial liabilities held for trading |
|
|
| 9,232,101 |
| 22,817,977 |
| 6,010,910 |
Financial liabilities at amortized cost |
|
|
| 25,685,022 |
| 53,503,471 |
| 61,706,449 |
Other liabilities |
|
|
| 1,318,085 |
| 366,439 |
| 1,396,340 |
Paid taxes |
| 25.a |
| (4,240,115) |
| (1,170,020) |
| (573,684) |
Total net cash flows from operating activities (1) |
|
|
| 6,748,607 |
| 4,026,292 |
| (4,615,146) |
|
|
|
|
|
|
|
|
|
2. Cash Flows From Investing Activities |
|
|
|
|
|
|
|
|
Investments |
|
|
| (1,945,372) |
| (2,136,002) |
| (3,503,603) |
Increase / Acquisition of Investments in subsidiaries |
|
|
| (3,105) |
| - |
| (1,085,470) |
Tangible assets |
|
|
| (873,140) |
| (1,070,288) |
| (1,838,284) |
Intangible assets |
|
|
| (670,576) |
| (710,176) |
| (579,849) |
Acquisition of subsidiary, less net cash in the acquisition |
|
|
| (392,998) |
| - |
| - |
Non - current assets held for sale |
| 11 |
| (10,462) |
| (355,538) |
| - |
Change in the scope of consolidation |
| 4 |
| 4,909 |
| - |
| - |
Disposal |
|
|
| 677,088 |
| 1,375,167 |
| 347,048 |
Net cash received from disposal of subsidiaries |
|
|
| - |
| 857,830 |
| - |
Capital reduction of investee in joint control |
| 12.b |
| 76,860 |
| - |
| - |
Subsidiaries, jointly controlled entities and associates |
| 3 |
| - |
| - |
| 55,493 |
Tangible assets |
| 13&43 |
| 42,226 |
| 55,220 |
| 216,750 |
Non - current assets held for sale |
| 11&43 |
| 208,232 |
| 317,321 |
| - |
Acquisition of subsidiary, less net cash in the acquisition |
|
|
| - |
| 59 |
| - |
Dividends and interest on capital received |
|
|
| 349,770 |
| 144,737 |
| 74,805 |
Total net cash flows from investing activities (2) |
|
|
| (1,268,284) |
| (760,835) |
| (3,156,555) |
|
|
|
|
|
|
|
|
|
3. Cash Flows From Financing Activities |
|
|
|
|
|
|
|
|
Capital Reduction |
| 29.e |
| - |
| - |
| (6,000,000) |
Issuance of Debt Instruments Eligible to Compose Capital |
| 21 |
| - |
| - |
| 6,000,000 |
Payment of Debt Instruments Eligible to Compose Capital |
| 21 |
| (701,671) |
| (609,035) |
| (291,241) |
Own shares Acquisition |
| 29 |
| (90,031) |
| (247,025) |
| (167,307) |
Issuance of other long-term financial liabilities |
| 19 |
| 50,313,469 |
| 72,936,057 |
| 53,187,121 |
Dividends paid and interest on capital |
|
|
| (3,210,762) |
| (3,992,956) |
| (2,196,101) |
Payments of subordinated liabilities |
| 20 |
| (8,362,652) |
| (216,075) |
| (2,495,283) |
Payments of other long-term financial liabilities |
| 19 |
| (56,164,769) |
| (63,516,234) |
| (55,388,115) |
Increase/ Decrease in non-controlling interests |
|
|
| 23,909 |
| 4,803 |
| 13,319 |
Total net cash flows from financing activities (3) |
|
|
| (18,192,507) |
| 4,359,535 |
| (7,337,607) |
Exchange variation on Cash and Cash Equivalents (4) |
|
|
| (2,289,849) |
| 2,106,652 |
| 521,270 |
Net Increase in Cash (1+2+3+4) |
|
|
| (15,002,033) |
| 9,731,644 |
| (14,588,038) |
Cash and cash equivalents at beginning of year |
|
|
| 33,131,614 |
| 23,399,970 |
| 37,988,008 |
Cash and cash equivalents at end of year |
|
|
| 18,129,581 |
| 33,131,614 |
| 23,399,970 |
|
|
|
|
|
|
|
|
|
Cash and cash equivalents components |
|
|
|
|
|
|
|
|
Cash |
| 5 |
| 4,445,940 |
| 7,141,137 |
| 9,786,013 |
Loans and other |
| 6 |
| 13,683,641 |
| 25,990,477 |
| 13,613,957 |
Total of cash and cash equivalents |
|
|
| 18,129,581 |
| 33,131,614 |
| 23,399,970 |
|
|
|
|
|
|
|
|
|
Non-cash transactions |
|
|
|
|
|
|
|
|
Foreclosures loans and other assets transferred to non-current assets held for sale | 11 |
| 834,903 |
| 293,440 |
| 337,840 | |
Dividends and interest on capital declared but not paid |
| 29.b |
| 4,750,000 |
| 3,000,000 |
| 690,000 |
Supplemental information |
|
|
|
|
|
|
|
|
Interest received |
|
|
| 75,818,511 |
| 70,566,274 |
| 58,461,650 |
Interest paid |
|
|
| 46,051,070 |
| 37,912,698 |
| 31,004,745 |
(1) In 2015 includes mainly the effect noted in footnote 25.a. | ||||||||
The accompanying Notes are an integral part of these consolidated financial statements. | ||||||||
BANCO SANTANDER (BRASIL) S.A. |
NOTES TO THE CONSOLIDATED FINANCIAL STATEMENTS |
(Amounts in thousands of Brazilian Reais - R$, unless otherwise stated) |
1. Introduction, basis of presentation of the consolidated financial statements and other information | |||||||||||||||||
a) Introduction | |||||||||||||||||
Banco Santander (Brasil) S.A. (Banco Santander or Bank), directly and indirectly controlled by Banco Santander, S.A., based in Spain (Banco Santander Spain), is the lead institution of the Financial and Prudential Group (Conglomerate Santander) towards the Central Bank of Brazil (Bacen), established as a corporation, with headquarters at Avenida Presidente Juscelino Kubitschek, 2041 and 2235 - A Block - Vila Olímpia - São Paulo - SP. Banco Santander operates as a multiple service bank, conducting its operations by means of portfolios such as commercial, investment, lending and financing, mortgage lending, leasing, credit card operations and foreign exchange. Through its subsidiaries, the Bank also operates in the payment institution, leasing, buying club management and securities, insurance brokerage operations, capitalization and pension plan. The Bank's activities are conducted within the context of a group of institutions that operate on an integrated basis in the financial market. The corresponding benefits and costs of providing services are absorbed between them, they are conducted in the normal course of business and under commutative conditions. | |||||||||||||||||
The consolidated financial statements for the year ended on December 31, 2016, 2015 and 2014 were authorized for issue by the Board of directors at the meeting held on February 24, 2017. | |||||||||||||||||
b) Basis of presentation of the consolidated financial statements | |||||||||||||||||
These consolidated financial statements were prepared in accordance with International Financial Reporting Standards (IFRS) issued by the International Accounting Standards Board (IASB), and the interpretations issued by the IFRS Interpretations Committee (Current name of IFRIC). All the relevant information specific to Banco Santander's financial statements, and only these, are being evidenced, and correspond to those used by Banco Santander in its management. | |||||||||||||||||
Adoption of new standards and interpretations | |||||||||||||||||
The Bank has adopted all standards and interpretations that became effective up to January 1, 2016. The following standards and interpretations are applicable to the Bank and had no effect on the financial statements: | |||||||||||||||||
• Amendment IFRS 11 - Business Jointly - The amendment establishes accounting methods for the acquisition of joint ventures and joint operations which constitute an business, as established methodology in the IFRS 3 - Business Combinations.Effective for years beginning on January 1, 2016. | |||||||||||||||||
• Amendment to IAS 1 - Presentation of Financial Statements - The amendments are related to materiality concepts, order of notes, subtotals, accounting policies and breakdown.Effective for years beginning on January 1, 2016. | |||||||||||||||||
• Amendments to IFRS 10 - Consolidated Financial Statements and IAS 28 - Sale or Contribution of Assets between an Investor and its Associate or Joint Venture - These amendments establish that a gain or loss must be recognized for the full amount when the transaction involves assets that constitute a business (whether the business is housed in a subsidiary or not). When the transaction involves assets that do not constitute a business, a partial gain or loss is recognized, even if these assets are housed in a subsidiary. Effective for years beginning on January 1, 2016. | |||||||||||||||||
• Amendment to IAS 16 - Tangible assets and IAS 38 - Intangible Assets - The amendment clarifies the principle basis for depreciation and amortization as the expected pattern of consumption of future economic benefits of the asset. Effective for years beginning on January 1, 2016. | |||||||||||||||||
• Annual Improvements of IFRS | |||||||||||||||||
Improvements to IFRSs, 2012-2014 cycle (obligatory for reporting annual periods, that beginning on 1 January 2016) - These improvements introduce minor amendments to IFRS 5 - Non-current Assets Held for Sale and Discontinued Operations, IFRS 7 - Financial Instruments, IAS 19 - Employee Benefits and IAS 34 - Interim Financial Reporting. | |||||||||||||||||
The amendments to IFRS 5 - Non-current Assets Held for Sale and Discontinued Operations - Address the circumstances in which an entity reclassifies an asset (or disposal group) from held for sale to held for distribution (or vice versa).The amendments clarify that this change must be considered as a continuation of the original disposal plan and therefore the requirements of IFRS 5 relating to alteration of the sales plan are not applicable. The amendments also clarify the guidance regarding discontinuation of accounting "held for distribution". | |||||||||||||||||
The amendments to IFRS 7 - Financial Instruments, provide clarification on whether servicing agreements constitute continuing involvement for the purpose of the transfer disclosures. | |||||||||||||||||
The amendments to IAS 19 - Employee Benefits, clarify that the rate used to discount post-retirement benefit obligations must be determined based on market yields at the end of the reporting period with respect to corporate bonds of high quality. The evaluation of the depth of a market for corporate bonds of high quality must be the level of the currency (i.e., the same currency in which the benefits will be paid). For currencies for which there are no high liquidity for these corporate bonds of high quality market, must be based on the market yields on government securities denominated in that currency at the end of the reporting period. | |||||||||||||||||
The amendments to IAS 34 - Interim Financial Reporting, were made to clarify the meaning of disclosure of information "elsewhere in the interim financial report" and to require the inclusion of a cross-reference from the interim financial statements to the location of this information. | |||||||||||||||||
Changes arising from IFRS Update cycles, did not produce a material impact on the financial statements of the Bank. | |||||||||||||||||
Standards and Interpretations that became effective after December 31, 2016 | |||||||||||||||||
Lastly, at the date of preparation of these consolidated financial statements, the following standards and interpretations which effectively come into force after December 31, 2016 had not yet been adopted by the Bank: | |||||||||||||||||
• IFRS 9, Financial Instruments (mandatory for annual reporting periods beginning on or after 1st January 2018) issued in July 2014, the International Accounting Standards Board (IASB) approved the IFRS 9, to replace IAS39 – Financial instruments: establishing the requirements for the recognition and measurement of financial instruments to be applied as from January 2018. | |||||||||||||||||
1. Model proposed by IFRS 9 | |||||||||||||||||
The main new developments of the standard are as follows: | |||||||||||||||||
1.a) Classification of financial instruments | |||||||||||||||||
The criterion for classifying financial assets will depend both on their business management model and the features of the contractual flows. Consequently, the asset will be measured at amortized cost, at fair value with changes in equity, or at fair value with changes in profit/loss for the period. IFRS 9 also establishes the option of designating an instrument at fair value with changes in P/L under certain conditions. | |||||||||||||||||
The main activity of Banco Santander is the concession of retail banking operations and does not concentrate its exposure on complex financial products and the Bank is currently implementing an analysis of its portfolios in order to identify and classify the financial instruments into their corresponding portfolio under IFRS 9 and identify existing business models. | |||||||||||||||||
Based on current analysis, the Bank has not significant differences with respect to the composition of the portfolios until 2018 are expected, it is considered that there will be no significant changes with respect to the classification that was being carried out under pre-existing regulation: | |||||||||||||||||
• Financial assets classified as Loans and Advances and Held-to-Maturity under IAS 39 will generally be classified into amortized cost. | |||||||||||||||||
• Available for sale debt instruments will generally continue to be classified into fair value with changes in other comprehensive income, unless cash flows features imply its classification into other portfolio. | |||||||||||||||||
• Available for sale equity instruments will be classified into fair value, and depending on the nature of the investment, their variations will be recorded in the income statement or in other comprehensive income (irrevocably). | |||||||||||||||||
• Financial instruments currently classified into fair value through profit or loss will generally continue to be classified into this category, not expecting reclassifications. | |||||||||||||||||
1.b) Credit risk impairment model | |||||||||||||||||
The most important new development compared with the current model is that the new accounting standard introduces the concept of expected loss, whereas the current model (IAS 39) is based on incurred loss. | |||||||||||||||||
Scope of application | |||||||||||||||||
The IFRS 9 asset impairment model is applicable to financial assets classified in categories at amortized cost, to debt instruments valued at fair value through other comprehensive income, to leasing receivables, and to contingent risks and commitments not valued at fair value e availability of credit lines. | |||||||||||||||||
Classification of financial instruments by phases | |||||||||||||||||
The financial instruments portfolio for impairment purposes will be divided into three categories, depending on the phase each instrument has with regard to its credit risk: | |||||||||||||||||
- Stage 1: a financial instrument is in phase 1 when there has been no significant increase in its risk since it was initially registered. If applicable, the valuation correction for losses will amount to the possible credit expected losses arising from possible defaults with ta period of 12 months following the reporting date. | |||||||||||||||||
- Stage 2: if there has been a significant increase in risk since the date in which the instrument was initially registered, but the impairment has not actually materialized, then the financial instrument will be included in this stage. In this case, the amount of the valuation correction for losses will be the expected losses owing to defaults throughout the residual life of the financial instrument. In order to assess the significant increase in credit risk, both quantitative indicators used in the ordinary credit risk management and other qualitative variables such as the forbearance flag for not impaired exposures or the facilities are included in a special debt sustainability agreement shall be taken into account. | |||||||||||||||||
- Stage 3: a financial instrument will be included in this phase when it is considered to be effectively impaired. In this case, the amount of the valuation correction for losses will be the expected credit risk losses throughout the residual life of the financial instrument. | |||||||||||||||||
Impairment estimation methodology | |||||||||||||||||
Expected loss is measured using the following factors: | |||||||||||||||||
- Exposure at Default (EAD): is the amount of the transaction exposed to credit risk including the ratio of current undrawn exposure that could be drawn at default. Developed models incorporate hypotheses considering possible modifications in the payment schedule. | |||||||||||||||||
- Probability of Default (PD): is the likelihood that a counterparty will fail to meet its obligation to pay principal or interest. For the purposes of IFRS 9, this will consider both PD-12 months, which is the probability of the financial instrument entering default within the next 12 months, and also lifetime PD, which is the probability of the transaction entering into default between the reporting date and the transaction’s residual maturity date. Future information of relevance is considered to be needed to estimate these parameters, according to the standard. | |||||||||||||||||
- Loss Given Default (LGD): is the loss produced in the event of default. In other words, this reflects the percentage of exposure that could not be recovered in the event of a default. It depends mainly on the ability to demand additional collateral, which is considered as credit risk mitigants associated with each financial asset, and the future cash flows that are expected to be recovered. According to the standard, forward-looking information must be taken into account in the estimation. | |||||||||||||||||
- Discount rate: the rate applied to the future cash flows estimated during the expected life of the asset, and which is equal to the net present value of the financial instrument at its carrying value. When calculating the discount rate, expected losses for default when estimating future cash flows are not generally taken into account, except in cases in which the asset is considered to be impaired, in which case the interest rate applied will take into account such losses, and it will be known as the effective interest rate adjusted for credit risk. | |||||||||||||||||
In order to estimate the above parameters, the Bank has applied on its experience in developing internal models for the estimation of parameters both for regulatory and management purposes. | |||||||||||||||||
Use of present, past and future information | |||||||||||||||||
Apart from using present and past information, the Bank currently uses forward-looking information in internal management and regulatory processes, considering several scenarios. In this sense, the Bank will re-use its experience in the management of such information and maintain consistency with the information used in the other processes. | |||||||||||||||||
1.c) Accounting of hedges | |||||||||||||||||
IFRS 9 includes new hedge accounting requirements which have a twofold objective: to simplify current requirements, and to bring hedge accounting in line with risk management, so allowing there to be a greater variety of derivative financial instruments which may be considered to be hedging instruments. | |||||||||||||||||
However, the Bank (at the moment) decided to keep its Hedge Accounting hedges in line with the accounting guidelines established in IAS 39, having seen the pronouncement provided by the Board of the IASB. | |||||||||||||||||
Once the analysis of the advantages and disadvantages of the proposal is completed, the Bank shall make its decision for hedge accounting under IFRS 9. | |||||||||||||||||
2. IFRS 9 implementation strategy | |||||||||||||||||
The Santander Spain Group together with its subsidiaries has established a global work stream with the aim of adapting its processes to the new classification standards for financial instruments, accounting of hedges and estimating credit risk impairment, so that such processes are applicable in a uniform way for all Bank units, and, at the same time, can be adapted to each unit’s individual features. | |||||||||||||||||
Accordingly, the Bank is working towards defining an objective internal model and analyzing all the changes which are needed to adapt accounting classifications and credit risk impairment estimation models in force in each unit to the previous definitions. | |||||||||||||||||
In principle, the governance structure currently implemented at both corporate level and in each one of the units, complies with the requirements set out in the new standards. | |||||||||||||||||
The project’s main phases and milestones | |||||||||||||||||
During this exercise, the Bank has successfully completed the design and development phase of the implementation plan. The major milestones achieved include the definition of functional requirements as well as the design of an operational model adapted to the requirements of IFRS 9. At the IT environment, the technological needs have been identified as well as the necessary adaptations to the existing control environment. | |||||||||||||||||
The Bank is currently in the implementation phase of the models and requirements defined. The objective of the Bank at this stage is to ensure an efficient implementation, optimizing its resources as well as the designs elaborated in previous stages. | |||||||||||||||||
Once the implementation phase is completed, the Bank will test the effective performance of the model through several simulations and ensuring that the transition to the new operating model meets the objectives established in the previous phases. This last stage includes the parallel execution of the provisions calculation. | |||||||||||||||||
• IFRS 15 - Revenue from Customers Contracts : The standard was issued in May 2014 and applies to an annual reporting period beginning on January 1, 2018. The standard specifies how and when an entity will recognize revenue as well as requiring such entities to provide users of financial statements with more informative, relevant disclosures. The standard provides five basic principles to be applied to all contracts with customers, which are: i) identify the contract with the customer; ii) identify the implementing obligations under the contract; iii) determine the transaction price; iv) allocate the transaction price to performance obligations; and v) recognize revenue at the moment (or the extent to which) the entity carrying out an obligation of execution. | |||||||||||||||||
• IFRS 16 - Leases Contracts - The standard was issued in January 2016 and the effective date after January 1st, 2019. This standard contains a new approach to lease accounting that requires a lessee to recognize assets and liabilities for the rights and obligations created by leases. | |||||||||||||||||
• Amendment to IFRS 2 - Share-based payment – The standard was issued in June 2016, and the effective date after January,1st 2017. This standard is intended to clarify the accounting for a share-based payment according to officials in situations in which the financial settlement award is canceled and replaced by a new award that its market value is higher than the original. | |||||||||||||||||
The potential impacts of changes in force from 2017 are under review by the Bank, which should be completed by the entry into force of the standard. | |||||||||||||||||
c) Used estimates | |||||||||||||||||
The consolidated results and the determination of consolidated equity are influenced by the accounting policies, assumptions, estimates and measurement bases used by the management of the Bank in preparing the consolidated financial statements. The Bank makes estimates and assumptions that affect the reported amounts of assets and liabilities of future periods. All estimates and assumptions required, in conformity with IFRS, are best estimates undertaken in accordance with the applicable standard. | |||||||||||||||||
In the consolidated financial statements estimates were made by the management of the Bank and of the consolidated entities in order to quantify certain assets, liabilities, revenues, expenses, and disclosure notes. | |||||||||||||||||
c.1) Critical estimates | |||||||||||||||||
The estimates and critical assumptions that have the most significant impact on the carrying amounts of certain assets, liabilities, revenues and expenses and the disclosure of explanatory notes, are described below: | |||||||||||||||||
i. Allowance for loan losses | |||||||||||||||||
The carrying amount of impaired financial assets is adjusted by recording a provision for losses on debts of "Impairment Losses on Financial Assets (Net) - Loans and Receivables" in the consolidated income statement. The reversal of previously recorded losses is recognized in the consolidated income statement in the period in which the impairment decrease and it can be related objectively to an event of recovery. | |||||||||||||||||
To determine the balance of “Provision for Impairment Losses”, Banco Santander first assesses whether there is objective evidence of impairment loss individually for financial assets that are significant, and individually or collectively for financial assets that are not significant. | |||||||||||||||||
To measure the impairment loss on loans individually evaluated for impairment, the Bank considers the conditions of the borrower, such as their economic and financial situation, level of indebtedness, ability to generate income, cash flow, management, corporate governance and quality of internal controls, payment history, industry expertise, contingencies and credit limits, as well as characteristics of assets, such as its nature and purpose, type, sufficiency and liquidity level guarantees and total amount of credit, as well as based on historical experience of impairment and other circumstances known at the moment of evaluation. | |||||||||||||||||
To measure the impairment loss on loans collectively evaluated for impairment, the Bank segregates financial assets into groups considering the characteristics and similarity of credit risk, in other words, according to segment, the type of assets, guarantees and other factors associated as the historical experience of impairment and other circumstances known at the time of assessment. | |||||||||||||||||
For further details see Note 2.i. | |||||||||||||||||
ii. Income Tax (IRPJ) and Social Contribution on Net Income (CSLL) | |||||||||||||||||
The current income tax expense is calculated by sum of the current tax, social contribution, pis and cofins resulting from application of the appropriate tax rate to the taxable profit for the year (net of any deductions allowable for tax purposes), and of the changes in deferred tax assets and liabilities recognized in the consolidated income statement. | |||||||||||||||||
Deferred tax assets and liabilities include temporary differences, which are identified as the amounts expected to be payable or recoverable on differences between the carrying amounts of assets and liabilities and their related tax bases, and tax loss and tax credit carry forwards. These amounts are measured at the tax rates that are expected to apply in the period when the asset is realized or the liability is settled. Deferred tax assets are only recognized for temporary differences to the extent that it is considered probable that the consolidated entities will have sufficient future taxable profits against which the deferred tax assets can be utilized, and the deferred tax assets do not arise from the initial recognition (except in a business combination) of other assets and liabilities in a transaction that affects neither taxable profit or accounting profit. Other deferred tax assets (tax loss and tax credit carry forwards) are only recognized if it is considered probable that the consolidated entities will have sufficient future taxable profits against which they can be utilized. | |||||||||||||||||
The deferred tax assets and liabilities recognized are reassessed at each balance sheets date in order to ascertain whether they still exist, and the appropriate adjustments are made on the basis of the findings of the analyses performed. Under the current regulation, the expected realization of tax credits based on the Bank's projections of future results and based on technical study. | |||||||||||||||||
For more details see note 2.aa | |||||||||||||||||
iii. Fair value measurement of certain financial instruments | |||||||||||||||||
Financial instruments are initially recognized at fair value, which is considered equivalent to the transaction price, until proven otherwise, and those that are not measured at fair value through profit are adjusted by the transaction costs. | |||||||||||||||||
Financial assets and liabilities are subsequently measured at each period-end by using valuation techniques. This calculation is based on assumptions, which take into account management's judgment based on existing information and market conditions at the date of financial statements. | |||||||||||||||||
Banco Santander classifies fair value measurements using a fair value hierarchy that reflects the model used in the measurement process, segregating financial instruments between Level I, II or III. | |||||||||||||||||
Notes 2.e & 48.c8 present the sensitivity analysis and accounting policies for Financial Instruments, respectively. | |||||||||||||||||
iv. Post-employment benefits | |||||||||||||||||
The defined benefit plans are recorded based on an actuarial study, conducted annually by specialized company, at the end of each year to be effective for the subsequent period and are recognized in income in "Interest expense and similar Charges" and "Provisions (net)". | |||||||||||||||||
The present value of the defined benefit obligation is the present value without any assets deductions of expected future payments required to settle the obligation resulting from employee service in the current and past periods. | |||||||||||||||||
Notes 2 & 23.iii present the sensitivity analysis and accounting policies for Post-employment benefits, respectively. | |||||||||||||||||
v. Provisions, contingent assets and liabilities | |||||||||||||||||
Provisions for the judicial and administrative proceedings are recorded when the risk of loss of administrative or judicial proceeding is considered probable and the amounts can be reliably measured, based on the nature, complexity and history of lawsuits and the opinion of legal counsel internal and external. | |||||||||||||||||
Provisions are made when the risk of loss of judicial or administrative proceedings is assessed as probable and the amounts involved can be measured with sufficient accuracy, based on best available information. They are fully or partially reversed when the obligations cease to exist or are reduced. Given the uncertainties arising from the proceedings, it is not practicable to determine the timing of any outflow (cash disbursement). | |||||||||||||||||
For more details see note 2.r | |||||||||||||||||
vi. Goodwill | |||||||||||||||||
The goodwill recorded is subject to impairment test at least annually or in a short period, if any indication of impairment of assets. | |||||||||||||||||
The recoverable goodwill amounts are determined from value in use calculations. For this purpose, we estimate cash flow for a period of 5 years. We prepare cash flows considering several factors, including: (i) macro-economic projections, such as interest rates, inflation and exchange rates, among other, (ii) the performance and growth estimates of the Brazilian financial system, (iii) increased costs, returns, synergies and investment plans, (iv) the behavior of customers, and (v) the growth rate and long-term adjustments to cash flows. These estimates rely on assumptions regarding the likelihood of future events, and changing certain factors could result in different outcomes. The estimate of cash flows is based on valuations prepared by independent research company or whenever there is evidence of reduction to its recoverable amount, which is reviewed annually or whenever there is an evidence of reduction on its recoverable value and approved by the Executive Board. | |||||||||||||||||
For additional details see note 14. | |||||||||||||||||
d) Capital management | |||||||||||||||||
Capital management considers the regulatory and economic levels. The objective is to achieve an efficient capital structure in terms of cost and compliance, meeting the requirements of the regulatory body and contributing to achieving the goals of the classification of rating agencies and investors' expectations. The capital management includes securitization, sale of assets, raising capital through issue of shares, subordinated liabilities and hybrid instruments. | |||||||||||||||||
From an economic standpoint, capital management seeks to optimize value creation at the Bank and at its different business segment. To this end, the economic capital, RORAC (return on risk-adjusted capital) and value creation data for each business segment are generated, analyzed and reported to the management committee on a quarterly basis. Within the framework of the internal capital adequacy assessment process (Pillar 2 of the Basel Capital Accord), the Group uses an economic capital measurement model with the objective of ensuring that there is sufficient capital available to support all the risks of its activity in different economic scenarios, with the solvency levels agreed upon by the Bank. | |||||||||||||||||
In order to adequately manage the Bank’s capital, it is essential to estimate and analyze future needs, in anticipation of the various phases of the business cycle. Projections of regulatory and economic capital are made based in financial projections (balance sheets, income statement, etc.) and on macroeconomic scenarios estimated by the Economic Research Service. These estimates are used by the Bank as a reference to plan the management actions (issues, securitizations, etc.) required to achieve its capital targets. | |||||||||||||||||
2. Accounting policies and method of measurement | |||||||||||||||||
The accounting policies and method of measurement applied in preparing the consolidated financial statements were as follows: | |||||||||||||||||
a) Foreign currency transactions | |||||||||||||||||
The consolidated financial statements of Banco Santander are presented in Brazilian Reais, the functional and reporting currency of these financial statements. | |||||||||||||||||
For each subsidiary, entity under joint control and investment in an unconsolidated company, Banco Santander has defined the functional currency. The assets and liabilities of these entities with functional currency other than the Brazilian Real are translated as follows: | |||||||||||||||||
| - Assets and liabilities are translated at the exchange rate at the balance sheets date. | |||||||||||||||||
| - Revenues and expenses are translated at the monthly average exchange rates. | |||||||||||||||||
| - Gain and losses on translation of net investment are recorded in the statement of comprehensive income, in “exchange rate of investees located abroad”. | |||||||||||||||||
b) Basis of consolidation | |||||||||||||||||
i. Subsidiaries | |||||||||||||||||
“Subsidiaries” are defined as entities over which the Bank has control. Control is based on whether the Bank has: i) power over the investee; ii) exposure, or rights, to variable returns from its involvement with the investee; and iii) the ability to use its power over the investee to affect the amount of the returns, as set forth in the law, the Bylaws or agreement. | |||||||||||||||||
Consolidation of a subsidiary begins when the Bank obtains control over the subsidiary and ceases when the Bank loses control of the subsidiary. Specifically, income and expense of a subsidiary acquired or disposed during the year are included in the consolidated income statement and other comprehensive income from the date the Bank gains controls until the date when the Bank ceases to control the subsidiary. | |||||||||||||||||
Profit or loss and each component of Other Comprehensive Income are attributed to the owners of the Bank and to the non-controlling interests even if the effect is attributed to non-controlling interests. Total comprehensive income of subsidiaries is attributed to the owners of the Bank and to the non-controlling interest even if this generates a negative balance for non-controlling interests. All transactions, balances, income and expenses between the companies of the Santander Group are eliminated in the consolidated financial statements. | |||||||||||||||||
Changes in the Bank’s interest in a subsidiary that do not result in loss of control are accounted for as equity transactions. Any difference between the amount by which the non-controlling interests are adjusted and the fair value of the consideration paid or received is recognized directly in equity and attributed to owners of the Company. | |||||||||||||||||
When the Bank loses control of a subsidiary, the profit or loss on disposal is calculated as the difference between (i) the aggregate of the fair value of the consideration received and the fair value of any retained interest and (ii) the previous carrying amount of the assets (including goodwill), and liabilities of the subsidiary and any non-controlling interests. Amounts previously recognized in other comprehensive income in relation to the subsidiary are accounted for (i.e. reclassified to profit or loss or transferred directly to retained earnings) in the same manner as would be required if the relevant assets or liabilities are disposed of. The fair value of any investment retained in the former subsidiary at the date when control is lost is regarded as the fair value on initial recognition for subsequent accounting under IAS 39 Financial Instruments: Recognition and Measurement or, when applicable, the costs on initial recognition of an investment in an associate or jointly controlled entity. | |||||||||||||||||
ii. Interests in joint ventures (jointly controlled entities) and associates | |||||||||||||||||
Joint ventures mean interests in entities that are not subsidiaries but which are jointly controlled by two or more unrelated entities. This is evidenced by contractual arrangements whereby two or more entities (“ventures”) acquire interests in entities (jointly controlled entities) or carry out transactions or hold assets so that strategic financial and operating decisions affecting the joint venture require the unanimous consent of the ventures. | |||||||||||||||||
Associates are entities over which the Bank is in a position to exercise significant influence (significant influence is the power to participate in the financial and operating policy decisions of the investee) but it does not control or has joint control over those policies. | |||||||||||||||||
In the consolidated financial statements, interest in joint ventures and investments in associates are accounted for using the equity method, i.e. at the Bank’s share of net assets of the investee, after taking into account the dividends received from capital reductions and other related transactions. In the case of transactions with an associate, the related profits or losses are eliminated to the extent of the Bank’s investment in the associate. Relevant information regarding companies accounted for under the equity method by the Bank is provided in note 12. | |||||||||||||||||
iii. Business combinations, acquisitions and disposals | |||||||||||||||||
A business combination is the combination of two or more separate entities or economic units into one single entity or group of entities and is accounted for in accordance with IFRS 3 - “Business Combinations”. | |||||||||||||||||
Business combinations are carried out so that the Bank obtains control over an entity and are recognized for accounting purposes as follows: | |||||||||||||||||
| • The Bank measures the cost of the business combination, defined as the fair value of the assets offered, the liabilities incurred and the equity instruments issued, if any. | |||||||||||||||||
| • The fair values of the assets, liabilities and contingent liabilities of the acquired entity or business, including any intangible assets which might not have been recognized by the acquiree, are estimated at the acquisition date and recognized in the consolidated balance sheets. | |||||||||||||||||
| • The excess of the acquisition cost over the fair values of the identifiable net assets acquired are recognized as goodwill (note 14). The excess of fair values of the identifiable net assets over the acquisition cost is bargain purchase gain and is recorded as income on the date of acquisition. | |||||||||||||||||
Also, note 4 below includes a description of the most significant transaction carried out in 2016, 2015 and 2014. | |||||||||||||||||
iv. Investment Funds | |||||||||||||||||
These include investment funds in which the Santander Group companies hold a substantial participation interest or the entirety of the participation interests and are therefore exposed to, or have rights, to variable returns and have the ability to affect those returns through power over the fund, in accordance with IFRS 10 - Consolidated Financial Statements and are therefore consolidated in these financial statements. | |||||||||||||||||
c) Definitions and classification of financial instruments | |||||||||||||||||
i. Definitions | |||||||||||||||||
A “financial instrument” is any contract that gives rise to a financial asset of one entity and, simultaneously, to a financial liability or financial interest of another entity. | |||||||||||||||||
An “equity instrument” is any agreement that evidences a residual interest in the assets of the issuing entity after deducting all of its liabilities. | |||||||||||||||||
A “financial derivative” is a financial instrument whose value changes in response to the change in an observable market variable (such as an interest rate, foreign exchange rate, financial instrument price, market index or credit rating), whose initial investment is very small compared with other financial instruments with a similar response to changes in market factors, and which is generally settled at a future date. | |||||||||||||||||
“Hybrid financial instruments” are contracts that simultaneously include a non-derivative host contract together with a derivative, known as an embedded derivative, that is not separately transferable and has the effect that some of the cash flows of the hybrid contract vary in a way similar to a stand-alone derivative. | |||||||||||||||||
The following transactions are not treated for accounting purposes as financial instruments: | |||||||||||||||||
| • Investments in subsidiaries, jointly controlled entities and associates (note 3&12). | |||||||||||||||||
| • Rights and obligations under employee benefit plans (note 23). | |||||||||||||||||
ii. Classification of financial assets for measurement purposes | |||||||||||||||||
Financial assets are initially classified into the various categories used for management and measurement purposes, unless they have to be presented as “Non-current assets held for sale” or they relate to “Cash and balances with the Brazilian Central Bank”, “Hedging derivatives” and “Investment in associates”, which are reported separately. | |||||||||||||||||
Financial assets are included for measurement purposes in one of the following categories: | |||||||||||||||||
| • Financial assets held for trading (at fair value through profit or loss): this category includes the financial assets acquired for the purpose of generating a profit in the near term from fluctuations in their prices and financial derivatives that are not designated as hedging instruments. | |||||||||||||||||
| • Other financial assets at fair value through profit or loss: this category includes hybrid financial assets not held for trading that are measured entirely at fair value and financial assets not held for trading that are included in this category in order to obtain more relevant information, either because this eliminates or significantly reduces recognition or measurement inconsistencies (“accounting mismatches”) that would arise from measuring assets or liabilities or recognizing the gains or losses on them on different bases, or because a group of financial assets or financial liabilities or both is managed and its performance is evaluated on a fair value basis, in accordance with a documented risk management or investment strategy, and information about the group is provided on that basis to the Bank’s key management personnel. | |||||||||||||||||
Financial instruments included in this category (and “Other financial liabilities at fair value through profit or loss”) are permanently subject to a consistent system of measuring, managing and controlling risks and returns that enables all the financial instruments involved to be monitored and identified and allows the effective reduction of risk to be checked. Financial assets may only be included in this category on the date they are acquired or originated. | |||||||||||||||||
Available-for-sale financial assets are stated at fair value. This category includes debt instruments not classified as “Held-to-maturity investments”, “Loans and receivables” or “Financial assets at fair value through profit or loss”, and equity instruments issued by entities other than subsidiaries, associates and jointly controlled entities, provided that such instruments have not been classified as “Financial assets held for trading” or as “Other financial assets at fair value through profit or loss”. Gains and losses arising from changes in fair value are recognized in "Equity" in the line item "Valuation Adjustment" with the exception of cumulative losses for non-recovery, which are recognized in profit or loss. When the investment is disposed of or is determined to be impaired, the cumulative gain or loss previously accumulated in "Equity - Valuation Adjustments" is reclassified to profit or loss. | |||||||||||||||||
• Loans and receivables: this category includes financing granted to third parties, based on their nature, irrespective of the type of borrower and the form of financing, including finance lease transactions in which the consolidated entities act as lessors. The consolidated entities generally intend to hold the loans and credits granted by them until their final maturity and, therefore, they are presented in the consolidated balance sheets at their amortized cost (which includes the required adjustments to reflect estimated impairment losses). | ||||||||||||||||
• Held-to-maturity investments: this category includes debt instruments traded in an active market, with fixed maturity and with fixed or determinable payments, for which the Bank has both the intention and proven ability to hold to maturity. These investments are measured at amortized cost less any impairment, with revenue recognized on an effective yield basis. | ||||||||||||||||
iii. Classification of financial assets for presentation purposes | ||||||||||||||||
Financial assets are classified by nature into the following items in the consolidated balance sheets: | ||||||||||||||||
• Cash and balances with the Brazilian Central Bank: cash balances and balances receivable on demand relating to deposits with the Brazilian Central Bank. | ||||||||||||||||
• Loans and receivables: includes the balance of loans granted by the Bank, as well as finance lease receivables and other debit balances of a financial nature in favor of the Bank, such as checks drawn on credit institutions, balances receivable from clearing houses and settlement agencies for transactions on the stock exchange and organized markets, bonds given in cash, capital calls, fees and commissions receivable for financial guarantees and debit balances arising from transactions not originated in Banking transactions and services, such as the collection of rentals and similar items. | ||||||||||||||||
• Loans and amounts due from credit institutions: credit of any nature in the name of financial institutions. | ||||||||||||||||
• Loans and advances to customers: includes the debit balances of all the remaining credit and loans granted by the Bank, including money market operations through central counterparties. | ||||||||||||||||
• Debt instruments: bonds and other securities that represent a debt for their issuer, that generate an interest return, and that are in the form of certificates or book entries. | ||||||||||||||||
• Equity instruments: financial instruments issued by other entities, such as shares, which have the nature of equity instruments for the issuer, unless they are investments in subsidiaries, jointly controlled entities or associates. Investment fund units not consolidated are included in this item. | ||||||||||||||||
• Trading derivatives: includes the fair value in favor of the Bank of derivatives which do not form part of hedge accounting. | ||||||||||||||||
• Hedging derivatives: includes the fair value in favor of the Bank of derivatives designated as hedging instruments in hedge accounting. | ||||||||||||||||
• Investments in associates: includes the investments in the share capital of associates. | ||||||||||||||||
iv. Classification of financial liabilities for measurement purposes | ||||||||||||||||
Financial liabilities are classified for measurement purposes into one of the following categories: | ||||||||||||||||
• Financial liabilities held for trading (at fair value through profit or loss): this category includes the financial liabilities issued for the purpose of generating a profit in the short term from fluctuations in their prices, financial derivatives not considered to qualify for hedge accounting and financial liabilities arising from the direct sale of financial assets purchased under resale agreements or borrowed (“Short positions”). | ||||||||||||||||
• Other financial liabilities at fair value through profit or loss: financial liabilities are included in this category when more relevant information is obtained, either because this eliminates or significantly reduces recognition or measurement inconsistencies (“accounting mismatches”) that would arise from measuring assets or liabilities or recognizing the gains or losses on them on different bases, or because a group of financial liabilities or financial assets and liabilities is managed and its performance is evaluated on a fair value basis, in accordance with a documented risk management or investment strategy, and information about the Bank is provided on that basis to the Bank’s key management personnel. | ||||||||||||||||
• Financial liabilities at amortized cost: financial liabilities, irrespective of their instrumentation and maturity, not included in any of the abovementioned categories which arise from the funding-taking activities carried on by financial institutions. | ||||||||||||||||
v. Classification of financial liabilities for presentation purposes | ||||||||||||||||
Financial liabilities are classified by nature into the following items in the consolidated balance sheets: | ||||||||||||||||
• Deposits from the Brazilian Central Bank: deposits of any nature received from the Brazilian Central Bank. | ||||||||||||||||
• Deposits from credit institutions: deposits of any nature, including Borrowings and On endings and money market funding received from credit institutions. | ||||||||||||||||
• Customer deposits: includes deposits of any nature such as demand deposits, saving deposits and time deposits including money market operation received fromcustomer. | ||||||||||||||||
• Marketable debt securities: includes the amount of bonds and other debt represented by marketable securities, other than subordinated liabilities. | ||||||||||||||||
• Trading derivatives: includes the fair value, with a negative balance for the Bank, of derivatives which do not form part of hedge accounting. | ||||||||||||||||
• Short positions: includes the amount of financial liabilities arising from the outright sale of financial assets purchased under reverse repurchase agreements or borrowed. | ||||||||||||||||
• Subordinated liabilities: amount of financing received which, for the purposes of payment priority, ranks behind ordinary debt. This category also includes the financial instruments issued by the Bank which, although equity for legal purposes, do not meet the requirements for classification as equity. | ||||||||||||||||
• Other financial liabilities: includes the amount of payment obligations having the nature of financial liabilities not included in other items, and liabilities under financial guarantee contracts, unless they have been classified as doubtful. | ||||||||||||||||
• Hedging derivatives: includes the fair value of the Bank’s liability in respect of derivatives designated as hedging instruments in hedge accounting. | ||||||||||||||||
d) Funding, debt notes issued and other liabilities | |||||||||||||||||
Funding debt rates and other liabilities Instruments are recognized initially at fair value, considered primarily as the transaction price. They are subsequently measured at amortized cost and its expenses are recognized as a financial cost. | |||||||||||||||||
Among the liabilities initial recognition methods, it is important to emphasize those compound financial instruments which are classified as such due to the fact that the instruments contain both, a debt instrument (liability) and an embedded equity component (derivative). | |||||||||||||||||
The recognition of a compound instrument consists of a combination of (i) a main instrument, which is recognized as an entity’s genuine liability (debt) and (ii) an equity component (derivative convertible into ordinary share). | |||||||||||||||||
The issue of "Notes" must be registered at specific account liabilities and updated according to the agreed rates and adjusted by the effect of exchange rate variations, when denominated in foreign currency. All remuneration related to these instruments, such as interest and Exchange variation (difference between the functional currency and the currency in which the instrument was named) shall be accounted for as expenses for the period, according to the accrual basis. | |||||||||||||||||
The relevant details of these issued instruments are described in note 21. | |||||||||||||||||
e) Measurement of financial assets and liabilities and recognition of fair value changes | |||||||||||||||||
In general, financial assets and liabilities are initially recognized at fair value which, in the absence of evidence to the contrary, is deemed to be the transaction price. Financial instruments not measured at fair value through profit or loss, are adjusted by the transaction costs. Financial assets and liabilities are subsequently measured at each period-end as follows: | |||||||||||||||||
i. Measurement of financial assets | |||||||||||||||||
Financial assets are measured at fair value, without deduction of estimated costs of transaction that may be incurred on their disposal, except for loans and receivables, held-to-maturity investments, equity instruments whose fair value cannot be determined in a sufficiently objective manner and financial derivatives that have as equity instruments subject and are settled by delivery of those instruments. | |||||||||||||||||
"Fair value" is the price that would be received to sell an asset or paid to transfer a liability in an orderly transaction between market participants at the measurement date. The most objective and ordinary reference to fair value of a financial instrument are the price would be paid for a financial strument on significative and transparent market.("market price") | |||||||||||||||||
If there is no market price for a given financial instrument, its fair value is estimated on the basis of valuation techniques commonly used by the international financial community, according to the specific features of the instrument to be measured and, particularly, the various types of risk associated with it. | |||||||||||||||||
All derivatives are recognized in the balance sheets at fair value from the trade date. If the fair value is positive, they are recognized as assets and if the fair value is negative, they are recognized as liabilities. The changes in the fair value of derivatives from the trade date are recognized in “Gains (losses) on financial assets and liabilities” in the consolidated income statement. Specifically, the fair value of standard financial derivatives included in the portfolios of financial assets or liabilities held for trading is deemed to be their daily quoted price and if, for exceptional reasons, the quoted price cannot be determined on a given date, these financial derivatives are measured using methods similar to those used to measure over the counter “OTC” derivatives. | |||||||||||||||||
The fair value of OTC derivatives is taken to be the sum of the future cash flows arising from the instrument, discounted to present value at the date of measurement (“present value” or “theoretical close”) using valuation techniques commonly used by the financial markets: “net present value” (NPV), option pricing models and other methods. | |||||||||||||||||
“Loans and receivables” and “Held-to-maturity investments” are measured at amortized cost using the effective interest method. “Amortized cost” is the acquisition cost of a financial asset or liability plus or minus, as appropriate, the principal repayments and the cumulative amortization (taken to the income statement) between the difference of the initial cost and the maturity amount. In the case of financial assets, amortized cost furthermore includes any reductions for impairment or uncollectibility. In the case of loans and receivables hedged in fair value hedges, the changes in the fair value of these assets related to the risk or risks being hedged are recognized. | |||||||||||||||||
The “effective interest rate” is the discount rate that exactly matches the initial amount of a financial instrument to all its estimated cash flows of all kinds over its remaining life. For fixed rate financial instruments, the effective interest rate coincides with the contractual interest rate established on the acquisition date plus, where applicable, the fees and transaction costs that, because of their nature, form part of their financial return. In the case of floating rate financial instruments, the effective interest rate coincides with the rate of return prevailing in all connections until the next benchmark interest reset date. | |||||||||||||||||
Equity instruments whose fair value cannot be determined in a sufficiently objective manner are measured at acquisition cost adjusted, where appropriate, by any related impairment loss. | |||||||||||||||||
The amounts at which the financial assets are recognized represent, in all material respects, the Bank’s maximum exposure to credit risk at each reporting date. Also, the Bank has received collateral and other credit enhancements to mitigate its exposure to credit risk, which consist mainly of mortgage guarantees, cash collateral, equity instruments and personal security, assets leased out under leasing and renting agreements, assets acquired under repurchase agreements and securities loans and derivatives. | |||||||||||||||||
ii. Measurement of financial liabilities | |||||||||||||||||
In general, financial liabilities are measured at amortized cost, as defined above, except for those included under “Financial liabilities held for trading” and “Other financial liabilities at fair value through profit or loss” and financial liabilities designated as hedge items (or hedging instruments) in fair value hedges, which are measured at fair value. | |||||||||||||||||
iii. Recognition of fair value changes | |||||||||||||||||
As a general rule, changes in the carrying amount of financial assets and liabilities are recognized in the consolidated income statement, distinguishing between those arising from the accrual of interest and similar items -which are recognized under “Interest and similar income” or “Interest expense and similar charges”, as appropriate- and those arising for other reasons, which are recognized at their net amount under “Gains (losses) on financial assets and liabilities (net)”. | |||||||||||||||||
Adjustments due to changes in fair value arising from Available-for-sale financial assets are recognized temporarily in equity under “Other Comprehensive Income”. Items charged or credited to this account remain in the Bank’s consolidated equity until the related assets are written-off, whereupon they are charged to the consolidated income statement. | |||||||||||||||||
iv. Hedging transactions | |||||||||||||||||
The consolidated entities use financial derivatives for the following purposes: i) to provide these instruments to customers who request them in the management of their market and credit risks; ii) to use these derivatives in the management of the risks of the Bank entities' own positions and assets and liabilities (“hedging derivatives”); and iii) to obtain gains from changes in the prices of these derivatives (“financial derivatives”). | |||||||||||||||||
Financial derivatives that do not qualify for hedge accounting are treated for accounting purposes as trading derivatives. | |||||||||||||||||
A derivative qualifies for hedge accounting if all the following conditions are met: | |||||||||||||||||
1. The derivative hedges one of the following three types of exposure: | |||||||||||||||||
a. Changes in the fair value of assets and liabilities due to fluctuations, among other, in the interest rate and/or exchange rate to which the position or balance to be hedged is subject (“fair value hedge”); | |||||||||||||||||
b. Changes in the estimated cash flows arising from financial assets and liabilities, commitments and highly probable forecast transactions (“cash flow hedge”); | |||||||||||||||||
c. The net investment in a foreign operation (“hedge of a net investment in a foreign operation”). | |||||||||||||||||
2. It is effective in offsetting exposure inherent in the hedged item or position throughout the expected term of the hedge, which means that: | |||||||||||||||||
a. At the date of arrangement the hedge is expected, under normal conditions, to be highly effective (“prospective effectiveness”). | |||||||||||||||||
b. There is sufficient evidence that the hedge was actually effective during the whole life of the hedged item or position (“retrospective effectiveness”). | |||||||||||||||||
3. There must be adequate documentation evidencing the specific designation of the financial derivative to hedge certain balances or transactions and how this effective hedge was expected to be achieved and measured, provided that this is consistent with the Bank’s management of own risks. | |||||||||||||||||
The changes in value of financial instruments qualifying for hedge accounting are recognized as follows: | |||||||||||||||||
a. In fair value hedges, the gains or losses arising on both the hedging instruments and the hedged items (attributable to the type of risk being hedged) are recognized directly in the consolidated income statement. | |||||||||||||||||
b. In cash flow hedges, the effective portion of the change in value of the hedging instrument is recognized temporarily in equity under “Other comprehensive Income - Cash flow hedges” until the forecasted transactions occur, when it is recognized in the consolidated income statement, unless, if the forecast transactions result in the recognition of non-financial assets or liabilities, it is included in the cost of the non-financial asset or liability. The ineffective portion of the change in value of hedging derivatives is recognized directly in the consolidated income statement. | |||||||||||||||||
c. The ineffective portion of the gains and losses on the hedging instruments of cash flow hedges and hedges of a net investment in a foreign operation are recognized directly under “Gains (losses) on financial assets and liabilities (net)” in the consolidated income statement. | |||||||||||||||||
If a derivative designated as a hedge instrument no longer meets the requirements described above due to expiration, ineffectiveness or for any other reason, the derivative is classified as a trading derivative. | |||||||||||||||||
When fair value hedge accounting is discontinued, the adjustments previously recognized on the hedged item are transferred to profit or loss at the effective interest rate re-calculated at the date of hedge discontinuation. The adjustments must be fully amortized until maturity. | |||||||||||||||||
When cash flow hedges are discontinued, any cumulative gain or loss on the hedging instrument recognized in equity under "Other comprehensive Income” (from the period when the hedge was effective) remains recognized in equity until the forecast transaction occurs at which time it is recognized in profit or loss, unless the transaction is no longer expected to occur, in which case any cumulative gain or loss is recognized immediately in profit or loss. | |||||||||||||||||
f) Settlement of financial assets and liabilities | |||||||||||||||||
The accounting treatment of transfers of financial assets depends on the extent to which the risks and rewards associated with the transferred assets are transferred to third parties: | |||||||||||||||||
| 1. If the Bank transfers substantially all the risks and rewards to third parties-unconditional sale of financial assets, sale of financial assets under an agreement to repurchase them at their fair value at the date of repurchase, sale of financial assets with a purchased call option or written put option that is deeply out of the money, securitization of assets in which the transferor does not retain a subordinated debt or grant any credit enhancement to the new holders, and other similar cases, the transferred financial asset is derecognized and any rights or obligations retained or created in the transfer are recognized simultaneously. | |||||||||||||||||
| 2. If the Bank retains substantially all the risks and rewards associated with the transferred financial asset -sale of financial assets under an agreement to repurchase them at a fixed price or at the sale price plus interest, a securities lending agreement in which the borrower undertakes to return the same or similar assets, and other similar cases, the transferred financial asset is not derecognized and continues to be measured by the same criteria as those used before the transfer. However, the following items are recognized: | |||||||||||||||||
a. An associated financial liability, for an amount equal to the consideration received; this liability is subsequently measured at amortized cost. | |||||||||||||||||
b. The income from the transferred financial asset not derecognized and any expense incurred on the new financial liability. | |||||||||||||||||
| 3. If the Bank neither transfers or retains substantially all the risks and rewards associated with the transferred financial asset - sale of financial assets with a purchased call option or written put option that is not deeply in or out of the money, securitization of assets in which the transferor retains a subordinated debt or other type of credit enhancement for a portion of the transferred asset, and other similar cases, the following distinction is made: | |||||||||||||||||
a. If the transferor does not retain control of the transferred financial asset, the asset is derecognized and any rights or obligations retained or created in the transfer are recognized. | |||||||||||||||||
b. If the transferor retains control, it continues to recognize the transferred financial asset for an amount equal to its exposure to changes in value and recognizes a financial liability associated with the transferred financial asset. The net carrying amount of the transferred asset and the associated liability is the amortized cost of the rights and obligations retained, if the transferred asset is measured at amortized cost, or the fair value of the rights and obligations retained, if the transferred asset is measured at fair value. | |||||||||||||||||
Accordingly, financial assets are only settled when the rights on the cash flows they generate have been extinguished or when substantially all the inherent risks and rewards have been transferred to third parties. Similarly, financial liabilities are only derecognized when the obligations they generate have been extinguished or when they are acquired, with the intention of either to cancel them or to resell them. | |||||||||||||||||
g) Offsetting of financial instruments | |||||||||||||||||
Financial asset and liability balances are offset (i.e. reported in the consolidated balance sheets at their net amount) only if the Bank and their subsidiaries currently have a legally enforceable right to set off the recognized amounts and intend either to settle on a net basis, or to realize the asset and settle the liability simultaneously. | |||||||||||||||||
The following table provides details of financial assets and liabilities subject to offsetting at December 31, 2016, 2015 and 2014: | |||||||||||||||||
| In thousand of Reais |
|
|
|
|
|
|
|
|
|
|
|
|
| 2016 | ||
Financial assets, gross | Financial assets | Financial assets | |||||||||||||||
Assets: | |||||||||||||||||
| Derivatives |
|
|
|
|
|
|
| 16,510,517 |
| - |
| 16,510,517 | ||||
| Repurchase agreements |
|
|
|
|
| 47,424,919 |
| - |
| 47,424,919 | ||||||
|
|
|
|
|
|
|
|
|
|
|
|
|
|
|
|
|
|
Financial liabilities, gross | Financial liabilities | Financial liabilities | |||||||||||||||
Liabilities: | |||||||||||||||||
| Derivatives |
|
|
|
|
|
|
| 11,913,799 |
| - |
| 11,913,799 | ||||
| Repurchase agreements |
|
|
|
|
| 126,048,442 |
| - |
| 126,048,442 | ||||||
| In thousand of Reais |
|
|
|
|
|
|
|
|
|
|
|
|
| 2015 | ||
Financial assets, gross | Financial assets | Financial assets | |||||||||||||||
Assets: | |||||||||||||||||
| Derivatives |
|
|
|
|
| 26,250,362 |
| - |
| 26,250,362 | ||||||
| Repurchase agreements |
|
|
| 31,987,323 |
| - |
| 31,987,323 | ||||||||
|
|
|
|
|
|
|
|
|
|
|
|
|
|
|
|
|
|
Financial liabilities, gross | Financial liabilities | Financial liabilities | |||||||||||||||
Liabilities: | |||||||||||||||||
| Derivatives |
|
|
|
|
| 24,716,959 |
| - |
| 24,716,959 | ||||||
| Repurchase agreements |
|
|
| 115,003,783 |
| - |
| 115,003,783 | ||||||||
| In thousand of Reais |
|
|
|
|
|
|
|
|
|
|
|
|
| 2014 | ||
Financial assets, gross | Financial assets | Financial assets | |||||||||||||||
Assets: | |||||||||||||||||
| Derivatives |
|
|
|
|
| 8,727,688 |
| - |
| 8,727,688 | ||||||
| Repurchase agreements |
|
|
| 24,887,260 |
| - |
| 24,887,260 | ||||||||
|
|
|
|
|
|
|
|
|
|
|
|
|
|
|
|
|
|
Financial liabilities, gross | Financial liabilities | Financial liabilities | |||||||||||||||
Liabilities: | |||||||||||||||||
| Derivatives |
|
|
|
|
| 9,178,262 |
| - |
| 9,178,262 | ||||||
| Repurchase agreements |
|
|
| 97,113,281 |
| - |
| 97,113,281 | ||||||||
On December 31, 2016, 2015 and 2014, the Bank has no financial instruments that meet the conditions for recognition on a net basis. | |||||||||||||||||
h) Regular way purchases of financial assets | |||||||||||||||||
Regular way purchases of financial assets are recognized on trade date. The assets are settled when the rights to receive cash flows have expired or the Bank has transferred substantially all the risks and rewards of ownership. | |||||||||||||||||
i) Impairment of financial assets | |||||||||||||||||
i. Definition | |||||||||||||||||
A financial asset is considered impaired when there is objective evidence that events have occurred which: | |||||||||||||||||
• Give rise to an adverse impact on the future cash flows that were estimated at the transaction date, in the case of debt instruments (loans and debt securities); | |||||||||||||||||
• Mean that their carrying amount cannot be fully recovered, in the case of equity instruments; | |||||||||||||||||
• Arising from the violation of terms of loans, and | |||||||||||||||||
• During the Bankruptcy process. | |||||||||||||||||
As a general rule, when the events above are observed, the carrying amount of impaired financial assets is adjusted by recording a provision for losses on debts expense as "Losses on financial assets (net)" in the consolidated income statement. The reversal of previously recorded losses is recognized in the consolidated income statement in the period in which the impairment and decrease can be related objectively to an event of recovery. | |||||||||||||||||
ii. Debt instruments carried at amortized cost | |||||||||||||||||
The amount of an impairment loss incurred for determination of the recoverable amount on a debt instrument measured at amortized cost is equal to the difference between its carrying amount and the present value of its estimated future cash flows (excluding future credit losses that have not been incurred) discounted the original effective interest rate of the financial asset (or the effective interest rate computed at initial recognition), and is presented as a reduction of the asset balance and recorded in income statements. | |||||||||||||||||
In estimating the future cash flows of debt instruments the following factors are taken into account: | |||||||||||||||||
• All the amounts that are expected to be obtained over the remaining life of the instrument, in this case, the provided guarantees. The impairment loss takes into account the likelihood of collecting accrued interest receivable. | |||||||||||||||||
• The various types of risk to which each instrument is subject; and | |||||||||||||||||
• The circumstances in which collections will foreseeably be made. | |||||||||||||||||
These cash flows are subsequently discounted using the instrument's effective interest rate. | |||||||||||||||||
Specifically in regards to recoverable amount losses resulting from materialization of the insolvency risk of the obligors (credit risk), a debt instrument is impaired due to insolvency when there is evidence of a deterioration of the obligor's ability to pay, either because it is in arrears or for other reasons. | |||||||||||||||||
The Bank has certain policies, methods and procedures for covering its credit risk arising both from insolvency allocable to counterparties. | |||||||||||||||||
These policies, methods and procedures are applied in the granting, examination and documentation of debt instruments, and contingent liabilities and commitments, the identification of their recoverable amount and the calculation of the amounts necessary to cover the related credit risk. | |||||||||||||||||
The procedures applied in the identification, measurement, control and reduce the exposure to credit risk, are based on an individual basis or grouped by similarity. | |||||||||||||||||
• Customers with individual management: Wholesale segment customers, financial institutions and certain companies. Risk management is performed through an analysis complemented by tools to support decision-making model-based risk assessment internal procedure. | |||||||||||||||||
• Customers with standardized management: individuals and companies not classified as individual clients. Risk management models based on automated decision-making and risk assessment procedure, complemented, when the model is not comprehensive or accurate enough, by teams of analysts specializing in this type of risk. The credits related to customers standardized, are usually considered not recoverable when they have historical loss experience and delay greater than 90 days. | |||||||||||||||||
Regarding the provision for impairment losses from credit risk, the Bank evaluates all loans. Loans are either individually evaluated for impairment or collectively evaluated for impairment. Loans accounted as amortized cost, which are not individually evaluated for impairment, are collectively evaluated for impairment, grouping them considering the similarity of risk. Loans individually evaluated for impairment are not included in balances that are collectively evaluated for impairment. | |||||||||||||||||
The Bank first assesses whether objective evidence of impairment loss individually for financial assets that are individually significant, and individually or collectively for financial assets that are not individually significant. | |||||||||||||||||
To measure the impairment loss on loans individually evaluated for impairment, the Bank considers the conditions of the borrower, such as their economic and financial situation, level of indebtedness, ability to generate income, cash flow , management, corporate governance and quality of internal controls, payment history, industry expertise, contingencies and credit limits, as well as characteristics of assets, such as its nature and purpose, type, sufficiency and liquidity level guarantees and total amount of credit, as well as based on historical experience of impairment and other circumstances known at the moment of evaluation. | |||||||||||||||||
To measure the impairment loss on loans collectively evaluated for impairment, the Bank segregates financial assets into groups considering the characteristics and similarity of credit risk, in other words, according to segment, the type of assets, guarantees and other factors associated as the historical experience of impairment and other circumstances known at the time of assessment. | |||||||||||||||||
In some cases the observable data required to estimate the amount of an impairment loss on a financial asset may be limited or no longer fully relevant to current circumstances. | |||||||||||||||||
In such cases, an entity uses its experienced judgment to estimate the amount of any impairment loss. Similarly an entity uses its experienced judgment to adjust observable data for a group of financial assets to reflect current circumstances. | |||||||||||||||||
The impairment loss is calculated by using statistical models that consider the following factors: | |||||||||||||||||
• Exposure at default or “EAD” is the amount of risk exposure at the date of default by the borrower. | |||||||||||||||||
In accordance with IFRS, the exposure at default used for this calculation is the current exposure, as reported in the balance sheets. | |||||||||||||||||
• Probability of default, or “PD”, is the probability of the borrower failing to meet its principal and/or interest payment obligations. | |||||||||||||||||
PD is measured using a time horizon of one year; that is, it quantifies the probability of the borrower defaulting in the coming year. A loan is in default if either the principal or interest is past due by ninety days or more or the loan is current but there are doubts as to the solvency of the counterparty (subjective doubtful assets). | |||||||||||||||||
• Loss given default, or “LGD”, is the loss arising in the event of default. | |||||||||||||||||
LGD calculation is based on the net charge offs on defaulted loans, taking into account the guarantees/collateral associated with the loans, the income and expenses associated with the recovery process and the timing of delinquency. | |||||||||||||||||
• Loss identification period, or “LIP,” is the time period between the occurrence of a loss event and the identification of an objective evidence of this loss. In other words, it represents the time horizon from the credit loss occurrence until the effective confirmation of such loss. | |||||||||||||||||
• In addition, prior to charging off past due loans (which is only done after the Bank have completed all recovery efforts and after about 360 days late), is composed fully provision the remaining balance of the loan so our allowance for loan losses fully cover the losses. Thus, the Bank understands that its loan loss allowance methodology has been developed to fit its risk metrics and capture loans that could potentially become impaired. | |||||||||||||||||
iii. Debt or equity instruments classified as available for sale | |||||||||||||||||
The difference between the amortized cost and fair value of debt or equity instruments classified as available for sale are recorded in equity under "Other Comprehensive Income." | |||||||||||||||||
When there is objective evidence that the aforementioned differences are due to a prolonged decline in fair value, they are no longer recognized in equity and are reclassified, at the cumulative amount at that date, to the consolidated income statement. Losses from a prolonged decline in fair value relating to an investment in equity instruments are not reversed in subsequent periods. | |||||||||||||||||
j) Repurchase agreements | |||||||||||||||||
Purchases (disposal) of financial assets under a non-optional resale (repurchase) agreement at a fixed price are recognized in the consolidated balance sheets as Investment (funding), in repurchase agreements based on the nature of the debtor (creditor), under “Cash and balances with the Brazilian Central Bank”, “Loans and amounts due from credit institutions” or “Loans and advances to customers” (“Deposits from the Brazilian Central Bank”, “Deposits from credit institutions” or “Customer deposits”). | |||||||||||||||||
Differences between the purchase and sale prices are recognized as interest over the contract term. | |||||||||||||||||
k) Accounting for leases | |||||||||||||||||
i. Financial leases | |||||||||||||||||
Financial leases are leases that transfer substantially all the risks and rewards incidental to ownership of the leased asset to the lessee. | |||||||||||||||||
When the consolidated entities act as the lessors of an asset, all types of finances leases have guaranteed residual values, and the sum of the present value of the lease payments receivable from the lessee plus the guaranteed residual value which is the exercise price of the purchase option of the lessee at the end of the lease term is recognized as loans to third parties and is therefore included under “Loans and receivables” in the consolidated balance sheets. | |||||||||||||||||
The finance income arising from these contracts is credited to “Interest and similar income” in the consolidated income statement so as to achieve a constant rate of return over the lease term. | |||||||||||||||||
l) Non-current assets held for sale | |||||||||||||||||
“Non-current assets held for sale” includes the carrying amount of individual items or disposal groups or items forming part of a business unit earmarked for disposal (“Discontinued operations”), whose sale in their present condition is highly probable and is expected to occur within one year, the property or other non-current assets received by the consolidated entities as total or partial settlement of their debtors' payment obligations to them are deemed to be non-current assets held for sale through the completion of actions which normally occurs up to one year. | |||||||||||||||||
Non-current assets held for sale are measured at the lower of fair value less costs to sell and their carrying amount at the date of classification in this category.Non-current assets held for sale are not depreciated. | |||||||||||||||||
Impairment losses on an asset or disposal group arising from a reduction in its carrying amount to its fair value (less costs to sell) are recognized under “Gains (losses) on disposal and expenses of non-current assets held for sale not classified as discontinued operations” in the consolidated income statement. The gains on a non-current asset held for sale resulting from subsequent increases in fair value (less costs to sell) increase its carrying amount and are recognized in the consolidated income statement up to an amount equal to the impairment losses previously recognized. | |||||||||||||||||
m) Residual maturity periods and average interest rates | |||||||||||||||||
The analysis of the maturities of the balances of certain items in the consolidated balance sheets and the average interest rates at 2016, 2015 and 2014 year-end is provided in note 45-d. | |||||||||||||||||
n) Tangible assets | |||||||||||||||||
“Tangible assets” includes the amount of buildings, land, furniture, vehicles, computer hardware and other fixtures owned by the Bank, including tangible assets received by the Bank in full or partial satisfaction of financial assets representing receivables from third parties which are intended to be held for continuing use and tangible assets acquired under finance leases are presented at acquisition cost, less the related accumulated depreciation and any impairment losses (net carrying amount higher than recoverable amount). | |||||||||||||||||
Depreciation is calculated, using the straight-line method, on the basis of the acquisition cost of the assets less their residual value. The land on which the buildings and other structures are located has an indefinite life and, therefore, it is not depreciated. | |||||||||||||||||
The tangible asset depreciation charge is recognized in the consolidated income statement and is calculated basically using the following depreciation rates (based on the average years of estimated useful life of the various assets): | |||||||||||||||||
|
|
|
|
|
|
|
|
|
|
|
|
|
|
|
|
| Annual |
Buildings for own use |
|
|
|
|
|
|
|
|
|
|
|
|
|
|
| 4% | |
Furniture |
|
|
|
|
|
|
|
|
|
|
|
|
|
|
| 10% | |
Fixtures |
|
|
|
|
|
|
|
|
|
|
|
|
|
|
| 10% | |
Office and IT equipment |
|
|
|
|
|
|
|
|
|
|
|
|
| 20% | |||
Leasehold improvements |
|
|
|
|
|
|
|
|
| 10% or up to contractual maturity | |||||||
The Bank assesses at end of each period, if there is no indication that the items of tangible assets may be impaired carrying amount exceeds its recoverable amount either for use or sale. | |||||||||||||||||
Once a reduction in the impairment loss of tangible assets is identified, it is adjusted to reach its recoverable amount by recognizing an impairment loss recorded in "Impairment loss on other assets (Net)". Additionally the value of depreciation of that asset is recalculated in order to adjust the value of the life of the asset. | |||||||||||||||||
In case of evidence or indication of an impairment loss of a tangible asset, the Bank recognizes the reversal of impairment loss recorded in prior years and should adjust the future depreciation expenses according to the lifetime value of the property. Under no circumstance, a reversal of impairment loss of an asset will increase its carrying amount higher than the amount that it would have had no impairment loss been recognized in prior years. | |||||||||||||||||
Upkeep and maintenance expenses relating to property, plant and equipment for own use are recognized as an expense in the period in which they are incurred. | |||||||||||||||||
o) Intangible assets | |||||||||||||||||
Intangible assets are identifiable non-monetary assets (separable from other assets) without physical substance which arise as a result of a legal transaction or software development. Only assets whose cost can be estimated reliably and from which the consolidated entities consider it probable that future economic benefits will be generated are recognized. | |||||||||||||||||
Intangible assets are recognized initially at acquisition or production cost and are subsequently measured deducting any accumulated amortization and any accumulated impairment losses. | |||||||||||||||||
i. Goodwill | |||||||||||||||||
In the acquisition and/or merger of investment in subsidiary, any difference between the investment cost and the investor's share in net fair value of assets, liabilities and contingent liabilities of the investee (subsidiary or affiliate) is accounted for in accordance with IFRS 3 "Business Combination ". | |||||||||||||||||
Goodwill is recognized only when the amount of the investee acquired exceeds the fair value at the acquisition date, and therefore represents a payment made by the acquirer in anticipation of future economic benefits of assets of the acquired entity that can not be individually identified and recognized separately. | |||||||||||||||||
At the end of each reporting period or whenever there is any indication of impairment, the goodwill is reviewed for impairment (impairment test) and, if there is any impairment, the goodwill is written down against Impairment losses on Goodwill and other intangible assets in the consolidated income statement. | |||||||||||||||||
The net fair value adjustments of assets, liabilities and contingent liabilities of the investee in relation to its carrying amount are allocated to individual identifiable assets acquired and liabilities assumed that comprise it based on their respective fair values at the date of purchase. | |||||||||||||||||
In the case of a business combination achieved in stages, prior interest in the acquire is measured again at fair value at acquisition date when control of the acquire is obtained. | |||||||||||||||||
ii. Other intangible assets | |||||||||||||||||
Other intangible assets are non-monetary asset without physical substance. Generally arising from software development and acquisition of rights that can generate benefits for the Bank.They can have characteristics of definite or indefinite period. | |||||||||||||||||
Other intangible assets are considered to have indefinite useful life when, based on an analysis of all relevant factors, it is concluded that there is no foreseeable limit to the period over which the asset is expected to generate cash inflows for the Bank, or a finite useful life, in all other cases. | |||||||||||||||||
Intangible assets with indefinite useful lives are not amortized, but rather, at the end of each period, the entity reviews the remaining useful life of assets to determine if they are still undefined and, if this is not the case, the change should be accounted for as a change in accounting estimate. | |||||||||||||||||
Intangible assets with definite useful life are amortized over its useful life by using methods similar to those used to depreciate tangible assets. The amortization expense is recognized under "Depreciation and amortization" in the consolidated income statement. | |||||||||||||||||
The Bank assesses at the end of each period, if there is any indication that the items of intangible assets may present an impairment loss, i.e. an asset that presents the carrying amount higher than the net realizable value. After identifying any reduction in impairment loss, it is adjusted to reach its fair value. | |||||||||||||||||
Measurement of the recoverable amount of other intangible assets - software is made based on the value in use, as well as the analysis of the discontinuity of the asset in relation to the activities of the Bank. | |||||||||||||||||
Expenditures for acquisition and development of software are amortized over a maximum period of 5 years. | |||||||||||||||||
p) Other assets | |||||||||||||||||
Other Assets include the balance of all prepayments and accrued income (excluding accrued interest), acquired customer list, the net amount of the difference between pension plan obligations and the fair value of the plan assets with a balance on the entity’s behalf, when this net amount is to be reported in the consolidated balance sheets, and the amount of any other assets not included in other items. | |||||||||||||||||
The Bank uses the value in use of customer relationship as a basis for measuring the impairment since it is not reasonably possible to determine the net value of sales, because there is no basis for making a reliable estimate of the value to be obtained by selling the asset in a transaction at cumulative basis, between knowledgeable, willing parties. The value in use of customer lists acquired related to the purchase of the "payroll" will be determined individually. An analyses that aims to demonstrate the expectation of generating future economic benefit and the present value of expected cash flows is prepared by the business areas. Quarterly, these analyses are reviewed based on the actual cash flows of each business (value in use), which are compared with the carrying amount, checking whether there is a need to record a loss on non-recoverability. | |||||||||||||||||
q) Liabilities for insurance contracts | |||||||||||||||||
The liabilities for insurance contracts are comprised substantially by mathematical provisions for current and future benefits (PMBaC and PMBC). Insurance contracts are contracts under which the Bank accepts a significant risk, other than a financial risk, from a policyholder by agreeing to compensate the beneficiary on the occurrence of an uncertain future event by which the policyholder will be adversely affected. | |||||||||||||||||
Insurance liabilities are recognized when the contract is entered into and the premiums are charged. Contracts that have been classified as insurance are not reclassified subsequently. The liability is derecognized when the contract expires or is cancelled. | |||||||||||||||||
All valuation methods used by the subsidiaries are based on the general principle that the carrying amount of the net liability must be sufficient to meet any reasonably foreseeable obligation resulting from the insurance contracts. Investment assumptions are either determined by the local regulator and based on management’s future expectations. In the latter case, the anticipated future investment return is set by management, considering the available market information and economic indicators. A significant assumption related to estimated gross profits on variable annuities, is the annual long-term growth rate of the underlying assets. | |||||||||||||||||
At each balance sheets date an assessment is made of whether the provisions for Mathematical provisions are adequate. | |||||||||||||||||
In the years ended December 31, 2016, 2015 and 2014, as determined by IFRS 4 and subsequent amendments, the adequacy of the technical provisions constituted were evaluated through Liability Adequacy Test (LAT). | |||||||||||||||||
In December 31, 2016, the LAT indicated the need for the additional constitution of technical provisions amounted to R$85,395 (2015 - R$57,523) for FGB plans. | |||||||||||||||||
r) Provision for contingent assets and liabilities | |||||||||||||||||
Banco Santander and its subsidiaries are involved in judicial and administrative proceedings related to tax, labor and civil, in the normal course of their activities. | |||||||||||||||||
The provisions include legal obligations, judicial and administrative proceedings related to tax and social security obligations, whose object is to challenge their legality or constitutionality, regardless of the assessment that the probability of success, the amounts are fully recognized in the financial statements. Provisions are reviewed at each balance sheet date and adjusted to reflect the current best estimate and may be fully or partially reversed or reduced when the outflows of resources and obligations relevant to the process are no longer probable, including decay of legal deadlines, among others. | |||||||||||||||||
Provisions for the judicial and administrative proceedings are recorded when the risk of loss of administrative or judicial proceeding is considered probable and the amounts can be reliably measured, based on the nature, complexity and history of lawsuits, the legal opinion of the internal and external advisors, based on the best available information. For provisions for which the risk of loss is possible, are not recorded and the information is disclosed in the financial statements (Note 24.h.) and for those for which the risk of loss is remote, no disclosure is required. On the favorable decisions to Santander, the counterparty has the right, in the event of specific legal requirements, to file a rescission action within a period determined by current legislation. Rescission actions are considered as new events and will be evaluated for contingent liability purposes if and when they are filed. | |||||||||||||||||
Contingent assets are not recognized, except when there are guarantees or favorable judicial decisions, about which features no longer fit, characterizing the gain as practically certain. Assets with probable success, if any, are only disclosed in the financial statements. | |||||||||||||||||
s) Other liabilities | |||||||||||||||||
“Other liabilities” includes the balance of all accrued expenses and deferred income, excluding accrued interest, and the amount of any other liabilities not included in other categories. | |||||||||||||||||
t) Share-based compensation | |||||||||||||||||
The Bank has long-term compensation plans with vesting conditions. The main vesting conditions are: (1) service conditions, since it is necessary that the participant continues to be employed by the Bank during the term of the Plan for their rights to vest; (2) performance conditions, since the number of Units that ultimately vest will be determined according to the result of certain performance parameter of the Bank, such as: total Shareholder Return (TSR) and may be reduced in case of failure to achieve the goals of reducing the Return on Risk Adjusted Capital (RORAC), comparison between actual and budget in each year, as determined by the Board of Directors and (3) market conditions, since some parameters are linked to the market price of the Bank´s shares. The Bank measures the fair value of the services rendered by reference to the fair value of the equity instruments granted at the grant date, taking into account the market conditions for each plan when estimating the fair value. | |||||||||||||||||
Settlement in shares | |||||||||||||||||
The Bank measures the fair value of the services received by reference to the fair value of the equity instruments granted at the grant date, taking into account the market conditions for each grant when estimating the fair value. In order to recognize the personnel expenses against equity reserves throughout the vesting period, as the services are received, the Bank considers the treatment of service conditions and recognize the amount for the services received during the vesting period based on the best available estimate of the number of equity instruments expected to vest. Semi-annually, the Bank reviews the estimate of the number of equity instruments expected to vest. | |||||||||||||||||
Settlement in cash | |||||||||||||||||
For cash-settled share-based compensation (in the form of share appreciation rights), the Bank measures the fair value of services rendered and the corresponding liability incurred, based on the fair value of the share appreciation rights at the grant date and until the liability is settled. The Banks remeasures the fair value of the liability at the end of each reporting period and at the date of settlement, with any changes in fair value recognized in profit or loss for the period. In order to recognize the personnel expenses against a provision in “other liabilities” throughout the vesting period, reflecting the period as the services are received, the Bank bases the total liability on the best estimate of the number of share appreciation rights that will vest at the end of the vesting period and recognizes the amount for the services received during the vesting period based on such best available estimate. Periodically, the Bank reviews such estimate of the number of share appreciation rights that will vest at the end of vesting period. | |||||||||||||||||
u) Recognition of income and expenses | |||||||||||||||||
The most significant criteria used by the Bank to recognize its income and expenses are summarized as follows: | |||||||||||||||||
i. Interest income, interest expenses and similar items | |||||||||||||||||
Interest income, interest expenses and similar items are generally recognized on an accrual basis using the effective interest method. Dividends received from other companies are recognized as income when the consolidated entities' right to receive them arises. | |||||||||||||||||
ii. Commissions, fees and similar items | |||||||||||||||||
Fees and commission income and expenses are recognized in income using criteria that vary according to their nature (note 36).The main criteria are as follows: | |||||||||||||||||
• Fee and commission income and expenses relating to financial assets and financial liabilities measured at fair value through profit or loss are recognized when paid; | |||||||||||||||||
• Those arising from transactions or services that are performed over a period of time are recognized over the life of these transactions or services; and | |||||||||||||||||
• Those relating to services provided in a single act are recognized when the single act has been performed. | |||||||||||||||||
Certain 2014 and 2015 (note 36 and 37) fee and commission income and expense related to the business activities of the subsidiary Getnet S.A., acquired in 2014, have been reclassified to conform to the 2016 presentation. | |||||||||||||||||
iii. Non-financial income and expenses | |||||||||||||||||
These are recognized for accounting purposes on an accrual basis. | |||||||||||||||||
iv. Deferred collections and payments | |||||||||||||||||
These are recognized for accounting purposes at the amount resulting from discounting the expected cash flows at market rates. | |||||||||||||||||
v. Loan arrangement fees | |||||||||||||||||
Loan arrangement fees, mainly loan origination and application fees, are accrued and recognized in income over the term of the loan. In the case of loan origination fees, the portion relating to the associated direct costs incurred in the loan arrangement is recognized immediately in the consolidated income statement. | |||||||||||||||||
v) Guarantees | |||||||||||||||||
v.1) Financial guarantees | |||||||||||||||||
“Financial guarantees” are defined as contracts whereby an entity undertakes to make specific payments for a third party if the latter does not do so, irrespective of the various legal forms they may have, such as guarantees, irrevocable documentary credits issued or confirmed by the entity, among others. | |||||||||||||||||
The Bank initially recognizes the commission of the financial guarantees as liability in the consolidated balance sheets at fair value, which is generally the present value of the fees, commissions and similar interest receivable from these contracts over their term. | |||||||||||||||||
Financial guarantees, regardless of the guarantor, type of instrument or other circumstances, are reviewed periodically so as to determine the credit risk to which they are exposed and, if appropriate, to consider whether a provision is required. The credit risk is determined by application of criteria similar to those established for quantifying impairment losses on debt instruments measured at amortized cost. | |||||||||||||||||
The provisions made for these transactions are recognized under “Provisions - Provisions for contingent liabilities, commitments and other provisions” in the consolidated balance sheets (note 24). | |||||||||||||||||
If a specific provision is required for financial guarantees, the related unearned commissions are recognized under “Financial liabilities at amortized cost – Other financial liabilities” in the consolidated balance sheets are reclassified to the appropriate provision. | |||||||||||||||||
v.2) Guarantees and Credit Risk Mitigation Policy | |||||||||||||||||
Banco Santander controls the credit risk through the use of collateral in its operations. Each business unit is responsible for credit risk management and formalizes the use of collateral in its lending policies. | |||||||||||||||||
Banco Santander uses guarantees in order to increase their resilience in the subject to credit risk operations. The guarantees can be used fiduciary, real, legal structures with power mitigation and compensation agreements. The Bank periodically reviews its policy guarantees by technical parameters, normative and also its historical basis, to determine whether the guarantee is legally valid and enforceable. | |||||||||||||||||
Credit limits are continually monitored and changed in customer behavior function. Thus, the potential loss values represent a fraction of the amount available. | |||||||||||||||||
w) Assets under management and investment and pension funds managed by the Bank | |||||||||||||||||
Assets owned by third parties and managed by the consolidated entities are not presented in the consolidated balance sheets. Management fees are included in “Fee and commission income” in the consolidated income statement. Note 45-b contains information on the third-party assets managed by the Bank. | |||||||||||||||||
The investment funds and pension funds managed by the consolidated entities are not recorded in the consolidated balance sheets since the related assets are owned by third parties. The fees and commissions earned in the year for the services rendered by the Bank entities to these funds (asset management and custody services) are recognized under “Fee and commission income” in the consolidated income statement. | |||||||||||||||||
x) Post-employment benefits | |||||||||||||||||
Post-employment benefit plans include the commitments of the Bank: (i) addition to the benefits of public pension plan; and (ii) healthcare in case of retirement, permanent disability or death for those employees, and their direct beneficiaries. | |||||||||||||||||
Defined contribution plans | |||||||||||||||||
Defined benefit plans is the post-employment benefit plan which the Bank, and its subsidiaries, as the sponsoring entity pays fixed contributions into a pension fund, not having a legal or constructive obligation to pay further contributions if the fund does not hold sufficient assets to pay all benefits relating to services provided in the current and in previous periods. | |||||||||||||||||
The contributions made in this connection are recognized under "Interest Expense and Similar Charges" in the income statement. | |||||||||||||||||
Defined benefit plans | |||||||||||||||||
Defined benefit plan is the post-employment benefit plan which is not a defined contribution plan and is shown in Note 23 For this type of plan, the sponsoring entity's obligation is to provide the benefits agreed with employees, assuming the potential actuarial risk that benefits will cost more than expected. | |||||||||||||||||
For defined benefit plan, the amendment of IAS 19 established fundamental changes in the accounting for and disclosure of employee post-employment benefits such as removing the corridor approach in the accounting for the obligation of the plans, as well as changes in the criteria for recognition of conventional interest of plan assets (valuation based on the discount rate actuarial liability). | |||||||||||||||||
In addition, it occours full recognition of liabilities on account of actuarial losses (actuarial deficit) not recognized previously, in contrast to the stockholders’ equity (Other Comprehensive Income). | |||||||||||||||||
Main Definitions | |||||||||||||||||
- The present value of the defined benefit obligation is the present value without any assets deductions of expected future payments required to settle the obligation resulting from employee service in the current and past periods, without deducting any plan assets. | |||||||||||||||||
- Deficit or surplus is: (a) the present value of the defined benefit obligation, less (b) the fair value of plan assets. | |||||||||||||||||
- The sponsoring entity may recognize the plan's assets in the balance sheets when they meet the following characteristics: (i) the assets of the fund are sufficient to meet all employee benefit plan or a sponsor obligations; or (ii) the assets are returned to the sponsoring entity in order to reimburse it for employee benefits already paid. | |||||||||||||||||
- Actuarial gains and losses correspond to changes in the present value of defined benefit obligation resulting from: (a) adjustments by experience (the effects of differences between the actuarial assumptions adopted and what has actually occurred); and (b) effects of changes in actuarial assumptions. | |||||||||||||||||
- Current service cost is the increase in the present value of the defined benefit obligation resulting from employee service in the current period. | |||||||||||||||||
- The past service cost is the change in present value of defined benefit obligation for employee service in prior periods resulting from a change in the plan or reductions in the number of employees covered. | |||||||||||||||||
Post-employment benefits are recognized in income in "Interest expense and similar Charges" and "Provisions (net)". | |||||||||||||||||
The defined benefit plans are recorded based on an actuarial study, conducted annually by an external consulting firm, at the end of each year to be effective for the subsequent period. | |||||||||||||||||
y) Other long-term employee benefits | |||||||||||||||||
“Other long-term employee benefits”, defined as obligations to early retirees considered as those who have ceased to render services at the entity but who, without being legally retired, continue to have economic rights relating to the entity until they acquire the legal status of retiree, long-service bonuses, obligations for death of spouse or disability before retirement that depend on the employee's length of service at the entity and other similar items, are treated for accounting purposes, where applicable, as established above for defined benefit post-employment plans, except that all past service costs and actuarial gains and losses are recognized immediately (note 23). | |||||||||||||||||
z) Termination benefits | |||||||||||||||||
Termination benefits are recognized when there is a detailed formal plan identifying the basic changes to be made, provided that implementation of the plan has begun, its main features have been publicly announced or objective facts concerning its implementation have been disclosed. | |||||||||||||||||
aa) Income taxes (IRPJ), Social Contribution (CSLL), Social Integration Program (PIS) and Tax for Social Security Financing (COFINS) | |||||||||||||||||
Income tax is calculated at the rate of 15% plus a surcharge of 10% levied on the profit, after adjustments determined by tax legislation. The social contribution (CSLL) is calculated at the rate of 20% for financial institutions (15% up to August 2015) and 9% for other companies, levied on the profit, after considering the adjustments determined by tax legislation. The CSLL rate for financial institutions, legal persons of private insurance and capitalization was increased from 15% to 20% for the fiscal period between September 1, 2015 and December 31, 2018, pursuant to Law 13,169/2015 (a result of the conversion into law of Provisional Measure 675/2015). | |||||||||||||||||
The expense for corporate income tax is recognized in the consolidated income statement, except when it results from a transaction recognized directly in equity, in which case the tax effect is also recognized in equity. | |||||||||||||||||
The current income tax expense is calculated as the sum of the current tax resulting from application of the appropriate tax rate to the taxable profit for the year (net of any deductions allowable for tax purposes), and of the changes in deferred tax assets and liabilities recognized in the consolidated income statement. | |||||||||||||||||
Tax assets classified as "Current" are amounts of tax to be recovered within the next twelve months. | |||||||||||||||||
Tax liabilities includes the amount of all tax liabilities (except provisions for taxes), which are broken down into “current” amount payable in respect of the income tax on the taxable profit for the year and other taxes in the next twelve months. | |||||||||||||||||
Deferred tax assets and liabilities include temporary differences, which are identified as the amounts expected to be payable or recoverable on differences between the carrying amounts of assets and liabilities and their related tax bases, and tax loss and tax credit carry forwards. These amounts are measured at the tax rates that are expected to apply in the period when the asset is realized or the liability is settled. | |||||||||||||||||
Deferred tax assets are only recognized for temporary differences to the extent that it is considered probable that the consolidated entities will have sufficient future taxable profits against which the deferred tax assets can be utilized, and the deferred tax assets do not arise from the initial recognition (except in a business combination) of other assets and liabilities in a transaction that affects neither taxable profit or accounting profit. Other deferred tax assets (tax loss and tax credit carry forwards) are only recognized if it is considered probable that the consolidated entities will have sufficient future taxable profits against which they can be utilized. | |||||||||||||||||
Due to the change in social contribution tax rate, the group companies made the remeasurement of tax credit assets and deferred liabilities at the rates applicable to the period in which estimates the realization of assets and settlement of liabilities. | |||||||||||||||||
Income and expenses recognized directly in stockholders equity are accounted for as temporary differences. | |||||||||||||||||
The deferred tax assets and liabilities recognized are reassessed at each balance sheets date in order to ascertain whether they still exist, and the appropriate adjustments are made on the basis of the findings of the analyses performed. | |||||||||||||||||
Under the current regulation, the expected realization of tax credits based on the Bank's projections of future results and based on technical study, as shown in Note 25. | |||||||||||||||||
PIS (Social Integration Program) and COFINS (Tax for Social Security Financing) taxes have been computed at a combined rate of 4.65% on certain gross revenues and expenses. Financial institutions may deduct financial expenses in determining the PIS/COFINS tax basis. PIS and COFINS are considered a profit-base component (net basis of certain revenues and expenses), therefore and accordingly to IAS 12 it is recorded as income taxes. | |||||||||||||||||
ab) Consolidated cash flow statements | |||||||||||||||||
The following terms are used in the consolidated cash flow statements with the following meanings: | |||||||||||||||||
• Cash flows: inflows and outflows of cash and cash equivalents, which are short-term, highly liquid investments that are subject to an insignificant risk of changes in value and original maturity of three months or less. | |||||||||||||||||
• Operating activities: the primary revenue-generating activities of credit institutions and other activities that are not investing or financing activities. | |||||||||||||||||
• Investing activities: the acquisition and disposal of long-term assets and other investments not included in cash and cash equivalents. | |||||||||||||||||
• Financing activities: activities that result in changes in the size and breakdown of the equity and liabilities that are not operating activities. | |||||||||||||||||
In preparing the consolidated cash flows statement, the high liquidity investments with insignificant risk of changes in their values were classified as "Cash and cash equivalents". The Bank classifies as cash and cash equivalents balances recorded under "Cash and balance with the Brazilian Central Bank" and "Loans and amounts due from credit institutions" in the consolidated balance sheets, except restricted resources and long-term transactions. | |||||||||||||||||
The interest paid and received correspond basically to operating activities of Banco Santander. | |||||||||||||||||
3. Basis of consolidation | |||||||||||||||||
Below are highlight the controlled entities and investment funds included in the consolidated financial statements of Banco Santander. Similar information regarding companies accounted for under the equity method by the Bank is provided in Note 12. | |||||||||||||||||
|
|
|
|
|
|
|
|
|
|
|
|
|
|
|
|
|
|
Directly and Indirectly controlled by Banco Santander (Brasil) S.A. | Participation % | ||||||||||||||||
Activity | Direct | Direct and Indirect | |||||||||||||||
| Banco Bandepe S.A. |
|
|
|
|
|
|
|
|
|
|
| Bank |
| 100.00% |
| 100.00% |
| Santander Leasing S.A. Arrendamento Mercantil (Santander Leasing) |
|
|
|
| Leasing |
| 78.57% |
| 99.99% | |||||||
| Aymoré Crédito, Financiamento e Investimento S.A. (Aymoré CFI) |
|
|
|
| Financial |
| 100.00% |
| 100.00% | |||||||
| Santander Brasil Administradora de Consórcio Ltda. |
|
|
|
| Buying club |
| 100.00% |
| 100.00% | |||||||
| Santander Microcrédito Assessoria Financeira S.A. |
|
|
|
| Microcredit |
| 100.00% |
| 100.00% | |||||||
| Santander Brasil Advisory Services S.A. |
|
|
|
| Other Activities |
| 96.58% |
| 96.58% | |||||||
| Atual Companhia Securitizadora de Créditos Financeiros |
|
|
|
| Securitization |
| 100.00% |
| 100.00% | |||||||
| Santander Corretora de Câmbio e Valores Mobiliários S.A. |
|
|
|
| Broker |
| 99.99% |
| 100.00% | |||||||
| Santander Participações S.A. |
|
|
|
| Holding |
| 100.00% |
| 100.00% | |||||||
| Getnet Adquirência e Serviços para Meios de Pagamento S.A. (Getnet S.A.)(1) |
|
|
|
| Payment Institution |
| 88.50% |
| 88.50% | |||||||
| Sancap Investimentos e Participações S.A. (Sancap) |
|
|
|
| Holding |
| 100.00% |
| 100.00% | |||||||
| Santander Brasil EFC |
|
|
|
| Financial |
| 100.00% |
| 100.00% | |||||||
| Santander S.A. Serviços Técnicos, Administrativos e de Corretagem de Seguros (Santander Serviços) |
|
|
| Insurance Broker |
| 60.65% |
| 60.65% | ||||||||
|
|
|
|
|
|
|
|
|
|
|
|
|
|
|
|
|
|
| Controlled by Santander Serviços |
|
|
|
|
|
|
|
|
|
|
|
|
|
| ||
| Webcasas S.A. |
|
|
|
|
|
|
|
|
|
|
| Other Activities |
| - |
| 100.00% |
|
|
|
|
|
|
|
|
|
|
|
|
|
|
|
|
| |
Controlled by Getnet S.A. |
|
|
|
|
|
|
|
|
|
|
|
|
|
| |||
| Auttar HUT Processamento de Dados Ltda. (Auttar HUT) |
|
|
|
|
| Other Activities |
| - |
| 100.00% | ||||||
| Integry Tecnologia e Serviços A.H.U Ltda. (Integry Tecnologia) |
|
|
|
|
| Other Activities |
| - |
| 100.00% | ||||||
| Toque Fale Serviços de Telemarketing Ltda. (Toque Fale) |
|
|
|
|
| Other Activities |
| - |
| 100.00% | ||||||
| Controlled by Sancap |
|
|
|
|
|
|
|
|
|
|
|
|
|
| ||
| Santander Capitalização S.A. |
|
|
|
|
|
|
|
|
|
|
| Savings and annuities |
| - |
| 100.00% |
| Evidence Previdência S.A. |
|
|
|
|
|
|
|
|
| Social Securities |
| - |
| 100.00% | ||
| Controlled by Aymoré CFI | ||||||||||||||||
| Super Pagamentos e Administração de Meios Eletrônicos Ltda. (Super) (2) |
|
|
|
|
|
|
|
|
|
|
| Other Activities |
| - |
| 100.00% |
| Banco Olé Bonsucesso Consignado S.A. (Olé Consignado) (Current Company Name of Banco Bonsucesso Consignado)(3) |
|
|
| Bank |
| - |
| 60.00% | ||||||||
| Banco PSA Finance Brasil S.A.(6) |
|
|
| Bank |
| - |
| 50.00% | ||||||||
| Controlled by Olé Consignado (Current Company Name of Banco Bonsucesso Consignado) |
|
|
|
|
| |||||||||||
| BPV Promotora de Vendas e Cobrança Ltda. |
|
|
|
| Other Activities | - |
| 100.00% | ||||||||
| Bonsucesso Tecnologia Ltda (Current Company Name of BSI Informática Ltda.) |
|
|
| Other Activities |
| - |
| 100.00% | ||||||||
| Controlled by Santander Leasing |
|
|
|
|
|
|
|
| ||||||||
| Santander Finance Arrendamento Mercantil S.A (Current Company Name of PSA Finance Arrendamento Mercantil S.A)(6) |
|
|
| Leasing |
| - |
| 100.00% | ||||||||
| Controlled by Santander Participações |
|
|
|
|
|
|
|
|
|
|
|
| ||||
| BW Guirapá I S.A.(4) |
|
|
|
| Holding |
| - |
| 86.81% | |||||||
| Controlled by BW Guirapá I S.A.(4) |
|
|
|
|
|
|
|
|
|
| ||||||
| Central Eólica Angical S.A. (4) |
|
|
|
| Wind Energy |
| - |
| 100.00% | |||||||
| Central Eólica Caititu S.A.(4) |
|
|
|
| Wind Energy |
| - |
| 100.00% | |||||||
| Central Eólica Coqueirinho S.A.(4) |
|
|
|
| Wind Energy |
| - |
| 100.00% | |||||||
| Central Eólica Corrupião S.A.(4) |
|
|
|
| Wind Energy |
| - |
| 100.00% | |||||||
| Central Eólica Inhambu S.A.(4) |
|
|
|
| Wind Energy |
| - |
| 100.00% | |||||||
| Central Eólica Tamanduá Mirim S.A.(4) |
|
|
|
| Wind Energy |
| - |
| 100.00% | |||||||
| Central Eólica Teiu S.A.(4) |
|
|
|
| Wind Energy |
| - |
| 100.00% | |||||||
Participation % | |||||||||||||||||
Directly and Indirectly controlled by Banco Santander (Brasil) S.A. | Activity | Direct | Direct and Indirect | ||||||||||||||
| Santander FIC FI Contract I Referenciado DI |
|
|
|
|
| Investment Fund |
| - |
| (a) | ||||||
| Santander Fundo de Investimento Unix Multimercado Crédito Privado | Investment Fund |
| - |
| (a) | |||||||||||
| Santander Fundo de Investimento Diamantina Multimercado Crédito Privado de Investimento no Exterior | Investment Fund |
| - |
| (a) | |||||||||||
| Santander Fundo de Investimento Amazonas Multimercado Crédito Privado de Investimento no Exterior | Investment Fund |
| - |
| (a) | |||||||||||
| Santander Fundo de Investimento SBAC Referenciado DI Crédito Privado | Investment Fund |
| - |
| (a) | |||||||||||
| Santander Fundo de Investimento Guarujá Multimercado Crédito Privado de Investimento no Exterior | Investment Fund |
| - |
| (a) | |||||||||||
| Santander Fundo de Investimento Financial Curto Prazo | Investment Fund |
| - |
| (a) | |||||||||||
| Santander Fundo de Investimento Capitalization Renda Fixa | Investment Fund |
| - |
| (a) | |||||||||||
| Santander Paraty QIF PLC(5) | Investment Fund |
| - |
| (a) | |||||||||||
| Santander FI Hedge Strategies Fund(5) | Investment Fund |
| - |
| (a) | |||||||||||
| BRL V - Fundo de Investimento Imobiliário-FII(7) | Real Estate Investment Fund |
| - |
| (a) | |||||||||||
(a)Company over which the Bank is exposed, or has rights, to variable returns and have the ability to affect those returns through the power of decision, in accordance with IFRS 10 - Consolidated Financial Statements. Banco Santander and its subsidiaries holds 100% of the shares of these investment funds. | |||||||||||||||||
(1) In May, 2016, it was approved by Brazil Central Bank the authorization process for operation of the Company as a payment institution. | |||||||||||||||||
(2) On January 4, 2016, Aymoré CFI informed the owners of the shares representing the remaining 50% of Super Pagamentos total voting capital its decision to exercise the call option for the acquisition of such shares, for a value of approximately R$113 million. The transaction was concluded on March 10, 2016. (Note 4.b) | |||||||||||||||||
(3) At the ESM of March 3, 2016 was approved the change from the name of Banco Bonsucesso Consignado S.A. for Banco Olé Bonsucesso Consignado S.A., the change process has been approved by the Bacen on June 1, 2016. At the ESM of November 1, 2016, was approved the capital increase of Olé Consignado in the amount of R$50,000, from the current R$350,000 to R$400,000, throught the insuance of 28,509,708 new nominated ordinary shares, without nominal value. The process of the increase was approved by the Bacen in November 22, 2016. | |||||||||||||||||
(4) Investments transferred from the non-current assets held for sale caption in September, 2016 (Note 11). | |||||||||||||||||
(5) Banco Santander, through its subsidiaries, holds the risks and benefits of the Santander Paraty and the Sub-fund Santander FI Hedge Strategies, based in Ireland, and both are fully consolidated in its financial statements. The Irish market, an investment fund cannot act directly and, therefore, there was the need to create another structure (a sub-fund), Santander FI Hedge Strategies. The Santander Paraty has no equity position, and all derived position of the balance sheet of Santander FI Hedge Strategies. | |||||||||||||||||
(6) Investment acquired on August 1, 2016 (Note 4.e). | |||||||||||||||||
(7) This fund was established and became consolidated from August 2016. It is a structure where the Banco Santander figured as lender of certain debts (loans). The real object guarantee of said operations were converted into capital contributions by Fundo de Investimento Imobiliário, in conjunction concomitant transfer of the same shares to Banco Santander through dation process of payment of the above credit operations. | |||||||||||||||||
On July 14, 2016 it has completed the sales transaction of 100% of the shares representing the capital of Mantiq by Banco Santander and by Santander Participações to Angra Ventures Participações Ltda. | |||||||||||||||||
4. Change in the scope of consolidation | |||||||||||||||||
a) Sale of Santander Securities Services Brasil DTVM S.A. | |||||||||||||||||
On June 19, 2014, preliminary documents were executed containing the main terms and conditions related to the sale of the operation of qualified custody business, currently performed by Banco Santander, and all of the shares issued by Santander Securities Services Brasil Distribuidora de Títulos e Valores Mobiliários S.A. | |||||||||||||||||
On August 31, 2015 the sales transaction of the qualified custody business, with the sale of all shares of Santander Securities Services Brazil Distribuidora de Títulos e Valores Mobiliários S.A. to Santander Securities Services Brasil Participações S.A., indirectly controlled by Banco Santander Spain was concluded at the amount of R$859 million, according to was informed to the market on June 19, 2014. | |||||||||||||||||
The transaction generated a gain of R$750,550 before taxes, recorded in the caption Result on disposal of assets not classified as non-current assets held for sale. | |||||||||||||||||
The operation fits into the context of a global strategic partnership between Banco Santander Spain and a group led by Warburg Pincus LLC in qualified custody activity in Spain, Brazil and Mexico. | |||||||||||||||||
b) Investment in Super Pagamentos e Administração de Meios Eletrônicos Ltda. (“Super Pagamentos”) | |||||||||||||||||
On October 3, 2014, Aymoré CFI signed an investment agreement ("Agreement") with a view to make an investment in Super Pagamentos, which would result in the subscription and payment of new shares issued by Super, representing 50% of its total and voting capital. | |||||||||||||||||
The closing of the operation occurred on December 12, 2014 and was subject to completion of certain conditions precedent set forth in the Agreement, including the prior approval of the Central Bank (obtained on December 2, 2014). Aymoré CFI subscribed and paid share capital of Super Pagamentos in R$31,128, through the issuance of 20 million new common shares. | |||||||||||||||||
On January 4, 2016, Aymoré CFI informed the owners of the shares representing the remaining 50% of Super Pagamentos´ total voting capital its decision to exercise the call option for the acquisition of such shares, for a value of approximately R$113 million. The transaction was concluded on March 10, 2016. | |||||||||||||||||
Accordingly, Aymoré as the parent company purchased the remaining equity instruments of Super Pagamentos entity and should therefore consider the paid value of goodwill for expected future profitability as a reduction of shareholders' equity, since, according to the IFRS 10 this transaction is characterized as transactions between partners. For the same reason, the amount paid for the equity value of the interest participation acquired from non-controlling shareholder is a movement among Stockholders' Equity accounts. | |||||||||||||||||
c) Investment Agreement between Banco Santander and Banco Bonsucesso S.A. (Banco Bonsucesso) | |||||||||||||||||
On July 30, 2014 Banco Santander, through its controlled company Aymore CFI, and Banco Bonsucesso entered into an Investment Agreement whereby agreed to form an association in payroll credit card loan segment and payroll loans (Olé Consignado). | |||||||||||||||||
On February 10, 2015, with the approval of the BACEN, the transaction was completed and Banco Santander, through Aymoré CFI, became the controlling shareholder of Olé Consignado, with 60% of the total and voting capital through an investment of R$460 million. Banco Bonsucesso remained with the remaining portion of the share capital (40%). | |||||||||||||||||
In December 2015, it has completed the study of the allocation of the purchase price (Purchase Price Allocation - PPA) on the acquisition of Bonsucesso by Aymoré, based on acquisition date as below: | |||||||||||||||||
Book value | Fair value | ||||||||||||||||
Available-for-Sale Financial Assets | 121,468 |
| 121,468 | ||||||||||||||
Loans and Receivables |
|
|
|
|
|
|
|
|
|
|
| 508,147 |
| 508,147 | |||
Others Assets |
|
|
|
|
|
|
|
|
|
|
|
|
| 374,151 |
| 374,151 | |
Intangible Assets (1) |
|
|
|
|
|
|
|
|
|
|
|
|
| - |
| 62,000 | |
Total assets |
|
|
|
|
|
|
|
|
|
|
|
|
| 1,003,766 |
| 1,065,766 | |
Financial liabilities |
|
|
|
|
|
|
|
|
|
|
|
|
| 466,162 |
| 466,162 | |
Others liabilities |
|
|
|
|
|
|
|
|
|
|
|
|
| 397,604 |
| 397,604 | |
Total liabilities |
|
|
|
|
|
|
|
|
|
|
|
|
| 863,766 |
| 863,766 | |
Capital increase by Aymore CFI |
|
|
|
|
|
|
|
|
|
|
| 460,000 |
| 460,000 | |||
Total of net assets acquired |
|
|
|
|
|
|
|
|
|
|
| 600,000 |
| 662,000 | |||
Non-controlling interest(2) |
|
|
|
|
|
|
|
|
|
|
|
|
| 264,800 | |||
Total consideration transferred by Aymore to acquire control |
|
| 460,000 | ||||||||||||||
Goodwill(3) |
|
|
|
|
|
|
|
|
|
|
|
|
|
|
| 62,800 | |
(1) Intangible assets identified relate to brand and customer relationship with estimated useful life of 10 years and 4 years, respectively. | |||||||||||||||||
(2) Amount of non-controlling interests were measured at R$240 million as the proportional value of the net assets of the investee. | |||||||||||||||||
(3) Goodwill will be tax deductible under current legislation. | |||||||||||||||||
Olé Consignado has become the exclusive vehicle of Banco Bonsucesso and its affiliates for the payroll credit supply in Brazil and should consolidate existing payroll loans at Banco Santander and Banco Bonsucesso, in accordance with the association. Banco Santander will continue to originate from payroll loans through their own channels independently. | |||||||||||||||||
In the operation context, it was granted between institutions a put option (right of Olé Consignado to sell) and purchase (right of Banco Santander acquisition), relating to the shares held by Banco Bonsucesso, equivalent to 40% of capital of this company. According to IAS 32, it has recognized a financial liability for the amount of R$307 million by the commitment made in relation to the put option, accounted in Shareholders' Equity, the amount of R$67 million and non-controlling interests, the amount of R$240 million. | |||||||||||||||||
At the ESM occurred on March 3, 2016 the amendment of the corporate name of Banco Bonsucesso Consignado S.A. to Banco Olé Bonsucesso Consignado S.A. was approved, the process was approved by the Bacen on June 1, 2016 . | |||||||||||||||||
d) Partnership Formation with the Hyundai Group in Brazil | |||||||||||||||||
On April 28, 2016, the Aymoré CFI and Banco Santander entered into a transaction for the formation of a partnership with Hyundai Motor Brasil Montadora de Automóveis Ltda. (Hyundai Motor Brazil) and Hyundai Capital Services, Inc. (Hyundai Capital) for the constitution of Banco Hyundai Capital Brasil S.A. and an insurance brokerage company to provide, respectively, auto finance and insurance brokerage services and products to consumers and Hyundai dealerships in Brazil. The partnership capital structure will have a shareholding of 50% (fifty percent) of the Aymoré, 25% (twenty five percent) of Hyundai Capital and 25% (twenty five percent) of Hyundai Motor Brazil. The execution of the operation shall be subject to the fulfillment of certain conditions precedent usual in similar transactions, including obtaining the applicable regulatory approvals. | |||||||||||||||||
e) Agreement on the Acquisition, of part of the Financial Operation of PSA Group in Brazil and a consequent creation of a Joint Venture | |||||||||||||||||
On August 1, 2016, after the fulfillment of the applicable conditions precedent, including obtaining the appropriate regulatory approvals, the Aymoré CFI and Banco Santander, in the context of a partnership between the Banque PSA Finance (Banque PSA) and Santander Consumer Finance in Europe for joint operation of the vehicle financing business of PSA brands (Peugeot, Citroën and DS), signed definitive documents for the formation of a financial cooperation with Banque PSA to offer a range of financial and insurance products to consumers and dealers of PSA in Brazil. | |||||||||||||||||
The main vehicle of financial cooperation is Banco PSA Finance Brasil S.A. which is now held in the proportion of 50% by Aymoré CFI, a subsidiary of Banco Santander, and 50% by Banque PSA.. The purchase price was equal to the book value (proportional to the 50% acquired) on the closing date (08/01/2016). The operation also included the acquisition by Banco Santander subsidiary, 100% of Santander Finance Arrendamento Mercantil S.A. (Current Company Name of PSA Finance Arrendamento Mercantil S.A.), whose price was equivalent to 74% of the equity value on the closing date recording a bargain purchase gain, and also 50% of PSA Corretora de Seguros e Serviços Ltda., whose purchase price was equal to the book value (proportional) on the closing date. | |||||||||||||||||
Banco Santander started to consolidate these companies from August 1, 2016, considering its shareholder agreement over Santander Finance Arrendamento Mercantil S.A and majority holding in the other investments. | |||||||||||||||||
f) Merger of Getnet Tecnologia em Captura e Processamento de Transações H.U.A.H. S.A. (Getnet) into Getnet Adquirencia e Serviços para Meios de Pagamento S.A. (current corporate name of Santander Getnet) | |||||||||||||||||
Banco Santander announced to the market on April 7, 2014, the company's purchase of Getnet ("Transaction"), through its subsidiary SGS, partner of Banco Santander in the development of the activities of acquiring and processing debit and credit cards payments. | |||||||||||||||||
At the Extraordinary General Meeting occurred on July 31, 2014, the capital increase of SGS of R$1 million was approved, from the current R$16,000 to R$1,189,503 through the issuance of 54 million new common shares, nominative and without par value, fully subscribed and paid by Banco Santander as follows: R$1 million in local currency and R$17,240 in through the carrying amount, by Banco Santander of 5,300 common shares without par value issued by the iZettle do Brasil Meios de Pagamento S.A to the capital of SGS, which raised the share of Banco Santander from in Getnet S.A. 50.0% to 88.5%. | |||||||||||||||||
On July 31, 2014, SGS acquired all the shares of Getnet, the total price of R$1,156.3 million (R$1,089.1 million paid and R$67.2 million payable). At December 31, 2014, has completed the study of the allocation of the purchase price (Purchase Price Allocation - PPA), based on stockholders equity of July 31, 2014 and a summary of values is informed below: | |||||||||||||||||
Summary of values: | |||||||||||||||||
Stockholders’ Equity on July 31, 2014 | 42,895 | ||||||||||||||||
Added value of assets(1) | 74.064 | ||||||||||||||||
Adjusted accounting value | 116.959 | ||||||||||||||||
Purchase Price | 1,156,263 | ||||||||||||||||
Goodwill(2) | 1,039,304 | ||||||||||||||||
(1) Recorded under Tangible Assets. | |||||||||||||||||
(2) Goodwill is tax deductible under current legislation. | |||||||||||||||||
At the Extraordinary General Meeting occurred on August 31, 2014, it was approved the merger of Getnet by SGS, which had its name changed to "Getnet Adquirencia e Serviços para Meios de Pagamento S.A." (Getnet S.A.) under the "Private Instrument of Protocol and Justification of Merger of Getnet by Getnet Adquirencia e Serviços para Meios de Pagamento S.A. (Protocol) of August 29, 2014 (the Merger). | |||||||||||||||||
The implementation of the Merger represents an important step in the simplification, consolidation and integration of capture and processing of operations activities of electronic payments Group Santander in Brazil, allowing for the consolidation for all commercial, financial and accounting purposes. | |||||||||||||||||
By the Protocol, Getnet S.A. received the book value of all assets, rights and obligations of Getnet totaling R$42,895 which was extinguished and succeeded by Getnet S.A. in all their rights and obligations. In view that all the shares issued by Getnet are the property of Getnet S.A., there was no increase in the share capital of Getnet S.A. following the approval of the Merger, so the net assets of Getnet was registered in Getnet S.A. in return of the investment account. | |||||||||||||||||
The acquisition of Getnet and their incorporation by SGS enabled Getnet S.A. pass to consolidate all activities of acquiring and credit and debit cards payment processing, still subject to approval by the Bacen. | |||||||||||||||||
The context of the transaction, Banco Santander has granted to the minority shareholders of Getnet S.A. a put option over shares of Getnet S.A. held by them equivalent to 11.5% of the total capital of the company. As set out in IAS 32, was recognized for the commitment made, as counterpart to a specific account in stockholders' equity in the amount of R$950 million. | |||||||||||||||||
5. Cash and balances with the Brazilian Central Bank | |||||||||||||||||
| Thousands of Reais |
|
|
|
|
|
|
|
|
|
|
| 2016 |
| 2015 |
| 2014 |
| Cash and cash equivalents |
|
|
|
|
|
|
|
|
| 4,445,940 |
| 7,141,137 |
| 9,786,013 | ||
| of which: |
|
|
|
|
|
|
|
|
|
|
|
|
|
|
|
|
| Cash |
|
|
|
|
|
|
|
|
|
|
| 3,316,800 |
| 2,995,112 |
| 3,525,864 |
| Money market investments |
|
|
|
|
|
|
|
|
| 1,129,140 |
| 4,146,025 |
| 6,260,149 | ||
| Money market investments(1) |
|
|
|
|
|
|
|
|
| 45,242,674 |
| 27,170,892 |
| 16,212,907 | ||
| Central Bank compulsory deposits(2) |
|
|
|
|
|
|
| 60,916,297 |
| 54,831,324 |
| 29,904,928 | ||||
| Total |
|
|
|
|
|
|
|
|
|
|
| 110,604,911 |
| 89,143,353 |
| 55,903,848 |
(1) Includes securities purchased under agreements to resell, long term and not considered cash equivalents. | |||||||||||||||||
(2) Central Bank compulsory deposits relate to a minimum balance that financial institutions are required to maintain with the Central Bank of Brazil based on a percentage of deposits received from third parties, considered as restricted use of resources. | |||||||||||||||||
6. Loans and amounts due from credit institutions | |||||||||||||||||
The breakdown, by classification, type and currency, of the balances of “Loans and amounts due from credit institutions” in the consolidated balance sheets is as follows: | |||||||||||||||||
| Thousands of Reais |
|
|
|
|
|
|
|
|
| 2016 |
| 2015 |
| 2014 | ||
| Classification: |
|
|
|
|
|
|
|
|
|
|
|
|
|
|
|
|
| Loans and receivables |
|
|
|
|
|
|
|
|
| 27,762,473 |
| 42,422,638 |
| 28,917,397 | ||
| Of which: |
|
|
|
|
|
|
|
|
|
|
|
|
|
|
|
|
| Loans and amounts due from credit institutions, gross |
|
|
|
|
| 27,963,914 |
| 42,601,397 |
| 29,059,676 | ||||||
| Impairment losses (note 10.c) |
|
|
|
|
|
|
|
|
| (201,441) |
| (178,759) |
| (142,279) | ||
| Loans and amounts due from credit institutions, net |
|
|
|
|
| 27,762,473 |
| 42,422,638 |
| 28,917,397 | ||||||
| Loans and amounts due from credit institutions, gross |
|
|
|
|
| 27,963,914 |
| 42,601,397 |
| 29,059,676 | ||||||
|
|
|
|
|
|
|
|
|
|
|
|
|
|
|
|
|
|
| Thousands of Reais |
|
|
|
|
|
|
|
|
|
|
| 2016 |
| 2015 |
| 2014 |
| Type: |
|
|
|
|
|
|
|
|
|
|
|
|
|
|
|
|
| Applications in time deposits(2) |
|
|
|
|
|
|
|
|
| 2,070,151 |
| 3,626,514 |
| 4,818,894 | ||
| Reverse repurchase agreements(1) (2) |
|
|
|
|
|
|
|
|
| 848,096 |
| 152,870 |
| 2,407,741 | ||
| Escrow deposits |
|
|
|
|
|
|
|
|
|
|
| 9,836,300 |
| 9,493,169 |
| 8,170,504 |
| Cash and Foreign currency investments(2) |
|
|
|
|
|
|
| 13,194,923 |
| 24,057,973 |
| 12,398,350 | ||||
| Other accounts |
|
|
|
|
|
|
|
|
|
|
| 2,014,444 |
| 5,270,871 |
| 1,264,187 |
| Total |
|
|
|
|
|
|
|
|
|
|
| 27,963,914 |
| 42,601,397 |
| 29,059,676 |
|
|
|
|
|
|
|
|
|
|
|
|
|
|
|
|
|
|
| Currency: |
|
|
|
|
|
|
|
|
|
|
|
|
|
|
|
|
| Brazilian Real |
|
|
|
|
|
|
|
|
|
|
| 25,421,465 |
| 18,631,226 |
| 15,469,912 |
| US dollar |
|
|
|
|
|
|
|
|
|
|
| 1,658,980 |
| 23,607,170 |
| 12,180,659 |
| Euro |
|
|
|
|
|
|
|
|
|
|
| 779,314 |
| 323,053 |
| 1,371,277 |
| Pound sterling |
|
|
|
|
|
|
|
|
|
|
| 51,972 |
| 4,964 |
| 12,656 |
| Other currencies |
|
|
|
|
|
|
|
|
|
|
| 52,183 |
| 34,984 |
| 25,172 |
| Total |
|
|
|
|
|
|
|
|
|
|
| 27,963,914 |
| 42,601,397 |
| 29,059,676 |
(1) Collateralized by debt instruments. | |||||||||||||||||
(2) Includes R$13,683,641 (2015 - R$25,990,477 and 2014 - R$13,613,957), of short-term transactions and low risk of change in its value, considered cash equivalents. | |||||||||||||||||
Note 45-d contains a detail of the residual maturity periods of loans and receivables and of the related average interest rates. | |||||||||||||||||
7. Debt instruments | |||||||||||||||||
The breakdown, by classification, type and currency, of the balances of “Debt instruments” is as follows: | |||||||||||||||||
| Thousands of Reais |
|
|
|
|
|
|
|
|
|
|
| 2016 |
| 2015 |
| 2014 |
Classification: | |||||||||||||||||
| Financial assets held for trading |
|
|
|
|
|
|
|
|
| 59,994,946 |
| 25,193,598 |
| 47,106,811 | ||
| Other financial assets at fair value through profit or loss |
|
|
|
|
| 1,668,749 |
| 1,506,570 |
| 93,900 | ||||||
| Available-for-sale financial assets(2) |
|
|
|
|
|
|
|
|
| 55,829,572 |
| 67,103,274 |
| 73,510,698 | ||
| Held to maturity investments (2) |
|
|
|
|
|
|
|
|
| 10,048,761 |
| 10,097,836 |
| - | ||
| Loans and receivables(2) |
|
|
|
|
|
|
|
|
| 16,283,259 |
| 11,812,701 |
| - | ||
| Of which: |
|
|
|
|
|
|
|
|
|
|
|
|
|
|
|
|
| Loans and receivables - Debt Instruments |
|
|
|
|
|
|
| 17,838,162 |
| 11,957,161 |
| - | ||||
| Provision for impairment losses (impairment) |
|
|
|
|
|
|
| (1,554,903) |
| (144,460) |
| - | ||||
| Total |
|
|
|
|
|
|
|
|
|
|
| 143,825,287 |
| 115,713,979 |
| 120,711,409 |
|
|
|
|
|
|
|
|
|
|
|
|
|
|
|
|
|
|
| Type: |
|
|
|
|
|
|
|
|
|
|
|
|
|
|
|
|
| Government securities - Brazil(1) |
|
|
|
|
|
|
|
|
| 122,971,854 |
| 93,439,724 |
| 103,598,096 | ||
| Debentures and Promissory notes |
|
|
|
|
|
|
|
|
| 12,922,763 |
| 11,967,222 |
| 13,428,165 | ||
| Other debt securities |
|
|
|
|
|
|
|
|
|
|
| 7,930,670 |
| 10,307,033 |
| 3,685,148 |
| Total |
|
|
|
|
|
|
|
|
|
|
| 143,825,287 |
| 115,713,979 |
| 120,711,409 |
|
|
|
|
|
|
|
|
|
|
|
|
|
|
|
|
|
|
| Currency: |
|
|
|
|
|
|
|
|
|
|
|
|
|
|
|
|
| Brazilian Real |
|
|
|
|
|
|
|
|
|
|
| 134,037,665 |
| 109,836,568 |
| 114,257,666 |
| US dollar |
|
|
|
|
|
|
|
|
|
|
| 9,107,513 |
| 5,111,982 |
| 6,453,743 |
| Euro |
|
|
|
|
|
|
|
|
|
|
| 680,109 |
| 765,429 |
| - |
| Total |
|
|
|
|
|
|
|
|
|
|
| 143,825,287 |
| 115,713,979 |
| 120,711,409 |
(1) Includes, substantially, National Treasury Bills (LTN), Treasury Bills (LFT) e National Treasury Notes (NTN-A, NTN-B, NTN-C e NTN-F). | |||||||||||||||||
Transfer between categories(2) | |||||||||||||||||
In January 2014, the Bank made an issue of securities eligible to compose the capital of Tier I and Reference Equity (PR) Tier II, in the amount of US$2.5 billion (equivalent to R$6 billion) (Note 29.e). Aiming to mitigate the risk of interest rates in US dollars, it was made the purchase of assets indexed in this currency: NTN-A and Eurobonds issued by the federal government of Brazil and BNDES (acquired via Santander Cayman). Initially, these securities were classified as "Available-For-Sale Financial Assets - Debt instruments", and in July 1, 2015, were reclassified to "Held to maturity investments". On December 31, 2016 such securities amounted to R$10,048,761 (2015 - R$10,097,836). Banco Santander has the financial capacity and intention to hold to maturity securities classified as held-to-maturity. Additionally, were reclassified securities from "Available-For-Sale Financial Assets - Debt instruments" to "Loans and Receivables - Debt instruments". On December 31, 2016 such securities amounted to R$16,283,259 (2015 - R$11,812,701). | |||||||||||||||||
The fair value of this operation is R$10,555,437 (note 31) | |||||||||||||||||
Additionally, in the first quarter of 2016, due to the Banco Santander's strategy change, it was reclassified from Available Financial Assets for sale - Debt instruments to Loans and Receivables - Debt Instruments the total amount of R$4,562,869, meeting the required in IAS 39. | |||||||||||||||||
The transfers above comply with IAS 39. | |||||||||||||||||
| |||||||||||||||||
Note 45-d contains a detail of the residual maturity periods of available-for-sale financial assets and of loans and receivables and of the related average interest rates. | |||||||||||||||||
8. Equity instruments | |||||||||||||||||
a) Breakdown | |||||||||||||||||
The breakdown, by classification and type, of the balances of “Equity instruments” is as follows: | |||||||||||||||||
| Thousands of Reais |
|
|
|
|
|
|
|
|
|
|
| 2016 |
| 2015 |
| 2014 |
Classification: | |||||||||||||||||
| Financial assets held for trading |
|
|
|
|
|
|
|
|
| 398,461 |
| 404,973 |
| 391,656 | ||
| Other financial assets at fair value through profit or loss |
|
|
|
|
| 42,455 |
| 573,664 |
| 902,794 | ||||||
| Available-for-sale financial assets |
|
|
|
|
|
|
|
|
| 1,985,473 |
| 1,162,332 |
| 1,653,644 | ||
| Total |
|
|
|
|
|
|
|
|
|
|
| 2,426,389 |
| 2,140,969 |
| 2,948,094 |
|
|
|
|
|
|
|
|
|
|
|
|
|
|
|
|
|
|
| Type: |
|
|
|
|
|
|
|
|
|
|
|
|
|
|
|
|
| Shares of Brazilian companies |
|
|
|
|
|
|
|
|
| 1,185,653 |
| 1,168,186 |
| 1,338,776 | ||
| Shares of foreign companies |
|
|
|
|
|
|
|
|
| 3,588 |
| 11,445 |
| 8,401 | ||
| Investment fund units and shares(1) |
|
|
|
|
|
|
|
|
| 1,237,148 |
| 961,338 |
| 1,600,917 | ||
| Total |
|
|
|
|
|
|
|
|
|
|
| 2,426,389 |
| 2,140,969 |
| 2,948,094 |
(1) Comprised mainly by investing in stocks, which mainly correspond to investments in assets in the electricity segment and technology, which is consistent with the established rules and accounting practices. | |||||||||||||||||
b) Changes | |||||||||||||||||
The changes in the balance of “Equity instruments – Financial assets held for trading” were as follows: | |||||||||||||||||
| Thousands of Reais |
|
|
|
|
|
|
|
|
|
|
| 2016 |
| 2015 |
| 2014 |
| Balance at beginning of year |
|
|
|
|
|
|
|
|
| 404,973 |
| 391,656 |
| 477,577 | ||
| Net additions /disposals |
|
|
|
|
|
|
|
|
| (7,125) |
| 26,273 |
| (73,963) | ||
| Valuation adjustments |
|
|
|
|
|
|
|
|
|
| 613 |
| (12,956) |
| (11,958) | |
| Balance at end of year |
|
|
|
|
|
|
|
|
| 398,461 |
| 404,973 |
| 391,656 | ||
The changes in the balance of “Equity instruments – Other financial assets at fair value through profit or loss” were as follows: | |||||||||||||||||
| Thousands of Reais |
|
|
|
|
|
|
|
|
|
|
| 2016 |
| 2015 |
| 2014 |
| Balance at beginning of year |
|
|
|
|
|
|
|
|
| 573,664 |
| 902,794 |
| 1,192,334 | ||
| Net additions /disposals |
|
|
|
|
|
|
|
|
| (531,209) |
| (318,307) |
| (289,540) | ||
| Valuation adjustments |
|
|
|
|
|
|
|
|
|
| - |
| (10,823) |
| - | |
| Balance at end of year |
|
|
|
|
|
|
|
|
| 42,455 |
| 573,664 |
| 902,794 | ||
The changes in the balance of “Equity instruments – Available-for-sale financial assets” were as follows: | |||||||||||||||||
| Thousands of Reais |
|
|
|
|
|
|
|
|
|
|
| 2016 |
| 2015 |
| 2014 |
| Balance at beginning of year |
|
|
|
|
|
|
|
|
| 1,162,332 |
| 1,653,644 |
| 1,329,810 | ||
| Net additions /disposals |
|
|
|
|
|
|
|
|
| 852,820 |
| (482,406) |
| 307,917 | ||
| Valuation adjustments |
|
|
|
|
|
|
|
|
|
| (29,679) |
| (8,906) |
| 15,917 | |
| Balance at end of year |
|
|
|
|
|
|
|
|
| 1,985,473 |
| 1,162,332 |
| 1,653,644 | ||
9. Derivative financial instruments and Short positions | |||||||||||||||||
a) Trading and hedging derivatives | |||||||||||||||||
a.1) Derivatives Recorded in Memorandum and Balance sheets | |||||||||||||||||
Portfolio Summary of Trading Derivative and Used as Hedge | |||||||||||||||||
|
|
|
|
|
|
|
|
|
|
|
|
| 2016 |
| 2015 |
| 2014 |
Assets | |||||||||||||||||
| Swap Differentials Receivable |
|
|
|
|
|
|
|
|
| 15,321,646 |
| 22,312,106 |
| 5,538,082 | ||
| Option Premiums to Exercise |
|
|
|
|
|
|
|
|
| 935,520 |
| 895,684 |
| 628,851 | ||
| Forward Contracts and Others |
|
|
|
|
|
|
|
|
| 8,445,807 |
| 3,042,572 |
| 2,560,755 | ||
| Total |
|
|
|
|
|
|
|
|
|
|
| 24,702,973 |
| 26,250,362 |
| 8,727,688 |
|
|
|
|
|
|
|
|
|
|
|
|
|
|
|
|
|
|
Liabilities | |||||||||||||||||
| Swap Differentials Payable |
|
|
|
|
|
|
|
|
| 12,267,819 |
| 20,154,760 |
| 6,552,166 | ||
| Option Premiums Launched |
|
|
|
|
|
|
|
|
| 1,166,002 |
| 827,757 |
| 569,011 | ||
| Forward Contracts and Others |
|
|
|
|
|
|
|
|
| 6,802,794 |
| 3,734,442 |
| 2,057,085 | ||
| Total |
|
|
|
|
|
|
|
|
|
|
| 20,236,615 |
| 24,716,959 |
| 9,178,262 |
Summary by Category | ||||||||||||||||
Trading | 2016 |
| 2015 |
| 2014 | |||||||||||
Notional | Fair Value | Notional | Fair Value | Notional | Fair Value | |||||||||||
"Swap" |
|
|
|
|
| 381,238,135 |
| 3,142,125 |
| 611,162,351 |
| 3,221,966 |
| 569,872,773 |
| (332,734) |
Asset |
|
|
|
| 196,887,188 |
| 24,311,485 |
| 315,466,085 |
| 38,512,406 |
| 284,533,034 |
| 67,713,764 | |
CDI (InterBank Deposit Rates) | 44,868,680 |
| 22,759,822 |
| 38,808,344 |
| 9,081,792 |
| 70,772,781 |
| - | |||||
Fixed Interest Rate - Real | 126,300,261 |
| - |
| 200,528,046 |
| - |
| 83,317,134 |
| 67,425,070 | |||||
Indexed to Price and Interest Rates | 9,225,789 |
| - |
| 15,491,509 |
| 6,421,310 |
| 31,603,343 |
| 288,694 | |||||
Foreign Currency | 16,492,458 |
| 1,551,663 |
| 60,626,540 |
| 23,009,304 |
| 98,810,878 |
| - | |||||
Others | - |
| - |
| 11,646 |
| - |
| 28,898 |
| - | |||||
Liabilities | 184,350,947 |
| (21,169,360) |
| 295,696,266 |
| (35,290,440) |
| 285,339,739 |
| (68,046,498) | |||||
CDI (InterBank Deposit Rates) | 23,178,722 |
| - |
| 32,000,584 |
| - |
| 101,623,563 |
| (30,163,786) | |||||
Fixed Interest Rate - Real | 133,185,717 |
| (17,414,147) |
| 218,588,847 |
| (35,280,694) |
| 16,491,571 |
| - | |||||
Indexed to Price and Interest Rates | 12,767,212 |
| (3,518,297) |
| 6,930,103 |
| - |
| 31,118,848 |
| - | |||||
Foreign Currency | 15,049,776 |
| (38,836) |
| 38,176,732 |
| (9,746) |
| 136,072,590 |
| (37,879,212) | |||||
Others | 169,520 |
| (198,080) |
| - |
| - |
| 33,167 |
| (3,500) | |||||
Options | 175,841,405 |
| (230,482) |
| 91,877,351 |
| 67,927 |
| 240,746,222 |
| 59,840 | |||||
Purchased Position | 83,883,966 |
| 935,520 |
| 46,024,648 |
| 895,684 |
| 116,184,661 |
| 628,851 | |||||
Call Option - US Dollar | 12,693,748 |
| 181,463 |
| 5,018,652 |
| 665,655 |
| 3,942,457 |
| 331,533 | |||||
Put Option - US Dollar | 3,788,161 |
| 392,048 |
| 2,735,625 |
| 31,520 |
| 1,767,822 |
| 49,704 | |||||
Call Option - Other | 20,115,932 |
| 62,517 |
| 14,106,701 |
| 113,809 |
| 56,931,274 |
| 153,976 | |||||
InterBank Market | 17,391,500 |
| 7,062 |
| 13,114,822 |
| 93,435 |
| 51,308,444 |
| 118,061 | |||||
Others(1) | 2,724,432 |
| 55,455 |
| 991,879 |
| 20,374 |
| 5,622,830 |
| 35,915 | |||||
Put Option - Other | 47,286,125 |
| 299,492 |
| 24,163,670 |
| 84,700 |
| 53,543,108 |
| 93,638 | |||||
InterBank Market | 46,106,600 |
| 18,029 |
| 23,350,994 |
| 4,558 |
| 49,105,277 |
| 1,335 | |||||
Others(1) | 1,179,525 |
| 281,463 |
| 812,676 |
| 80,142 |
| 4,437,831 |
| 92,303 | |||||
Sold Position | 91,957,439 |
| (1,166,002) |
| 45,852,703 |
| (827,757) |
| 124,561,561 |
| (569,011) | |||||
Call Option - US Dollar | 4,314,988 |
| (141,172) |
| 3,331,244 |
| (596,729) |
| 4,239,625 |
| (428,681) | |||||
Put Option - US Dollar | 7,390,733 |
| (952,407) |
| 4,402,202 |
| (73,815) |
| 1,774,640 |
| (25,163) | |||||
Call Option - Other | 30,441,646 |
| (46,940) |
| 14,567,407 |
| (122,683) |
| 54,354,491 |
| (103,436) | |||||
InterBank Market | 27,597,764 |
| (4,087) |
| 13,730,262 |
| (112,707) |
| 53,571,293 |
| (72,078) | |||||
Others(1) | 2,843,882 |
| (42,853) |
| 837,145 |
| (9,976) |
| 783,198 |
| (31,358) | |||||
Put Option - Other | 49,810,072 |
| (25,483) |
| 23,551,850 |
| (34,530) |
| 64,192,805 |
| (11,731) | |||||
InterBank Market | 49,245,495 |
| (5,793) |
| 23,218,228 |
| (1,615) |
| 60,555,093 |
| (1,950) | |||||
Others(1) | 564,577 |
| (19,690) |
| 333,622 |
| (32,915) |
| 3,637,712 |
| (9,781) | |||||
|
|
|
|
|
|
|
|
|
|
|
|
|
|
|
| |
Futures Contracts | 104,651,180 |
| - |
| 184,191,204 |
| - |
| 302,239,388 |
| - | |||||
Purchased Position | 40,396,456 |
| - |
| 41,186,341 |
| - |
| 105,230,874 |
| - | |||||
Exchange Coupon (DDI) | 14,473,180 |
| - |
| 4,274,352 |
| - |
| 6,888,319 |
| - | |||||
Interest Rates (DI1 and DIA) | 23,756,523 |
| - |
| 22,760,484 |
| - |
| 94,307,498 |
| - | |||||
Foreign Currency | 1,393,538 |
| - |
| 11,710,934 |
| - |
| 3,897,223 |
| - | |||||
Indexes(2) |
|
|
|
|
| 195,160 |
| - |
| 577,149 |
| - |
| 137,834 |
| - |
Others |
|
|
|
|
| 578,055 |
| - |
| 1,863,422 |
| - |
| - |
| - |
Sold Position | 64,254,724 |
| - |
| 143,004,863 |
| - |
| 197,008,514 |
| - | |||||
Exchange Coupon (DDI) | 15,048,490 |
| - |
| 58,499,504 |
| - |
| 50,378,949 |
| - | |||||
Interest Rates (DI1 and DIA) | 29,047,678 |
| - |
| 20,836,314 |
| - |
| 57,355,214 |
| - | |||||
Foreign Currency | 17,384,256 |
| - |
| 35,463,589 |
| - |
| 15,845,107 |
| - | |||||
Indexes(2) | 185,506 |
| - |
| 500,993 |
| - |
| 8,418 |
| - | |||||
Treasury Bonds/Notes | 2,588,794 |
| - |
| 49,163 |
| - |
| 249,203 |
| - | |||||
Others | - |
| - |
| 27,655,300 |
| - |
| 73,171,623 |
| - | |||||
Forward Contracts and Others | 50,853,154 |
| 1,643,013 |
| 51,051,014 |
| (691,870) |
| 46,406,749 |
| 503,670 | |||||
Purchased Commitment | 20,864,170 |
| 3,386,347 |
| 21,570,405 |
| 3,028,038 |
| 20,552,988 |
| 270,611 | |||||
Currencies | 19,951,984 |
| 3,391,275 |
| 21,570,405 |
| 2,690,632 |
| 20,302,193 |
| 19,677 | |||||
Others | 912,186 |
| (4,928) |
| - |
| 337,406 |
| 250,795 |
| 250,934 | |||||
Sold Commitment | 29,988,984 |
| (1,743,334) |
| 29,480,609 |
| (3,719,908) |
| 25,853,761 |
| 233,059 | |||||
Currencies | 29,911,406 |
| (1,826,965) |
| 29,140,219 |
| (3,382,384) |
| 25,708,788 |
| 474,273 | |||||
Others | 77,578 |
| 83,631 |
| 340,390 |
| (337,524) |
| 144,973 |
| (241,214) | |||||
(1) Includes stock options, indices and commodities. | ||||||||||||||||
(2) Includes Bovespa index and S&P. | ||||||||||||||||
a.2) Derivatives Financial Instruments by Counterparty | ||||||||||||||||
Notional |
|
|
|
|
|
|
|
|
|
|
|
|
|
|
| 2016 |
Related | Financial | |||||||||||||||
Customers | Parties | Institutions(1) | Total | |||||||||||||
"Swap" |
|
|
|
|
|
|
|
|
| 43,082,605 |
| 15,910,871 |
| 137,893,712 |
| 196,887,188 |
Options |
|
|
|
|
|
|
|
|
| 5,916,105 |
| 839,182 |
| 169,086,118 |
| 175,841,405 |
Futures Contracts |
|
|
|
|
|
|
|
|
| - |
| - |
| 104,651,180 |
| 104,651,180 |
Forward Contracts and Others |
|
|
|
|
|
|
| 29,044,676 |
| 17,563,319 |
| 4,245,159 |
| 50,853,154 | ||
(1) Includes trades with the BM&FBovespa and other securities and commodities exchanges. | ||||||||||||||||
Notional |
|
|
|
|
|
|
|
|
|
|
|
|
| 2015 |
| 2014 |
Related | Financial | |||||||||||||||
Customers | Parties | Institutions(1) | Total | Total | ||||||||||||
"Swap" |
|
|
|
|
|
|
| 127,294,285 |
| 129,084,483 |
| 59,087,317 |
| 315,466,085 |
| 284,533,034 |
Options |
|
|
|
|
|
|
| 3,958,901 |
| 1,458,552 |
| 86,459,898 |
| 91,877,351 |
| 240,746,222 |
Futures Contracts |
|
|
|
|
|
|
| - |
| - |
| 184,191,204 |
| 184,191,204 |
| 302,239,388 |
Forward Contracts and Others |
|
|
|
|
| 32,603,287 |
| 15,172,977 |
| 3,274,750 |
| 51,051,014 |
| 46,406,749 | ||
(1) Includes trades with the BM&FBovespa and other securities and commodities exchanges. | ||||||||||||||||
a.3) Derivatives Financial Instruments by Maturity | ||||||||||||||||
|
|
|
|
|
|
|
|
|
|
|
|
|
|
|
|
|
Notional |
|
|
|
|
|
|
|
|
|
|
|
|
|
|
| 2016 |
Up to | From 3 to | Over | ||||||||||||||
3 Months | 12 Months | 12 Months | Total | |||||||||||||
"Swap" |
|
|
|
|
|
|
|
|
| 17,499,576 |
| 26,810,380 |
| 152,577,232 |
| 196,887,188 |
Options |
|
|
|
|
|
|
|
|
| 10,785,982 |
| 10,624,762 |
| 154,430,661 |
| 175,841,405 |
Futures Contracts |
|
|
|
|
|
|
|
|
| 66,298,799 |
| 16,041,642 |
| 22,310,739 |
| 104,651,180 |
Forward Contracts and Others |
|
|
|
|
|
|
| 28,235,186 |
| 17,826,727 |
| 4,791,241 |
| 50,853,154 | ||
Notional |
|
|
|
|
|
|
|
|
|
|
|
|
| 2015 |
| 2014 |
Up to | From 3 to | Over | ||||||||||||||
3 Months | 12 Months | 12 Months | Total | Total | ||||||||||||
"Swap" |
|
|
|
|
|
|
| 20,862,816 |
| 28,175,069 |
| 266,428,200 |
| 315,466,085 |
| 284,533,034 |
Options |
|
|
|
|
|
|
| 36,064,710 |
| 52,183,999 |
| 3,628,642 |
| 91,877,351 |
| 240,746,222 |
Futures Contracts |
|
|
|
|
|
|
| 59,763,763 |
| 92,346,365 |
| 32,081,076 |
| 184,191,204 |
| 302,239,388 |
Forward Contracts and Others |
|
|
|
|
| 26,545,840 |
| 16,772,668 |
| 7,732,506 |
| 51,051,014 |
| 46,406,749 | ||
a.4) Derivatives by Market Trading | ||||||||||||||||
|
|
|
|
|
|
|
|
|
|
|
|
|
|
|
|
|
Notional |
|
|
|
|
|
|
|
|
| Stock Exchange(1) |
|
|
| Over the Counter |
| 2016 |
Cetip(2) |
| Total | ||||||||||||||
"Swap" |
|
|
|
|
|
|
|
|
| 133,759,441 |
| 61,856,098 |
| 1,271,649 |
| 196,887,188 |
Options |
|
|
|
|
|
|
|
|
| 166,899,868 |
| 8,234,147 |
| 707,390 |
| 175,841,405 |
Futures Contracts |
|
|
|
|
|
|
|
|
| 104,651,180 |
| - |
| - |
| 104,651,180 |
Forward Contracts and Others |
|
|
|
|
|
|
| - |
| 35,427,573 |
| 15,425,581 |
| 50,853,154 | ||
(1) Includes trades with the BM&FBovespa and other securities and commodities exchanges. | ||||||||||||||||
(2) Includes amounts traded on other clearinghouses. | ||||||||||||||||
Notional |
|
|
|
|
|
|
| Stock Exchange(1) |
|
|
| Over the Counter |
| 2015 |
| 2014 |
Cetip(2) |
| Total | Total | |||||||||||||
"Swap" |
|
|
|
|
|
|
| 157,833,059 |
| 114,219,144 |
| 43,413,882 |
| 315,466,085 |
| 284,533,034 |
Options |
|
|
|
|
|
|
| 87,165,911 |
| 4,129,727 |
| 581,713 |
| 91,877,351 |
| 240,746,222 |
Futures Contracts |
|
|
|
|
|
|
| 184,191,204 |
| - |
| - |
| 184,191,204 |
| 302,239,388 |
Forward Contracts and Others |
|
|
|
|
| - |
| 33,428,467 |
| 17,622,547 |
| 51,051,014 |
| 46,406,749 | ||
(1) Includes trades with the BM&FBovespa and other securities and commodities exchanges. | ||||||||||||||||
(2) Includes amounts traded on other clearinghouses. | ||||||||||||||||
a.5) Derivatives Used as Hedge Instruments | |||||||||||||||||
Derivatives used as hedge by index are as follows: | |||||||||||||||||
Fair Value Hedge | |||||||||||||||||
Banco Santander’s fair value strategy consists of hedging exposure to changes in fair value in receivables and interest payments related to recognized assets and liabilities. | |||||||||||||||||
The adopted fair value management methodology segregates transactions by risk factor (e.g. Real/Dollar foreign exchange risk, fixed Reais interest rate risk, Dollar foreign exchange coupon risk, inflation risk, interest rate risk, etc.). The transactions generate exposures that are consolidated by risk factor and compared with internal pre-established limits. | |||||||||||||||||
In order to hedge against changes of fair value in receivables and interest payments, Santander uses interest rate Swap contracts related to pre-fixed assets and liabilities. | |||||||||||||||||
Banco Santander applies fair value hedges as follows: | |||||||||||||||||
• It contracts Foreign Currency + Coupon against % CDI swaps and designates them as a derivative instrument in a Hedge Accounting structure, having funding operations as the hedged item in this relationship, based on the instrument of Assumption of Foreign Currency Debt. The hedging relationships were designated in March 2015 and the related Swaps will mature between January 2017 and 2020. | |||||||||||||||||
• It contracts Foreign Currency + Coupon against % CDI swaps (sold jointly to the client) and designates them as a derivative instrument in a Hedge Accounting structure, having foreign currency loans as the hedged item in this relationship. The hedging relationships were designated in January 2016 and the related Swaps will mature between January 2017 and 2021. | |||||||||||||||||
• Banco Santander has a portfolio of Reais-indexed Assets traded in the Cayman Islands. In the Reais transaction, the value of the Dollar asset will be converted into Reais at the exchange rate in the contract on the date of recorded of the transaction. After the conversion, the principal, already denominated in Reais will be restated by % CDI or a pre-fixed rate. The Assets will be covered by Cross Currency Swaps in order to transfer the risk in Reais to LIBOR + Coupon. The hedging relationships were designated in October 2015 and the related Swaps will mature between March 2017 and 2021. | |||||||||||||||||
• Banco Santander has a portfolio of loan assets issued in foreign currency - Dollar at a fixed rate in the Balance Sheet of the “Santander EFC” (independent subsidiary in Spain), whose functional currency is the euro. In order to manage this mismatch, the Bank designates each Foreign Currency Floating EUR X Fixed Dollar swap as the fair value hedge of the corresponding loan. The hedging relationships were designated in 2013 and the related Swaps will mature between June 2017 and 2020. | |||||||||||||||||
• Banco Santander has a portfolio of private securities indexed to Brazilian inflation (IPCA and IGPM) combined with (IPCA or IGPM) + Coupon against CDI swaps; the Bank designates each Inflation + Coupon against CDI swap as the fair value hedge of the corresponding asset. The hedging relationships were designated between 2012 and 2015 and was matured June 2016. | |||||||||||||||||
• Santander has a portfolio of private securities in foreign currency combined with Foreign Currency + Coupon against CDI swaps; the Bank designates each Foreign Currency + Coupon against CDI swap as the fair value hedge of the corresponding asset. The hedging relationships were designated in 2011 and 2012 and was matured June 2016. | |||||||||||||||||
• Banco Santander has a portfolio of private securities indexed to the TJLP (Long-term Interest Term) combined with (TJLP) + Coupon against CDI swaps; the Bank designates each TJLP + Coupon against CDI swap as the fair value hedge of the corresponding asset. The hedging relationships were designated between 2012 and 2015 and was matured June 2016. | |||||||||||||||||
In order to assess the effectiveness and measure the ineffectiveness of the strategies, the institution complies with international accounting standard IAS 39, which requires that the effectiveness test be performed at the beginning (prospective test) of the hedge structure and be repeated periodically (prospective and retrospective tests) in order to demonstrate that the hedge ratio remains effective. | |||||||||||||||||
a) Prospective test:In accordance with the standard, the prospective test must be performed on the inception date and on a quarterly basis in order to demonstrate that the expectations regarding the effectiveness of the hedge ratio are high. | |||||||||||||||||
a.1) Initial prospective test (at inception): it is restricted to a qualitative review of the critical terms and conditions of the hedging instrument and the hedged item in order to conclude whether changes in the fair value of the two instruments are expected to fully offset each other. | |||||||||||||||||
a.2) Periodic prospective test:the sensitivity of the fair value of the hedged item and the hedging instrument will be periodically computed at a parallel variation of 10 basis points in the interest rate curve. For the purposes of effectiveness, these two sensitivity ratios should be between 80% and 125%. | |||||||||||||||||
b) Retrospective test:the retrospective effectiveness test will be performed by comparing the MTM change of the hedging instrument since the inception date with the MTM change of the hedged item since the inception date, excluding the transaction’s liquidity and credit spread: | |||||||||||||||||
In fair value hedges, gains or losses, both on hedging instruments and hedged items (attributable to the type of risk being hedged) are recognized directly in the consolidated statement of income. | |||||||||||||||||
|
|
|
|
|
|
|
|
|
|
| 12/31/2016 |
| 12/31/2015 | ||||
| Hedge Structure |
|
|
|
|
|
|
|
|
| Effective Portion Accumulated |
| Portion Ineffective |
| Effective Portion Accumulated |
| Portion Ineffective |
Fair Value Hedge |
|
|
| ||||||||||||||
| Debentures |
|
|
|
|
| - |
| - |
| 10,502 |
| - | ||||
| Eurobonds |
|
|
|
|
|
|
| 13,163 |
| - |
| 2,051 |
| - | ||
| NCE |
|
|
|
|
|
|
| - |
| - |
| 53,131 |
| - | ||
| Resolution 2770 |
|
|
|
|
| - |
| - |
| 35,338 |
| - | ||||
| Trade Finance Off |
|
|
|
|
| 20,471 |
| - |
| 11,046 |
| - | ||||
| Total |
|
|
|
|
|
| 33,634 |
| - |
| 112,068 |
| - | |||
|
|
|
|
|
|
| 2016 |
| 2015 |
| 2014 | ||||||
Adjustment | Adjustment | Adjustment | |||||||||||||||
to Market | Fair Value | to Market | Fair Value | to Market | Fair Value | ||||||||||||
| Hedge Instruments |
|
|
|
|
|
|
|
|
|
|
|
|
|
| ||
| Swap Contracts |
|
|
|
|
| (26,703) |
| (136,467) |
| (66,990) |
| 86,822 | (80,671) | (163,307) | ||
| Asset |
|
|
|
|
| 11,486 |
| 1,046,012 |
| 57,829 |
| 7,130,753 |
| 62,296 |
| 3,126,038 |
| CDI (InterBank Deposit Rates)(1) (2) (7) |
|
|
|
|
| - |
| - |
| 4,376 |
| 1,783,075 |
| 1,549 |
| 1,515,508 |
| Fixed Interest Rate - Real(2) |
|
|
|
|
| - |
| - |
| 27,184 |
| 3,549,659 |
| 707 |
| 492,912 |
| Indexed to Foreign Currency - Pre Dollar(7) |
|
|
|
|
| 1,103 |
| 17,678 |
| 790 |
| 94,472 |
| - |
| - |
| Indexed to Foreign Currency - USD/BRL - Dollar (3) |
|
|
|
|
| (8,957) |
| 744,260 |
| (10,904) |
| 665,025 |
| - |
| - |
| Indexed to Foreign Currency - Libor - Dollar(2) (4) (5) (7) |
|
|
|
|
| - |
| - |
| 1,962 |
| 612,623 |
| 10,850 |
| 352,587 |
| Indexed to Foreign Currency - Swiss Franc(5) |
|
|
|
|
| - |
| - |
| - |
| - |
| 2,628 |
| 339,980 |
| Indexed to Foreign Currency - Euro(7) |
|
|
|
|
| 19,340 |
| 284,074 |
| 34,347 |
| 390,156 |
| 46,092 |
| 400,066 |
| Indexed to Foreign Currency - Pre YEN (8) |
|
|
|
|
| - |
| - |
| 74 |
| 35,743 |
| 470 |
| 24,985 |
| Liabilities |
|
|
|
|
| (38,189) |
| (1,182,479) |
| (124,819) |
| (7,043,931) |
| (142,967) |
| (3,289,345) |
| Indexed to Foreign Currency - US Dollar (1)(7) |
|
|
|
|
| (14,958) |
| (323,197) |
| (55,892) |
| (1,082,503) |
| (82,987) |
| (1,155,573) |
| Indexed Indices of Prices and Interest(2) |
|
|
|
|
| - |
| - |
| (30,982) |
| (831,156) |
| (43,771) |
| (1,291,277) |
| Indexed to Foreign Currency - Pre Dollar(4) |
|
|
|
|
| (1,103) |
| (17,676) |
| - |
| - |
| (555) |
| (15,776) |
| CDI (InterBank Deposit Rates)(3) (5) |
|
|
|
|
| (18,395) |
| (804,059) |
| (12,298) |
| (3,279,438) |
| (900) |
| (26,875) |
| Indexed to Foreign Currency - Libor - US Dollar(6) (8) |
|
|
|
|
| - |
| - |
| (61) |
| (41,513) |
| (2,810) |
| (376,420) |
| Fixed Interest Rate - Real(7) |
|
|
|
|
| (3,733) |
| (37,547) |
| (25,586) |
| (1,809,321) |
| (11,944) |
| (423,424) |
Object of Hedge | |||||||||||||||||
| Assets |
|
|
|
|
| 23,165 |
| 693,132 |
| 110,003 |
| 3,103,783 |
| 119,205 |
| 2,296,907 |
| Loans and Receivables |
|
|
|
|
| 23,165 |
| 693,132 |
| 94,104 |
| 2,218,727 |
| 82,368 |
| 1,666,203 |
| Indexed to Foreign Currency - US Dollar |
|
|
|
|
| 4,809 |
| 323,780 |
| 42,348 |
| 1,295,383 |
| 46,947 |
| 954,266 |
| Indexed to Foreign Currency - Pre Dollar |
|
|
|
|
| - |
| - |
| - |
| - |
| (423) |
| 15,365 |
| Indexed Indices of Prices and Interest |
|
|
|
|
| - |
| - |
| 52,984 |
| 916,765 |
| 32,415 |
| 453,559 |
| CDI (InterBank Deposit Rates) |
|
|
|
|
| 13,253 |
| 331,805 |
| - |
| - |
| 600 |
| 25,110 |
| Fixed Interest Rate - Real |
|
|
|
|
| 5,103 |
| 37,547 |
| (1,228) |
| 6,579 |
| 2,829 |
| 217,903 |
| Debt instruments |
|
|
|
|
| - |
| - |
| 15,899 |
| 885,056 |
| 36,837 |
| 630,704 |
| CDI (InterBank Deposit Rates) |
|
|
|
|
| - |
| - |
| 10,578 |
| 503,415 |
| - |
| - |
| Fixed Interest Rate - Real |
|
|
|
|
| - |
| - |
| 5,321 |
| 381,641 |
| - |
| - |
| Available-for-Sale Securities - Debentures |
|
|
|
|
| - |
| - |
| - |
| - |
| 36,837 |
| 630,704 |
| Liabilities |
|
|
|
|
| 12,830 |
| (803,929) |
| (8,383) |
| (3,520,951) |
| (2,826) |
| (366,992) |
| Foreign Borrowings |
|
|
|
|
| 12,830 |
| (803,929) |
| (8,342) |
| (3,485,167) |
| - |
| - |
| Indexed to Foreign Currency - US Dollar |
|
|
|
|
| 12,830 |
| (803,929) |
| (8,342) |
| (3,485,167) |
| - |
| - |
| Marketable debt securities |
|
|
|
|
| - |
| - |
| (41) |
| (35,784) |
| (2,826) |
| (366,992) |
| Eurobonds |
|
|
|
|
| - |
| - |
| (41) |
| (35,784) |
| (2,826) |
| (366,992) |
(1) Instruments whose the hedge object are loans operations indexed in foreign currency - dollar with fair value R$323,780 (2015 - R$1,295,383 and 2014 - R$954,266) and on December 31, 2015 securities shown by debentures with fair value R$59,615 (2014 - R$82,819). | |||||||||||||||||
(2) On December 31, 2015, instruments whose hedge objects are indexed loans in price indices and interest amounted to R$916,765 (2014 - R$453,559) and instruments whose hedge object are securities shown by debentures with fair value R$443,800 (2014 - R$547,885). | |||||||||||||||||
(3) On December 31, 2014, instruments whose the hedge item are loans operations indexed in foreign currency fixed interest - US dollar with fair value R$15,365. | |||||||||||||||||
(4) Instruments whose the hedge item are loan operations indexed in CDI with fair value R$331,805 (2014 - R$25,110). | |||||||||||||||||
(5) On December 31, 2015, instruments whose hedge objects are obligations for securities abroad - Eurobonds with fair value R$35,784 (2014 - R$366,992). | |||||||||||||||||
(6) Instruments whose hedge objects are loans operations indexed pre fixed interest - Reais with a market value of R$37,547 (2015 - R$6,579 and 2014 - R$217,903). | |||||||||||||||||
(7) Instruments whose hedge objects are foreign loans operations indexed foreign currency - dollar with a market value of R$803,929 and on December 31, 2015, assets instruments whose objects of hedge are securities represented by promissory notes indexed to fixed interest rates - real with a market value of R$381,641. | |||||||||||||||||
(8)In June of 2016, the management decided to change the strategic position of the hedged items relating to loans and debentures operations: indexed to foreign currency dollar, foreign currency pre-dollar, price indexes and pre-real interest rate that no longer have hedge accounting and remained economic hedge, with effect on Income statements for the period an expense of R$12,102 net of tax. | |||||||||||||||||
Cash Flow Hedge | |||||||||||||||||
Banco Santander’s cash flow hedge strategies consist of hedging exposure to changes in cash flows, interest payments and the exchange rate, which are attributable to changes in the interest rates related to recognized assets and liabilities and changes in the exchange rate of non-recognized assets and liabilities. | |||||||||||||||||
Banco Santander applies cash flow hedges as follows: | |||||||||||||||||
• It contracts Fixed Dollar Liabilities and Reais Asset swaps and designates them as a derivative instrument in a Cash Flow Hedge structure, having Reais funding operations with third-parties in the Cayman Islands as the hedged item in this relationship. The hedging relationships were designated in January 2016 and the related hedges will mature between 2017 and 2021. | |||||||||||||||||
• It contracts Fixed Dollar Asset and Floating Reais Liability swaps and designates them as a derivative instrument in a Cash Flow Hedge structure, having floating-Reias-indexed loan operations with third-parties in the Cayman Islands as the hedged item in this relationship. The hedging relationships were designated in January 2016 and the related hedges will mature between January 2017 and 2021. | |||||||||||||||||
• It contracts USD futures or DDI + DI Futures (Synthetic Dollar Futures) and designates them as a derivative instrument in a Cash Flow Hedge structure, having part of its dollar Loan portfolio as the hedged item in this relationship. The hedging relationships were designated in 2007 and the related hedges will mature between January 2017 and 2025. | |||||||||||||||||
In order to assess the effectiveness and measure the ineffectiveness of these strategies, Banco Santander follows the IAS 39, which recommends that the hedge effectiveness test be performed at the inception/beginning (prospective test) of the hedge structure and be repeated periodically (prospective and retrospective tests) in order to demonstrate that the expected hedge ratio remains effective (between 80% and 125%). | |||||||||||||||||
In this hedge strategy the effectiveness tests (prospective and retrospective) are conducted through creation of two hypothetical derivatives, one for the object and another for the instrument. | |||||||||||||||||
The hypothetical derivative of the object is a conceptual swap where the liability leg simulates the “stable portion” to be protected and the asset leg is identical to the Pre-fixed leg of the derivative designated as hedge. For the hypothetical derivative of the instrument the asset leg will be set by the number of contracts of the future and the liability leg will be the pre-fixed rate negotiated on the acquisition of these contracts. The hypothetical derivative is stable once the contracts are kept until the maturity. | |||||||||||||||||
Any ineffectiveness will be recognized in profit or loss. | |||||||||||||||||
a) Prospective Test: in accordance with the standard, the prospective test should be performed on the inception date and on a quarterly basis in order to demonstrate that the expectations regarding the effectiveness of the hedge ratio are high. However, the tests are carried out on a monthly basis in order to monitor the projections in a proactive and more efficient manner, in addition to ensuring better maintenance of test-related routines. | |||||||||||||||||
a.1) Periodic Prospective Test:According to the agreed process flow, Market Risk performs the projections of three scenarios to the tests, being: 1st 10bps in the curve; 2nd 50bps in the curve and 3rd 100bps in the curve. Using the validated estimates, VPE Finance Strategy and Quality - Management Information | Products & Segments will perform the prospective tests through the valuation of the two legs variable from operation to market. | |||||||||||||||||
a.2) Initial Prospective Test:the methodology of the periodic prospective test should also be applied on the initial date of each new strategy. | |||||||||||||||||
The Ineffective portion will be recognized using the hedge prospective test. | |||||||||||||||||
Ineffective Portion = Prospective Effectiveness – 100% | |||||||||||||||||
b) Retrospective Test:It should be made monthly with historical data to demonstrate cumulatively that the hedge was effective, according to the methodology presented previously.Any ineffectiveness will be recognized in profit or loss. | |||||||||||||||||
The Ineffective portion will be recognized through the prospective hedge test. | |||||||||||||||||
Effectiveness should range between 80% and 125%. | |||||||||||||||||
In cash flow hedges, the effective portion of changes in the value of the hedging instrument is temporarily recognized in equity under “Other comprehensive income - cash flow hedges” until the expected transactions occur, when this portion is then recognized in the consolidated income statement. However, if the expected transactions result in the recognition of non-financial assets or liabilities, this portfolio will be included in the cost of financial assets or liabilities. The non-effective portion of the change in the value of foreign exchange hedging derivatives is recognized directly in the consolidated income statement. And the non-effective portion of gains and losses on cash flow hedging instruments in a foreign operation is recognized directly in “Gains (losses) with (net) financial assets and liabilities” in the consolidated income statement. | |||||||||||||||||
|
|
|
|
|
|
|
|
|
|
| 12/31/2016 |
| 12/31/2015 | ||||
| Hedge Structure |
|
|
|
|
|
|
|
|
| Effective Portion Accumulated |
| Portion Ineffective |
| Effective Portion Accumulated |
| Portion Ineffective |
Cash Flow Hedge |
| ||||||||||||||||
| Eurobonds |
|
|
|
|
|
|
| (20,535) |
| - |
| (29,750) |
| - | ||
| Loans and Receivables |
|
|
|
|
| 174,956 |
| - |
| (575,571) |
| - | ||||
| Total |
|
|
|
|
|
| 154,421 |
| - |
| (605,321) |
| - | |||
|
|
|
|
|
|
| 2016 |
| 2015 |
| 2014 | ||||||
Adjustment | Adjustment | Adjustment | |||||||||||||||
|
|
|
|
|
|
| to Fair Value |
| Fair Value |
| to Fair Value |
| Fair Value |
| to Fair Value |
| Fair Value |
Hedge Instruments | |||||||||||||||||
| Swap Contracts |
|
|
|
|
| (27,261) |
| 48,169 |
| (35,492) |
| (1,151,442) |
| (108,678) |
| (518,043) |
| Asset |
|
|
|
|
| 137,664 |
| 1,952,189 |
| 151,793 |
| 7,931,100 |
| 128,759 |
| 3,949,062 |
| Indexed to Foreign Currency - Swiss Franc (1) |
| - |
| - |
| 6,998 |
| 1,244,985 |
| 20,210 |
| 620,028 | ||||
| Indexed to Foreign Currency - Chile (2) |
| - |
| - |
| 1,622 |
| 302,907 |
| 4,624 |
| 105,428 | ||||
| Indexed in Reais(3) |
| - |
| - |
| (13,690) |
| 3,733,095 |
| (36,351) |
| 1,242,260 | ||||
| Indexed to Foreign Currency - Pre Dollar(4) (5) |
| 84,812 |
| 1,477,821 |
| 127,632 |
| 2,170,572 |
| 97,890 |
| 1,033,677 | ||||
| Indexed to Foreign Currency - Euro(6) |
| 52,852 |
| 474,368 |
| 29,231 |
| 479,541 |
| 42,386 |
| 947,669 | ||||
| Liabilities |
| (164,925) |
| (1,904,020) |
| (187,285) |
| (9,082,542) |
| (237,437) |
| (4,467,105) | ||||
| Deposit Certificate Interbank - CDI |
| (995) |
| (341,938) |
| - |
| - |
| - |
| - | ||||
| Indexed to Foreign Currency - Pre Dollar(1) (2) (3) (4) |
| - |
| - |
| (17,767) |
| (6,598,073) |
| (63,132) |
| (2,514,597) | ||||
| Indexed to Foreign Currency - Reais(4) |
| (1,288) |
| (199,954) |
| - |
| (22,855) |
| (15,444) |
| (120,394) | ||||
| Indexed to Foreign Currency - Pre Euro (4) |
| (102,998) |
| (805,326) |
| (133,376) |
| (1,851,822) |
| (108,193) |
| (767,424) | ||||
| Indexed to Foreign Currency - Dollar(5) |
| (59,367) |
| (548,684) |
| (34,379) |
| (544,339) |
| (40,440) |
| (528,305) | ||||
| Indexed to Foreign Currency - Reais(5) |
| (277) |
| (8,118) |
| (1,763) |
| (65,453) |
| (10,228) |
| (536,385) | ||||
|
|
|
|
|
|
|
|
|
|
|
|
| 2016 |
| 2015 |
| 2014 |
|
|
|
|
|
|
|
|
|
|
|
|
| Notional |
| Notional |
| Notional |
Hedge Instruments | |||||||||||||||||
Future Contracts | 80,149,530 | 72,798,063 | 16,053,248 | ||||||||||||||
Trade Finance Operations(6) |
|
|
|
|
|
|
| 80,149,530 |
| 72,798,063 |
| 16,053,248 | |||||
Foreign Currency - Dollar |
|
|
|
|
|
|
| 450,571 |
| 2,651,572 |
| 16,053,248 | |||||
Interest Rate (DI1 and DIA) |
|
|
|
|
|
|
| 46,314,644 |
| 34,303,028 |
| - | |||||
Interest Rate DDI1 |
|
|
|
|
|
|
| 33,384,315 |
| 35,843,463 |
| - | |||||
|
|
|
|
|
|
|
|
|
|
|
|
|
|
|
|
|
|
2016 | 2015 | 2014 | |||||||||||||||
Hedge Item - Cost | |||||||||||||||||
| Assets |
|
|
|
|
|
| 27,858,923 |
| 37,251,860 |
| 17,678,432 | |||||
| Lending Operations - Financing and Export Credit and Imports |
|
|
|
|
| 24,720,800 |
| 35,743,885 |
| 15,999,182 | ||||||
| Loans and Receivables |
|
|
|
|
|
|
| 496,874 |
| 641,421 |
| 1,023,468 | ||||
| Brazilian Foreign Debt Bonds |
|
|
|
|
|
|
| 701,300 |
| 866,554 |
| 655,782 | ||||
| Available for sale - Promissory Notes - NP |
|
|
|
|
|
| 1,939,949 |
| - |
| - | |||||
| Liabilities |
|
|
|
|
|
|
| (1,332,972) |
| (1,995,118) |
| (1,960,197) | ||||
| Foreign Borrowings |
|
|
|
|
|
| (1,332,972) |
| - |
| - | |||||
| Eurobonds |
|
|
|
|
|
| - |
| (1,995,118) |
| (1,960,197) | |||||
(1) On December 31, 2015, operations due April 12, 2016 (2014 - operations due March 4, 2015 and April 12, 2016), whose object of "hedging" transactions are Eurobonds. | |||||||||||||||||
(2) On December 31, 2015, operation due April 13, 2016 (2014 - operation due April 13, 2016), whose object of "hedge" is an operation of Eurobonds. | |||||||||||||||||
(3) On December 31, 2015, operation due March 18, 2016 (2014 - operations due March 18, 2015, September 18, 2015 and March 18, 2016), whose object of "hedge" is an operation of Eurobonds. | |||||||||||||||||
(4) Operation maturing on April 01, 2021 (2015 - operation due March 18, 2016 and April 1, 2021 and 2014 - operation due October 26, 2015 and April 1, 2021) which hedge objects its securities operation represented by Brazilian External Debt Bonds and loans operation. | |||||||||||||||||
(5) Operations maturing between January 2017 and December 2025 (2015 - operations maturing between August 2016 and June 2021 and 2014 - operations maturing between May, 2015 and June, 2021), whose objects "hedge "contracts are loans from lending institutions. | |||||||||||||||||
(6) Operation maturing between January 2017 and January 2018 (2015 - operation maturing between January 2016 and December 2024 and 2014 - operation maturing February 2, 2015) and the updated value of the instruments of R$29,164,917 (2015 - R$35,743,844 and 2014 - R$15,991,293), whose object of "hedge" are the loans - loan agreements and credit export and import. | |||||||||||||||||
Between July and September 2014 operations were contracted to hedge accounting of cash flow with the object of hedge Bank deposit certificates (CDB). In October, 2014 this structure was discontinued. The effect of marking to market the future contracts net of tax effects that will be recognized in income and is posted in equity corresponds to a credit of R$904,049 which will be amortized over the contract terms. | |||||||||||||||||
The effect of marking to market the swaps and future contracts corresponds to a credit in the amount of R$69,489 (2015 - corresponds to a debit in the amount of R$345,373 and 2014 - corresponds to a debit in the amount of R$77,261) accounted on Stockholders equity, net of tax effects. | |||||||||||||||||
Hedging of Foreign Investments | |||||||||||||||||
Banco Santander operates a branch in the Cayman Islands and a subsidiary called Santander Brasil Estabelecimento Financeiro de Credito, EFC, or “Santander EFC” (independent subsidiary in Spain), which are used mainly to raise funds in international funding and financial markets, to provide the Bank with credit lines that are extended to its customers to finance foreign trade and working capital. | |||||||||||||||||
In order to hedge against changes in future cash flows and the impact of the exchange rate on net investments in foreign operations, the Bank uses futures contracts traded at the BM&FBovespa, forward contracts and Spot contracts. | |||||||||||||||||
Santander EFC’s functional currency is the euro; however, the foreign exchange differences generated in the conversion of this investment into reais are recorded under “Other Comprehensive Income”. The Cayman Islands branch’s functional currency is Real. As a result, exchange rate differences of dollar operations are recorded in profit or loss. In order to cover the exchange rate exposure, the Bank uses derivatives. In accordance with the Brazilian tax rules, gains or losses arising from the impact of the appreciation or depreciation of the real on foreign investments are not taxable or deductible for PIS/COFINS/IR/CSLL purposes, while gains and losses from derivatives used as hedges are taxable. The objective of this derivative is to protect net income after taxes. Given that the exchange rate effects are not taxable or deductible and that the effect of the changes in said derivatives is taxed or deductible, the notional value of the contracted derivatives is higher than the value of the hedged net assets. | |||||||||||||||||
In the case of Santander EFC, the Bank uses Hedge Accounting. The changes in the value of derivatives and their tax effects are recorded in “Other Comprehensive Income”, offsetting the exchange rate changes caused by the conversion of the investment into reais when the hedging is effective. | |||||||||||||||||
The Bank does not use Hedge Accounting in the Cayman Islands branch. The foreign exchange variation of dollar operations and the effect of the derivatives used in economic hedging (futures contracts) are recorded in profit or loss. The special tax treatment of these foreign currency changes result in volatility in Operating Income (Loss) before Taxes and in “Income Taxes”. | |||||||||||||||||
The ineffective portion of gains and losses on hedging instruments of net investment in a foreign operation is recognized directly in “Gains(losses) with (net) financial assets and liabilities” in the consolidated income statement. | |||||||||||||||||
a) Prospective Test:in accordance with the standard, the prospective test should be performed on the inception date and on a quarterly basis in order to demonstrate that the expectations regarding the effectiveness of the hedge ratio are high. However, the tests are carried out on a monthly basis in order to monitor the projections in a proactive and more efficient manner, in addition to ensuring better maintenance of test-related routines. | |||||||||||||||||
a.1) Periodic Prospective Test:The prospective test will be performed comparing the sensitivity of the object with the sensitivity of the instrument to the exchange variation. The sensitivity will be calculated based on 3 scenarios with a 10%, 20% and 30% variation in the EUR / BRL exchange rate and the USD / BRL exchange rate. | |||||||||||||||||
a.2) Initial Prospective Test:the methodology of the periodic prospective test should also be applied on the initial date of each new strategy. | |||||||||||||||||
The Ineffective portion will be recognized using the hedge prospective test. | |||||||||||||||||
Ineffective Portion = Prospective Effectiveness – 100% | |||||||||||||||||
b) Retrospective Test: The retrospective test will be performed by comparing the cumulative exchange variation from the beginning of the designation of the object with the cumulative exchange variation of the hedging instrument. | |||||||||||||||||
The Ineffective portion will be recognized through the prospective hedge test. | |||||||||||||||||
Effectiveness should range between 80% and 125%. | |||||||||||||||||
Hedge of foreign investments, the effective portion of changes in the value of the hedging instrument is temporarily recognized in equity until the expected transactions occur, when this portion is then recognized in the consolidated income statement. However, if the expected transactions result in the recognition of non-financial assets or liabilities, this portfolio will be included in the cost of financial assets or liabilities. The non-effective portion of the change in the value of exchange rate hedging derivatives is recognized directly in the consolidated income statement. And the non-effective portion of gains and losses on cash flow hedging instruments in a foreign operation is recognized directly in “Gains (losses) with (net) financial assets and liabilities” in the consolidated income statement. | |||||||||||||||||
|
|
|
|
|
|
|
|
|
|
| 12/31/2016 |
| 12/31/2015 | ||||
| Hedge Structure |
|
|
|
|
|
|
|
|
| Effective Portion Accumulated |
| Portion Ineffective |
| Effective Portion Accumulated |
| Portion Ineffective |
Foreign investment |
| ||||||||||||||||
| Forward / Spot |
|
|
|
|
| 44,844 |
| - |
| 13,462 |
| - | ||||
| Total |
|
|
|
|
|
| 44,844 |
| - |
| 13,462 |
| - | |||
On December 31, 2016, the notional value of this Investment Hedge is R$2,687,347, maturing between January, 2017 to June, 2017 and the effect of R$2,552,596, of exchange rate changes recorded in equity, net of taxes. | |||||||||||||||||
a.6) Derivatives Pledged as Guarantee | |||||||||||||||||
The guarantee margin transactions traded on the BM&FBovespa using own and third-party derivatives is composed of government securities. | |||||||||||||||||
|
|
|
|
|
|
|
|
|
|
|
|
| 2016 |
| 2015 |
| 2014 |
|
|
| |||||||||||||||
Financial Treasury Bill - LFT |
|
|
|
|
|
|
| 1,556,804 |
| 330,605 |
| 1,135,366 | |||||
National Treasury Bill - LTN |
|
|
|
|
|
|
| 4,636,644 |
| 8,757,097 |
| 4,688,978 | |||||
National Treasury Notes - NTN |
|
|
|
|
|
|
| 27,598 |
| 757,969 |
| 1,763,751 | |||||
Total |
|
|
|
|
|
|
|
|
|
|
| 6,221,046 |
| 9,845,671 |
| 7,588,095 | |
b) Short positions | |||||||||||||||||
On December 31, 2016 the balance of short positions totaled R$31,694,269 (2015 - R$20,047,631 and 2014 - R$11,285,431) which includes the amount of financial liabilities resulting from the direct sale of financial assets purchased through resale or loan commitments. | |||||||||||||||||
10. Loans and advances to customers | |||||||||||||||||
a) Breakdown | |||||||||||||||||
The breakdown, by classification, of the balances of “Loans and advances to customers” in the consolidated balance sheets is as follows: | |||||||||||||||||
| Thousands of Reais |
|
|
|
|
| 2016 |
| 2015 |
| 2014 | ||||||
| |||||||||||||||||
| Loans and receivables |
|
|
|
|
|
|
|
|
| 252,002,774 |
| 252,033,449 |
| 235,690,349 | ||
| Of which: |
|
|
|
|
|
|
|
|
|
|
|
|
|
|
|
|
| Loans and receivables at amortized cost |
|
|
|
|
|
|
| 268,437,556 |
| 267,266,449 |
| 249,110,881 | ||||
| Provision for impairment losses (impairment) |
|
|
|
|
|
|
| (16,434,782) |
| (15,233,000) |
| (13,420,532) | ||||
| Loans and advances to customers, net |
|
|
|
|
|
|
| 252,002,774 |
| 252,033,449 |
| 235,690,349 | ||||
| Loans and advances to customers, gross |
|
|
|
|
|
|
| 268,437,556 |
| 267,266,449 |
| 249,110,881 | ||||
| Thousands of Reais |
|
|
| 2016 |
| 2015 |
| 2014 | ||||||||
Type: |
| ||||||||||||||||
| Loans operations(1) |
|
|
| 257,256,452 |
| 257,671,667 |
| 243,424,562 | ||||||||
| Lease Portfolio |
|
|
| 2,092,882 |
| 2,126,210 |
| 2,265,807 | ||||||||
| Repurchase agreements |
|
|
| 308,483 |
| 517,536 |
| 6,463 | ||||||||
| Other receivables(2) |
|
|
| 8,779,739 |
| 6,951,036 |
| 3,414,049 | ||||||||
| Total |
|
|
| 268,437,556 |
| 267,266,449 |
| 249,110,881 | ||||||||
(1) Includes loans and other loans with credit characteristics. | |||||||||||||||||
(2) Refer substantially to Exchange Operations and Other Receivables without characteristics of credit granting. | |||||||||||||||||
Note 45-d contains a detail of the residual maturity periods of loans and receivables and of the related average interest rates. | |||||||||||||||||
There are no loans and advances to customers for material amounts without fixed maturity dates. | |||||||||||||||||
b) Detail | |||||||||||||||||
Following is a detail, by loan type and status, borrower sector and interest rate formula, of the loans and advances to customers, which reflect the Bank’s exposure to credit risk in its core business, gross of impairment losses: | |||||||||||||||||
| Thousands of Reais |
|
|
|
|
|
|
|
|
| 2016 |
| 2015 |
| 2014 | ||
Loan borrower sector: | |||||||||||||||||
| Commercial, and industrial |
|
|
|
|
|
|
|
|
| 140,993,043 |
| 150,880,864 |
| 133,087,371 | ||
| Real estate-construction |
|
|
|
|
|
|
|
|
| 36,650,011 |
| 36,851,879 |
| 31,864,656 | ||
| Installment loans to individuals |
|
|
|
|
|
|
|
|
| 88,701,763 |
| 77,407,496 |
| 81,893,047 | ||
| Lease financing |
|
|
|
|
|
|
|
|
| 2,092,739 |
| 2,126,210 |
| 2,265,807 | ||
| Total(1) |
|
|
|
|
|
|
|
|
| 268,437,556 |
| 267,266,449 |
| 249,110,881 | ||
(1) It includes commercial credit, secured loans, reverse repurchase agreements, finance leases, other term loans and impaired assets. | |||||||||||||||||
Interest rate formula: | |||||||||||||||||
| Fixed interest rate |
|
|
|
|
|
|
|
|
| 178,231,509 |
| 173,018,504 |
| 172,649,313 | ||
| Floating rate |
|
|
|
|
|
|
|
|
| 90,206,047 |
| 94,247,945 |
| 76,461,568 | ||
| Total |
|
|
|
|
|
|
|
|
|
|
| 268,437,556 |
| 267,266,449 |
| 249,110,881 |
Debt Sector by Maturity | Less than 1 year | % of total | Between 1 and 5 years | % of total | More than 5 years | % of total | Total | % of total | |||||||||
Commercial and industrial |
| 99,657,167 |
| 61.65% |
| 35,789,118 |
| 45.10% |
| 5,546,758 |
| 20.23% |
| 140,993,043 |
| 52.52% | |
Real estate |
| 8,648,702 |
| 5.35% |
| 11,761,420 |
| 14.82% |
| 16,239,889 |
| 59.23% |
| 36,650,011 |
| 13.65% | |
Installment loans to individuals |
| 52,205,927 |
| 32.29% |
| 30,867,880 |
| 38.90% |
| 5,627,956 |
| 20.53% |
| 88,701,763 |
| 33.05% | |
Lease financing |
| 1,152,436 |
| 0.71% |
| 937,950 |
| 1.18% |
| 2,353 |
| 0.01% |
| 2,092,739 |
| 0.78% | |
Loans and advances to customers, gross | 161,664,232 |
| 100.00% |
| 79,356,368 |
| 100.00% |
| 27,416,956 |
| 100.00% |
| 268,437,556 |
| 100.00% | ||
|
|
|
|
|
|
| |||||||||||
| Thousands of Reais | 2016 | 2015 | 2014 | ||||||||||||||
Maturity | |||||||||||||||||
Less than 1 year |
|
|
|
|
|
|
|
|
| 161,664,232 |
| 116,555,381 |
| 150,953,694 | |||
Between 1 and 5 years |
|
|
|
|
|
|
|
|
| 79,356,369 |
| 104,563,829 |
| 79,939,575 | |||
More than 5 years |
|
|
|
|
|
|
|
|
| 27,416,955 |
| 46,147,239 |
| 18,217,612 | |||
Loans and advances to customers, gross |
|
|
|
|
|
|
| 268,437,556 |
| 267,266,449 |
| 249,110,881 | |||||
Internal risk classification | |||||||||||||||||
Low |
|
|
|
|
|
|
|
|
|
|
| 207,889,639 |
| 211,645,464 |
| 199,200,968 | |
Medium-low |
|
|
|
|
|
|
|
|
|
|
| 32,104,168 |
| 29,500,791 |
| 27,043,995 | |
Medium |
|
|
|
|
|
|
|
|
|
|
| 10,940,879 |
| 8,638,914 |
| 7,934,964 | |
Medium - high |
|
|
|
|
|
|
|
|
|
|
| 6,976,969 |
| 8,552,474 |
| 5,899,116 | |
High |
|
|
|
|
|
|
|
|
|
|
| 10,525,901 |
| 8,928,806 |
| 9,031,838 | |
Loans and advances to customers, gross |
| 268,437,556 |
| 267,266,449 |
| 249,110,881 | |||||||||||
c) Impairment losses | |||||||||||||||||
The changes in the allowances for the impairment losses on the balances of “Loans and receivables” were as follows: | |||||||||||||||||
| Thousands of Reais |
|
|
|
|
|
|
|
|
|
|
| 2016 |
| 2015 |
| 2014 |
| Balance at beginning of year |
|
|
|
|
|
|
|
|
| 15,411,759 |
| 13,562,811 |
| 13,640,545 | ||
| Impairment losses charged to income for the year |
|
|
|
|
|
|
| 14,383,935 |
| 13,723,179 |
| 12,048,587 | ||||
| Of which: |
|
|
|
|
|
|
|
|
|
|
|
|
|
|
|
|
| Commercial and industrial |
|
|
|
|
|
|
|
|
| 6,523,051 |
| 6,634,110 |
| 4,875,243 | ||
| Real estate-construction |
|
|
|
|
|
|
|
|
| 369,431 |
| 91,196 |
| 37,891 | ||
| Installment loans to individuals |
|
|
|
|
|
|
|
|
| 7,616,819 |
| 6,765,541 |
| 6,867,258 | ||
| Lease financing |
|
|
|
|
|
|
|
|
|
|
| (125,366) |
| 232,332 |
| 268,195 |
| Write-off of impaired balances against recorded impairment allowance |
| (11,604,568) |
| (11,874,231) |
| (12,126,321) | ||||||||||
| Of which: |
|
|
|
|
|
|
|
|
|
|
|
|
|
|
|
|
| Commercial and industrial |
|
|
|
|
|
|
|
|
| (4,553,166) |
| (4,953,324) |
| (4,493,800) | ||
| Real estate-construction |
|
|
|
|
|
|
|
|
| (189,625) |
| (77,412) |
| (96,715) | ||
| Installment loans to individuals |
|
|
|
|
|
|
|
|
| (6,810,997) |
| (6,621,809) |
| (7,336,858) | ||
| Lease financing |
|
|
|
|
|
|
|
|
|
|
| (50,780) |
| (221,686) |
| (198,948) |
| Balance at end of year |
|
|
|
|
|
|
|
|
| 18,191,126 |
| 15,411,759 |
| 13,562,811 | ||
| Of which: |
|
|
|
|
|
|
|
|
|
|
|
|
|
|
|
|
| Loans and advances to customers |
|
|
|
|
|
|
| 16,434,782 |
| 15,233,000 |
| 13,420,532 | ||||
| Loans and amounts due from credit institutions (Note 6) |
| 201,441 |
| 178,759 |
| 142,279 | ||||||||||
| Provision for Debt Instruments (Note 7) |
| 1,554,903 |
| - |
| - | ||||||||||
|
|
|
|
|
|
|
| ||||||||||
| Recoveries of loans previously charged off |
| 994,101 |
| 757,320 |
| 855,016 | ||||||||||
| Of which: |
|
|
|
|
|
| ||||||||||
| Commercial and industrial |
| 562,393 |
| 293,668 |
| 184,908 | ||||||||||
| Real estate-construction |
| 102,826 |
| 86,360 |
| 80,804 | ||||||||||
| Installment loans to individuals |
| 314,422 |
| 348,090 |
| 559,826 | ||||||||||
| Lease financing |
| 14,460 |
| 29,202 |
| 29,478 | ||||||||||
Taking into account these amounts recognized in “Impairment losses charged to income for the year” and the "Recoveries of loans previously charged off", the "Impairment losses on financial assets - Loans and receivables” amounted to R$13,389,834 in 2016, R$12,965,859 in 2015 and R$11,193,571 in 2014. | |||||||||||||||||
The balances of the provision for losses due to non-recovery by debtor sector are as follows: | |||||||||||||||||
| Thousands of Reais |
|
|
| 2016 |
| 2015 |
| 2014 | ||||||||
Commercial and industrial |
|
|
|
|
| 10,555,109 |
| 8,585,225 |
| 6,905,522 | |||||||
Real estate |
|
|
|
|
| 363,859 |
| 184,053 |
| 170,269 | |||||||
Installment loans to individuals |
|
|
|
|
| 7,225,822 |
| 6,420,000 |
| 6,275,183 | |||||||
Lease financing |
|
|
|
|
| 46,336 |
| 222,481 |
| 211,837 | |||||||
Total |
|
|
|
|
|
|
|
|
|
|
| 18,191,126 |
| 15,411,759 |
| 13,562,811 | |
d) Impaired assets | |||||||||||||||||
The detail of the changes in the balance of the financial assets classified as “Loans and receivables – loans and advances to customers” and considered to be impaired due to credit risk is as follows: | |||||||||||||||||
| Thousands of Reais |
|
|
| 2016 |
| 2015 |
| 2014 | ||||||||
| Balance at beginning of year |
|
|
|
|
| 18,599,379 |
| 14,011,225 |
| 14,021,777 | ||||||
| Net additions |
|
|
|
|
| 11,892,321 |
| 16,462,385 |
| 12,115,769 | ||||||
| Written-off assets |
|
|
|
|
| (11,604,568) |
| (11,874,231) |
| (12,126,321) | ||||||
| Balance at end of year |
|
|
|
|
| 18,887,132 |
| 18,599,379 |
| 14,011,225 | ||||||
Following is a detail of the financial assets considered to be impaired classified by age of the oldest past-due amount: | |||||||||||||||||
| Thousands of Reais |
|
|
|
|
|
|
|
|
|
|
| 2016 |
| 2015 |
| 2014 |
| With no Past-Due Balances or Less than 3 Months Past Due |
| 10,550,548 |
| 10,307,442 |
| 6,056,246 | ||||||||||
| With Balances Past Due by |
|
|
|
|
|
|
|
|
|
| ||||||
| 3 to 6 Months |
|
|
|
|
| 2,983,575 |
| 3,763,466 |
| 3,042,247 | ||||||
| 6 to 12 Months |
|
|
|
|
| 4,921,527 |
| 4,186,323 |
| 4,343,615 | ||||||
| 12 to 18 Months |
|
|
|
|
| 339,596 |
| 265,407 |
| 398,782 | ||||||
| 18 to 24 Months |
|
|
|
|
| 53,578 |
| 20,045 |
| 88,955 | ||||||
| More than 24 Months |
|
|
|
|
| 38,308 |
| 56,696 |
| 81,380 | ||||||
| Total |
|
|
|
|
|
|
|
|
|
|
| 18,887,132 |
| 18,599,379 |
| 14,011,225 |
Debt Sector | |||||||||||||||||
Commercial and industrial |
|
|
|
|
|
|
|
|
| 11,628,655 |
| 10,748,644 |
| 6,736,928 | |||
Real estate |
|
|
|
|
| 718,514 |
| 828,966 |
| 375,291 | |||||||
Installment loans to individuals |
|
|
|
|
| 6,487,717 |
| 6,970,241 |
| 6,838,576 | |||||||
Lease financing |
|
|
|
|
| 52,246 |
| 51,528 |
| 60,430 | |||||||
Total |
|
|
|
|
|
|
|
|
|
|
| 18,887,132 |
| 18,599,379 |
| 14,011,225 | |
e) Loan past due for less than 90 days but not classified as impaired | |||||||||||||||||
| Thousands of Reais |
| 2016 |
| % of total loans past due for less than 90 days |
| 2015 |
| % of total loans past due for less than 90 days |
| 2014 |
| % of total loans past due for less than 90 days | ||||
| Commercial and industrial |
| 4,141,349 |
| 23.79% |
| 5,072,197 |
| 24.27% |
| 4,579,622 |
| 23.20% | ||||
| Mortgage loans |
|
|
|
|
| 5,201,709 |
| 29.88% |
| 7,551,584 |
| 36.13% |
| 6,095,965 |
| 30.88% |
| Installment loans to individuals |
| 7,957,294 |
| 45.71% |
| 8,235,699 |
| 39.40% |
| 8,974,454 |
| 45.45% | ||||
| Financial Leasing |
|
| 108,607 |
| 0.62% |
| 41,013 |
| 0.20% |
| 93,035 |
| 0.47% | |||
| Total(1) |
|
|
|
|
| 17,408,959 |
| 100.00% |
| 20,900,493 |
| 100.00% |
| 19,743,076 |
| 100.00% |
| (1) Refers only to loans past due between 1 and 90 days. | ||||||||||||||||
f) Lease at present value | |||||||||||||||||
As at December 31, 2016, 2015 and 2014 there were no material agreements for lease contracts. | |||||||||||||||||
Breakdown by maturity | |||||||||||||||||
Gross investment in lease transactions | |||||||||||||||||
| Thousands of Reais |
|
|
| 2016 |
| 2015 |
| 2014 | ||||||||
| Overdue |
|
|
|
|
|
|
|
|
|
|
| 16,051 |
| 21,127 |
| 35,292 |
| Due to: |
|
|
|
|
|
|
|
|
|
|
|
|
|
|
|
|
| Up to 1 year |
|
|
|
|
|
|
|
|
|
|
| 1,207,473 |
| 1,241,798 |
| 1,270,897 |
| From 1 to 5 years |
|
|
|
|
| 1,190,844 |
| 1,184,418 |
| 1,263,873 | ||||||
| Over 5 years |
|
|
|
|
| 4,079 |
| 6,078 |
| 7,413 | ||||||
| Total |
|
|
|
|
|
|
|
|
|
|
| 2,418,447 |
| 2,453,421 |
| 2,577,475 |
g) Transfer of financial assets with retention of risks and benefits | |||||||||||||||||
In December 31, 2016, the amount recorded on “Loans and advances to customers” related to loan portfolio assigned is R$783,967 (2015 - R$202,113 and 2014 - R$262,515), and R$774,673 (2015 - R$190,333 and 2014 - R$242,024) of “Other financial liabilities - Financial Liabilities Associated with Assets Transfer”. | |||||||||||||||||
The foregoing transfer was conducted with a recourse clause and the mandatory repurchase is provided for in the following events: | |||||||||||||||||
- agreements in default for longer than 90 consecutive days; | |||||||||||||||||
- agreements under renegotiation; | |||||||||||||||||
- agreements subject to novation pursuant to Resolution 3,401 of the Brazilian Monetary Council (CMN); | |||||||||||||||||
- agreements subject to rights of intervention by certain parties to the contract. | |||||||||||||||||
11. Non-current assets held for sale | |||||||||||||||||
At December 31, 2016, 2015 and 2014, the total amount of non-current assets held for sale includes foreclosed assets and other tangible assets. The change in the "Non-current assets held for sale" is as follows: | |||||||||||||||||
| Thousands of Reais |
|
|
|
|
|
|
|
|
|
|
| 2016 |
| 2015 |
| 2014 |
| Balance at beginning of year |
|
|
|
|
|
|
|
|
| 1,310,033 |
| 978,274 |
| 324,412 | ||
| Foreclosures loans |
|
|
| 834,903 |
| 293,440 |
| 337,840 | ||||||||
| Capital Increase in Companies held for sale |
|
|
| 10,462 |
| 355,538 |
| - | ||||||||
| Change in the scope of consolidation(1) (4) |
|
|
| (497,847) |
| - |
| 418,846 | ||||||||
| Sales(2) |
|
|
| (239,291) |
| (317,321) |
| (102,850) | ||||||||
| Others |
|
|
|
|
|
|
|
|
|
|
| 48 |
| 102 |
| 26 |
| Final balance, gross(3) |
|
|
| 1,418,308 |
| 1,310,033 |
| 978,274 | ||||||||
| Impairment losses |
|
|
| (80,423) |
| (72,540) |
| (48,326) | ||||||||
| Impairment as a percentage of foreclosed assets |
|
|
| 5.67% |
| 5.54% |
| 4.94% | ||||||||
| Balance at end of year |
|
|
|
|
|
|
|
|
| 1,337,885 |
| 1,237,493 |
| 929,948 | ||
(1) On September 30, 2014 based on the sale plan, investments in Wind Energy entities were transferred to this heading whose current condition is for sale; as approved by the Directors of Banco Santander, in compliance with required by IFRS 5. | |||||||||||||||||
(2) In 2015, refers mainly to the sale by Santander Participações S.A. of all of its interest in Santos Energia and its subsidiaries, and the Special Purpose Entities Gestamp Eólica Sierra de Santana S.A., Gestamp Eólica Paraíso S.A., Gestamp Eólica Lanchinha S.A., Gestamp Eólica Seridó S.A. and Gestamp Eólica Lagoa Nova S.A. In 2014, includes sale of administrative buildings. | |||||||||||||||||
(3) Refers mainly to buildings and vehicles arising from executions of loans. | |||||||||||||||||
(4) On September 30, 2016, due to no expectation of sale of this investment by the current market situation, management decided to transfer the total of this balance, to caption investments in affiliates and subsidiaries in the country (Note 2). | |||||||||||||||||
12. Investments in associates and joint ventures | |||||||||||||||||
Jointly controlled | |||||||||||||||||
Banco Santander considers investments classified as jointly controlled: when they possess a shareholders' agreement, which sets the strategic financial and operating decisions require the unanimous consent of all investors. | |||||||||||||||||
Significant Influence | |||||||||||||||||
Banco Santander considers investments classified as significant influence over the associates who have indication of board members. | |||||||||||||||||
a) Breakdown | |||||||||||||||||
|
|
|
|
|
|
|
|
|
|
|
|
|
|
| Participation % | ||
| Jointly Controlled by Banco Santander | Activity | Country | 2016 | 2015 | 2014 | |||||||||||
| Banco RCI Brasil S.A. (Current Company Name of RCI Brasil Leasing) (5) |
| Financial |
| Brazil |
| 39.89% |
| 39.89% |
| 39.89% | ||||||
| Norchem Participações e Consultoria S.A.(1) |
| Other Activities |
| Brazil |
| 50.00% |
| 50.00% |
| 50.00% | ||||||
| Cibrasec - Companhia Brasileira de Securitização(1) (7) |
| Securitization |
| Brazil |
| 9.72% |
| 13.64% |
| 13.64% | ||||||
| Estruturadora Brasileira de Projetos S.A. - EBP(1) |
| Other Activities |
| Brazil |
| 11.11% |
| 11.11% |
| 11.11% | ||||||
| Campo Grande Empreendimentos | Other Activities |
| Brazil |
| 25.32% |
| 25.32% |
| - | |||||||
|
|
|
|
|
|
|
|
|
|
|
|
|
|
|
|
|
|
| Jointly Controlled by Santander S.A. Serviços Técnicos, Administrativos e de Corretagem de Seguros (Santander Serviços) | ||||||||||||||||
| Webmotors S.A.(3) (9) |
|
| Other Activities |
| Brazil |
| 70.00% |
| 70.00% |
| 70.00% | |||||
| Tecnologia Bancária S.A. - TECBAN(1)(4) |
| Other Activities |
| Brazil |
| 19.81% |
| 19.81% |
| 19.81% | ||||||
|
|
|
|
|
|
|
|
|
|
|
|
|
|
|
|
|
|
| Jointly Controlled by Getnet S.A. | ||||||||||||||||
| iZettle do Brasil Meios de Pagamento S.A. ("iZettle do Brasil”) (6) |
| Other Activities |
| Brazil |
| - |
| 50.00% |
| 50.00% | ||||||
|
|
|
|
|
|
|
|
|
|
|
|
|
|
|
|
|
|
Jointly Controlled by Santander Participações S.A. | |||||||||||||||||
| PSA Corretora de Seguros e Serviços Ltda.(8) | Insurance Broker |
| Brazil |
| 50.00% |
| - |
| - | |||||||
|
|
|
|
|
|
|
|
|
|
|
|
|
|
|
|
|
|
| Significant Influence of Banco Santander |
|
|
|
|
|
|
|
|
| |||||||
| Norchem Holding e Negócios S.A.(1) | Other Activities |
| Brazil |
| 21.75% |
| 21.75% |
| 21.75% | |||||||
|
|
|
|
|
|
|
|
|
|
|
| Investments |
|
| ||||||||
|
|
|
|
|
|
|
|
|
|
|
| 2016 |
| 2015 |
| 2014 | ||||||
Jointly Controlled by Banco Santander |
|
|
|
|
|
| 578,761 |
| 567,367 |
| 545,110 | |||||||||||
Banco RCI Brasil S.A.(5) |
|
|
|
|
|
|
|
|
| 538,756 |
| 526,680 |
| 502,894 | ||||||||
Norchem Participações e Consultoria S.A.(1) |
|
|
|
|
| 26,302 |
| 23,665 |
| 23,739 | ||||||||||||
Cibrasec - Companhia Brasileira de Securitização(1) (7) |
|
|
| 7,435 |
| 10,325 |
| 10,236 | ||||||||||||||
Estruturadora Brasileira de Projetos S.A. - EBP(1) |
|
|
|
|
| 6,268 |
| 6,697 |
| 8,241 | ||||||||||||
|
|
|
|
|
|
|
|
|
|
|
|
|
|
|
|
| ||||||
Jointly Controlled by Santander S.A. Serviços Técnicos, Administrativos e de Corretagem de Seguros (Santander Serviços) | 389,678 |
| 476,640 |
| 458,444 | |||||||||||||||||
Webmotors S.A.(3) (9) |
|
|
|
|
|
|
|
|
| 246,965 |
| 339,899 |
| 327,615 | ||||||||
Tecnologia Bancária S.A. - TECBAN(1) (4) |
|
|
|
|
| 142,713 |
| 136,741 |
| 130,829 | ||||||||||||
|
|
|
|
|
|
|
|
|
|
|
|
|
|
|
|
| ||||||
Jointly Controlled by Santander Participações S.A |
|
|
|
|
| 658 |
| - |
| - | ||||||||||||
PSA Corretora de Seguros e Serviços Ltda.(8) |
|
|
|
|
| 658 |
| - |
| - | ||||||||||||
|
|
|
|
|
|
|
|
|
|
|
|
|
|
|
|
| ||||||
Jointly Controlled by Getnet S.A. |
|
|
|
|
|
|
| - |
| (2,768) |
| 491 | ||||||||||
iZettle do Brasil(6) |
|
|
|
|
|
|
|
|
| - |
| (2,768) |
| 491 | ||||||||
|
|
|
|
|
|
|
|
|
|
|
|
|
|
|
|
| ||||||
Significant Influence of Banco Santander |
|
|
|
|
| 20,980 |
| 19,504 |
| 19,416 | ||||||||||||
Norchem Holding e Negócios S.A.(1) |
|
|
|
|
|
|
| 20,980 |
| 19,504 |
| 19,416 | ||||||||||
Total |
|
|
|
|
|
|
|
|
|
|
| 990,077 |
| 1,060,743 |
| 1,023,461 | ||||||
|
|
|
|
|
|
|
|
|
|
|
|
|
|
|
|
| ||||||
|
|
|
|
|
|
|
|
|
|
|
|
|
| Results of Investments | ||||||||
|
|
|
|
|
|
|
|
|
|
|
| 1/01 to 12/31/2016 | 1/01 to 12/31/2015 | 1/01 to 12/31/2014 | ||||||||
Jointly Controlled by Banco Santander |
|
|
|
|
|
| 16,748 |
| 85,993 |
| 49,094 | |||||||||||
Banco RCI Brasil S.A.(5) |
|
|
|
|
|
|
|
|
| 14,175 |
| 85,221 |
| 54,414 | ||||||||
Norchem Participações e Consultoria S.A.(1) |
|
|
|
|
| 2,637 |
| 1,976 |
| 4,434 | ||||||||||||
Cibrasec - Companhia Brasileira de Securitização(1) (7) |
|
|
| 366 |
| 340 |
| 179 | ||||||||||||||
Estruturadora Brasileira de Projetos S.A. - EBP(1) |
|
|
|
|
| (430) |
| (1,544) |
| (2,768) | ||||||||||||
BW Guirapá I S.A.(2) |
|
|
|
|
|
|
|
|
| - |
| - |
| (7,165) | ||||||||
|
|
|
|
|
|
|
|
|
|
|
|
|
|
|
|
| ||||||
Jointly Controlled by Santander Serviços |
|
|
|
|
| 28,990 |
| 29,309 |
| 40,823 | ||||||||||||
Webmotors S.A.(3) (9) |
|
|
|
|
|
|
|
|
| 23,019 |
| 23,397 |
| 21,539 | ||||||||
Tecnologia Bancária S.A. - TECBAN (1) (4) |
|
|
|
|
| 5,971 |
| 5,912 |
| 19,284 | ||||||||||||
|
|
|
|
|
|
|
|
|
|
|
|
|
|
|
|
| ||||||
Jointly Controlled by Santander Participações S.A |
|
|
|
|
| 548 |
| - |
| - | ||||||||||||
PSA Corretora de Seguros e Serviços Ltda.(8) |
|
|
|
|
| 548 |
| - |
| - | ||||||||||||
|
|
|
|
|
|
|
|
|
|
|
|
|
|
|
|
| ||||||
Jointly Controlled by Getnet S.A. |
|
|
|
|
|
|
| (225) |
| (491) |
| (1,779) | ||||||||||
iZettle do Brasil(6) |
|
|
|
|
|
|
|
|
| (225) |
| (491) |
| (1,779) | ||||||||
|
|
|
|
|
|
|
|
|
|
|
|
|
|
|
|
| ||||||
Significant Influence of Banco Santander |
|
|
|
|
| 1,476 |
| 1,501 |
| 2,958 | ||||||||||||
Norchem Holding e Negócios S.A.(1) |
|
|
|
|
|
|
| 1,476 |
| 1,501 |
| 2,958 | ||||||||||
Total |
|
|
|
|
|
|
|
|
|
|
| 47,537 |
| 116,312 |
| 91,096 | ||||||
|
|
|
|
|
|
|
|
|
|
|
|
|
|
|
|
| ||||||
|
|
|
|
|
|
|
|
|
|
|
|
|
|
|
| 2016 | ||||||
|
|
|
|
|
|
|
|
|
|
|
| Total assets |
| Total liabilities | Total profit(11) | |||||||
Jointly Controlled by Banco Santander |
|
|
|
|
|
|
|
|
| 8,831,611 |
| 7,318,656 |
| 89,544 | ||||||||
Banco RCI Brasil S.A.(5) |
|
|
|
|
|
|
|
|
| 8,603,844 |
| 7,276,320 |
| 79,223 | ||||||||
Norchem Participações e Consultoria S.A.(1) |
|
|
|
|
| 78,833 |
| 26,228 |
| 5,274 | ||||||||||||
Cibrasec - Companhia Brasileira de Securitização(1) (7) |
|
|
| 91,083 |
| 14,659 |
| 7,011 | ||||||||||||||
Estruturadora Brasileira de Projetos S.A. - EBP(1) |
|
|
|
|
| 57,851 |
| 1,449 |
| (1,964) | ||||||||||||
|
|
|
|
|
|
|
|
|
|
|
|
|
|
|
|
| ||||||
Jointly Controlled by Santander Serviços |
|
|
|
|
| 1,456,444 |
| 940,962 |
| 57,502 | ||||||||||||
Webmotors S.A.(3) (9) |
|
|
|
|
|
|
|
|
| 145,499 |
| 35,231 |
| 29,934 | ||||||||
Tecnologia Bancária S.A. - TECBAN (1) (4) |
|
|
|
|
| 1,310,945 |
| 905,731 |
| 27,568 | ||||||||||||
|
|
|
|
|
|
|
|
|
|
|
|
|
|
|
|
| ||||||
Jointly Controlled by Santander Participações S.A |
|
|
|
|
| 3,382 |
| 2,066 |
| 1,093 | ||||||||||||
PSA Corretora de Seguros e Serviços Ltda.(8) |
|
|
|
|
| 3,382 |
| 2,066 |
| 1,093 | ||||||||||||
|
|
|
|
|
|
|
|
|
|
|
|
|
|
|
|
| ||||||
Significant Influence of Banco Santander |
|
|
|
|
| 127,598 |
| 31,136 |
| 6,792 | ||||||||||||
Norchem Holding e Negócios S.A.(1) |
|
|
|
|
|
|
| 127,598 |
| 31,136 |
| 6,792 | ||||||||||
Total |
|
|
|
|
|
|
|
|
|
|
| 10,419,035 |
| 8,292,820 |
| 154,931 | ||||||
|
|
|
|
|
|
|
|
|
|
|
|
|
|
|
| 2015 |
Total assets | Total liabilities | Total profit(11) | ||||||||||||||
Jointly Controlled by Banco Santander |
|
|
|
|
|
| 8,702,727 |
| 7,170,602 |
| 180,663 | |||||
Banco RCI Brasil S.A.(5) |
|
|
| 8,474,418 |
| 7,125,614 |
| 174,629 | ||||||||
Norchem Participações e Consultoria S.A. (1) |
|
|
| 73,288 |
| 25,958 |
| 3,953 | ||||||||
Cibrasec - Companhia Brasileira de Securitização(1) (7) |
|
|
| 92,495 |
| 16,775 |
| 1,932 | ||||||||
Estruturadora Brasileira de Projetos S.A. - EBP(1) |
|
|
| 62,526 |
| 2,255 |
| 149 | ||||||||
|
|
|
|
|
|
|
|
|
|
| ||||||
Jointly Controlled by Santander Serviços |
|
| 1,531,883 | 890,028 | 83,902 | |||||||||||
Webmotors S.A.(3) (9) |
|
|
| 279,935 |
| 36,904 |
| 36,636 | ||||||||
Tecnologia Bancária S.A. - TECBAN (1) (4) |
|
|
| 1,251,948 |
| 853,124 |
| 47,266 | ||||||||
|
|
|
|
|
|
|
|
|
|
| ||||||
Jointly Controlled by Getnet S.A. | 20,210 | 25,747 | (2,420) | |||||||||||||
iZettle do Brasil(6) |
|
|
|
|
|
| 20,210 |
| 25,747 |
| (2,420) | |||||
Significant Influence of Banco Santander |
|
|
|
|
| 119,687 | 30,017 | 6,902 | ||||||||
Norchem Holding e Negócios S.A.(1) |
|
|
|
|
|
| 119,687 |
| 30,017 |
| 6,902 | |||||
Total |
|
|
|
|
|
|
|
|
|
|
| 10,374,507 |
| 8,116,394 |
| 269,047 |
|
|
|
|
|
|
|
|
|
|
|
|
|
|
|
| 2014 |
Total assets | Total liabilities | Total profit(11) | ||||||||||||||
Jointly Controlled by Banco Santander | 9,575,690 | 8,102,926 | 159,601 | |||||||||||||
Banco RCI Brasil S.A.(5) |
|
|
| 9,316,712 |
| 8,049,342 |
| 148,644 | ||||||||
Norchem Participações e Consultoria S.A. (1) |
| 81,395 |
| 25,220 |
| 8,868 | ||||||||||
Cibrasec - Companhia Brasileira de Securitização(1) (7) |
| 98,490 |
| 23,444 |
| 3,618 | ||||||||||
Estruturadora Brasileira de Projetos S.A. - EBP(1) |
| 79,093 |
| 4,920 |
| (1,529) | ||||||||||
Jointly Controlled by Santander Serviços |
|
| 1,191,219 | 605,654 | 110,078 | |||||||||||
Webmotors S.A.(3) (9) |
|
|
| 260,531 |
| 20,275 |
| 31,097 | ||||||||
Tecnologia Bancária S.A. - TECBAN (1) (4) |
|
|
| 930,688 |
| 585,379 |
| 78,981 | ||||||||
Jointly Controlled by Getnet S.A. | 8,438 | 11,555 | (13,380) | |||||||||||||
iZettle do Brasil(6) |
|
|
|
|
|
| 8,438 |
| 11,555 |
| (13,380) | |||||
Significant Influence of Banco Santander |
|
|
|
|
| 156,942 | 67,674 | 13,602 | ||||||||
Norchem Holding e Negócios S.A.(1) |
|
|
|
|
|
| 156,942 |
| 67,674 |
| 13,602 | |||||
Total |
|
|
|
|
|
|
|
|
|
|
| 10,932,289 |
| 8,787,809 |
| 269,901 |
b) changes | ||||||||||||||||
The changes in the balance of this item were as follows: | ||||||||||||||||
|
|
|
|
|
|
|
|
|
|
|
| 2016 |
| 2015 |
| 2014 |
Jointly Controlled by Banco Santander |
|
|
|
|
|
|
|
|
|
| ||||||
Balance at beginning of year |
| 1,041,239 |
| 1,004,045 |
| 947,992 | ||||||||||
Change in the scope of consolidation(2) | (2,926) |
| - |
| 7,165 | |||||||||||
Low/ Additions(6) (8) |
| 3,105 |
| (2,768) |
| (4,393) | ||||||||||
Capital gains/reduction(9) |
| (76,860) |
| - |
| 368 | ||||||||||
Income from companies accounted for by the equity method | 46,061 |
| 114,811 |
| 88,138 | |||||||||||
Dividends proposed/received |
|
|
| (39,424) |
| (74,849) |
| (35,197) | ||||||||
Others |
|
|
|
|
| (2,098) |
| - |
| (28) | ||||||
Balance at end of year | 969,097 | 1,041,239 | 1,004,045 | |||||||||||||
|
|
|
|
|
|
|
|
|
|
|
|
|
|
|
|
|
Significant Influence of Banco Santander | ||||||||||||||||
Balance at beginning of year |
|
|
|
|
|
|
|
|
| 19,504 |
| 19,416 |
| 115,811 | ||
Change in the scope of consolidation(2) |
|
|
| - |
| - |
| (88,715) | ||||||||
Income from companies accounted for by the equity method |
|
|
|
|
| 1,476 |
| 1,501 |
| 2,958 | ||||||
Dividends proposed/received |
|
|
|
|
|
|
|
|
| - |
| (1,413) |
| (10,638) | ||
Balance at end of year |
|
|
|
|
|
|
|
|
| 20,980 |
| 19,504 |
| 19,416 | ||
(1) Companies with a lag of one month for the equity calculation. Accounting for equity income was used on 12/31/2016 the position of 11/30/2016. | ||||||||||||||||
(2) On September, 2014 the investment held in BW Guirapá I S.A. by Banco Santander was transferred to Santander Participações and was reclassified to non-current assets held for sale (Note 11). Investments transferred from the non-current assets item held for sale in September 2016. | ||||||||||||||||
(3) In March 7, 2014 was concluded acquisition by company Webmotors SA, 100% of the share capital of KM Locanet Ltd. - ME (Compreauto). | ||||||||||||||||
(4) On 18 July 2014 it was published a Notice to the Market with a view to inform that the country’s leading retail Banks, among them Banco Santander, by means of one of its subsidiaries, (“Shareholders”), executed on July 17, 2014 a new Shareholders’ Agreement of Tecban (“New Shareholders’ Agreement”). The New Shareholders’ Agreement establishes that, within approximately 4 years from its effective date, the Shareholders shall have replaced part of their own external-access Automated Teller Machines (“ATMs”) with ATMs from Rede Banco24Horas, which are and will continue to be managed by Tecban, thus enhancing the efficiency, quality and points of services to their clients. The effectiveness of the Shareholders’ Agreement is subject to certain conditions precedent, among which its approval by the competent regulatory body (The General Superintendency of CADE published in the Diário Oficial da União, on October 23, 2014, its decision in which approved, without restrictions, the related transaction). | ||||||||||||||||
(5) The EGM of July 21, 2015, approved the Company's transformation into a multiple bank, with investment portfolios, leasing and credit, financing and investment and also the change of the name of the Companhia de Arrendamento Mercantil RCI Brasil to Banco RCI Brasil S.A. This process was approved by the BACEN on October 28, 2015. | |||||||||||||||||
(6) In June 2016 the interest held in iZetlle do Brasil S.A was sold. | |||||||||||||||||
(7) At the ESM held on April 29, 2016 was approved the reform in the distribution structure of the capital of Cibrasec through the creation of preferred shares issued by the Company with voting rights and the share conversion of the common shares of Company into preferred shares, this reform was ratified at the ESM held on May 30, 2016. Banco Santander became part of their ordinary shares held in the capital of Cibrasec, the corresponding amount to five thousand (5,000) common shares issued by Cibrasec 50 (fifty) preferred shares in the proportion of 100 (one hundred) common shares for each one (1) preferred share, and still held 4,000 (four thousand) common shares in the capital of Cibrasec. Each preferred share entitles the holder the right to one hundred (100) times the right to dividends of the common shares, so that the economic rights were maintained, however, the conversion resulted in reduction in the percentage shareholding in Cibrasec. | |||||||||||||||||
(8) Investment acquired on August 1, 2016. | |||||||||||||||||
(9) At the ESM realized in September 26, 2016, was approved the reduction of the capital of Webmotors S.A. without cancellation of shares in the amount of R$109,800 to be considered excessive to maintain its activities, and the capital of R$194,580 to R$84,780. | |||||||||||||||||
(10) On 31 December 2016, 2015 and 2014 the balances of Assets, Liabilities and Profit refer to 100% of the company balance sheet. There is not balance to the "Other Comprehensive Income" in these companies. | |||||||||||||||||
(*) The Bank does not have collateral with associates and joint ventures. | |||||||||||||||||
(**) The Bank does not have contingent liabilities with significant risk of possible losses related to investments in affiliates. | |||||||||||||||||
c) Impairment losses | |||||||||||||||||
No impairment losses were recognized on investments in associates and joint ventures in 2016, 2015 and 2014. | |||||||||||||||||
d) Other information | |||||||||||||||||
Details of the principal jointly controlled entities: | |||||||||||||||||
•Banco RCI Brasil S.A.: A company incorporated in the form of corporation headquartered in Parana, is primarily engaged in the practice of loans in order to sustain the growth of automotive brands Renault and Nissan in the Brazilian market by financing the dealer network and the end consumer. It is a financial institution that is part of the RCI Banque Group and the Santander Group, with operations conducted as part of a set of institutions that operate in the financial market. According to the Shareholders' Agreement, the key decisions that impact this society are taken jointly between Banco Santander and other controllers. On July 21, 2015 the Company's transformation into a Multiple Bank was approved, with investment portfolios, leasing and credit, financing and investment and also the change of company name of Companhia de Arrendamento Mercantil RCI Brasil to Banco RCI Brasil S.A. This process was approved by the Central Bank of Brazil on October 28, 2015. On January 29, 2016, the Companhia de Crédito, Financiamento e Investimento RCI Brasil was merged into its subsidiary Banco RCI Brasil S.A., with this process the interest previously held by RCI Brasil went to Banco Santander. | |||||||||||||||||
• Webmotors S.A.: A company incorporated in the form of capital company with headquarters in São Paulo and is engaged in the design, implementation and / or availability of electronic catalogs, space, products, services or means of marketing products and / or services related to the automotive industry, on the Internet through the "website" www.webmotors.com.br (owned by Webmotors) or other means related to e-commerce activities and other uses or Internet applications, as well as participation in capital in other companies and the management of business ventures and the like. It is a company of the Economic Conglomerate - Financial Santander (Santander Group) andCarsales.com Investments PTY LTD (Carsales), and operations conducted as part of a group of institutions that operate jointly. According to the Shareholders' Agreement, the key decisions that impact this society are taken jointly between Banco Santander and other controllers. | |||||||||||||||||
In thousand of Reais |
|
|
|
| 2016 |
|
|
|
|
| 2015 | ||||||
Banco RCI Brasil |
| Webmotors | Banco RCI Brasil |
| Webmotors | ||||||||||||
| Current assets |
|
|
|
| 4,103,866 |
| 23,071 |
|
|
| 5,038,181 |
| 85,552 | |||
| Non-current assets |
|
|
|
|
| 4,499,978 |
| 122,428 |
|
|
| 3,436,237 |
| 194,383 | ||
| Current liabilities |
|
|
|
|
| 3,629,575 |
| 32,601 |
|
|
| 3,998,536 |
| 30,877 | ||
| Non-current liabilities |
|
|
|
|
| 3,646,745 |
| 2,630 |
|
|
| 3,127,078 |
| 6,027 | ||
| Cash and cash equivalents |
|
|
|
|
| 23,612 |
| 1,663 |
|
|
| 38,217 |
| 681 | ||
| Depreciation and amortization |
|
|
| (911) |
| (12,295) |
|
|
| (3,783) |
| (9,883) | ||||
| Revenue |
|
|
|
|
| 1,575,550 |
| 135,242 |
|
|
| 591,810 |
| 137,947 | ||
| Interest income |
|
|
|
|
| 1,368,643 |
| 28,047 |
|
|
| 1,424,211 |
| 27,854 | ||
| Interest expense |
|
|
|
|
| (903,061) |
| - |
|
|
| (903,864) |
| (69) | ||
| Tax Income / (expense) |
|
|
| (3,326) |
| (13,370) |
|
|
| (108,837) |
| (16,086) | ||||
| Current financial liabilities (excluding trade and other payables and provisions) |
| 3,629,575 |
| 31,707 |
|
|
| 3,436,699 |
| 30,110 | ||||||
| Non-current financial liabilities (excluding trade and other payables and provisions) |
| 3,646,745 |
| 1,736 |
|
|
| 2,565,241 |
| 5,260 | ||||||
13. Tangible assets | |||||||||||||||||
Tangible assets of the Bank relate to property, plant and equipment for the Bank own use. The Bank does not have tangible assets held as investment property nor leased out under operating leases. The Bank is also not a part of any financial lease contracts as of and during fiscal years ended December 31, 2016, 2015 and 2014. | |||||||||||||||||
a) Breakdown | |||||||||||||||||
The detail, by class of asset, of the tangible assets in the consolidated balance sheets is as follows: | |||||||||||||||||
| In thousand of reais | ||||||||||||||||
Cost | Land and buildings |
| IT equipment and fixtures |
| Furniture and vehicles |
| Works in progress and others |
| Total | ||||||||
| Balance at December 31, 2013 | 3,020,484 |
| 2,142,937 |
| 5,583,177 |
| 4,465 |
| 10,751,063 | |||||||
| Additions | 160,091 |
| 431,813 |
| 1,246,380 |
| - |
| 1,838,284 | |||||||
| Additions resulting mergers |
| - |
| 67,581 |
| 587,049 |
| - |
| 654,630 | ||||||
| Write-off |
|
|
|
|
|
|
| (20,574) |
| (2,757) |
| (277,438) |
| - |
| (300,769) |
| Transfers |
|
|
|
|
|
|
| (386,453) |
| 49,416 |
| (171,866) |
| - |
| (508,903) |
| Balance at December 31, 2014 |
| 2,773,548 |
| 2,688,990 |
| 6,967,302 |
| 4,465 |
| 12,434,305 | ||||||
| |||||||||||||||||
| Additions |
|
|
|
|
|
|
| 15,997 |
| 120,378 |
| 933,913 |
| - |
| 1,070,288 |
| Additions resulting mergers |
| - |
| 2,723 |
| 4,739 |
| - |
| 7,462 | ||||||
| Write-off |
|
|
|
|
|
|
| (19,991) |
| (12,233) |
| (228,324) |
| - |
| (260,548) |
| Transfers |
|
|
|
|
|
|
| (44,695) |
| 350,889 |
| (314,139) |
| (706) |
| (8,651) |
| Balance at December 31, 2015 |
| 2,724,859 |
| 3,150,747 |
| 7,363,491 |
| 3,759 |
| 13,242,856 | ||||||
| Additions |
|
|
|
|
|
|
| 3,024 |
| 154,852 |
| 715,264 |
| - |
| 873,140 |
| Additions resulting mergers |
|
|
|
|
| - |
| 2,021 |
| 3,961 |
| - |
| 5,982 | ||
| Write-off |
|
|
|
|
|
|
| (29,174) |
| (15,011) |
| (141,442) |
| - |
| (185,627) |
| Change in the scope of consolidation |
| - |
| 45 |
| 257 |
| - |
| 302 | ||||||
| Transfers |
|
|
|
|
|
|
| 12,484 |
| 74,361 |
| (82,650) |
| - |
| 4,195 |
| Balance at December 31, 2016 |
| 2,711,193 |
| 3,367,015 |
| 7,858,881 |
| 3,759 |
| 13,940,848 | ||||||
Accumulated depreciation | |||||||||||||||||
| Balance at December 31, 2013 | (407,068) |
| (1,412,264) |
| (2,005,320) |
| - |
| (3,824,652) | |||||||
| Additions |
|
|
|
|
|
|
| (59,533) |
| (332,629) |
| (480,587) |
| - |
| (872,749) |
| Additions resulting mergers |
|
|
|
|
| - |
| - |
| (652,155) |
| - |
| (652,155) | ||
| Write-off |
|
|
|
|
|
|
| 1,742 |
| 6,725 |
| 163,105 |
| - |
| 171,572 |
| Transfers |
|
|
|
|
|
|
| (310) |
| (1,627) |
| (152,052) |
| - |
| (153,989) |
| Balance at December 31, 2014 |
| (465,169) |
| (1,739,795) |
| (3,127,009) |
| - |
| (5,331,973) | ||||||
| Additions |
|
|
|
|
|
|
| (83,106) |
| (343,642) |
| (602,958) |
| - |
| (1,029,706) |
| Additions resulting mergers |
|
|
|
|
| - |
| (831) |
| (3,357) |
| - |
| (4,188) | ||
| Write-off |
|
|
|
|
|
|
| 17,353 |
| 10,531 |
| 207,420 |
| - |
| 235,304 |
| Transfers |
|
|
|
|
|
|
| (624) |
| (19,143) |
| (76,827) |
| - |
| (96,594) |
| Balance at December 31, 2015 | (531,546) |
| (2,092,880) |
| (3,602,731) |
| - |
| (6,227,157) | |||||||
| Additions |
|
|
|
|
|
|
| (82,963) |
| (387,855) |
| (683,770) |
| - |
| (1,154,588) |
| Additions resulting mergers |
|
|
|
|
| - |
| (1,594) |
| (1,234) |
| - |
| (2,828) | ||
| Write-off |
|
|
|
|
|
|
| 13,999 |
| 13,092 |
| 121,338 |
| - |
| 148,429 |
| Change in the scope of consolidation |
| - |
| (26) |
| (76) |
| - |
| (102) | ||||||
| Transfers |
|
|
|
|
|
|
| 6,300 |
| (39,836) |
| (5,761) |
| - |
| (39,297) |
| Balance at December 31, 2016 | (594,210) |
| (2,509,099) |
| (4,172,234) |
| - |
| (7,275,543) | |||||||
|
|
|
|
| |||||||||||||
Losses from non-recovery (impairment) | |||||||||||||||||
| Balance at December 31, 2013 |
|
|
|
|
| (40,484) |
| - |
| - |
| - |
| (40,484) | ||
| Impacts on results |
|
|
|
|
|
|
| 9,188 |
| - |
| - |
| - |
| 9,188 |
| Balance at December 31, 2014 |
| (31,296) |
| - |
| - |
| - |
| (31,296) | ||||||
| Impacts on results |
|
|
|
|
|
|
| (2,077) |
| - |
| - |
| - |
| (2,077) |
| Write-off |
|
|
|
|
|
|
| 23,588 |
| - |
| - |
| - |
| 23,588 |
| Balance at December 31, 2015 |
|
| (9,785) |
| - |
| - |
| - |
| (9,785) | |||||
| Impacts on results |
|
| (3,246) |
| - |
| (5,841) |
| - |
| (9,087) | |||||
| Balance at December 31, 2016 |
|
| (13,031) |
| - |
| (5,841) |
| - |
| (18,872) | |||||
Carrying amount | |||||||||||||||||
| Balance at December 31, 2014 | 2,277,083 |
| 949,195 |
| 3,840,293 |
| 4,465 |
| 7,071,036 | |||||||
| Balance at December 31, 2015 |
| 2,183,528 |
| 1,057,867 |
| 3,760,760 |
| 3,759 |
| 7,005,914 | ||||||
| Balance at December 31, 2016 |
| 2,103,952 |
| 857,916 |
| 3,680,806 |
| 3,759 |
| 6,646,433 | ||||||
The depreciation expenses has been included in the line item “Depreciation and amortization” in the income statement. | |||||||||||||||||
b) Tangible asset purchase commitments | |||||||||||||||||
On December 31, 2016 the Bank has contractual commitments for the acquisition of tangible assets amount of R$9.1 million (2015 - R$0 and 2014 R$0). | |||||||||||||||||
14. Intangible assets - Goodwill | |||||||||||||||||
Goodwill is the difference between the acquisition cost and the Bank's participation in the net fair value of assets, liabilities and contingent liabilities of the acquire. When the difference is negative (negative goodwill), it is recognized immediately through profit or loss. In accordance with IFRS 3 Business Combinations, goodwill is stated at cost and is not amortized but tested annually for impairment or whenever there is an evidence of reduction on the recoverable value of the cash generating unit to which the goodwill was allocated. Goodwill is recognized at cost considering the accumulated impairment losses. Impairment losses related to goodwill are not reversible. Gains and losses related to the sale of an entity include the carrying amount of goodwill relating to the entity sold. | |||||||||||||||||
The goodwill recorded is subject to impairment test (note 2.o.i) and has been allocated according to the operating segments (note 46). | |||||||||||||||||
Based on the assumptions described above management has not identified any evidence of impairment(3) on December 31, 2016, 2015 and 2014. | |||||||||||||||||
| Thousands of Reais |
|
|
|
|
|
|
|
|
|
|
| 2016 |
| 2015 |
| 2014 |
| Breakdown |
|
|
|
|
|
|
|
|
| |||||||
| Banco ABN Amro Real S.A. (Banco Real) |
|
|
|
| 27,217,565 |
| 27,217,565 |
| 27,217,565 | |||||||
| Olé Consignado (Current Company name of Banco Bonsucesso Consignado) |
|
|
| 62,800 |
| 62,800 |
| - | ||||||||
| Super Pagamentos e Administração de Meios Eletrônicos Ltda. (Super) |
|
|
| 13,050 |
| 13,050 |
| 14,086 | ||||||||
| Getnet Adquirência e Serviços para Meios de Pagamento S.A. (Santander Getnet) |
|
|
| 1,039,304 |
| 1,039,304 |
| 1,039,304 | ||||||||
| BW Guirapá I S.A. |
|
|
| 22,320 |
| - |
| - | ||||||||
| Total |
|
|
|
|
|
|
|
|
|
|
| 28,355,039 |
| 28,332,719 |
| 28,270,955 |
|
|
|
|
|
|
|
|
|
|
|
|
|
|
|
|
|
|
Commercial Banking | |||||||||||||||||
2016 | 2015 | 2014 | |||||||||||||||
Main assumptions: | |||||||||||||||||
| Basis of determining recoverable amounts |
|
|
|
|
| Value in use: cash flows | ||||||||||
| Period of the projections of cash flows(1) |
|
|
|
|
|
|
| 5 years |
| 5 years |
| 5 years | ||||
| Growth rate perpetual |
|
|
|
|
|
|
| 8.0% |
| 7.5% |
| 7.0% | ||||
| Discount rate(2) |
|
|
|
|
|
|
| 15.2% |
| 15.2% |
| 14.4% | ||||
(1) The projections of cash flow are prepared using growth plans and internal budget of the administration, based on historical data, market expectations and conditions such as industry growth, interest rate and inflation. | |||||||||||||||||
(2) The discount rate is calculated based on the capital asset pricing model (CAPM).The discount rate before tax is 20.23% (2015 - 20.11%). | |||||||||||||||||
(3) The recoverability test base date is December 31, 2016, since at the end of each reportable period or whenever there is any indication of impairment, goodwill (tested for impairment Recoverability). | |||||||||||||||||
The changes of goodwill in December, 31 2016, 2015 and 2014 were as follows: | |||||||||||||||||
| Thousands of Reais |
|
|
|
|
|
|
|
|
|
|
| 2016 |
| 2015 |
| 2014 |
Balance at beginning of the year |
|
|
|
|
|
|
|
|
| 28,332,719 |
| 28,270,955 |
| 27,217,565 | |||
| Additions: |
|
|
|
|
|
|
|
|
|
|
|
|
|
|
|
|
| Getnet S.A./Super/Bonsucesso/BW Guirapá(1) |
|
|
| 22,320 |
| 61,764 |
| 1,053,390 | ||||||||
| Balance at end of the year |
|
|
|
|
|
|
|
|
| 28,355,039 |
| 28,332,719 |
| 28,270,955 | ||
(1) In 2016 refers to goodwill of BW Guirapá. In 2015, investment contract which Banco Santander, through Aymoré CFI, became the controlling shareholder of Banco Bonsucesso Consignado, with 60% of capital. In 2014, includes the goodwill on the acquisition of all the shares issued by Getnet and the result of the acquisition by Aymoré in company Super Pagamentos e Administração de Meios Eletrônicos Ltda. | |||||||||||||||||
15. Intangible assets - Other intangible assets | |||||||||||||||||
The details by asset category of the "other intangible assets" of the consolidated balance sheets are as follow: | |||||||||||||||||
| Cost |
|
|
|
|
|
|
|
|
|
|
| IT developments |
| Other assets |
| Total |
| Balance at December 31, 2013 |
|
|
|
|
|
|
|
|
| 3,892,521 |
| 345,343 |
| 4,237,864 | ||
| Additions |
|
|
|
|
|
|
|
|
|
|
| 571,018 |
| 11,841 |
| 582,859 |
| Additions resulting mergers |
|
|
|
|
|
|
|
|
| 171,071 |
| - |
| 171,071 | ||
| Write-off |
|
|
|
|
|
|
|
|
|
|
| (10,651) |
| (316) |
| (10,967) |
| Transfers |
|
|
|
|
|
|
|
|
|
|
| (46,885) |
| - |
| (46,885) |
| Balance at December 31, 2014 |
|
|
|
|
|
|
|
|
| 4,577,074 |
| 356,868 |
| 4,933,942 | ||
| Additions |
|
|
|
|
|
|
|
|
|
|
| 607,642 |
| 3,647 |
| 611,289 |
| Additions resulting mergers |
|
|
|
|
|
|
|
|
| 759 |
| 1 |
| 760 | ||
| Write-off |
|
|
|
|
|
|
|
|
|
|
| (11,282) |
| - |
| (11,282) |
| Transfers |
|
|
|
|
|
|
|
|
|
|
| 28,307 |
| 37,200 |
| 65,507 |
| Balance at December 31, 2015 |
|
|
|
|
|
|
|
|
| 5,202,500 |
| 397,716 |
| 5,600,216 | ||
| Additions |
|
|
|
|
|
|
|
|
|
|
| 652,490 |
| 18,395 |
| 670,885 |
| Additions resulting mergers |
|
|
|
|
|
|
|
|
| 250 |
| 89 |
| 339 | ||
| Write-off |
|
|
|
|
|
|
|
|
|
|
| (450) |
| (10,202) |
| (10,652) |
| Change in the scope of consolidation |
|
|
|
|
|
|
|
|
| 4 |
| - |
| 4 | ||
| Transfers |
|
|
|
|
|
|
|
|
|
|
| 12,150 |
| - |
| 12,150 |
| Balance at December 31, 2016 |
|
|
|
|
|
|
|
|
| 5,866,944 |
| 405,998 |
| 6,272,942 | ||
| Accumulated amortization | IT developments |
| Other assets |
| Total | |||||||||||
| Balance at December 31, 2013 |
| (1,891,927) |
| (212,929) |
| (2,104,856) | ||||||||||
| Additions |
|
|
|
|
|
|
|
|
|
|
| (468,461) |
| (20,919) |
| (489,380) |
| Additions resulting mergers |
|
|
|
|
|
|
|
|
| (110,193) |
| - |
| (110,193) | ||
| Write-off |
|
|
|
|
|
|
|
|
|
|
| 2,155 |
| 316 |
| 2,471 |
| Transfers |
|
|
|
|
|
|
|
|
|
|
| 4,153 |
| - |
| 4,153 |
| Balance at December 31, 2014 | (2,464,273) |
| (233,532) |
| (2,697,805) | |||||||||||
|
|
|
|
|
|
|
|
|
|
|
|
|
|
| |||
| Additions |
|
|
|
|
|
|
|
|
|
|
| (413,450) |
| (46,861) | (460,311) | |
| Additions resulting mergers |
|
|
|
|
|
|
|
|
| (115) |
| - |
| (115) | ||
| Write-off |
|
|
|
|
|
|
|
|
|
|
| 10,169 |
| - |
| 10,169 |
| Transfers |
|
|
|
|
|
|
|
|
|
|
| 18,675 |
| 13,614 |
| 32,289 |
| Balance at December 31, 2015 |
|
|
|
|
|
|
|
|
| (2,848,994) |
| (266,779) |
| (3,115,773) | ||
| Additions |
|
|
|
|
|
|
|
|
|
|
| (304,046) |
| (24,005) | (328,051) | |
| Additions resulting mergers |
|
|
|
|
|
|
|
|
| (249) |
| - |
| (249) | ||
| Write-off |
|
|
|
|
|
|
|
|
|
|
| 141 |
| 10,202 |
| 10,343 |
| Change in the scope of consolidation |
|
|
|
|
|
|
|
|
| (1) |
| - |
| (1) | ||
| Transfers |
|
|
|
|
|
|
|
|
|
|
| 32,167 |
| 3,427 |
| 35,594 |
| Balance at December 31, 2016 |
|
|
|
|
|
|
|
|
| (3,120,982) |
| (277,155) |
| (3,398,137) | ||
| Losses from non-recovery (Impairment) - IT | ||||||||||||||||
| Balance at December 31, 2013 |
|
| (286,197) |
| - |
| (286,197) | |||||||||
| Impact on net profit |
| (5,123) |
| - | (5,123) | |||||||||||
| Write-off |
|
|
|
|
|
|
|
|
|
|
| 5,486 |
| - |
| 5,486 |
| Balance at December 31, 2014 |
|
|
| (285,834) |
| - |
| (285,834) | ||||||||
|
|
|
|
|
|
|
|
|
|
|
|
|
|
|
|
|
|
Impact on net profit(1) | (670,556) | (8,698) | (679,254) | ||||||||||||||
| Write-off |
|
|
|
|
|
|
|
|
|
|
| (38,412) |
| - |
| (38,412) |
| Balance at December 31, 2015 |
|
|
| (994,802) |
| (8,698) |
| (1,003,500) | ||||||||
|
|
|
|
|
|
|
|
|
|
|
|
|
|
|
|
|
|
Impact on net profit | 898 | (6,736) | (5,838) | ||||||||||||||
| Transfers |
|
|
|
|
|
|
|
|
|
|
| 16,193 |
| 143 |
| 16,336 |
| Balance at December 31, 2016 |
|
|
| (977,711) |
| (15,291) |
| (993,002) | ||||||||
|
|
|
|
|
|
|
|
|
|
|
|
|
|
|
|
|
|
| Carrying amount |
|
|
|
|
|
|
|
| ||||||||
| Balance at December 31, 2014 |
|
|
|
|
| 1,826,967 |
| 123,336 |
| 1,950,303 | ||||||
| Balance at December 31, 2015 |
|
|
|
|
| 1,358,704 |
| 122,239 |
| 1,480,943 | ||||||
| Balance at December 31, 2016 |
|
|
|
|
| 1,768,251 |
| 113,552 |
| 1,881,803 | ||||||
|
|
|
|
|
|
|
|
|
|
|
|
|
|
|
|
|
|
(1) In 2015, includes impairment loss of assets in the acquisition and development of software in the amount of R$674,780. The loss in the acquisition and development of software was recorded due to obsolescence function and disruption of these systems. | |||||||||||||||||
The amortization expenses has been included in the line item “Depreciation and amortization” in the income statement. | |||||||||||||||||
16. Other assets | |||||||||||||||||
The breakdown of the balance of “Other assets” is as follows: | |||||||||||||||||
| Thousands of Reais |
|
|
| 2016 |
| 2015 |
| 2014 | ||||||||
| Customer relationships (1) |
|
|
| 62,625 |
| 221,478 |
| 946,571 | ||||||||
| Prepayments and accrued income |
|
|
|
|
| 1,825,467 |
| 1,383,476 |
| 1,289,624 | ||||||
| Contractual guarantees of former controlling stockholders (Note 24.c.5) |
|
|
| 814,925 |
| 789,974 |
| 783,909 | ||||||||
| Actuarial asset (Note 23) |
|
|
|
|
| 153,661 |
| - |
| 557 | ||||||
| Amounts receivable of covenants |
|
|
|
|
| - |
| 8 |
| 530,311 | ||||||
| Other receivables(2) |
|
|
|
|
| 2,247,334 |
| 1,407,182 |
| 1,515,754 | ||||||
| Total |
|
|
|
|
|
|
|
|
|
|
| 5,104,012 |
| 3,802,118 |
| 5,066,726 |
|
|
|
|
|
|
|
|
|
|
|
|
|
|
|
|
|
|
(1) In 2015, the balance shown is net of provision for non-recoverable loss of the asset recorded for the purchase of rights to the provision of payroll services in the amount of R$534,281 recorded in "Impairment losses on other assets (net) - Others". The loss on the rights in the acquisition of payrolls was recorded due to the reduction of the expected return value in the management of payrolls and contracts break history. | |||||||||||||||||
(2) Corresponds mainly to receivables from third parties. | |||||||||||||||||
17. Deposits from the Brazilian Central Bank and Deposits from credit institutions | |||||||||||||||||
The breakdown, by classification, type and currency, of the balances of these items is as follows: | |||||||||||||||||
| Thousands of Reais |
|
|
|
|
|
|
|
|
|
|
| 2016 |
| 2015 |
| 2014 |
Classification: | |||||||||||||||||
| Financial liabilities at amortized cost |
|
|
|
|
|
|
|
|
| 78,634,072 |
| 69,451,498 |
| 63,674,201 | ||
| Total |
|
|
|
|
|
|
|
|
|
|
| 78,634,072 |
| 69,451,498 |
| 63,674,201 |
|
|
|
|
|
|
|
|
|
|
|
|
|
|
|
|
|
|
| Type: |
|
|
|
|
|
|
|
|
|
|
|
|
|
|
|
|
| Demand deposits(1) |
|
|
|
|
|
|
|
|
|
|
| 314,112 |
| 144,596 |
| 161,538 |
| Time deposits(2) |
|
|
|
|
|
|
|
|
|
|
| 49,548,858 |
| 55,795,205 |
| 42,044,680 |
| Repurchase agreements |
|
|
|
|
|
|
|
|
| 28,771,102 |
| 13,511,697 |
| 21,467,983 | ||
| Of which: |
|
|
|
|
|
|
|
|
|
|
|
|
|
|
|
|
Backed operations with Private Securities(3) | 446,429 |
| 84,573 |
| 961,359 | ||||||||||||
| Backed operations with Government Securities |
|
|
|
|
|
|
| 28,324,673 |
| 13,427,124 |
| 20,506,624 | ||||
| Total |
|
|
|
|
|
|
|
|
|
|
| 78,634,072 |
| 69,451,498 |
| 63,674,201 |
|
|
|
|
|
|
|
|
|
|
|
|
|
|
|
|
|
|
| Currency: |
|
|
|
|
|
|
|
|
|
|
|
|
|
|
|
|
| Reais |
|
|
|
|
|
|
|
|
|
|
| 51,339,830 |
| 33,056,128 |
| 39,519,636 |
| Euro |
|
|
|
|
|
|
|
|
|
|
| 576,994 |
| 528,465 |
| 66,735 |
| US dollar |
|
|
|
|
|
|
|
|
|
|
| 26,546,404 |
| 35,612,670 |
| 24,085,176 |
| Other currencies |
|
|
|
|
|
|
|
|
|
|
| 170,844 |
| 254,235 |
| 2,654 |
| Total |
|
|
|
|
|
|
|
|
|
|
| 78,634,072 |
| 69,451,498 |
| 63,674,201 |
(1) Non-interest bearing accounts. | |||||||||||||||||
(2) It includes the operation with credit institution arising from export and import financing lines, BNDES and Finame on-lending and abroad and other credit lines abroad. | |||||||||||||||||
(3) Refers basically to repurchase agreements backed by debentures own issue. | |||||||||||||||||
Note 45-d contains a detail of the remaining maturity of financial liabilities at amortized cost and of the related average interest rates. | |||||||||||||||||
18. Customer deposits | |||||||||||||||||
The breakdown, by classification and type, of the balance of “Customer deposits” is as follows: | |||||||||||||||||
| Thousands of Reais |
|
|
|
|
|
|
|
|
|
|
| 2016 |
| 2015 |
| 2014 |
Classification: | |||||||||||||||||
| Financial liabilities at amortized cost |
|
|
|
|
|
|
|
|
| 247,445,177 |
| 243,042,872 |
| 220,644,019 | ||
| Total |
|
|
|
|
|
|
|
|
|
|
| 247,445,177 |
| 243,042,872 |
| 220,644,019 |
|
|
|
|
|
|
|
|
|
|
|
|
|
|
|
|
|
|
| Type: |
|
|
|
|
|
|
|
|
|
|
|
|
|
|
|
|
| Demand deposits |
|
|
|
|
|
|
|
|
|
|
|
|
|
|
|
|
| Current accounts(1) |
|
|
|
|
|
|
|
|
|
|
| 15,868,201 |
| 15,579,923 |
| 15,507,604 |
| Savings accounts |
|
|
|
|
|
|
|
|
|
|
| 36,051,476 |
| 35,984,838 |
| 37,938,936 |
| Time deposits |
|
|
|
|
|
|
|
|
|
|
| 94,478,875 |
| 89,986,025 |
| 91,552,181 |
| Repurchase agreements |
|
|
|
|
|
|
|
|
| 101,046,625 |
| 101,492,086 |
| 75,645,298 | ||
| Of which: |
|
|
|
|
|
|
|
|
|
|
|
|
|
|
|
|
| Backed operations with Private Securities(2) |
|
|
|
|
|
|
|
|
|
|
| 59,460,210 |
| 61,173,979 |
| 46,699,288 |
| Backed operations with Government Securities |
|
|
|
|
|
|
|
|
|
|
| 41,586,415 |
| 40,318,107 |
| 28,946,010 |
| Total |
|
|
|
|
|
|
|
|
|
|
| 247,445,177 |
| 243,042,872 |
| 220,644,019 |
(1) Non-interest bearing accounts. | |||||||||||||||||
(2) Refers basically to repurchase agreements backed by debentures own issue. | |||||||||||||||||
Note 45-d contains a detail of the residual maturity periods of financial liabilities at amortized cost and of the related average interest rates. | |||||||||||||||||
19. Marketable debt securities | |||||||||||||||||
The breakdown, by classification and type, of the balance of “Marketable debt securities” is as follows: | |||||||||||||||||
| Thousands of Reais |
|
|
|
|
|
|
|
|
|
|
| 2016 |
| 2015 |
| 2014 |
Classification: | |||||||||||||||||
| Financial liabilities at amortized cost |
|
|
|
|
|
|
|
|
| 99,842,955 |
| 94,658,300 |
| 70,355,249 | ||
| Total |
|
|
|
|
|
|
|
|
|
|
| 99,842,955 |
| 94,658,300 |
| 70,355,249 |
|
|
|
|
|
|
|
|
|
|
|
|
|
|
|
|
|
|
| Type: |
|
|
|
|
|
|
|
|
|
|
|
|
|
|
|
|
| Real estate credit notes - LCI(1) |
|
|
|
|
|
|
|
|
| 23,983,429 |
| 23,795,322 |
| 22,669,332 | ||
| Bonds and other securities |
|
|
|
|
|
|
|
|
| 7,721,646 |
| 13,465,373 |
| 11,784,701 | ||
| Treasury Bills(2) |
|
|
|
|
|
|
|
|
|
|
| 61,157,037 |
| 55,300,989 |
| 33,998,433 |
| Agribusiness credit notes - LCA (3) |
|
|
|
|
|
|
|
|
| 6,980,843 |
| 2,096,616 |
| 1,902,783 | ||
| Total |
|
|
|
|
|
|
|
|
|
|
| 99,842,955 |
| 94,658,300 |
| 70,355,249 |
|
|
|
|
|
|
|
|
|
|
|
|
|
|
|
|
|
|
Indexers: | Domestic | Abroad | |||||||||||||||
| Treasury Bills |
|
|
|
|
|
|
|
|
|
|
|
|
| 97% to 108% of CDI |
| - |
100% of IGPM | - | ||||||||||||||||
100% of IPCA | - | ||||||||||||||||
Pre fixed: 10,05% to 17,74% | - | ||||||||||||||||
|
|
|
|
|
|
|
|
|
|
|
|
|
|
| 104% to 105% of SELIC |
| - |
| Real estate credit notes - LCI |
|
|
| 70% to 97% of CDI |
| - | ||||||||||
Pre fixed: 8,27% of 14,91% | - | ||||||||||||||||
100% of IPCA | - | ||||||||||||||||
|
|
|
|
|
|
|
|
|
|
|
|
|
|
| 100% of TR |
| - |
| Agribusiness credit notes - LCA |
|
|
| 87% to 94% of CDI |
| - | ||||||||||
| Eurobonds |
|
|
|
|
|
|
|
|
|
|
|
|
| 0,7% to 3% |
| 0,72% to 15,70% |
(1) Real Estate Credit Notes are fixed income securities pegged by mortgages and mortgage-backed securities or liens on property. On December 31, 2016, have maturities between 2017 to 2026 (12/31/2015 - there are maturities between 2016 to 2020). | |||||||||||||||||
(2) The main features of the Treasury Bills are the minimum period of two years, minimum notional of R$300 and permission for early redemption of only 5% of the issued amount. On December 31, 2016, have a maturity between 2017 to 2025 (2015 - have a maturity between 2016 to 2025 and 2014 - have a maturity between 2015 to 2025 ). | |||||||||||||||||
(3) Agribusiness credit notes are fixed income securities in which resources are allocated to the promotion of agribusiness. On December 31, 2016, have maturities between 2017 to 2018 (12/31/2015 - they have a maturity between 2016 to 2018). | |||||||||||||||||
The breakdown, by currency, of the balance of this account is as follows: | |||||||||||||||||
Thousands of Reais |
|
|
|
|
| ||||||||||||
Currency: | 2016 | 2015 | 2014 | ||||||||||||||
| Real |
|
|
|
|
|
|
|
|
|
|
| 92,132,195 |
| 82,506,826 |
| 59,870,381 |
| US dollar |
|
|
|
|
|
|
|
|
|
|
| 7,645,542 |
| 11,180,678 |
| 9,418,869 |
| Swiss Francs |
|
|
|
|
|
|
|
|
|
|
| - |
| 603,889 |
| 940,256 |
| Peso/Chile |
|
|
|
|
|
|
|
|
|
|
| - |
| 135,388 |
| 101,264 |
| Iene |
|
|
|
|
|
|
|
|
|
|
| - |
| 35,743 |
| 24,479 |
| Euro |
|
|
|
|
|
|
|
|
|
|
| 65,218 |
| 195,776 |
| - |
| Total |
|
|
|
|
|
|
|
|
|
|
| 99,842,955 |
| 94,658,300 |
| 70,355,249 |
|
|
|
|
|
|
|
|
| Average interest (%) | ||||||||
Currency: | 2016 | 2015 | 2014 | ||||||||||||||
| Real |
|
|
|
|
|
|
|
|
|
|
| 11.7% |
| 12.1% |
| 9.6% |
| US dollar |
|
|
|
|
|
|
|
|
|
|
| 3.7% |
| 1.0% |
| 3.0% |
| Swiss Francs |
|
|
|
|
|
|
|
|
|
|
| - |
| - |
| 1.8% |
| Peso/Chile |
|
|
|
|
|
|
|
|
|
|
| - |
| - |
| 4.6% |
| Iene |
|
|
|
|
|
|
|
|
|
|
| - |
| 3.1% |
| 5.6% |
| Total |
|
|
|
|
|
|
|
|
|
|
| 12.1% |
| 11.3% |
| 9.6% |
The changes in the balance of Marketable debt instruments were as follows: | |||||||||||||||||
| Thousands of Reais |
|
|
|
|
|
|
|
|
|
|
| 2016 |
| 2015 |
| 2014 |
|
|
|
|
|
|
|
|
|
|
|
|
|
|
|
|
| |
| Balance at beginning of the year |
|
|
|
| 94,658,300 |
| 70,355,249 |
| 65,300,548 | |||||||
| Issuances |
|
|
|
|
|
|
|
|
|
|
| 50,313,469 |
| 72,936,057 |
| 53,187,121 |
| Payments |
|
|
|
|
|
|
|
|
|
|
| (56,164,769) |
| (63,516,234) |
| (55,388,115) |
| Interest (Note 34) |
|
|
|
|
|
|
|
|
|
|
| 12,212,922 |
| 10,047,874 |
| 6,347,571 |
| Exchange differences and Others |
|
|
|
|
| (1,305,204) |
| 4,835,354 |
| 1,125,481 | ||||||
| Transfer Held For Sale |
|
|
|
|
|
| - |
| - |
| (217,357) | |||||
| Additions arising from acquisitions of companies |
|
|
| 128,237 |
| - |
| - | ||||||||
| Balance at end of the year |
|
|
| 99,842,955 |
| 94,658,300 |
| 70,355,249 | ||||||||
At December 31, 2016, 2015 and 2014, none of these instruments was convertible into Bank shares or granted privileges or rights which, in certain circumstances, make them convertible into shares. | |||||||||||||||||
The note 45-d contains a detail of the residual maturity periods of financial liabilities at amortized cost and of the related average interest rates in each year. | |||||||||||||||||
The breakdown of "Bonds and other securities" is as follows: | |||||||||||||||||
|
|
|
|
|
|
|
|
|
|
| Interest rate (p.a) |
|
|
|
|
|
|
Issuance | Maturity | Currency | 2016 | 2015 | 2014 | ||||||||||||
| Eurobonds |
| apr and nov-10 |
| apr-15 |
| US$ |
| 4.5% |
| - |
| - |
| 2,173,398 | ||
| Eurobonds |
| jan and jun-11 |
| jan-16 |
| US$ |
| 4.3% |
| - |
| 3,268,431 |
| 2,256,237 | ||
| Eurobonds |
| feb and sep-12 |
| feb-17 |
| US$ |
| 4.6% |
| 4,116,309 |
| 5,025,982 |
| 3,575,617 | ||
| Eurobonds(2) |
|
|
| apr-12 |
| apr-16 |
| CHF |
| 3.3% |
| - |
| 603,889 |
| 412,596 |
| Eurobonds(2) |
|
|
| mar-13 |
| apr-18 |
| US$ |
| 4,5% a 8,4% (1) |
| - |
| - |
| 892,090 |
| Eurobonds(2) |
| mar and may-13 |
| mar-16 |
| R$ |
| 8.0% |
| - |
| 1,255,841 |
| 1,258,363 | ||
| Eurobonds(2) |
|
|
| jun-13 |
| jun-15 |
| CHF |
| 1.1% |
| - |
| - |
| 339,686 |
| Eurobonds(2) |
|
|
| mar-13 |
| mar-15 |
| CHF |
| 1.7% |
| - |
| - |
| 187,974 |
| Eurobonds(2) |
|
|
| apr-12 |
| apr-16 |
| CLP |
| 4.6% |
| - |
| 135,388 |
| 101,264 |
| Eurobonds |
|
|
| oct-14 |
| oct-16 |
| US$ |
| 2.0% |
| - |
| 102,708 |
| 51,488 |
| Eurobonds(2) |
|
|
| sep-14 |
| sep-16 |
| JPY |
| 1.8% |
| - |
| 35,743 |
| 24,480 |
| Eurobonds |
|
|
| dec-15 |
| jul-16 |
| US$ |
| 2.7% |
| - |
| 195,254 |
| - |
| Eurobonds |
|
|
| dec-15 |
| jun-16 |
| EUR |
| 1.0% |
| - |
| 170,053 |
| - |
| Eurobonds |
|
|
| jun-15 |
| jan-16 |
| US$ |
| 1.1% |
| - |
| 173,487 |
| - |
| Eurobonds |
|
|
| jul-15 |
| jan-16 |
| US$ |
| 1.1% |
| - |
| 839,956 |
| - |
| Eurobonds |
|
|
| aug-15 |
| feb-16 |
| US$ |
| 1.2% |
| - |
| 510,082 |
| - |
| Eurobonds |
|
|
| aug-15 |
| feb-16 |
| US$ |
| 1.1% |
| - |
| 291,345 |
| - |
| Eurobonds |
|
|
| feb-15 |
| feb-18 |
| US$ |
| 2.2% |
| 39,727 |
| 47,598 |
| - |
| Eurobonds |
|
|
| jul-15 |
| jul-20 |
| US$ |
| 3.0% |
| 10,206 |
| 11,877 |
| - |
| Eurobonds |
|
|
| feb-16 |
| mar-17 |
| US$ |
| 2.5% |
| 39,940 |
| - |
| - |
| Eurobonds |
|
|
| jun-16 |
| jun-17 |
| US$ |
| 1.0% |
| 475,424 |
| - |
| - |
| Eurobonds |
|
|
| apr-16 |
| apr-17 |
| US$ |
| 1.0% |
| 111,059 |
| - |
| - |
| Eurobonds |
|
|
| jul-16 |
| jul-17 |
| US$ |
| 2.0% |
| 761,129 |
| - |
| - |
| Eurobonds |
|
|
| aug-16 |
| aug-17 |
| US$ |
| 2.0% |
| 185,533 |
| - |
| - |
| Eurobonds |
|
|
| sep-16 |
| sep-17 |
| US$ |
| 2.0% |
| 195,206 |
| - |
| - |
| Eurobonds |
|
|
| sep-16 |
| mar-17 |
| US$ |
| 1.4% |
| 50,045 |
| - |
| - |
| Eurobonds |
|
|
| sep-16 |
| sep-17 |
| US$ |
| 2.1% |
| 35,562 |
| - |
| - |
| Eurobonds |
|
|
| oct-16 |
| jan-17 |
| US$ |
| 0.9% |
| 32,422 |
| - |
| - |
| Eurobonds |
|
|
| nov-16 |
| feb-17 |
| US$ |
| 0.9% |
| 93,498 |
| - |
| - |
| Eurobonds |
|
|
| dec-16 |
| mar-17 |
| US$ |
| 0.9% |
| 62,219 |
| - |
| - |
| Eurobonds |
|
|
| nov-16 |
| mai-17 |
| US$ |
| 1.4% |
| 34,720 |
| - |
| - |
| Eurobonds |
|
|
| dec-16 |
| jun-17 |
| US$ |
| 1.4% |
| 62,105 |
| - |
| - |
| Eurobonds |
|
|
| oct-16 |
| oct-17 |
| US$ |
| 2.2% |
| 249,214 |
| - |
| - |
| Eurobonds |
|
|
| oct-16 |
| oct-17 |
| EUR |
| 0.4% |
| 37,507 |
| - |
| - |
| Eurobonds |
|
|
| nov-16 |
| nov-17 |
| US$ |
| 2.0% |
| 130,791 |
| - |
| - |
| Eurobonds |
|
|
| nov-16 |
| nov-17 |
| US$ |
| 1.8% |
| 138,605 |
| - |
| - |
| Eurobonds |
|
|
| dec-16 |
| dec-17 |
| US$ |
| 1.8% |
| 48,448 |
| - |
| - |
| Others |
|
|
|
|
|
|
|
|
|
|
| 811,977 |
| 797,739 |
| 511,508 |
| Total |
|
|
|
|
|
|
|
|
|
|
| 7,721,646 |
| 13,465,373 |
| 11,784,701 |
(1) The transaction was settled in advance in the first quarter of 2015 and had compound interest flow: up to April 17, 2013 equal to 4.5% per year in the period from April 18, 2013 to October 17, 2017 equal to 8.4% pa and October 18, 2017 to April 17 2018 equal to 7.0% p.a. | |||||||||||||||||
(2) On December 31, 2015 includes R$1,995,118 (2014 - R$1,960,197) in cash flow hedge operations, being R$1,255,841 indexed in Reais (2014 - R$1,258,363), R$603,889 indexed on foreign currency - Swiss Franc (2014 - R$600,570), R$R$135,388 in Chilean Peso (2014 - R$101,264) and R$35,743 for market risk hedge operations (2014 - R$364,166), being R$35.743 (2014 - R$24,480) indexed to foreign currency - YEN and the value at December 31,2014 R$339,686 indexed to foreign currency - Swiss Franc. | |||||||||||||||||
20. Subordinated liabilities | |||||||||||||||||
The detail of the balance of “Subordinated liabilities” is as follows: | |||||||||||||||||
| Thousands of Reais | ||||||||||||||||
Issuance | Maturity(1) | Amount (millions) | Interest rate | 2016 | 2015 | 2014 | |||||||||||
| Subordinated Liabilities |
| jun-06 |
| jul-16 |
| R$1.500 |
| 105.0% CDI |
| - |
| 4,196,347 |
| 3,683,128 | ||
| Subordinated Liabilities |
| oct-06 |
| sep-16 |
| R$850 |
| 104.5% CDI |
| - |
| 2,266,789 |
| 1,990,794 | ||
| Subordinated Liabilities |
| jul-06 to oct-06 |
| jul-16 |
| R$447 |
| 104.5% CDI |
| - |
| 1,230,505 |
| 1,080,684 | ||
| Subordinated Liabilities |
| may-08 |
| may-15 to may-18 |
| R$283 |
| CDI (2) |
| 98,378 |
| 114,467 |
| 114,050 | ||
| Subordinated Liabilities |
| may-08 to jun-08 |
| may-15 to jun-18 |
| R$268 |
| IPCA (3) |
| 367,868 |
| 289,196 |
| 425,421 | ||
| Total |
|
|
|
|
|
|
|
|
|
|
| 466,246 |
| 8,097,304 |
| 7,294,077 |
(1) Subordinated certificates of deposit issued by Banco Santander S.A. with yield paid at the end of the term together with the principal. | |||||||||||||||||
(2) Indexed to 100% and 112% of the CDI. | |||||||||||||||||
(3) Indexed to the IPCA (extended consumer price index) plus interest of 8.3% p.a. to 8.4% p.a. | |||||||||||||||||
The detail by currency, of the balance of “Subordinated liabilities” is as follows: | |||||||||||||||||
|
|
|
|
|
|
| Thousands of Reais |
| Average Interest Rate (%) | ||||||||
Currency: | 2016 | 2015 | 2014 | 2016 | 2015 | 2014 | |||||||||||
| Real |
|
|
|
|
| 466,246 |
| 8,097,304 |
| 7,294,077 |
| 9.6% |
| 14.6% |
| 11.2% |
| Total |
|
|
|
|
| 466,246 |
| 8,097,304 |
| 7,294,077 |
| 9.6% |
| 14.6% |
| 11.2% |
The changes in “Subordinated liabilities” were as follows: | |||||||||||||||||
|
|
|
|
|
|
|
|
|
|
|
|
| 2016 |
| 2015 |
| 2014 |
| Balance at beginning of year |
|
|
| 8,097,304 |
| 7,294,077 |
| 8,906,144 | ||||||||
| Payments |
|
|
|
|
|
|
|
|
|
|
| (8,362,652) |
| (216,075) |
| (2,495,282) |
| Interest (Note 34) |
|
|
|
|
|
|
|
|
|
|
| 731,594 |
| 1,019,302 |
| 883,215 |
| Balance at end of year |
|
|
|
|
|
|
|
|
| 466,246 |
| 8,097,304 |
| 7,294,077 | ||
Note 45-d contains a detail of the residual maturity periods of subordinated liabilities at each year-end and of the related average interest rates in each year. | |||||||||||||||||
21. Debt Instruments Eligible to Compose Capital | |||||||||||||||||
Details of the balance of "Debt Instruments Eligible to Compose Capital" for the issuance of such instruments to compose the Tier I and Tier II of regulatory capital due to the Regulatory Capital Optimization Plan (Note 29.e), are as follows: | |||||||||||||||||
|
|
|
|
|
|
|
|
|
|
|
|
| 2016 |
| 2015 |
| 2014 |
|
|
| Issuance |
|
| Maturity |
| Issuance Value |
| Interest Rate (p.a.)(3) |
|
|
|
|
| ||
| Tier I(1) |
| jan-14 |
| no maturity (perpetual) |
| R$3,000 |
| 7.4% |
| 4,125,557 |
| 4,943,194 |
| 3,361,971 | ||
| Tier II (2) |
| jan-14 |
|
|
| jan-24 |
| R$3,000 |
| 6.0% |
| 4,186,361 |
| 5,015,843 |
| 3,411,341 |
| Total |
|
|
|
|
|
|
|
|
|
| 8,311,918 |
| 9,959,037 |
| 6,773,312 | |
(1) Interest quarterly paid from April 29, 2014. | |||||||||||||||||
(2) Interest semiannually paid from July 29, 2014. | |||||||||||||||||
(3) The effective interest rate, considering the income tax source assumed by the issuer, is 8.676% and 7.059% for instruments Tier I and Tier II, respectively. | |||||||||||||||||
Changes in the balance of "Debt Instruments Eligible to Compose Capital" in twelve-months period ended December 31, 2016, 2015 and 2014 were as follows: | |||||||||||||||||
|
|
|
|
|
|
|
|
|
|
|
|
| 2016 |
| 2015 |
| 2014 |
| Balance at beginning of the year |
|
|
| 9,959,037 |
| 6,773,312 |
| - | ||||||||
| Issues |
|
|
|
|
|
|
|
|
|
|
| - |
| - |
| 6,000,000 |
| Interest payment Tier I(1) |
|
|
|
|
|
|
| 276,587 |
| 277,024 |
| 239,931 | ||||
| Interest payment Tier II(1) |
|
|
|
|
|
|
| 225,161 |
| 226,266 |
| 195,541 | ||||
| Exchange differences / Others |
|
|
| (1,447,196) |
| 3,291,470 |
| 629,081 | ||||||||
| Payments of interest - Tier I |
|
|
| (379,039) |
| (347,201) |
| (191,466) | ||||||||
| Payments of interest - Tier II |
|
|
| (322,632) |
| (261,834) |
| (99,775) | ||||||||
| Balance at end of the year |
|
|
| 8,311,918 |
| 9,959,037 |
| 6,773,312 | ||||||||
(1) The remuneration of interest relating to the Debt Instruments Eligible to Compose Capital Tier I and II were recorded against income for the period as "Interest expense and similar charges" (Note 34). | |||||||||||||||||
22. Other financial liabilities | |||||||||||||||||
The breakdown of the balances of these items is as follows: | |||||||||||||||||
| Thousands of Reais |
|
|
| 2016 |
| 2015 |
| 2014 | ||||||||
| Credit card obligations |
|
|
|
|
|
|
| 25,420,237 |
| 20,611,690 |
| 19,909,272 | ||||
| Unsettled financial transactions(2) |
|
|
|
|
|
|
|
|
| 3,829,374 |
| 5,814,199 |
| 1,106,011 | ||
| Dividends payable |
|
|
|
|
|
|
| 4,346,128 |
| 2,846,433 |
| 849,322 | ||||
| Tax collection accounts - Tax payables |
|
|
|
|
|
|
| 1,157,386 |
| 879,834 |
| 676,405 | ||||
| Liability associated with the transfer of assets (Note 10.g) |
|
|
|
|
| 774,673 |
| 190,333 |
| 242,024 | ||||||
| Other financial liabilities(1) |
|
|
|
|
|
|
| 1,351,301 |
| 1,730,156 |
| 662,701 | ||||
| Total |
|
|
|
|
|
|
|
|
|
|
| 36,879,099 |
| 32,072,645 |
| 23,445,735 |
(1) On December 31, 2016, 2015 and 2014 includes the financial liabilities in the amount of R$307 million related to the put option of the commitment of the shares held by Banco Bonsucesso and R$950 million related to the put option having as object the shares held by non-controlling of Getnet SA. | |||||||||||||||||
(2) Includes operations to liquidate with BM&FBovespa and payment orders in foreign currency. | |||||||||||||||||
Note 45-d contains a detail of the residual maturity periods of other financial assets and liabilities at each year-end. | |||||||||||||||||
23. Provisions for pensions and similar obligations | |||||||||||||||||
On December 31, 2016 the balance of provisions for pension funds and similar obligations totaled R$2,710,627 (2015 - R$2,696,653 and 2014 - R$3,869,728). | |||||||||||||||||
i. Supplemental Pension Plan | |||||||||||||||||
The Banco Santander and its subsidiaries sponsor private pension entities and plans exclusive to employees and former employees, pension funds and cash assistance with the purpose of providing retirement and pension benefits that supplement those provided by the government, as defined in the basic regulations of each plan. | |||||||||||||||||
• Banesprev - Fundo Banespa de Seguridade Social (Banesprev) | |||||||||||||||||
- Plan I: defined benefit plan fully funded by Banco Santander, covers employees hired after May 22, 1975 called Participants Recipients, and those hired until May 22, 1975 called Participants Aggregates, who are also entitled to death benefits.Plan is closed to new employees since March 28, 2005. | |||||||||||||||||
- Plan II: defined benefit plan, constituted from July 27, 1994, effective of the new text of the Statute and Regulations of the Basic Plan II, Plan I participants who chose the new plan began to contribute to the rate of 44.9% stipulated by the actuary for funding each year, introduced in April 2012 extraordinary cost to the sponsor and participants, as agreed with the PREVIC - Superintendence of Pension Funds due Deficit in plan.Plan is closed to new entrants since June 3, 2005. | |||||||||||||||||
- Plan V: defined benefit plan fully defrayed by Banco Santander, covers employees hired until after May 22, 1975,closed and settled. | |||||||||||||||||
- Supplemental Pension Plan: defined benefit plan was created in view of the privatization of Banespa and is managed by Banesprev and offered only to employees hired before May 22, 1975, this Plan effective January 1, 2000.Plan is closed to new entrants since April 28, 2000. | |||||||||||||||||
- Plan III: variable contribution plan, for employees hired after May 22,1975, previously served by the Plans I and II. Under this plan contributions are made by Banco Santander and the participants. Plan structured as defined contribution during the period of contribution and defined benefit during the receipt of benefit, if paid as monthly income for life.Plan is closed to new entrants since September 1, 2005. | |||||||||||||||||
- Plan IV: variable contribution plan, designed for employees hired as of November 27, 2000, Sponsor funds risk benefits and administrative expenses only. In this plan the benefit is set in the form of defined contribution during the period of contribution and defined benefit during the receipt of benefits in the form of monthly income for life, in whole or in part of the benefit. Risk benefit modeled as defined benefits. Plan is closed to new entrants since July 23, 2010. | |||||||||||||||||
- Three plans (DCA, DAB and CACIBAN): additional retirement and former employees associated pension, arising from the process of acquisition of the former Banco Meridional, established under the defined benefit plan.The plans are closed to new participants. | |||||||||||||||||
• Sanprev - Santander Associação de Previdência (Sanprev) | |||||||||||||||||
- Plan I: defined benefit plan, established on September 27, 1979, covering employees enrolled in the plan sponsor and is in process of extinction since June 30, 1996. | |||||||||||||||||
- Plan II: plan that provides insurance risk, pension supplement temporary, disability retirement annuity and the supplemental death and sickness allowance and birth, including employees enrolled in the plan sponsor and is funded solely by sponsors through monthly contributions, as indicated by the actuary.Plan is closed to new entrants since March 10, 2010. | |||||||||||||||||
- Plan III: variable contribution plan covering employees of the sponsors who made the choice to contribute, by contributing freely chosen by participants from 2% of salary contribution. That the benefit plan is a defined contribution during the contribution and defined benefit during the receipt of the benefit, being in the form of monthly income for life, in whole or in part of the benefit.Plan is closed to new entrants since March 10, 2010. | |||||||||||||||||
• Bandeprev - Bandepe Previdência Social (Bandeprev) | |||||||||||||||||
Defined benefit plan, sponsored by Banco Bandepe and Banco Santander, managed by Bandeprev. The plans are divided into basic plan and special retirement supplement plan, with different eligibility requirements, contributions and benefits by subgroups of participants. The plans are closed to new entrants since 1999 for Banco Bandepe’s employees and for others since 2011. | |||||||||||||||||
• Other plans | |||||||||||||||||
SantanderPrevi - Sociedade de Previdência Privada (SantanderPrevi):it´s a closed pension entity, which aims at setting up and implementation of benefit plans pension character, complementary to the general welfare, in the form of actual legislation. | |||||||||||||||||
The Retirement Plan of SantanderPrevi is the only structured as Defined Contribution and open to new members, with contributions shared between sponsors and plan participants. The appropriate values by the sponsors in the year of 2016 was R$87,603 (2015 - R$79,365). | |||||||||||||||||
It has 10 cases of lifetime income with benefits arising from the previous plan. | |||||||||||||||||
ii. Actuarial Techniques | |||||||||||||||||
The amount of the defined benefit obligations was determined by independent actuaries using the following actuarial techniques: | |||||||||||||||||
• Valuation method: | |||||||||||||||||
Projected unit credit method, which sees each year of service as giving rise to an additional unit of benefit entitlement and measures each unit separately. | |||||||||||||||||
• Nominal discount rate for actuarial obligation and calculation of interest on assets: | |||||||||||||||||
- Banesprev, Sanprev, SantanderPrevi, Bandeprev and Other Plans - 10.9% (2015 - 12.3% and 2014 - 10.9%). | |||||||||||||||||
- Cabesp, Law 9,656 and others obligations - 10.8% (2014 - 12.03% and 2014 - 11.0%). | |||||||||||||||||
• Estimated long-term inflation rate: | |||||||||||||||||
- Banesprev, Sanprev, SantanderPrevi, Bandeprev and Other Plans - 4.5% (2015 - 4.5% and 2014 - 4.5%). | |||||||||||||||||
• Estimate salary increase rate: | |||||||||||||||||
- Banesprev, Sanprev, SantanderPrevi, Bandeprev Básico and Other Plans - 5.0% (2015 - 5.0% and 2014 - 5.0%). | |||||||||||||||||
iii. Health and Dental Care Plan | |||||||||||||||||
• Cabesp - Caixa Beneficente dos Funcionários do Banco do Estado de São Paulo S.A. | |||||||||||||||||
Entity that covers health and dental care expenses of employees hired until Banespa privatization in 2000, as defined in the entity's bylaws. | |||||||||||||||||
• HolandaPrevi’s Retirees (current corporate name of SantanderPrevi) | |||||||||||||||||
For the health care plan Retirement has lifelong nature and is a closed group. In shutdown the employee should have completed 10 years of employment with Banco Real and 55 years of age. In this case it was offered continuity of health care plan where the employee bears 70% of the monthly and Bank subsidizes 30%. This rule lasted until December, 2002 and after this period that the employee was off like status Retired Holandaprevi, bears 100% of the monthly health plan. | |||||||||||||||||
• Former employees of Banco Real S.A. (retiree by Circulars) | |||||||||||||||||
It refers to health insurance for former Banco Real's employees, whose lifetime benefit has been granted in the same condition as the active employees, with the same coverage and plan characteristics. | |||||||||||||||||
Eligible only to plans basic and standard first apartment, opting for apartment he takes the difference between the plans more co-participation in the basic plan. Not allowed new additions of dependents. It has subsidizes of 90% of the plan. | |||||||||||||||||
• Bandeprev’s retirees | |||||||||||||||||
The health care plan retirees of Bandeprev’s pension plan beneficiaries is a lifetime benefit, for which Banco Santander is responsible for defraying 50% of the benefits of employees retired until November 27, 1998 and 30% of the benefits of employees retired after privatization. | |||||||||||||||||
• Officer with Lifetime Benefits (Lifetime Officers) | |||||||||||||||||
Lifetime health care benefit granted to former officers of Banco Sudameris Brasil S.A. In this case, no conclusion, being 100% funded by the Bank. | |||||||||||||||||
• Free Clinic | |||||||||||||||||
Health care plan (free clinic) is offered for life to retirees who have contributed to the Foundation Sudameris for at least 25 years and has difference in default if the user chooses apartment. The plan is only offered in standard ward where the cost is 100% of the Foundation Sudameris. | |||||||||||||||||
• Life insurance for Banco Real’s retirees | |||||||||||||||||
For Retirees from Circulars: indemnity in case of Natural Death, Disease Disability, Accidental Death. The subsidy is 45.28% of the value. This benefit is also granted to retirees Fundação Sudameris where cost is 100% of the retired.It is a closed group. | |||||||||||||||||
Additionally, it is assured to retired employees, since they meet to certain legal requirements and full pays their respective contributions, the right to be maintaining as a beneficiary of the Banco Santander health plan, in the same conditions for healthcare coverage, taken place during their employment contract. Banco Santander provisions related to this retired employees are accrued using actuarial calculations based in the present value of the current cost. | |||||||||||||||||
The funding status of the defined benefit obligations in 2016 and in the last 3 years are as follows: | |||||||||||||||||
| Thousands of Reais |
|
|
|
|
|
|
|
|
|
|
| 2016 |
| 2015 |
| 2014 |
Present value of the obligations - Post-employment plans: | |||||||||||||||||
| To current employees |
|
|
|
|
|
|
|
|
|
| 770,423 |
| 753,697 |
| 871,376 | |
| Vested obligations to retired employees |
|
|
|
|
|
|
| 19,998,703 |
| 16,772,102 |
| 17,019,976 | ||||
|
|
|
|
|
|
|
|
|
|
|
| 20,769,126 |
| 17,525,799 |
| 17,891,352 | |
| Less: |
|
|
|
|
|
|
|
|
|
|
|
|
|
|
|
|
| Fair value of plan assets |
|
|
|
|
|
|
|
|
| 20,116,916 |
| 16,275,269 |
| 16,067,029 | ||
| Unrecognized assets(1) |
|
|
|
|
|
|
|
|
| (969,162) |
| (963,031) |
| (874,304) | ||
| Provisions – Post-employment plans, net |
|
|
|
|
|
|
| 1,621,372 |
| 2,213,561 |
| 2,698,627 | ||||
Present value of the obligations - Other similar obligations: | |||||||||||||||||
| To current employees |
|
|
|
|
| 200,009 |
| 315,474 |
| 340,123 | ||||||
| Vested obligations to retired employees |
|
|
|
|
|
|
| 4,046,480 |
| 5,719,260 |
| 5,737,398 | ||||
|
|
|
|
|
|
|
|
|
|
|
| 4,246,489 |
| 6,034,734 |
| 6,077,521 | |
| Less: |
|
|
|
|
|
|
|
|
|
|
|
|
|
|
|
|
| Fair value of plan assets |
|
|
|
|
|
|
|
|
| 3,310,895 |
| 5,673,071 |
| 4,906,977 | ||
| Unrecognized assets(1) |
|
|
|
|
|
|
|
|
| - |
| (121,429) |
| - | ||
| Provisions – Other similar obligations, net |
|
|
|
|
|
|
| 935,594 |
| 483,092 |
| 1,170,544 | ||||
| Total provisions for pension plans, net |
|
|
|
|
|
|
| 2,556,966 |
| 2,696,653 |
| 3,869,171 | ||||
| Of which: |
|
|
|
|
|
|
|
|
|
|
|
|
|
|
|
|
| Actuarial provisions |
|
|
|
|
|
|
|
|
| 2,710,627 |
| 2,696,653 |
| 3,869,728 | ||
| Actuarial assets (note 16) |
|
|
|
|
|
|
|
|
| 153,661 |
| - |
| 557 | ||
(1) Refers to fully funded plans Banesprev I and III, Sanprev I,II and III and Bandeprev. | |||||||||||||||||
The amounts recognized in the consolidated income statement in relation to the aforementioned defined benefit obligations are as follows: | |||||||||||||||||
| Thousands of Reais |
|
| Post-Employment Plans | |||||||||||||
2016 | 2015 | 2014 | |||||||||||||||
|
|
|
|
|
|
|
|
|
| ||||||||
| Current service cost |
|
|
|
|
|
|
|
|
| 15,416 |
| 20,560 |
| 11,189 | ||
| Interest cost (net) |
|
|
|
|
|
|
|
|
|
|
| 120,524 |
| 187,650 |
| 134,076 |
| Interest on assets not recognized |
|
|
|
|
|
|
|
|
|
|
| 117,981 |
| 95,652 |
| - |
| Other movements |
|
|
|
|
|
|
|
|
|
|
| 4,355 |
| (2,607) |
| (3,481) |
| Total |
|
|
|
|
|
|
|
|
|
|
| 258,276 |
| 301,255 |
| 141,784 |
| Thousands of Reais |
|
| Other Similar Obligations | |||||||||||||
2016 | 2015 | 2014 | |||||||||||||||
| Current service cost |
|
|
|
|
|
|
|
|
| 9,064 |
| 10,740 |
| 10,606 | ||
| Interest cost (net) |
|
|
|
|
|
|
|
|
|
|
| 38,064 |
| 124,469 |
| (384,410) |
| Interest on assets not recognized |
|
|
|
|
|
|
|
|
|
|
| 14,608 |
| - |
| - |
| Other movements |
|
|
|
|
|
|
|
|
|
|
| 55,943 |
| 27 |
| (77,165) |
| Total |
|
|
|
|
|
|
|
|
|
|
| 117,679 |
| 135,236 |
| (450,969) |
The changes in the present value of the accrued defined benefit obligations were as follows: | |||||||||||||||||
| Thousands of Reais |
|
|
|
|
|
|
| Post-Employment Plans | ||||||||
2016 | 2015 | 2014 | |||||||||||||||
|
|
| |||||||||||||||
| Present value of the obligations at beginning of year |
|
|
|
|
| 17,525,799 |
| 17,891,352 |
| 16,497,830 | ||||||
| Current service cost |
|
|
|
|
|
|
|
|
|
|
| 15,416 |
| 20,560 |
| 11,146 |
| Interest cost |
|
|
|
|
|
|
|
|
|
|
| 2,046,949 |
| 1,877,942 |
| 1,770,565 |
| Benefits paid |
|
|
|
|
|
|
|
|
|
|
| (1,679,794) |
| (1,530,082) |
| (1,445,736) |
| Actuarial (gains)/losses |
|
|
|
|
|
|
|
|
| 2,844,733 |
| (753,155) |
| 1,056,019 | ||
| Others |
|
|
|
|
|
|
|
|
|
|
| 16,023 |
| 19,182 |
| 1,528 |
| Present value of the obligations at end of year |
|
|
|
|
|
|
| 20,769,126 |
| 17,525,799 |
| 17,891,352 | ||||
| Thousands of Reais |
|
| Other Similar Obligations | |||||||||||||
2016 | 2015 | 2014 | |||||||||||||||
|
|
|
| ||||||||||||||
| Present value of the obligations at beginning of year |
|
|
|
|
| 6,034,734 |
| 6,077,521 |
| 5,524,178 | ||||||
| Current service cost |
|
|
|
|
|
|
|
|
|
|
| 9,064 |
| 10,740 |
| 10,607 |
| Interest cost |
|
|
|
|
|
|
|
|
|
|
| 703,874 |
| 653,206 |
| 608,412 |
| Benefits paid |
|
|
|
|
|
|
|
|
|
|
| (465,029) |
| (421,429) |
| (342,936) |
| Actuarial (gains)/losses |
|
|
|
|
|
|
|
|
| 1,330,371 |
| (285,304) |
| 279,855 | ||
| Other(1) |
|
|
|
|
|
|
|
|
|
|
| (3,366,525) |
| - |
| (2,595) |
| Present value of the obligations at end of year |
|
|
|
|
|
| 4,246,489 |
| 6,034,734 |
| 6,077,521 | |||||
(1) In the fourth quarter of 2016, Banco Santander updated the procedures for recognizing its obligations to the entity CABESP, in accordance with its bylaws, which establishes the coverage of medical costs in the equality of proportion between associates and sponsor. | |||||||||||||||||
The changes in the fair value of the plan assets were as follows: | |||||||||||||||||
| Thousands of Reais |
|
| Post-Employment Plans | |||||||||||||
2016 | 2015 | 2014 | |||||||||||||||
|
|
|
| ||||||||||||||
| Fair value of plan assets at beginning of year |
|
|
|
|
| 16,275,269 |
| 16,067,029 |
| 15,271,532 | ||||||
| Interest (Expense) Income |
|
|
|
|
| 1,926,424 |
| 1,690,293 |
| 1,652,774 | ||||||
| Remeasurement - Actual return (loss) on plan assets excluding the amounts included in net |
| 1,589,517 |
| (297,461) |
| 241,663 | ||||||||||
| Contributions |
|
|
|
|
|
|
|
|
|
|
| 2,001,806 |
| 298,198 |
| 300,624 |
| Of which: |
|
|
|
|
|
|
|
|
|
|
|
|
|
|
|
|
| By the Bank |
|
|
|
|
|
|
|
|
|
|
| 1,985,722 |
| 279,111 |
| 280,996 |
| By plan participants |
|
|
|
|
|
|
|
|
|
| 16,084 |
| 19,087 |
| 19,627 | |
| Benefits paid |
|
|
|
|
|
|
|
|
|
|
| (1,676,116) |
| (1,482,914) |
| (1,399,142) |
| Exchange differences and other items |
|
|
|
|
|
|
|
|
| 16 |
| 124 |
| (422) | ||
| Fair value of plan assets at end of year |
|
|
|
|
| 20,116,916 |
| 16,275,269 |
| 16,067,029 | ||||||
| Thousands of Reais |
|
| Other Similar Obligations | |||||||||||||
2016 | 2015 | 2014 | |||||||||||||||
|
|
|
| ||||||||||||||
| Fair value of plan assets at beginning of year |
|
|
|
|
| 5,673,071 |
| 4,906,977 |
| 4,629,910 | ||||||
| Interest (Expense) Income |
|
|
|
|
|
|
|
|
| 665,811 |
| 528,737 |
| 496,373 | ||
| Remeasurement - Actual return (loss) on plan assets excluding the amounts included in net interest expense |
| 718,628 |
| 581,755 |
| 187,841 | ||||||||||
| Contributions |
|
|
|
|
|
|
|
|
|
|
| - |
| 52,894 |
| 50,468 |
| Of which: |
|
|
|
|
|
|
|
|
|
|
|
|
|
|
|
|
| By the Bank |
|
|
|
|
|
|
|
|
|
|
| - |
| 52,894 |
| 50,468 |
| Benefits paid |
|
|
|
|
|
|
|
|
|
|
| (3,746,615) |
| (397,292) |
| (319,550) |
| Exchange differences and other items |
|
|
|
|
|
|
|
|
| - |
| - |
| (138,065) | ||
| Fair value of plan assets at end of year |
|
|
|
|
|
|
| 3,310,895 |
| 5,673,071 |
| 4,906,977 | ||||
Opening of gains (losses) Actuarial from experience, financial assumptions and demographic hypotheses: | |||||||||||||||||
| Thousands of Reais | Post-Employment Plans | |||||||||||||||
|
|
|
|
|
|
|
|
|
|
|
|
| 2016 |
| 2015 |
| 2014 |
Experience Plan |
|
|
|
|
|
|
|
|
|
|
|
| (696,910) |
| (1,299,660) |
| (580,616) |
Changes in Financial Assumptions |
|
|
|
|
|
|
|
|
|
|
|
| (2,135,189) |
| 2,049,061 |
| (475,403) |
Changes in Financial Demographic |
|
|
|
|
|
|
|
|
|
|
|
| (12,773) |
| - |
| - |
Gain (Loss) Actuarial - Obligation |
|
|
|
|
|
|
|
|
|
|
|
| (2,844,872) |
| 749,401 |
| (1,056,019) |
Return on Investment, Return Unlike Implied Discount Rate |
|
|
|
|
|
|
|
|
|
|
| 1,589,446 |
| (297,271) |
| 241,663 | |
Gain (Loss) Actuarial - Asset |
|
|
|
|
|
|
|
|
|
|
|
| 1,589,446 |
| (297,271) |
| 241,663 |
Changes in Superavit Uncollectible |
|
|
|
|
|
|
|
|
|
|
| 111,926 |
| - |
| - | |
|
|
|
|
|
|
|
|
|
|
|
|
|
|
|
|
|
|
| Thousands of Reais | Other Similar Obligations | |||||||||||||||
|
|
|
|
|
|
|
|
|
|
|
|
| 2016 |
| 2015 |
| 2014 |
Experience Plan |
|
|
|
|
|
|
|
|
|
|
|
| (1,116,845) |
| (433,550) |
| (80,468) |
Changes in Financial Assumptions |
|
|
|
|
|
|
|
|
|
|
|
| (537,952) |
| 718,854 |
| (199,387) |
Changes in Financial Demographic |
|
|
|
|
|
|
|
|
|
|
|
| (379) |
| - |
| - |
Gain (Loss) Actuarial - Obligation |
|
|
|
|
|
|
|
|
|
|
|
| (1,655,176) |
| 285,304 |
| (279,855) |
Return on Investment, Return Unlike Implied Discount Rate |
|
|
|
|
|
|
|
|
|
|
| 718,628 |
| 581,755 |
| 187,841 | |
Gain (Loss) Actuarial - Asset |
|
|
|
|
|
|
|
|
|
|
|
| 718,628 |
| 581,755 |
| 187,841 |
Changes in Superavit Uncollectible |
|
|
|
|
|
|
|
|
|
|
|
| 136,037 |
| - |
| - |
Effect without Risk Sharing |
|
|
|
|
|
|
|
|
|
|
|
| 380,434 |
| - |
| - |
The experience adjustments arising from plan assets and liabilities are shown bellow: | |||||||||||||||||
|
|
|
|
|
|
|
|
| Post - Employment Plans | ||||||||
In thousand of reais | 2016 | 2015 | 2014 | ||||||||||||||
Experience in Net Assets Adjustments |
|
|
|
|
|
|
| 1,589,517 |
| (297,461) |
| 241,663 | |||||
|
|
|
|
|
|
|
| Other Similar Obligations | |||||||||
In thousand of reais | 2016 | 2015 | 2014 | ||||||||||||||
Experience in Net Assets Adjustments |
|
|
|
|
|
|
| 718,628 |
| 581,755 |
| 187,841 | |||||
The amounts of actuarial obligation of defined benefit plans uninsured and defined benefit plans partially or totally covered are shown below: | |||||||||||||||||
|
|
|
|
|
|
|
|
| |||||||||
In thousand of reais | 2016 | 2015 | 2014 | ||||||||||||||
Defined benefit plans uninsured |
|
|
|
|
|
|
|
|
| 555,160 |
| 826,963 |
| 878,550 | |||
Defined benefit plans partially or totally covered |
|
|
|
|
|
|
| 24,442,275 |
| 22,734,017 |
| 23,090,769 | |||||
In 2017 the Bank expects to make contributions to fund these obligations for amounts similar to those made in 2016. | |||||||||||||||||
The main categories of plan assets as a percentage of total plan assets are as follows: | |||||||||||||||||
|
|
|
|
|
|
|
|
|
|
|
|
| 2016 |
| 2015 |
| 2014 |
Equity instruments |
|
|
|
|
|
|
|
|
|
|
| 1.00% |
| 0.48% |
| 3.04% | |
Debt instruments |
|
|
|
|
|
|
|
|
|
|
| 98.16% |
| 98.54% |
| 93.94% | |
Properties |
|
|
|
|
|
|
|
|
|
|
| 0.30% |
| 0.28% |
| 0.32% | |
Other |
|
|
|
|
|
|
|
|
|
|
| 0.54% |
| 0.70% |
| 2.70% | |
The expected return on plan assets was determined on the basis of the market expectations for returns over the duration of the related obligations. | |||||||||||||||||
The actual return on plan assets was R$4,900,380 (2015 - R$2,503,610 and 2014 - R$2,578,652). | |||||||||||||||||
The following table shows the estimated benefits payable at December 31, 2016 for the next ten years: | |||||||||||||||||
Thousands of Reais | |||||||||||||||||
2017 |
|
|
|
|
|
|
|
|
|
|
|
|
|
|
| 2,016,693 | |
2018 |
|
|
|
|
|
|
|
|
|
|
|
|
|
|
| 2,105,021 | |
2019 |
|
|
|
|
|
|
|
|
|
|
|
|
|
|
| 2,196,158 | |
2020 |
|
|
|
|
|
|
|
|
|
|
|
|
|
|
| 2,288,697 | |
2021 to 2026 |
|
|
|
|
|
|
|
|
|
|
|
|
| 15,541,948 | |||
Total |
|
|
|
|
|
|
|
|
|
|
|
|
|
|
| 24,148,517 | |
Presumptions about the rates related to medical care costs have a significant impact on the amounts recognized in income. A change of one percentage point in the medical care cost rates would have the effects as follows: | |||||||||||||||||
Thousands of Reais |
|
|
|
|
|
|
|
|
|
|
|
|
|
|
|
| |
Sensitivity | |||||||||||||||||
(+) 1,0% | (-) 1,0% | ||||||||||||||||
Effect on current service cost and interest on actuarial liabilities |
|
|
| 58,416 |
| (24,839) | |||||||||||
Effects on present value of obligation |
|
|
| 527,586 |
| (451,242) | |||||||||||
The following table shows the duration of the actuarial liabilities of the plans sponsored by Banco Santander: | |||||||||||||||||
| Plans |
|
|
|
|
|
|
| Post - Employment Plans | ||||||||
|
|
|
|
|
|
|
|
| Duration (in years) | ||||||||
| Banesprev Plans I |
|
|
|
|
|
|
|
|
|
|
|
|
|
|
| 11.47 |
| Banesprev Plans II |
|
|
|
|
|
|
|
|
|
|
|
|
|
|
| 11.42 |
| Banesprev Plans III |
|
|
|
|
|
|
|
|
|
|
|
|
|
|
| 8.44 |
| Banesprev Plans IV |
|
|
|
|
|
|
|
|
|
|
|
|
|
|
| 16.34 |
| Banesprev Plans V |
|
|
|
|
|
|
|
|
|
|
|
|
|
|
| 8.57 |
| Banesprev Pre-75 |
|
|
|
|
|
|
|
|
|
|
|
|
|
|
| 9.29 |
| Sanprev I |
|
|
|
|
|
|
|
|
|
|
|
|
|
|
| 6.29 |
| Sanprev II |
|
|
|
|
|
|
|
|
|
|
|
|
|
|
| 12.87 |
| Sanprev III |
|
|
|
|
|
|
|
|
|
|
|
|
|
|
| 9.12 |
| Bandeprev Basic |
|
|
|
|
|
|
|
|
|
|
|
|
|
|
| 9.11 |
| Bandeprev Special I |
|
|
|
|
|
|
|
|
|
|
|
|
|
|
| 6.54 |
| Bandeprev Special II |
|
|
|
|
|
|
|
|
|
|
|
|
|
|
| 6.48 |
| SantanderPrevi |
|
|
|
|
|
|
|
|
|
|
|
|
|
|
| 6.59 |
| CACIBAN / DAB / DCA |
|
|
|
|
|
|
|
|
|
|
|
|
| 6,58 / 5,56 / 6,22 | ||
| Plans |
|
|
|
|
|
|
|
| Other Similar Obligations | |||||||
|
|
|
|
|
|
|
|
|
|
|
|
|
|
|
|
|
|
| Cabesp |
|
|
|
|
|
|
|
|
|
|
|
|
|
|
| 12.93 |
| Law 9656 |
|
|
|
|
|
|
|
|
|
|
|
|
|
|
| - |
| Bandepe |
|
|
|
|
|
|
|
|
|
|
|
|
|
|
| 14.57 |
| Free Clinic |
|
|
|
|
|
|
|
|
|
|
|
|
|
|
| 11.03 |
| Lifetime officers |
|
|
|
|
|
|
|
|
|
|
|
|
|
|
| 9.12 |
| Circulars(1) |
|
|
|
|
|
|
|
|
|
|
|
|
|
|
| 12,91 / 10,05 |
| Life Insurance |
|
|
|
|
|
|
|
|
|
|
|
|
|
|
| 7.68 |
(1) The duration 12.91 refers to the plan of Former Employees of Banco ABN Amro and 10.05 to the plan of Former Employees of Banco Real. | |||||||||||||||||
Actuarial Assumptions Adopted in Calculations | |||||||||||||||||
|
|
|
|
|
|
|
|
| 2016 |
|
|
| 2015 |
|
|
| 2014 |
Pension | Health | Pension | Health | Pension | Health | ||||||||||||
Nominal Discount Rate for Actuarial Obligation |
| 10.9% |
| 10.8% |
| 12.3% |
| 12.0% |
| 10.9% |
| 11.0% | |||||
Rate Calculation of Interest Under Assets to the Next Year |
| 10.9% |
| 10.8% |
| 12.3% |
| 12.0% |
| 10.9% |
| 11.0% | |||||
Estimated Long-term Inflation Rate |
| 4.5% |
| 4.5% |
| 4.5% |
| 4.5% |
| 4.5% |
| 4.5% | |||||
Estimated Salary Increase Rate |
| 5.0% |
| 5.0% |
| 5.0% |
| 5.0% |
| 5.0% |
| 5.0% | |||||
Boards of Mortality |
| AT2000 |
| AT2000 |
| AT2000 |
| AT2000 |
| AT2000 |
| AT2000 | |||||
(1) For Banesprev II, V and Pré 75 plans. | |||||||||||||||||
(2) For Cabesp plans. | |||||||||||||||||
24. Provisions for judicial and administrative proceedings, commitments and other provisions | |||||||||||||||||
a) Breakdown | |||||||||||||||||
The breakdown of the balance of “Provisions” is as follows: | |||||||||||||||||
| Thousands of Reais |
|
|
|
|
|
|
|
|
|
|
| 2016 |
| 2015 |
| 2014 |
| Judicial and administrative proceedings under the responsibility of former controlling stockholders | 814,925 |
| 789,974 |
| 783,909 | |||||||||||
| Judicial and administrative proceedings |
|
|
|
|
|
|
|
|
|
|
| 7,470,344 |
| 7,000,680 |
| 5,487,882 |
| Of which: |
|
|
|
|
|
|
|
|
|
|
|
|
|
|
|
|
| Civil |
|
|
|
|
|
|
|
|
|
|
| 1,842,549 |
| 1,986,602 |
| 1,755,367 |
| Labor |
|
|
|
|
|
|
|
|
|
|
| 3,138,645 |
| 2,501,426 |
| 1,982,393 |
| Tax and Social Security |
|
|
|
|
|
|
|
|
|
|
| 2,489,150 |
| 2,512,652 |
| 1,750,122 |
| Others provisions(1) |
|
|
|
|
|
|
|
|
|
|
| 780,595 |
| 922,370 |
| 985,925 |
| Total |
|
|
|
|
|
|
|
|
|
|
| 9,065,864 |
| 8,713,024 |
| 7,257,716 |
(1) In 2016, includes R$450,284 (2015 - R$301,447) relating to the expenses of projects aimed at improving operational productivity and efficiency. | |||||||||||||||||
b) Changes | |||||||||||||||||
The changes in “Provisions” were as follows: | |||||||||||||||||
| Thousands of Reais |
| 2016 | ||||||||||||||
Pensions | Other Provisions | Total | |||||||||||||||
| Balance at beginning of year |
|
|
|
|
|
|
|
|
| 2,696,653 |
| 8,713,024 |
| 11,409,677 | ||
| Additions charged to income: |
|
|
|
|
|
|
|
|
|
|
|
|
|
| ||
| Interest expense and similar charges (Note 33 & 34) |
|
|
|
|
|
|
| 287,576 |
| - |
| 287,576 | ||||
| Personnel Expenses (Note 41) |
|
|
|
|
|
|
|
|
| 24,481 |
| - |
| 24,481 | ||
| Additions to provisions |
|
|
|
|
|
|
|
|
| 60,309 |
| 2,645,764 |
| 2,706,073 | ||
| Other Comprehensive Income |
|
|
|
|
|
|
|
|
|
|
| 1,876,888 |
| - |
| 1,876,888 |
| Payments to external funds |
|
|
|
|
|
|
|
|
| (2,074,873) |
| - |
| (2,074,873) | ||
| Amount used |
|
|
|
|
|
|
|
|
|
|
| - |
| (2,330,283) |
| (2,330,283) |
| Transfer to other assets - actuarial assets (Note 16) |
|
|
|
|
|
|
| (153,595) |
| - |
| (153,595) | ||||
| Transfers, exchange differences and other changes |
|
|
|
|
|
|
| (6,812) |
| 37,359 |
| 30,547 | ||||
| Balance at end of year |
|
|
|
|
|
|
|
|
| 2,710,627 |
| 9,065,864 |
| 11,776,491 | ||
| Thousands of Reais |
|
|
|
|
|
|
| 2015 | ||||||||
Pensions | Other Provisions(1) | Total | |||||||||||||||
| Balance at beginning of year |
|
|
|
|
|
|
|
|
| 3,869,728 |
| 7,257,716 |
| 11,127,444 | ||
| Additions charged to income: |
|
|
|
|
|
|
|
|
|
|
|
|
|
| ||
| Interest expense and similar charges (Note 34) |
|
|
|
|
|
|
| 404,171 |
| - |
| 404,171 | ||||
| Personnel Expenses (Note 41) |
|
|
|
|
|
|
|
|
| 31,332 |
| - |
| 31,332 | ||
| Additions to provisions |
|
|
|
|
|
|
|
|
| (3,912) |
| 3,997,463 |
| 3,993,551 | ||
| Other Comprehensive Income |
|
|
|
|
|
|
|
|
|
|
| (1,201,893) |
| - |
| (1,201,893) |
| Payments to pensioners and early retirees with a charge to internal provisions |
|
|
| (47,682) |
| - |
| (47,682) | ||||||||
| Payments to external funds |
|
|
|
|
|
|
|
|
| (354,534) |
| - |
| (354,534) | ||
| Amount used |
|
|
|
|
|
|
|
|
|
|
| - |
| (2,225,641) |
| (2,225,641) |
| Other Comprehensive Income |
|
|
|
|
|
|
|
|
| (557) |
| - |
| (557) | ||
| Transfers, exchange differences and other changes |
|
|
|
|
|
|
| - |
| (315,646) |
| (315,646) | ||||
| Sale of companies(1) |
|
|
|
|
|
|
|
|
|
|
| - |
| (868) |
| (868) |
| Balance at end of year |
|
|
|
|
|
|
|
|
| 2,696,653 |
| 8,713,024 |
| 11,409,677 | ||
(1) Sale of Santander Securities. | |||||||||||||||||
| Thousands of Reais |
|
|
|
|
|
|
| 2014 | ||||||||
Pensions | Other Provisions(1) | Total | |||||||||||||||
| Balance at beginning of year |
|
|
|
|
|
|
|
|
| 3,043,311 |
| 7,849,077 |
| 10,892,388 | ||
| Additions charged to income: |
|
|
|
|
|
|
|
|
|
|
|
|
|
| ||
| Interest expense and similar charges (Note 34) |
|
|
|
|
|
|
| 318,267 |
| - |
| 318,267 | ||||
| Personnel Expenses (Note 41) |
|
|
|
|
|
|
|
|
| 21,830 |
| - |
| 21,830 | ||
| Additions to provisions |
|
|
|
|
|
|
|
|
|
|
| (3,833) |
| 2,109,856 |
| 2,106,023 |
| Payments to pensioners and early retirees with a charge to internal provisions |
|
|
| (66,250) |
| - |
| (66,250) | ||||||||
| Payments to external funds |
|
|
|
|
|
|
|
|
| (354,117) |
| - |
| (354,117) | ||
| Amount used |
|
|
|
|
|
|
|
|
|
|
| - |
| (2,666,217) |
| (2,666,217) |
| Other Comprehensive Income |
|
|
|
|
|
|
|
|
| 910,859 |
| - |
| 910,859 | ||
| Transfer to other assets - actuarial assets (Note 16) |
|
|
|
|
|
|
| (339) |
| - |
| (339) | ||||
| Transfers, exchange differences and other changes |
|
|
|
|
|
|
| - |
| (35,000) |
| (35,000) | ||||
| Balance at end of year |
|
|
|
|
|
|
|
|
| 3,869,728 |
| 7,257,716 |
| 11,127,444 | ||
(1) Includes, primarily, provisions for tax risks and legal obligations, and judicial and administrative proceedings of labor and civil lawsuits. | |||||||||||||||||
c) Provisions for civil, labor, tax and social security contingencies | |||||||||||||||||
Banco Santander and its subsidiaries are involved in litigation and administrative tax, labor and civil proceedings arising in the normal course of its activities. | |||||||||||||||||
The provisions were constituted based on the nature, complexity and history of actions and evaluation of successful businesses based on the opinions of internal and external legal advisors. The Santander has the policy to accrue the full amount of proceedings whose loss is probable. The legal obligation statutory tax and social security were fully recognized in the financial statements. | |||||||||||||||||
Management understands that the provisions recorded are sufficient to meet legal obligations and losses from lawsuits and administrative proceedings as follows: | |||||||||||||||||
c.1) Lawsuits and Administrative Proceedings - Tax and Social Security | |||||||||||||||||
The Bank and its subsidiaries adhered, in August 2014, to the program of amnesty established by Law 12.996/14. | |||||||||||||||||
Joining the program includes administrative charge resulting from the deduction of taxes expenses and interest, with preliminary decision that suspended payments related to the IRPJ and da CSLL between the years 2006 and 2008. Such case was pending from decision at the administrative level, risk classification was assessed as possible losses, according to legal counsel. Other administrative and judicial proceedings were also included this program. | |||||||||||||||||
Tax and social security contingencies procedures included in payment were registered at the time of subscription on the program through financial settlement in the amount of R$412,602, after the recorded deferred tax assets, was zero in net income. | |||||||||||||||||
The main lawsuits related to tax legal obligations, recorded in the line "Tax Liabilities - Current", fully registered as obligation, are described below: | |||||||||||||||||
• PIS and Cofins - R$3,290,900 (2015 - R$3,015,147 and 2014 - R$10,463,919): Banco Santander and its subsidiaries filed lawsuits seeking to eliminate the application of Law 9,718/1998, which modified the calculation basis for PIS and Cofins to cover all revenues of legal entities and not only those arising from the provision of services and sale of goods. Regarding the Banco Santander Process, on April 23, 2015, a STF decision was issued admitting the Extraordinary Appeal filed by the Federal Government regarding PIS and denying the follow-up to the Extraordinary Appeal of the Federal Public Prosecutor regarding Cofins. Both appealed this decision, without any success, so that the suit relating to Cofins is defined, ruling the judgment of the Federal Regional Court of the 4th Region of August 2007, favorable to Banco Santander. The Banco Santander's PIS and the PIS and Cofins liabilities of the other controlled companies are pending final judgment by the STF. In fiscal year 2015, with the decision of the STF, Banco Santander reversed the balance of the provision constituted to cover legal obligations related to Cofins, in the amount of R$7,950 million (R$4,770 million, after tax effects). | |||||||||||||||||
• Increase in CSLL tax rate - R$851,744 (2015 - R$795,859 and 2014 - R$1,357,957) – The Bank and its subsidiaries are discussing the increase in the CSLL tax rate, from 9% to 15%, established by Executive Act 413/2008, which subsequently became Law 11,727/2008, in April 2008. Judicial proceedings are pending of judgment. | |||||||||||||||||
Banco Santander and its subsidiaries are parties to judicial and administrative proceedings related to tax and social security matters, which are classified based on the opinion of legal counsel as probable loss risk. | |||||||||||||||||
The main topics discussed in these lawsuits are: | |||||||||||||||||
• CSLL - equal tax treatment - R$54,245 (2015 - R$52,268 and 2014 - R$54,111) - The Bank and its subsidiaries filed a lawsuit challenging the application of an increased CSLL rate of 18% for financial companies, applicable until 1998, compared to the CSLL rate of 8% for non-financial companies on the basis of the constitutional principle of equal tax treatment. | |||||||||||||||||
• Tax on Services for Financial Institutions (ISS) - R$621,437 (2015 - R$755,211 and 2014 - R$722,366): The Bank and its subsidiaries filed lawsuits, in administrative and judicial proceedings, some municipalities collection of ISS on certain revenues derived from transactions not usually classified as services. | |||||||||||||||||
• Social Security Contribution (INSS) - R$266,391 (2015 - R$527,111 and 2014 - R$442.583): The Bank and its subsidiaries are involved in administrative and judicial proceedings regarding the collection of income tax on social security and education allowance contributions over several funds that, according to the evaluation of legal advisors, do not have nature of salary. | |||||||||||||||||
• Provisional Contribution on Financial Transactions (CPMF) on Customer Operations - R$689,987 (2015 – R$657,750 and 2014 – R$0): In May 2003, the Federal Revenue Service of Brazil issued an assessment notice in Santander Distribuidora de Títulos e Valores Mobiliários Ltda. (Santander DTVM) and another suit at Banco Santander Brasil S.A. The subject of the suit was the collection of CPMF on operations carried out by Santander DTVM in the administration of its clients' funds and compensation services provided by the Bank to Santander DTVM, which occurred during the years 2000, 2001 and 2002. In June 2015, the defenses were assessed with unfavorable decisions at the administrative level (CARF). On July 3, 2015, Banco and Produban Serviços de Informática S.A. (current name of Santander DTVM) filed a lawsuit seeking to cancel both tax debts, which in the period ended December 31, 2016 totaled R$1,382 million. Based on the assessment of the legal advisors, a provision was set up to cover the loss considered probable in the lawsuit. | |||||||||||||||||
c.2) Lawsuits and Administrative Proceedings - Labor | |||||||||||||||||
These are lawsuits brought by labor Unions, Associations, Public Prosecutors and former employees claiming labor rights they believe are due, especially payment for overtime and other labor rights, including retirement benefit lawsuits. | |||||||||||||||||
For claims considered to be similar and usual, provisions are recognized based on the history of payments and successes. Claims that do not fit the previous criteria are accrued according to individual assessment performed, and provisions are based on the probable loss, the law and jurisprudence according to the assessment of loss made by legal counsel. | |||||||||||||||||
c.3) Lawsuits and Administrative Proceedings - Civil | |||||||||||||||||
These provisions are generally caused by: (1) Action with a request for revision of contractual terms and conditions or requests for monetary adjustments, including supposed effects of the implementation of various government economic plans, (2) action deriving of financing agreements, (3) execution action; and (4) action indemnity by loss and damage. For civil actions considered common and similar in nature, provisions are recorded based on the average of cases closed. Claims that do not fit the previous criteria are accrued according to individual assessment performed, and provisions are based on the probable loss, the law and jurisprudence according to the assessment of loss made by legal counsel. | |||||||||||||||||
The main lawsuits classified as probable loss are described below: | |||||||||||||||||
Lawsuits for indemnity -seeking indemnity for property damage and/or emotional distress, regarding the consumer relationship on matters related to credit cards, consumer credit, bank accounts, collection and loans and other operations. In the civil lawsuits considered to be similar and usual, provisions are recorded based on the average of cases closed. Civil lawsuits that do not fit into the previous criterion are accrued according to the individual assessment made, and provisions are recognized based on the probable loss, the law and jurisprudence according to the assessment of loss made by legal counsel. | |||||||||||||||||
Economic Plans- efforts to recover actions with collective the deficient inflation adjustments in savings accounts arising from the Economic Plans (Bresser, Verão, Collor I and II). These refer to the lawsuits filed by savings accountholders disputing the interest credited by the Banco Santander under such plans as they considered that such legal amendments infringed on the rights acquired with regard to the application of the inflation indexes. Provisions are recorded based on the average losses of cases closed. | |||||||||||||||||
Civil lawsuits that do not fit into the previous criterion are accrued according to the individual assessment made, and provisions are recognized based on the probable loss, the law and jurisprudence according to the assessment of loss made by legal counsel. The Banco Santander is also a party in public class action suits on the same issue filed by consumer rights organizations, Public Prosecutor’s Offices and Public Defender’s Offices. In these cases, the provision is made only after the final unappeasable sentence is handed down on the lawsuits, based on the individual execution orders. The Superior Tribunal da Justiça (STJ - Justice Superior Court) decided against the bank’s. The STF is still analyzing the subject and has already ordered the suspension of all the procedures except those that were not already decided in trial courts and those who have a final decision. However, the assessment of this question is paralyzed in the Supreme Court for lack of quorum, considering that some of his ministers declared themselves unable to judge the matter and therefore is likely to judgment remains paralyzed for several years yet. There are decisions favorable to banks at the STF with regard to the economic phenomenon similar to that of savings accounts, as in the case of monetary restatement of time deposits - CDB and agreements (present value table). | |||||||||||||||||
Moreover, there are precedents at the STF regarding the constitutionality of the norms that changed Brazil’s monetary standard. On April 14, 2010, in the STJ was recently decided that the deadline for the filing of civil lawsuits that argue the government's purge of five years, but this decision not handed down on the lawsuits yet. Thus, with this decision, a majority stake, as was proposed after the period of 5 years is likely to be rejected, reducing the values involved. Still, the STF decided that the deadline for individual savers to qualify in the public civil litigations, also is five years, counted from the final judgment of their sentence. Banco Santander believes in the success of the arguments defended in these courts based on their content and the sound legal basis. | |||||||||||||||||
c.4) Civil, labor, tax and social security contingencies classified as possible loss risk | |||||||||||||||||
Refer to judicial and administrative proceedings involving civil, labor, tax and social security matters assessed by the legal counsels as possible loss risk, which were not accrued as a provision. | |||||||||||||||||
Tax lawsuits classified as possible loss risk, totaled R$18,653 million, including the following main lawsuits: | |||||||||||||||||
• Credit Losses - The Bank and its companies challenged the tax assessments issued by the Federal Revenue Services challenging the deduction for credit losses because they fail to meet the relevant requirements under applicable law. As of December 31, 2016 the amount related to this challenge is approximately R$730 million. | |||||||||||||||||
• INSS on Profit Sharing Payments –The Bank and the subsidiaries are involved in several legal and administrative proceedings against the tax authorities in connection with the taxation for social security purposes of certain items which are not considered to be employee remuneration. As of December 31, 2016 amounts related to these proceedings totaled approximately R$2,978 million. | |||||||||||||||||
•IRPJ and CSLL - Capital Gain -the Brazilian Federal Revenue Service issued infraction notices against Zurich Santander Brasil Seguros e Previdência S.A., successor company of ABN AMRO Brasil Dois Participações S.A. (AAB Dois Par), charging income Tax and Social Contribution to related to 2005 tax, claiming that capital gain in sales shares of Real Seguros S.A and Real Vida Previdência S.A. by AAB Dois Par should be taxed an rate of 34% instead 15%. The assessment was contested administratively based on understanding tax treatment adopted at the transaction was in compliance and capital gain tax paid was in compliance with the legislation. We had a partial favorable the decision on CARF, that disregard the fine and interest on this fine. Currently awaiting the assessment of a Amendment of Judgment by Zurich and the judgment of the Extraordinary Appeal filed by the Federal Government . The Banco Santander is responsible for any adverse outcome in this process as former controlling of Zurich Santander Brasil Seguros e Previdência S.A. As of December 31, 2016 the amount related to this proceeding is approximately R$279 million. | |||||||||||||||||
• Goodwill amortization of Banco Real – The Brazilian Internal Revenue Service issued a tax assessment notice against the Bank to require IRPJ and CSLL payments, including late payment charges, for the 2009 base period. The Tax Authorities considered that the goodwill related to the acquisition of Banco Real, amortized before its incorporation, could not be deducted by Banco Santander for tax purposes. The notice of infringement was duly challenged. On July 14, 2015, the RFB's Trial Division decided favorably to Banco Santander, which led to the filing of an Appeal (ex officio) by the Treasury. On November 10, 2016, the appeal was filed, prompting the Bank to lodge an appeal with CARF, which is awaiting judgment.As of December 31, 2016, the amount was R$1,259 million. | |||||||||||||||||
•Goodwill amortization of Banco Sudameris – The Tax Authorities have issued infraction notices to require the income tax and social contribution payments, including late charges, relating to tax deduction of amortization of goodwill from the acquisition of Banco Sudameris, related period of 2007 to 2012. Banco Santander timely presented their appeals, which are pending. On December 31, 2016, the figure was R$568 million. | |||||||||||||||||
The labor lawsuits classified as possible loss risk totaled R$15 million, excluding the lawsuit below: | |||||||||||||||||
Semiannual Bonus or Profit Sharing - a labor lawsuit relating to the payment of a semiannual bonus or, alternatively, profit sharing, to retired employees from the former Banco do Estado de São Paulo S.A. - Banespa, that had been hired up to May 22, 1975, filed as Banespa’s Retirees Association. This lawsuit was dismissed against the Bank by the Superior Labor Court. The STF rejected the extraordinary appeal of the Bank by a monocratic decision maintaining the earlier condemnation. Santander brought Regimental Appeal which awaits decision by the STF. The Regimental Appeal is an internal appeal filed in the STF itself, in order to refer the monocratic decision to a group of five ministers. The 1st Class of the STF upheld the appeal by the Bank and denied the Afabesp. The materials of the extraordinary appeal of the Bank now proceed to the STF for decision on overall impact and judgment. The amount related to this claim is not disclosed due to the current stage of the lawsuit and the possible impact such disclosure may have on the progress of the claim. | |||||||||||||||||
Readjustment of Banesprev retirement complements by the IGPDI -lawsuit filed in 2002 in Federal Court by the Association of Retired Employees of the Bank of the State of São Paulo requesting the readjustment of the supplementation of retirement by the IGPDI for Banespa retirees who have been admitted until May 22 Of 1975. The judgment granted the correction but only in the periods in which no other form of adjustment was applied. The Bank and Banesprev have appealed this decision and although the appeals have not yet been judged, the Bank's success rate in this regard in the High Courts is around 90%. In Provisional Execution, calculations were presented by the Bank and Banesprev with "zero" result due to the exclusion of participants who, among other reasons, are listed as authors in other actions or have already had some type of adjustment. The amount related to this action is not disclosed due to the current stage of the process and the possible impact that such disclosure may generate on the progress of the action. | |||||||||||||||||
The liabilities related to civil lawsuits with possible loss risk totaled R$1,211 million, being the main processes as follows: | |||||||||||||||||
Indemnity lawsuit arising of the Banco Bandepe- related to mutual agreement on appeal to the Justice Superior Court (STJ - Superior Tribunal de Justiça) | |||||||||||||||||
Indemnity lawsuit related to custody services- provided by Banco Santander (Brasil) S.A. at an early stage and still not handed down; | |||||||||||||||||
Lawsuit arising out of a contractual dispute- the acquisition of Banco Geral do Comércio S.A. on appeal to the Court of the State of São Paulo (TJSP - Tribunal de Justiça do Estado de São Paulo). | |||||||||||||||||
c.5) Judicial and administrative proceedings under the responsibility of former controlling stockholders | |||||||||||||||||
Refer to tax, labor and civil lawsuits in the amounts of R$810,383, R$712 and R$3,830 (2015 - R$785,837, R$890 and R$3,247 and 2014 - R$773,304, R$2,520 and R$8,085), with responsibility of the former controlling stockholders of the banks and acquired entities. Based on the agreements signed these lawsuits have guarantees of full reimbursement by the former controlling stockholders, and amounts reimbursable were recorded under other assets. | |||||||||||||||||
25. Tax assets and liabilities | |||||||||||||||||
a) Income and Social Contribution Taxes | |||||||||||||||||
The total charge for the year can be reconciled to accounting profit as follows: | |||||||||||||||||
| Thousands of Reais |
|
|
|
|
|
|
|
|
|
|
| 2016 |
| 2015 |
| 2014 |
| OperatingProfit BeforeTax |
|
|
|
|
|
|
|
|
| 16,383,902 |
| (3,215,718) |
| 6,443,329 | ||
| Interest on capital(1) |
|
|
|
|
|
|
|
|
|
|
| (3,850,000) |
| (1,400,000) |
| (690,000) |
| Unrealized profits |
|
|
|
|
|
|
|
|
|
|
| - |
| - |
| (142) |
| Operating Profit Before Tax |
|
|
|
|
|
|
|
|
| 12,533,902 |
| (4,615,718) |
| 5,753,187 | ||
| Rates (25% income tax and 20% social contribution tax in 2015 |
| (5,640,256) |
| 2,077,073 |
| (2,301,275) | ||||||||||
| PIS and COFINS (net of income and social contribution taxes)(2) (8) | (1,641,181) |
| 1,861,767 |
| (813,814) | |||||||||||
| Non-taxable/Non-deductable: |
|
|
|
|
| |||||||||||
| Equity in affiliates |
|
|
|
|
|
|
|
|
| 21,392 |
| 52,340 |
| 36,438 | ||
| Goodwill(3) |
|
|
|
|
|
|
|
|
|
|
| 734,952 |
| 1,252,578 |
| 1,471,590 |
| Exchange variation - foreign branches(4) |
|
|
|
|
|
|
| (3,561,133) |
| 5,913,741 |
| 920,694 | ||||
| Adjustments: |
|
|
|
|
|
|
|
|
|
|
|
|
|
|
|
|
| Constitution of income and social contribution taxes on temporary differences (5) | 605,058 |
| 1,266,588 |
| 29,257 | |||||||||||
| Effects of change in rate of social contribution taxes(6) |
|
|
|
|
| (613,202) |
| 52,145 |
| 11,419 | ||||||
| Other adjustments(7) (9) |
|
|
|
|
|
| 1,175,386 |
| 573,312 |
| (89,862) | |||||
| Income taxes |
|
|
|
|
|
|
| (8,918,984) |
| 13,049,544 |
| (735,553) | ||||
| Of which: |
|
|
|
|
|
|
|
|
|
|
|
|
|
|
|
|
| Current tax(8) |
|
|
|
|
|
|
|
|
|
|
| (3,575,099) |
| 3,631,631 |
| (2,791,425) |
| Deferred taxes |
|
|
|
|
|
|
|
|
|
|
| (5,343,885) |
| 9,417,913 |
| 2,055,872 |
| Taxes paid in the year |
|
|
|
|
|
|
|
|
|
| (4,240,115) |
| (1,170,020) |
| (573,684) | |
(1) Amount distributed to shareholders as interest attributable to shareholders’ equity. For accounting purposes, although the interest should be reflected in the statement of income for tax deduction, the charge is reversed before the calculation of the net income in the statutory financial statements and deducted from the shareholders’ equity since is considered as dividend. | |||||||||||||||||
(2) PIS and COFINS are considered a profit-base component (net basis of certain revenues and expenses), therefore and accordingly to IAS 12 it is recorded as income taxes. | |||||||||||||||||
(3) Tax-deductible goodwill originating from the acquisition of Banco ABN Amro Real S.A. (in 2007) as a result of a subsequent group restructuring. The amortization of the tax deductible goodwill is expected to continue until 2017 and the income tax benefit is shown in the income tax reconciliation. The tax-deductible goodwill is not considered to generate taxable temporary difference and thus no deferred income tax liability is recorded. | |||||||||||||||||
(4) Permanent difference related of foreign currency exchange variation on investments abroad nontaxable/ deductible (see details below). | |||||||||||||||||
(5) In 2015, includes the increase in CSLL tax rate | |||||||||||||||||
(6) Effect of rate differences for the other non-financial corporations, which the social contribution tax rate is 9%. | |||||||||||||||||
(7) In 2016, includes the IAS 21 amounted to R$575.131 (see Hedge of Investments Abroad below) and non-taxable income/non-deductible expenses R$349.120. | |||||||||||||||||
Cofins(8) | |||||||||||||||||
In June 2015, Banco Santander recorded the reversal of legal liabilities (recorded under tax liabilities - current) amounted to R$7,950 million related to Cofins. On the Consolidated Income Statements the registration occurred on "Interest expense and similar charges" amounted to R$2,057 million and "Income Taxes", amounted to R$5,893 million (Note 23-c.1). Such gain taxed at the current rates of IR and CSLL, resulted in a R$3,180 of tax expense also recorded in "Income taxes." | |||||||||||||||||
With this decision handed down on the lawsuits , the Bank also recognizes the right to offset COFINS paid in the period 1999-2006, under the Income taxes of R$381,597 and under Interest and similar income update as to tax offset the amount of R$383,560. The amount of taxes on these revenues amounted to R$306,102. | |||||||||||||||||
Hedge of Investments abroad(9) | |||||||||||||||||
Banco Santander operate a branch in the Cayman Islands and subsidiary called Santander Brasil Establecimiento Financiero de Credito, EFC, or “Santander EFC” (independent subsidiary in Spain) which used primarily for sourcing funds in the international banking and capital markets to provide credit lines, which are extended to our customers for working capital and trade-related financings. | |||||||||||||||||
The functional currency of Santander EFC is the Euro, so the exchange rate differences generated for converting that investment to the real are recorded in "Other comprehensive income". In the case of the Cayman branch, its functional currency is the Real. Thus, the foreign exchange differences of operations that are carried out in US dollars are recorded as a result. To hedge exposure to foreign exchange variations, the Bank uses derivative. According to Brazilian tax rules, gains or losses resulting from the impact of the appreciation or depreciation of the real on foreign investment are not taxable for PIS/ COFINS / IR / CSLL purposes while gains or losses from derivatives used as hedges are taxable. The purpose of these derivatives is to protect the net result after tax. Whereas the effect of exchange rate changes are not taxable, and the effect of changes in these derivatives suffer taxation, the notional of the derivative contracts is greater than the amount of net assets protected. | |||||||||||||||||
In the case of Santander EFC, the Bank uses hedge accounting (Net Investment Hedge). Changes in the value of derivatives, as well as related tax effect, are recorded in other comprehensive income, offsetting the exchange differences produced by the conversion of the investment for real when the hedges are effective. | |||||||||||||||||
In the case of the Cayman Islands branch, the Bank does not use hedge accounting. Exchange differences of operations in dollars and the effects of derivatives used for economic protection (futures contracts) are recorded in income. The different tax treatment of such exchange differences result in volatility in Operating Profit Before Tax and Tax on income account. Exchange rate variations recorded in results from operations in dollars in the Cayman branch in the nine months ended December 31, 2016, resulted in a loss of R$6,770 million. On the other hand, contracts for derivatives contracted to cover these positions generated a gain in earnings account (losses) on financial assets and liabilities of R$12,910 million. The tax effect of these derivatives impacted the line Income taxes, generating a tax loss of R$6,140 million consisting of R$600 million PIS/COFINS and R$5,539 million IR and CSLL. | |||||||||||||||||
b) Effective tax rate calculation | |||||||||||||||||
The effective tax rate is as follows: | |||||||||||||||||
| Thousands of Reais |
|
|
|
| 2016 |
| 2015 |
| 2014 | |||||||
| Operating Profit Before Tax |
|
|
|
|
| 16,383,902 |
| (3,215,718) |
| 6,443,329 | ||||||
| Income tax |
|
|
|
|
| 8,918,984 |
| (13,049,544) |
| 735,553 | ||||||
| Effective tax rate(1) |
|
|
|
|
| 54.44% |
| 405.80% |
| 11.42% | ||||||
(1) In 2016, 2015 and 2014, considering the tax effect of the exchange variation over foreign branches and the economic hedge, accounted in the Gains (losses) on financial assets and liabilities (net) (note 37) the effective tax rate would have been 27.1%, -18.3% and 29.6%, respectively. In 2015 there were the gain on the Cofins judicial action (see disclosure above), which excluding the effects the effective tax rate would be 19.1%. | |||||||||||||||||
c) Tax recognized in equity | |||||||||||||||||
In addition to the income tax recognized in the consolidated income statement, the Bank recognized the following amounts in consolidated equity: | |||||||||||||||||
| Thousands of Reais |
|
|
| 2016 |
| 2015 |
| 2014 | ||||||||
| Tax credited to equity |
|
|
|
|
| 2,955,552 |
| 4,943,957 |
| 2,477,167 | ||||||
| Measurement of available-for-sale securities |
|
|
|
|
| 963,990 |
| 2,743,797 |
| 756,760 | ||||||
| Measurement of cash flow hedges |
|
|
|
|
| 4,145 |
| 267,511 |
| 4,667 | ||||||
| Measurement of investment hedges |
|
|
|
|
| 562,353 |
| 1,137,484 |
| 467,992 | ||||||
| Defined benefit plan |
|
|
|
|
| 1,425,064 |
| 795,165 |
| 1,247,748 | ||||||
| Tax charged to equity |
|
|
|
|
| (1,795,115) |
| (1,255,867) |
| (748,528) | ||||||
| Measurement of available-for-sale securities |
|
|
|
|
| (1,701,732) |
| (1,251,773) |
| (654,582) | ||||||
| Measurement of cash flow hedges |
|
|
|
|
| (87,929) |
| (2,250) |
| (86,675) | ||||||
| Defined benefit plan |
|
|
|
|
| (5,454) |
| (1,844) |
| (7,271) | ||||||
| Total |
|
|
|
|
|
|
|
|
|
|
| 1,160,437 |
| 3,688,090 |
| 1,728,639 |
d) Deferred taxes | |||||||||||||||||
The detail of the balances of “Tax assets – Deferred” and “Tax liabilities – Deferred” is as follows: | |||||||||||||||||
| Thousands of Reais |
|
|
|
| 2016 |
| 2015 |
| 2014 | |||||||
| Deferred Tax assets |
|
|
|
|
| 24,437,112 |
| 30,575,504 |
| 20,038,000 | ||||||
| Of which: |
|
|
|
|
|
|
|
|
|
| ||||||
| Temporary differences(1) |
|
|
|
|
| 23,398,886 |
| 29,538,257 |
| 18,333,315 | ||||||
| Tax loss carry forwards |
|
|
|
|
| 382,867 |
| 381,888 |
| 1,049,326 | ||||||
| Social contribution taxes 18% |
|
|
|
|
| 655,359 |
| 655,359 |
| 655,359 | ||||||
| Tax offset |
|
|
|
|
| - |
| - |
| - | ||||||
| Total deferred tax assets |
|
|
|
|
| 24,437,112 |
| 30,575,504 |
| 20,038,000 | ||||||
|
|
|
|
|
|
|
|
|
|
|
|
|
|
|
|
|
|
| Deferred tax liabilities |
|
|
|
|
| 1,268,037 |
| 817,125 |
| 312,420 | ||||||
| Of which: |
|
|
|
|
|
|
|
|
|
| ||||||
| Excess depreciation of leased assets |
|
|
|
|
| 144,623 |
| 185,531 |
| 245,471 | ||||||
| Adjustment to fair value of trading securities and derivatives |
|
|
| 1,123,414 |
| 631,594 |
| 66,949 | ||||||||
| Total deferred tax liabilities |
|
|
|
|
| 1,268,037 |
| 817,125 |
| 312,420 | ||||||
(1) Temporary differences relate mainly to impairment losses on loans and receivables and provisions for judicial and administrative proceedings, and the effect of the fair value of financial instruments. | |||||||||||||||||
Accordingly, Banco Santander (Brasil) recognizes the tax credits based on the projection of taxable income for the Bank and each subsidiary individually, based on a history of profitability over a foreseeable horizon of up to 10 years considered as a reasonable level of security, given the economic scenario where the Bank operates. In the case of the tax loss was also considered the fiscal limitation of use of 30% of the taxable income of each year. | |||||||||||||||||
It was not recorded deferred tax assets related to tax loss and temporary differences in amount of R$1,085,272 in 2016 (2015 - R$1,438,349), R$1,084,230 on tax loss of Banco Santander (2015 - R$1,234,794) . Based on a technical study for the realization of deferred tax assets and liabilities drawn up by the Directors of Banco Santander, these tax credits should be accounted to the extent that it becomes probable that future taxable profit will allow their recovery. | |||||||||||||||||
The changes in the balances of “Tax Assets – Deferred” and “Tax Liabilities – Deferred” in the last three years were as follows: | |||||||||||||||||
| Thousands of Reais |
|
|
|
|
| Balances at December 31, 2015 |
| Adjustment to |
| Valuation adjustments(1) |
| Other(2) |
| Acquisition / Merger |
| Balances at December 31, 2016 |
| Deferred tax assets |
|
|
|
|
| 30,575,504 |
| (5,318,219) |
| (1,580,025) |
| 652,599 |
| 107,253 |
| 24,437,112 |
| Temporary differences |
|
|
| 29,538,257 |
| (5,319,198) |
| (1,580,025) |
| 652,599 |
| 107,253 |
| 23,398,886 | ||
| Tax loss carry forwards |
|
|
| 381,888 |
| 979 |
| - |
| - |
| - |
| 382,867 | ||
| Social contribution taxes 18% |
|
|
| 655,359 |
| - |
| - |
| - |
| - |
| 655,359 | ||
| Deferred tax liabilities |
|
|
| 817,125 |
| 25,666 |
| 947,628 |
| (523,182) |
| 800 |
| 1,268,037 | ||
| Temporary differences |
|
|
| 817,125 |
| 25,666 |
| 947,628 |
| (523,182) |
| 800 |
| 1,268,037 | ||
| Total |
|
|
|
|
| 29,758,379 |
| (5,343,885) |
| (2,257,653) |
| 1,175,781 |
| 106,453 |
| 23,169,075 |
| Thousands of Reais |
|
|
|
|
| Balances at December 31, 2014 |
| Adjustment to |
| Valuation adjustments(1) |
| Other(2) |
| Acquisition / Merger |
| Balances at December 31, 2015 |
| Deferred tax assets |
|
|
|
|
| 20,038,000 |
| 8,866,221 |
| 1,575,891 |
| 93,991 |
| 1,401 |
| 30,575,504 |
| Temporary differences |
|
|
| 18,333,315 |
| 9,535,994 |
| 1,575,891 |
| 93,991 |
| (934) |
| 29,538,257 | ||
| Tax loss carry forwards |
|
|
| 1,049,326 |
| (669,773) |
| - |
| - |
| 2,335 |
| 381,888 | ||
| Social contribution taxes 18% |
|
|
| 655,359 |
| - |
| - |
| - |
| - |
| 655,359 | ||
| Deferred tax liabilities |
|
|
| 312,420 |
| (551,692) |
| 962,406 |
| 93,991 |
| - |
| 817,125 | ||
| Temporary differences |
|
|
| 312,420 |
| (551,692) |
| 962,406 |
| 93,991 |
| - |
| 817,125 | ||
| Total |
|
|
|
|
| 19,725,580 |
| 9,417,913 |
| 613,485 |
| - |
| 1,401 |
| 29,758,379 |
| Thousands of Reais |
|
|
|
|
| Balances at December 31, 2013 |
| Adjustment to |
| Valuation adjustments(1) |
| Other(2) |
| Acquisition / Merger |
| Balances at December 31, 2014 |
| Deferred tax assets |
|
|
|
|
| 19,195,626 |
| 1,807,815 |
| 105,838 |
| (1,187,475) |
| 116,196 |
| 20,038,000 |
| Temporary differences |
|
|
| 17,131,721 |
| 2,222,326 |
| 105,838 |
| (1,187,475) |
| 60,905 |
| 18,333,315 | ||
| Tax loss carry forwards |
|
|
| 1,366,178 |
| (372,143) |
| - |
| - |
| 55,291 |
| 1,049,326 | ||
| Social contribution taxes 18% |
|
|
| 697,727 |
| (42,368) |
| - |
| - |
| - |
| 655,359 | ||
| Deferred tax liabilities |
|
|
| 1,623,593 |
| (248,057) |
| 124,359 |
| (1,187,475) |
| - |
| 312,420 | ||
| Temporary differences |
|
|
| 1,623,593 |
| (248,057) |
| 124,359 |
| (1,187,475) |
| - |
| 312,420 | ||
| Total |
|
|
|
|
| 17,572,033 |
| 2,055,872 |
| (18,521) |
| - |
| 116,196 |
| 19,725,580 |
(1) It relates to tax recognized in equity. | |||||||||||||||||
(2) In 2016, it mainly refers to net of deferred taxes amounted to R$523,182 (2015 - R$93,991 and 2014 - R$1,187,475), which have the same counterparty and realization period and R$1,343,410 related taxes to compensate. | |||||||||||||||||
e) Expected realization of deferred tax assets | |||||||||||||||||
| Year |
|
|
|
|
|
|
|
|
|
|
| Temporary differences |
| Tax loss carry forwards |
| Social contribution taxes 18% |
| 2017 |
|
|
|
|
|
|
|
|
|
|
| 6,903,158 |
| 104,401 |
| 32,254 |
| 2018 |
|
|
|
|
|
|
|
|
|
|
| 5,438,202 |
| 66,406 |
| 537 |
| 2019 |
|
|
|
|
|
|
|
|
|
|
| 6,516,520 |
| 35,755 |
| 18,998 |
| 2020 |
|
|
|
|
|
|
|
|
|
|
| 2,973,550 |
| 77,469 |
| 103,069 |
| 2021 |
|
|
|
|
|
|
|
|
|
|
| 273,869 |
| 41,564 |
| 451,685 |
| 2022 to 2024 |
|
|
|
|
|
|
|
|
|
|
| 564,872 |
| 45,813 |
| 48,816 |
| 2025 to 2026 |
|
|
|
|
|
|
|
|
|
|
| 728,715 |
| 11,459 |
| - |
| Total |
|
|
|
|
|
|
|
|
|
|
| 23,398,886 |
| 382,867 |
| 655,359 |
Projections of future taxable income include estimates referring to macroeconomic variables, exchange rate and interest rate fluctuations, the history of recent tax losses, among others, which may vary from the actual amounts. | |||||||||||||||||
f) Current Taxes | |||||||||||||||||
The current tax assets refers to the balance of Income, Social Contribution Taxes, PIS/COFINS Offset. | |||||||||||||||||
26. Other liabilities | |||||||||||||||||
The breakdown of the balance of “Other Liabilities” is as follows: | |||||||||||||||||
| Thousands of Reais |
|
| 2016 |
| 2015 |
| 2014 | |||||||||
| Accrued expenses and deferred income(1) |
|
|
|
|
|
|
| 2,925,598 |
| 2,480,666 |
| 2,444,231 | ||||
| Transactions in transit |
|
|
|
|
|
|
|
|
| 916,844 |
| 900,089 |
| 631,611 | ||
| Provision for share-based payment |
|
|
|
|
|
|
|
|
| 212,384 |
| 186,526 |
| 250,062 | ||
| Liabilities for insurance contracts |
|
|
|
|
|
|
|
|
| 1,584,303 |
| 1,365,793 |
| - | ||
| Other(2) |
|
|
|
|
|
|
|
|
|
|
| 2,559,970 |
| 1,917,122 |
| 2,020,981 |
| Total |
|
|
|
|
|
|
|
|
|
|
| 8,199,099 |
| 6,850,196 |
| 5,346,885 |
(1) Corresponds, mainly, the payments to be made - personnel expenses. | |||||||||||||||||
(2) Includes credits for funds to be released. | |||||||||||||||||
27. Other Comprehensive Income | |||||||||||||||||
The balances of Other Comprehensive Income include the amounts, net of the related tax effect, of the adjustments to assets and liabilities recognized temporarily in equity stated in the Consolidated Statement of Changes in Equity and Consolidated Statements of Comprehensive Income until they are extinguished or realized, when they are recognized in the consolidated income statement. The amounts attributable to subsidiaries, investments in associates and joint ventures are presented, on a line by line basis, in the appropriate items based on their nature. | |||||||||||||||||
It should be noted that the consolidated Statements of Comprehensive Income includes the changes to Other Comprehensive Income as follows: | |||||||||||||||||
- Revaluation gains (losses): This includes the amount of the gains, net of losses incurred in the year, recognized directly in equity. The amounts recognized in equity in the year remain under this item, even if in the same year they are transferred to the income statement or to the initial carrying amount of the assets or liabilities or are reclassified to another line item. | |||||||||||||||||
- Amounts transferred to income statement: This includes the amount of the revaluation gains (losses) previously recognized in equity, even in the same year, which are subsequently recognized in the income statement. | |||||||||||||||||
- Amounts transferred to the initial carrying amount of hedged items: This includes the amount of the revaluation gains (losses) previously recognized in Equity, even in the same year, which are recognized in the initial carrying amount of assets or liabilities as a result of cash flow hedges. | |||||||||||||||||
- Other transfers: This includes the amount of the transfers made in the year between the various Other Comprehensive Income items. | |||||||||||||||||
In the Consolidated Statements of Comprehensive Income the amounts in "Other Comprehensive Income" are recognized gross, including the amount relating to non-controlling interests, and the corresponding tax effect is presented under a separate item, except in the case of entities accounted for using the equity method, the amounts for which are presented net of the tax effect. | |||||||||||||||||
a) Available-for-sale financial assets | |||||||||||||||||
Other Comprehensive Income - Available-for-sale financial assets includes the net amount of unrealized changes in the fair value of assets classified as available-for-sale financial assets (see Notes 7 and 8), net of taxes. | |||||||||||||||||
The breakdown, by type of instrument and geographical origin of the issuer, of Other Comprehensive Income Available-for-sale financial assets at December 31, 2016, 2015 and 2014 is as follows: | |||||||||||||||||
| In thousand of reais |
|
|
|
| 2016 | |||||||||||
|
|
|
| Revaluation gains | Revaluation losses | Net revaluation gains/(losses) | Fair value | ||||||||||
Debt Instruments |
|
|
|
|
|
|
|
|
|
|
|
|
|
|
|
| |
Government debt securities |
|
|
|
|
|
|
| 454,609 |
| (31,288) |
| 423,321 |
| 50,384,382 | |||
Private-sector debt securities |
|
|
|
|
|
|
| 101,593 |
| (6,501) |
| 95,092 |
| 5,445,190 | |||
|
|
|
|
|
|
|
|
|
|
|
|
|
|
|
|
|
|
Equity instruments |
|
|
|
|
|
|
|
|
|
|
|
|
|
|
|
| |
Domestic |
|
|
|
|
|
|
|
|
| 220,535 |
| (72,758) |
| 147,777 |
| 1,985,473 | |
| Of which: |
|
|
|
|
|
|
|
|
|
|
|
|
|
|
|
|
| Listed |
|
|
|
|
|
|
|
|
| 147,844 |
| (50,269) |
| 97,575 |
| 1,024,505 |
| Unlisted |
|
|
|
|
|
|
|
|
| 72,691 |
| (22,489) |
| 50,202 |
| 960,968 |
| Total |
|
|
|
|
|
|
|
|
| 776,737 |
| (110,547) |
| 666,190 |
| 57,815,045 |
| In thousand of reais |
|
|
|
|
|
|
|
|
|
|
|
|
| 2015 | ||
|
|
|
| Revaluation gains | Revaluation losses | Net revaluation gains/(losses) | Fair value | ||||||||||
Debt Instruments |
|
|
|
|
|
|
|
|
|
|
|
|
|
|
|
| |
Government debt securities |
|
|
|
|
|
|
| 2,110 |
| (2,692,507) |
| (2,690,397) |
| 57,720,858 | |||
Private-sector debt securities |
|
|
|
|
|
|
| 10,585 |
| (67,277) |
| (56,692) |
| 9,382,416 | |||
|
|
|
|
|
|
|
|
|
|
|
|
|
|
|
|
|
|
Equity instruments |
|
|
|
|
|
|
|
|
|
|
|
|
|
|
|
| |
Domestic |
|
|
|
|
|
|
|
|
| 213,299 |
| (111,627) |
| 101,672 |
| 1,162,332 | |
| Of which: |
|
|
|
|
|
|
|
|
|
|
|
|
|
|
|
|
| Listed |
|
|
|
|
|
|
|
|
| 119,436 |
| (99,357) |
| 20,079 |
| 77,299 |
| Unlisted |
|
|
|
|
|
|
|
|
| 93,863 |
| (12,270) |
| 81,593 |
| 1,085,033 |
| Total |
|
|
|
|
|
|
|
|
| 225,994 |
| (2,871,411) |
| (2,645,417) |
| 68,265,606 |
| In thousand of reais |
|
|
|
|
|
|
|
|
|
|
|
|
| 2014 | ||
|
|
|
| Revaluation gains | Revaluation losses | Net revaluation gains/(losses) | Fair value | ||||||||||
Debt Instruments |
|
|
|
|
|
|
|
|
|
|
|
|
|
|
|
| |
Government debt securities |
|
|
|
|
|
|
| 137,165 |
| (286,905) |
| (149,740) |
| 52,557,244 | |||
Private-sector debt securities |
|
|
|
|
|
|
| 283,541 |
| (124,230) |
| 159,311 |
| 20,953,454 | |||
|
|
|
|
|
|
|
|
|
|
|
|
|
|
|
|
|
|
Equity instruments |
|
|
|
|
|
|
|
|
|
|
|
|
|
|
|
| |
Domestic |
|
|
|
|
|
|
|
|
| 535,849 |
| (472,128) |
| 63,721 |
| 1,653,644 | |
| Of which: |
|
|
|
|
|
|
|
|
|
|
|
|
|
|
|
|
| Listed |
|
|
|
|
|
|
|
|
| 467,854 |
| (431,239) |
| 36,615 |
| 542,188 |
| Unlisted |
|
|
|
|
|
|
|
|
| 67,995 |
| (40,889) |
| 27,106 |
| 1,111,456 |
| Total |
|
|
|
|
|
|
|
|
| 956,555 |
| (883,263) |
| 73,292 |
| 75,164,342 |
At each reporting date, the Bank assesses whether there is any objective evidence indicating that the available-for-sale financial assets (debt securities and equity instruments) are impaired. | |||||||||||||||||
This assessment includes but is not limited to an analysis of the following information: i) the issuer’s economic and financial position, any default or late payments, issuer’s solvency, the evolution of its business, short-term projections, trends observed with respect to its earnings and, if applicable, its dividend distribution policy; ii) market-related information such as changes in the general economic situation, changes in the issuer’s industry which might affect its ability to pay; iii) changes in the fair value of the security analyzed, and analysis of the reasons of such changes—whether they are specific to the security or the result of the general uncertainty concerning the economy or the country—and iv) independent analysts’ reports and forecasts and other independent market information. | |||||||||||||||||
In the case of equity instruments, when the changes in the fair value of the equity instrument being evaluated are assessed, the duration and significance of the decline in its market price below cost is taken into account. Nevertheless, it should be noted that the Bank assesses, on a case-by-case basis each of the equity instruments that have incurred losses, and monitors the performance of their market prices, recognizing an impairment loss as soon as it is determined that the recoverable amount could be decreased. | |||||||||||||||||
If, after completing the above assessment, the Bank considers that the presence of one or more of these factors affect recovery of the cost of the financial asset, an impairment loss is recognized in the consolidated income statement for the amount of the loss in equity under Other Comprehensive Income. Also, where the Bank does not intend and/or is not able to hold the investment for a sufficient amount of time to recover the cost, the financial asset is written down to its fair value. | |||||||||||||||||
b) Cash flow hedges | |||||||||||||||||
Other Comprehensive Income—Cash flow hedges includes the gains or losses attributable to hedging instruments that qualify as effective hedges. These amounts will remain under this heading until they are recognized in the consolidated income statement in the periods in which the hedged items affect it (see Note 9). | |||||||||||||||||
Accordingly, amounts representing valuation losses will be offset in the future by gains generated by the hedged items. | |||||||||||||||||
c) Hedges of net investments in foreign operations and Translation adjustments foreign investment | |||||||||||||||||
Other Comprehensive Incomes—Hedges of net investments in foreign operations includes the net amount of changes in the value of hedging instruments in hedges of net investments in foreign operations, for the portion of these changes considered as effective hedges (Note 9). | |||||||||||||||||
Other Comprehensive Income—Exchange differences includes the net amount of the differences arising on the translation to Reais of the balances of the consolidated entities whose functional currency is not the Reais (Note 2.a). | |||||||||||||||||
The Bank has recorded a transaction of investment hedge on its investment in Santander EFC, an independent subsidiary in Spain. Accordingly, amounts representing valuation losses will be offset in the future by gains generated by the hedged instruments. | |||||||||||||||||
28. Non-controlling interests | |||||||||||||||||
“Non-controlling interests” include the net amount of the equity of subsidiaries attributable to equity instruments that do not belong, directly or indirectly, to the Bank, including the portion attributed to them of profit for the year. | |||||||||||||||||
a) Breakdown | |||||||||||||||||
The detail, by company, of the balance of “Equity - Non-controlling interests” is as follows: | |||||||||||||||||
| Thousands of Reais |
|
| 2016 |
| 2015 |
| 2014 | |||||||||
| Santander Leasing S.A. Arrendamento Mercantil |
|
| 441 |
| 421 |
| 408 | |||||||||
| Santander Brasil Advisory Services S.A |
|
| 529 |
| 516 |
| 473 | |||||||||
| Super Pagamentos e Administração de Meios Eletrônicos S.A. |
|
| - |
| 14,664 |
| - | |||||||||
| Getnet S.A. |
|
| 168,863 |
| 176,278 |
| 155,217 | |||||||||
| Banco Olé Bonsucesso Consignado S.A. (Olé Consignado) (Current Company Name of Banco Bonsucesso Consignado) |
| 30,425 |
| 5,014 |
| - | ||||||||||
| Santander Serviços Técnicos, Administrativos e de Corretagem de Seguros |
| 318,498 |
| 238,169 |
| 224,075 | ||||||||||
| BW Guirapá S.A. |
| 68,691 |
| - |
| - | ||||||||||
| Banco PSA Finance Brasil S.A. |
| 138,057 |
| - |
| - | ||||||||||
| Total |
|
|
|
|
|
|
|
|
|
|
| 725,504 |
| 435,062 |
| 380,173 |
| Thousands of Reais |
|
|
|
|
|
|
|
|
|
|
| 2016 |
| 2015 |
| 2014 |
| Profit attributable to non-controlling interests |
|
|
| 130,355 |
| 50,086 |
| 77,753 | ||||||||
| Of which: |
|
|
|
|
|
|
|
|
|
|
|
|
|
|
|
|
| Santander Leasing S.A. Arrendamento Mercantil |
|
|
|
|
| 41 |
| 38 |
| 17 | ||||||
| Santander Brasil Advisory Services S.A |
|
|
|
|
| 34 |
| 49 |
| 24 | ||||||
| Super Pagamentos e Administração de Meios Eletrônicos S.A. |
|
|
|
|
| - |
| (2,379) |
| - | ||||||
| Getnet S.A. |
|
|
|
|
|
|
|
|
|
|
| 27,209 |
| 35,932 |
| 37,912 |
| Banco Olé Bonsucesso Consignado S.A. (Olé Consignado) (Current Company Name of Banco Bonsucesso Consignado) |
| 5,432 |
| 4,996 |
| - | ||||||||||
| Santander Serviços Técnicos, Administrativos e de Corretagem de Seguros |
|
|
| 98,717 |
| 10,859 |
| 40,182 | ||||||||
| BW Guirapá S.A. |
|
|
|
|
| (2,957) |
| - |
| - | ||||||
| Banco PSA Finance Brasil S.A. |
|
|
|
|
|
|
|
|
| 1,879 |
| - |
| - | ||
| Other companies |
|
|
|
|
|
|
|
|
|
|
| - |
| 591 |
| (382) |
b) Changes | |||||||||||||||||
The changes in the balance of “Non-controlling interests” are summarized as follows: | |||||||||||||||||
| Thousands of Reais |
|
|
|
|
|
|
|
|
|
|
| 2016 |
| 2015 |
| 2014 |
| Balance at beginning of year |
|
|
|
|
|
| 435,062 |
| 380,173 |
| 289,101 | |||||
| Change in the scope of consolidation(1) (2) |
|
|
|
|
|
| 159,469 |
| 16,608 |
| 60,744 | |||||
| Dividends paid / Interest on Capital |
|
|
|
|
|
| (18,140) |
| (2,754) |
| (47,216) | |||||
| Capital increase(3) |
|
|
|
|
|
| 20,000 |
| - |
| - | |||||
| Profit attributable to non-controlling interests |
|
|
|
|
|
|
| 130,355 |
| 50,086 |
| 77,753 | ||||
| Transition Adjustments to the amendments to the IAS 19 |
|
|
|
|
| (1,604) |
| 5,916 |
| (209) | ||||||
| Others |
|
|
|
|
|
|
|
|
|
|
| 362 |
| (14,967) |
| - |
| Balance at end of year |
|
|
|
|
|
| 725,504 |
| 435,062 |
| 380,173 | |||||
(1) In 2016 refers to the participation of non - controlling of BW Guirapá and Banco PSA Finance Brasil, in and 2014 refers to Getnet S.A., in 2015 refers to Super and in 2014 refers to Getnet S.A.. | |||||||||||||||||
(2) Includes the acquisition of the shares representing the remaining 50% of the voting capital of Super by Aymoré CFI (note 4.b). | |||||||||||||||||
| (3)Increases in the share capital of Olé Consignado. | |||||||||||||||||
29. Shareholders’ equity | |||||||||||||||||
a) Capital | |||||||||||||||||
According to the by-laws, Banco Santander's capital stock may be increased up to the limit of its authorized capital, regardless of statutory reform, by resolution of the Board of Directors and through the issuance of up to 9,090,909,090 (nine billion, ninety million, nine hundred and nine thousand and ninety) shares, subject to the established legal limits on the number of preferred shares. Any capital increase that exceeds this limit will require shareholders` approval. | |||||||||||||||||
The capital stock, fully subscribed and paid, is divided into registered book-entry shares with no par value. | |||||||||||||||||
|
|
|
|
|
|
| Thousands of shares | ||||||||||
2016 | 2015 | ||||||||||||||||
Common | Preferred | Total | Common | Preferred | Total | ||||||||||||
| Brazilian residents |
|
|
|
|
| 67,498 |
| 92,949 |
| 160,447 |
| 56,306 |
| 81,280 |
| 137,586 |
| Foreign residents |
|
|
|
|
| 3,783,473 |
| 3,619,163 |
| 7,402,636 |
| 3,794,666 |
| 3,630,833 |
| 7,425,499 |
| Total shares |
|
|
|
|
| 3,850,971 |
| 3,712,112 |
| 7,563,083 |
| 3,850,972 |
| 3,712,113 |
| 7,563,085 |
| (-) Treasury shares |
|
|
|
|
| (25,786) |
| (25,786) |
| (51,572) |
| (20,218) |
| (20,218) |
| (40,436) |
| Total outstanding |
|
|
|
|
| 3,825,185 |
| 3,686,326 |
| 7,511,511 |
| 3,830,754 |
| 3,691,895 |
| 7,522,649 |
|
|
|
|
|
|
| Thousands of shares | ||||||||||
2014 | |||||||||||||||||
Common | Preferred | Total | |||||||||||||||
| Brazilian residents |
|
|
|
|
|
|
|
|
|
|
| 127,192 |
| 153,105 |
| 280,297 |
| Foreign residents |
|
|
|
|
|
|
|
|
|
|
| 3,742,658 |
| 3,577,885 |
| 7,320,543 |
| Total shares |
|
|
|
|
|
|
|
|
|
|
| 3,869,850 |
| 3,730,990 |
| 7,600,840 |
| (-) Treasury shares |
|
|
|
|
|
|
|
|
|
|
| (29,612) |
| (29,612) |
| (59,224) |
| Total outstanding |
|
|
|
|
|
|
|
|
|
|
| 3,840,238 |
| 3,701,378 |
| 7,541,616 |
|
|
|
|
|
|
|
|
|
|
|
|
|
|
|
|
|
|
In 2015, issuance costs of the Global Offering of Shares held in October 2009, have been reclassified from Capital to Reserves heading for a better presentation amounted to R$193,616. | |||||||||||||||||
b) Dividends and Interest on Capital | |||||||||||||||||
According to the Bank’s bylaws, shareholders are entitled to a minimum dividend equivalent to 25% of net income for the year, adjusted according to legislation. Preferred shares are nonvoting and nonconvertible, but have the same rights and advantages granted to common shares, in addition to priority in the payment of dividends at a rate that is 10% higher than those paid on common shares, and in the capital reimbursement, without premium, in the event of liquidation of the Bank. | |||||||||||||||||
Dividend have been and will continue to be calculated and paid in accordance with Brazilian Corporate Law. | |||||||||||||||||
Prior to the annual shareholders meeting, the Board of Directors may resolve on the declaration and payment of dividends on earnings based on (i) balance sheets or earning reserves shown in the last balance sheet; or (ii) balance sheets issued in the period shorter than 6 months, provided that the total dividends paid in each half of the fiscal year shall not exceed the amount of capital reserves.These dividends are fully attributed to the mandatory dividend. | |||||||||||||||||
|
|
|
|
|
|
|
|
|
|
| 2016 | ||||||
Thousands of Reais | Real per Thousand Shares / Units | ||||||||||||||||
Common | Preferred | Units | |||||||||||||||
| Interest on Capital(1) (4) |
|
|
|
|
|
|
|
|
| 500,000 |
| 63.4290 |
| 69.7719 |
| 133.2009 |
| Intermediate Dividends(2) (5) |
|
|
|
|
|
|
|
|
| 700,000 |
| 88.8309 |
| 97.7140 |
| 186.5448 |
| Intercalary Dividends(2) (5) |
|
|
|
|
|
|
|
|
| 700,000 |
| 88.8309 |
| 97.7140 |
| 186.5448 |
| Interest on Capital(3) (5) |
|
|
|
|
|
|
|
|
| 3,350,000 |
| 425.1192 |
| 467.6311 |
| 892.7503 |
| Total |
|
|
|
|
|
|
|
|
| 5,250,000 |
|
|
|
|
|
|
(1) Established by the Board of Directors in June 2016, Common Shares - R$53.9146, preferred - R$59.3061 and Units - R$113.2207 net of taxes. | |||||||||||||||||
(2) Established by the Board of Directors in December 2016. | |||||||||||||||||
(3) Established by the Board of Directors in December 2016, Common Shares- R$361.3513, preferred - R$397.4864 and Units - R$758.8377 net of taxes. | |||||||||||||||||
(4) The amount of the interest on capital will be fully input into the mandatory dividends for the year 2016 and were be paid from August 26, 2016 without any compensation as monetary correction. | |||||||||||||||||
(5) The amount of intermediate, intercalary dividends and interest on capital will be fully attributed to supplementary and mandatory dividends for the year 2016 and will be paid from February 23, 2017, without any compensation to the restatement. | |||||||||||||||||
|
|
|
|
|
|
|
|
|
|
| 2015 | ||||||
Thousands of Reais | Real per Thousand Shares / Units | ||||||||||||||||
Common | Preferred | Units | |||||||||||||||
| Intercalary Dividends(1) (3) |
|
|
|
|
|
|
| 150,000 |
| 18.9474 |
| 20.8421 |
| 39.7895 | ||
| Intermediary Dividends(2) (4) |
|
|
|
|
|
|
| 3,050,000 |
| 385.8116 |
| 424.3927 |
| 810.2043 | ||
| Intercalary Dividends(3) (7) |
|
|
|
|
|
|
| 1,600,000 |
| 202.7412 |
| 223.0153 |
| 425.7564 | ||
| Interest on Capital (4) (7) |
|
|
|
|
|
|
|
|
| 1,400,000 |
| 177.3985 |
| 195.1384 |
| 372.5369 |
| Total |
|
|
|
|
|
|
|
|
| 6,200,000 |
|
|
|
|
|
|
(1) Established by the Board of Directors in March 2015. | |||||||||||||||||
(2) Established by the Board of Directors in September 2015. | |||||||||||||||||
(3) Established by the Board of Directors in December 2015. | |||||||||||||||||
(4) Established by the Board of Directors in December 2015, Common Shares - R$150.7887, preferred - R$165.8676 and Units - R$316.6563 net of taxes. | |||||||||||||||||
(5) The amount of the interim dividend were fully attributed to supplementary and mandatory dividends, respectively, for the year 2015 and were paid from August 28, 2015, without any compensation to the restatement. | |||||||||||||||||
(6) The amount of the interim dividend were fully attributed to supplementary and mandatory dividends, respectively, for the year 2015 and were paid from October 05, 2015, without any compensation to the restatement. | |||||||||||||||||
(7) The amount of the interim dividends and interest on capital were fully input into the mandatory dividends for the year 2015 and were paid from February 25, 2016, without any compensation as monetary correction. | |||||||||||||||||
|
|
|
|
|
|
|
|
|
|
| 2014 | ||||||
Thousands of Reais | Reais per Thousand Shares / Units | ||||||||||||||||
Common | Preferred | Units | |||||||||||||||
| Interim Dividends (1) (5) |
|
|
|
|
|
|
|
|
| 99,807 |
| 12.6008 |
| 13.8609 |
| 26.4617 |
| Intercalary Dividends (1) (5) |
|
|
|
|
|
|
|
|
| 120,193 |
| 15.1745 |
| 16.6919 |
| 31.8664 |
| Intercalary Dividends (2) (5) |
|
|
|
|
|
|
|
|
| 400,000 |
| 50.5005 |
| 55.5505 |
| 106.0510 |
| Intercalary Dividends (3) (6) |
|
|
|
|
|
|
|
|
| 220,000 |
| 27.7738 |
| 30.5512 |
| 58.3250 |
| Interest on Capital (4) (6) |
|
|
|
|
|
|
|
|
| 690,000 |
| 87.2120 |
| 95.9332 |
| 183.1452 |
| Total |
|
|
|
|
|
|
|
|
| 1,530,000 |
|
|
|
|
|
|
(1) Established by the Board of Directors in March 2014. | |||||||||||||||||
(2) Established by the Board of Directors in June 2014. | |||||||||||||||||
(3) Established by the Board of Directors in September 2014. | |||||||||||||||||
(4) Established by the Board of Directors in December 2014, common R$74.1309, preferred - R$81.5442 e units - R$155.6751, net of taxes. | |||||||||||||||||
(5) The amount of interim and intercalary dividends were fully attributed to supplementary and mandatory dividends for the year 2014 and were paid from August 28, 2014, without any compensation to the restatement. | |||||||||||||||||
(6) The amount of intercalary dividends were fully attributed to supplementary and mandatory dividends for the year 2014 and were paid from February 26, 2015, without any compensation to the restatement. | |||||||||||||||||
c) Reserves | |||||||||||||||||
The reserves are allocated as follows after the deductions and statutory provisions, from the net income: | |||||||||||||||||
Legal reserve | |||||||||||||||||
In accordance with Brazilian Corporate Law, 5% is transferred to the legal reserve, until it reaches 20% of the share capital. This reserve is designed to ensure the integrity of the capital and can only be used to offset losses or increase capital. | |||||||||||||||||
Capital reserve | |||||||||||||||||
The Bank´s capital reserve consists of: reserve of goodwill for the subscription of shares and other capital reserves, and can only be used to absorb losses that exceed retained earnings and profit reserves, redemption, repayment or purchase of shares of our treasury; incorporation of the capital, or payment of dividends to preferred shares in certain circumstances. | |||||||||||||||||
Reserve for equalization dividend | |||||||||||||||||
After the destination of dividends, the remaining balance if any, may, upon proposal of the Executive Board and approved by the Board of Directors, be designated to constitute a reserve for equalization of dividends, which is limited to 50% of the Capital. This reserve aims to ensure funds for the payment of dividends, including the form of Interest on Capital, or any interim payment to maintain the flow of shareholders remuneration. | |||||||||||||||||
d) Treasury shares | |||||||||||||||||
In the meeting held on November 3, 2016, the Bank’s Board of Directors approved, in continuation of the buyback program that expired on November 4, 2016, the buyback program of its Units and ADRs, by the Bank or its agency in Cayman, to be held in treasury or subsequently sold. | |||||||||||||||||
The Buyback Program will cover the acquisition up to 38,402,972 Units, representing 38,402,972 common shares and 38,402,972 preferred shares, or the ADRs, which, on September 30, 2016, corresponded to approximately 1.02% of the Bank’s share capital. On September 30, 2016, the Bank held 384,029,725 common shares and 411,834,140 preferred shares being traded. | |||||||||||||||||
The Buyback has the purpose to (1) maximize the value creation to shareholders by means of an efficient capital structure management; and (2) enable the payment of officers, management level employees and others Bank’s employees and companies under its control, according to the Long Term Incentive Plans. | |||||||||||||||||
The term of the Buyback Program is 365 days counted from November 4, 2016, and will expire on November 3, 2017. | |||||||||||||||||
|
|
|
|
|
|
|
|
| 2016 |
|
|
| 2015 |
|
|
| 2014 |
Quantity | Quantity | Quantity | |||||||||||||||
Units | ADRs | Units | ADRs |
| Units | ADRs | |||||||||||
| Treasury shares at beginning of the period |
| 7,080,068 |
| 13,137,665 |
| 16,531,177 |
| 13,080,565 |
| 11,823,638 |
| 6,748,347 | ||||
| Shares Acquisitions |
|
|
|
|
| 14,284,400 |
| - |
| 13,873,413 |
| 57,100 |
| 7,425,000 |
| 6,332,218 |
| Cancellation of ADRs(1) |
|
|
|
|
| 13,137,665 |
| - 13,137,665 |
| - |
| - |
| - |
| - |
| Cancellation of Shares(2) |
|
|
|
|
| - |
| - |
| (18,878,954) |
| - |
| - |
| - |
| Payment - Share-based compensation |
| (8,716,213) |
| - |
| (4,445,568) |
| - | (2,717,461) |
| - | |||||
| Treasury shares at end of period |
| 25,785,920 |
| - |
| 7,080,068 |
| 13,137,665 |
| 16,531,177 |
| 13,080,565 | ||||
| Balance of Treasury Shares in thousands of reais(2) (3) | R$ 513,889 |
| R$ 0 |
| R$ 106,764 |
| R$ 317,094 |
| R$ 230,420 |
| R$ 215,036 | |||||
|
|
|
|
|
|
|
|
|
|
|
|
|
| ||||
| Cost/Market Value |
|
|
|
|
| Units |
| ADRs |
| Units |
| ADRs |
| Units |
| ADRs |
| Minimum cost |
|
|
|
|
| R$ 7.55 |
| US$ 4,37 |
| R$ 11.01 |
| US$ 4,37 |
| R$ 11.01 |
| US$ 4,61 |
| Weighted average cost |
|
|
| R$ 16.43 |
| US$ 6,17 |
| R$ 14.28 |
| US$ 6,17 |
| R$ 14.23 |
| US$ 6,18 | ||
| Maximum cost |
|
|
|
|
| R$ 26.81 |
| US$ 10,21 |
| R$ 18.51 |
| US$ 10,21 |
| R$ 18.52 |
| US$ 10,21 |
| Market value |
|
|
|
|
| R$ 28.32 |
| US$ 8,58 |
| R$ 16.04 |
| US$ 3,89 |
| R$ 13.46 |
| US$ 5,02 |
(1) In January 2016 was the transformation of all ADRs that were held in treasury for UNIT's. | |||||||||||||||||
(2) Extraordinary General Meeting held on December 14, 2015 the cancellation of 18,878,954 Units was approved (18,878,954 ON and 18,878,954 PN totaling 37,757,908 treasury shares) equivalent to R$268,573. | |||||||||||||||||
(3) The total number of treasury shares on December 31, 2016 is R$514,034 (2015 - R$423,953 and 2014 - R$445,501) and includes issuance costs amounted to R$145 (2015 - R$95 and 2014 - R$45). | |||||||||||||||||
Additionally, in the year ended December 31, 2016, treasury shares were sold, that resulted in a loss of R$11,574 (2015 - R$3,918 and 2014 - R$4,926) recorded directly in equity in capital reserves. | |||||||||||||||||
e) Plan to Optimize the Regulatory Capital | |||||||||||||||||
On September 26, 2013, the Bank disclosed a Material Fact announcing that, in order to optimize its capital structure, the Board of Directors submitted a proposal to optimize the composition of Banco Santander’s regulatory capital to the shareholders for their approval ("PR Optimization Plan"). The aim is to establish a more efficient capital structure, consistent with the new prudent capital rules and aligned with Banco Santander’s business plan and asset growth. The PR Optimization Plan had the following items: (i) the redistribution of equity to the shareholders of Banco Santander in the total amount of R$6,000,000, with no reduction in the number of shares; (ii) the issuance abroad of capital instruments to compose Tier I and Tier II of Banco Santander’s regulatory capital and; (iii) a bonus share program and an adjustment in the composition of the Units, followed by a reverse share split (inplit), with the purpose of eliminating trading in cents. | |||||||||||||||||
Equity Distributions | |||||||||||||||||
On November 1, 2013, the proposals for return of funds to shareholders was approved on Shareholders’ Meeting. In January 2014, conditions for effective recovery of resources (end of the period of opposition from unsecured creditors, approval by the Bacen and filing the minutes of the meeting at the Junta Comercial do Estado de São Paulo - JUCESP) were satisfied. The Equity Distributions to shareholders occurred on January 29, 2014, and the Bank's shares and Units have been traded ex-rights to the Equity Distributions since January 15, 2014. | |||||||||||||||||
Issuance Notes | |||||||||||||||||
On January 14, 2014 the Board of Directors approved the issuance of notes outside Brazil, in dollars, amounting to R$6,000,000.The issuance of Notes held on January 29, 2014. | |||||||||||||||||
The specific characteristics of the Notes issued to compose the Tier I are: (a) Notional: US$1,247,713, equivalent to R$3,000,000, (b) Interest Rate: 7.375% p.a. (c) Maturity: The Tier I Notes shall be perpetual; (d) Frequency of interest payment: interest will be paid quarterly from April 29, 2014; (e) Discretion: Banco Santander can cancel the distribution of interest at any time, for an unlimited period, with no accumulation rights and this suspension shall not be considered as a default event; (f) Subordination: in the case of insolvency, the Notes' financial settlement is subordinated to all Tier II capital instruments. The specific characteristics of the Notes issued to form the Tier II are: (a) Notional: US$1,247,713, equivalent to R$3,000,000 (b) Interest Rate: 6.0% p.a. (c) Maturity: the Tier II Notes will mature on January 29, 2024, and (d) Frequency of interest payment: interest payable semi-annually from July 29, 2014. | |||||||||||||||||
On April 15, 2014, the Bacen approved the issued notes to compose the Tier I and Tier II of Bank’s regulatory capital since the issuance date. | |||||||||||||||||
Bonus Shares and Share Reverse Split (inplit) | |||||||||||||||||
With the purposes of eliminating the trading in cents of SANB3 (common) and SANB4 (preferred) shares, increasing liquidity and reducing costs of transaction thereof, on March 18, 2014, our shareholders, in the extraordinary general meeting approved, (i) a bonus share of 19,002,100,957 preferred shares to our shareholders, at the ratio of 0.047619048 preferred shares for each common share (SANB3) or preferred share (SANB4), which results in bonus share of five (5) preferred shares for each Unit (SANB11), through the capitalization of reserves in the amount of R$171,799; and (ii) share reverse split (inplit) of the totality of our common shares and preferred shares in a ratio of 1:55, so that each fifty-five (55) common shares and fifty-five (55) preferred shares will henceforth correspond to one (1) common share and one (1) preferred share, respectively. As a result, each Unit (SANB11) will be comprised of one common share and one preferred share.These events were implemented on June 2, 2014. | |||||||||||||||||
Exchange Offer | |||||||||||||||||
On April 29, 2014 the Bank published Material Fact in order to inform that it was informed by its indirect controlling shareholder, Banco Santander Spain, that it would launch a voluntary exchange offer in Brazil and United States for acquisition of up to the totality of the shares of Banco Santander that are not held by Banco Santander Spain, which represented approximately 25% of Banco Santander’s share capital, with payment in shares of Banco Santander Spain. As a result of the Transaction, Bank would continue to be a listed company, although it would change from the Level 2 (Nivel 2) of Corporate Governance of BM&FBovespa to the traditional segment. | |||||||||||||||||
On June 9, 2014, it was held an extraordinary shareholder meeting, which resolved on the following Agenda: (a) the exit of the Bank from Level 2 of Corporate Governance; and (b) the selection of the specialized firm NM Rothschild & Sons (Brasil) Ltda., to be hired to prepare a valuation report, called a “laudo”, based on the Bank’s economic value, for purposes of the Exchange Offer and the consequent exit from Level 2. | |||||||||||||||||
On June 13, 2014, the Bank published Material Fact, in order to inform that the valuation report, called a “laudo”, prepared by N M Rothschild & Sons (Brasil) Ltda., was duly filed on the date hereof with (i) the CVM; (ii) the BM&FBovespa; and (iii) the U.S. Securities and Exchange Commission - SEC. The Company informed as well that an application for registration of the Exchange Offer was duly filed with the CVM on the date hereof. | |||||||||||||||||
On October 2, 2014 Banco Santander´s Board of Directors issued an opinion regarding the Offer and Banco Santander filed with the U.S. Securities and Exchange Commission its position with respect to the proposed transaction by means of a Schedule 14D-9. On October 16, 2014 Banco Santander Spain and Banco Santander disclosed to the market the adjustment of exchange ratio of the Voluntary Exchange Tender Offer referred to in the Public Notice (edital) published on September 18, 2014. In accordance with the Public Notice, the exchange ratio, and consequently the amount of BDR that entitles each Subscription Receipt, was adjusted from 0.70 BDR for each Unit BDR and 0.35 BDR for each share, either ordinary or preferred, to 0.7152 BDR each Unit and 0.3576 BDR for each share, either ordinary or preferred, in view of the compensation declared by Banco Santander Spain on October 16, 2014, under the Santander Dividendo Elección program, with record date on October 17, 2014. | |||||||||||||||||
On October 31, 2014, Banco Santander together with Banco Santander Spain has published a Material Fact regarding the Exchange Offers Results. Banco Santander Spain acquired 1,640,644 shares and 517,827,702 Units, representing, together, 13.65% of the share capital of Bank, thereby, the participation of Grupo Santander in Banco Santander would be 88.30% of its total share capital, 88.87% of its common shares and 87.71% of its preferred shares, considering also the American Depositary Receipts - ADRs representative of Units acquired in the Exchange in the USA. As consequence of the Offer, Santander Brasil´s shares are no longer listed on Level 2 of BM&FBovespa, and are trading on the traditional listing segment. | |||||||||||||||||
30. Earnings per share | |||||||||||||||||
a) Basic earnings per share | |||||||||||||||||
Basic earnings per share is calculated by dividing the net profit attributable to the Parent by the weighted average outstanding shares during the year average number, excluding the average number of own shares held during the year and held in treasury. | |||||||||||||||||
|
|
|
|
|
|
|
|
|
|
|
|
| 2016 |
| 2015 |
| 2014 |
Profit attributable to the Parent |
|
|
|
|
|
|
|
| 7,334,563 |
| 9,783,740 |
| 5,630,023 | ||||
|
|
|
|
|
|
|
|
|
|
|
|
|
|
|
|
|
|
Earnings per share (Brazilian Reais) |
|
|
|
|
|
|
|
|
|
|
|
| |||||
Basic earnings per 1,000 shares (Brazilian Reais) |
|
|
|
|
|
|
|
|
|
|
|
|
|
|
|
|
|
Common shares |
|
|
|
|
|
|
|
|
|
|
| 929.93 |
| 1,236.96 |
| 709.69 | |
Preferred shares |
|
|
|
|
|
|
|
|
|
|
| 1,022.92 |
| 1,360.66 |
| 780.66 | |
Net Profit attributable - Basic (Brazilian Reais) |
|
|
|
|
|
|
|
|
|
|
|
|
|
|
|
|
|
Common shares |
|
|
|
|
|
|
|
|
|
|
| 3,560,288 |
| 4,748,896 |
| 2,733,205 | |
Preferred shares |
|
|
|
|
|
|
|
|
|
|
| 3,774,275 |
| 5,034,844 |
| 2,896,818 | |
|
|
|
|
|
|
|
|
|
|
|
| ||||||
Weighted average shares outstanding - Basic |
|
|
|
|
|
|
|
|
|
|
|
|
|
|
|
|
|
Common shares |
|
|
|
|
|
|
|
|
|
|
| 3,828,555 |
| 3,839,159 |
| 3,851,278 | |
Preferred shares |
|
|
|
|
|
|
|
|
|
|
| 3,689,696 |
| 3,700,299 |
| 3,710,746 | |
b) Diluted earning per share | |||||||||||||||||
The diluted earnings per share is calculated by dividing the net profit attributable to the Parent by the weighted average outstanding shares during the year average number, excluding the average number of own shares held during the year and held in treasury, including the effect of dilutive potential programs long-term compensation. | |||||||||||||||||
|
|
|
|
|
|
|
|
|
|
|
|
| 2016 |
| 2015 |
| 2014 |
Profit attributable to the Parent |
|
|
|
|
|
|
|
| 7,334,563 |
| 9,783,740 |
| 5,630,023 | ||||
|
|
|
|
|
|
|
|
|
|
|
|
|
|
|
|
|
|
Earnings per share (Brazilian Reais) | |||||||||||||||||
Diluted earnings per 1,000 shares (Brazilian Reais) | |||||||||||||||||
Common shares |
|
|
|
|
|
|
|
|
|
|
| 929.03 |
| 1,235.79 |
| 709.40 | |
Preferred shares |
|
|
|
|
|
|
|
|
|
|
| 1,021.93 |
| 1,359.36 |
| 780.34 | |
Net Profit attributable - Basic (Brazilian Reais) | |||||||||||||||||
Common shares |
|
|
|
|
|
|
|
|
|
|
| 3,560,222 |
| 4,748,810 |
| 2,733,184 | |
Preferred shares |
|
|
|
|
|
|
|
|
|
|
| 3,774,341 |
| 5,034,930 |
| 2,896,839 | |
|
|
|
|
|
|
|
|
|
|
|
|
|
|
|
|
|
|
Weighted average shares outstanding (in thousands) - Diluted | |||||||||||||||||
Common shares |
|
|
|
|
|
|
|
|
|
|
| 3,832,211 |
| 3,842,744 |
| 3,852,823 | |
Incremental shares from stock options granted under Stock Option Plan - Units |
|
| 3,656 |
| 3,585 |
| 1,545 | ||||||||||
|
|
|
|
|
|
|
|
|
|
|
|
|
|
|
|
|
|
Preferred shares |
|
|
|
|
|
|
|
|
|
|
| 3,693,352 |
| 3,703,884 |
| 3,712,291 | |
Incremental shares from stock options granted under Stock Option Plan - Units |
|
| 3,656 |
| 3,585 |
| 1,545 | ||||||||||
31. Fair value of financial assets and liabilities | |||||||||||||||||
Under IFRS 13, fair value measurement using a fair value hierarchy that reflects the model used in the measurement process should be in accordance with the following hierarchical levels: | |||||||||||||||||
Level 1:Determined on the basis of public (unadjusted) prices in active markets for identical assets and liabilities, these include public debt securities, stocks, derivatives listed. | |||||||||||||||||
Level 2: Are those derived from inputs other than quoted prices included within Level 1 that are observable for the asset or liability, either directly (as prices) or indirectly (derived from prices). | |||||||||||||||||
Level 3: Are those derived from valuation techniques that include inputs for the asset or liability that are not based on observable market data (unobservable inputs). | |||||||||||||||||
Trading Financial Assets, Others financial assets at fair value on through profit or loss, Available-for-sale financial assets and Financial liabilities held for trading. | |||||||||||||||||
Level 1:The securities with high liquidity and observable prices in an active market are classified as level 1. At this level were classified most of the Brazilian Government Securities (mainly LTN, LFT, NTN-B, NTN-C and NTN-F), shares in stocks and other securities traded in an active market. | |||||||||||||||||
Level 2: When price quotations cannot be observed, the Management, using their own internal models, make their best estimate of the price that would be set by the market. These models use data based on observable market parameters as an important reference. Various techniques are used to make these estimates, including the extrapolation of observable market data and extrapolation techniques. The best evidence of fair value of a financial instrument on initial recognition is the transaction price, unless the fair value of the instrument can be obtained from other market transactions carried out with the same instrument or similar instruments or can be measured using a valuation technique in which the variables used include only data from observable market, especially interest rates. These securities are classified within Level 2 of the fair value hierarchy and are composed mainly by Private Securities (prominently on Debenture portfolio) in a market with less liquidity than those classified at Level 1. | |||||||||||||||||
Level 3: When there is information that is not based on observable market data, Banco Santander uses internally developed models, from curves generated according to the internal model. Level 3 comprises mainly unlisted shares that are not generally traded in an active market. | |||||||||||||||||
Derivatives | |||||||||||||||||
Level 1:Derivatives traded on exchanges are classified in Level 1 of the hierarchy. | |||||||||||||||||
Level 2:For the valuation derivatives traded over the counter, and the valuation of financial instruments (primarily swaps and options), are usually used as observable market data: exchange rates, interest rates, volatility, correlation between indexes and market liquidity. | |||||||||||||||||
When pricing the financial instruments mentioned, uses the method of the Black-Scholes model (exchange rate options, interest rate options; caps and floors) and the method of present value (discount of future values by market curves). | |||||||||||||||||
Level 3:Derivatives not traded in the stock market and that do not have an observable data in a active market were classified as Level 3, these and are composed of complex derivatives. | |||||||||||||||||
The following table shows a summary of the fair values of financial assets and liabilities for the years ended December 31, 2016, 2015 and 2014, classified based on several measurement methods adopted by the Bank to determine fair value: | |||||||||||||||||
| In thousands of Reais |
|
|
|
|
| 2016 | ||||||||||
Level 1(1) | Level 2(1) | Level 3 | Total | ||||||||||||||
| Financial assets held for trading |
| 59,410,908 |
| 25,462,755 |
| - |
| 84,873,663 | ||||||||
| Debt instruments |
|
|
|
|
|
|
|
|
| 59,034,363 |
| 960,583 |
| - |
| 59,994,946 |
| Equity instruments |
|
|
|
|
|
|
|
|
| 376,545 |
| 21,916 |
| - |
| 398,461 |
| Trading derivatives |
|
|
|
|
|
|
|
|
| - |
| 24,480,256 |
| - |
| 24,480,256 |
| Other financial assets at fair value through profit or loss |
| 1,597,660 |
| 76,035 |
| 37,509 |
| 1,711,204 | ||||||||
| Debt instruments |
|
|
|
|
|
|
|
|
| 1,592,714 |
| 76,035 |
| - |
| 1,668,749 |
| Equity instruments |
|
|
|
|
|
|
|
|
| 4,946 |
| - |
| 37,509 |
| 42,455 |
| Available-for-sale financial assets |
| 51,160,044 |
| 5,703,389 |
| 951,612 |
| 57,815,045 | ||||||||
| Debt instruments |
|
|
|
|
|
|
|
|
| 50,172,609 |
| 5,656,963 |
| - |
| 55,829,572 |
| Equity instruments |
|
|
|
|
|
|
|
|
| 987,435 |
| 46,426 |
| 951,612 |
| 1,985,473 |
| Hedging derivatives (assets) |
| - |
| 222,717 |
| - |
| 222,717 | ||||||||
| Financial liabilities held for trading |
| 31,694,269 |
| 19,925,600 |
| - |
| 51,619,869 | ||||||||
| Trading derivatives |
|
|
|
|
|
|
|
|
| - |
| 19,925,600 |
| - |
| 19,925,600 |
| Short positions |
|
|
|
|
|
|
|
|
| 31,694,269 |
| - |
| - |
| 31,694,269 |
| Hedging derivatives (liabilities) |
| - |
| 311,015 |
| - |
| 311,015 | ||||||||
(1) There was no transfer between levels 1 and 2. | |||||||||||||||||
| In thousands of Reais |
| 2015 | ||||||||||||||
| Level 2 | Level 3 | Total | ||||||||||||||
| Financial assets held for trading |
| 24,952,744 |
| 25,583,987 |
| - |
| 50,536,731 | ||||||||
| Debt instruments |
|
|
|
|
|
|
| 24,579,100 |
| 614,498 |
| - |
| 25,193,598 | ||
| Equity instruments |
|
|
|
|
|
|
| 373,644 |
| 31,329 |
| - |
| 404,973 | ||
| Trading derivatives |
|
|
|
|
|
|
| - |
| 24,938,160 |
| - |
| 24,938,160 | ||
| Other financial assets at fair value through profit or loss |
| 1,420,332 |
| 86,238 |
| 573,664 |
| 2,080,234 | ||||||||
| Debt instruments |
|
|
|
|
|
|
| 1,420,332 |
| 86,238 |
| - |
| 1,506,570 | ||
| Equity instruments |
|
|
|
|
|
|
| - |
| - |
| 573,664 |
| 573,664 | ||
| Available-for-sale financial assets |
| 56,497,320 |
| 10,910,469 |
| 857,817 |
| 68,265,606 | ||||||||
| Debt instruments |
|
|
|
|
|
|
| 56,250,013 |
| 10,853,261 |
| - |
| 67,103,274 | ||
| Equity instruments |
|
|
|
|
|
|
| 247,307 |
| 57,208 |
| 857,817 |
| 1,162,332 | ||
| Hedging derivatives (assets) |
| - |
| 1,312,202 |
| - |
| 1,312,202 | ||||||||
| Financial liabilities held for trading |
| 20,047,631 |
| 22,340,137 |
| - |
| 42,387,768 | ||||||||
| Trading derivatives |
|
|
|
|
|
|
| - |
| 22,340,137 |
| - |
| 22,340,137 | ||
| Short positions |
|
|
|
|
|
|
| 20,047,631 |
| - |
| - |
| 20,047,631 | ||
| Hedging derivatives (liabilities) |
| - |
| 2,376,822 |
| - |
| 2,376,822 | ||||||||
| In thousands of Reais |
| 2014 | ||||||||||||||
| Level 2 | Level 3 | Total | ||||||||||||||
| Financial assets held for trading |
| 46,771,577 |
| 9,238,697 |
| 3,329 |
| 56,013,603 | ||||||||
| Debt instruments |
|
|
|
|
|
|
| 46,478,155 |
| 628,656 |
| - |
| 47,106,811 | ||
| Equity instruments |
|
|
|
|
|
|
| 293,422 |
| 94,905 |
| 3,329 |
| 391,656 | ||
| Trading derivatives |
|
|
|
|
|
|
| - |
| 8,515,136 |
| - |
| 8,515,136 | ||
| Other financial assets at fair value through profit or loss |
| - |
| 93,900 |
| 902,794 |
| 996,694 | ||||||||
| Debt instruments |
|
|
|
|
|
|
| - |
| 93,900 |
| - |
| 93,900 | ||
| Equity instruments |
|
|
|
|
|
|
| - |
| - |
| 902,794 |
| 902,794 | ||
| Available-for-sale financial assets |
| 54,241,121 |
| 20,025,265 |
| 897,956 |
| 75,164,342 | ||||||||
| Debt instruments |
|
|
|
|
|
|
| 53,668,491 |
| 19,842,207 |
| - |
| 73,510,698 | ||
| Equity instruments |
|
|
|
|
|
|
| 572,630 |
| 183,058 |
| 897,956 |
| 1,653,644 | ||
| Hedging derivatives (assets) |
| - |
| 212,552 |
| - |
| 212,552 | ||||||||
| Financial liabilities held for trading |
| 11,285,431 |
| 8,284,360 |
| - |
| 19,569,791 | ||||||||
| Trading derivatives |
|
|
|
|
|
|
| - |
| 8,284,360 |
| - |
| 8,284,360 | ||
| Short positions |
|
|
|
|
|
|
| 11,285,431 |
| - |
| - |
| 11,285,431 | ||
| Hedging derivatives (liabilities) |
| - |
| 893,902 |
| - |
| 893,902 | ||||||||
Certain financial instruments in 2014 and 2015 have been reclassified in the table above in line with the submission of 2016. | |||||||||||||||||
Movements in fair value of Level 3 | |||||||||||||||||
The following tables demonstrate the movements during 2016, 2015 and 2014 for the financial assets and liabilities classified as Level 3 in the fair value hierarchy: | |||||||||||||||||
| In thousand of reais |
| Fair Value |
| Gains/ losses (Realized-Not Realized) |
| Transfers in and/ or out of Level 3 |
| Additions |
| Settled |
| Fair value | ||||
|
|
|
|
|
|
|
|
|
|
|
|
|
|
|
|
|
|
| Other financial assets at fair value through profit or loss | 573,664 |
| 2,806 |
| (14,345) |
| 111 |
| (524,727) |
| 37,509 | |||||
| Available-for-sale financial assets | 857,817 |
| (60,934) |
| (3,085) |
| 461,185 |
| (303,371) |
| 951,612 | |||||
| In thousand of reais |
| Fair Value |
| Gains/ losses (Realized-Not Realized) |
| Transfers in and/ or out of Level 3 |
| Additions |
| Settled |
| Fair value | ||||
|
|
|
|
|
|
|
|
|
|
|
|
|
|
|
|
|
|
| Financial assets held for trading |
| 3,329 |
| - |
| - |
| - |
| (3,329) |
| - | ||||
| Other financial assets at fair value through profit or loss |
| 902,794 |
| (329,130) |
| - |
| - |
| - |
| 573,664 | ||||
| Available-for-sale financial assets |
| 897,956 |
| (58,008) |
| - |
| 54,785 |
| (36,916) |
| 857,817 | ||||
| In thousand of reais |
| Fair Value |
| Gains/ losses (Realized-Not Realized) |
| Transfers in and/ or out of Level 3 |
| Additions |
| Settled |
| Fair value | ||||
|
|
|
|
|
|
|
|
|
|
|
|
|
|
|
|
|
|
| Financial assets held for trading |
| 3,453 |
| (124) |
| - |
| - |
| - |
| 3,329 | ||||
| Other financial assets at fair value through profit or loss |
| 1,192,334 |
| 138,016 |
| - |
| 35,426 |
| (462,982) |
| 902,794 | ||||
| Available-for-sale financial assets |
| 553,355 |
| 24,133 |
| - |
| 320,468 |
| - |
| 897,956 | ||||
Financial assets and liabilities not measured at fair value | |||||||||||||||||
The financial assets owned by the Bank are measured at fair value in the accompanying consolidated balance sheets, except for loans and receivables. | |||||||||||||||||
Similarly, the Bank’s financial liabilities except for financial liabilities held for trading and those measured at fair value - are measured at amortized cost in the consolidated balance sheets. | |||||||||||||||||
i) Financial assets measured at other than fair value | |||||||||||||||||
Following is a comparison of the carrying amounts of the Bank’s financial assets measured at other than fair value and their respective fair values at December 31, 2016, 2015 and 2014: | |||||||||||||||||
| Thousands of Reais |
|
|
| 2016 | ||||||||||||
Carrying Amount | Fair Value | Level 1 | Level 2 | Level 3 | |||||||||||||
Assets | |||||||||||||||||
| Money market investments - Brazilian Central Bank (note 5) |
| 46,371,814 |
| 46,341,971 |
| - |
| 46,341,971 |
| - | ||||||
| Held to maturity investments (note 7) |
|
|
|
|
| 10,048,761 |
| 10,555,437 |
| 6,942,173 |
| 3,613,264 |
| - | ||
Loans and receivables: |
|
|
|
|
|
|
| ||||||||||
| Loans and amounts due from credit institutions (note 6) |
| 27,762,473 |
| 27,757,607 |
| - |
| 27,757,607 |
| - | ||||||
| Loans and advances to customers (note 10) |
|
|
| 252,002,774 |
| 253,860,027 |
| - |
| - |
| 253,860,027 | ||||
| Loans and receivables - Debt instruments (note 7) |
|
|
| 16,283,259 |
| 16,003,885 |
| - |
| 16,003,885 |
| - | ||||
| Total |
|
|
|
|
|
|
| 352,469,081 |
| 354,518,927 |
| 6,942,173 |
| 93,716,727 |
| 253,860,027 |
| Thousands of Reais |
|
|
|
|
| 2015 | ||||||||||
Carrying Amount | Fair Value | Level 1 | Level 2 | Level 3 | |||||||||||||
Assets | |||||||||||||||||
| Money market investments - Brazilian Central Bank (note 5) |
| 31,316,917 |
| 31,310,136 |
| - |
| 31,310,136 |
| - | ||||||
| Held to maturity investments (note 7) |
|
|
|
|
| 10,097,836 |
| 9,257,519 |
| 5,698,211 |
| 3,559,308 |
| - | ||
Loans and receivables: | |||||||||||||||||
| Loans and amounts due from credit institutions (note 6) |
| 42,422,638 |
| 42,381,130 |
| - |
| 42,381,130 |
| - | ||||||
| Loans and advances to customers (note 10) |
|
|
| 252,033,449 |
| 251,319,173 |
| - |
| - |
| 251,319,173 | ||||
| Loans and receivables - Debt instruments (note 7) |
|
|
| 11,812,701 |
| 11,457,378 |
| - |
| 11,457,378 |
| - | ||||
| Total |
|
|
|
|
|
|
| 347,683,541 |
| 345,725,336 |
| 5,698,211 |
| 88,707,952 |
| 251,319,173 |
| Thousands of Reais |
|
|
|
|
|
|
|
|
| 2014 | ||||||
Carrying Amount | Fair Value | Level 1 | Level 2 | Level 3 | |||||||||||||
Assets | |||||||||||||||||
| Money market investments - Brazilian Central Bank (note 5) |
| 22,473,056 |
| 22,467,107 |
| - |
| 22,467,107 |
| - | ||||||
Loans and receivables: | |||||||||||||||||
| Loans and amounts due from credit institutions (note 6) |
| 28,917,397 |
| 28,878,632 |
| - |
| 28,878,632 |
| - | ||||||
| Loans and advances to customers (note 10) |
|
|
| 235,690,349 |
| 235,086,295 |
| - |
| - |
| 235,086,295 | ||||
| Total |
|
|
|
|
|
|
| 287,080,802 |
| 286,432,034 |
| - |
| 51,345,739 |
| 235,086,295 |
Certain financial instruments in 2014 and 2015 have been reclassified in the table above in line with the submission of 2016. | |||||||||||||||||
ii) Financial liabilities measured at other than fair value | |||||||||||||||||
Following is a comparison of the carrying amounts of the Bank’s financial liabilities measured at other than fair value and their respective fair values at December 31, 2016, 2015 and 2014: | |||||||||||||||||
| Thousands of Reais |
|
|
|
| 2016 | |||||||||||
Carrying Amount | Fair Value | Level 1 | Level 2 | Level 3 | |||||||||||||
Liabilities | |||||||||||||||||
| Financial liabilities at amortized cost: |
|
|
|
|
|
|
|
|
|
|
|
|
|
| ||
| Deposits from Bacen and credit institutions (note 17) |
|
|
| 78,319,960 |
| 78,323,271 |
| - |
| - |
| 78,323,271 | ||||
| Customer deposits (note 18) |
|
|
|
|
| 231,079,303 |
| 231,125,526 |
| - |
| - |
| 231,125,526 | ||
| Marketable debt securities (note 19) |
|
|
|
|
| 99,842,955 |
| 99,671,288 |
| - |
| 7,321,870 |
| 92,349,418 | ||
| Subordinated liabilities (note 20) |
|
|
|
|
| 466,246 |
| 452,439 |
| - |
| - |
| 452,439 | ||
| Debt Instruments Eligible to Compose Capital (note 21) |
| 8,311,918 |
| 8,311,918 |
| - |
| 8,311,918 |
| - | ||||||
| Other financial liabilities (note 22) |
|
|
|
|
| 36,879,099 |
| 35,622,099 |
| - |
| - |
| 35,622,099 | ||
| Total |
|
|
|
|
|
|
| 454,899,481 |
| 453,506,541 |
| - |
| 15,633,788 |
| 437,872,753 |
| Thousands of Reais |
|
|
|
|
| 2015 | ||||||||||
Carrying Amount | Fair Value | Level 1 | Level 2 | Level 3 | |||||||||||||
Liabilities | |||||||||||||||||
| Financial liabilities at amortized cost: |
|
|
|
|
|
|
|
|
|
|
|
|
|
| ||
| Deposits from Bacen and credit institutions (note 17) |
|
|
| 69,306,902 |
| 69,307,617 |
| - |
| - |
| 69,307,617 | ||||
| Customer deposits (note 18) |
|
|
|
|
| 227,462,949 |
| 227,422,985 |
| - |
| - |
| 227,422,985 | ||
| Marketable debt securities (note 19) |
|
|
|
|
| 94,658,300 |
| 95,486,114 |
| - |
| 13,712,057 |
| 81,774,057 | ||
| Subordinated liabilities (note 20) |
|
|
|
|
| 8,097,304 |
| 8,142,296 |
| - |
| - |
| 8,142,296 | ||
| Debt Instruments Eligible to Compose Capital (note 21) |
| 9,959,037 |
| 9,959,037 |
| - |
| 9,959,037 |
| - | ||||||
| Other financial liabilities (note 22) |
|
|
|
|
| 32,072,645 |
| 30,815,646 |
| - |
| - |
| 30,815,646 | ||
| Total |
|
|
|
|
|
|
| 441,557,137 |
| 441,133,695 |
| - |
| 23,671,094 |
| 417,462,601 |
| Thousands of Reais |
|
|
|
|
|
|
|
|
| 2014 | ||||||
Carrying Amount | Fair Value | Level 1 | Level 2 | Level 3 | |||||||||||||
Liabilities | |||||||||||||||||
| Financial liabilities at amortized cost: |
|
|
|
|
|
|
|
|
|
|
|
|
|
| ||
| Deposits from Bacen and credit institutions (note 17) |
|
|
| 63,512,663 |
| 63,536,717 |
| - |
| - |
| 63,536,717 | ||||
| Customer deposits (note 18) |
|
|
|
|
| 205,136,415 |
| 205,292,422 |
| - |
| - |
| 205,292,422 | ||
| Marketable debt securities (note 19) |
|
|
|
|
| 70,355,249 |
| 71,058,657 |
| - |
| 12,353,107 |
| 58,705,550 | ||
| Subordinated liabilities (note 20) |
|
|
|
|
| 7,294,077 |
| 7,382,396 |
| - |
| - |
| 7,382,396 | ||
| Debt Instruments Eligible to Compose Capital (note 21) |
| 6,773,312 |
| 6,773,312 |
| - |
| 6,773,312 |
| - | ||||||
| Other financial liabilities (note 22) |
|
|
|
|
| 23,445,735 |
| 22,495,735 |
| - |
| - |
| 22,495,735 | ||
| Total |
|
|
|
|
|
|
| 376,517,451 |
| 376,539,239 |
| - |
| 19,126,419 |
| 357,412,820 |
Certain financial instruments in 2014 and have been reclassified in the table above in line with the submission of 2016. | |||||||||||||||||
The methods and assumptions to estimate the fair value are defined below: | |||||||||||||||||
- Money market investments - Brazilian Central Bank - The carrying amount is approximated to the fair value. | |||||||||||||||||
- Loans and amounts due from credit institutions and from customers – Fair value are estimated for groups of loans with similar characteristics. The fair value was measured by discounting estimated cash flow using the interest rate of new contracts. | |||||||||||||||||
That is, the future cash flow of the current loan portfolio is estimated using the contractual rates, and then the new loans spread over the risk free interest rate are incorporated to the risk free yield curve in order to calculate the loan portfolio fair value. In terms of behavior assumptions, it is important to underline that a prepayment rate is applied to the loan portfolio, thus a more realistic future cash flow is achieved. | |||||||||||||||||
- Deposits from Bacen and credit institutions and Customer deposits – The fair value of deposits was calculated by discounting the difference between the cash flows on a contractual basis and current market rates for instruments with similar maturities. For variable-rate deposits, the carrying amount was considered to approximates fair value. | |||||||||||||||||
- Marketable debt securities, Subordinated liabilities and Debt Instruments Eligible to Compose Capital – The fair value of long-term loans were estimated by cash flow discounted at the interest rate offered on the market with similar terms and maturities. | |||||||||||||||||
The valuation techniques used to estimate each level are defined in note 2.e. | |||||||||||||||||
32. Operational Ratios | |||||||||||||||||
Financial institutions are required to maintain Regulatory Capital (PR), Tier I and Principal Capital consistent with their risk activities, higher to the minimum requirement of the Regulatory Capital Requirement, represented by the sum of the partial credit risk, market risk and operational risk. | |||||||||||||||||
The minimum Regulatory Capital requirement (PR) was 11% until December 31, 2015, reducing gradually to 8% on January 1, 2019.The minimum Regulatory Capital requirement until December 31, 2016 is 9.875%. The minimum Total Capital Tier I requirement is 6% from January 1, 2015 and the minimum Principal Capital requirement is 4.5% from October 1, 2013. | |||||||||||||||||
In July 2008 came into force the rules on regulatory capital measurement by the Standardized Approach of Basel II. These rules were repealed by Resolution 4,192/2013 and 4,278/2013 which took effect on October 01, 2013. And the Resolution 4,193 and 4,281 of 2013, establishing the model for calculating the minimum Regulatory Capital requirements (PR), Tier I and Principal Capital. These resolutions state that the composition of the Regulatory Capital is done through equity, subordinated debt, hybrid capital instruments. The index is calculated on a consolidated basis, as shown below:
| |||||||||||||||||
|
|
|
|
|
|
|
|
|
|
|
|
| Financial Conglomerate
| ||||
Thousands of Reais | 2016(1) | 2015(1) | 2014(2) | ||||||||||||||
Tier I Regulatory Capital |
|
|
|
|
|
|
|
|
| 56,264,021 |
| 52,785,049 |
| 58,592,358 | |||
Principal Capital |
|
|
|
|
|
|
|
|
|
|
| 52,136,837 |
| 47,840,179 |
| 55,228,661 | |
Supplementary capital |
|
|
|
|
|
|
|
|
|
|
| 4,127,184 |
| 4,944,870 |
| 3,363,697 | |
Tier II Regulatory Capital |
|
|
|
|
|
|
|
|
| 4,280,864 |
| 5,182,065 |
| 4,970,999 | |||
Regulatory Capital (Tier I and II) |
|
|
|
|
|
|
|
|
| 60,544,885 |
| 57,967,114 |
| 63,563,357 | |||
Required Regulatory Capital |
|
|
|
|
|
|
|
|
| 36,669,570 |
| 40,531,194 |
| 40,010,083 | |||
Portion of Credit Risk(3) |
|
|
|
|
|
|
|
|
| 31,309,944 |
| 36,355,897 |
| 35,527,889 | |||
Market Risk Portions(4) |
|
|
|
|
|
|
|
|
| 2,388,626 |
| 2,300,969 |
| 2,807,798 | |||
Operational Risk Portion |
|
|
|
|
|
|
|
|
| 2,971,000 |
| 1,874,328 |
| 1,674,396 | |||
Basel I Ratio |
|
|
|
|
|
|
|
|
|
|
| 15.2 |
| 14.3 |
| 16.1 | |
Basel Principal Capital |
|
|
|
|
|
|
|
|
| 14.0 |
| 13.0 |
| 15.2 | |||
Basel |
|
|
|
|
|
|
|
|
|
|
| 16.3% |
| 15.7% |
| 17.5% | |
(1) Amounts calculated based on the consolidated information provided by the Consolidated Prudencial. | |||||||||||||||||
(2) Amounts calculated based on the consolidated information provided by the financial institutions (Financial Conglomerate). | |||||||||||||||||
(3) To calculate the capital allocation for credit risk were considered modifications and inclusions of Bacen Circular 3,714 of August 20, 2014, Bacen Circular 3,770 of October 29,2015, which amending Circular 3,644 of March 4, 2013. | |||||||||||||||||
(4) Includes portions for market risk exposures subject to variations in rates of foreign currency coupons (PJUR2), price indexes (PJUR3) and interest rate (PJUR1/PJUR4), the price of commodities (PCOM), the price of shares classified as trading portfolios (PACS), and portions for gold exposure and foreign currency transactions subject to foreign exchange (PCAM). | |||||||||||||||||
The risk activity is governed by the following basic principles, which are aligned with the strategy and business model of the Santander Group, and takes into account the recommendations of the supervisory authorities, regulators and the best market practices. | |||||||||||||||||
• Integration in the Culture of Risks; | |||||||||||||||||
• Management Involvement; | |||||||||||||||||
• Independence of the Risk Function; | |||||||||||||||||
•Formulation of Risk Appetite; | |||||||||||||||||
•Fully Risk Consideration; | |||||||||||||||||
• Anticipation and Predictability; | |||||||||||||||||
•Common Management Instruments; | |||||||||||||||||
•Decision and Collegiate Bodies; | |||||||||||||||||
• Organizational structure; | |||||||||||||||||
•Limits Authority and Responsibilities; | |||||||||||||||||
•Risks Limitation; | |||||||||||||||||
•Efficient Information Channels. | |||||||||||||||||
The fundamental principles governing the risk governance model are: | |||||||||||||||||
• Independence of the risk function in relation to the business area; | |||||||||||||||||
•Management involvement in decision-making; | |||||||||||||||||
•Collegiate decisions and consensus on credit operations. | |||||||||||||||||
Based on these principles, the governance structure of the decision-making process is composed by committees that act in accordance to pre-defined levels of authority. The ERC - Executive Risk Committee is the local decision forum, which has representatives of the management, including the CEO, the Risk Executive Vice President and Executive Vice Presidents that are member of the executive committee and officers that report to them . The main responsibilities of this committee are: | |||||||||||||||||
•Follow the evolution of credit and market portfolios; | |||||||||||||||||
•Decide on credit proposals; | |||||||||||||||||
•Define and follow the Risk Appetite fulfilment; | |||||||||||||||||
•Define the actions regarding the recommendations formulated by the local regulator; | |||||||||||||||||
•Approve the risk regulation as well as the changes in risk policies that impact revenues, margin or provision expenses. | |||||||||||||||||
The Capital Policies of Banco Santander establish the general guidelines that should govern the areas involved operations in the capital management and control processes. | |||||||||||||||||
The content is structured as follows: | |||||||||||||||||
•Strategic Capital Policies; | |||||||||||||||||
•Capital Management and Control Policies; | |||||||||||||||||
• Operational Capital Policies; | |||||||||||||||||
• Organizational Structure and Governance Policies. | |||||||||||||||||
All processes related to capital issues follow a governance of approval that is aligned with the standards established in the Risk Governance Model mentioned above. | |||||||||||||||||
The definition of committees and approvals are established from the lines of defense: | |||||||||||||||||
• 1st Line of Defense: the main functions is the process of capital management coordination, annual capital planning definition, capital structure establishment, annual capital budgets monitoring, etc. .; | |||||||||||||||||
• 2nd Line of Defense: must ensure effective control of capital risk management and certify that the level of risk appetite is covering the institution's capital; | |||||||||||||||||
• 3rd Line of Defense: represents the role of independent reviewer. | |||||||||||||||||
Banco Santander, quarterly disclose information relating to risk management and Required Regulatory Capital (PRE) which is not an extension of the Financial Statements and it isn't audited. A report with further details of the structure and methodology will be disclosed at the website www.santander.com.br/ri. | |||||||||||||||||
Financial institutions are required to maintain investments in tangible assets compatible with adjusted regulatory capital. Funds invested in tangible assets, calculated on a consolidated basis, are limited to 50% of adjusted regulatory capital, as per prevailing regulation. On December 31, 2016, 2015 and 2014 Banco Santander classifies for said index. | |||||||||||||||||
33. Interest and similar income | |||||||||||||||||
“Interest and similar income” in the consolidated income statement comprises the interest accruing in the year on all financial assets with an implicit or explicit return, calculated by applying the effective interest method, irrespective of measurement at fair value; and the rectifications of income as a result of hedge accounting. Interest is recognized gross, without deducting any tax withheld at source. | |||||||||||||||||
The breakdown of the main items of interest and similar charges accrued in 2016, 2015 and 2014 is as follows: | |||||||||||||||||
| Thousands of Reais |
|
|
| 2016 |
| 2015 |
| 2014 | ||||||||
| Cash and balances with the Brazilian Central Bank |
| 7,315,570 |
| 4,625,467 |
| 5,951,667 | ||||||||||
| Loans and amounts due from credit institutions |
| 7,472,729 |
| 5,075,636 |
| 4,114,877 | ||||||||||
| Loans and advances to customers |
|
| 43,977,981 |
| 41,844,940 |
| 37,083,942 | |||||||||
| Debt instruments |
|
| 14,783,164 |
| 14,872,834 |
| 10,419,408 | |||||||||
| Pensions (note 24.b) |
|
|
| 3,344 |
| - |
| - | ||||||||
| Other interest |
|
| 3,593,289 |
| 3,451,323 |
| 1,354,022 | |||||||||
| Total |
|
| 77,146,077 |
| 69,870,200 |
| 58,923,916 | |||||||||
34. Interest expense and similar charges | |||||||||||||||||
“Interest expense and similar charges” in the consolidated income statement includes the interest accruing in the year on all financial liabilities with an implicit or explicit return, including remuneration in kind, calculated by applying the effective interest method, irrespective of measurement at fair value; the rectifications of cost as a result of hedge accounting; and the interest cost attributable to pension funds. | |||||||||||||||||
The breakdown of the main items of interest expense and similar charges accrued in 2016, 2015 and 2014 is as follows: | |||||||||||||||||
| Thousands of Reais |
|
|
|
|
|
|
|
|
|
|
| 2016 |
| 2015 |
| 2014 |
| Deposits from credit institutions |
|
|
|
|
|
|
|
|
| 3,369,931 |
| 4,584,244 |
| 3,216,162 | ||
| Customer deposits |
|
|
|
|
|
|
|
|
|
|
| 25,693,236 |
| 20,666,382 |
| 18,079,417 |
| Marketable debt securities and subordinated liabilities: |
|
|
|
|
|
|
|
|
|
| ||||||
| Marketable debt securities (note 19) |
|
|
|
|
|
|
|
|
| 12,212,922 |
| 10,047,874 |
| 6,347,571 | ||
| Subordinated liabilities (note 20) |
|
|
|
|
|
|
|
|
| 731,594 |
| 1,019,302 |
| 883,215 | ||
| Debt Instruments Eligible to Compose Capital (note 21) |
|
|
|
|
| 501,748 |
| 503,290 |
| 435,472 | ||||||
| Pensions (note 24.b) |
|
|
|
|
|
|
|
|
|
|
| 290,920 |
| 404,171 |
| 318,267 |
| Other interest(1) |
|
|
|
|
|
|
|
|
|
|
| 3,759,233 |
| 1,307,826 |
| 2,415,300 |
| Total |
|
|
|
|
|
|
|
|
|
|
| 46,559,584 |
| 38,533,089 |
| 31,695,404 |
(1) Include R$2,057 million related to the reversal of legal obligations realized in June 2015. | |||||||||||||||||
35. Income from equity instruments | |||||||||||||||||
“Income from equity instruments” includes the dividends and payments on equity instruments out of profits generated by investees after the acquisition of the equity interest. | |||||||||||||||||
The breakdown of the balance of this item is as follows: | |||||||||||||||||
| Thousands of Reais |
|
|
|
|
|
|
|
|
|
|
| 2016 |
| 2015 |
| 2014 |
Equity instruments classified as: | |||||||||||||||||
| Financial assets held for trading |
|
|
|
|
|
|
|
|
| 21,489 |
| 44,312 |
| 52,910 | ||
| Available-for-sale financial assets |
|
|
|
|
|
|
|
|
| 237,056 |
| 85,703 |
| 75,762 | ||
| Other financial instruments at fair value through profit or loss |
|
|
|
|
| - |
| 12,866 |
| 93,630 | ||||||
| Total |
|
|
|
|
|
|
|
|
|
|
| 258,545 |
| 142,881 |
| 222,302 |
36. Fee and commission income | |||||||||||||||||
“Fee and commission income” comprises the amount of all fees and commissions accruing in favor of the Bank in the year, except those that form an integral part of the effective interest rate on financial instruments. | |||||||||||||||||
The breakdown of the balance of this item is as follows: | |||||||||||||||||
| Thousands of Reais |
|
|
|
|
|
|
|
|
|
|
| 2016 |
| 2015 |
| 2014 |
Collection and payment services: | |||||||||||||||||
| Bills |
|
|
|
|
|
|
|
|
|
|
| 789,996 |
| 654,340 |
| 572,886 |
| Demand accounts |
|
|
|
|
|
|
|
|
|
|
| 1,786,175 |
| 1,496,535 |
| 1,364,654 |
| Cards (Credit and Debit) and Acquiring Services |
|
|
|
|
|
|
|
|
|
|
| 4,090,766 |
| 3,479,361 |
| 3,562,098 |
| Checks and other |
|
|
|
|
|
|
|
|
|
|
| 169,100 |
| 154,400 |
| 160,486 |
| Orders |
|
|
|
|
|
|
|
|
|
|
| 364,102 |
| 318,322 |
| 303,149 |
| Total |
|
|
|
|
|
|
|
|
|
|
| 7,200,139 |
| 6,102,958 |
| 5,963,273 |
|
|
|
|
|
|
|
|
|
|
|
|
|
|
|
|
|
|
| Marketing of non-Banking financial products: |
|
|
|
|
|
|
|
|
|
|
|
| ||||
| Investment funds |
|
|
|
|
|
|
|
|
|
|
| 1,014,401 |
| 982,533 |
| 954,697 |
| Insurance |
|
|
|
|
|
|
|
|
|
|
| 2,114,316 |
| 2,156,230 |
| 1,693,475 |
| Capitalization |
|
|
|
|
|
|
|
|
|
|
| 325,531 |
| 15,765 |
| 275,569 |
| Total |
|
|
|
|
|
|
|
|
|
|
| 3,454,248 |
| 3,154,528 |
| 2,923,741 |
|
|
|
|
|
|
|
|
|
|
|
|
|
|
|
|
|
|
| Securities services: |
|
|
|
|
|
|
|
|
|
|
|
|
|
|
|
|
| Securities underwriting and placement |
|
|
|
|
|
|
|
| 357,513 |
| 280,471 |
| 278,926 | |||
| Securities trading |
|
|
|
|
|
|
|
|
|
|
| 115,334 |
| 105,979 |
| 123,731 |
| Administration and custody |
|
|
|
|
|
|
|
|
| 65,667 |
| 81,154 |
| 91,321 | ||
| Asset management |
|
|
|
|
|
|
|
|
|
|
| 1,863 |
| 1,705 |
| 1,771 |
| Total |
|
|
|
|
|
|
|
|
|
|
| 540,377 |
| 469,309 |
| 495,749 |
|
|
|
|
|
|
|
|
|
|
|
|
|
|
|
|
|
|
| Other: |
|
|
|
|
|
|
|
|
|
|
|
|
|
|
|
|
| Foreign exchange |
|
|
|
|
|
|
|
|
|
|
| 722,912 |
| 597,620 |
| 441,347 |
| Financial guarantees |
|
|
|
|
|
|
|
|
|
|
| 634,375 |
| 507,921 |
| 378,698 |
| Other fees and commissions |
|
|
|
|
|
|
|
|
| 996,430 |
| 964,855 |
| 1,165,290 | ||
| Total |
|
|
|
|
|
|
|
|
|
|
| 2,353,717 |
| 2,070,396 |
| 1,985,335 |
|
|
|
|
|
|
|
|
|
|
|
|
|
|
|
|
|
|
| Total |
|
|
|
|
|
|
|
|
|
|
| 13,548,481 |
| 11,797,191 |
| 11,368,098 |
37. Fee and commission expense | |||||||||||||||||
“Fee and commission expense” shows the amount of all fees and commissions paid or payable in the year, except those that form an integral part of the effective interest rate on financial instruments. | |||||||||||||||||
The breakdown of the balance of this item is as follows: | |||||||||||||||||
| Thousands of Reais |
|
|
|
|
|
|
|
|
|
|
| 2016 |
| 2015 |
| 2014 |
| Fees and commissions assigned to third parties (1) |
|
|
|
|
|
|
| 1,620,812 |
| 1,520,480 |
| 1,539,947 | ||||
| Other fees and commissions |
|
|
|
|
|
|
|
|
| 950,073 |
| 793,202 |
| 1,062,265 | ||
| Total |
|
|
|
|
|
|
|
|
|
|
| 2,570,885 |
| 2,313,682 |
| 2,602,212 |
(1) Composite, principally, by Credit cards. | |||||||||||||||||
38. Gains (losses) on financial assets and liabilities (net) | |||||||||||||||||
Gains (losses) on financial assets and liabilities (net) includes the amount of the valuation adjustments of financial instruments, except those attributable to interest accrued as a result of application of the effective interest method and to allowances, and the gains or losses derived from the sale and purchase thereof. | |||||||||||||||||
The breakdown of the balance of this item, by type of instrument, is as follows: | |||||||||||||||||
| Thousands of Reais |
|
|
|
|
|
|
|
|
|
|
| 2016 |
| 2015 |
| 2014 |
| Held for trading(1) |
|
|
|
|
|
|
|
|
|
|
| 3,166,399 |
| (19,936,801) |
| 2,270,059 |
| Other financial instruments at fair value through profit or loss(2) |
|
|
|
|
| 82,638 |
| 46,859 |
| (77,624) | ||||||
| Financial instruments not measured at fair value through profit or loss |
|
|
|
|
| (115,202) |
| (120,523) |
| 512,190 | ||||||
| Of which: Available-for-sale financial assets |
|
|
|
|
|
|
|
|
|
| ||||||
| Debt instruments |
|
|
|
|
|
|
|
|
|
|
| (108,318) |
| 385,605 |
| 528,824 |
| Equity instruments |
|
|
|
|
|
|
|
|
|
|
| (6,884) |
| (506,128) |
| (16,634) |
| Hedging derivatives and other |
|
|
|
|
|
|
|
|
| (117,679) |
| 7,606 |
| 43,538 | ||
| Total |
|
|
|
|
|
|
|
|
|
|
| 3,016,156 |
| (20,002,859) |
| 2,748,163 |
(1) Includes the economic hedge of the Bank’s position in Cayman, which is a non-autonomous subsidiary (note 25). | |||||||||||||||||
(2) Includes the net gain arising from transactions involving debt securities, equity instruments and derivatives included in this portfolio, since the Bank manages its risk in these instruments on a global basis. | |||||||||||||||||
39. Exchange differences (net) | |||||||||||||||||
"Exchange differences" demonstrate the gains or losses on foreign currency transactions, the differences that arise on translations of monetary items in foreign currencies to the functional currency, and those disclosed on non-monetary assets in foreign currency at the time of their disposal. On December 31, 2016 the amount was R$4,574,814, of which R$16,634,809 Revenue with Exchange variations and R$12,059,995 of expenses with Exchange Variations (2015 - R$52,013,425 of revenue and R$41,929,005 of expenses and 2014 - R$13,920,938 of revenue and R$17,556,537 of expenses). | |||||||||||||||||
40. Other operating expense (net) | |||||||||||||||||
The breakdown of "Other operating income (expense)" is as follows: | |||||||||||||||||
| Thousands of Reais |
|
|
|
|
|
|
|
|
|
|
| 2016 |
| 2015 |
| 2014 |
| Other operating income |
|
|
|
|
|
|
|
|
| 690,310 |
| 566,006 |
| 332,343 | ||
| Other operating expense |
|
|
|
|
|
|
|
|
| (1,067,560) |
| (668,444) |
| (572,539) | ||
| Contributions to fund guarantee of credit - FGC |
|
|
|
|
|
|
| (247,321) |
| (244,685) |
| (230,281) | ||||
| Total |
|
|
|
|
|
|
|
|
|
|
| (624,571) |
| (347,123) |
| (470,477) |
41. Personnel expenses | |||||||||||||||||
a) Breakdown | |||||||||||||||||
The breakdown of “Personnel expenses” is as follows: | |||||||||||||||||
| Thousands of Reais |
|
|
|
|
|
|
|
|
|
|
| 2016 |
| 2015 |
| 2014 |
| Wages and salaries |
|
|
|
|
|
|
|
|
|
|
| 5,377,284 |
| 4,655,400 |
| 4,512,303 |
| Social security costs |
|
|
|
|
|
|
|
|
|
|
| 1,273,486 |
| 1,316,282 |
| 1,203,028 |
| Benefits |
|
|
|
|
|
|
|
|
|
|
| 1,277,781 |
| 1,183,902 |
| 1,092,996 |
| Defined benefit pension plans (note 24) |
|
|
|
|
|
|
| 24,481 |
| 31,332 |
| 21,830 | ||||
| Contributions to defined contribution pension plans |
|
|
|
|
|
|
| 86,576 |
| 78,785 |
| 65,434 | ||||
| Share-based compensation |
|
|
|
|
|
|
|
|
| 86,963 |
| 175,976 |
| 74,148 | ||
| Training |
|
|
|
|
|
|
|
|
|
|
| 62,518 |
| 92,883 |
| 98,963 |
| Other personnel expenses |
|
|
|
|
|
|
|
|
| 188,176 |
| 264,232 |
| 134,740 | ||
| Total |
|
|
|
|
|
|
|
|
|
|
| 8,377,265 |
| 7,798,792 |
| 7,203,442 |
b) Share-Based Compensation | |||||||||||||||||
Banco Santander has long-term compensation plans linked to the market price of the shares . The members of the Executive Board of Banco Santander are eligible for these plans, besides the members selected by the Board of Directors and informed to the Human Resources, may also be eligible according to the seniority of the group. For the Board of Directors members in order to be eligible, they are required to exercise Executive Board functions. These amounts are recorded under Other liabilities (note 26) and personnel expenses (Note 41). | |||||||||||||||||
b.1) Local Program | |||||||||||||||||
The Local Program Banco Santander is divided into two types of independent plans: (i) share purchase plans and (ii) Share Delivery Plans. | |||||||||||||||||
On 25 October 2011, Banco Santander held an EGM, which approved the grant of the Incentive Long - Term Incentive Plan (SOP 2014) - Investment in Certificates of Deposit Shares ("Units") to certain directors and Managerial level employees of the Bank and companies under its control. | |||||||||||||||||
On 29 April, 2013, Banco Santander held an EGM, which approved the grant of the Banco Santander’s share-based compensation program - Stock Option Plan for Share Deposit Certificates – Units (SOP 2013) and the Long-Term Incentive Plan - Investment in Share Deposit Certificates (PSP 2013). | |||||||||||||||||
(i) Share purchase plans | |||||||||||||||||
The share purchase plans correspond to the Option Plans of Purchase Share Deposit Certificates - Units (SOP). | |||||||||||||||||
The characteristic of each plan are: | |||||||||||||||||
Long-Term Incentive Plan - SOP 2014: It was a 3 year Call Option Plan. The period for exercise was between June 30, 2014 to June 30, 2016. The number of Units exercisable by the participants were determined according to the result of the determination of a performance parameter of the Bank: total Shareholder Return (TSR) and adjusted by the indicator the Return on Risk Adjusted Capital (RORAC), comparison made between realized and budgeted in each year, as determined by the Board of Directors.The final result of the plan was 15%. | |||||||||||||||||
Long-Term Incentive Plan – SOP 2013:It is a call option plan with 3 years of vesting. The period for the exercise comprises is between June 30, 2016 to June 30, 2018. The number of Units to be exercised by the participants were determined according to the result of measurement of a performance parameter of the Bank: Total Shareholder Return (TSR) and adjusted by the indicator Return on Assets by Risk (RoRWA), comparison between realized and budgeted in each year.The final result of the plan was 89.61%. | |||||||||||||||||
(ii) Stock Delivery Plans | |||||||||||||||||
The stock delivery plans consist of the Long Term Incentive Plan - Investment in Share Deposit Certificates - Units (PSP). | |||||||||||||||||
Long-Term Incentive Plan – PSP 2013: Share-based compensation plan, promoting a commitment of executives with the long-term results. The Plan had as its object the variable compensation by the Bank to Participants, 100% (one hundred percent) in Units. | |||||||||||||||||
b.1.1) Fair Value and Plans Performance Parameters | |||||||||||||||||
For accounting of the Local Program plans, an independent consultant promoted simulations based on Monte Carlo methodology's, as presented the performance parameters used to calculate the shares to be granted. Such parameters are associated with their respective probabilities of occurrence, which are updated at the close of each period. | |||||||||||||||||
|
|
|
|
|
|
|
|
|
|
|
|
| PSP 2013/SOP 2013(1) | ||||
Total Shareholder Return (TSR) rank | % of Exercisable Shares | ||||||||||||||||
| 1st |
|
|
|
|
|
|
|
|
|
|
|
|
|
|
| 100% |
| 2nd |
|
|
|
|
|
|
|
|
|
|
|
|
|
|
| 75% |
| 3th |
|
|
|
|
|
|
|
|
|
|
|
|
|
|
| 50% |
| (1) The percentage of shares determined at the position of TSR is subject to a penalty according to the implementation of the RoRWA. | ||||||||||||||||
|
|
|
|
|
|
|
|
|
|
|
|
| SOP 2014(1) | ||||
Total Shareholder Return (TSR) rank | % of Exercisable Shares | ||||||||||||||||
| 1st |
|
|
|
|
|
|
|
|
|
|
|
|
|
|
| 100% |
| 2nd |
|
|
|
|
|
|
|
|
|
|
|
|
|
|
| 70% |
| 3th |
|
|
|
|
|
|
|
|
|
|
|
|
|
|
| 50% |
| 4th |
|
|
|
|
|
|
|
|
|
|
|
|
|
|
| 25% |
| (1) The percentage of shares determined at the position of TSR is subject to a penalty according to the implementation of the Return on Risk Adjusted Capital (RORAC). | ||||||||||||||||
For measurement of the fair value the following premises was used: | |||||||||||||||||
PSP 2013 | |||||||||||||||||
| Method of Assessment |
|
|
|
|
|
|
|
|
|
|
|
|
| Binomial | ||
| Volatility |
|
|
|
|
|
|
|
|
|
|
|
|
|
|
| 40.00% |
| Probability of Occurrence |
|
|
|
|
|
|
|
|
|
|
|
|
| 60.27% | ||
| Risk-Free Rate |
|
|
|
|
|
|
|
|
|
|
|
|
|
|
| 11.80% |
|
|
|
|
|
|
|
|
|
|
|
|
|
|
|
|
|
|
|
|
|
|
|
|
|
|
|
|
|
|
|
| SOP 2013 |
| SOP 2014 | |
| Method of Assessment |
|
|
|
|
|
|
|
|
|
|
| Black&Scholes |
| Black&Scholes | ||
| Volatility |
|
|
|
|
|
|
|
|
|
|
|
|
| 40.00% |
| 40.00% |
| Rate of Dividends |
|
|
|
|
|
|
|
|
|
|
|
|
| 3.00% |
| 3.00% |
| Vesting Period |
|
|
|
|
|
|
|
|
|
|
|
|
| 3 years |
| 3 years |
| Average Exercise Time |
|
|
|
|
|
|
|
|
|
|
| 5 years |
| 5 years | ||
| Risk-Free Rate |
|
|
|
|
|
|
|
|
|
|
|
|
| 11.80% |
| 10.50% |
| Probability of Occurrence |
|
|
|
|
|
|
|
|
|
|
| 60.27% |
| 71.26% | ||
| Fair Value of the Option Shares |
|
|
|
|
|
|
|
|
|
|
| R$5,96 |
| R$6,45 | ||
The average value of shares SANB11(Shares of the Bank in BM&FBovespa) of the year is R$19.94 (2015 - R$14.96 and 2014 - R$15.06). | |||||||||||||||||
In 2016, daily pro-rata expenses amounted to R$15,789 (2015 - R$R$11,642 and 2014 - R$85,898), relating to the SOP plan and expenses amounted to R$9,798 (2015 - R$7,775 and 2014 - R$2,692) relating to the PSP plan. | |||||||||||||||||
|
|
|
|
|
|
|
|
|
|
|
|
|
|
| Date of |
|
|
Commencement | Expiration | ||||||||||||||||
Number of | Exercise | of Exercise | Date of Exercise | ||||||||||||||
Units | Price in Reais | Year Granted | Employees | Period | Period | ||||||||||||
| Final Balance on December 31, 2014 |
| 13,830,464 |
|
|
|
|
|
|
|
|
|
| ||||
| Cancelled options (SOP - 2013) |
|
|
| (748,408) |
| 14.43 |
| 2013 |
| Managers |
| 06/30/16 |
| 06/30/18 | ||
| Cancelled options (PSP - 2013) |
|
|
| (117,453) |
|
|
| 2013 |
| Managers |
| 08/13/13 |
| 06/30/16 | ||
| Cancelled options (SOP delivery 2014) |
|
|
| (52,500) |
| 14.31 |
| 2011 |
| Managers |
| 06/30/14 |
| 06/30/16 | ||
| Exercised options (SOP delivery 2014) |
| (248,499) |
|
|
| 2011 |
| Managers |
| 06/30/14 |
| 06/30/16 | ||||
| Final Balance on December 31, 2015 |
| 12,663,604 |
|
|
|
|
|
|
|
|
|
| ||||
| Cancelled options (SOP - 2013) |
|
|
| (1,346,779) |
| 12.84 |
| 2013 |
| Managers |
| 06/30/16 |
| 06/30/18 | ||
| Exercised options (SOP - 2013) |
|
|
| (5,386,523) |
| 12.84 |
| 2013 |
| Managers |
| 06/30/16 |
| 06/30/18 | ||
| Granted options (SOP - 2013) |
|
|
| 220,606 |
| 12.84 |
| 2013 |
| Managers |
| 06/30/16 |
| 06/30/18 | ||
| Cancelled options (PSP - 2013) |
|
|
| (298,446) |
|
|
| 2013 |
| Managers |
| 08/13/13 |
| 06/30/16 | ||
| Granted options (PSP - 2013) |
|
|
| (2,147,515) |
|
|
| 2013 |
| Managers |
| 08/13/13 |
| 06/30/16 | ||
| Cancelled options (SOP - 2014) |
|
|
| (34,196) |
| 14.31 |
| 2011 |
| Managers |
| 06/30/14 |
| 06/30/16 | ||
| Exercised options (SOP - 2014) |
|
|
| (693,230) |
| 12.72 |
| 2011 |
| Managers |
| 06/30/14 |
| 06/30/16 | ||
| Final Balance on December 31, 2016 |
| 2,977,521 |
|
|
|
|
|
|
|
|
|
| ||||
| SOP 2014 |
|
|
|
|
| - |
| 12.72 |
| 2011 |
| Managers |
| 06/30/14 |
| 06/30/16 |
| SOP 2013 |
|
|
|
|
| 2,977,521 |
| 12.84 |
| 2013 |
| Managers |
| 06/30/16 |
| 06/30/18 |
| PSP 2013 |
|
|
|
|
| - |
|
|
| 2013 |
| Managers |
| 08/13/13 |
| 06/30/16 |
| Total |
|
|
|
|
| 2,977,521 |
|
|
|
|
|
|
|
|
|
|
b.2) Global Program | |||||||||||||||||
Long-Term Incentive Policy | |||||||||||||||||
In 2014, it was released a share delivery plan called 1st Long Term Incentive Global CRDIV - Grant 2014. This plan is subject to achievement of performance indicator Total Shareholder Return (TSR) of the Santander Group, comparing the evolution of the Group in this indicator for the main global competitors and the settlement will be in the World Group Santander shares. | |||||||||||||||||
In 2016 it was launched a stock delivery plan called 2nd Long -Term Incentive Global Plan CRDIV - Grant 2015. | |||||||||||||||||
Fair Value of Global Plan | |||||||||||||||||
1st Long-Term Incentive Global Plan Grant 2014 - ILP CRDIV | |||||||||||||||||
It was assumed that the grantee will not leave the Bank’s employment during the term of each plan. The fair value of the 50% linked to the Bank’s relative TSR position was calculated, on the grant date, on the basis of the report provided by external valuators whose assessment was carried out using a Monte Carlo valuation model, performing 10 thousand simulations to determine the TSR of each of the companies in the Benchmark Group, taking into account the variables set forth below. The results (each of which represents the delivery of a number of shares) are classified in decreasing order by calculating the weighted average and discounting the amount at the risk-free interest rate. | |||||||||||||||||
In view of the high correlation between TSR and EPS, it was considered feasible to extrapolate that (in a high percentage of cases) the TSR value is also valid for EPS. Therefore, it was initially determined that the fair value of the portion of the plans linked to the Bank’s relative EPS position, i.e. of the remaining 50% of the options granted, was the same as that of the 50% corresponding to the TSR. Since this valuation refers to a non-market condition, it is reviewed and adjusted on a yearly basis. | |||||||||||||||||
Long Term Incentive Global CRDIV - Grant 2014 | |||||||||||||||||
|
|
|
|
|
|
|
|
|
|
|
|
| 2 years |
| 3 years |
| 4 years |
| Future income Dividend |
|
|
|
| 11.1% |
| 10.8% |
| 9.5% | |||||||
| Expected Volatility |
|
|
|
| 32.7% |
| 34.7% |
| 36.9% | |||||||
| Volatility comparator |
|
|
|
| 12% -52% |
| 16% - 56% |
| 16% - 52% | |||||||
| Risk-free interest rate |
|
|
|
| 1.7% |
| 2,1% |
| 2,5% | |||||||
| Correlation |
|
|
|
| 0.55 |
| 0.55 |
| 0.55 | |||||||
The indicator will be used to measure the achievement of targets will be the comparison of the Total Shareholder Return (TSR) of the Santander Group with the RTA of fifteen leading the Group's global competitors. | |||||||||||||||||
The indicator is calculated in two stages: initially for program verification in 2014 and a second time in the annual payment of each installment (2015, 2016 and 2017). | |||||||||||||||||
Each executive has a target in dollars. If the indicators are reached, the target will be converted to Group's shares awarded in installments in the years 2016, 2017 and 2018, with sale restriction of one (1) year after each delivery. | |||||||||||||||||
2nd Long -Term Incentive Global Plan CRDIV - Grant 2015. | |||||||||||||||||
| |||||||||||||||||
Indicators - First time | |||||||||||||||||
1. RTA vs. Competitors | |||||||||||||||||
2. ROTE Bank vs. Budget | |||||||||||||||||
3. Employee satisfaction | |||||||||||||||||
4. Customer satisfaction | |||||||||||||||||
5. Binding of Companies vs. Budget | |||||||||||||||||
Each executive has a target in reais, converted to Santander Group's shares (SAN) for a price of R$17,473, which will be delivered in 2019, with a restriction of one (1) year after delivery. | |||||||||||||||||
|
|
|
|
|
|
|
|
| Number of Shares |
| Granted Year |
| Employees |
| Data of Commencement of the Period |
| Data of Expiry of Period |
|
|
|
|
|
|
|
|
|
|
|
|
| |||||
| 1st Long Term Incentive Global CRDIV - Grant 2014 |
| 1,613,057 |
| 2014 |
| Executives |
| jan - 2014 |
| dec - 2017 | ||||||
| 2nd Long -Term Incentive Global Plan CRDIV - Grant 2015 |
| 1,775,049 |
| 2016 |
| Executives |
| jan - 2015 |
| dec - 2018 | ||||||
| Balance Plans on December 31, 2016 |
|
|
| 3,388,106 |
|
|
|
|
|
|
|
| ||||
In 2016, were recognized daily pro-rata expenses amounted to R$8,873 (2015 - R$6,760 and 2014 - R$7,491), related to costs to the respective dates of the above cycles, for total plans of the Global Program. | |||||||||||||||||
Plans do not result in dilution of the share capital of the Bank, because they are paid in shares of Banco Santander Spain. | |||||||||||||||||
b.3) Variable Remuneration based in shares | |||||||||||||||||
The Annual stockholders’ Meeting of Banco Santander Spain, held on June 11, 2010, approved the new policy for executive compensation through a referenced variable remuneration in shares plan effective for all the companies of the Group, including Banco Santander. This new policy, subject to adjustments applicable to Banco Santander, were approved by Appointment and Compensation Committee and Board of Directors at the meeting held on February 2, 2011. | |||||||||||||||||
The plan's objectives are: (i) to align the compensation program with the principles of the “Financial Stability Board” (FSB) agreed upon at the G20; (ii) to align Banco Santander’s interests with those of the plan’s participants (to achieve the sustainable and recurring growth and profitability of Banco Santander’s businesses and to recognize the participants’ contributions); (iii) to allow the retention of participants; and (iv) to improve Banco Santander’s performance and defend the interests of stockholders' via a long-term commitment. | |||||||||||||||||
The purpose of the plan is the cash or shares payment of part of the variable compensation owed by Banco Santander to the plan’s participants pursuant to the Bank’s compensation policy, based on the future performance of the bank’s shares. | |||||||||||||||||
The referenced variable remuneration in shares is within the limits of the overall management compensation approved by Banco Santander's Annual Stockholders' Meeting. | |||||||||||||||||
The total number of shares on which the compensation plan is based will be settled in three installments and equally allocated to each of the three fiscal years following the reference year. | |||||||||||||||||
On December 19, 2012, the Board of Directors approved the proposed new incentive plan (deferred) for payment of the variable remuneration of directors and certain employees, which will be subject to resolution of the ordinary general meeting on February 15, 2013. | |||||||||||||||||
On April 24, 2013, the Board of Directors approved the proposed new incentive plan (deferred) for payment of the variable remuneration of directors and certain employees, which was approved in AGE (Extraordinary General Meeting) of June 3, 2013. | |||||||||||||||||
On March 18, 2015, the Board of Directors approved the proposed new incentive plan (deferred) for payment of the variable remuneration of directors and certain employees, which was approved in AGE (Extraordinary General Meeting) of April 30, 2015. | |||||||||||||||||
On September 29, 2015, the Board of Directors approved the proposed new incentive plan (deferred) for payment of the variable remuneration of directors and certain employees, which was approved in AGE (Extraordinary General Meeting) of December 14, 2015. | |||||||||||||||||
On October 25, 2016, the Board of Directors approved the proposed new incentive plan (deferred) for payment of the variable remuneration of directors and certain employees, which was approved in AGE (Extraordinary General Meeting) of December 21, 2016. | |||||||||||||||||
This proposal includes certain requirements for deferred payment of part of the future variable compensation due to its managers and other employees, given the financial basis for sustainable long-term adjustments in future payments due to the risks assumed and fluctuations in cost of capital. | |||||||||||||||||
The variable compensation plan Banco Santander has been assessed and became divided into two programs: (i) Collective Identified and (ii) Collective unidentified. | |||||||||||||||||
a) Identified Collective - Participants of the Executive Committee, Statutory Officers and other executives who take significant risks in the Bank and are responsible for the control areas. The payment deferral will be held in two ways: 50% in cash, indexed to 100% of CDI and 50% in shares (Units SANB11). On the period ended on December 31, 2016, was recorded loss amounted to R$52,500 (2015 - R$89,961 and 2014 - R$28,371), regarding the provision of the deferral plan in shares. | |||||||||||||||||
b) Collective Unidentified - managerial employees and other employees of the organization that will be benefited from the deferral plan. The deferred amount will be paid 100% cash, indexed to 100% of CDI. On the year ended on December 31, 2016, there were expense of R$79,794 (2014 - R$59,797 and 2014 - R$41,553). | |||||||||||||||||
42. Other administrative expenses | |||||||||||||||||
a) Breakdown | |||||||||||||||||
The breakdown of the balance of this item is as follows: | |||||||||||||||||
| Thousands of Reais |
|
|
|
|
|
|
|
|
|
|
| 2016 |
| 2015 |
| 2014 |
| Property, fixtures and supplies |
|
|
|
|
|
|
|
|
| 1,278,556 |
| 1,268,498 |
| 1,209,401 | ||
| Technology and systems |
|
|
|
|
|
|
|
|
| 1,246,809 |
| 1,192,533 |
| 1,106,392 | ||
| Advertising |
|
|
|
|
|
|
|
|
|
|
| 486,772 |
| 523,343 |
| 467,096 |
| Communications |
|
|
|
|
|
|
|
|
|
|
| 488,799 |
| 481,217 |
| 501,419 |
| Per diems and travel expenses |
|
|
|
|
|
|
|
|
| 133,123 |
| 160,135 |
| 140,986 | ||
| Taxes other than income tax |
|
|
|
|
|
|
|
|
| 84,932 |
| 128,022 |
| 78,389 | ||
| Surveillance and cash courier services |
|
|
|
|
|
|
| 622,362 |
| 614,596 |
| 573,697 | ||||
| Insurance premiums |
|
|
|
|
|
|
|
|
|
|
| 21,308 |
| 20,975 |
| 17,004 |
| Specialized and technical services |
|
|
|
|
|
|
|
|
| 1,744,726 |
| 1,820,657 |
| 2,004,874 | ||
| Technical reports |
|
|
|
|
|
|
|
|
|
|
| 437,683 |
| 406,755 |
| 404,548 |
| Others specialized and technical services |
|
|
|
|
|
|
| 1,307,043 |
| 1,413,902 |
| 1,600,326 | ||||
| Other administrative expenses |
|
|
|
|
|
|
|
|
| 435,758 |
| 506,364 |
| 639,116 | ||
| Total |
|
|
|
|
|
|
|
|
|
|
| 6,543,145 |
| 6,716,340 |
| 6,738,374 |
b) Other information | |||||||||||||||||
The balance of “Technical reports” includes the fees paid by the consolidated companies to their respective auditors, the detail being as follows: | |||||||||||||||||
| Millions of Reais |
|
|
|
|
|
|
|
|
|
|
| 2016 |
| 2015 |
| 2014 |
| Audit of the annual financial statements of the companies audited by external audit(1) (constant scope of consolidation) |
| 9.2 |
| 12.0 |
| 10.4 | ||||||||||
|
|
|
| ||||||||||||||
| Audit Related |
|
|
|
|
|
|
|
|
|
|
| 0.1 |
| 1.5 |
| 1.3 |
| Taxes |
|
|
|
|
|
|
|
|
|
|
| - |
| - |
| 0.1 |
| Others |
|
|
|
|
|
|
|
|
|
|
| 0.7 |
| 1.7 |
| 0.4 |
| Total |
|
|
|
|
|
|
|
|
|
|
| 10.0 |
| 15.2 |
| 12.2 |
(1) On March 18, 2016, the Banco Santander contracted PricewaterhouseCoopers Auditores Independentes (PWC), to act as an independent audit of the Bank and the companies that make up the Conglomerate Santander in Brazil, to replace Deloitte Touche Tohmatsu Auditores Independentes (Deloitte), which provided an independent audit service until December 2015. | |||||||||||||||||
The approximate value of taxes according to law 12,741/2012 totaled R$1.8 million. | |||||||||||||||||
Services provided by other audit firms totaled R$4.9 million (2015 - R$4.2 million and 2014 - R$6.2 million). | |||||||||||||||||
43. Gains (losses) on disposal of assets not classified as non-current assets held for sale | |||||||||||||||||
The breakdown of the balance of this item is as follows: | |||||||||||||||||
| Thousands of Reais |
|
|
|
|
|
|
|
|
|
|
| 2016 |
| 2015 |
| 2014 |
| Gains |
|
|
|
|
|
|
|
|
|
|
| 12,584 |
| 787,628 |
| 87,696 |
| On disposal of tangible assets |
|
|
|
|
|
|
|
|
| 12,575 |
| 30,478 |
| 87,696 | ||
| On disposal of investments(1) |
|
|
|
|
|
|
|
|
| 9 |
| 757,150 |
| - | ||
| Losses |
|
|
|
|
|
|
|
|
|
|
| (8,768) |
| (7,013) |
| (850) |
| On disposal of tangible assets |
|
|
|
|
|
|
|
|
| (7,547) |
| (502) |
| (143) | ||
| On disposal of investments |
|
|
|
|
|
|
|
|
| (1,221) |
| (6,511) |
| (707) | ||
| Total |
|
|
|
|
|
|
|
|
|
|
| 3,816 |
| 780,615 |
| 86,846 |
| (1) In 2015 includes a gain of R$750,550, related to the operation with the sale of Santander Securities Services Brasil DTVM S.A. (note 4.a). | ||||||||||||||||
44. Gains (losses) on disposal and expenses of non-current assets held for sale not classified as discontinued operations | |||||||||||||||||
It refers basically to the result on disposal of property received in the processes of recovery of loans to customers and the provision of the recoverable value of these assets. | |||||||||||||||||
45. Other disclosures | |||||||||||||||||
a) Guarantees and commitments | |||||||||||||||||
The Bank provides a variety of guarantees to its customers to improve their credit standing and allow them to compete. The following table summarizes at December 31, 2016, 2015 and 2014 all of the guarantees. | |||||||||||||||||
As required, the “maximum potential amount of future payments” represents the notional amounts that could be lost if there were a total default by the guaranteed parties, without consideration of possible recoveries from collateral held or pledged, or recoveries under recourse provisions. There is no relationship between these amounts and probable losses on these guarantees. In fact, "maximum potential amount of future payments" significantly exceeds inherent losses. | |||||||||||||||||
| Thousands of Reais |
|
|
|
|
|
|
|
|
|
|
| 2016 |
| 2015 |
| 2014 |
Maximum potential amount of future payments | |||||||||||||||||
Contingent liabilities | |||||||||||||||||
| Guarantees and other sureties |
|
|
|
|
|
|
|
|
| 32,629,975 |
| 42,836,334 |
| 38,386,017 | ||
| Financial guarantees |
|
|
|
|
|
|
|
|
| 24,475,507 |
| 41,183,159 |
| 37,034,862 | ||
| Performance guarantees |
|
|
|
|
|
|
|
|
| 532,232 |
| 521,373 |
| 565,032 | ||
| Financial letters of credit |
|
|
|
|
|
|
|
|
| 7,462,761 |
| 874,661 |
| 523,608 | ||
| Other |
|
|
|
|
|
|
|
|
|
|
| 159,475 |
| 257,141 |
| 262,515 |
| Other contingent exposures |
|
|
|
|
|
|
|
|
| 635,055 |
| 774,383 |
| 948,300 | ||
| Documentary Credits |
|
|
|
|
|
|
|
|
| 635,055 |
| 774,383 |
| 948,300 | ||
| Total Contingent Liabilities |
|
|
|
|
|
|
|
|
| 33,265,030 |
| 43,610,717 |
| 39,334,317 | ||
|
|
|
|
|
|
|
|
|
|
|
|
|
|
|
|
|
|
| Commitments |
|
|
|
|
|
|
|
|
|
|
|
|
|
|
|
|
| Loan commitments draw able by third parties(1) |
|
|
|
|
|
|
| 91,251,198 |
| 91,960,299 |
| 98,592,601 | ||||
| Total Commitments |
|
|
|
|
|
|
|
|
|
|
| 91,251,198 |
| 91,960,299 |
| 98,592,601 |
|
|
|
|
|
|
|
|
|
|
|
|
|
|
|
|
|
|
| Total |
|
|
|
|
|
|
|
|
|
|
| 124,516,228 |
| 135,571,016 |
| 137,926,918 |
(1) Includes the approved limits and unused overdraft, credit card and others. | |||||||||||||||||
Financial guarantees are provided to our clients in respect of their obligations to third parties. We have the right to seek reimbursement from our clients for any amount we shall have to pay under such guarantee. Additionally, we may hold cash or other highly liquid collateral for these guarantees. These guarantees are subject to the same credit evaluation performed on the origination of loans. | |||||||||||||||||
We expect many of these guarantees to expire without the need to disburse any cash. Therefore, in the ordinary course of business, we expect that these guarantees will have virtually no impact on our liquidity. | |||||||||||||||||
Performance guarantees are issued to guaranteed customers obligations such as to make contractually specified investments, to supply specified products, commodities, or maintenance or warranty services to a third party, completion of projects in accordance with contract terms, etc. Financial standby letters of credit include guarantees of payment of loans, credit facilities, promissory notes and trade acceptances. The Bank always requires collateral to grant this kind of financial guarantees. In Documentary Credits, the Bank acts as a payment intermediary between trading companies located in different countries (import-export transactions). Under a documentary credit transaction, the parties involved deal with the documents rather than the commodities to which the documents may relate. Usually the traded commodities are used as collateral to the transaction and the Bank may provide some credit facilities. Loan commitments draw able by third parties include mostly credit card lines and commercial commitments. Credit card lines are unconditionally cancelable by the issuer. Commercial commitments are mostly 1 year facilities subject to information requirements to be provided by our customers. | |||||||||||||||||
The risk criteria followed to issue all kinds of guarantees, financial standby letters of credit, documentary credits and any risks of signature are in general the same as those used for other products of credit risk, and therefore subject to the same admission and monitoring standards. The guarantees granted on behalf of our customers are subject to the same credit quality review process as any other risk product. On a regular basis, at least once a year, the solvency of the mentioned customers is checked as well as the probability of those guarantees to be executed. In case that any doubt on the customer’s solvency may arise we create allowances with charge to net income, by the amount of the inherent losses even if there is no claim to us. | |||||||||||||||||
The provision for losses on the non-recovery guarantees and other securities (Note 10.c) is recorded as "Impairment losses on financial assets (net)” on consolidated income statement and its calculation is described in note 2.i. | |||||||||||||||||
Additionally, the liability recognized as deferred revenue for the premium received for providing the above guarantees, which is being amortized into income over the life of the related guarantees is R$476,564 (2015 - R$385,169 and 2014 - R$325,039). | |||||||||||||||||
b) Off-balance-sheets funds under management | |||||||||||||||||
Banco Santander has under its management investment funds for which we do not hold any substantial participation interests and we do not act as principal over the funds, and therefore no ownership in such funds. Based on the contractual relationship governing the management of such funds, third parties who hold the participation interests in such funds are those who are exposed to, or have rights, to variable returns and have the ability to affect those returns through power over the fund. Moreover, though the Bank acts as fund manager, in analyzing the fund manager’s remuneration regime, the remuneration regime is proportionate to the service rendered, and therefore does not create exposure of such importance to indicate that the fund manager is acting as the principal (Note 2.w). | |||||||||||||||||
The detail of off-balance-sheets funds managed by the Bank is as follows: | |||||||||||||||||
| Thousands of Reais |
|
|
|
|
|
|
|
|
|
|
| 2016 |
| 2015 |
| 2014 |
| Funds under management |
|
|
|
|
|
|
|
|
| 1,533,620 |
| 2,542,286 |
| 4,591,810 | ||
| Total |
|
|
|
|
|
|
|
|
|
|
| 1,533,620 |
| 2,542,286 |
| 4,591,810 |
c) Third-party securities held in custody | |||||||||||||||||
At December 31, 2016, the Bank held in custody debt securities and equity instruments totaling R$27,772,714 (2015 - R$38,412,152 and 2014 - R$398,499,007) entrusted to it by third parties. | |||||||||||||||||
d) Residual maturity periods and Average interest rates | |||||||||||||||||
The breakdown, by maturity, of the balances of certain items in the consolidated balance sheets is as follows: | |||||||||||||||||
|
|
| 2016 | ||||||||||||||
Thousands of Reais | |||||||||||||||||
On | Up to | 3 to | 1 to | 3 to | After 5 | Total | Average | ||||||||||
Assets: | |||||||||||||||||
| Cash and balances with the Brazilian Central Bank |
| 14,917,634 |
| 42,538,383 |
| 3,833,431 |
| - |
| - |
| 49,315,463 |
| 110,604,911 |
| 13.5% |
| Debt instruments(2) |
| - |
| 21,709,350 |
| 10,136,133 |
| 26,674,215 |
| 28,135,295 |
| 30,838,274 |
| 117,493,267 |
| 14.2% |
| Equity instruments |
| 593,594 |
| 48,054 |
| 252,087 |
| 486,408 |
| 21,313 |
| 1,024,933 |
| 2,426,389 |
| - |
| Loans and amounts due from credit institutions |
| 13,614,198 |
| 2,849,696 |
| 923,308 |
| 532,399 |
| 34,458 |
| 9,808,414 |
| 27,762,473 |
| 8.6% |
| Loans and advances to customer |
| 30,408,851 |
| 68,218,474 |
| 60,047,442 |
| 54,558,381 |
| 17,357,244 |
| 21,412,382 |
| 252,002,774 |
| 26.5% |
| Loans and Receivables - Debt instruments |
| 822,874 |
| 1,287,372 |
| 2,960,099 |
| 5,044,803 |
| 4,472,758 |
| 1,695,353 |
| 16,283,259 |
| 13.6% |
| Held to maturity investments |
| - |
| - |
| 12,378 |
| 371,621 |
| 1,173,360 |
| 8,491,402 |
| 10,048,761 |
| 4.0% |
| Derivatives |
| 620,422 |
| 9,209,421 |
| 3,571,126 |
| 3,813,687 |
| 5,481,210 |
| 2,007,107 |
| 24,702,973 |
|
|
| Total |
| 60,357,151 |
| 136,651,329 |
| 78,164,878 |
| 87,667,827 |
| 51,194,428 |
| 122,586,221 |
| 536,621,834 |
| 18.4% |
|
|
|
|
|
|
|
|
|
|
|
|
|
|
|
|
| |
|
|
| 2016 | ||||||||||||||
Thousands of Reais | |||||||||||||||||
On | Up to | 3 to | 1 to | 3 to | After 5 | Total | Average | ||||||||||
| Liabilities: |
|
|
|
|
|
|
|
|
|
|
|
|
|
|
|
|
| Financial liabilities at amortized cost: |
|
|
|
|
|
|
|
|
|
|
|
|
|
|
|
|
| Deposits from credit institutions(1) |
| 770,467 |
| 40,581,025 |
| 23,315,006 |
| 8,215,378 |
| 2,818,095 |
| 2,934,101 |
| 78,634,072 |
| 16.0% |
| Customer deposits(1) |
| 60,919,032 |
| 64,154,475 |
| 68,505,808 |
| 39,630,274 |
| 14,003,821 |
| 231,767 |
| 247,445,177 |
| 13.3% |
| Marketable debt securities(1) |
| - |
| 21,833,927 |
| 56,637,880 |
| 20,620,077 |
| 312,143 |
| 438,928 |
| 99,842,955 |
| 12.7% |
| Subordinated liabilities |
| - |
| - |
| - |
| 466,246 |
| - |
| - |
| 466,246 |
| 9.6% |
| Debt Instruments Eligible to Compose Capital |
| - |
| 113,995 |
| - |
| - |
| - |
| 8,197,923 |
| 8,311,918 |
| - |
| Other financial liabilities |
| 3,004,041 |
| 33,559,710 |
| 356 |
| 7,992 |
| - |
| 307,000 |
| 36,879,099 |
| - |
| Financial liabilities held for trading: |
|
|
|
|
|
|
|
|
|
|
|
|
|
|
|
|
| Short positions |
| - |
| 743 |
| 2,887,723 |
| 8,333,584 |
| 3,344,083 |
| 17,128,136 |
| 31,694,269 |
| 9.8% |
| Derivatives |
| 333,287 |
| 8,052,349 |
| 2,506,131 |
| 2,523,506 |
| 5,376,180 |
| 1,445,162 |
| 20,236,615 |
| - |
| Total |
| 65,026,827 |
| 168,296,224 |
| 153,852,904 |
| 79,797,057 |
| 25,854,322 |
| 30,683,017 |
| 523,510,351 |
| 12.0% |
Difference (assets less liabilities) |
| (4,669,676) |
| (31,644,895) |
| (75,688,026) |
| 7,870,770 |
| 25,340,106 |
| 91,903,204 |
| 13,111,483 |
| - | |
|
|
| 2015 | ||||||||||||||
Thousands of Reais | |||||||||||||||||
On | Up to | 3 to | 1 to | 3 to | After 5 | Total | Average | ||||||||||
Assets: | |||||||||||||||||
| Cash and balances with the Brazilian Central Bank |
| 57,826,436 |
| 26,530,459 |
| 4,786,458 |
| - |
| - |
| - |
| 89,143,353 |
| 14.5% |
| Debt instruments |
| 109,808 |
| 5,094,088 |
| 11,456,643 |
| 30,805,793 |
| 14,821,110 |
| 53,426,537 |
| 115,713,979 |
| 9.6% |
| Equity instruments |
| 2,140,969 |
| - |
| - |
| - |
| - |
| - |
| 2,140,969 |
| - |
| Loans and amounts due from credit institutions |
| 29,064,151 |
| 781,340 |
| 1,298,609 |
| 2,448,123 |
| 133,299 |
| 8,697,116 |
| 42,422,638 |
| 9.5% |
| Loans and advances to customer |
| 22,662,559 |
| 73,674,326 |
| 59,527,021 |
| 54,371,603 |
| 18,227,451 |
| 23,570,489 |
| 252,033,449 |
| 22.2% |
| Total |
| 111,803,923 |
| 106,080,213 |
| 77,068,731 |
| 87,625,519 |
| 33,181,860 |
| 85,694,142 |
| 501,454,388 |
| 17.2% |
|
|
|
|
|
|
|
|
|
|
|
|
|
|
|
|
| |
| Liabilities: |
|
|
|
|
|
|
|
|
|
|
|
|
|
|
|
|
| Financial liabilities at amortized cost: |
|
|
|
|
|
|
|
|
|
|
|
|
|
|
|
|
| Deposits from credit institutions(1) |
| 943,539 |
| 29,303,606 |
| 24,374,967 |
| 8,819,650 |
| 3,346,250 |
| 2,663,486 |
| 69,451,498 |
| 12.1% |
| Customer deposits(1) |
| 52,009,232 |
| 74,456,462 |
| 39,245,968 |
| 62,868,721 |
| 14,305,045 |
| 157,444 |
| 243,042,872 |
| 14.1% |
| Marketable debt securities(1) |
| - |
| 16,639,669 |
| 26,833,967 |
| 50,815,528 |
| 298,178 |
| 70,958 |
| 94,658,300 |
| 8.7% |
| Subordinated liabilities |
| - |
| - |
| 7,685,328 |
| 411,976 |
| - |
| - |
| 8,097,304 |
| 14.6% |
| Debt Instruments Eligible to Compose Capital |
| - |
| - |
| - |
| - |
| - |
| 9,959,037 |
| 9,959,037 |
| - |
| Other financial liabilities |
| 199,805 |
| 30,095,592 |
| 1,438,387 |
| 31,862 |
| - |
| 307,000 |
| 32,072,646 |
| - |
| Financial liabilities held for trading: |
|
|
|
|
|
|
|
|
|
|
|
|
|
|
|
|
| Short positions |
| - |
| - |
| - |
| 2,865,813 |
| 7,915,932 |
| 9,265,886 |
| 20,047,631 |
| 11.8% |
| Derivatives |
| 5,600 |
| 2,666,788 |
| 1,863,221 |
| 2,953,682 |
| 2,122,437 |
| 12,728,409 |
| 22,340,137 |
| - |
| Total |
| 53,158,176 |
| 153,162,117 |
| 101,441,838 |
| 128,767,232 |
| 27,987,842 |
| 35,152,220 |
| 499,669,425 |
| 12.4% |
Difference (assets less liabilities) |
| 58,645,747 |
| (47,081,904) |
| (24,373,107) |
| (41,141,713) |
| 5,194,018 |
| 50,541,922 |
| 1,784,963 |
|
| |
|
|
| 2014 | ||||||||||||||
Thousands of Reais | |||||||||||||||||
On | Up to | 3 to | 1 to | 3 to | After 5 | Total | Average | ||||||||||
Assets: | |||||||||||||||||
| Cash and balances with the Brazilian Central Bank |
| 33,434,065 |
| 22,168,842 |
| 300,941 |
| - |
| - |
| - |
| 55,903,848 |
| 10.9% |
| Debt instruments |
| - |
| 15,337,090 |
| 20,758,336 |
| 34,258,870 |
| 17,315,307 |
| 33,041,806 |
| 120,711,409 |
| 10.5% |
| Equity instruments |
| 2,948,094 |
| - |
| - |
| - |
| - |
| - |
| 2,948,094 |
| - |
| Loans and amounts due from credit institutions |
| 14,735,346 |
| 1,333,206 |
| 4,844,420 |
| 1,430,260 |
| 466,904 |
| 6,107,261 |
| 28,917,397 |
| 11.5% |
| Loans and advances to customer |
| 9,110,511 |
| 66,015,934 |
| 71,124,998 |
| 57,395,636 |
| 14,967,223 |
| 17,076,047 |
| 235,690,349 |
| 22.6% |
| Total |
| 60,228,016 |
| 104,855,072 |
| 97,028,695 |
| 93,084,766 |
| 32,749,434 |
| 56,225,114 |
| 444,171,097 |
| 17.0% |
|
|
|
|
|
|
|
|
|
|
|
|
|
|
|
|
| |
| Liabilities: |
|
|
|
|
|
|
|
|
|
|
|
|
|
|
|
|
| Financial liabilities at amortized cost: |
|
|
|
|
|
|
|
|
|
|
|
|
|
|
|
|
| Deposits from credit institutions(1) |
| 182,108 |
| 31,587,311 |
| 19,689,042 |
| 8,331,404 |
| 2,228,999 |
| 1,655,337 |
| 63,674,201 |
| 11.1% |
| Customer deposits(1) |
| 54,303,688 |
| 59,729,834 |
| 25,106,427 |
| 68,866,674 |
| 12,637,396 |
| - |
| 220,644,019 |
| 11.2% |
| Marketable debt securities(1) |
| - |
| 17,563,577 |
| 30,819,783 |
| 19,969,449 |
| 1,907,628 |
| 94,812 |
| 70,355,249 |
| 10.8% |
| Subordinated liabilities |
| - |
| - |
| 199,124 |
| 6,747,305 |
| 347,648 |
| - |
| 7,294,077 |
| 11.2% |
| Debt Instruments Eligible to Compose Capital |
| - |
| 147,165 |
| - |
| - |
| - |
| 6,626,147 |
| 6,773,312 |
| 0.0% |
| Other financial liabilities |
| 60,649 |
| 21,614,192 |
| 1,430,693 |
| 103,355 |
| 9,923 |
| 226,923 |
| 23,445,735 |
| - |
| Total |
| 54,546,445 |
| 130,642,079 |
| 77,245,069 |
| 104,018,187 |
| 17,131,594 |
| 8,603,219 |
| 392,186,593 |
| 10.9% |
| Difference (assets less liabilities) |
| 5,681,571 |
| (25,787,007) |
| 19,783,626 |
| (10,933,421) |
| 15,617,840 |
| 47,621,895 |
| 51,984,504 |
|
|
(1) Include obligations which may be subject to early repayment, being: sight and time deposits, repurchase agreements with customers, LCI and LCA. | |||||||||||||||||
(2) In 2015, includes Held to maturity investments. | |||||||||||||||||
e) Equivalent value in Reais of assets and liabilities | |||||||||||||||||
The main foreign currency balances in the consolidated balance sheets, based on the nature of the related items, is as follows: | |||||||||||||||||
| Equivalent Value in Thousands of Reais |
| 2016 |
| 2015 |
| 2014 | ||||||||||
Assets | Liabilities | Assets | Liabilities | Assets | Liabilities | ||||||||||||
| Cash and balances with the Brazilian Central Bank |
| 174,605 |
| - |
| 230,881 |
| - |
| 206,750 |
| - | ||||
| Financial assets/liabilities held for trading |
| 402,186 |
| 371,100 |
| 2,109,665 |
| 2,276,540 |
| 52,511 |
| 1,423,571 | ||||
| Available-for-sale financial assets |
|
|
| 9,787,622 |
| - |
| 4,142,821 |
| - |
| 7,112,048 |
| - | ||
| Loans and receivables |
|
|
| 28,061,831 |
| - |
| 36,418,917 |
| - |
| 35,662,235 |
| - | ||
| Financial liabilities at amortized cost |
|
|
| - |
| 39,465,409 |
| - |
| 58,294,796 |
| - |
| 33,775,217 | ||
| Total |
|
|
|
|
| 38,426,244 |
| 39,836,509 |
| 42,902,284 |
| 60,571,336 |
| 43,033,544 |
| 35,198,788 |
f) Other Obligations | |||||||||||||||||
The Banco Santander rents properties, mainly used for branches, based on a standard contract which may be cancelled at its own criterion and includes the right to opt for renewals and adjustment clauses. The leases are classified as operating leases. Total future minimum payments of non-cancelable operating leases as of December 31, 2016 is R$2,933,276 (2015 - R$3,199,111 and 2014 - R$2,521,985), of which R$646,804 (2015 - R$640,132 and 2014 - R$654,925) up to 1 year, R$1,789,670 (2015 - R$1,873,889 and 2014 - R$1,497,161) from 1 year to up to 5 years and R$496,802 (2015 - R$685,090 and 2014 - R$369,899) after 5 years. Additionally, Banco Santander has contracts for a matures indeterminate, totaling R$1,013 (2015 - R$696 and 2014 - R$967) monthly rent corresponding to the contracts with this feature. Payment of operating leases recognized as expenses in 2016 fiscal year were R$663,801 (2015 - R$659,332 and 2014 - R$679,379). | |||||||||||||||||
Monthly rental contracts will be adjusted on an annual basis, as per prevailing legislation, at Índice Geral de Preços do Mercado (IGPM) variation. The lessee is entitled to unilaterally rescind the agreement, at any time, as contractual clauses and legislation. | |||||||||||||||||
g) Obligation offset and settlement agreements | |||||||||||||||||
Obligation offset and settlement agreements - Resolution CMN 3,263/2005 – The Bank has an obligation offset and settlement agreement within the ambit of national financial institutions (SFN), entered into with individuals and legal entities which may or may not be members of SFN, resulting in improved assurance of financial settlement, with the parties with which it has this type of agreement. These agreements establish that payment obligations with the Bank, arising from loans and derivative transactions, in case of default of the counterparty, will be offset against payment obligations of the Bank with the counterparty. | |||||||||||||||||
h) Contingent assets | |||||||||||||||||
On December 31, 2016, 2015 and 2014 no contingent assets were recorded. | |||||||||||||||||
46. Business segment reporting | |||||||||||||||||
In accordance with IFRS 8, an operating segment is a component of an entity: | |||||||||||||||||
(a) that engages in business activities from which it may earn revenues and incur expenses (including revenues and expenses relating to transactions with other components of the same entity), | |||||||||||||||||
(b) whose operating results are regularly reviewed by the entity’s Management responsible to make decisions about resources to be allocated to the segment and assess its performance, and | |||||||||||||||||
(c) For which discrete financial information are available. | |||||||||||||||||
Based on these guidelines the Bank has identified, the following reportable operating segments: | |||||||||||||||||
| • Commercial Banking, | |||||||||||||||||
| • Global Wholesale Banking, | |||||||||||||||||
The Bank operates in Brazil and abroad, through the Cayman branch and its subsidiary in Spain, with Brazilian clients and therefore has no geographical segments. | |||||||||||||||||
The Commercial Banking segment encompasses the entire commercial banking business (except for the Corporate Banking business managed globally using the Global Relationship Model). The Global Wholesale Banking segment reflects the returns on the Global Corporate Banking business, those on Investment Banking and Markets worldwide, including all treasury departments and the equities business. | |||||||||||||||||
The income statements and other significant data are as follows: | |||||||||||||||||
| Thousands of Reais |
|
|
|
|
|
|
|
|
| 2016 | ||||||
(Condensed) Income Statement | Commercial Banking | Global Wholesale Banking | Total | ||||||||||||||
NET INTEREST INCOME | 27,365,857 |
| 3,220,636 | 30,586,493 | |||||||||||||
| Income from equity instruments |
|
|
|
|
|
|
|
|
| 258,545 |
| - |
| 258,545 | ||
| Income from companies accounted for by the equity method |
|
|
|
|
| 47,537 |
| - |
| 47,537 | ||||||
| Net fee and commission income |
|
|
|
|
|
|
|
|
| 9,580,332 |
| 1,397,264 |
| 10,977,596 | ||
| Gains (losses) on financial assets and liabilities (net) and Exchange differences (net)(1) |
| 5,619,356 |
| 1,971,614 |
| 7,590,970 | ||||||||||
| Other operatingexpense(net) |
|
|
|
|
|
|
|
|
| (611,051) |
| (13,520) |
| (624,571) | ||
| TOTAL INCOME |
|
|
|
|
|
|
|
|
|
|
| 42,260,576 |
| 6,575,994 |
| 48,836,570 |
| Personnel expenses |
|
|
|
|
|
|
|
|
|
|
| (7,638,124) |
| (739,141) |
| (8,377,265) |
| Other administrative expenses |
|
|
|
|
|
|
|
|
| (6,272,987) |
| (270,158) |
| (6,543,145) | ||
| Depreciation and amortization |
|
|
|
|
|
|
|
|
| (1,381,742) |
| (100,897) |
| (1,482,639) | ||
| Provisions (net) |
|
|
|
|
|
|
|
|
|
|
| (2,685,278) |
| (39,464) |
| (2,724,742) |
| Impairment losses on financial assets (net) |
|
|
|
|
|
|
| (11,607,468) |
| (1,693,977) |
| (13,301,445) | ||||
| Impairment losses on non-financial assets (net) |
|
|
|
|
|
|
| (114,154) |
| (167) |
| (114,321) | ||||
| Other non-financial gains (losses) |
|
|
|
|
|
|
|
|
| 90,889 |
| - |
| 90,889 | ||
| OPERATING PROFIT BEFORE TAX(1) |
|
|
|
|
|
|
| 12,651,712 |
| 3,732,190 |
| 16,383,902 | ||||
|
|
|
|
|
|
|
|
|
|
|
|
|
|
|
|
| |
| Other: |
|
|
|
|
|
|
|
|
|
|
|
|
|
|
|
|
| Total assets |
|
|
|
|
|
|
|
|
|
|
| 557,624,385 |
| 76,768,855 |
| 634,393,240 |
| Loans and advances to customers |
|
|
|
|
|
|
|
|
| 191,433,209 |
| 60,569,565 |
| 252,002,774 | ||
| Customer deposits |
|
|
|
|
|
|
|
|
|
|
| 228,923,947 |
| 18,521,230 |
| 247,445,177 |
(1) Includes in the Commercial Bank, the fiscal hedge of investment in dollar (a strategy to mitigate the effects of fiscal and exchange rate variation of offshore investments on net income), the result of which is recorded in "Gains (losses) on financial assets and liabilities" net of taxes. Adjusted for amounted to R$6,139,714 due to the effects of the valuation of the Real against the Dollar in 2016, the Operating Profit before Tax for the Commercial Bank segment was R$6,511,998. | |||||||||||||||||
| Thousands of Reais |
|
|
|
|
|
|
|
|
| 2015 | ||||||
(Condensed) Income Statement | Commercial Banking | Global Wholesale Banking | Total | ||||||||||||||
NET INTEREST INCOME | 27,040,507 | 4,296,604 | 31,337,111 | ||||||||||||||
| Income from equity instruments |
|
|
|
|
|
|
|
|
| 142,881 |
| - |
| 142,881 | ||
| Income from companies accounted for by the equity method |
|
|
|
|
| 116,312 |
| - |
| 116,312 | ||||||
| Net fee and commission income |
|
|
|
|
|
|
|
|
| 8,240,868 |
| 1,242,641 |
| 9,483,509 | ||
| Gains (losses) on financial assets and liabilities (net) and Exchange differences (net)(1) |
| (9,068,985) |
| (849,454) |
| (9,918,439) | ||||||||||
| Other operatingexpense(net) |
|
|
|
|
|
|
|
|
| (335,318) |
| (11,805) |
| (347,123) | ||
| TOTAL INCOME |
|
|
|
|
|
|
|
|
|
|
| 26,136,265 |
| 4,677,986 |
| 30,814,251 |
| Personnel expenses |
|
|
|
|
|
|
|
|
|
|
| (7,123,390) |
| (675,402) |
| (7,798,792) |
| Other administrative expenses |
|
|
|
|
|
|
|
|
| (6,449,732) |
| (266,608) |
| (6,716,340) | ||
| Depreciation and amortization |
|
|
|
|
|
|
|
|
| (1,361,330) |
| (128,687) |
| (1,490,017) | ||
| Provisions (net) |
|
|
|
|
|
|
|
|
|
|
| (4,012,922) |
| 11,628 |
| (4,001,294) |
| Impairment losses on financial assets (net) |
|
|
|
|
|
|
| (12,365,037) |
| (1,268,952) |
| (13,633,989) | ||||
| Impairment losses on non-financial assets (net) |
|
|
|
|
|
|
| (1,220,161) |
| (484) |
| (1,220,645) | ||||
| Other non-financial gains (losses) |
|
|
|
|
|
|
|
|
| 831,108 |
| - |
| 831,108 | ||
| OPERATING PROFIT BEFORE TAX(1) |
|
|
|
|
|
|
| (5,565,199) |
| 2,349,481 |
| (3,215,718) | ||||
|
|
|
|
|
|
|
|
|
|
|
|
|
|
|
|
| |
| Other: |
|
|
|
|
|
|
|
|
|
|
|
|
|
|
|
|
| Total assets |
|
|
|
|
|
|
|
|
|
|
| 524,192,046 |
| 81,202,482 |
| 605,394,528 |
| Loans and advances to customers |
|
|
|
|
|
|
|
|
| 185,371,651 |
| 66,661,798 |
| 252,033,449 | ||
| Customer deposits |
|
|
|
|
|
|
|
|
|
|
| 223,165,976 |
| 19,876,896 |
| 243,042,872 |
| (1) Includes in the Commercial Bank, the fiscal hedge of investment in dollar (a strategy to mitigate the effects of fiscal and exchange rate variation of offshore investments on net income), the result of which is recorded in "Gains (losses) on financial assets and liabilities" net of taxes. Adjusted for losses amounted to R$11,531,844 due to the effects of the devaluation of the Real against the Dollar in 2015, the Operating Profit before Tax for the Commercial Bank segment was R$5,966,645. | ||||||||||||||||
| Thousands of Reais |
|
|
|
|
|
|
|
|
| 2014 | ||||||
(Condensed) Income Statement | Commercial Banking | Global Wholesale Banking | Total | ||||||||||||||
| NET INTEREST INCOME |
|
|
|
|
|
|
|
|
| 25,042,170 |
| 2,186,342 |
| 27,228,512 | ||
| Income from equity instruments |
|
|
|
|
|
|
|
|
| 222,302 |
| - |
| 222,302 | ||
| Income from companies accounted for by the equity method |
|
|
|
|
| 91,096 |
| - |
| 91,096 | ||||||
| Net fee and commission income |
|
|
|
|
|
|
|
|
| 7,748,888 |
| 1,016,998 |
| 8,765,886 | ||
| Gains (losses) on financial assets and liabilities (net) and Exchange differences (net)(1) |
| (1,480,288) |
| 592,852 |
| (887,436) | ||||||||||
| Other operatingexpense(net) |
|
|
|
|
|
|
|
|
| (450,936) |
| (19,541) |
| (470,477) | ||
| TOTAL INCOME |
|
|
|
|
|
|
|
|
|
|
| 31,173,232 |
| 3,776,651 |
| 34,949,883 |
| Personnel expenses |
|
|
|
|
|
|
|
|
|
|
| (6,597,680) |
| (605,762) |
| (7,203,442) |
| Other administrative expenses |
|
|
|
|
|
|
|
|
| (6,493,024) |
| (245,350) |
| (6,738,374) | ||
| Depreciation and amortization |
|
|
|
|
|
|
|
|
| (1,226,196) |
| (135,933) |
| (1,362,129) | ||
| Provisions (net) |
|
|
|
|
|
|
|
|
|
|
| (2,030,408) |
| (5,829) |
| (2,036,237) |
| Impairment losses on financial assets (net) |
|
|
|
|
|
|
| (10,710,448) |
| (561,157) |
| (11,271,605) | ||||
| Impairment losses on non-financial assets (net) |
|
|
|
|
|
|
| 13,943 |
| (10,192) |
| 3,751 | ||||
| Other non-financial gains (losses) |
|
|
|
|
|
|
|
|
| 101,482 |
| - |
| 101,482 | ||
| OPERATING PROFIT BEFORE TAX(1) |
|
|
|
|
|
|
| 4,230,901 |
| 2,212,428 |
| 6,443,329 | ||||
|
|
|
|
|
|
|
|
|
|
|
|
|
|
|
|
| |
| Other: |
|
|
|
|
|
|
|
|
|
|
|
|
|
|
|
|
| Total assets |
|
|
|
|
|
|
|
|
|
|
| 447,099,883 |
| 73,131,027 |
| 520,230,910 |
| Loans and advances to customers |
|
|
|
|
|
|
|
|
| 177,426,688 |
| 58,263,661 |
| 235,690,349 | ||
| Customer deposits |
|
|
|
|
|
|
|
|
|
|
| 199,721,072 |
| 20,922,947 |
| 220,644,019 |
| (1) Includes in the Commercial Bank, the fiscal hedge of investment in dollar (a strategy to mitigate the effects of fiscal and exchange rate variation of offshore investments on net income), the result of which is recorded in "Gains (losses) on financial assets and liabilities" net of taxes. Adjusted for losses amounted to R$1,668,111 due to the effects of the devaluation of the Real against the Dollar in 2014, the Operating Profit before Tax for the Commercial Bank segment was R$5,899,012. | ||||||||||||||||
47. Related party transactions | |||||||||||||||||
The parties related to the Bank are deemed to include, in addition to its subsidiaries, associates and jointly controlled entities, the Bank’s key management personnel and the entities over which the key management personnel may exercise significant influence or control. | |||||||||||||||||
Following is a detail of the business transactions performed by the Bank with its related parties on December 31, 2016, 2015 and 2014: | |||||||||||||||||
a) Key-person management compensation | |||||||||||||||||
The Board of Directors' meeting held on March 22, 2016, was approved in accordance with the Compensation and Appointment Committee the global compensation proposal of directors (Board of Directors and Executive Officers) for the year 2016, amounting to R$300,000, covering fixed remuneration, variable and equity-based and other benefits. The proposal was approved by the extraordinary stockholders' meeting held on April 29, 2016. | |||||||||||||||||
i) Long-term benefits | |||||||||||||||||
The Banco Santander as well as Banco Santander Spain, as other subsidiaries of Santander Group, have long-term compensation programs tied to their share's performance, based on the achievement of goals. | |||||||||||||||||
ii) Short-term benefits | |||||||||||||||||
The following table shows the Board of Directors’ and Executive Board’s: | |||||||||||||||||
| Thousands of Reais |
|
|
|
|
|
|
|
|
|
|
| 2016 |
| 2015 |
| 2014 |
| Fixed compensation |
|
|
|
|
|
|
|
|
|
|
| 90,169 |
| 69,779 |
| 53,170 |
| Variable compensation |
|
|
|
|
|
|
|
|
| 120,443 |
| 108,087 |
| 86,990 | ||
| Other |
|
|
|
|
|
|
|
|
|
|
| 14,579 |
| 15,246 |
| 14,971 |
| Total Short-term benefits |
|
|
|
|
|
|
|
|
| 225,191 |
| 193,112 |
| 155,131 | ||
| Share-based payment |
|
|
|
|
|
|
|
|
| 49,488 |
| 11,777 |
| 23,697 | ||
| Total Long-term benefits |
|
|
|
|
|
|
|
|
| 49,488 |
| 11,777 |
| 23,697 | ||
| Total(1) |
|
|
|
|
|
|
|
|
|
|
| 274,679 |
| 204,889 |
| 178,828 |
(1) Refers to the amount paid by Banco Santander to its executives officers for the positions which they hold in the Bank and other companies of the conglomerate. | |||||||||||||||||
Additionally, in 2016, withholding taxes were collected on management compensation in the amount of R$30,312 (2015 - R$28,044 and 2014 - R$28,493). | |||||||||||||||||
iii) Contract termination | |||||||||||||||||
The termination of the employment relationship for non-fulfillment of obligations or voluntarily does not entitle executives to any financial compensation. | |||||||||||||||||
b) Lending operations | |||||||||||||||||
Under current law, it is not granted loans or advances involving: | |||||||||||||||||
I - directors, members of board of directors and audit committee as well as their spouses and relatives up to the second degree; | |||||||||||||||||
II - individuals or legal entities of Banco Santander, which hold more than 10% of the share capital; | |||||||||||||||||
III - Legal entities which hold more than 10% of the share capital, Banco Santander and its subsidiaries; | |||||||||||||||||
IV - legal entities which hold more than 10% of the share capital, any of the directors or members of the Board of Directors and Audit Committee or management's own financial institution, as well as their spouses or relatives up to the second degree. | |||||||||||||||||
c) Ownership Interest | |||||||||||||||||
The table below shows the direct interest (common shares and preferred shares) as of December 31, 2016, 2015 and 2014: | |||||||||||||||||
|
|
|
|
|
|
| 2016 | ||||||||||
Common | Preferred | Total | |||||||||||||||
Shares | Common | Shares | Preferred | Shares | Total | ||||||||||||
Stockholders' | (thousands) | Shares (%) | (thousands) | Shares (%) | (thousands) | Shares (%) | |||||||||||
| Grupo Empresarial Santander, S.L.(1) |
| 1,107,673 |
| 28.8% |
| 1,019,645 |
| 27.5% |
| 2,127,318 |
| 28.1% | ||||
| Sterrebeeck B.V.(1) |
|
|
|
|
| 1,809,583 |
| 47.0% |
| 1,733,644 |
| 46.7% |
| 3,543,227 |
| 46.9% |
| Banco Santander, S.A.(1) |
|
|
|
|
| 521,965 |
| 13.6% |
| 519,268 |
| 14.0% |
| 1,041,233 |
| 13.8% |
| Qatar Holding, LLC |
| 207,812 |
| 5.4% |
| 207,812 |
| 5.6% |
| 415,624 |
| 5.5% | ||||
| Employees |
|
|
|
|
| 3,914 |
| 0.1% |
| 3,929 |
| 0.1% |
| 7,843 |
| 0.1% |
| Members of the Board of Directors |
|
|
| (*) |
| (*) |
| (*) |
| (*) |
| (*) |
| (*) | ||
| Members of the Executive Board |
|
|
| (*) |
| (*) |
| (*) |
| (*) |
| (*) |
| (*) | ||
| Other |
|
|
|
|
| 174,238 |
| 4.5% |
| 202,028 |
| 5.5% |
| 376,266 |
| 5.0% |
| Total |
|
|
|
|
| 3,825,185 |
| 99.4% |
| 3,686,326 |
| 99.4% |
| 7,511,511 |
| 99.4% |
| Treasury shares |
|
|
|
|
| 25,786 |
| 0.6% |
| 25,786 |
| 0.6% |
| 51,572 |
| 0.6% |
| Total |
|
|
|
|
| 3,850,971 |
| 199.4% |
| 3,712,112 |
| 199.4% |
| 7,563,083 |
| 199.4% |
| Free Float(2) | 385,964 |
| 10.0% |
| 413,769 |
| 11.1% |
| 799,733 |
| 10.6% | |||||
|
|
|
|
|
|
| 2015 | ||||||||||
Common | Preferred | Total | |||||||||||||||
Shares | Common | Shares | Preferred | Shares | Total | ||||||||||||
Stockholders' | (thousands) | Shares (%) | (thousands) | Shares (%) | (thousands) | Shares (%) | |||||||||||
| Grupo Empresarial Santander, S.L.(1) |
| 1,107,673 |
| 28.8% |
| 1,019,645 |
| 27.5% |
| 2,127,318 |
| 28.1% | ||||
| Sterrebeeck B.V.(1) |
|
|
|
|
| 1,809,583 |
| 47.0% |
| 1,733,644 |
| 46.7% |
| 3,543,227 |
| 46.9% |
| Banco Santander, S.A.(1) |
|
|
|
|
| 518,207 |
| 13.5% |
| 519,089 |
| 14.0% |
| 1,037,296 |
| 13.7% |
| Santander Insurance Holding(1) |
|
|
| 3,758 |
| 0.1% |
| 179 |
| - |
| 3,937 |
| 0.1% | ||
| Qatar Holding, LLC |
|
|
|
|
| 207,812 |
| 5.4% |
| 207,812 |
| 5.6% |
| 415,624 |
| 5.5% |
| Employees |
|
|
|
|
| 3,066 |
| 0.1% |
| 3,088 |
| 0.1% |
| 6,154 |
| 0.1% |
| Members of the Board of Directors |
|
|
| (*) |
| (*) |
| (*) |
| (*) |
| (*) |
| (*) | ||
| Members of the Executive Board |
|
|
| (*) |
| (*) |
| (*) |
| (*) |
| (*) |
| (*) | ||
| Other |
|
|
|
|
| 180,655 |
| 4.7% |
| 208,438 |
| 5.6% |
| 389,093 |
| 5.1% |
| Total |
|
|
|
|
| 3,830,754 |
| 99.5% |
| 3,691,895 |
| 99.5% |
| 7,522,649 |
| 99.5% |
| Treasury shares |
|
|
|
|
| 20,218 |
| 0.5% |
| 20,218 |
| 0.5% |
| 40,436 |
| 0.5% |
| Total |
|
|
|
|
| 3,850,972 |
| 199.5% |
| 3,712,113 |
| 199.4% |
| 7,563,085 |
| 199.5% |
| Free Float(2) | 391,533 |
| 10.2% |
| 419,338 |
| 11.3% |
| 810,871 |
| 10.7% | |||||
|
|
|
|
|
|
| 2014 | ||||||||||
Common | Preferred | Total | |||||||||||||||
Shares | Common | Shares | Preferred | Shares | Total | ||||||||||||
Stockholders' | (thousands) | Shares (%) | (thousands) | Shares (%) | (thousands) | Shares (%) | |||||||||||
| Grupo Empresarial Santander, S.L.(1) |
| 1,107,673 |
| 28.6% |
| 1,019,645 |
| 27.3% |
| 2,127,318 |
| 28.0% | ||||
| Sterrebeeck B.V.(1) |
|
|
|
|
| 1,809,583 |
| 46.8% |
| 1,733,644 |
| 46.5% |
| 3,543,227 |
| 46.6% |
| Banco Santander, S.A.(1) |
|
|
| 518,207 |
| 13.4% |
| 519,089 |
| 13.9% |
| 1,037,296 |
| 13.6% | ||
| Santander Insurance Holding(1) |
|
|
| 3,758 |
| 0.1% |
| 179 |
| 0.0% |
| 3,937 |
| 0.1% | ||
| Qatar Holding, LLC |
|
|
|
|
| 207,812 |
| 5.1% |
| 207,812 |
| 5.3% |
| 415,624 |
| 5.2% |
| Employees |
|
|
|
|
| 4,098 |
| 0.1% |
| 4,121 |
| 0.1% |
| 8,219 |
| 0.1% |
| Members of the Board of Directors |
|
|
| (*) |
| (*) |
| (*) |
| (*) |
| (*) |
| (*) | ||
| Members of the Executive Board |
|
|
| (*) |
| (*) |
| (*) |
| (*) |
| (*) |
| (*) | ||
| Other |
|
|
|
|
| 189,107 |
| 5.2% |
| 216,888 |
| 6.2% |
| 405,995 |
| 5.7% |
| Total |
|
|
|
|
| 3,840,238 |
| 99.3% |
| 3,701,378 |
| 99.3% |
| 7,541,616 |
| 99.3% |
| Treasury shares |
|
|
|
|
| 29,612 |
| 0.7% |
| 29,612 |
| 0.7% |
| 59,224 |
| 0.7% |
| Total |
|
|
|
|
| 3,869,850 |
| 199.3% |
| 3,730,990 |
| 199.3% |
| 7,600,840 |
| 199.3% |
| Free Float(2) | 401,017 |
| 10.4% |
| 428,821 |
| 11.5% |
| 829,838 |
| 10.9% | |||||
(1) Companies of the Santander Spain Group. | |||||||||||||||||
(2) Composed of Employees, Qatar Holding and other. | |||||||||||||||||
(*) None of the members of the Board of Directors and the Executive Board holds 1.0% or more of any class of shares. | |||||||||||||||||
d) Related-Party Transactions | |||||||||||||||||
The transactions and compensation for services among Banco Santander companies are carried out under usual market value, rates and terms, and on an arm´s length basis. | |||||||||||||||||
Banco Santander has the Policy on Related Party Transactions approved by the Board of Directors, which aim to ensure that all transactions are made on the policy typified in view the interests of Banco Santander and its stockholders'. The policy defines powers to approve certain transactions by the Board of Directors. The rules laid down are also applied to all employees and directors of Banco Santander and its subsidiaries. | |||||||||||||||||
The principal transactions and balances are as follows: | |||||||||||||||||
| Thousands of Reais |
|
|
|
|
|
|
|
|
|
|
| 2016 | ||||
Parent(1) | Joint-controlled | Other Related-Party(2) | |||||||||||||||
| Assets |
|
|
|
|
|
|
|
|
|
|
| 10,919,116 |
| 794,800 |
| 556,248 |
| Financial assets for trading - Derivatives net |
|
|
|
|
|
|
| (184,304) |
| - |
| (400,570) | ||||
| Banco Santander, S.A. – Spain |
|
|
|
|
|
|
| (184,304) |
| - |
| - | ||||
| Abbey National Treasury Services Plc |
|
|
|
|
|
|
| - |
| - |
| (91,828) | ||||
| Real Fundo de Investimento Multimercado Santillana Credito Privado |
|
|
|
|
|
|
| - |
| - |
| (308,742) | ||||
| Loans and other values with credit institutions - Cash and overnight operations in foreign currency | 10,900,941 |
| - |
| 94,530 | |||||||||||
| Banco Santander, S.A. – Spain(3) (5) |
| 10,900,941 |
| - |
| - | ||||||||||
| Banco Santander Totta, S.A. |
| - |
| - |
| 1,261 | ||||||||||
| Abbey National Treasury Services Plc |
| - |
| - |
| 92,118 | ||||||||||
| Bank Zachodni |
| - |
| - |
| 117 | ||||||||||
| Banco Santander, S.A. – Mexico |
| - |
| - |
| 1,034 | ||||||||||
| Loans and advances to customers |
| - |
| 136,354 |
| 862,288 | ||||||||||
| Zurich Santander Brasil Seguros e Previdência S.A. |
| - |
| - |
| 862,553 | ||||||||||
| Webmotors S.A. |
| - |
| 136,354 |
| - | ||||||||||
| Santander Brasil Gestão de Recursos Ltda |
| - |
| - |
| (265) | ||||||||||
| Loans and other values with credit institutions(1) |
| 25,546 |
| 656,806 |
| - | ||||||||||
| Banco Santander – Spain |
| 25,546 |
| - |
| - | ||||||||||
| Banco RCI Brasil S.A. (Current Company Name of Social da RCI Brasil Leasing)(8) |
| - |
| 656,806 |
| - | ||||||||||
| Other Assets |
|
|
|
|
|
|
|
|
|
|
| 176,933 |
| 1,640 |
| - |
| Banco Santander – Spain |
| 176,933 |
| - |
| - | ||||||||||
Banco RCI Brasil S.A. (Current Company Name of Social da RCI Brasil Leasing)(8) |
| - |
| 1,640 |
| - | |||||||||||
| Liabilities |
|
|
|
|
|
|
|
|
|
|
| (11,984,199) |
| (106,527) |
| (1,222,556) |
| Deposits of Brazil Central Bank and deposits of credit institutions |
|
|
|
|
| (327,466) |
| (40,202) |
| (980,702) | ||||||
| Banco Santander, S.A. – Spain(4) |
| (327,466) |
| - |
| - | ||||||||||
| Santander Securities |
| - |
| - |
| (208,059) | ||||||||||
| Santander Brasil Asset |
| - |
| - |
| (12,079) | ||||||||||
| Real Fundo de Investimento Multimercado Santillana Credito Privado |
| - |
| - |
| (757,874) | ||||||||||
| Banco Santander, S.A. – Uruguay |
| - |
| - |
| (2,158) | ||||||||||
| Banco RCI Brasil S.A. (Current Company Name of Social da RCI Brasil Leasing)(8) |
| - |
| (40,202) |
| - | ||||||||||
| Others |
| - |
| - |
| (532) | ||||||||||
| Customer deposits |
|
|
|
|
|
|
|
|
|
|
| - |
| (66,325) |
| (189,794) |
| ISBAN Brasil S.A. |
| - |
| - |
| (22,232) | ||||||||||
| Santander Securities |
| - |
| - |
| (52,484) | ||||||||||
| Produban Serviços de Informática S.A. |
| - |
| - |
| (19,653) | ||||||||||
| Zurich Santander Brasil Seguros e Previdência S.A. |
| - |
| - |
| (44,840) | ||||||||||
| Santander Brasil Gestão de Recursos Ltda. |
| - |
| - |
| (39,361) | ||||||||||
| Webmotors S.A. |
| - |
| (66,325) |
| - | ||||||||||
| Others |
| - |
| - |
| (11,224) | ||||||||||
| Other financial liabilities - Dividends and interest on capital Payable |
|
|
|
| (3,794,130) |
| - |
| (16,494) | |||||||
| Banco Santander – Spain |
| (589,227) |
| - |
| - | ||||||||||
| Grupo Empresarial Santander, S.L.(1) |
| (1,201,612) |
| - |
| - | ||||||||||
| Sterrebeeck B.V.(1) |
| (2,003,291) |
| - |
| - | ||||||||||
| Banco Madesant - Sociedade Unipessoal, S.A. |
| - |
| - |
| (1,075) | ||||||||||
| Santusa Holding, S.L. |
|
|
|
|
|
|
|
|
|
|
| - |
| - |
| (15,419) |
| Other Payables |
|
|
|
|
|
|
|
|
|
|
| (2,954) |
| - |
| (35,566) |
| Banco Santander, S.A. – Spain |
| (2,954) |
| - |
| - | ||||||||||
| Santander Brasil Asset |
| - |
| - |
| (70) | ||||||||||
| ISBAN Brasil S.A. |
| - |
| - |
| (339) | ||||||||||
| Santander Securities |
| - |
| - |
| (4,430) | ||||||||||
| Zurich Santander Brasil Seguros e Previdência S.A. |
| - |
| - |
| (30,684) | ||||||||||
| Others |
| - |
| - |
| (43) | ||||||||||
| Debt Instruments Eligible to Compose Capital |
|
|
|
|
|
|
| (7,859,649) |
| - |
| - | ||||
| Banco Santander – Spain(2) (7) |
| (7,859,649) |
| - |
| - | ||||||||||
| Thousands of Reais |
|
|
|
|
|
|
|
|
|
|
| 2015 | ||||
Parent(1) | Joint-controlled | Other Related-Party(2) | |||||||||||||||
| Assets |
|
|
|
|
|
|
|
|
|
|
| 23,245,276 |
| 954,190 |
| 805,572 |
| Financial assets for trading - Derivatives net |
|
|
|
|
|
|
| (265,491) |
| - |
| (536,215) | ||||
| Banco Santander, S.A. – Spain |
|
|
|
|
|
|
| (265,491) |
| - |
| - | ||||
| Abbey National Treasury Services Plc |
|
|
|
|
|
|
| - |
| - |
| (156,976) | ||||
| Real Fundo de Investimento Multimercado Santillana Credito Privado |
|
|
|
|
|
|
| - |
| - |
| (379,239) | ||||
| Loans and other values with credit institutions - Cash and overnight operations in foreign currency | 23,248,821 |
| - |
| 136,634 | |||||||||||
| Banco Santander, S.A. – Spain(3) (5) |
| 23,248,821 |
| - |
| - | ||||||||||
| Banco Santander Totta, S.A. |
| - |
| - |
| 1,303 | ||||||||||
| Abbey National Treasury Services Plc |
| - |
| - |
| 135,165 | ||||||||||
| Bank Zachodni |
| - |
| - |
| 101 | ||||||||||
| Banco Santander, S.A. – Mexico |
| - |
| - |
| 65 | ||||||||||
| Loans and advances to customers |
| - |
| 11,112 |
| 1,205,153 | ||||||||||
| Zurich Santander Brasil Seguros e Previdência S.A. |
| - |
| - |
| 753,581 | ||||||||||
| Webmotors S.A. |
| - |
| 11,112 |
| - | ||||||||||
| Santander Brasil Gestão de Recursos Ltda. |
| - |
| - |
| 186 | ||||||||||
| BW Guirapá |
|
|
|
|
|
|
|
|
|
|
| - |
| - |
| 451,386 |
| Loans and other values with credit institutions(1) |
| 26,414 |
| 940,236 |
| - | ||||||||||
| Banco Santander – Spain |
| 26,414 |
| - |
| - | ||||||||||
| Companhia de Crédito, Financiamento e Investimento RCI Brasil(8) |
| - |
| 939,861 |
| - | ||||||||||
| Banco RCI Brasil S.A. (Current Company Name of Social da RCI Brasil Leasing)(8) |
| - |
| 375 |
| - | ||||||||||
| Other Assets |
|
|
|
|
|
|
|
|
|
|
| 235,532 |
| 2,842 |
| - |
| Banco Santander – Spain |
| 235,532 |
| - |
| - | ||||||||||
| Companhia de Crédito, Financiamento e Investimento RCI Brasil(8) |
| - |
| 2,276 |
| - | ||||||||||
Banco RCI Brasil S.A. (Current Company Name of Social da RCI Brasil Leasing)(8) |
| - |
| 566 |
| - | |||||||||||
| Liabilities |
|
|
|
|
|
|
|
|
|
|
| (12,155,786) |
| (255,330) |
| (937,572) |
| Deposits of Brazil Central Bank and deposits of credit institutions |
|
|
|
|
| (219,037) |
| (37,796) |
| (650,620) | ||||||
| Banco Santander, S.A. – Spain(4) |
| (219,037) |
| - |
| - | ||||||||||
| Companhia de Crédito, Financiamento e Investimento RCI Brasil(8) |
| - |
| (31,656) |
| - | ||||||||||
| Santander Brasil Asset |
| - |
| - |
| (12,360) | ||||||||||
| Real Fundo de Investimento Multimercado Santillana Credito Privado |
| - |
| - |
| (616,399) | ||||||||||
| Banco Santander, S.A. – Uruguay |
| - |
| - |
| (20,533) | ||||||||||
| Banco RCI Brasil S.A. (Current Company Name of Social da RCI Brasil Leasing)(8) |
| - |
| (6,140) |
| - | ||||||||||
| Others |
| - |
| - |
| (1,328) | ||||||||||
| Marketable debt securities |
| (12,416) |
| - |
| - | ||||||||||
| Banco Santander, S.A. – Spain(6) |
| (12,416) |
| - |
| - | ||||||||||
| Customer deposits |
|
|
|
|
|
|
|
|
|
|
| - |
| (217,534) |
| (285,870) |
| ISBAN Brasil S.A. |
| - |
| - |
| (43,842) | ||||||||||
| Santander Securities |
| - |
| - |
| (679) | ||||||||||
| Produban Serviços de Informática S.A. |
| - |
| - |
| (29,993) | ||||||||||
| Zurich Santander Brasil Seguros e Previdência S.A. |
| - |
| - |
| (109,506) | ||||||||||
| Santander Brasil Gestão de Recursos Ltda |
| - |
| - |
| (72,182) | ||||||||||
| Webmotors S.A. |
| - |
| (217,534) |
| - | ||||||||||
| Others |
| - |
| - |
| (29,668) | ||||||||||
| Other financial liabilities - Dividends and interest on capital Payable |
|
|
|
| (2,488,510) |
| - |
| (705) | |||||||
| Banco Santander – Spain |
| (385,067) |
| - |
| - | ||||||||||
| Grupo Empresarial Santander, S.L.(1) |
| (788,119) |
| - |
| - | ||||||||||
| Santander Insurance Holding, S.L. |
| (1,398) |
| - |
| - | ||||||||||
| Sterrebeeck B.V.(1) |
| (1,313,926) |
| - |
| - | ||||||||||
| Banco Madesant - Sociedade Unipessoal, S.A. |
| - |
| - |
| (705) | ||||||||||
| Other Payables |
|
|
|
|
|
|
|
|
|
|
| - |
| - |
| (377) |
| Santander Brasil Asset |
| - |
| - |
| (68) | ||||||||||
| ISBAN Brasil S.A. |
| - |
| - |
| (309) | ||||||||||
| Debt Instruments Eligible to Compose Capital |
|
|
|
|
|
|
| (9,435,823) |
| - |
| - | ||||
| Banco Santander – Spain(2) (7) |
| (9,435,823) |
| - |
| - | ||||||||||
| Thousands of Reais |
|
|
|
|
|
|
|
|
|
|
| 2014 | ||||
Parent(1) | Joint-controlled | Other Related-Party(2) | |||||||||||||||
| Assets |
|
|
|
|
|
|
|
|
|
|
| 11,033,229 |
| 1,880,176 |
| 546,856 |
| Financial assets for trading - Derivatives net |
|
|
|
|
|
|
| (98,286) |
| - |
| (87,161) | ||||
| Banco Santander, S.A. – Spain |
|
|
|
|
|
|
|
|
| (98,286) |
| - |
| - | ||
| Santander Benelux, S.A., N.V. |
|
|
|
|
|
|
|
|
| - |
| - |
| 381,956 | ||
| Abbey National Treasury Services Plc |
|
|
|
|
|
|
|
| - |
| - |
| (871) | |||
| Real Fundo de Investimento Multimercado Santillana Credito Privado |
|
|
|
|
| - |
| - |
| (468,246) | ||||||
| Loans and other values with credit institutions - Cash and overnight operations in foreign currency | 10,913,872 |
| - |
| 2,787 | |||||||||||
| Banco Santander, S.A. – Spain(3) (5) |
| 10,913,872 |
| - |
| - | ||||||||||
| Banco Santander Totta, S.A. |
| - |
| - |
| 2,787 | ||||||||||
| Loans and advances to customers |
| - |
| 10,340 |
| 631,149 | ||||||||||
| Zurich Santander Brasil Seguros e Previdência S.A. |
| - |
| - |
| 630,694 | ||||||||||
| Webmotors S.A. |
| - |
| 10,340 |
| - | ||||||||||
| Santander Brasil Gestão de Recursos Ltda |
| - |
| - |
| 455 | ||||||||||
| Loans and other values with credit institutions(1) |
| 11,900 |
| 1,867,750 |
| 81 | ||||||||||
| Banco Santander – Spain |
| 11,900 |
| - |
| - | ||||||||||
| Companhia de Crédito, Financiamento e Investimento RCI Brasil(8) |
| - |
| 1,867,138 |
| - | ||||||||||
| Banco RCI Brasil S.A. (Current Company Name of Social da RCI Brasil Leasing)(8) |
| - |
| 612 |
| - | ||||||||||
| Real Fundo de Investimento Multimercado Santillana Credito Privado |
| - |
| - |
| 81 | ||||||||||
| Other Assets |
|
|
|
|
|
|
|
|
|
|
| 205,743 |
| 2,086 |
| - |
| Banco Santander – Spain |
| 205,743 |
| - |
| - | ||||||||||
| Companhia de Crédito, Financiamento e Investimento RCI Brasil(8) |
| - |
| 2,086 |
| - | ||||||||||
|
|
|
|
|
|
|
|
|
|
|
|
|
|
|
|
|
|
| Liabilities |
|
|
|
|
|
|
|
|
|
|
| (7,375,101) |
| (161,871) |
| (612,659) |
| Deposits of Brazil Central Bank and deposits of credit institutions |
|
|
|
|
| (416,969) |
| (19,186) |
| (286,348) | ||||||
| Banco Santander, S.A. – Spain(4) |
| (416,969) |
| - |
| - | ||||||||||
| Companhia de Crédito, Financiamento e Investimento RCI Brasil(8) |
| - |
| (15,699) |
| - | ||||||||||
| Santander Brasil Asset |
| - |
| - |
| (16,742) | ||||||||||
| Real Fundo de Investimento Multimercado Santillana Credito Privado |
| - |
| - |
| (261,865) | ||||||||||
| Banco Santander, S.A. – Uruguay |
| - |
| - |
| (7,741) | ||||||||||
| Banco RCI Brasil S.A. (Current Company Name of Social da RCI Brasil Leasing)(8) |
| - |
| (3,487) |
| - | ||||||||||
| Marketable debt securities |
| (6,082) |
| - |
| - | ||||||||||
| Banco Santander, S.A. – Spain(7) |
| (6,082) |
| - |
| - | ||||||||||
| Customer deposits |
|
|
|
|
|
|
|
|
|
|
| - |
| (142,685) |
| (271,753) |
| ISBAN Brasil S.A. |
| - |
| - |
| (70,449) | ||||||||||
| Produban Serviços de Informática S.A. |
| - |
| - |
| (41,646) | ||||||||||
| Zurich Santander Brasil Seguros e Previdência S.A. |
| - |
| - |
| (49,526) | ||||||||||
| Santander Brasil Gestão de Recursos Ltda |
| - |
| - |
| (89,830) | ||||||||||
| Webmotors S.A. |
| - |
| (142,685) |
| - | ||||||||||
| Others |
| - |
| - |
| (20,302) | ||||||||||
| Other financial liabilities - Dividends and interest on capital Payable |
|
|
|
| (538,636) |
| - |
| (47,271) | |||||||
| Banco Santander, S.A. – Spain |
| (25,084) |
| - |
| - | ||||||||||
| Grupo Empresarial Santander, S.L.(1) |
| (134,413) |
| - |
| - | ||||||||||
| Santander Insurance Holding, S.L. |
| (403) |
| - |
| - | ||||||||||
| Sterrebeeck B.V.(1) |
| (378,736) |
| - |
| - | ||||||||||
| Banco Madesant - Sociedade Unipessoal, S.A. |
| - |
| - |
| (55) | ||||||||||
| Santusa Holding, S.L. |
| - |
| - |
| (47,216) | ||||||||||
| Other Payables |
|
|
|
|
|
|
|
|
|
|
| (7,719) |
| - |
| (7,287) |
| Banco Santander – Spain |
| (7,719) |
| - |
| - | ||||||||||
| Produban Serviços de Informática S.A. |
| - |
| - |
| (441) | ||||||||||
| Zurich Santander Brasil Seguros e Previdência S.A. |
| - |
| - |
| (35) | ||||||||||
| Santander Brasil Asset |
| - |
| - |
| (6,811) | ||||||||||
Debt Instruments Eligible to Compose Capital |
|
|
|
|
|
|
| (6,405,695) |
| - |
| - | |||||
Banco Santander – Spain(2) (7) |
| (6,405,695) |
| - |
| - | |||||||||||
(*) All loans and amounts to related parties were made in our ordinary course of business and on sustainable basis, including interest rates and collateral and did not involve more than the normal risk of collectability or present other unfavorable features. | |||||||||||||||||
(1) Banco Santander (Brasil) S.A. is indirectly controlled by Banco Santander Spain (note 1-a), through its subsidiary Grupo Empresarial Santander, S.L. and Sterrebeeck B.V. | |||||||||||||||||
(2) Refers to the Company's subsidiaries (Banco Santander Spain). | |||||||||||||||||
(3) In December 31, 2016, refers to the cash of R$582,571 (2015 - R$1,866,683 and 2014 - R$410,193). | |||||||||||||||||
(4) As at December 31, 2016, refers to raising funds through operations transfers abroad amounted to R$327,466 (2015 - R$219,037 and 2014 - R$416,969), with maturity until November, 2017 and interest between 0.56% and 12.95%p.a. | |||||||||||||||||
(5) On December 30, 2016, include foreign currency investments (overnight applications) due on January 03, 2017 in the amount of R$10,269,812 (2015 - R$20,699,539 and 2014 - R$10,663,319) and interest of 0.68% p.a held at Santander Establishment Credit Financial, Banco Santander Brazil and its Grand Cayman Branch. | |||||||||||||||||
(6) Refers the emissions of Eurobonds of Grand Cayman Branch, maturing between from January 16 2016 to February 13, 2017 and interest of 3.152% p.a and 4.625% p.a. | |||||||||||||||||
(7) Refers to the portion acquired by the controller with the PR Optimization Plan held in the first half of 2014. | |||||||||||||||||
(8) In February, 2016 the Cia de Crédito, Financiamento e Investimentos Renault was acquired by Banco RCI Brasil. | |||||||||||||||||
| Thousands of Reais | 2016 | |||||||||||||||
Parent(1) | Joint-controlled | Other Related-Party(2) | |||||||||||||||
| �� | |||||||||||||||||
| Income |
|
|
|
|
|
|
|
|
|
|
| (798,022) |
| 136,111 |
| 1,197,489 |
Interest and similar income - Loans and amounts due from credit institutions |
|
|
| 39,677 |
| 114,909 |
| 396 | |||||||||
| Banco Santander, S.A. – Spain |
| 39,677 |
| - |
| - | ||||||||||
| Banco RCI Brasil S.A. (Current Company Name of Social da RCI Brasil Leasing)(6) |
| - |
| 114,909 |
| - | ||||||||||
| Abbey National Treasury Services Plc |
| - |
| - |
| 396 | ||||||||||
| Interest expense and similar charges - Customer deposits |
|
|
|
|
| (4,192) |
| (26,996) |
| (49,420) | ||||||
| ISBAN Brasil S.A. |
| - |
| - |
| (3,560) | ||||||||||
| Banco Santander, S.A. – Spain |
| (4,192) |
| - |
| - | ||||||||||
| Santander Brasil Gestão de Recursos Ltda |
| - |
| - |
| (12,417) | ||||||||||
| Santander Cultural |
| - |
| - |
| (11) | ||||||||||
| Real Fundo de Investimento Multimercado Santillana Credito Privado |
| - |
| - |
| (31,097) | ||||||||||
| Webmotors S.A. |
| - |
| (26,996) |
| - | ||||||||||
| Produban Serviços de Informática S.A. |
| - |
| - |
| (2,117) | ||||||||||
| Others |
| - |
| - |
| (218) | ||||||||||
| Interest expense and similar charges - Deposits from credit institutions |
|
|
| (512) |
| (10,959) |
| (115,458) | ||||||||
| Banco Santander, S.A. – Spain |
| (512) |
| - |
| - | ||||||||||
| Banco RCI Brasil S.A. (Current Company Name of Social da RCI Brasil Leasing)(6) |
| - |
| (10,959) |
| - | ||||||||||
| Santander Securities |
| - |
| - |
| (20,979) | ||||||||||
| SAM Brasil Participações |
| - |
| - |
| (133) | ||||||||||
| Real Fundo de Investimento Multimercado Santillana Credito Privado |
| - |
| - |
| (88,467) | ||||||||||
| Santander Securities |
| - |
| - |
| (4,119) | ||||||||||
| Santander Asset Management, S.A. SGIIC. |
| - |
| - |
| (1,760) | ||||||||||
| Fee and commission income (expense) |
|
|
|
|
|
|
| 5,334 |
| 20,133 |
| 1,955,255 | ||||
| Banco Santander, S.A. – Spain |
| 5,334 |
| - |
| - | ||||||||||
| Banco RCI Brasil S.A. (Current Company Name of Social da RCI Brasil Leasing)(6) |
| - |
| 19,211 |
| - | ||||||||||
| Banco Santander International |
| - |
| - |
| 20,959 | ||||||||||
| Santander Securities |
| - |
| - |
| 1,896 | ||||||||||
| Webmotors S.A. |
| - |
| 922 |
| - | ||||||||||
| Zurich Santander Brasil Seguros S.A. |
| - |
| - |
| 218,773 | ||||||||||
| Zurich Santander Brasil Seguros e Previdência S.A. |
| - |
| - |
| 1,711,138 | ||||||||||
| Others |
| - |
| - |
| 2,489 | ||||||||||
| Gains (losses) on financial assets and liabilities (net) and exchange differences (net) |
| (613,168) |
| 39,024 |
| 267,983 | ||||||||||
| Banco Santander, S.A. – Spain |
| (613,168) |
| - |
| - | ||||||||||
| Real Fundo de Investimento Multimercado Santillana Credito Privado |
| - |
| - |
| 257,475 | ||||||||||
| Abbey National Treasury Services Plc |
| - |
| - |
| 38,274 | ||||||||||
| Banco RCI Brasil S.A. (Current Company Name of Social da RCI Brasil Leasing)(6) |
| - |
| 39,024 |
| - | ||||||||||
| Santander Securities |
| - |
| - |
| (16,038) | ||||||||||
| Santander Investment Securities Inc. |
| - |
| - |
| (15,115) | ||||||||||
| Others |
| - |
| - |
| 3,387 | ||||||||||
| Administrative expenses and Amortization |
|
|
|
|
|
|
| - |
| - |
| (840,739) | ||||
| ISBAN Brasil S.A. |
| - |
| - |
| (290,430) | ||||||||||
| Produban Serviços de Informática S.A. |
| - |
| - |
| (209,253) | ||||||||||
| ISBAN Chile S.A. |
| - |
| - |
| (26) | ||||||||||
| Aquanima Brasil Ltda. |
| - |
| - |
| (24,557) | ||||||||||
| TECBAN - Tecnologia Bancaria Brasil |
| - |
| - |
| (213,194) | ||||||||||
| Produban Servicios Informaticos Generales, S.L. |
| - |
| - |
| (21,525) | ||||||||||
| Ingeniería de Software Bancario, S.L. |
| - |
| - |
| (42,519) | ||||||||||
| Santander Securities |
|
|
|
|
|
|
|
|
|
|
| - |
| - |
| (35,882) |
| Others |
| - |
| - |
| (3,353) | ||||||||||
| Others Administrative expenses - Donation |
|
|
|
|
|
|
| - |
| - |
| (20,528) | ||||
| Santander Cultural |
| - |
| - |
| (2,737) | ||||||||||
| Fundacao Santander |
| - |
| - |
| (3,452) | ||||||||||
| Instituto Escola Brasil |
| - |
| - |
| (939) | ||||||||||
| Fundação Sudameris |
| - |
| - |
| (13,400) | ||||||||||
Debt Instruments Eligible to Compose Capital |
|
|
|
|
|
|
| (225,161) |
| - |
| - | |||||
| Banco Santander Espanha(2)(8) |
| (225,161) |
| - |
| - | ||||||||||
| Thousands of Reais |
|
|
|
|
|
|
| 2015 | ||||||||
Parent(1) | Joint-controlled | Other Related-Party(2) | |||||||||||||||
| Income |
|
|
|
|
|
|
|
|
|
|
| (761,189) |
| 189,182 |
| 2,509,524 |
Interest and similar income - Loans and amounts due from credit institutions |
|
|
| 31,930 |
| 163,684 |
| 104 | |||||||||
| Banco Santander, S.A. – Spain |
| 31,930 |
| - |
| - | ||||||||||
| Companhia de Crédito, Financiamento e Investimento RCI Brasil(6) |
| - |
| 163,684 |
| - | ||||||||||
| Abbey National Treasury Services Plc |
| - |
| - |
| 104 | ||||||||||
| Interest expense and similar charges - Customer deposits |
|
|
|
|
| - |
| (25,330) |
| (28,508) | ||||||
| ISBAN Brasil S.A. |
| - |
| - |
| (7,841) | ||||||||||
| Santander Brasil Gestão de Recursos Ltda |
| - |
| - |
| (14,302) | ||||||||||
| Webmotors S.A. |
| - |
| (25,330) |
| - | ||||||||||
| Produban Serviços de Informática S.A. |
| - |
| - |
| (3,752) | ||||||||||
| Others |
| - |
| - |
| (2,613) | ||||||||||
| Interest expense and similar charges - Deposits from credit institutions |
|
|
| (311) |
| (1,447) |
| (89,636) | ||||||||
| Banco Santander, S.A. – Spain |
| (311) |
| - |
| - | ||||||||||
| Banco RCI Brasil S.A. (Current Company Name of Social da RCI Brasil Leasing)(6) |
| - |
| (1,447) |
| - | ||||||||||
| Real Fundo de Investimento Multimercado Santillana Credito Privado |
| - |
| - |
| (15,584) | ||||||||||
| Santander Securities |
| - |
| - |
| (71,939) | ||||||||||
| Santander Asset Management, S.A. SGIIC. |
| - |
| - |
| (2,113) | ||||||||||
| Fee and commission income (expense) |
|
|
|
|
|
|
| (8,022) |
| 21,376 |
| 1,889,138 | ||||
| Banco Santander, S.A. – Spain |
| (8,022) |
| - |
| - | ||||||||||
| Banco RCI Brasil S.A. (Current Company Name of Social da RCI Brasil Leasing)(6) |
| - |
| 3,863 |
| - | ||||||||||
| Companhia de Crédito, Financiamento e Investimento RCI Brasil(6) |
| - |
| 16,579 |
| - | ||||||||||
| Banco Santander International |
| - |
| - |
| 8,804 | ||||||||||
| Webmotors S.A. |
| - |
| 934 |
| - | ||||||||||
| Zurich Santander Brasil Seguros S.A. |
| - |
| - |
| 248,824 | ||||||||||
| Zurich Santander Brasil Seguros e Previdência S.A. |
| - |
| - |
| 1,626,288 | ||||||||||
| Others |
| - |
| - |
| 5,222 | ||||||||||
| Gains (losses) on financial assets and liabilities (net) and exchange differences (net) |
| (406,523) |
| 30,899 |
| 953,678 | ||||||||||
| Banco Santander, S.A. – Spain |
| (406,523) |
| - |
| - | ||||||||||
| Santander Benelux, S.A., N.V. |
| - |
| - |
| 424,182 | ||||||||||
| Real Fundo de Investimento Multimercado Santillana Credito Privado |
| - |
| - |
| 602,557 | ||||||||||
| Abbey National Treasury Services Plc |
| - |
| - |
| (88,881) | ||||||||||
| Companhia de Crédito, Financiamento e Investimento RCI Brasil(6) |
| - |
| 30,899 |
| - | ||||||||||
| Others |
| - |
| - |
| 15,820 | ||||||||||
| Administrative expenses and Amortization |
|
|
|
|
|
|
| - |
| - |
| (982,135) | ||||
| ISBAN Brasil S.A. |
| - |
| - |
| (406,662) | ||||||||||
| Produban Serviços de Informática S.A. |
| - |
| - |
| (205,137) | ||||||||||
| ISBAN Chile S.A. |
| - |
| - |
| (1,024) | ||||||||||
| Aquanima Brasil Ltda. |
| - |
| - |
| (24,075) | ||||||||||
| TECBAN - Tecnologia Bancaria Brasil |
| - |
| - |
| (160,563) | ||||||||||
| Produban Servicios Informaticos Generales, S.L. |
| - |
| - |
| (22,834) | ||||||||||
| Konecta Brazil Outsourcing Ltda |
| - |
| - |
| (98,492) | ||||||||||
| Ingeniería de Software Bancario, S.L. |
| - |
| - |
| (57,293) | ||||||||||
| Others |
| - |
| - |
| (6,055) | ||||||||||
| Others Administrative expenses - Donation |
|
|
|
|
|
|
| - |
| - |
| (18,071) | ||||
| Santander Cultural |
| - |
| - |
| (3,231) | ||||||||||
| Fundacao Santander |
| - |
| - |
| (3,500) | ||||||||||
| Instituto Escola Brasil |
| - |
| - |
| (1,140) | ||||||||||
| Fundação Sudameris |
| - |
| - |
| (10,200) | ||||||||||
Debt Instruments Eligible to Compose Capital |
|
|
|
|
|
|
| (378,263) |
| - |
| - | |||||
| Banco Santander Espanha(2)(8) |
| (378,263) |
| - |
| - | ||||||||||
Gain on disposal of non-current assets held for sale not classified as discontinued operations |
| - |
| - |
| 784,954 | |||||||||||
| Capital Riesgo Global(3) |
| - |
| - |
| 34,404 | ||||||||||
| Santander Securities Services Brasil Participações S.A.(5) |
| - |
| - |
| 750,550 | ||||||||||
| Thousands of Reais |
|
|
|
|
|
|
| 2014 | ||||||||
Parent(1) | Joint-controlled | Other Related-Party(2) | |||||||||||||||
| Income |
|
|
|
|
|
|
|
|
|
|
| (1,165,021) |
| 147,917 |
| 1,178,208 |
Interest and similar income - Loans and amounts due from credit institutions |
|
|
| 11,523 |
| 117,531 |
| 9 | |||||||||
| Banco Santander, S.A. – Spain |
| 11,523 |
| - |
| - | ||||||||||
| Abbey National Treasury Services Plc |
| - |
| - |
| 5 | ||||||||||
| Companhia de Crédito, Financiamento e Investimento RCI Brasil(6) |
| - |
| 117,531 |
| - | ||||||||||
| Santander Benelux, S.A., N.V. |
| - |
| - |
| 4 | ||||||||||
| Interest expense and similar charges - Customer deposits |
|
|
|
|
| - |
| (14,187) |
| (20,064) | ||||||
| ISBAN Brasil S.A. |
| - |
| - |
| (7,342) | ||||||||||
| Produban Serviços de Informática S.A. |
| - |
| - |
| (3,075) | ||||||||||
| Webmotors S.A. |
| - |
| (14,187) |
| - | ||||||||||
| Santander Brasil Gestão de Recursos Ltda |
| - |
| - |
| (8,528) | ||||||||||
| Others |
| - |
| - |
| (1,119) | ||||||||||
| Interest expense and similar charges - Deposits from credit institutions |
|
|
| (125) |
| (5,669) |
| (62,396) | ||||||||
| Banco Santander, S.A. – Spain |
| (125) |
| - |
| - | ||||||||||
| Companhia de Crédito, Financiamento e Investimento RCI Brasil(6) |
| - |
| (5,669) |
| - | ||||||||||
| Real Fundo de Investimento Multimercado Santillana Credito Privado |
| - |
| - |
| (51,313) | ||||||||||
| Santander Asset Management, S.A. SGIIC. |
| - |
| - |
| (11,083) | ||||||||||
| Expense and similar charges - Marketable debt securities |
| (364) |
| - |
| - | ||||||||||
| Banco Santander, S.A. – Spain |
| (364) |
| - |
| - | ||||||||||
| Fee and commission income (expense) |
|
|
|
|
|
|
| (40,549) |
| 27,704 |
| 1,708,494 | ||||
| Companhia de Crédito, Financiamento e Investimento RCI Brasil(6) |
| - |
| 21,899 |
| - | ||||||||||
| Banco RCI Brasil S.A. (Current Company Name of Social da RCI Brasil Leasing)(6) |
| - |
| 4,038 |
| - | ||||||||||
| Banco Santander, S.A. – Spain |
| (40,549) |
| - |
| - | ||||||||||
| Webmotors S.A. |
| - |
| 1,767 |
| - | ||||||||||
| Zurich Santander Brasil Seguros S.A. |
| - |
| - |
| 36,799 | ||||||||||
| Zurich Santander Brasil Seguros e Previdência S.A. |
| - |
| - |
| 1,668,597 | ||||||||||
| Others |
| - |
| - |
| 3,098 | ||||||||||
| Gains (losses) on financial assets and liabilities (net) and exchange differences (net) |
| (786,665) |
| 22,538 |
| 477,107 | ||||||||||
| Banco Santander, S.A. – Spain |
| (786,665) |
| - |
| - | ||||||||||
| Santander Benelux, S.A., N.V. |
| - |
| - |
| 473,512 | ||||||||||
| Real Fundo de Investimento Multimercado Santillana Credito Privado |
| - |
| - |
| (15,355) | ||||||||||
| Abbey National Treasury Services Plc |
| - |
| - |
| 16,117 | ||||||||||
| Companhia de Crédito, Financiamento e Investimento RCI Brasil(6) |
| - |
| 22,538 |
| - | ||||||||||
| Others |
| - |
| - |
| 2,833 | ||||||||||
| Administrative expenses and Amortization |
|
|
|
|
|
|
| - |
| - |
| (903,073) | ||||
| ISBAN Chile S.A. |
| - |
| - |
| (2,461) | ||||||||||
| ISBAN Brasil S.A. |
| - |
| - |
| (396,611) | ||||||||||
| Produban Serviços de Informática S.A. |
| - |
| - |
| (213,703) | ||||||||||
| Ingeniería de Software Bancario, S.L. |
| - |
| - |
| (49,783) | ||||||||||
| Produban Servicios Informaticos Generales, S.L. |
| - |
| - |
| (26,230) | ||||||||||
| TECBAN - Tecnologia Bancaria Brasil |
| - |
| - |
| (129,057) | ||||||||||
| Konecta Brazil Outsourcing Ltda |
| - |
| - |
| (51,033) | ||||||||||
| Aquanima Brasil Ltda. |
| - |
| - |
| (24,075) | ||||||||||
| Others |
| - |
| - |
| (10,120) | ||||||||||
| Others Administrative expenses - Donation |
|
|
|
|
|
|
| - |
| - |
| (21,869) | ||||
| Santander Cultural |
| - |
| - |
| (4,929) | ||||||||||
| Fundacao Santander |
| - |
| - |
| (3,440) | ||||||||||
| Instituto Escola Brasil |
| - |
| - |
| (1,500) | ||||||||||
| Fundação Sudameris |
| - |
| - |
| (12,000) | ||||||||||
| Debt Instruments Eligible to Compose Capital |
|
|
|
|
|
|
| (348,841) |
| - |
| - | ||||
| Banco Santander Espanha(2)(7) |
| (348,841) |
| - |
| - | ||||||||||
(1) Banco Santander (Brasil) S.A. is indirectly controlled by Banco Santander Spain, through its subsidiary Grupo Empresarial Santander, S.L. and Sterrebeeck B.V. | |||||||||||||||||
(2) Refers to the Company's subsidiaries (Banco Santander, S.A .-Spain). | |||||||||||||||||
(3) Refers the profit on disposal of the company MS Participações. | |||||||||||||||||
(4) Refers the profit on disposal of the company Santander Brasil Asset Management. | |||||||||||||||||
(5) Refers the profit on disposal of the company Santander Securities Services Brasil DTVM S.A. | |||||||||||||||||
(6) In February, 2016 the Cia de Crédito, Financiamento e Investimentos Renault was acquired by Banco RCI Brasil. | |||||||||||||||||
48. Risk management | |||||||||||||||||
Risk management at Banco Santander is based on the following principles: | |||||||||||||||||
1. Independence of the management activities related to the business; | |||||||||||||||||
2. Involvement of the Senior Management in decision-making; | |||||||||||||||||
3. Consensus in the decision making on credit operations between the areas of Risk and Business; | |||||||||||||||||
4. Collegiate decision-making, which includes the branch network, aiming to encourage opinion diversity and avoiding the attribution of individual decisions; | |||||||||||||||||
5. The use of statistical tools to estimate default, which includes internal rating, credit scoring and behavior scoring, RORAC (Return on Risk Adjusted Capital), VaR (Value at Risk), economic capital, scenario assessment, among others; | |||||||||||||||||
6. Global approach, which an integrated treatment of risk factors in the business departments and the concept of economic capital as a consistent metric for risk undertaken and for business management; | |||||||||||||||||
7. Common management tools | |||||||||||||||||
8. Organizational structure | |||||||||||||||||
9. Scopes and responsibilities | |||||||||||||||||
10. Risk limitation | |||||||||||||||||
11. Recognition | |||||||||||||||||
12. Effective information channel | |||||||||||||||||
13. Maintenance of a medium-low risk profile, and low volatility by: | |||||||||||||||||
• The portfolio diversification, limiting concentration in customers, groups, sectors, products or geographically speaking; the complexity level of market operations reduction; the analysis of social and environmental risks of businesses and projects financed by the bank; continuous follow up to prevent the portfolios from deteriorating. | |||||||||||||||||
• Policies and procedures definition that are part of the Regulatory Framework Risk, which regulates the risk activities and processes. They follow the instructions of the Board of Directors, the regulations of the BACEN and the international best practices in order to protect the capital and ensure business' profitability. | |||||||||||||||||
At Banco Santander, the risk management and control process is structured using as reference the framework defined at corporate level and described according to the following phases: | |||||||||||||||||
a) Adaptation of corporate management frameworks and policies that reflect Banco Santander’s risk management principles. | |||||||||||||||||
Within this regulatory framework, the Corporate Risk Management Framework, regulates the principles and standards governing Banco Santander´s risk activities, based on the corporate organization and a management models, meeting the necessary regulatory requirements for credit management. | |||||||||||||||||
The organizational model comprises the management map, which defines the risk function and governance, and the regulatory framework itself. | |||||||||||||||||
b) Identification of risks through the constant review and monitoring of exposures, the assessment of new products, businesses and deals (singular transactions); | |||||||||||||||||
c) Risks measurement using methods and models periodically tested. | |||||||||||||||||
d) Preparation and distribution of a complete set of reports that are reviewed daily by the heads at all levels of Banco Santander management. | |||||||||||||||||
e) Implementation of a risk control system which checks, on a daily basis, the degree to which the Bank´s risk profile matches the risk policies approved and the risk limits set. The most noteworthy corporate tools and techniques (abovementioned) already in use at Banco Santander are in different stages of maturity regarding the level of implementation and use in Bank. For wholesale segment, these techniques are quite in line with the corporate level development. For local segments, internal ratings and scorings based models, VaR and market risk scenario analysis and stress testing were already embedded in risk management routine while Expected loss, Economic Capital and RORAC have been integrated in risk management. | |||||||||||||||||
f) Internal ratings- and scorings-based models which, by assessing the various qualitative and quantitative risk components by customer and transaction, making it possible to estimate, firstly, the probability of default and, subsequently, the expected loss, based on Loss Given Default (LGD) estimates. | |||||||||||||||||
g) Economic capital, as a homogeneous measurement of the assumed risk and the basis for the measurement of the performance management. | |||||||||||||||||
h) RORAC, used both as a transaction pricing tool in the whole sale segment (more precisely in global ranking and markets - bottom-up approach) as for in the analysis of portfolios and units (top-down approach). | |||||||||||||||||
i) VaR, which is used for controlling and setting the market risk limits for the various treasury portfolios. | |||||||||||||||||
j) Scenario analysis and stress testing to supplement the analysis market and credit risk in order to assess the impact of alternative scenarios, even over provisions and capital. | |||||||||||||||||
a) Corporate Governance of the Risk Function | |||||||||||||||||
The structure of Banco Santander’s Risk Committee is defined in accordance with the highest standards of prudent management, while respecting local legal and regulatory environment. | |||||||||||||||||
Its main responsibilities are: | |||||||||||||||||
- Integrate and adapt the Bank's risk to local level, as well as risk management strategy and the willingness and level of risk tolerance, previously approved by the executive committee and board of directors, all matched with corporate standards of Banco Santander Spain; | |||||||||||||||||
- Approve the proposals, operations and limits of clients and portfolio; | |||||||||||||||||
- Authorize the use of management tools and local risk models and being aware of the result of their internal validation. | |||||||||||||||||
- Keeping updated, assessing and monitoring any observations and recommendations periodically formulated by the supervisory authorities regarding their functions. | |||||||||||||||||
The organizational structure of the executive vice-presidency consists of areas which are responsible for credit risk management, market and structural, operational and risk model. The credit risk management structure is composed of directors who act from the point of view of retail and wholesale portfolios management. A specific area has the mission to consolidate the portfolios and their respective risks, supporting the management with the integrated risk vision. In addition to this award, it is also responsible for compliance with regulators, external and internal auditors, as well as the Group's headquarters in Spain. | |||||||||||||||||
It has a department called risk architecture, which includes a set of transverse functions of all risk factors necessary for the construction of an advanced management model. Methodology (development, parameterization models that reach all areas of risk), Governance, Policy and Risk Culture, Capital, Stress Test and Risk MI (responsible for the generation, exploitation and dissemination of information beyond the project information systems) are areas part of this structure. | |||||||||||||||||
Further details of the structure, methodologies and control system related to risk management is described in the report available on the website www.santander.com.br. | |||||||||||||||||
b) Credit Risk | |||||||||||||||||
b.1) Introduction to the treatment of credit risk | |||||||||||||||||
The Credit Risk Management provides subsidies to define strategies as risk appetite, to establish limits, including exposure analysis and trends as well as the effectiveness of the credit policy. The goal is to maintain a risk profile and adequate minimum profitability to offset the estimated default, both client and portfolio, as defined by the Executive Committee and Board of Directors. Additionally, it is responsible for the risk management systems applied in the identification, measurement, control and reduction of exposure to risk in individual or clustered by similar operations. | |||||||||||||||||
The Risk Management is specialized according to each clients' characteristics, being segregated between individual clients (with the accompanied of dedicated analysts) and customers with similar characteristics (standardized). | |||||||||||||||||
| • Individualized management: It is performed by a risk analyst set, which prepares the analysis, and forwards it to the Risk Committee and monitors the client's progress. It covers the Wholesale segment customers (Corporate and GB&M), financial institutions and certain companies; | |||||||||||||||||
| • Standardized management: Aimed at individuals and companies not classified as individualized customers. Based on automated models of decision-making and internal risk assessment, complemented by commercial heave and analysts specialized teams to handle exceptions.
| |||||||||||||||||
Macroeconomic aspects and market conditions, sectored and geographical concentration, as well as customer profiling and economic prospects are also evaluated and considered in the appropriate measuring of credit risk. | |||||||||||||||||
b.2) Measures and measurement tools | |||||||||||||||||
Rating tools | |||||||||||||||||
The Bank uses proprietary internal rating models to measure the credit quality of a given customer or transaction. Each rating relates to a certain probability of default or non-payment, determined on the basis of the customer's historical experience, with the exception of certain portfolios classified as “low default portfolios”. Rating/Scores models are used in the Bank’s loan approval and risk monitoring process. | |||||||||||||||||
In some cases the observable data required to estimate the amount of an impairment loss on a financial asset may be limited or no longer fully relevant to current circumstances. In such cases, an entity uses its experienced judgment to estimate the amount of any impairment loss. Similarly an entity uses its experienced judgment to adjust observable data for a group of financial assets to reflect current circumstances. | |||||||||||||||||
The classification of loans into different categories is made according to the analysis of economic and financial situation of the client and any other registratered information updated frequently. New modes of operation are subject to credit risk evaluation, verification and adaptation to the controls adopted by the Bank. | |||||||||||||||||
Ratings assigned to customers are reviewed periodically to include any new financial information available and the experience in the Banking relationship. The frequency of the reviews is increased in case of customers that reach certain levels in the automatic warning systems and of customers classified as requiring special monitoring. The own rating tools are reviewed to qualifications by them awarded are progressively cleared. | |||||||||||||||||
Credit risk parameters | |||||||||||||||||
The estimative of the risk parameters Probability of Default (PD) and Loss Given Default (LGD) are based on internal experience, i.e. on default observations and on the experience in defaulted loan recoveries during a defined credit cycle. | |||||||||||||||||
For low risk portfolios, such as banks, sovereign risk or global wholesale clients, the parameters are based on CDS market data and with global broadness, using Group Santander´s world presence. | |||||||||||||||||
For the other portfolios, parameter estimative are based on the Bank’s internal experience. | |||||||||||||||||
In addition to the Probability of Default (PD), the Bank is managing its credit portfolio, seeking to make loans to borrowers that have higher volumes of guarantees associated with the operations and also works constantly on strengthening its credit recovery area. These and other actions combined, are responsible for ensuring the adequacy of LGD parameters (Loss Given Default, the loss resulting from the borrower's default event to honor the principal and/or interest payments). | |||||||||||||||||
LGD calculation is based on net losses of non-performing loans, considering the guarantees associated with the transaction, revenues and expenses related to the recovery process and also the timing thereof. | |||||||||||||||||
Besides that , the Loss identification period, or “LIP,” is also considered in the estimation of the risk parameters that is represented by the time period between the occurrence of a loss event and the identification of an objective evidence of this loss. In other words, it represents the time horizon from the credit loss occurrence until the effective confirmation of such loss. | |||||||||||||||||
The Bank use proprietary internal rating models to measure the credit quality of a given customer or transaction. Each rating relates to a certain probability of default or non-payment, determined on the basis of the customer's history, with the exception of certain portfolios classified as “low default portfolios”. These ratings and models are used in loan approval and risk monitoring processes. | ||||||||||||||||
The table below shows our loans portfolio by the internal risk rating levels and their corresponding probability of default: | ||||||||||||||||
|
|
|
|
|
|
|
|
|
|
|
| 2016 |
| 2015 |
| 2014 |
Internal Risk Model |
|
|
|
|
|
|
|
|
|
|
|
|
|
|
|
|
Low |
|
|
|
|
|
|
|
|
|
|
| 207,922,810 |
| 211,645,463 |
| 199,200,968 |
Medium-low |
|
|
|
|
|
|
|
|
|
|
| 32,104,167 |
| 29,500,790 |
| 27,043,995 |
Medium |
|
|
|
|
|
|
|
|
|
|
| 10,940,879 |
| 8,638,914 |
| 7,934,964 |
Medium - high |
|
|
|
|
|
|
|
|
|
|
| 6,976,969 |
| 8,552,474 |
| 5,899,116 |
High |
|
|
|
|
|
|
|
|
|
|
| 10,492,731 |
| 8,928,808 |
| 9,031,838 |
Loans and advances to customers, gross |
|
|
|
|
|
|
| 268,437,556 |
| 267,266,449 |
| 249,110,881 | ||||
b.3) Observed loss: measures of credit cost | ||||||||||||||||
The Bank monthly estimate losses related to credit risk and then we compare those estimates with actual losses of the month. Periodically conduct tests in order to monitor and maintain control over credit risk. | ||||||||||||||||
To complement the use of admission and rating, the Bank use other measures that supports the prudent and effective management of credit risk, based on the loss observed. | ||||||||||||||||
The cost of credit is measured by the sum of credit losses of year and to the average loans portfolio of the year. | ||||||||||||||||
b.4) Credit risk cycle | ||||||||||||||||
Banco Santander has a global view of its credit portfolio throughout the various phases of the risk cycle, with a level of detail that allows us to evaluate the current situation of risk and any movements. This mapping is accompanied by the Board of Directors and the Executive Committee of the bank that no only sets policies and risk procedures, limits and delegates responsibilities. It also approves and supervises the activities of the area. | ||||||||||||||||
The risk management process consists of identifying, measuring, analyzing, controlling, negotiating and deciding on, as appropriate, the risks incurred in the Bank’s operations and companies of the conglomerate.The risk cycle comprises three different phases: | ||||||||||||||||
• Pre-sale: this phase includes the risk planning and setting targets, determination of the Bank’s risk appetite, approval of new products, risk analysis and credit rating process, and limit setting. | ||||||||||||||||
• Sale: this is the decision-making phase for both pre-classified and specific transactions. | ||||||||||||||||
• Post-sale: this phase comprises the risk monitoring, measurement and control processes and the recovery process. | ||||||||||||||||
Planning and setting risk limits | ||||||||||||||||
Risk limit setting is a dynamic process that identifies Banco Santander’s risk appetite by assessing business proposals and its risk attitude. This process is defined in the global risk limit plan, an agreed-upon comprehensive document for the integrated management of the balance sheets and its inherent risks. The risk limits are founded on two basic structures: customers/segments and products. | ||||||||||||||||
Within the Bank's strategic planning, the limits of risk appetite are based. Business proposals have to be aligned with the limits set by management. It defines a document with the limits previously agreed with the management, these limits have to be observed for the preparation of business proposals. | ||||||||||||||||
For individualized risks, customers represent the most basic level, to which individual limits are established (pre-classification), defining the maximum acceptable level of credit risk with the customer and minimum return required on the basis of allocated capital. | ||||||||||||||||
For large corporate groups we use a pre-classification model, based on an economic capital allocated. | ||||||||||||||||
For other groups of companies, we use a simplified pre-classification model in maximum nominal amounts of credit for each period. | ||||||||||||||||
To the risks of customers with standardized management, the limits of the portfolios are planned using credit management programs (SGP) agreed document for the areas of business and risks, and approved by the Executive Committee. This document contains the results expected for the business in terms of risk and return, beyond the limits which govern the activity and risk management. This client group has a more automated treatment in risks. | ||||||||||||||||
Risk analysis and rating process | ||||||||||||||||
Risk analysis is a pre-requisite for the approval of loans to customers by the Bank. This analysis consists of examining the counterparty’s ability on meeting its contractual obligations to the Banco Santander, which involves analyzing the customer’s credit quality, its risk transactions, solvency, and sustainability of business and the return to be obtained in view of the risk assumed. | ||||||||||||||||
The risk analysis is conducted yearly, at least, and can be held shortly when client profile indicates (through systems with centralized alerts, managers visits to clients or specific credit analysis), or when operations are not covered by pre-classification. | ||||||||||||||||
Decision-Making on Operations | ||||||||||||||||
The process of decision making on operations aims to analyze them and adopt resolutions, taking into account interest risks (risk appetite) and any important elements of operation to offset the risk and return. | ||||||||||||||||
The Banco Santander uses, among others, the RORAC methodology (return on risk-adjusted capital), for risk analysis and pricing in the decision-making process on transactions and deals. | ||||||||||||||||
Risk monitoring and control | ||||||||||||||||
In addition to the tasks performed by the Internal Audit Division, the Vice Presidency of Risks has a specific area of risk monitoring function for adequate credit quality control, formed by local and global teams with specific resources, for adequate credit quality control. | ||||||||||||||||
This monitoring function is based on process of permanent observation to enable early detection of any incidents that might arise in the evolution of the risk, the transactions, the customers and their environment, and the adoption of preventive actions.The risk monitoring function is specialized by customer segment. | ||||||||||||||||
For this purpose a system called “firms under special surveillance” (FEVE, using the Spanish acronym) was designed that we can distinguish in four categories based on the degree of concern raised by the circumstances observed (extinguish, secure, reduce and monitor. The inclusion of a company in the FEVE system does not mean that there has been a losses due to default, but rather that has deemed advisable to adopt a specific policy for this company, to place a person in charge and to set the policy implementation period. Customers classified as FEVE are revised at least every six months, or every three months for those classified in the most severe categories. A company is classified as FEVE by different ways, such as a result of the monitoring process itself, a review performed by Internal Audit, a decision made by the sales manager responsible for that company or the triggering of the automatic warning system. The assigned rating is avoided at least once a year. | |||||||||||||||||
For exposures to standardized customers, the key indicators are monitored in order to detect any variance in the performance of the loan portfolio in respect to the forecasts contained in the credit management programs. | |||||||||||||||||
Risk control function | |||||||||||||||||
The control function is performed by assessing risks from various complementary perspectives, the main pillars being control by geographical location, business area, management model, product and process, facilitating thus the detection of specific areas requiring measures for which decisions should be taken. Get an overview of the bank's loan portfolio over the various phases of the credit cycle, with a level of detail that allows the assessment of the current risk situation and any moviments. | |||||||||||||||||
Any changes in the Bank’s risk exposure are controlled on an ongoing and systematic basis against budgets, limits and benchmarks, and the impacts of these changes in certain future situations, both of an exogenous nature and those arising from strategic decisions, are assessed in order to establish measures that place the profile and amount of the loss portfolio within the parameters set by Executive Commission. | |||||||||||||||||
b.5) Credit recovery | |||||||||||||||||
Strategies and action channels are defined according to the days of past due loans and the amounts, that result in a Map of Responsibilities and always look as the first alternative, the client's recovery. | |||||||||||||||||
Customers with higher risk have a model of recovery, with a commercial follow-up and a recovery specialist. | |||||||||||||||||
b.6) Credit risk from other outlook | |||||||||||||||||
Certain areas and specific views of credit risk deserve a specialist’s attention, complementary to global risk management. | |||||||||||||||||
Concentration risk | |||||||||||||||||
Concentration risk is an essential factor in the area of credit risk management. The Bank constantly monitors the degree of concentration of its credit risk portfolios, by geographical area/country, economic sector, product and customer group. | |||||||||||||||||
The risk committee establishes the risk policies and reviews the exposure limits required to ensure adequate management of credit risk portfolio concentration. | |||||||||||||||||
From the sectorial standpoint, the distribution of the corporate portfolio is adequately diversified. | |||||||||||||||||
The Bank’s Risk Area works closely with the Finance Area in the active management of credit portfolios, which includes reducing the concentration of exposures through several techniques, such as the arrangement of credit derivatives for hedging purposes or the performance of securitization transactions, in order to optimize the risk/return ratio of the total portfolio. | |||||||||||||||||
Credit risk from financial market operations | |||||||||||||||||
This heading includes the credit risk arising in treasury operations with customers, mainly credit institutions. These operations are performed both via money market financing products with different financial institutions and via derivative instruments arranged for the purpose of serving our customers. | |||||||||||||||||
Risk control is performed using an integrated, real-time system that enables the Bank to know at any time the unused exposure limit with respect to any counterparty, any product and maturity and at any Bank unit. | |||||||||||||||||
Credit risk is measured at its current market value and its potential value (exposure value considering the future variation in the underlying market factors). Therefore, the equivalent credit risk (CRE) is defined as the sum of net replacement value plus the maximum potential value of the contracts in the future. | |||||||||||||||||
Environmental risk | |||||||||||||||||
Environmental Risk management for the Wholesale Bank is performed through the analysis of social and environmental practices of customers who have limits or credit risk over R$1 million. This analysis considers items such as contaminated land, deforestation, working conditions and other possible points of environmental attention where you can have possibility of penalties and losses. The procedure is performed by a specialized team, trained in Biology, Health and Safety Engineering, Geology and Chemistry Engineering. A team of financial analysis considers the potential damage and impact that unfavorable environmental condition may compromise the financial condition and customer guarantees. The analysis focuses on preserving capital and reputation in the market and the spread of the practice is achieved through the constant training of commercial and credit areas on the application of social and environmental risk patterns in the credit approval process for corporate clients in the Wholesale Bank. | |||||||||||||||||
b.7) Variations in main aggregates in 2016 (unaudited) | |||||||||||||||||
The trends observed in 2016 were consistent with those of 2015, where under a challenging economic environment, the Santander model proved to be effective. The Bank succeeded in preserving the quality of our business decreasing the default rates from 7.0% in December, 2015 to 6.2% in December, 2016. | |||||||||||||||||
This income was possible thanks to a combination of factors. Among them, a credit mix with focus on safer lines; partnerships; a deep knowledge and monitorization of the customer’s financial life; and the deployment of strong debt renegotiation campaigns. | |||||||||||||||||
The involvement of senior management in decision making (held collectively at our Committees), besides independence Risks relating to the business, allow more assertive decisions and reducing credit risk. | |||||||||||||||||
The analysis of credit for projects and companies in the Wholesale segment, continue to integrate opinions of our area of Environmental Risk. | |||||||||||||||||
Below the table (audited) of the evolution of the main indicators of credit. | |||||||||||||||||
|
|
|
|
|
|
|
|
|
|
|
|
| 2016 |
| 2015 |
| 2014 |
| Credit risk exposure - customers (Thousand of Reais) |
|
|
|
|
|
|
| 301,702,586 |
| 310,877,166 |
| 288,445,198 | ||||
| Loans and advances to customers, gross (note 10) |
|
|
|
|
|
|
| 268,437,556 |
| 267,266,449 |
| 249,110,881 | ||||
| Contingent Liabilities - Guarantees and other sureties (note 44) |
|
|
|
|
| 33,265,030 |
| 43,610,717 |
| 39,334,317 | ||||||
| Non-performing loans ratio (%) |
|
|
|
|
|
|
|
|
| 7.04% |
| 7.00% |
| 5.62% | ||
| Impairment coverage ratio (%) |
|
|
|
|
|
|
|
|
| 96.31% |
| 82.86% |
| 96.80% | ||
| Specific credit loss provisions, net of RAWO (*) (Thousand of Reais) |
|
|
|
|
| 18,191,126 |
| 15,411,760 |
| 13,562,809 | ||||||
| Cost of credit (% of risk) |
|
|
|
|
|
|
|
|
| 4.52% |
| 5.07% |
| 3.79% | ||
Data prepared on the basis of management criteria and the accounting criteria of the controller unit. | |||||||||||||||||
(*) RAWO = Recoveries of Assets Derecognized. | |||||||||||||||||
c) Market Risk | |||||||||||||||||
Market risk is the exposure to risks such as interest rates, exchange rates, prices of goods, prices in the stock market and others values, according to the type of product, volume of operations, term and conditions of the agreement and underlying volatility. | |||||||||||||||||
The Bank operates according to global policies, within the Group’s risk tolerance level, aligned with the objectives in Brazil and in the world. | |||||||||||||||||
With this purpose, it has developed its own Risk Management model, according to the following principles: | |||||||||||||||||
- Functional independence; | |||||||||||||||||
- Executive capacity sustained by knowledge and proximity with the client; | |||||||||||||||||
- Global reach of the function (different types of risks); | |||||||||||||||||
- Collective decision-making, that evaluates a variety of possible scenarios and do not compromise the results with individual decision (including Brazil Executive Risk Committee - Comitê Executivo de Riscos Brasil). This Comitee delimits and approves the operations. The Asset and Liabilities Committee, which responds for the capital management and structural risks, including country-risk, liquidity and interest rates. | |||||||||||||||||
- Management and improvement of the equation risk/return; and | |||||||||||||||||
- Advanced methodologies for risk management, such as Value at Risk – VaR (historical simulation of 521 days with a confidence level of 99% and time horizon of one day), scenarios, financial margin sensibility, equity value and contingency plan. | |||||||||||||||||
The Market Risks structure is part of the Vice Presidency of Credit and Market Risks, an independent area that applies risk policies taking into consideration the guidelines of the Board of Directors and the Risks Division of Santander in Spain. | |||||||||||||||||
c.1) Activities subject to market risk | |||||||||||||||||
The measurement, control and monitoring of the market risk area comprises all operations in which net worth risk is assumed. This risk arises from changes in the risk factors –interest rate, exchange rate, equities, commodity prices and the volatility thereof– and from the solvency and liquidity risk of the various products and markets in which the Bank operates. | |||||||||||||||||
The activities are segmented by risk type as follows: | |||||||||||||||||
- Trading: this item includes financial services for customers, trading operations and positioning mainly in fixed-income, equity , foreign currency products and shares. | |||||||||||||||||
- Balance sheets management: A risk management assessment aims to give stability to interest income from the commercial and economic value of the Bank, maintaining adequate levels of liquidity and solvency. The risk is measured by the balance sheets exposure to movements in interest rates and level of liquidity. | |||||||||||||||||
- Structural risks: | |||||||||||||||||
i. Structural foreign currency risk/hedges of results: foreign currency risk arising from the currency in which investments in consolidable and non-consolidable companies are made (structural exchange rate). This item also includes the positions taken to hedge the foreign currency risk on future results generated in currencies other than the Real (hedges of results). | |||||||||||||||||
ii. Structural equities risk: this item includes equity investments in non-consolidated financial and non-financial companies that give rise to equities risk. | |||||||||||||||||
The Treasury area is responsible for managing the positions taken in the trading activity. | |||||||||||||||||
The Financial Management area is responsible for the balance sheet management risk and structural risks through the application of uniform methodologies adapted to the situation of each market in which the Bank operates. Thus, in the convertible currencies area, Financial Management directly manages the Parent's risks and coordinates the management of the other units operating in these currencies. Decisions affecting the management of these risks are taken through the ALCO (Asset Liability Control committees) in the respective countries. | |||||||||||||||||
The Financial Management goal is to ensure the stability and recurring nature of both the net interest margin of the commercial activity and the Bank’s economic value, whilst maintaining adequate liquidity and solvency levels. | |||||||||||||||||
Each of these activities is measured and analyzed using different tools in order to reflect their risk profiles as accurately as possible. | |||||||||||||||||
Interest rate Risk | |||||||||||||||||
The following table aggregates by product the operations cash flows of companies’ perimeter that have interest income. The transactions are demonstrated book balance for the ending date for the years 2015 and 2016. It is not associated to the risk management of changes in interest rates or index mismatches, which is done by using Market Risk metrics. However, it allows the analyses of maturity concentrations and possible risks, and below it, the amounts of the same products are allocated by their maturity, except for the account about receivables and obligations linked to derivative contracts. | |||||||||||||||||
|
|
|
|
|
|
|
|
|
|
|
|
|
|
| 2016 | ||
Position of accounts subject to interest rate risk | In millions of Reais | ||||||||||||||||
|
|
|
|
|
|
| 0 to 30 days |
| 31 to 180 days |
| 181 to 365 days |
| 1 to 5 years |
| Above 5 years |
| Total |
Interest-earning assets: | |||||||||||||||||
Financial Assets Held For Trading | 26,960 | 5,242 | 4,593 | 31,938 | 14,918 | 83,651 | |||||||||||
| Debt instruments |
| 20,232 |
| 2,370 |
| 2,711 |
| 23,479 |
| 10,335 |
| 59,127 | ||||
| Equity instruments |
| 397 |
| - |
| - |
| - |
| - |
| 397 | ||||
| Trading derivatives |
| 6,331 |
| 2,872 |
| 1,882 |
| 8,459 |
| 4,582 |
| 24,126 | ||||
Available-For-Sale Financial Assets | 2,940 | 1,350 | 1,761 | 42,683 | 11,046 | 59,780 | |||||||||||
| Debt instruments |
| 954 |
| 1,350 |
| 1,761 |
| 42,683 |
| 11,046 |
| 57,794 | ||||
Equity instruments | 1,985 | - | - | - | - | 1,985 | |||||||||||
| Other Financial Assets At Fair Value Through Profit Or Loss |
| 80 |
| 14 |
| 50 |
| 486 |
| 981 |
| 1,611 | ||||
| Debt instruments |
| 38 |
| 14 |
| 50 |
| 486 |
| 981 |
| 1,569 | ||||
| Equity instruments |
| 42 |
| - |
| - |
| - |
| - |
| 42 | ||||
| Non-Current Assets Held For Sale |
| 79 |
| 168 |
| 220 |
| 2,920 |
| 6,549 |
| 9,936 | ||||
| Reserves from Brazilian Central Bank |
| 58,594 |
| - |
| - |
| - |
| - |
| 58,594 | ||||
| Loans and Receivables |
| 16,435 |
| 99,924 |
| 32,590 |
| 79,467 |
| 68,120 |
| 296,536 | ||||
| Total |
|
|
|
|
| 105,088 |
| 106,698 |
| 39,214 |
| 157,494 |
| 101,614 |
| 510,108 |
Interest-bearing liabilities: | |||||||||||||||||
| Deposits from credit institutions |
| 135,457 |
| 49,973 |
| 46,686 |
| 69,605 |
| 4,987 |
| 306,708 | ||||
| Subordinated debts |
| - |
| 268 |
| 255 |
| 8,260 |
| - |
| 8,783 | ||||
| Marketable debt securities |
| 6,214 |
| 40,229 |
| 33,336 |
| 23,647 |
| 495 |
| 103,921 | ||||
| Trading derivatives |
| 6,046 |
| 1,308 |
| 1,268 |
| 7,123 |
| 4,167 |
| 19,912 | ||||
| Short positions |
| 31,551 |
| - |
| - |
| - |
| - |
| 31,551 | ||||
| Total |
|
|
|
|
| 179,268 |
| 91,778 |
| 81,545 |
| 108,635 |
| 9,649 |
| 470,875 |
|
|
|
|
|
|
|
|
|
|
|
|
|
|
| 2015 | ||
Position of accounts subject to interest rate risk | In millions of Reais | ||||||||||||||||
|
|
|
|
|
|
| 0 to 30 days |
| 31 to 180 days |
| 181 to 365 days |
| 1 to 5 years |
| Above 5 years |
| Total |
Interest-earning assets: | |||||||||||||||||
Financial Assets Held For Trading | 3,399 | 5,288 | 6,917 | 21,436 | 8,149 | 45,189 | |||||||||||
| Debt instruments |
| 1,225 |
| 1,806 |
| 4,542 |
| 12,038 |
| 4,182 |
| 23,793 | ||||
| Equity instruments |
| 405 |
| - |
| - |
| - |
| - |
| 405 | ||||
| Trading derivatives |
| 1,769 |
| 3,482 |
| 2,374 |
| 9,398 |
| 3,967 |
| 20,990 | ||||
Available-For-Sale Financial Assets | 2,210 | 3,109 | 8,643 | 31,242 | 21,842 | 67,046 | |||||||||||
| Debt instruments |
| 1,047 |
| 3,109 |
| 8,643 |
| 31,242 |
| 21,842 |
| 65,883 | ||||
Equity instruments | 1,162 | - | - | - | - | 1,162 | |||||||||||
| Other Financial Assets At Fair Value Through Profit Or Loss |
| 611 |
| 12 |
| 48 |
| 427 |
| 893 |
| 1,991 | ||||
| Debt instruments |
| 38 |
| 12 |
| 48 |
| 427 |
| 893 |
| 1,418 | ||||
| Equity instruments |
| 574 |
| - |
| - |
| - |
| - |
| 574 | ||||
| Non-Current Assets Held For Sale |
| 80 |
| 163 |
| 215 |
| 2,096 |
| 7,327 |
| 9,881 | ||||
| Reserves from Brazilian Central Bank |
| 52,183 |
| - |
| - |
| - |
| - |
| 52,183 | ||||
| Loans and Receivables |
| 20,259 |
| 79,073 |
| 40,635 |
| 82,695 |
| 59,986 |
| 282,648 | ||||
| Total |
|
|
|
|
| 78,742 |
| 87,645 |
| 56,458 |
| 137,896 |
| 98,197 |
| 458,938 |
Interest-bearing liabilities: | |||||||||||||||||
| Deposits from credit institutions |
| 116,365 |
| 39,972 |
| 36,960 |
| 95,602 |
| 5,764 |
| 294,663 | ||||
| Subordinated debts |
| 44 |
| 87 |
| 7,990 |
| 9,694 |
| - |
| 17,815 | ||||
| Marketable debt securities |
| 8,070 |
| 24,823 |
| 12,484 |
| 52,032 |
| 52 |
| 97,461 | ||||
| Trading derivatives |
| 1,550 |
| 3,671 |
| 1,430 |
| 7,122 |
| 2,854 |
| 16,627 | ||||
| Short positions |
| 20,899 |
| - |
| - |
| - |
| - |
| 20,899 | ||||
| Total |
|
|
|
|
| 146,928 |
| 68,553 |
| 58,864 |
| 164,450 |
| 8,670 |
| 447,465 |
Currency Risk | |||||||||||||||||
|
|
|
|
|
|
|
|
|
|
|
|
|
|
| 2016 | ||
Position of accounts subject to currency risk | In millions of Reais | ||||||||||||||||
|
|
|
|
|
|
|
|
|
|
|
|
|
|
|
|
|
|
Asset: | Dollar | Euro | Others | Total | |||||||||||||
|
|
|
|
|
|
|
|
|
|
|
|
|
| ||||
| Cash/Applications/Securities (FC/foreign) |
|
|
|
|
| 4,839 |
| - |
| - |
| 4,839 | ||||
| Loans Operations and Leasing, net |
| 3,485 |
| - |
| - |
| 3,485 | ||||||||
| Foreign Permanent Asset |
|
|
|
|
| 34,337 |
| 2,662 |
| - |
| 36,999 | ||||
| Derivatives |
|
|
|
|
| 166,626 |
| 24,173 |
| 11,241 |
| 202,040 | ||||
| Others |
|
|
|
|
| 25,273 |
| 1,020 |
| - |
| 26,293 | ||||
| Total |
|
|
|
|
| 234,560 |
| 27,855 |
| 11,241 |
| 273,656 | ||||
Liabilities: | Dollar | Euro | Others | Total | |||||||||||||
|
|
|
|
|
|
|
|
|
|
|
|
|
| ||||
| Funding in foreign currency |
|
|
|
|
| 32,255 |
| 640 |
| - |
| 32,895 | ||||
| Derivatives |
|
|
|
|
| 183,277 |
| 27,973 |
| 11,426 |
| 222,676 | ||||
| Others |
|
|
|
|
| 19,198 |
| - |
| 104 |
| 19,302 | ||||
| Total |
|
|
|
|
| 234,730 |
| 28,613 |
| 11,530 |
| 274,873 | ||||
c.2) Methodologies | |||||||||||||||||
Trading | |||||||||||||||||
The Bank calculates its market risk capital requirement using a standard model provided by Central Bank of Brazil. | |||||||||||||||||
The standard methodology applied to trading activities by the Banco Santander in 2016 was the value at risk (VaR), which measures the maximum expected loss with a given confidence level and time horizon. This methodology was based on a standard historical simulation with a 99% confidence level and a one-day time horizon. Statistical adjustments were made to enable the swift and efficient incorporation of the most recent events that condition the level of risk assumed. | |||||||||||||||||
Specifically, the Bank uses a time window of two years or 521 daily data obtained retrospectively from the reference date of the VaR calculation. Two figures are calculated each day, one by applying an exponential decline factor which gives a lesser weighting to more distant observations in time, and another with uniform weightings for all observations. The VaR reported is the higher of these two figures. | |||||||||||||||||
VaR is not the only measure. It is used because it is easy to calculate and because it provides a good reference of the level of risk incurred by the Bank. However, other measures are simultaneously being implemented to enable the Bank to exercise greater risk control in all the markets in which it operates. | |||||||||||||||||
One of these measures is scenario analysis, which consists of defining behavior scenarios for various financial variables and determining the impact on results of applying them to the Bank’s activities. These scenarios can replicate past events (such as crisis) or, conversely, determine plausible scenarios that are unrelated to past events. A minimum of three types of scenarios are defined (plausible, severe and extreme) which, together with VaR, make it possible to obtain a much more complete spectrum of the risk profile. | |||||||||||||||||
The positions are monitored daily through an exhaustive control of changes in the portfolios, aiming to detect possible incidents and correct them immediately. The daily preparation of an income statement is an excellent risk indicator, once it allows us to observe and detect the impact of changes in financial variables on the portfolios. The daily calculation of the result is also an excellent indicator of the risk, as it allows us to observe and detect the impact of changes in financial variables in the portfolios. | |||||||||||||||||
Lastly, due to their atypical nature, derivatives and credit trading management (actively traded credit – Trading Book) activities are controlled by assessing specific measures on a daily basis. In the case of derivatives, these measures are sensitive to fluctuations in the price of the underlying (delta and gamma), in volatility (vega) and in time (theta). For credit trading management activities, the measures controlled include sensitivity to spread, jump-to-default and position concentrations by rating level. | |||||||||||||||||
In respect to the credit risk inherent in the trading portfolios (Credit Trading portfolios), and in keeping with the recommendations made by the Basel Committee of Banking Supervision, an additional measure has been introduced, the Incremental Risk Charge (IRC), in order to cover the default risk which is not properly captured in the VaR, through the variation of the related market prices of credit spreads. The instruments affected are basically fixed-income bonds, , derivatives on bonds (forwards, options, etc.) and credit derivatives (credit default swaps, asset-backed securities, etc.). The method used to calculate the IRC, is defined globally at Group level. | |||||||||||||||||
c.3) Balance-sheets management | |||||||||||||||||
Interest rate risk | |||||||||||||||||
The Bank analyses the sensitivity of the net interest margin and market value of equity to changes in interest rates. This sensitivity arises from maturity and interest rate repricing gaps in the various balance sheets items. | |||||||||||||||||
On the basis of the balance-sheets interest rate position, and considering the market situation and outlook, the necessary financial measures are adopted to align this position with that desired by the Bank. These measures can range from the taking of positions on markets to the definition of the interest rate features of commercial products. | |||||||||||||||||
The measures used by the Bank to control interest rate risk in these activities are the interest rate gap, the sensitivity of net interest margin (NIM) and market value of equity (MVE) to changes in interest rates, the duration of capital, value at risk (VaR) and scenario analysis. | |||||||||||||||||
Interest rate gap of assets and liabilities | |||||||||||||||||
The interest rate gap analysis focuses on the mismatches between the interest reset periods of on-balance-sheets assets and liabilities and of off-balance-sheets items. This analysis facilitates a basic snapshot of the balance sheets structure and enables concentrations of interest rate risk in the various maturities to be detected. Additionally, it is a useful tool for estimating the possible impact of potential changes in interest rates on the entity's net interest margin and market value of equity. | |||||||||||||||||
The flows of all the on- and off-balance-sheets aggregates must be broken down and placed at the point of repricing or maturity. The duration and sensitivity of aggregates that do not have a contractual maturity date are analyzed and estimated using an internal model. | |||||||||||||||||
Net interest margin (NIM) sensitivity | |||||||||||||||||
The sensitivity of the net interest margin measures the change in the expected accruals for a specific period (12 months) given a shift in the interest rate curve. | |||||||||||||||||
The sensitivity of the net interest margin is calculated by simulating the margin both for a scenario of changes in the interest rate curve and for the current scenario, the sensitivity being the difference between the two margins so calculated. | |||||||||||||||||
Market value of equity (MVE) sensitivity | |||||||||||||||||
The sensitivity of the market value of equity is a complementary measure to the sensitivity of the net interest margin. | |||||||||||||||||
This sensitivity measures the interest rate risk implicit in the market value of equity based on the effect of changes in interest rates on the present values of financial assets and liabilities. | |||||||||||||||||
Value at risk (VaR) | |||||||||||||||||
The value at risk for balance sheets aggregates and investment portfolios is calculated by applying the same standard as that used for trading: historical simulation with a confidence interval of 99% . Statistical adjustments were made to enable the swift and efficient incorporation of the most recent events that condition the level of risk assumed. | |||||||||||||||||
c.4) Liquidity risk | |||||||||||||||||
Liquidity risk is associated with the Bank’s ability to finance its commitments at reasonable market prices and to carry out its business plans with stable sources of funding.The Bank permanently monitors maximum gap profiles. | |||||||||||||||||
The measures used to control liquidity risk in balance sheets management are the liquidity gap, liquidity ratios, stress scenarios and contingency plans. | |||||||||||||||||
Liquidity gap | |||||||||||||||||
The liquidity gap determines the inflow and outflow of funds for assets, liabilities (note 45.d) and off-balance sheets accounts at a given time horizon, making it possible to analyze mismatches between the Bank's expected inflow and outflow of funds. | |||||||||||||||||
A liquidity gap may be prepared and analyzed as divided into local currency liquidity gap and foreign currency liquidity gap, under which cash and cash equivalents, inflows and outflows and strategies are segregated into local and foreign currency, respectively. | |||||||||||||||||
The Bank prepares three types of Liquidity Gap analysis: | |||||||||||||||||
1 - Contractual liquidity gap | |||||||||||||||||
The Contractual Liquidity Gap determines the contractual maturity flows of the Bank’s major products on a consolidated basis, and any existing mismatches. It also informs the available liquidity in one day and the consumption of or increase in liquidity in the period. | |||||||||||||||||
2 - Operational liquidity gap | |||||||||||||||||
Daily cash monitoring and management considering the market situation, maturities and renewal of assets and liabilities, liquidity requirement and specific events. | |||||||||||||||||
3 - Projected liquidity gap | |||||||||||||||||
Based on the Contractual Liquidity Gap, new maturity flows are projected considering the Bank’s budget plan. | |||||||||||||||||
Liquidity ratios | |||||||||||||||||
In addition to the Liquidity Gap analysis, a Structure Liquidity model is also prepared to assess the structure profile of the sources and uses of the Bank’s funds, which includes Liquidity Ratio studies. | |||||||||||||||||
The key Liquidity Ratios analyzed are as follows: | |||||||||||||||||
• Deposits / Lending operations – measures the Institution’s ability to finance lending operations with more stable and lower-cost funding. | |||||||||||||||||
• Stable Liabilities / Permanent Assets – measures the ration between Capital + Other Stable Liabilities and Investments + Other Permanent Assets. | |||||||||||||||||
• Market Funding / Total Assets – measures the percentage of the Group’s assets financed with less stable and higher-cost funding. | |||||||||||||||||
• Short-term market funding / Market Funding – measures the percentage of probable liquidity loss (less than 90 days) on total less stable funding. | |||||||||||||||||
• Net Assets / Short-term Market Funding – measures the commitment ratio of highly-liquid assets and probable liquidity loss(less than 90 days). | |||||||||||||||||
Banco Santander uses in its liquidity risk management the Liquidity Coverage Ratio (LCR). LCR (Liquidity Coverage Ratio) is a short-term liquidity ratio for a 30-day stress scenario. Represents the result of the division of the high quality assets and the net cash outflows. | |||||||||||||||||
The total of the High Quality Liquidity Assets – HQLA is composed mainly by Brazilian federal government bonds and reserve requirements returns. The Net Outflows are mainly composed by losses of deposits, compensated in part by Inflows, which are mainly credits. | |||||||||||||||||
Throughout the three observations in this disclosure (exercise with end of October, November and December 2016) the institution presented a surplus (difference between net assets and net outflows) of R$32.1 billion, which resulted in an LCR of 174%(1)(2015 - 136%), comfortably above the regulatory requirement of 70%. | |||||||||||||||||
(1) Refers to the average of the quarter as indicated in the publication of Circular 3,678 of the local regulator. | |||||||||||||||||
Customers Funding | |||||||||||||||||
Santander has different sources of funding, both in terms of products and the mix of customers, with emphasis on retail operations of the Time Deposits. Total customer funds are currently at the level of R$364,788 million and showed stability compared to volumes at the end of 2015. | |||||||||||||||||
|
|
|
|
|
|
|
|
|
|
|
|
|
|
| In millions of Reais | ||
Customers Funding | 2016 | 2015 | |||||||||||||||
|
|
|
|
|
|
| 0 a 30 days |
| Total |
| % |
| 0 a 30 days |
| Total |
| % |
| Demand deposits |
|
|
| 15,794 |
| 15,794 |
| 100% |
| 14,990 |
| 14,990 |
| 100% | ||
| Savings accounts |
|
|
| 35,901 |
| 35,901 |
| 100% |
| 35,842 |
| 35,842 |
| 100% | ||
| Time deposits |
|
|
| 24,452 |
| 150,686 |
| 16% |
| 22,048 |
| 148,682 |
| 15% | ||
| InterBank deposit |
|
|
| 944 |
| 2,379 |
| 40% |
| 1,896 |
| 2,855 |
| 66% | ||
| Funds from acceptances and issuance of securities |
| 6,304 |
| 105,120 |
| 6% |
| 8,126 |
| 98,246 |
| 8% | ||||
| Borrowings and Onlendings |
|
|
| 4,114 |
| 46,124 |
| 9% |
| 2,836 |
| 52,769 |
| 5% | ||
| Subordinated Debts/ Debt Instruments Eligible to Compose Capital |
|
|
| - |
| 8,784 |
| 0% |
| 234 |
| 18,006 |
| 1% | ||
| Total |
|
|
| 87,509 |
| 364,788 |
| 24% |
| 85,972 |
| 371,390 |
| 23% | ||
Assets and liabilities in accordance with the remaining contractual maturities, considering the undiscounted flows are as follows: | |||||||||||||||||
|
|
|
|
|
|
|
|
|
|
|
|
|
|
| 2016 | ||
Non-Discounted Future Flows Except Derivatives | In millions of Reais | ||||||||||||||||
|
|
|
|
|
|
| 0 to 30 days |
| 31 to 180 days |
| 181 to 365 days |
| 1 to 5 years |
| Above 5 years |
| Total |
Interest-earning assets: | |||||||||||||||||
Financial Assets Held For Trading | 27,093 | 5,262 | 4,749 | 36,135 | 25,573 | 98,812 | |||||||||||
| Debt instruments |
| 20,762 |
| 2,390 |
| 2,867 |
| 27,676 |
| 20,991 |
| 74,686 | ||||
| Trading derivatives |
| 6,331 |
| 2,872 |
| 1,882 |
| 8,459 |
| 4,582 |
| 24,126 | ||||
Available-For-Sale Financial Assets | 1,492 | 1,373 | 1,819 | 55,056 | 29,854 | 89,594 | |||||||||||
| Debt instruments |
| 1,492 |
| 1,373 |
| 1,819 |
| 55,056 |
| 29,854 |
| 89,594 | ||||
| Other Financial Assets At Fair Value Through Profit Or Loss |
| 38 |
| 14 |
| 52 |
| 586 |
| 1,824 |
| 2,514 | ||||
| Debt instruments |
| 38 |
| 14 |
| 52 |
| 586 |
| 1,824 |
| 2,514 | ||||
| Non-Current Assets Held For Sale |
| 79 |
| 170 |
| 227 |
| 3,307 |
| 9,979 |
| 13,762 | ||||
| Reserves from Brazilian Central Bank |
| 58,594 |
| - |
| - |
| - |
| - |
| 58,594 | ||||
| Loans and Receivables |
| 18,151 |
| 112,337 |
| 42,763 |
| 106,518 |
| 82,770 |
| 362,539 | ||||
| Total |
|
|
|
|
| 105,447 |
| 119,156 |
| 49,610 |
| 201,602 |
| 150,000 |
| 625,815 |
Interest-bearing liabilities: | |||||||||||||||||
| Deposits from credit institutions |
| 135,725 |
| 51,098 |
| 50,024 |
| 86,535 |
| 7,444 |
| 330,826 | ||||
| Subordinated Debts/ Debt Instruments Eligible to Compose Capital |
| - |
| 347 |
| 330 |
| 10,633 |
| - |
| 11,310 | ||||
| Marketable debt securities |
| 6,234 |
| 41,431 |
| 35,390 |
| 27,344 |
| 521 |
| 110,920 | ||||
| Trading derivatives |
| 6,046 |
| 1,308 |
| 1,268 |
| 7,123 |
| 4,167 |
| 19,912 | ||||
| Short positions |
| 31,551 |
| - |
| - |
| - |
| - |
| 31,551 | ||||
| Total |
|
|
|
|
| 179,556 |
| 94,184 |
| 87,012 |
| 131,635 |
| 12,132 |
| 504,519 |
|
|
|
|
|
|
|
|
|
|
|
|
|
|
| 2015 | ||
Non-Discounted Future Flows Except Derivatives | In millions of Reais | ||||||||||||||||
|
|
|
|
|
|
| 0 to 30 days |
| 31 to 180 days |
| 181 to 365 days |
| 1 to 5 years |
| Above 5 years |
| Total |
Interest-earning assets: | |||||||||||||||||
Financial Assets Held For Trading | 2,831 | 4,125 | 7,031 | 24,032 | 16,623 | 54,642 | |||||||||||
| Debt instruments |
| 1,226 |
| 1,860 |
| 4,761 |
| 15,430 |
| 13,151 |
| 36,428 | ||||
| Trading derivatives |
| 1,605 |
| 2,265 |
| 2,270 |
| 8,602 |
| 3,472 |
| 18,214 | ||||
Available-For-Sale Financial Assets | 1,048 | 3,185 | 9,475 | 41,894 | 55,640 | 111,242 | |||||||||||
| Debt instruments |
| 1,048 |
| 3,185 |
| 9,475 |
| 41,894 |
| 55,640 |
| 111,242 | ||||
| Other Financial Assets At Fair Value Through Profit Or Loss |
| 38 |
| 12 |
| 48 |
| 427 |
| 893 |
| 1,418 | ||||
| Debt instruments |
| 38 |
| 12 |
| 48 |
| 427 |
| 893 |
| 1,418 | ||||
| Non-Current Assets Held For Sale |
| 80 |
| 163 |
| 219 |
| 2,360 |
| 10,358 |
| 13,180 | ||||
| Reserves from Brazilian Central Bank |
| 52,183 |
| - |
| - |
| - |
| - |
| 52,183 | ||||
| Loans and Receivables |
| 22,717 |
| 89,907 |
| 51,196 |
| 110,204 |
| 73,132 |
| 347,156 | ||||
| Total |
|
|
|
|
| 78,897 |
| 97,392 |
| 67,969 |
| 178,917 |
| 156,646 |
| 579,821 |
Interest-bearing liabilities: | |||||||||||||||||
| Deposits from credit institutions |
| 116,525 |
| 40,676 |
| 40,453 |
| 128,627 |
| 8,594 |
| 334,875 | ||||
| Subordinated Debts/ Debt Instruments Eligible to Compose Capital |
| 297 |
| 113 |
| 8,845 |
| 12,606 |
| - |
| 21,861 | ||||
| Marketable debt securities |
| 8,093 |
| 25,732 |
| 13,900 |
| 67,049 |
| 116 |
| 114,890 | ||||
| Trading derivatives |
| 1,230 |
| 1,937 |
| 1,265 |
| 6,915 |
| 2,604 |
| 13,951 | ||||
| Short positions |
| 20,899 |
| - |
| - |
| - |
| - |
| 20,899 | ||||
| Total |
|
|
|
|
| 147,044 |
| 68,458 |
| 64,463 |
| 215,197 |
| 11,314 |
| 506,476 |
Scenario analysis / Contingency plan | |||||||||||||||||
Liquidity management requires an analysis of financial scenarios where possible liquidity issues are evaluated. For this, crisis scenarios are built and then studied. The model used for this analysis is the Liquidity Stress Test. | |||||||||||||||||
The Liquidity Stress Test assesses the institution’s financial structure and ability to resist and respond to the most extreme situations. | |||||||||||||||||
The purpose of the Liquidity Stress Test is to simulate adverse market conditions, making it possible assess impacts on the institution’s liquidity and payment ability, so as to take preventive actions or avoid positions that may adversely affect liquidity in worst-case scenarios. | |||||||||||||||||
Scenarios are determined based on an analysis of the market commitment during prior crisis and future estimates.Four scenarios with different intensity levels are prepared. | |||||||||||||||||
Based on an analysis of the stress models, the Minimum Liquidity concept was determined, which is the minimum liquidity required to support the liquidity losses of up to 90% for 90 days in all crisis scenarios simulated. | |||||||||||||||||
Based on the results obtained through the Liquidity Stress Test, the Bank prepares its Liquidity Contingency Plan, which is a formal combination of preventive and corrective actions to be taken in liquidity crisis scenarios. | |||||||||||||||||
The Liquidity Contingency Plan is primarily intended to the following: | |||||||||||||||||
• Crisis identification – the preparation of a Liquidity Contingency Plan requires the determination in advance of a measurable parameter determining the institution’s liquidity condition and structure. This parameter is the Liquidity Minimum Limit determined by the Liquidity Stress Test. When this limit is exceeded, there is a liquidity crisis environment, and thus, the Contingency Plan is used. | |||||||||||||||||
• Internal Communication – after the crisis is identified, it is necessary to establish clear communication channels to mitigate the problems raised. People held accountable for taking these contingency actions should be notified of the extent of the contingency and measures to be taken. | |||||||||||||||||
• Corrective actions – Actions intended to actually generate the funds required to solve or mitigate the effects of crisis, as follows: | |||||||||||||||||
- Assess the type and severity of the crisis; | |||||||||||||||||
- Identify the most impacted segment; | |||||||||||||||||
- Put in practice the measures planned to generate funds, considering the required amount and cost of the additional resource, either financial or image cost. | |||||||||||||||||
ALCO reviews and approves stress models, Minimum Liquidity and Contingency Plan on a semi-annual basis. | |||||||||||||||||
If adverse market conditions occur, ALCO may review and approve new models, Minimum Liquidity and Contingency Plan when needed. | |||||||||||||||||
c.5) Structural foreign currency risk / Hedges of results / Structural equities risk | |||||||||||||||||
These activities are monitored by measuring positions, VaR and results. | |||||||||||||||||
c.5.1) Complementary measures | |||||||||||||||||
Calibration and test measures | |||||||||||||||||
Back-testing consists of performing a comparative analysis between VaR estimates and daily “clean” results (profit or loss on the portfolios at the end of the preceding day valued at following-day prices) and “dirty” (managerial income taking into account also the costs, intraday results and loading). The aim of these tests is to verify and provide a measure of the accuracy of the models used to calculate VaR. | |||||||||||||||||
Back-testing analyses performed at Banco Santander comply, at the very least, with the BIS recommendations regarding the verification of the internal systems used to measure and manage financial risks. Additionally, the Santander Bank also conducts hypothesis tests: excess tests, normality tests, Spearman’s rank correlation, average excess measures, etc. | |||||||||||||||||
The assessment models are regularly calibrated and tested by a specialized unit. | |||||||||||||||||
c.6) Control system | |||||||||||||||||
Limit setting | |||||||||||||||||
The limit setting process is performed together with the budgeting activity and is the tool used to establish the assets and liabilities available to each business activity. Limit setting is a dynamic process that responds to the level of risk considered acceptable by management. | |||||||||||||||||
The limits structure requires a process to be performed that pursues, among others, the following objectives: | |||||||||||||||||
1. To identify and delimit, in an efficient and comprehensive manner, the main types of financial risk incurred, so that they are consistent with business management and the defined strategy. | |||||||||||||||||
2. To quantify and communicate to the business areas the risk levels and profile deemed acceptable by senior management so as to avoid undesired risks. | |||||||||||||||||
3. To give flexibility to the business areas for the efficient and timely assumption of financial risks, depending on market changes, and for the implementation of the business strategies, provided that the acceptable levels of risk are not exceeded. | |||||||||||||||||
4. To allow business makers to assume risks which, although prudent, are sufficient to obtain the budgeted results. | |||||||||||||||||
5. To delimit the range of products and underlying assets with which each Treasury unit can operate, taking into account features such as assessment model and systems, liquidity of the instruments involved, etc. | |||||||||||||||||
c.7) Risks and results in 2016 | |||||||||||||||||
Financial Intermediation Activities | |||||||||||||||||
The average VaR from negotiation portfolio of the bank in 2016 ended in R$804 thousands (2015 - R$525 million and 2014 – R$32,3 million). The dynamic management of this profile allows the Bank to change its strategy to capitalize the opportunities offered by a uncertain environment. | |||||||||||||||||
c.7.1) Asset and liability management(1) | |||||||||||||||||
Interest rate risk | |||||||||||||||||
Convertible currencies | |||||||||||||||||
At 2016 year-end, the sensitivity of the net interest margin at one year to parallel increases of 100 basis points applied to Banco Santander portfolios was concentrated on the BRL interest rate curve was positive by R$385 million. Also at 2016 year-end, the sensitivity market value of equity to parallel increases of 100 basis points applied to the Banco Santander in the BRL interest rate curve was positive by R$1,680 million. | |||||||||||||||||
Quantitative risk analysis | |||||||||||||||||
The interest rate risk in balance sheets management portfolios, measured in terms of sensitivity of the net interest margin (NIM) at one year to a parallel increase of 100 b.p. in the interest rate curve, decreased R$140 million over 2016, reaching a maximum of R$569 million in April. The sensitivity value decreased R$120 million during 2016, reaching a maximum of R$2,204 million in July. The main factors that occurred in 2016 and influenced in sensitivity were the volatility of the exchange rate (convexity effect), portfolio’s decayment, update of implicit methodology on cash flow of the Bank’s products and liquidity. | |||||||||||||||||
| Thousands of Reais |
|
|
|
|
|
|
|
|
|
|
|
|
|
|
|
|
2016 | 2015 | 2014 | |||||||||||||||
Sensibilities | |||||||||||||||||
| Net Interest Margin |
|
|
|
|
|
|
|
|
|
|
| 385 |
| 525 |
| 490 |
| Market Value of Equity |
|
|
|
|
|
|
|
|
|
| 1,680 |
| 1,800 |
| 1,846 | |
| Value at Risk - Balance |
|
|
|
|
|
|
|
|
|
|
|
|
|
| ||
| VaR |
|
|
|
|
|
|
|
|
|
|
| 804 |
| 926 |
| 605 |
(1) Includes the balance sheets total, except for the financial assets and liabilities held for trading. | |||||||||||||||||
Structural liquidity management | |||||||||||||||||
Structural liquidity management seeks to finance the Bank’s recurring business with optimal maturity and cost conditions, avoiding the need to assume undesired liquidity risks. | |||||||||||||||||
The main features of the structural liquidity management in 2016 were as follows: | |||||||||||||||||
• Ample structural liquidity position. Since Banco Santander is basically a commercial Bank, customer deposits constitute the main source of liquidity in its financing structure. These deposits, combined with capital and other similar instruments, enable the Bank to cover most of its liquidity requirements and, as a result, the financing raised in wholesale markets is moderate with respect to the size of its balance sheets. | |||||||||||||||||
• In Brazil, the legal reserve requirement takes a considerable part of the funding. | |||||||||||||||||
• Obtainment of liquidity through diversification in instruments. Additionally, subordinated and senior debts have an overall long maturity. | |||||||||||||||||
• The local balance sheets should be self-funded. | |||||||||||||||||
• Based on stress test results, a minimum liquidity buffer is maintained. | |||||||||||||||||
• Banco Santander reliance in international funding is not considerable. | |||||||||||||||||
• The aim is that hard currency related activities be funded with third parties hard currency funding. | |||||||||||||||||
• Though, given the potential disruptions in this market, Banco Santander has mechanisms to use the local liquidity in order to support hard currency activities. | |||||||||||||||||
• High capacity to obtain on-balance-sheets liquidity. Government bond positions are held for liquidity management purposes. | |||||||||||||||||
• The Bank performs control and management functions, which involves planning its funding requirements, structuring the sources of financing to achieve optimum diversification in terms of maturities and instruments, and defining contingency plans. | |||||||||||||||||
In practice, the liquidity management performed by the Bank consists of the following: | |||||||||||||||||
• Each year, a liquidity plan is prepared on the basis of the financing needs arising from the budgets of each business. Based on these liquidity requirements and taking into account certain prudential limits on the obtainment of short-term market financing, the Bank establishes an issue and securitization plan for the year. | |||||||||||||||||
• Throughout the year the Bank periodically monitors the actual changes in financing requirements and updates this plan accordingly. | |||||||||||||||||
• Control and analysis of liquidity risk. The primary objective is to guarantee that the Bank has sufficient liquidity to meet its short- and long-term financing requirements in normal market situations. To this end, the Bank employs certain balance-sheets control measures, such as the liquidity gap and liquidity ratios. | |||||||||||||||||
Simultaneously, various scenario (or stress-scenario) analysis are conducted which consider the additional requirements that could arise if certain extreme but plausible events occur. The aim pursued is to cover a broad spectrum of situations that are more or less likely to affect the Bank, thus enabling it to prepare the related contingency plans. | |||||||||||||||||
c.8) Sensitivity analysis | |||||||||||||||||
The risk management is focused on portfolios and risk factors pursuant to the requirements of regulators and good international practices. | |||||||||||||||||
Financial instruments are segregated into trading and Banking portfolios, as in the management of market risk exposure, according to the best market practices and the transaction classification and capital management criteria of the New Standardized Approach of regulators. The trading portfolio consists of all transactions with financial instruments and products, including derivatives, held for trading, and the Banking portfolio consists of core business transactions arising from the different Banco Santander business lines and their possible hedges. Accordingly, based on the nature of Banco Santander’s activities, the sensitivity analysis was presented for trading and Banking portfolios. | |||||||||||||||||
Banco Santander performs the sensitivity analysis of the financial instruments in accordance with requirements of regulatory bodies and international best practices, considering the market information and scenarios that would adversely affect the positions and the income of the Bank. | |||||||||||||||||
The table below summarizes the stress amounts generated by Banco Santander’s corporate systems, related to the Banking and trading portfolio, for each one of the portfolio scenarios as at December 31, 2016. | |||||||||||||||||
Trading portfolio | |||||||||||||||||
|
|
|
|
|
|
|
|
| 2016 | ||||||||
Risk Factor | Description | Scenario 1 | Scenario 2 | Scenario 3 | |||||||||||||
Interest Rate - Reais |
|
|
| Exposures subject to changes in interest fixed rate |
|
|
| (6,274) |
| (242,001) |
| (484,003) | |||||
Coupon Interest Rate |
|
|
| Exposures subject to changes in coupon rate of interest rate |
| (3,458) |
| (39,970) |
| (79,939) | |||||||
Inflation |
|
|
| Exposures subject to change in coupon rates of price indexes |
| (5,428) |
| (88,258) |
| (176,515) | |||||||
Coupon - US Dollar |
|
|
| Exposures subject to changes in coupon US Dollar rate |
| (21) |
| (5,106) |
| (10,212) | |||||||
Coupon - Other Currencies |
| Exposures subject to changes in coupon foreign currency rate |
| (357) |
| (6,048) |
| (12,097) | |||||||||
Foreign currency |
|
|
| Exposures subject to foreign exchange |
|
|
| (6,547) |
| (163,687) |
| (327,373) | |||||
Eurobond/Treasury/Global |
| Exposures subject to changes in interest rate negotiated roles in international market |
| (2) |
| (90) |
| (179) | |||||||||
Shares and Indexes |
|
|
| Exposures subject to change in shares price |
|
|
| (618) |
| (15,458) |
| (30,915) | |||||
Other |
|
|
| Exposures not meeting the previous settings |
|
|
| (17,786) |
| (2,276) |
| (4,551) | |||||
Total(1) |
|
|
|
|
|
|
|
|
|
|
| (40,491) |
| (562,894) |
| (1,125,784) | |
(1) Amounts net of taxes. | |||||||||||||||||
Scenario 1: a shock of 10 base points on the interest curves and 1% to price changes (currency and stocks); | |||||||||||||||||
Scenario 2: a shock of +25% and -25% in all risk factors, are considered the greatest losses per risk factor; | |||||||||||||||||
Scenario 3: a shock of +50% and -50% in all risk factors, are considered the greatest losses per risk factor. | |||||||||||||||||
Portfolio Banking | |||||||||||||||||
|
|
|
|
|
|
|
|
| 2016 | ||||||||
Risk Factor | Description | Scenario 1 | Scenario 2 | Scenario 3 | |||||||||||||
Interest Rate - Reais |
|
|
| Exposures subject to changes in interest fixed rate |
|
|
| (53,558) |
| (1,376,404) |
| (2,621,638) | |||||
TR and Long-Term Interest Rate - (TJLP) |
| Exposures subject to changes in Exchange of TR in TJLP |
| (3,128) |
| (82,938) |
| (177,829) | |||||||||
Inflation |
|
|
| Exposures subject to change in coupon rates of price indexes |
| (11,551) |
| (206,934) |
| (354,086) | |||||||
Coupon - US Dollar |
|
|
| Exposures subject to changes in coupon US Dollar rate |
| (412) |
| (57,174) |
| (103,108) | |||||||
Coupon - Other Currencies |
| Exposures subject to changes in coupon foreign currency rate |
| (7,224) |
| (45,407) |
| (91,225) | |||||||||
Interest Rate Markets International | Exposures subject to changes in interest rate negotiated roles in international market |
| (13,143) |
| (190,043) |
| (352,433) | ||||||||||
Foreign Currency |
|
| Exposures subject to Foreign Exchange | Exposures subject to Foreign Exchange | (722) |
| (18,048) |
| (36,097) | ||||||||
Total(1) |
|
|
|
|
|
|
|
|
|
|
| (89,738) |
| (1,976,948) |
| (3,736,416) | |
(1) Amounts net of taxes. | |||||||||||||||||
Scenario 1: a shock of 10 base points in interest rate curves and 1% price variance (currency); | |||||||||||||||||
Scenario 2:a shock of +25% and -25% in all risk factors, are considered the greatest losses per risk factor; | |||||||||||||||||
Scenario 3:a shock of +50% and -50% in all risk factors, are considered the greatest losses per risk factor. | |||||||||||||||||
d) Independent Structure | |||||||||||||||||
The local corporative area, called Non-Financial Risks, is responsible for implementing the management and control model of Operational Risks and Internal Controls of Banco Santander. It is subordinated to Executive Vice-President of Risks and count with people, structure, standards, methodologies and tools for ensuring adequacy of the management and control model. | |||||||||||||||||
The Administration is an acting part and is aligned with the mission of the areas, recognizing, participating and sharing responsibility for the continuous improvement of the operational and technological risk management culture and structure as well as of the internal control system. Then they can ensure compliance with the established objectives and goals, as well as the security and quality of the products and services provided by the Bank. | |||||||||||||||||
The Bank's Board of Directors Santander opted to adopt the Alternative Standardized Approach (ASA) to calculate the installment of Required Notional Equity (PRE) related to operational risk. | |||||||||||||||||
d.1)Non-Financial Risks | |||||||||||||||||
It has as mission towards Banco Santander: Support for the achievement of the strategic objectives and the decision-making process, the adequacy and attendance mandatory requirements, the maintenance of solidity, reliability, reduction and mitigation of losses due to operational risks, further on to the implementation, dissemination of the culture of operational risks and internal controls. | |||||||||||||||||
Acts in preventing the operational risk and supports for the continued strengthening of the internal control system, attending the requirements of regulatory agencies, New Basel Agreement – BIS II and Sarbanes Oxley requirements and resolutions of the National Monetary Council. This model also follows the guidelines established by Santander Spain, which was based on COSO-Committee of Sponsoring Organizations of the Tread way Commission-Internal Control – Integrated Framework 2013. | |||||||||||||||||
The procedures developed and adopted are intended to ensure Santander Bank continuous presence among the select group of financial institutions recognized as having the best operational risk management practices, thereby helping to continuously improve its reputation, solidity and reliability in the local and international markets. | |||||||||||||||||
In the second half of 2014, was consolidated the adoption if the approaches by lines of defense, which started in April, 2014 and approved in the Executive Committee. | |||||||||||||||||
Defence Line Model | |||||||||||||||||
|
| |||||||||||||||||
Non-financial risks is the second line of defense in Santander's model and aims to maintain the fulfillment, alignment and compliance with corporate guidelines of the Santander group, the Basle Accord and resolutions of the National Monetary Council. Also acts in the control and challenge of the activities performed by the first line of Defense, contributing to its strengthening. | |||||||||||||||||
In line with the strengthening of an independent structure and glimpsing an integrated approach to risk management, the Internal Controls area became part of the structure of non-financial Risks. | |||||||||||||||||
The internal control Model ("MCI") deployed at Banco Santander is based on the methodology developed by the Committee of Sponsoring Organizations of the Tread way Commission ("COSO"), which covers for strategic components, operational, financial and compliance, disclosure that were set within the framework of internal control. The Bank has adapted its MCI to the most demanding international standards established by COSO (Internal Control – Integrated Framework 2013) having as main goals the mitigation of risks, providing transparency to the preparation and disclosure of financial statements and comply with the requirements of current legislation and of the regulatory agencies. The MCI is based on self-assessment by responsible of activities, processes, sub-processes, and controls (control self assessment-CSA) and disseminates within the Bank through regulatory, internal notes and instruction guides available on the local Intranet, Internal Controls Portal and the Norms Portal. | |||||||||||||||||
The system supports the Administration in the management of MCI, besides documenting the sub-processes, risks and associated control, indicators, and also in certification by the managers responsible for controls activities, sub-processes, processes, activities and subgroups, which provides comfort as to the financial statements for certification for the CEO and the Director Executive Vice President. | |||||||||||||||||
d.2) Comprehensiveness and Sustainability | |||||||||||||||||
| |||||||||||||||||
• Improvement of operational efficiency and productivity in the activities and processes. | |||||||||||||||||
•Compliance with existing regulations: Bacen, Susep, CVM and BIS, as well as new requirements and monitoring the timely fulfillment of requests from regulators. | |||||||||||||||||
• Strengthening of the reputation and improvement in the relation of Risk x Return to the public with whom the Bank maintains relationship. | |||||||||||||||||
• Maintenance and preservation of the quality and reliability of products and services. | |||||||||||||||||
• Identifying and addressing timely the corrections of identified vulnerabilities in processes. | |||||||||||||||||
• Dissemination of culture of advanced management and control of Operational Risks, by means of internal communication (intranet, personal course, "online" courses and monthly communication by “Boletim de RO” and “Boletim Flash de RO”), with reinforcement in the "Accountability". | |||||||||||||||||
This solid and efficient structure permits the continuous enhancement of existing methodologies and the further dissemination of the culture of responsibility in regard to the advanced management of operational risk. | |||||||||||||||||
d.3) Differential factor | |||||||||||||||||
The Non-financial Risk area invests in the development, training and updating of its professionals so they can keep up with changes in the business environment, in addition to offering training programs for other professionals through the intranet and on-site courses. Among the personal course, we highlight the achievement of training aimed at increasing culture of RO management, training to perform risk control and self-assessment exercises (RCSA), and training for the capture of operational losses, among others. | |||||||||||||||||
This has made a significant contribution to Santander Bank consistently achieving its strategic and operational goals, by providing knowledge of the exposure to assumed operational risks and the controlled environment, maintaining the Bank’s low-risk profile and ensuring the sustainable development of its operations. | |||||||||||||||||
The Bank stand out: | |||||||||||||||||
• Annual Operational and Technological Risk Prevention and Control Week; | |||||||||||||||||
• Training on the necessary procedures for evaluating the internal control environment; | |||||||||||||||||
• Mandatory training for all Banco Santander employees through NetCurses, addressing the issue of operational risks and business continuity; | |||||||||||||||||
• The creation, dissemination and maintenance of Instruction Manuals, promoting corporate values and commitment; | |||||||||||||||||
• Coordination of the annual process for projecting losses caused by operational risks, defining action plans to reduce these losses and for accountability; | |||||||||||||||||
• Development of key risk indicators, aiming to ensure absolute and relative analyses based on volumetric and market analysis; | |||||||||||||||||
• Composition of lines of defense creating new functions for the role of operational risk representative: "Coordinator" and "Coordinator Assist" Operational Risk covering the perimeter of RO and "experts" in cases where the operational risk is transverse to the organization. | |||||||||||||||||
• Six-monthly review of Internal Controls of the company by the responsible managers for the controls, sub processes, processes and activities documented in MCI to support theChief Executive Officer and Executive Vice President of Finance. | |||||||||||||||||
• Accession to the new model released by COSO - Framework 2013 with the adequacy of existing controls to 17 new principles. | |||||||||||||||||
d.4) Communication Policy | |||||||||||||||||
The Non-Financial Risk area is part of Santander’s governance structure and produces a series of specific monthly reports for management detailing events that occurred, the main activities undertaken, and the corrective and precautionary action plans identified and monitored, ensuring transparency and providing knowledge for governance forums. | |||||||||||||||||
Semiannually, it prepares the Management Report and Control of Operational, Technological Risk , the Management of Business Continuity and the Evaluation of Internal Controls. Which is presented to the Bank’s Board of Directors and the Quality Assessment Report and Adequacy of the Internal Control Model presented on the Executive Committee for its awareness and to enable it to take resolutions on the results and activities developed in the period. | |||||||||||||||||
Additional informations can be obtained from the Bank’s Social and Annual Reports on its website. | |||||||||||||||||
e) Reputational Risk | |||||||||||||||||
e.1) Reputational Risk | |||||||||||||||||
Reputational risk is the exposure arising from negative public opinion, irrespective of whether this opinion is based on facts or merely on public perception. The reputational risk management is accomplished through responsible involvement in the right business with the right client. | |||||||||||||||||
Accordingly Banco Santander aims to offer the most suitable product according to the each customer profile. | |||||||||||||||||
e.2) Compliance | |||||||||||||||||
The Compliance Risk is the legal risk or regulatory sanctions, financial loss, or damages to the Bank reputation that may suffer as a result of failure to comply with laws, regulations, codes of conduct and good Banking practices in the exercise of their activity. The Compliance at Banco Santander has a proactive approach, working in educational processes, monitoring and corporate communications. | |||||||||||||||||
The Compliance area operates independently, reporting to Management and Regulatory Compliance Panel, contributing for the maintenance of the reputation and integrity of Banco Santander. | |||||||||||||||||
e.3) Directives | |||||||||||||||||
a. Compliance principles – Ethics and Conduct in the Securities Markets | |||||||||||||||||
The Bank’s ethical principles and conduct parameters are established in internal policies which are made available to all employees. Conduct Code in the Securities Markets and its formal acknowledgement is mandatory to all staff working close to securities markets. Proper communication channels are in place to clarify doubts and complaints from employees, the monitoring and controlling of these information are conducted in a way that adherence to the rules established is secured. | |||||||||||||||||
b. Money Laundering Prevention | |||||||||||||||||
The Bank’s money Laundering Prevention policies and terrorism financing prevention are based on the knowledge and rigorousness of the acceptance of new clients, the Bank complemented by the continuous scrutiny of all transactions where the Bank are involved in. The importance given to the theme is reflected on the direct involvement of management, namely the Operational Money Laundering Prevention and Compliance Committee, which meets each trimester to deliberate on issues regarding the theme and to be directly involved with new clients acceptance and suspicious transactions reporting. | |||||||||||||||||
c. New products and services and suitability | |||||||||||||||||
All new products and services are debated/analyzed internally at various levels until their risks have been fully mitigated, and subsequently approved by the Commercialization Local Committee (CLC), composed of Santander executives. After review and approval, the new products and services are monitored trying to identify them so timely events that may pose reputational risk, which if identified, are reported to the CLC. | |||||||||||||||||
f) Compliance with the new regulatory framework | |||||||||||||||||
The Banco Santander has assumed from the outset a firm commitment to the principles underlying the “Revised Framework of International Convergence of Capital Measurement and Capital Standards” (Basel II). This framework allows entities to make internal estimates of the capital they are required to hold in order to safeguard their solvency against events caused by various types of risk. As a result of this commitment, the Santander Bank has devoted all the human and material resources required to ensure the success of the Basel II implementation plan. For this purpose, a Basel II team was created in the past, consisting of qualified professionals from the Bank’s different areas: mainly Finance, Risks, Technology and Operations, Internal Audit −to verify the whole process, as the last layer of control at the entity−, and Business −particularly as regards the integration of the internal models into management. Additionally, specific work teams have been set up to guarantee the proper management of the most complex aspects of the implementation. | |||||||||||||||||
Supplementing the efforts of the Basel II operating team, Santander Bank management has displayed total involvement from the very beginning. Thus, the progress of the project and the implications of the implementation of the New Capital Accord for the Banco Santander have been reported to the management committee and to the board of directors on a regular basis. | |||||||||||||||||
In the specific case of credit risk, the implementation of Basel II entails the recognition, for regulatory capital purposes, of the internal models that have been used for management purposes. | |||||||||||||||||
The Bank intends to apply, over the next five years, the advanced internal ratings-based (AIRB) approach under Basel II for substantially all its Banks, until the percentage of net exposure of the loan portfolio covered by this approach is close to 100%. | |||||||||||||||||
The additional capital requirements derived from the self assessment process (Pillar II) should be offset by the risk profile that characterizes the Bank's business activities (low average risk), due to its focus on Banco Comercial (small and medium-sized enterprises and Individuals) and the diversification of the business. The Pillar 2 which takes into account the impact of risks not addressed under Pillar I (regulatory capital) and the benefits arising from the diversification among risks, businesses and geographical locations. | |||||||||||||||||
The Banco Santander continued in 2014 with the project for the progressive implementation of the technology platforms and methodological developments required for the roll-out of the AIRB approaches for regulatory capital calculation purposes. | |||||||||||||||||
Regarding the other risks addressed under Pillar I of Basel II, Banco Santander is developing internal models for market risk and will remain using the standardized method for operational risk, since it considers the premature use of advanced models (AMA) for this purpose . Regarding the Market Risk, Banco Santander presented his candidacy in the second half of 2011, pending approval with the regulators for the use of internal models for calculating regulatory capital. | |||||||||||||||||
Pillar II is another significant line of action under the Basel Corporate Framework. In addition to reviewing and strengthening the methodology supporting the economic capital model, the technology was brought into line with the platform supporting Pillar I, so that all the information on credit risk will come from this source. | |||||||||||||||||
Besides the Basel II implementations, Banco Santander complies with the new regulations of Basel III, as standards released by Bacen. | |||||||||||||||||
According to the definition proposed by the Basel Committee (Basel III), Credit Valuation Adjustment (CVA) is an adjustment to the fair value of derivative financial instruments in order to measure the credit risk of a counterparty. Thus, the CVA depends on the credit spread of the counterparty, as well as the market risk factors that drive the values of the derivatives and, therefore, their exposure. In an analytical way, the CVA can be defined by the following expression: | |||||||||||||||||
CVA = EE * PD * DF * LGD(1) | |||||||||||||||||
(1) EE=Expected Exposure; PD=Probability of Default; DF=Discount Factor; LGD=Loss Given Default | |||||||||||||||||
Expected Exposure (EE) is the future exposure of the derivative based on the counterparty's market risk. The probability of default (PD) is calculated based on credit spreads and is also valued at market. The discount factor (DF) is the factor that brings to the present value the projected exposure weighted by its respective probability of default. A Loss Given Default (LGD) is the estimated loss in the event of a credit event. | |||||||||||||||||
f.1) Internal validation of risk models | |||||||||||||||||
Internal validation is a pre-requisite for the supervisory validation process by Basel II implementation. A specialized unit of the Entity, with sufficient independence, obtains a technical opinion on the adequacy of the internal models for the intended internal or regulatory purposes, and concludes on their usefulness and effectiveness. This unit must also assess whether the risk management and control procedures are adequate for the Entity’s risk strategy and profile. | |||||||||||||||||
In addition to complying with the regulatory requirement, the internal validation area provides an essential support to the risk committee and management, as they are responsible for ensuring that appropriate procedures and systems are in place to monitor and control the entity's risks. In this case, the internal validation area is responsible for providing a qualified and independent opinion so that the responsible authorities decide on the authorization of the use of models (for management purposes as well as regulatory use). | |||||||||||||||||
Internal model validation at Banco Santander encompasses credit risk models, market risk models, ALM, pricing models, stress test models, the economic capital model and other models related to the exercise of ICAAP. The scope of the validation includes not only the more theoretical or methodological aspects, but also the technology systems and the quality of the data they provide, on which their effective operation relies, and, in general, all the relevant aspects of advanced risk management (controls, reporting, uses, involvement of management, etc.). Therefore, the aim of internal validation is to review quantitative, qualitative, technological and corporate governance related to regulatory and management aspects concerning the model risk control. | |||||||||||||||||
Among the main functions of the Internal Model Validation area are the following: | |||||||||||||||||
i. Establish general validation principles, conducting an independent evaluation process including (I) data quality, (II) use of the methodology and (III) functioning of the models; | |||||||||||||||||
ii. Propose documents and model validation guides; | |||||||||||||||||
iii. Evaluate the methodology and data used in the development of the model and challenge the model and its use, stating the implications and limitations of the model, as well as the associated risks; | |||||||||||||||||
iv. Issue a technical opinion on the adequacy of internal models for the intended internal and regulatory effects, concluding on their usefulness and effectiveness; and | |||||||||||||||||
v. Provide essential support to risk committees and management of the Bank, through a qualified and independent opinion for responsible decision-making on the authorization of the use of models (for management purposes as well as regulatory use). | |||||||||||||||||
It is important to note that Banco Santander's internal validation function is fully consistent with the independent validation criteria for advanced approach issued by the Basel Committee, the European supervisor 'home regulator' (Banco de España and the European Central Bank) and the Bacen in compliance with the provisions of Circular 3,648 dated March 4, 2013 (Chapter III), Circular Letter 3,565 of September 6, 2012 and Circular 3,547 of July 2011. In this case, the Bank maintains a Segregation of functions between internal validation and internal audit, which is the last layer of validation of Bank control. | |||||||||||||||||
The internal audit is responsible for evaluating and reviewing the internal validation methodology and work and issues opinions with an effective level of autonomy. Internal Audit (third line of defense), as the ultimate control function in the Group, should (i) periodically assess the adequacy of policies, methods and procedures and (ii) confirm that they are effectively implemented in the management . | |||||||||||||||||
f.2) Capital Management | |||||||||||||||||
Capital management considers the regulatory and economic aspects and its objective is to achieve an efficient capital structure in terms of cost and compliance, meeting the requirements of the regulatory authorities and supporting to accomplish the goals of the classification of rating agencies and investors' expectations. The capital management includes securitization, sale of assets and raise capital through issuing shares, subordinated liabilities and hybrid instruments. | |||||||||||||||||
From an economic standpoint, capital management seeks to optimize value creation at the Bank and at its different business segment. To this end, the economic capital, RORAC (return on risk-adjusted capital) and data about the value creation of each business segment are generated. Within the framework of the internal capital adequacy assessment process (Pillar II of the Basel Capital Accord) the Group uses an economic capital measurement model with the objective of ensuring that there is sufficient capital available to support all the risks of its activity in different economic scenarios, with the solvency levels agreed upon by the Group. | |||||||||||||||||
In order to adequately manage the Bank’s capital, it is essential to estimate and analyze future needs, in anticipation of the various phases of the business cycle. Projections of regulatory and economic capital are made based on financial projections (balance sheets, income statement, etc.) and on macroeconomic scenarios estimated by the Economic Research Service. These estimative are used by the Bank as a reference to plan the management actions (issues, securitizations, etc.) required to achieve its capital targets and ensure adequate solvency levels. | |||||||||||||||||
g) Economic capital | |||||||||||||||||
g.1) Main objectives | |||||||||||||||||
The development of economic capital models in finance aims to solve a fundamental problem of regulatory capital, Sensitivity Risk. | |||||||||||||||||
In this context, the economic capital models are essentially designed to generate risk-sensitive estimative, allowing greater precision in risk management, as well as better allocation of economic capital by business units of Banco Santander. | |||||||||||||||||
The Banco Santander has directed efforts to build a model of robust and integrated economic capital to the business management. | |||||||||||||||||
The main objectives of the structure of economic capital of the Banco Santander are: | |||||||||||||||||
1 - Consolidate Pillar I and other risks which affect business in a single quantitative model, and determine estimates of capital by establishing correlations between different risks; | |||||||||||||||||
2 - Quantify and monitor different types of variations in risk; | |||||||||||||||||
3 - Distribute capital consumption between the different portfolios and manage the efficiency of return on capital (RORAC); | |||||||||||||||||
4 - Estimating the Economic Value Added for each business unit. Economic profit must exceed the cost of the Bank's capital; | |||||||||||||||||
5 - Accordance with the regulation in areas where the Bank operates in the review process of Pillar II by supervisors. | |||||||||||||||||
g.2) The Economic Capital Model | |||||||||||||||||
In calculating the economic capital, is the Bank's definition of losses to be covered. Thus, is used a confidence interval necessary to ensure business continuity. The confidence interval for the Banco Santander is 99.90% higher than required by Basel II. | |||||||||||||||||
The risk profile in Brazil is distributed by Credit risk, Market, ALM, Business, Operations and fixed assets. However, to successfully anticipate the changes proposed in Basel III, new risks have been incorporated to model: Intangibles, pension funds (defined benefit) and tax credits, which allow the Bank to adopt a position even more conservative and prudent. | |||||||||||||||||
| % Capital |
|
|
|
|
|
|
|
|
|
|
| 2016 |
| 2015 |
| 2014 |
New | New | New | |||||||||||||||
Risk Type | Methodology | Methodology | Methodology | ||||||||||||||
| Credit |
|
|
|
|
|
|
|
|
|
|
| 62% |
| 56% |
| 60% |
| Market |
|
|
|
|
|
|
|
|
|
|
| 5% |
| 4% |
| 5% |
| ALM |
|
|
|
|
|
|
|
|
|
|
| 9% |
| 9% |
| 9% |
| Business |
|
|
|
|
|
|
|
|
|
|
| 8% |
| 8% |
| 4% |
| Operational |
|
|
|
|
|
|
|
|
|
|
| 6% |
| 5% |
| 7% |
| Fixed Assets |
|
|
|
|
|
|
|
|
|
|
| 2% |
| 1% |
| 1% |
| Intangible Assets |
|
|
|
|
|
|
|
|
|
|
| 1% |
| 6% |
| 0 |
| Pension Funds |
|
|
|
|
|
|
|
|
|
|
| 1% |
| 2% |
| 0 |
| Deferred Tax Assets |
|
|
|
|
|
|
|
|
|
|
| 6% |
| 9% |
| 0 |
| TOTAL |
|
|
|
|
|
|
|
|
|
|
| 100% |
| 100% |
| 100% |
Still, for being a commercial Bank, credit is the main source of risk in Banco Santander and the evolution of this portfolio is a leading factor for oscillation. | |||||||||||||||||
Banco Santander periodically evaluates the level and evolution of RORAC (risk-adjusted return) of the main business units. The RORAC is the quotient of the profit generated on allocated capital, using the following formula: | |||||||||||||||||
RoRAC=Profit/Economic Capital | |||||||||||||||||
Banco Santander also makes the planning of capital in order to obtain future projections of economic and regulatory capital. The estimative obtained for the Bank are incorporated to different scenarios consistently, including its strategic objectives (organic growth, M & A, payout ratio, credits, etc.). Possible management strategies leading to optimize capital and solvency return of the Bank are identified. | |||||||||||||||||
g) Economic capital
RoRAC | |||||||||||||||||
Banco Santander has used the RORAC, with the following objectives: | |||||||||||||||||
1 – Analyze and set a minimum price for operations (admission) and clients (monitoring). | |||||||||||||||||
2 – Estimate capital consumption of each customer, economic groups, portfolio or business segment, in order to optimize the allocation of economic capital, maximizing the efficiency of the Bank. | |||||||||||||||||
3 – Measure and monitor business performance. | |||||||||||||||||
To evaluate the operations of global customers, the calculation of economic capital takes into account some variables used in the calculation of expected and unexpected losses. | |||||||||||||||||
Among these variables are: | |||||||||||||||||
1 – Counterparty rating; | |||||||||||||||||
2 – Maturity; | |||||||||||||||||
3 – Guarantees; | |||||||||||||||||
4 – Type of financing; | |||||||||||||||||
The return on capital is determined by the cost of capital. To create value for shareholders, the minimum return operation must exceed the cost of capital of Banco Santander. | |||||||||||||||||
APPENDIX I – RECONCILIATION OF SHAREHOLDERS’ EQUITY AND NET INCOME - BRGAAP vs IFRS | ||||||||||
| ||||||||||
The table below presents a conciliation of stockholders' equity and net income attributed to the parent between standards adopted in Brazil (BRGAAP) and IFRS, with the conceptual description of the main adjustments: | ||||||||||
| ||||||||||
Thousands of Reais |
|
|
| Note |
| 2016 |
| 2015 |
| 2014 |
|
|
|
|
|
|
|
|
|
|
|
Shareholders' equity attributed under to the Parent Brazilian GAAP |
|
| 57,771,524 |
| 54,819,073 |
| 57,320,685 | |||
IFRS adjustments, net of taxes, when applicable: |
|
|
|
|
|
|
|
| ||
Impairment on loans and receivables |
| a |
| 124,787 |
| 132,878 |
| 128,080 | ||
Category transfers |
|
|
| b |
| 650,109 |
| 704,519 |
| - |
Deferral of financial fees, commissions and inherent costs under effective interest rate method |
|
|
|
|
|
|
|
| ||
| c |
| 216,192 |
| 138,314 |
| 114,780 | |||
Reversal of goodwill amortization |
| d |
| 25,123,410 |
| 23,344,320 |
| 20,560,813 | ||
Realization on purchase price adjustments |
| e |
| 778,882 |
| 798,776 |
| 874,738 | ||
Recognition of fair value in the partial sale in subsidiaries |
|
|
| f |
| 112,052 |
| 112,052 |
| 112,052 |
Option for Acquisition of Equity Instrument |
|
|
| g |
| (1,017,000) |
| (1,017,000) |
| (950,000) |
Negative goodwill PSA |
|
|
| h |
| 52,686 |
| - |
| - |
Others |
|
|
|
|
| 274,413 |
| 367,290 |
| 141,972 |
Shareholders' equity attributed to the parent under IFRS |
|
|
| 84,087,055 |
| 79,400,222 |
| 78,303,120 | ||
Non-controlling interest under IFRS |
|
|
| 725,504 |
| 435,062 |
| 380,173 | ||
Shareholders' equity (including non-controlling interest) under IFRS |
|
| 84,812,559 |
| 79,835,284 |
| 78,683,293 | |||
|
|
|
|
|
|
|
|
|
|
|
Thousands of Reais |
|
|
| Note |
| 2016 |
| 2015 |
| 2014 |
|
|
|
|
|
|
|
|
|
|
|
Net income attributed to the Parent under Brazilian GAAP |
|
|
| 5,532,962 |
| 6,998,196 |
| 2,161,170 | ||
IFRS adjustments, net of taxes, when applicable: |
|
|
|
|
|
|
|
| ||
Impairment on loans and receivables |
| a |
| (8,091) |
| 4,798 |
| 36,998 | ||
Deferral of financial fees, commissions and inherent costs under effective interest rate method |
|
|
|
|
|
|
|
| ||
| c |
| 77,878 |
| 23,534 |
| (11,053) | |||
Reversal of goodwill amortization |
| d |
| 1,756,587 |
| 2,783,507 |
| 3,683,391 | ||
Realization on purchase price adjustments |
| e |
| (76,247) |
| (75,962) |
| (75,151) | ||
Negative goodwill PSA |
|
|
| h |
| 52,686 |
| - |
| - |
Others |
|
|
|
|
| (1,212) |
| 49,667 |
| (165,332) |
Net income attributed to the parent under IFRS |
|
|
| 7,334,563 |
| 9,783,740 |
| 5,630,023 | ||
Non-controlling interest under IFRS |
|
|
| 130,355 |
| 50,086 |
| 77,753 | ||
Net income (including non-controlling interest) under IFRS |
|
|
| 7,464,918 |
| 9,833,826 |
| 5,707,776 | ||
a) Impairment on loans and receivables: | |||||||||||||||||
On the income refers to the adjust based on estimated losses on loans and receivables portfolio, which was established with based on historical loss of impairment and other circumstances known at the time of evaluation, according to the guidance provided by IAS 39 "Financial Instruments: Recognition and Measurement. These criteria differ in certain aspects of the criteria adopted under BRGAAP, which uses certain regulatory limits set by the Central Bank. | |||||||||||||||||
b) Transfer of category | |||||||||||||||||
The IAS 39 permits reclassification of the category "available for sale" to "held to maturity" and "available for sale" to "loans and receivables" at any time, provided that the entity has the intention and ability to hold the financial asset in this category. However, for the purpose of local books (BR GAAP), pursuant to art. 5 of BACEN Circular 3,068, the revaluation regarding the classification into categories of securities may only be made when preparing the half-yearly and the yearly financial statements. For purposes of IFRS financial statements of December 2015 Banco Santander reclassified some securities therefore July 1, 2015 and to Brazilian GAAP purposes due to local requirements mentioned above such change occurred at December 31, 2015. | |||||||||||||||||
c) Deferral of financial fees, commissions and other costs under effective interest rate method: | |||||||||||||||||
Under IFRS, in accordance with IAS 39 “Financial Instruments: Recognition and Measurement”, financial fees, commissions and other costs that are integral part of effective interest rate of financial instruments measured at amortized cost are recognized in profit or loss over the term of the corresponding contracts. Under BRGAAP these fees and expenses are recognized directly as income when received or paid. | |||||||||||||||||
d) Reversal of goodwill amortization: | |||||||||||||||||
Under BRGAAP, goodwill is amortized systematically over a period upto 10 years and additionally, the goodwill recorded is measured annually or whenever there is any indication that the asset may be impaired. Under IFRS, in accordance with IAS 38 “Intangible Assets”, goodwill is not amortized, but instead, is tested for impairment, at least annually, and whenever there is an indication that the goodwill may be impaired; comparing its recoverable amount with its carrying value. The tax amortization of goodwill of Banco ABN Amro Real SA represents a difference between book and tax basis of a permanent nature and definitive as the possibility of future use of resources to settle a tax liability is considered remote by management, supported by the opinion of expert external advisors. The tax amortization of goodwill is permanent and definitive, and therefore does not apply to the recognition of a deferred tax liability in accordance with IAS 12, on temporary differences. | |||||||||||||||||
e) Realization on purchase price adjustments: | |||||||||||||||||
As part of the allocation of the purchase price related to the acquisition of Banco Real, following the requirements of IFRS 3, the Bank has recognized the assets and liabilities of the acquiree to fair value, including identifiable intangible assets with finite lives. Under BRGAAP, in a business combination, the assets and liabilities are kept at their book value. This purchase price adjustment relates substantially to the following items: | |||||||||||||||||
• The allocation related to the value of assets in the loan portfolio. The initial recognition of value of the loans at fair value, adjustment to the yield curve of the loan portfolio in comparison to its nominal value, which is apportion by its average realization period. | |||||||||||||||||
• The amortization of the identified intangible assets with finite lives over their estimated useful lives. | |||||||||||||||||
f) Recognition of fair value in the partial disposal of investments in subsidiaries | |||||||||||||||||
Under IFRS, in accordance with IFRS 10 "Consolidated Financial Statements" on partial disposal of a permanent investment, fair value is recognized over the remaining portion (Webmotors). Under BRGAAP, this type of operation, ongoing participation is accounted for by its book value. | |||||||||||||||||
g) Option for Acquisition of Equity Instrument | |||||||||||||||||
Within the context of transaction, Banco Santander has granted to the members of Getnet S.A. and Banco Bonsucesso a put option over all shares of Getnet S.A. and Banco Bonsucesso held by them. The overall out in IAS 32, a financial liability was recognized for this commitment, with a specific charge in an account in stockholders' equity in the amount of R$950 million and R$67 million, respectively. | |||||||||||||||||
h) Negative goodwill PSA | |||||||||||||||||
Aymoré Crédito e Financiamento acquired 100% of PSA Leasing and therefore a negative goodwill in the amount of R$93 million was identified in this acquisition. In accordance with IFRS 3 (Business Combinations), negative goodwill is understood as the greater of the net value, at the acquisition date, of the identifiable assets acquired and the amount actually paid, and is recognized against income. | |||||||||||||||||
APPENDIX II – STATEMENTS OF VALUE ADDED |
|
|
|
|
|
|
|
|
|
| |||||||
|
|
|
|
|
|
|
|
|
|
|
|
|
|
|
|
|
|
The following Statements of value added is not required under IFRS but being presented as supplementary information as required by Brazilian Corporate Law for publicly-held companies, and has been derived from the Bank´s consolidated financial statements prepared in accordance with IFRS. | |||||||||||||||||
|
|
|
|
|
|
|
|
|
|
|
|
|
|
|
|
|
|
|
|
|
|
|
|
|
|
|
|
|
|
|
|
| 2016 | ||
Thousands of Reais |
|
|
|
|
|
|
|
|
|
|
|
|
|
|
|
| |
Interest and similar income |
|
|
|
|
|
|
|
|
|
|
| 77,146,077 |
|
| |||
Net fee and commission income |
|
|
|
|
|
|
|
|
|
|
| 10,977,596 |
|
| |||
Impairment losses on financial assets (net) |
|
|
|
|
|
|
|
|
| (13,301,445) |
|
| |||||
Other income and expense |
|
|
|
|
|
|
|
|
|
|
| (751,727) |
|
| |||
Interest expense and similar charges |
|
|
|
|
|
|
|
|
|
|
| (46,559,584) |
|
| |||
Third-party input |
|
|
|
|
|
|
|
|
|
|
|
|
| (5,804,939) |
|
| |
Materials, energy and others |
|
|
|
|
|
|
|
|
|
|
| (510,961) |
|
| |||
Third-party services |
|
|
|
|
|
|
|
|
|
|
|
|
| (4,589,468) |
|
| |
Impairment of assets |
|
|
|
|
|
|
|
|
|
|
|
| (114,321) |
|
| ||
Other |
|
|
|
|
|
|
|
|
|
|
|
|
| (590,189) |
|
| |
Gross added value |
|
|
|
|
|
|
|
|
|
|
|
|
| 21,705,978 |
|
| |
Retention |
|
|
|
|
|
|
|
|
|
|
|
|
|
|
|
|
|
Depreciation and amortization |
|
|
|
|
|
|
|
|
|
|
| (1,482,639) |
|
| |||
Added value produced |
|
|
|
|
|
|
|
|
|
|
| 20,223,339 |
|
| |||
Investments in affiliates and subsidiaries |
|
|
|
|
|
|
|
|
| 47,537 |
|
| |||||
Added value to distribute |
|
|
|
|
|
|
|
|
|
|
| 20,270,876 |
|
| |||
Added value distribution |
|
|
|
|
|
|
|
|
|
|
|
|
|
| |||
Employee |
|
|
|
|
|
|
|
|
|
|
|
|
| 7,378,374 |
| 36.4% | |
Compensation |
|
|
|
|
|
|
|
|
|
|
|
|
| 5,455,374 |
|
| |
Benefits |
|
|
|
|
|
|
|
|
|
|
|
|
| 1,397,711 |
|
| |
Government severance indemnity funds for employees - FGTS |
|
|
|
|
|
|
| 352,939 |
|
| |||||||
Other |
|
|
|
|
|
|
|
|
|
|
|
|
| 172,350 |
|
| |
Taxes |
|
|
|
|
|
|
|
|
|
|
|
|
| 4,659,989 |
| 23.0% | |
Federal |
|
|
|
|
|
|
|
|
|
|
|
|
| 4,101,629 |
|
| |
State |
|
|
|
|
|
|
|
|
|
|
|
|
| 717 |
|
| |
Municipal |
|
|
|
|
|
|
|
|
|
|
|
|
| 557,643 |
|
| |
Compensation of third-party capital - rental |
|
|
|
|
|
|
|
|
| 767,595 |
| 3.8% | |||||
Remuneration of interest on capital |
|
|
|
|
|
|
|
|
|
|
| 7,464,918 |
| 36.8% | |||
Dividends and interest on capital |
|
|
|
|
|
|
|
|
|
|
| 4,550,000 |
|
| |||
Profit Reinvestment |
|
|
|
|
|
|
|
|
|
|
|
|
| 2,784,563 |
|
| |
Profit (loss) attributable to non-controlling interests |
|
|
|
|
|
|
|
|
| 130,355 |
|
| |||||
Total |
|
|
|
|
|
|
|
|
|
|
|
|
| 20,270,876 |
| 100.0% | |
|
|
|
|
|
|
|
|
|
|
|
|
|
|
|
|
|
|
|
|
|
|
|
|
|
|
|
|
| 2015 |
| 2014 | ||||
Thousands of Reais |
|
|
|
|
|
|
|
|
|
|
|
|
|
|
|
| |
Interest and similar income |
|
|
|
|
|
|
| 69,870,200 |
|
|
| 58,923,916 |
|
| |||
Net fee and commission income |
|
|
|
|
|
|
| 9,483,509 |
|
|
| 8,765,886 |
|
| |||
Impairment losses on financial assets (net) |
|
|
|
|
| (13,633,989) |
|
|
| (11,271,605) |
|
| |||||
Other income and expense |
|
|
|
|
|
|
| (3,867,959) |
|
|
| (1,350,357) |
|
| |||
Interest expense and similar charges |
|
|
|
|
|
|
| (38,533,089) |
|
|
| (31,695,404) |
|
| |||
Third-party input |
|
|
|
|
|
|
|
|
| (7,061,296) |
|
|
| (5,958,217) |
|
| |
Materials, energy and others |
|
|
|
|
|
|
| (520,831) |
|
|
| (511,384) |
|
| |||
Third-party services |
|
|
|
|
|
|
|
|
| (4,632,346) |
|
|
| (4,653,478) |
|
| |
Impairment of assets |
|
|
|
|
|
|
|
| (1,220,645) |
|
|
| 3,751 |
|
| ||
Other |
|
|
|
|
|
|
|
|
| (687,474) |
|
|
| (797,106) |
|
| |
Gross added value |
|
|
|
|
|
|
|
|
| 16,257,376 |
|
|
| 17,414,219 |
|
| |
Retention |
|
|
|
|
|
|
|
|
|
|
|
|
|
|
|
| |
Depreciation and amortization |
|
|
|
|
|
|
| (1,490,017) |
|
|
| (1,362,129) |
|
| |||
Added value produced |
|
|
|
|
|
|
| 14,767,359 |
|
|
| 16,052,090 |
|
| |||
Added value received from transfer |
|
|
|
|
|
|
|
|
|
|
|
|
|
| |||
Investments in affiliates and subsidiaries |
|
|
|
|
| 116,312 |
|
|
| 91,096 |
|
| |||||
Added value to distribute |
|
|
|
|
|
|
| 14,883,671 |
|
|
| 16,143,186 |
|
| |||
Added value distribution |
|
|
|
|
|
|
|
|
|
|
|
|
|
| |||
Employee |
|
|
|
|
|
|
|
|
| 6,829,965 |
| 45.9% |
| 6,312,224 |
| 39.1% | |
Compensation |
|
|
|
|
|
|
|
|
| 4,824,615 |
|
|
| 4,578,960 |
|
| |
Benefits |
|
|
|
|
|
|
|
|
| 1,300,788 |
|
|
| 1,187,751 |
|
| |
Government severance indemnity funds for employees - FGTS |
|
|
| 391,608 |
|
|
| 310,561 |
|
| |||||||
Other |
|
|
|
|
|
|
|
|
| 312,954 |
|
|
| 234,952 |
|
| |
Taxes |
|
|
|
|
|
|
|
|
| (2,527,787) |
| -17.0% |
| 3,425,169 |
| 21.2% | |
Federal |
|
|
|
|
|
|
|
|
| (3,023,224) |
|
|
| 3,366,835 |
|
| |
State |
|
|
|
|
|
|
|
|
| 659 |
|
|
| 1,235 |
|
| |
Municipal |
|
|
|
|
|
|
|
|
| 494,778 |
|
|
| 57,099 |
|
| |
Compensation of third-party capital - rental |
|
|
|
|
| 747,667 |
| 5.0% |
| 698,017 |
| 4.3% | |||||
Remuneration of interest on capital |
|
|
|
|
|
|
| 9,833,826 |
| 66.1% |
| 5,707,776 |
| 35.4% | |||
Dividends and interest on capital |
|
|
|
|
|
|
| 6,200,000 |
|
|
| 1,430,193 |
|
| |||
Profit Reinvestment |
|
|
|
|
|
|
|
|
| 3,583,740 |
|
|
| 4,199,830 |
|
| |
Profit (loss) attributable to non-controlling interests |
|
|
|
|
| 50,086 |
|
|
| 77,753 |
|
| |||||
Total |
|
|
|
| �� |
|
|
|
| 14,883,671 |
| 100.0% |
| 16,143,186 |
| 100.0% | |
(Free Translation into English from the Original Previously Issued in Portuguese) | ||||||||||||||||
| ||||||||||||||||
BANCO SANTANDER (BRASIL) S.A. | ||||||||||||||||
MANAGEMENT REPORT | ||||||||||||||||
|
|
|
|
|
|
|
|
|
|
|
|
|
|
|
|
|
Dear Stockholders: | |||||||||||||||||||
We present the Management Report to the Consolidated Financial Statements of Banco Santander (Brasil) S.A. (Banco Santander or Bank) for the fiscal year ended December 31, 2016, prepared in accordance with the International Financial Reporting Standards (IFRS) issued by the International Accounting Standards Board (IASB), and the interpretations issued by the IFRS Interpretations Committee (Current name of IFRIC). | |||||||||||||||||||
1) Macroeconomic Environment | |||||||||||||||||||
In the last three months of the year 2016, the relationship between the Real and the Dollar hovered around the level of BRL 3.30/USD, without indicating a clear trend. After a clear appreciation movement during the first half of 2016, the exchange rate closed December at BRL 3.26/USD, near to the value of BRL 3.25/USD registered in the third quarter. The optimistic view regarding the domestic economic and the decrease of risk perception, which favored the BRL appreciation, lost momentum in the last quarter of 2016. This was mainly due to the interest rate increase in the United States (and the expectation of further increases) and the recent economic indicators in Brazil, which suggested that the beginning of economic activity rebound will be postponed to later in 2017. | |||||||||||||||||||
With this context, the environment for banking activity in Brazil remains challenging. The labor market, for example, is still deteriorating and precarious, a fact that can be verified by the fast rise in the unemployment rate, which reached 12.4% in November in the seasonally adjusted series, according to Banco Santander estimates. | |||||||||||||||||||
Further relief should come from monetary policy. After a further cut (0.75%) in the Selic rate in January 2017 (which was reduced to 13.0%), the Bank expects that the Bank will continue the process of monetary easing in the coming years, with a view to improving the inflationary situation, the anchoring of inflation expectations and the evolution of the approval of fiscal adjustment measures by the government. Signs of Bacen in recent official documents reinforce this perception. Regarding fiscal policy, despite the positive effects that the recovery of the activity should exert on the tax collection in 2017, the results should continue to be deficient in the coming years. The reforms already proposed by the government and those expected for the coming months are aimed at stabilizing debt in the long term. | |||||||||||||||||||
In this scenario, in November 2016 the total credit portfolio intensified the decline in the YoY comparison, decreasing 2.3% compared to the same month of the previous year. This decrease was mainly due to non-earmarked credit, which declined by 4.1% in the same comparison, while credit with directed resources also contracted in the same period, but with less intensity (approximately 0.4%). Even the portfolio of public banks, which grew at a rate above 10% in 2015, showed a YoY comparison in November (1.5%). Conservative concessions on the part of public and private banks, caution in consumer borrowing and high indebtedness of households and companies are factors that must maintain this downward trend in credit over the coming months. However, if the fall expected by the Bank in the course of 2017 to take place (Banco Santander's projection is that the benchmark interest rate will decline to 9.75% by the end of 2017), and consumer confidence will resume Its recovery trajectory (interrupted by the increase in the volatility of the external scenario and some disappointment with the economic indicators for the third quarter), the Bank believes that credit should accelerate again in 2017. | |||||||||||||||||||
2) Performance | |||||||||||||||||||
2.1) Net Income | |||||||||||||||||||
|
|
|
|
|
|
|
|
|
|
|
|
|
|
|
|
| |||
CONSOLIDATED INCOME STATEMENTS |
|
|
|
|
| 12M16 |
| 12M15 |
| annual changes% | 4Q16 |
| 3Q16 |
| 4Q16 vs. 3Q16 | ||||
INTEREST NET INCOME |
|
|
|
|
|
|
| 30,586.5 |
| 31,337.1 |
| -2.4 | 8,190.5 |
| 7,531.1 |
| 8.8 | ||
Income from equity instruments | 258.5 | 142.9 | 80.9 | 198.8 | 15.6 | 1,174.4 | |||||||||||||
Income from companies accounted for by the equity method | 47.5 | 116.3 | -59.2 | (3.0) | 11.8 | -125.4 | |||||||||||||
Fees (net) | 10,977.6 | 9,483.5 | 15.8 | 3,114.1 | 2,737.3 | 13.8 | |||||||||||||
Gains (losses) on financial assets and liabilities (net) + Exchange differences (net) | 7,591.0 | (9,918.5) | -176.5 | (866.2) | 177.8 | -587.2 | |||||||||||||
Other operating expense (net) | (624.6) | (347.1) | 79.9 | (227.4) | (160.5) | 41.7 | |||||||||||||
TOTAL INCOME | 48,836.5 | 30,814.2 | 58.5 | 10,406.8 | 10,313.1 | 0.9 | |||||||||||||
Administrative and personnel expenses | (14,920.4) | (14,515.1) | 2.8 | (4,018.5) | (3,699.2) | 8.6 | |||||||||||||
Depreciation and amortization | (1,482.6) | (1,490.0) | -0.5 | (386.3) | (372.8) | 3.6 | |||||||||||||
Provisions (net) | (2,724.7) | (4,001.3) | -31.9 | (662.0) | (568.4) | 16.5 | |||||||||||||
Impairment losses on financial assets and other assets (net) | (13,415.8) | (14,854.6) | -9.7 | (5,062.5) | (2,649.2) | 91.1 | |||||||||||||
Gains (losses) on disposal of assets not classified as non-current | 3.8 | 780.6 | -99.5 | 1.3 | (1.7) | -176.5 | |||||||||||||
Gains (losses) on non-current assets held for sale not classified | 87.1 | 50.5 | 72.5 | 2.5 | 88.9 | -97.2 | |||||||||||||
Operating Profit Before Tax | 16,383.9 | (3,215.7) | -609.5 | 281.3 | 3,110.7 | -91.0 | |||||||||||||
Income taxes | (8,919.0) | 13,049.5 | -168.3 | 1,236.3 | (810.1) | -252.6 | |||||||||||||
CONSOLIDATED NET INCOME |
|
|
|
|
|
| 7,464.9 |
| 9,833.8 |
| -24.1 | 1,517.6 |
| 2,300.6 |
| -34.0 | |||
Main events of the Consolidated Income Statements between the years of 2016 and 2015: | |||||||||||||||||||
1) In the first half 2015 was registered a reversal of legal obligations in the amount of R$7,950 million related to Cofins, under "Net Interest Income" - R$2,057 million and "Income Taxes" - R$5,893 million. The tax effect was recorded in "Income Taxes", in the amount to R$3,180 million. | |||||||||||||||||||
2) Hedge of the foreign investments - The Bank operates a branch in the Cayman Islands, used primarily for sourcing funds in the international banking and capital markets to provide credit lines for us, which are extended to our customers for working capital and trade-related financings. To protect the exposures exchange rate variations, the Bank uses derivative. The gains or losses resulting from the impact of appreciation or devaluation for the real in foreign investments is nontaxable to PIS/COFINS/IR/CSLL, while gains or losses from derivatives used as hedges are taxable. The purpose of these derivatives is to protect the after-tax results. This operation is recorded in "Gains (losses) with financial assets and liabilities (net)" fully offset the tax line. On December 31, 2016, the effects of the valuation of the Real against the US Dollar was R$6,140 million (2015 - Devaluation of R$11,532 million.) | |||||||||||||||||||
Analysis of Income by Segment | |||||||||||||||||||
The Bank has two segments, commercial (except for the Corporate Banking business managed globally using the Global Relationship Model - Global Model of Relationship) and the Global Wholesale Banking segment includes the Investment Banking and markets operations, including departments cash and stock trades. | |||||||||||||||||||
Below, the Bank presents table by segment: | |||||||||||||||||||
OPERATING INCOME BEFORE TAXES BY SEGMENT (R$Millions) |
| 12M16 |
| % in profit before tax |
| 12M15 |
| annual changes % |
| 4Q16 | % in profit before tax |
| 3Q16 |
| 4Q16 vs. 3Q16 | ||||
Commercial Bank(1) |
|
|
| 12,651.7 |
| 77.2 |
| (5,565.2) |
| 327.3 |
| (469.3) | -166.8 |
| 2,243.5 |
| -120.9 | ||
Global Wholesale Banking | 3,732.2 | 22.8 | 2,349.5 | 58.9 | 750.7 | 27.9 | 867.3 | -13.4 | |||||||||||
Operating Profit Before Tax |
| 16,383.9 |
| 100.0 |
| (3,215.7) |
| 609.5 |
| 281.4 | -138.9 |
| 3,110.8 |
| -91.0 | ||||
(1) On December 31, 2016, includes in the Commercial Bank, the economic hedge of investment in US Dollar, and excluding this effect, the Operating Income before taxation Adjusted for this segment was R$6,512 million and R$5,967 million, respectively. | |||||||||||||||||||
General Expenses | |||||||||||||||||||
The other administrative expenses totaled R$6,543.1 million and R$6,716.3 million in 2016 and 2015 respectively. The personnel expenses totaled R$8,377.3 million and R$7,798.8 million in 2016 and 2015 respectively. The other administrative expenses reduced 2.6% and the personnel expenses increased 7.4% YoY. | |||||||||||||||||||
The efficiency ratio, calculated by division of the administrative and personnel expenses amounting R$14,920.4 million by total revenue in the amount to R$48,836.5 million, reached 30.6% (2015 - 47.1%), presenting a significant improvement. | |||||||||||||||||||
2.2) Assets and Liabilities | |||||||||||||||||||
|
|
|
|
|
|
|
|
|
|
|
|
|
|
|
|
|
|
|
|
BALANCE SHEET |
|
|
|
|
|
|
|
|
| Dec/16 |
| Dec/15 | annual changes% |
| Sep/16 |
| Dec/16 vs. Sep/16 changes % | ||
Cash and Balances with the Brazilian Central Bank |
|
|
|
|
| 110,604.9 |
| 89,143.4 | 24.1 |
| 118,860.1 |
| -6.9 | ||||||
Financial Assets held for Trading | 84,873.7 | 50,536.7 | 67.9 | 61,897.0 | 37.1 | ||||||||||||||
Other Financial Assets at Fair Value Through Profit or Loss | 1,711.2 | 2,080.2 | -17.7 | 1,782.8 | -4.0 | ||||||||||||||
Available-for-Sale Financial Assets | 57,815.1 | 68,265.6 | -15.3 | 64,712.8 | -10.7 | ||||||||||||||
Held to maturity investments(1) | 10,048.8 | 10,097.8 | -0.5 | 9,849.5 | 2.0 | ||||||||||||||
Loans and Receivables(1) | 296,048.5 | 306,268.8 | -3.3 | 282,956.4 | 4.6 | ||||||||||||||
Hedging Derivatives | 222.7 | 1,312.2 | -83.0 | 186.5 | 19.4 | ||||||||||||||
Non-Current Assets Held For Sale | 1,337.9 | 1,237.5 | 8.1 | 1,074.7 | 24.5 | ||||||||||||||
Investments in Associates and Joint Ventures | 990.1 | 1,060.7 | -6.7 | 1,008.7 | -1.8 | ||||||||||||||
Tax Assets | 28,753.2 | 34,769.9 | -17.3 | 27,625.4 | 4.1 | ||||||||||||||
Other Assets | 5,104.0 | 3,802.1 | 34.2 | 5,107.4 | -0.1 | ||||||||||||||
Tangible Asset | 6,646.4 | 7,005.9 | -5.1 | 6,712.2 | -1.0 | ||||||||||||||
Intangible Asset | 30,236.8 | 29,813.7 | 1.4 | 30,108.5 | 0.4 | ||||||||||||||
TOTAL ASSETS | 634,393.2 | 605,394.5 | 4.8 | 611,882.1 | 3.7 | ||||||||||||||
|
| ||||||||||||||||||
Financial Liabilities Held For Trading | 51,619.9 | 42,387.8 | 21.8 | 42,332.9 | 21.9 | ||||||||||||||
Financial Liabilities at Amortized Cost | 471,579.5 | 457,281.7 | 3.1 | 453,777.1 | 3.9 | ||||||||||||||
Hedge Derivatives | 311.0 | 2,376.8 | -86.9 | 307.9 | 1.0 | ||||||||||||||
Provisions | 11,776.5 | 11,409.7 | 3.2 | 11,674.3 | 0.9 | ||||||||||||||
Tax Liabilities | 6,094.7 | 5,253.1 | 16.0 | 6,913.9 | -11.8 | ||||||||||||||
Other Liabilities | 8,199.1 | 6,850.2 | 19.7 | 8,332.9 | -1.6 | ||||||||||||||
TOTAL LIABILITIES | 549,580.7 | 525,559.3 | 4.6 | 523,339.0 | 5.0 | ||||||||||||||
|
| ||||||||||||||||||
Total Equity | 84,812.6 | 79,835.3 | 6.2 | 88,543.1 | -4.2 | ||||||||||||||
|
| ||||||||||||||||||
TOTAL LIABILITIES AND STOCKHOLDERS' EQUITY |
|
|
|
|
| 634,393.2 |
| 605,394.5 | 4.8 |
| 611,882.1 |
| 3.7 | ||||||
Funding | |||||||||||||||||||
Total funding (deposits of Brazil Central Bank and deposits of credit institutions, deposits from clients, marketable debt securities, subordinated liabilities and debt instruments eligible to compose capital) reached R$434,700.4 million in 2016 and R$425,209,0 in 2015, increased of 2.2%. | |||||||||||||||||||
Transfer between categories(1) | |||||||||||||||||||
In January 2014, the Bank made an issue of securities eligible to compose the capital of Tier I and Reference Equity (PR) Tier II, in the amount of US$2.5 billion (equivalent to R$6 billion). Aiming to mitigate the risk of interest rates in US dollars, was made the purchase of assets indexed in this currency: NTN-A and Eurobonds issued by the federal government of Brazil and BNDES (acquired via Santander Cayman). Initially, these securities were classified as "Available-For-Sale Financial Assets - Debt instruments", and on July 1, 2015, were reclassified to "Held to maturity investments". On December 31, 2016 such securities amounted to R$10,049 million (2015 - R$10,098 million). Banco Santander has the financial capacity and intention to hold to maturity securities classified as held-to-maturity. Additionally, were reclassified securities from "Available-For-Sale Financial Assets - Debt instruments" to "Loans and Receivables - Debt instruments". On December 31, 2016 such securities amounted to R$16,283 million (2015 - R$11,813 million). | |||||||||||||||||||
The fair value of this operation is R$10,555 million. | |||||||||||||||||||
Additionally, in the first quarter of 2016, due to the Banco Santander's strategy change, were reclassified from Available Financial Assets for sale - Debt instruments to Loans and Receivables - Debt Instruments the total amount of R$4,563 million, meeting the required in IAS 39. | |||||||||||||||||||
The transfers above comply with IAS 39. | |||||||||||||||||||
2.3) Loan Portfolio | |||||||||||||||||||
|
|
|
|
|
|
|
|
|
|
|
|
|
|
|
|
|
|
|
|
LOANS AND RECEIVABLES |
|
|
|
|
|
|
| Dec/16 |
| Dec/15 | annual changes% |
| Sep/16 |
| Dec/16 vs. Sep/16 changes % | ||||
Loans and amounts due from credit institutions, gross |
|
|
|
|
| 27,963.9 |
| 42,601.3 | -34.4 |
| 26,835.1 |
| 4.2 | ||||||
Impairment losses | (201.4) | (178.7) | 12.7 | (191.9) | 5.0 | ||||||||||||||
Loans and amounts due from credit institutions, net | 27,762.5 | 42,422.6 | -34.6 | 26,643.2 | 4.2 | ||||||||||||||
|
| ||||||||||||||||||
Loans and advances to customers, gross | 268,437.6 | 267,266.4 | 0.4 | 254,624.2 | 5.4 | ||||||||||||||
Impairment losses | (16,434.8) | (15,233.0) | -7.9 | (13,889.7) | 18.3 | ||||||||||||||
Loans and advances to customers, net | 252,002.8 | 252,033.4 | 0.0 | 240,734.5 | 4.7 | ||||||||||||||
|
| ||||||||||||||||||
Debt instruments | 17,838.2 | 11,957.1 | 49.2 | 16,884.2 | 5.7 | ||||||||||||||
Impairment losses | (1,554.9) | (144.4) | 976.8 | (1,305.6) | 19.1 | ||||||||||||||
Debt instruments, net | 16,283.3 | 11,812.7 | 37.8 | 15,578.6 | 4.5 | ||||||||||||||
|
| ||||||||||||||||||
TOTAL LOANS AND RECEIVABLES |
|
|
|
|
|
|
| 296,048.6 |
| 306,268.7 | -3.3 |
| 282,956.3 |
| 4.6 | ||||
Impairment losses | |||||||||||||||||||
The expenses for impairment losses, including the loans previously charged off, totaled R$13,389.8 million and R$12,965.9 million in the fiscal year ended on December 31, 2016 and 2015, respectively, increasing 3.3%. | |||||||||||||||||||
2.4) Stockholders’ Equity | |||||||||||||||||||
In December 2016, Banco Santander consolidated stockholders’ equity presented an increase of 6.2%, compared to December, 2015. | |||||||||||||||||||
The variance of stockholders’ equity in 2016 is due, mainly, to the increase of other comprehensive income in the amount of R$2,783.7 million, which includes as the main event the changes in fair value of certain operations, the net income of the fiscal year in the amount of R$7,464.9 million and reduced Interest on Capital in the amount of R$4,550.0 million. | |||||||||||||||||||
In the meeting held on November 3, 2016, the Bank’s Board of Directors approved, in continuation of the buyback program that expired on November 4, 2016, the buyback program of its Units and ADRs, by the Bank or its agency in Cayman, to be held in treasury or subsequently sold. | |||||||||||||||||||
The Buyback Program will cover the acquisition up to 38,402,972 Units, representing 38,402,972 common shares and 38,402,972 preferred shares, or the ADRs, which, on September 30, 2016, corresponded to approximately 1.02% of the Bank’s share capital. On September 30, 2016, the Bank held 384,029,725 common shares and 411,834,140 preferred shares being traded. | |||||||||||||||||||
The Buyback has the purpose to (1) maximize the value creation to shareholders by means of an efficient capital structure management; and (2) enable the payment of officers, management level employees and other Bank employees and companies under its control, according to the Long Term Incentive Plans. | |||||||||||||||||||
The term of the Buyback Program is 365 days as from November 4, 2016, and will expire on November 3, 2017. | |||||||||||||||||||
| |||||||||||||||||||
TREASURY SHARES |
|
|
|
|
|
|
|
|
|
|
|
| Dec/16 |
|
|
| Dec/15 | ||
|
| Quantity |
|
|
| Quantity | |||||||||||||
| Units | ADRs |
| Units |
| ADRs | |||||||||||||
Treasury shares at beginning of the fiscal year | 7,080,068 | 13,137,665 | 16,531,177 | 13,080,565 | |||||||||||||||
Shares Acquisitions | 14,284,400 | - | 13,873,413 | 57,100 | |||||||||||||||
Cancellation of ADRs(1) | 13,137,665 | (13,137,665) | - | - | |||||||||||||||
Cancellation of Shares(2) | - | - | (18,878,954) | - | |||||||||||||||
Payment - Share-based compensation | (8,716,213) | - | (4,445,568) | - | |||||||||||||||
Treasury shares at end of the fiscal year | 25,785,920 | - | 7,080,068 | 13,137,665 | |||||||||||||||
Balance of Treasury Shares in thousands of reais (2)(3) | R$ 513,889 | R$ - | R$ 106,764 | R$ 317,094 | |||||||||||||||
|
| ||||||||||||||||||
Cost/market Value | Units | ADRs | Units | ADRs | |||||||||||||||
Minimum cost | R$ 7.55 | US$ 4.37 | R$ 11.01 | US$4.37 | |||||||||||||||
Weighted average cost | R$ 16.43 | US$ 6.17 | R$ 14.28 | US$6.17 | |||||||||||||||
Maximum cost | R$ 26.81 | US$ 10.21 | R$ 18.51 | US$10.21 | |||||||||||||||
Market value |
|
|
|
|
|
|
|
|
|
|
|
| R$ 28.32 | US$ 8.58 |
| R$ 16.04 |
| US$3.89 | |
(1) In January 2016 was the transformation of all ADRs that were held in treasury for UNIT's. | |||||||||||||||||||
(2) Extraordinary General Meeting held on December 14, 2015 the cancellation of 18,878,954 Units was approved (18,878,954 ON and 18,878,954 PN totaling 37,757,908 treasury shares) equivalent to R$269 million. | |||||||||||||||||||
(3) The total number of treasury shares on December 31, 2016 is R$514 million (12/31/2015 - R$424 million) and includes issuance costs amounting to R$145 thousand (12/31/2015 - R$95 thousand). | |||||||||||||||||||
In the fiscal year of 2016 there were highlights of Dividends and Interest on Capital. | |||||||||||||||||||
|
|
|
|
|
|
|
|
|
|
|
|
|
|
|
|
|
|
|
|
DIVIDENDS AND INTEREST ON CAPITAL |
|
|
|
|
|
|
|
| Dec/16 |
| Sep/16 |
| Dec/15 | ||||||
Interest on capital | 3,850.0 | 500.0 | 1,400.0 | ||||||||||||||||
Interim Dividends | 700.0 | 0.0 | 3,050.0 | ||||||||||||||||
Intercalary Dividends | 700.0 | 0.0 | 1,750.0 | ||||||||||||||||
Total |
|
|
|
|
|
|
|
|
|
|
|
|
| 5,250.0 |
| 500.0 |
| 6,200.0 | |
2.5) Basel Index | |||||||||||||||||||
Financial institutions are required by Bacen to maintain Regulatory Capital (PR), Tier I and Principal Capital consistent with their risk activities, higher to the minimum requirement of the Regulatory Capital Requirement, represented by the sum of the partial credit risk, market risk and operational risk. | |||||||||||||||||||
As established by CMN Resolution 4,193/2013 the requirement for PR is 11% until December 31, 2015, from January 2016 the requirement is 9.875% plus 0.625% of conservation of capital, totaling 10.5% until December 2016, of which Tier I is 6% and the Main Capital is 4.5%. | |||||||||||||||||||
The index is calculated on a consolidated basis, as follows: | |||||||||||||||||||
|
|
|
|
|
|
|
|
|
|
|
| ||||||||
BASEL INDEX % |
|
|
|
|
|
|
| Dec/16 | Sep/16 |
| Jun/16 |
| Dec/15 | ||||||
Basel Index - consolidated |
|
|
|
|
|
|
|
|
|
|
| 16.30 | 17.60 |
| 17.71 |
| 15.72 | ||
2.6) Main Subsidiaries | |||||||||||||||||||
The table below presents the balances of total assets, net assets, net income and credit operations for the fiscal year ended December 31, 2016 the principal subsidiaries of Banco Santander portfolio: | |||||||||||||||||||
|
|
|
|
|
|
|
|
|
|
|
|
|
|
|
|
|
|
| |
SUBSIDIARIES |
|
|
|
|
|
|
| Total | Stockholders' Equity |
| Net Income (Loss) |
| Loan Portfolio (1) | ||||||
Santander Leasing S.A. Arrendamento Mercantil | 74,916.8 | 5,699.3 | 527.1 | 2,093.0 | |||||||||||||||
Aymoré Crédito, Financiamento e Investimento S.A. | 31,179.9 | 1,364.5 | 52.5 | 25,557.3 | |||||||||||||||
Santander Brasil, Establecimiento Financiero de Credito, S.A. | 2,810.2 | 2,552.6 | (142.4) | 1,269.6 | |||||||||||||||
Banco Olé Bonsucesso Consignado S.A. (Olé Consignado) | 7,665.0 | 676.1 | 13.6 | 7,354.3 | |||||||||||||||
Getnet Adquirência e Serviços para Meios de Pagamento S.A.(2) | 17,337.4 | 1,468.4 | 282.6 | 0.0 | |||||||||||||||
Banco PSA Finance Brasil S.A. | 2,011.0 | 276.1 | 5.8 | 1,827.2 | |||||||||||||||
Santander Corretora de Câmbio e Valores Mobiliários S.A |
|
|
|
|
|
|
| 929.1 | 557.7 |
| 106.1 |
| 0.0 | ||||||
(1) Includes Leasing portfolio and other credits. | |||||||||||||||||||
(2) In the third quarter of 2016, after Getnet got from the Bacen approval to act as a payment institution, the activities of acquiring, as well as their related assets and liabilities are now recorded in this entity. | |||||||||||||||||||
Balances reported above are in accordance with accounting practices established by Brazilian Corporate Law and standards established by the CMN, the Bacen and document template provided in the Accounting National Financial System Institutions (Cosif) and the CVM, that does not conflict with the rules of Bacen. | |||||||||||||||||||
3) Other Significant Events | |||||||||||||||||||
3.1) Corporate Restructuring | |||||||||||||||||||
The Bank implemented several social movements in order to reorganize the operations and activities of entities according to the business plan of the Banco Santander. | |||||||||||||||||||
a) Partnership Formation with the Hyundai Group in Brazil | |||||||||||||||||||
On April 28, 2016, the Aymoré CFI and Banco Santander entered into a transaction for the formation of a partnership with Hyundai Motor Brasil Montadora de Automóveis Ltda. (Hyundai Motor Brazil) and Hyundai Capital Services, Inc. (Hyundai Capital) for the constitution of Banco Hyundai Capital Brasil S.A. and an insurance brokerage company to provide, respectively, auto finance and insurance brokerage services and products to consumers and Hyundai dealerships in Brazil. The partnership capital structure will have a shareholding of 50% (fifty percent) of Aymoré, 25% (twenty five percent) of Hyundai Capital and 25% (twenty five percent) of Hyundai Motor Brazil. The closing of the transaction shall be subject to the fulfillment of certain conditions precedent usual in similar transactions, including obtaining the applicable regulatory approvals. | |||||||||||||||||||
b) Investment in the Company Super Pagamentos e Administração de Meios Eletrônicos LTDA. (“Super Pagamentos”) | |||||||||||||||||||
On October 3, 2014, Aymoré CFI signed an investment agreement ("Agreement") with a view to make an investment in Super Pagamentos, which shall result in the subscription and payment of new shares issued by Super Pagamentos, representing 50% of its total and voting capital. | |||||||||||||||||||
The closing of the operation held on December 12, 2014 and was subject to completion of certain conditions precedent set forth in the Agreement, including the prior approval of the Bacen (obtained on December 2, 2014). Aymoré CFI subscribed and paid share capital of Super Pagamentos in R$31 million, through the issuance of 20 million new common shares. Santander Conglomerate controls such company. | |||||||||||||||||||
On January 4, 2016, Aymoré CFI informed the owners of the shares representing the remaining 50% of Super Pagamentos´s total voting capital its Decision to exercise the call option for the acquisition of such shares, for a value of approximately R$113 million. The transaction was concluded on March 10, 2016. | |||||||||||||||||||
Before the event, qualified Aymoré as Company purchased the remaining equity instruments of Super Pagamentos entity and should therefore consider the paid value of goodwill for expected future profitability (goodwill) as a reduction of shareholders' equity, since, according to the IFRS 10 this transaction is characterized as transactions between partners. For the same reason, the amount paid for the equity value of the interest participation acquired from non-controlling shareholder is a movement among Stockholders' Equity accounts. | |||||||||||||||||||
c) Investment Agreement between Banco Santander and Banco Bonsucesso S.A. (Banco Bonsucesso) | |||||||||||||||||||
On July 30, 2014 Banco Santander, through its controlled company Aymoré CFI, and Banco Bonsucesso entered into an Investment Agreement whereby agreed to form an association in payroll credit card loan segment and payroll loans (Olé Consignado). | |||||||||||||||||||
On February 10, 2015, with the approval of the Bacen, the transaction was completed and Banco Santander, through Aymoré CFI, became the controlling shareholder of Olé Consignado, with 60% of the total and voting capital through an investment of R$460 million. Banco Bonsucesso remained with the remaining portion of the share capital (40%). | |||||||||||||||||||
In December 2015, it has completed the study of the allocation of the purchase price (Purchase Price Allocation - PPA) on the acquisition of Bonsucesso by Aymoré, based on acquisition date as below: | |||||||||||||||||||
|
|
|
|
|
|
|
|
|
|
|
|
|
|
|
|
|
|
|
|
| Book value | Fair value | |||||||||||||||||
| Available-for-Sale Financial Assets |
|
|
|
|
|
|
|
|
|
|
| 121 |
| 121 | ||||
| Loans and Receivables |
|
|
|
|
|
|
|
|
|
|
| 508 |
| 508 | ||||
| Others Assets |
|
|
|
|
|
|
|
|
|
|
| 374 |
| 374 | ||||
| Intangible Assets(1) |
|
|
|
|
|
|
|
|
|
|
| - |
| 63 | ||||
| Total assets |
|
|
|
|
|
|
|
|
|
|
| 1,004 |
| 1,066 | ||||
| Financial liabilities at amortized cost |
|
|
|
|
|
|
|
|
|
|
| 466 |
| 466 | ||||
| Others liabilities |
|
|
|
|
|
|
|
|
|
|
| 397 |
| 398 | ||||
| Total liabilities |
|
|
|
|
|
|
|
|
|
|
| 864 |
| 864 | ||||
| Capital increase by Aymoré CFI |
|
|
|
|
|
|
|
|
|
|
| 460 |
| 460 | ||||
| Total of net assets acquired |
|
|
|
|
|
|
|
|
|
|
| 600 |
| 662 | ||||
| Non-controlling interest(2) |
|
|
|
|
|
|
|
|
|
|
|
|
| 265 | ||||
| Total consideration transferred by Aymoré to acquire control |
|
|
|
|
|
|
|
|
|
| 460 | |||||||
| Goodwill(3) |
|
|
|
|
|
|
|
|
|
|
|
|
| 63 | ||||
(1) Intangible assets identified relate to brand and customer relationship with estimated useful life of 10 years and 4 years, respectively. | |||||||||||||||||||
(2) Amount of non-controlling interests were measured at R$240 million as the proportional value of the net assets of the investee. | |||||||||||||||||||
(3) Goodwill will be tax deductible under current legislation. | |||||||||||||||||||
Olé Consignado has become the exclusive vehicle of Banco Bonsucesso and its affiliates for the payroll credit supply in Brazil and should consolidate existing payroll loans at Banco Santander and Olé Consignado, in accordance with the association. Banco Santander will continue to originate from payroll loans through their own channels independently. | |||||||||||||||||||
In the operation context, it was granted between institutions a put option (right of Banco Bonsucesso to sell) and purchase (right of Banco Santander acquisition), relating to the shares held by Banco Bonsucesso, equivalent to 40% of capital of this company. According IAS 32, it was recognized a financial liability for the amount of R$307 million by the commitment made in relation to the put option, accounted in Shareholders' Equity, the amount of R$67 million and non-controlling interests, the amount of R$240 million. | |||||||||||||||||||
The EGM of March 3, 2016 approved the change of name from Banco Bonsucesso Consignado S.A. to Banco Olé Bonsucesso Consignado S.A., the change process has been approved by the Bacen on September 1, 2016. | |||||||||||||||||||
d) Sale of Santander Securities Services Brasil DTVM S.A. | |||||||||||||||||||
On September 19, 2014, preliminary documents were executed containing the main terms and conditions related to the sale of the operation of qualified custody business, currently performed by Banco Santander, and all of the shares issued by Santander Securities Services Brasil Distribuidora de Títulos e Valores Mobiliários S.A. | |||||||||||||||||||
On August 31, 2015 the sales transaction of the qualified custody business, with the sale of all shares of Santander Securities Services Brasil Distribuidora de Títulos e Valores Mobiliários S.A. to Santander Securities Services Brasil Participações S.A., indirectly controlled by Banco Santander Espanha, S.A. was concluded at the amount of R$859 million. | |||||||||||||||||||
The transaction generated a gain of R$751 before taxes, recorded in the 3rd quarter 2015 in the caption Result on disposal of assets not classified as non-current assets held for sale. | |||||||||||||||||||
The operation fits into the context of a global negotiation of the custody business, which involves, in addition to Brazil, the qualified custodian activity in Spain and Mexico. | |||||||||||||||||||
e) Agreement on the Acquisition, of part of the Financial Operation of PSA Group in Brazil and a Consequent Creation of a Joint Venture | |||||||||||||||||||
On August 1, 2016, after the fulfillment of the applicable conditions precedent, including obtaining the appropriate regulatory approvals, Aymoré CFI and Banco Santander, in the context of a partnership between the Banque PSA Finance ("Banque PSA") and Santander Consumer Finance in Europe for joint operation of the vehicle financing business of PSA brands (Peugeot, Citroën and DS), signed definitive documents for the formation of a financial cooperation with Banque PSA for offering a range of financial and insurance products to consumers and dealers of PSA in Brazil. | |||||||||||||||||||
The main vehicle of financial cooperation is Banco PSA Finance Brasil S.A. who is being held in the proportion of 50% by Aymoré CFI, a subsidiary of Banco Santander, and 50% by Banque PSA. The purchase price was equal to the book value (proportional) on the closing date (08/01/2016). The operation also included the acquisition by Banco Santander subsidiary, 100% of PSA Finance Arrendamento Mercantil S.A., whose price was equivalent to 74% of the equity value on the closing date, and also 50% of PSA Corretora de Seguros e Serviços Ltda., whose price was equal to the book value (proportional) on the closing date. | |||||||||||||||||||
Banco Santander started to consolidate these entities from August 1, 2016 | |||||||||||||||||||
i) Others Corporate Movements | |||||||||||||||||||
We also performed the following corporate actions: | |||||||||||||||||||
• On July 14, 2016, was completed the sale transaction of 100% of the shares representing the capital stock of Mantiq by Banco Santander and the Santander Participações to Angra Ventures Participações Ltda. | |||||||||||||||||||
• In June 2016 the holding in the iZettle S.A. Brazil was sold in its entirety. | |||||||||||||||||||
• On April 30, 2015, the merger and consequent extinction of the company Go Pay by Getnet it were formalized. | |||||||||||||||||||
• On March 23, 2015, Santander Participações S.A. sold all of its interest in the Special Purpose Companies Gestamp Eólica Serra de Santana S.A., Gestamp Eólica Paraíso S.A., Gestamp Eólica Lanchinha S.A., Gestamp Eólica Seridó S.A. e Gestamp Eólica Lagoa Nova S.A. to ICG do Brazil S.A., a company indirectly controlled by Santander Spain, in the total amount of R$120 million. | |||||||||||||||||||
• On March 23, 2015, Santander Participações S.A. sold its entire stake in Santos Energy Participações S.A. to Inversiones Global Capital, S.A., a company indirectly controlled by Santander Spain, in the total amount of R$127 million. | |||||||||||||||||||
4) Strategy | |||||||||||||||||||
Banco Santander is the only international bank with scale in the country. The Bank is convinced that the best way to grow in a recurring and sustainable manner is by providing excellent services to enhance the level of satisfaction and attract more customers, making them more engaged. The performance of Banco Santander is based on a close and lasting relationship with customers, suppliers and shareholders. To achieve that goal, the Bank strives to help people and businesses to prosper by being a Simple, Personal and Fair Bank, which is embodied by the following strategic priorities: | |||||||||||||||||||
• Increase customer preference and engagement by offering targeted, simple, digital, innovative and efficient products and services through a multi-channel platform; | |||||||||||||||||||
• Improve the recurrence and sustainability of results by growing in businesses with greater revenue diversification, aiming to strike a balance between credit, funding and services. At the same time, maintaining risk management and strict expenses control; | |||||||||||||||||||
• Be discipline with capital and liquidity to preserve solidity, face regulatory changes and seize growth opportunities; and | |||||||||||||||||||
• Increase productivity through an intense agenda of commercial improvements that enable the Bank to offer a complete portfolio of services | |||||||||||||||||||
In 2016, the highlight is the following advances: | |||||||||||||||||||
• Acceleration in the business transformation agenda: | |||||||||||||||||||
Digital Advances: New mobile banking functionalities have been implemented for individuals, with improved application evaluation (4.5 stars in the Apple Store and 4.2 in Google Play). A digital service channel for Van Gogh and Empresas I clients and expanded remote customer service for all Corporate and Global Corporate Banking (GCB) customers. The Banco Santander ends of the year with 6.3 million registrations in biometrics and an increase in digital transactions that went from 66% in 2015 to 73% of total bank transactions.Through e-commerce, product sales in digital channels tripled; | |||||||||||||||||||
Simplification of processes: through the "Certo" and "Clique Único" model, Bando Santander increased efficiency and commercial productivity, which enabled on the one hand, commercial managers to increase contact time with customers and, on the other hand, Experience in hiring some products. | |||||||||||||||||||
Retail innovations: "Santander Way", an application for card management, was developed and Banco Santander pioneered the provision of Samsung Pay customers. In addition, a business agreement with American Airlines was announced for card issuance and mileage accrual in order to provide customers with a better experience through one of the most recognized mileage programs on the market. On the acquiring side, Getnet's revenue continues with a strong growth pace, with a performance superior to that of the market. In 2016 Banco Santander increased the acceptance of flags and launched to the individual clients the "Account Connects with the Red", a current account option with a low cost POS. | |||||||||||||||||||
Actions to increase the presence of Banco Santander in the market: after one year of the acquisition of Banco Bonsucesso, the Olé Consignado brand was launched and the acquisition of 100% of the Super Account was completed. Banco Santander repositioned itself in the agribusiness segment, inaugurated the first agency focused on the segment and was recognized for the "Lide Agronegócios 2016" award. With the "Avançar" program, one of the offers of "Santander Negócios & Empresas", supported small and medium-sized clients in the pillars of development, internationalization and people management. In 2016 it had more than 338 thousand accesses in the program portal and was recognized by Euromoney as the best bank for this segment. | |||||||||||||||||||
• Strengthening performance in leading businesses: | |||||||||||||||||||
At Santander Financiamentos, Banco Santander remains the leader in vehicle financing, with a market share of 20%, according to data released by the Bacen. To strengthen its operations, a joint venture with Hyundai was created, the association with the PSA Bank was concluded and the new digital platform "+ negócios" was launched, a tool developed based on the best global practices, which digitalizes the entire customer experience, Strong business growth potential. | |||||||||||||||||||
In Global Corporate Banking, Banco Santander was recognized as the leader in financial advisory services for financing projects in Brazil, by ANBIMA and continues as a leader in the foreign exchange market, by the Bacen. In the ranking of M & A operations, it moved from 5th position in 2015 to 1 in 2016, according to Thomson Reuters. | |||||||||||||||||||
• Customer bonding: | |||||||||||||||||||
All of these factors were fundamental to a more positive momentum in our business and a 16.1% increase in the tied customer base, which totaled 3.7 million. | |||||||||||||||||||
• People: | |||||||||||||||||||
With the purpose of supporting people to prosper, the Santander Academy, a new training concept, was launched for employees. Also in 2016, Banco Santander was included in the ranking of "Best Companies to Work For", according to Great Place to Work (GPTW). | |||||||||||||||||||
• Sustainability: | |||||||||||||||||||
In 2016, Santander contributed significantly to the Santander Group's integration into the Dow Jones Sustainability Index (DJSI), reaching 6th place (11th in 2015) among the banks of a total of 316 Integrate the index. | |||||||||||||||||||
In terms of sustainability, Santander maintains a leading position among private banks in the Microcredit program. And in the segment of Universities, through the distribution of scholarships, contributes actively to the process of advancement of education in the Country. | |||||||||||||||||||
5) Rating Agencies | ||||||||||||||||||
Banco Santander is rated by international ratings agencies and the ratings assigned reflect many factors including management quality, operating performance and financial strength, as well as other factors related to the financial sector and economic environment in which the Bank is inserted, having the long-term foreign currency rating limited to the sovereign rating. The table below presents the ratings assigned by the rating agencies Standard & Poor's and Moody's: | ||||||||||||||||||
| ||||||||||||||||||
6) Corporate Governance | ||||||||||||||||||
The Board of Directors approved, in a meeting held on February 24, 2017, the Banco Santander's Consolidated Financial Statements for fiscal year ended December 31, 2016, prepared in accordance with the International Financial Reporting Standards (IFRS). | ||||||||||||||||||
The Board of Directors approved, in a meeting held on January 24, 2017, the Banco Santander's Consolidated Financial Statements for fiscal year ended December 31, 2016, prepared in accordance with the Brazilian accounting practices, applicable to financial institutions authorized to operate by Bacen. | ||||||||||||||||||
The Board of Directors approved, in a meeting held on December 29, 2016, the proposal for declaration and payment of (I) Dividends in the total amount of R$1,400 million, of which: (i) Interim amount of R$700 million, calculated based on the balance sheet of November 30th, 2016; and (ii) Intermediary amount of R$700 million, based on the dividend equalization reserve, and (II) Interest on Capital, in the gross amount of R$3,350 million. | ||||||||||||||||||
The Board of Directors, in a meeting held on December 15, 2016: (i) knew the resignation of Mr. Eduardo Nunes Gianini, of his position as member of the Remuneration Committee of the Banco Santander, according to the letter of resignation submitted to the Board of Directors; (ii) approved the appointment of Mr. Luiz Fernando Sanzogo Giorgi, as a member of the Remuneration Committee of the Company, for a complementary term of office, which shall be valid until the first Board of Directors’ Meeting after the 2017 Ordinary Shareholders’ Meeting take office; and (iii) knew the resignation of Mr. Mario Roberto Opice Leão of his position as officer without specific designation of the Banco Santander, in accordance with the letter of resignation presented to the Board of Directors. | ||||||||||||||||||
The Board of Directors approved, in a meeting held on November 3rd, 2016: (I) the election of Mr. Igor Mario Puga to compose the Banco Santander's Executive Board, for a complementary term of office, which shall be valid until the officers elected in the first Board of Directors’ Meeting after the 2017 Ordinary Shareholders’ Meeting take office, as Officer without specific designation and (II) the new buyback program of (i) Units, each representing one (1) common share and one (1) preferred share issued by the Banco Santander, or (ii) ADRs, by the Banco Santander or by its branch in Cayman, to be held in treasury or subsequently sold, pursuant to CVM Normative Instruction No. 567 of September 17th, 2015 (“CVM Instruction 567”). | ||||||||||||||||||
The Board of Directors approved, in a meeting held on October 25, 2016, the Banco Santander’s Consolidated Interim Financial Statements regarding the 3rd quarter ended September 30th, 2016, prepared in accordance with the Brazilian accounting practices, applicable to financial institutions authorized to operate by Bacen, as well as the Consolidated Interim Financial Statements prepared in accordance with the International Financial Reporting Standards (IFRS). | ||||||||||||||||||
The Board of Directors knew, in a meeting held on August 24, 2016, the resignation of Ms. Marília Artimonte Rocca as the Director member function of Board of Directors, the Compensation Committee and the Nominating Committee, Governance and Compliance of Banco Santander. | ||||||||||||||||||
The Board of Directors approved, in a meeting held on July 26, 2016, the Banco Santander's Consolidated Interim Financial Statements regarding the second quarter ended June 30th, 2016, prepared in accordance with the Brazilian accounting practices, applicable to financial institutions authorized to operate by Bacen, and the Consolidated Interim Financial Statements prepared in accordance with the International Financial Reporting Standards (IFRS) and the Consolidated Financial Statements of the Conglomerate Prudential. | ||||||||||||||||||
The Board of Directors approved, in a meeting held on June 29, 2016, the Declaration and payment of Interest on Equity, in the gross amount of R$500 million, which was paid on August 26, 2016, with no compensation of monetary restatement. | ||||||||||||||||||
The Board of Directors approved, in a meeting held on May 2, 2016, the election of Mr. Alexandre Silva D'Ambrósio to compose the Banco Santander's Board of Directors, to the position of Executive Vice President for a complementary term of office, which shall be valid until the officers elected in the first Board of Directors’ Meeting after the 2017 Ordinary Shareholders’ Meeting take office. | ||||||||||||||||||
The Board of Directors approved, in a meeting held on April 25, 2016, the Banco Santander's Consolidated Interim Financial Statements regarding the 1st quarter ended March 31, 2016, prepared in accordance with the Brazilian accounting practices, applicable to financial institutions authorized to operate by Bacen, as well as the Consolidated Interim Financial Statements prepared in accordance with the International Financial Reporting Standards (IFRS). | ||||||||||||||||||
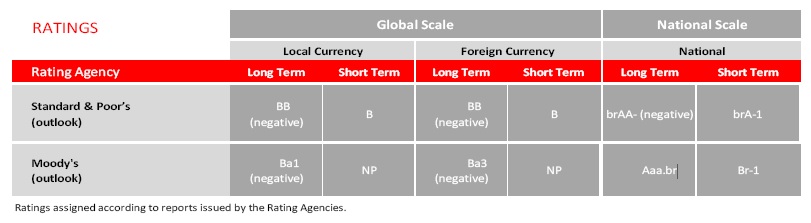
The Board of Directors approved in a meeting held on March 22, 2016: (i) the election of the Banco Santander's Audit Committee members, for a one (1) year term, which shall be postponed until the investiture of the members that shall be elected on the First Board of Directors’ meeting to be held after the Ordinary General Meeting of 2017, as follows: René Luiz Grande, reappointed as Coordinator; Luiz Carlos Nannini, as technical qualified member; and Elidie Palma Bifano, as member; and (ii) ratified (a) the current composition of the Nomination, Governance and Compliance Committee, as follows: Jesús Maria Zabalza Lotina, as Coordinator; Celso Clemente Giacometti and Marília Artimonte Rocca; and (b) the current composition of the Sustainability and Society Committee, as follows: Jesús Maria Zabalza Lotina, as Coordinator; José Luciano Duarte Penido, Gilberto Mifano and Viviane Senna Lalli. | |||||||||||||||||||
The Board of Directors approved in a meeting held on March 18, 2016, the hiring by Santander of the company PricewaterhouseCoopers Auditores Independentes, enrolled with Corporate Taxpayer Registry (CNPJ) 61.562.112/0001-20, and under Local Accounting Council Registry (ACR) 2SP000160/O-5 and registered with the CVM under Declaratory act 5.038 of September 8th, 1998, with headquarters at Av. Francisco Matarazzo, 1400, 9th, 10th and 13th to 17th floor, Torre Torino, Água Branca, São Paulo/SP, to act as independent audit company of Santander and of the companies part of Santander Conglomerate in Brazil, for 2016, 2017 and 2018 fiscal years, in replacement of Deloitte Touche Tohmatsu Auditores Independentes. | |||||||||||||||||||
The Board of Directors approved in a meeting held on February 26, 2016: (i) the Financial Statements by standard under International Accounting Standards (IFRS), issued by the International Accounting Standards Board (IASB) and interpretations of the IFRS Interpretations Committee (IFRS), referred to the fiscal year ended on December 31, 2015; and (ii) the Ombudsman Office Report regarding the second semester of 2015 and the corrective measures taken due to the complaints received, in order to comply with Resolution No. 4,433, of July 23, 2015, of the National Monetary Council. | |||||||||||||||||||
The Board of Directors approved, in a meeting held on January 26, 2016, the election of Mr. Marino Alexandre Calheiros Aguiar and Mario Roberto Opice Leão to compose the Banco Santander's Board of Directors, to the position of Officer without specific designation for a complementary term of office, which shall be valid until the officers elected in the first Board of Directors’ Meeting after the 2017 Ordinary Shareholders’ Meeting take office. | |||||||||||||||||||
7) Risk Management | |||||||||||||||||||
7.1) Corporate Governance of the Risk Function | |||||||||||||||||||
The organizational structure of the Executive Vice President of Risks, which is independent from commercial areas, is composed by areas responsible for the management of the financial and non-financial risks, with management segregated by segments (individuals retail, companies retail and wholesale). | |||||||||||||||||||
A specific Control and Risks Consolidation department has the mission to report a consolidated view of all risks to the local management and to the Group’s governance, as well as to improve risk appetite and risk assessment exercise (Risk Identification & Assessment). It is also responsible for developing the relationship with supervisors and regulators on risks subjects, altogether with Santander Risk Group, in Spain. It is supported by: Enterprise Risk Management, Credit Consolidation and control, model risks, non-financial risks and associate companies risk control. | |||||||||||||||||||
Another department includes a set of transverse functions (Governance, Policy, Risk Culture, Methodology, Stress Test, Capital and Risk MI) necessary for an advanced risk management model. | |||||||||||||||||||
The governance model is structured both in a vision of Decision, focusing on examination and approval of credit proposals and limits, as in the Control, aiming the full control of risks | |||||||||||||||||||
The fundamental principles that rule the risk governance model are: | |||||||||||||||||||
• Independence of the risks in relation to business area; | |||||||||||||||||||
• Involvement of management in Decision making; and | |||||||||||||||||||
• Collegiate Decisions and consensus on credit operations. | |||||||||||||||||||
The ERC - Executive Risk Committee is the local Decision-making forum with representatives of the Bank's management, including the CEO, Vice President and the other members of the Executive Board. | |||||||||||||||||||
The CCR - Risk Control Committee is the control and monitoring local forum with representatives of the Bank's management, including the VPE of risks and the Vice President of finance. | |||||||||||||||||||
The relevant issues of risk management or those that exceed the jurisdiction of these committees are forward and Decided by the Board of Directors. | |||||||||||||||||||
Further details of the structure, methodologies and control system related to risk management is described in the report available on the website www.santander.com.br. | |||||||||||||||||||
7.2) Structure of Capital Management | |||||||||||||||||||
The goal is to achieve an efficient capital structure, meeting the regulatory requirements and contributing to reach the goals regarding the classification of rating branches. The capital management including securitization, sale of assets, raising capital through shares issues, subordinated debt and hybrid instruments. | |||||||||||||||||||
The capital management seeks to optimize value creation in the Banco Santander and the different business units. To this end, capital management, Return on Risk Adjusted Capital (RORAC) and the creation of data values for each business unit are generated. The Banco Santander uses a measurement model of economic capital in order to ensure it has enough capital available to support the risks of economic activity in different scenarios, with solvency levels agreed by the Group. | |||||||||||||||||||
Projections of economic and regulatory capital are made based on financial projections (Balance Sheet, Income Statements, etc.) and macroeconomic scenarios estimated by the economic research service of the Financial Management area. The economic capital models are essentially designed to generate risk-sensitive estimates with two goals in mind: more precision in risk management and allocation of economic capital to various units of Banco Santander. | |||||||||||||||||||
7.3) Credit Risk | |||||||||||||||||||
The Credit Risk Management aims to supply subsidies to the definition of strategies, according to the risk appetite, in addition to setting limits, spanning the analysis and control of exposure and trends as well as the effectiveness of credit policies. The objective is to keep an appropriate risk profile and a minimum profitability that compensates the estimated default, both the client and the portfolio as defined the Executive Committee and Management Board. | |||||||||||||||||||
Risk Management specializes in the characteristics of the customers, as well as the process of risk management is segregated between individual customers (with monitoring of dedicated analysts) and customers with similar characteristics (standardized). | |||||||||||||||||||
7.4) Market Risk | |||||||||||||||||||
Market risk is exposure to risk factors including interest rates, exchange rates, commodities prices, stock market prices and other values, according to the type of product, the volume of operations, terms and conditions of the agreement and underlying volatility. market risk management includes practices of measuring and monitoring the use of limits that are pre-set by internal committees, of the value at risk of the portfolios, of sensitivity to fluctuating interest rates, of exposure to foreign exchange rates, of liquidity gaps, among other practices which the control and monitoring of the risks which might affect the position of Banco Santander portfolios in the different markets in which the Bank operates. | |||||||||||||||||||
For this the Bank, it has developed its own Risk Management model, the following principles: | |||||||||||||||||||
• Functional independence; | |||||||||||||||||||
• Executive capacity sustained by knowledge and customer proximity; | |||||||||||||||||||
• Global scope (different types of risk); | |||||||||||||||||||
• Collective Decisions that evaluate all possible scenarios and not compromise the results of individual Decisions, including Executive Risk Committee (ERC), which sets limits and approves the transactions and the Executive Committee of Assets and Liabilities, which is responsible for the management of capital and structural risks, which includes country risk, liquidity and interest rates; | |||||||||||||||||||
• Management and optimization of the risk/return; and | |||||||||||||||||||
• Advanced methodologies for risk management, such as Value at Risk (VaR) (historical simulation of 521 days, with a confidence level of 99% and a time horizon of one day), scenarios, sensitivity of net interest income, asset value and sensitivity contingency plan. | |||||||||||||||||||
The structure of market Risk is part of the Vice President of Risks, which implements the policies of risk. | |||||||||||||||||||
7.5) Environmental and Social Risk | |||||||||||||||||||
Social and environmental risk management for the wholesale banking customers is accomplished through a management system for customers who have credit limits or credit risk above R$1 million, which considers aspects such as contaminated land, deforestation, working conditions and other social and environmental points of attention in which there is possibility of penalties. A specialized team, with background in Biology, Geology, Health and Safety Engineering and Chemical Engineering, monitors the environmental practices of our wholesale clients. The financial analysis team studies the potential damage and impacts that adverse social and environmental situations may cause to the financial condition of customers and their guarantees. The analysis focuses on preserving capital and market reputation, and the dissemination of this practice is achieved by constant training of both commercial and risk areas on the application of social and environmental risk standards in the credit approval process for corporate client. | |||||||||||||||||||
The Bank's Social and Environmental Risk Policy is included under the Social and Environmental Responsibility Policy of the Bank, in accordance with Resolution 4,327 of CMN. | |||||||||||||||||||
7.6) Operational Risk Management, Internal Controls, Sarbanes-Oxley Act and Internal Audit | |||||||||||||||||||
The local corporative area, Non-Financial Risks, is responsible for implementing the Operational Risks and Internal Controls management of Banco Santander. It is subordinated to unit Control and Risk Consolidation and count with people, structure, standards, methodologies and tools for ensuring adequacy of the management and control model. | |||||||||||||||||||
Acts in preventing the operational risk and supports for the continued strengthening of the internal control system, attending the requirements of regulatory agencies, New Basel Agreement – BIS II and Sarbanes Oxley requirements and resolutions of the National Monetary Council. This model also follows the guidelines established by the Santander Spain based on COSO-Committee of Sponsoring Organizations of the Treadway Commission-Internal Control – Integrated Framework 2013. | |||||||||||||||||||
The management plays an active part, aligned with the mission of the areas, recognizing, participating and sharing responsibility for: the continuous improvements of the operational and technological risk management culture and structure; improvements in the internal control environment, in order to ensure compliance with the established objectives and goals and also the security and quality of the products and services provided. | |||||||||||||||||||
Banco Santander’s Board of Directors opted to adopt the Alternative Standardized Approach (ASA) to calculate the installment of Required Notional Equity related to operational risk. | |||||||||||||||||||
Additional information on the management models can be found in the annual and social reports on www.santander.com.br/ri. | |||||||||||||||||||
Internal Audit reports directly to the Board of Directors, whose activities are supervised by the Audit Committee. | |||||||||||||||||||
Internal Audit’s objective is to supervise the compliance, efficiency and effectiveness of internal control systems, as well as the reliability and quality of accounting information. Thus, all Banco Santander’s companies, business units, departments and core services are under its scope of application. The Internal Audit has quality certificate issued by the Institute of Internal Auditors (IIA). | |||||||||||||||||||
The Audit Committee and the Board of Directors were informed on Internal Audit’s works to be done during the year 2016, according to its annual plan. | |||||||||||||||||||
The Audit Committee favorably reviewed the annual work plan of the Internal Audit and approved of the activity report for the year 2016. | |||||||||||||||||||
In order to perform its duties and reduce coverage risks inherent to Conglomerate's activities, the Internal Audit area has internally-developed tools updated whenever necessary. | |||||||||||||||||||
Among these tools, it is worth mentioning the risk matrix, for it is used as a planning tool, prioritizing each unit’s risk level, based on, among others, its inherent risks, audit’s last rating, level of compliance with recommendations and size. | |||||||||||||||||||
Throughout the twelve months of 2016, internal control procedures and controls on information systems pertaining to units under analysis were assessed according to the work plan for 2016, taking into account their design and operating effectiveness. | |||||||||||||||||||
8) People | |||||||||||||||||||
When the discussion is about the growth and development of Banco Santander, a force stands out: the People. Having a motivated and dedicated employees is a Decisive factor in making the Bank in the best bank for customers and the best company for professionals. | |||||||||||||||||||
Professionals are the strongest link between the Bank and customers and so, day after day, Banco Santander enhances their management practices because knows only with engaged professional, motivated, well trained and with full professional development, the Bank will manage to get more and better customers, satisfied, proud to do business with us and the Santander brand. | |||||||||||||||||||
The daily performance of the Banco Santander with customers, employees, shareholders and society is guided by the purpose of the Bank to contribute to people and businesses to prosper and the way you act. | |||||||||||||||||||
The Bank has a talented and dedicated team of about 47,000 employees only in Brazil. The Bank seeks professionals who identify with the Corporate Culture, to be a Simple Bank (with uncomplicated and easy services to operate), Personal (with solutions and channels that meet costumers needs and preferences) and Fair (promoting business and relationships that are good for customers, shareholders and employees). In addition to identifying with the culture, our professionals act in their day to day aligned to it. | |||||||||||||||||||
9) Sustainable Development | |||||||||||||||||||
Sustainability is a strategic part of business, in Santander. It is a commitment that seeks results for business and society in a simple, personal and fair way, which is concretized through a strategy based in three pillars: Social and Financial Inclusion, Education and Social and Environmental Business and Management. Among the fourth quarter highlights of Social and Financial Inclusion are: Santander Microcredit, currently the largest productive and oriented microcredit operation among private banks in Brazil, offering credit and financial advice to low-income micro entrepreneurs and since 2002, it disbursed approximately R$3.8 billion for more than 394,000 customers, the 2016 edition of the "Parceiros em Ação" Program was launched, it promotes financial education and empowers entrepreneurs in the communities where Santander Microcredit operates. This year, 81 entrepreneurs were trained The "Amigo de Valor", program, which allows the Bank, as well as its employees and clients to direct part of their due income tax to the Funds for the Rights of Children and Adolescents, in 2016 directed R$10,583 million for 38 projects distributed in Brazil. Through the corporate program of Volunteer "Escola Brasil" Program 6,049 employees acted as volunteers mobilizing 95,746 people in 438 actions carried out supporting 183 public schools. In relation to the second pillar, Education, the Bank has partnerships with 389 higher education institutions, since 2005 Santander Universidades Brazil has granted over 148,000 scholarships. In the third Pillar, Social and environmental business and management, since 2013, Santander Financiamentos through the CDC Energy Efficiency of Equipment, finances photovoltaic solar energy systems (direct conversion of solar energy into electricity). In 2016, 149 partners with a business turnover above R$19,7 million were accredited. In the “Agro Sustentável” program, Santander currently increased 1,000 customers, more than 220 employers and outsourced firms were trained or sensitized in relation to ERR (Environmental Rural Register) and other socio and environmental issues and 251 customers agreed to participate in the agreement with Coopercitrus and Bayer (Cooperatives). | |||||||||||||||||||
10) Other Information | |||||||||||||||||||
It is part of Banco Santander´s policy to restrict the services provided by the independent auditors, so as to preserve the auditor’s independence and objectivity, in accordance with Brazilian and international standards, which provides the necessity of approval of any services by the Audit Committee of the Bank. | |||||||||||||||||||
In compliance with CVM Instruction 381/2003, we hereby inform that in the fiscal year ended on December 31, 2016, were provided non-audit services of the financial statements by PricewaterhouseCoopers, which cumulatively represent more than 5% of the related overall audit fee consideration, are these: | |||||||||||||||||||
|
|
|
|
|
|
|
|
|
|
|
|
|
|
|
|
|
|
|
|
Description of services | |||||||||||||||||||
Review of the Debt Program Global Medium Term Notes. | |||||||||||||||||||
Financial and Fiscal Due Diligence. | |||||||||||||||||||
*Additional services totaled R$736 thousand reais, representing 6.15% of total remuneration. | |||||||||||||||||||
In addition, the Bank confirms that PricewaterhouseCoopers has procedures, policies and controls to ensure its independence, including the review of work performed, including any services other than external audit. This evaluation is based on the applicable regulations and accepted principles that preserve the independence of the auditor: (i) the auditor should not audit their own work; (ii) the auditor should not perform management functions; and (iii) the auditor should not promote the interests of his client. Acceptance and professional services not related to external audit for the fiscal year ended December 31, 2016 did not affect the independence and objectivity in the conduct of external audit examinations of the Banco Santander and other Group entities, since the principles above were observed. | |||||||||||||||||||
The Board of Directors | |||||||||||||||||||
(Authorized at the Meeting of the Board of February 24, 2017). | |||||||||||||||||||
*** | |||||||||||||||||||
BANCO SANTANDER (BRASIL) S.A. | ||||||||
Executives' Report on the Financial Statements | ||||||||
In order to comply with article 25, § 1º, item VI, of the Brazilian Securities and Exchange Commission (CVM) Instruction n°. 480, of December 7, 2009, members of the Executive Board of Banco Santander (Brasil) S.A. (Banco Santander or Company) declare that discussed, reviewed and agreed with the Banco Santander´s Financial Statements in accordance with International Financial Reporting Standards (IFRS) criteria for the period ended December 31, 2016 and the documents that compose them, as follows: Management Report, consolidated balance sheet, consolidated statement of income, comprehensive income, consolidated statement of cash flows, consolidated statement of changes in equity and related notes, which were prepared in accordance with IFRS issued by the International Accounting Standards Board ( IASB ). These financial statements and the documents that compose them were the subject of unqualified opinions by the Independent Auditors and the Company's Audit Committee. | ||||||||||||||||
Members of Companies’ Executive on December 31, 2016: | ||||||||||||||||
CEO | ||||||||||||||||
Sergio Agapito Lires Rial | ||||||||||||||||
Vice-President Senior Executive Officers | ||||||||||||||||
Conrado Engel | ||||||||||||||||
José de Paiva Ferreira | ||||||||||||||||
Vice-President Executive Officer and Investor Relations | ||||||||||||||||
Angel Santodomingo Martell | ||||||||||||||||
Vice-President Executive Officers | ||||||||||||||||
Alexandre Silva D'Ambrósio | ||||||||||||||||
Antonio Pardo de Santayana Montes | ||||||||||||||||
Carlos Rey de Vicente | ||||||||||||||||
Jean Pierre Dupui | ||||||||||||||||
João Guilherme de Andrade So Consiglio | ||||||||||||||||
Juan Sebastian Moreno Blanco | ||||||||||||||||
Manoel Marcos Madureira | ||||||||||||||||
Vanessa de Souza Lobato Barbosa | ||||||||||||||||
Executive Officers | ||||||||||||||||
Jose Alberto Zamorano Hernandez | ||||||||||||||||
José Roberto Machado Filho | ||||||||||||||||
Maria Eugênia Andrade Lopez Santos | ||||||||||||||||
Officers Without Designation | ||||||||||||||||
Alexandre Grossmann Zancani | ||||||||||||||||
Amancio Acúrcio Gouveia | ||||||||||||||||
Ana Paula Nader Alfaya | ||||||||||||||||
André de Carvalho Novaes | ||||||||||||||||
Cassio Schmitt | ||||||||||||||||
Cassius Schymura | ||||||||||||||||
Ede Ilson Viani | ||||||||||||||||
Felipe Pires Guerra de Carvalho | ||||||||||||||||
Flávio Tavares Valadão | ||||||||||||||||
Gilberto Duarte de Abreu Filho | ||||||||||||||||
Igor Mario Puga (*) | ||||||||||||||||
Luis Guilherme Mattos de Oliem Bittencourt | ||||||||||||||||
Luiz Masagão Ribeiro Filho | ||||||||||||||||
Marcelo Malanga | ||||||||||||||||
Marcelo Zerbinatti | ||||||||||||||||
Marcio Aurelio de Nobrega | ||||||||||||||||
Marino Alexandre Calheiros Aguiar | ||||||||||||||||
Mário Adolfo Libert Westphalen | ||||||||||||||||
Nilton Sergio Silveira Carvalho | ||||||||||||||||
Rafael Bello Noya | ||||||||||||||||
Ramón Sanchez Díez | ||||||||||||||||
Reginaldo Antonio Ribeiro | ||||||||||||||||
Roberto de Oliveira Campos Neto | ||||||||||||||||
Robson de Souza Rezende | ||||||||||||||||
Ronaldo Wagner Rondinelli | ||||||||||||||||
Sérgio Gonçalves | ||||||||||||||||
Thomas Gregor Ilg | ||||||||||||||||
Ulisses Gomes Guimarães | ||||||||||||||||
(*) Pending approval by Bacen. | ||||||||||||||||
BANCO SANTANDER (BRASIL) S.A. | ||||||||
Executives' Report of Independent Auditors' Report | ||||||||
In order to comply with article 25, § 1º, item V, of the Brazilian Securities and Exchange Commission (CVM) Instruction n°. 480, of December 7, 2009, members of the Executive Board of Banco Santander (Brasil) S.A. (Banco Santander or Company) declare that discussed, reviewed and agreed with the opinions expressed in the Banco Santander´s Independent Auditors´Report for the Financial Statements in accordance with International Financial Reporting Standards (IFRS) criteria for the period ended December 31, 2016 and the documents that compose them, as follows: Management Report, consolidated balance sheet, consolidated statement of income, comprehensive income, consolidated statement of cash flows, consolidated statement of changes in equity and related notes, which were prepared in accordance with IFRS issued by the International Accounting Standards Board ( IASB ). These financial statements and the documents that compose them were the subject of unqualified opinions by the Independent Auditors and the Company's Audit Committee. | ||||||||||||||||
Members of Companies’ Executive on December 31, 2016: | ||||||||||||||||
CEO | ||||||||||||||||
Sergio Agapito Lires Rial | ||||||||||||||||
Vice-President Senior Executive Officers | ||||||||||||||||
Conrado Engel | ||||||||||||||||
José de Paiva Ferreira | ||||||||||||||||
Vice-President Executive Officer and Investor Relations | ||||||||||||||||
Angel Santodomingo Martell | ||||||||||||||||
Vice-President Executive Officers | ||||||||||||||||
Alexandre Silva D'Ambrósio | ||||||||||||||||
Antonio Pardo de Santayana Montes | ||||||||||||||||
Carlos Rey de Vicente | ||||||||||||||||
Jean Pierre Dupui | ||||||||||||||||
João Guilherme de Andrade So Consiglio | ||||||||||||||||
Juan Sebastian Moreno Blanco | ||||||||||||||||
Manoel Marcos Madureira | ||||||||||||||||
Vanessa de Souza Lobato Barbosa | ||||||||||||||||
Executive Officers | ||||||||||||||||
Jose Alberto Zamorano Hernandez | ||||||||||||||||
José Roberto Machado Filho | ||||||||||||||||
Maria Eugênia Andrade Lopez Santos | ||||||||||||||||
Officers Without Designation | ||||||||||||||||
Alexandre Grossmann Zancani | ||||||||||||||||
Amancio Acúrcio Gouveia | ||||||||||||||||
Ana Paula Nader Alfaya | ||||||||||||||||
André de Carvalho Novaes | ||||||||||||||||
Cassio Schmitt | ||||||||||||||||
Cassius Schymura | ||||||||||||||||
Ede Ilson Viani | ||||||||||||||||
Felipe Pires Guerra de Carvalho | ||||||||||||||||
Flávio Tavares Valadão | ||||||||||||||||
Gilberto Duarte de Abreu Filho | ||||||||||||||||
Igor Mario Puga (*) | ||||||||||||||||
Luis Guilherme Mattos de Oliem Bittencourt | ||||||||||||||||
Luiz Masagão Ribeiro Filho | ||||||||||||||||
Marcelo Malanga | ||||||||||||||||
Marcelo Zerbinatti | ||||||||||||||||
Marcio Aurelio de Nobrega | ||||||||||||||||
Marino Alexandre Calheiros Aguiar | ||||||||||||||||
Mário Adolfo Libert Westphalen | ||||||||||||||||
Nilton Sergio Silveira Carvalho | ||||||||||||||||
Rafael Bello Noya | ||||||||||||||||
Ramón Sanchez Díez | ||||||||||||||||
Reginaldo Antonio Ribeiro | ||||||||||||||||
Roberto de Oliveira Campos Neto | ||||||||||||||||
Robson de Souza Rezende | ||||||||||||||||
Ronaldo Wagner Rondinelli | ||||||||||||||||
Sérgio Gonçalves | ||||||||||||||||
Thomas Gregor Ilg | ||||||||||||||||
Ulisses Gomes Guimarães | ||||||||||||||||
(*) Pending approval by Bacen. | ||||||||||||||||
Banco Santander (Brasil) S.A. | ||
| By: | /S/ Amancio Acurcio Gouveia | |
Amancio Acurcio Gouveia Officer Without Specific Designation | ||
| By: | /S/ Carlos Rey de Vicenti | |
Carlos Rey de Vicenti Vice - President Executive Officer | ||