SECURITIES AND EXCHANGE COMMISSION
Commission File Number: 001-34476
Bloco A – Vila Olimpia
São Paulo, SP 04543-011
Federative Republic of Brazil
Indicate by check mark if the registrant is submitting the Form 6-K in paper as permitted by Regulation S-T Rule 101(b)(1):
Yes _______ No ___X____
Indicate by check mark if the registrant is submitting the Form 6-K in paper as permitted by Regulation S-T Rule 101(b)(7):
Yes _______ No ___X____
Indicate by check mark whether by furnishing the information contained in this Form, the Registrant is also thereby furnishing the information to the Commission pursuant to Rule 12g3-2(b) under the Securities Exchange Act of 1934:
Yes _______ No ___X____
If “Yes” is marked, indicate below the file number assigned to the registrant in connection with Rule 12g3-2(b): N/A
(Free Translation into English from the Original Previously Issued in Portuguese) | |
BANCO SANTANDER (BRASIL) S.A. AND SUBSIDIARIES | |
(Free Translation into English from the Original Previously Issued in Portuguese) | |
BANCO SANTANDER (BRASIL) S.A. AND SUBSIDIARIES | |
Dear Stockholders: | ||||||||||||||||
We present the Management Report to Individual and Consolidated Financial Statements of Banco Santander (Brasil) S.A. (Banco Santander or Bank) related to the fiscal year ended December 31, 2017, prepared in accordance with accounting practices set by Brazilian Corporate Law, the standards of the National Monetary Council (CMN), the Central Bank of Brazil (Bacen) and document template provided by the Accounting National Financial System Institutions (Cosif) and the Brazilian Exchange Commission (CVM), that does not conflict with the rules issued by Bacen. | ||||||||||||||||
The consolidated financial statements in accordance with the International Accounting Standards Board (IASB) for the fiscal year ended December 31, 2017, will be disclosed within the legal deadline, on the website www.santander.com.br/ri. | ||||||||||||||||
1) Macroeconomic Environment | ||||||||||||||||
Banco Santander sees 2018 as a year of great opportunity for Brazil. The country is experiencing an important moment in terms of macroeconomic conditions. Fundamentals related to external accounts, inflation and interest rates have rarely been so benign in the history of the Brazilian economy. The only significant disadvantage, in Santander's opinion, is the fiscal imbalance. Thus, Banco Santander expects a broad space for economic growth above its potential in 2018 and 2019, and without inflationary pressure derived from domestic demand, due to the still high idleness in the local scenario. | ||||||||||||||||
Regarding the main economic indicators, Banco Santander highlights the growth of 1.4% of the Brazilian GDP in the third quarter of 2017, when compared to the same period of 2016. The improvement on the domestic activity is proving increasingly widespread among sectors, boosted by the effects of monetary easing (reductions in interest rates) and a moderate recovery on the labor market. As a result, the Bank expects real GDP growth of 1.0% in 2017 and 3.2% in 2018 and 2019 (more optimistic figures than the market consensus, currently at 1.0%, 2.7% and 2.8%, respectively). In addition, inflation keeps controlled, consolidating an unprecedented situation in 2017: not only the Extended Consumer Price Index (IPCA) (official inflation measure) closed the year below the target of 4.5% it was also below the minimum rate of the tolerance range (3.0%) for the first time in history and ended the year of 2017 with an increase of 2.95%. Some factors contributed to this result: on one hand, the successful efforts of the Bacen and the economic team, which allowed monetary policy to gain credibility and efficiency over the last year and a half; on the other hand, a contribution of factors that were not under the control of the monetary authority, such as the strong expansion of the agricultural crop, which generated food deflation (-4.9%) in 2017. For 2018, Banco Santander projects an increase of 3.8% in the IPCA, still lower than the target. Among these, it is worth pointing out the deflation in food prices, which was responsible for most of the inflationary surprises this year; in fact, the decline of around -4.9% in the food group in 2017 represents the biggest drop since the implementation of the inflation targeting regime implemented in 1999. Looking ahead, the Bank believes that the IPCA and its main core inflation factors will remain comfortably below the inflation target in 2018 and 2019, as a reflection of (i) the economy's high idleness; (ii) weak inertia; and (iii) great credibility of the monetary authority. | ||||||||||||||||
In Banco Santander's opinion, this favorable inflation situation opens the way for the Copom - Monetary Policy Committee - to reduce the Selic rate to levels below 7.0% p.y, meaning a scenario with the lowest interest rates in the recent 60 years, keeping such levels until the beginning of 2019. By the way, the Copom proceeded as expected in the last monetary policy decision of 2017 (held on December 5 and 6), cutting the basic interest rate by 50 basis points, basis from 7.50% p.y to 7.00% p.y, and signaling, according to Banco Santander's view, that an additional cut of 25 basis points at the next meeting (scheduled for February 6 and 7, 2018) is the most likely scenario. As a result, the Bank continues to project the Selic rate at 6.75% p.y in 2018. | ||||||||||||||||
These low interest rates are expected to promote an accelerated expansion of domestic demand for next year, both by rising household consumption (by greater magnitude) and the resumption of investments. Meanwhile, the interest rate curve is likely to remain steep, given to not only the cyclical nature of economic policy but also uncertainties about international interest rates and local elections in 2018 (and their effects on reforms and fiscal solvency). In this sense, the Bank believes that, like the long part of the interest curve, the exchange rate should also reflect the change in perception on the international and political scenarios; but volatility aside, the Bank projects only a slight depreciation of the exchange rate in the coming quarters (Banco Santander's forecast is R$/US$3.50 at the end of 2018). | ||||||||||||||||
Another important news is the Brazilian government's new attempt to approve the pension reform. In summary, the government agreed to relax some of the conditions established in the original proposal, as well as leave some aspects for further discussion; however, central points of the reform were maintained, namely: (i) minimum retirement age for all workers and (ii) convergence of civil servants' benefits to the same limit imposed to private sector beneficiaries, in both cases with a gradual transition rule. According to the Bank's calculations, the new text would preserve about 60 percent of the estimated savings from the broader and deeper reform proposed by the government a year ago. However, Banco Santander remains skeptical about the approval of the pension reform in the Chamber of Deputies in 2018, taking into consideration the great challenge of the government to gather 308 (out of a total of 513) votes in favor. | ||||||||||||||||
The presidential elections to be held on this year will be important for the discussion on whether or not there will be an economic agenda focused on adjusting fiscal accounts and approving structural reforms, and thus on building a macroeconomic environment with sustainable growth long-term. | ||||||||||||||||
2) Performance | ||||||||||||||||
2.1) Corporate Net Income | �� | |||||||||||||||
CONSOLIDATED INCOME STATEMENTS |
| 12M17 |
| 12M16 |
| annual changes % |
| 4Q17 |
| 3Q17 |
| 4Q17 vs. 3Q17 | ||||
Financial Income |
|
|
| 76,310.8 |
| 85,909.6 |
| -11.2 |
| 16,558.6 |
| 20,025.5 |
| -17.3 | ||
Financial Expenses | (49,363.7) | (59,111.7) | -16.5 | (10,928.6) | (11,239.1) | -2.8 | ||||||||||
Gross Profit From Financial Operations(1) | 26,947.1 | 26,797.9 | 0.6 | 5,630.0 | 8,786.4 | -35.9 | ||||||||||
Other Operating (Expenses) Income(2) | (13,559.1) | (13,018.9) | 4.1 | (3,068.2) | (4,066.4) | -24.5 | ||||||||||
|
| |||||||||||||||
Operating Income | 13,388.0 | 13,778.9 | -2.8 | 2,561.8 | 4,720.1 | -45.7 | ||||||||||
|
| |||||||||||||||
Non-Operating Income(3) | (259.6) | (415.6) | -37.5 | 53.0 | (34.5) | -253.6 | ||||||||||
|
| |||||||||||||||
Income Before Taxes on Income and Profit Sharing | 13,128.4 | 13,363.3 | -1.8 | 2,614.8 | 4,685.5 | -44.2 | ||||||||||
|
| |||||||||||||||
Income Tax and Social Contribution(1) | (3,278.3) | (6,496.7) | -49.5 | 333.7 | (2,343.1) | -114.2 | ||||||||||
Profit Sharing | (1,460.0) | (1,208.8) | 20.8 | (357.2) | (437.8) | -18.4 | ||||||||||
Non-Controlling Interest(4) | (393.5) | (124.8) | 215.3 | (93.2) | (109.9) | -15.1 | ||||||||||
|
| |||||||||||||||
Consolidated Net Income | 7,996.6 | 5,533.0 | 44.5 | 2,498.1 | 1,794.7 | 39.2 | ||||||||||
|
| |||||||||||||||
Excludes goodwill amortizations expenses(5) | 1,534.7 | 1,805.6 | -15.0 | 166.2 | 457.1 | -63.6 | ||||||||||
|
| |||||||||||||||
Net Income Excluding Goodwill Amortization |
|
|
| 9,531.3 |
| 7,338.6 |
| 29.9 |
| 2,664.2 |
| 2,251.7 |
| 18.3 | ||
For a better understanding of the results in BRGAAP, below is the Gross Profit from Financial Operations, disregarding the hedge effect (according to item 1): | ||||||||||||||||
ADJUSTED GROSS PROFIT FROM FINANCIAL OPERATIONS |
| 12M17 |
| 12M16 |
| annual changes % |
| 4Q17 |
| 3Q17 |
| 4Q17 vs. 3Q17 | ||||
Operating Income |
|
|
| 26,947.1 |
| 26,797.9 |
| 0.6 |
| 5,630.0 |
| 8,786.4 |
| -35.9 | ||
Income Tax and Social Contribution (hedge) | 730.1 | (6,058.0) | -112.1 | 1,326.5 | (1,226.5) | -208.2 | ||||||||||
Adjusted Gross Profit From Financial Operations |
|
|
| 27,677.2 |
| 20,739.9 |
| 33.4 |
| 6,956.5 |
| 7,559.9 |
| -8.0 | ||
INCOME TAX AND SOCIAL CONTRIBUITION |
| 12M17 |
| 12M16 |
| annual changes % |
| 4Q17 |
| 3Q17 |
| 4Q17 vs. 3Q17 | ||||
Income Tax and Social Contribution |
|
|
| (3,278.3) |
| (6,496.7) |
| -49.5 |
| 333.7 |
| (2,343.1) |
| -114.2 | ||
Income Tax and Social Contribution (hedge) | (730.1) | 6,058.0 | -112.1 | (1,326.5) | 1,226.5 | -208.2 | ||||||||||
Adjusted Income Tax and Social Contribution |
|
|
| (4,008.4) |
| (438.7) |
| 813.9 |
| (992.8) |
| (1,116.6) |
| -11.2 | ||
1) Foreign Exchange Hedge of the Grand Cayman Branch and the Subsidiary Santander Brasil EFC | ||||||||||||||||
Banco Santander operates a branch in the Cayman Islands and a subsidiary called Santander Brasil Establecimiento Financiero de Credito, EFC, or “Santander Brasil EFC” (subsidiary in Spain) which are used, mainly, to raise funds in the capital and financial foreign markets, providing credit lines that are extended to clients for trade-related financings and working capital. To protect the exposures to foreign exchange rate variations, the Bank uses derivatives. According to Brazilian tax rules, the gains or losses resulting from the impact of appreciation or depreciation of the local currency (Real) in foreign investments are nontaxable to PIS/Cofins/IR/CSLL, while gains or losses from derivatives used as hedges are taxable or deductible. The purpose of these derivatives are to protect the after-tax net income. | ||||||||||||||||
The different tax treatment of such foreign exchange rate differences results in a volatility on the operational earnings or losses and on the gross revenue tax expense (PIS/Cofins) and income taxes (IR/CSLL), as demonstrated below: | ||||||||||||||||
FOREIGN EXCHANGE HEDGE OF THE GRAND CAYMAN BRANCH |
| 12M17 |
| 12M16 |
| annual changes % |
| 4Q17 |
| 3Q17 |
| 4Q17 vs. 3Q17 | ||||
Exchange Variation |
|
|
| 892.9 |
| (7,408.2) |
| -112.1 |
| 1,621.9 |
| (1,499.2) |
| -208.2 | ||
Derivative Financial Instruments | (1,702.6) | 14,123.4 | -112.1 | (3,092.6) | 2,858.6 | -208.2 | ||||||||||
Income Tax and Social Contribution | 730.1 | (6,058.0) | -112.1 | 1,326.5 | (1,226.5) | -208.2 | ||||||||||
PIS/Cofins |
|
|
|
|
| 80.2 |
| (656.8) |
| -112.2 |
| 144.8 |
| (132.9) |
| -209.0 |
2) Other Operating (Expenses) Income | ||||||||||||||||
Fees - Income from Services Rendered and Banking Fees grew, mainly, due to the higher transactionality. This was due to: (a) credit/debit card commission and Acquirer Services, on December 31, 2017, a growth of 22.3% in 12 months, due to higher sales volume; (b) current account service, an increase of 12.3% in 12 months, influenced by the increase in customer bonding, higher transactionality and product realignment; and (c) insurance fees, an increase of 13.8% in 12 months, due to the expansion of the product portfolio and growth of the lending product, which accompanies the credit dynamics. | ||||||||||||||||
Fees |
| 12M17 |
| 12M16 |
| annual changes % |
| 4Q17 |
| 3Q17 |
| 4Q17 vs. 3Q17 | ||||
Cards (Debit and Credit) and Acquiring Services |
|
|
| 4,939.9 |
| 4,038.5 |
| 22.3 |
| 1,394.4 |
| 1,233.5 |
| 13.0 | ||
Checking Account Services | 2,908.3 | 2,589.9 | 12.3 | 763.8 | 746.5 | 2.3 | ||||||||||
Insurance Fees |
|
|
|
|
| 2,515.9 |
| 2,210.6 |
| 13.8 |
| 721.3 |
| 580.8 |
| 24.2 |
General Expenses - The total of general expenses including personnel expenses, other administrative expenses and profit sharing expenses, excluding the effects of goodwill amortization, increased 5.3% in 12 months, while personnel and profit sharing expenses increased 3.3% and other administrative expenses increased 7.2%, in the same comparison period. The increase in personnel expenses was mainly influenced by higher compensation expenses, due to the incentive to meritocracy aligned with the performance of the business. Expenses were also impacted by collective agreement, which occurred in December 2017. The increase in administrative expenses was mainly due to promotions and publicity, due to the greater commercial actions in the period and data processing, due to the additional expenses of technology, resulting from the resizing of the new level of transactions. | ||||||||||||||||
General Expenses |
| 12M17 |
| 12M16 |
| annual changes % |
| 4Q17 |
| 3Q17 |
| 4Q17 vs. 3Q17 | ||||
Personnel Expenses |
|
|
| (9,091.5) |
| (8,803.5) |
| 3.3 |
| (2,366.6) |
| (2,319.3) |
| 2.0 | ||
Other Administrative Expenses | (10,189.9) | (9,503.4) | 7.2 | (2,825.1) | (2,591.7) | 9.0 | ||||||||||
General Expenses, excluding the effects of goodwill amortization |
| (19,281.4) |
| (18,306.9) |
| 5.3 |
| (5,191.8) |
| (4,911.0) |
| 5.7 | ||||
3) Operating Income | ||||||||||||||||
In the fiscal year of 2017, includes expenses of R$42 million related to the sale of BW Guirapá I S.A. (according to item 3.2), R$272 million of provisions for devaluations on real estate, constituted from appraisal reports prepared by specialized external consulting and on December 31, 2016, includes the amount of R$450 million, related to the establishment of the Efficiency and Productivity Fund, which was not necessary in 2017. | ||||||||||||||||
4) Non-Controlling Interest | ||||||||||||||||
The increase was mainly due to the growth in the results of the subsidiaries Banco RCI, Olé, Getnet and entities that also hold the non-controlling interest of the Banco Santander's external partners. | ||||||||||||||||
5) Goodwill Amortization Expenses | ||||||||||||||||
The variation was due to the amortization of Banco Real's acquisition goodwill, completed in October 2017. | ||||||||||||||||
2.2) Assets and Liabilities | ||||||||||||||||
CONSOLIDATED BALANCE SHEETS |
|
|
|
|
| Dec/17 |
| Dec/16 |
| annual changes % |
| Sep/17 |
| Sep/17 vs. Dec/17 | ||
Current and Long-Term Assets |
|
|
|
|
| 672,560.6 |
| 688,673.4 |
| -2.3 |
| 664,984.2 |
| 1.1 | ||
Permanent Assets | 11,171.6 | 13,031.1 | -14.3 | 11,784.2 | -5.2 | |||||||||||
TOTAL ASSETS | 683,732.2 | 701,704.5 | -2.6 | 676,768.5 | 1.0 | |||||||||||
|
| |||||||||||||||
Current and Long-Term Liabilities | 621,824.2 | 640,842.7 | -3.0 | 611,636.8 | 1.7 | |||||||||||
Deferred Income | 511.4 | 564.6 | -9.4 | 505.5 | 1.2 | |||||||||||
Non-Controlling Interest | 1,896.7 | 2,525.7 | -24.9 | 2,267.6 | -16.4 | |||||||||||
|
| |||||||||||||||
Stockholders' Equity | 59,500.0 | 57,771.5 | 3.0 | 62,358.6 | -4.6 | |||||||||||
|
| |||||||||||||||
TOTAL LIABILITIES AND STOCKHOLDERS' EQUITY |
|
|
| 683,732.2 |
| 701,704.5 |
| -2.6 |
| 676,768.5 |
| 1.0 | ||||
Total assets are mainly represented: | ||||||||||||||||
(R$ Millions) |
|
|
|
|
|
|
| Dec/17 |
| Dec/16 |
| annual changes % |
| Sep/17 |
| Sep/17 vs. Dec/17 |
Loan Portfolio |
|
|
|
|
|
|
| 272,562.2 |
| 256,882.9 |
| 6.1 |
| 262,964.7 |
| 3.6 |
Securities and Derivative Financial Instruments(1) | 171,729.7 | 169,589.7 | 1.3 | 182,557.1 | -5.9 | |||||||||||
Interbank Investments | 46,760.7 | 59,669.2 | -21.6 | 49,963.2 | -6.4 | |||||||||||
Interbank Accounts |
|
|
|
|
| 82,503.8 |
| 62,900.2 |
| 31.2 |
| 68,276.8 |
| 20.8 | ||
(1) Given the provisions of Circular Bacen 3,068/2001, Banco Santander has the financial capacity and intention to hold to maturity, securities classified as held-to-maturity, in the amount of R$9,579.0 million on Dec 31, 2017 (12/31/2016 - R$9,388.4 million). | ||||||||||||||||
2.3) Loan Portfolio | ||||||||||||||||
MANAGEMENT DISCLOSURE OF LOAN PORTFOLIO BY SEGMENT |
|
|
|
|
| Dec/17 |
| Dec/16(2) |
| annual changes % |
| Sep/17 |
| Sep/17 vs. Dec/17 | ||
Individuals(1) |
|
|
|
|
|
|
| 108,115.3 | 91,414.3 | 18.3 | 102,263.2 | 5.7 | ||||
Consumer Finance | 41,884.4 | 34,777.1 | 20.4 | 39,178.0 | 6.9 | |||||||||||
Small and Medium-sized Entities | 34,287.7 | 32,798.8 | 4.5 | 32,944.6 | 4.1 | |||||||||||
Large-sized Entity | 88,274.9 | 97,892.8 | -9.8 | 88,578.9 | -0.3 | |||||||||||
Total Loan portfolio (gross) | 272,562.3 | 256,883.0 | 6.1 | 262,964.7 | 3.6 | |||||||||||
|
| |||||||||||||||
Other Operations with Credit Risk | 75,345.2 | 65,900.1 | 14.3 | 73,444.1 | 2.6 | |||||||||||
Total Extended Portfolio (gross) | 347,907.5 | 322,783.1 | 7.8 | 336,408.8 | 3.4 | |||||||||||
|
| |||||||||||||||
Allowance for Loan Losses | -17,462.0 | -18,332.7 | -4.7 | -17,326.6 | 0.8 | |||||||||||
|
| |||||||||||||||
Total Loan portfolio (net) |
|
|
|
|
| 330,445.5 |
| 304,450.4 |
| 8.5 |
| 319,082.2 |
| 3.6 | ||
(1) Including the loans to individual in the consumer finance segment, the individual portfolio reached R$144,942 on December 31, 2017 (12/31/2016 - R$122,287). | ||||||||||||||||
(2) As of the first quarter of 2017, there was a migration of part of the portfolio balances between the Small and Medium Entities and Large Companies segments, due to the change in the revenues of certain customers, for better comparability the 2016 information was reclassified. | ||||||||||||||||
On Dec 31, 2017, the main highlight was the segment "Individuals", which presented growth in both periods, being 18.3% higher compared to the December, 2016 and 5.7% in September, 2017 and "Consumer Finance" also grew in both periods, being 20.4% higher compared to the December, 2016 and 6.9% in September, 2017. | ||||||||||||||||
Delinquency | ||||||||||||||||
The over-90 delinquency ratio reached 3.2% of the total credit portfolio in December 2017, decreasing 0.2 b.p over December, 2016 (3.4%) and increasing 0.3 b.p over September, 2017 (2.9%). The indicators are at controlled levels and reflect the strength of the culture and risk management. | ||||||||||||||||
Allowance for loan losses represents 6.4% of the loan portfolio in December 2017, 7.1% in December, 2016 and 6.6% in September, 2017. | ||||||||||||||||
The allowance for loan losses expenses, net of revenues with recovery of loans previously written off for the year ended on December 31, 2017 is R$9,173.5 million and R$10,404.8 million in 2016, decreasing 11.8%. This improvement shows the quality indicators of the credit portfolio at controlled levels. | ||||||||||||||||
2.4) Funding by Customers | ||||||||||||||||
FUNDING BY CUSTOMERS |
|
|
|
|
| Dec/17 |
| Dec/16 |
| annual changes % |
| Sep/17 |
| Sep/17 vs. Dec/17 | ||
Demand Deposits |
|
|
|
|
| 17,177.0 | 16,006.3 | 7.3 | 15,979.8 | 7.5 | ||||||
Saving Deposits | 40,572.4 | 36,051.5 | 12.5 | 38,570.2 | 5.2 | |||||||||||
Time Deposits | 142,480.7 | 90,524.8 | 57.4 | 146,867.2 | -3.0 | |||||||||||
Debentures/LCI/LCA(1) | 70,470.5 | 90,426.3 | -22.1 | 68,730.9 | 2.5 | |||||||||||
Treasury Bills/Structured Operations Certificates | 36,918.5 | 65,393.3 | -43.5 | 39,095.5 | -5.6 | |||||||||||
|
| |||||||||||||||
Total Funding |
|
|
|
|
|
|
| 307,619.0 |
| 298,402.3 |
| 3.1 |
| 309,243.6 |
| -0.5 |
(1) Debentures repurchase agreement, Real Estate Credit Notes (LCI) and Agribusiness Credit Notes (LCA). | ||||||||||||||||
The total funding resources increased 3.1%, compared to December, 2016, highlighting the growth of Time Deposits, due to the reduction in funding with Treasury Bills as a consequence of Bacen Resolution 4,527/16, which restricted the renewal of repurchase agreements with debentures issued by Santander Leasing beginning on May 2017. | ||||||||||||||||
2.5) Stockholders’ Equity | ||||||||||||||||
In December 2017, Banco Santander consolidated stockholders’ equity presented an increase of 3.0% compared to December, 2016 and a decrease of 4.6% compared to September, 2017. | ||||||||||||||||
The variation in the Stockholders' Equity balance between December 2017 and December 2016 was mainly due to the negative variation of the employee benefits plan in the amount of R$620.9 million, positive variation of the asset valuation adjustment (securities and derivative financial instruments) in the amount of R$1,188.4 million and the net income for the fiscal year in the amount of R$7,996.6 million and reduced, mainly, by the established of Interest on Capital in the amount of R$3,800 million and Dividends in the amount of R$2,500. In addition, CMN Resolution 4,512 dated July 28, 2016 and Circular Letter Bacen 3,782 dated on September 19, 2016, established accounting procedures to be applied, determining the constitution of a provision to cover losses associated with financial guarantees provided in any form, in the appropriate account of the liability, taking into consideration the impact on the corresponding income statement account during of the period, prospectively from January 1, 2017. The provisions previously recorded had their effect recorded in stockholders' equity, with a counterpart account in liabilities. The adoption of this standard in the period ended on September 30, 2017, impacted stockholders' equity (first adoption) by R$179.3 million, net of tax effect. | ||||||||||||||||
Treasury Shares | ||||||||||||||||
In the meeting held on November 1, 2017, the Bank’s Board of Directors approved, in continuation of the buyback program that expired on November 3, 2017, the buyback program of its Units and ADRs, by the Bank or its agency in Cayman, to be held in treasury or subsequently sold. | ||||||||||||||||
The Buyback Program will cover the acquisition up to 38,717,204 Units, representing 38,717,204 common shares and 38,717,204 preferred shares, or the ADRs, which, on September 30, 2017, corresponded to approximately 1.03% of the Bank’s share capital. On September 30, 2017, the Bank held 373,269,828 common shares and 401,074,242 preferred shares being traded. | ||||||||||||||||
The Buyback has the purpose to (1) maximize the value creation to shareholders by means of an efficient capital structure management; and (2) enable the payment of officers, management level employees and others Bank’s employees and companies under its control, according to the Long Term Incentive Plans. The term of the Buyback Program is 365 days counted from November 6, 2017, and will expire on November 5, 2018. | ||||||||||||||||
|
|
|
|
|
|
|
|
|
|
|
| Dec/17 |
|
|
| Dec/16 |
|
|
|
|
|
|
|
|
|
|
|
| Quantity |
|
| Quantity | |
|
| Units | Units |
| ADRs | |||||||||||
Treasury shares at beginning of the period | 25,786 | 7,080 | 13,138 | |||||||||||||
Cancellation(1) (2) | (32,276) | 13,138 | (13,138) | |||||||||||||
Shares Acquisitions | 12,768 | 14,284 | - | |||||||||||||
Payment - Share-based compensation | (4,505) | (8,716) | - | |||||||||||||
Treasury shares at end of the period | 1,773 | 25,786 | - | |||||||||||||
Subtotal - Treasury Shares in thousands of reais | R$ 148,246 | R$ 513,889 | R$ - | |||||||||||||
| R$ 194 | R$ 145 | R$ - | |||||||||||||
Balance of Treasury Shares in thousands of reais | R$ 148,440 | R$ 514,034 | R$ - | |||||||||||||
|
| |||||||||||||||
Cost/market Value | Units | Units | ADRs | |||||||||||||
Minimum cost | R$ 7.55 | R$ 7.55 | US$ 4.37 | |||||||||||||
Weighted average cost | R$ 24.41 | R$ 19.93 | US$ 6.17 | |||||||||||||
Maximum cost | R$ 32.29 | R$ 26.81 | US$ 10.21 | |||||||||||||
Market value |
|
|
|
|
|
|
|
|
|
|
| R$ 27.64 |
| R$ 28.32 |
| US$ 8.58 |
(1) In January 2016 there was the transformation of all ADRs that were held in treasury for UNIT's. | ||||||||||||||||
(2) At the EGM held on September, 18, 2017, it was approved the cancellation of 64.551.366 treasury shares (equivalent to 32.276 thousand Units) with the counterparty headings Capital Reserves and Profit Reserves, which represent the total of treasury shares registered in the book of common shares at that date, without reduction of the capital and consequent change in the clause 5th from the Bylaws in order to reflect the new quantities of common and preferred shares, nominative and without value which represent the Banco Santander´s capital. | ||||||||||||||||
In the fiscal year of 2017, there were highlights of Dividends and Interest on Capital, as below: | ||||||||||||||||
DIVIDENDS AND INTEREST ON CAPITAL |
|
|
|
|
| 12M17 |
| 9M17 |
| 12M16 | ||||||
Interest on capital |
|
|
|
|
|
|
|
|
| 3,800.0 |
| 1,500.0 |
| 3,850.0 | ||
Interim Dividends | 0.0 | 0.0 | 700.0 | |||||||||||||
Intercalary Dividends | 2,500.0 | 0.0 | 700.0 | |||||||||||||
Total |
|
|
|
|
|
|
|
|
|
|
| 6,300.0 |
| 1,500.0 |
| 5,250.0 |
2.6) Basel Index | ||||||||||||||||
Financial institutions are required by Bacen to maintain Regulatory Capital (PR), Tier I and Principal Capital consistent with their risk activities, higher than the minimum requirement of the Regulatory Capital Requirement, represented by the sum of the partial credit risk, market risk and operational risk. | ||||||||||||||||
As required by Resolution CMN 4,193/2013, the requirement for Regulatory Capital in 2016 was 10.5%, composed by 9.875% of Minimum Regulatory Capital plus 0.625% of Additional Conservation Buffer. Considering this additional, the Tier I increased to 6.625% and the Minimum Main Capital to 5.125%. | ||||||||||||||||
For the year 2017, the requirement for Regulatory Capital remains at 10.5%, considering 9.25% of Minimum Regulatory Capital and 1.25% of Additional Conservation Buffer.The Tier I reaches 7.25% and the Minimum Main Capital 5.75%. | ||||||||||||||||
The Basel ratio is determined in accordance with the Financial Statements of the Prudential Conglomerate prepared in accordance with accounting practices adopted in Brazil, applicable to institutions authorized to operate by Bacen, as shown bellow: | ||||||||||||||||
|
|
|
|
|
|
|
|
| ||||||||
BASEL INDEX % |
|
|
| Dec/17 |
| Sep/17 |
| Jun/17 |
| Dec/16 | ||||||
Basel Index - consolidated |
|
|
|
|
|
|
| 15.83 |
| 16.18 |
| 16.50 |
| 16.30 | ||
2.7) Main Subsidiaries | ||||||||||||||||
The table below presents the balances of total assets, net assets, net income and credit operations for the period ended Dec 31, 2017 for the main subsidiaries of Banco Santander portfolio: | ||||||||||||||||
SUBSIDIARIES |
| Total Assets |
| Stockholders' Equity |
| Net |
| Loan |
| Ownership/Interest (%) | ||||||
Santander Leasing S.A. Arrendamento Mercantil | 38,791.5 | 5,825.6 | 479.4 | 1,888.4 | 99.99 | |||||||||||
Aymoré Crédito, Financiamento e Investimento S.A. | 38,423.7 | 1,546.1 | 582.7 | 32,238.1 | 100.00 | |||||||||||
Santander Brasil, Establecimiento Financiero de Crédito, S.A. | 3,144.2 | 3,033.6 | 71.4 | 1,926.6 | 100.00 | |||||||||||
Banco Olé Bonsucesso Consignado S.A. (Olé Consignado) | 10,527.7 | 878.1 | 133.2 | 10,118.4 | 60.00 | |||||||||||
Getnet Adquirência e Serviços para Meios de Pagamento S.A. | 22,030.6 | 1,792.2 | 424.7 | 0.0 | 88.50 | |||||||||||
Banco PSA Finance Brasil S.A. | 1,992.5 | 294.6 | 46.1 | 1,719.2 | 50.00 | |||||||||||
Banco RCI Brasil S.A. | 9,065.9 | 1,080.3 | 186.2 | 7,597.2 | 39.89 | |||||||||||
Santander Corretora de Câmbio e Valores Mobiliários S.A. |
|
|
| 910.2 |
| 565.1 |
| 7.0 |
| 0.0 |
| 100.00 | ||||
(1) Includes Leasing portfolio and other loans. | ||||||||||||||||
Balances reported above are in accordance with accounting practices established by Brazilian Corporate Law and standards established by the CMN, the Bacen and document template provided in the Accounting National Financial System Institutions (Cosif) and the CVM, that does not conflict with the rules issued by Bacen. | ||||||||||||||||
3) Other Events | ||||||||||||||||
3.1) Market Maker Services | ||||||||||||||||
On September 28, 2017, the Bank announced the hiring of BTG Pactual Corretora de Títulos e Valores Mobiliários S.A. as the market maker services provider for the Stocks Deposits Certificates (Units) issuance by the Bank, under the code SANB11, traded by B3 – Brasil, Bolsa, Balcão S.A. (B3 S.A.)(current name of BM&Bovespa – Bolsa de Valores, Mercadorias e Futuros), which is replacing Brasil Plural Corretora de Câmbio, Títulos e Valores Mobiliários S.A..The new market maker has began its activities on January 2, 2018. | ||||||||||||||||
3.2) Sale of BW Guirapá | ||||||||||||||||
On December 22, 2017, Santander Corretora de Seguros (current corporate name of Santander Participações SA), Cia de Ferro Ligas da Bahia - Ferbasa SA (Ferbasa) and Brazil Wind SA entered into an agreement for the sale of 100% (one hundred percent) of the shares issued by BW Guirapá I SA (respectively the Agreement and BW Guirapá I SA) held by Santander Corretora de Seguros and Brazil Wind SA to Ferbasa (Operation). Subject to confirmation of certain assumptions, the acquisition price for all the shares held by Santander Corretora de Seguros will be up to R$414 million, and there may be an additional payment of up to R$35 million if future targets stipulated in the Contract are fulfilled. Considering the current situation of the agreement, this investment has been written off, as a consequence, the assets and liabilities of BW Guirapá and subsidiaries are no longer consolidated in the Conglomerate Balance Sheet, and the result is recorded in the income statement until the base date of November 30, 2017. | ||||||||||||||||
3.3) Change in the scope of consolidation | ||||||||||||||||
As of January 1, 2017, came into force CMN resolution No. 4,517 of August 24, 2016, with prospective application, which establishes that equity interests in jointly-controlled companies must be accounted using the equity method.Based on that, Banco Santander ceased to consolidate the companies Cibrasec Companhia Brasileira de Securitização, Norchem Participações e Consultoria S.A., Estruturadora Brasileira de Projetos S.A., Webmotors S.A., PSA Corretora de Seguros e Serviços Ltda. and TecBan - Tecnologia Bancária S.A. and subsidiaries.The change did not impact significantly the consolidated financial statements. | ||||||||||||||||
3.4) Public offering of Qatar Holding LLC | ||||||||||||||||
On April 11, 2017, Banco Santander in Brasil informed its shareholders and the market in general, in furtherance of the material facts disclosed on March 28, 2017 and April 6, 2017, the settlement of the secondary public offering for the distribution of 80,000,000 units issued by Banco Santander in Brasil and held by Qatar Holding LLC (Selling Shareholder), including in the form of American Depositary Shares (ADSs), having been allocated 22,000,000 Units for the Brazilian offering and 58,000,000 ADSs for the international offering. The price per Unit was set at R$25.00, resulting on a total amount of R$2 billion. Additionally, the amount of Units of the international offering initially offered was increased by an additional batch of 12,000,000 Units, exclusively in the form of ADSs also held by the Selling Shareholder. | ||||||||||||||||
3.5) Opening of the branch in Luxembourg | ||||||||||||||||
The Bacen, on June 9, 2017, granted to Banco Santander the authorization for the incorporation of a branch in Luxembourg, with a capital equivalent to US$1 billion. Its purpose is to complement the foreign trade strategy for corporate clients - large Brazilian companies and their operations abroad - to offer products and financial services through an offshore entity that is not established in a jurisdiction with favored taxation and great ability to source funds. | ||||||||||||||||
The branch's incorporation still depends on the authorization to be granted by the Luxembourg financial authority. | ||||||||||||||||
3.6) Non-Current Assets Held for Sale | ||||||||||||||||
On April 20, 2017, Banco Santander acquired from Grupo WTorre shares equivalent to 94.60% of the capital stock of Real TJK Empreendimento Imobiliário S.A. (currently named Rojo Entretenimento S.A.), which is the owner company of the Santander Theatre, due to a debt restructuring. | ||||||||||||||||
The stake in such investment has temporary character and is registered as non-current assets held for sale. | ||||||||||||||||
3.7) Accession to the Program, according to MP 783/2017 | ||||||||||||||||
In October 2017 the Bank also joined the Incentive Payment Programs and Installments issued by the cities Rio de Janeiro and São Paulo. Accessions to the programs include lawsuits and administrative proceedings related to ISS of the periods from 2005 to 2016, in the total amount of R$293 million. As a consequence were registered income of R$435 million. The result recorded a reversal of provisions, net of tax effects, in the amount of R$96 million. | ||||||||||||||||
In August 2017, Banco Santander adhered to the program for the payment of tax and social security debts (in accordance with MP 783/2017). Adherence to the program included administrative proceedings related to IRPJ, CSLL and Social Security Contributions related to the periods from 1999 to 2005. Accordingly, expenses were recorded in the third quarter of 2017, in the accounts of administrative expenses, operating expenses and taxes, totaling R$334 million, after tax effects. | ||||||||||||||||
3.8) Corporate Restructuring | ||||||||||||||||
Several social movements were implemented in order to reorganize the operations and activities of entities according to the business plan of the Banco Santander. | ||||||||||||||||
a) Partnership with HDI Seguros S.A. for the Creation of a Totally Digital Cars Insurance Company | ||||||||||||||||
On December 20, 2017, Banco Santander signed binding documents with HDI Seguros SA (HDI Seguros), to form a partnership for the issuance, offering and sale of auto insurance, in a 100% digital way, through creation of a new insurance company - Santander Auto, to be held 50% (fifty percent) by Sancap, a company controlled by Banco Santander, and 50% (fifty percent) by HDI Seguros. The completion of the operation is subject to compliance with certain conditions, including obtaining the relevant regulatory authorizations. | ||||||||||||||||
b) Agreement for Indirect Purchase of Shares Capital of Ipanema Empreendimentos e Participações and Gestora de Investimentos Ipanema | ||||||||||||||||
On July 5, 2017, Atual Companhia Securitizadora, a company wholly-owned by Banco Santander, entered into a purchase and sale agreement to acquire a corporate interest equivalent to 70% of the quotas representing Ipanema Empreendimentos e Participações Ltda., Gestora de Investimentos Ipanema Ltda and Fundo Investimento Ipanema NPL V. On September 19, 2017, Bacen authorized the Acquisition and, after fulfilling the other precedent conditions, the parties concluded the transaction on October 16, 2017. | ||||||||||||||||
c) Creation of the Gestora de Inteligência de Crédito S.A. – Partnership between Banco Santander and other Banks in the Brazilian market | ||||||||||||||||
On April 14, 2017, the definitive documents necessary for the creation of a new credit bureau, Gestora de Inteligência de Crédito SA ("Company"), were signed by the shareholders, whose control will be shared among the shareholders who will hold 20% of the its share capital, each. The Company will develop a database with the objective of aggregating, reconciling and processing registration and credit information of individuals and legal entities, in accordance with the applicable standards, providing a significant improvement in the processes of granting, pricing and directing credit lines. The Bank estimates that the Company will be fully operational in 2019. | ||||||||||||||||
d) Partnership with the Hyundai Group in Brazil | ||||||||||||||||
On April 28, 2016, the Aymoré CFI and Banco Santander entered into a transaction for the constitution of a partnership with Hyundai Motor Brasil Montadora de Automóveis Ltda. (Hyundai Motor Brazil) and Hyundai Capital Services, Inc. (Hyundai Capital) for the constitution of Banco Hyundai Capital Brasil S.A. and an insurance brokerage company to provide, respectively, auto finance and insurance brokerage services and products to clients and Hyundai dealerships in Brazil. The partnership capital structure will have a shareholding of 50% (fifty percent) of the Aymoré CFI, 25% (twenty five percent) of Hyundai Capital and 25% (twenty five percent) of Hyundai Motor Brazil. The implementation of the operation shall be subject to the applicable regulatory approvals. On September 19th, 2017, it was published in the Federal Official Gazette the Presidential Decree recognizing the Brazilian government’s interest in the foreign shareholding on a national financial entity to be incorporated jointly by Santander and Hyundai. | ||||||||||||||||
e) Agreement on the Acquisition, of part of the Financial Operation of PSA Group in Brazil and a consequent creation of a Joint Venture | ||||||||||||||||
On August 1, 2016, after the fulfillment of the applicable conditions precedent, including obtaining the appropriate regulatory approvals, Aymoré CFI and Banco Santander, in the context of a partnership between the Banque PSA Finance ("Banque PSA") and Santander Consumer Finance in Europe for joint operation of the vehicle financing business of PSA brands (Peugeot, Citroën and DS), signed definitive documents for the formation of a financial cooperation with Banque PSA for offering a range of financial and insurance products to consumers and dealers of PSA in Brazil. | ||||||||||||||||
The main vehicle of financial cooperation is Banco PSA Finance Brasil S.A. who is being held in the proportion of 50% by Aymoré CFI, a subsidiary of Banco Santander, and 50% by Banque PSA. The purchase price was equal to the book value (proportional) on the transaction closing date (08/01/2016). The operation also included the acquisition by Banco Santander subsidiary, 100% of PSA Finance Arrendamento Mercantil S.A., whose price was equivalent to 74% of the equity value on the closing date, and also 50% of PSA Corretora de Seguros e Serviços Ltda., whose price was equal to the book value (proportional) on the closing date. | ||||||||||||||||
Banco Santander started to consolidate these entities from August 1, 2016. | ||||||||||||||||
f) Investment in the Company Super Pagamentos e Administração de Meios Eletrônicos LTDA. (“Super”) | ||||||||||||||||
On January 4, 2016, Aymoré CFI informed the owners of the shares representing the remaining 50% of Super´s total voting capital its Decision to exercise the call option for the acquisition of such shares, for a value of approximately R$113 million.The transaction was concluded on March 10, 2016. | ||||||||||||||||
g) Other Corporate Events | ||||||||||||||||
• On December 30, 2016, at the EGM of Webmotors S.A., the merger and the Private Instrument of Protocol and Justification of Incorporation of Virtual Motors by Webmotors S.A. were approved, so that Webmotors S.A. received, for its accounting value, based on the balance sheet drawn up on November 30, 2016, all of the assets, rights and obligations of Virtual Motors, with the extinction of Virtual Motors that will be succeeded by Webmotors S.A. in all its rights and obligations. | ||||||||||||||||
• On March 10, 2017, was approved at the EGM of Santander Brasil Advisory, in order to simplify the operational procedures of the company, the group of shares representing its capital stock at the ratio of 100,000 common shares to one common share. As a result of the reverse split, the number of shares representing the Santander Brasil Advisory capital stock was changed from 1,370,914 to 13 common shares, all nominative and without par value, and any fractional shares were canceled. Shareholders who individually held less shares than the one adopted as a reason for the reverse split will receive for their shares the book value to them before the reverse split, calculated based on the shareholders' equity reflected in the Santander Brasil Advisory balance sheet drawn up in February 2017, which is, R$11.22 per common share. | ||||||||||||||||
• On August 31, 2017, the merger and the Private Instrument of Protocol and Justification of Santander Microcrédito by Santander Corretora de Seguros (Current Corporate Name of Santander Participações S.A.) were approved, so that Santander Corretora de Seguros received through their book value, based on the balance sheet drawn up on June 30, 2017, all of the assets, rights and obligations of Santander Microcrédito. With the extinction of Santander Microcrédito the Santander Corretora de Seguros became its successor in all its rights and obligations. | ||||||||||||||||
• On September 29, 2017, the merger and the Private Instrument of Protocol and Justification of Santander Brasil Advisory by Santander Corretora de Seguros (Current Corporate Name of Santander Participações S.A.) were approved, so that Santander Corretora de Seguros received through their book value, based on the balance sheet drawn up on August 31, 2017, all of the assets, rights and obligations of Santander Brasil Advisory. With the extinction of Santander Brasil Advisory the Santander Corretora de Seguros became its successor in all its rights and obligations. | ||||||||||||||||
• On November 17, 2017, was formalized the acquisition by Banco Santander of the participation by Santusa Holding, S.L. (equivalent to 39.35%) in the share capital of Santander Serviços. Thus, Banco Santander becomes the holder of 99.99% of the shares of Santander Serviços. | ||||||||||||||||
• On November 30, 2017, the merger and the Private Instrument of Protocol and Justification of the Merger Santander Serviços by Santander Corretora de Seguros (Current Corporate Name of Santander Participações S.A.). With the extinction of Santander Serviços, Santander Corretora de Seguros became its successor in all its rights and obligations. | ||||||||||||||||
4) Strategy | ||||||||||||||||
Banco Santander is the only international bank with a scale in the country. The Bank is sure that the way to grow in a profitable, recurring and sustainable way is to provide excellent services to increase the level of satisfaction and obtain more clients, more linked. The Bank's operations are based on a close and lasting relationship with customers, suppliers and shareholders. To achieve it, the purpose is to contribute to people and businesses to prosper, being a Simple, Personal and Fair Bank, with the following strategic priorities: | ||||||||||||||||
• Increase customer preference and engagement with segmented, simple, digital and innovative products and services through a multi-channel platform; | ||||||||||||||||
• Improve profitability, recurrence and sustainability, growing in business, with greater diversification of revenues, considering a balance between credit, funding and services, while maintaining a preventive risk management and strict control of expenses; | ||||||||||||||||
• Have capital and liquidity discipline to maintain soundness, address regulatory change, and seize growth opportunities; and | ||||||||||||||||
• Increase productivity through an intense business improvement agenda that enables a complete portfolio of services to be delivered. | ||||||||||||||||
In 2017, the Bank achieved historically outstanding results, reflecting a dynamic of strong commercial acceleration, speed of innovations and services. In addition, it has made progress in strengthening internal culture: It is a more aligned organization in consistently improving customer experience and as a result of these actions, it continues to increase profitable market share. | ||||||||||||||||
People | ||||||||||||||||
• Culture is Santander's Foundation! In 2017, the Bank strengthened its culture and today is a better-aligned organization to consistently improve customer service and experience. | ||||||||||||||||
GPTW (Great Place to Work): For the second consecutive year the Bank received the recognition to compose the ranking of "Best Companies to Work" in the country. | ||||||||||||||||
• Global engagement survey reached 88 percent this year. | ||||||||||||||||
• The largest corporate event of the Bank was held at the Allianz Parque stadium, with more than 40,000 employees joining (approximately 85% of the total). | ||||||||||||||||
Retail | ||||||||||||||||
• Cards: robust growth in credit card revenue for the ninth consecutive quarter, reaching 15.1%1 market share, an increase of 190bps in 12 months. The commercialization of AAdvantage® cards continues with a high index of activation and Santander Way continues to maintain good evaluation in the market of applications (4.8 stars in Apple and 4.6 stars in Google Play). With a continuous focus on improving the offer, this quarter, Santander Pass, a bracelet and sticker was launched with NFC technology for payment by approach; initiated identity check mobile tests, in partnership with Mastercard and Dafiti, to authenticate online payments through biometrics or facial identification; and the Bank started the offering of the new Santander/Smiles credit cards. | ||||||||||||||||
• Payroll Loans: strong growth in origination (+58% in the 12-month period), with growth above market, which has contributed to expand market share to 12.9%2 (+214bps in 12 months). Digital backlog has supported the growth of this portfolio. Which reinforces the strategy of providing a better customer experience. | ||||||||||||||||
• Investments: the Bank reinforced the concept of financial advisory services with closer customer service, offering a solution that is adequate to the needs of each client, and inaugurated Santander One, a digital platform focused on financial education and recommendation of the best solutions which has already reached more than 8 million views in the quarter. | ||||||||||||||||
• Real Estate: In this quarter, the Bank intensified its commercial activity with the clients, with the purpose of encouraging the product. In addition, it maintained the offer of Real Estate Credit with rate from one digit. All these actions allowed to increase the production for individual clients (+ 88% in twelve months), superior to the market. | ||||||||||||||||
Getnet | ||||||||||||||||
• Strong growth in total revenues in the year (+ 31% in 12 months), 3 times higher than the market1, reaching R$142.1 billion, explained by credit sales (+ 29% in twelve months) and debt (+ 36% in twelve months). The assertive strategy in the segment made it possible to reach 11.5%1 (+ 168bps in 12 months) of market share. Throughout the year, the full-acquisition model was implemented and the option of buying or renting the POS was launched, allowing the customer to choose the service that best suits their needs. | ||||||||||||||||
In 2017, the Bank was awarded a prominent position among the acquiring companies in Latin America, occupying the 2nd place in transactions through web3 and 4th place in total transactions3. | ||||||||||||||||
SMEs | ||||||||||||||||
• Agro: the Bank continues to improve the specialized service to enable appropriate solutions for customers in this segment. Throughout 2017 expanded its presence and opened 14 stores in strategic regions. | ||||||||||||||||
• Companies: the Bank increased its market share to 11%4 (+ 241bps in twelve months) and continues to strengthen this segment with differentiated offers, sectorized and specialized services, with the objective of expanding the portfolio and expanding the linkage. | ||||||||||||||||
The Bank was recognized as the World's Best Bank for SMEs by Euromoney. | ||||||||||||||||
Black week | ||||||||||||||||
• Aligned with the digital strategy, Black Week Santander, a disruptive strategy in the Brazilian financial sector, with specific offers in the physical and digital channels, was held. With strong sales growth through e-commerce, Black Week Santander contributed to the Bank in the year, total sales of e-commerce increased by 78% (in twelve months), driven mainly by credit cards (+ 1.9x in twelve months) and personal credit (+ 2.1x in twelve months). | ||||||||||||||||
Strengthening Leading Business | ||||||||||||||||
• Santander Financing: Banco Santander continues to lead vehicle financing, with a market share of 23.0%2 (+ 310bps in 12 months). The +Negócios digital platform continues to support portfolio expansion, with a twelve-month increase of 60% in single vehicle credit simulations compared to December 2016. + Vezes, a digital platform focused on the segment of goods and services (CDC)5 has already reached some 175,000 unique simulations per month. This innovation positions to capture business opportunities. | ||||||||||||||||
• Global Corporate Banking (GCB): improvement of service in the segment, with a more customer-centric model, which enabled the Bank to be recognized as a leader: (i) In the foreign exchange market, leading operations, according to Bacen6; (ii) Recognized as leader in financial advisory services for project financing in Brazil, by Dealogic7 and Anbima7. | ||||||||||||||||
The Bank was elected the Best Treasury of Brazil8 and is among the best Research in Brazil and Latin America9. | ||||||||||||||||
More partnership | ||||||||||||||||
HDI Seguros: a joint venture10 with HDI Seguros was announced in the quarter for the issuance, offering and sale of auto insurance in a 100% digital format. The operation strengthens the leadership in vehicle financing and will establish new levels of services for the market insurance, where customers can contract the product in a simpler and faster way. | ||||||||||||||||
Customer bonding | ||||||||||||||||
The growth in the customer base shows a continuous focus on improving the customer experience. As a result, the active customer base has grown for 31 consecutive months. | ||||||||||||||||
Recognition | ||||||||||||||||
• Awarded by The Banker as the best bank in Brazil, Latin America and Global and by Euromoney, as the best bank in Brazil and Latin America and Latam transformation. | ||||||||||||||||
|
|
|
| |||||||||||||
(1) Source ABECS, base date of September 2017. | ||||||||||||||||
(2) Source Bacen, base date of November 2017. | ||||||||||||||||
(3) Source Nilson Report, base date of 2016. | ||||||||||||||||
(4) Source Bacen, base date of September 2017. | ||||||||||||||||
(5) Direct consumer credit. | ||||||||||||||||
(6) Bacen, base date of December 2017. | ||||||||||||||||
(7) Financial Advisory Americas. Dealogic. 9M17 and Financial Advisor - leadership since 2008, ANBIMA 2016. | ||||||||||||||||
(8) Source Euromoney. | ||||||||||||||||
(9) Source Institutional Investor Magazine | ||||||||||||||||
(10) The completion of the operation is subject to compliance with certain conditions, including obtaining the required regulatory authorizations. | ||||||||||||||||
5) Rating Agencies | ||||||||||||||||
Banco Santander is rated by international ratings agencies and the ratings assigned reflect many factors including management quality, operating performance and financial strength, as well as other factors related to the financial sector and economic environment in which the Bank is inserted, having the long-term foreign currency rating limited to the sovereign rating. The table below presents the ratings assigned by the rating agencies Standard & Poor's and Moody's: | ||||||||||||||||
| ||||||||||||||||
| ||||||||||||||||
|
|
| ||||||||||||||
(1) Latest Credit Analysis report issued on: January 11, 2018. | ||||||||||||||||
(2) Latest Credit Analysis report issued on: December 6, 2017. | ||||||||||||||||
6) Corporate Governance | ||||||||||||||||
The Board of Directors approved, in a meeting held on January 29, 2018, the Banco Santander's Consolidated Financial Statements, prepared in accordance with the Brazilian accounting practices, applicable to financial institutions authorized to operate by Bacen, for period ended December 31, 2017. | ||||||||||||||||
The Board of Directors approved, in a meeting held on November 1, 2017, the new buyback program of Units or American Depositary Receipts (“ADRs”) issued by the Company (“Buyback Program”), pursuant to CVM Normative Instruction No. 567 of September 17, 2015. | ||||||||||||||||
The Board of Directors approved, in a meeting held on November 1, 2017, the election of Mr. Leopoldo Martinez Cruz as Director without specific designation, for a complementary mandate, which shall be valid until the officers elected in the first Board of Directors’ Meeting after the 2019 Ordinary Shareholders’ Meeting. | ||||||||||||||||
The Board of Directors approved, in a meeting held on November 21, 2017, the exoneration of Mrs. Ana Paula Nader Alfaya from her post of Director without specific designation of the Bank. | ||||||||||||||||
The Board of Directors approved, in a meeting held on October 24, 2017, the Banco Santander's Consolidated Financial Statements, prepared in accordance with the Brazilian accounting practices, applicable to financial institutions authorized to operate by Bacen and the Banco Santander's Interim Consolidated Financial Statements, prepared in accordance with the International Financial Reporting Standards (IFRS), for period ended September 30, 2017. | ||||||||||||||||
The Board of Directors approved, in a meeting held on August 31, 2017, in compliance with CMN Resolution nº 4.557 of February 23, 2017: (i) the appointment of Mr. Antonio Pardo de Santayana Montes as Director responsible for risk management (CRO) of the Prudential Conglomerate of the Bank ("Santander Conglomerate"); (ii) the appointment of Mr. Angel Santodomingo Martell as Director responsible for capital management of Santander Conglomerate; (iii) the amendments in the Internal Regulations of the Company's Risk and Compliance Committee; (iv) the amendments in the Internal Regulations of the Company's Board of Directors; and (v) the appointment of the members of the Risk and Compliance Committee of Santander Conglomerate, for a complementary mandate, which shall be valid until the investiture of the elected persons at the first meeting of the Board of Directors being held after the 2019 Ordinary Shareholders Meeting: Mr. Álvaro Antonio Cardoso de Souza, Bernardo Parnes, Conrado Engel, Deborah Stern Vieitas, acting as coordinator, and José de Paiva Ferreira. The directors responsible for risk management (CRO) and capital management indicated for the functions established by the standard, had previously performed these functions in compliance with the best practices adopted by Banco Santander. | ||||||||||||||||
The Board of Directors approved, in a meeting held on August 29, 2017, the exoneration of Mr. Flávio Tavares Valadão from his post of Director without specific designation of the Bank. | ||||||||||||||||
The Board of Directors approved, in a meeting held on August 25, 2017, the election of Mr. Mário Roberto Opice Leão as Executive Vice-President, for a complementary term of office, which shall be valid until the officers elected in the first Board of Directors’ Meeting after the 2019 Ordinary Shareholders’ Meeting. | ||||||||||||||||
The Board of Directors approved, in a meeting held on August 14, 2017, the appointment of Mr. Carlos Rey de Vicente as member of the Company's Sustainability Committee, for a complementary mandate, which shall be valid until the investiture of the elected persons at the first meeting of the Board of Directors being held after the 2019 Ordinary Shareholders Meeting. | ||||||||||||||||
The Board of Directors approved, in a meeting held on July 31, 2017, the exoneration of Mr. João Guilherme de Andrade So Consiglio from his post of Vice-President Executive Director of the Bank. | ||||||||||||||||
The Board of Directors approved, in a meeting held on July 26, 2017, the exoneration of Mr. Mario Adolfo Libert Westphalen from his post of Director without specific designation of the Bank. | ||||||||||||||||
The Board of Directors approved, in a meeting held on July 25, 2017, the Banco Santander's Consolidated Financial Statements, prepared in accordance with the Brazilian accounting practices, applicable to financial institutions authorized to operate by Bacen and the Banco Santander's Interim Consolidated Financial Statements, prepared in accordance with the International Financial Reporting Standards (IFRS), for period ended June 30, 2017. | ||||||||||||||||
The Board of Directors approved in a meeting held on May 30, 2017, the final version of the Policy for Succession of the Senior Management Members, drawn up in line with the resolution 4.538/16 of the Bacen. | ||||||||||||||||
The Board of Directors approved in a meeting held on May 09, 2017, the appointment, in place of Mrs. Maria Lucia Ettore de Jesus, of Mr. Valdemir Moreira de Lima, for the function of Ombudsman of the Banco Santander, for term of office of 1 year, with effect from the date of such meeting. | ||||||||||||||||
The Board of Directors approved in a meeting held on May 02, 2017: (i) the appointment of the Company’s Audit Committee members, for a one (1) year term, until the investiture of the members that shall be elected on the First Board of Directors’ meeting to be held after the Ordinary General Meeting of 2018; (ii) the appointment of the Company’s Risks and Compliance Committee members, for a term of office until August 31th, 2017, after which the Board of Directors will reorganize the Risk Committee in accordance with CMN Resolution nº 4.557/17; and (iii) the appointment of the members of the Sustainability, Nomination and Governance and Remuneration Committees of the Banco Santander, for a term of office until the investiture of the elected persons at the first meeting of the Board of Directors being held after the 2019 Ordinary Shareholders Meeting. | ||||||||||||||||
The Board of Directors approved in a meeting held on May 02, 2017: the election, for a new term of office until the investiture of the elected persons at the first Meeting of the Board of Directors being held after the 2019 Ordinary Shareholders Meeting, of the members to compose the Banco Santander’s Board of Executive Officers. | ||||||||||||||||
The Board of Directors approved, in a meeting held on April 25, 2017, the Banco Santander's Consolidated Financial Statements, prepared in accordance with the Brazilian accounting practices, applicable to financial institutions authorized to operate by Bacen and the Banco Santander's Interim Consolidated Financial Statements, prepared in accordance with the International Financial Reporting Standards (IFRS), for period ended March 31, 2017. | ||||||||||||||||
The Board of Directors was informed, in a meeting held on March 28, 2017, the resignation of Mr. Marcio Aurelio de Nobrega of his position as Director without specific designation of the Bank, in accordance with the letter of resignation presented to the Board of Directors on March 10, 2017. | ||||||||||||||||
The Board of Directors approved, in a meeting held on February 22, 2017, a review of Governance of the Board of Directors, in the following terms: (i) the amendment of the internal regulations of the Nominating, Governance and Compliance Committee, reflecting its scope and denomination, passing such a body to be called the Nominating and Governance Committee; (ii) the amendment of the internal regulations of the Sustainability and Society Committee, reflecting it denomination, passing such a body to be called the Sustainability Committee; (iii) the amendment of the internal regulations of the Risk Committee, reflecting its scope and denomination, passing such a body to be called the Risk and Compliance Committee; (iv) to appoint, as a member of the Compensation Committee, pursuant to Art. 17, XXI of the Bylaws, Mr. Celso Clemente Giacometti; (v) to appoint, as a member of the Nominating and Governance Committee, Mr. Luiz Fernando Sanzogo Giorgi. | ||||||||||||||||
7) Risk Management | ||||||||||||||||
On February 23, 2017, Bacen published CMN Resolution 4,557, which provides for the risk and capital management structure (GIRC) and entered into force 180 days from the date of its publication. The resolution highlights the need to implement an integrated risk and capital management framework, definition of integrated stress testing program and Risk Appetite Statement (RAS), constitution of Risk Committee and appointment of director for management and director of capital. Banco Santander carried out a mapping of necessary actions aiming at adherence to the new resolution without identifying relevant impacts resulting from this standard up to the date of publication of this note. | ||||||||||||||||
7.1) Corporate Governance of the Risk Function | ||||||||||||||||
The governance model is structured in a vision of decision, focusing on examination and approval of proposals and credit limits, and in a vision of control, with a focus on full control of risks. | ||||||||||||||||
The fundamental principles that rule the risk governance model are: | ||||||||||||||||
• Independence of the risks in relation to business area; | ||||||||||||||||
• Involvement of the management in decision making; and | ||||||||||||||||
• Collegial Decisions and consensus on credit operations. | ||||||||||||||||
The CER-Executive Committee of Risks is the local decision-making forum with representatives of the Bank's management, including the President, Vice President and the other members of the Executive Board. The main tasks of this Committee are: | ||||||||||||||||
• Monitor the development of credit and market portfolios; | ||||||||||||||||
• Decide on credit proposals; | ||||||||||||||||
• Define and monitor the risk appetite fulfillment; | ||||||||||||||||
• Define the actions with regard to the recommendations made by the local regulator and by Internal Audit; | ||||||||||||||||
• Approve and authorize the management tools, improvement initiatives, the follow-up of projects and any other relevant activities related to the management of risks; and | ||||||||||||||||
• Approve risk policies as well as changes in risk policies with impact on revenue, margin or costs of provision. | ||||||||||||||||
The CCR-Risk Control Committee is the control and monitoring local forum with representatives of the Bank's management, including the VPE of Risks and the Vice President of Finance. The main tasks of this Committee are: | ||||||||||||||||
• Conduct a comprehensive and periodic follow-up of all risk, if its profile is within the established in the risk appetite, Business Strategic Planning and in the budget approved by the Board of Directors; | ||||||||||||||||
• Conduct a periodic and independent control of risk management activities; | ||||||||||||||||
• Supervise the measures adopted with regard to risks, to comply with the recommendations and directions made by the local regulator and internal audit; and | ||||||||||||||||
• Provide to the Board of Directors and the Executive Commission with the information and assistance they need in terms of risks. | ||||||||||||||||
The relevant topics of risk management or those that exceed the jurisdiction of these committees will be forwarded and decided by the Board of Directors. | ||||||||||||||||
| ||||||||||||||||
| ||||||||||||||||
7.2) Structure of Capital Management | ||||||||||||||||
Banco Santander has a capital management structure marked by a robust governance framework, which enables the Entity to define, in an efficient way, the functions of each area. Furthermore, there is a clear definition about which processes and activities should be developed to ensure an effective capital management, under both normal and stressed conditions. In this way, the institution aims to maintain a solid capital structure, in compliance with regulatory requirements and generating profits for its shareholders. | ||||||||||||||||
7.3) Credit Risk | ||||||||||||||||
Credit risk is the exposure to loss in the case of total or partial default of the clients or counterparties in the fulfillment of their financial obligations to the Banco Santander. Credit risk management seeks to establish strategies, besides setting limits, including the analysis of exposure and trends, and the effectiveness of credit policies. The goal is to maintain a risk profile and adequate minimum profitability which compensates the estimated default risk of the client and portfolios, as established by the Executive Committee. | ||||||||||||||||
7.4) Market Risk | ||||||||||||||||
Market risk is exposure to risk factors including interest rates, exchange rates, commodities prices, stock market prices and other values, according to the type of product, the volume of operations, terms and conditions of the agreement and underlying volatility. Market risk management includes practices of measuring and monitoring the use of limits that are pre-set by internal committees, of the value at risk of the portfolios, of sensitivity to fluctuating interest rates, of exposure to foreign exchange rates, of liquidity gaps, among other practices which the control and monitoring of the risks which might affect the position of Banco Santander portfolios in the different markets in which the Bank operates. | ||||||||||||||||
To work on the market risk, the Bank has developed its own Risk Management model, with the following principles: | ||||||||||||||||
• Functional independence; | ||||||||||||||||
• Executive capacity sustained by knowledge and clients proximity; | ||||||||||||||||
• Global scope reach (different types of risk); | ||||||||||||||||
• Collegial Decisions that evaluate all possible scenarios and do not compromise the results of individual Decisions, including Executive Risk Committee (ERC), which sets limits and approves the transactions and the Executive Committee of Assets and Liabilities, which is responsible for the management of capital and structural risks, which includes country risk, liquidity and interest rates; | ||||||||||||||||
• Management and optimization of the risk/return; and | ||||||||||||||||
• Advanced methodologies for risk management, such as Value at Risk (VaR) (historical simulation of 521 days, with a confidence level of 99% and a time horizon of one day), scenarios, sensitivity of net interest income, asset value and sensitivity contingency plan. | ||||||||||||||||
The structure of market Risk is part of the Vice President of Risks, which implements the policies of risk. | ||||||||||||||||
7.5) Environmental and Social Risk | ||||||||||||||||
Social and environmental risk management for the wholesale banking customers is accomplished through a management system for customers who have credit limits or credit risk above R$1 million, which considers aspects such as contaminated land, deforestation, working conditions and other social and environmental points of attention in which there is possibility of penalties. A specialized team, with background in Biology, Geology, Health and Safety Engineering and Chemical Engineering, monitors the environmental practices of our wholesale clients. The financial analysis team studies the potential damage and impacts that adverse social and environmental situations may cause to the financial condition of customers and their guarantees. The analysis focuses on preserving capital and market reputation, and the dissemination of this practice is achieved by constant training of both commercial and risk areas on the application of social and environmental risk standards in the credit approval process for corporate client. | ||||||||||||||||
The Bank's Social and Environmental Risk Policy is included under the Social and Environmental Responsibility Policy of the Bank, in accordance with Resolution 4,327 of CMN. | ||||||||||||||||
7.6) Operational Risk Management, Internal Controls, Sarbanes-Oxley Act and Internal Audit | ||||||||||||||||
Operational risk losses can occur due in inadequacy or failures with process, systems, human failures and/or from exposure to external events. This definition includes the legal risk associated with the inadequacy or deficiency in contracts signed by the Banc, as well as penalties for non-compliance with legal provisions and damages for third parties arising from the activities developed by the Bank, but excludes those that occurr as a consequence of strategic risk. Operational risk losses may result in financial losses, adversely affect the continuity of the business and also negatively affect Bank's image. | ||||||||||||||||
To accomplish the operational risk objectives, was established an operational risk model based on three lines of defense, with the objective of continuously improving and developing the management and control of operational risks. | ||||||||||||||||
• First line of defense: all business and support areas within Banco Santander are responsible for identifying, managing, mitigating and reporting operational risk; | ||||||||||||||||
• Second line of defense: the Operational Risk Control and Technological and Cyber Risk Control units monitoring and ensuring sound operational and technological risk management practices throughout the organization having as premise to implement disseminate our operational risk culture, defining methodologies, policies, tools, training and applicable procedures and requirements for the effective management of operational risk and of ensuring there is adequate business contingency planning in place throughout the Bank; and | ||||||||||||||||
• Third line of defense:the internal audit department is responsible for undertaking independent reviews of the risk management undertaken by the first and second lines of defense and for promoting continuous model improvements. | ||||||||||||||||
The objectives of the Operational Risk management model are: | ||||||||||||||||
• to disseminate a culture of operational risk management and control, to foster the prevention of risk events and operational risks losses and to mitigate their financial, legal and reputational impacts; | ||||||||||||||||
• to provide support to decision-makers within Banco Santander; | ||||||||||||||||
• to ensure the business continuity in a sustainable manner and to improve internal controls; and | ||||||||||||||||
• to maintain control of the operational risk in a manner which is consistent with our business strategy. | ||||||||||||||||
The following bodies are involved in the implementation of the risk management model: | ||||||||||||||||
• Risk Control Committee: A committee which aims to perform a holistic and periodic monitoring of the risks to which the Bank is exposed and to exercise independent control on the risk management activities; | ||||||||||||||||
• Operational Risk Operational Committee: A committee which aims to ensure and to foster the adequate monitoring, control and mitigation of operational risks; and | ||||||||||||||||
• Operational Risk Forum: An independent forum, responsible for implementing and disseminating cultural norms, methodologies, standards, policies, tools, training and procedures applicable and required for the effective and efficient management and control of operational risk. | ||||||||||||||||
The risk management model assists managers in achieving their strategic objectives by contributing to the decision-making process and by reducing operational risk losses. It is based on best market practice in the identification, assessment, monitoring, management and control of operational risks. It is compliant with the applicable regulatory requirements and seeks to ensure the sustained improvement of the internal controls environment. | ||||||||||||||||
Internal Audit reports directly to the Board of Directors, whose activities are supervised by the Audit Committee. | ||||||||||||||||
Internal Audit’s objective is to supervise the compliance, efficiency and effectiveness of internal control systems, as well as the reliability and quality of accounting information. Thus, all Banco Santander’s companies, business units, departments and core services are under its scope of application. The Internal Audit has quality certificate issued by the Institute of Internal Auditors (IIA). | ||||||||||||||||
The Audit Committee and the Board of Directors were informed on Internal Audit’s works to be done during the year 2017, according to its annual plan. | ||||||||||||||||
The Audit Committee favorably reviewed the annual work plan of the Internal Audit and approved of the activity report for the year 2017. | ||||||||||||||||
In order to perform its duties and reduce coverage risks inherent to Banco Santander's activities, the Internal Audit area has internally-developed tools updated whenever necessary. | ||||||||||||||||
Among these tools, it is worth mentioning the risk matrix, for it is used as a planning tool, prioritizing each unit’s risk level, based on, among others, its inherent risks, audit’s last rating, level of compliance with recommendations and size. | ||||||||||||||||
Throughout the fiscal year of 2017, internal control procedures and controls on information systems pertaining to units under analysis were assessed according to the work plan for 2017, taking into account their design and operating effectiveness. | ||||||||||||||||
8) People | ||||||||||||||||
When the discussion is about the growth and development of Banco Santander, a force stands out: the People. Having a motivated and dedicated employees is a Decisive factor in making the Bank in the best bank for clients and the best company for professionals. | ||||||||||||||||
Professionals are the strongest link between the Bank and clients and so, day after day, Banco Santander enhances their management practices because it knows that only with engaged professional, motivated, well trained and with full professional development, the Bank will manage to get more and better clients, satisfied, proud to do business with Banco Santander and the Santander brand. | ||||||||||||||||
The daily performance of Banco Santander with clients, employees, shareholders and society is guided by the purpose of the Bank to contribute to people and businesses to prosper and their way of act. | ||||||||||||||||
The Bank has a talented and dedicated team of more than 47,000 employees only in Brazil. The Bank seeks professionals who identified with the Corporate Culture, to be a Simple Bank (with uncomplicated and easy services to operate), Personal (with solutions and channels that meet clients needs and preferences) and Fair (promoting business and relationships that are good for clients, shareholders and employees). In addition to identifying with the culture, the Banco Santander's professionals act in their day to day aligned to it. | ||||||||||||||||
9) Sustainable Development | ||||||||||||||||
Sustainability is a strategic part of business, in Santander. It is a commitment that seeks results for business and for society in a simple, personal and fair way, which is based on a strategy with three pillars: Social and Financial Inclusion, Education and Management and Socio-environmental Business. Among the highlights of the fourth quarter of 2017 in relation to Social and Financial Inclusion are Prospera Santander Microcredit with the incorporation of the value offer, reaching the highest result in 15 years, with a disbursement of R$800 million (32.9% more than in 2016) and more than 200 thousand active clients/operations, with opening of account of new 40 thousand entrepreneurs. | ||||||||||||||||
In the scope of Private Social Investment, in 2017, the program Partners in Action, which supports the development of microenterprises in low-income regions where Prospera Santander Microcredit is present, trained 984 entrepreneurs in 17 cities. The Friend of Value Program, which directs resources from employees, clients and the Bank to the Child and Adolescent Rights Council Funds, reached in 2017 a transfer of more than R$12 million reais to 38 initiatives distributed in 27 municipalities for Brazil. Together, these initiatives will serve approximately 10,000 children and adolescents at social risk, as well as their families. | ||||||||||||||||
The corporate volunteer program, Programa Escola Brasil (PEB), carried out more than 400 actions that impacted approximately 93,000 people; In Pilar Educação, with 315 Higher Education Institutions, in 2017, the Santander Universities Brazil program granted 3,437 scholarships, of these, 1,389 are international, 925 are national and 1,123 are employment exchanges. | ||||||||||||||||
The Bank continues to move forward with the "Fit to Grow" model implemented in 2016 for rational expenditure management. At the end of the first year of implementation, it had identified and treated wastes involving energy, water, paper and cleaning materials and office, thus achieving savings of R$75 million. There was also a decrease in air travel, which reduced about 32% of CO2 emissions in the bank's inventory. We also continue with the process of evolution of social and environmental responsibility governance, with the creation of the Senior Social and Environmental Responsibility Policy Group (PRSA). The Group acts in strategic decision-making, acting as a liaison with the Executive Committee and reinforcing the involvement of central areas for compliance with the PRSA. | ||||||||||||||||
Some of the sustainability awards and recognitions received in 2017 are: the Bank for the 8th consecutive year is part of the B3 - Brasil Corporate Sustainability Index portfolio, Bolsa, Balcão; was recognized by the Guia Exame de Sustentabilidade (Guia Exame de Sustentabilidade), promoted by Exame magazine, of the Abril publishing house; Prize Spanish Chamber of Sustainability, where Universia Brasil was one of the highlights in the Large Business category; with the Fit to Grow case, the Bank was awarded in the category of Product or Service Sustainability by the ECO Award, held by the American Chamber of Commerce (Amcham) and recognized as the "Leader in Efficiency Practices" by the Latin American Federation of Banks (FELABAN ) and International Finance Corporation (IFC); was also recognized by the CDP (Carbon Disclosure Project) as one of the largest Brazilian leaders in the topic of climate change, having reached the highest score among companies in the financial sector; and the headquarters of Banco Santander, in São Paulo, won the Guia de Rodas Seal, a qualification related to accessibility for people with disabilities (PCD). | ||||||||||||||||
10) Independent Audit | ||||||||||||||||
Banco Santander's policy of including its subsidiaries in contracting services not related to the external audit of its independent auditors is based on Brazilian and international auditing standards that preserve the auditor's independence. This reasoning provides as follows: (i) the auditor should not audit his own work, (ii) the auditor should not perform managerial duties on his client, (iii) the auditor should not promote the interests of his client, and (iv) need for approval of any services by the Bank's Audit Committee. | ||||||||||||||||
In compliance with the Instruction of the Securities Commission 381/2003, Banco Santander informs that in the year ended December 31, 2017, PricewaterhouseCoopers provided services not related to the independent audit of the Financial Statements of Banco Santander and subsidiaries under 5% of total fees related to independent auditing services, as follows: | ||||||||||||||||
Hiring date |
| Description of services | ||||||||||||||
03/30/2017 | Comfort Letter - Brazilian and International Offer | |||||||||||||||
06/23/2017 |
| Annual review of the accounting numbers of the MTN emission program | ||||||||||||||
In addition, the Bank confirms that PricewaterhouseCoopers has procedures, policies and controls to ensure its independence, which include an evaluation of the work performed, covering any service that is not independent of the Financial Statements of Banco Santander and its subsidiaries. This evaluation is based on the applicable regulations and accepted principles that preserve the independence of the auditor. The acceptance and provision of professional services not related to the external audit during the year ended December 31, 2017 did not affect the independence and objectivity in conducting the external audits carried out in Banco Santander and other entities of the Group, since the above principles were observed. | ||||||||||||||||
The Board of Directors | ||||||||||||||||
(Authorized at the Meeting of the Board of January 29, 2017). | ||||||||||||||||
*** | ||||||||||||||||
www.pwc.com.br
(A free translation of the original in Portuguese)
|
Banco Santander (Brasil) S.A. Parent company and consolidated
|
BCOSANT17FC-PAR.DOCX
Banco Santander (Brasil) S.A.
(A free translation of the original in Portuguese)
Independent auditor's report
To the Board of Directors and Stockholders
Banco Santander (Brasil) S.A.
Opinion
We have audited the accompanying parent company financial statements of Banco Santander (Brasil) S.A. ("Bank"), which comprise the balance sheet as at December 31, 2017 and the statements of income, changes in equity and cash flows for the six-month period and year then ended, as well as the accompanying consolidated financial statements of Banco Santander (Brasil) S.A. and its subsidiaries ("Consolidated"), which comprise the consolidated balance sheet as at December 31, 2017 and the consolidated statements of income, changes in equity and cash flows for the six-month period and year then ended, and a summary of significant accounting policies and other explanatory information.
In our opinion, the parent company and consolidated financial statements referred to above present fairly, in all material respects, the financial position of Banco Santander (Brasil) S.A. and of Banco Santander (Brasil) S.A. and its subsidiaries as at December 31, 2017, and their financial performance and cash flows for the six-month period and year then ended, in accordance with accounting practices adopted in Brazil, applicable to institutions authorized to operate by the Brazilian Central Bank (BACEN)
Basis for opinion
We conducted our audit in accordance with Brazilian and International Standards on Auditing. Our responsibilities under those standards are further described in the Auditor’s responsibilities for the audit of the parent company and consolidated financial statements section of our report. We are independent of the Bank and its subsidiaries in accordance with the ethical requirements established in the Code of Professional Ethics and Professional Standards issued by the Brazilian Federal Accounting Council, and we have fulfilled our other ethical responsibilities in accordance with these requirements. We believe that the audit evidence we have obtained is sufficient and appropriate to provide a basis for our audit opinion.
BCOSANT17FC-PAR.DOCX
2
Banco Santander (Brasil) S.A.
Key audit matters
| Key audit matters are those matters that, in our professional judgment,
Our audit for the year ended December 31, 2017 was planned and |  |
Why it is a Key Audit Matter | How the matter was addressed in the audit |
|
|
Allowance for loan losses (Notes 3i and 8) |
|
|
|
The estimation of the allowance for loan losses involves a high level of judgment by Management. The establishment of the allowance for loan losses involves the assessment of several assumptions and internal and external factors, including default levels and guarantees of the portfolios, renegotiation policy, and the current and prospective economic scenarios. Accordingly, this area remained as an area of focus in our audit.
This judgment considers several assumptions in the determination of the allowances. The allowance for loan losses is recorded in accordance with the regulatory requirements of the Brazilian Central Bank (BACEN), especially Resolution 2,682 of the National Monetary Council (CMN), and is based on the analyses of outstanding receivables (overdue and not yet due), according to the internal policies that consider the establishment of credit ratings (risk classification). Likewise, it considers the expectation of realization of the loan portfolio, in addition to the requirement of current legislation, based on past experience, current scenario and future expectations, specific portfolio risks and Management's assessment of risks in the recording of the allowance.
| We carried out procedures to update our understanding, and tested the internal controls that are significant in the calculation and recognition of the allowance for loan losses, mainly including the following processes: approval of the credit policy; credit analysis; credit granting and renegotiated transactions; attribution of rating considering the risk of the recoverable value of transactions; processing and recording of provisions; reconciliation of accounting balances with the analytical position; and preparation of the notes to the financial statements.
We have also conducted tests to verify the integrity and completeness of the database used to calculate the allowance for loan losses, in addition to tests to verify the application of the calculation methodology for this allowance in relation to the ratings attributed, as well as the comparison of the account balances with the analytical reports.
We consider that the criteria and assumptions adopted by Management to determine and record the allowance for loan losses are consistent with those adopted for the prior year, and reasonable, in all material respects, in the context of the financial statements. |
|
|
|
|
BCOSANT17FC-PAR.DOCX
3
Banco Santander (Brasil) S.A.
Why it is a Key Audit Matter | How the matter was addressed in the audit |
|
|
Recognition and recoverable value of tax credits (Notes 3s, 3t and 11) |
|
|
|
The income tax and social contribution credits arising from temporary differences in the calculation bases of these taxes, as well as income tax and social contribution losses, are recognized in the books based on the expectation that future taxable profits will be available for their realization.
The expectation of tax credit realization is based on projections of future results that require judgment by Management, including the use of assumptions.
Considering the subjectivity inherent to this process, this matter remained an area of focus in our audit. | We carried out procedures to update our understanding and tested the significant internal controls that involve the calculation of these tax credits, as well as the estimates of the recoverable value of these tax credits, in accordance with the applicable standards of the National Monetary Council (CMN) and the Brazilian Central Bank.
We obtained an understanding of the critical assumptions included in result projections, and performed tests regarding the mathematical accuracy of the amounts estimated In addition, we compared the historical results projected with those actually obtained.
We performed tests to confirm the nature and amounts of the temporary differences, and income tax and social contribution losses that could be deducted from the future tax bases with the assistance of our experts in the tax area.
We discussed with Management and the Audit Committee, and confirmed the approval of the technical study that supports the realization of the tax credits by the proper management bodies.
We consider that the criteria and assumptions adopted by Management to determine and record the aforementioned tax credits are sound and reasonable, in all material respects, in the context of the financial statements. |
|
|
Provisions for contingent liabilities (Notes 3q and 23) |
|
|
|
Banco Santander and its subsidiaries are parties to tax, labor and civil proceedings, at the administrative and judicial levels, resulting from the normal course of their business.
In general, these proceedings are terminated after a long period and involve not only discussions on merits, but also complex procedural aspects, in accordance with applicable legislation.
The decision to recognize a contingent liability and the measurement bases require the judgment of the Bank's Management, which is periodically reassessed, including when preparing the financial statements, and considering new events. In the circumstances, this area remained as an area of focus in our audit. | We updated our understanding and tested the significant internal controls that involve the identification and recording of liabilities, and the disclosures in the notes to the financial statements, including, among others, the internal controls related to the calculation model adopted for the establishment of provisions for labor and civil contingencies, which are recorded under the average historical losses criterion, for claims considered common and similar in nature.
When applicable, we tested the application of the mathematical models for the calculation of the average historical losses related to the labor and civil contingencies. We also tested the quantity of outstanding proceedings at the base date of the financial statements.
We performed confirmation procedures with the law firms responsible for the significant administrative and judicial proceedings to confirm the assessment of the prognosis, also considering the new events that occurred during the year, the completeness of the information, and the correct amount of the provisions.
With the support of our experts, we updated our understanding with regard to the reasonableness of the estimate of loss in the most significant tax, labor and civil proceedings.
We consider that the criteria and assumptions adopted by Management to determine and record the provisions for contingent liabilities are consistent with those adopted for the prior year, and reasonable, in all material respects, in the context of the financial statements. |
|
|
|
|
BCOSANT17FC-PAR.DOCX
4
Banco Santander (Brasil) S.A.
Why it is a Key Audit Matter | How the matter was addressed in the audit |
|
|
|
|
Provision for post-employment benefit plans (Notes 3n and 35) |
|
|
|
The Bank has post-employment benefit plans with characteristics of defined benefit, arising from existing plans in institutions acquired in former years, whose amounts are significant in the context of the financial statements, and involve the need to use an adequate database, and the establishment of assumptions with a high degree of subjectivity, such as: discount, inflation and mortality rates.
This remained an area of focus in our audit, since changes in assumptions may result in significant impacts on the obligations related to defined benefit plans. In addition, the establishment of assumptions involves a significant degree of judgment by Management. | We carried out procedures to update our understanding and tested the significant internal controls that involve the recording and measurement of liabilities arising from post-employment benefit plans. Among others, our tests considered the controls related to the completeness and adequacy of the databases, the existence and correct amount of the assets of the benefit plans, and the approval of assumptions considered in the actuarial calculations.
We updated our understanding of the methodologies and judgments used by Management to determine the assumptions applied in the calculation of the obligations in comparison with market parameters.
We confirmed the consistency of the most significant assumptions adopted in the actuarial calculations with those adopted in the last annual actuarial assessment, and also evaluated the reasonableness of the changes in assumptions made by management.
Also, on a sample basis, we tested the existence and the recalculation of the fair value of the plan assets.
We consider that the criteria and assumptions adopted by Management to determine and record the provision for post-employment benefit plans are reasonable, in all material respects, in the context of the financial statements. |
|
|
|
|
BCOSANT17FC-PAR.DOCX
5
Banco Santander (Brasil) S.A.
Why it is a Key Audit Matter | How the matter was addressed in the audit |
|
|
|
|
Measurement of the fair value of certain financial instruments and derivatives with low liquidity and without an active market (Notes 3g, 3h and 6) |
|
|
|
The measurement of the fair value of financial instruments remained an area of focus of our audit due to its significance in the context of the financial statements, and the involvement of a high level of judgment by Management, since the measurement depend on valuation techniques carried out through internal models, which are based on certain assumptions for the valuation of instruments with low liquidity and without an active market and/or observable data. These financial instruments mostly comprise investments in securities issued by companies and derivative contracts. | We carried out procedures to update our understanding and tested the significant internal controls that involve the measurement, recognition and disclosure of the fair value of financial instruments and derivatives.
With the assistance of our experts in the pricing of financial instruments, we updated our understanding of the pricing calculation methodologies, analyzed the reasonableness of the assumptions used by Management to prepare pricing curves and internal models, and also verified the alignment of these assumptions and models with the practices adopted in the market.
We performed independent valuation tests of certain transactions, selected on sampling basis.
We consider that the criteria and assumptions adopted by Management to measure the fair value of these financial instruments and derivatives are reasonable, in all material respects, in the context of the financial statements.
|
|
|
|
|
BCOSANT17FC-PAR.DOCX
6
Banco Santander (Brasil) S.A.
Why it is a Key Audit Matter | How the matter was addressed in the audit |
|
|
|
|
Information technology environment |
|
|
|
Banco Santander (Brasil) S.A. has a business environment that is highly dependent on technology, requiring a complex infrastructure to support the high volume of transactions processed daily in its several systems.
The risks inherent to information technology, associated with deficiencies in processes and controls that support the processing of the technology systems, considering the legacy systems and existing technology environments, could result in the incorrect processing of critical information, including those used in the preparation of the financial statements. Therefore, this matter remained an area of focus in our audit. | With the assistance of our system experts, we reviewed our evaluation of the design and tested the operating effectiveness of the controls related to the management of the information technology environment, including the compensating controls established.
The procedures carried out involved the combination of the control tests, and, when applicable, the testing of compensating controls, as well as the conduction of tests regarding the key processes related to information security, the development and maintenance of systems, and the operation of computers related to the infrastructure that supports the Bank's business.
As a result of this work, we considered that the technology environment processes and controls provided a reasonable basis to determine the nature and extent of our audit procedures on the financial statements. |
|
|
|
|
Other matters
Statements of value added
The parent company and consolidated Statements of Value Added for the year ended December 31, 2017, prepared under the responsibility of the Bank's management, and whose presentation is required by the Brazilian corporate legislation for listed companies, but is considered supplementary information for BACEN purposes, were submitted to audit procedures performed in conjunction with our audit of the financial statements. For the purposes of forming our opinion, we evaluated whether these statements are reconciled with the financial statements and accounting records, as applicable, and if their form and content are in accordance with the criteria defined in Technical Pronouncement CPC 09 - "Statement of Value Added". In our opinion, these statements of value added have been properly prepared, in all material respects, in accordance with the criteria established in the Technical Pronouncement and are consistent with the parent company and consolidated financial statements taken as a whole.
BCOSANT17FC-PAR.DOCX
7
Banco Santander (Brasil) S.A.
Other information accompanying the parent company and consolidated financial statements and the auditor's report
The Bank's management is responsible for the other information that comprises the Management Report.
Our opinion on the parent company and consolidated financial statements does not cover the Management Report, and we do not express any form of audit conclusion thereon.
In connection with the audit of the parent company and consolidated financial statements, our responsibility is to read the Management Report and, in doing so, consider whether this report is materially inconsistent with the financial statements or our knowledge obtained in the audit or otherwise appears to be materially misstated. If, based on the work we have performed, we conclude that there is a material misstatement in the Management Report, we are required to report that fact.We have nothing to report in this regard.
Responsibilities of management and those charged with governance for the parent company and consolidated financial statements
Management is responsible for the preparation and fair presentation of the parent company and consolidated financial statements in accordance with accounting practices adopted in Brazil, applicable to institutions authorized to operate by the Brazilian Central Bank (BACEN), and for such internal control as management determines is necessary to enable the preparation of financial statements that are free from material misstatement, whether due to fraud or error.
In preparing the parent company and consolidated financial statements, management is responsible for assessing the ability of the Bank and its subsidiaries to continue as a going concern, disclosing, as applicable, matters related to going concern and using the going concern basis of accounting unless management either intends to liquidate the Bank and its subsidiaries or to cease operations, or has no realistic alternative but to do so.
Those charged with governance are responsible for overseeing the financial reporting process of the Bank and its subsidiaries.
Auditor's responsibilities for the audit of the parent company and consolidated financial statements
Our objectives are to obtain reasonable assurance about whether the parent company and consolidated financial statements as a whole are free from material misstatement, whether due to fraud or error, and to issue an auditor’s report that includes our opinion. Reasonable assurance is a high level of assurance, but is not a guarantee that an audit conducted in accordance with Brazilian and International Standards on Auditing will always detect a material misstatement when it exists. Misstatements can arise from fraud or error and are considered material if, individually or in the aggregate, they could reasonably be expected to influence the economic decisions of users taken on the basis of these financial statements.
As part of an audit in accordance with Brazilian and International Standards on Auditing, we exercise professional judgment and maintain professional skepticism throughout the audit. We also:
• Identify and assess the risks of material misstatement of the parent company and consolidated financial statements, whether due to fraud or error, design and perform audit procedures responsive to those risks, and obtain audit evidence that is sufficient and appropriate to provide a basis for our opinion. The risk of not detecting a material misstatement resulting from fraud is higher than for oneresulting from error, as fraud may involve collusion, forgery, intentional omissions, misrepresentations, or the override of internal control.
BCOSANT17FC-PAR.DOCX
8
Banco Santander (Brasil) S.A.
• Obtain an understanding of internal control relevant to the audit in order to design audit procedures that are appropriate in the circumstances, but not for the purpose of expressing an opinion on the effectiveness of the internal control of the Bank and its subsidiaries.
• Evaluate the appropriateness of accounting policies used and the reasonableness of accounting estimates and related disclosures made by management.
• Conclude on the appropriateness of management's use of the going concern basis of accounting and, based on the audit evidence obtained, whether a material uncertainty exists related to events or conditions that may cast significant doubt on the ability of the Bank and its subsidiaries to continue as a going concern. If we conclude that a material uncertainty exists, we are required to draw attention in our auditor’s report to the related disclosures in the parent company and consolidated financial statements or, if such disclosures are inadequate, to modify our opinion. Our conclusions are based on the audit evidence obtained up to the date of our auditor's report. However, future events or conditions may cause the Bank and its subsidiaries to cease to continue as a going concern.
• Evaluate the overall presentation, structure and content of the parent company and consolidated financial statements, including the disclosures, and whether the financial statements represent the underlying transactions and events in a manner that achieves fair presentation.
• Obtain sufficient appropriate audit evidence regarding the financial information of the entities or business activities within the Group to express an opinion on the consolidated financial statements. We are responsible for the direction, supervision and performance of the group audit. We remain solely responsible for our audit opinion.
We communicate with those charged with governance regarding, among other matters, the planned scope and timing of the audit and significant audit findings, including any significant deficiencies in internal control that we identify during our audit.
We also provide those charged with governance with a statement that we have complied with relevant ethical requirements regarding independence, and to communicate with them all relationships and other matters that may reasonably be thought to bear on our independence, and where applicable, related safeguards.
From the matters communicated with those charged with governance, we determine those matters that were of most significance in the audit of the financial statements of the current period and are therefore the key audit matters. We describe these matters in our auditor’s report unless law or regulation precludes public disclosure about the matter or when, in extremely rare circumstances, we determine that a matter should not be communicated in our report because the adverse consequences of doing so would reasonably be expected to outweigh the public interest benefits of such communication.
São Paulo, January 29, 2018
PricewaterhouseCoopers Auditores Independentes CRC 2SP000160/O-5 | Edison Arisa Pereira Contador CRC 1SP127241/O-0 |
BCOSANT17FC-PAR.DOCX
9
(Free Translation into English from the Original Previously Issued in Portuguese) | |
BANCO SANTANDER (BRASIL) S.A. AND SUBSIDIARIES | |
In thousands of Brazilian Real - R$, unless otherwise stated | |
Bank | Consolidated | |||||||||
|
| Notes |
| 12/31/2017 |
| 12/31/2016 |
| 12/31/2017 |
| 12/31/2016 |
Current Assets |
|
|
| 378,400,031 |
| 451,755,119 |
| 411,052,577 |
| 451,815,929 |
Cash |
| 4 |
| 11,148,561 |
| 5,513,365 |
| 11,234,369 |
| 5,723,084 |
Interbank Investments |
| 5 |
| 71,055,301 |
| 80,312,979 |
| 46,240,236 |
| 59,513,115 |
Money Market Investments |
|
|
| 34,414,303 |
| 47,405,162 |
| 34,484,321 |
| 47,479,196 |
Interbank Deposits |
|
|
| 27,226,866 |
| 21,909,362 |
| 2,341,195 |
| 1,034,414 |
Foreign Currency Investments |
|
|
| 9,414,132 |
| 10,998,455 |
| 9,414,720 |
| 10,999,505 |
Securities and Derivative Financial |
|
|
|
|
|
|
|
|
|
|
Instruments |
| 6 |
| 59,009,344 |
| 97,187,849 |
| 74,425,223 |
| 90,341,153 |
Own Portfolio |
|
|
| 21,749,034 |
| 40,300,328 |
| 29,592,305 |
| 40,293,749 |
Subject to Repurchase Commitments |
|
|
| 28,459,543 |
| 45,744,640 |
| 21,716,051 |
| 29,724,515 |
Derivative Financial Instruments |
|
|
| 6,059,567 |
| 11,087,166 |
| 16,213,994 |
| 17,307,264 |
Deposited in the Central Bank |
|
|
| 8,803 |
| 12,379 |
| 71,234 |
| 12,378 |
Privatization Currencies |
|
|
| 727 |
| 927 |
| 727 |
| 927 |
Pledged in Guarantees |
|
|
| 2,731,670 |
| 42,409 |
| 6,830,912 |
| 3,002,320 |
Interbank Accounts |
| 7 |
| 69,209,753 |
| 62,355,313 |
| 82,230,408 |
| 62,732,413 |
Payments and Receipts Pending Settlement |
|
|
| 6,577,308 |
| 1,179 |
| 19,200,600 |
| 1,179 |
Restricted Deposits: |
|
|
| 62,386,433 |
| 60,823,290 |
| 62,783,796 |
| 61,200,390 |
Central Bank Deposits |
|
|
| 62,384,107 |
| 60,821,548 |
| 62,781,470 |
| 61,198,648 |
National Housing System (SFH) |
|
|
| 2,326 |
| 1,742 |
| 2,326 |
| 1,742 |
Interbank Transfers |
|
|
| 227,630 |
| 1,507,241 |
| 227,630 |
| 1,507,241 |
Correspondents |
|
|
| 18,382 |
| 23,603 |
| 18,382 |
| 23,603 |
Lending Operations |
| 8 |
| 70,472,211 |
| 72,774,540 |
| 94,049,534 |
| 93,929,025 |
Public Sector |
|
|
| 11,926 |
| 3,024 |
| 11,926 |
| 3,024 |
Private Sector |
|
|
| 73,988,046 |
| 76,601,989 |
| 98,139,434 |
| 97,941,488 |
Lending Operations Assignment |
|
|
| - |
| - |
| 56,964 |
| 460,090 |
(Allowance for Loan Losses) |
| 8.f |
| (3,527,761) |
| (3,830,473) |
| (4,158,790) |
| (4,475,577) |
Leasing Operations |
| 8 |
| - |
| 4 |
| 1,324,768 |
| 1,492,080 |
Private Sector |
|
|
| - |
| 5 |
| 1,344,466 |
| 1,518,203 |
(Allowance for Lease Losses) |
| 8.f |
| - |
| (1) |
| (19,698) |
| (26,123) |
Other Receivables |
|
|
| 96,370,493 |
| 132,633,521 |
| 99,869,384 |
| 136,311,891 |
Credits for Avals and Sureties Honored |
|
|
| 39,186 |
| 1,062 |
| 39,186 |
| 1,062 |
Foreign Exchange Portfolio |
| 9 |
| 53,370,513 |
| 89,829,757 |
| 53,370,513 |
| 89,829,757 |
Income Receivable |
|
|
| 2,238,371 |
| 1,459,653 |
| 1,731,330 |
| 747,168 |
Trading Account |
| 10 |
| 985,646 |
| 1,527,178 |
| 1,215,473 |
| 1,695,397 |
Deferred Taxes |
| 11 |
| 3,340,220 |
| 8,234,581 |
| 3,815,576 |
| 9,102,267 |
Others |
| 12 |
| 36,821,967 |
| 31,949,644 |
| 40,171,446 |
| 35,349,654 |
(Allowance for Other Receivables Losses) |
| 8.f |
| (425,410) |
| (368,354) |
| (474,140) |
| (413,414) |
Other Assets |
|
|
| 1,134,368 |
| 977,548 |
| 1,678,655 |
| 1,773,168 |
Non-Current Assets Held for Sale |
| 13 |
| 130,713 |
| - |
| 130,713 |
| - |
Other Assets |
|
|
| 906,375 |
| 740,639 |
| 1,374,193 |
| 1,317,152 |
(Allowance for Valuation) |
|
|
| (276,575) |
| (78,412) |
| (350,829) |
| (78,413) |
Prepaid Expenses |
|
|
| 373,855 |
| 315,321 |
| 524,578 |
| 534,429 |
Long-Term Assets |
|
|
| 278,811,570 |
| 274,424,155 |
| 261,508,030 |
| 236,857,511 |
Interbank Investments |
| 5 |
| 21,840,772 |
| 14,812,506 |
| 520,440 |
| 156,126 |
Interbank Deposits |
|
|
| 21,840,772 |
| 14,812,506 |
| 520,440 |
| 156,126 |
Securities and Derivative Financial |
|
|
|
|
|
|
|
|
|
|
Instruments |
| 6 |
| 125,931,316 |
| 126,433,127 |
| 97,304,451 |
| 79,248,514 |
Own Portfolio |
|
|
| 32,371,256 |
| 28,560,600 |
| 29,610,935 |
| 19,747,415 |
Subject to Repurchase Commitments |
|
|
| 76,572,322 |
| 80,468,239 |
| 49,322,185 |
| 40,450,482 |
Derivative Financial Instruments |
|
|
| 5,244,306 |
| 6,763,824 |
| 5,329,774 |
| 6,768,692 |
Deposited with the Central Bank |
|
|
| 2,223,899 |
| 3,032,518 |
| 2,296,355 |
| 3,032,518 |
Privatization Currencies |
|
|
| 1,278 |
| 1,846 |
| 1,278 |
| 1,846 |
Pledged in Guarantees |
|
|
| 4,426,641 |
| 7,606,100 |
| 5,652,310 |
| 9,247,561 |
Securities Obtained from Commitments with Free Mover |
|
|
| 5,091,614 |
| - |
| 5,091,614 |
| - |
Interbank Accounts |
| 7 |
| 273,430 |
| 167,818 |
| 273,430 |
| 167,818 |
Restricted Deposits: |
|
|
| 273,430 |
| 167,818 |
| 273,430 |
| 167,818 |
National Housing System (SFH) |
|
|
| 273,430 |
| 167,818 |
| 273,430 |
| 167,818 |
Lending Operations |
| 8 |
| 86,203,176 |
| 84,068,998 |
| 111,247,107 |
| 101,366,048 |
Public Sector |
|
|
| 46,974 |
| 63,205 |
| 46,974 |
| 63,205 |
Private Sector |
|
|
| 97,425,089 |
| 96,120,967 |
| 123,159,231 |
| 114,148,328 |
Lending Operations Related to Assignment |
|
|
| 166,982 |
| 164,402 |
| 248,955 |
| 164,402 |
(Allowance for Loan Losses) |
| 8.f |
| (11,435,869) |
| (12,279,576) |
| (12,208,053) |
| (13,009,887) |
Leasing Operations |
| 8 |
| - |
| 2 |
| 1,200,133 |
| 1,332,698 |
Private Sector |
|
|
| 1 |
| 2 |
| 1,252,872 |
| 1,363,828 |
(Allowance for Lease Losses) |
| 8.f |
| (1) |
| - |
| (52,739) |
| �� (31,130) |
Other Receivables |
|
|
| 44,068,296 |
| 48,306,300 |
| 50,334,627 |
| 53,750,238 |
Receivables for Guarantees Honored |
|
|
| 315,956 |
| 53,524 |
| 315,956 |
| 53,524 |
Foreign Exchange Portfolio |
| 9 |
| 6,748,712 |
| 2,316,371 |
| 6,748,712 |
| 2,316,371 |
Income Receivable |
|
|
| 223,648 |
| 213,362 |
| 223,648 |
| 213,362 |
Deferred Taxes |
| 11 |
| 19,552,697 |
| 15,548,383 |
| 22,344,067 |
| 17,664,421 |
Others |
| 12 |
| 17,705,459 |
| 30,476,712 |
| 21,250,798 |
| 33,879,141 |
(Allowance for Other Receivables Losses) |
| 8.f |
| (478,176) |
| (302,052) |
| (548,554) |
| (376,581) |
Other Assets |
|
|
| 494,580 |
| 635,404 |
| 627,842 |
| 836,069 |
Temporary Assets |
|
|
| 1,765 |
| 101,801 |
| 1,773 |
| 101,809 |
(Allowance for Losses) |
|
|
| (1,765) |
| (1,765) |
| (1,773) |
| (1,773) |
Prepaid Expenses |
|
|
| 494,580 |
| 535,368 |
| 627,842 |
| 736,033 |
|
|
|
|
|
|
|
|
|
|
|
Permanent Assets |
|
|
| 27,402,426 |
| 26,807,262 |
| 11,171,605 |
| 13,031,097 |
Investments |
|
|
| 17,983,953 |
| 16,500,112 |
| 370,946 |
| 177,813 |
Investments in Affiliates and Subsidiaries: |
| 15 |
| 17,963,316 |
| 16,480,840 |
| 350,053 |
| 158,548 |
Domestic |
|
|
| 14,929,728 |
| 13,928,244 |
| 350,053 |
| 158,548 |
Foreign |
|
|
| 3,033,588 |
| 2,552,596 |
| - |
| - |
Other Investments |
|
|
| 46,556 |
| 51,830 |
| 52,325 |
| 62,879 |
(Allowance for Losses) |
|
|
| (25,919) |
| (32,558) |
| (31,432) |
| (43,614) |
Fixed Assets |
| 16 |
| 5,804,626 |
| 6,043,158 |
| 6,395,684 |
| 7,550,743 |
Real Estate in Use |
|
|
| 2,496,780 |
| 2,538,788 |
| 2,597,407 |
| 2,857,794 |
Others Fixed Assets |
|
|
| 11,642,294 |
| 10,923,912 |
| 12,801,568 |
| 12,932,316 |
(Accumulated Depreciation) |
|
|
| (8,334,448) |
| (7,419,542) |
| (9,003,291) |
| (8,239,367) |
Intangible Assets |
| 17 |
| 3,613,847 |
| 4,263,992 |
| 4,404,975 |
| 5,302,541 |
Goodwill |
|
|
| 26,419,016 |
| 26,120,037 |
| 27,758,074 |
| 27,474,881 |
Others Intangible Assets |
|
|
| 8,964,796 |
| 8,590,069 |
| 9,508,395 |
| 9,142,961 |
(Accumulated Amortization) |
|
|
| (31,769,965) |
| (30,446,114) |
| (32,861,494) |
| (31,315,301) |
Total Assets |
|
|
| 684,614,027 |
| 752,986,536 |
| 683,732,212 |
| 701,704,537 |
Current Liabilities |
|
|
| 459,722,481 |
| 542,620,235 |
| 451,559,710 |
| 483,912,382 |
Deposits |
| 18.a |
| 166,797,454 |
| 158,705,975 |
| 144,589,321 |
| 97,394,726 |
Demand Deposits |
|
|
| 17,133,923 |
| 16,016,316 |
| 17,176,981 |
| 16,006,319 |
Savings Deposits |
|
|
| 40,572,369 |
| 36,051,476 |
| 40,572,369 |
| 36,051,476 |
Interbank Deposits |
|
|
| 24,698,773 |
| 62,843,599 |
| 2,811,654 |
| 2,240,291 |
Time Deposits |
|
|
| 84,392,389 |
| 43,794,584 |
| 84,018,316 |
| 43,096,551 |
Other Deposits |
|
|
| - |
| - |
| 10,001 |
| 89 |
Money Market Funding |
| 18.b |
| 110,346,900 |
| 132,400,766 |
| 97,601,475 |
| 121,760,781 |
Own Portfolio |
|
|
| 103,622,592 |
| 114,772,683 |
| 96,878,750 |
| 113,137,300 |
Third Parties |
|
|
| 6,259,682 |
| 14,799,595 |
| 258,099 |
| 5,794,993 |
Linked to Trading Portfolio Operations |
|
|
| 464,626 |
| 2,828,488 |
| 464,626 |
| 2,828,488 |
Funds from Acceptance and Issuance of |
|
|
|
|
|
|
|
|
|
|
Securities |
| 18.c |
| 50,482,288 |
| 79,435,491 |
| 52,115,435 |
| 81,262,272 |
Exchange Acceptances |
|
|
| - |
| - |
| 639,835 |
| 553,811 |
Real Estate Credit Notes, Mortgage Notes, |
|
|
|
|
|
|
|
|
|
|
Credit and Similar Notes |
|
|
| 48,167,503 |
| 70,650,037 |
| 49,160,815 |
| 71,923,007 |
Securities Issued Abroad |
|
|
| 1,272,494 |
| 7,673,171 |
| 1,272,494 |
| 7,673,171 |
Funding by Structured Operations Certificates |
| 1,042,291 |
| 1,112,283 |
| 1,042,291 |
| 1,112,283 | ||
Interbank Accounts |
| 7 |
| 60,378 |
| 43,995 |
| 264,390 |
| 43,995 |
Receipts and Payments Pending Settlement |
|
|
| - |
| - |
| 191,727 |
| - |
Interbank Transfers |
|
|
| - |
| - |
| 12,285 |
| - |
Correspondents |
|
|
| 60,378 |
| 43,995 |
| 60,378 |
| 43,995 |
Interbranch Accounts |
|
|
| 4,274,512 |
| 3,886,513 |
| 4,274,512 |
| 3,886,557 |
Third-Party Funds in Transit |
|
|
| 4,273,771 |
| 3,886,121 |
| 4,273,771 |
| 3,886,121 |
Internal Transfers of Assets |
|
|
| 741 |
| 392 |
| 741 |
| 436 |
Borrowings |
| 18.e |
| 33,061,035 |
| 29,839,343 |
| 32,027,306 |
| 28,557,611 |
Local Borrowings - Other Institutions |
|
|
| - |
| - |
| 77,087 |
| 41,667 |
Foreign Borrowings |
|
|
| 33,061,035 |
| 29,839,343 |
| 31,950,219 |
| 28,515,944 |
Domestic Onlendings - Official Institutions | 18.e |
| 6,224,384 |
| 4,981,107 |
| 6,224,384 |
| 4,981,107 | |
National Economic and Social Development |
|
|
|
|
|
|
|
|
|
|
Bank (BNDES) |
|
|
| 3,479,329 |
| 2,422,382 |
| 3,479,329 |
| 2,422,382 |
Federal Savings and Loan Bank (CEF) |
|
|
| 3,632 |
| 4,023 |
| 3,632 |
| 4,023 |
National Equipment Financing Authority (FINAME) |
| 2,505,707 |
| 2,321,457 |
| 2,505,707 |
| 2,321,457 | ||
Other Institutions |
|
|
| 235,716 |
| 233,245 |
| 235,716 |
| 233,245 |
Derivative Financial Instruments |
| 6 |
| 5,797,638 |
| 8,442,552 |
| 15,943,399 |
| 14,585,133 |
Derivative Financial Instruments |
|
|
| 5,797,638 |
| 8,442,552 |
| 15,943,399 |
| 14,585,133 |
Other Payables |
|
|
| 82,677,892 |
| 124,884,493 |
| 98,519,488 |
| 131,440,200 |
Collected Taxes and Other |
|
|
| 139,321 |
| 136,701 |
| 168,067 |
| 165,173 |
Foreign Exchange Portfolio |
| 9 |
| 48,664,949 |
| 84,631,442 |
| 48,664,949 |
| 84,631,442 |
Social and Statutory |
|
|
| 4,951,781 |
| 4,591,369 |
| 5,019,442 |
| 4,707,285 |
Tax and Social Security |
| 19 |
| 1,555,596 |
| 1,891,028 |
| 2,585,381 |
| 2,442,614 |
Trading Account |
| 10 |
| 83,848 |
| 971,989 |
| 607,274 |
| 1,236,059 |
Subordinated Debt |
| 20 |
| 519,230 |
| - |
| 519,230 |
| - |
Debt Instruments Eligible to Compose Capital |
| 21 |
| 114,104 |
| 114,104 |
| 114,104 |
| 114,104 |
Others |
| 22 |
| 26,649,063 |
| 32,547,860 |
| 40,841,041 |
| 38,143,523 |
Long-Term Liabilities |
|
|
| 165,044,386 |
| 152,246,637 |
| 170,264,470 |
| 156,930,276 |
Deposits |
| 18.a |
| 63,170,609 |
| 50,153,678 |
| 58,942,822 |
| 48,310,437 |
Interbank Deposits |
|
|
| 3,014,560 |
| 2,253,495 |
| 480,468 |
| 882,147 |
Time Deposits |
|
|
| 60,156,049 |
| 47,900,183 |
| 58,462,354 |
| 47,428,290 |
Money Market Funding |
| 18.b |
| 32,360,542 |
| 39,162,956 |
| 32,360,542 |
| 39,162,956 |
Own Portfolio |
|
|
| 294,454 |
| 10,440,823 |
| 294,454 |
| 10,440,823 |
Linked to Trading Portfolio Operations |
|
|
| 32,066,088 |
| 28,722,133 |
| 32,066,088 |
| 28,722,133 |
Funds from Acceptance and Issuance of |
|
|
|
|
|
|
|
|
|
|
Securities |
| 18.c |
| 21,754,723 |
| 21,626,157 |
| 24,541,042 |
| 23,907,802 |
Exchange Acceptances |
|
|
| - |
| - |
| 537,344 |
| 536,444 |
Real Estate Credit Notes, Mortgage Notes, |
|
|
|
|
|
|
|
|
|
|
Credit and Similar Notes |
|
|
| 20,086,361 |
| 21,453,818 |
| 22,335,336 |
| 23,199,019 |
Securities Issued Abroad |
|
|
| 720,387 |
| 49,031 |
| 720,387 |
| 49,031 |
Funding by Structured Operations Certificates |
| 947,975 |
| 123,308 |
| 947,975 |
| 123,308 | ||
Borrowings |
| 18.e |
| 1,381,924 |
| 1,638,173 |
| 1,443,306 |
| 2,042,406 |
Local Borrowings - Other Institutions |
|
|
| 476,876 |
| - |
| 538,258 |
| 404,233 |
Foreign Borrowings |
|
|
| 905,048 |
| 1,638,173 |
| 905,048 |
| 1,638,173 |
Domestic Onlendings - Official Institutions | 18.e |
| 10,411,313 |
| 11,821,538 |
| 10,411,313 |
| 11,821,538 | |
National Economic and Social Development |
|
|
|
|
|
|
|
|
|
|
Bank (BNDES) |
|
|
| 5,981,081 |
| 7,000,580 |
| 5,981,081 |
| 7,000,580 |
Federal Savings and Loan Bank (CEF) |
|
|
| 86,621 |
| 95,720 |
| 86,621 |
| 95,720 |
National Equipment Financing Authority (FINAME) |
| 4,339,195 |
| 4,719,077 |
| 4,339,195 |
| 4,719,077 | ||
Other Institutions |
|
|
| 4,416 |
| 6,161 |
| 4,416 |
| 6,161 |
Derivative Financial Instruments |
| 6 |
| 4,610,657 |
| 5,185,103 |
| 4,737,485 |
| 5,359,381 |
Derivative Financial Instruments |
|
|
| 4,610,657 |
| 5,185,103 |
| 4,737,485 |
| 5,359,381 |
Other Payables |
|
|
| 31,354,618 |
| 22,659,032 |
| 37,827,960 |
| 26,325,756 |
Foreign Exchange Portfolio |
| 9 |
| 6,652,981 |
| 2,121,659 |
| 6,652,981 |
| 2,121,659 |
Tax and Social Security |
| 19 |
| 1,848,736 |
| 983,070 |
| 2,284,919 |
| 1,260,300 |
Negotiation and Intermediation of Securities |
| 10 |
| - |
| 1,386 |
| - |
| 1,386 |
Subordinated Debts |
| 20 |
| - |
| 466,246 |
| - |
| 466,246 |
Debt Instruments Eligible to Compose Capital |
| 21 |
| 8,325,451 |
| 8,200,695 |
| 8,325,451 |
| 8,200,695 |
Others |
| 22 |
| 14,527,450 |
| 10,885,976 |
| 20,564,609 |
| 14,275,470 |
|
|
|
|
|
|
|
|
|
|
|
Deferred Income |
|
|
| 353,214 |
| 365,087 |
| 511,386 |
| 564,609 |
Deferred Income |
|
|
| 353,214 |
| 365,087 |
| 511,386 |
| 564,609 |
|
|
|
|
|
|
|
|
|
|
|
Stockholders' Equity |
| 24 |
| 59,493,946 |
| 57,754,577 |
| 59,499,954 |
| 57,771,524 |
Capital: |
|
|
| 57,000,000 |
| 57,000,000 |
| 57,000,000 |
| 57,000,000 |
Brazilian Residents |
|
|
| 4,808,186 |
| 4,808,186 |
| 4,808,186 |
| 4,808,186 |
Foreign Residents |
|
|
| 52,191,814 |
| 52,191,814 |
| 52,191,814 |
| 52,191,814 |
Capital Reserves |
|
|
| 172,398 |
| 395,925 |
| 174,616 |
| 396,951 |
Profit Reserves |
|
|
| 4,054,160 |
| 3,024,381 |
| 4,057,950 |
| 3,039,459 |
Adjustment to Fair Value |
|
|
| (1,584,172) |
| (2,151,695) |
| (1,584,172) |
| (2,150,852) |
(-) Treasury Shares | (148,440) |
| (514,034) |
| (148,440) |
| (514,034) | |||
|
|
|
|
|
|
|
|
|
|
|
Non Controlling Interest |
| 24.f |
| - |
| - |
| 1,896,692 |
| 2,525,746 |
Total Stockholders' Equity |
|
|
| 59,493,946 |
| 57,754,577 |
| 61,396,646 |
| 60,297,270 |
|
|
|
|
|
|
|
|
|
|
|
Total Liabilities |
|
|
| 684,614,027 |
| 752,986,536 |
| 683,732,212 |
| 701,704,537 |
The accompanying notes from Management are an integral part of these financial statements. | ||||||||||
(Free Translation into English from the Original Previously Issued in Portuguese) | |
BANCO SANTANDER (BRASIL) S.A. AND SUBSIDIARIES | |
In thousands of Brazilian Real - R$, unless otherwise stated | |
Bank | Consolidated | |||||||||||||
07/01 to | 01/01 to | 01/01 to | 07/01 to | 01/01 to | 01/01 to | |||||||||
|
| Notes |
| 12/31/2017 |
| 12/31/2017 |
| 12/31/2016 |
| 12/31/2017 |
| 12/31/2017 |
| 12/31/2016 |
Income Related to Financial Operations |
|
|
| 34,147,491 |
| 73,926,572 |
| 90,968,893 |
| 36,584,147 |
| 76,310,782 |
| 85,909,559 |
Loan Operations |
|
|
| 18,197,834 |
| 36,958,966 |
| 31,641,657 |
| 23,608,151 |
| 47,222,446 |
| 40,296,634 |
Leasing Operations |
|
|
| - |
| - |
| - |
| 188,082 |
| 398,976 |
| 453,092 |
Securities Transactions |
| 6.a |
| 12,527,138 |
| 27,483,677 |
| 36,831,272 |
| 9,356,461 |
| 19,098,663 |
| 23,466,402 |
Derivatives Transactions |
|
|
| 649,655 |
| 1,665,959 |
| 6,833,349 |
| 648,135 |
| 1,741,704 |
| 5,853,244 |
Foreign Exchange Operations |
|
|
| 358,286 |
| 2,279,894 |
| 8,597,403 |
| 349,027 |
| 2,268,573 |
| 8,730,862 |
Operations of Sale or Transfer of Financial Assets |
|
|
| - |
| - |
| 626 |
| 6,824 |
| 11,299 |
| 6,057 |
Compulsory Deposits |
|
|
| 2,414,578 |
| 5,538,076 |
| 7,064,586 |
| 2,427,467 |
| 5,569,121 |
| 7,103,268 |
|
|
|
|
|
|
|
|
|
|
|
|
|
|
|
Expenses on Financial Operations |
|
|
| (22,631,613) |
| (52,386,868) |
| (67,657,273) |
| (22,167,702) |
| (49,363,680) |
| (59,111,741) |
Funding Operations Market |
| 18.d |
| (16,816,708) |
| (39,994,951) |
| (61,042,902) |
| (15,246,700) |
| (34,944,603) |
| (50,546,182) |
Borrowings and Onlendings Operations |
|
|
| (865,172) |
| (2,256,706) |
| 5,002,138 |
| (1,103,357) |
| (2,640,276) |
| 4,674,222 |
Leasing Operations |
|
|
| (49) |
| (68) |
| (161) |
| - |
| - |
| - |
Allowance for Loan Losses |
| 8.f |
| (4,949,684) |
| (10,135,143) |
| (11,616,348) |
| (5,817,645) |
| (11,778,801) |
| (13,239,781) |
|
|
|
|
|
|
|
|
|
|
|
|
|
|
|
Gross Income Related to Financial Operations |
|
|
| 11,515,878 |
| 21,539,704 |
| 23,311,620 |
| 14,416,445 |
| 26,947,102 |
| 26,797,818 |
|
|
|
|
|
|
|
|
|
|
|
|
|
|
|
Other Operating Revenues (Expenses) |
|
|
| (5,172,988) |
| (10,070,891) |
| (10,249,408) |
| (7,134,583) |
| (13,559,096) |
| (13,018,924) |
Banking Service Fees |
| 27 |
| 4,554,409 |
| 8,781,721 |
| 8,516,904 |
| 5,909,040 |
| 11,382,843 |
| 10,307,587 |
Income Related to Bank Charges |
| 27 |
| 1,834,812 |
| 3,479,607 |
| 2,791,600 |
| 2,200,425 |
| 4,227,916 |
| 3,410,665 |
Personnel Expenses |
| 28 |
| (3,564,256) |
| (6,989,522) |
| (6,882,891) |
| (3,890,801) |
| (7,631,464) |
| (7,594,675) |
Other Administrative Expenses |
| 29 |
| (5,197,268) |
| (10,153,832) |
| (9,742,549) |
| (6,040,084) |
| (11,724,618) |
| (11,309,008) |
Tax Expenses |
| 30 |
| (1,445,306) |
| (2,774,709) |
| (3,326,637) |
| (1,858,036) |
| (3,587,475) |
| (4,043,926) |
Investments in Affiliates and Subsidiaries |
| 15 |
| 1,194,348 |
| 2,076,992 |
| 1,418,525 |
| 9,270 |
| 25,279 |
| 1,477 |
Other Operating Revenues |
| 31 |
| 1,772,997 |
| 3,485,641 |
| 3,438,806 |
| 2,016,378 |
| 4,056,243 |
| 4,202,967 |
Other Operating Expenses |
| 32 |
| (4,322,724) |
| (7,976,789) |
| (6,463,166) |
| (5,480,775) |
| (10,307,820) |
| (7,994,011) |
|
|
|
|
|
|
|
|
|
|
|
|
|
|
|
Operating Income |
|
|
| 6,342,890 |
| 11,468,813 |
| 13,062,212 |
| 7,281,862 |
| 13,388,006 |
| 13,778,894 |
|
|
|
|
|
|
|
|
|
|
|
|
|
|
|
Non-Operating Income |
| 33 |
| 73,156 |
| (139,032) |
| (431,997) |
| 18,482 |
| (259,595) |
| (415,601) |
|
|
|
|
|
|
|
|
|
|
|
|
|
|
|
Income Before Taxes on Income and Profit Sharing |
| 6,416,046 |
| 11,329,781 |
| 12,630,215 |
| 7,300,344 |
| 13,128,411 |
| 13,363,293 | ||
|
|
|
|
|
|
|
|
|
|
|
|
|
|
|
Income Tax and Social Contribution |
| 34 |
| (1,366,725) |
| (1,950,138) |
| (5,972,044) |
| (2,009,417) |
| (3,278,291) |
| (6,496,717) |
Provision for Income Tax |
|
|
| 115,771 |
| (618,223) |
| (234,779) |
| (361,986) |
| (1,528,168) |
| (595,075) |
Provision for Social Contribution Tax |
|
|
| 243,404 |
| (314,545) |
| (364,910) |
| (77,873) |
| (959,170) |
| (641,669) |
Deferred Tax Credits |
|
|
| (1,725,900) |
| (1,017,370) |
| (5,372,355) |
| (1,569,558) |
| (790,953) |
| (5,259,973) |
|
|
|
|
|
|
|
|
|
|
|
|
|
|
|
Profit Sharing |
|
|
| (761,640) |
| (1,383,771) |
| (1,136,534) |
| (795,081) |
| (1,460,009) |
| (1,208,821) |
|
|
|
|
|
|
|
|
|
|
|
|
|
|
|
Non Controlling Interest |
| 24.f |
| - |
| - |
| - |
| (203,190) |
| (393,534) |
| (124,793) |
|
|
|
|
|
|
|
|
|
|
|
|
|
|
|
Net Income |
|
|
| 4,287,681 |
| 7,995,872 |
| 5,521,637 |
| 4,292,656 |
| 7,996,577 |
| 5,532,962 |
|
|
|
|
|
|
|
|
|
|
|
|
|
|
|
Number of Shares (Thousands) |
| 24.a |
| 7,486,841 |
| 7,486,841 |
| 7,511,511 |
|
|
|
|
|
|
Net Income per Thousand Shares (R$) |
|
|
| 572.70 |
| 1,067.99 |
| 735.09 |
|
|
|
|
|
|
The accompanying notes from Management are an integral part of these financial statements. | ||||||||||||||
(Free Translation into English from the Original Previously Issued in Portuguese) | |
BANCO SANTANDER (BRASIL) S.A. AND SUBSIDIARIES | |
In thousands of Brazilian Real - R$, unless otherwise stated | |
Profit Reserves | Adjustment to Fair Value |
| |||||||||||||||||||
Reserve for | Others | ||||||||||||||||||||
Capital | Legal | Dividend | Own | Affiliates and | Adjustment | Retained | (-)Treasury | ||||||||||||||
| Notes |
| Capital |
| Reserves |
| Reserve |
| Equalization |
| Position |
| Subsidiaries |
| to Fair Value |
| Earnings |
| Shares |
| Total |
|
|
|
|
|
|
|
|
|
|
|
|
|
|
|
|
|
|
|
|
|
|
Balances as of December 31, 2015 |
|
| 57,000,000 |
| 433,473 |
| 1,838,374 |
| 914,370 |
| (3,657,416) |
| (141,913) |
| (1,141,646) |
| - |
| (423,953) |
| 54,821,289 |
Employee Benefit Plan |
|
| - |
| - |
| - |
| - |
| - |
| - |
| (941,834) |
| - |
| - |
| (941,834) |
Treasury Shares | 24.d |
| - |
| - |
| - |
| - |
| - |
| - |
| - |
| - |
| (90,031) |
| (90,031) |
Result of Treasury Shares | 24.d |
| - |
| (11,574) |
| - |
| - |
| - |
| - |
| - |
| - |
| - |
| (11,574) |
Reservations for Share - Based Payment |
|
| - |
| (33,130) |
| - |
| - |
| - |
| - |
| - |
| - |
| - |
| (33,130) |
Adjustment to Fair Value - Securities and | |||||||||||||||||||||
Derivative Financial Instruments |
|
| - |
| - |
| - |
| - |
| 3,520,603 |
| 210,511 |
| - |
| - |
| - |
| 3,731,114 |
Restructuring of Capital | 24.d |
| - |
| - |
| - |
| - |
| - |
| - |
| - |
| - |
| (50) |
| (50) |
Dividends based on the Dividend Equalization Reserve | 24.b |
| - |
| - |
| - |
| (700,000) |
| - |
| - |
| - |
| - |
| - |
| (700,000) |
Net Income |
|
| - |
| - |
| - |
| - |
| - |
| - |
| - |
| 5,521,637 |
| - |
| 5,521,637 |
Appropriations: |
|
|
|
|
|
|
|
|
|
|
|
|
|
|
|
|
|
|
|
|
|
Legal Reserve | 24.c |
| - |
| - |
| 276,082 |
| - |
| - |
| - |
| - |
| (276,082) |
| - |
| - |
Dividends | 24.b |
| - |
| - |
| - |
| - |
| - |
| - |
| - |
| (700,000) |
| - |
| (700,000) |
Interest on Capital | 24.b |
| - |
| - |
| - |
| - |
| - |
| - |
| - |
| (3,850,000) |
| - |
| (3,850,000) |
Reserve for Dividend Equalization | 24.c |
| - |
| - |
| - |
| 695,555 |
| - |
| - |
| - |
| (695,555) |
| - |
| - |
Others |
|
| - |
| 7,156 |
| - |
| - |
| - |
| - |
| - |
| - |
| - |
| 7,156 |
Balances as of December 31, 2016 |
|
| 57,000,000 |
| 395,925 |
| 2,114,456 |
| 909,925 |
| (136,813) |
| 68,598 |
| (2,083,480) |
| - |
| (514,034) |
| 57,754,577 |
Changes in the Exercise |
|
| - |
| (37,548) |
| 276,082 |
| (4,445) |
| 3,520,603 |
| 210,511 |
| (941,834) |
| - |
| (90,081) |
| 2,933,288 |
|
|
|
|
|
|
|
|
|
|
|
|
|
|
|
|
|
|
|
|
|
|
Balances as of December 31, 2016 |
|
| 57,000,000 |
| 395,925 |
| 2,114,456 |
| 909,925 |
| (136,813) |
| 68,598 |
| (2,083,480) |
| - |
| (514,034) |
| 57,754,577 |
Employee Benefit Plans |
|
| - |
| - |
| - |
| - |
| - |
| - |
| (620,903) |
| - |
| - |
| (620,903) |
Treasury Shares | 24.d |
| - |
| (257,602) |
| - |
| (486,815) |
| - |
| - |
| - |
| - |
| 365,643 |
| (378,774) |
Result of Treasury Shares | 24.d |
| - |
| (2,498) |
| - |
| - |
| - |
| - |
| - |
| - |
| - |
| (2,498) |
Reservations for Share - Based Payment |
|
| - |
| 36,573 |
| - |
| - |
| - |
| - |
| - |
| - |
| - |
| 36,573 |
Adjustment to Fair Value - Securities and | |||||||||||||||||||||
Derivative Financial Instruments |
|
| - |
| - |
| - |
| - |
| 1,167,376 |
| 21,050 |
| - |
| - |
| - |
| 1,188,426 |
Restructuring of Capital | 24.d |
| - |
| - |
| - |
| - |
| - |
| - |
| - |
| - |
| (49) |
| (49) |
Net Income |
|
| - |
| - |
| - |
| - |
| - |
| - |
| - |
| 7,995,872 |
| - |
| 7,995,872 |
Appropriations: |
|
|
|
|
|
|
|
|
|
|
|
|
|
|
|
|
|
|
|
|
|
Legal Reserve | 24.c |
| - |
| - |
| 390,829 |
| - |
| - |
| - |
| - |
| (390,829) |
| - |
| - |
Dividends | 24.b |
| - |
| - |
| - |
| - |
| - |
| - |
| - |
| (2,500,000) |
| - |
| (2,500,000) |
Interest on Capital | 24.b |
| - |
| - |
| - |
| - |
| - |
| - |
| - |
| (3,800,000) |
| - |
| (3,800,000) |
Reserve for Dividend Equalization | 24.c |
| - |
| - |
| - |
| 1,125,765 |
| - |
| - |
| - |
| (1,125,765) |
| - |
| - |
First Time Adoption: Financial Guarantees Provided - CMN Resolution nº 4,512 (Note 3.w and 22) |
|
| - |
| - |
| - |
| - |
| - |
| - |
| - |
| (179,278) |
| - |
| (179,278) |
Balances as of December 31, 2017 |
|
| 57,000,000 |
| 172,398 |
| 2,505,285 |
| 1,548,875 |
| 1,030,563 |
| 89,648 |
| (2,704,383) |
| - |
| (148,440) |
| 59,493,946 |
Changes in the Exercise |
|
| - |
| (223,527) |
| 390,829 |
| 638,950 |
| 1,167,376 |
| 21,050 |
| (620,903) |
| - |
| 365,594 |
| 1,739,369 |
|
|
|
|
|
|
|
|
|
|
|
|
|
|
|
|
|
|
|
|
|
|
Balances as of June 30, 2017 |
|
| 57,000,000 |
| 359,687 |
| 2,290,901 |
| 3,762,393 |
| 507,546 |
| 118,021 |
| (2,525,376) |
| - |
| (677,069) |
| 60,836,103 |
Employee Benefit Plans |
|
| - |
| - |
| - |
| - |
| - |
| - |
| (179,007) |
| - |
| - |
| (179,007) |
Treasury Shares | 24.d |
| - |
| (257,602) |
| - |
| (486,815) |
| - |
| - |
| - |
| - |
| 528,654 |
| (215,763) |
Result of Treasury Shares | 24.d |
| - |
| (2,154) |
| - |
| - |
| - |
| - |
| - |
| - |
| - |
| (2,154) |
Reservations for Share - Based Payment |
|
| - |
| 72,467 |
| - |
| - |
| - |
| - |
| - |
| - |
| - |
| 72,467 |
Adjustment to Fair Value - Securities and | |||||||||||||||||||||
Derivative Financial Instruments |
|
| - |
| - |
| - |
| - |
| 523,017 |
| (28,373) |
| - |
| - |
| - |
| 494,644 |
Restructuring of Capital | 24.d |
| - |
| - |
| - |
| - |
| - |
| - |
| - |
| - |
| (25) |
| (25) |
Net Income |
|
| - |
| - |
| - |
| - |
| - |
| - |
| - |
| 4,287,681 |
| - |
| 4,287,681 |
Appropriations: |
|
| |||||||||||||||||||
Legal Reserve | 24.c |
| - |
| - |
| 214,384 |
| - |
| - |
| - |
| - |
| (214,384) |
| - |
| - |
Dividends | 24.b |
| - |
| - |
| - |
| - |
| - |
| - |
| - |
| (2,500,000) |
| - |
| (2,500,000) |
Interest on Capital | 24.b |
| - |
| - |
| - |
| - |
| - |
| - |
| - |
| (3,300,000) |
| - |
| (3,300,000) |
Reserve for Dividend Equalization | 24.c |
| - |
| - |
| - |
| (1,726,703) |
| - |
| - |
| - |
| 1,726,703 |
| - |
| - |
Balances as of December 31, 2017 |
|
| 57,000,000 |
| 172,398 |
| 2,505,285 |
| 1,548,875 |
| 1,030,563 |
| 89,648 |
| (2,704,383) |
| - |
| (148,440) |
| 59,493,946 |
Changes in the Half |
|
| - |
| (187,289) |
| 214,384 |
| (2,213,518) |
| 523,017 |
| (28,373) |
| (179,007) |
| - |
| 528,629 |
| (1,342,157) |
The accompanying notes from Management are an integral part of these financial statements. | |||||||||||||||||||||
(Free Translation into English from the Original Previously Issued in Portuguese) | |
BANCO SANTANDER (BRASIL) S.A. AND SUBSIDIARIES | |
In thousands of Brazilian Real - R$, unless otherwise stated | |
Profit Reserves | Adjustment to Fair Value |
|
|
| |||||||||||||||||||||
Reserve for | Others | Total | |||||||||||||||||||||||
Capital | Legal | Dividend | Own | Affiliates and | Adjustment | Retained | (-)Treasury | Stockholders' | Minority | Stockholders' | |||||||||||||||
| Notes |
| Capital |
| Reserves |
| Reserve |
| Equalization |
| Position |
| Subsidiaries |
| to Fair Value |
| Earnings |
| Shares |
| Equity |
| Interest |
| Equity |
|
|
|
|
|
|
|
|
|
|
|
|
|
|
|
|
|
|
|
|
|
|
|
|
| |
Balances as of December 31, 2015 |
|
| 57,000,000 |
| 436,389 |
| 1,838,374 |
| 936,746 |
| (3,684,924) |
| (141,913) |
| (1,141,646) |
| - |
| (423,953) |
| 54,819,073 |
| 1,956,130 |
| 56,775,203 |
Employee Benefit Plan |
|
| - |
| - |
| - |
| - |
| - |
| - |
| (941,834) |
| - |
| - |
| (941,834) |
| - |
| (941,834) |
Treasury Shares | 24.d |
| - |
| - |
| - |
| - |
| - |
| - |
| - |
| - |
| (90,031) |
| (90,031) |
| - |
| (90,031) |
Result of Treasury Shares | 24.d |
| - |
| (11,574) |
| - |
| - |
| - |
| - |
| - |
| - |
| - |
| (11,574) |
| - |
| (11,574) |
Reservations for Share - Based Payment |
|
| - |
| (35,020) |
| - |
| - |
| - |
| - |
| - |
| - |
| - |
| (35,020) |
| - |
| (35,020) |
Adjustment to Fair Value - Securities and | |||||||||||||||||||||||||
Derivative Financial Instruments |
|
| - |
| - |
| - |
| - |
| 3,520,603 |
| 210,511 |
| - |
| - |
| - |
| 3,731,114 |
| - |
| 3,731,114 |
Restructuring of Capital | 24.d |
| - |
| - |
| - |
| - |
| - |
| - |
| - |
| - |
| (50) |
| (50) |
| - |
| (50) |
Dividends based on the Dividend Equalization Reserve | 24.b |
| - |
| - |
| - |
| (700,000) |
| - |
| - |
| - |
| - |
| - |
| (700,000) |
| - |
| (700,000) |
Net Income |
|
| - |
| - |
| - |
| - |
| - |
| - |
| - |
| 5,532,962 |
| - |
| 5,532,962 |
| - |
| 5,532,962 |
Appropriations: |
|
|
|
|
|
|
|
|
|
|
|
|
|
|
|
|
|
|
|
|
|
|
|
|
|
Legal Reserve | 24.c |
| - |
| - |
| 276,082 |
| - |
| - |
| - |
| - |
| (276,082) |
| - |
| - |
| - |
| - |
Dividends | 24.b |
| - |
| - |
| - |
| - |
| - |
| - |
| - |
| (700,000) |
| - |
| (700,000) |
| - |
| (700,000) |
Interest on Capital | 24.b |
| - |
| - |
| - |
| - |
| - |
| - |
| - |
| (3,850,000) |
| - |
| (3,850,000) |
| - |
| (3,850,000) |
Reserve for Dividend Equalization | 24.c |
| - |
| - |
| - |
| 688,257 |
| 28,351 |
| - |
| - |
| (706,880) |
| - |
| 9,728 |
| - |
| 9,728 |
Non Controlling Interest Results | 24.f |
| - |
| - |
| - |
| - |
| - |
| - |
| - |
| - |
| - |
| - |
| 124,793 |
| 124,793 |
Others |
|
| - |
| 7,156 |
| - |
| - |
| - |
| - |
| - |
| - |
| - |
| 7,156 |
| 444,823 |
| 451,979 |
Balances as of December 31, 2016 |
|
| 57,000,000 |
| 396,951 |
| 2,114,456 |
| 925,003 |
| (135,970) |
| 68,598 |
| (2,083,480) |
| - |
| (514,034) |
| 57,771,524 |
| 2,525,746 |
| 60,297,270 |
Changes in the Exercise |
|
| - |
| (39,438) |
| 276,082 |
| (11,743) |
| 3,548,954 |
| 210,511 |
| (941,834) |
| - |
| (90,081) |
| 2,952,451 |
| 569,616 |
| 3,522,067 |
|
|
|
|
|
|
|
|
|
|
|
|
|
|
|
|
|
|
|
|
|
|
|
|
| |
Balances as of December 31, 2016 |
|
| 57,000,000 |
| 396,951 |
| 2,114,456 |
| 925,003 |
| (135,970) |
| 68,598 |
| (2,083,480) |
| - |
| (514,034) |
| 57,771,524 |
| 2,525,746 |
| 60,297,270 |
Employee Benefit Plans |
|
| - |
| - |
| - |
| - |
| - |
| - |
| (620,903) |
| - |
| - |
| (620,903) |
| - |
| (620,903) |
Treasury Shares | 24.d |
| �� - |
| (257,602) |
| - |
| (486,815) |
| - |
| - |
| - |
| - |
| 365,643 |
| (378,774) |
| - |
| (378,774) |
Result of Treasury Shares | 24.d |
| - |
| (2,498) |
| - |
| - |
| - |
| - |
| - |
| - |
| - |
| (2,498) |
| - |
| (2,498) |
Reservations for Share - Based Payment |
|
| - |
| 37,765 |
| - |
| - |
| - |
| - |
| - |
| - |
| - |
| 37,765 |
| - |
| 37,765 |
Adjustment to Fair Value - Securities and | |||||||||||||||||||||||||
Derivative Financial Instruments |
|
| - |
| - |
| - |
| - |
| 1,167,376 |
| 21,050 |
| - |
| - |
| - |
| 1,188,426 |
| - |
| 1,188,426 |
Restructuring of Capital | 24.d |
| - |
| - |
| - |
| - |
| - |
| - |
| - |
| - |
| (49) |
| (49) |
| - |
| (49) |
Net Income |
|
| - |
| - |
| - |
| - |
| - |
| - |
| - |
| 7,996,577 |
| - |
| 7,996,577 |
| - |
| 7,996,577 |
Appropriations: |
|
|
|
|
|
|
|
|
|
|
|
|
|
|
|
|
|
|
|
|
|
|
|
|
|
Legal Reserve | 24.c |
| - |
| - |
| 390,830 |
| - |
| - |
| - |
| - |
| (390,830) |
| - |
| - |
| - |
| - |
Dividends | 24.b |
| - |
| - |
| - |
| - |
| - |
| - |
| - |
| (2,500,000) |
| - |
| (2,500,000) |
| - |
| (2,500,000) |
Interest on Capital | 24.b |
| - |
| - |
| - |
| - |
| - |
| - |
| - |
| (3,800,000) |
| - |
| (3,800,000) |
| - |
| (3,800,000) |
Reserve for Dividend Equalization | 24.c |
| - |
| - |
| - |
| 1,114,476 |
| (843) |
| - |
| - |
| (1,126,469) |
| - |
| (12,836) |
| - |
| (12,836) |
Non Controlling Interest Results | 24.f |
| - |
| - |
| - |
| - |
| - |
| - |
| - |
| - |
| - |
| - |
| 393,534 |
| 393,534 |
First Time Adoption: Financial Guarantees Provided - CMN Resolution nº 4,512 (Note 3.w and 22) |
|
| - |
| - |
| - |
| - |
| - |
| - |
| - |
| (179,278) |
| - |
| (179,278) |
| - |
| (179,278) |
Others |
|
| - |
| - |
| - |
| - |
| - |
| - |
| - |
| - |
| - |
| - |
| (1,022,588) |
| (1,022,588) |
Balances as of December 31, 2017 |
|
| 57,000,000 |
| 174,616 |
| 2,505,286 |
| 1,552,664 |
| 1,030,563 |
| 89,648 |
| (2,704,383) |
| - |
| (148,440) |
| 59,499,954 |
| 1,896,692 |
| 61,396,646 |
Changes in the Exercise |
|
| - |
| (222,335) |
| 390,830 |
| 627,661 |
| 1,166,533 |
| 21,050 |
| (620,903) |
| - |
| 365,594 |
| 1,728,430 |
| (629,054) |
| 1,099,376 |
|
|
|
|
|
|
|
|
|
|
|
|
|
|
|
|
|
|
|
|
|
|
|
|
| |
Balances as of June 30, 2017 |
|
| 57,000,000 |
| 361,250 |
| 2,290,902 |
| 3,761,207 |
| 528,601 |
| 118,021 |
| (2,525,376) |
| - |
| (677,069) |
| 60,857,536 |
| 2,544,509 |
| 63,402,045 |
Employee Benefit Plans |
|
| - |
| - |
| - |
| - |
| - |
| - |
| (179,007) |
| - |
| - |
| (179,007) |
| - |
| (179,007) |
Treasury Shares | 24.d |
| - |
| (257,602) |
| - |
| (486,815) |
| - |
| - |
| - |
| - |
| 528,654 |
| (215,763) |
| - |
| (215,763) |
Result of Treasury Shares | 24.d |
| - |
| (2,154) |
| - |
| - |
| - |
| - |
| - |
| - |
| - |
| (2,154) |
| - |
| (2,154) |
Reservations for Share - Based Payment |
|
| - |
| 73,122 |
| - |
| - |
| - |
| - |
| - |
| - |
| - |
| 73,122 |
| - |
| 73,122 |
Adjustment to Fair Value - Securities and | |||||||||||||||||||||||||
Derivative Financial Instruments |
|
| - |
| - |
| - |
| - |
| 523,017 |
| (28,373) |
| - |
| - |
| - |
| 494,644 |
| - |
| 494,644 |
Restructuring of Capital | 24.d |
| - |
| - |
| - |
| - |
| - |
| - |
| - |
| - |
| (25) |
| (25) |
| - |
| (25) |
Net Income |
|
| - |
| - |
| - |
| - |
| - |
| - |
| - |
| 4,292,656 |
| - |
| 4,292,656 |
| - |
| 4,292,656 |
Appropriations: |
|
| |||||||||||||||||||||||
Legal Reserve | 24.c |
| - |
| - |
| 214,384 |
| - |
| - |
| - |
| - |
| (214,384) |
| - |
| - |
| - |
| - |
Dividends | 24.b |
| - |
| - |
| - |
| - |
| - |
| - |
| - |
| (2,500,000) |
| - |
| (2,500,000) |
| - |
| (2,500,000) |
Interest on Capital | 24.b |
| - |
| - |
| - |
| - |
| - |
| - |
| - |
| (3,300,000) |
| - |
| (3,300,000) |
| - |
| (3,300,000) |
Reserve for Dividend Equalization | 24.c |
| - |
| - |
| - |
| (1,721,728) |
| (21,055) |
| - |
| - |
| 1,721,728 |
| - |
| (21,055) |
| - |
| (21,055) |
Non Controlling Interest Results | 24.f |
| - |
| - |
| - |
| - |
| - |
| - |
| - |
| - |
| - |
| - |
| 203,190 |
| 203,190 |
Others |
|
| - |
| - |
| - |
| - |
| - |
| - |
| - |
| - |
| - |
| - |
| (851,007) |
| (851,007) |
Balances as of December 31, 2017 |
|
| 57,000,000 |
| 174,616 |
| 2,505,286 |
| 1,552,664 |
| 1,030,563 |
| 89,648 |
| (2,704,383) |
| - |
| (148,440) |
| 59,499,954 |
| 1,896,692 |
| 61,396,646 |
Changes in the Half |
|
| - |
| (186,634) |
| 214,384 |
| (2,208,543) |
| 501,962 |
| (28,373) |
| (179,007) |
| - |
| 528,629 |
| (1,357,582) |
| (647,817) |
| (2,005,399) |
The accompanying notes from Management are an integral part of these financial statements. | |||||||||||||||||||||||||
(Free Translation into English from the Original Previously Issued in Portuguese) | |
BANCO SANTANDER (BRASIL) S.A. AND SUBSIDIARIES | |
In thousands of Brazilian Real - R$, unless otherwise stated | |
| Bank |
| Consolidated | |||||||||||
07/01 to | 01/01 to | 01/01 to |
| 07/01 to |
| 01/01 to |
| 01/01 to | |||||
| Notes |
| 12/31/2017 |
| 12/31/2017 | 12/31/2016 |
| 12/31/2017 |
| 12/31/2017 |
| 12/31/2016 | |
Operational Activities |
|
|
|
|
|
|
|
|
|
|
|
|
|
Net Income |
|
| 4,287,681 |
| 7,995,872 |
| 5,521,637 |
| 4,292,656 |
| 7,996,577 |
| 5,532,962 |
Adjustment to Net Income |
|
| 8,094,535 |
| 14,455,239 |
| 18,628,945 |
| 10,639,074 |
| 19,206,070 |
| 21,955,494 |
Allowance for Loan Losses | 8.f |
| 4,949,684 |
| 10,135,143 |
| 11,616,348 |
| 5,817,645 |
| 11,778,801 |
| 13,239,781 |
Provision for Legal Proceedings and Administrative |
|
| 1,304,132 |
| 2,805,372 |
| 2,277,961 |
| 1,538,436 |
| 3,309,606 |
| 2,621,775 |
Deferred Tax Credits |
|
| 1,698,895 |
| 661,108 |
| 5,348,341 |
| 1,557,447 |
| 428,096 |
| 5,083,310 |
Equity in Affiliates and Subsidiaries | 15 |
| (1,194,348) |
| (2,076,992) |
| (1,418,525) |
| (9,270) |
| (25,279) |
| (1,477) |
Depreciation and Amortization | 29 |
| 1,443,674 |
| 3,097,232 |
| 3,170,728 |
| 1,701,383 |
| 3,603,637 |
| 3,626,805 |
Recognition (Reversal) Allowance for Other Assets | 33 |
| (68,881) |
| 198,067 |
| 4,731 |
| (61,190) |
| 271,579 |
| 5,361 |
Gain (Loss) on Sale of Other Assets | 33 |
| (34,545) |
| (36,690) |
| (1,492) |
| (27,081) |
| (30,250) |
| (2,203) |
Gain (Loss) on Impairment of Assets | 32 |
| 305,669 |
| 327,884 |
| 142 |
| 305,669 |
| 327,884 |
| 147 |
Gain (Loss) on Sale of Investments | 33 |
| - |
| (1,787) |
| - |
| 42,812 |
| 43,838 |
| 1,631 |
Provision for Financial Guarantees | 31 |
| 35,084 |
| (13,584) |
| - |
| 35,084 |
| (13,584) |
| - |
Monetary Adjustment of Escrow Deposits | 31 |
| (252,878) |
| (494,789) |
| (560,860) |
| (332,667) |
| (655,628) |
| (764,020) |
Recoverable Taxes | 31 |
| (34,704) |
| (144,552) |
| (136,115) |
| (64,459) |
| (214,849) |
| (220,487) |
Effects of Changes in Foreign Exchange Rates on Cash |
|
| - |
| - |
| 2,252,382 |
| - |
| - |
| 2,289,849 |
Effects of Changes in Foreign Exchange Rates on Assets and Liabilities |
|
| (72,569) |
| 33,691 |
| (3,924,661) |
| (72,569) |
| 33,691 |
| (3,924,661) |
Others |
|
| 15,322 |
| (34,864) |
| (35) |
| 207,834 |
| 348,528 |
| (317) |
Changes on Assets and Liabilities |
|
| 2,436,716 |
| 26,891,235 |
| (14,919,473) |
| 807,869 |
| 24,179,502 |
| (17,815,907) |
Decrease (Increase) in Interbank Investments |
|
| (3,860,766) |
| 1,410,919 |
| (21,399,845) |
| 2,151,781 |
| 11,777,420 |
| (17,868,579) |
Decrease (Increase) in Securities and Derivative |
|
| 17,961,516 |
| 37,050,278 |
| (25,657,539) |
| 956,748 |
| (129,580) |
| (24,850,362) |
Decrease (Increase) in Lending and Leasing Operations |
|
| (5,460,450) |
| (10,387,294) |
| 139,665 |
| (12,444,769) |
| (21,815,683) |
| (2,907,788) |
Decrease (Increase) in Deposits on Central Bank of Brazil |
| 2,239,344 |
| (1,562,559) |
| (5,992,335) |
| 2,230,350 |
| (1,582,822) |
| (6,102,840) | |
Decrease (Increase) in Other Receivables |
|
| (10,401,665) |
| 41,015,285 |
| (13,530,723) |
| (9,583,055) |
| 42,055,483 |
| (14,644,091) |
Decrease (Increase) in Other Assets |
|
| 166,241 |
| (17,746) |
| (12,347) |
| 216,016 |
| 111,464 |
| (6,471) |
Net Change on Other Interbank and Interbranch Accounts |
| (4,149,937) |
| (4,993,111) |
| (1,395,361) |
| (16,569,217) |
| (17,412,435) |
| (1,395,361) | |
Increase (Decrease) in Deposits |
|
| 7,863,869 |
| 21,108,410 |
| 7,756,400 |
| 24,916,778 |
| 57,826,980 |
| 3,624,105 |
Increase (Decrease) in Money Market Funding |
|
| (19,204,211) |
| (28,856,280) |
| 23,864,990 |
| (20,121,018) |
| (30,961,720) |
| 25,963,306 |
Increase (Decrease) in Borrowings |
|
| 5,466,414 |
| 2,757,598 |
| (3,240,037) |
| 5,680,392 |
| 3,039,158 |
| (4,572,825) |
Increase (Decrease) in Other Liabilities |
|
| 12,507,566 |
| (29,910,476) |
| 26,004,322 |
| 24,648,253 |
| (16,830,131) |
| 27,211,107 |
Increase (Decrease) in Change in Deferred Income |
|
| 20,711 |
| (11,873) |
| 915 |
| (8,010) |
| (53,020) |
| (9,831) |
Income Tax Recovered/(Paid) |
|
| (711,916) |
| (711,916) |
| (1,457,578) |
| (1,266,380) |
| (1,845,612) |
| (2,256,277) |
Net Cash Provided by (Used in) Operational Activities |
| 14,818,932 |
| 49,342,346 |
| 9,231,109 |
| 15,739,599 |
| 51,382,149 |
| 9,672,549 | |
Investing Activities |
|
|
|
|
|
|
|
|
|
|
|
|
|
Increase in Equity at Affiliates and Subsidiaries | 15 |
| (154,154) |
| (154,154) |
| - |
| (34,154) |
| (34,154) |
| - |
Purchase of Investment |
|
| (253) |
| (611) |
| (902) |
| (370) |
| (728) |
| (113,912) |
Purchase of Fixed Assets |
|
| (525,550) |
| (782,879) |
| (589,384) |
| (723,167) |
| (1,112,318) |
| (934,403) |
Purchase of Intangible Assets |
|
| (1,284,597) |
| (1,837,437) |
| (1,132,379) |
| (1,330,032) |
| (1,914,451) |
| (1,219,427) |
Acquisition of Non-Current Assets Held for Sale | 13 |
| - |
| (43,713) |
| - |
| - |
| (43,713) |
| - |
Net Cash Received on Sale/Reduction of Investments |
|
| 5,441 |
| 8,777 |
| 379 |
| 4,976 |
| 10,539 |
| 403 |
Acquisition of Subsidiary, less Net Cash on Acquisition | 15 |
| (290,260) |
| (290,260) |
| - |
| (266,627) |
| (275,091) |
| (393,102) |
Proceeds from Assets not in Use |
|
| 219,243 |
| 250,897 |
| 226,033 |
| 273,716 |
| 318,224 |
| 227,590 |
Proceeds from Property for Own Use |
|
| 78,511 |
| 93,509 |
| 28,152 |
| 78,736 |
| 113,380 |
| 79,883 |
Dividends and Interest on Capital Received |
|
| 691,651 |
| 1,523,249 |
| 1,239,825 |
| 11,331 |
| 101,666 |
| 249,393 |
Change in the Scope of Consolidation | 2 |
| - |
| - |
| - |
| - |
| (3,758) |
| 4,909 |
Net Cash Provided by (Used in) Investing Activities |
|
| (1,259,968) |
| (1,232,622) |
| (228,276) |
| (1,985,591) |
| (2,840,404) |
| (2,098,666) |
Financing Activities |
|
|
|
|
|
|
|
|
|
|
|
|
|
Purchase of Own Share | 24.d |
| (215,763) |
| (378,774) |
| (90,031) |
| (215,763) |
| (378,774) |
| (90,031) |
Issuance of Long - Term Emissions |
|
| 37,704,508 |
| 60,138,230 |
| 50,313,469 |
| 39,383,490 |
| 62,863,354 |
| 52,971,066 |
Long - Term Payments |
|
| (49,305,658) |
| (96,979,205) |
| (56,164,769) |
| (50,986,095) |
| (99,825,185) |
| (59,345,386) |
Subordinated Debts - Payments |
|
| - |
| - |
| (8,362,652) |
| - |
| - |
| (8,362,652) |
Debt Instruments Eligible to Compose Capital - Payments |
|
| (311,785) |
| (623,147) |
| (2,724,511) |
| (311,785) |
| (623,147) |
| (2,724,511) |
Dividends and Interest on Capital Paid |
|
| (845,921) |
| (5,450,125) |
| (3,222,362) |
| (1,104,528) |
| (5,915,637) |
| (3,234,086) |
Increase (Decrease) on Non Controlling Interest |
|
| - |
| - |
| - |
| (232,770) |
| (282,216) |
| 501,561 |
Net Cash Provided by (Used in) Financing Activities |
|
| (12,974,619) |
| (43,293,021) |
| (20,250,856) |
| (13,467,451) |
| (44,161,605) |
| (20,284,039) |
Exchange Variation on Cash and Cash Equivalents |
|
| - |
| - |
| (2,252,382) |
| - |
| - |
| (2,289,849) |
Increase (Decrease) in Cash and Cash Equivalents |
|
| 584,345 |
| 4,816,703 |
| (13,500,405) |
| 286,557 |
| 4,380,140 |
| (15,000,005) |
Cash and Cash Equivalents at the Beginning of Exercise | 4 |
| 22,080,036 |
| 17,847,678 |
| 31,348,083 |
| 22,226,760 |
| 18,133,177 |
| 33,133,182 |
Cash and Cash Equivalents at the End of Exercise | 4 |
| 22,664,381 |
| 22,664,381 |
| 17,847,678 |
| 22,513,317 |
| 22,513,317 |
| 18,133,177 |
The accompanying notes from Management are an integral part of these financial statements. | |||||||||||||
(Free Translation into English from the Original Previously Issued in Portuguese) | |
BANCO SANTANDER (BRASIL) S.A. AND SUBSIDIARIES | |
In thousands of Brazilian Real - R$, unless otherwise stated | |
|
|
|
|
|
| Bank |
|
|
|
|
|
| Consolidated | ||||
01/01 to | 01/01 to | 01/01 to | 01/01 to | ||||||||||||||
| Notes |
| 12/31/2017 |
|
|
| 12/31/2016 |
|
|
| 12/31/2017 |
|
|
| 12/31/2016 |
|
|
Income Related to Financial Operations |
|
| 73,926,572 |
|
|
| 90,968,893 |
|
|
| 76,310,782 |
|
|
| 85,909,559 |
|
|
Income Related to Bank Charges and Banking Service Fees | 27 |
| 12,261,328 |
|
|
| 11,308,504 |
|
|
| 15,610,759 |
|
|
| 13,718,252 |
|
|
Allowance for Loans Losses | 8.f |
| (10,135,143) |
|
|
| (11,616,348) |
|
|
| (11,778,801) |
|
|
| (13,239,781) |
|
|
Other Revenues and Expenses |
|
| (4,302,296) |
|
|
| (3,456,215) |
|
|
| (6,183,288) |
|
|
| (4,206,498) |
|
|
Financial Expenses |
|
| (42,251,725) |
|
|
| (56,040,925) |
|
|
| (37,584,879) |
|
|
| (45,871,960) |
|
|
Third-party Input |
|
| (6,674,255) |
|
|
| (5,877,888) |
|
|
| (7,720,614) |
|
|
| (6,934,353) |
|
|
Materials, Energy and Others |
|
| (237,707) |
|
|
| (264,138) |
|
|
| (245,210) |
|
|
| (274,651) |
|
|
Third-Party Services | 29 |
| (1,792,808) |
|
|
| (1,808,057) |
|
|
| (2,186,892) |
|
|
| (2,179,100) |
|
|
Impairment of Assets | 32 |
| (327,884) |
|
|
| (142) |
|
|
| (327,884) |
|
|
| (147) |
|
|
Others |
|
| (4,315,856) |
|
|
| (3,805,551) |
|
|
| (4,960,628) |
|
|
| (4,480,455) |
|
|
Gross Added Value |
|
| 22,824,481 |
|
|
| 25,286,021 |
|
|
| 28,653,959 |
|
|
| 29,375,219 |
|
|
Retentions |
|
|
|
|
|
|
|
|
|
|
|
|
|
|
|
|
|
Depreciation and Amortization | 29 |
| (3,097,232) |
|
|
| (3,170,728) |
|
|
| (3,603,637) |
|
|
| (3,626,805) |
|
|
Added Value Produced Net |
|
| 19,727,249 |
|
|
| 22,115,293 |
|
|
| 25,050,322 |
|
|
| 25,748,414 |
|
|
Added Value Received from Transfer |
|
|
|
|
|
|
|
|
|
|
|
|
|
|
|
|
|
Investments in Affiliates and Subsidiaries | 15 |
| 2,076,992 |
|
|
| 1,418,525 |
|
|
| 25,279 |
|
|
| 1,477 |
|
|
Added Value to Distribute |
|
| 21,804,241 |
|
|
| 23,533,818 |
|
|
| 25,075,601 |
|
|
| 25,749,891 |
|
|
Added Value Distribution |
|
|
|
|
|
|
|
|
|
|
|
|
|
|
|
|
|
Employee |
|
| 7,431,769 |
| 34.1% |
| 7,103,148 |
| 30.2% |
| 8,058,009 |
| 32.1% |
| 7,784,119 |
| 30.2% |
Compensation | 28 |
| 4,131,010 |
|
|
| 4,019,028 |
|
|
| 4,535,505 |
|
|
| 4,445,079 |
|
|
Benefits | 28 |
| 1,282,067 |
|
|
| 1,354,269 |
|
|
| 1,383,505 |
|
|
| 1,467,289 |
|
|
Government Severance Indemnity Funds for Employees - FGTS |
| 381,312 |
|
|
| 319,540 |
|
|
| 415,726 |
|
|
| 359,557 |
|
| |
Others |
|
| 1,637,380 |
|
|
| 1,410,311 |
|
|
| 1,723,273 |
|
|
| 1,512,194 |
|
|
Taxes and Contributions |
|
| 5,666,371 |
| 26.0% |
| 10,214,958 |
| 43.4% |
| 7,899,230 |
| 31.5% |
| 11,560,020 |
| 44.9% |
Federal |
|
| 5,110,779 |
|
|
| 9,721,225 |
|
|
| 7,242,554 |
|
|
| 10,983,045 |
|
|
State |
|
| 945 |
|
|
| 627 |
|
|
| 1,260 |
|
|
| 717 |
|
|
Municipal |
|
| 554,647 |
|
|
| 493,106 |
|
|
| 655,416 |
|
|
| 576,258 |
|
|
Compensation of Third-Party Capital - Rental | 29 |
| 710,229 |
| 3.3% |
| 694,075 |
| 2.9% |
| 728,251 |
| 2.9% |
| 747,997 |
| 2.9% |
Remuneration of Interest on Capital |
|
| 7,995,872 |
| 36.6% |
| 5,521,637 |
| 23.5% |
| 8,390,111 |
| 33.5% |
| 5,657,755 |
| 22.0% |
Interest on Capital | 24.b |
| 6,300,000 |
|
|
| 3,850,000 |
|
|
| 6,300,000 |
|
|
| 3,850,000 |
|
|
Profit Reinvestment |
|
| 1,695,872 |
|
|
| 1,671,637 |
|
|
| 1,696,577 |
|
|
| 1,682,962 |
|
|
Participation Results of Non-Controlling Shareholders | 24.f |
| - |
|
|
| - |
|
|
| 393,534 |
|
|
| 124,793 |
|
|
Total |
|
| 21,804,241 |
| 100.0% |
| 23,533,818 |
| 100.0% |
| 25,075,601 |
| 100.0% |
| 25,749,891 |
| 100.0% |
The accompanying notes from Management are an integral part of these financial statements. | |||||||||||||||||
(Free Translation into English from the Original Previously Issued in Portuguese) | |
BANCO SANTANDER (BRASIL) S.A. AND SUBSIDIARIES | |
In thousands of Brazilian Real - R$, unless otherwise stated | |
1. General Information | ||||||||||||||
Banco Santander (Brasil) S.A. (Banco Santander or Bank), directly and indirectly controlled by Banco Santander, S.A., based in Spain (Banco Santander Spain), is the lead institution of the Financial and Prudential Group (Conglomerate Santander) towards the Central Bank of Brazil (Bacen), established as a corporation, with head office at 2041 and 2235, Presidente Juscelino Kubitschek Avenue - A Block - Vila Olímpia - São Paulo - SP. Banco Santander operates as a multiple service bank, conducting its operations by means of portfolios such as commercial, investment, loans and advances, mortgage loans, leasing, credit card operations and foreign exchange. Through its subsidiaries, the Bank also operates on the means of payment business, leasing, shares club management, securities and insurance brokerage operations, capitalization and pension plan. The Bank's activities are conducted within the context of a group of institutions that operate on an integrated basis in the financial market. The corresponding benefits and costs of providing services are absorbed between them, they are conducted in the normal course of business and under commutative conditions. | ||||||||||||||
2. Presentation of Financial Statements | ||||||||||||||
The financial statements of Banco Santander, which include its dependence abroad (Bank) and the consolidated statements (Consolidated), were prepared in accordance with accounting practices adopted in Brazil, established by the Brazilian Corporation Law, National Monetary System (CMN) and the model of the document provided for in the Accounting Plan of the Institutions of the National Financial System (COSIF) of the Brazilian Securities and Exchange Commission (CVM), in which they do not conflict with the standards issued by the Central Bank and show all information relevant to the financial statements, which are consistent with those used by management in its management. The consolidated financial statements include the Bank and its subsidiaries indicated in Note 15 and investment funds, where Santander Conglomerate companies are the main beneficiaries or holders of the main obligations. The portfolios of these investment funds are classified by type of operation and are distributed in the same categories in which they were originally allocated. As of January 1, 2017, pursuant to CMN Resolution No. 4,517 of August 24, 2016, equity interests in jointly-owned subsidiaries were evaluated under the equity method on a prospective basis. | ||||||||||||||
All the relevant information related to Banco Santander's financial statements, and only them, are being evidenced, and correspond to those used by Banco Santander´s management. | ||||||||||||||
Investment Funds Consolidated | ||||||||||||||
Ÿ Santander Fundo de Investimento Amazonas Multimercado Crédito Privado de Investimento no Exterior (Santander FI Amazonas); | ||||||||||||||
Ÿ Santander Fundo de Investimento Diamantina Multimercado Crédito Privado de Investimento no Exterior (Santander FI Diamantina); | ||||||||||||||
Ÿ Santander Fundo de Investimento Guarujá Multimercado Crédito Privado de Investimento no Exterior (Santander FI Guarujá); | ||||||||||||||
Ÿ Santander Fundo de Investimento Unix Multimercado Crédito Privado (Santander FI Unix); | ||||||||||||||
Ÿ Santander Fundo de Investimento Capitalization Renda Fixa (Santander FI Capitalization); | ||||||||||||||
Ÿ Santander Fundo de Investimento SBAC Referenciado DI Crédito Privado (Santander FI SBAC); | ||||||||||||||
Ÿ Santander FIC FI Contract I Referenciado DI (Santander FIC FI Contract); | ||||||||||||||
Ÿ Santander Paraty QIF PLC (Santander Paraty)(5); | ||||||||||||||
Ÿ Santander Fundo de Investimento Financial Curto Prazo (Santander FI Financial); | ||||||||||||||
Ÿ Venda de Veículos Fundo de Investimento em Direitos Creditórios (Venda de Veículos FIDC);(1) | ||||||||||||||
Ÿ Fundo de Investimento em Direitos Creditórios RCI Brasil I - Financiamento de Veículos (FI Direitos Creditórios RCI | ||||||||||||||
Ÿ Fundo de Investimento em Direitos Creditórios RN Brasil - Financiamento de Veículos (FI RN Brasil - Financiamento | ||||||||||||||
Ÿ BRL V - Fundo de Investimento Imobiliário - FII (Fundo de Investimento Imobiliário)(4); | ||||||||||||||
Ÿ ŸSantander FI Hedge Strategies Fund (Santander FI Hedge Strategies)(5); | ||||||||||||||
Ÿ Fundo de Investimento em Direitos Creditórios Multisegmentos NPL Ipanema VI - Não Padronizado (Fundo | ||||||||||||||
Ÿ Fundo de Investimento em Direitos Creditórios Multisegmentos NPL Ipanema V - Não Padronizado (Fundo | ||||||||||||||
|
| |||||||||||||
(1) The carmaker Renault (not belonging to the Conglomerate Santander) sells its trade receivables to the Fund. This Fund buys only trade receivables from Renault carmaker. In turn, the Banco RCI Brasil S.A. (Note 15) owns 100% of its subordinated shares. | ||||||||||||||
(2) Banco RCI Brasil S.A. (company belonging to the Conglomerate Santander) sell its product portfolio "floorplan" to the Fund, and holds 100% of its subordinated shares. This Fund buys exclusively credit portfolio from Banco RCI Brasil S.A. | ||||||||||||||
(3) Banco RCI Brasil S.A. sold receivables (CDC portfolio) to FI RN Brasil – Financiamento de Veículos.The senior shares will have only one investor. Banco RCI Brasil S.A. holds 100% of subordinated shares. | ||||||||||||||
(4) Banco Santander figured as lender of certain delayed debts (loans) for which had real assets as guarantees. The process of credit recovery consists in converted into capital contributions by the Real Estate Fund in conjunction transfer of the same shares to Banco Santander through the process of payment in kind of the above credit operations payments. | ||||||||||||||
(5) Banco Santander, through its subsidiaries, holds the risks and benefits of Santander Paraty and the Santander FI Hedge Strategies Subfund, resident in Ireland, and both are fully consolidated in its Consolidated Financial Statements. In the Irish market, an investment fund can not act directly and, for that reason, it was necessary to create another structure (a sub-fund), Santander FI Hedge Strategies. Santander Paraty does not have a financial position, and all position is derived from the financial position of Santander FI Hedge Strategies. | ||||||||||||||
(6) This investment fund was formed and started to be consolidated in September of 2017. It refers to a structure where the Bank has sold certain loans agreements which were already written-off (agreements matured over 360 days) and transferred to this fund. The current Companhia Securitizadora de Créditos Financeiros (current Securitization Company) (Note 15), company controlled by the Bank, holds 100% of the fund´s shares. | ||||||||||||||
(7) This fund was consolidated in October 2017 and is indirectly controlled by Atual Securitizadora (Notes 15 and 37.b). | ||||||||||||||
During the preparation of the consolidated financial statements the information regarding equity in subsidiaries, significant receivable and payable balances, revenues and expenses arising from transactions between domestic branches, foreign branches and subsidiaries, unrealized profits between these entities have been eliminated were removed and non-controlling shareholders participation are stated separately in stockholders’ equity and in the income statements. In the period ended in 2017, the balance sheet and income statement components of jointly-controlled subsidiaries have been proportionately consolidated according to each participation in the subsidiary´s equity. | ||||||||||||||
Leasing operations have been reclassified in order to reflect its financial position according to the financial method. | ||||||||||||||
The preparation of financial statements requires Management estimates and assumptions that affect the reported amounts of assets and liabilities, disclosure of provision and contingent liabilities and the reported amounts of revenues and expenses for the reporting periods. Since Management’s judgment involves making estimates concerning the probability of future events, actual amounts could differ from those estimates. The main estimates and assumptions are provision of allowance for loan losses, realization of the tax credit, contingent liabilities, pension plan and the fair value of financial assets. | ||||||||||||||
The Board of Directors authorized the issuance of the Financial Statements of the year ended on December 31, 2017 at the meeting held on January 29, 2018. | ||||||||||||||
The consolidated financial statements based on international accounting standards issued by the International Accounting Standards Board (IASB) for the year ended December 31, 2017 will be disclosed legal deadline, at the website www.santander.com.br/ri. | ||||||||||||||
3. Significant Accounting Practices | ||||||||||||||
a) Income Statement | ||||||||||||||
The income statement accounting method is determined based on the accrual method and include income, charges, monetary adjustment and exchange rate changes earned or incurred through the balance sheet on a daily pro rata basis. | ||||||||||||||
b) Functional Currency | ||||||||||||||
Functional Currency and Presentation Currency | ||||||||||||||
CMN Resolution 4,524 of September 29, 2016, with prospective application as of January 1, 2017, established accounting procedures for recognition by financial institutions and other institutions authorized to operate by the Central Bank that hold investments abroad: I - effects of exchange rate variations resulting from the conversion of transactions carried out in foreign currency by investees abroad to the respective functional currencies; II - the effects of exchange rate variations resulting from the translation of the balances of the financial statements of investees abroad of the respective functional currencies into the national currency; and III - of operations for hedge purposes of foreign exchange variation of investments abroad. These changes did not impact the financial statements of Banco Santander in the year 2017. The functional currency is considered the currency of the main economic environment in which the entity operates. | ||||||||||||||
The financial statements are presented in Brazilian Real (R$), which is the functional and presentation currency of Banco Santander its subsidiaries, including its overseas subsidiary and branch. | ||||||||||||||
Assets and liabilities of foreign branch and subsidiary are converted in real as follows: | ||||||||||||||
Ÿ Assets and liabilities are converted at the exchange rate on the balance sheet date; and | ||||||||||||||
Ÿ Revenues and expenses are converted at the monthly average exchange rates. | ||||||||||||||
c) Current and Long-Term Assets and Liabilities | ||||||||||||||
They are stated at their realizable and/or settlement amounts and they include income, charges, monetary adjustments or changes in exchange rates earned or incurred through the end of the reporting period, calculated on a daily pro rata basis and, when applicable, the effect of adjustments to decrease the cost of assets at their market values. | ||||||||||||||
Receivables and payables up to 12 months are classified in current assets and liabilities, respectively. Trading securities that, regardless of their maturity date, are classified in short-term, according to the Bacen rule (Circular 3,068/2001). | ||||||||||||||
d) Cash and Cash Equivalents | ||||||||||||||
For the cash flows statement purposes, cash and cash equivalents correspond to the balances of cash and interbank investments immediately convertible into cash, with insignificant risk of change in its value or with original maturity equal to ninety days or less. | ||||||||||||||
Bank's management decided to segregate into a different line the "Effects of Changes in Foreign Exchange Rates on Assets and Liabilities" and the corresponding impacts on the net cash flows from operating activities. Consequently, the consolidated cash flow statements amounts for the year ended December 31, 2016 have been reclassified, with the purpose of improve the presentation of the financial statements.Management considered such reclassifications as immaterial. | ||||||||||||||
e) Interbank Investments and Credits Related to Bacen | ||||||||||||||
They are stated at their settlement amounts and include income, charges, monetary adjustments or changes in exchange rates earned or incurred through the end of the reporting period, calculated on a daily pro rata basis. | ||||||||||||||
e.1) Repurchase Agreement | ||||||||||||||
Repurchase Agreement (Repo) | ||||||||||||||
The bank’s own fixed income securities used as ballast in the repurchasing agreement are highlighted in specific accounts of the asset (linked securities), on transaction date, by the updated accounting average, by type and maturity of the security. The difference between the repurchase value and the sale is the expense of the operation. | ||||||||||||||
To perform sales transactions with repurchase agreements the Bank also uses third-party securities as ballast. Those operations are registered as advance in the balance sheet. | ||||||||||||||
Reverse Repurchase Agreement (Reverse Repo) | ||||||||||||||
The financing granted by ballast with fixed-income securities (third-parties) are recorded on the financed position at liquidation value. The difference between the resale value and the purchase is recognized as the income of the operation. The securities acquired in a reverse repurchase agreement are transferred to the funded status when used as ballast for the sale transactions with repurchase agreements. | ||||||||||||||
Repurchasing Performed With Free Movement Agreements | ||||||||||||||
For the operations with free movement agreements, at the moment of the definitive sale of the securities acquired with resale agreement, the liability account referred to this operation must be evaluated by the securities' market value. | ||||||||||||||
f) Securities | ||||||||||||||
Securities are stated and classified into the following categories and accounting evaluation: | ||||||||||||||
I - Trading securities; | ||||||||||||||
II - Available-for-sale securities; and | ||||||||||||||
III - Held-to-maturity securities. | ||||||||||||||
Trading securities include securities purchased for the purpose of being actively and frequently traded while held-to-maturity securities include those for which the Bank has intention and financial capacity to hold to maturity. Available-for-sale securities include those which cannot be classified in categories I (trading) and III (held-to-maturity). Securities classified into categories I and II are stated at acquisition cost plus income earned through the balance sheet date, calculated on a daily pro rata basis, and adjusted to fair value, with gains or losses on such adjustment being recorded against: | ||||||||||||||
(1) The corresponding income or expense account, net of tax effects, in income statement for the period, when relating to securities classified into the trading category; and | ||||||||||||||
(2) A separated account in stockholders’ equity, net of taxes effects, when related to securities classified into the available-for-sale category. The adjustments to market value recorded on sale of these securities are transferred to the income statement for the period. | ||||||||||||||
Securities classified into the held-to-maturity category are stated at acquisition cost plus income earned through the balance sheet, calculated on a daily pro rata basis. | ||||||||||||||
Any permanent losses recorded on the sale value of securities classified into available-for-sale and held-to-maturity are recognized in the income statement of the period. | ||||||||||||||
g) Derivatives Financial Instruments | ||||||||||||||
Derivatives are classified according to Management's intent to use them for hedging purposes or not. Transactions made by customers' request, by Bank´s will, or that are not qualify as hedge accounting, especially derivatives used to manage the global risk exposure, are recorded at market value, with realized and unrealized gains and losses recorded in the income statement for the period. | ||||||||||||||
Derivative financial instruments designated as part of a framework of protection against risks ("hedge") can be classified as: | ||||||||||||||
I - Fair value hedge; and | ||||||||||||||
II - Cash flow hedge. | ||||||||||||||
Derivatives designated as hedge and the respective hedged items are adjusted to market value, considering the following: | ||||||||||||||
(1) For those classified in category I, the increase or decrease in their amount are recorded in the income statement for the period, net of tax effects; and | ||||||||||||||
(2) For those classified in category II, the increase or decrease in their amount of the effective portion is recorded against a separated account in stockholders’ equity, net of tax effects. | ||||||||||||||
Some hybrid financial instruments contain both derivative financial instrument and non-derivative asset or liability. In these cases, the derivative financial instrument represents an embedded derivative.Embedded derivatives are recorded separately from the host contracts. | ||||||||||||||
h) Minimum Requirements in the Process of Financial Instruments Valuation (Securities and Derivatives Financial Instruments) | ||||||||||||||
The CMN Resolution 4,277 of October 31, 2013 (required since June 30, 2015) provides the minimum requirements to be observed in the process of financial instruments valuation measured at market value and on the adoption of prudential adjustments by financial institutions.The financial instruments mentioned in the Resolution include: | ||||||||||||||
a) Securities classified as "trading" and "available-for-sale", according to the Central Bank´s Circular 3,068 of November 8, 2001; | ||||||||||||||
b) Derivatives Financial Instruments, according to the Central Bank Letter 3,082; of January 30, 2002; and | ||||||||||||||
c) Other financial instruments at fair value, regardless of their classification in the trading portfolio, established in CMN Resolution 3,464 of June 26, 2007. | ||||||||||||||
According to this resolution the Bank has established procedures to assess the need for adjustments in the value of financial instruments mentioned above, observing the prudential, relevance and reliability criteria. This review includes, among other factors, the credit risk spread in the registration of the market value of these instruments. | ||||||||||||||
i) Loan Portfolio and Allowance for Losses | ||||||||||||||
The loan portfolio includes lending, leasing, advances on exchange contracts and other loans with credit characteristics. It is stated at present value, considering the indexes, interest rates and charges agreed, calculated on a daily pro rata basis through the end of the reporting period. The revenue recognition only occurs when it is actually received for lending operations past due over 60 days. | ||||||||||||||
Normally, the Bank writes off loans losses when they are past due over 360 days. In the case of long-term credit operations (over 3 years) their losses are written off when they complete 540 days late. Credit operations written of as loss are recorded in a compensation account for a minimum of five years and while not exhausted all procedures for collection. | ||||||||||||||
The financial assets involved in credit operations sold without risk retention are written off from the balance sheet, which are now kept in the compensation account. The results of these sales are fully recognized when they are realized. | ||||||||||||||
Since January 2012, as required by CMN Resolution 3,533/2008 and Resolution 3,895/2010, all credit operations sold with risk retention will have their results (profit or loss) recognized by the remaining terms of operations, and financial assets involved in these sales shall remain registered as loans and the amount received as obligations for sale operations or transfer of financial assets. | ||||||||||||||
Allowances for loan losses are recognized based on the analysis of outstanding loans and advances (past-due and current), past experience, future expectations, specific portfolio risks, and Management´s risk assessment policy for recognizing allowances, as established by CMN Resolution 2,682/1999. | ||||||||||||||
j) Non-Current Assets Held for Sale and Other Assets | ||||||||||||||
Non-current assets held for sale includes the carrying amount of individual items, disposal groups, or items forming part of a business unit earmarked for disposal (“discontinued operations”), whose sale in their present condition is highly probable and is expected to occur within one year. | ||||||||||||||
Other assets refer mainly to assets not for own use, being composed basically of properties and vehicles received as payment. | ||||||||||||||
Non-current assets held for sale and assets not for own use are generally recorded at the lower amount between the fair value less sale costs and their carrying amount at the date of classification in this category, and they are not depreciated. | ||||||||||||||
k) Prepaid Expenses | ||||||||||||||
Funds used in advance payments, whose benefits or services will be provided in future years, are allocated to profit or loss in accordance to the terms of the related agreements. | ||||||||||||||
k.1) Commissions Paid to Banking Correspondents | ||||||||||||||
In accordance with CMN Resolution 4,294 and Central Bank Circular 3,693 issued in December 2013, from January 2015 the commissions paid to intermediate agents responsible for origination of new credit operations are limited to maximum percentages of: (i) 6% of the value of new credit operation originated and (ii) 3% of the transferred value (portability). | ||||||||||||||
Such commissions must be fully recognized as expenses when they are incurred. | ||||||||||||||
The Central Bank Circular 3,738 of December 2014 has allowed the possibility of staggered implementation of the aforementioned accounting procedure.The bank is using this prerogative, as follows: | ||||||||||||||
a) 2015: Fully recognize as an expense the value of 1/3 of the commission paid, the difference being recognized as an asset and allocated to income for the period of 36 months or the term of the contract, whichever is lower; | ||||||||||||||
b) 2016: Fully recognize as an expense the value of 2/3 of the commission paid, the difference being recognized as an asset and allocated to income for the period of 36 months or the term of the contract, whichever is lower; and | ||||||||||||||
c) 2017: Recognize the full amount of commission paid as expense. | ||||||||||||||
In accordance with Central Bank Circular 3,722 of October 2014, the accounting procedures previously described were applied prospectively from January 2015. | ||||||||||||||
From January 2020, if an unamortized balance of sales commission paid in advance to the correspondent still exists, this amount must be fully allocated to income statement. | ||||||||||||||
l) Permanent Assets | ||||||||||||||
They are stated at acquisition cost, are tested for impairment annually or more frequently if the conditions or circumstances indicate that assets may be impaired, and evaluated considering the following aspects: | ||||||||||||||
l.1) Investments | ||||||||||||||
Adjustments to investments in affiliates and subsidiaries are measured by equity method of accounting and recorded as investments in affiliates and subsidiaries. Other investments are stated at cost method reduced to fair value, when applicable. | ||||||||||||||
l.2) Fixed Assets | ||||||||||||||
The depreciation of fixed assets is determined under the straight-line method, based on the following annual rates: buildings - 4%, facilities, furniture, equipment in use, security systems and communications - 10%, data processing systems and vehicles - 20%, and leasehold improvements - 10% or through the maturity of the rental contracts. | ||||||||||||||
l.3) Intangible Assets | ||||||||||||||
Goodwill on acquisition of subsidiaries is amortized over 10 years, based on expected future earnings and it is tested for impairment annually or more frequently if conditions or circumstances indicate that the asset may be impaired. | ||||||||||||||
In July 2015 the Bank revised the goodwill amortization curve related to Banco Real´s acquisition. This measure aims to suit original amortization curve to the term, extension and proportion of future income. The amortization of this goodwill will be completed in October, 2017 (originally 2016). For the year ended December 31, 2016, there was no change in the amortization curve of the referred goodwill. | ||||||||||||||
The rights over the acquisition of payroll services are registered by the amount paid. Those services are related to payroll processing and payroll loans, maintenance of collection portfolio, supplier payment services and other banking services. The amount paid is allocated to income statement according to the terms of the respective agreements. | ||||||||||||||
Software acquisition and development expenses are amortized over a maximum of 5 years. | ||||||||||||||
m) Technical Reserves Related to the Activities of Pensions and Capitalization | ||||||||||||||
Technical reserves are recognized and calculated in accordance with the provisions and criteria established in the National Council of Private Insurance (CNSP) and Superintendence of Private Insurance (Susep). | ||||||||||||||
Technical Reserves to Pensions | ||||||||||||||
Technical provisions are recognized in accordance with the criteria below: | ||||||||||||||
• Provision for Unearned Premiums (PPNG) | ||||||||||||||
The PPNG consists of the portions of the net premiums of ceded coinsurance, corresponding to the periods that the risks described in the agreements do not occur, calculated on the "pro rata" day basis. According to Circular Susep 517/2015 and its subsequent changes, in the period between the issue and the beginning of the agreement, the calculation of this provision is made considering the duration of the risk. | ||||||||||||||
• Provision for Unearned Premiums-Current Risks but not Issued (PPNG-RVNE) | ||||||||||||||
The PPNG-RVNE estimates the portion of the unearned premiums relating to the risk already taken which do not have their agreements issued yet. This provision is estimated based on the behavior of historical of agreements issued delayed, according to Actuarial Technical Note (NTA). | ||||||||||||||
• Mathematical Provisions for Benefits to Grant and Granted (PMBaC and PMBC) | ||||||||||||||
The PMBaC are estimated based on the contributions collected through the financial regime of capitalization. The PMBC represents obligations taken in the form of continued income plans, being estimated based on the actuarial calculation for traditional types of plans. | ||||||||||||||
• Provisions for Unsettled Claims (PSL) | ||||||||||||||
The PSL is estimated based on warns received by Evidence Previdência S.A. (Evidence) (Note 15), related the single payments and accrued income, from claims reported until the date of calculation, including coinsurance accepted, not net by the reinsurance agreements and net of coinsurance ceded. The write-off of the provision due to payment is characterized by the financial settlement, by the receipt of the compensation payment, by annuity or losing income, or by other cases provided by law. | ||||||||||||||
• PSL Lawsuit | ||||||||||||||
It is estimated for all claims in the lawsuit, based on the probability of loss and classified as probable, possible and remote. | ||||||||||||||
The claims in the lawsuit are reviewed individually by the Legal Department to be classified among the probability of loss, being updated whenever it is needed. | ||||||||||||||
In the PSL, the monetary adjustments and legal fees of collapsing are still applied, according to the agreement indexer and interest of 1% percent per month. | ||||||||||||||
• Provision for Claims Incurred But not Reported (IBNR) | ||||||||||||||
The IBNR must be constituted to cover the claims incurred and not yet reported by the base date of calculation. The term "claim" covers all claims and benefits of pension plans. Evidence does not have a sufficient database for the elaboration of its own methodology. In this way, the technical procedures defined in Circular Susep 517/2015 and subsequent amendments are used. | ||||||||||||||
• Provision of Related Expenses (PDR) | ||||||||||||||
The PDR is estimated in order to cover expected values related to claims expenses. For structured plans in the financial regime of simple sharing and allocation of cover capital, the provision covers the expenses, applicable and not applicable, related to the settlement of claims or benefits, due to claims incurred, warned or not. | ||||||||||||||
• Provision of Financial Surplus (PEF) | ||||||||||||||
The PEF covers the financial surplus values provisioned, to be used in accordance with the rules of each plan. This provision is calculated considering the return on investments held versus the guaranteed profitability in each plan. | ||||||||||||||
• Provision for Redemptions and/or Other Amounts to Regulate (PVR) | ||||||||||||||
It covers the values relating to redemption to regularize, the return of contributions, awards or the requested portability that for whatever reason have not been made yet. | ||||||||||||||
• Complementary Coverage Provision (PCC) | ||||||||||||||
The PCC shall be estimated when the insufficiency is detected in the technical provisions due to the Test of Adequacy of Liabilities (TAP). | ||||||||||||||
Technical Provisions for Capitalization | ||||||||||||||
Technical provisions are elaborated according to the following criteria: | ||||||||||||||
Ÿ Mathematical provisions for redemption results from the accumulation of percentages applicable on payments made, capitalized with the interest rate predicted in the plan and updated through the basic yield rate of savings account - Basic Reference Rate (TR); | ||||||||||||||
Ÿ Provision for redemption of anticipated securities is estimated from the cancellation for non-payment or redemption request, based on the value of the mathematical provision of redemption estimated at the time of securities cancellation and the provision for redemption of the matured securities is estimated after the end of the securities validity; | ||||||||||||||
Ÿ Provision for raffles to be held is estimated based on a percentage of the installment paid and it aims to cover the raffles which the securities will compete, but that they have not been carried out yet. The provision of raffles payable is estimated for the securities raffled, but which have not been paid yet; and | ||||||||||||||
Ÿ Administrative expenses provision aims to reflect the present value of future expenses of capitalization securities whose duration extends from the date of its constitution. | ||||||||||||||
n) Employees Benefit Plans | ||||||||||||||
Post-employment benefit plans include the following commitments taken by the Bank: (i) addition to the benefits of public pension plan; and (ii) medical assistance in case of retirement, permanent disability or death of eligible employees, and their direct beneficiaries. | ||||||||||||||
Defined Contribution Plans | ||||||||||||||
Defined benefit plans is the post-employment benefit plan which the Bank and its subsidiaries, as the sponsoring entity pays fixed contributions to a pension fund, not having a legal or constructive obligation to pay additional contributions if the fund does not hold sufficient assets to pay all benefits relating to services provided in the current and in previous periods. | ||||||||||||||
The contributions made in this connection are recognized under personnel expenses in the income statement. | ||||||||||||||
Defined Benefit Plans | ||||||||||||||
Defined benefit plan is the post-employment benefit plan which is not a defined contribution plan and is showed in Note 35. For this type of plan, the sponsoring entity's obligation is to provide the employees with the agreed benefits, assuming the potential actuarial risk that benefits will cost more than expected. | ||||||||||||||
Since January 2013, Banco Santander applies the CPC 33 (R1) which establishes substantially the full recognition in a liability account when actuarial losses recognized (actuarial deficit) will not occur, with the counterparty in a equity´s account (other valuation adjustments). | ||||||||||||||
Main Definitions | ||||||||||||||
- The present value of the defined benefit obligation is the present value of expected future payments required to settle the obligation resulting from employee´s service in the current and past periods, without deducting any plan´s assets. | ||||||||||||||
- Deficit or surplus is: (a) the present value of the defined benefit obligation, minus (b) the fair value of plan´s assets. | ||||||||||||||
- The sponsoring entity may recognize the plan's assets in the balance sheet when they meet the following characteristics: (i) the assets of the fund are sufficient to pay all benefits for plan´s employees or a sponsoring entity´s obligations; or (ii) the assets are returned to the sponsoring entity in order to reimburse it for employee benefits already paid. | ||||||||||||||
- Actuarial gains and losses are changes in present value of defined benefit obligation resulting from: (a) adjustments by experience (the effects of differences between the actuarial assumptions adopted and what has actually occurred); and (b) effects of changes in actuarial assumptions. | ||||||||||||||
- Current service cost is the increase in the present value of the defined benefit obligation resulting from employee service in the current period. | ||||||||||||||
-The past service cost is the change in present value of defined benefit obligation for employee service in prior periods resulting from a change in the plan or reductions in the number of employees covered. | ||||||||||||||
Post-employment benefits are allocated to the income statement in the lines of other operating expenses - actuarial losses - retirement plans (Note 32) and personnel expenses (Note 28). | ||||||||||||||
The defined benefit plans are recorded based on an actuarial study, conducted annually by an external specialized consulting entity and approved by Management at the end of each year to be effective for the subsequent period. | ||||||||||||||
o) Share Based Compensation | ||||||||||||||
The Bank has compensation plans with long-term conditions for acquisition. The main conditions for acquisition are: (1) conditions of service, provided if the participant remains employed during the period of the Plan to acquire a position to exercise their rights; (2) performance conditions, the amount of investment in Certificates of Deposit Shares (Units) exercisable by the participants will be determined according to the result of a performance measurement parameter of the Bank: Total Shareholder Return (TSR) and it may be reduced, if it does not achieve the goals of the Return on Risk Weighted Assets (RoRWA) modifier, comparison between realized and budgeted in each year, as determined by the Board of Directors and (3) market conditions, since some parameters are conditioned to the value of the shares of the Bank. The Bank measures the fair value of the services rendered by reference to the fair value of the equity instruments granted at the grant date, taking into consideration the market conditions for each plan when the fair value is estimated. | ||||||||||||||
Settlement in Share | ||||||||||||||
The fair value of services is measured by reference to the fair value of the equity instruments granted at the grant date, taking into consideration the market conditions for each plan when the fair value is estimated. In order to recognize the staff costs in contrast with the capital reserves during the period covered, as the services are received, it is considered the treatment of conditions of service and the amount recognized for services received over the period of assessment based on the best estimative for the number of equity instruments expected to grant. | ||||||||||||||
Settlement in Cash | ||||||||||||||
For share-based payments settled in cash (in the form of share appreciation), the Bank measures the services rendered and the corresponding liabilities incurred in the fair value appreciation of the shares at grant date and until the liability is settled. The fair value of liability is revaluated at the end of each reporting period and the date of settlement, with any changes in fair value recognized in the income statement. In order to recognize the staff costs with the counterparty on the "wages payable" provisions throughout the validity period, reflecting how the services are rendered, the total liability measurement is based on the best estimative of the right of the shares appreciation that will be acquired at the end of the validity period and recognizes the value of the services rendered during the validity period based on the best available estimative. Periodically, the Bank evaluates its estimative over the number of stock appreciation rights to be acquired at the end of the grace period. | ||||||||||||||
p) Funding, Notes Issued and Other Liabilities | ||||||||||||||
Financial liabilities instruments are recognized initially at fair value, considered as the trade price. They are subsequently measured at amortized cost with expenses recognized as a financial cost (Note 18.d). | ||||||||||||||
Among the liabilities initial recognition methods, it is important to emphasize those compound financial instruments which are recognized as such due to the fact that they contain both a debt instrument (liability), and an equity component (embedded derivative). | ||||||||||||||
The recognition of a compound instrument consists in a combination of (i) a main instrument, which is recognized as an entity’s genuine liability (debt) and (ii) an equity component (derivative convertible into common shares). | ||||||||||||||
In accordance to the COSIF, the hybrid capital and debt instruments represents obligations of issuers (financial institutions) and should be recorded in specific accounts of the liabilities adjusted according for the effect of exchange rate variation, when denominated in foreign currency. All the yield related to these instruments, such as interest and exchange variation (difference between the functional currency and the currency in which the instrument was denominated) shall be accounted as expenses of the period, in compliance with the accrual basis method. | ||||||||||||||
Related to the stockholders' equity component, your registration occurs at the initial moment based in its fair value, if it is different from zero. | ||||||||||||||
The relevant details of the nature of these compound instruments issued are described in Note 21. | ||||||||||||||
q) Provisions, Contingent Assets and Liabilities | ||||||||||||||
Banco Santander and its subsidiaries are involved in judicial and administrative lawsuits related to tax, labor and civil, in the normal course of their activities. | ||||||||||||||
The provisions include legal obligations, judicial and administrative lawsuits related to tax and social security obligations, whose matter is to challenge their legality or constitutionality where, regardless the assessment of their loss probability, the amounts are fully recognized in the financial statements. | ||||||||||||||
Provisions are reviewed at each financial statements date and adjusted to reflect the current best estimate and may be fully or partially reversed or reduced when the financial outflows and obligations relevant to the process are no longer probable, including decay of legal deadlines, among others. | ||||||||||||||
Judicial and administrative provisions are constituted when the risk of loss of the judicial or administrative action is assessed as probable and the amounts involved are measurable with sufficient security, based on the nature, complexity, and history of the actions and the opinion of the internal legal counsel and the best information available. For lawsuits for which the risk of loss is possible, provisions are not recorded and the information is disclosed in the notes to the financial statements (Note 23.h) and for proceedings for which the risk of loss is remote, disclosure is not required. | ||||||||||||||
Contingent assets are not recognized, except when there are guarantees or favorable judicial decisions in lawsuits from the past with the same matter, when no further claims are applicable, characterizing the success in such litigation. Contingent assets with the risk of success as probable, if any, are only disclosed in the financial statements. | ||||||||||||||
In lawsuits with favorable decisions to Santander, the counterparty has the right, in the event of specific legal requirements attended, to file a rescission action within a period determined by current legislation. Rescission actions are considered new lawsuits and will they be evaluated for contingent liability purposes if and when they are filed. | ||||||||||||||
r) Social Integration Program (PIS) and Contribution for the Financing of Social Security (Cofins) | ||||||||||||||
The PIS (0.65%) and COFINS (4.00%) are calculated on the gross revenue related to the main activity of the legal entity. The financial institutions may deduct funding expenses in the establishment of the amount base for calculation. PIS and COFINS expenses are recorded in tax expenses. For non-financial companies the rates are 1.65% for PIS and 7.6% for COFINS. | ||||||||||||||
| ||||||||||||||
s) Income Tax (IRPJ) and Social Contribution on Net Income (CSLL) | ||||||||||||||
IRPJ is calculated at the rate of 15% plus a surtax of 10% applied on profit, after adjustments determined by tax legislation. The Social Contribution Tax on Net Profit (CSLL) is calculated at the rate of 20% for financial institutions, insurance and capitalization companies and 9% for other companies, applied on profit, after adjustments required by tax legislation. The CSLL rate applicable to financial institutions, insurance and capitalization companies was raised from 15% to 20% for the period between September,1st 2015 and December, 31 2018, in the terms of the current law 13,169/2015 (result of the conversion into law of Provisory Measure 675/2015). | ||||||||||||||
Deferred tax credits and liabilities are basically calculated on the temporary differences between the accounting and taxable income, tax losses, negative basis of social contribution and adjustments to market value of securities and derivative financial instruments. The recognition of deferred tax credits and liabilities is made at the rates applicable to the period in which the asset is realized and / or the liability is settled. | ||||||||||||||
In accordance with the current regulation, the tax credits are recognized to the extent that it is probable its recovery with the base of future taxable income generation. The expected realization of the tax credits according to Note 11.b is based on the projections of future earnings supported by a technical study. | ||||||||||||||
t) Impairment | ||||||||||||||
The financial and non-financial assets are measured at the end of each reporting period in order to identify evidence of impairment in its accounting value. If there is any indication, the entity shall estimate the recoverable amount of the asset and that loss shall be recognized immediately in the income statement. The recoverable amount of an asset is defined as the highest amount between its fair value net of selling expenses and its value in use. | ||||||||||||||
u) Deferred Income | ||||||||||||||
It refers to income received before the maturity of the underlying obligation and include non-refundable income, primarily related to guarantees provided and credit card annual fees. The allocation to income statement is made in accordance with the terms of the agreements. | ||||||||||||||
v) Non-Controlling Interest - Consolidated Stockholders' Equity | ||||||||||||||
The non-controlling interests (minority interests) are reported and highlighted in a separate stockholders' equity of the parent entity for presentation purposes of the consolidated financial statements. | ||||||||||||||
w) Financial Guarantees | ||||||||||||||
Resolution CMN 4,512 of July 28, 2016 and Circular Letter Bacen 3,782 of September 19, 2016 established accounting procedures to be applied, determining on the constitution of a provision to cover losses associated with financial guarantees provided in any form, to be applied prospectively as from January 1, 2017. Losses associated with the likelihood of future disbursements linked to financial guarantees provided are measured in accordance with recognized credit risk management models and practices and based on consistent information and criteria, verifiable. The provision should be sufficient to cover probable losses over the term of the guarantee provided and are evaluated periodically. Provisions related to financial guarantees rendered before January 1, 2017 were recorded as a contra entry to the shareholders' equity account, in accordance with the Resolution and Circular Letter mentioned above. | ||||||||||||||
4. Cash and Cash Equivalents | ||||||||||||||
|
|
|
|
|
|
|
|
|
|
|
|
|
|
|
Bank | Consolidated | |||||||||||||
|
|
|
| 12/31/2017 | 12/31/2016 | 12/31/2015 | 12/31/2017 | 12/31/2016 | 12/31/2015 | |||||
Cash |
|
|
| 11,148,561 |
| 5,513,365 |
| 5,231,627 |
| 11,234,369 |
| 5,723,084 |
| 6,863,856 |
Interbank Investments |
| 11,515,820 |
| 12,334,313 |
| 26,116,456 |
| 11,278,948 |
| 12,410,093 |
| 26,269,326 | ||
Money Market Investments |
| 603,408 |
| 1,053,105 |
| 3,993,155 |
| 673,426 |
| 1,129,140 |
| 4,146,025 | ||
Interbank Deposits |
| 1,498,280 |
| 282,753 |
| 292,520 |
| 1,190,802 |
| 282,753 |
| 292,520 | ||
Foreign Currency Investments |
| 9,414,132 |
| 10,998,455 |
| 21,830,781 |
| 9,414,720 |
| 10,998,200 |
| 21,830,781 | ||
Total |
|
|
| 22,664,381 |
| 17,847,678 |
| 31,348,083 |
| 22,513,317 |
| 18,133,177 |
| 33,133,182 |
5. Interbank Investments | ||||||||||||||
|
|
|
|
|
|
|
|
|
|
|
|
|
|
|
Bank | ||||||||||||||
|
|
|
|
|
|
|
|
|
|
|
| 12/31/2017 |
| 12/31/2016 |
Up to | From 3 to | Over | ||||||||||||
|
|
|
|
|
| 3 Months |
| 12 Months |
| 12 Months |
| Total |
| Total |
Money Market Investments |
|
|
| 16,041,387 |
| 18,372,916 |
| - |
| 34,414,303 |
| 47,405,162 | ||
Own Portfolio |
|
|
|
|
| 603,271 |
| - |
| - |
| 603,271 |
| 1,049,511 |
Financial Treasury Bills - LFT |
|
|
| 208,159 |
| - |
| - |
| 208,159 |
| 546,618 | ||
National Treasury Bills - LTN |
|
|
| 120,795 |
| - |
| - |
| 120,795 |
| 281,870 | ||
National Treasury Notes - NTN |
|
|
| 274,317 |
| - |
| - |
| 274,317 |
| 221,023 | ||
Third-party Portfolio |
|
|
| 2,024,997 |
| 4,374,382 |
| - |
| 6,399,379 |
| 15,089,724 | ||
National Treasury Bills - LTN |
|
|
| 548,856 |
| 72,870 |
| - |
| 621,726 |
| 2,692,139 | ||
National Treasury Notes - NTN |
|
|
| 1,476,141 |
| 4,301,512 |
| - |
| 5,777,653 |
| 12,397,585 | ||
Sold Position |
|
|
|
|
| 13,413,119 |
| 13,998,534 |
| - |
| 27,411,653 |
| 31,265,927 |
National Treasury Bills - LTN |
|
|
| 1,263,176 |
| 1,101,003 |
| - |
| 2,364,179 |
| 4,791,784 | ||
National Treasury Notes - NTN |
|
|
| 12,149,943 |
| 12,897,531 |
| - |
| 25,047,474 |
| 26,474,143 | ||
Interbank Deposits |
|
|
| 5,747,549 |
| 21,479,317 |
| 21,840,772 |
| 49,067,638 |
| 36,721,868 | ||
Foreign Currency Investments |
|
|
| 9,414,132 |
| - |
| - |
| 9,414,132 |
| 10,998,455 | ||
Total |
|
|
|
|
| 31,203,068 |
| 39,852,233 |
| 21,840,772 |
| 92,896,073 |
| 95,125,485 |
Current |
|
|
|
|
|
|
|
|
|
|
| 71,055,301 |
| 80,312,979 |
Long-term |
|
|
|
|
|
|
|
|
|
|
| 21,840,772 |
| 14,812,506 |
Consolidated | ||||||||||||||
|
|
|
|
|
|
|
|
|
|
|
| 12/31/2017 |
| 12/31/2016 |
Up to | From 3 to | Over | ||||||||||||
|
|
|
|
|
| 3 Months |
| 12 Months |
| 12 Months |
| Total |
| Total |
Money Market Investments |
|
|
| 16,111,405 |
| 18,372,916 |
| - |
| 34,484,321 |
| 47,479,196 | ||
Own Portfolio |
|
|
|
|
| 2,300,490 |
| 4,374,382 |
| - |
| 6,674,872 |
| 10,128,147 |
Financial Treasury Bills - LFT |
|
|
| 208,159 |
| - |
| - |
| 208,159 |
| 546,619 | ||
National Treasury Bills - LTN |
|
|
| 738,909 |
| 72,870 |
| - |
| 811,779 |
| 3,041,941 | ||
National Treasury Notes - NTN |
|
|
| 1,353,422 |
| 4,301,512 |
| - |
| 5,654,934 |
| 6,539,587 | ||
Third-party Portfolio |
|
|
| 397,796 |
| - |
| - |
| 397,796 |
| 6,085,122 | ||
National Treasury Bills - LTN |
|
|
| 760 |
| - |
| - |
| 760 |
| 6,102 | ||
National Treasury Notes - NTN |
|
|
| 397,036 |
| - |
| - |
| 397,036 |
| 6,079,020 | ||
Sold Position |
|
|
|
|
| 13,413,119 |
| 13,998,534 |
| - |
| 27,411,653 |
| 31,265,927 |
National Treasury Bills - LTN |
|
|
| 1,263,176 |
| 1,101,003 |
| - |
| 2,364,179 |
| 4,791,784 | ||
National Treasury Notes - NTN |
|
|
| 12,149,943 |
| 12,897,531 |
| - |
| 25,047,474 |
| 26,474,143 | ||
Interbank Deposits |
|
|
| 1,373,608 |
| 967,587 |
| 520,440 |
| 2,861,635 |
| 1,190,540 | ||
Foreign Currency Investments |
|
|
| 9,414,720 |
| - |
| - |
| 9,414,720 |
| 10,999,505 | ||
Total |
|
|
|
|
| 26,899,733 |
| 19,340,503 |
| 520,440 |
| 46,760,676 |
| 59,669,241 |
Current |
|
|
|
|
|
|
|
|
|
|
| 46,240,236 |
| 59,513,115 |
Long-term |
|
|
|
|
|
|
|
|
|
|
| 520,440 |
| 156,126 |
6. Securities and Derivatives Financial Instruments | ||||||||||||||
a) Securities | ||||||||||||||
I) By Category | ||||||||||||||
|
|
|
|
|
|
|
|
|
|
|
|
|
| Bank |
|
|
|
|
|
|
|
|
|
|
|
| 12/31/2017 |
| 12/31/2016 |
Amortized | Effect of Adjustment to | Carrying | Carrying | |||||||||||
|
|
|
|
|
| Cost |
| Income |
| Equity |
| Amount |
| Amount |
Trading Securities |
|
|
| 32,185,664 |
| 153,095 |
| - |
| 32,338,759 |
| 62,305,120 | ||
Government Securities |
|
|
| 31,527,948 |
| 161,352 |
| - |
| 31,689,300 |
| 58,056,201 | ||
Private Securities |
|
|
|
| 657,716 |
| (8,257) |
| - |
| 649,459 |
| 4,248,919 | |
Available-for-Sale Securities |
|
|
| 130,382,276 |
| 364,878 |
| 971,882 |
| 131,719,036 |
| 134,076,424 | ||
Government Securities |
|
|
| 79,487,956 |
| 364,434 |
| 1,427,932 |
| 81,280,322 |
| 50,965,594 | ||
Private Securities |
|
|
|
| 50,894,320 |
| 444 |
| (456,050) |
| 50,438,714 |
| 83,110,830 | |
Held-to-Maturity Securities |
|
|
| 9,578,992 |
| - |
| - |
| 9,578,992 |
| 9,388,442 | ||
Government Securities |
|
|
| 9,578,992 |
| - |
| - |
| 9,578,992 |
| 9,388,442 | ||
Total Securities |
|
|
|
|
| 172,146,934 |
| 517,973 |
| 971,882 |
| 173,636,789 |
| 205,769,986 |
Derivatives (Assets) |
|
|
| 12,797,005 |
| (1,464,531) |
| (28,601) |
| 11,303,873 |
| 17,850,990 | ||
Total Securities and Derivatives |
|
|
| 183,943,937 |
| (946,558) |
| 943,281 |
| 184,940,660 |
| 223,620,976 | ||
Current |
|
|
|
|
|
|
|
|
|
|
| 59,009,344 |
| 97,187,849 |
Long-term |
|
|
|
|
|
|
|
|
|
|
| 125,931,316 |
| 126,433,127 |
Derivatives (Liabilities) |
|
|
| (12,045,943) |
| 1,637,733 |
| (85) |
| (10,408,295) |
| (13,627,655) | ||
Current |
|
|
|
|
|
|
|
|
|
|
| (5,797,638) |
| (8,442,552) |
Long-term |
|
|
|
|
|
|
|
|
|
|
| (4,610,657) |
| (5,185,103) |
|
|
|
|
|
|
|
|
|
|
|
|
|
| Consolidated |
|
|
|
|
|
|
|
|
|
|
|
| 12/31/2017 |
| 12/31/2016 |
Amortized | Effect of Adjustment to | Carrying | Carrying | |||||||||||
|
|
|
|
|
| Cost |
| Income |
| Equity |
| Amount |
| Amount |
Trading Securities |
|
|
| 37,697,135 |
| 250,975 |
| - |
| 37,948,110 |
| 62,739,022 | ||
Government Securities |
|
|
| 35,749,437 |
| 223,807 |
| - |
| 35,973,244 |
| 60,984,954 | ||
Private Securities |
|
|
|
| 1,947,698 |
| 27,168 |
| - |
| 1,974,866 |
| 1,754,068 | |
Available-for-Sale Securities |
|
|
| 101,293,880 |
| 364,878 |
| 1,000,046 |
| 102,658,804 |
| 73,386,247 | ||
Government Securities |
|
|
| 82,733,339 |
| 364,434 |
| 1,455,843 |
| 84,553,616 |
| 54,591,429 | ||
Private Securities |
|
|
|
| 18,560,542 |
| 444 |
| (455,797) |
| 18,105,189 |
| 18,794,818 | |
Held-to-Maturity Securities |
|
|
| 9,578,992 |
| - |
| - |
| 9,578,992 |
| 9,388,442 | ||
Government Securities |
|
|
| 9,578,992 |
| - |
| - |
| 9,578,992 |
| 9,388,442 | ||
Total Securities |
|
|
|
|
| 148,570,008 |
| 615,853 |
| 1,000,046 |
| 150,185,907 |
| 145,513,711 |
Derivatives (Assets) |
|
|
| 15,532,036 |
| 5,905,954 |
| 105,778 |
| 21,543,768 |
| 24,075,956 | ||
Total Securities and Derivatives |
|
|
| 164,102,043 |
| 6,521,807 |
| 1,105,824 |
| 171,729,674 |
| 169,589,667 | ||
Current |
|
|
|
|
|
|
|
|
|
|
| 74,425,223 |
| 90,341,153 |
Long-term |
|
|
|
|
|
|
|
|
|
|
| 97,304,451 |
| 79,248,514 |
Derivatives (Liabilities) |
|
|
| (13,699,361) |
| (6,738,384) |
| (243,139) |
| (20,680,884) |
| (19,944,514) | ||
Current |
|
|
|
|
|
|
|
|
|
|
| (15,943,399) |
| (14,585,133) |
Long-term |
|
|
|
|
|
|
|
|
|
|
| (4,737,485) |
| (5,359,381) |
(Free Translation into English from the Original Previously Issued in Portuguese) | |
BANCO SANTANDER (BRASIL) S.A. AND SUBSIDIARIES | |
In thousands of Brazilian Real - R$, unless otherwise stated | |
II) Trading Securities | ||||||||||||||||||||
|
|
|
|
|
|
|
|
|
|
|
|
|
|
|
|
| ||||
|
|
|
|
|
|
|
|
|
|
|
| Bank |
|
|
|
|
|
|
| Consolidated |
|
|
|
|
|
|
|
|
|
| 12/31/2017 |
| 12/31/2016 |
|
|
|
|
| 12/31/2017 |
| 12/31/2016 |
Adjustment | Adjustment | |||||||||||||||||||
Amortized | to Fair Value - | Carrying | Carrying | Amortized | to Fair Value - | Carrying | Carrying | |||||||||||||
Trading Securities |
| Cost |
| Income |
| Amount |
| Amount |
| Cost |
| Income |
| Amount |
| Amount | ||||
Government Securities |
| 31,527,948 |
| 161,352 |
| 31,689,300 |
| 58,056,201 |
| 35,749,437 |
| 223,807 |
| 35,973,244 |
| 60,984,954 | ||||
Financial Treasury Bills - LFT |
| 1,814,957 |
| 1,015 |
| 1,815,972 |
| 3,347,930 |
| 4,523,362 |
| 1,549 |
| 4,524,911 |
| 4,713,707 | ||||
National Treasury Bills - LTN |
| 6,559,093 |
| 24,550 |
| 6,583,643 |
| 10,232,632 |
| 6,559,093 |
| 24,550 |
| 6,583,643 |
| 10,232,632 | ||||
National Treasury Notes - NTN A |
| 210,350 |
| 2,412 |
| 212,762 |
| 199,195 |
| 210,350 |
| 2,412 |
| 212,762 |
| 199,195 | ||||
National Treasury Notes - NTN B |
| 15,219,905 |
| 80,853 |
| 15,300,758 |
| 18,793,474 |
| 15,576,733 |
| 83,513 |
| 15,660,246 |
| 19,184,569 | ||||
National Treasury Notes - NTN C |
| 1,588 |
| 84 |
| 1,672 |
| 53,533 |
| 1,157,844 |
| 59,345 |
| 1,217,189 |
| 1,225,414 | ||||
National Treasury Notes - NTN F |
| 7,508,384 |
| 47,056 |
| 7,555,440 |
| 25,300,465 |
| 7,508,384 |
| 47,056 |
| 7,555,440 |
| 25,300,465 | ||||
Agricultural Debt Securities - TDA |
| 146,997 |
| 5,344 |
| 152,341 |
| 128,268 |
| 146,997 |
| 5,344 |
| 152,341 |
| 128,268 | ||||
Brazilian Foreign Debt Notes |
| 66,674 |
| 38 |
| 66,712 |
| 704 |
| 66,674 |
| 38 |
| 66,712 |
| 704 | ||||
Private Securities |
|
|
| 657,716 |
| (8,257) |
| 649,459 |
| 4,248,919 |
| 1,947,698 |
| 27,168 |
| 1,974,866 |
| 1,754,068 | ||
Shares |
|
|
| 484 |
| (235) |
| 249 |
| 257 |
| 201,445 |
| 35,190 |
| 236,635 |
| 124,997 | ||
Receivables Investment Fund - FIDC(1) |
| - |
| - |
| - |
| 1,996 |
| - |
| - |
| - |
| 1,996 | ||||
Investment Fund Shares in Participation - FIP | - | - | - | - | - | - | - | 21,313 | ||||||||||||
Investment Fund Shares |
| 85,084 |
| (813) |
| 84,271 |
| - |
| 1,075,841 |
| (813) |
| 1,075,028 |
| 1,083,298 | ||||
Investment Fund Real Estate |
| - |
| - |
| - |
| - |
| 48,246 |
| - |
| 48,246 |
| 24,032 | ||||
Debentures(3) (9) |
|
|
| 397,258 |
| (3,542) |
| 393,716 |
| 4,068,289 |
| 447,276 |
| (3,542) |
| 443,734 |
| 268,481 | ||
Financial Bills - LF |
|
|
| - |
| - |
| - |
| - |
| - |
| - |
| - |
| 48,600 | ||
Certificates of Real Estate Receivables - CRI |
| 104,814 |
| (3,672) |
| 101,142 |
| 30,280 |
| 104,814 |
| (3,672) |
| 101,142 |
| 30,325 | ||||
Certificates of Agribusiness Receivables - CRA | 70,076 |
| 5 |
| 70,081 |
| 148,097 |
| 70,076 |
| 5 |
| 70,081 |
| 148,097 | |||||
Certificates of Time Deposits - CDB |
| - |
| - |
| - |
| - |
| - |
| - |
| - |
| 2,929 | ||||
Total |
| 32,185,664 |
| 153,095 |
| 32,338,759 |
| 62,305,120 |
| 37,697,135 |
| 250,975 |
| 37,948,110 |
| 62,739,022 | ||||
|
|
|
|
|
|
|
|
|
|
|
|
|
|
|
|
|
|
|
| Bank |
12/31/2017 | ||||||||||||||||||||
Trading Securities |
|
|
|
|
|
|
| Without |
| Up to |
| From 3 to |
| From 1 to |
| Over |
| |||
by Maturity |
|
|
| Maturity |
| 3 Months |
| 12 Months |
| 3 Years |
| 3 Years |
| Total | ||||||
Government Securities |
|
|
|
|
| - |
| 1,023,026 |
| 5,243,572 |
| 7,651,549 |
| 17,771,153 |
| 31,689,300 | ||||
Financial Treasury Bills - LFT |
|
|
|
|
| - |
| 246,160 |
| 356,986 |
| 638,429 |
| 574,397 |
| 1,815,972 | ||||
National Treasury Bills - LTN |
|
|
|
|
| - |
| 273,619 |
| 1,884,520 |
| 3,793,216 |
| 632,288 |
| 6,583,643 | ||||
National Treasury Notes - NTN A |
|
|
|
|
| - |
| - |
| 772 |
| - |
| 211,990 |
| 212,762 | ||||
National Treasury Notes - NTN B |
|
|
|
|
| - |
| 51,665 |
| 2,945,148 |
| 2,166,564 |
| 10,137,381 |
| 15,300,758 | ||||
National Treasury Notes - NTN C |
|
|
|
|
| - |
| - |
| 6 |
| - |
| 1,666 |
| 1,672 | ||||
National Treasury Notes - NTN F |
|
|
|
|
| - |
| 381,819 |
| - |
| 997,946 |
| 6,175,675 |
| 7,555,440 | ||||
Agricultural Debt Securities - TDA |
|
|
|
|
| - |
| 3,745 |
| 56,140 |
| 55,394 |
| 37,062 |
| 152,341 | ||||
Brazilian Foreign Debt Securities |
|
|
|
|
| - |
| 66,018 |
| - |
| - |
| 694 |
| 66,712 | ||||
Private Securities |
|
|
|
|
|
|
| 84,520 |
| 2,677 |
| 19,968 |
| 22,696 |
| 519,598 |
| 649,459 | ||
Shares |
|
|
|
|
|
|
| 249 |
| - |
| - |
| - |
| - |
| 249 | ||
Investment Fund Shares |
|
|
|
|
| 84,271 |
| - |
| - |
| - |
| - |
| 84,271 | ||||
Debentures(3) (9) |
|
|
|
|
|
|
| - |
| 2,087 |
| 17,479 |
| 22,681 |
| 351,469 |
| 393,716 | ||
Certificates of Real Estate Receivables - CRI |
|
|
|
|
| - |
| 552 |
| 2,489 |
| - |
| 98,101 |
| 101,142 | ||||
Certificates of Agribusiness Receivables - CRA |
|
|
| - |
| 38 |
| - |
| 15 |
| 70,028 |
| 70,081 | ||||||
Total |
|
|
|
|
|
|
| 84,520 |
| 1,025,703 |
| 5,263,540 |
| 7,674,245 |
| 18,290,751 |
| 32,338,759 | ||
|
|
|
|
|
|
|
|
|
|
|
|
|
|
|
|
|
|
|
| Consolidated |
12/31/2017 | ||||||||||||||||||||
Trading Securities |
|
|
|
|
|
|
| Without |
| Up to |
| From 3 to |
| From 1 to |
| Over |
|
| ||
by Maturity |
|
|
|
|
|
|
| Maturity |
| 3 Months |
| 12 Months |
| 3 Years |
| 3 Years |
| Total | ||
Government Securities |
|
|
|
|
| - |
| 1,145,110 |
| 5,483,698 |
| 8,884,259 |
| 20,460,177 |
| 35,973,244 | ||||
Financial Treasury Bills - LFT |
|
|
|
|
| - |
| 321,626 |
| 597,112 |
| 1,862,605 |
| 1,743,568 |
| 4,524,911 | ||||
National Treasury Bills - LTN |
|
|
|
|
| - |
| 273,619 |
| 1,884,520 |
| 3,793,216 |
| 632,288 |
| 6,583,643 | ||||
National Treasury Notes - NTN A |
|
|
|
|
| - |
| - |
| 772 |
| - |
| 211,990 |
| 212,762 | ||||
National Treasury Notes - NTN B |
|
|
|
|
| - |
| 58,730 |
| 2,945,148 |
| 2,175,098 |
| 10,481,270 |
| 15,660,246 | ||||
National Treasury Notes - NTN C |
|
|
|
|
| - |
| 39,553 |
| 6 |
| - |
| 1,177,630 |
| 1,217,189 | ||||
National Treasury Notes - NTN F |
|
|
|
|
| - |
| 381,819 |
| - |
| 997,946 |
| 6,175,675 |
| 7,555,440 | ||||
Agricultural Debt Securities - TDA |
|
|
|
|
| - |
| 3,745 |
| 56,140 |
| 55,394 |
| 37,062 |
| 152,341 | ||||
Brazilian Foreign Debt Notes |
|
|
|
|
| - |
| 66,018 |
| - |
| - |
| 694 |
| 66,712 | ||||
Private Securities |
|
|
|
|
|
|
| 1,341,956 |
| 70,365 |
| 20,251 |
| 22,696 |
| 519,598 |
| 1,974,866 | ||
Shares |
|
|
|
|
|
|
| 236,635 |
| - |
| - |
| - |
| - |
| 236,635 | ||
Investment Fund Shares in Participation - FIP |
|
|
|
|
| - |
| - |
| - |
| - |
| - |
| - | ||||
Investment Fund Shares |
|
|
|
|
| 1,075,028 |
| - |
| - |
| - |
| - |
| 1,075,028 | ||||
Investment Fund Real Estate |
|
|
|
|
|
|
|
|
| 30,293 |
| 17,670 |
| 283 |
| - |
| - |
| 48,246 |
Debentures(3) |
|
|
|
|
|
|
| - |
| 52,105 |
| 17,479 |
| 22,681 |
| 351,469 |
| 443,734 | ||
Certificates of Real Estate Receivables - CRI |
|
|
|
|
| - |
| 552 |
| 2,489 |
| - |
| 98,101 |
| 101,142 | ||||
Certificates of Agribusiness Receivables - CRA |
|
|
| - |
| 38 |
| - |
| 15 |
| 70,028 |
| 70,081 | ||||||
Certificates of Time Deposits - CDB |
|
|
|
|
| - |
| - |
| - |
| - |
| - |
| - | ||||
Total |
|
|
|
|
|
|
| 1,341,956 |
| 1,215,475 |
| 5,503,949 |
| 8,906,955 |
| 20,979,775 |
| 37,948,110 | ||
III) Available-for-Sale Securities | ||||||||||||||||||||
|
|
|
|
|
|
|
|
|
|
|
|
|
|
|
|
| ||||
|
|
|
|
|
|
|
|
|
|
|
|
|
|
|
|
|
|
|
| Bank |
|
|
|
|
|
|
|
|
|
|
|
|
|
|
|
|
|
| 12/31/2017 |
| 12/31/2016 |
| ||||||||||||||||||||
Amortized |
|
| Fair Value on: | Carrying | Carrying | |||||||||||||||
Available-for-Sale Securities |
|
|
|
|
|
|
| Cost |
| Income | Equity |
| Amount |
| Amount | |||||
Government Securities |
|
|
|
|
|
|
| 79,487,956 |
| 364,434 |
| 1,427,932 |
| 81,280,322 |
| 50,965,594 | ||||
Treasury Certificates - CFT |
|
|
|
|
|
|
| 672 |
| - |
| 212 |
| 884 |
| 792 | ||||
Securitized Credit |
|
|
|
|
|
|
|
|
| 1,799 |
| - |
| 206 |
| 2,005 |
| 2,774 | ||
Financial Treasury Bills - LFT(10) |
|
|
|
|
|
|
| 8,815,793 |
| - |
| 12,384 |
| 8,828,177 |
| 13,009,538 | ||||
National Treasury Bills - LTN(7) |
|
|
|
|
|
|
| 38,148,988 |
| 219,611 |
| 570,293 |
| 38,938,892 |
| 15,427,266 | ||||
National Treasury Notes - NTN A |
|
|
|
|
|
|
| 1,148,706 |
| - |
| 96,903 |
| 1,245,609 |
| 1,098,376 | ||||
National Treasury Notes - NTN B |
|
|
|
|
|
|
| 9,244,147 |
| - |
| 661,747 |
| 9,905,894 |
| 6,676,617 | ||||
National Treasury Notes - NTN C(2) |
|
|
|
|
|
|
| 623,512 |
| - |
| 24,188 |
| 647,700 |
| 1,457,303 | ||||
National Treasury Notes - NTN F(2) (5) (8) |
|
|
|
|
|
|
| 16,738,324 |
| 144,823 |
| 65,780 |
| 16,948,927 |
| 10,103,843 | ||||
Spanish Foreign Debt Bonds |
|
|
|
|
|
|
| 4,766,015 |
| - |
| (3,781) |
| 4,762,234 |
| 3,189,085 | ||||
Private Securities |
|
|
|
|
|
|
|
|
| 50,894,320 |
| 444 |
| (456,050) |
| 50,438,714 |
| 83,110,830 | ||
Shares |
|
|
|
|
|
|
|
|
| 46,264 |
| - |
| 153 |
| 46,417 |
| 570,918 | ||
Investment Fund Shares in Participation - FIP(6) |
|
|
|
|
| 33,368 |
| - |
| - |
| 33,368 |
| 37,510 | ||||||
Investment Fund Shares |
|
|
|
|
|
|
| 765,519 |
| - |
| - |
| 765,519 |
| 638,240 | ||||
Investment Fund Real Estate |
|
|
|
|
|
|
|
|
|
|
| 424,255 |
| - |
| - |
| 424,255 |
| 587,558 |
Debentures (3) (9) |
|
|
|
|
|
|
|
|
| 41,625,232 |
| - |
| (506,373) |
| 41,118,859 |
| 75,534,609 | ||
Eurobonds |
|
|
|
|
|
|
|
|
| - |
| - |
| - |
| - |
| 158,057 | ||
Promissory Notes - NP (4) |
|
|
|
|
|
|
| 6,067,759 |
| 444 |
| 51,779 |
| 6,119,982 |
| 3,794,761 | ||||
Financial Bills - LF |
|
|
|
|
|
|
|
|
| 253,766 |
| - |
| 18,201 |
| 271,967 |
| 1,260,295 | ||
Certificates of Real Estate Receivables - CRI |
|
|
|
|
|
|
| 250,586 |
| - |
| (3,410) |
| 247,176 |
| 398,435 | ||||
Rural Product Note - CPR |
|
|
|
|
|
|
| 1,427,571 |
| - |
| (16,400) |
| 1,411,171 |
| 130,447 | ||||
Total |
|
|
|
|
|
|
|
|
| 130,382,276 |
| 364,878 |
| 971,882 |
| 131,719,036 |
| 134,076,424 | ||
|
|
|
|
|
|
|
|
|
|
|
|
|
|
|
|
|
|
|
| Consolidated |
|
|
|
|
|
|
|
|
|
|
|
|
|
|
|
|
|
| 12/31/2017 |
| 12/31/2016 |
| ||||||||||||||||||||
Amortized |
|
| Fair Value on: | Carrying | Carrying | |||||||||||||||
Available-for-Sale Securities |
|
|
|
|
|
|
| Cost |
| Income | Equity |
| Amount |
| Amount | |||||
Government Securities |
|
|
|
|
|
|
| 82,733,339 |
| 364,434 |
| 1,455,843 |
| 84,553,616 |
| 54,591,429 | ||||
Treasury Certificates - CFT |
|
|
|
|
|
|
| 672 |
| - |
| 212 |
| 884 |
| 792 | ||||
Securitized Credit |
|
|
|
|
|
|
|
|
| 1,799 |
| - |
| 206 |
| 2,005 |
| 2,774 | ||
Financial Treasury Bills - LFT(10) |
|
|
|
|
|
|
| 9,413,916 |
| - |
| 12,303 |
| 9,426,219 |
| 13,859,561 | ||||
National Treasury Bills - LTN(7) |
|
|
|
|
|
|
| 38,844,404 |
| 219,611 |
| 593,209 |
| 39,657,224 |
| 16,500,386 | ||||
National Treasury Notes - NTN A |
|
|
|
|
|
|
| 1,148,706 |
| - |
| 96,903 |
| 1,245,609 |
| 1,098,376 | ||||
National Treasury Notes - NTN B |
|
|
|
|
|
|
| 9,244,147 |
| - |
| 661,747 |
| 9,905,894 |
| 6,676,617 | ||||
National Treasury Notes - NTN C(2) |
|
|
|
|
|
|
| 623,512 |
| - |
| 24,188 |
| 647,700 |
| 1,457,303 | ||||
National Treasury Notes - NTN F(2) (5) (8) |
|
|
|
|
|
|
| 18,690,168 |
| 144,823 |
| 70,856 |
| 18,905,847 |
| 11,806,535 | ||||
Spanish Foreign Debt Bonds |
|
|
|
|
|
|
| 4,766,015 |
| - |
| (3,781) |
| 4,762,234 |
| 3,189,085 | ||||
Private Securities |
|
|
|
|
|
|
|
|
| 18,560,541 |
| 444 |
| (455,797) |
| 18,105,188 |
| 18,794,818 | ||
Shares |
|
|
|
|
|
|
|
|
| 51,611 |
| - |
| 153 |
| 51,764 |
| 925,220 | ||
Investment Fund Shares in Participation - FIP (6) |
|
|
|
|
| 33,370 |
| - |
| - |
| 33,370 |
| 42,456 | ||||||
Investment Fund Shares |
|
|
|
|
|
|
| 66,399 |
| - |
| - |
| 66,399 |
| 151,202 | ||||
Investment Fund Real Estate |
|
|
|
|
|
|
| 65,259 |
| - |
| 221 |
| 65,480 |
| 62,807 | ||||
Debentures (3) |
|
|
|
|
|
|
|
|
| 10,246,204 |
| - |
| (506,373) |
| 9,739,831 |
| 11,589,925 | ||
Eurobonds |
|
|
|
|
|
|
|
|
| - |
| - |
| - |
| - |
| 158,057 | ||
Promissory Notes - NP (4) |
|
|
|
|
|
|
| 6,067,759 |
| 444 |
| 51,779 |
| 6,119,982 |
| 3,797,619 | ||||
Foreign Exchange Bills - LC |
|
|
|
|
|
|
| 10,426 |
| - |
| - |
| 10,426 |
| 20,594 | ||||
Financial Bills - LF |
|
|
|
|
|
|
|
|
| 340,694 |
| - |
| 18,233 |
| 358,927 |
| 1,489,268 | ||
Certificates of Real Estate Receivables - CRI |
|
|
|
|
|
|
| 250,586 |
| - |
| (3,410) |
| 247,176 |
| 398,435 | ||||
Certificates of Time Deposits - CDB |
|
|
|
|
|
|
| 662 |
| - |
| - |
| 662 |
| 28,788 | ||||
Rural Product Note - CPR |
|
|
|
|
|
|
| 1,427,571 |
| - |
| (16,400) |
| 1,411,171 |
| 130,447 | ||||
Total |
|
|
|
|
|
|
|
|
| 101,293,880 |
| 364,878 |
| 1,000,046 |
| 102,658,804 |
| 73,386,247 | ||
|
|
|
|
|
|
|
|
|
|
|
|
|
|
|
|
|
|
|
| Bank |
|
|
|
|
|
|
|
|
|
|
|
|
|
|
|
|
|
|
|
| 12/31/2017 |
Available-for-Sale Securities |
|
|
|
|
| Without |
| Up to |
| From 3 to |
| From 1 to |
| Over |
|
| ||||
by Maturity |
|
|
|
|
|
|
| Maturity |
| 3 Months |
| 12 Months |
| 3 Years |
| 3 Years |
| Total | ||
Government Securities |
|
|
|
|
| - |
| 825,892 |
| 14,155,373 |
| 22,376,011 |
| 43,923,046 |
| 81,280,322 | ||||
Treasury Certificates - CFT |
|
|
|
|
| - |
| - |
| - |
| - |
| 884 |
| 884 | ||||
Securitized Credit |
|
|
|
|
|
|
| - |
| 198 |
| 529 |
| 994 |
| 284 |
| 2,005 | ||
Financial Treasury Bills - LFT(10) |
|
|
|
|
| - |
| - |
| - |
| 13,135 |
| 8,815,042 |
| 8,828,177 | ||||
National Treasury Bills - LTN(7) |
|
|
|
|
| - |
| 10,000 |
| 9,383,025 |
| 22,361,882 |
| 7,183,985 |
| 38,938,892 | ||||
National Treasury Notes - NTN A |
|
|
|
|
| - |
| - |
| 4,510 |
| - |
| 1,241,099 |
| 1,245,609 | ||||
National Treasury Notes - NTN B |
|
|
|
|
| - |
| 49,592 |
| 5,075 |
| - |
| 9,851,227 |
| 9,905,894 | ||||
National Treasury Notes - NTN C(2) |
|
|
|
|
| - |
| �� 6,255 |
| - |
| - |
| 641,445 |
| 647,700 | ||||
National Treasury Notes - NTN F(2) (5) (8) |
|
|
|
|
| - |
| 759,847 |
| - |
| - |
| 16,189,080 |
| 16,948,927 | ||||
Spanish Foreign Debt Bonds |
|
|
|
|
| - |
| - |
| 4,762,234 |
| - |
| - |
| 4,762,234 | ||||
Private Securities |
|
|
|
|
|
|
| 765,522 |
| 1,022,800 |
| 3,701,447 |
| 10,071,271 |
| 34,877,674 |
| 50,438,714 | ||
Shares |
|
|
|
|
|
|
| 3 |
| - |
| 46,414 |
| - |
| - |
| 46,417 | ||
Investment Fund Shares in Participation - FIP(6) |
|
|
| - |
| - |
| - |
| 4,009 |
| 29,359 |
| 33,368 | ||||||
Investment Fund Shares |
|
|
|
|
| 765,519 |
| - |
| - |
| - |
| - |
| 765,519 | ||||
Investment Fund Real Estate |
|
|
|
|
| - |
| 424,255 |
| - |
| - |
| - |
| 424,255 | ||||
Debentures (3) (9) |
|
|
|
|
|
|
| - |
| 215,866 |
| 950,706 |
| 6,805,783 |
| 33,146,504 |
| 41,118,859 | ||
Promissory Notes - NP(4) |
|
|
|
|
| - |
| 347,814 |
| 2,304,573 |
| 2,438,840 |
| 1,028,755 |
| 6,119,982 | ||||
Financial Bills - LF |
|
|
|
|
|
|
| - |
| - |
| 94,294 |
| 177,673 |
| - |
| 271,967 | ||
Certificates of Real Estate Receivables - CRI |
|
|
|
|
| - |
| 1,272 |
| - |
| 50,270 |
| 195,634 |
| 247,176 | ||||
Rural Product Note - CPR |
|
|
|
|
| - |
| 33,593 |
| 305,460 |
| 594,696 |
| 477,422 |
| 1,411,171 | ||||
Total |
|
|
|
|
|
|
| 765,522 |
| 1,848,692 |
| 17,856,820 |
| 32,447,282 |
| 78,800,720 |
| 131,719,036 | ||
|
|
|
|
|
|
|
|
|
|
|
|
|
|
|
|
|
|
|
| Consolidated |
|
|
|
|
|
|
|
|
|
|
|
|
|
|
|
| 12/31/2017 | ||||
Available-for-Sale Securities |
|
|
|
|
| Without |
| Up to |
| From 3 to |
| From 1 to |
| Over |
|
| ||||
by Maturity |
|
|
|
|
|
|
| Maturity |
| 3 Months |
| 12 Months |
| 3 Years |
| 3 Years |
| Total | ||
Government Securities |
|
|
|
|
| - |
| 914,188 |
| 14,684,102 |
| 23,022,743 |
| 45,932,583 |
| 84,553,616 | ||||
Treasury Certificates - CFT |
|
|
|
|
| - |
| - |
| - |
| - |
| 884 |
| 884 | ||||
Securitized Credit |
|
|
|
|
|
|
| - |
| 198 |
| 529 |
| 994 |
| 284 |
| 2,005 | ||
Financial Treasury Bills - LFT(10) |
|
|
|
|
| - |
| - |
| 257,547 |
| 212,717 |
| 8,955,955 |
| 9,426,219 | ||||
National Treasury Bills - LTN(7) |
|
|
|
| - |
| 10,000 |
| 9,654,207 |
| 22,809,032 |
| 7,183,985 |
| 39,657,224 | |||||
National Treasury Notes - NTN A |
|
|
|
|
| - |
| - |
| 4,510 |
| - |
| 1,241,099 |
| 1,245,609 | ||||
National Treasury Notes - NTN B |
|
|
|
|
| - |
| 49,592 |
| 5,075 |
| - |
| 9,851,227 |
| 9,905,894 | ||||
National Treasury Notes - NTN C(2) |
|
|
|
|
| - |
| 6,255 |
| - |
| - |
| 641,445 |
| 647,700 | ||||
National Treasury Notes - NTN F(2) (5) (8) |
|
|
|
|
| - |
| 848,143 |
| - |
| - |
| 18,057,704 |
| 18,905,847 | ||||
Spanish Foreign Debt Bonds |
|
|
|
|
| - |
| - |
| 4,762,234 |
| - |
| - |
| 4,762,234 | ||||
Private Securities |
|
|
|
|
|
|
| 137,229 |
| 686,167 |
| 3,701,449 |
| 7,437,580 |
| 6,142,763 |
| 18,105,188 | ||
Shares |
|
|
|
|
|
|
| 5,350 |
| - |
| 46,414 |
| - |
| - |
| 51,764 | ||
Investment Fund Shares in Participation - FIP(6) |
|
|
|
|
| - |
| - |
| 2 |
| 4,009 |
| 29,359 |
| 33,370 | ||||
Investment Fund Shares |
|
|
|
|
| 66,399 |
| - |
| - |
| - |
| - |
| 66,399 | ||||
Investment Fund Real Estate |
|
|
|
|
|
|
|
|
| 65,480 |
| - |
| - |
| - |
| - |
| 65,480 |
Debentures(3) |
|
|
|
|
| - |
| 215,866 |
| 950,706 |
| 4,161,666 |
| 4,411,593 |
| 9,739,831 | ||||
Promissory Notes - NP(4) |
|
|
|
|
| - |
| 347,814 |
| 2,304,573 |
| 2,438,840 |
| 1,028,755 |
| 6,119,982 | ||||
Foreign Exchange Bills - LC |
|
|
|
|
| - |
| - |
| - |
| 10,426 |
| - |
| 10,426 | ||||
Financial Bills - LF |
|
|
|
|
|
|
| - |
| 86,960 |
| 94,294 |
| 177,673 |
| - |
| 358,927 | ||
Certificates of Real Estate Receivables - CRI |
|
|
|
|
| - |
| 1,272 |
| - |
| 50,270 |
| 195,634 |
| 247,176 | ||||
Certificates of Time Deposits - CDB |
|
|
|
|
| - |
| 662 |
| - |
| - |
| - |
| 662 | ||||
Rural Product Note - CPR |
|
|
|
|
| - |
| 33,593 |
| 305,460 |
| 594,696 |
| 477,422 |
| 1,411,171 | ||||
Total |
|
|
|
|
|
|
| 137,229 |
| 1,600,355 |
| 18,385,551 |
| 30,460,323 |
| 52,075,346 |
| 102,658,804 | ||
(1) Receivables Investment Fund (FIDC) shares are calculated based on the value of the receivables and other financial assets in the respective portfolios, less respective provisions that take into consideration aspects related to the debtors, their guarantors and the corresponding transaction’s characteristics, according to accounting standards and practices of credit evaluation. | ||||||||||||||||||||
(2) During the year ended December 31, 2016, the amount of R$25,027, net of tax effects, in the Consolidated result, for the sale of NTN-C and part of NTN-F to the market (Note 24.e). | ||||||||||||||||||||
(3) Bank and Consolidated, includes securities issued by mixed-capital companies in the amount of R$1,838 (12/31/2016 - R$583) in securities for trading and R$1,442,684(12/31/2016 - R$1,206,434) in available-for-sale securities. | ||||||||||||||||||||
(4) Includes R$125,974 (12/31/2016 - R$146,392) of hedge objects related to market risks (Note 6.b.V.a) and R$1,194,266 (12/31/2016 - R$1,939,949) of hedge objects related to cash flow hedge (Nota 6.b.v.b). | ||||||||||||||||||||
(5) On December 31, 2017, the quantity of 1,040,000 in the amount of R$1,090,788 (12/31/2016 - 1,040,000 in the amount of R$1,022,488) Notes National Treasury - NTN-F, with maturity on January 1, 2025 (12/31/2016 - maturity on January 1, 2025) are bound by the obligation assumed by Banco Santander to hedge the unamortized reserves Plan V of the Social Security Fund (Banesprev). | ||||||||||||||||||||
(6) These assets are measured through the fair value of the Invested Funds that must reflect the market conditions at the time of their measurement, understood as the date of the initial recognition, the presentation of the financial statements or that in which information on the Fund's assets is disclosed to the market, the measurement of the fair value of the investments must be established on a consistent and verifiable basis. In cases where the Trustee of the Invested Fund concludes that the fair value of an entity is not reliably measurable, the cost value may be utilized until it is practicable to measure fair value on a reliable basis, and the trustee shall disclose, in explanatory note, the reasons that led it to conclude that the fair value is not reliably measurable, together with a summary of the condensed financial statements of the investments of these Funds (CVM Instruction 579/2016). | ||||||||||||||||||||
(7) On December 31, 2017, it includes the amount of R$13,893,932 hedge objects related to market risk (Note 6.b.V.a) | ||||||||||||||||||||
(8) On December 31, 2017, it includes the amount of R$10,885,899 hedge objects related to market risk (Note 6.b.V.a) | ||||||||||||||||||||
(9) On June 30, 2017, management decided to change the classification between categories of Debentures. These transactions are recorded in the assets of Banco Santander, which are issued by its owner subsidiary Santander Leasing S.A. Arrendamento Mercantil (Santander Leasing) and transferred from the Trading to Available for Sale category, in the amount of R$4,014,640. This transfer did not impact the Consolidated and also did not generate an effect on the result. The change in the category occurred due to the recent trading history of this asset. | ||||||||||||||||||||
(10) On December 31, 2017, includes the amount of R$5,071,220 of securities subject to cash flow hedge (Note 6.b.V.b). | ||||||||||||||||||||
IV) Held-to-Maturity Securities | ||||||||||||||||||||
|
|
|
|
|
|
|
|
|
|
|
|
|
|
|
|
|
|
|
| Bank/Consolidated |
12/31/2017 | ||||||||||||||||||||
|
|
|
|
|
|
|
|
|
|
|
|
|
|
|
|
|
|
|
| By Maturity |
|
|
|
|
|
|
|
|
| ||||||||||||
AmortizedCost | Up to | From 3 to | From 1 to | Over | ||||||||||||||||
Held-to-Maturity Securities(1) | 12/31/2017 | 12/31/2016 | 3 Months |
| 12 Months |
| 3 Years |
| 3 Years | Total | ||||||||||
Government Securities |
|
|
| 9,578,992 |
| 9,388,442 |
| 101,465 |
| 38,519 |
| 450,877 |
| 8,988,131 |
| 9,578,992 | ||||
National Treasury Notes - NTN A |
|
|
| 2,849,352 |
| 2,921,564 |
| - |
| 11,406 |
| - |
| 2,837,946 |
| 2,849,352 | ||||
Brazilian Foreign Debt Bonds(2) |
|
|
| 6,729,640 |
| 6,466,878 |
| 101,465 |
| 27,113 |
| 450,877 |
| 6,150,185 |
| 6,729,640 | ||||
Total |
|
|
|
|
| 9,578,992 |
| 9,388,442 |
| 101,465 |
| 38,519 |
| 450,877 |
| 8,988,131 |
| 9,578,992 | ||
(1) The fair value of held to maturity securities is R$10,587,117 (12/31/2016 - R$10,555,437). | ||||||||||||||||||||
(2) It includes the amount of R$809,660 (12/31/2016 - R$701,300) of cash flow object hedge (Note 6.b.V.b). | ||||||||||||||||||||
For the period ended December 31, 2017, there were no changes in the federal public securities and other securities classified as held to maturity. | ||||||||||||||||||||
Given the provisions of Article 5 of Circular Bacen 3,068/2001, Banco Santander has the financial capacity and intention to hold to maturity securities classified as held-to-maturity. | ||||||||||||||||||||
The market value of securities is estimated based on the average quotation on organized markets and their estimated cash flows, discounted to present value using the applicable interest rate curves, considered as representative of market conditions at the end of balance. | ||||||||||||||||||||
V) Financial Income - Securities Transactions | ||||||||||||||||||||
|
|
|
|
|
|
|
|
|
|
|
|
|
|
|
|
| ||||
|
|
|
|
|
|
|
|
|
|
|
|
|
|
|
| Bank |
|
|
| Consolidated |
01/01 to | 01/01 to | 01/01 to | 01/01 to | |||||||||||||||||
|
|
|
|
|
|
|
|
|
|
|
|
|
| 12/31/2017 |
| 12/31/2016 |
| 12/31/2017 |
| 12/31/2016 |
Income From Fixed-Income Securities(1) |
|
|
|
|
|
| 19,405,124 |
| 25,757,275 |
| 15,088,131 |
| 15,021,542 | |||||||
Income From Interbank Investments |
|
|
|
|
|
| 9,058,668 |
| 11,277,121 |
| 4,650,152 |
| 6,838,364 | |||||||
Income From Variable-Income Securities (2) |
|
|
|
|
|
| (233,631) |
| 88,674 |
| (12,459) |
| 222,744 | |||||||
Financial Income of Pension and Capitalization |
|
|
|
|
|
| - |
| - |
| 138,626 |
| 150,233 | |||||||
Provision for Impairment Losses(3) |
|
|
|
|
|
| (848,958) |
| (390,036) |
| (881,262) |
| (443,045) | |||||||
Others(4) |
|
|
|
|
|
| 102,474 |
| 98,238 |
| 115,475 |
| 1,676,564 | |||||||
Total |
|
|
|
|
|
| 27,483,677 |
| 36,831,272 |
| 19,098,663 |
| 23,466,402 | |||||||
(1) Includes expenses with exchange variation in the amount of R$109,086 (2016 - income in the amount of R$497,838) in the Bank and R$65,795 (2016 - income in the amount of R$603,735) in the Consolidated. | ||||||||||||||||||||
(2) Includes income with exchange variation in the amount of R$653 (2016 - expense in the amount of R$10,481) in the Bank and Consolidated. | ||||||||||||||||||||
(3) Corresponds to the permanent loss record, referring to securities classified as available for sale. | ||||||||||||||||||||
(4) Corresponds, mainly, to income from investment funds and participations. | ||||||||||||||||||||
b) Derivatives Financial Instruments | ||||||||||||||
The main risk factors associated to derivatives contracted are related to exchange rates, interest rates and stocks. To manage these and other market risk factors the Bank uses practices which include the measurement and follow up of the limit´s usage previously defined on internal committees, as well as the daily follow up of the portfolios values in risk, sensitivities and changes in the interest rate and exchange exposure, liquidity gaps, among other practices which allow the control and follow up on the main risk metrics that can affect the Bank´s position in the several markets which it acts. Based on this management model the Bank has accomplished its goal, using operations with derivatives, in optimize the relation risk/benefits even in situation with great volatility. | ||||||||||||||
The derivatives fair value is determined through quotation of market prices. The swaps contracts fair value is determined using discounted cash flow modeling techniques, reflecting suitable risk factors. The fair value of NDF and Future contracts are also determined based on the quotation of market prices for derivatives traded in specific chamber (ie. stock Exchange for example) or using the same methodology applied for swap contracts. The fair value of options derivatives (call and put) is determined based on the mathematical models, such as Black & Scholes, using yield rates, implied volatilities and the fair value of the corresponding asset. The current market prices are used to price the volatilities. For the derivatives which do not have prices directly disclosed by specific chamber, their fair values are obtained through pricing models which use market information, based on disclosed prices of more liquid assets. Interest rate curves and market volatilities are extracted from theses prices to be used as first input in these models. | ||||||||||||||
I) Derivatives Recorded in Memorandum Accounts and Balance Sheets | ||||||||||||||
|
|
|
|
|
|
|
|
|
| Bank | ||||
12/31/2017 | 12/31/2016 | |||||||||||||
|
|
|
|
|
|
|
| Trading |
|
|
|
|
| Trading |
|
|
|
| Notional |
| Cost |
| Fair Value |
| Notional |
| Cost |
| Fair Value |
Swap |
|
|
|
|
| 1,615,516 |
| 1,051,709 |
|
|
| 5,417,902 |
| 3,138,044 |
Assets |
|
|
| 148,017,969 |
| 57,881,622 |
| 57,391,573 |
| 118,076,726 |
| 23,171,475 |
| 24,315,423 |
CDI (Interbank Deposit Rates) |
| 42,608,262 |
| 22,374,055 |
| 22,364,283 |
| 44,868,680 |
| 21,689,958 |
| 22,763,760 | ||
Fixed Interest Rate - Real |
| 31,745,948 |
| - |
| - |
| 47,732,950 |
| - |
| - | ||
Indexed to Price and Interest Rates |
| 5,709,977 |
| - |
| - |
| 9,225,789 |
| - |
| - | ||
Foreign Currency |
|
|
| 67,895,932 |
| 35,507,567 |
| 35,027,290 |
| 16,249,307 |
| 1,481,517 |
| 1,551,663 |
Others |
|
|
| 57,850 |
| - |
| - |
| - |
| - |
| - |
Liabilities |
|
|
| 146,402,453 |
| (56,266,106) |
| (56,339,864) |
| 112,658,824 |
| (17,753,573) |
| (21,177,379) |
CDI (Interbank Deposit Rates) |
| 20,234,207 |
| - |
| - |
| 23,178,722 |
| - |
| - | ||
Fixed Interest Rate - Real |
| 53,035,866 |
| (21,289,918) |
| (21,419,177) |
| 61,775,580 |
| (14,042,630) |
| (17,461,002) | ||
Indexed to Price and Interest Rates |
| 40,263,568 |
| (34,553,591) |
| (34,525,308) |
| 12,767,212 |
| (3,541,423) |
| (3,518,297) | ||
Foreign Currency |
|
|
| 32,388,365 |
| - |
| - |
| 14,767,790 |
| - |
| - |
Others |
|
|
| 480,447 |
| (422,597) |
| (395,379) |
| 169,520 |
| (169,520) |
| (198,080) |
Options |
|
|
| 187,690,913 |
| 208,446 |
| 146,693 |
| 169,608,057 |
| 449,906 |
| 154,967 |
Purchased Position |
| 86,278,377 |
| 520,456 |
| 489,458 |
| 80,830,149 |
| 1,076,380 |
| 883,474 | ||
Call Option - Foreign Currency |
| 9,403,298 |
| 214,347 |
| 172,591 |
| 12,693,748 |
| 215,095 |
| 181,463 | ||
Put Option - Foreign Currency |
| 5,097,595 |
| 65,569 |
| 42,486 |
| 3,788,161 |
| 352,584 |
| 392,048 | ||
Call Option - Other |
| 1,230,140 |
| 15,083 |
| 5,203 |
| 17,492,141 |
| 16,939 |
| 15,914 | ||
Interbank Market |
|
|
| 1,185,310 |
| 7,021 |
| 389 |
| 17,391,500 |
| 7,152 |
| 7,062 |
Others(1) |
|
|
| 44,830 |
| 8,062 |
| 4,814 |
| 100,641 |
| 9,787 |
| 8,852 |
Put Option - Other |
| 70,547,344 |
| 225,457 |
| 269,178 |
| 46,856,099 |
| 491,762 |
| 294,049 | ||
Interbank Market |
|
|
| 70,295,282 |
| 216,914 |
| 257,944 |
| 46,106,600 |
| 13,968 |
| 18,029 |
Others(1) |
|
|
| 252,062 |
| 8,543 |
| 11,234 |
| 749,499 |
| 477,794 |
| 276,020 |
Sold Position |
|
|
| 101,412,536 |
| (312,010) |
| (342,765) |
| 88,777,908 |
| (626,474) |
| (728,507) |
Call Option - Foreign Currency |
| 5,638,163 |
| (113,031) |
| (117,159) |
| 4,314,988 |
| (121,751) |
| (141,172) | ||
Put Option - Foreign Currency |
| 5,952,678 |
| (98,395) |
| (80,195) |
| 7,390,733 |
| (470,629) |
| (553,458) | ||
Call Option - Other |
| 19,260,781 |
| (33,135) |
| (15,115) |
| 27,784,459 |
| (15,425) |
| (13,957) | ||
Interbank Market |
|
|
| 19,151,110 |
| (17,837) |
| (515) |
| 27,597,764 |
| (5,891) |
| (4,087) |
Others(1) |
|
|
| 109,671 |
| (15,298) |
| (14,600) |
| 186,695 |
| (9,534) |
| (9,870) |
Put Option - Other |
| 70,560,914 |
| (67,449) |
| (130,296) |
| 49,287,728 |
| (18,669) |
| (19,920) | ||
Interbank Market |
|
|
| 70,494,622 |
| (54,376) |
| (126,743) |
| 49,245,495 |
| (9,225) |
| (5,793) |
Others(1) |
|
|
| 66,292 |
| (13,073) |
| (3,553) |
| 42,233 |
| (9,444) |
| (14,127) |
|
|
|
|
|
|
|
|
|
| Bank | ||||
12/31/2017 | 12/31/2016 | |||||||||||||
|
|
|
|
|
|
|
| Trading |
|
|
|
|
| Trading |
|
|
|
| Notional |
| Cost |
| Fair Value |
| Notional |
| Cost |
| Fair Value |
Futures Contracts |
| 161,679,490 |
| - |
| - |
| 104,348,970 |
| - |
| - | ||
Purchased Position |
| 54,759,916 |
| - |
| �� - |
| 40,286,253 |
| - |
| - | ||
Exchange Coupon (DDI) |
| 9,616,936 |
| - |
| - |
| 14,473,180 |
| - |
| - | ||
Interest Rates (DI1 and DIA) |
| 26,456,303 |
| - |
| - |
| 23,694,707 |
| - |
| - | ||
Foreign Currency |
|
|
| 16,733,437 |
| - |
| - |
| 1,393,538 |
| - |
| - |
Indexes(2) |
|
|
| 1,734,205 |
| - |
| - |
| 146,773 |
| - |
| - |
Treasury Bonds/Notes |
| 219,035 |
| - |
| - |
| 578,055 |
| - |
| - | ||
Sold Position |
|
|
| 106,919,574 |
| - |
| - |
| 64,062,717 |
| - |
| - |
Exchange Coupon (DDI) |
| 55,016,928 |
| - |
| - |
| 15,048,490 |
| - |
| - | ||
Interest Rates (DI1 and DIA) |
| 51,135,994 |
| - |
| - |
| 28,942,103 |
| - |
| - | ||
Foreign Currency |
|
|
| 745,849 |
| - |
| - |
| 17,384,256 |
| - |
| - |
Indexes(2) |
|
|
| 20,803 |
| - |
| - |
| 99,074 |
| - |
| - |
Treasury Bonds/Notes |
| - |
| - |
| - |
| 2,588,794 |
| - |
| - | ||
Forward Contracts and Others |
| 47,797,322 |
| (920,582) |
| (261,636) |
| 50,775,576 |
| 66,994 |
| 907,377 | ||
Purchased Commitment |
| 23,479,857 |
| (3,607,256) |
| 619,809 |
| 20,864,170 |
| 724,000 |
| 2,734,342 | ||
Currencies |
|
|
| 21,525,220 |
| (3,606,223) |
| 618,007 |
| 19,951,984 |
| 724,000 |
| 2,738,737 |
Others |
|
|
| 1,954,637 |
| (1,033) |
| 1,802 |
| 912,186 |
| - |
| (4,395) |
Sell Commitment |
|
| 24,317,465 |
| 2,686,674 |
| (881,445) |
| 29,911,406 |
| (657,006) |
| (1,826,965) | |
Currencies |
|
|
| 22,096,104 |
| 2,688,198 |
| (877,864) |
| 29,911,406 |
| (657,006) |
| (1,826,965) |
Others |
|
|
| 2,221,361 |
| (1,524) |
| (3,581) |
| - |
| - |
| - |
|
|
|
|
|
|
|
|
|
|
|
|
|
| Consolidated |
12/31/2017 | 12/31/2016 | |||||||||||||
|
|
|
|
|
|
|
| Trading |
|
|
|
|
| Trading |
|
|
|
| Notional |
| Cost |
| Fair Value |
| Notional |
| Cost |
| Fair Value |
Swap |
|
|
|
|
| 2,453,547 |
| 1,072,976 |
|
|
| 12,544,823 |
| 3,110,732 |
Assets |
|
|
| 202,464,902 |
| 56,082,202 |
| 57,679,171 |
| 199,767,970 |
| 25,813,018 |
| 26,962,872 |
CDI (Interbank Deposit Rates) |
| 33,673,210 |
| 17,009,034 |
| 22,794,489 |
| 47,649,278 |
| 24,370,336 |
| 25,450,045 | ||
Fixed Interest Rate - Real |
| 95,700,715 |
| - |
| - |
| 126,400,445 |
| - |
| - | ||
Indexed to Price and Interest Rates |
| 5,592,892 |
| - |
| - |
| 9,225,789 |
| - |
| - | ||
Foreign Currency |
|
|
| 67,493,635 |
| 39,073,168 |
| 34,884,682 |
| 16,492,458 |
| 1,442,682 |
| 1,512,827 |
Others |
|
|
| 4,450 |
| - |
| - |
| - |
| - |
| - |
Liabilities |
|
|
| 200,011,355 |
| (53,628,655) |
| (56,606,195) |
| 187,223,147 |
| (13,268,195) |
| (23,852,140) |
CDI (Interbank Deposit Rates) |
| 16,664,176 |
| - |
| - |
| 23,278,942 |
| - |
| - | ||
Fixed Interest Rate - Real |
| 114,357,076 |
| (18,656,361) |
| (21,687,884) |
| 135,957,697 |
| (9,557,252) |
| (20,135,763) | ||
Indexed to Price and Interest Rates |
| 40,146,968 |
| (34,554,076) |
| (34,527,986) |
| 12,767,212 |
| (3,541,423) |
| (3,518,297) | ||
Foreign Currency |
|
|
| 28,420,467 |
| - |
| - |
| 15,049,776 |
| - |
| - |
Others |
|
|
| 422,668 |
| (418,218) |
| (390,325) |
| 169,520 |
| (169,520) |
| (198,080) |
Options |
|
|
| 190,061,609 |
| 210,736 |
| 168,035 |
| 175,841,405 |
| 448,739 |
| 168,467 |
Purchased Position |
| 87,503,833 |
| 511,819 |
| 553,218 |
| 83,883,966 |
| 1,149,704 |
| 935,520 | ||
Call Option - Foreign Currency |
| 9,369,821 |
| 211,870 |
| 169,542 |
| 12,693,748 |
| 215,095 |
| 181,463 | ||
Put Option - Foreign Currency |
| 5,130,392 |
| 65,287 |
| 42,389 |
| 3,788,161 |
| 352,584 |
| 392,048 | ||
Call Option - Other |
| 1,953,481 |
| 15,083 |
| 59,219 |
| 20,115,932 |
| 60,830 |
| 62,517 | ||
Interbank Market |
|
|
| 1,185,310 |
| 7,021 |
| 389 |
| 17,391,500 |
| 7,152 |
| 7,062 |
Others(1) |
|
|
| 768,171 |
| 8,062 |
| 58,830 |
| 2,724,432 |
| 53,678 |
| 55,455 |
Put Option - Other |
| 71,050,139 |
| 219,579 |
| 282,068 |
| 47,286,125 |
| 521,195 |
| 299,492 | ||
Interbank Market |
|
|
| 70,295,282 |
| 216,914 |
| 257,944 |
| 46,106,600 |
| 13,968 |
| 18,029 |
Others(1) |
|
|
| 754,857 |
| 2,665 |
| 24,124 |
| 1,179,525 |
| 507,227 |
| 281,463 |
Sold Position |
|
|
| 102,557,776 |
| (301,083) |
| (385,183) |
| 91,957,439 |
| (700,965) |
| (767,053) |
Call Option - Foreign Currency |
| 5,595,163 |
| (112,765) |
| (117,059) |
| 4,314,988 |
| (121,751) |
| (141,172) | ||
Put Option - Foreign Currency |
| 5,919,598 |
| (95,764) |
| (77,145) |
| 7,390,733 |
| (470,629) |
| (553,458) | ||
Call Option - Other |
| 19,880,180 |
| (25,105) |
| (48,327) |
| 30,441,646 |
| (75,754) |
| (46,940) | ||
Interbank Market |
|
|
| 19,151,110 |
| (17,837) |
| (515) |
| 27,597,764 |
| (5,891) |
| (4,087) |
Others(1) |
|
|
| 729,070 |
| (7,268) |
| (35,446) |
| 2,843,882 |
| (69,863) |
| (42,853) |
Put Option - Other |
| 71,162,835 |
| (67,449) |
| (155,018) |
| 49,810,072 |
| (32,831) |
| (25,483) | ||
Interbank Market |
|
|
| 70,494,622 |
| (54,376) |
| (126,743) |
| 49,245,495 |
| (9,225) |
| (5,793) |
Others(1) |
|
|
| 668,213 |
| (13,073) |
| (28,275) |
| 564,577 |
| (23,606) |
| (19,690) |
|
|
|
|
|
|
|
|
|
|
|
|
|
| Consolidated |
12/31/2017 | 12/31/2016 | |||||||||||||
|
|
|
|
|
|
|
| Trading |
|
|
|
|
| Trading |
|
|
|
| Notional |
| Cost |
| Fair Value |
| Notional |
| Cost |
| Fair Value |
Futures Contracts |
| 161,725,596 |
| - |
| - |
| 104,651,180 |
| - |
| - | ||
Purchased Position |
| 54,806,022 |
| - |
| - |
| 40,396,456 |
| - |
| - | ||
Exchange Coupon (DDI) |
| 9,616,936 |
| - |
| - |
| 14,473,180 |
| - |
| - | ||
Interest Rates (DI1 and DIA) |
| 26,456,303 |
| - |
| - |
| 23,756,523 |
| - |
| - | ||
Foreign Currency |
|
|
| 16,733,437 |
| - |
| - |
| 1,393,538 |
| - |
| - |
Indexes(2) |
|
|
| 1,780,311 |
| - |
| - |
| 195,160 |
| - |
| - |
Treasury Bonds/Notes |
| 219,035 |
| - |
| - |
| 578,055 |
| - |
| - | ||
Sold Position |
|
|
| 106,919,574 |
| - |
| - |
| 64,254,724 |
| - |
| - |
Exchange Coupon (DDI) |
| 55,016,928 |
| - |
| - |
| 15,048,490 |
| - |
| - | ||
Interest Rates (DI1 and DIA) |
| 51,135,994 |
| - |
| - |
| 29,047,678 |
| - |
| - | ||
Foreign Currency |
|
|
| 745,849 |
| - |
| - |
| 17,384,256 |
| - |
| - |
Indexes(2) |
|
|
| 20,803 |
| - |
| - |
| 185,506 |
| - |
| - |
Treasury Bonds/Notes |
| - |
| - |
| - |
| 2,588,794 |
| - |
| - | ||
Forward Contracts and Others |
| 47,823,561 |
| (920,582) |
| (234,069) |
| 50,853,154 |
| 144,572 |
| 990,702 | ||
Purchased Commitment |
| 23,506,096 |
| (3,607,256) |
| 647,376 |
| 20,864,170 |
| 724,000 |
| 2,734,342 | ||
Currencies |
|
|
| 21,525,220 |
| (3,606,223) |
| 618,007 |
| 19,951,984 |
| 724,000 |
| 2,738,737 |
Others |
|
|
| 1,980,876 |
| (1,033) |
| 29,369 |
| 912,186 |
| - |
| (4,395) |
Sell Commitment |
|
| 24,317,465 |
| 2,686,674 |
| (881,445) |
| 29,988,984 |
| (579,428) |
| (1,743,640) | |
Currencies |
|
|
| 22,096,104 |
| 2,688,198 |
| (877,864) |
| 29,911,406 |
| (657,006) |
| (1,826,965) |
Others |
|
|
| 2,221,361 |
| (1,524) |
| (3,581) |
| 77,578 |
| 77,578 |
| 83,325 |
(1) Includes index options, mainly, options involving DI and CDI and shares. | ||||||||||||||
(2) Includes Bovespa and S&P indexes. | ||||||||||||||
II) Derivatives Financial Instruments by Counterparty | ||||||||||||||
|
|
|
|
|
|
|
|
|
|
|
|
|
| Bank |
Notional | ||||||||||||||
|
|
|
|
|
|
|
|
|
|
|
| 12/31/2017 |
| 12/31/2016 |
Related | Financial | |||||||||||||
|
|
|
|
|
| Customers |
| Parties |
| Institutions(1) |
| Total |
| Total |
Swap |
|
|
|
|
| 32,912,721 |
| 30,616,901 |
| 84,488,347 |
| 148,017,969 |
| 118,076,726 |
Options |
|
|
|
|
| 11,263,513 |
| 1,397,815 |
| 175,029,586 |
| 187,690,914 |
| 169,608,057 |
Futures Contracts |
|
|
|
|
| - |
| - |
| 161,679,490 |
| 161,679,490 |
| 104,348,970 |
Forward Contracts and Others |
|
|
| 25,470,287 |
| 18,816,991 |
| 3,510,044 |
| 47,797,322 |
| 50,775,576 | ||
|
|
|
|
|
|
|
|
|
|
|
|
|
| Consolidated |
Notional | ||||||||||||||
|
|
|
|
|
|
|
|
|
|
|
| 12/31/2017 |
| 12/31/2016 |
Related | Financial | |||||||||||||
|
|
|
|
|
| Customers |
| Parties |
| Institutions(1) |
| Total |
| Total |
Swap |
|
|
|
|
| 32,912,721 |
| 19,599,395 |
| 149,952,786 |
| 202,464,902 |
| 199,767,970 |
Options |
|
|
|
|
| 11,263,513 |
| 1,240,309 |
| 177,557,787 |
| 190,061,609 |
| 175,841,405 |
Futures Contracts |
|
|
|
|
| - |
| - |
| 161,725,596 |
| 161,725,596 |
| 104,651,180 |
Forward Contracts and Others |
|
|
| 25,470,287 |
| 18,816,991 |
| 3,536,283 |
| 47,823,561 |
| 50,853,154 | ||
(1) Includes trades with the B3 S.A. - Brasil, Bolsa, Balcão (B3) (Current Corporate Name of BM&FBovespa - Bolsa de Valores, Mercadorias e Futuros (BM&FBovespa)) and other securities and commodities exchanges. | ||||||||||||||
III) Derivatives Financial Instruments by Maturity | ||||||||||||||
|
|
|
|
|
|
|
|
|
|
|
|
|
| Bank |
Notional | ||||||||||||||
|
|
|
|
|
|
|
|
|
|
|
| 12/31/2017 |
| 12/31/2016 |
Up to | From 3 to | Over | ||||||||||||
|
|
|
|
|
| 3 Months |
| 12 Months |
| 12 Months |
| Total |
| Total |
Swap |
|
|
|
|
| 21,053,193 |
| 52,827,751 |
| 74,137,026 |
| 148,017,970 |
| 118,076,726 |
Options |
|
|
|
|
| 45,557,734 |
| 87,694,031 |
| 54,439,149 |
| 187,690,914 |
| 169,608,057 |
Futures Contracts |
|
|
|
|
| 65,443,370 |
| 55,490,159 |
| 40,745,961 |
| 161,679,490 |
| 104,348,970 |
Forward Contracts and Others |
|
|
| 25,009,426 |
| 14,230,387 |
| 8,557,508 |
| 47,797,321 |
| 50,775,576 | ||
|
|
|
|
|
|
|
|
|
|
|
|
|
| Consolidated |
Notional | ||||||||||||||
|
|
|
|
|
|
|
|
|
|
|
| 12/31/2017 |
| 12/31/2016 |
Up to | From 3 to | Over | ||||||||||||
|
|
|
|
|
| 3 Months |
| 12 Months |
| 12 Months |
| Total |
| Total |
Swap |
|
|
|
|
| 20,770,438 |
| 51,272,820 |
| 130,421,645 |
| 202,464,903 |
| 199,767,970 |
Options |
|
|
|
|
| 46,139,545 |
| 89,403,700 |
| 54,518,365 |
| 190,061,610 |
| 175,841,405 |
Futures Contracts |
|
|
|
|
| 65,489,476 |
| 55,490,159 |
| 40,745,961 |
| 161,725,596 |
| 104,651,180 |
Forward Contracts and Others |
|
|
| 25,015,557 |
| 14,250,495 |
| 8,557,508 |
| 47,823,560 |
| 0,853,154 | ||
IV) Derivatives Financial Instruments by Trade Market | ||||||||||||||
|
|
|
|
|
|
|
|
|
|
|
|
|
|
|
Bank | ||||||||||||||
Notional | ||||||||||||||
|
|
|
|
|
|
|
|
|
|
|
| 12/31/2017 |
| 12/31/2016 |
|
|
|
|
|
|
|
| Exchange(1) |
| Over the Counter (2) |
| Total |
| Total |
Swap |
|
|
|
|
|
|
| 67,112,505 |
| 80,905,464 |
| 148,017,969 |
| 118,076,726 |
Options |
|
|
|
|
|
|
| 172,144,700 |
| 15,546,214 |
| 187,690,914 |
| 169,608,057 |
Futures Contracts |
|
|
|
|
|
|
| 161,679,490 |
| - |
| 161,679,490 |
| 104,348,970 |
Forward Contracts and Others |
|
|
|
|
| 395,212 |
| 47,402,109 |
| 47,797,321 |
| 50,775,576 | ||
|
|
|
|
|
|
|
|
|
|
|
|
|
| Consolidated |
Notional | ||||||||||||||
|
|
|
|
|
|
|
|
|
|
|
| 12/31/2017 |
| 12/31/2016 |
|
|
|
|
|
|
|
| Exchange(1) |
| Over the Counter (2) |
| Total |
| Total |
Swap |
|
|
|
|
|
|
| 67,112,505 |
| 135,352,397 |
| 202,464,902 |
| 199,767,970 |
Options |
|
|
|
|
|
|
| 172,144,700 |
| 17,916,910 |
| 190,061,610 |
| 175,841,405 |
Futures Contracts |
|
|
|
|
|
|
| 161,725,596 |
| - |
| 161,725,596 |
| 104,651,180 |
Forward Contracts and Others |
|
|
|
|
| 395,212 |
| 47,428,349 |
| 47,823,561 |
| 50,853,154 | ||
(1) Includes amount traded with the B3 (Current Corporate Name of BM&Fbovespa) which includes Cetip's operations values from its incorporation by B3. | ||||||||||||||
(2) Composed by operations that are included in Clearing Houses, according to the regulation of the Bacen. | ||||||||||||||
V) Derivatives Used as Hedge Instruments | ||||||||||||||
Derivatives used as hedge instruments by index are as follows: | ||||||||||||||
a) Market Risk Hedge | ||||||||||||||
|
|
|
|
|
|
|
|
|
|
|
|
|
| Bank |
|
|
|
|
|
|
|
| 12/31/2017 |
|
|
|
|
| 12/31/2016 |
Adjustment | Adjustment | |||||||||||||
|
|
|
| Cost |
| to Fair Value |
| Fair Value |
| Cost |
| to Fair Value |
| Fair Value |
Hedge Instruments | ||||||||||||||
Swap Contracts |
| (34,008) |
| (101,922) |
| (135,930) |
| (66,261) |
| (31,085) |
| (97,346) | ||
Assets |
|
|
| 928,656 |
| (23,408) |
| 905,248 |
| 769,792 |
| (7,854) |
| 761,938 |
Indexed by Foreign Currency - Fixed |
| 8,422 |
| 320 |
| 8,742 |
| 16,575 |
| 1,103 |
| 17,678 | ||
Indexed by Foreign Currency - USD/BRL |
| 715,457 |
| (23,585) |
| 691,872 |
| 753,217 |
| (8,957) |
| 744,260 | ||
CDI (Interbank Deposit Rates)(5) |
| 204,777 |
| (143) |
| 204,634 |
| - |
| - |
| - | ||
Liabilities |
|
|
| (962,664) |
| (78,514) |
| (1,041,178) |
| (836,053) |
| (23,231) |
| (859,284) |
Indexed by Foreign Currency - Fixed |
| (209,554) |
| (16,303) |
| (225,857) |
| (16,575) |
| (1,103) |
| (17,678) | ||
CDI (Interbank Deposit Rates) (1) (2) |
| (453,018) |
| (21,380) |
| (474,398) |
| (785,664) |
| (18,395) |
| (804,059) | ||
Fixed Interest Rate - Real(3) |
|
|
| (23,006) |
| (3,838) |
| (26,844) |
| (33,814) |
| (3,733) |
| (37,547) |
Indexed by Foreign Currency - | (277,086) |
| (36,993) |
| (314,079) |
| - |
| - |
| - | |||
Hedge Object |
|
|
|
|
|
|
|
|
|
|
|
|
|
|
Assets |
|
|
| 967,370 |
| 78,520 |
| 1,045,890 |
| 350,995 |
| 18,354 |
| 369,349 |
Lending Operation (Note 8.a and e) |
|
|
| 841,841 |
| 78,075 |
| 919,916 |
| 212,480 |
| 10,477 |
| 222,957 |
CDI (Interbank Deposit Rates)(2) |
| 335,670 |
| 16,401 |
| 352,071 |
| 212,480 |
| 10,477 |
| 222,957 | ||
Indexed by Foreign Currency - Fixed |
| 208,527 |
| 16,416 |
| 224,943 |
| - |
| - |
| - | ||
Indexed by Foreign Currency - Euro(4) |
| 280,467 |
| 41,358 |
| 321,825 |
| - |
| - |
| - | ||
Interest Rate - Real (3) |
| 17,177 |
| 3,900 |
| 21,077 |
| - |
| - |
| - | ||
Available-for-Sale Securities (Note 6.a.III) |
|
|
| 125,529 |
| 445 |
| 125,974 |
| 138,515 |
| 7,877 |
| 146,392 |
Promissory Notes - PN |
|
| ||||||||||||
CDI (Interbank Deposit Rates)(1) (2) |
| 119,538 |
| 354 |
| 119,892 |
| 106,070 |
| 2,775 |
| 108,845 | ||
Interest Rate - Real(3) |
| 5,991 |
| 91 |
| 6,082 |
| 32,445 |
| 5,102 |
| 37,547 | ||
Liabilities |
|
|
| - |
| - |
| - |
| (816,759) |
| 12,830 |
| (803,929) |
Funding and Borrowings and Onlendings | ||||||||||||||
Loans Issued Abroad (Note 18.e) |
| - |
| - |
| - |
| (816,759) |
| 12,830 |
| (803,929) | ||
Indexed by Foreign Currency - US Dollar(2) |
| - |
| - |
| - |
| (816,759) |
| 12,830 |
| (803,929) | ||
|
|
|
|
|
|
|
|
|
|
|
|
|
| Consolidated |
|
|
|
|
|
|
|
| 12/31/2017 |
|
|
|
|
| 12/31/2016 |
Adjustment | Adjustment | |||||||||||||
|
|
|
| Cost |
| to Fair Value |
| Fair Value |
| Cost |
| to Fair Value |
| Fair Value |
Hedge Instruments | ||||||||||||||
Swap Contracts |
| (35,011) |
| (95,672) |
| (130,683) |
| (109,766) |
| (26,703) |
| (136,469) | ||
Assets |
|
|
| 2,992,712 |
| 12,954 |
| 3,005,666 |
| 1,034,526 |
| 11,486 |
| 1,046,012 |
Indexed by Foreign Currency - Fixed |
| 8,422 |
| 320 |
| 8,742 |
| 16,575 |
| 1,103 |
| 17,678 | ||
Indexed by Foreign Currency - USD/BRL |
| 715,457 |
| (23,585) |
| 691,872 |
| 753,217 |
| (8,957) |
| 744,260 | ||
CDI (Interbank Deposit Rates)(5) (8) |
| 1,818,723 |
| (357) |
| 1,818,366 |
| - |
| - |
| - | ||
Indexed by Foreign Currency - Euro(6) (7) |
| 450,110 |
| 36,576 |
| 486,686 |
| 264,734 |
| 19,340 |
| 284,074 | ||
Liabilities |
|
|
| (3,027,723) |
| (108,626) |
| (3,136,349) |
| (1,144,292) |
| (38,189) |
| (1,182,481) |
Indexed by Foreign Currency - |
| (241,806) |
| (20,109) |
| (261,915) |
| (308,239) |
| (14,958) |
| (323,197) | ||
Indexed by Foreign Currency - Fixed |
| (209,554) |
| (16,303) |
| (225,857) |
| (16,575) |
| (1,103) |
| (17,678) | ||
CDI (Interbank Deposit Certificates) (1) (2) |
| (453,018) |
| (21,380) |
| (474,398) |
| (785,664) |
| (18,395) |
| (804,059) | ||
Fixed Interest Rate - Real(3) (8) |
|
|
| (1,640,730) |
| 22 |
| (1,640,708) |
| (33,814) |
| (3,733) |
| (37,547) |
Indexed by Foreign Currency - Colombian | (205,529) |
| (13,863) |
| (219,392) |
| - |
| - |
| - | |||
Indexed by Foreign Currency - Euro(4) | (277,086) |
| (36,993) |
| (314,079) |
| - |
| - |
| - | |||
Hedge Object |
|
|
|
|
|
|
|
|
|
|
|
|
|
|
Assets |
|
|
| 3,049,206 |
| 77,623 |
| 3,126,829 |
| 669,966 |
| 23,165 |
| 693,131 |
Lending Operation (Note 8.a and e) |
|
|
| 1,302,830 |
| 79,496 |
| 1,382,326 |
| 531,451 |
| 15,288 |
| 546,739 |
CDI (Interbank Deposit Rates) (2) |
| 335,670 |
| 16,401 |
| 352,071 |
| 212,480 |
| 10,477 |
| 222,957 | ||
Indexed by Foreign Currency - US Dollar(6) |
|
|
| 284,101 |
| 4,319 |
| 288,420 |
| 318,971 |
| 4,811 |
| 323,782 |
Indexed by Foreign Currency - Fixed |
| 208,527 |
| 16,416 |
| 224,943 |
| - |
| - |
| - | ||
Indexed by Foreign Currency - Colombian |
| 176,888 |
| (2,898) |
| 173,990 |
| - |
| - |
| - | ||
Indexed by Foreign Currency - Euro(4) |
| 280,467 |
| 41,358 |
| 321,825 |
| - |
| - |
| - | ||
Interest Rate - Real (3) |
| 17,177 |
| 3,900 |
| 21,077 |
| - |
| - |
| - | ||
Available-for-Sale Securities (Note 6.a.III) |
|
|
| 1,746,376 |
| (1,873) |
| 1,744,503 |
| 138,515 |
| 7,877 |
| 146,392 |
Promissory Notes - PN |
| 125,529 |
| 445 |
| 125,974 |
| 138,515 |
| 7,877 |
| 146,392 | ||
CDI (Interbank Deposit Rates)(1) (2) |
| 119,538 |
| 354 |
| 119,892 |
| 106,070 |
| 2,775 |
| 108,845 | ||
Interest Rate - Real(3) |
| 5,991 |
| 91 |
| 6,082 |
| 32,445 |
| 5,102 |
| 37,547 | ||
National Treasury Notes - NTN F (8) (2) |
| 1,620,847 |
| (2,318) |
| 1,618,529 |
| - |
| - |
| - | ||
Liabilities |
|
|
| - |
| - |
| - |
| (816,759) |
| 12,830 |
| (803,929) |
Money Market Funding and Borrowings and Onlendings |
|
|
|
|
|
|
|
|
|
|
|
|
|
|
Foreign Borrowings (Note 18.e) |
| - |
| - |
| - |
| (816,759) |
| 12,830 |
| (803,929) | ||
Indexed by Foreign Currency - US |
| - |
| - |
| - |
| (816,759) |
| 12,830 |
| (803,929) | ||
|
|
|
|
|
|
|
|
|
|
|
|
|
| Bank/Consolidated |
|
|
|
|
|
|
|
|
|
|
|
|
|
| 12/31/2017 |
|
|
|
|
|
|
|
|
|
|
|
|
|
| Notional |
Hedge instruments |
|
|
|
|
|
|
|
|
|
|
|
| ||
Futures Contracts(9) |
|
|
|
|
|
|
|
|
|
|
| 22,206,615 | ||
Interest Rate (DI1 and DIA) |
|
|
|
|
|
|
|
|
|
|
| 22,206,615 | ||
|
|
|
|
|
|
|
|
|
|
|
|
|
| Bank/Consolidated |
|
|
|
|
|
|
|
|
|
|
|
|
|
| 12/31/2017 |
Adjustment | ||||||||||||||
|
|
|
|
|
|
|
|
|
| Cost |
| to Fair Value |
| Fair Value |
Hedge Object | ||||||||||||||
Assets |
|
|
|
|
|
|
|
|
| 24,415,397 |
| 364,434 |
| 24,779,831 |
Securities - Available for Sale (Note 6.a.III) |
|
| ||||||||||||
Public Titles(9) |
|
|
|
|
|
|
|
|
| 24,415,397 |
| 364,434 |
| 24,779,831 |
National Treasury Bills - LTN |
|
|
|
|
|
|
|
|
| 13,674,321 |
| 219,611 |
| 13,893,932 |
National Treasury Notes - NTN F |
|
|
|
|
|
|
|
|
| 10,741,076 |
| 144,823 |
| 10,885,899 |
(1) Bank and Consolidated, obligations over instruments whose hedged items are securities represented by promissory notes indexed in certificates of interbank deposits (CDI) with market value of R$109,538 (12/31/2016 - R$108,845). | ||||||||||||||
(2) Bank and Consolidated, these are obligations over instruments whose hedge items are credit operations and securities represented by promissory notes indexed in interbank deposit certificates (CDI), with market value of credit operations of R$352,071 (12/31/2016 - R$222,957) and December 31, 2017 promissory notes of R$10,354; and December 31, 2016 assets instruments whose hedged items are foreign currency indexed bonds denominated in foreign currency - US dollar in the market value of R$803,929. | ||||||||||||||
(3) Bank and Consolidated, these are obligations over instruments whose hedged items are securities represented by promissory notes indexed to Real interest rates with market value of R$6,082 (12/31/2016 - R$37,547) and credit operations in the amount of R$21,077. | ||||||||||||||
(4) Bank and Consolidated, these are obligations over instruments whose hedged items are credit operations indexed in foreign currency - fixed interest euro at the market value of R$321,825. | ||||||||||||||
(5) Bank and Consolidated, these are obligations over instruments whose hedged items are credit operations indexed in foreign currency - fixed interest US dollar in the market value of R$224,943. | ||||||||||||||
(6) In the Consolidated, these are obligations over instruments whose hedge items are credit operations indexed in foreign currency - US dollar with a market value of R$288,420 (12/31/2016 - R$323,782). | ||||||||||||||
(7) In the Consolidated, these are obligations over instruments whose hedged items are credit operations indexed in foreign currency - Colombian peso with market value of R$173,990. | ||||||||||||||
(8) In the Consolidated, these are obligations over instruments whose hedged items are pre-fixed government securities with a market value e of R$1,618,529. | ||||||||||||||
(9) Current value of the instruments as of December 31, 2017 is R$22,206,615. | ||||||||||||||
The analysis of the effectiveness of these operations was in accordance with Bacen Circular Letter 3,082/2002. | ||||||||||||||
b) Cash Flow Hedge | ||||||||||||||
|
|
|
|
|
|
|
|
|
|
|
|
|
| Bank |
|
|
|
|
|
|
|
| 12/31/2017 |
|
|
|
|
| 12/31/2016 |
Adjustment | Adjustment | |||||||||||||
|
|
|
| Cost |
| to Fair Value |
| Fair Value |
| Cost |
| to Fair Value |
| Fair Value |
Hedge Instruments | ||||||||||||||
Swap Contracts |
|
|
| 123,428 |
| (28,686) |
| 94,742 |
| 140,828 |
| (20,535) |
| 120,293 |
Assets |
|
|
| 1,174,656 |
| (36,590) |
| 1,138,066 |
| 1,382,765 |
| 84,746 |
| 1,467,511 |
Indexed by Foreign Currency - Fixed |
| 1,035,029 |
| (42,150) |
| 992,879 |
| 1,382,765 |
| 84,746 |
| 1,467,511 | ||
Indexed by Foreign Currency - |
| 139,627 |
| 5,560 |
| 145,187 |
| - |
| - |
| - | ||
Liabilities |
|
|
| (1,051,228) |
| 7,904 |
| (1,043,324) |
| (1,241,937) |
| (105,281) |
| (1,347,218) |
CDI (Interbank Deposit Rates)(1) (2) |
|
|
| (142,190) |
| (5,735) |
| (147,925) |
| (340,943) |
| (995) |
| (341,938) |
Fixed Interest Rate - Real(1) |
|
|
| - |
| - |
| - |
| (198,666) |
| (1,288) |
| (199,954) |
Indexed by Foreign Currency - Fixed |
| (909,038) |
| 13,639 |
| (895,399) |
| (702,328) |
| (102,998) |
| (805,326) | ||
|
|
|
|
|
|
|
|
|
|
|
|
|
| Consolidated |
|
|
|
|
|
|
|
| 12/31/2017 |
|
|
|
|
| 12/31/2016 |
Adjustment | Adjustment | |||||||||||||
|
|
|
| Cost |
| to Fair Value |
| Fair Value |
| Cost |
| to Fair Value |
| Fair Value |
Hedge Instruments | ||||||||||||||
Swap Contracts |
|
|
| 123,985 |
| (137,361) |
| (13,376) |
| 83,063 |
| (85,053) |
| (1,990) |
Assets |
|
|
| 6,011,762 |
| 116,754 |
| 6,128,516 |
| 4,364,638 |
| 176,056 |
| 4,540,694 |
Indexed by Foreign Currency - Fixed |
| 1,035,029 |
| (42,150) |
| 992,879 |
| 1,393,009 |
| 84,811 |
| 1,477,820 | ||
Indexed by Foreign Currency - |
| 139,627 |
| 5,560 |
| 145,187 |
| - |
| - |
| - | ||
Indexed by Foreign Currency - Euro(3) |
| 1,088,569 |
| 134,435 |
| 1,223,004 |
| 421,516 |
| 52,852 |
| 474,368 | ||
CDI (Interbank Deposit Rates) (4) |
| 3,748,537 |
| 18,909 |
| 3,767,446 |
| 2,550,113 |
| 38,393 |
| 2,588,506 | ||
Liabilities |
|
|
| (5,887,777) |
| (254,115) |
| (6,141,892) |
| (4,281,575) |
| (261,109) |
| (4,542,684) |
CDI (Interbank Deposit Rates)(1) (2) |
| (142,190) |
| (5,735) |
| (147,925) |
| (340,943) |
| (995) |
| (341,938) | ||
Indexed by Interest Rate - Pré Real (1) (4) |
| (3,809,809) |
| (131,127) |
| (3,940,936) |
| (2,741,145) |
| (97,473) |
| (2,838,618) | ||
Indexed by Foreign Currency - Fixed | (909,038) |
| 13,639 |
| (895,399) |
| �� (702,328) |
| (102,998) |
| (805,326) | |||
Indexed by Foreign Currency - Dollar (3) |
| (1,026,740) |
| (130,892) |
| (1,157,632) |
| (489,318) |
| (59,366) |
| (548,684) | ||
Indexed by Foreign Currency - Real (3) |
| - |
| - |
| - |
| (7,841) |
| (277) |
| (8,118) | ||
|
|
|
|
|
|
|
|
|
|
|
|
|
| Bank/Consolidated |
|
|
|
|
|
|
|
|
|
|
|
| 12/31/2017 |
| 12/31/2016 |
|
|
|
|
|
|
|
|
|
|
|
| Notional |
| Notional |
Hedge Instruments | ||||||||||||||
Future Contracts |
|
|
|
|
|
|
|
|
| 60,299,595 |
| 80,149,530 | ||
Trade Finance Operations(5) |
|
|
|
|
|
|
|
|
| 54,995,334 |
| 80,149,530 | ||
Foreign Currency - Dollar |
|
|
|
|
|
|
|
|
| 3,362,582 |
| 450,571 | ||
Interest Rates (DI1 and DIA) |
|
|
|
|
|
|
|
|
| 32,344,276 |
| 46,314,644 | ||
Interest Rates DDI1 |
|
|
|
|
|
|
|
|
| 19,288,476 |
| 33,384,315 | ||
Securities(6) |
|
|
|
|
|
|
|
|
|
|
| 5,304,261 |
| - |
Interest Rates (DI1 and DIA) |
|
|
|
|
|
|
|
|
| 5,304,261 |
| - | ||
Bank | Consolidated | |||||||||||||
|
|
|
|
|
|
|
| 12/31/2017 |
| 12/31/2016 |
| 12/31/2017 |
| 12/31/2016 |
Hedge Object - Cost | ||||||||||||||
Asset |
|
|
|
|
|
|
| 24,652,963 |
| 27,362,050 |
| 25,697,292 |
| 27,858,924 |
Lending Operations (Note 8.a) |
|
|
|
|
|
|
|
|
|
|
|
| ||
Import and Export Credit and Financing(3) (5) |
|
|
| 7,632,915 |
| 10,558,755 |
| 8,295,191 |
| 10,816,781 | ||||
Lending Operations(3) (5) |
|
|
|
|
| 9,590,587 |
| 13,632,049 |
| 9,972,640 |
| 13,870,897 | ||
Other Receivables(5) |
|
|
|
|
| 354,315 |
| 529,997 |
| 354,315 |
| 529,997 | ||
Securities |
|
|
|
|
|
|
| |||||||
Available-for-Sale Securities - Promissory Notes - NP (Note 6.a.III)(2) (5) |
| 1,194,266 |
| 1,939,949 |
| 1,194,266 |
| 1,939,949 | ||||||
Available for Sale - Public Securities - Financial |
| 5,071,220 |
| - |
| 5,071,220 |
| - | ||||||
Held to Maturity - Securities Foreign Debt Bonds (Note 6.a. IV)(1) |
| 809,660 |
| 701,300 |
| 809,660 |
| 701,300 | ||||||
Liabilities |
|
|
|
|
|
|
| - |
| (1,332,972) |
| (4,130,347) |
| (4,223,472) |
Money Market Funding and Borrowings and Onlendings | ||||||||||||||
Deposits (Note 18.a) | ||||||||||||||
Certificates of Interbank Deposit - CDI(4) |
|
|
| - |
| - |
| (333,343) |
| (547,556) | ||||
Real Estate Credit, Mortgage, Credit and Similar (Note 18.c) | ||||||||||||||
Exchange Acceptances | ||||||||||||||
Exchange Treasury Bills - LC(4) |
|
|
|
|
| - |
| - |
| (763,103) |
| (573,596) | ||
Real Estate Credit, Mortgage, Credit and Similar | ||||||||||||||
Financial Treasury Bills - LF(4) |
|
|
|
|
| - |
| - |
| (3,033,901) |
| (1,769,348) | ||
Borrowings and Onlendings (Note 18.e) | ||||||||||||||
Foreign Lending Obligations(5) |
|
|
|
|
| - |
| (1,332,972) |
| - |
| (1,332,972) | ||
(1) Bank and Consolidated, operation due April 1, 2021 (12/31/2016 - operation due April 1, 2021) which hedge objects are securities represented by title Brazilian External Debt Bonds. | ||||||||||||||
(2) Bank and Consolidated, operations maturing between January 5 and April 14, 2018, whose hedged items are securities represented by promissory notes. | ||||||||||||||
(3) Consolidated, operations maturing between January, 30 2018 and September 30, 2022 (12/31/2016 - operations maturing between March, 2017 and June, 2021), which objects "hedge" contracts are loans from lending institutions. | ||||||||||||||
(4) Consolidated, operations with maturities between January 2018 and December 2020 (12/31/2016 - operations with maturities between May 2017 and November 2019), whose hedge items are deposits with interbank deposit certificates (CDI), bills of exchange (LC) and financial letters (LF). | ||||||||||||||
(5) Bank and Consolidated, transactions with maturity between February, 2018 and November, 2026 (12/31/2016 - transactions with maturities between January 2017 and January 2018) and restated instrument value of R$16,811,747 (12/31/2016 - R$29,164,917) where operations are denominated in US dollars and futures in DI and IDD when used in conjunction with the foreign exchange coupon hedges the trade finance operations, whose hedge is a credit transaction - Financing and export and import credit, lending operations, other credits, securities represented by promissory notes and foreign loan obligations. | ||||||||||||||
(6) Bank and Consolidated, operation maturing between March, 2021 and March, 2023 and updated value of the instruments of R$5,304,261, whose object of "hedge" are Financial Treasury Bills - LFT, recorded in securities. | ||||||||||||||
In the Bank and Consolidated, the mark-to-market effect of swap and futures contracts corresponds to a credit in the amount of R$116,441 (12/31/2016 - R$69,489) and is recorded in stockholders' equity, net of tax effects , of which R$9,342 (12/31/2016 - R$59,930) will be realized in the next twelve months. | ||||||||||||||
The analysis of the effectiveness of these operations was in accordance with Bacen Circular 3,082/2002, in 2017, income was recorded in the amount of R$9,267 referring to the ineffective portion. | ||||||||||||||
VI) Derivatives Pledged as Guarantee | ||||||||||||||
The guarantee margin for transactions traded on the B3 (Current Corporate Name of BM&Fbovespa) with derivative financial instruments from own portfolio and third-party portfolio is composed by Brazilian Internal Debt Bonds. | ||||||||||||||
|
|
|
|
|
|
|
|
|
| Bank |
|
|
| Consolidated |
|
|
|
|
|
|
|
| 12/31/2017 |
| 12/31/2016 |
| 12/31/2017 |
| 12/31/2016 |
Financial Treasury Bills - LFT |
|
|
|
|
| 11,938 |
| 714,031 |
| 708,960 |
| 1,556,804 | ||
National Treasury Bills - LTN |
|
|
|
|
| 4,371,286 |
| 4,636,644 |
| 4,371,286 |
| 4,636,644 | ||
National Treasury Notes - NTN |
|
|
|
|
| 1,003,583 |
| 27,598 |
| 1,193,315 |
| 27,598 | ||
Total |
|
|
|
|
|
|
| 5,386,807 |
| 5,378,273 |
| 6,273,561 |
| 6,221,046 |
VII) Derivatives Recorded in Assets and Liabilities | ||||||||||||||
|
|
|
|
|
|
|
|
|
| Bank |
|
|
| Consolidated |
|
|
|
|
|
|
|
| 12/31/2017 |
| 12/31/2016 |
| 12/31/2017 |
| 12/31/2016 |
Assets |
|
|
|
|
|
|
|
|
|
|
|
|
|
|
Swap Differentials Receivable |
|
|
|
|
| 5,700,402 |
| 9,258,813 |
| 15,848,969 |
| 15,348,102 | ||
Option Premiums to Exercise |
|
|
|
|
| 489,458 |
| 883,474 |
| 553,218 |
| 935,520 | ||
Forward Contracts and Others |
|
|
|
|
| 5,114,013 |
| 7,708,703 |
| 5,141,581 |
| 7,792,334 | ||
Total |
|
|
|
|
|
|
| 11,303,873 |
| 17,850,990 |
| 21,543,768 |
| 24,075,956 |
Liabilities | ||||||||||||||
Swap Differentials Payable |
|
|
|
|
| 4,689,879 |
| 6,097,822 |
| 14,920,051 |
| 12,375,829 | ||
Option Premiums Launched |
|
|
|
|
| 342,766 |
| 728,507 |
| 385,183 |
| 767,053 | ||
Forward Contracts and Others |
|
|
|
|
| 5,375,650 |
| 6,801,326 |
| 5,375,650 |
| 6,801,632 | ||
Total |
|
|
|
|
|
|
| 10,408,295 |
| 13,627,655 |
| 20,680,884 |
| 19,944,514 |
c) Financial Instruments - Sensitivity Analysis | ||||||||||||||
The risk management is focused on portfolios and risk factors pursuant to Bacen’s regulations and good international practices. | ||||||||||||||
The new rules of Basel III follow a phase in schedule, thus enabling the application of the rules gradually until 2019. | ||||||||||||||
Financial instruments are segregated into trading and banking portfolios, as in the management of market risk exposure, according to the best market practices and the transaction classification and capital management criteria of Bacen´s Basileia Standard Method. The trading portfolio consists of all transactions with financial instruments and products, including derivatives, held for trading, and the banking portfolio consists of core business transactions arising from the different Banco Santander business lines and their possible hedges. Therefore, based on the nature of Banco Santander’s activities, the sensitivity analysis was divided by both trading and banking portfolios. | ||||||||||||||
Banco Santander performs the sensitivity analysis of the financial instruments in accordance with requirements of CVM Instruction 475/2008, considering the market information and scenarios that would adversely affect the positions of the Bank. | ||||||||||||||
The table below summarizes the stress test amounts generated by Banco Santander’s corporate systems, related to the trading and banking portfolio, for each one of the portfolio scenarios as of December 31, 2017. | ||||||||||||||
Trading Portfolio |
|
|
|
|
|
|
|
|
| |||||
Risk Factor |
|
|
| Description |
|
|
|
|
| Scenario 1 |
| Scenario 2 |
| Scenario 3 |
Interest Rate - Real |
| Exposures subject to Changes in Interest |
| (2,447) |
| (73,635) |
| (147,269) | ||||||
Coupon Interest Rate |
| Exposures subject to Changes in Coupon |
| (944) |
| (19,373) |
| (38,746) | ||||||
Coupon - US Dollar |
| Exposures subject to Changes in Coupon |
| (5,306) |
| (16,830) |
| (33,659) | ||||||
Coupon - Other Currencies |
| Exposures subject to Changes in Coupon |
| (6,399) |
| (29,576) |
| (59,152) | ||||||
Foreign Currency |
|
|
| Exposures subject to Foreign Exchange |
| (4,933) |
| (123,334) |
| (246,668) | ||||
Eurobond/Treasury/Global |
| Exposures subject to Changes in Interest |
| (1,469) |
| (8,734) |
| (17,469) | ||||||
Inflation |
|
|
| Exposures subject to Change in Coupon |
| (5,032) |
| (77,354) |
| (154,707) | ||||
Shares and Indexes |
| Exposures subject to Change in Shares Price |
| (1,768) |
| (44,194) |
| (88,388) | ||||||
Total(1) |
|
|
|
|
|
|
|
|
| (28,298) |
| (393,030) |
| (786,058) |
(1) Amounts net of taxes. | ||||||||||||||
Scenario 1: a shock of +10 base points on the interest curves and 1% to price changes (currency and share). | ||||||||||||||
Scenario 2: a shock of +25% and -25% in all risk factors, are considered the greatest losses per risk factor. | ||||||||||||||
Scenario 3:a shock of +50% and -50% in all risk factors, are considered the greatest losses per risk factor. | ||||||||||||||
Banking Portfolio |
|
|
|
|
|
|
|
|
| |||||
Risk Factor |
|
|
| Description |
|
|
|
|
| Scenario 1 |
| Scenario 2 |
| Scenario 3 |
Interest Rate - Real |
| Exposures subject to Changes in Interest |
| (57,909) |
| (1,100,271) |
| (2,145,529) | ||||||
TR and Long-Term Interest Rate - (TJLP) |
| Exposures subject to Change in Exchange |
| (17,245) |
| (327,661) |
| (638,940) | ||||||
Inflation |
|
|
| Exposures subject to Change in Coupon |
| (34,794) |
| (661,094) |
| (1,289,132) | ||||
Coupon - US Dollar |
| Exposures subject to Changes in Coupon |
| (7,123) |
| (135,334) |
| (263,901) | ||||||
Coupon - Other Currencies |
| Exposures subject to Changes in Coupon |
| (2,423) |
| (46,031) |
| (89,761) | ||||||
Interest Rate Markets International |
| Exposures subject to Changes in Interest |
| (10,655) |
| (202,441) |
| (394,759) | ||||||
Foreign Currency |
|
|
| Exposures subject to Foreign Exchange |
| (1,116) |
| (27,896) |
| (55,792) | ||||
Total(1) |
|
|
|
|
|
|
|
|
| (131,265) |
| (2,500,728) |
| (4,877,814) |
(1) Amounts net of taxes. | ||||||||||||||
Scenario 1: a shock of +10 base points on the interest curves and 1% to price changes(currency). | ||||||||||||||
Scenario 2: a shock of +25% and -25% in all risk factors, are considered the greatest losses per risk factor. | ||||||||||||||
Scenario 3:a shock of +50% and -50% in all risk factors, are considered the greatest losses per risk factor. | ||||||||||||||
7. Interbank Accounts | ||||||||||||||
The amount of interbank accounts are composed of restricted deposits with the Bacen to meet compulsory obligations for demand deposits, savings deposits and time deposits, and payments and receipts pending settlement, represented by checks and other documents sent to clearinghouses payment transactions (assets and liabilities position) (Note 12). | ||||||||||||||
8. Loan Portfolio and Allowance for Loan Losses | ||||||||||||||
a) Loan Portfolio | ||||||||||||||
|
|
|
|
|
|
|
|
|
| Bank |
|
|
| Consolidated |
|
|
|
|
|
|
|
| 12/31/2017 |
| 12/31/2016 |
| 12/31/2017 |
| 12/31/2016 |
Lending Operations |
|
|
| 171,639,017 |
| 172,953,587 |
| 221,663,484 |
| 212,780,537 | ||||
Loans and Discounted Titles (3) |
|
|
|
|
| 90,001,769 |
| 90,658,938 |
| 101,161,949 |
| 98,581,263 | ||
Financing(4) |
|
|
|
|
|
|
| 35,104,254 |
| 36,631,187 |
| 73,829,604 |
| 68,075,722 |
Rural and Agroindustrial - Financing |
|
|
|
|
| 11,675,791 |
| 8,958,221 |
| 11,675,791 |
| 8,958,221 | ||
Real Estate Financing |
|
|
|
|
| 34,689,048 |
| 36,490,536 |
| 34,689,048 |
| 36,490,536 | ||
Securities Financing |
|
|
|
|
| 1,173 |
| 50,303 |
| 1,173 |
| 50,303 | ||
Lending Operations Related to Assignment |
|
|
| 166,982 |
| 164,402 |
| 305,919 |
| 624,492 | ||||
Leasing Operations |
|
|
|
|
| 1 |
| 7 |
| 2,597,338 |
| 2,882,031 | ||
Advances on Foreign Exchange Contracts(1) (Note 9) |
|
|
| 5,070,912 |
| 5,101,851 |
| 5,070,912 |
| 5,101,851 | ||||
Other Receivables(2) (5) |
|
|
|
|
| 40,147,992 |
| 33,344,087 |
| 43,309,959 |
| 36,133,837 | ||
Total |
|
|
|
|
|
|
| 216,857,922 |
| 211,399,532 |
| 272,641,693 |
| 256,898,256 |
Current |
|
|
|
|
|
|
| 112,042,662 |
| 108,886,706 |
| 139,930,480 |
| 133,425,588 |
Long-term |
|
|
|
|
|
|
| 104,815,260 |
| 102,512,826 |
| 132,711,213 |
| 123,472,668 |
(1) Advance on foreign exchange contracts are classified as a reduction of other obligations. | ||||||||||||||
(2) Comprise receivables for guarantees honored other receivables - others (granted to borrowers to purchase securities, assets, notes and receivable - Note 12) and income receivable on foreign exchange contracts (Note 9). | ||||||||||||||
(3) Includes the amount of R$281,679 (12/31/2016 - R$81,697) Bank and R$744,089 (12/31/2016 - R$405,479) Consolidated contracts objects loans of "hedge" market risk (Note 6.b.V.a) and the amount of R$9,590,587 (12/31/2016 - R$13,632,049) Bank and R$9,972,640 (12/31/2016 - R$13,870,897) Consolidated, contracts of loan object "hedge" cash flow (Note 6.b.V.b). | ||||||||||||||
(4) Includes the amount of R$638,237 (12/31/2016 - R$141,260) Bank and Consolidated of financing "hedge" contracts objects of market risk (Note 6.b.V.a), and the amount of R$7,632,915 (12/31/2016 - R$10,558,755) Bank and R$8,295,191 (12/31/2016 - R$10,816,781) Consolidated of financing "hedge" contracts objects cash flow (Note 6.b.V.b.). | ||||||||||||||
(5) In the Bank and Consolidated, includes the amount of R$354,315 (12/31/2016 - R$529,997 )of contracts of credit objects of cash flow "hedge".(Note 6.b.V.b.) | ||||||||||||||
Sale or Transfer Operations of Financial Assets | ||||||||||||||
According to Resolution CMN 3,533/2008 updated with later norms, the lending operations with substantial retention of risks and benefits, started from January 1, 2012 to remain registered in the loan portfolio. For lending operations made until December 31, 2011, regardless of the retention or transfer of substantial risks and benefits, financial assets were written off from the record of the original operation and the result recorded in the transfer to the appropriate result. | ||||||||||||||
(i) With Substantial Transfer of Risks and Benefits | ||||||||||||||
During the exercise 2017, operations were carried out credit assignment without recourse in the amount of R$590,118 (2016 - R$267,770) Bank and Consolidated and were recorded substantially in loans and discounted securities, classified as H risk level. | ||||||||||||||
(ii) With Substantial Retention of Risks and Benefits | ||||||||||||||
Since August 2016, in the Consolidated, the amount referring to the loan portfolio assigned with co-obligation started to include the operations coming from Banco PSA Finance Brasil S.A. (Banco PSA). On December 31, 2017, the present value of the operations assigned to Banco PSA is R$138,937 (12/31/2016 - R$460,090). | ||||||||||||||
On September, 2015 the Bank made assignment of receivables with recourse related to the Funded Participation operations (Export) in the amount of R$201,706 with maturity on April, 2019. On December 31, 2017 the present value of the divested operations is R$166,982 (12/31/2016 - R$164,402). | ||||||||||||||
On December 2011, the Bank made the assignment of receivables with recourse relating to real estate financing in the amount of R$688,821, which fall due until October 2041. On December 31, 2017, the present value of the divested operations is R$125,478 (12/31/2016 - R$159,745). | ||||||||||||||
These assignment operations were carried out with a co-obligation clause, and compulsory repurchase is envisaged in the following situations: | ||||||||||||||
- Contracts in default for a period exceeding 90 consecutive days; | ||||||||||||||
- Contracts subject to renegotiation; | ||||||||||||||
- Contracts subject to portability in accordance with CMN Resolution 3,401/2006; and | ||||||||||||||
- Contracts subject to intervention. | ||||||||||||||
The compulsory repurchase price will be calculated by unpaid balance of the loan due date at the time of its repurchase. | ||||||||||||||
From the date of transfer cash flows from operations will be paid directly to the assignee entity. | ||||||||||||||
b) Loan Portfolio by Maturity | ||||||||||||||
|
|
|
|
|
|
|
|
|
|
|
|
|
|
|
Bank | Consolidated | |||||||||||||
|
|
|
| �� |
|
|
| 12/31/2017 |
| 12/31/2016 |
| 12/31/2017 |
| 12/31/2016 |
Overdue |
|
|
|
|
|
|
| 7,589,001 |
| 7,054,119 |
| 8,706,106 |
| 8,084,332 |
Due to: |
|
|
|
|
|
|
|
|
|
|
|
|
|
|
Up to 3 Months |
|
|
|
|
|
|
| 58,353,903 |
| 61,524,849 |
| 68,376,226 |
| 70,650,136 |
From 3 to 12 Months |
|
|
|
|
|
| 53,688,759 |
| 47,361,857 |
| 71,554,254 |
| 62,775,452 | |
Over 12 Months |
|
|
|
|
|
|
| 97,226,259 |
| 95,458,707 |
| 124,005,107 |
| 115,388,336 |
Total |
|
|
|
|
|
|
| 216,857,922 |
| 211,399,532 |
| 272,641,693 |
| 256,898,256 |
c) Lease Portfolio Operations | ||||||||||||||
|
|
|
|
|
|
|
|
|
| Bank |
|
|
| Consolidated |
|
|
|
|
|
|
|
| 12/31/2017 |
| 12/31/2016 |
| 12/31/2017 |
| 12/31/2016 |
Gross Investment in Leasing Operations |
|
|
|
|
| 1 |
| 7 |
| 3,088,690 |
| 3,455,534 | ||
Lease Receivables |
|
|
|
|
| 1 |
| 4 |
| 2,059,052 |
| 2,339,735 | ||
Unrealized Residual Values(1) |
|
|
|
|
| - |
| 3 |
| 1,029,638 |
| 1,115,799 | ||
Unearned Income on Lease |
|
|
|
|
| - |
| (3) |
| (2,037,716) |
| (2,316,599) | ||
Offsetting Residual Values |
|
|
|
|
| - |
| (3) |
| (1,029,638) |
| (1,115,799) | ||
Leased Assets |
|
|
|
|
| 66,611 |
| 68,451 |
| 6,699,397 |
| 7,390,260 | ||
Accumulated Depreciation |
|
|
|
|
| (66,611) |
| (68,451) |
| (3,531,301) |
| (3,949,169) | ||
Excess Depreciation |
|
|
|
|
| 25,957 |
| 27,109 |
| 1,321,640 |
| 1,517,892 | ||
Losses on Unamortized Lease |
|
|
|
|
| - |
| - |
| 222,865 |
| 247,375 | ||
Advances for Guaranteed Residual Value |
|
|
|
|
| (25,957) |
| (27,103) |
| (2,138,695) |
| (2,349,857) | ||
Other Assets |
|
|
|
|
|
|
| - |
| - |
| 2,096 |
| 2,394 |
Total of Lease Portfolio at Present Value |
|
|
| 1 |
| 7 |
| 2,597,338 |
| 2,882,031 | ||||
(1) Guaranteed residual value of lease agreements, net of advances. | ||||||||||||||
Leasing unrealized financial income (lease income to appropriate related to minimum payments to receive) in the Consolidated is R$491,352 (12/31/2016 - R$573,503). | ||||||||||||||
On December 31, 2017 and 2016, there were no individually material agreements or commitments for lease contracts. | ||||||||||||||
Report per Lease Portfolio Maturity of Gross Investment | ||||||||||||||
|
|
|
|
|
|
|
|
|
| Bank |
|
|
| Consolidated |
|
|
|
|
|
|
|
| 12/31/2017 |
| 12/31/2016 |
| 12/31/2017 |
| 12/31/2016 |
Overdue |
|
|
|
|
|
|
| 1 |
| 2 |
| 9,716 |
| 27,105 |
Due to: |
|
|
|
|
|
|
|
|
|
|
|
|
|
|
Up to 1 Year |
|
|
|
|
|
|
| - |
| 5 |
| 1,441,341 |
| 1,625,438 |
From 1 to 5 Years |
|
|
|
|
| - |
| - |
| 1,633,057 |
| 1,794,786 | ||
Over 5 Years |
|
|
|
|
|
|
| - |
| - |
| 4,576 |
| 8,205 |
Total |
|
|
|
|
|
|
| 1 |
| 7 |
| 3,088,690 |
| 3,455,534 |
Report per Lease Portfolio Maturity at Present Value | ||||||||||||||
|
|
|
|
|
|
|
|
|
| Bank |
|
|
| Consolidated |
|
|
|
|
|
|
|
| 12/31/2017 |
| 12/31/2016 |
| 12/31/2017 |
| 12/31/2016 |
Overdue |
|
|
|
|
|
|
| 1 |
| 2 |
| 8,538 |
| 24,117 |
Due to: |
|
|
|
|
|
|
|
|
|
|
|
|
|
|
Up to 1 Year |
|
|
|
|
|
|
| - |
| 5 |
| 1,344,466 |
| 1,518,203 |
From 1 to 5 Years |
|
|
|
|
| - |
| - |
| 1,242,339 |
| 1,335,895 | ||
Over 5 Years |
|
|
|
|
|
|
| - |
| - |
| 1,995 |
| 3,816 |
Total |
|
|
|
|
|
|
| 1 |
| 7 |
| 2,597,338 |
| 2,882,031 |
d) Loan Portfolio by Business Sector | ||||||||||||||
|
|
|
|
|
|
|
|
|
| Bank |
|
|
| Consolidated |
|
|
|
|
|
|
|
| 12/31/2017 |
| 12/31/2016 |
| 12/31/2017 |
| 12/31/2016 |
Private Sector |
|
|
|
|
|
|
| 216,799,022 |
| 211,333,303 |
| 272,582,793 |
| 256,832,027 |
Industry |
|
|
|
|
|
|
| 55,611,046 |
| 62,455,022 |
| 57,403,395 |
| 63,829,839 |
Commercial |
|
|
|
|
|
|
| 27,137,523 |
| 26,864,271 |
| 31,050,058 |
| 30,357,498 |
Financial Institutions |
|
|
|
|
| 1,152,604 |
| 1,111,393 |
| 1,156,855 |
| 1,116,062 | ||
Services and Other(1) |
|
|
|
|
| 32,461,007 |
| 33,607,965 |
| 35,492,891 |
| 36,071,493 | ||
Individuals |
|
|
|
|
|
|
| 97,946,270 |
| 84,422,338 |
| 144,942,407 |
| 122,286,564 |
Credit Cards |
|
|
|
|
|
|
| 24,420,815 |
| 20,676,801 |
| 24,420,815 |
| 20,676,801 |
Mortgage Loans |
|
|
|
|
|
|
| 28,112,463 |
| 27,153,241 |
| 28,112,463 |
| 27,153,241 |
Payroll Loans |
|
|
|
|
|
|
| 15,497,855 |
| 11,632,735 |
| 25,616,252 |
| 18,987,060 |
Financing and Vehicles Lease |
|
|
|
|
| 1,835,375 |
| 1,859,677 |
| 36,227,482 |
| 30,194,853 | ||
Others (2) |
|
|
|
|
|
|
| 28,079,762 |
| 23,099,884 |
| 30,565,395 |
| 25,274,609 |
Agricultural |
|
|
|
|
|
|
| 2,490,572 |
| 2,872,314 |
| 2,537,187 |
| 3,170,571 |
Public Sector |
|
|
|
|
|
|
| 58,900 |
| 66,229 |
| 58,900 |
| 66,229 |
State |
|
|
|
|
|
|
| 26,241 |
| 50,647 |
| 26,241 |
| 50,647 |
Municipal |
|
|
|
|
|
|
| 32,659 |
| 15,582 |
| 32,659 |
| 15,582 |
Total |
|
|
|
|
|
|
| 216,857,922 |
| 211,399,532 |
| 272,641,693 |
| 256,898,256 |
|
|
|
|
|
|
|
|
|
|
|
|
|
|
|
(1) Includes the activities of mortgage companies - business plan, transportation services, health, personal and others. | ||||||||||||||
(2) Includes personal loans, overdraft among others. | ||||||||||||||
e) Classification of Loan Portfolio and Respective Allowance for Loan Losses by Risk Level | ||||||||||||||
|
|
|
|
|
|
|
|
|
|
|
|
|
| Bank |
12/31/2017 | ||||||||||||||
Minimum Allowance |
|
|
|
| Loan Portfolio |
|
|
|
| Allowance | ||||
Risk Level |
| Required (%) |
| Current |
| Past Due(1) |
| Total(3) |
| Required |
| Additional(2) |
| Total |
AA |
| - |
| 82,161,883 |
| - |
| 82,161,883 |
| - |
| - |
| - |
A |
| 0.5% |
| 80,068,069 |
| - |
| 80,068,069 |
| 400,340 |
| 297,689 |
| 698,029 |
B |
| 1% |
| 14,449,689 |
| 1,547,327 |
| 15,997,016 |
| 159,970 |
| 264,618 |
| 424,588 |
C |
| 3% |
| 9,306,222 |
| 1,799,710 |
| 11,105,932 |
| 333,178 |
| 733,441 |
| 1,066,619 |
D |
| 10% |
| 7,794,981 |
| 1,988,601 |
| 9,783,582 |
| 978,358 |
| 157,214 |
| 1,135,572 |
E |
| 30% |
| 2,429,455 |
| 1,656,825 |
| 4,086,280 |
| 1,225,884 |
| - |
| 1,225,884 |
F |
| 50% |
| 1,605,399 |
| 1,892,247 |
| 3,497,646 |
| 1,748,823 |
| - |
| 1,748,823 |
G |
| 70% |
| 798,126 |
| 907,666 |
| 1,705,792 |
| 1,194,055 |
| - |
| 1,194,055 |
H |
| 100% |
| 3,327,732 |
| 5,045,915 |
| 8,373,647 |
| 8,373,647 |
| - |
| 8,373,647 |
Total |
|
|
| 201,941,556 |
| 14,838,291 |
| 216,779,847 |
| 14,414,255 |
| 1,452,962 |
| 15,867,217 |
|
|
|
|
|
|
|
|
|
|
|
|
|
| Bank |
12/31/2016 | ||||||||||||||
Minimum Allowance |
|
|
|
| Loan Portfolio |
|
|
|
| Allowance | ||||
Risk Level |
| Required (%) |
| Current |
| Past Due(1) |
| Total(3) |
| Required |
| Additional(2) |
| Total |
AA |
| - |
| 83,304,514 |
| - |
| 83,304,514 |
| - |
| - |
| - |
A |
| 0.5% |
| 73,169,632 |
| - |
| 73,169,632 |
| 365,848 |
| 275,044 |
| 640,892 |
B |
| 1% |
| 14,214,859 |
| 1,097,714 |
| 15,312,573 |
| 153,126 |
| 248,731 |
| 401,857 |
C |
| 3% |
| 9,333,702 |
| 2,139,320 |
| 11,473,022 |
| 344,191 |
| 744,383 |
| 1,088,574 |
D |
| 10% |
| 8,000,687 |
| 2,482,841 |
| 10,483,528 |
| 1,048,353 |
| 577,450 |
| 1,625,803 |
E |
| 30% |
| 2,009,675 |
| 1,451,340 |
| 3,461,015 |
| 1,038,304 |
| - |
| 1,038,304 |
F |
| 50% |
| 1,859,835 |
| 1,201,808 |
| 3,061,643 |
| 1,530,821 |
| - |
| 1,530,821 |
G |
| 70% |
| 1,273,196 |
| 956,548 |
| 2,229,744 |
| 1,560,821 |
| - |
| 1,560,821 |
H |
| 100% |
| 3,122,836 |
| 5,770,548 |
| 8,893,384 |
| 8,893,384 |
| - |
| 8,893,384 |
Total |
|
|
| 196,288,936 |
| 15,100,119 |
| 211,389,055 |
| 14,934,848 |
| 1,845,608 |
| 16,780,456 |
|
|
|
|
|
|
|
|
|
|
|
|
|
| Consolidated |
12/31/2017 | ||||||||||||||
Minimum Allowance |
|
|
|
| Loan Portfolio |
|
|
|
| Allowance | ||||
Risk Level |
| Required (%) |
| Current |
| Past Due(1) |
| Total(3) |
| Required |
| Additional(2) |
| Total |
AA |
| - |
| 95,785,639 |
| - |
| 95,785,639 |
| - |
| - |
| - |
A |
| 0.5% |
| 112,295,243 |
| - |
| 112,295,243 |
| 561,476 |
| 319,088 |
| 880,564 |
B |
| 1% |
| 18,084,843 |
| 2,896,661 |
| 20,981,504 |
| 209,815 |
| 264,618 |
| 474,433 |
C |
| 3% |
| 10,672,845 |
| 2,984,458 |
| 13,657,303 |
| 409,719 |
| 733,441 |
| 1,143,160 |
D |
| 10% |
| 7,998,220 |
| 2,489,277 |
| 10,487,497 |
| 1,048,749 |
| 157,214 |
| 1,205,963 |
E |
| 30% |
| 2,507,129 |
| 1,934,230 |
| 4,441,359 |
| 1,332,408 |
| - |
| 1,332,408 |
F |
| 50% |
| 1,729,351 |
| 2,121,498 |
| 3,850,849 |
| 1,925,425 |
| - |
| 1,925,425 |
G |
| 70% |
| 806,133 |
| 1,069,806 |
| 1,875,939 |
| 1,313,157 |
| - |
| 1,313,157 |
H |
| 100% |
| 3,402,067 |
| 5,784,797 |
| 9,186,864 |
| 9,186,864 |
| - |
| 9,186,864 |
Total |
|
|
| 253,281,470 |
| 19,280,727 |
| 272,562,197 |
| 15,987,613 |
| 1,474,361 |
| 17,461,974 |
|
|
|
|
|
|
|
|
|
|
|
|
|
| Consolidated |
12/31/2016 | ||||||||||||||
Minimum Allowance |
|
|
|
| Loan Portfolio |
|
|
|
| Allowance | ||||
Risk Level |
| Required (%) |
| Current |
| Past Due(1) |
| Total(3) |
| Required |
| Additional(2) |
| Total |
AA |
| - |
| 97,759,855 |
| - |
| 97,759,855 |
| - |
| - |
| - |
A |
| 0.5% |
| 95,665,266 |
| - |
| 95,665,266 |
| 478,326 |
| 296,236 |
| 774,562 |
B |
| 1% |
| 17,462,836 |
| 2,328,983 |
| 19,791,819 |
| 197,918 |
| 248,732 |
| 446,650 |
C |
| 3% |
| 10,160,710 |
| 3,188,136 |
| 13,348,846 |
| 400,465 |
| 744,383 |
| 1,144,848 |
D |
| 10% |
| 8,128,531 |
| 2,873,991 |
| 11,002,522 |
| 1,100,252 |
| 577,450 |
| 1,677,702 |
E |
| 30% |
| 2,066,273 |
| 1,696,249 |
| 3,762,522 |
| 1,128,757 |
| - |
| 1,128,757 |
F |
| 50% |
| 1,877,166 |
| 1,407,104 |
| 3,284,270 |
| 1,642,135 |
| - |
| 1,642,135 |
G |
| 70% |
| 1,392,106 |
| 1,107,260 |
| 2,499,366 |
| 1,749,556 |
| - |
| 1,749,556 |
H |
| 100% |
| 3,240,086 |
| 6,528,416 |
| 9,768,502 |
| 9,768,502 |
| - |
| 9,768,502 |
Total |
|
|
| 237,752,829 |
| 19,130,139 |
| 256,882,968 |
| 16,465,911 |
| 1,866,801 |
| 18,332,712 |
(1) Includes current and past-due operations. | ||||||||||||||
(3) The total loan portfolio includes the value of a credit of R$78,075 (12/31/2016 - R$10,477) Bank and R$79,496 (12/31/2016 - R$15,288) Consolidated, related to the adjustment to fair value of loans that are being hedged, recorded in accordance with Article 5 of Circular Letter 3,624 of the Bacen of December 26, 2013 and are not included in the note of the risk levels (Note 6.b.V.a). | ||||||||||||||
f) Changes in Allowance for Loan Losses | ||||||||||||||
|
|
|
|
|
|
|
|
|
| Bank |
|
|
| Consolidated |
01/01 to | 01/01 to | 01/01 to | 01/01 to | |||||||||||
|
|
|
|
|
|
|
| 12/31/2017 |
| 12/31/2016 |
| 12/31/2017 |
| 12/31/2016 |
Opening Balance |
|
|
|
|
| 16,780,456 |
| 15,593,565 |
| 18,332,712 |
| 16,832,226 | ||
Allowances Recognized |
|
|
|
|
| 10,135,143 |
| 11,616,348 |
| 11,778,801 |
| 13,239,781 | ||
Write-offs |
|
|
|
|
|
|
| (11,048,382) |
| (10,429,457) |
| (12,649,539) |
| (11,739,295) |
Closing Balance |
|
|
|
|
|
| 15,867,217 |
| 16,780,456 |
| 17,461,974 |
| 18,332,712 | |
Current |
|
|
|
|
|
|
| 3,953,171 |
| 4,198,828 |
| 4,652,628 |
| 4,915,114 |
Long-term |
|
|
|
|
|
|
| 11,914,046 |
| 12,581,628 |
| 12,809,346 |
| 13,417,598 |
Recoveries Credits (1) |
|
|
|
|
| 2,455,251 |
| 2,645,366 |
| 2,605,275 |
| 2,834,935 | ||
(1) It is recorded as financial income in the items: lending operations and leasing operations. Includes results of assignment without recourse, related to the prior operations written off, as losses amounting the value to R$169,460 (2016 - R$162,496) Bank and R$132,483 (2016 - R$183.663) Consolidated. | ||||||||||||||
g) Renegotiated Credits | ||||||||||||||
|
|
|
|
|
|
|
|
|
|
|
|
|
|
|
Bank | Consolidated | |||||||||||||
12/31/2017 |
| 12/31/2016 |
| 12/31/2017 |
| 12/31/2016 | ||||||||
Renegotiated Credits |
|
|
|
|
| 13,155,907 |
| 13,327,164 |
| 13,655,633 |
| 13,497,388 | ||
Allowance for Loan Losses |
|
|
|
|
| (7,744,788) |
| (7,785,193) |
| (7,923,051) |
| (7,851,068) | ||
Percentage of Coverage on Renegotiated Credits |
|
|
| 58.9% |
| 58.4% |
| 58.0% |
| 58.2% | ||||
h) Loan Portfolio Concentration | ||||||||||||||
|
|
|
|
|
|
|
|
|
|
|
|
|
| Consolidated |
Loan Portfolio and Credit Guarantees(1), Securities(2) | 12/31/2017 | 12/31/2016 | ||||||||||||
and Derivatives Financial Instruments(3) |
|
|
| Risk |
| % |
| Risk |
| % | ||||
Largest Debtor |
|
|
|
|
|
|
| 4,405,863 |
| 1.2% |
| 6,446,102 |
| 1.9% |
10 Largest |
|
|
|
|
|
|
| 27,307,559 |
| 7.7% |
| 31,490,745 |
| 9.5% |
20 Largest |
|
|
|
|
|
|
| 44,180,854 |
| 12.5% |
| 45,622,490 |
| 13.8% |
50 Largest |
|
|
|
|
|
|
| 70,193,706 |
| 19.9% |
| 71,551,505 |
| 21.6% |
100 Largest |
|
|
|
|
|
|
| 91,342,646 |
| 25.9% |
| 93,949,486 |
| 28.4% |
(1) Includes portions of loans to release the business plan. | ||||||||||||||
(2) Refers to debentures, promissory notes and certificates of real estate receivables - CRI. | ||||||||||||||
(3) Refers to credit of derivatives risk. | ||||||||||||||
9. Foreign Exchange Portfolio | ||||||||||||||
|
|
|
|
|
|
|
|
|
|
|
|
|
|
|
Bank/Consolidated | ||||||||||||||
|
|
|
|
|
|
|
|
|
|
|
| 12/31/2017 |
| 12/31/2016 |
Assets | ||||||||||||||
Rights to Foreign Exchange Sold |
|
|
|
|
|
|
|
|
| 33,464,563 |
| 53,657,710 | ||
Exchange Purchased Pending Settlement |
|
|
|
|
|
|
|
|
| 26,601,130 |
| 38,480,488 | ||
Advances in Local Currency |
|
|
|
|
|
|
|
|
| (113,998) |
| (123,953) | ||
Income Receivable from Advances and Importing Financing (Note 8.a) |
|
|
|
|
| 86,481 |
| 100,205 | ||||||
Currency and Documents Term Foreign Currency |
|
|
|
|
|
|
| 81,049 |
| 31,678 | ||||
Total |
|
|
|
|
|
|
|
|
|
|
| 60,119,225 |
| 92,146,128 |
Current |
|
|
|
|
|
|
|
|
|
|
| 53,370,513 |
| 89,829,757 |
Long-term |
|
|
|
|
|
|
|
|
|
|
| 6,748,712 |
| 2,316,371 |
Liabilities | ||||||||||||||
Exchange Sold Pending Settlement |
|
|
|
|
|
|
|
|
| 40,516,382 |
| 54,316,838 | ||
Foreign Exchange Purchased |
|
|
|
|
|
|
|
|
| 19,872,398 |
| 37,538,056 | ||
Advances on Foreign Exchange Contracts (Note 8.a) |
|
|
|
|
|
|
| (5,070,912) |
| (5,101,851) | ||||
Others |
|
|
|
|
|
|
|
|
|
|
| 62 |
| 58 |
Total |
|
|
|
|
|
|
|
|
|
|
| 55,317,930 |
| 86,753,101 |
Current |
|
|
|
|
|
|
|
|
|
|
| 48,664,949 |
| 84,631,442 |
Long-term |
|
|
|
|
|
|
|
|
|
|
| 6,652,981 |
| 2,121,659 |
Memorandum Accounts | ||||||||||||||
Outstanding Import Credits – Foreign Currency |
|
|
|
|
|
|
| 1,915,492 |
| 635,055 | ||||
Confirmed Export Credits – Foreign Currency |
|
|
|
|
|
|
| 651,740 |
| 498,197 | ||||
10. Securities Trading and Brokerage | ||||||||||||||
|
|
|
|
|
|
|
|
|
| Bank |
|
|
| Consolidated |
|
|
|
|
|
|
|
| 12/31/2017 |
| 12/31/2016 |
| 12/31/2017 |
| 12/31/2016 |
Assets |
|
|
|
|
|
|
|
|
|
|
|
|
|
|
Financial Assets and Pending Settlement Transactions |
|
|
| 142,665 |
| 1,350,035 |
| 142,825 |
| 1,350,344 | ||||
Clearinghouse Transactions |
|
|
|
|
|
|
| - |
| 196 |
| 6,349 |
| 26,296 |
Debtors Pending Settlement |
|
|
|
|
| - |
| 13,296 |
| 223,318 |
| 155,106 | ||
Stock Exchanges - Guarantee Deposits |
|
|
|
|
| 41,997 |
| 14,145 |
| 41,997 |
| 14,145 | ||
Others (1) |
|
|
|
|
|
|
| 800,984 |
| 149,506 |
| 800,984 |
| 149,506 |
Total |
|
|
|
|
|
|
| 985,646 |
| 1,527,178 |
| 1,215,473 |
| 1,695,397 |
Current |
|
|
|
|
|
|
| 985,646 |
| 1,527,178 |
| 1,215,473 |
| 1,695,397 |
Liabilities | ||||||||||||||
Financial Assets and Pending Settlement Transactions |
|
|
| 73,437 |
| 902,393 |
| 95,103 |
| 920,248 | ||||
Creditors Pending Settlement |
|
|
|
|
| 4,269 |
| 4,392 |
| 183,636 |
| 137,986 | ||
Creditors for Loan of Shares |
|
|
|
|
| 1,194 |
| 61,845 |
| 321,093 |
| 168,013 | ||
Clearinghouse Transactions |
|
|
|
|
| - |
| - |
| 1,360 |
| 3,708 | ||
Records and Settlement |
|
|
|
|
| 1,971 |
| 2,594 |
| 3,105 |
| 3,928 | ||
Acquisition and Subscription of Securities Arising Release |
|
|
| - |
| - |
| - |
| 1,274 | ||||
Others |
|
|
|
|
|
|
| 2,977 |
| 2,151 |
| 2,977 |
| 2,288 |
Total |
|
|
|
|
|
|
| 83,848 |
| 973,375 |
| 607,274 |
| 1,237,445 |
Current |
|
|
|
|
|
|
| 83,848 |
| 971,989 |
| 607,274 |
| 1,236,059 |
Long-term |
|
|
|
|
|
|
| - |
| 1,386 |
| - |
| 1,386 |
|
|
|
|
|
|
|
|
|
|
|
|
|
|
|
(1) Refers to deposits used as guarantee for derivatives transactions made with customers in the counter market. | ||||||||||||||
11. Deferred Taxes | ||||||||||||||
a) Nature and Origin of Recorded Deferred Tax Assets | ||||||||||||||
|
|
|
|
|
|
|
|
|
|
|
|
|
| Bank |
|
|
|
|
|
|
|
| 12/31/2016 |
| Recognition |
| Realization |
| 12/31/2017 |
Allowance for Loan Losses |
|
|
|
|
| 11,226,152 |
| 4,124,494 |
| (4,902,062) |
| 10,448,584 | ||
Reserve for Legal and Administrative Proceedings - Civil |
|
|
| 783,276 |
| 336,398 |
| (95,727) |
| 1,023,947 | ||||
Reserve for Tax Risks and Legal Obligations |
|
|
| 1,380,786 |
| 242,498 |
| (261,543) |
| 1,361,741 | ||||
Reserve for Legal and Administrative Proceedings - Labor |
|
|
| 1,060,611 |
| 565,742 |
| (97,268) |
| 1,529,085 | ||||
Adjustment to Fair Value of Trading Securities and Derivatives(1) |
| 3,719,237 |
| 858,318 |
| (2,259,345) |
| 2,318,210 | ||||||
Adjustment to Fair Value of Available-for-sale Securities |
|
| 545,119 |
| - |
| (229,854) |
| 315,265 | |||||
Accrual for Pension Plan(2) |
|
|
|
|
| 884,543 |
| 471,464 |
| - |
| 1,356,007 | ||
Profit Sharing, Bonuses and Personnel Gratuities |
|
|
| 363,200 |
| 553,508 |
| (512,999) |
| 403,709 | ||||
Other Temporary Provisions(3) |
|
|
|
|
| 3,178,827 |
| - |
| (112,908) |
| 3,065,919 | ||
Total Tax Credits on Temporary Differences |
|
|
| 23,141,751 |
| 7,152,422 |
| (8,471,706) |
| 21,822,467 | ||||
Tax Losses and Negative Social Contribution Bases |
|
|
| - |
| 548,697 |
| - |
| 548,697 | ||||
Social Contribution Tax - Executive Act 2,158/2001 |
|
|
| 641,213 |
| - |
| (119,460) |
| 521,753 | ||||
Balance of RecordedDeferred Taxes Assets |
|
|
|
|
| 23,782,964 |
| 7,701,119 |
| (8,591,166) |
| 22,892,917 | ||
Current |
|
|
|
|
|
|
| 8,234,581 |
|
|
|
|
| 3,340,220 |
Long-term |
|
|
|
|
|
|
| 15,548,383 |
|
|
|
|
| 19,552,697 |
|
|
|
|
|
|
|
|
|
|
|
|
|
| Bank |
|
|
|
|
|
|
|
| 12/31/2015 |
| Recognition |
| Realization |
| 12/31/2016 |
Allowance for Loan Losses |
|
|
|
|
| 11,129,702 |
| 4,530,738 |
| (4,434,288) |
| 11,226,152 | ||
Reserve for Legal and Administrative Proceedings - Civil |
|
|
| 777,079 |
| 449,209 |
| (443,012) |
| 783,276 | ||||
Reserve for Tax Risks and Legal Obligations |
|
|
| 1,627,384 |
| 334,083 |
| (580,681) |
| 1,380,786 | ||||
Reserve for Legal and Administrative Proceedings - Labor |
|
|
| 875,489 |
| 1,486,262 |
| (1,301,140) |
| 1,060,611 | ||||
Adjustment to Fair Value of Trading Securities and Derivatives(1) |
| 9,913,918 |
| 2,878,328 |
| (9,073,009) |
| 3,719,237 | ||||||
Adjustment to Fair Value of Available-for-sale Securities |
|
| 2,486,103 |
| - |
| (1,940,984) |
| 545,119 | |||||
Accrual for Pension Plan(2) |
|
|
|
|
| 874,253 |
| 559,526 |
| (549,236) |
| 884,543 | ||
Profit Sharing, Bonuses and Personnel Gratuities |
|
|
| 373,329 |
| 511,440 |
| (521,569) |
| 363,200 | ||||
Other Temporary Provisions(3) |
|
|
|
|
| 2,432,406 |
| 812,785 |
| (66,364) |
| 3,178,827 | ||
Total Tax Credits on Temporary Differences |
|
|
| 30,489,663 |
| 11,562,371 |
| (18,910,283) |
| 23,141,751 | ||||
Social Contribution Tax - Executive Act 2,158/2001 |
|
|
| 641,213 |
| - |
| - |
| 641,213 | ||||
Balance of Recorded Tax Credits |
|
|
|
|
| 31,130,876 |
| 11,562,371 |
| (18,910,283) |
| 23,782,964 | ||
Current |
|
|
|
|
|
|
| 8,063,063 |
|
|
|
|
| 8,234,581 |
Long-term |
|
|
|
|
|
|
| 23,067,813 |
|
|
|
|
| 15,548,383 |
|
|
|
|
|
|
|
| Change in the |
|
|
|
|
|
|
Scope of | Consolidated | |||||||||||||
|
|
|
|
|
| 12/31/2016 |
| Consolidation (Note 15) |
| Recognition |
| Realization |
| 12/31/2017 |
Allowance for Loan Losses |
|
|
| 12,321,090 |
| (181) |
| 4,751,512 |
| (5,271,589) |
| 11,800,832 | ||
Reserve for Legal and Administrative Proceedings - Civil |
| 868,273 |
| 3,846 |
| 408,200 |
| (139,666) |
| 1,140,653 | ||||
Reserve for Tax Risks and Legal Obligations |
| 2,266,355 |
| 14,152 |
| 362,370 |
| (336,301) |
| 2,306,576 | ||||
Reserve for Legal and Administrative Proceedings - Labor |
| 1,124,992 |
| 9,201 |
| �� 597,005 |
| (116,300) |
| 1,614,898 | ||||
Adjustment to Fair Value of Trading Securities and |
| 3,745,880 |
| - |
| 858,318 |
| (2,277,571) |
| 2,326,627 | ||||
Adjustment to Fair Value of Available-for-sale Securities |
| 569,194 |
| - |
| 31,628 |
| (231,009) |
| 369,813 | ||||
Accrual for Pension Plan(2) |
|
|
| 886,535 |
| 2,605 |
| 476,998 |
| (1,886) |
| 1,364,252 | ||
Profit Sharing, Bonuses and Personnel Gratuities |
| 386,483 |
| 160 |
| 585,416 |
| (537,455) |
| 434,604 | ||||
Other Temporary Provisions(3) |
|
|
| 3,434,482 |
| 8,368 |
| 59,680 |
| (210,145) |
| 3,292,385 | ||
Total Tax Credits on Temporary Differences |
| 25,603,284 |
| 38,151 |
| 8,131,127 |
| (9,121,922) |
| 24,650,640 | ||||
Tax Loss Carryforwards |
|
|
| 508,045 |
| - |
| 603,625 |
| (138,566) |
| 973,104 | ||
Social Contribution Tax - Executive Act 2,158/2001 |
| 655,359 |
| - |
| - |
| (119,460) |
| 535,899 | ||||
Balance ofRecorded Tax Credits |
|
|
| 26,766,688 |
| 38,151 |
| 8,734,752 |
| (9,379,948) |
| 26,159,643 | ||
Current |
|
|
|
|
| 9,102,267 |
|
|
|
|
|
|
| 3,815,576 |
Long-term |
|
|
|
|
| 17,664,421 |
|
|
|
|
|
|
| 22,344,067 |
|
|
|
|
|
|
|
| Change in the |
|
|
|
|
|
|
Scope of | Consolidated | |||||||||||||
|
|
|
|
|
| 12/31/2015 |
| Consolidation (Note 15) |
| Recognition |
| Realization |
| 12/31/2016 |
Allowance for Loan Losses |
|
|
| 12,013,011 |
| - |
| 5,175,082 |
| (4,867,003) |
| 12,321,090 | ||
Reserve for Legal and Administrative Proceedings - Civil |
| 847,544 |
| - |
| 504,224 |
| (483,495) |
| 868,273 | ||||
Reserve for Tax Risks and Legal Obligations |
| 2,500,587 |
| - |
| 467,456 |
| (701,688) |
| 2,266,355 | ||||
Reserve for Legal and Administrative Proceedings - Labor |
| 909,010 |
| - |
| 1,541,362 |
| (1,325,380) |
| 1,124,992 | ||||
Adjustment to Fair Value of Trading Securities and |
| 10,006,970 |
| (1,547) |
| 2,906,024 |
| (9,165,567) |
| 3,745,880 | ||||
Adjustment to Fair Value of Available-for-sale Securities |
| 2,609,682 |
| - |
| 21,787 |
| (2,062,275) |
| 569,194 | ||||
Accrual for Pension Plan(2) |
|
|
| 874,347 |
| - |
| 561,423 |
| (549,235) |
| 886,535 | ||
Profit Sharing, Bonuses and Personnel Gratuities |
| 399,358 |
| - |
| 540,232 |
| (553,107) |
| 386,483 | ||||
Other Temporary Provisions(3) |
|
|
| 2,635,520 |
| 108,867 |
| 885,434 |
| (195,339) |
| 3,434,482 | ||
Total Tax Credits on Temporary Differences |
| 32,796,029 |
| 107,320 |
| 12,603,024 |
| (19,903,089) |
| 25,603,284 | ||||
Tax Loss Carryforwards |
|
|
| 537,037 |
| - |
| 162,362 |
| (191,354) |
| 508,045 | ||
Social Contribution Tax - Executive Act 2,158/2001 |
| 655,359 |
| - |
| - |
| - |
| 655,359 | ||||
Balance ofRecorded Tax Credits |
|
|
| 33,988,425 |
| 107,320 |
| 12,765,386 |
| (20,094,443) |
| 26,766,688 | ||
Current |
|
|
|
|
| 8,786,456 |
|
|
|
|
|
|
| 9,102,267 |
Long-term |
|
|
|
|
| 25,201,969 |
|
|
|
|
|
|
| 17,664,421 |
(1) Includes tax credits IRPJ, CSLL, PIS and Cofins. | ||||||||||||||
(2) Includes tax credits IRPJ and CSLL, adjustments on plan benefits to employees as mentioned Note 3.n. | ||||||||||||||
(3) Composed mainly by administrative provisions nature and escrow deposits. | ||||||||||||||
Banco Santander has deferred tax assets not registered in assets in the amount of R$171,228 (12/31/2016 - R$1,084,230) and R$172,108 (12/31/2016 - R$1,085,272) Consolidated. | ||||||||||||||
The accounting record of the deferred tax assets in the Santander Brasil financial statements was made at the rates applicable to the expected period of its realization and is based on the projection of future results and a technical study prepared pursuant to CMN Resolution 3,059/2002, with the amendments to the Resolution CMN 4,441/2015. | ||||||||||||||
b) Expected Realization of Recorded Tax Credits | ||||||||||||||
|
|
|
|
|
|
|
|
|
|
|
|
|
| Bank |
|
|
|
|
|
|
|
|
|
|
|
|
|
| 12/31/2017 |
Temporary Differences | Tax Loss | Total | ||||||||||||
Year |
|
|
| IRPJ |
| CSLL |
| PIS/Cofins | Carryforwards | CSLL 18% | CSLL 18% |
| Recorded | |
2018 |
|
|
| 1,363,069 |
| 833,553 |
| 73,148 |
| 548,697 |
| 521,753 |
| 3,340,220 |
2019 |
|
|
| 2,476,053 |
| 1,501,350 |
| 72,475 |
| - |
| - |
| 4,049,878 |
2020 |
|
|
| 2,836,193 |
| 1,674,932 |
| 72,475 |
| - |
| - |
| 4,583,600 |
2021 |
|
|
| 2,516,779 |
| 1,513,104 |
| 29,368 |
| - |
| - |
| 4,059,251 |
2022 |
|
|
| 2,454,622 |
| 1,464,648 |
| 29,368 |
| - |
| - |
| 3,948,638 |
2023 to 2024 |
|
|
| 1,475,276 |
| 885,166 |
| 9,596 |
| - |
| - |
| 2,370,038 |
2025 to 2026 |
|
|
| 328,398 |
| 212,894 |
| - |
| - |
| - |
| 541,292 |
Total |
|
|
| 13,450,390 |
| 8,085,647 |
| 286,430 |
| 548,697 |
| 521,753 |
| 22,892,917 |
|
|
|
|
|
|
|
|
|
|
|
|
|
| Consolidated |
|
|
|
|
|
|
|
|
|
|
|
|
|
| 12/31/2017 |
|
| Temporary Differences | Tax Loss | Total | ||||||||||
Year |
|
|
| IRPJ |
| CSLL |
| PIS/Cofins |
| Carryforwards |
| CSLL 18% |
| Recorded |
2018 |
|
|
| 1,574,852 |
| 978,477 |
| 74,645 |
| 651,703 |
| 535,899 |
| 3,815,576 |
2019 |
|
|
| 2,772,868 |
| 1,685,415 |
| 73,972 |
| 92,914 |
| - |
| 4,625,169 |
2020 |
|
|
| 3,065,015 |
| 1,817,401 |
| 73,597 |
| 77,209 |
| - |
| 5,033,222 |
2021 |
|
|
| 2,820,823 |
| 1,689,518 |
| 30,489 |
| 58,987 |
| - |
| 4,599,817 |
2022 |
|
|
| 3,087,611 |
| 1,825,579 |
| 30,489 |
| 33,205 |
| - |
| 4,976,884 |
2023 to 2024 |
|
|
| 1,547,133 |
| 929,403 |
| 9,750 |
| 51,199 |
| - |
| 2,537,485 |
2025 to 2026 |
|
|
| 343,030 |
| 220,481 |
| 92 |
| 7,887 |
| - |
| 571,490 |
Total |
|
|
| 15,211,332 |
| 9,146,274 |
| 293,034 |
| 973,104 |
| 535,899 |
| 26,159,643 |
Due to differences between accounting, tax and corporate, expected realization of tax credits should not be taken as indicative of future net income. | ||||||||||||||
c) Present Value of Tax Credits | ||||||||||||||
The present value of the tax credits recorded is R$18,489,387 (12/31/2016 - R$20,525,234) in the Bank and R$21,113,682 (12/31/2016 - R$23,117,101) in the Consolidated, calculated according to with the expectation of realizing the temporary differences, tax loss carryforwards, negative social contribution tax, Social Contribution 18% - MP 2,158/2001 and the average funding rate, projected for the corresponding periods. | ||||||||||||||
12. Other Receivables - Other | ||||||||||||||
|
|
|
|
|
|
|
|
|
| Bank |
|
|
| Consolidated |
|
|
|
|
|
|
|
| 12/31/2017 |
| 12/31/2016 |
| 12/31/2017 |
| 12/31/2016 |
Notes and Credits Receivable (Note 8.a) |
|
|
|
|
|
|
|
|
|
|
|
| ||
Credit Cards |
|
|
|
|
|
|
| 20,412,186 |
| 16,757,154 |
| 20,609,595 |
| 16,809,107 |
Receivables(1) |
|
|
|
|
|
|
| 18,938,486 |
| 16,305,283 |
| 21,903,044 |
| 18,801,078 |
Rural Product Note (CPR) |
|
|
|
|
| 33,319 |
| 42,793 |
| 33,319 |
| 42,793 | ||
Others |
|
|
|
|
|
|
| - |
| - |
| - |
| 241,758 |
Escrow Deposits for |
|
|
|
|
|
|
|
|
|
|
|
| ||
Tax Claims |
|
|
|
|
|
|
| 4,938,022 |
| 4,721,942 |
| 7,229,156 |
| 6,894,499 |
Labor Claims |
|
|
|
|
|
|
| 1,711,652 |
| 1,643,978 |
| 1,788,976 |
| 1,707,724 |
Others |
|
|
|
|
|
|
| 1,123,320 |
| 1,050,112 |
| 1,277,941 |
| 1,427,416 |
Contract Guarantees - Former Controlling Stockholders (Note 23.i) |
| 625,924 |
| 724,116 |
| 707,131 |
| 814,925 | ||||||
Recoverable Taxes |
|
|
|
|
| 3,217,676 |
| 3,684,562 |
| 4,046,543 |
| 4,332,304 | ||
Receivables - Buyer Services (Note 22 and 26.e)(2) (3) (4) |
|
|
| 1,445,102 |
| 15,258,438 |
| 15,994 |
| 15,152,967 | ||||
Reimbursable Payments |
|
|
|
|
| 202,689 |
| 146,131 |
| 225,973 |
| 167,429 | ||
Salary Advances/Others |
|
|
|
|
| 88,721 |
| 64,883 |
| 127,785 |
| 111,513 | ||
Employee Benefit Plan (Note 35) |
|
|
|
|
| 169,940 |
| 130,462 |
| 198,188 |
| 153,661 | ||
Debtors for Purchase of Assets (Note 8.a) |
|
|
|
|
| 322,378 |
| 84,066 |
| 322,378 |
| 84,310 | ||
Receivable from Affiliates (Note 26.e) |
|
|
|
|
| 20,542 |
| 853,930 |
| 1,497 |
| 862,893 | ||
Others |
|
|
|
|
|
|
| 1,277,469 |
| 958,506 |
| 2,934,724 |
| 1,624,418 |
Total |
|
|
|
|
|
|
| 54,527,426 |
| 62,426,356 |
| 61,422,244 |
| 69,228,795 |
Current |
|
|
|
|
|
|
| 36,821,967 |
| 31,949,644 |
| 40,171,446 |
| 35,349,654 |
Long-term |
|
|
|
|
|
|
| 17,705,459 |
| 30,476,712 |
| 21,250,798 |
| 33,879,141 |
(1) It consists of operations with credit assignment characteristics substantially composed of "Confirming" operations with companies subject to credit risk and analysis of loan losses by segment in accordance with the Bank risk policies. | ||||||||||||||
(2) At Banco Santander, includes the amount of R$1,431,004 (12/31/2016 - R$15,246,008) receivable related to Acquisition of its subsidiary Getnet Adquirencia e Serviços para Meios de Pagamento S.A. (Getnet S.A.). | ||||||||||||||
(3) In September 2017, Getnet S.A. implemented operational procedures to carry out financial settlements with commercial establishments (a process started with the approval to operate as a means of payment institution by the Central Bank). With this procedure, the assets and liabilities related to operations with commercial establishments were recorded by Getnet S.A. This change is aligned with the business plan of Banco Santander in Brazil and did not generate impact on its Consolidated Income Statements. | ||||||||||||||
(4) Securities reclassified to Inter-company Relations - Payments and Receivables to be settled - Payment Transactions, prospectively, as required by Circular Letter Bacen 3,828, dated June 19, 2017 (Note 7). | ||||||||||||||
13. Non-Current Assets Held for Sale | ||||||||||||||
As of December 31, 2017, it is comprised of the acquisition of shares corresponding to 94.60% of the capital stock of Real TJK Empreendimento Imobiliário SA (currently called Rojo Entretenimento SA) on April 20, 2017, Holder of the Teatro Santander, as a result of a debt restructuring. Participation in this investment is provisional. The amount recorded was R$130,713 in the Bank and Consolidated. | ||||||||||||||
14. Dependences Information and Foreign Subsidiary | ||||||||||||||
Branches: | ||||||||||||||
Cayman | ||||||||||||||
The Grand Cayman Agency is licensed under the Banks and Fiduciary Companies Act, or "Bank and Trust Companies Act," and is duly registered as a Foreign Company with the Registrar of Companies in Grand Cayman, Cayman Islands. The agency is therefore duly authorized to carry out banking business in the Cayman Islands and is currently engaged in fund raising business in the international banking and capital market to provide credit lines to Banco Santander, which are then extended to Banco Santander clients' for financing working capital and foreign trade. It also receives deposits in foreign currency from corporate clients and individuals and provides credit to Brazilian and foreign clients, primarily to support commercial operations with Brazil. | ||||||||||||||
Luxembourg | ||||||||||||||
The Bacen, on June 9, 2017, granted to Banco Santander the authorization for the incorporation of a branch in Luxembourg, with a capital equivalent to US$1 billion and the purpose of complementing the foreign trade strategy for corporate clients - large Brazilian companies and their operations abroad - and offering products and financial services through an offshore entity that is not established in a jurisdiction with favored taxation and has a greater ability to source funds. | ||||||||||||||
The incorporation of the branch is still subject to the authorization to be granted by the Luxembourg financial authority. | ||||||||||||||
Subsidiary: | ||||||||||||||
Banco Santander has a subsidiary in Spain, Santander Brasil, Establecimiento Financiero de Credito, S.A. (Santander Brasil EFC), to complement the foreign trade strategy for corporate clients - large brazilian companies and their operations abroad - and offer products and financial services through an offshore entity that is not established in a jurisdiction with favored taxation. | ||||||||||||||
The summarized financial position of dependency and foreign subsidiary, converted at the exchange rate prevailing at balance sheet date in the financial statements include: | ||||||||||||||
|
|
|
|
|
|
|
|
|
|
|
|
|
|
|
Grand Cayman Branch(3) | Santander Brasil EFC (3) | |||||||||||||
12/31/2017 |
| 12/31/2016 |
| 12/31/2017 |
| 12/31/2016 | ||||||||
Assets |
|
|
|
|
|
|
| 90,036,549 |
| 81,192,782 |
| 3,144,220 |
| 2,810,242 |
Current and Long-term Assets |
|
|
|
|
| 90,036,549 |
| 81,192,780 |
| 3,144,220 |
| 2,810,164 | ||
Cash |
|
|
|
|
|
|
| 3,590,430 |
| 544,468 |
| 67,989 |
| 182,366 |
Interbank Investments |
|
|
|
|
| 14,922,470 |
| 13,467,647 |
| 1,111,404 |
| 1,323,784 | ||
Securities and Derivatives Financial Instruments |
|
|
| 35,691,013 |
| 34,721,940 |
| 97,652 |
| 4,606 | ||||
Lending Operations(1) |
|
|
|
|
| 18,642,828 |
| 22,770,598 |
| 1,853,191 |
| 1,094,243 | ||
Foreign Exchange Portfolio |
|
|
|
|
| 15,461,077 |
| 8,466,560 |
| - |
| - | ||
Others |
|
|
|
|
|
|
| 1,728,731 |
| 1,221,567 |
| 13,984 |
| 205,165 |
Permanent Assets |
|
|
|
|
| - |
| 2 |
| - |
| 78 | ||
Liabilities |
|
|
|
|
|
|
| 90,036,549 |
| 81,192,782 |
| 3,144,220 |
| 2,810,242 |
Current and Long-term Liabilities |
|
|
|
|
| 49,732,979 |
| 44,495,525 |
| 95,754 |
| 240,053 | ||
Deposits and Money Market Funding |
|
|
|
|
| 10,272,902 |
| 5,026,564 |
| 51,421 |
| - | ||
Funds from Acceptance and Issuance of Securities |
|
|
| 1,911,963 |
| 7,434,693 |
| - |
| - | ||||
Borrowings(2) |
|
|
|
|
|
|
| 19,975,625 |
| 21,081,194 |
| - |
| - |
Foreign Exchange Portfolio |
|
|
|
|
| 15,450,218 |
| 8,351,718 |
| - |
| - | ||
Others |
|
|
|
|
|
|
| 2,122,271 |
| 2,601,356 |
| 44,333 |
| 240,053 |
Deferred Income |
|
|
|
|
| 21 |
| 107 |
| 14,878 |
| 17,563 | ||
Stockholders' Equity |
|
|
|
|
| 40,303,549 |
| 36,697,150 |
| 3,033,588 |
| 2,552,626 | ||
Exercise Income |
|
|
|
|
|
|
| 2,469,434 |
| 874,548 |
| 71,401 |
| (142,398) |
(1) Refers mainly to export financing operations. | ||||||||||||||
(2) Borrowings abroad regarding financing lines to exports and imports and other lines of credit. | ||||||||||||||
(3) The functional currency is Real (Note 3.b) | ||||||||||||||
(Free Translation into English from the Original Previously Issued in Portuguese) | |
BANCO SANTANDER (BRASIL) S.A. AND SUBSIDIARIES | |
In thousands of Brazilian Real - R$, unless otherwise stated | |
15. Investments in Affiliates and Subsidiaries |
|
|
|
|
|
|
|
|
|
|
|
|
|
|
| ||||
|
|
|
|
|
|
|
|
|
|
|
|
|
|
|
|
|
|
|
|
|
|
|
|
|
|
|
|
|
|
|
|
|
|
|
|
|
|
|
|
|
|
|
|
|
|
|
|
|
|
|
|
|
|
|
|
|
|
| 12/31/2017 |
|
|
|
|
|
|
|
|
|
|
| Quantity of Shares or Quotas Owned |
|
|
|
| ||||
|
|
|
|
|
|
|
|
|
|
| Directly or Indirectly (in Thousands) |
|
|
| Direct | ||||
|
|
|
|
|
|
|
|
|
|
|
|
| Common Shares |
| Preferred |
| Direct |
| and Indirect |
Investments |
|
|
|
|
|
|
|
| Activity |
|
|
| and Quotas |
| Shares |
| Participation |
| Participation |
Controlled by Banco Santander |
|
|
|
|
|
|
|
|
|
|
|
|
|
|
|
|
| ||
Santander Leasing |
|
|
|
|
|
|
|
| Leasing |
|
|
| 11,043,798 |
| - |
| 78.57% |
| 99.99% |
Santander Brasil Administradora de Consórcio Ltda. (Santander Brasil Consórcio) |
|
| Buying Club |
|
|
| 95,349 |
| - |
| 100.00% |
| 100.00% | ||||||
Banco Bandepe S.A. (Banco Bandepe) |
|
|
|
|
| Bank |
|
|
| 2,184 |
| - |
| 100.00% |
| 100.00% | |||
Banco RCI Brasil S.A. |
|
| Bank |
|
|
| 81 |
| 81 |
| 39.89% |
| 39.89% | ||||||
Aymoré Crédito, Financiamento e Investimento S.A. (Aymoré CFI) |
|
|
| Financial |
|
|
| 287,706,670 |
| - |
| 100.00% |
| 100.00% | |||||
Santander Corretora de Câmbio e Valores Mobiliários S.A. (Santander CCVM) |
|
|
|
|
|
|
|
| Broker |
|
|
| 14,067,673 |
| 14,067,673 |
| 99.99% |
| 100.00% |
Santander Corretora de Seguros, Investimentos e Serviços S.A. (Santander Corretora |
|
| Other Activities |
|
|
| 4,687 |
| - |
| 100.00% |
| 100.00% | ||||||
Getnet S.A. |
|
|
|
|
|
|
|
| Payment Institution |
|
|
| 61,565 |
| - |
| 88.50% |
| 88.50% |
Sancap Investimentos e Participações S.A. (Sancap) |
|
|
|
| Holding |
|
|
| 12,728,211 |
| - |
| 100.00% |
| 100.00% | ||||
Santander Brasil EFC |
|
|
|
|
|
| Financial |
|
|
| 75 |
| - |
| 100.00% |
| 100.00% | ||
Atual Securitizadora (18) |
|
|
|
|
|
| Securitization |
|
|
| 120,000 |
| - |
| 100.00% |
| 100.00% | ||
Santander Holding Imobiliária S.A. (Current Corporate Name of Webcasas S.A.)(22) (24) |
|
| Holding |
|
|
| 24,500 |
| - |
| 100.00% |
| 100.00% | ||||||
Controlled by Aymoré CFI |
|
|
|
|
|
|
|
|
|
|
|
|
|
|
|
|
| ||
Super Pagamentos e Administração de Meios Eletrônicos S.A. (Super Pagamentos) (11) (14) |
|
| Payment Institution |
|
|
| 90,724 |
| - |
| - |
| 100.00% | ||||||
Banco Olé Bonsucesso Consignado S.A. (Olé Consignado)(28) |
|
| Bank |
|
|
| 261,949 |
| - |
| - |
| 60.00% | ||||||
Banco PSA |
|
|
|
|
|
|
|
| Bank |
|
|
| 105 |
| - |
| - |
| 50.00% |
Controlled by Santander Leasing |
|
|
|
|
|
|
|
|
|
|
|
|
|
|
|
|
| ||
Santander Finance Arrendamento Mercantil S.A. (Santander Finance Arrendamento Mercantil) |
| Leasing |
|
|
| 182 |
| - |
| - |
| 100.00% | |||||||
Controlled by Sancap |
|
|
|
|
|
|
|
|
|
|
|
|
|
|
|
|
| ||
Santander Capitalização S.A. (Santander Capitalização) |
|
|
|
| Capitalization |
|
|
| 64,615 |
| - |
| - |
| 100.00% | ||||
Evidence |
|
|
|
|
|
|
|
| Private Pension |
|
|
| 12,591,172 |
| - |
| - |
| 100.00% |
|
|
|
|
|
|
|
|
|
|
|
|
|
|
|
|
|
|
|
|
|
| 12/31/2017 |
|
|
|
|
|
|
|
|
|
|
|
|
|
| Quantity of Shares or Quotas Owned |
|
|
|
| ||||
|
|
|
|
|
|
|
|
|
|
|
|
|
| Directly or Indirectly (in Thousands) |
|
|
| Direct | ||||
|
|
|
|
|
|
|
|
|
|
|
|
|
|
|
| Common Shares |
| Preferred |
| Direct |
| and Indirect |
Investments |
|
|
|
|
|
|
|
|
|
|
| Activity |
|
|
| and Quotas |
| Shares |
| Participation |
| Participation |
Controlled by Atual Securitizadora (18) (23) |
|
|
|
|
|
|
|
|
|
|
|
|
|
|
|
|
|
| ||||
Ipanema Empreendimentos e Participações(23) |
|
|
|
|
|
|
| Collection and Recover of Credit Management |
|
|
| 140 |
| - |
| - |
| 70.00% | ||||
Controlled by Ipanema Empreendimentos e Participações(23) |
|
|
|
|
|
|
|
|
|
|
|
|
|
|
|
| ||||||
Gestora de Investimentos Ipanema(23) |
|
|
|
|
|
|
|
|
| Resources Management |
|
|
| 11 |
| - |
| - |
| 100.00% | ||
Jointly Controlled Companies by Banco Santander(8) |
|
|
|
|
|
|
|
|
|
|
|
|
|
|
|
|
|
| ||||
Cibrasec Companhia Brasileira de Securitização (Cibrasec)(1) |
|
|
|
|
| Securitization |
|
|
| 4 |
| - |
| 9.72% |
| 9.72% | ||||||
Norchem Participações e Consultoria S.A. (Norchem Participações) |
|
|
|
|
| Other Activities |
|
|
| 950 |
| - |
| 50.00% |
| 50.00% | ||||||
Estruturadora Brasileira de Projetos S.A. - EBP (EBP)(1) (29) |
|
|
|
|
|
|
|
|
|
|
| Other Activities |
|
|
| 3,859 |
| 2,953 |
| 11.11% |
| 11.11% |
Gestora de Inteligência de Crédito S.A. (Gestora de Crédito) (12) (21) |
|
|
|
|
|
|
|
|
|
|
| Credit Bureau |
|
|
| 3,560 |
| 3,560 |
| 20.00% |
| 20.00% |
Campo Grande Empreendimentos |
|
|
|
|
|
|
|
|
|
|
| Other Activities |
|
|
| 255 |
| - |
| 25.32% |
| 25.32% |
Jointly Controlled Companies by Santander Corretora de Seguros (Current |
|
|
|
|
|
|
|
|
|
|
|
|
|
| ||||||||
Webmotors S.A.(2) (5) |
|
|
|
|
|
|
|
|
|
|
| Other Activities |
|
|
| 366,182,676 |
| - |
| - |
| 70.00% |
TecBan - Tecnologia Bancária S.A. (TecBan) |
|
|
|
|
|
|
| Other Activities |
|
|
| 743,944 |
| - |
| - |
| 19.81% | ||||
PSA Corretora de Seguros e Serviços Ltda. (PSA Corretora de Seguros)(4) (27) |
|
|
| Insurance Broker |
|
|
| 450 |
| - |
| - |
| 50.00% | ||||||||
Controlled by Getnet S.A |
|
|
|
|
|
|
|
|
|
|
|
|
|
| ||||||||
Auttar HUT Processamento de Dados Ltda. (Auttar HUT) |
|
|
|
|
|
|
| Other Activities |
|
|
| 3,865 |
| - |
| - |
| 100.00% | ||||
Integry Tecnologia e Serviços A.H.U Ltda. (Integry Tecnologia) (9) |
|
|
|
|
|
|
|
|
|
|
| Other Activities |
|
|
| 76,276 |
| - |
| - |
| 100.00% |
Toque Fale Serviços de Telemarketing Ltda. (Toque Fale) |
|
|
|
|
|
|
|
|
|
|
| Other Activities |
|
|
| 6,050 |
| - |
| - |
| 100.00% |
Controlled by TecBan |
|
|
|
|
|
|
|
|
|
|
|
|
|
|
|
|
|
|
|
| ||
Tbnet Comércio Locação e Administração Ltda. (Tbnet) (6) |
|
|
|
|
|
| Other Activities |
|
|
| 220,002 |
| - |
| - |
| 100.00% | |||||
Controlled by Tebnet |
|
|
|
|
|
|
|
|
|
|
|
|
|
|
|
|
|
|
|
| ||
Tbforte Segurança e Transporte de Valores Ltda. (Tbforte) (7) |
|
|
|
|
| Other Activities |
|
|
| 212,855 |
| - |
| - |
| 100.00% | ||||||
Controlled by Olé Consignado(28) |
|
|
|
|
|
|
|
|
|
|
|
|
|
| ||||||||
BPV Promotora de Vendas e Cobrança Ltda. |
|
|
|
|
|
|
| Other Activities |
|
|
| 6,950 |
| - |
| - |
| 100.00% | ||||
Olé Tecnologia Ltda. (Current Corporate Name of Bonsucesso Tecnologia Ltda.)(13) |
| Other Activities |
|
|
| 450 |
| - |
| - |
| 100.00% | ||||||||||
Affiliate |
|
|
|
|
|
|
|
|
|
|
|
|
|
|
|
|
|
|
|
|
|
|
Norchem Holdings e Negócios S.A. (Norchem Holdings) |
|
|
|
|
|
|
| Other Activities |
|
|
| 1,679 |
| - |
| 21.75% |
| 21.75% | ||||
|
|
|
|
|
|
|
|
|
|
|
|
|
|
|
|
|
|
|
|
|
|
|
|
|
|
|
|
|
|
|
|
|
|
| Adjusted |
|
|
|
|
|
|
|
|
|
|
|
|
|
|
|
|
|
|
|
|
|
| Stockholders' | Net Income (Loss) |
|
|
|
|
|
|
|
| |
|
|
|
|
|
|
|
|
|
|
|
| Equity |
| Adjusted |
| Investments Value |
|
|
| Equity Accounting Results | ||
|
|
|
|
|
|
|
|
|
|
|
|
|
| 01/01 to |
|
|
|
|
| 01/01 to |
| 01/01 to |
|
|
|
|
|
|
|
|
|
|
|
| 12/31/2017 |
| 12/31/2017 |
| 12/31/2017 |
| 12/31/2016 |
| 12/31/2017 |
| 12/31/2016 |
Controlled by Banco Santander |
|
|
|
|
|
|
|
|
|
|
|
|
|
|
|
|
|
|
|
| ||
Santander Leasing |
|
|
|
|
|
|
|
|
|
|
| 5,825,572 |
| 479,383 |
| 4,577,432 |
| 4,478,155 |
| 376,715 |
| 414,170 |
Santander Brasil Consórcio |
|
|
|
|
|
|
|
|
| 234,316 |
| 97,701 |
| 234,316 |
| 136,615 |
| 97,701 |
| 30,799 | ||
Banco Bandepe |
|
|
|
|
|
|
|
|
|
|
| 3,192,478 |
| 236,054 |
| 3,192,478 |
| 3,086,221 |
| 236,054 |
| 260,182 |
Banco RCI Brasil S.A. |
|
|
|
|
|
|
|
|
|
| 1,080,271 |
| 186,156 |
| 430,930 |
| 529,562 |
| 74,259 |
| 31,602 | |
Aymoré CFI |
|
|
|
|
|
|
|
|
|
|
| 1,546,130 |
| 582,704 |
| 1,546,130 |
| 1,364,514 |
| 582,704 |
| 52,538 |
Santander CCVM |
|
|
|
|
|
|
|
|
|
|
| 564,676 |
| 7,049 |
| 564,675 |
| 557,736 |
| 7,049 |
| 106,085 |
Santander Microcrédito Assessoria Financeira S.A (Santander Microcrédito)(16) |
|
|
|
|
|
| - |
| - |
| - |
| 17,317 |
| - |
| (17) | |||||
Santander Brasil Advisory Services S.A. (Santander Brasil Advisory)(17) |
|
|
|
|
|
| - |
| - |
| - |
| 14,698 |
| - |
| 953 | |||||
Santander Corretora de Seguros (Current Corporate Name of Santander Participações S.A.) (10) (19) (20) |
|
|
|
|
|
| 2,187,349 |
| 251,120 |
| 2,192,359 |
| 1,542,410 |
| 163,030 |
| 157,545 | |||||
Getnet S.A. |
|
|
|
|
|
|
|
|
|
|
| 1,792,213 |
| 424,712 |
| 1,586,109 |
| 1,299,508 |
| 375,870 |
| 250,069 |
Sancap |
|
|
|
|
|
|
|
|
|
|
| 394,373 |
| 114,064 |
| 394,454 |
| 362,233 |
| 114,146 |
| 102,176 |
Santander S.A. Serviços Técnicos, Administrativos e de Corretagem de Seguros (Santander Serviços)(22) (25) (26) |
|
|
|
|
|
| - |
| - |
| - |
| 478,039 |
| - |
| 146,968 | |||||
Santander Brasil EFC |
|
|
|
|
|
|
|
|
|
| 3,033,588 |
| 71,401 |
| 3,033,588 |
| 2,552,626 |
| 71,401 |
| (142,398) | |
Atual Securitizadora (18) |
|
|
|
|
|
|
|
|
| 98,638 |
| (21,362) |
| 98,638 |
| - |
| (21,362) |
| - | ||
Santander Holding Imobiliária S.A. (Current Corporate Name of Webcasas S.A.)(22) (24) |
|
|
|
|
|
|
|
|
|
|
| 23,885 |
| 1,228 |
| 23,885 |
| - |
| 253 |
| - |
Mantiq Investimentos Ltda. (Mantiq) (3) |
|
|
|
|
|
|
|
|
| - |
| - |
| - |
| - |
| - |
| 3,276 | ||
Controlled by Aymoré CFI |
|
|
|
|
|
|
|
|
|
|
|
|
|
|
|
|
|
|
|
| ||
Super Pagamentos (11) (14) |
|
|
|
|
|
|
|
|
| 36,369 |
| (3,283) |
| - |
| - |
| - |
| - | ||
Olé Consignado (28) |
|
|
|
|
|
|
|
|
|
|
| 878,077 |
| 133,216 |
| - |
| - |
| - |
| - |
Banco PSA |
|
|
|
|
|
|
|
|
|
|
| 294,591 |
| 46,059 |
| - |
| - |
| - |
| - |
Controlled by Santander Leasing |
|
|
|
|
|
|
|
|
|
|
|
|
|
|
|
|
|
|
|
|
|
|
Santander Finance Arrendamento Mercantil |
|
|
|
|
|
|
| 389,252 |
| 23,205 |
| - |
| - |
| - |
| - | ||||
Controlled by Sancap |
|
|
|
|
|
|
|
|
|
|
|
|
|
|
|
|
|
|
|
| ||
Santander Capitalização |
|
|
|
|
|
|
|
|
| 86,312 |
| 107,235 |
| - |
| - |
| - |
| - | ||
Evidence |
|
|
|
|
|
|
|
|
|
|
| 282,798 |
| 12,123 |
| - |
| - |
| - |
| - |
|
|
|
|
|
|
|
|
|
|
|
|
|
|
|
|
|
|
|
|
|
|
|
|
|
|
|
|
|
|
|
|
|
|
| Adjusted |
|
|
|
|
|
|
|
|
|
|
|
|
|
|
|
|
|
|
|
|
|
| Stockholders' | Net Income (Loss) |
|
|
|
|
|
|
|
| |
|
|
|
|
|
|
|
|
|
|
|
| Equity |
| Adjusted |
| Investments Value |
|
|
| Equity Accounting Results | ||
|
|
|
|
|
|
|
|
|
|
|
|
|
| 01/01 to |
|
|
|
|
| 01/01 to |
| 01/01 to |
|
|
|
|
|
|
|
|
|
|
|
| 12/31/2017 |
| 12/31/2017 |
| 12/31/2017 |
| 12/31/2016 |
| 12/31/2017 |
| 12/31/2016 |
Controlled by Atual Securitizadora(18) (23) |
|
|
|
|
|
|
|
|
|
|
|
|
|
|
|
|
|
| ||||
Ipanema Empreendimentos e Participações(23) |
|
|
|
|
|
|
| 773 |
| (49) |
| - |
| - |
| - |
| - | ||||
Controlled by Ipanema Empreendimentos e Participações(23) |
|
|
|
|
|
|
|
|
|
|
|
|
|
| ||||||||
Gestora de Investimentos Ipanema(23) |
|
|
| 704 |
| 317 |
| - |
| - |
| - |
| - | ||||||||
Jointly Controlled Companies by Banco Santander(8) |
|
|
|
|
|
|
|
|
|
| ||||||||||||
Cibrasec(1) |
|
|
|
|
|
|
|
|
|
|
| 76,494 |
| 7,025 |
| 7,438 |
| 7,432 |
| 1,000 |
| 892 |
Norchem Participações |
|
|
|
|
|
|
|
|
| 51,100 |
| 2,666 |
| 25,550 |
| 26,302 |
| 1,333 |
| 2,637 | ||
EBP (1) (29) |
|
|
|
|
|
|
| 42,363 |
| (14,038) |
| 4,707 |
| 6,266 |
| (1,560) |
| (429) | ||||
Gestora de Crédito(12) (21) |
|
|
|
|
|
|
| 147,563 |
| (23,212) |
| 29,512 |
| - |
| (4,642) |
| - | ||||
Campo Grande Empreendimentos |
|
|
|
|
| - |
| - |
| 255 |
| 255 |
| - |
| - | ||||||
Others |
|
|
|
|
|
|
|
|
|
|
| - |
| - |
| - |
| (30) |
| 1,824 |
| - |
Controlled by Getnet S.A. |
|
|
|
|
|
|
|
|
|
|
|
|
|
|
|
|
|
|
|
| ||
Auttar HUT |
|
|
|
|
|
|
|
|
|
|
| 14,999 |
| 2,569 |
| - |
| - |
| - |
| - |
Integry Tecnologia(9) |
|
|
|
|
|
|
|
|
|
|
| 72,852 |
| (1,824) |
| - |
| - |
| - |
| - |
Toque Fale |
|
|
|
|
|
|
|
|
|
|
| 3,713 |
| 1,511 |
| - |
| - |
| - |
| - |
Controlled by Olé Consignado(28) |
|
|
|
|
|
|
|
|
|
|
|
|
|
|
|
|
|
| ||||
BPV Promotora de Vendas e Cobrança Ltda. |
|
|
|
|
|
|
| 12,773 |
| 5,823 |
| - |
| - |
| - |
| - | ||||
Olé Tecnologia Ltda. (Current Corporate Name of Bonsucesso Tecnologia Ltda.)(13) |
| 3,267 |
| 2,817 |
| - |
| - |
| - |
| - | ||||||||||
|
|
|
|
|
|
|
|
|
|
|
|
|
|
|
|
|
|
|
|
|
|
|
|
|
|
|
|
|
|
|
|
|
|
|
|
|
|
|
|
|
|
|
|
|
|
|
|
|
|
|
|
|
|
|
|
|
| Adjusted |
|
|
|
|
|
|
|
|
|
|
|
|
|
|
|
|
|
|
|
|
|
| Stockholders' | Net Income (Loss) |
|
|
|
|
|
|
|
| |
|
|
|
|
|
|
|
|
|
|
|
| Equity |
| Adjusted |
| Investments Value |
|
|
| Equity Accounting Results | ||
|
|
|
|
|
|
|
|
|
|
|
|
|
| 01/01 to |
|
|
|
|
| 01/01 to |
| 01/01 to |
|
|
|
|
|
|
|
|
|
|
|
| 12/31/2017 |
| 12/31/2017 |
| 12/31/2017 |
| 12/31/2016 |
| 12/31/2017 |
| 12/31/2016 |
Affiliate |
|
|
|
|
|
|
|
|
|
|
|
|
|
|
|
|
|
|
|
|
|
|
Norchem Holdings |
|
|
|
|
|
|
|
|
|
|
| 95,909 |
| 5,597 |
| 20,860 |
| 20,981 |
| 1,217 |
| 1,477 |
Total Bank |
|
|
|
|
|
|
|
|
|
|
|
|
|
|
| 17,963,316 |
| 16,480,840 |
| 2,076,992 |
| 1,418,525 |
Jointly Controlled Companies by Banco Santander(8) |
|
|
|
|
|
|
|
|
|
|
|
|
|
|
|
|
|
| ||||
Cibrasec(1) |
|
|
|
|
|
|
|
|
|
|
| 76,494 |
| 7,025 |
| 7,438 |
| - |
| 1,000 |
| - |
Norchem Participações |
|
|
|
|
|
|
|
|
| 51,100 |
| 2,666 |
| 25,550 |
| - |
| 1,333 |
| - | ||
EBP (1) (29) |
|
|
|
|
|
|
|
|
|
|
| 42,363 |
| (14,038) |
| 4,707 |
| - |
| (1,560) |
| - |
Gestora de Crédito(12) (21) |
|
|
|
|
|
|
|
|
|
|
| 147,563 |
| (23,212) |
| 29,512 |
| - |
| (4,642) |
| - |
Campo Grande Empreendimentos |
|
|
|
|
|
|
|
|
|
|
| - |
| - |
| 255 |
| - |
| - |
| - |
Jointly Controlled Companies Directly or Indirectly by Santander Corretora de Seguros (Current |
|
|
|
|
|
|
|
|
|
|
| |||||||||||
Webmotors S.A.(2) (5) |
|
|
|
|
|
|
|
|
| 139,322 |
| 29,055 |
| 87,867 |
| - |
| 20,338 |
| - | ||
TecBan |
|
|
|
|
|
|
|
|
|
|
| 447,180 |
| 42,986 |
| 88,587 |
| - |
| 8,307 |
| - |
PSA Corretora de Seguros(4) (27) |
|
|
|
|
|
|
|
|
| 2,982 |
| 1,665 |
| 1,491 |
| - |
| 833 |
| - | ||
Controlled by TecBan |
|
|
|
|
|
|
|
|
|
|
|
|
|
|
|
|
|
|
|
|
|
|
Tbnet(6) |
|
|
|
|
|
|
|
|
|
|
| 100,773 |
| (40,908) |
| - |
| - |
| - |
| - |
Controlled by Tebnet |
|
|
|
|
|
|
|
|
|
|
|
|
|
|
|
|
|
|
|
|
|
|
Tbforte(7) |
|
|
|
|
|
|
|
|
|
|
| 95,397 |
| (41,404) |
| - |
| - |
| - |
| - |
Affiliate |
|
|
|
|
|
|
|
|
|
|
|
|
|
|
|
|
|
|
|
|
|
|
Norchem Holdings |
|
|
|
|
|
|
|
|
|
|
| 95,909 |
| 5,597 |
| 20,860 |
| 20,981 |
| 1,217 |
| 1,477 |
Others(30) |
|
|
|
|
|
|
|
|
|
|
|
|
|
|
| 83,786 |
| 137,567 |
| (1,547) |
| - |
Total Consolidated |
|
|
|
|
|
|
|
|
|
|
|
|
|
|
| 350,053 |
| 158,548 |
| 25,279 |
| 1,477 |
|
|
|
|
|
|
|
|
|
|
|
|
|
|
|
|
|
|
|
|
|
|
|
(1) Although the participations was less than 20%, the Bank exercises control over the entity together with other major stockholders' through a stockholders' agreement where no business decision can be taken by a single stockholder. | ||||||||||||||||||||||
|
|
|
|
|
|
|
|
|
|
|
|
|
|
|
|
|
|
|
|
|
|
|
(2) Although participation exceeds 50%, in accordance with the stockholder' agreement, the control is shared by Santander Corretora de Seguros (Current Corporate Name of Santander Participações S.A.) and Carsales.com. Investments PTY LTD (Carsales). | ||||||||||||||||||||||
|
|
|
|
|
|
|
|
|
|
|
|
|
|
|
|
|
|
|
|
|
|
|
(3) Investment sold in July 14, 2016. | ||||||||||||||||||||||
|
|
|
|
|
|
|
|
|
|
|
|
|
|
|
|
|
|
|
|
|
|
|
(4) Pursuant to the stockholder' agreement, the control is shared by Santander Corretora de Seguros (Current Corporate Name of Santander Participações S.A.) and PSA Services LTD. | ||||||||||||||||||||||
|
|
|
|
|
|
|
|
|
|
|
|
|
|
|
|
|
|
|
|
|
|
|
(5) On December 30, 2016, Virtual Motors Páginas Eletrônicas Ltda. - ME (Virtual Motors) was merged into Webmotors S.A (Note 37.e). | ||||||||||||||||||||||
|
|
|
|
|
|
|
|
|
|
|
|
|
|
|
|
|
|
|
|
|
|
|
(6) At the Meetings of the shareholders held in the period from January to December 2017, capital increase were approved in the amount of R$77,907, from R$142,095 to R$220,002, with the issuance of 77,907 thousand new shares, in the par value of R$1.00 (one Real) each, whose increase were paid in the currency of the country on the same date as the approval by the partners. | ||||||||||||||||||||||
|
|
|
|
|
|
|
|
|
|
|
|
|
|
|
|
|
|
|
|
|
|
|
(7) At the Meetings of the shareholders held between January to December 2017, capital increase were approved in the amount of R$76,589, from R$136,266 to R$212,855, with the issue of 76,589 new shares, in the par value of R$1.00 (one Real) each, whose increase were paid in the currency of the country on the same date as the approval of the partners. | ||||||||||||||||||||||
|
|
|
|
|
|
|
|
|
|
|
|
|
|
|
|
|
|
|
|
|
|
|
(8) Effective January 1, 2017, CMN Resolution 4,517 of August 24, 2016, which establishes that equity interests in jointly controlled companies must be accounted for using the equity method (Note 2) . | ||||||||||||||||||||||
|
|
|
|
|
|
|
|
|
|
|
|
|
|
|
|
|
|
|
|
|
|
|
(9) On March 9, 2017, under a contractual amendment, Management resolved by mutual agreement to increase Integry Tecnologia's capital stock in the amount of R$75,000, from the current R$1,276 to R$76,276, through the distribution of 75,000,000 (seventy and five million) of new quotas with a par value of R$1.00 each. | ||||||||||||||||||||||
|
|
|
|
|
|
|
|
|
|
|
|
|
|
|
|
|
|
|
|
|
|
|
(10) At the Extraordinary General Meeting (EGM) held on May 8, 2017, it was approved the change of company name from Santander Participações S.A. to Santander Corretora de Seguros, Investimentos e Serviços S.A. At the same EGM, it was approved the company´s purpose change. | ||||||||||||||||||||||
|
|
|
|
|
|
|
|
|
|
|
|
|
|
|
|
|
|
|
|
|
|
|
(11) In May, 2017, it was approved by Bacen the authorization process for the Company operates a means of payment institution. | ||||||||||||||||||||||
|
|
|
|
|
|
|
|
|
|
|
|
|
|
|
|
|
|
|
|
|
|
|
(12) Company incorporated in April 2017 and it is in the pre-operational phase. Pursuant to the shareholders' agreement, the control is shared between shareholders who hold 20% of its share capital each (Note 37.c). At the EGM held on July 6, 2017, the capital increase of Gestora de Crédito was approved in the total amount of R$65,822, so that the share capital increased from R$1 to R$65,823, through the issuance of 6,582,200 (six million, five hundred eighty-two thousand two hundred) new shares, of which 3,291,100 (three million, two hundred ninety-one thousand, one hundred), 1,316,440 (one million, three hundred sixteen thousand, four hundred and forty) preffered shares Class A and 1,316,440 (one million, three hundred sixteen thousand, four hundred and forty) preffered shares Class B and 658,220 (six hundred fifty eight thousand, two hundred, twenty) class C preffered shares, with no par value, at the issue price of R$10.00, corresponding to the equity value of the shares. The shares issued in the capital increase were fully subscribed at the same date by the shareholders in the proportion of 20% of its share capital each. | ||||||||||||||||||||||
|
|
|
|
|
|
|
|
|
|
|
|
|
|
|
|
|
|
|
|
|
|
|
(13) According to the contractual change on June 13, 2017, the shareholders agreed to change company´s name from Bonsucesso Tecnologia Ltda. to Olé Tecnologia Ltda. | ||||||||||||||||||||||
|
|
|
|
|
|
|
|
|
|
|
|
|
|
|
|
|
|
|
|
|
|
|
(14) At the ESM held on July 21, 2017, the capital increase of Super Payments in the amount of R$20,000 was approved, increasing the capital stock from R$49,451 to R$69,451 through the issuance of 50,724,086 (fifty million, seven hundred and twenty-four thousand and eighty-six) new nominative common shares, with no par value, in all identical to those previously existing, at the approximate issue price of R$394.29 per thousand shares at the book value of Super Payments on June 30, 2017. The shares issued were fully subscribed and paid-in on the same date by Aymoré CFI. | ||||||||||||||||||||||
|
|
|
|
|
|
|
|
|
|
|
|
|
|
|
|
|
|
|
|
|
|
|
(15) The investment held by Santander Corretora de Seguros in BW Guirapá I S.A. was written off in December 2017 (Note 37.e). | ||||||||||||||||||||||
|
|
|
|
|
|
|
|
|
|
|
|
|
|
|
|
|
|
|
|
|
|
|
(16) On August 31, 2017, Santander Microcrédito was merged into Santander Corretora de Seguros (Current Corporate Name of Santander Participações S.A.) (Note 37.e). | ||||||||||||||||||||||
|
|
|
|
|
|
|
|
|
|
|
|
|
|
|
|
|
|
|
|
|
|
|
(17) On September 29, 2017, Santander Brasil Advisory was merged into Santander Corretora de Seguros (Current Corporate Name of Santander Participações S.A.)(Note 37.e). | ||||||||||||||||||||||
|
|
|
|
|
|
|
|
|
|
|
|
|
|
|
|
|
|
|
|
|
|
|
(18) At the ESM held on September 11, 2017, a capital increase of R$120,000 was approved, through the issuance of 120,000,000 (one hundred and twenty million) new common shares, nominative and without par value, the capital stock of R$100.00 (one hundred reais) to R$120,000. The shares issued as a result of the capital increase were fully subscribed by the shareholder Banco Santander. | ||||||||||||||||||||||
|
|
|
|
|
|
|
|
|
|
|
|
|
|
|
|
|
|
|
|
|
|
|
(19) At the ESM held on August 31, 2017, a capital increase of R$17,652 was approved, in view of the version of the net assets of Santander Microcrédito (Note 37.e), based on its book value at the date - based on June 30, 2017, entirely destined to the share capital account of Santander Corretora de Seguros, transferring the capital stock from the current R$1,700,000 to R$1,717,652, through the issuance of a total of 51,776 (fifty-one thousand, seven hundred and seventy-six) registered common shares with no par value that were subscribed and paid by Banco Santander on that date, the issue price was set at R$340.93 per share, calculated based on their respective book values, on the base date of June 30, 2017. | ||||||||||||||||||||||
|
|
|
|
|
|
|
|
|
|
|
|
|
|
|
|
|
|
|
|
|
|
|
(20) At the ESM held on September 29, 2017, Santander Corretora de Seguros' shareholders' equity increase was approved in the amount of R$12,900, based on the net assets of Santander Brasil Advisory calculated based on its book value at base date of August 31, 2017 (Note 37.e), of which the amount of R$8,463 was allocated to the share capital account of Santander Corretora de Seguros, increasing the current capital from R$1,717,652 to R$1,726,115, by issuing a total of 37,554 (thirty-seven thousand, five hundred and fifty-four) nominative common shares with no par value that were subscribed and paid-in on that date by Banco Santander, the issue price was set at R$343.50 per share, calculated based on their respective carrying amounts, on the base date of August 31, 2017. | ||||||||||||||||||||||
|
|
|
|
|
|
|
|
|
|
|
|
|
|
|
|
|
|
|
|
|
|
|
(21) At the EGM held in October 5, 2017, it was approved the share capital increase of the Gestora de Crédito in the amount of R$ 285,205, that way its share capital increased from R$65,823 to R$351,028, through the issuance of 29,013,700 ( twenty nine million, thirteen thousand, seven houndred) new shares, being 14,506,850 (fourteen million, five hundred six, eight hundred fifty) as ordinary shares, 5,802,740 (five million, eight hundred two thousand, seven hundred forty) preferred shares Class A, 5,802,740 (five million, eight hundred two thousand, seven hundred forty) preferred shares Class B, and 2,901,370 ( two million, nine hundred one, three hundred seventy) preferred shares Class C, without par value, at the issuance price of R$9.83 per share, corresponding to the equity shares price. It was also approved the payment timetable of the new shares issuance presented by the Management of Gestora de Crédito. That way, the share capital increase was fully subscribed at the same day by the shareholdes in the proportion of 20% of each interest which were partially paid. | ||||||||||||||||||||||
|
|
|
|
|
|
|
|
|
|
|
|
|
|
|
|
|
|
|
|
|
|
|
(22) Through the Private Stock Purchase and Sale Agreement held on October 26, 2017, Santander Serviços sold its interest held in Webcasas S.A. to Banco Santander.The full sale occurred at book value. | ||||||||||||||||||||||
|
|
|
|
|
|
|
|
|
|
|
|
|
|
|
|
|
|
|
|
|
|
|
(23) Investment acquired in October 2017 (Note 37.b). | ||||||||||||||||||||||
|
|
|
|
|
|
|
|
|
|
|
|
|
|
|
|
|
|
|
|
|
|
|
(24) At the ESM held on November 1, 2017 it was approved the company´s name change from Webcasas S.A. to Santander Holding Imobiliária S.A. and also its purpose in order to be in compliance with the new activities. | ||||||||||||||||||||||
|
|
|
|
|
|
|
|
|
|
|
|
|
|
|
|
|
|
|
|
|
|
|
(25) On November 17, 2017, Banco Santander acquired from Santusa Holding, S.L. the share held by it in the share capital of Santander Serviços. The amount of R$298,978 relating to goodwill was recorded (Note 37.e). | ||||||||||||||||||||||
|
|
|
|
|
|
|
|
|
|
|
|
|
|
|
|
|
|
|
|
|
|
|
(26) On November 30, 2017, Santander Serviços was merged into Santander Corretora de Seguros (Current Corporate Name of Santander Participações S.A.) (Note 37.e). | ||||||||||||||||||||||
|
|
|
|
|
|
|
|
|
|
|
|
|
|
|
|
|
|
|
|
|
|
|
(27) In December 2017, according to the contractual change, the PSA Corretora de Seguros shareholders decided to increase its share capital in R$401, that way the share capital increased from R$500 to R$901, through the issuance of 400,532 (four hundred thousand, five hundred thirty two) new shares, which each new share has the value of R$1 (one real). The new shares issued were subscribed and paid at the same date, in local currency, according to the proportion of each shareholder equivalent to 50% to the company´s share capital, that is, 200,266 (two hundred thousand, two hundred sixty six) shares. | ||||||||||||||||||||||
|
|
|
|
|
|
|
|
|
|
|
|
|
|
|
|
|
|
|
|
|
|
|
(28) At the ESM held on December 19, 2017, it was approved the increase of the Olé Conignado´s share capital in the amount of R$120,000, increasing it from R$400,000 to R$520,000, through the issuance of 58,071,890 (fifty eight million, seventy one thousand, eight hundred ninety) new ordinary shares without par value. The share capital increase approved by the shareholders is still pending from Bacen´s approval. | ||||||||||||||||||||||
|
|
|
|
|
|
|
|
|
|
|
|
|
|
|
|
|
|
|
|
|
|
|
(29) According to its Bylaws, EBP was formed in order to carry out projects to contribute for the brazilian economic and social development for the period of 10 years. After the conclusion of the timetable set EPB closes its activities this year of 2018. The dissolution of its rights and liquidation were aproved in the EGM held on january 29, 2018. | ||||||||||||||||||||||
|
|
|
|
|
|
|
|
|
|
|
|
|
|
|
|
|
|
|
|
|
|
|
(30) Includes the net amortization amount of R$19,481 (12/31/2016 - R$25,735) referring to the conclusion of the Purchase Price Allocation (PPA) study on the acquisition of Bonsucesso by Aymoré CFI, R$78,825 (12/31/2016 - R$90,094) related to goodwill on the acquisition of the shares representing the remaining 50% of the voting capital stock of Super, R$13,014 referring to the final adjustment value in the acquisition price of Banco PSA., R$27,163 referring to goodwill on the acquisition of 70% of Ipanema Empreendimentos e Participações by Atual Securitizadora, and on December 31, 2016 the amount of R$21,762 related to the goodwill recorded in BW Guirapá I SA related to the acquisition of Special Purpose Companies (SPE). | ||||||||||||||||||||||
(Free Translation into English from the Original Previously Issued in Portuguese) | |
BANCO SANTANDER (BRASIL) S.A. AND SUBSIDIARIES | |
In thousands of Brazilian Real - R$, unless otherwise stated | |
16. Fixed Assets | ||||||||||||||
|
|
|
|
|
|
|
|
|
|
|
|
|
| Bank |
12/31/2017 | 12/31/2016 | |||||||||||||
|
|
|
|
|
|
|
| Cost |
| Depreciation |
| Net |
| Net |
Real Estate |
|
|
|
|
| 2,496,780 |
| (675,292) |
| 1,821,488 |
| 1,893,845 | ||
Land |
|
|
|
|
| 660,006 |
| - |
| 660,006 |
| 668,141 | ||
Buildings |
|
|
|
|
| 1,836,774 |
| (675,292) |
| 1,161,482 |
| 1,225,704 | ||
Others Fixed Assets |
|
|
|
|
| 11,642,294 |
| (7,659,156) |
| 3,983,138 |
| 4,149,313 | ||
Installations, Furniture and Equipment |
|
|
| 3,361,623 |
| (1,818,354) |
| 1,543,269 |
| 1,449,269 | ||||
Data Processing Equipment |
|
|
|
|
| 3,340,707 |
| (2,848,035) |
| 492,672 |
| 748,818 | ||
Leasehold Improvements |
|
|
|
|
| 3,782,302 |
| (2,223,432) |
| 1,558,870 |
| 1,624,277 | ||
Security and Communication Equipment |
|
|
| 762,123 |
| (509,471) |
| 252,652 |
| 277,607 | ||||
Others |
|
|
|
|
| 395,539 |
| (259,864) |
| 135,675 |
| 49,342 | ||
Total |
|
|
|
|
| 14,139,074 |
| (8,334,448) |
| 5,804,626 |
| 6,043,158 | ||
|
|
|
|
|
|
|
|
|
|
|
|
|
| Consolidated |
12/31/2017 | 12/31/2016 | |||||||||||||
|
|
|
|
|
|
|
| Cost |
| Depreciation |
| Net |
| Net |
Real Estate |
|
|
|
|
| 2,597,407 |
| (690,908) |
| 1,906,499 |
| 2,187,136 | ||
Land |
|
|
|
|
| 692,948 |
| - |
| 692,948 |
| 702,032 | ||
Buildings |
|
|
|
|
| 1,904,459 |
| (690,908) |
| 1,213,551 |
| 1,485,104 | ||
Others Fixed Assets |
|
|
|
|
| 12,801,568 |
| (8,312,383) |
| 4,489,185 |
| 5,363,607 | ||
Installations, Furniture and Equipment |
|
|
| 3,465,234 |
| (1,835,948) |
| 1,629,286 |
| 2,168,242 | ||||
Data Processing Equipment |
|
|
|
|
| 3,545,753 |
| (2,930,731) |
| 615,022 |
| 958,214 | ||
Leasehold Improvements |
|
|
|
|
| 3,846,737 |
| (2,266,547) |
| 1,580,190 |
| 1,651,786 | ||
Security and Communication Equipment |
|
|
| 1,545,720 |
| (1,017,014) |
| 528,706 |
| 486,797 | ||||
Others |
|
|
|
|
| 398,124 |
| (262,143) |
| 135,981 |
| 98,568 | ||
Total |
|
|
|
|
| 15,398,975 |
| (9,003,291) |
| 6,395,684 |
| 7,550,743 | ||
17. Intangibles | ||||||||||||||
|
|
|
|
|
|
|
|
|
|
|
|
|
| Bank |
12/31/2017 | 12/31/2016 | |||||||||||||
|
|
|
|
|
|
|
| Cost |
| Amortization |
| Net |
| Net |
Goodwill on Acquired Companies(1) |
|
|
| 26,419,016 |
| (26,084,055) |
| 334,961 |
| 1,368,177 | ||||
Other Intangible Assets |
|
|
|
|
| 8,964,796 |
| (5,685,910) |
| 3,278,886 |
| 2,895,815 | ||
Acquisition and Development of Software (2) |
|
|
| 6,093,074 |
| (4,549,501) |
| 1,543,573 |
| 1,633,443 | ||||
Exclusivity Contracts for Provision of Banking Services |
| 2,550,242 |
| (870,937) |
| 1,679,305 |
| 1,197,278 | ||||||
Others |
|
|
|
|
| 321,480 |
| (265,472) |
| 56,008 |
| 65,094 | ||
Total |
|
|
|
|
| 35,383,812 |
| (31,769,965) |
| 3,613,847 |
| 4,263,992 | ||
|
|
|
|
|
|
|
|
|
|
|
|
|
| Consolidated |
12/31/2017 | 12/31/2016 | |||||||||||||
|
|
|
|
|
|
|
| Cost |
| Amortization |
| Net |
| Net |
Goodwill on Acquired Companies(1) |
|
|
| 27,758,074 |
| (26,827,953) |
| 930,121 |
| 2,173,901 | ||||
Other Intangible Assets |
|
|
|
|
| 9,508,395 |
| (6,033,541) |
| 3,474,854 |
| 3,128,640 | ||
Acquisition and Development of Software(2) |
|
|
| 6,555,992 |
| (4,833,763) |
| 1,722,229 |
| 1,840,289 | ||||
Exclusivity Contracts for Provision of Banking Services |
|
| 2,550,242 |
| (870,937) |
| 1,679,305 |
| 1,197,278 | |||||
Others |
|
|
|
|
| 402,161 |
| (328,841) |
| 73,320 |
| 91,073 | ||
Total |
|
|
|
|
| 37,266,469 |
| (32,861,494) |
| 4,404,975 |
| 5,302,541 | ||
(1) The amortization of Banco Real's acquisition goodwill was completed in October 2017. | ||||||||||||||
(2) In 2017, includes asset impairment losses (Note 32). | ||||||||||||||
18. Funding and Borrowings and Onlendings | ||||||||||||||
a) Deposits | ||||||||||||||
|
|
|
|
|
|
|
|
|
|
|
|
|
| Bank |
|
|
|
|
|
|
|
|
|
|
|
| 12/31/2017 |
| 12/31/2016 |
Without | Up to 3 | From 3 to | Over 12 | |||||||||||
|
|
|
| Maturity |
| Months |
| 12 Months |
| Months |
| Total |
| Total |
Demand Deposits |
| 17,133,923 |
| - |
| - |
| - |
| 17,133,923 |
| 16,016,316 | ||
Savings Deposits |
| 40,572,369 |
| - |
| - |
| - |
| 40,572,369 |
| 36,051,476 | ||
Interbank Deposits |
| - |
| 15,680,564 |
| 9,018,209 |
| 3,014,560 |
| 27,713,333 |
| 65,097,094 | ||
Time Deposits(1) (2) |
| 90,805 |
| 37,659,790 |
| 46,641,794 |
| 60,156,049 |
| 144,548,438 |
| 91,694,767 | ||
Total |
| 57,797,097 |
| 53,340,354 |
| 55,660,003 |
| 63,170,609 |
| 229,968,063 |
| 208,859,653 | ||
Current |
|
|
|
|
|
|
|
|
| 166,797,454 |
| 158,705,975 | ||
Long-term |
|
|
|
|
|
|
|
|
| 63,170,609 |
| 50,153,678 | ||
|
|
|
|
|
|
|
|
|
|
|
|
|
| Consolidated |
|
|
|
|
|
|
|
|
|
|
|
| 12/31/2017 |
| 12/31/2016 |
Without | Up to 3 | From 3 to | Over 12 | |||||||||||
|
|
|
| Maturity |
| Months |
| 12 Months |
| Months |
| Total |
| Total |
Demand Deposits |
| 17,176,981 |
| - |
| - |
| - |
| 17,176,981 |
| 16,006,319 | ||
Savings Deposits |
| 40,572,369 |
| - |
| - |
| - |
| 40,572,369 |
| 36,051,476 | ||
Interbank Deposits(1) |
| - |
| 1,435,256 |
| 1,376,398 |
| 480,468 |
| 3,292,122 |
| 3,122,438 | ||
Time Deposits(1) (2) |
| 90,805 |
| 37,255,918 |
| 46,671,593 |
| 58,462,354 |
| 142,480,670 |
| 90,524,841 | ||
Other Deposits |
| 10,001 |
| - |
| - |
| - |
| 10,001 |
| 89 | ||
Total |
| 57,850,156 |
| 38,691,174 |
| 48,047,991 |
| 58,942,822 |
| 203,532,143 |
| 145,705,163 | ||
Current |
|
|
|
|
|
|
|
|
| 144,589,321 |
| 97,394,726 | ||
Long-term |
|
|
|
|
|
|
|
|
| 58,942,822 |
| 48,310,437 | ||
(1) Includes the amount of R$333,343 (12/31/2016 - R$547,556) of Interbank Deposits - CDI, used as cash flow hedge objects (Note 6.b.V.b). | ||||||||||||||
(2) Considering the maturities established in the respective applications, there is the possibility of immediate withdrawal, in advance of maturity. | ||||||||||||||
b) Money Market Funding | ||||||||||||||
|
|
|
|
|
|
|
|
|
|
|
|
|
| Bank |
|
|
|
|
|
|
|
|
|
|
|
| 12/31/2017 |
| 12/31/2016 |
Up to 3 | From 3 to | Over 12 | ||||||||||||
|
|
|
|
|
| Months |
| 12 Months |
| Months |
| Total |
| Total |
Own Portfolio |
|
|
| 83,184,340 |
| 20,438,252 |
| 294,454 |
| 103,917,046 |
| 125,213,506 | ||
Government Securities |
|
|
| 69,963,405 |
| 50,751 |
| - |
| 70,014,156 |
| 65,419,749 | ||
Debt Securities in Issue |
|
|
| 6,681,033 |
| 20,328,395 |
| 284,365 |
| 27,293,793 |
| 54,457,505 | ||
Others |
|
|
| 6,539,902 |
| 59,106 |
| 10,089 |
| 6,609,097 |
| 5,336,252 | ||
Third Parties |
|
|
| 6,259,682 |
| - |
| - |
| 6,259,682 |
| 14,799,595 | ||
Linked to Trading Portfolio Operations |
| - |
| 464,626 |
| 32,066,088 |
| 32,530,714 |
| 31,550,621 | ||||
Total |
|
|
| 89,444,022 |
| 20,902,878 |
| 32,360,542 |
| 142,707,442 |
| 171,563,722 | ||
Current |
|
|
|
|
|
|
|
|
| 110,346,900 |
| 132,400,766 | ||
Long-term |
|
|
|
|
|
|
|
|
| 32,360,542 |
| 39,162,956 | ||
|
|
|
|
|
|
|
|
|
|
|
|
|
| Consolidated |
|
|
|
|
|
|
|
|
|
|
|
| 12/31/2017 |
| 12/31/2016 |
Up to 3 | From 3 to | Over 12 | ||||||||||||
|
|
|
|
|
| Months |
| 12 Months |
| Months |
| Total |
| Total |
Own Portfolio |
|
|
| 76,440,847 |
| 20,437,903 |
| 294,454 |
| 97,173,204 |
| 123,578,123 | ||
Government Securities |
|
|
| 63,219,912 |
| 50,751 |
| - |
| 63,270,663 |
| 64,116,094 | ||
Debt Securities in Issue |
|
|
| 6,681,033 |
| 20,328,046 |
| 284,365 |
| 27,293,444 |
| 54,125,777 | ||
Others |
|
|
| 6,539,902 |
| 59,106 |
| 10,089 |
| 6,609,097 |
| 5,336,252 | ||
Third Parties |
|
|
| 258,099 |
| - |
| - |
| 258,099 |
| 5,794,993 | ||
Linked to Trading Portfolio Operations |
| - |
| 464,626 |
| 32,066,088 |
| 32,530,714 |
| 31,550,621 | ||||
Total |
|
|
| 76,698,946 |
| 20,902,529 |
| 32,360,542 |
| 129,962,017 |
| 160,923,737 | ||
Current |
|
|
|
|
|
|
|
|
| 97,601,475 |
| 121,760,781 | ||
Long-term |
|
|
|
|
|
|
|
|
| 32,360,542 |
| 39,162,956 | ||
c) Funds from Acceptance and Issuance of Securities | ||||||||||||||
|
|
|
|
|
|
|
|
|
|
|
|
|
| Bank |
|
|
|
|
|
|
|
|
|
|
|
| 12/31/2017 |
| 12/31/2016 |
Up to 3 | From 3 to | Over 12 | ||||||||||||
|
|
|
|
|
| Months |
| 12 Months |
| Months |
| Total |
| Total |
Real Estate Credit Notes, Mortgage Notes, |
| 12,365,790 |
| 35,801,713 |
| 20,086,361 |
| 68,253,864 |
| 92,103,855 | ||||
Real Estate Credit Notes - LCI(1) |
|
|
| 6,581,743 |
| 15,693,444 |
| 5,438,688 |
| 27,713,875 |
| 23,983,429 | ||
Agribusiness Credit Notes - LCA (2) |
| 2,639,185 |
| 5,253,648 |
| 961,220 |
| 8,854,053 |
| 6,980,844 | ||||
Treasury Bills - LF(3) |
|
|
| 3,144,862 |
| 14,854,621 |
| 13,686,453 |
| 31,685,936 |
| 61,139,582 | ||
Securities Issued Abroad |
|
|
| 524,819 |
| 747,675 |
| 720,387 |
| 1,992,881 |
| 7,722,202 | ||
Eurobonds |
|
|
| 524,819 |
| 747,675 |
| 720,387 |
| 1,992,881 |
| 7,722,202 | ||
Funding by Structured Operations Certificates |
| 260,665 |
| 781,626 |
| 947,975 |
| 1,990,266 |
| 1,235,591 | ||||
Total |
|
|
| 13,151,274 |
| 37,331,014 |
| 21,754,723 |
| 72,237,011 |
| 101,061,648 | ||
Current |
|
|
|
|
|
|
|
|
| 50,482,288 |
| 79,435,491 | ||
Long-term |
|
|
|
|
|
|
|
|
| 21,754,723 |
| 21,626,157 | ||
|
|
|
|
|
|
|
|
|
|
|
|
|
| Consolidated |
|
|
|
|
|
|
|
|
|
|
|
| 12/31/2017 |
| 12/31/2016 |
Up to 3 | From 3 to | Over 12 | ||||||||||||
|
|
|
|
|
| Months |
| 12 Months |
| Months |
| Total |
| Total |
Exchange Acceptances(5) |
|
|
| 273,212 |
| 366,623 |
| 537,344 |
| 1,177,179 |
| 1,090,255 | ||
Real Estate Credit Notes, Mortgage Notes, | ||||||||||||||
Credit and Similar Notes |
| 12,417,038 |
| 36,743,777 |
| 22,335,336 |
| 71,496,151 |
| 95,122,026 | ||||
Real Estate Credit Notes - LCI(1) |
|
|
| 6,581,743 |
| 15,693,444 |
| 5,438,688 |
| 27,713,875 |
| 23,983,429 | ||
Agribusiness Credit Notes - LCA(2) |
| 2,639,185 |
| 5,253,648 |
| 961,220 |
| 8,854,053 |
| 6,980,844 | ||||
Treasury Bills - LF(3) (4) |
|
|
| 3,196,110 |
| 15,796,685 |
| 15,935,428 |
| 34,928,223 |
| 64,157,753 | ||
Securities Issued Abroad |
|
|
| 524,819 |
| 747,675 |
| 720,387 |
| 1,992,881 |
| 7,722,202 | ||
Eurobonds |
|
|
| 524,819 |
| 747,675 |
| 720,387 |
| 1,992,881 |
| 7,722,202 | ||
Funding by Structured Operations Certificates |
| 260,665 |
| 781,626 |
| 947,975 |
| 1,990,266 |
| 1,235,591 | ||||
Total |
|
|
| 13,475,734 |
| 38,639,701 |
| 24,541,042 |
| 76,656,477 |
| 105,170,074 | ||
Current |
|
|
|
|
|
|
|
|
| 52,115,435 |
| 81,262,272 | ||
Long-term |
|
|
|
|
|
|
|
|
| 24,541,042 |
| 23,907,802 | ||
|
|
|
|
|
|
|
|
|
|
|
|
|
|
|
(1) Real Estate Credit Note are fixed income securities linked with mortgages and guaranteed by mortgage-backed securities or liens on property. On December 31, 2017, they have maturities between 2018 to 2026 (12/31/2016 - maturities between 2017 to 2026). | ||||||||||||||
(2) Agribusiness credit notes are fixed income securities which resources are allocated to the promotion of agribusiness, indexed between 86.0% to 94.0% of CDI. On December 31, 2017, its maturities dates are between 2018 to 2019 (12/31/2016 - maturities dates between 2017 to 2018). | ||||||||||||||
(3) The main features of the Treasury Bills are the minimum period of two years, minimum notional of R$300 and permission for early redemption of only 5% of the issued amount. On December 31, 2017, its maturities dates are between 2018 to 2025 (12/31/2016 - maturities dates between 2017 to 2025). | ||||||||||||||
(4) Includes the amount of R$3,033,901 (12/31/2016 - R$1,769,348) of Treasury Bills - LF, used as cash flow hedge object (Note 6.b.V.b). | ||||||||||||||
(5) Includes the amount of R$763,103 (12/31/2016 - R$573,596) of Exchange Treasury Bills - LC, used as cash flow hedge object (Note 6.b.V.b). | ||||||||||||||
|
|
|
|
|
|
|
|
|
|
|
|
|
| Bank/Consolidated |
12/31/2017 | 12/31/2016 | |||||||||||||
Eurobonds |
| Issuance |
| Maturity |
| Currency |
| Interest Rate (p.a) |
| Total |
| Total | ||
Eurobonds |
| 2017 |
| 2018 |
| US$ |
| Zero Coupon at 2.4% | 1,195,668 |
| - | |||
Eurobonds |
| 2017 |
| 2019 |
| US$ |
| Libor 3M + 1.0% |
| 165,677 |
| - | ||
Eurobonds |
| 2017 |
| 2024 |
| US$ |
| 6.9% at 10.0% |
| 541,487 |
| - | ||
Eurobonds |
| 2016 |
| 2017 |
| US$ |
| 0.7% at 2.5% |
| - |
| 3,408,932 | ||
Eurobonds |
| 2012 |
| 2017 |
| US$ |
| 4.6% |
| - |
| 4,116,309 | ||
Others |
|
|
|
|
|
|
|
|
| 90,049 |
| 196,961 | ||
Total |
|
|
|
|
|
|
|
|
|
| 1,992,881 |
| 7,722,202 | |
d) Money Market Funding Expenses | ||||||||||||||
|
|
|
|
|
|
|
|
|
| Consolidated |
|
|
| Bank |
01/01 a | 01/01 a | 01/01 a | 01/01 a | |||||||||||
|
|
|
|
|
|
|
| 12/31/2017 |
| 12/31/2016 |
| 12/31/2017 |
| 12/31/2016 |
Time Deposits(1) (2) |
|
|
|
|
| 9,776,874 |
| 7,363,350 |
| 9,711,539 |
| 7,262,634 | ||
Savings Deposits |
|
|
|
|
| 2,336,862 |
| 2,726,421 |
| 2,336,862 |
| 2,726,421 | ||
Interbank Deposits |
|
|
|
|
| 4,488,100 |
| 9,006,721 |
| 284,005 |
| 393,412 | ||
Money Market Funding (3) |
|
|
|
|
| 16,358,420 |
| 24,170,391 |
| 15,054,086 |
| 21,646,664 | ||
Upgrade and Provisions Interest and Pension Plans and Capitalization |
| - |
| - |
| 112,323 |
| 129,576 | ||||||
Acceptance and Issuance of Securities |
|
|
| 6,519,679 |
| 16,656,474 |
| 6,928,278 |
| 17,264,709 | ||||
Others |
|
|
|
|
| 515,016 |
| 1,119,545 |
| 517,510 |
| 1,122,766 | ||
Total |
|
|
|
|
| 39,994,951 |
| 61,042,902 |
| 34,944,603 |
| 50,546,182 | ||
|
|
|
|
|
|
|
|
|
|
|
|
|
|
|
(1) In the Bank and Consolidated, includes the record of interest in the amount of R$495,213 (2016 - R$501,748), related to the issuance of the Debt Instrument Eligible to Tier I and II Capital (Note 21). | ||||||||||||||
(2) Includes exchange variation expenses in the amount of R$494,178 (2016 - income in the amout of R$2,146,234) in the Bank and R$495,307 (2016 - income in the amout of R$2,419,833) in the Consolidated. | ||||||||||||||
|
|
|
|
|
|
|
|
|
|
|
|
|
|
|
(3) Includes exchange variation income in the amount of R$1,384,488 (12/31/2016 - expense in the amout of R$2,928,154) in the Bank and R$1,392,649 (2016 - expense in the amout of R$ 2,926,665) in the Consolidated. | ||||||||||||||
e) Borrowings and Onlendings | ||||||||||||||
|
|
|
|
|
|
|
|
|
|
|
|
|
| Bank |
|
|
|
|
|
|
|
|
|
|
|
| 12/31/2017 |
| 12/31/2016 |
Up to 3 | From 3 to | Over 12 | ||||||||||||
|
|
|
|
|
| Months |
| 12 Months |
| Months |
| Total |
| Total |
DomesticBorrowings |
|
|
| - |
| - |
| 476,876 |
| 476,876 |
| - | ||
Import and Export Financing Lines |
| 10,466,458 |
| 13,722,196 |
| 240,503 |
| 24,429,157 |
| 14,556,516 | ||||
Other Credit Lines(1) |
|
|
| 3,825,864 |
| 5,046,517 |
| 664,545 |
| 9,536,926 |
| 16,921,000 | ||
Domestic Onlendings |
|
|
| 1,163,378 |
| 5,061,006 |
| 10,411,313 |
| 16,635,697 |
| 16,802,645 | ||
Total |
|
|
| 15,455,700 |
| 23,829,719 |
| 11,793,237 |
| 51,078,656 |
| 48,280,161 | ||
Current |
|
|
|
|
|
|
|
|
| 39,285,419 |
| 34,820,450 | ||
Long-term |
|
|
|
|
|
|
|
|
| 11,793,237 |
| 13,459,711 | ||
|
|
|
|
|
|
|
|
|
|
|
|
|
| Consolidated |
|
|
|
|
|
|
|
|
|
|
|
| 12/31/2017 |
| 12/31/2016 |
Up to 3 | From 3 to | Over 12 | ||||||||||||
|
|
|
|
|
| Months |
| 12 Months |
| Months |
| Total |
| Total |
Domestic Borrowings |
|
|
|
|
| 21,598 |
| 55,489 |
| 538,258 |
| 615,345 |
| 445,900 |
Foreign Borrowings |
|
|
| 13,181,506 |
| 18,768,713 |
| 905,048 |
| 32,855,267 |
| 30,154,117 | ||
Import and Export Financing Lines |
| 10,466,458 |
| 13,722,196 |
| 240,503 |
| 24,429,157 |
| 13,233,117 | ||||
Other Credit Lines(1) |
|
|
| 2,715,048 |
| 5,046,517 |
| 664,545 |
| 8,426,110 |
| 16,921,000 | ||
Domestic Onlendings |
|
|
| 1,163,378 |
| 5,061,006 |
| 10,411,313 |
| 16,635,697 |
| 16,802,645 | ||
Total |
|
|
| 14,366,482 |
| 23,885,208 |
| 11,854,619 |
| 50,106,309 |
| 47,402,662 | ||
Current |
|
|
|
|
|
|
|
|
| 38,251,690 |
| 33,538,718 | ||
Long-term |
|
|
|
|
|
|
|
|
| 11,854,619 |
| 13,863,944 | ||
(1) Includes the amount of R$816,759 (12/31/2016 - R$816,759), of bonds subject to market risk hedge (Note 6.b.V.a) and on December 31, 2016 the amount of R$1,332,972 of obligations subject to cash flow hedge (Note 6.b.V.b). | ||||||||||||||
In the Bank and Consolidated, the export and import financing lines are funded by foreign banks, for foreign exchange transactions purposes, related to export bills discounting and export and import pre-financing, with maturity until 2022 (12/31/2016 - through 2019) and subject to financial charges corresponding to exchange rate changes plus interest ranging from 0.5% p.a. to 9.5% p.a. (12/31/2016 - 0.6% p.a. to 32.4% p.a.). | ||||||||||||||
Domestic onlendings - official institutions are subject to financial charges corresponding to the TJLP, exchange variation of the currency basket of the BNDES, or US dollar exchange variation, plus interest rate in accordance with the operating policies of the BNDES System. | ||||||||||||||
19. Tax and Social Security | ||||||||||||||
|
|
|
|
|
|
|
|
|
| Bank |
|
|
| Consolidated |
|
|
|
|
|
|
|
| 12/31/2017 |
| 12/31/2016 |
| 12/31/2017 |
| 12/31/2016 |
Deferred Tax Liabilities |
|
|
|
|
| 2,319,695 |
| 1,809,299 |
| 2,787,143 |
| 2,265,591 | ||
Provision for Taxes and Contributions on Income |
|
|
| - |
| - |
| 140,439 |
| 33,113 | ||||
Taxes Payable |
|
|
|
|
| 1,084,637 |
| 1,064,799 |
| 1,942,718 |
| 1,404,210 | ||
Total |
|
|
|
|
| 3,404,332 |
| 2,874,098 |
| 4,870,300 |
| 3,702,914 | ||
Current |
|
|
|
|
| 1,555,596 |
| 1,891,028 |
| 2,585,381 |
| 2,442,614 | ||
Long-term |
|
|
|
|
| 1,848,736 |
| 983,070 |
| 2,284,919 |
| 1,260,300 | ||
a) Nature and Origin of Deferred Tax Liabilities | ||||||||||||||
|
|
|
|
|
|
|
|
|
|
|
|
|
| Bank |
|
|
|
|
|
|
|
| 12/31/2016 |
| Recognition |
| Realization |
| 12/31/2017 |
Adjustment to Fair Value of Trading Securities and Derivatives(1) |
| 965,750 |
| - |
| (66,774) |
| 898,976 | ||||||
Adjustment to Fair Value of Available-for-Sale |
|
|
| 836,197 |
| 509,481 |
| - |
| 1,345,678 | ||||
Excess Depreciation of Leased Assets |
|
|
| 6,777 |
| - |
| (287) |
| 6,490 | ||||
Others |
|
|
|
|
| 575 |
| 67,976 |
| - |
| 68,551 | ||
Total |
|
|
|
|
| 1,809,299 |
| 577,457 |
| (67,061) |
| 2,319,695 | ||
|
|
|
|
|
|
|
|
|
|
|
|
|
| Bank |
|
|
|
|
|
|
|
| 12/31/2015 |
| Recognition |
| Realization |
| 12/31/2016 |
Adjustment to Fair Value of Trading Securities and Derivatives(1) |
| 999,137 |
| - |
| (33,387) |
| 965,750 | ||||||
Adjustment to Fair Value of Available-for-Sale |
|
|
| 61,270 |
| 774,927 |
| - |
| 836,197 | ||||
Excess Depreciation of Leased Assets |
|
|
| 7,188 |
| - |
| (411) |
| 6,777 | ||||
Others |
|
|
|
|
| 25,364 |
| - |
| (24,789) |
| 575 | ||
Total |
|
|
|
|
| 1,092,959 |
| 774,927 |
| (58,587) |
| 1,809,299 | ||
|
|
|
|
|
|
|
| Change in |
|
|
|
|
|
|
the Scope of | ||||||||||||||
Consolidation | Consolidated | |||||||||||||
|
|
|
|
|
| 12/31/2016 |
| (Note 15) |
| Recognition |
| Realization |
| 12/31/2017 |
Adjustment to Fair Value of Trading Securities and |
| 969,321 |
| - |
| 28,369 |
| (67,207) |
| 930,483 | ||||
Adjustment to Fair Value of Available-for-Sale |
| 892,971 |
| - |
| 550,705 |
| (16,784) |
| 1,426,892 | ||||
Excess Depreciation of Leased Assets |
| 385,127 |
| - |
| - |
| (54,535) |
| 330,592 | ||||
Others |
|
|
| 18,172 |
| 5,350 |
| 86,329 |
| (10,675) |
| 99,176 | ||
Total |
|
|
| 2,265,591 |
| 5,350 |
| 665,403 |
| (149,201) |
| 2,787,143 | ||
|
|
|
|
|
|
|
| Change in |
|
|
|
|
|
|
the Scope of | ||||||||||||||
Consolidation | Consolidated | |||||||||||||
|
|
|
|
|
| 12/31/2015 |
| (Note 15) |
| Recognition |
| Realization |
| 12/31/2016 |
Adjustment to Fair Value of Trading Securities and |
| 1,057,929 |
| - |
| 3,134 |
| (91,742) |
| 969,321 | ||||
Adjustment to Fair Value of Available-for-Sale |
| 65,740 |
| - |
| 846,364 |
| (19,133) |
| 892,971 | ||||
Excess Depreciation of Leased Assets |
| 485,278 |
| 800 |
| - |
| (100,951) |
| 385,127 | ||||
Others |
|
|
| 33,872 |
| - |
| 9,868 |
| (25,568) |
| 18,172 | ||
Total |
|
|
| 1,642,819 |
| 800 |
| 859,366 |
| (237,394) |
| 2,265,591 | ||
(1) Includes IRPJ, CSLL, PIS and Cofins. | ||||||||||||||
b) Expected Realization of Deferred Tax Liabilities | ||||||||||||||
|
|
|
|
|
|
|
|
|
|
|
|
|
| Bank |
|
|
|
|
|
|
|
|
|
|
|
|
|
| 12/31/2017 |
Temporary Differences | ||||||||||||||
Year |
|
|
|
|
|
|
| IRPJ |
| CSLL |
| PIS/Cofins |
| Total |
2018 |
|
|
|
|
| 263,321 |
| 156,694 |
| 50,944 |
| 470,959 | ||
2019 |
|
|
|
|
| 200,433 |
| 118,962 |
| 38,677 |
| 358,072 | ||
2020 |
|
|
|
|
| 200,433 |
| 118,962 |
| 38,677 |
| 358,072 | ||
2021 |
|
|
|
|
| 204,399 |
| 122,625 |
| 38,677 |
| 365,701 | ||
2022 |
|
|
|
|
| 204,399 |
| 122,625 |
| 38,677 |
| 365,701 | ||
2023 to 2025 |
|
|
|
|
| 214,607 |
| 128,721 |
| 38,276 |
| 381,604 | ||
2026 to 2027 |
|
|
|
|
| 12,259 |
| 7,327 |
| - |
| 19,586 | ||
Total |
|
|
|
|
| 1,299,851 |
| 775,916 |
| 243,928 |
| 2,319,695 | ||
|
|
|
|
|
|
|
|
|
|
|
|
|
| Consolidated |
|
|
|
|
|
|
|
|
|
|
|
|
|
| 12/31/2017 |
Temporary Differences | ||||||||||||||
Year |
|
|
|
|
|
|
| IRPJ |
| CSLL |
| PIS/Cofins |
| Total |
2018 |
|
|
|
|
| 341,066 |
| 164,816 |
| 52,293 |
| 558,175 | ||
2019 |
|
|
|
|
| 274,308 |
| 126,997 |
| 40,025 |
| 441,330 | ||
2020 |
|
|
|
|
| 256,247 |
| 126,997 |
| 40,025 |
| 423,269 | ||
2021 |
|
|
|
|
| 257,383 |
| 129,097 |
| 40,025 |
| 426,505 | ||
2022 |
|
|
|
|
| 257,383 |
| 129,097 | �� | 40,025 |
| 426,505 | ||
2023 to 2025 |
|
|
|
|
| 311,774 |
| 137,327 |
| 40,783 |
| 489,884 | ||
2026 to 2027 |
|
|
|
|
| 13,577 |
| 7,898 |
| - |
| 21,475 | ||
Total |
|
|
|
|
| 1,711,738 |
| 822,229 |
| 253,176 |
| 2,787,143 | ||
20. Subordinated Debts | ||||||||||||||
Consist of securities issued according to Bacen rules, which are used as Tier II of the Capital Regulatory for calculating operating limits, according to the proportion defined by CMN Resolution 4,192 of March 1, 2013, and the amendments introduced by Resolution 4,278 of October 31, 2013. | ||||||||||||||
|
|
|
|
|
|
|
|
|
|
|
|
|
| Bank/Consolidated |
|
|
|
|
|
|
|
|
|
|
|
| 12/31/2017 |
| 12/31/2016 |
Subordinated Deposit |
| Issuance |
| Maturity(1) |
| Amount (Million) |
| Interest Rate (p.a.) |
| Total |
| Total | ||
Subordinated Deposit Certificates |
| May-08 |
| May-15 to May-18 |
| R$283 |
| CDI (2) |
| 109,572 |
| 98,378 | ||
Subordinated Deposit Certificates |
| May-08 to June-08 |
| May-15 to June-18 |
| R$268 |
| IPCA(3) |
| 409,658 |
| 367,868 | ||
Total |
|
|
|
|
|
|
|
|
|
| 519,230 |
| 466,246 | |
Current |
|
|
|
|
|
|
|
|
| 519,230 |
| - | ||
Long Term |
|
|
|
|
|
|
|
|
| - |
| 466,246 | ||
|
|
|
|
|
|
|
|
|
|
|
|
|
|
|
(1) Subordinated time deposits issued with the payment of interest rate and principal at the end of the term. | ||||||||||||||
(2) As of December 31, 2017 and 2016, indexed issuance between 100% and 112% of CDI. | ||||||||||||||
(3) As of December 31, 2017 and 2016, indexed to the IPCA plus interest of 8.3% p.a. to 8.4% p.a. | ||||||||||||||
21. Debt Instruments Eligible to Compose Capital | ||||||||||||||
Details of the balance of Debt Instruments Eligible to Compose Capital referred to the issuance of equity instruments for the composition of Tier I and Tier II of Regulatory Capital due to the Capital Optimization Plan, are as follows: | ||||||||||||||
|
|
|
|
|
|
|
|
|
|
|
|
|
| Bank/Consolidated |
|
|
|
|
|
|
|
|
|
|
|
| 12/31/2017 |
| 12/31/2016 |
Debt Instruments Eligible to |
| Issuance |
| Maturity |
| Amount (Million) |
| Interest Rate (p.a.)(3) |
| Total |
| Total | ||
Tier I(1) |
| January - 14 |
| No Maturity (Perpetual) |
| R$3,000 |
| 7.375% |
| 4,189,108 |
| 4,127,184 | ||
Tier II(2) |
| January - 14 |
| January - 24 |
| R$3,000 |
| 6.000% |
| 4,250,447 |
| 4,187,615 | ||
Total |
|
|
|
|
|
|
|
|
| 8,439,555 |
| 8,314,799 | ||
Current |
|
|
|
|
|
|
|
|
| 114,104 |
| 114,104 | ||
Long-term |
|
|
|
|
|
|
|
|
| 8,325,451 |
| 8,200,695 | ||
(1) Interest rate paid quarterly from April 29, 2014. | ||||||||||||||
(2) Interest rate paid semiannually from July 29, 2014. | ||||||||||||||
(3) The effective interest rate, considering the Taxes (IR) made by the issuer, is 8.676% and 7.059% for instruments Tier I and Tier II, respectively. | ||||||||||||||
22. Other Payables - Other | ||||||||||||||
|
|
|
|
|
|
|
|
|
|
|
|
|
|
|
Bank | Consolidated | |||||||||||||
|
|
|
|
|
|
|
| 12/31/2017 |
| 12/31/2016 |
| 12/31/2017 |
| 12/31/2016 |
Provision Technical for Pension and Capitalization Operations |
| - |
| - |
| 1,864,315 |
| 1,681,252 | ||||||
Payables for Credit Cards (Note 12) |
|
|
|
|
|
| 20,037,937 |
| 24,446,860 |
| 30,552,706 |
| 24,651,578 | |
Provision for Tax Risks and Legal Obligations (Note 23.b) (2) |
| 4,279,109 |
| 4,522,224 |
| 6,999,881 |
| 7,080,310 | ||||||
Provision for Legal and Administrative Proceedings - |
| 5,481,162 |
| 4,653,511 |
| 5,994,219 |
| 5,014,004 | ||||||
Provision for Financial Guarantees (Note 22.a) |
|
|
|
|
|
| 312,373 |
| - |
| 312,373 |
| - | |
Employee Benefit Plans (Note 35) |
|
|
|
|
|
| 3,899,753 |
| 2,696,848 |
| 3,923,458 |
| 2,710,626 | |
Payables for Acquisition of Assets and Rights |
|
|
| 20,974 |
| 22,588 |
| 20,974 |
| 22,588 | ||||
Reserve for Tax Contingencies - Responsibility of |
| 616,934 |
| 719,574 |
| 698,141 |
| 810,383 | ||||||
Reserve for Legal and Administrative Proceedings - Responsibility of |
| 8,990 |
| 4,542 |
| 8,990 |
| 4,542 | ||||||
Accrued Liabilities |
|
|
|
|
|
|
|
|
|
|
|
|
| |
Personnel Expenses |
|
|
|
|
|
| 1,650,756 |
| 1,432,366 |
| 1,781,180 |
| 1,564,155 | |
Administrative Expenses |
|
|
|
|
|
| 308,372 |
| 301,877 |
| 487,992 |
| 422,133 | |
Others Payments |
|
|
|
|
|
| 58,396 |
| 35,135 |
| 143,100 |
| 159,652 | |
Creditors for Unreleased Funds |
|
|
|
|
| 956,444 |
| 482,091 |
| 956,444 |
| 482,091 | ||
Provision of Payment Services |
|
|
|
|
| 522,365 |
| 460,432 |
| 522,365 |
| 460,432 | ||
Suppliers |
|
|
|
|
| 379,137 |
| 290,281 |
| 1,126,375 |
| 922,082 | ||
Others(1) |
|
|
|
|
|
| 2,643,811 |
| 3,365,507 |
| 6,013,137 |
| 6,433,165 | |
Total |
|
|
|
|
| 41,176,513 |
| 43,433,836 |
| 61,405,650 |
| 52,418,993 | ||
Current |
|
|
|
|
| 26,649,063 |
| 32,547,860 |
| 40,841,041 |
| 38,143,523 | ||
Long-term |
|
|
|
|
| 14,527,450 |
| 10,885,976 |
| 20,564,609 |
| 14,275,470 | ||
(1) In the Consolidated, includes the obligation concerning the transfer of the Fund Portfolio Guarantee Benefit (FGB) registered with Evidence. | ||||||||||||||
(2) According to Circular Letter Bacen 3,782/2016, the provisions for tax risks was reclassified from tax and social security to other payables - others. | ||||||||||||||
a) Provision for Financial Guarantees | ||||||||||||||
The classification of the guarantees operations for the constitution of provision is based on the estimate of the involved risk. It happens due to the quality evaluation process applied to the clients and operations, using statistical model based on quantitative and qualitative information or on specialized credit analyst, which allow them to be classified according their default probabilities, based on internal and market´s objective variables (bureaus), previously identified as predictive of default probability. After this evaluation the operations are classified according to the provisioning ratings, having as reference the Resolution CMN 2,682/1999. Based on the results of this analysis, amounts related to operations’ coverage are registered as provision considering the type of the guarantee, according to the requirements of Resolution CMN 4,512/2016. | ||||||||||||||
|
|
|
|
|
|
|
|
|
|
|
|
|
|
|
Bank/Consolidated | ||||||||||||||
|
|
|
|
|
|
|
|
|
|
|
|
|
| 12/31/2017 |
Balance Guarantees | ||||||||||||||
Type of Financial Guarantee |
|
|
|
|
|
|
|
|
| Provided |
| Provision | ||
Linked to International Merchandise Trade |
|
|
| 339,354 |
| 13,080 | ||||||||
Linked to Bids, Auctions, Provision of Services or Execution of Works |
|
|
|
|
| 3,038,745 |
| 17,053 | ||||||
Linked to the Supply of Goods |
|
|
|
|
|
|
|
|
|
|
| 1,664,361 |
| 4,475 |
Linked to the Distribution of Securities by Public Offer |
|
|
|
|
|
|
|
|
|
|
| 565,000 |
| - |
Guarantee in Legal and Administrative Proceedings of Fiscal Nature |
|
|
|
|
| 11,548,131 |
| 118,949 | ||||||
Other Guarantees |
|
|
|
|
|
|
|
|
| 844 |
| 4 | ||
Other Bank Guarantees |
|
|
|
|
|
|
|
|
| 15,918,965 |
| 142,886 | ||
Other Financial Guarantees |
|
|
|
|
|
|
|
|
| 2,184,684 |
| 15,926 | ||
Total |
|
|
|
|
|
|
|
|
| 35,260,084 |
| 312,373 | ||
Changes in Allowances for Financial Guarantees | ||||||||||||||
|
|
|
|
|
|
|
|
|
|
|
|
|
|
|
Bank/Consolidated | ||||||||||||||
01/01 to | ||||||||||||||
| 12/31/2017 | |||||||||||||
Balance at Beginning (1) - Initial Adoption - Resolution CMN 4,512) |
|
|
|
|
| 325,957 | ||||||||
Constitution (Note 31) |
|
|
|
|
|
|
|
|
|
|
| 184,300 | ||
Reversal(2) (Note 31) |
|
|
|
|
|
|
|
|
|
|
| (197,884) | ||
Balance at End |
|
|
|
|
|
|
|
|
|
|
| 312,373 | ||
(1) The net amount of tax effect corresponds to R$179,278. | ||||||||||||||
(2) Corresponds to the honored bond, change in rating and provision recorded in the allowance for doubtful accounts. | ||||||||||||||
23. Provisions, Contingent Assets and Liabilities and Legal Obligations - Tax and Social Security | ||||||||||||||
a) Contingent Assets | ||||||||||||||
In the Bank and Consolidated, on December 31, 2017 and 2016, no contingent assets were registered (Note 3.q). | ||||||||||||||
b) Balance Sheet of Provisions for Judicial and Administrative Proceedings and Legal Obligations by Nature | ||||||||||||||
|
|
|
|
|
|
|
|
|
| Bank |
|
|
| Consolidated |
|
|
|
|
|
|
|
| 12/31/2017 |
| 12/31/2016 |
| 12/31/2017 |
| 12/31/2016 |
Reserve for Tax Contingencies and Legal Obligations (Note 22) |
| 4,279,109 |
| 4,522,224 |
| 6,999,881 |
| 7,080,310 | ||||||
Accrual for Legal and Administrative Proceedings - |
| 5,481,162 |
| 4,653,511 |
| 5,994,219 |
| 5,014,004 | ||||||
Labor |
| 3,240,115 |
| 2,988,869 |
| 3,457,092 |
| 3,146,383 | ||||||
Civil |
| 2,241,047 |
| 1,664,642 |
| 2,537,127 |
| 1,867,621 | ||||||
Total |
|
|
|
|
| 9,760,271 |
| 9,175,735 |
| 12,994,100 |
| 12,094,314 | ||
c) Change in Accrual for Judicial and Administrative Proceedings and Legal Obligations | ||||||||||||||
|
|
|
|
|
|
|
|
|
|
|
|
|
| Bank |
01/01 to | 01/01 to | |||||||||||||
|
|
|
|
|
|
|
| 12/31/2017 |
|
|
|
|
| 12/31/2016 |
|
| Tax(3) |
| Labor |
| Civil |
| Tax |
| Labor |
| Civil | ||
Balance at Beginning | 4,522,224 |
| 2,988,869 |
| 1,664,642 |
| 4,475,644 |
| 2,422,387 |
| 1,838,658 | |||
Recognition Net of Reversal(1) |
| (215,721) |
| 1,146,067 |
| 855,173 |
| (140,897) |
| 1,224,189 |
| 368,919 | ||
Inflation Adjustment |
| 240,854 |
| 591,824 |
| 187,175 |
| 361,752 |
| 296,241 |
| 167,757 | ||
Write-offs Due to Payment |
| (281,554) |
| (1,237,299) |
| (448,966) |
| (172,776) |
| (1,122,652) |
| (710,692) | ||
Others |
| 13,306 |
| (249,346) |
| (16,977) |
| (1,499) |
| 168,704 |
| - | ||
Balance at End |
| 4,279,109 |
| 3,240,115 |
| 2,241,047 |
| 4,522,224 |
| 2,988,869 |
| 1,664,642 | ||
Escrow Deposits - |
| 1,031,291 |
| 505,485 |
| 480,187 |
| 1,155,001 |
| 543,795 |
| 442,330 | ||
Escrow Deposits - Securities |
| 19,694 |
| 15,100 |
| 9,369 |
| 13,584 |
| 16,944 |
| 9,479 | ||
Total Escrow Deposits(2) |
| 1,050,985 |
| 520,585 |
| 489,556 |
| 1,168,585 |
| 560,739 |
| 451,809 | ||
|
|
|
|
|
|
|
|
|
|
|
|
|
| Consolidated |
01/01 to | 01/01 to | |||||||||||||
|
|
|
|
|
|
|
| 12/31/2017 |
|
|
|
|
| 12/31/2016 |
| Tax(3) |
| Labor |
| Civil |
| Tax |
| Labor |
| Civil | |||
Balance at Beginning |
| 7,080,310 |
| 3,146,383 |
| 1,867,621 |
| 6,973,763 |
| 2,505,553 |
| 2,008,716 | ||
Recognition Net of Reversal(1) |
| (194,829) |
| 1,221,742 |
| 1,050,067 |
| (255,470) |
| 1,318,798 |
| 512,798 | ||
Inflation Adjustment |
| 398,111 |
| 619,427 |
| 215,088 |
| 550,272 |
| 308,401 |
| 186,976 | ||
Write-offs Due to Payment |
| (284,415) |
| (1,278,427) |
| (572,722) |
| (190,093) |
| (1,159,944) |
| (850,988) | ||
Change in the Scope of |
| (12,832) |
| (1,262) |
| 447 |
| - |
| 3,934 |
| 6,692 | ||
Others |
| 13,536 |
| (250,771) |
| (23,374) |
| 1,838 |
| 169,641 |
| 3,427 | ||
Balance at End |
| 6,999,881 |
| 3,457,092 |
| 2,537,127 |
| 7,080,310 |
| 3,146,383 |
| 1,867,621 | ||
Escrow Deposits - | 2,446,197 |
| 532,815 |
| 501,451 |
| 2,511,454 |
| 564,605 |
| 451,990 | |||
Escrow Deposits - Securities |
| 20,936 |
| 15,100 |
| 9,369 |
| 14,439 |
| 16,944 |
| 9,503 | ||
Total Escrow Deposits(2) |
| 2,467,133 |
| 547,915 |
| 510,820 |
| 2,525,893 |
| 581,549 |
| 461,493 | ||
|
|
|
|
|
|
|
|
|
|
|
|
|
|
|
(1)Tax risks include the constitutions of tax provisions related to lawsuits and administrative proceedings and legal obligations, recorded in the headings tax expenses, other operating income and other operating expenses IR and CSLL. | ||||||||||||||
(2) Refers to the values of escrow deposits, limited to the amount of the provision for contingency and don't include the escrow deposit, for possible contingencies and/or remote and appeal deposits. | ||||||||||||||
| ||||||||||||||
(3) In 2017, it includes the effects of the access on the Sponsored Payments and Installments Programs from the cities of São Paulo and Rio de Janeiro and lawsuits related to IRPJ, CSLL and Social Securities Contributions related to the period from 1999 to 2005 (Note 23.3). | ||||||||||||||
d) Provisions for Contingent Civil, Labor, Tax and Social Security | ||||||||||||||
Banco Santander and its subsidiaries are involved in lawsuits and administrative proceedings related to tax, labor, social security and civil arising in the normal course of its activities. | ||||||||||||||
The provisions were constituted based on the nature, complexity, lawsuits historic and company´s assessment of lawsuit losses based on the opinions of internal and external legal advisors. The Santander has the policy to constitute provision of full amount of lawsuits whose the result of loss assessment is probable. The legal obligation of tax and social security were fully recognized in the financial statements. | ||||||||||||||
Management understands that the provisions recorded are sufficient to meet legal obligations and losses from lawsuits and administrative proceedings as follows: | ||||||||||||||
e) Lawsuits and Administrative Proceedings related to Tax and Social Security | ||||||||||||||
In October 2017, the Bank also joined the Incentive Payment and Installment Programs of the municipalities of São Paulo and Rio de Janeiro. Adhesions to the programs included payment of administrative and legal proceedings related to the ISS, related to the periods 2005 to 2016, in the total of R$292,353 in the Bank and R$292,562 in the Consolidated. As a consequence, provisions were reversed in the amount of R$435,074 in the Bank and R$435,454 in the Consolidated. In the Statement of Income, a reversal of provisions was recorded, net of tax effects, in the total of R$96,029 in the Bank and R$96,129 in the Consolidated. | ||||||||||||||
In August, 2017, The Bank and its affiliates joined a federal amnesty program established by MP (Law) 783/2017 and reissues. | ||||||||||||||
Adherence to the program included administrative proceedings related to IRPJ, CSLL and Social Security Contributions referring to the base periods from 1999 to 2005, in the total of R$534,001, after the benefits of the installment program, of which R$191,897 was paid in August 2017 and R$342,104, which will be realized until January 31, 2018. As a consequence of joining the program, expenses were recorded in income for the period in the amount of R$325,834 in the Bank and R$333,996 in the Consolidated, after tax effects. | ||||||||||||||
The main lawsuits and administrative proceedings related to legal obligations, tax and social security are described as follow: | ||||||||||||||
PIS and Cofins - R$1,775,326 Bank and R$3,514,651 Consolidated (12/31/2016 - R$1,669,219 Bank and R$3,303,368 Consolidated): Banco Santander and its subsidiaries filed lawsuits seeking to eliminate the application of Law 9,718/1998, which modified the calculation basis for PIS and Cofins to cover all revenues of legal entities and not only those arising from the provision of services and sale of goods. Regarding the Banco Santander Process, on April 23, 2015, a STF decision was issued admitting the Extraordinary Appeal filed by the Federal Government regarding PIS and denying the follow-up to the Extraordinary Appeal of the Federal Public Prosecutor regarding Cofins. Both appealed this decision, without any success, so that the suit relating to Cofins is defined, ruling the judgment of the Federal Regional Court of the 4th Region of August 2007, favorable to Banco Santander. The Banco Santander's PIS and the PIS and Cofins liabilities of the other controlled companies are pending final judgment by the STF. | ||||||||||||||
Increase in CSLL Tax Rate - R$366,002 Bank and R$1,009,281 Consolidated (12/31/2016 - R$345,202 Bank and R$948,968 Consolidated): the Bank Santander and its subsidiaries are discussing the increase in the CSLL tax rate, from 9% to 15%, established by Executive Act 413/2008, subsequently converted into Law 11,727/2008, as from April 2008.Judicial proceedings are pending of judgment. | ||||||||||||||
Banco Santander and its subsidiaries are parties in lawsuits and administrative proceedings related to tax and social security matters, which their risk of loss are classified as probable, based on the opinion of legal counsel. | ||||||||||||||
The main topics discussed in these lawsuits are: | ||||||||||||||
Tax on Services (ISS) - Financial Institutions -R$223,139 in the Bank and R$237,960 in the Consolidated (12/31/2016 - R$607,882 in the Bank and R$621,586 in the Consolidated): Banco Santander and its subsidiaries discuss administrative and legal requirements , by several municipalities, of the payment of ISS on various revenues arising from operations that are usually not classified as services. | ||||||||||||||
Social Security Contribution (INSS) - R$265,009 Bank and R$265,022 Consolidated (12/31/2016 - R$259,845 Bank and R$266,391 Consolidated): Banco Santander and its subsidiaries are involved in administrative and judicial proceedings regarding the collection of income tax on social security and education allowance contributions over several funds that, according to the evaluation of legal advisors, do not have nature of salary. | ||||||||||||||
Provisional Contribution on Financial Transactions (CPMF) on Customer Operations - R$714,604 (12/31/2016 - R$689,987) Bank and Consolidated: in May 2003, the Federal Revenue Service issued a tax assessment against Santander Distribuidora de Títulos e Valores Mobiliários Ltda. (Santander DTVM) and another tax assessment against Banco Santander Brasil S.A. The tax assessments refer to the collection of CPMF tax on transactions conducted by Santander DTVM in the cash management of its customers’ funds and clearing services provided by Banco to Santander DTVM in 2000, 2001 and 2002. Based on the risk assessment of legal counsel, the tax treatment was accurate. Santander DTVM had a favorable decision at the Board of Tax Appeals (CARF). Banco Santander had a unfavorable decision and was considered responsible for the collection of the CPMF tax. Both decisions were appealed by the respective losing party to the highest jurisdiction of CARF. In June 2015 , Bank and DTVM had obtained a non favorable decision at CARF. On July 3, 2015 Bank and Produban Serviços de Informática S.A. (actual Santander DTVM company name) filed lawsuit aiming to cancel both tax charges on the period ended December 31, 2017 amounting R$1,432 million. Based on the evaluation of legal advisors, were consisted provision to the probable loss. | ||||||||||||||
f) Lawsuits and Administrative Proceedings of Labor | ||||||||||||||
These are lawsuits filed by labor Unions, Associations, Public Prosecutors and former employees claiming labor rights they believe are due, especially payment for overtime and other labor rights, including retirement benefit lawsuits. | ||||||||||||||
For claims considered to be similar and usual, provisions are recognized based on the payments and successes historic. Claims that do not fit the previous criteria have their provisions constituted according to individual assessment performed, and provisions being constituted based on the risk of loss as probable, the law and jurisprudence according to the assessment of loss made by legal counsel. | ||||||||||||||
g) Lawsuits and Administrative Proceedings of Civil | ||||||||||||||
These contingencies are generally caused by: (1) Lawsuits with a request for revision of contractual terms and conditions or requests for monetary adjustments, including supposed effects of the implementation of various government economic plans, (2) lawsuits deriving of financing agreements, (3) lawsuits of execution; and (4) lawsuits of indemnity by loss and damage. For civil lawsuits considered common and similar in nature, provisions are recorded based on the average of cases closed. Claims that do not fit the previous criteria are provisioned according to individual assessment performed, and provisions are based on the risk of loss as probable, the law and jurisprudence according to the assessment of loss made by legal counsel. | ||||||||||||||
The main processes with the classification of risk of loss as probable are described below: | ||||||||||||||
Lawsuits for Indemnity - seeking indemnity for material and emotional damage, regarding the consumer relationship on matters related to credit cards, consumer credit, bank accounts, collection and loans and other operations. In the civil lawsuits considered to be similar and usual, provisions are recorded based on the average of cases closed. Civil lawsuits that do not fit into the previous criteria are provisioned according to the individual assessment made, being the provisions recognized based on the risk of loss as probable, the law and jurisprudence according to the assessment of loss made by legal counsel. | ||||||||||||||
Economic Plans - they referred to lawsuits filed by savings accountholders, related to supposed inflation purge arising from the Economic Plans (Bresser, Verão, Collor I and II), based on the understanding that such plans violated acquired rights relating to the application of inflation indexes on Saving Accounts, Lawsuits Deposits and Time Deposits (CDB). Provisions arising from such lawsuits are recorded based on the individual evaluationof loss made by external legal consultants. | ||||||||||||||
|
|
|
|
|
|
|
|
|
|
|
|
|
|
|
The Banco Santander is also party in public class lawsuits on the same matter filed by consumer rights organizations, Public Prosecutor’s Offices and Public Defender’s Offices. The provision is made for the lawsuits with the classification of risk as probable, based on the individual execution orders. The STF is still analyzing the subject and has already ordered the suspension of all the procedures except those that were not already decided in courts or in phase of definitive execution. There are decisions favorable to banks at the STF with regard to the economic phenomenon similar to the savings accounts, as in the case of monetary restatement of time deposits - CDB and agreements (present value table). | ||||||||||||||
|
|
|
|
|
|
|
|
|
|
|
|
|
|
|
However, the Supreme Court´s jurisprudence has not come to a conclusion regarding the constitutionality of the norms that changed Brazil’s monetary standard. On April 14, 2010, the STJ was recently decided that the deadline for the filing of civil lawsuits that argue the government's purge is five years, but this decision has not been handed down on the lawsuits yet. Thus, with this decision, a majority lawsuits, as they were filed after the period of five years is likely to be rejected, reducing the values involved. Still, the STF decided that the deadline for individual savers to become party on the public civil litigations, is also five years, counted from the final unappealable sentence. Banco Santander believes in the success of the arguments defended in these courts based on their content and the legal basis. | ||||||||||||||
|
|
|
|
|
|
|
|
|
|
|
|
|
|
|
At the end of 2017, the General Union Law (AGU), Bacen, Institute of Consumer Protection (Idec), the Brazilian Front of the Moneysavers (Febrapo), the Brazilian Banks Federation (Febraban) have signed an agreement with the purpose to close all lawsuits related to Economic Plans. | ||||||||||||||
|
|
|
|
|
|
|
|
|
|
|
|
|
|
|
The discussions focused on the definition of the amount that would be paid to each person according to the oustanding balance in the saving account. The total amount of the payments will depend on the number of the additional clients, and also on the number of moneysavers that approved in the courts the existance of their account and balance in the birthday date of the indexes changes. The term of the agreement signed by the parties was submitted to the STF, which is responsible to decide about its viability. | ||||||||||||||
|
|
|
|
|
|
|
|
|
|
|
|
|
|
|
The Management considers that the provision made are enough to cover the risks involved in the economic plans, considering the possible agreement which awaits the Supreme Court decision. | ||||||||||||||
h) Civil, Labor, Tax, and Security Social Liabilities Contingent Classified with Loss Risk as Possible | ||||||||||||||
Refer to lawsuits and administrative proceedings involving tax, labor and civil matters classified by legal counsels with loss risk as possible, which they were not recorded. | ||||||||||||||
The tax lawsuits classification with loss risk as possible, totaled R$18,741 million, being the main lawsuits as follow: | ||||||||||||||
Credit Losses - Bank and its subsidiaries challenged the tax assessments issued by the Federal Revenue Services claiming the deduction for credit losses because they fail to meet the relevant requirements under applicable law. As of December 31, 2017 the amount related to this claim is approximately R$436 million. | ||||||||||||||
INSS on Profits or Results (PLR) - Bank and the subsidiaries are involved in several lawsuits and administrative proceedings against the tax authorities in connection with the taxation for social security purposes of certain items which are not considered to be employee remuneration. As of December 31, 2017 the amounts related to these proceedings totaled approximately R$3,929 million. | ||||||||||||||
IRPJ and CSLL - Capital Gain - the Federal Tax Office of Brazil issued infraction notices against Santander Seguros, successor company of ABN AMRO Brasil Dois Participações S.A. (AAB Dois Par), charging income Tax and Social Contribution to related base year 2005. The Federal Tax Office of Brazil claims that capital gain in sales of shares from Real Seguros S.A and Real Vida Previdência S.A. by AAB Dois Par should be taxed by the rate of 34% instead 15%. The assessment was contested administratively based on understanding that tax treatment adopted at the transaction was in compliance with tax laws and capital gain was taxed properly. The administrative lawsuit is awaiting trial. The Banco Santander is responsible for any adverse outcome in this lawsuit as former Zurich Santander Brasil Seguros e Previdência S.A. stockholder. As of December 31, 2017 the amount related to this lawsuit is approximately R$292 million. | ||||||||||||||
Goodwill Amortization of Banco Real - the Federal Tax Office of Brazil issued infraction notices against the Bank to require the income tax and social payments, including late charges, for the period of 2009. The Tax Authorities considered that the goodwill related to acquisition of Banco Real, amortized for accounting purposes prior to the merger, could not be deduced by Banco Santander for tax purposes. The infraction notice was contested. On July 14, 2015, the Police Judging RFB decided favorably to Banco Santander, fully canceling the tax debt. On November 10, 2016, the appeal was filed, prompting the Bank to lodge an appeal with CARF, which is awaiting judgment.On December 31, 2017, the balance was approximately R$1,332 million. | ||||||||||||||
Goodwill Amortization of Banco Sudameris-the Tax Authorities have issued infraction notices to require the income tax and social contribution payments, including late charges, relating to tax deduction of amortization of goodwill from the acquisition of Banco Sudameris, related to the period of 2007 to 2012. Banco Santander timely presented its appeals, which are pending. On December 31, 2017, the balance was approximately R$609 million. | ||||||||||||||
Unapproved Compensation - The Bank and its affiliates discuss administrative and legal proceedings with the Federal Revenue Office to grant tax relief with credits arising from overpayments. On December 31, 2017, approximately R$2,230 million. | ||||||||||||||
The labor claims with classification of loss risk as possible totaled R$29 million, excluding the lawsuits below: | ||||||||||||||
Semiannual Bonus or PLR -a labor lawsuit relating to the payment of a semiannual bonus or, alternatively, profit sharing, to retired employees from Banco do Estado de São Paulo S.A. - Banespa, that had been hired up to May 22, 1975, filed by Banespa’s Retirees Association. This lawsuit was dismissed against the Bank by the Superior Labor Court. The STF rejected the extracommon appeal of the Bank by a monocratic decision maintaining the earlier condemnation. Santander filed a Regimental Appeal which holds STF´s decision. The Regimental Appeal is an internal appeal filed in the STF, in order to refer the monocratic decision to a group of five ministers. The 1st Class of the Supreme Court upheld the appeal by the Bank and denied the Afabesp. The subjects of the extracommon appeal of the Bank will move forward to the Supreme Court for decision on overall impact and judgment. The amount related to this claim is not disclosed due to the current stage of the lawsuit and such disclosure may impact the progress of the claim. | ||||||||||||||
Readjustment of Banesprev retirement complements by the IGPDI -lawsuit filed in 2002 in Federal Court by the Association of Retired Employees of the Banco do Estado de São Paulo S.A. - Banespa, requesting the readjustment of the retirement supplementation by the IGPDI for Banespa retirees who have been admitted until May 22, 1975. The judgment granted the correction but only in the periods in which no other form of adjustment could be applied. The Bank and Banesprev have appealed this decision and although the appeals have not yet been judged, the Bank's success rate in this matter in the High Courts is around 90%. In Provisional Execution, calculations were presented by the Bank and Banesprev with "zero" result due to the exclusion of participants who, among other reasons, are listed as authors in other lawsuits or have already had some type of adjustment. The amount related to this claim is not disclosed due to the current stage of the lawsuit and such disclosure may impact the progress of the claim. | ||||||||||||||
The liabilities related to civil lawsuits with classification of loss risk as possible totaled R$1,356 million, being the main lawsuits as follow: | ||||||||||||||
Indemnity Lawsuit Arising of the Banco Bandepe - related to mutual agreement on appeal to the Justice Superior Court (STJ - Superior Tribunal de Justiça). | ||||||||||||||
Indemnity Lawsuit Related to Custody Services - provided by Banco Santander at an early stage which was not handed down yet. | ||||||||||||||
Lawsuit Arising from a Contractual Dispute - the acquisition of Banco Geral do Comércio S.A. on appeal to the Court of the State of São Paulo (TJSP - Tribunal de Justiça do Estado de São Paulo). | ||||||||||||||
i) Other Lawsuits Under the Responsibility of Former Controlling Stockholders | ||||||||||||||
Refer to tax, labor and civil lawsuits, in the amounts of R$616,934, R$2,607 and R$6,383 (12/31/2016 - R$719,574, R$712 and R$3,830) in the Bank and R$698,141, R$2,607 and R$6,383 (12/31/2016 - R$810,383, R$712 and R$3,830) in the Consolidated, respectively, recorded in other financial liabilities (Note 22) which the responsible people were the former controlling stockholders of the Bank and acquired companies. Based on the agreement signed, these lawsuits have guaranteed reimbursement from part of the former controllers, whose respective duties were recorded in other receivables - others (Note 12). | ||||||||||||||
a) Capital | ||||||||||||||
According to the by-laws, Banco Santander's capital stock may be increased up to the limit of its authorized capital, regardless of statutory reform, by resolution of the Board of Directors and through the issuance of up to 9,090,909,090 (nine billion, ninety million, nine hundred and nine thousand and ninety) shares, subject to the established legal limits on the number of preferred shares. Any capital increase that exceeds this limit will require stockholders' approval. | ||||||||||||||
|
|
|
|
|
|
|
|
|
|
|
|
|
| Shares in Thousands |
|
|
|
|
|
|
|
| 12/31/2017 |
|
|
|
|
| 12/31/2016 |
|
|
|
| Common |
| Preferred |
| Total |
| Common |
| Preferred |
| Total |
Brazilian Residents |
| 66,207 |
| 91,779 |
| 157,986 |
| 67,497 |
| 92,949 |
| 160,446 | ||
Foreign Residents |
| 3,752,488 |
| 3,588,057 |
| 7,340,545 |
| 3,783,474 |
| 3,619,163 |
| 7,402,637 | ||
Total |
| 3,818,695 |
| 3,679,836 |
| 7,498,531 |
| 3,850,971 |
| 3,712,112 |
| 7,563,083 | ||
(-) Treasury Shares |
| (5,845) |
| (5,845) |
| (11,690) |
| (25,786) |
| (25,786) |
| (51,572) | ||
Total Outstanding |
| 3,812,850 |
| 3,673,991 |
| 7,486,841 |
| 3,825,185 |
| 3,686,326 |
| 7,511,511 | ||
b) Dividends and Interest on Capital | ||||||||||||||
According to the Bank’s bylaws, stockholders are entitled to a minimum dividend equivalent to 25% of net income for the year, adjusted according to legislation. Preferred shares are nonvoting and nonconvertible, but have the same rights and advantages granted to common shares, in addition to priority in the payment of dividends at a rate that is 10% higher than those paid on common shares, and in the capital reimbursement, without premium, in the event of liquidation of the Bank. | ||||||||||||||
Dividend payments have been calculated and paid in accordance with Brazilian Corporate Law. | ||||||||||||||
Prior to the Annual Stockholders Meeting, the Board of Directors may resolve on the declaration and payment of dividends on earnings based on (i) balance sheets or earning reserves showed in the last balance sheet; or (ii) balance sheets issued in the period shorter than 6 months, since the total of dividends paid in each half of the fiscal year shall not exceed the amount of capital reserves. These dividends are fully attributed to the mandatory dividend. | ||||||||||||||
|
|
|
|
|
|
|
|
|
|
|
|
|
| 12/31/2017 |
| In Thousands | Brazilian Real per Thousand Shares/Units | ||||||||||||
|
|
|
|
|
| of Brazilian Real |
| Common |
| Preferred |
| Units | ||
Interest on Capital(1) (6) |
|
|
|
|
|
|
| 500,000 |
| 63.3780 |
| 69.7158 |
| 133.0938 |
Interest on Capital(2) (6) |
|
|
|
|
|
|
| 500,000 |
| 63.5280 |
| 69.8808 |
| 133.4088 |
Interest on Capital(3) (6) |
|
|
|
|
|
|
| 500,000 |
| 63.5917 |
| 69.9509 |
| 133.5427 |
Intercalary Dividends(4) (6) |
|
|
|
|
|
|
| 2,500,000 |
| 318.2994 |
| 350.1293 |
| 668.4287 |
Interest on Capital(5) (6) |
|
|
|
|
|
|
| 2,300,000 |
| 292.8354 |
| 322.1190 |
| 614.9544 |
Total |
|
|
|
|
| 6,300,000 |
|
|
|
|
|
| ||
|
|
|
|
|
|
|
|
|
|
|
|
|
|
|
(1) Established by the Board of Directors in April 2017, Common Shares- R$53.8713, preferred - R$59.2584 and Units - R$113.1297 net of taxes. | ||||||||||||||
(2) Established by the Board of Directors in July 2017, Common Shares- R$53.9988, preferred - R$59.3987 and Units - R$113.3975 net of taxes. | ||||||||||||||
(3) Established by the Board of Directors in September 2017, Common Shares- R$54.0530, preferred - R$59.4583 and Units - R$113.5113 net of taxes. | ||||||||||||||
(4) Established by the Board of Directors in December 2017. | ||||||||||||||
|
|
|
|
|
|
|
|
|
|
|
|
|
|
|
(5) Established by the Board of Directors in December 2017, Common Shares- R$248.9101, preferred - R$273.8011 and Units - R$522.7112 net of taxes. | ||||||||||||||
|
|
|
|
|
|
|
|
|
|
|
|
|
|
|
(6) The amount of interest on stockholders' equity and interim dividends will be fully charged to the mandatory dividends for the year 2017. | ||||||||||||||
|
|
|
|
|
|
|
|
|
|
|
|
|
| 12/31/2016 |
| In Thousands | Brazilian Real per Thousand Shares/Units | ||||||||||||
|
|
|
|
|
| of Brazilian Real |
| Common |
| Preferred |
| Units | ||
Interest on Capital(1) (4) |
|
|
|
|
|
|
| 500,000 |
| 63.4290 |
| 69.7719 |
| 133.2009 |
Intermediate Dividends(2) (4) |
|
|
|
|
|
|
| 700,000 |
| 88.8309 |
| 97.7140 |
| 186.5448 |
Intercalary Dividends(2) (4) |
|
|
|
|
|
|
| 700,000 |
| 88.8309 |
| 97.7140 |
| 186.5448 |
Interest on Capital(3) (4) |
|
|
|
|
|
|
| 3,350,000 |
| 425.1192 |
| 467.6311 |
| 892.7503 |
Total |
|
|
|
|
| 5,250,000 |
|
|
|
|
|
| ||
|
|
|
|
|
|
|
|
|
|
|
|
|
|
|
(1) Established by the Board of Directors in June 2016, Common Shares- R$53.9146, preferred - R$59.3061 and Units - R$113.2207 net of taxes. | ||||||||||||||
(2) Established by the Board of Directors in December 2016. | ||||||||||||||
(3) Established by the Board of Directors in December 2016, Common Shares- R$361.3513, preferred - R$397.4864 and Units - R$758.8377 net of taxes. | ||||||||||||||
(4) The amount of interest on stockholders' equity and interim dividends will be fully charged to the mandatory dividends for the year 2016. | ||||||||||||||
c) Reserves | ||||||||||||||
Net income, after deductions and statutory provisions, will be allocated as follows: | ||||||||||||||
Legal Reserve | ||||||||||||||
According to Brazilian corporate law, 5% to the legal reserve, until it reaches 20% of the share capital. This reserve is intended to ensure the integrity of capital and can only be used to offset losses or increase capital. | ||||||||||||||
Capital Reserve | ||||||||||||||
The Bank´s capital reserve consists of: goodwill reserve for subscription of shares and other capital reserves, and can only be used to absorb losses that exceed retained earnings and profit reserves, redemption, reimbursement or acquisition of shares for the Bank´s own issue; capital increase, or payment of dividends to preferred shares under certain circumstances. | ||||||||||||||
Reserve for Equalization Dividend | ||||||||||||||
After the allocation of dividends, the remaining balance if any, may, upon proposal of the Executive Board and approved by the Board of Directors, be allocated to reserve for equalization of dividends, which will be limited to 50% of the share capital. This reserve aims to ensure funds for the payment of dividends, including as interest on own capital, or any interim payment to maintain the flow of stockholders remuneration. | ||||||||||||||
d) Treasury Shares | ||||||||||||||
In the meeting held on November 1, 2017, the Bank’s Board of Directors approved, in continuation of the buyback program that expired on November 3, 2017, the buyback program of its Units and ADRs, by the Bank or its agency in Cayman, to be held in treasury or subsequently sold. | ||||||||||||||
|
|
|
|
|
|
|
|
|
|
|
|
|
|
|
The Buyback Program will cover the acquisition up to 38,717,204 Units, representing 38,717,204 common shares and 38,717,204 preferred shares, or the ADRs, which, on September 30, 2017, corresponded to approximately 1.03% of the Bank’s share capital. On September 30, 2017, the Bank held 373,269,828 common shares and 401,074,242 preferred shares being traded. | ||||||||||||||
|
|
|
|
|
|
|
|
|
|
|
|
|
|
|
The Buyback has the purpose to (1) maximize the value creation to stockholders by means of an efficient capital structure management; and (2) enable the payment of officers, management level employees and others Bank’s employees and companies under its control, according to the Long Term Incentive Plans. The term of the Buyback Program is 365 days counted from November 6, 2017, and will expire on November 5, 2018. | ||||||||||||||
|
|
|
|
|
|
|
|
|
|
|
|
|
| Bank/Consolidated |
Shares in Thousands | ||||||||||||||
|
|
|
|
|
|
|
|
|
| 12/31/2017 |
|
|
| 12/31/2016 |
|
| Quantity |
|
| Quantity | |||||||||
|
|
|
|
|
|
|
|
|
| Units |
| Units |
| ADRs |
Treasury Shares at Beginning of the Exercise |
|
|
|
|
| 25,786 |
| 7,080 |
| 13,138 | ||||
Cancellation of ADRs(1) (2) |
|
|
|
|
|
|
| (32,276) |
| 13,138 |
| (13,138) | ||
Shares Acquisitions |
|
|
|
|
|
|
| 12,768 |
| 14,284 |
| - | ||
Payment - Share-Based Compensation |
|
|
|
|
| (4,505) |
| (8,716) |
| - | ||||
Treasury Shares at Beginning of the Exercise |
|
|
|
|
| 1,773 |
| 25,786 |
| - | ||||
Subtotal - Treasury Shares in Thousands of Reais |
|
|
|
|
|
|
|
|
| R$ 148,246 |
| R$ 513,889 |
| - |
Issuance Cost in Thousands of Reais |
|
|
|
|
|
|
|
|
| R$ 194 |
| R$ 145 |
| - |
Balance of Treasury Shares in Thousands of Reais |
|
|
|
|
|
|
|
|
| R$ 148,440 |
| R$ 514,034 |
| - |
|
|
|
|
|
|
|
|
|
|
|
|
|
|
|
Cost/Market Value |
|
|
|
|
|
|
| Units |
| Units |
| ADRs | ||
Minimum Cost |
|
|
|
|
|
|
| R$7.55 |
| R$7.55 |
| US$4.37 | ||
Weighted Average Cost |
|
|
|
|
|
|
| R$24.41 |
| R$19.93 |
| US$6.17 | ||
Maximum Cost |
|
|
|
|
|
|
| R$32.29 |
| R$26.81 |
| US$10.21 | ||
Market Value |
|
|
|
|
|
|
| R$27.64 |
| R$28.32 |
| US$8.58 | ||
(1) In January 2016 there was the transformation of all ADRs that were held in treasury for UNIT's. | ||||||||||||||
(2) At the Extraordinary General Meeting held on September 18, 2017, the cancellation of 64,551,366 treasury shares (equivalent to 32,276 hundred Units) , representing the totality of the treasury shares recorded in the book of registry of nominative shares on that date, with no capital reduction, and the consequent amendment of caput of article 5 of the Bylaws, in order to reflect the new amount of common and preferred shares, nominative and without par value representing the Banco Santander share capital. | ||||||||||||||
Additionally, in the period ended on December 31, 2017, treasury shares were traded, that resulted in a loss of R$2,498 (2016 - loss of R$11,574) recorded directly in equity in capital reserves. | ||||||||||||||
e) Consolidated Stockholders’ Equity - Unrealized Income | ||||||||||||||
The consolidated stockholders’ equity is reduced mainly to unrealized income of R$6,008 (12/31/2016 - R$16,947). In 2017, there were realized results in the amounting of R$705 (2016 - R$11,325). In 2016 includes values referred to trading with third parties NTN-C and part of NTN-F, related to the sale made by Banco Santander to Santander Leasing (Note 6. a III) recorded in 2012 as unrealized results in the amount of R$514,532. | ||||||||||||||
f) Non Controlling Interest | |||||||||
|
|
|
|
|
|
|
|
|
|
|
| Stockholders’ Equity |
|
| Income | ||||
01/01 a | 01/01 a | ||||||||
|
|
| 12/31/2017 |
| 12/31/2016 |
| 12/31/2017 |
| 12/31/2016 |
Banco RCI Brasil S.A. (Note 15) |
| 649,341 | 797,963 | (111,897) | (47,621) | ||||
Santander Leasing (Note 15) |
| 395 |
| 441 |
| (47) |
| (41) | |
Getnet S.A. (Note 15) |
| 206,105 |
| 168,863 |
| (48,842) |
| (21,306) | |
Santander Brasil Advisory (Note 15) | - |
| 529 |
| - |
| (34) | ||
BW Guirapá I S.A. (Note 15 and 37.e) | - |
| 68,691 |
| 795 |
| (6,223) | ||
Olé Consignado (Note 15) |
| 322,431 |
| 270,425 |
| (53,286) |
| (5,432) | |
Banco PSA (Note 15) |
| 147,295 |
| 138,057 |
| (19,884) |
| (2,883) | |
Santander Serviços (Note 15) |
| - |
| 313,391 |
| (88,089) |
| (96,667) | |
FI Direitos Creditórios RCI Brasil I (Note 2) | 268,792 |
| 468,656 |
| (43,876) |
| 48,505 | ||
FI RN Brasil - Financiamento de Veículos (Note 2) | 301,736 |
| 298,434 |
| (28,563) |
| 7,276 | ||
Outros |
| 597 |
| 296 |
| 155 |
| (367) | |
Total |
|
| 1,896,692 |
| 2,525,746 |
| (393,534) |
| (124,793) |
25. Operational Ratios | |||||||||
In July 2008 came into force the rules on regulatory capital measurement by the Standardized Approach of Basel II. On 2013 was issued a set of Resolutions and Circulars, aligned with the recommendations of the Basel Committee on Banking Supervision. These rules were repealed by CMN Resolution 4,192 and 4,193 which took effect from October 2013, establishing the model for calculating the minimum Regulatory Capital requirements, Tier I and Common Equity Tier I. These Resolutions states that the composition of the Regulatory Capital is done through equity, subordinated debt and hybrid capital instruments. | |||||||||
As required by Resolution CMN 4,193/2013, the requirement for PR in 2016 was 10.5%, composed of 9.875% of Reference Equity Minimum plus 0.625% of Capital Conservation Additional. Considering this additional, PR Level I increased to 6.625% and Minimum Principal Capital to 5.125%. | |||||||||
For the base year 2017, the PR requirement remains at 10.5%, including 9.25% of Minimum of Reference Equity and a further 1.25% of Capital Conservation Additional. The PR Level I reaches 7.25% and the Principal Capital Minimum 5.75%. | |||||||||
As a continuation the adoption of the rules established by CMN Resolution 4,192/2013, as of January 2015, came into force the Prudential Conglomerate, defined by CMN Resolution 4,280/2013. | |||||||||
The index is calculated on a consolidated basis based on the information of Consolidated Prudential, as shown below: | |||||||||
|
|
|
|
|
|
|
| ||
|
|
|
|
|
|
| 12/31/2017 |
| 12/31/2016 |
Tier I Regulatory Capital |
|
|
|
|
| 56,386,001 |
| 56,264,021 | |
Principal Capital |
|
|
|
|
| 52,196,893 |
| 52,136,837 | |
Supplementary Capital (Note 21) |
|
|
|
|
| 4,189,108 |
| 4,127,184 | |
Tier II Regulatory Capital (Note 21) |
|
|
|
|
| 4,250,447 |
| 4,280,864 | |
Regulatory Capital (Tier I and II) |
|
|
|
| 60,636,448 |
| 60,544,885 | ||
Credit Risk(1) |
|
|
|
|
| 324,696,458 |
| 317,062,725 | |
Market Risk(2) |
|
|
|
|
| 25,857,109 |
| 24,188,620 | |
Operational Risk |
|
|
|
|
| 32,579,126 |
| 30,086,072 | |
Total RWA(3) |
|
|
|
|
| 383,132,693 |
| 371,337,417 | |
Basel I Ratio |
|
|
|
|
|
| 14.72 |
| 15.15 |
Basel Principal Capital |
|
|
|
|
|
| 13.62 |
| 14.04 |
Basel Regulatory Capital |
|
|
|
|
| 15.83 |
| 16.30 | |
(1) Exposures to credit risk subject to the calculation of the capital requirement using a standardized approach (RWACPAD) are based on the procedures established by Circular Bacen 3,644, dated March 4, 2013 and its subsequent complements through the wording of Circular Bacen 3,174 of August 20, 2014 and Bacen Circular 3,770 of October 29, 2015. | |||||||||
(2) Includes portions for market risk exposures subject to variations in rates of foreign currency coupons (RWAjur2), price indexes (RWAjur3) and interest rate (RWAjur1/RWAjur4), the price of commodities (RWAcom), the price of shares classified as trading portfolios (RWAacs), and portions for gold exposure and foreign currency transactions subject to foreign exchange (RWAcam). | |||||||||
(3) Risk Weighted Assets. | |||||||||
Banco Santander, quarterly discloses Pillar III information relating to risk management, Regulatory Capital and Risk Weighted Assets. A report with further details of the structure and methodology will be disclosed on the website www.ri.santander.com.br/ri. | |||||||||
Financial institutions are required to maintain investments in permanent assets compatible with adjusted regulatory capital. Funds invested in permanent assets, calculated on a consolidated basis, are limited to 50% of adjusted regulatory capital, as per prevailing regulation. Banco Santander classifies for said index. The Bank is in compliance with the requirements aforementioned. | |||||||||
26. Related Parties | ||||||||||||||
a) Key Management Personnel Compensation | ||||||||||||||
The Board of Directors' meeting, held on March 28, 2017 approved, in accordance with the Compensation Committee the maximum global compensation proposal for the directors (Board of Directors and Executive Officers) overall amounting to R$300,000 for the 2017 financial year, covering fixed remuneration, variable and equity-based and other benefits. The proposal was approved by the Ordinary General Meeting (OGM) held on April 28, 2017. | ||||||||||||||
a.1) Long Term Benefits | ||||||||||||||
The Bank, likewise Banco Santander Spain and other companies controlled by Santander Group, develops long-term compensation programs-tied to the performance of the market price of its shares, based on the achievement of certain goals (Note 35.f). | ||||||||||||||
a.2) Short Term Benefits | ||||||||||||||
The table below shows the salary of Board of Directors and Executive Board: | ||||||||||||||
|
|
|
|
|
|
|
|
|
|
|
|
|
|
|
01/01 to | 01/01 to | |||||||||||||
|
|
|
|
|
|
|
|
|
|
|
| 12/31/2017 |
| 12/31/2016 |
Fixed Compensation |
|
|
|
|
|
|
|
|
| 85,163 |
| 91,115 | ||
Variable Compensation |
|
|
|
|
|
|
|
|
| 140,044 |
| 120,632 | ||
Others |
|
|
|
|
|
|
|
|
| 12,893 |
| 15,555 | ||
Total Short-Term Benefits |
|
|
|
|
|
|
|
|
| 238,100 |
| 227,302 | ||
Shares Based Payments |
|
|
|
|
|
|
|
|
| 3,187 |
| 49,488 | ||
Total Long-Term Benefits |
|
|
|
|
|
|
|
|
| 3,187 |
| 49,488 | ||
Total(1) |
|
|
|
|
|
|
|
|
| 241,287 |
| 276,790 | ||
(1) Refers to the amount paid by Banco Santander and its subsidiaries to their Managers for positions they hold at Banco Santander and other companies in the Conglomerate Santander. | ||||||||||||||
Additionally, in 2017, charges were collected on Management compensation in the amount of R$31,709 (2016 - R$30,823). | ||||||||||||||
b) Contract Termination | ||||||||||||||
The termination of the employment relationship of managers for non-fulfillment of obligations or voluntarily by the employee does not give right to any financial compensation. | ||||||||||||||
c) Lending Operations | ||||||||||||||
The current law prevents the Bank to grant loans or advances to: | ||||||||||||||
I - officers, members of the Board of Directors and Audit Committee as well as their spouses and relatives up to the second degree; | ||||||||||||||
II - individuals or legal entities that holds more than 10% of Banco Santander´s share capital; | ||||||||||||||
III - legal entities in which Banco Santander holds more than 10% of its share capital; | ||||||||||||||
IV - legal entities in which any of the officers, members of the Board of Directors and Audit Committee, as well as their spouses or relatives up to the second degree, hold more than 10% of the share capital. | ||||||||||||||
d) Ownership Interest | ||||||||||||||
The table below shows the direct interest (common and preferred shares): | ||||||||||||||
| ||||||||||||||
|
|
|
|
|
|
|
|
|
|
|
|
|
| Shares in Thousands |
12/31/2017 | ||||||||||||||
Preferred | Total | |||||||||||||
Common Shares | Preferred | Shares | Total | Shares | ||||||||||
Stockholders' |
|
|
| Common Shares |
| (%) |
| Shares |
| (%) |
| Shares |
| (%) |
Sterrebeeck B.V.(1) |
| 1,809,583 |
| 47.4% |
| 1,733,644 |
| 47.1% |
| 3,543,227 |
| 47.2% | ||
Grupo Empresarial Santander, | 1,107,673 |
| 29.0% |
| 1,019,645 |
| 27.7% |
| 2,127,318 |
| 28.4% | |||
Banco Santander, S.A.(1) |
| 521,964 |
| 13.6% |
| 519,268 |
| 14.1% |
| 1,041,232 |
| 13.9% | ||
Employees |
| 3,551 |
| 0.1% |
| 3,556 |
| 0.1% |
| 7,107 |
| 0.1% | ||
Directors (*) |
| 4,016 |
| 0.1% |
| 4,016 |
| 0.1% |
| 8,032 |
| 0.1% | ||
Others |
| 366,063 |
| 9.6% |
| 393,862 |
| 10.7% |
| 759,925 |
| 10.1% | ||
Total Outstanding |
| 3,812,850 |
| 99.8% |
| 3,673,991 |
| 99.8% |
| 7,486,841 |
| 99.8% | ||
Treasury Shares |
| 5,845 |
| 0.2% |
| 5,845 |
| 0.2% |
| 11,690 |
| 0.2% | ||
Total |
| 3,818,695 |
| 100.0% |
| 3,679,836 |
| 100.0% |
| 7,498,531 |
| 100.0% | ||
Free Float (2) |
| 369,614 |
| 9.7% |
| 397,418 |
| 10.8% |
| 767,032 |
| 10.2% | ||
|
|
|
|
|
|
|
|
|
|
|
|
|
| Shares in Thousands |
12/31/2016 | ||||||||||||||
Preferred | Total | |||||||||||||
Common Shares | Preferred | Shares | Total | Shares | ||||||||||
Stockholders' |
|
|
| Common Shares |
| (%) |
| Shares |
| (%) |
| Shares |
| (%) |
Sterrebeeck B.V.(1) |
| 1,809,583 |
| 47.0% |
| 1,733,644 |
| 46.7% |
| 3,543,227 |
| 46.9% | ||
GES(1) | 1,107,673 |
| 28.8% |
| 1,019,645 |
| 27.5% |
| 2,127,318 |
| 28.1% | |||
Banco Santander, S.A.(1) |
| 521,965 |
| 13.6% |
| 519,268 |
| 14.0% |
| 1,041,233 |
| 13.8% | ||
Qatar Holding |
|
|
| 207,812 |
| 5.4% |
| 207,812 |
| 5.6% |
| 415,624 |
| 5.5% |
Employees |
| 3,914 |
| 0.1% |
| 3,929 |
| 0.1% |
| 7,843 |
| 0.1% | ||
Members of the Board of Directors | (*) |
| (*) |
| (*) |
| (*) |
| (*) |
| (*) | |||
Members of the Executive Board |
| (*) |
| (*) |
| (*) |
| (*) |
| (*) |
| (*) | ||
Others |
| 174,238 |
| 4.5% |
| 202,028 |
| 5.5% |
| 376,266 |
| 5.0% | ||
Total Outstanding |
| 3,825,185 |
| 99.4% |
| 3,686,326 |
| 99.4% |
| 7,511,511 |
| 99.4% | ||
Treasury Shares |
|
|
| 25,786 |
| 0.6% |
| 25,786 |
| 0.6% |
| 51,572 |
| 0.6% |
Total |
| 3,850,971 |
| 100.0% |
| 3,712,112 |
| 100.0% |
| 7,563,083 |
| 100.0% | ||
Free Float (2) |
|
|
| 385,964 |
| 10.0% |
| 413,769 |
| 11.1% |
| 799,733 |
| 10.6% |
|
|
|
|
|
|
|
|
|
|
|
|
|
|
|
(1)Companies of the Santander Spain Group. | ||||||||||||||
(2) In 2017, composed of Officials and Others. | ||||||||||||||
(*) None of the members of the Board of Directors and the Executive Board holds 1.0% or more of any class of shares. | ||||||||||||||
d.1) Qatar Holding LLC's Public Offering | ||||||||||||||
On April 11, 2017, Banco Santander Brasil informed its stockholders and the market in general, in furtherance of the material facts disclosed on March 28, 2017 and April 6, 2017, the settlement of the secondary public offering for the distribution of eighty million (80,000,000) Units issued by Banco Santander Brasil and held by Qatar Holding LLC (Selling Stockholder), including in the form of American Depositary Shares (ADSs), allocating twenty-two million (22,000,000) Units for the Brazilian offering and fifty-eight million (58,000,000) ADSs for the international offering. The price per Unit was set at twenty-five reais (R$25.00), resulting on a total amount of two billion reais (R$2,000,000,000.00). Additionally, the amount of Units of the international offering initially offered was increased by an additional batch of twelve million (12,000,000) Units, exclusively in the form of ADSs also held by the Selling Stockholder. | ||||||||||||||
e) Related-Party Transactions | ||||||||||||||
Santander has a Policy for Related Party Transactions approved by the Board of Directors, which aims to ensure that all transactions typified by the policy to take effect in view of the interests of Banco Santander and its stockholders. The policy defines the power to approve certain transactions by the Board of Directors. The planned rules also apply to all employees and officers of Banco Santander and its subsidiaries. | ||||||||||||||
Operations and charges for services with related parties are carried out in the ordinary course of business and under reciprocal conditions, including interest rates, terms and guarantees, and do not entail greater risk than the normal collection or have other disadvantages. | ||||||||||||||
The main transactions and balance are as follows: | ||||||||||||||
|
|
|
|
|
|
|
|
|
|
|
|
|
|
|
|
|
|
|
|
|
|
|
|
|
|
| Bank | ||
Assets | Income | Assets | Income | |||||||||||
(Liabilities) |
| (Expenses) | (Liabilities) |
| (Expenses) | |||||||||
01/01 to | 01/01 to | |||||||||||||
|
|
|
|
|
|
|
| 12/31/2017 |
| 12/31/2017 |
| 12/31/2016 |
| 12/31/2016 |
Cash |
|
|
|
| 523,801 |
| - |
| 402,617 |
| - | |||
Banco Santander Espanha(2) |
|
|
|
|
| 519,543 |
| - |
| 400,205 |
| - | ||
Banco Santander (México), S.A.(4) |
|
|
| 1,348 |
| - |
| 1,034 |
| - | ||||
Banco Santander Totta, S.A.(4) |
|
|
|
|
| 2,733 |
| - |
| 1,261 |
| - | ||
Others |
|
|
|
|
| 177 |
| - |
| 117 |
| - | ||
Interbank Investments |
|
|
|
|
| 53,590,339 |
| 4,458,335 |
| 45,801,141 |
| 4,535,632 | ||
Aymoré CFI(3) |
|
|
|
|
| 33,802,456 |
| 3,204,613 |
| 27,473,607 |
| 3,588,665 | ||
Banco Santander Espanha(1) (2) |
|
|
|
|
| 7,384,336 |
| 81,904 |
| 10,269,812 |
| 37,381 | ||
Banco PSA(3) |
|
|
|
|
| 1,112,049 |
| 104,697 |
| 832,849 |
| 40,355 | ||
Banco RCI Brasil S.A.(3) |
|
|
|
|
| 1,189,751 |
| 87,381 |
| 589,376 |
| 114,909 | ||
Banco Bandepe (3) |
|
|
|
|
| 848,896 |
| 26,013 |
| - |
| - | ||
Olé Consignado(3) |
|
|
|
|
| 9,252,851 |
| 953,727 |
| 6,635,497 |
| 754,322 | ||
Securities |
|
|
|
|
| 31,379,028 |
| 4,933,037 |
| 67,744,952 |
| 10,492,182 | ||
Santander Leasing(3) |
|
|
|
|
| 31,379,028 |
| 4,933,037 |
| 67,744,952 |
| 10,492,182 | ||
Derivatives Financial Instruments - Net |
|
|
| (98,311) |
| (130,480) |
| (170,020) |
| 553,129 | ||
Real Fundo de Investimento Multimercado Santillana Crédito Privado | 165,743 |
| (79,480) |
| (155,095) |
| 257,475 | |||||
Abbey National Treasury Services Plc (Abbey National Treasury)(4) |
| (71,672) |
| 23,843 |
| (91,828) |
| 38,274 | ||||
Banco Santander Espanha(2) |
|
|
|
|
| (196,333) |
| 88,017 |
| 70,020 |
| (74,877) |
Santander FI Amazonas(3) |
|
|
|
|
| (712) |
| (1,572) |
| 2,738 |
| 487,690 |
Santander FI Hedge Strategies(3) (Note 2) |
|
|
| 113,676 |
| (114,309) |
| (109,760) |
| (282,845) | ||
Getnet S.A. (3) |
|
|
|
|
| - |
| 517 |
| - |
| - |
Santander FI Diamantina(3) |
|
|
|
|
| (109,013) |
| (47,496) |
| 113,905 |
| 127,412 |
Interfinancial Relations |
|
|
|
|
| 6,739,129 |
| - |
| - |
| - |
Getnet S.A. (Note 12)(3) (8) |
|
|
|
|
| 6,739,129 |
| - |
| - |
| - |
Loan Operations |
|
|
|
|
| - |
| 538 |
| - |
| 1,443 |
Cibrasec(5) (10) |
|
|
|
|
| - |
| 538 |
| - |
| 1,443 |
Dividends and Bonuses Receivables |
|
|
| 525,903 |
| 581,209 |
| 717,619 |
| 932,964 | ||
Aymoré CFI(3) |
|
|
|
|
| 80,750 |
| 95,000 |
| 93,133 |
| 384,536 |
Santander Leasing(3) |
|
|
|
|
| 267,152 |
| 314,296 |
| 272,703 |
| 320,826 |
Banco RCI Brasil S.A. (3) |
|
|
|
|
| 12,207 |
| 31,913 |
| 33,171 |
| 39,024 |
Santander Corretora de Seguros (Current Corporate Name of Santander | - |
| - |
| 2,194 |
| - | |||||
Sancap(3) |
|
|
|
|
| - |
| - |
| 122,467 |
| 12,000 |
Santander CCVM(3) |
|
|
|
|
| 402 |
| - |
| 30,969 |
| 36,434 |
Banco Bandepe (3) |
|
|
|
|
| 119,000 |
| 140,000 |
| 95,142 |
| 111,932 |
Santander Serviços(3) (13) |
|
|
|
|
| - |
| - |
| 31,197 |
| 27,962 |
Getnet S.A.(3) |
|
|
|
|
| 46,794 |
| - |
| 35,130 |
| - |
Diversos |
|
|
|
|
| - |
| - |
| 1,513 |
| 250 |
Trading Account |
|
|
|
|
| 480,736 |
| 6,184 |
| 154,823 |
| 1,329 |
Abbey National Treasury(4) |
|
|
|
|
| 71,751 |
| 879 |
| 92,118 |
| 396 |
Banco Santander Espanha(2) |
|
|
|
|
| 408,985 |
| 5,305 |
| 62,705 |
| 933 |
Foreign Exchange Portfolio - Net |
|
|
| 726 |
| 551,309 |
| (104,243) |
| 15,300 | ||
Banco Santander Espanha(2) |
|
|
|
|
| 726 |
| 551,309 |
| (104,243) |
| 15,300 |
Income Receivable |
|
|
|
|
| 899,619 |
| 1,813,860 |
| - |
| - |
Zurich Santander Brasil Seguros e Previdência S.A.(4) |
|
|
| 899,619 |
| 1,580,918 |
| - |
| - | ||
Zurich Santander Brasil Seguros S.A.(4) |
|
|
| - |
| 232,942 |
| - |
| - | ||
Receivables from Affiliates |
|
|
|
|
| 1,451,546 |
| 871,859 |
| 16,099,938 |
| 2,553,630 |
Zurich Santander Brasil Seguros e Previdência S.A.(4) |
|
|
| - |
| - |
| 834,736 |
| 1,548,974 | ||
Zurich Santander Brasil Seguros S.A.(4) |
|
|
| - |
| - |
| - |
| 220,869 | ||
Santander Capitalização S.A. (3) |
|
|
|
|
| 18,914 |
| 256,833 |
| 18,831 |
| 221,373 |
Aymoré CFI (3) |
|
|
|
|
| - |
| 438,111 |
| - |
| 416,012 |
Santander CCVM(3) |
|
|
|
|
| - |
| 88,017 |
| - |
| 95,766 |
Santander Leasing(3) |
|
|
|
|
| - |
| 2,083 |
| - |
| 3,640 |
Santander Serviços (3) (13) |
|
|
|
|
| - |
| 20,609 |
| - |
| 19,047 |
Santander Microcrédito(3) (11) |
|
|
|
|
| - |
| 4,134 |
| - |
| 7,628 |
Santander Brasil Consórcio (3) |
|
|
|
|
| 131 |
| 10,708 |
| - |
| 3,714 |
Santander Corretora de Seguros (Current Corporate Name of Santander | - |
| 11,299 |
| - |
| 2,999 | |||||
Getnet S.A.(3) (8) |
|
|
|
|
| 1,431,004 |
| 27,331 |
| 15,246,008 |
| 2,007 |
Webmotors S.A.(7) |
|
|
|
|
| - |
| - |
| - |
| 300 |
Others |
|
|
|
|
| 1,497 |
| 12,734 |
| 363 |
| 11,301 |
Other Receivables - Others |
|
|
|
|
| 10,444 |
| 25,205 |
| 15,887 |
| 45,341 |
Banco Santander Espanha(2) |
|
|
|
|
| 5,243 |
| - |
| 12,089 |
| 8,363 |
Santander Capitalização S.A. (3) |
|
|
|
|
| 4,742 |
| - |
| 3,462 |
| 9,452 |
Banco Santander International(4) |
|
|
|
|
| - |
| 20,480 |
| - |
| 20,959 |
Santander Securities Services Brasil DTVM S.A.(4) |
|
|
| - |
| 1,265 |
| - |
| 1,896 | ||
Others |
|
|
|
|
| 459 |
| 3,460 |
| 336 |
| 4,671 |
Deposits |
|
|
|
|
| (29,962,477) |
| (4,572,688) |
| (66,972,258) |
| (8,991,876) |
Santander Leasing(3) |
|
|
|
|
| (22,084,813) |
| (3,886,151) |
| (59,211,733) |
| (8,138,709) |
Banco Santander Espanha(2) |
|
|
|
|
| (157,814) |
| (13,093) |
| (1,556) |
| - |
Aymoré CFI(3) |
|
|
|
|
| (3,140,522) |
| (358,465) |
| (2,938,745) |
| (423,953) |
Banco Bandepe(3) |
|
|
|
|
| - |
| (26,013) |
| (763,992) |
| (142,205) |
Zurich Santander Brasil Seguros e Previdência S.A.(4) |
|
|
| (55,935) |
| - |
| (44,840) |
| - | ||
Zurich Santander Brasil Seguros S.A.(4) |
|
|
| (2,760) |
| - |
| (8,725) |
| - | ||
Santander Brasil Gestão de Recursos Ltda.(4) |
|
|
| (32,334) |
| (6,636) |
| (39,361) |
| (12,417) | ||
Sancap(3) |
|
|
|
|
| (14,774) |
| (1,434) |
| (19,998) |
| (2,224) |
Santander Brasil Asset Management Distribuidora de Títulos e Valores | (16,766) |
| (1,263) |
| (12,079) |
| (1,760) | |||||
Webmotors S.A. (6) (10) |
|
|
|
|
| (9,798) |
| (4,486) |
| (66,325) |
| (26,996) |
Fundo de Investimento Santillana (4) |
|
|
| (1,543,752) |
| (95,753) |
| (757,874) |
| (88,467) | ||
Isban Brasil S.A.(4) |
|
|
|
|
| (20,893) |
| (2,145) |
| (22,232) |
| (3,560) |
Produban Serviços de Informática S.A. (4) |
|
|
| (34,410) |
| (1,547) |
| (19,653) |
| (2,117) | ||
Banco RCI Brasil S.A.(3) |
|
|
|
|
| (47,423) |
| (3,026) |
| (40,202) |
| (10,959) |
Santander Microcrédito (3) (11) |
|
|
|
|
| - |
| (145) |
| (6,420) |
| (1,152) |
Santander Corretora de Seguros (Current Corporate Name of Santander | (108,443) |
| (69,091) |
| (736,921) |
| (85,189) | |||||
Santander Securities Services Brasil DTVM S.A. (4) |
|
|
| (300,074) |
| (24,344) |
| (208,059) |
| (20,979) | ||
Santander Brasil Consórcio (3) |
|
|
|
|
| (72,374) |
| (10,264) |
| (99,402) |
| (9,755) |
Santander FI Hedge Strategies (3) (Note 2) |
|
|
| (2,051,476) |
| (53,405) |
| (462,928) |
| - | ||
Santander Capitalização S.A.(3) |
|
|
|
|
| (2,801) |
| - |
| (3,836) |
| - |
Santander CCVM(3) |
|
|
|
|
| (1,288) |
| (1,222) |
| (41,595) |
| (7,375) |
Santander Securities Services Brasil Participações S.A. (4) |
| (71,947) |
| (6,190) |
| (52,484) |
| (4,119) | ||||
Super Pagamentos(3) |
|
|
|
|
| (91,570) |
| (3,950) |
| (28,891) |
| (2,723) |
Santander Holding Imobiliária S.A. (Current Corporate Name of |
| (43) |
| (1,807) |
| (22,366) |
| (2,790) | ||||
Santander Brasil Advisory(3) (12) |
|
|
|
|
| - |
| (884) |
| - |
| - |
Santander Brasil EFC(3) |
|
|
|
|
| - |
| - |
| (1,323,399) |
| - |
Getnet S.A.(3) |
|
|
|
|
| (52,889) |
| - |
| - |
| - |
Others |
|
|
|
|
| (47,578) |
| (1,374) |
| (38,642) |
| (4,427) |
Repurchase Commitments |
|
|
|
|
| (12,914,370) |
| (1,322,208) |
| (10,793,632) |
| (2,555,686) |
Fundo de Investimento Santillana(4) |
|
|
| (168,944) |
| (16,458) |
| (153,647) |
| (31,097) | ||
Getnet S.A.(3) |
|
|
|
|
| - |
| (15,667) |
| (331,729) |
| (21,050) |
Santander FI Amazonas(3) |
|
|
|
|
| (326,246) |
| (14,772) |
| (54,197) |
| (21,790) |
Santander FI Financial (3) |
|
|
|
|
| (10,815,781) |
| (980,397) |
| (9,840,206) |
| (1,210,228) |
Santander Leasing(3) |
|
|
|
|
| - |
| (196,129) |
| - |
| (1,236,426) |
Banco Bandepe(3) |
|
|
|
|
| (61,436) |
| (5,274) |
| (740) |
| (5,102) |
Olé Consignado(3) |
|
|
|
|
| (13,301) |
| (1,348) |
| (6,000) |
| (151) |
Santander CCVM(3) |
|
|
|
|
| (17,104) |
| (1,114) |
| (6,904) |
| (1,404) |
Santander FI SBAC(3) |
|
|
|
|
| (725,427) |
| (28,765) |
| (3,296) |
| (37) |
Santander FI Guarujá(3) |
|
|
|
|
| (83,947) |
| (3,206) |
| (68,334) |
| (4,091) |
SAM Brasil Participações S.A.(3) |
|
|
|
|
| - |
| - |
| - |
| (3) |
Santander FI Diamantina (3) |
|
|
|
|
| (58,635) |
| (3,806) |
| (6,503) |
| (6,782) |
Banco PSA (3) |
|
|
|
|
| - |
| - |
| (321,700) |
| (16,689) |
Santander Finance Arrendamento Mercantil(3) |
|
|
| (334,819) |
| (30,892) |
| - |
| - | ||
Santander FI Unix(3) |
|
|
|
|
| (308,381) |
| (22,481) |
| - |
| - |
Others |
|
|
|
|
| (349) |
| (1,899) |
| (376) |
| (836) |
Funds from Acceptance and Issuance of Securities |
| - |
| (729) |
| (10,886) |
| (860) | ||||
Super Pagamentos (3) |
|
|
|
|
| - |
| (729) |
| (10,886) |
| (860) |
Borrowings and Onlendings |
|
|
|
|
| (1,299,775) |
| - |
| (183,741) |
| - |
Banco Santander Espanha(2) |
|
|
|
|
| (187,493) |
| - |
| (181,051) |
| - |
Banco Santander S.A. (Uruguay)(4) |
|
|
| (1,466) |
| - |
| (2,158) |
| - | ||
Santander Brasil EFC(3) |
|
|
|
|
| (1,110,816) |
| - |
| - |
| - |
Banco Santander Río S.A.(4) |
|
|
|
|
| - |
| - |
| (532) |
| - |
Dividends and Bonuses Payables |
|
|
| (3,993,952) |
| - |
| (3,795,205) |
| - | ||
Banco Santander Espanha(2) |
|
|
|
|
| (620,264) |
| - |
| (589,227) |
| - |
Sterrebeeck B.V.(2) |
|
|
|
|
| (2,108,086) |
| - |
| (2,003,291) |
| - |
GES (2) (4) |
|
|
|
|
| (1,264,470) |
| - |
| (1,201,612) |
| - |
Banco Madesant - Sociedade Unipessoal, S.A. (Banco Madesant) (4) |
| (1,132) |
| - |
| (1,075) |
| - | ||||
Payables from Affiliates |
|
|
|
|
| (11,171) |
| (554,750) |
| (7,374) |
| (442,414) | ||
Produban Servicios Informáticos Generales, S.L. (Produban Servicios) (4) |
| (905) |
| (43,505) |
| - |
| (18,099) | ||||||
Isban Brasil S.A.(4) |
|
|
|
|
| - |
| (87,111) |
| (339) |
| (121,977) | ||
Produban Serviços de Informática S.A. (4) |
|
|
| - |
| (215,722) |
| - |
| (190,862) | ||||
Ingenieria de Software Bancário, S.L. (Ingeniería) (4) |
|
|
| - |
| (38,857) |
| - |
| (16,634) | ||||
Santander Microcrédito(3) (11) |
|
|
|
|
| - |
| (22,176) |
| (3,595) |
| (39,151) | ||
Santander Corretora de Seguros (Current Corporate Name of Santander | (4,894) |
| (29,232) |
| - |
| - | |||||||
Banco Santander Espanha(2) |
|
|
|
|
| (430) |
| (51,632) |
| (372) |
| - | ||
Getnet S.A.(3) |
|
|
|
|
| (1,867) |
| (23,059) |
| (1,820) |
| (17,973) | ||
Santander Securities Services Brasil DTVM S.A.(4) |
|
|
| (2,936) |
| (42,603) |
| (1,179) |
| (35,882) | ||||
Others |
|
|
|
|
| (139) |
| (853) |
| (69) |
| (1,836) | ||
Debt Instruments Eligible to Compose Capital |
|
|
| (7,977,576) |
| (222,065) |
| (7,859,649) |
| (225,161) | ||||
Banco Santander Espanha(2) (7) |
|
|
|
|
| (7,977,576) |
| (222,065) |
| (7,859,649) |
| (225,161) | ||
Donations |
|
|
|
|
| - |
| (15,457) |
| - |
| (13,400) | ||
Fundação Sudameris |
|
|
|
|
| - |
| (15,050) |
| - |
| (13,400) | ||
Fundação Santander |
|
|
|
|
| - |
| (407) |
| - |
| - | ||
Other Payables - Others |
|
|
|
|
| (32,917) |
| (894,619) |
| (34,969) |
| (1,167,366) | ||
Banco Santander Espanha(2) |
|
|
|
|
| - |
| (6,686) |
| - |
| (3,250) | ||
Isban Brasil S.A. (4) |
|
|
|
|
| - |
| (318,639) |
| - |
| (296,651) | ||
TecBan(6) (10) |
|
|
|
|
| - |
| (262,046) |
| - |
| (213,194) | ||
Ingeniería(4) |
|
|
|
|
| - |
| (38,100) |
| - |
| (37,253) | ||
Produban Serviços de Informática S.A. (4) |
|
|
| - |
| (35,346) |
| - |
| (51,371) | ||||
Produban Servicios(4) |
|
|
|
|
| - |
| (1,616) |
| - |
| (1,540) | ||
Aquanima Brasil Ltda.(4) |
|
|
|
|
| - |
| (25,638) |
| - |
| (24,557) | ||
Zurich Santander Brasil Seguros e Previdência S.A.(4) |
|
|
| (11,874) |
| - |
| (18,680) |
| (18,680) | ||||
Getnet S.A.(3) |
|
|
|
|
| (17,217) |
| (154,530) |
| (13,038) |
| (496,357) | ||
Santander Securities Services Brasil DTVM S.A. (4) |
|
|
| (3,826) |
| (29,600) |
| (3,251) |
| (18,926) | ||||
Others |
|
|
|
|
| - |
| (22,418) |
| - |
| (5,587) | ||
|
|
|
|
|
|
|
|
|
|
|
|
|
|
|
|
|
|
|
|
|
|
|
|
|
|
| Consolidated | ||
Assets | Income | Assets | Income | |||||||||||
(Liabilities) |
| (Expenses) | (Liabilities) |
| (Expenses) | |||||||||
01/01 to | 01/01 to | |||||||||||||
|
|
|
|
|
|
|
| 12/31/2017 |
| 12/31/2017 |
| 12/31/2016 |
| 12/31/2016 |
Cash |
|
|
|
|
| 591,790 |
| - |
| 584,983 |
| - | ||
Banco Santander Espanha(2) |
|
|
|
|
| 587,532 |
| - |
| 582,571 |
| - | ||
Banco Santander (México), S.A.(4) |
|
|
| 1,348 |
| - |
| 1,034 |
| - | ||||
Banco Santander Totta, S.A.(4) |
|
|
|
|
| 2,733 |
| - |
| 1,261 |
| - | ||
Others |
|
|
|
|
| 177 |
| - |
| 117 |
| - | ||
Interbank Investments |
|
|
|
|
| 7,384,336 |
| 81,911 |
| 10,269,812 |
| 37,381 | ||
Banco Santander Espanha(1) (2) |
|
|
|
|
| 7,384,336 |
| 81,911 |
| 10,269,812 |
| 37,381 | ||
Derivatives Financial Instruments - Net |
|
|
| (29,843) |
| 159,825 |
| (326,986) |
| 84,249 | ||||
Fundo de Investimento Santillana (4) |
|
|
| 165,743 |
| (79,480) |
| (155,095) |
| 257,475 | ||||
Abbey National Treasury(4) |
|
|
|
|
| (71,672) |
| 23,843 |
| (91,828) |
| 38,274 | ||
Banco Santander Espanha(2) |
|
|
|
|
| (123,914) |
| 215,462 |
| (80,063) |
| (211,500) | ||
Trading Account |
|
|
|
|
| 480,736 |
| 254,750 |
| 154,823 |
| 7,949 | ||
Banco Santander Espanha(2) |
|
|
|
|
| 408,985 |
| 253,871 |
| 62,705 |
| 7,949 | ||
Abbey National Treasury (4) |
|
|
|
|
| 71,751 |
| 879 |
| 92,118 |
| - | ||
Foreign Exchange Portfolio - Net |
|
|
| 726 |
| 551,309 |
| (104,243) |
| 15,300 | ||||
Banco Santander Espanha(2) |
|
|
|
|
| 726 |
| 551,309 |
| (104,243) |
| 15,300 | ||
Dividends and Bonuses Receivables |
|
|
|
|
| 9,846 |
| - |
| - |
| - | ||
Webmotors S.A(6) (10) |
|
|
|
|
| 9,846 |
| - |
| - |
| - | ||
Income Receivable |
|
|
|
|
| 925,835 |
| 2,485,403 |
| - |
| - | ||
Zurich Santander Brasil Seguros e Previdência S.A.(4) |
|
|
| 925,835 |
| 2,187,867 |
| - |
| - | ||||
Zurich Santander Brasil Seguros S.A.(4) |
|
|
| - |
| 297,536 |
| - |
| - | ||||
Receivables from Affiliates |
|
|
|
|
| 1,497 |
| 4,621 |
| 862,893 |
| 1,954,866 | ||
Zurich Santander Brasil Seguros e Previdência S.A.(4) |
|
|
| - |
| - |
| 862,553 |
| 1,730,006 | ||||
Zurich Santander Brasil Seguros S.A.(4) |
|
|
| - |
| - |
| - |
| 220,869 | ||||
Others |
|
|
|
|
| 1,497 |
| 4,621 |
| 340 |
| 3,991 | ||
Other Receivables - Others |
|
|
|
|
| 5,323 |
| 23,564 |
| 188,337 |
| 34,692 | ||
Banco Santander Espanha(2) |
|
|
|
|
| 5,323 |
| (190) |
| 188,337 |
| 8,531 | ||
Banco Santander International(4) |
|
|
|
|
| - |
| 20,480 |
| - |
| 20,959 | ||
Santander Securities Services Brasil DTVM S.A.(4) |
|
|
| - |
| 1,265 |
| - |
| - | ||||
Others |
|
|
|
|
|
|
| - |
| 2,009 |
| - |
| 5,202 |
Deposits |
|
|
|
|
| (2,293,300) |
| (155,716) |
| (1,169,362) |
| (133,762) | ||
Banco Santander Espanha(2) |
|
|
|
|
| (200,445) |
| (13,093) |
| (1,556) |
| - | ||
Zurich Santander Brasil Seguros S.A.(4) |
|
|
| (2,760) |
| - |
| (8,725) |
| - | ||||
Zurich Santander Brasil Seguros e Previdência S.A.(4) |
|
|
| (55,935) |
| - |
| (44,840) |
| - | ||||
Isban Brasil S.A. (4) |
|
|
|
|
| (20,893) |
| (2,145) |
| (22,232) |
| (3,560) | ||
Produban Serviços de Informática S.A. (4) |
|
|
| (34,410) |
| (1,547) |
| (19,653) |
| (2,117) | ||||
Santander Brasil Gestão de Recursos Ltda. (4) |
|
|
| (32,334) |
| (6,636) |
| (39,361) |
| (12,417) | ||||
Fundo de Investimento Santillana (4) |
|
|
| (1,543,752) |
| (95,753) |
| (757,874) |
| (88,467) | ||||
Santander Brasil Asset(4) |
|
|
|
|
| (16,766) |
| (1,263) |
| (12,079) |
| (1,760) | ||
Santander Securities Services Brasil DTVM S.A.(4) |
|
|
| (300,074) |
| (24,344) |
| (208,059) |
| (20,979) | ||||
Santander Securities Services Brasil Participações S.A. (4) |
| (71,947) |
| (6,190) |
| (52,484) |
| (4,119) | ||||||
Webmotors S.A. (6) (10) |
|
|
|
|
| (9,798) |
| (4,486) |
| - |
| - | ||
Others |
|
|
|
|
| (4,186) |
| (259) |
| (2,499) |
| (343) | ||
Repurchase Commitments |
|
|
|
|
| (168,944) |
| (16,458) |
| (153,647) |
| (31,100) | ||
SAM Brasil Participações S.A. (4) |
|
|
|
|
| - |
| - |
| - |
| (3) | ||
Fundo de Investimento Santillana(4) |
|
|
| (168,944) |
| (16,458) |
| (153,647) |
| (31,097) | ||||
Borrowings and Onlendings |
|
|
|
|
| (188,959) |
| - |
| (183,741) |
| - | ||
Banco Santander Espanha (2) |
|
|
|
|
| (187,493) |
| - |
| (181,051) |
| - | ||
Banco Santander S.A. (Uruguay)(4) |
|
|
| (1,466) |
| - |
| (2,158) |
| - | ||||
Banco Santander Río S.A. (4) |
|
|
|
|
| - |
| - |
| (532) |
| - | ||
Dividends and Bonuses Payables |
|
|
| (3,993,952) |
| - |
| (3,810,624) |
| - | ||||
Sterrebeeck B.V.(2) |
|
|
|
|
| (2,108,086) |
| - |
| (2,003,291) |
| - | ||
GES (2)(4) |
|
|
|
|
| (1,264,470) |
| - |
| (1,201,612) |
| - | ||
SIH(4) |
|
|
|
|
| - |
| - |
| (15,419) |
| - | ||
Banco Santander Espanha(2) |
|
|
|
|
| (620,264) |
| - |
| (589,227) |
| - | ||
Banco Madesant (4) |
|
|
|
|
| (1,132) |
| - |
| (1,075) |
| - | ||
Payables from Affiliates |
|
|
|
|
| (6,676) |
| (704,731) |
| (4,542) |
| (394,684) | ||
Banco Santander Espanha(2) |
|
|
|
|
| (2,051) |
| (267,440) |
| (2,954) |
| (547) | ||
Produban Servicios(4) |
|
|
|
|
| (905) |
| (44,847) |
| - |
| (19,729) | ||
Isban Brasil S.A.(4) |
|
|
|
|
| - |
| (92,540) |
| (339) |
| (127,187) | ||
Produban Serviços de Informática S.A. (4) |
|
|
| - |
| (215,800) |
| - |
| (191,095) | ||||
Ingeniería(4) |
|
|
|
|
| - |
| (38,857) |
| - |
| (16,634) | ||
Santander Brasil Asset(4) |
|
|
|
|
| (69) |
| (1,721) |
| (70) |
| (2,604) | ||
Santander Securities Services Brasil DTVM S.A.(4) |
|
|
| (2,936) |
| (42,603) |
| (1,179) |
| (35,882) | ||||
Others |
|
|
|
|
| (715) |
| (923) |
| - |
| (1,006) | ||
Debt Instruments Eligible to Compose Capital |
|
|
| (7,977,576) |
| (222,065) |
| (7,859,649) |
| (225,161) | ||||
Banco Santander Espanha(2) (7) |
|
|
|
|
| (7,977,576) |
| (222,065) |
| (7,859,649) |
| (225,161) | ||
Donations |
|
|
|
|
| - |
| (21,273) |
| - |
| (20,528) | ||
Santander Cultural |
|
|
|
|
| - |
| (3,513) |
| - |
| (2,737) | ||
Fundação Sudameris |
|
|
|
|
| - |
| (15,050) |
| - |
| (13,400) | ||
Fundação Santander |
|
|
|
|
| - |
| (1,837) |
| - |
| (3,452) | ||
Instituto Escola Brasil |
|
|
|
|
| - |
| (873) |
| - |
| (939) | ||
Other Payables - Other |
|
|
|
|
| (31,157) |
| (764,897) |
| (30,684) |
| (468,936) | ||
Banco Santander Espanha(2) |
|
|
|
|
| - |
| (6,907) |
| - |
| (3,256) | ||
Isban Brasil S.A.(4) |
|
|
|
|
| - |
| (331,137) |
| - |
| (310,863) | ||
Produban Serviços de Informática S.A. (4) |
|
|
| - |
| (36,723) |
| - |
| (52,754) | ||||
Ingeniería(4) |
|
|
|
|
| - |
| (38,171) |
| - |
| (37,571) | ||
Produban Servicios(4) |
|
|
|
|
| - |
| (1,616) |
| - |
| (1,540) | ||
Aquanima Brasil Ltda.(4) |
|
|
|
|
| - |
| (25,638) |
| - |
| (24,557) | ||
Zurich Santander Brasil Seguros e Previdência S.A.(4) |
|
|
| (27,325) |
| (18,488) |
| (30,684) |
| (18,680) | ||||
Santander Securities Services Brasil DTVM S.A.(4) |
|
|
| (3,826) |
| (29,600) |
| - |
| (18,926) | ||||
TecBan(6) (10) |
|
|
|
|
| - |
| (262,046) |
| - |
| - | ||
Others |
|
|
|
|
| (6) |
| (14,571) |
| - |
| (789) | ||
(1) Refers to investments in foreign currency (overnight) with maturity on January 2, 2018 and interest rates of 1.43% p.a. (12/31/2016 - with maturity on January 3, 2017 and interest rates of 0.68% p.a.) maintained by the Banco Santander Brasil and its Grand Cayman Branch. | ||||||||||||||
(2) Controller - Banco Santander is indirectly controlled by Banco Santander Spain (Note 1 and 26.d), through its subsidiary GES and Sterrebeeck B.V. | ||||||||||||||
(3) Direct or indirect controlled by Banco Santander. | ||||||||||||||
(4) Direct or indirect controlled by Banco Santander Spain. | ||||||||||||||
(5) Jointly Controlled - Banco Santander. | ||||||||||||||
(6) Jointly Controlled - Santander Corretora de Seguros (Current name of Santander Participações S.A.), until September 30, 2017 controlled by Santander Serviços which was incorporated by Santander Corretora de Seguros on November 30, 2017 (Note 15 and 37.e). | ||||||||||||||
(7) Refers to the portion acquired by the Parent Due to Regulatory Capital Optimization Plan held in the first half of 2014. | ||||||||||||||
(8) Corresponds to receivable values related to the Acquiring business. | ||||||||||||||
(9) At the ESM held on May 8, 2017, was approved the change of company name of Santander Participações S.A. to Santander Corretora de Seguros, Investimentos e Serviços S.A. (Note 15). | ||||||||||||||
(10) Effective from January 1, 2017, CMN Resolution 4,517 of August 24, 2016, which establishes that equity interests in jointly-controlled entities must be accounted for using the equity method (Note 15). | ||||||||||||||
(11) Incorporated company on August 31, 2017 (Note 15 e 37.e). | ||||||||||||||
|
|
|
|
|
|
|
|
|
|
|
|
|
|
|
(12) Incorporated company on September 29, 2017 (Note 15 e 37.e). | ||||||||||||||
|
|
|
|
|
|
|
|
|
|
|
|
|
|
|
(13) Incorporated company on November 30, 2017 (Note 15 e 37.e). | ||||||||||||||
|
|
|
|
|
|
|
|
|
|
|
|
|
|
|
(14) At the EGM held on November 1, 2017 it was approved the company´s name change from Webcasas S.A. to Santander Holding Imobiliária S.A. (Note 15). | ||||||||||||||
| ||||||||||||||
|
|
|
|
|
|
|
|
|
| Bank |
|
|
| Consolidated |
01/01 to | 01/01 to | 01/01 to | 01/01 to | |||||||||||
|
|
|
|
|
|
|
| 12/31/2017 |
| 12/31/2016 |
| 12/31/2017 |
| 12/31/2016 |
Asset Management |
|
|
|
|
| 842,851 |
| 1,036,175 |
| 1,008,414 |
| 1,077,052 | ||
Checking Account Services |
|
|
|
|
| 2,891,932 |
| 2,222,159 |
| 2,908,271 |
| 2,589,892 | ||
Lending Operations and Income from Guarantees Provided |
| 1,139,192 |
| 1,103,111 |
| 1,491,433 |
| 1,426,724 | ||||||
Lending Operations |
|
|
|
|
| 524,893 |
| 526,779 |
| 877,155 |
| 850,392 | ||
Income Guarantees Provided |
|
|
|
|
| 614,299 |
| 576,332 |
| 614,278 |
| 576,332 | ||
Insurance Fees |
|
|
|
|
| 2,069,771 |
| 1,994,293 |
| 2,515,855 |
| 2,210,551 | ||
Cards (Debit and Credit) and Acquiring Services |
|
|
| 3,172,229 |
| 3,149,818 |
| 4,939,905 |
| 4,038,494 | ||||
Collection |
|
|
|
|
|
|
| 1,376,256 |
| 1,219,081 |
| 1,388,687 |
| 1,223,895 |
Brokerage, Custody and Placement of Securities |
|
|
|
|
|
|
| 570,336 |
| 411,484 |
| 699,795 |
| 544,785 |
Others |
|
|
|
|
| 198,761 |
| 172,383 |
| 658,399 |
| 606,859 | ||
Total |
|
|
|
|
| 12,261,328 |
| 11,308,504 |
| 15,610,759 |
| 13,718,252 | ||
|
|
|
|
|
|
|
|
|
|
|
|
|
|
|
|
|
|
|
|
|
|
|
|
| Bank |
|
|
| Consolidated |
01/01 to | 01/01 to | 01/01 to | 01/01 to | |||||||||||
|
|
|
|
|
|
|
| 12/31/2017 |
| 12/31/2016 |
| 12/31/2017 |
| 12/31/2016 |
Compensation |
|
|
|
|
| 4,131,010 |
| 4,019,028 |
| 4,535,505 |
| 4,445,079 | ||
Charges |
|
|
|
|
| 1,506,880 |
| 1,420,702 |
| 1,638,149 |
| 1,571,139 | ||
Benefits |
|
|
|
|
| 1,282,067 |
| 1,354,269 |
| 1,383,505 |
| 1,467,289 | ||
Training |
|
|
|
|
| 55,182 |
| 59,812 |
| 59,704 |
| 70,292 | ||
Others |
|
|
|
|
| 14,383 |
| 29,080 |
| 14,601 |
| 40,876 | ||
Total |
|
|
|
|
| 6,989,522 |
| 6,882,891 |
| 7,631,464 |
| 7,594,675 | ||
| ||||||||||||||
|
|
|
|
|
|
|
|
|
| Bank |
|
|
| Consolidated |
01/01 to | 01/01 to | 01/01 to | 01/01 to | |||||||||||
|
|
|
|
|
|
|
| 12/31/2017 |
| 12/31/2016 |
| 12/31/2017 |
| 12/31/2016 |
Depreciation and Amortization(1) |
|
|
|
|
| 3,097,232 |
| 3,170,728 |
| 3,603,637 |
| 3,626,805 | ||
Outsourced and Specialized Services |
|
|
| 1,792,808 |
| 1,808,057 |
| 2,186,892 |
| 2,179,100 | ||||
Communications |
|
|
|
|
| 395,695 |
| 435,854 |
| 434,338 |
| 489,645 | ||
Data Processing |
|
|
|
|
| 1,759,805 |
| 1,468,375 |
| 1,926,880 |
| 1,595,749 | ||
Advertising, Promotions and Publicity |
|
|
| 471,639 |
| 354,821 |
| 572,670 |
| 436,283 | ||||
Rentals |
|
|
|
|
| 710,229 |
| 694,075 |
| 728,251 |
| 747,997 | ||
Transportation and Travel |
|
|
|
|
| 143,139 |
| 160,297 |
| 176,863 |
| 209,903 | ||
Financial System Services |
|
|
|
|
| 223,033 |
| 191,066 |
| 282,741 |
| 250,671 | ||
Security and Money Transport |
|
|
|
|
| 609,682 |
| 623,405 |
| 611,100 |
| 690,522 | ||
Asset Maintenance and Upkeep |
|
|
|
|
| 228,519 |
| 216,115 |
| 233,384 |
| 252,869 | ||
Water, Electricity and Gas |
|
|
|
|
| 177,142 |
| 200,726 |
| 181,321 |
| 206,536 | ||
Materials |
|
|
|
|
| 60,565 |
| 63,412 |
| 63,889 |
| 68,115 | ||
Others |
|
|
|
|
| 484,344 |
| 355,618 |
| 722,652 |
| 554,813 | ||
Total |
|
|
|
|
| 10,153,832 |
| 9,742,549 |
| 11,724,618 |
| 11,309,008 | ||
|
|
|
|
|
|
|
|
|
|
|
|
|
|
|
(1) Includes goodwill amortization of R$S1,332,195 (2016 - R$1,618,857) in the Bank and R$1,534,701 (2016 - R$1,805,572) in the Consolidated, held on time, length and proportion of the projected results which are subject to annual verification (Note 17). | ||||||||||||||
30. Tax Expenses | ||||||||||||||
| ||||||||||||||
|
|
|
|
|
|
|
|
|
| Bank |
|
|
| Consolidated |
01/01 to | 01/01 to | 01/01 to | 01/01 to | |||||||||||
|
|
|
|
|
|
|
| 12/31/2017 |
| 12/31/2016 |
| 12/31/2017 |
| 12/31/2016 |
Cofins (Contribution for Social Security Financing) (1) |
|
|
| 1,710,695 |
| 2,176,536 |
| 2,202,065 |
| 2,562,229 | ||||
ISS (Tax on Services) |
|
|
|
|
| 476,383 |
| 420,975 |
| 574,956 |
| 502,873 | ||
PIS(Tax on Revenue)(1) |
|
|
|
|
| 277,988 |
| 353,687 |
| 389,136 |
| 445,787 | ||
Others(2) |
|
|
|
|
| 309,643 |
| 375,439 |
| 421,318 |
| 533,037 | ||
Total |
|
|
|
|
| 2,774,709 |
| 3,326,637 |
| 3,587,475 |
| 4,043,926 | ||
(2) Includes provisions updates for PIS and Cofins of Law 9,718/1998. | ||||||||||||||
31. Other Operating Income | ||||||||||||||
|
|
|
|
|
|
|
|
|
|
|
|
|
|
|
|
|
|
|
|
|
|
|
|
| Bank |
|
|
| Consolidated |
01/01 to | 01/01 to | 01/01 to | 01/01 to | |||||||||||
|
|
|
|
|
|
|
| 12/31/2017 |
| 12/31/2016 |
| 12/31/2017 |
| 12/31/2016 |
Net Income Pension and Capitalization |
| - |
| - |
| 357,779 |
| 319,559 | ||||||
Reversal of Operating Provisions - Fiscal (Note 23.c)(1) |
| 247,046 |
| 149,719 |
| 233,989 |
| 216,366 | ||||||
Reversal of Provision for Financial Guarantees Provided (Note 22) |
| 13,584 |
| - |
| 13,584 |
| - | ||||||
Monetary Adjustment of Escrow Deposits |
|
|
| 494,789 |
| 560,860 |
| 655,628 |
| 764,020 | ||||
Recoverable Taxes |
|
|
|
|
| 144,552 |
| 136,115 |
| 214,849 |
| 220,487 | ||
Recovery of Charges and Expenses |
|
|
| 1,216,962 |
| 1,221,824 |
| 955,028 |
| 921,784 | ||||
Monetary Variation |
|
|
|
|
| 968,845 |
| 1,252,906 |
| 974,071 |
| 1,254,415 | ||
Others (2) |
|
|
|
|
| 399,863 |
| 117,382 |
| 651,315 |
| 506,336 | ||
Total |
|
|
|
|
| 3,485,641 |
| 3,438,806 |
| 4,056,243 |
| 4,202,967 | ||
(1) In 2017, includes R$74,869 in the Bank and R$76,562 in the Consolidated referring to the program of installments and cash payment of tax and social security debts established by MP 783/2017 and reissuation; and the amount of R$178,445 in the Bank and R$178,673 in the Consolidated referring to the incentive payment programs and installments of the municipalities of São Paulo and Rio de Janeiro (Note 23.e). | ||||||||||||||
(2) Includes exchange variation in the amount of R$73,819 (2016 - R$102,922) in the Bank and R$95,887 (2016 - R$198,165) in the Consolidated. | ||||||||||||||
|
|
|
|
|
|
|
|
|
|
|
|
|
|
|
|
|
|
|
|
|
|
|
|
| Bank |
|
|
| Consolidated |
01/01 to | 01/01 to | 01/01 to | 01/01 to | |||||||||||
|
|
|
|
|
|
|
| 12/31/2017 |
| 12/31/2016 |
| 12/31/2017 |
| 12/31/2016 |
Operating Provisions |
|
|
|
|
|
|
|
|
|
|
|
| ||
Labor (Note 23.c) |
|
|
|
|
| 1,146,067 |
| 1,224,189 |
| 1,221,742 |
| 1,318,798 | ||
Civil (Note 23.c) |
|
|
|
|
| 855,173 |
| 368,919 |
| 1,050,067 |
| 512,798 | ||
Credit Cards(4) |
|
|
|
|
| 1,618,533 |
| 1,589,299 |
| 1,699,726 |
| 1,204,040 | ||
Actuarial Losses - Pension Plan (Note 35.a) |
|
|
| 196,087 |
| 258,226 |
| 193,604 |
| 258,275 | ||||
Monetary Losses |
|
|
|
|
| 3,334 |
| 5,281 |
| 7,602 |
| 10,799 | ||
Legal Fees and Costs |
|
|
|
|
| 150,674 |
| 116,686 |
| 175,930 |
| 144,664 | ||
Serasa and SPC (Credit Reporting Agency) |
|
|
| 58,322 |
| 73,860 |
| 60,703 |
| 83,780 | ||||
Brokerage Fees |
|
|
|
|
| 56,563 |
| 64,362 |
| 71,544 |
| 70,051 | ||
Commissions |
|
|
|
|
| 303,426 |
| 132,151 |
| 1,388,954 |
| 594,853 | ||
Impairment(1) |
|
|
|
|
| 327,884 |
| 142 |
| 327,884 |
| 147 | ||
Others (2) (3) (5) |
|
|
|
|
| 3,260,726 |
| 2,630,051 |
| 4,110,064 |
| 3,795,806 | ||
Total |
|
|
|
|
| 7,976,789 |
| 6,463,166 |
| 10,307,820 |
| 7,994,011 | ||
(1) In 2017, the Bank registered impairment losses in R$305,669 over tangible assets related to system acquisition and development. These losses were registered based on technical analysis which have shown a reduction perspective on the expected future economic benefits from these assets.(Note 17). | ||||||||||||||
(2) Includes, mainly, inflation adjustment of provisions for lawsuits and administrative proceedings and legal obligations, provisions for the guarantee fund benefits and other provisions. | ||||||||||||||
(3) In 2017, includes R$214,640 in the Bank and R$218,992 in the Consolidated referring to the program of installments and cash payment of tax and social security debts established by MP 783/2017 and reissuation; and the amount of R$26,605 in the Bank and R$26,652 in the Consolidated referring to the incentive payment programs and installments of the municipalities of São Paulo and Rio de Janeiro (Note 23.e). | ||||||||||||||
(4) Includes exchange variation expense in the amount of R $ 1,637 (2016 - revenue of R $ 45,588) in the Bank and Consolidated. | ||||||||||||||
(5) Includes exchange variation in the amount of R $ 449,025 (2016 - R $ 99,467) in the Bank and R $ 473,981 (2016 - R $ 204,635) in the Consolidated. | ||||||||||||||
33. Non-OperatingIncome | ||||||||||||||
|
|
|
|
|
|
|
| |||||||
|
|
|
|
|
|
|
|
|
| Bank |
|
|
| Consolidated |
01/01 to | 01/01 to | 01/01 to | 01/01 to | |||||||||||
|
|
|
|
|
|
|
| 12/31/2017 |
| 12/31/2016 |
| 12/31/2017 |
| 12/31/2016 |
Result of Investments(1) |
|
|
|
|
|
| 1,787 |
| - |
| (43,838) |
| (1,631) | |
Result on Sale of Other Assets |
|
|
|
|
| 36,690 |
| 1,492 |
| 30,250 |
| 2,203 | ||
Reversal (Recognition) of Allowance for Losses on Other Assets (2) |
|
| (198,067) |
| (4,731) |
| (271,579) |
| (5,361) | |||||
Expense on Assets Not in Use |
|
|
|
|
| (25,447) |
| (12,538) |
| (27,939) |
| (16,012) | ||
Gains (Losses) of Capital |
|
|
|
|
| (17,036) |
| (3,325) |
| (18,743) |
| (10,819) | ||
Other Income (Expenses) (3) |
|
|
|
|
|
| 63,041 |
| (412,895) |
| 72,254 |
| (383,981) | |
Total |
|
|
|
|
| (139,032) |
| (431,997) |
| (259,595) |
| (415,601) | ||
(1) In 2017 in the Consolidated, includes the amount of R$41,999 related to the sale of BW Guirapá I S.A. (Note 15). | ||||||||||||||
(2) In 2017, includes R$198,067 in the Bank and R$271,579 in the Consolidated referring to provisions for devaluations on real estate, constituted from appraisal reports prepared by specialized external consulting. | ||||||||||||||
(3) In 2016, in the Bank and Consolidated, includes the amount of R$450,284, related to the establishment of the Efficiency and Productivity Fund. | ||||||||||||||
34. Income Tax and Social Contribution | ||||||||||||||
|
|
|
|
|
|
|
|
|
| |||||
|
|
|
|
|
|
|
|
|
| Bank |
|
|
| Consolidated |
01/01 to | 01/01 to | 01/01 to | 01/01 to | |||||||||||
|
|
|
|
|
|
|
| 12/31/2017 |
| 12/31/2016 |
| 12/31/2017 |
| 12/31/2016 |
Income Before Taxes on Income and Profit Sharing |
| 11,329,781 |
| 12,630,215 |
| 13,128,411 |
| 13,363,293 | ||||||
Profit Sharing (1) |
|
|
|
|
| (1,383,771) |
| (1,136,534) |
| (1,460,009) |
| (1,208,821) | ||
Interest on Capital |
|
|
|
|
| (3,800,000) |
| (3,850,000) |
| (3,800,000) |
| (3,926,943) | ||
UnrealizedIncome |
|
|
|
|
| - |
| - |
| (214) |
| (71) | ||
Income Before Taxes |
|
| 6,146,010 |
| 7,643,681 |
| 7,868,188 |
| 8,227,458 | |||||
Total Income and Social Contribution Tax at the Rates |
| (2,765,704) |
| (3,439,656) |
| (3,540,685) |
| (3,702,356) | ||||||
Equity in Subsidiaries(2) |
|
| 672,828 |
| 341,438 |
| (296,196) |
| 665 | |||||
Nondeductible Expenses, Net of Non-Taxable Income |
|
|
| 178,894 |
| 264,017 |
| 199,588 |
| 348,533 | ||||
Exchange Variation - Foreign Branches |
|
| 440,857 |
| (3,561,133) |
| 440,857 |
| (3,561,133) | |||||
Income and Social Contribution Taxes on Temporary Differences and |
| 1,135,804 |
| 511,083 |
| 1,151,796 |
| 606,593 | ||||||
Effects of Change in Rate of CSLL(3) |
| - |
| - |
| 131,667 |
| 65,893 | ||||||
Other Adjustments Social Contribution Taxes 5%(4) |
| (1,369,642) |
| (548,195) |
| (1,545,328) |
| (660,605) | ||||||
Other Adjustments, Including Profits Provided Abroad |
|
|
| (243,175) |
| 460,402 |
| 180,010 |
| 405,693 | ||||
Income and Social Contribution Taxes |
| (1,950,138) |
| (5,972,044) |
| (3,278,291) |
| (6,496,717) | ||||||
|
|
|
|
|
|
|
|
|
|
|
|
|
|
|
(1) The basis of calculation is the net income, after IR and CSLL. | ||||||||||||||
(2) As a result of equity in subsidiaries are not included interest on capital received and receivable. | ||||||||||||||
(3) Effect of rate differences for the other non-financial companies, which the social contribution tax rate is 9%. | ||||||||||||||
(4) Temporary rate increase of CSLL from September 2015 to December 2018 (Note 3.s). | ||||||||||||||
Foreign Exchange Hedge of the Grand Cayman Branch and the Subsidiary Santander Brasil EFC | ||||||||||||||
Banco Santander operates a branch in the Cayman Islands and a subsidiary called Santander Brazil Establecimiento Financiero de Credito, EFC, or “Santander Brasil EFC” (independent subsidiary in Spain) which are used mainly to raise funds in the capital and financial markets, providing credit lines that are extended to customers for trade-related financings and working capital (Note 14). | ||||||||||||||
To protect the exposures to foreign exchange rate variations, the Bank uses derivatives and international funding. According to Brazilian tax rules, the gains or losses resulting from the impact of appreciation or depreciation of the local currency (real) in foreign investments are nontaxable to PIS/Cofins/IR/CSLL, while gains or losses from derivatives used as hedges are taxable or deductible. The purpose of these derivatives are to protect the after-tax results. | ||||||||||||||
The different tax treatment of such foreign exchange rate results in a volatility on the operational profit or loss and on the gross revenue tax expense (PIS/Cofins) and income taxes (IR/CSLL). Exchange rate variations arising from foreign investments recorded for the accumulated of period ended on December 31, 2017 result in a gain of R$893 million (2016 - loss of R$7,408 million). On the other hand, the derivatives contracted to cover these positions generated a loss of "Derivatives Transaction" of R$1,703 million (2016 - gain of R$14,123 million). The tax effect of these derivatives impacted the Tax Expenses line generating a tax gain of R$810 million (2016 - loss of R$6,715 million) represented by R$80 million (2016 - R$657 million) of PIS/Cofins and R$730 million (2016 - R$6,058 million) IR/CSLL. | ||||||||||||||
35. Employee Benefit Plans - Post-Employment Benefits | ||||||||||||||
a) Supplemental Pension Plan | ||||||||||||||
Banco Santander and its subsidiaries sponsor the closed pension entities for the purpose of granting pensions and supplementary pensions over those granted by the Social Security, as defined in the basic regulations of each plan. | ||||||||||||||
I) Banesprev | ||||||||||||||
Plan I: defined benefit plan fully sponsored by Banco Santander, it covers employees hired after May 22, 1975 called Participants Recipients, and those hired until May 22, 1975 called Participants Aggregates, who are also entitled to death benefits.This plan is closed to new entrants since March 28, 2005. | ||||||||||||||
Plan II: defined benefit plan, constituted from July 27, 1994, effective of the new text of the Statute and Regulations of the Basic Plan II, Plan I participants who chose the new plan began to contribute to the rate of 44.9% stipulated by the actuary for funding each year, introduced in April 2012 extraordinary cost to the sponsor and participants, as agreed with the PREVIC - Superintendence of Pension Funds, due to deficit in the plan.This plan is closed to new entrants since June 3, 2005. | ||||||||||||||
Plan V: defined benefit plan fully sponsored by Banco Santander, it covers employees hired until May 22, 1975, closed and paid off. | ||||||||||||||
Supplemental Pension Plan Pré 75: defined benefit plan was created in view of the privatization of Banespa and is managed by Banesprev and offered only to employees hired before May 22, 1975, which its effective date is January 1, 2000.This plan is closed to new entrants since April 28, 2000. | ||||||||||||||
Plan III: variable contribution plan, for employees hired after May 22,1975, previously served by the Plans I and II. This plan receives contributions from the sponsor and the participants. The benefits are in the form of defined contribution during the period of contribution and defined benefit during the receipt of benefit, if paid as monthly income for life.Plan is closed to new entrants since September 1, 2005. | ||||||||||||||
Plan IV:variable contribution plan, designed for employees hired as of November 27, 2000, in which the sponsor only contributes to the risk benefits and administrative expenses. In this plan the benefit is set in the form of defined contribution during the period of contribution and defined benefit during the receipt of benefits in the form of monthly income for life, in whole or in part of the benefit. The risk benefits of the plan are in defined benefit.This plan is closed to new entrants since July 23, 2010. | ||||||||||||||
Three plans(DCA, DAB and CACIBAN): additional retirement and former employees associated pension, arising from the process of acquisition of the former Banco Meridional, established under the defined benefit plan.The plans are closed to new participants. | ||||||||||||||
Plano Sanprev I:defined benefit plan, established on September 27, 1979, covering employees enrolled in the plan sponsor and it is in process of extinction since June 30, 1996 (Note 35.a.II). | ||||||||||||||
Plan Sanprev II: plan that provides insurance risk, pension supplement temporary, disability retirement annuity and the supplemental death and sickness allowance and birth, including employees enrolled in the plan sponsor and is funded solely by sponsors through monthly contributions, as indicated by the actuary. This plan is closed to new entrants since March 10, 2010 (Note 35.a.II). | ||||||||||||||
Plan Sanprev III: variable contribution plan covering employees of the sponsors who made the choice to contribute, by contribution freely chosen by participants from 2% of their salary. That the benefit plan is a defined contribution during the contribution and defined benefit during the receipt of the benefit, being in the form of monthly income for life, in whole or in part of the benefit. This plan is closed to new entrants since March 10, 2010 (Note 35.a.II). | ||||||||||||||
II) Sanprev - Santander Associação de Previdência (Sanprev) | ||||||||||||||
Closed-End Private Pension Entity (EFPC) that used to manage three benefit plans, 2 in the Defined Benefit modality and 1 in the modality of Variable Contribution, whose process of management transfer of these plans to Banesprev occurred in January 2017. At the stage of requesting the process of closure of the operating permit with PREVIC. | ||||||||||||||
III) Bandeprev - Bandepe Previdência Social (Bandeprev) | ||||||||||||||
Defined benefit plan, sponsored by Banco Bandepe and Banco Santander, managed by Bandeprev. The plans are divided into basic plan and special retirement supplement plan, with different eligibility requirements, contributions and benefits by subgroups of participants. The plans are closed to new entrants since 1999 for Banco Bandepe’s employees and for others since 2011. | ||||||||||||||
IV) Other Plans | ||||||||||||||
SantanderPrevi - Sociedade de Previdência Privada (SantanderPrevi): it´s a closed-end private pension entity with the purpose of constitution and implementation of social security pension plans, complementary to the social security contribution, in the form of actual legislation. | ||||||||||||||
The Retirement Plan of SantanderPrevi is the only structured as Defined Contribution and open to new members, with contributions shared between sponsors and plan participants. The appropriate values by the sponsors in the year of 2017 was R$86,225 (2016 - R$84,532) in the Bank and R$86,449 (2016 - R$87,603) in the Consolidated. | ||||||||||||||
It has 10 cases of lifetime income with benefits arising from the previous plan. | ||||||||||||||
Determination of Net Actuarial Assets (Liabilities) | ||||||||||||||
|
|
|
|
|
|
|
|
|
|
|
|
|
|
|
Bank | ||||||||||||||
12/31/2017 | ||||||||||||||
Santander- | ||||||||||||||
|
|
|
|
|
|
|
|
| Banesprev(1) |
| previ |
| Bandeprev | |
Conciliation of Assets and Liabilities |
|
|
|
|
|
|
|
|
|
|
|
| ||
Present Value of Actuarial Obligations |
|
|
|
|
|
|
| (20,406,653) |
| (4,149) |
| (1,349,265) | ||
Fair Value of Plan Assets |
|
|
|
|
|
|
| 18,426,652 |
| 4,502 |
| 1,806,540 | ||
|
|
|
|
|
|
|
|
|
| (1,980,001) |
| 353 |
| 457,275 |
Being: | ||||||||||||||
Superavit |
|
|
|
|
|
|
|
|
| 620,842 |
| 353 |
| 457,275 |
Deficit |
|
|
|
|
|
|
|
|
| (2,600,843) |
| - |
| - |
Amount not Recognized as Assets |
|
|
|
|
|
|
|
|
| 453,120 |
| 353 |
| 455,057 |
Net Actuarial Asset (Note 12) |
|
|
|
|
|
|
| 167,722 |
| - |
| 2,218 | ||
Net Actuarial Liability (Note 22) |
|
|
|
|
|
|
| (2,600,843) |
| - |
| - | ||
Payments Made |
|
|
|
|
|
|
| 28,711 |
| - |
| 439 | ||
Revenues (Expenses) Recorded (Note 32) |
|
|
|
|
|
| (196,074) |
| 2 |
| (15) | |||
Other Equity Valuation Adjustments |
|
|
|
|
|
| (3,675,440) |
| 489 |
| 1,122 | |||
Actual Return on Plan Assets |
|
|
|
|
|
|
| 2,083,333 |
| 526 |
| 265,169 | ||
|
|
|
|
|
|
|
|
|
|
|
|
|
|
|
Bank | ||||||||||||||
12/31/2016 | ||||||||||||||
Santander- | ||||||||||||||
|
|
|
|
|
|
|
| Banesprev |
| Sanprev |
| previ |
| Bandeprev |
Conciliation of Assets and Liabilities |
|
|
|
|
|
|
|
|
|
|
|
| ||
Present Value of Actuarial Obligations |
|
|
|
|
| (18,800,949) |
| (470,844) |
| (3,300) |
| (1,255,406) | ||
Fair Value of Plan Assets |
|
|
|
|
| 17,202,141 |
| 797,480 |
| 4,473 |
| 1,662,153 | ||
|
|
|
|
|
|
|
| (1,598,808) |
| 326,636 |
| 1,173 |
| 406,747 |
Being: | ||||||||||||||
Superavit |
|
|
|
|
|
|
| 176,224 |
| 326,636 |
| 1,173 |
| 406,747 |
Deficit |
|
|
|
|
|
|
| (1,775,032) |
| - |
| - |
| - |
Amount not Recognized as Assets |
|
|
|
|
|
|
| 66,026 |
| 306,372 |
| 1,173 |
| 406,747 |
Net Actuarial Asset (Note 12) |
|
|
|
|
| 110,198 |
| 20,264 |
| - |
| - | ||
Net Actuarial Liability (Note 22) |
|
|
|
|
| (1,775,032) |
| - |
| - |
| - | ||
Payments Made |
|
|
|
|
| 1,989,176 |
| - |
| - |
| 457 | ||
Revenues (Expenses) Recorded (Note 32) |
|
|
|
|
|
|
| (255,720) |
| (2,049) |
| - |
| (457) |
Other Equity Valuation Adjustments |
|
|
|
| (3,091,368) |
| 11,323 |
| 488 |
| (672) | |||
Actual Return on Plan Assets |
|
|
|
|
| 2,914,934 |
| 151,690 |
| 995 |
| 361,089 | ||
|
|
|
|
|
|
|
|
|
|
|
|
|
|
|
Consolidated | ||||||||||||||
12/31/2017 | ||||||||||||||
Santander- | ||||||||||||||
|
|
|
|
|
|
|
|
|
| Banesprev(1) |
| previ |
| Bandeprev |
Conciliation of Assets and Liabilities |
|
|
|
|
|
|
|
|
|
|
|
| ||
Present Value of Actuarial Obligations |
|
|
|
|
|
|
| (20,648,194) |
| (4,149) |
| (1,349,265) | ||
Fair Value of Plan Assets |
|
|
|
|
|
|
| 18,878,594 |
| 4,502 |
| 1,806,540 | ||
|
|
|
|
|
|
|
|
|
| (1,769,600) |
| 353 |
| 457,275 |
Being: | ||||||||||||||
Superavit |
|
|
|
|
|
|
|
|
| 831,243 |
| 353 |
| 457,275 |
Deficit |
|
|
|
|
|
|
|
|
| (2,600,843) |
| - |
| - |
Value Unrecognized as Asset |
|
|
|
| 635,273 |
| 353 |
| 455,057 | |||||
Net Actuarial Asset (Note 12) |
|
|
|
|
|
|
| 195,970 |
| - |
| 2,218 | ||
Net Actuarial Liability (Note 22) |
|
|
|
|
|
|
| (2,600,843) |
| - |
| - | ||
Payments Made |
|
|
|
|
|
|
| 28,717 |
| - |
| 439 | ||
Revenues (Expenses) Recorded (Note 32) |
|
|
|
|
|
| (193,591) |
| 2 |
| (15) | |||
Other Equity Valuation Adjustments |
|
|
|
|
|
| (3,701,232) |
| 489 |
| 1,122 | |||
Actual Return on Plan Assets |
|
|
|
|
|
|
| 2,104,674 |
| 526 |
| 265,169 | ||
Consolidated | ||||||||||||||
12/31/2016 | ||||||||||||||
Santander- | ||||||||||||||
|
|
|
|
|
|
|
| Banesprev |
| Sanprev |
| previ |
| Bandeprev |
Conciliation of Assets and Liabilities |
|
|
|
|
|
|
|
|
|
|
|
| ||
Present Value of Actuarial Obligations |
|
|
|
|
| (19,039,252) |
| (471,168) |
| (3,300) |
| (1,255,406) | ||
Fair Value of Plan Assets |
|
|
|
|
| 17,652,316 |
| 797,974 |
| 4,473 |
| 1,662,153 | ||
|
|
|
|
|
|
|
| (1,386,936) |
| 326,806 |
| 1,173 |
| 406,747 |
Being: | ||||||||||||||
Superavit |
|
|
|
|
|
|
| 388,096 |
| 326,806 |
| 1,173 |
| 406,747 |
Deficit |
|
|
|
|
|
|
| (1,775,032) |
| - |
| - |
| - |
Value Unrecognized as Asset |
|
| 254,869 |
| 306,372 |
| 1,173 |
| 406,747 | |||||
Net Actuarial Asset (Note 12) |
|
|
|
|
| 133,227 |
| 20,434 |
| - |
| - | ||
Net Actuarial Liability (Note 22) |
|
|
|
|
| (1,775,032) |
| - |
| - |
| - | ||
Payments Made |
|
|
|
|
| 1,989,190 |
| - |
| - |
| 457 | ||
Revenues (Expenses) Recorded (Note 32) |
|
|
|
| (255,739) |
| (2,079) |
| - |
| (457) | |||
Other Equity Valuation Adjustments |
|
|
|
| (3,084,466) |
| 11,371 |
| 488 |
| (672) | |||
Actual Return on Plan Assets |
|
|
|
|
| 3,002,177 |
| 151,680 |
| 995 |
| 361,089 | ||
(1) Includes amounts referring to the transfer of Sanprev Plans (Note 35.a.II). | ||||||||||||||
Opening of gains (losses) actuarial from experience, financial assumptions and demographic hypotheses: | ||||||||||||||
|
|
|
|
|
|
|
|
|
|
|
|
|
| Bank |
12/31/2017 | ||||||||||||||
Santander- | ||||||||||||||
|
|
|
|
|
|
|
|
|
| Banesprev(1) |
| previ |
| Bandeprev |
Experience Plan |
|
|
|
|
|
|
| 660,088 |
| (793) |
| 8,312 | ||
Changes in Financial Assumptions |
|
|
|
|
| (1,448,316) |
| (219) |
| (92,500) | ||||
Changes in Demographic Assumptions |
|
|
|
|
| 146 |
| - |
| - | ||||
Gain (Loss) Actuarial - Obligation |
|
|
|
|
| (788,082) |
| (1,012) |
| (84,188) | ||||
Return on Investment, Return Unlike Implied Discount Rate |
|
|
| 206,950 |
| 66 |
| 89,876 | ||||||
Gain (Loss) Actuarial - Asset |
|
|
|
|
|
|
| 206,950 |
| 66 |
| 89,876 | ||
Chance in Irrecoverable Surplus |
|
|
|
|
| (40,056) |
| 947 |
| (3,893) | ||||
|
|
|
|
|
|
|
|
|
|
|
|
|
| Bank |
12/31/2016 | ||||||||||||||
Santander- | ||||||||||||||
|
|
|
|
|
|
|
| Banesprev |
| Sanprev |
| previ |
| Bandeprev |
Experience Plan |
|
|
|
|
| (602,042) |
| (68,022) |
| 240 |
| (15,871) | ||
Changes in Financial Assumptions |
|
|
| (1,944,759) |
| (43,885) |
| (241) |
| (122,567) | ||||
Changes in Demographic Assumptions |
|
|
| (13,211) |
| 8,553 |
| - |
| (7,761) | ||||
Gain (Loss) Actuarial - Obligation |
|
|
| (2,560,012) |
| (103,354) |
| (1) |
| (146,199) | ||||
Return on Investment, Return Unlike Implied Discount Rate |
| 1,284,302 |
| 68,933 |
| 545 |
| 194,225 | ||||||
Gain (Loss) Actuarial - Asset |
|
|
|
|
| 1,284,302 |
| 68,933 |
| 545 |
| 194,225 | ||
Chance in Irrecoverable Surplus |
|
|
| 87,831 |
| 56,733 |
| (543) |
| (48,539) | ||||
|
|
|
|
|
|
|
|
|
|
|
|
|
| Consolidated |
12/31/2017 | ||||||||||||||
Santander- | ||||||||||||||
|
|
|
|
|
|
|
|
|
| Banesprev (1) |
| previ |
| Bandeprev |
Experience Plan |
|
|
|
|
|
|
| 678,684 |
| (793) |
| 8,312 | ||
Changes in Financial Assumptions |
|
|
|
|
| (1,464,969) |
| (219) |
| (92,500) | ||||
Changes in Demographic Assumptions |
|
|
|
|
| 146 |
| - |
| - | ||||
Gain (Loss) Actuarial - Obligation |
|
|
|
|
| (786,139) |
| (1,012) |
| (84,188) | ||||
Return on Investment, Return Unlike Implied Discount Rate |
|
|
| 180,216 |
| 66 |
| 89,876 | ||||||
Gain (Loss) Actuarial - Asset |
|
|
|
|
|
|
| 180,216 |
| 66 |
| 89,876 | ||
Chance in Irrecoverable Surplus |
|
|
|
|
| (12,744) |
| 947 |
| (3,893) | ||||
|
|
|
|
|
|
|
|
|
|
|
|
|
| Consolidated |
12/31/2016 | ||||||||||||||
Santander- | ||||||||||||||
|
|
|
|
|
|
|
| Banesprev |
| Sanprev |
| previ |
| Bandeprev |
Experience Plan |
|
|
|
|
| (613,273) |
| (68,005) |
| 240 |
| (15,871) | ||
Changes in Financial Assumptions |
|
|
| (1,968,465) |
| (43,916) |
| (241) |
| (122,567) | ||||
Changes in Demographic Assumptions |
|
|
| (13,671) |
| 8,660 |
| - |
| (7,761) | ||||
Gain (Loss) Actuarial - Obligation |
|
|
| (2,595,409) |
| (103,261) |
| (1) |
| (146,199) | ||||
Return on Investment, Return Unlike Implied Discount Rate |
| 1,325,813 |
| 68,863 |
| 545 |
| 194,225 | ||||||
Gain (Loss) Actuarial - Asset |
|
|
|
|
| 1,325,813 |
| 68,863 |
| 545 |
| 194,225 | ||
Chance in Irrecoverable Surplus |
|
|
| 104,096 |
| 56,912 |
| (543) |
| (48,539) | ||||
(1) Include amounts referring to the transfer of Sanprev Plans (Note 35.a.II). | ||||||||||||||
The table below shows the duration of the actuarial obligations of the plans sponsored by Banco Santander: | ||||||||||||||
Plans |
|
|
|
|
|
|
|
|
|
|
| Duration (in Years) | ||
|
|
|
|
|
|
|
|
|
|
|
| 12/31/2017 |
| 12/31/2016 |
Banesprev | ||||||||||||||
Plan I |
|
|
|
|
|
|
|
|
| 11.26 |
| 11.47 | ||
Plan II |
|
|
|
|
|
|
|
|
| 11.51 |
| 11.42 | ||
Plan III |
|
|
|
|
|
|
|
|
| 9.03 |
| 8.44 | ||
Plan IV |
|
|
|
|
|
|
|
|
| 13.86 |
| 16.34 | ||
Plan V |
|
|
|
|
|
|
|
|
| 8.82 |
| 8.57 | ||
Pré-75 |
|
|
|
|
|
|
|
|
| 9.57 |
| 9.29 | ||
Meridional DCA, DAB e CACIBAN |
|
|
|
|
|
|
|
| 6.41/5.82/6.87 |
| 6.22/5.56/6.58 | |||
Sanprev (1) |
|
|
|
|
|
|
|
|
|
|
|
| ||
Plan I |
|
|
|
|
|
|
|
|
| 6.46 |
| 6.29 | ||
Plan II |
|
|
|
|
|
|
|
|
| 10.94 |
| 12.87 | ||
Plan III |
|
|
|
|
|
|
|
|
| 9.46 |
| 9.12 | ||
Bandeprev |
|
|
|
|
|
|
|
|
|
|
|
| ||
Plan Básico |
|
|
|
|
|
|
|
|
| 9.46 |
| 9.11 | ||
Plan Especial I |
|
|
|
|
|
|
|
|
| 6.75 |
| 6.54 | ||
Plan Especial II |
|
|
|
|
|
|
|
|
| 6.61 |
| 6.48 | ||
SantanderPrevi |
|
|
|
|
|
|
|
|
|
|
|
| ||
SantanderPrevi |
|
|
|
|
|
|
|
|
| 7.20 |
| 6.59 | ||
(1) On January 2017, the management of these Plans was transferred to Banesprev (Note 35.a.II). | ||||||||||||||
b) Health and Dental Care Plan | ||||||||||||||
Cabesp - Caixa Beneficente dos Funcionários do Banco do Estado de São Paulo: entity that covers health and dental care expenses of employees hired until Banespa privatization in 2000,as defined in the entity's bylaws. | ||||||||||||||
HolandaPrevi’s Retirees (current corporate name of SantanderPrevi): for the health care plan Retirement has lifetime nature and is a closed group. In his termination the employee should have completed 10 years of employment with Banco Real and 55 years of age. In this case it was offered the continuity of health care plan where the employee pays 70% and the Bank pays 30% of the monthly payment. This rule lasted until December, 2002 and after this period that the employee got terminated with the status Retired Holandaprevi, he pays 100% of the health plan monthly payment. | ||||||||||||||
Former Employees of Banco Real (Retiree by Circulares): it grants entitlement to healthcare to former employee of Banco Real, with lifetime benefit it was granted in the same condition as the active employee, in this case, with the same coverage and plan design. | ||||||||||||||
Eligible only for basic plans and premium apartment, if the beneficiary chooses for the apartment plan he pays the difference between the plans plus the co-participation in the basic plan. Not allowed new additions of dependents. It is subsidized in 90% of the plan. | ||||||||||||||
Bandeprev’s Retirees: health care plan granted to Bandeprev’s retirees as a lifetime benefit, for which Banco Santander is responsible for subsidizing 50% of the benefits of employees retired until November 27, 1998.For whom retired after this date, the subsidy is 30%. | ||||||||||||||
Officer with Lifetime Benefits (Lifetime Officers): lifetime health care benefit granted to a small closed group of former directors coming from Banco Sudameris, being 100% subsidized by the Bank. | ||||||||||||||
Free Clinic: health care plan (free clinic) is offered for a lifetime to retirees who have contributed to the Foundation Sudameris for at least 25 years and has difference in default if the user chooses apartment. The plan is only offered in standard infirmary where the cost is 100% of the Foundation Sudameris. | ||||||||||||||
Life Insurance for Banco Real Retirees (Life Insurance): granted for Retirees Circulars: indemnity in case of Natural Death, Disease Disability, Accidental Death. The subsidy is 45.28% of the value. This benefit is also granted to retirees from Foundation Sudameris and the cost is 100% of the retired.It is a closed group. | ||||||||||||||
Additionally, it is assured to retired employees, since they meet to certain legal requirements and fully pays their respective contributions, the right to be maintaining as a beneficiary of the Banco Santander health plan, in the same conditions for healthcare coverage, taken place during their employment contract. Banco Santander provisions related to this retired employees are calculated using actuarial calculations based in the present value of the current cost. | ||||||||||||||
|
|
|
|
|
|
|
|
|
|
|
|
|
| Bank |
12/31/2017 | 12/31/2017 | |||||||||||||
|
|
|
|
|
|
|
| Cabesp |
| Other Plans |
| Cabesp |
| Other Plans |
Conciliation of Assets and Liabilities |
|
|
|
|
|
|
|
|
|
|
|
| ||
Present Value of Actuarial Obligations |
|
|
|
|
| (4,176,476) |
| (701,551) |
| (3,557,640) |
| (555,160) | ||
Fair Value of Plan Assets |
|
|
|
|
| 3,579,117 |
| - |
| 3,190,984 |
| - | ||
|
|
| (597,359) |
| (701,551) |
| (366,656) |
| (555,160) | |||||
Being: | ||||||||||||||
Deficit |
|
|
|
|
|
|
| (597,359) |
| (701,551) |
| (366,656) |
| (555,160) |
Net Actuarial Liability (Note 22) |
|
|
|
|
|
|
| (597,359) |
| (701,551) |
| (366,656) |
| (555,160) |
Payments Made |
|
|
|
|
|
|
| 60,061 |
| 36,405 |
| 54,754 |
| 29,345 |
Revenues (Expenses) Recorded |
|
|
|
|
|
|
| (44,658) |
| (58,591) |
| (59,703) |
| (56,367) |
Other Equity Valuation Adjustments |
|
|
|
|
|
|
| (603,994) |
| (213,839) |
| (340,049) |
| (89,635) |
Actual Return on Plan Assets |
|
|
|
|
|
|
| 619,635 |
| - |
| 1,337,948 |
| - |
|
|
|
|
|
|
|
|
|
|
|
|
|
| Consolidated |
12/31/2017 | 12/31/2016 | |||||||||||||
|
|
|
|
|
|
|
| Cabesp |
| Other Plans |
| Cabesp |
| Other Plans |
Conciliation of Assets and Liabilities |
|
|
|
|
|
|
|
|
|
|
|
| ||
Present Value of Actuarial Obligations |
|
|
|
|
| (4,342,210) |
| (701,551) |
| (3,691,329) |
| (555,160) | ||
Fair Value of Plan Assets |
|
|
|
|
| 3,721,146 |
| - |
| 3,310,895 |
| - | ||
|
|
| (621,064) |
| (701,551) |
| (380,434) |
| (555,160) | |||||
Being: | ||||||||||||||
Deficit |
|
|
|
|
|
|
| (621,064) |
| (701,551) |
| (380,434) |
| (555,160) |
Net Actuarial Liability (Note 22) |
|
|
|
|
|
|
| (621,064) |
| (701,551) |
| (380,434) |
| (555,160) |
Payments Made |
|
|
|
|
|
|
| 61,803 |
| 36,405 |
| 55,907 |
| 29,345 |
Revenues (Expenses) Recorded |
|
|
|
|
|
|
| (46,460) |
| (58,591) |
| (61,311) |
| (56,367) |
Other Equity Valuation Adjustments |
|
|
|
|
|
|
| (586,155) |
| (213,839) |
| (342,555) |
| (89,635) |
Actual Return on Plan Assets |
|
|
|
|
|
|
| 651,582 |
| - |
| 1,384,439 |
| - |
Opening of gains (losses) actuarial from experience, financial assumptions and demographic hypotheses: | ||||||||||||||
|
|
|
|
|
|
|
|
|
|
|
|
|
| Bank |
12/31/2017 | 12/31/2016 | |||||||||||||
|
|
|
|
|
|
|
| Cabesp |
| Other Plans |
| Cabesp |
| Others Plans |
Experience Plan |
|
|
|
|
| (211,610) |
| (75,069) |
| (1,115,634) |
| 36,566 | ||
Changes in Financial Assumptions |
|
|
| (318,642) |
| (49,136) |
| (440,340) |
| (81,233) | ||||
Changes in Demographic Assumptions |
|
|
| - |
| - |
| - |
| (379) | ||||
Gain (Loss) Actuarial - Obligation |
|
|
| (530,252) |
| (124,205) |
| (1,555,974) |
| (45,046) | ||||
Return on Investment, Return Unlike Implied Discount Rate |
| 284,416 |
| - |
| 696,589 |
| - | ||||||
Gain (Loss) Actuarial - Assets |
|
|
|
|
| 284,416 |
| - |
| 696,589 |
| - | ||
Chance in Irrecoverable Surplus |
|
|
| - |
| - |
| 366,656 |
| - | ||||
|
|
|
|
|
|
|
|
|
|
|
|
|
| Consolidated |
12/31/2017 | 12/31/2016 | |||||||||||||
|
|
|
|
|
|
|
| Cabesp |
| Other Plans |
| Cabesp |
| Others Plans |
Experience Plan |
|
|
|
|
| (228,327) |
| (75,069) |
| (1,153,410) |
| 36,566 | ||
Changes in Financial Assumptions |
|
|
| (331,149) |
| (49,136) |
| (456,719) |
| (81,233) | ||||
Changes in Demographic Assumptions |
|
|
| - |
| - |
| - |
| (379) | ||||
Gain (Loss) Actuarial - Obligation |
|
|
| (559,476) |
| (124,205) |
| (1,610,129) |
| (45,046) | ||||
Return on Investment, Return Unlike Implied Discount Rate |
| 333,504 |
| - |
| 718,628 |
| - | ||||||
Gain (Loss) Actuarial - Obligation |
|
|
| 333,504 |
| - |
| 718,628 |
| - | ||||
Chance in Irrecoverable Surplus |
|
|
| - |
| - |
| 380,434 |
| - | ||||
The table below shows the duration of the actuarial obligations of the plans sponsored by Banco Santander: | ||||||||||||||
|
|
|
|
|
|
|
|
|
|
|
|
|
| Duration (in Years) |
Plans |
|
|
|
|
|
|
|
|
| 12/31/2017 |
| 12/31/2016 | ||
Cabesp |
|
|
|
|
|
|
|
|
| 13.02 |
| 12.93 | ||
Bandepe |
|
|
|
|
|
|
|
|
| 14.47 |
| 14.57 | ||
Free Clinic |
|
|
|
|
|
|
|
|
| 10.88 |
| 11.03 | ||
Lifelong Directors |
|
|
|
|
|
|
|
|
| 8.49 |
| 9.12 | ||
Circular(1) |
|
|
|
|
|
|
|
|
| 12.40 e 10.15 |
| 12.91 e 10.05 | ||
Life Insurance |
|
|
|
|
|
|
|
|
| 7.64 |
| 7.68 | ||
|
|
|
|
|
|
|
|
|
|
|
|
|
|
|
(1) The duration 12.40 (12/31/2016 - 12.91) refers to the plan of Former Employees of Banco ABN Amro and 10.15 (12/31/2016 - 10.05) to the plane of Former Employees of Banco Real. | ||||||||||||||
c) Management of Plan Assets | ||||||||||||||
The main asset categories as percentage of total assets of the plan: | ||||||||||||||
|
|
|
|
|
|
|
|
|
|
|
|
|
| Bank/Consolidated |
|
|
|
|
|
|
|
|
|
|
|
| 12/31/2017 |
| 12/31/2016 |
Equity Instruments |
|
|
|
|
|
|
|
|
| 4.6% |
| 1.0% | ||
Debt Instruments |
|
|
|
|
|
|
|
|
| 94.7% |
| 98.2% | ||
Real Estate |
|
|
|
|
|
|
|
|
| 0.4% |
| 0.3% | ||
Others |
|
|
|
|
|
|
|
|
| 0.4% |
| 0.5% | ||
d) Actuarial Assumptions Adopted in Calculations | ||||||||||||||
|
|
|
|
|
|
|
|
|
|
|
|
|
| Bank/Consolidated |
|
|
|
|
|
|
|
|
|
| 12/31/2017 |
|
|
| 12/31/2016 |
| Pension | Health | Pension | Health | ||||||||||
Nominal Discount Rate for Actuarial Obligation |
|
|
|
| 9.5 |
| 9.7 |
| 10.9 |
| 10.8 | |||
Rate Calculation of Interest Under Assets to the Next Year |
|
|
|
| 9.5 |
| 9.7 |
| 10.9 |
| 10.8 | |||
Estimated Long-term Inflation Rate |
|
|
|
| 4.0% |
| 4.0% |
| 4.5% |
| 4.5% | |||
Estimated Salary Increase Rate |
|
|
|
|
| 5.0% |
| 5.0% |
| 5.0% |
| 5.0% | ||
Boards of Mortality |
|
|
|
|
| AT2000 |
| AT2000 |
| AT2000 |
| AT2000 | ||
e) Sensitivity Analysis | ||||||||||||||
The assumptions about the rates related to the cost of medical care have a significant effect on the amounts recognized in income. The change of one percentage point in the rate of health care cost would have the following effects: | ||||||||||||||
|
|
|
|
|
|
|
|
|
|
|
|
|
|
|
Sensibility | ||||||||||||||
12/31/2016 | 12/31/2015 | |||||||||||||
|
|
|
|
|
|
|
| (+) 1.0% |
| (-) 1.0% |
| (+) 1.0% |
| (-) 1.0% |
Effect on Current Service Cost and Interest on the Actuarial Liabilities |
| 57,001 |
| (63,510) |
| 58,416 |
| (24,839) | ||||||
Effect on the Present Value of Obligations |
| 597,410 |
| (665,700) |
| 527,586 |
| (451,242) | ||||||
f) Share-Based Compensation | ||||||||||||||
Banco Santander has long-terms compensation plans linked to the market price of the shares. The members of the Executive Board of Banco Santander are eligible for these plans, as well as other members selected by the Board of Directors and informed to the Human Resources, whose selection will take into account seniority of the group. For the Board of Directors members in order to be eligible, it is necessary to exercise Executive Board functions. | ||||||||||||||
f.1) Local Program | ||||||||||||||
The long-term incentive plans SOP 2014, PSP 2013 and SOP 2013 were closed in the year 2016. In 2017, the only stock purchase plan of the Bank that remains open for the year is the Deposit Certificate Purchase Option Plan of Units (SOP 2013), as approved at the EGM of April 29, 2013. In 2017, a new plan for the Private area called the Private Ultra High Long Term Incentive Plan was set up. | ||||||||||||||
(i) Share Purchase Plans | ||||||||||||||
Long-Term Incentive Plan – SOP 2013: It is a call option plan with 3 years of duration. The period for the exercise comprises is between June 30, 2016 to June 30, 2018. The number of Units to be exercised by the participants were determined according to the result of measurement of a performance parameter of the Bank: Total Stockholder Return (TSR) and adjusted by the indicator Return on Assets by Risk (RoRWA), comparison between realized and budgeted in each year. The final result of the plan was 89.61%. | ||||||||||||||
a.1) Fair Value and Plans Performance Parameters | ||||||||||||||
For accounting of the Local Program plans, an independent consultant promoted simulations based on Monte Carlo methodology, as presented the performance parameters used to calculate the shares to be granted. Such parameters are associated with their respective probabilities of occurrence, which are updated at the close of each exercise. | ||||||||||||||
|
|
|
|
|
|
|
|
|
|
|
|
|
|
|
|
| SOP2013 (1) | ||||||||||||
TSR Position |
|
|
|
|
|
|
|
|
| % of Shares Exercisable | ||||
1° |
|
|
|
|
|
|
|
|
|
|
| 100% | ||
2° |
|
|
|
|
|
|
|
|
|
|
| 75% | ||
3° |
|
|
|
|
|
|
|
|
|
|
| 50% | ||
(1) The percentage of shares determined at the position of TSR is subject to a penalty according to the implementation of Return on Risk Weighted Assets (RoRWA). | ||||||||||||||
For the fair value measurement of the plans options the following premises were used: | ||||||||||||||
|
|
|
|
|
|
|
|
|
|
|
|
|
|
|
|
|
|
|
|
|
|
|
|
|
|
|
|
| SOP 2013 |
Method of Assessment |
|
|
|
|
|
|
|
|
|
|
| Black&Scholes | ||
Volatility |
|
|
|
|
|
|
|
|
| 40.00% | ||||
Rate of Dividends |
|
|
|
|
|
|
|
|
|
|
| 3.00% | ||
Vesting Period |
|
|
|
|
|
|
|
|
| 3 Years | ||||
Average Exercise Time |
|
|
|
|
|
|
|
|
|
|
| 5 Years | ||
Risk-Free Rate |
|
|
|
|
|
|
|
|
|
|
| 11.80% | ||
Probability of Occurrence |
|
|
|
|
|
|
|
|
|
|
| 60.27% | ||
Fair Value for Shares |
|
|
|
|
|
|
|
|
|
|
| R$5.96 | ||
The average value of shares SANB11 (shares of the Bank in B3 S.A. (Current Corporate Name of BM&FBovespa)) on December 31, 2017 was R$28.47 (12/31/2016 - R$19.94). | ||||||||||||||
On 2017, no pro rata expenses were recorded (2016 - R$15,710 Bank and R$15,789 Consolidated), related to the Stock Option Certificate (SOP). In the same period 2017, there were no expenses related to the Long Term Incentive Plan - Investment in Certificate of Deposit of Shares - Units (2016 - R$9,506 Bank and R$9,798 Consolidated). | ||||||||||||||
|
|
|
|
|
|
|
|
|
|
|
| Date of |
| Date of Expiry |
Number of | Concession | Employees | Commencement | of Exercise | ||||||||||
|
|
|
| Units |
| Exercise Price |
| Year |
| Group |
| Exercise Period |
| Period |
Balance Plans on Dec/31/2015 |
| 12,663,604 |
|
|
|
|
|
|
|
|
|
| ||
Cancelled Options (SOP 2013) |
| (1,346,779) |
| 12.84 |
| 2013 |
| Executives |
| 06/30/2016 |
| 06/30/2018 | ||
Exercised Options (SOP 2013) |
| (6,377,786) |
| 12.84 |
| 2013 |
| Executives |
| 06/30/2016 |
| 06/30/2018 | ||
Granted Options (SOP 2013) |
| 220,606 |
| 12.84 |
| 2013 |
| Executives |
| 06/30/2016 |
| 06/30/2018 | ||
Cancelled Options (PSP 2013) |
| (298,446) |
|
17.92 |
| 2013 |
| Executives |
| 08/13/2013 |
| 06/30/2016 | ||
Exercised Options (PSP 2013) |
| (2,147,515) |
|
17.92 |
| 2013 |
| Executives |
| 08/13/2013 |
| 06/30/2016 | ||
Cancelled Options (SOP 2014) |
| (34,196) |
| 14.31 |
| 2011 |
| Executives |
| 06/30/2014 |
| 06/30/2016 | ||
Exercised Options (SOP 2014) | (693,230) |
| 12.72 |
| 2011 |
| Executives |
| 06/30/2014 |
| 06/30/2016 | |||
Balance Plans on Dec/31/2016 |
| 1,986,258 |
|
|
|
|
|
|
|
|
|
| ||
Exercised Options (SOP 2013) |
| (869,247) |
| 12.84 |
| 2013 |
| Executives |
| 06/30/2016 |
| 06/30/2018 | ||
Balance Plans on Dec/31/2017 |
| 1,117,011 |
|
|
|
|
|
|
|
|
|
| ||
(ii) Local Long-Term Incentive Plan - Cash | ||||||||||||||
| ||||||||||||||
Long-Term Incentive Plan - Private Ultra High:Aims at aligning the interests of Banco Santander and the Participant with the objective, on the one hand, of the growth and profitability of the Private business and, on the other hand, the recognition of the Participant's contribution. The Plan has as its objective the payment by the Bank to the Participants as Variable Remuneration. | ||||||||||||||
|
|
|
|
|
|
|
|
|
|
|
|
|
|
|
Each participant has a target in Reais, if the indicators are reached, the target will be applied on the reference value, the first, paid in March 2020 and the second in March 2021. | ||||||||||||||
|
|
|
|
|
|
|
|
|
|
|
|
|
|
|
Indicators - Phase 1 (Reference Value) |
|
|
|
|
|
|
|
|
|
| ||||
|
|
|
|
|
|
|
|
|
|
|
|
|
|
|
• BAI of 2017. |
|
|
|
|
|
|
|
|
|
|
|
| ||
|
|
|
|
|
|
|
|
|
|
|
|
|
|
|
Indicators - Phase 2 (Calculation of Cash Incentive) |
|
|
|
|
|
|
|
| ||||||
|
|
|
|
|
|
|
|
|
|
|
|
|
|
|
• BAI - 50% (Benefit Indicator before Private Ultra High Segment Taxes); |
|
|
|
|
|
| ||||||||
|
|
|
|
|
|
|
|
|
|
|
|
|
|
|
• MOL - 25% (Private Ultra High Segment Net Margin Indicator); and |
|
|
|
|
|
| ||||||||
|
|
|
|
|
|
|
|
|
|
|
|
|
|
|
• AUM - 25% (Assets Under Management Indicator of Private Ultra High Segment). |
|
|
|
| ||||||||||
|
|
|
|
|
|
|
|
|
|
|
|
|
|
|
In 2017, expenses in the amount of R$2,935 were recorded in the Bank and Consolidated, related to the long-term incentive plan - Private Ultra High. | ||||||||||||||
f.2) Global Program | ||||||||||||||
Long-Term Incentive Policy | ||||||||||||||
In 2014, a share delivery plan called Long-Term Incentive Global Plan CRDIV - Grant 2014 was released. This plan is subject to achievement of performance indicator Total Stockholder Return (TSR) of the Santander Group, comparing the evolution of the Group in this indicator for the main global competitors and the settlement will be in the World Group Santander shares. | ||||||||||||||
In 2016 a stock delivery plan called 2nd Long-Term Incentive Global Plan CRDIV – Grant 2015 was launched. | ||||||||||||||
Global Plan Fair Value | ||||||||||||||
Long-Term Incentive Global Plan CRDIV - Grant 2014 | ||||||||||||||
It is considered that the beneficiaries will not leave Banco Santander during the term of each plan. The fair value of the 50% linked to Banco Santander's relative RTA position was calculated, on the grant date, based on the report provided by external evaluators, based on the Monte Carlo valuation model, performing 10 thousand simulations to determine the RTA of each company in the Reference Group, considering the following variables. The results (each representing the delivery of a certain number of shares) are classified in descending order by calculating the weighted average and discounting the value at the risk-free interest rate. | ||||||||||||||
In view of the high correlation between RTA and LPA, it can be considered (in a high percentage of cases) feasible to extrapolate that the RTA value is also valid for LPA. Therefore, it was initially determined that the fair value of the portion of the plans linked to the Bank’s relative LPA position, of the remaining 50% of the options granted, was the same as that of the 50% corresponding to the TSR. This valuation is reviewed and adjusted on a yearly basis, since its refers to a non-market condition. | ||||||||||||||
|
|
|
|
|
|
|
|
|
|
|
|
|
|
|
Long-Term Incentive Global Plan CRDIV - Grant 2014 |
|
|
|
|
|
|
|
| ||||||
2 Years | 3 Years | 4 Years | ||||||||||||
Future Income Dividend |
|
|
|
|
|
|
|
| 11.10% |
| 10.80% | 9.50% | ||
Expected Volatility |
|
|
|
|
|
|
|
| 32.70% |
| 34.70% | 36.90% | ||
Volatility Comparator |
|
|
|
|
|
|
|
| 12% -52% |
| 16% - 56% | 16% - 52% | ||
Risk-Free Interest Rate |
|
|
|
|
|
|
|
| 1.70% |
| 2.10% | 2.50% | ||
Correlation |
|
|
|
|
|
|
| 0.55 |
| 0.55 |
| 0.55 | ||
The indicator that will be used to measure the achievement of targets will be the comparison of the Total Stockholder Return (RTA) of the Santander Group with the RTA of fifteen (15) leading the Group's global competitors. | ||||||||||||||
The indicator is calculated in two stages: initially for program verification in 2014 and a second time in the annual payment of each installment (2015, 2016 and 2017). | ||||||||||||||
Each executive has a target in Reais, that was converted to Group's (SAN) by the cotation of R$19.2893, that will be delivered in shares awarded in installments in the years 2016, 2017 and 2018, with sale restriction of one (1) year after each delivery. | ||||||||||||||
2nd Long-Term Incentive Global Plan CRDIV - Grant 2015 | ||||||||||||||
The targets of shares agreed to each participant will be obtained through the application of the coefficients in two stages: initially for eligibility verification (2015-2016) and a second time to calculate the due number of shares (2016, 2017 e 2018). | ||||||||||||||
Indicators - Stage 1 | ||||||||||||||
• RTA Versus Competitors | ||||||||||||||
•ROTE (Return on Tangible Capital) Bank Versus Budget | ||||||||||||||
Indicators - Stage 2 | ||||||||||||||
• RTA versus Competitors | ||||||||||||||
•ROTE Bank Versus Budget | ||||||||||||||
• Employee Satisfaction | ||||||||||||||
• Customer Satisfaction | ||||||||||||||
• Corporate Entailment versus Budget | ||||||||||||||
Each executive has a target in Reais, which was converted into shares of the Santander Group (SAN) for a price of R$17,473, which will be delivered in 2019, with a restriction of one (1) year after delivery. | ||||||||||||||
|
|
|
|
|
|
|
|
|
|
|
|
|
|
|
Number of Shares | Date of Commencement of the Period | Date of Expiry of Period | ||||||||||||
|
|
|
|
| Granted | Employees | ||||||||
1st Long-Term Incentive Global Plan CRDIV - |
| 1,613,057 |
| 2014 |
| Executives |
| Jan/2014 |
| Dec/2017 | ||||
2nd Long -Term Incentive Global Plan CRDIV - |
| 1,775,049 |
| 2016 |
| Executives |
| Jan/2015 |
| Dec/2018 | ||||
Balance Plans on December 31, 2017 |
| 3,388,106 |
|
|
|
|
|
|
|
| ||||
On 2017, pro rata expenses were recorded in the amount of R$4,738 in the Bank and R$4,797 in the Consolidated (2016 - no expenses were recorded in the Bank and Consolidated), referring to the costs on the respective dates of the aforementioned cycles, for the total plans Of the Global Program. | ||||||||||||||
Plans do not cause dilution of the capital of the Bank, since they are paid in shares of Banco Santander Spain. | ||||||||||||||
f.3) Referenced Variable Remuneration in Shares | ||||||||||||||
Banco Santander Spain's General Stockholders Meeting, held on June 11, 2010, approved the new policy relating to executive compensation through the payment referenced in variable compensation shares to the Group companies, including Banco Santander. This new policy, with adjustments applicable to Banco Santander, was approved by the Compensation Committee and the Board of Directors on February 2, 2011. | ||||||||||||||
The plan's objectives are: (i) to align the compensation program with the principles of the Financial Stability Board (FSB) agreed at G20; (ii) to align Banco Santander’s interests with those of the plan’s participants (to achieve the sustainable and recurring growth and profitability of Banco Santander’s businesses and to recognize the participants’ contributions); (iii) to allow the retention of participants; and (iv) to improve Banco Santander’s performance and defend the interests of shareholders through a long-term commitment. | ||||||||||||||
The purpose of the plan is the cash or shares payment, as showed below, owed by Banco Santander to the plan’s participants pursuant to the bank’s compensation policy, based on the future performance of the bank’s shares. | ||||||||||||||
The payment of share-based variable compensation is with in the limits of the overall management compensation approved by Banco Santander's General Ordinary Meeting. | ||||||||||||||
The total number of shares on which the compensation plan is based will be settled in three installments and equally allocated to each of the three following years to the reference year. | ||||||||||||||
On March 18, 2015, the Board of Directors approved the proposed new incentive plan (deferral) for payment of the variable compensation of directors and certain employees, which was approved in EGM of April 30, 2015. | ||||||||||||||
On September 29, 2015, the Board of Directors approved the proposed new incentive plan (deferral) for payment of the variable compensation of directors and certain employees, which was approved in EGM of December 14, 2015. | ||||||||||||||
On October 25, 2016, the Board of Director approved the proposed new incentive plan (deferral) for payment of the variable compensation of directors and certain employees, which was approved in EGM of December 21, 2016. | ||||||||||||||
| ||||||||||||||
In the fourth quarter of 2017, the Board of Directors approved the proposal for a new Incentive Plan (deferral) to pay the variable remuneration of administrators and certain employees. | ||||||||||||||
This proposal includes certain requirements for deferred payment of part of the future variable compensation due to its managers and other employees, given the financial basis for sustainable long-term adjustments in future payments due to the risks assumed and fluctuations in cost of capital. | ||||||||||||||
The variable Banco Santander compensation plan is divided into two programs: (i) Collective Identified and (ii) Collective Unidentified. | ||||||||||||||
i) Collective Identified - Participants of the Executive Committee, Statutory Directors and other executives who take significant risks in the Bank and are responsible for the control areas. The deferral will be half in cash, indexed to 100% of CDI and half in shares (SANB11). On the year ended on December 31, 2017, we recorded expenses in the amount of R$81,232 (2016 - revenues in the amount of R$51,982) in the Bank and R$81,838 (2016 - revenues in the amount of R$52,500) in the Consolidated, regarding the provision of the deferral plan in shares. | ||||||||||||||
ii) Collective Unidentified - managerial employees and other employees of the organization that will be benefited from the deferral plan. The deferred amount will be paid 100% cash, indexed by 100% of CDI. On the year ended on December 31, 2017, there were recorded expenses of R$124,039 (2016 - R$79,344) in the Bank and R$124,926 (2016 - R$79,794) in the Consolidated. | ||||||||||||||
Banco Santander in Brazil follows the model which is based on a prudent risk management and the definition of risk appetite on the part of senior management in view of the local regulator and international best practices, aiming to protect the capital and ensuring the profitability of business. The Bank is exposed to the following main risks in its operations: | ||||||||||||||
Types of Risk | ||||||||||||||
Credit Risk | ||||||||||||||
Is the exposure to loss in the case of total or partial default by clients or counterparties in the fulfillment of their financial obligations to the Banco Santander. Credit risk management seeks to establish strategies, besides setting limits, including the analysis of exposure and trends and the effectiveness of credit policies. The goal is to maintain a risk profile and adequate minimum profitability which compensates the estimated default risk of customers and portfolios, as established by the Executive Committee. | ||||||||||||||
Market Risk | ||||||||||||||
Is the exposure to risk factors including interest rates, exchange rates, commodities prices, stock market prices and other values, according to the type of product, the volume of operations, terms and conditions of the agreement and underlying volatility. Market risk management includes practices of measuring and monitoring the use of limits that are pre-set by internal committees, of the value at risk of the portfolios, of sensitivity to fluctuating interest rates, of exposure to foreign exchange rates, of liquidity gaps, among other practices which the control and monitoring of the risks that might affect the position of Banco Santander portfolios in the different markets in which the Bank operates. | ||||||||||||||
Operational Risk | ||||||||||||||
Is the risk of loss based in inadequacy or failures with process, people, systems and / or from exposure to external events. This definition includes the legal risk associated with the inadequacy or deficiency in contracts signed by the Bank, as well as penalties for non-compliance with legal provisions and damages for third parties arising from the activities developed by the Bank, but excludes those that occur as a consequence of strategic risks. Management and control of operational risk are supported by the model of lines of defense, where roles and responsibilities are assigned to all layers of the organization to the topic of operational risks. | ||||||||||||||
The Operational Risk Control department is responsible for the 2nd line of defense, defining policies, methodology and tools for risk management, as well as challenging the 1st line of defense (other departments). | ||||||||||||||
The model allows continuous improvement in the management and control of operational risks, prevention and reduction of losses and risk events, identification of action plans and maintenance of business continuity, converging to the strengthening of the internal control environment. | ||||||||||||||
Compliance Risk | ||||||||||||||
Is the legal risk or regulatory sanctions, financial loss, or damages to the Bank reputation as a result of failure to comply with laws, regulations, codes of conduct and best banking practices. Compliance risk management has a proactive focus on this risk, policies, implementation of process, including monitoring, training, Consulting, risk assessmente and corporate communication of rules and laws to be applied to each businesses area of the Banco Santander. | ||||||||||||||
Money Laundering and Terrorism Financing Risk | ||||||||||||||
The inherent risk of Money Laundering is associated with the possibility of the Bank be used by your clients for Money Laundering through the contracting of products, services and realization of common or structured transactions involving funds earned from illicit businesses in Brazil and abroad, such as drug trafficking, public corruption, tax evasion and others. | ||||||||||||||
In the case of Terrorism Financing, the risk is related to the performance of transactions or in support of individuals and companies listed on international lists published by the FATF - Financial Action Task Force on Money Laundering, United Nations Organization (UN), European Union, among others, or funds of those people who identify themselves as supporters of extremist groups and for this reason, perform contributions, donations and work in a structured way in order to financially assist the terrorism. | ||||||||||||||
In order to prevent and combat money laundering and terrorist financing, the Bank has an Institutional Governance based on the best practices of control and compliance with the world standards of organisms and authorities in the countries where it operates. | ||||||||||||||
Based on internal and external regulations, the Bank conducts periodic training and aims to train, alert and educate its employees. | ||||||||||||||
Reputational Risk | ||||||||||||||
Reputational risk is defined as the risk of current or potential negative economic impact to the Bank due to damage to the perception of the bank of the part of employees, customers, shareholdes/investors and the wider community. | ||||||||||||||
Social and Environmental Risk | ||||||||||||||
Banco Santander’s Social and Environmental Responsibility Policy (PRSA), which complies with National Monetary Council Resolution 4,327/2014 and the SARB 14 self-regulation issued by Febraban, establishes principles and guidelines, and consolidates specific policies and procedures for social and environmental practices used in business and stakeholder relations, including risk management, impacts and opportunities. Santander has a statutory executive responsible for ensuring that this policy is being followed. The PRSA was reviewed in 2016 and continues to be a driver of social and environmental management. The governance of the PRSA has been consolidated in 2016, through the implementation of KPI´s panel, monitored by a group composed of the different areas, responsible for analyzing the progress and challenges involved in guaranteeing the compliance with its guidelines. Moreover, the Internal Audit department conducts the process of supervision of compliance with the commitments undertaken in relation to the Social and Environmental Responsibility Policy and associated policies. The PRSA is also monitored and assessed by the Sustainability Committee, linked to the Board of Directors. | ||||||||||||||
The commitments established in the PRSA are complemented by others detailed in policies such as Anticorruption Policy, Supplier Relation Policy, Human Rights policy, Social and Environmental Risk Policies. Among those, the Social Private Investment Policy aims to drive the Bank´s Social Private Investment strategy, defining the guidelines for the creation and maintenance of the bank´s social programs. | ||||||||||||||
Social and Environmental Risk is analyzed in order to mitigate issues arising from operational risk, capital risk, credit risk and reputational risk. | ||||||||||||||
Social and Environmental Risk management for Wholesales Banking is carried out through the analysis of the socio-environmental practices of clients that have limits or credit risk greater than BRL1 million. This analysis considers items such as contaminated land, deforestation, working conditions and other possible socio-environmental attention points in which there is a possibility of penalties and losses. A specialized team, with a background in Biology, Health and Safety Engineering, Geology and Chemical Engineering, perform this procedure. The financial analysis team considers the potential for damages and impacts that unfavorable socio-environmental situations can cause to the financial condition and the guarantees of the clients. The analysis focuses on preserving capital and reputation in the market and the dissemination of the practice is obtained through constant training of the commercial and credit areas about the application of socio-environmental risk standards in the credit approval process for legal entity in the Wholesale Bank. | ||||||||||||||
Since 2009, Banco Santander has been a signatory of the Equator Principles to mitigate socio-environmental risks in the financing of large projects. | ||||||||||||||
The credit rating process for clients from the Corporate sector - companies with revenue of more than BRL200 million - began to include a score for their social and environmental practices. The initiative known as Social and Environmental Rating, involves direct benefits for: 1) the client, which now has its social and environmental responsible practices rewarded with better credit terms; 2) the Bank, which has strengthened its credit; 3) and Society, by encouraging responsible practices to the clients´ business, promoting and incentivizing corporate responsibility in different production chains and sectors. | ||||||||||||||
The relationship between Santander and its suppliers is backed by the Global Compact guidelines - a UN initiative to adopt globally accepted practices in areas such as human rights, labor relations, the environment and the fight against corruption, which has been a signatory since 2007. These guidelines are present in the competition, homologation and hiring process. During the approval process, suppliers are evaluated in technical, administrative, legal and socioenvironmental aspects, and for 100% of suppliers of high criticality, the Bank has a Supplier Qualification Index (IQF). In the formalization of the provision of a service or acquisition of a good, the Bank uses contracts that have clauses of social and environmental responsibility aligned with the guidelines of the Global Compact. We implemented the Corporate Framework of Agreements with Third Parties and Control of Suppliers, which establishes guidelines that regulate the relationship between the Group's entities and suppliers, in order to mitigate the inherent risks of the business, from the contracting and / or outsourcing process, as well as during the term of the contract. During the service rendering, we have a process of monitoring our suppliers, verifying the regularity of tax, tax and labor obligations and transparency in relation to the Public Administration, allowing the adoption of actions to mitigate risks. It considers risks such as: Technological and Operational, Reputational, Legal, Compliance, Sustainability, among others. | ||||||||||||||
Risk Control Function | ||||||||||||||
On February 23, 2017, Bacen published CMN Resolution No. 4,557, which provides for the Risk and Capital Management (GIRC) structure and entered into force 180 days from the date of its publication. The Resolution highlights the need to implement an integrated risk and capital management structure, definition of an integrated stress test program and Risk Appetite Statement (RAS), constitution of a Risk Committee and appointment of a director for management and director of capital. Banco Santander carried out a mapping of the necessary actions, aiming at adherence to the new Resolution without identifying relevant impacts resulting from this standard up to the date of publication of this note. | ||||||||||||||
Banco Santander has an Integrated Risk Management area for identification, monitoring, control and consolidation, ensuring the correct treatment of all risks (financial and non-financial) to which it is potentially exposed, ensuring follow-up in appropriate internal forums of governance. | ||||||||||||||
Management and control of risks in the Conglomerate Santander is structured into three lines of defense, which develop three different functions. | ||||||||||||||
i. Management of risks from their generation; | ||||||||||||||
ii. Control and consolidation of risks, overseeing their management; and | ||||||||||||||
iii. Independent review of the risk activity. | ||||||||||||||
The three lines of defense should have sufficient separation and independence to not compromise the effectiveness of the general management. | ||||||||||||||
Without prejudice the independence aforementioned, the three lines of defense should act together to maximize their efficiency and boost their effectiveness. | ||||||||||||||
Definition of the Defense Lines | ||||||||||||||
First Line of Defense: Generation and Risk Management | ||||||||||||||
Lines of business or activities that create exposure to a risk are the first line of defense. The generation of risk in the first line of defense should be adjusted to the appetite and limits defined. In order to carry out its role, the first line of defense should be equipped with resources in order to be able to identify measure, manage and report the risks assumed. | ||||||||||||||
Second Line of Defense: Control and Supervision of Risks | ||||||||||||||
The second line of Defense, represented by the Executive Vice Presidency of Risks (from now, VPE of Risks), is composed by specialized teams in risk control and supervision of its management. This second line of defense should safeguard the effective control of risks and ensure that they are managed in accordance with the risk appetite defined by the Conglomerate Santander. | ||||||||||||||
Third Line of Defense: Internal Audit | ||||||||||||||
Internal Audit, acting as the last layer of control in the Conglomerate Santander, should regularly evaluate that policies, methods and procedures are adequate, and check that they are effectively implemented in the management. | ||||||||||||||
Corporate Governance Risk Function | ||||||||||||||
The governance model is structured in a vision of decision, focusing on examination and approval of proposals and credit limits, and in a vision of control, with a focus on full control of risks. | ||||||||||||||
The fundamental principles that rule the risk governance model are: | ||||||||||||||
• Independence of the risks in relation to business area; | ||||||||||||||
• Involvement of the management in decision making; and | ||||||||||||||
• Collegiate Decisions and consensus on credit operations. | ||||||||||||||
The CER-Executive Committee of Risks is the local decision-making forum with representatives of the Bank's management, including the President, VPE and the other members of the Executive Board.The main tasks of this Committee are: | ||||||||||||||
• Monitor the development of credit cards market; | ||||||||||||||
• Decide on proposals for credit; | ||||||||||||||
• Define and monitor compliance with risk appetite; | ||||||||||||||
• Define the actions with regard to the recommendations made by the local regulator and by Internal Audit; | ||||||||||||||
• Approve and authorize the management tools, improvement initiatives, the follow-up of projects and any other relevant activities related to the management of risks; and | ||||||||||||||
• Approve risk policies as well as changes in risk policies with impact on revenue, margin or costs of provision. | ||||||||||||||
The CCR - Risk Control Committee is the control and monitoring local forum with representatives of the Bank's management, including the VPE of Risks and the Vice President of Finance.The main tasks of this Committee are: | ||||||||||||||
• Conduct a comprehensive and periodic follow-up of all risks, if its profile is within the established in the risk appetite, Business Strategic Planning and in the budget approved by the Board of Directors; | ||||||||||||||
• Conduct a periodic and independent control of risk management activities; | ||||||||||||||
• Supervise the measures adopted with regard to risks, to comply with the recommendations and directions made by the regulatory body and Local Audit; and | ||||||||||||||
• Provide to the Board of Directors and the Executive Commission the information and assistance they need in terms of risks. | ||||||||||||||
The relevant issues of risk management or those that exceed the jurisdiction of these committees will be forwarded and decided by the Board of Directors. | ||||||||||||||
| ||||||||||||||
Credit Risk Management | ||||||||||||||
The credit risk management provides subsidies to the development of strategies as risk appetite, beyond boundaries, covering the exposure analysis and trends, as well as the effectiveness of the credit policy. The goal is to keep a risk profile and a minimum appropriate return to compensate the estimated default rates, both the client and the portfolio, as defined by the Executive Committee and Board of Directors. | ||||||||||||||
Credit risk management is specialized due to the characteristics of customers, being segregated between individual clients (with dedicated analysts tracking) and clients with similar characteristics (standardized): | ||||||||||||||
• Individualized Management – is performed by a risk analyst defined, which prepares analyses, forwards to the Committee and monitors the client´s risk evolution. Also covers clients of the wholesale segment: Corporate and Global Corporate Banking (GCB); and | ||||||||||||||
•Standardized Management - dedicated to individuals and companies not framed as individual clients. It is based on automated decision-making models and internal risk assessment, supplemented by commercial competence and specialized analysts teams to handle exceptions. | ||||||||||||||
The profile of credit risk assumed by the Bank is characterized by a diverse geographic distribution and prevalence of retail banking operations. Macroeconomic aspects and market conditions, as well as the sectorial and geographical concentration, the profile of the clients and the economic perspectives are also evaluated and found to be adequate in measuring credit risk. | ||||||||||||||
The risk involved in the loan, the borrower, counterparty identification, risk classification in different categories, the granting of credit and periodic assessments of the levels of risk are procedures that corroborate for the determination of volumes of guarantees and provisions necessary for credit operations that are carried out in accordance with the regulations in force and with the proper security. | ||||||||||||||
The policies, systems and procedures used are reassessed annually to be always according to the needs of the risk management and to the current market scenarios. | ||||||||||||||
a) Rating Models | ||||||||||||||
The Bank uses its own models score/rating, to measure the quality of a client's credit or another operation. Each rating is related to a probability of default or non-payment, determined from the historical experience of the institution, with the exception of a few regarded portfolios as Low Default Portfolios using market data to predict defaults. The scores/ratings are used in the process of approval and monitoring of risk. | ||||||||||||||
The ratings assigned to clients are reviewed periodically, incorporating the new information available and the experience developed in the banking relationship. The frequency of these new reviews is greater for clients who reach certain levels in the automatic systems and to those classified as special monitoring. | ||||||||||||||
The Global qualification tools are those applied to segments of sovereign risk, financial institutions and GCB, with centralized management in the Bank. These tools generate the rating of each client, which is obtained from an automatic module or quantitative, based on coefficients of balance sheets or macro-economic variables, complemented by the analyst's judgment and are reviewed to ensure that the qualifications for those assigned are progressively improved. | ||||||||||||||
In the case of companies and private institutions, a single methodology was set to develop a rating in each country, based on the same modules that previous ratings: quantity or automatic (in this case, analyzing the credit behavior of a sample of clients in relation to their financial States), qualitative or revision made by the analyst with final adjustments. | ||||||||||||||
For clients with standardized management, for both companies and clients, there are scoring tools that automatically assign a note to client. | ||||||||||||||
These tools are complemented with performance models, which allow a greater predictability of risk taken and which are used for preventive activities and marketing. | ||||||||||||||
b) Credit Risk Cycle | ||||||||||||||
The process of credit risk management is to identify, measure, analyze, manage, negotiate and decide about the exhibitions which Conglomerate Santander companies are subject. The cycle of credit risk management has different functions to each of the three phases: | ||||||||||||||
• Pre-sale: includes the processes of planning, goal setting, risk analysis, risk appetite definition, approval of new products and processes of credit rating; | ||||||||||||||
• Sale: decision making for pre-ranking and specific operations; and | ||||||||||||||
• Post Sale: covers the processes of monitoring, measurement and control, in addition to the management of the process and recovery. | ||||||||||||||
This process is followed by the Board of Directors and the Executive Board of the Bank that approves the policies and procedures of risks, the limits, the delegations of jurisdictions in addition to supervise the activities of the Vice Presidency. | ||||||||||||||
| ||||||||||||||
| ||||||||||||||
Planning and Risk Limits | ||||||||||||||
The risk limit establishes the Bank's interest by evaluating business proposals and the risk position. It is defined through risk appetite approved by the management of the Conglomerate and of the units. | ||||||||||||||
As a pre requirement for the Bank’s strategic planning, risk appetite limits are defined. Metrics and limits are approved by the Executive risk committee, by de board of directors, according to the governance stablished in the Banco Santander Risk Corporative framework. | ||||||||||||||
The limits are based on two basic structures: clients/segments and products. | ||||||||||||||
In the case of individual risks, the most basic level is the client, for which are established individual limits. | ||||||||||||||
For GCB clients it is used a pre-ranking model based on a measurement and monitoring system of economic capital.Regarding the Corporate segment, a operational limit model. | ||||||||||||||
In the case of standardized risks, risk limits are set by automatic tools (massive approval), that different rules apply according to the product, credit profile and risk of the customer and are described in the Commercial Strategic Planning (PEC), which is a document previously agreed by the Commercial area and contains the expected results in terms of risk/return. | ||||||||||||||
Risk Analysis | ||||||||||||||
It consists of examining the ability of the counterparty to meet its contractual commitments with the Bank and other entities of the Conglomerate. | ||||||||||||||
Through expert analysis or statistical models, is assigned a rating that reflects the probability of occurrence of default. | ||||||||||||||
This analysis is carried out at least annually, and may be reviewed with greater frequency if the risk profile of the client requests (due to centralized alert systems or visits of the Manager or credit analyst) or if there are specific operations outside of the credit limits stablished. | ||||||||||||||
Decision-Making on Proposals | ||||||||||||||
Aims to analyze and adopt resolutions, according to pre-established policies, taking into consideration the risk appetite and any important operation elements to evaluate the risk and return. | ||||||||||||||
The Bank Santander uses, among others, the Risk Adjusted to the Return on Capital (RORAC) methodology for the analysis and pricing in decision-making on operations and business, especially, in the largest Conglomerates (wholesale segment). | ||||||||||||||
Retail operations are released from approved limits via standardized form or through exception procedures, using judgmental elements as preset jurisdiction. | ||||||||||||||
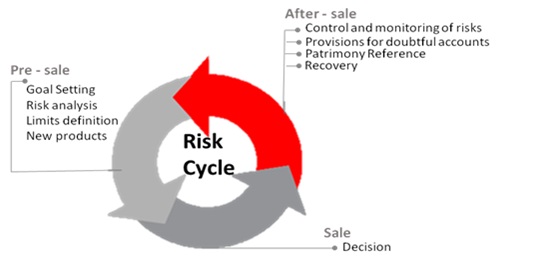
Risk Monitoring | ||||||||||||||
Preventive detection of deterioration in the credit quality of the operation is the responsibility of the business manager in conjunction with the risk analyst. Additionally, risk monitoring is carried out through a process of permanent observation for early identification of incidents that may arise in the development of operations, clients and environment. | ||||||||||||||
This monitoring can result in customer classification in SCAN, which is a system that allows differentiation of the management level and the action to be taken on a case by case basis. | ||||||||||||||
|
|
|
|
|
|
|
|
|
|
|
|
|
|
|
These clients are reviewed every six months or every quarter for cases of more severe categories. The classification SCAN can also arise from the review carried out by the Local Audit. | ||||||||||||||
Daily routines extracted from specific systems are used, at the individual level, with the aim of controlling the proper use of granted limits. In this same level, it is done the control of the guarantees sufficiency, for centralized management area. | ||||||||||||||
In the case of the risks in the standardized level, the key indicators (concentration, loss of credit and fulfillment of budget) are monitored in order to detect variations in the performance of the portfolio compared to projections carried out in PEC. | ||||||||||||||
The reassessment of risk in the client level occurs from the monthly calculation of risk through behavioral models which might consider, for example, variables relating to late payment and external constraints. | ||||||||||||||
Indicators are analyzed to measure performance and adherence of decisions taken, in order to determine possible adjustments in the levels of delegated jurisdiction. | ||||||||||||||
Provisions | ||||||||||||||
The Banco Santander constitutes provision in accordance with the current legislation of Bacen, in accordance with CMN Resolutions 2,682/1999, 2,697/2000 and Circular letter of Bacen 2,899/2000, sorting by rating credit operations and determines the minimum percentage of required provision (Note 8.e). | ||||||||||||||
Credit Recovery | ||||||||||||||
The Recovery business area is responsible for managing the non-performing portfolio. The area has the role to define, implement and monitor strategies and performances related to the delinquent client portfolios, seeking to ensure maximum efficiency in the recovery and considering all legal requirements. The area uses statistical tools to study the behavior of clients by drawing more assertive strategies for recovery. | ||||||||||||||
Clients most likely to pay are classified as low-risk clients with low probability of payment are classified as high risk, determining the intensity of the charge. | ||||||||||||||
The performances of the recovery channels are defined by the "Map of Responsibility", a document that uses the time of default versus the risk of value, and other characteristics used to compose the definition of strategies. | ||||||||||||||
The Bank use some specific recovery methods according to the public as detailed below: | ||||||||||||||
• Internal teams specialized in restructuring and credit recovery with direct management of delinquent clients with overdue more than 60 days and higher values; and | ||||||||||||||
• Specialized external offices to recover, report and assess high-risk customers. These offices are commissioned according to pre-established percentages applied to the amounts recovered. | ||||||||||||||
Sale of non-performing loans portfolio is a recurrent part of the recovery strategy, in which case only the credit rights are sold, all relationship and transactional means remain in the Bank. | ||||||||||||||
Sales of Defaulted Loans Portfolio | ||||||||||||||
Focusing on defaulted operations, the sales are held periodically through competitive or bilateral auction processes, in which it evaluates the conditions, characteristics and selling price of the portfolios that will be offered to potential investors. | ||||||||||||||
Structure of Capital Management | ||||||||||||||
Santander adopts a robust governance that supports all processes related to effective capital management aiming: | ||||||||||||||
• To define coherent way the functions of each team involved in capital management; | ||||||||||||||
• To ensure that the capital limits established in management, risk appetite and the Risk Identification Assessment (RIA) are met; | ||||||||||||||
• To ensure that actions related to the institution's strategy consider the impacts generated in the allocation of capital; | ||||||||||||||
• To ensure that senior management actively participates in management and is informed with recurrence about the behavior of capital indicators. | ||||||||||||||
In addition, the responsibilities of the main departments involved are defined, according to lines of defense: | ||||||||||||||
• First line of defense: responsible for coordinating the capital management process, annual capital planning, capital structure, monitoring the capital budgets; | ||||||||||||||
• Second line of defense: should ensure effective control of capital risk management and evaluate that the level of risk appetite is covering the Bank's capital; | ||||||||||||||
• Third line of defense: Independent reviews. | ||||||||||||||
All processes, calculations, and models involved in capital management are audited and validated internally as third line of defense, having the results reported to the Management. | ||||||||||||||
Santander Brasil has a director responsible for capital management, appointed by the Board of Directors. Furthermore, there is an institutional policy of capital management which are guidelines for the calculation, management, control and reporting of the Capital, fulfilling all the defined requirements for a capital management structure established in the Resolution 4,557/17. | ||||||||||||||
Other Information | ||||||||||||||
As of governance established, the main activities to be adopted for capital management are defined: | ||||||||||||||
• Definition of solvency and capital contribution targets; | ||||||||||||||
• Development of a Multiyear Capital Plan; | ||||||||||||||
• Assessment of the Capital Adequacy; | ||||||||||||||
• Development of Annual Capital Budget; | ||||||||||||||
• Monitoring and controlling the budget´s performance and development of action plans to correct any budget´s deviation. | ||||||||||||||
• Preparation of internal capital reports as well as reports to the supervisor and the market. | ||||||||||||||
For the stages of defining the capital targets, multiyear capital plan, budget and monthly control, it is verified the consistency with regulatory requirements, the institution's risk profile and risk appetite indicators. | ||||||||||||||
Finally, It is worth mentioning, that the process of management, monitoring and control of capital is carried out for both regulatory and economic capital. | ||||||||||||||
Several social movements were implemented in order to reorganize the operations and activities of entities according to the business plan of the Conglomerate Santander. | ||||||||||||||
a) Partnership Formation with HDI Seguros S.A. for the Creation of the Totally Digital Cars Insurance Company | ||||||||||||||
|
|
|
|
|
|
|
|
|
|
|
|
|
|
|
On December 20, 2017, Banco Santander signed binding documents with HDI Seguros SA (HDI Seguros), to form a partnership for the issuance, offering and sale of auto insurance, in a 100% digital way, through creation of a new insurance company - Santander Auto, to be held 50% (fifty percent) by Sancap, a company controlled by Banco Santander, and 50% (fifty percent) by HDI Seguros. The completion of the operation is subject to compliance with certain conditions, including obtaining the relevant regulatory authorizations. | ||||||||||||||
b) Agreement for Indirect Purchase of Shares Capital of Ipanema Empreendimentos e Participações and Gestora de Investimentos Ipanema | ||||||||||||||
On July 5, 2017, Atual Securitizadora, a wholly-owned subsidiary of Banco Santander (Note 15), entered into a purchase and sale agreement to acquire a corporate interest equivalent to 70% of the quotas representing Ipanema Empreendimentos e Participações Ltda. Gestora de Investimentos Ipanema Ltda. and the Investment Fund Ipanema NPL V. On September 19, 2017, the Central Bank authorized the acquisition and, after fulfilling the other conditions precedent, the parties concluded the transaction on October 16, 2017. | ||||||||||||||
c) Incorporation of the Gestora de Inteligência de Crédito S.A. – Partnership between Banco Santander and Others Banks of Brazilian Market | ||||||||||||||
On April 14, 2017, the definitive documents necessary for the creation of a new credit bureau, Gestora de Inteligência de Crédito SA ("Company"), were signed by the shareholders, whose control will be shared among the shareholders who will hold 20% of the its share capital each. The Company will develop a database with the objective of aggregating, reconciling and processing registration and credit information of individuals and legal entities, in accordance with the applicable standards, providing a significant improvement in the processes of granting, pricing and directing credit lines. The Bank estimates that the Company will be fully operational in 2019. | ||||||||||||||
d) Partnership Formation with the Hyundai Group in Brazil | ||||||||||||||
On April 28, 2016, the Aymoré CFI and Banco Santander entered into a transaction for the constitution of a partnership with Hyundai Motor Brasil Montadora de Automóveis Ltda. (Hyundai Motor Brazil) and Hyundai Capital Services, Inc. (Hyundai Capital) for the constitution of Banco Hyundai Capital Brasil S.A. and an insurance brokerage company to provide, respectively, auto finance and insurance brokerage services and products to clients and Hyundai dealerships in Brazil. The partnership capital structure will have a shareholding of 50% (fifty percent) of the Aymoré CFI, 25% (twenty five percent) of Hyundai Capital and 25% (twenty five percent) of Hyundai Motor Brazil. The implementation of the operation shall be subject to the applicable regulatory approvals. On September 19th, 2017, it was published in the Federal Official Gazette the Presidential Decree recognizing the Brazilian government’s interest in the foreign shareholding on a national financial entity to be incorporated jointly by Santander and Hyundai groups. | ||||||||||||||
e) Other Corporate Movements | ||||||||||||||
The following corporate acts were also carried out: | ||||||||||||||
• On December 22, 2017, Santander Corretora de Seguros (current corporate name of Santander Participações SA), Cia de Ferro Ligas da Bahia - Ferbasa SA (Ferbasa) and Brazil Wind SA entered into an agreement for the sale of 100% percent) of the shares issued by BW Guirapá I SA (respectively the Contract and BW Guirapá I SA) held by Santander Corretora de Seguros and Brazil Wind SA to Ferbasa (Operation). The basic price of the total sale of this operation is R$414 million, and an additional amount of up to R$35 million may be paid if future targets stipulated in the Contract are met. Considering the current situation of the contract, this investment was written off, as a result the assets and liabilities of BW Guirapa and its subsidiaries are no longer consolidated in the Conglomerate Balance Sheet, and the result is recorded in the income statement until the base date of November 30, 2017 (Notes 15 and 33). | ||||||||||||||
• On November 30, 2017, the merger and the Private Instrument of Protocol and Justification of the Merger Santander Serviços by Santander Corretora de Seguros (Current Corporate Name of Santander Participações S.A.). With the extinction of Santander Serviços , Santander Corretora de Seguros became its successor in all its rights and obligations. | ||||||||||||||
|
|
|
|
|
|
|
|
|
|
|
|
|
|
|
• On November 17, 2017, was formalized the acquisition by Banco Santander of the participation by Santusa Holding, S.L. (equivalent to 39.35%) in the share capital of Santander Serviços. Thus, Banco Santander becomes the holder of 99.99% of the shares of Santander Serviços. | ||||||||||||||
• On September 29, 2017, the merger and the Private Instrument of Protocol and Justification of Santander Brasil Advisory by Santander Corretora de Seguros (Current Corporate Name of Santander Participações S.A.) were approved, so that Santander Corretora de Seguros received through their book value, based on the balance sheet drawn up on August 31, 2017, all of the assets, rights and obligations of Santander Brasil Advisory. With the extinction of Santander Brasil Advisory the Santander Corretora de Seguros became its successor in all its rights and obligations. | ||||||||||||||
• On August 31, 2017, the merger and the Private Instrument of Protocol and Justification of Santander Microcrédito by Santander Corretora de Seguros (Current Corporate Name of Santander Participações S.A.) were approved, so that Santander Corretora de Seguros received through their book value, based on the balance sheet drawn up on June 30, 2017, all of the assets, rights and obligations of Santander Microcrédito. With the extinction of Santander Microcrédito the Santander Corretora de Seguros became its successor in all its rights and obligations. | ||||||||||||||
• On December 30, 2016, at the EGM of Webmotors S.A., the merger and the Private Instrument of Protocol and Justification of Incorporation of Virtual Motors by Webmotors S.A. were approved, so that Webmotors S.A. received, for its accounting value, based on the balance sheet drawn up on November 30, 2016, all of the assets, rights and obligations of Virtual Motors, with the extinction of Virtual Motors that will be succeeded by Webmotors S.A. in all its rights and obligations. | ||||||||||||||
a) The co-obligations and risks on guarantees provided on behalf of clients, recorded in compensation accounts, amounted to R$38,528,594 (12/31/2016 - R$34,251,930) in the Bank and R$39,173,505 (12/31/2016 - R$35,063,909) in the Consolidated. | ||||||||||||||
b) The total amount of Santander Conglomerate investment funds and assets under management is R$1,747,623 (12/31/2016 - R$1,533,620) and the total amount of investment funds and assets managed is R$188,728,634 (12/31/2016 - R$158,734,033) recorded in compensation accounts. | ||||||||||||||
c) The insurance contracted in effect on December 31, 2017, the global bank, fires, vehicles and other, have coverage amount of R$1,316,447 (12/31/2016 - R$876,519) in the Bank and R$1,323,806 (12/31/2016 - R$885,043) in the Consolidated and global bank, was hired insurance with coverage amount of R$148,499 (12/31/2016 - R$148,499) in the Bank and Consolidated, may be used alone or together, provided they do not exceed the contracted amount. | ||||||||||||||
d) On December 31, 2017 and 2016, there were no related operations and obligations related to active operations. In the year ented of 2016, revenues from related operations were recorded in the amount of R$170 and expenses related to the obligations related to operations related to R$170. | ||||||||||||||
e) Clearing and Settlement Agreements - CMN Resolution 3,263 / 2005 - Banco Santander has an agreement for the compensation and settlement of obligations under the National Financial System (SFN), signed with individuals and legal entities, whether or not members of the SFN, resulting in in greater guarantee of financial settlement, with the parties that have this modality of agreement. These agreements establish that the payment obligations to Banco Santander arising from credit and derivative operations, in the event of default by the counterparty, will be offset against Banco Santander's payment obligations to the counterparty. | ||||||||||||||
e) Obligation Offset and Settlement Agreements - CMN Resolution 3,263/2005 - Banco Santander has an obligation offset and settlement agreement within the ambit of National Financial Institutions (SFN), entered into with individuals and legal entities which may or may not be members of SFN, resulting in improved assurance of financial settlement, with the parties with which it has this type of agreement. These agreements establish that payment obligations with Banco Santander, arising from loans and derivative transactions, in case of default of the counterparty, will be offset against payment obligations of Banco Santander with the counterparty. | ||||||||||||||
f) Other Obligations - Banco Santander rents properties, mainly used for branches, based on a standard contract which may be cancelled at its own criteria and includes the right to opt for renewals and adjustment clauses, classified as operating lease.O total dos pagamentos mínimos futuros dos arrendamentos mercantis operacionais não canceláveis é demonstrado a seguir: | ||||||||||||||
|
|
|
|
|
|
|
|
|
|
|
|
|
|
|
|
|
|
|
|
|
|
|
|
|
|
|
|
|
|
|
|
|
|
|
|
|
|
|
|
|
| 12/31/2017 |
| 12/31/2016 |
Up to 1 Year |
|
|
|
|
|
|
|
|
|
|
| 624,424 |
| 646,804 |
Between1 to 5 Years |
|
|
|
|
|
|
|
|
|
|
| 1,545,101 |
| 1,789,670 |
More than 5 Years |
|
|
|
|
|
|
|
|
|
|
| 288,420 |
| 496,802 |
Total |
|
|
|
|
|
|
|
|
|
| 2,457,945 |
| 2,933,276 | |
Additionally, Banco Santander has contracts with no maturity date determined, totaling R$934 (12/31/2016 - R$1,013) corresponding to the monthly rent contracts with this feature. Payment of operating leases recognized as expenses in the year of 2017, were at the valued of R$655,949 (2016 - R$663,801). | ||||||||||||||
Monthly rental contracts will be adjusted on an annual basis, as per prevailing legislation, at Market General Price Index (IGPM) variation. The lessee is entitled to unilaterally rescind the agreement, at any time, in accordance with contractual clauses and legislation. | ||||||||||||||
g) In the context of the merger transaction of Getnet Tecnologia em Captura e Processamento de Transações H.U.A.H. S.A. (Getnet H.U.A.H. S.A.) into Getnet Adquirencia e Serviços para Meios de Pagamento S.A. (Getnet S.A.), Banco Santander has granted to members of the Getnet H.U.A.H. S.A. a put option linked to all shares of Getnet H.U.A.H. S.A. held by them, equivalent to 11.5% of the total capital of the company. Considering the conditions for the exercise of the put option, it was not registered any corresponding obligation. | ||||||||||||||
h) In the context of the operation, there were granted between Banco Santander and Banco Bonsucesso S.A. (Banco Bonsucesso) a put option (Banco Bonsucesso right of sale) and purchase (Banco Santander right to acquire), relating to all shares issued by the Banco Olé Consignado Bonsucesso held by them, representing to 40.0% of the total capital of the company owned by Banco Bonsucesso . Considering the conditions for the exercise of the put option, no corresponding obligation was recorded. | ||||||||||||||
**** | ||||||||||||||
(Free Translation into English from the Original Previously Issued in Portuguese) | |
BANCO SANTANDER (BRASIL) S.A. AND SUBSIDIARIES | |
Executives' Report on the Financial Statements | |
| |||||||||||||||||||||||||||||||||||
| |||||||||||||||||||||||||||||||||||
For purposes of compliance with Article 25, § 1, VI, CVM Instruction 480, of December 7, 2009, the Executives' of Banco Santander (Brasil) S.A. (Banco Santander) (Company) state that they have discussed, reviewed and agreed with the Banco Santander's Financial Statements for the period ended December 31, 2017, the Financial Statements prepared in accordance with International Financial Reporting Standards (IFRS) and the documents that comprise it, being: Management Report, consolidated balance sheets, consolidated income statements, consolidated statements of comprehensive income, consolidated cash flow statements, consolidated statements of changes in equity and notes to the consolidated financial statements, prepared according IFRS issued by the International Accounting Standards Board (IASB). These financial statements and the documents that comprise it, have been the object of an unqualified review report of the Independent Auditors and the recommendation for approval issued by the Audit Committee of the Company. | |||||||||||||||||||||||||||||||||||
Members of Banco Santander´s Executive Board on December 31, 2017: | |||||||||||||||||||||||||||||||||||
CEO | |||||||||||||||||||||||||||||||||||
Sergio Agapito Lires Rial | |||||||||||||||||||||||||||||||||||
Senior Vice-President Executive Officers | |||||||||||||||||||||||||||||||||||
Conrado Engel | |||||||||||||||||||||||||||||||||||
José de Paiva Ferreira | |||||||||||||||||||||||||||||||||||
Vice-President Executive Officer and Investor Relations Officer | |||||||||||||||||||||||||||||||||||
Angel Santodomingo Martell | |||||||||||||||||||||||||||||||||||
Vice-President Executive Officers | |||||||||||||||||||||||||||||||||||
Alexandre Silva D'Ambrósio | |||||||||||||||||||||||||||||||||||
Antonio Pardo de Santayana Montes | |||||||||||||||||||||||||||||||||||
Carlos Rey de Vicente | |||||||||||||||||||||||||||||||||||
Jean Pierre Dupui | |||||||||||||||||||||||||||||||||||
Juan Sebastian Moreno Blanco | |||||||||||||||||||||||||||||||||||
Manoel Marcos Madureira | |||||||||||||||||||||||||||||||||||
Mário Roberto Opice Leão | |||||||||||||||||||||||||||||||||||
Vanessa de Souza Lobato Barbosa | |||||||||||||||||||||||||||||||||||
Executive Officers | |||||||||||||||||||||||||||||||||||
Jose Alberto Zamorano Hernandez | |||||||||||||||||||||||||||||||||||
José Roberto Machado Filho | |||||||||||||||||||||||||||||||||||
Maria Eugênia Andrade Lopez Santos | |||||||||||||||||||||||||||||||||||
Officers Without Designation | |||||||||||||||||||||||||||||||||||
Alexandre Grossmann Zancani | |||||||||||||||||||||||||||||||||||
Amancio Acúrcio Gouveia | |||||||||||||||||||||||||||||||||||
André de Carvalho Novaes | |||||||||||||||||||||||||||||||||||
Cassio Schmitt | |||||||||||||||||||||||||||||||||||
Cassius Schymura | |||||||||||||||||||||||||||||||||||
Ede Ilson Viani | |||||||||||||||||||||||||||||||||||
Felipe Pires Guerra de Carvalho | |||||||||||||||||||||||||||||||||||
Gilberto Duarte de Abreu Filho | |||||||||||||||||||||||||||||||||||
Igor Mario Puga | |||||||||||||||||||||||||||||||||||
Leopoldo Martinez Cruz |
|
| |||||||||||||||||||||||||||||||||
Luis Guilherme Mattos de Oliem Bittencourt | |||||||||||||||||||||||||||||||||||
Luiz Masagão Ribeiro Filho | |||||||||||||||||||||||||||||||||||
Marcelo Malanga | |||||||||||||||||||||||||||||||||||
Marcelo Zerbinatti | |||||||||||||||||||||||||||||||||||
Marino Alexandre Calheiros Aguiar | |||||||||||||||||||||||||||||||||||
Nilton Sergio Silveira Carvalho | |||||||||||||||||||||||||||||||||||
Rafael Bello Noya | |||||||||||||||||||||||||||||||||||
Ramón Sanchez Díez | |||||||||||||||||||||||||||||||||||
Reginaldo Antonio Ribeiro | |||||||||||||||||||||||||||||||||||
Roberto de Oliveira Campos Neto | |||||||||||||||||||||||||||||||||||
Robson de Souza Rezende | |||||||||||||||||||||||||||||||||||
Ronaldo Wagner Rondinelli | |||||||||||||||||||||||||||||||||||
Sérgio Gonçalves | |||||||||||||||||||||||||||||||||||
Thomas Gregor Ilg | |||||||||||||||||||||||||||||||||||
Ulisses Gomes Guimarães | |||||||||||||||||||||||||||||||||||
|
|
|
|
|
| ||||||||||||||||||||||||||||||
(Free Translation into English from the Original Previously Issued in Portuguese) | |
BANCO SANTANDER (BRASIL) S.A. AND SUBSIDIARIES | |
Executives' Report of Independent Auditors' Report | |
In order to comply with the provisions of article 25, paragraph 1, item V, of the Instruction of the Securities and Exchange Commission (CVM) 480, of December 7, 2009, the members of the Executive Board of Banco Santander (Brasil) SA or Company) declare that they have discussed, reviewed and agreed to the Financial Statements under the BRGAAP criterion of Banco Santander, which includes the Independent Auditors' Report on the Financial Statements under the BRGAAP criterion of Banco Santander for the period ended December 31, 2017 , and the documents that comprise them, being: Management Report, balance sheets, income statement, statement of changes in equity, statement of cash flows, statement of value added and explanatory notes, which were prepared in accordance with accounting practices adopted in Brazil, in accordance with the Brazilian Corporation Law, the rules of the the Central Bank of Brazil in accordance with the model of the National Financial System Institutions Accounting Plan ("COSIF") and other applicable regulations and legislation. These Financial Statements and the accompanying documents were the subject of an unqualified report of the Independent Auditors and a recommendation for approval issued by the Company's Audit Committee. | ||||||||||||||||
Members of Banco Santander´s Executive Board on December 31, 2017: | ||||||||||||||||
CEO | ||||||||||||||||
Sergio Agapito Lires Rial | ||||||||||||||||
Senior Vice-President Executive Officers | ||||||||||||||||
Conrado Engel | ||||||||||||||||
José de Paiva Ferreira | ||||||||||||||||
Vice-President Executive Officer and Investor Relations Officer | ||||||||||||||||
Angel Santodomingo Martell | ||||||||||||||||
Vice-President Executive Officers | ||||||||||||||||
Alexandre Silva D'Ambrósio | ||||||||||||||||
Antonio Pardo de Santayana Montes | ||||||||||||||||
Carlos Rey de Vicente | ||||||||||||||||
Jean Pierre Dupui | ||||||||||||||||
Juan Sebastian Moreno Blanco | ||||||||||||||||
Manoel Marcos Madureira | ||||||||||||||||
Mário Roberto Opice Leão | ||||||||||||||||
Vanessa de Souza Lobato Barbosa | ||||||||||||||||
Executive Officers | ||||||||||||||||
Jose Alberto Zamorano Hernandez | ||||||||||||||||
José Roberto Machado Filho | ||||||||||||||||
Maria Eugênia Andrade Lopez Santos | ||||||||||||||||
Officers Without Designation | ||||||||||||||||
Alexandre Grossmann Zancani | ||||||||||||||||
Amancio Acúrcio Gouveia | ||||||||||||||||
André de Carvalho Novaes | ||||||||||||||||
Cassio Schmitt | ||||||||||||||||
Cassius Schymura | ||||||||||||||||
Ede Ilson Viani | ||||||||||||||||
Felipe Pires Guerra de Carvalho | ||||||||||||||||
Gilberto Duarte de Abreu Filho | ||||||||||||||||
Igor Mario Puga | ||||||||||||||||
Leopoldo Martinez Cruz |
|
| ||||||||||||||
Luis Guilherme Mattos de Oliem Bittencourt | ||||||||||||||||
Luiz Masagão Ribeiro Filho | ||||||||||||||||
Marcelo Malanga | ||||||||||||||||
Marcelo Zerbinatti | ||||||||||||||||
Marino Alexandre Calheiros Aguiar | ||||||||||||||||
Nilton Sergio Silveira Carvalho | ||||||||||||||||
Rafael Bello Noya | ||||||||||||||||
Ramón Sanchez Díez | ||||||||||||||||
Reginaldo Antonio Ribeiro | ||||||||||||||||
Roberto de Oliveira Campos Neto | ||||||||||||||||
Robson de Souza Rezende | ||||||||||||||||
Ronaldo Wagner Rondinelli | ||||||||||||||||
Sérgio Gonçalves | ||||||||||||||||
Thomas Gregor Ilg | ||||||||||||||||
Ulisses Gomes Guimarães | ||||||||||||||||
|
|
|
|
|
| |||||||||||
(Free Translation into English from the Original Previously Issued in Portuguese) | |
BANCO SANTANDER (BRASIL) S.A. AND SUBSIDIARIES | |
Summary of the Audit Committee Report - Six-Month Period and Fiscal Year Ended December, 31 2017 | |
The Audit Committee of Banco Santander (Brasil) S.A. ("Santander"), lead institution of the Economic and Financial Conglomerate ("Conglomerate”), acts as single entity for all the institutions part of the Conglomerate, including those entities under the supervision of the Superintendence of Private Insurance - SUSEP. | |||||||||||||||
According to its Internal Charter, available at the Santander investors relations website (www.ri.santander.com.br), the Audit Committee, among its attributions, advises the Board of Directors on the overview of the quality of the financial statements, its compliance with the applicable rules and legislation, the effectiveness and independence of the work performed by the internal and independent auditors, as well as on the effectiveness of the internal control system and operational risk management. The Audit Committee also recommends amendments and improvements on policies, practices and procedures identified during the course of the performance of its duties, whenever deemed necessary. | |||||||||||||||
The Audit Committee is composed by four independent members, all of which were appointed by the Board of Directors at the meeting held on May 2, 2017. The assessment made by the Audit Committee occurs mainly through meetings with executive officers, auditors and specialists and performs its analysis based on the documents and information received from these parties, in addition, the Audit Committee performs other activities when judged necessary. The Audit Committee evaluations are based, mainly, on the information received from the Board of Directors, Internal and Independent auditors and from the departments responsible for the monitoring of the internal controls and operational risks. The Audit Committee also monitors the recommendations and actions taken related to the results of inspections performed by regulatory bodies and self-regulatory bodies, also holding specific meetings with the Brazilian Central Bank representatives. | |||||||||||||||
The activities reports and meeting minutes are regularly submitted to the Board of Directors, with whom the Audit committee had regularly meetings during the six-month period ended on December 31, 2017. | |||||||||||||||
The Audit Committee developed the following activities: | |||||||||||||||
I. Financial Statements | |||||||||||||||
BrGaap and Prudencial – The Audit Committee analyzed the financial statements of each institution that composes the Conglomerate, confirming their compliance. Through this analysis, it became aware of the net income for the six-month period and year ended December 30, 2017, meeting with the independent auditors and with the professionals responsible for preparing the financial statements, previously to the financial statements issuance. | |||||||||||||||
II - Internal Control and Operational Risk Management | |||||||||||||||
The Audit Committee received information and held meetings with representatives of the Executive Vice Presidency of Risks, Executive Vice Presidency of Means, Technology and Operations, the Compliance Director and the main bodies responsible for the management, implementation and dissemination of the internal controls culture and infrastructure and the Conglomerate risk management. It also verified the cases under follow-up regarding the complaints received by the “Canal Aberto” (former “Canal de Denúncias”) and by the Superintendence of Special Occurrences. These verifications were conducted in accordance with Resolutions 2.554/ 1998, 3.198/2004 and 3.380/2006 of the National Monetary Council (CMN), the Sarbanes Oxley-SOX Act and Circular 249/04 of the Superintendence of Private Insurance (Susep). | |||||||||||||||
III - Internal Audit | |||||||||||||||
IV - Independent Audit | |||||||||||||||
V - Ombudsman | |||||||||||||||
VI - Other Activities | |||||||||||||||
Audit Committee | |||||||||||||||
São Paulo, January 29, 2018 | |||||||||||||||
Jose Luciano Duarte Penido - Coordinator | |||||||||||||||
Luiz Carlos Nannini - Financial Expert | |||||||||||||||
Elidie Palma Bifano | |||||||||||||||
Julio Sergio de Souza Cardozo | |||||||||||||||
Banco Santander (Brasil) S.A. | ||
| By: | /S/ Amancio Acurcio Gouveia | |
Amancio Acurcio Gouveia Officer Without Specific Designation | ||
| By: | /S/ Carlos Rey de Vicente | |
Carlos Rey de Vicente Vice - President Executive Officer | ||