SECURITIES AND EXCHANGE COMMISSION
Commission File Number: 001-34476
Bloco A – Vila Olimpia
São Paulo, SP 04543-011
Federative Republic of Brazil
Indicate by check mark if the registrant is submitting the Form 6-K in paper as permitted by Regulation S-T Rule 101(b)(1):
Yes _______ No ___X____
Indicate by check mark if the registrant is submitting the Form 6-K in paper as permitted by Regulation S-T Rule 101(b)(7):
Yes _______ No ___X____
Indicate by check mark whether by furnishing the information contained in this Form, the Registrant is also thereby furnishing the information to the Commission pursuant to Rule 12g3-2(b) under the Securities Exchange Act of 1934:
Yes _______ No ___X____
If “Yes” is marked, indicate below the file number assigned to the registrant in connection with Rule 12g3-2(b): N/A

Table of Contents
Managerial Analysis of Results–BR GAAP
2
All information presented in this report considers the managerial result, except where otherwise indicated. This quarter we had two events affecting the accounting result. Thus, for better comparability, we excluded these events from the managerial analysis. The reconciliation with the accounting result can be found on pages 26 and 27.
MANAGERIAL¹ ANALYSIS - BR GAAP | 2017 | 2016 | Var. | 4Q17 | 3Q17 | Var. |
|
| 12M |
|
| 3M | |
RESULTS (R$ million) |
|
|
|
|
|
|
Net interest income | 37,327 | 31,497 | 18.5% | 9,498 | 9,863 | -3.7% |
Fees | 15,611 | 13,263 | 17.7% | 4,239 | 3,871 | 9.5% |
Allowance for loan losses | (9,708) | (10,456) | -7.2% | (2,656) | (2,429) | 9.3% |
General Expenses² | (19,167) | (17,919) | 7.0% | (5,183) | (4,806) | 7.8% |
Personnel Expenses | (9,091) | (8,698) | 4.5% | (2,367) | (2,319) | 2.0% |
Administrative Expenses | (10,076) | (9,222) | 9.3% | (2,816) | (2,487) | 13.2% |
Managerial net profit³ | 9,953 | 7,339 | 35.6% | 2,752 | 2,586 | 6.4% |
Accounting net profit | 7,997 | 5,533 | 44.5% | 2,498 | 1,795 | 39.2% |
|
|
|
|
|
|
|
BALANCE SHEET (R$ million) |
|
|
|
|
|
|
Total assets | 683,732 | 701,705 | -2.6% | 683,732 | 676,768 | 1.0% |
Securities and Derivative Financial Instruments | 171,730 | 169,590 | 1.3% | 171,730 | 182,557 | -5.9% |
Loan portfolio | 272,562 | 256,883 | 6.1% | 272,562 | 262,965 | 3.6% |
Individuals | 108,115 | 91,414 | 18.3% | 108,115 | 102,263 | 5.7% |
Consumer finance | 41,884 | 34,777 | 20.4% | 41,884 | 39,178 | 6.9% |
SMEs | 34,288 | 32,799 | 4.5% | 34,288 | 32,945 | 4.1% |
Corporate | 88,275 | 97,893 | -9.8% | 88,275 | 88,579 | -0.3% |
Expanded Loan Portfolio⁴ | 347,907 | 322,783 | 7.8% | 347,907 | 336,409 | 3.4% |
Funding from Clients⁵ | 307,619 | 298,402 | 3.1% | 307,619 | 309,244 | -0.5% |
Deposits (demand, saving and time) | 200,230 | 142,583 | 40.4% | 200,230 | 201,417 | -0.6% |
Equity⁶ | 58,869 | 55,598 | 5.9% | 58,869 | 61,564 | -4.4% |
|
|
|
|
|
|
|
PERFORMANCE INDICATORS (%) |
|
|
|
|
|
|
Return on average equity excluding goodwill⁶ - annualized | 16.9% | 13.3% | 360 bps | 18.3% | 17.1% | 121 bps |
Return on average asset excluding goodwill⁶ - annualized | 1.5% | 1.1% | 36 bps | 1.6% | 1.6% | 6 bps |
Efficiency ratio⁷ | 44.1% | 48.3% | -418 bps | 44.3% | 43.7% | 59 bps |
Recurrence ratio⁸ | 81.4% | 74.0% | 743 bps | 81.8% | 80.5% | 125 bps |
BIS ratio | 15.8% | 16.3% | -48 bps | 15.8% | 16.2% | -35 bps |
Tier I | 14.7% | 15.2% | -43 bps | 14.7% | 15.2% | -45 bps |
Tier II | 1.1% | 1.2% | -4 bps | 1.1% | 1.0% | 10 bps |
|
|
|
|
|
|
|
PORTFOLIO QUALITY INDICATORS (%) |
|
|
|
|
|
|
Delinquency ratio (over 90 days) | 3.2% | 3.4% | -20 bps | 3.2% | 2.9% | 30 bps |
Individuals | 3.7% | 4.1% | -39 bps | 3.7% | 3.7% | -1 bps |
Corporate & SMEs | 2.5% | 2.7% | -17 bps | 2.5% | 1.9% | 60 bps |
Coverage ratio (over 90 days) | 202.5% | 212.0% | -953 bps | 202.5% | 229.7% | -2,726 bps |
Delinquency ratio (over 60 days) | 4.0% | 4.2% | -21 bps | 4.0% | 3.6% | 33 bps |
|
|
|
|
|
|
|
OTHER DATA |
|
|
|
|
|
|
Assets under management9 - AUM (R$ million) | 292,715 | 251,042 | 16.6% | 292,715 | 296,043 | -1.1% |
Branches | 2,255 | 2,254 | 1 | 2,255 | 2,255 | - |
PABs (mini branches) | 1,211 | 1,167 | 44 | 1,211 | 1,169 | 42 |
Own ATMs | 13,522 | 13,806 | (284) | 13,522 | 13,507 | 15 |
Shared ATMs | 21,195 | 19,868 | 1,327 | 21,195 | 20,940 | 255 |
Employees | 47,404 | 47,380 | 24 | 47,404 | 46,734 | 670 |
¹ Excluding 100% of the goodwill amortization expense, the foreign exchange hedge effect and other adjustments, as described on pages 26 and 27.
² Administrative expenses exclude 100% of the goodwill amortization expense. Personnel expenses include profit-sharing.
³ Managerial net profit corresponds to the corporate net profit, excluding the extraordinary result and the 100% reversal of the goodwill amortization expense that occurred in the period.
Goodwill amortization expenses were R$ 166 million in 4Q17, R$ 457 million in 3Q17 and R$ 451 million in 4Q16.
4Including other credit risk transactions (debentures, FDIC, CRI, promissory notes, international distribution promissory notes, acquiring-activities related assets and guarantees).
5Including Savings, Demand Deposits, Time Deposits, Debentures, LCA, LCI, financial bills and Certificates of Structured Operations ("COE").
6Excluding 100% of the goodwill balance (net of amortization), which amounted to R$ 631 million in 4Q17, R$ 795 million in 3Q17 and R$ 2,174 million in 4Q16.
7Efficiency Ratio: General Expenses / (Net Interest Income + Fees + Tax Expenses + Other Operating Income/Expenses).
8 Recurrence ratio: Fees/ General Expenses.
9According to ANBIMA (Brazilian Financial and Capital Markets Association) criteria.
3
Banco Santander Brasil is the only international bank with scale in the country. We are convinced that the best way to grow in a profitable, recurring and sustainable manner is by providing excellent services to enhance customer satisfaction levels and attract more customers, making them more loyal.Our actions are based on establishing close and long-lasting relationships with customers, suppliers and shareholders. To accomplish that goal, our purpose is to help people and businesses prosper by being a Simple, Personal and Fair Bank, guided by the following strategic priorities:
 |  |  |  |
| Increase | Improve the | Be disciplined | Boost |
| customer | profitability, | with capital and | productivity |
| preference and | recurrence and | liquidity to | through an |
| loyalty by | sustainability of our | preserve our | intense agenda |
| offering | results by growing in | solidity, face | of commercial |
| targeted, | businesses with | regulatory | improvements |
| simple, digital | greater revenue | changes and | that enable us to |
| and innovative | diversification, aiming | seize growth | offer a complete |
| products and | to strike a balance | opportunities. | portfolio of |
| services through | between loan, funding | services. | |
| a multi-channel | and services, while | ||
| platform. | maintaining a | ||
| preemptive risk | |||
| management | |||
| approach and | |||
| rigorous cost control. |
In 2017 we achieved historically remarkable results, reflecting a positive dynamic of strong commercial activity, combined with fast-paced innovations and services. Moreover, we further solidified the strength of our internal culture: we are a better-aligned organization to consistently provide a more delightful experience for our customers and, consequently, we grow in a sustainable and profitable manner. Due to these actions, we continued to expand our profitable market share.

People
- Culture is Santander's Foundation!In 2017we strengthened our culture and today we area better-aligned organization to consistentlyimprove customer service and experience.

GPTW (Great Place to Work):for the second consecutive year we ranked among the "Best Companies to Work for" in the country.
- Our global engagement survey reached 88%this year.
- We held our largest corporate event at AllianzParque stadium, with the participation ofnearly 35 thousand employees (approximately74% of our employees).

Retail
- Credit cards:robust growth in credit cardturnover for the ninth consecutive quarter,reaching a market share of 15.1%1, up 190bpsin 12 months.
The offering of AAdvantage® cards continuesto enjoy a high activation rate, whileSantander Way still maintains good ratings inapp stores (4.8 stars in Apple and 4.6 stars inGoogle Play). With a continued focus onperfecting our offerings, this quarter welaunched Santander Pass, an NFC technologybracelet and sticker for contactless payments;we initiated Identity Check Mobile tests inpartnership with Mastercard and Dafiti toauthenticate online payments throughbiometrics or facial recognition;
4
and we began to offer the new Santander/Smiles credit cards. In addition to that, we maintained our offeringof Mortgage Loans starting from single-digitrates. All these actions allowed us to increaseour origination of loans to individuals (+88% intwelve months), exceeding the market average.  Getnet
|  SMEs
 Strengthening leading businesses Strengthening leading businesses
|
 In 2017 we earned a prominent position among acquiring companies in Latin America, ranking 2ndin web3transactions and 4thintotal transactions3.
 We were named the Best Bank in the World for SMEs by Euromoney.
 Black Week
5
 We were named the Best Treasury in Brazil8 . We were named the Best Treasury in Brazil8 .
HDI Seguros:this quarter we announced a joint venture10with HDI Segurosfor the issuance, offering and fully digital sale of auto insurance. This deal reinforce our leadership in vehicle financing and will establish a new benchmark for services in the industry, in which customers will be able to purchase insurance products in a simpler and faster way. Sustainability: On the sustainability front,Santander continues to hold a prominent spot in the“ProsperaSantander”Microcredit Program, which already reached R$ 425 million in the loan portfolio at the end of December 2017. In the higher education segment, we have awarded approximately 9.5 thousand scholarships since 2015, actively contributing to the advancement of education inthe country. Our social and environmental loan portfolio totaled R$ 2.3 billion at the end of December 2017. |  Customer loyalty: Customer loyalty:Growth in our customer base illustrates our continued focus on enhancing the experience of our customers. As a result, our base of active current account holders has grown for 31 consecutive months.
|
 Other ventures:

1Source: ABECS, as of September 2017.2Source: Brazilian Central Bank, as of November 2017.3Source: Nilson Report, as of 2016.4Source: Brazilian Central Bank, as of September 2017.5Consumer credit.6Source: Brazilian Central Bank, as of December 2017.7Financial Advisory in the Americas. Dealogic. 9M17 and Financial Advisory–leadership since 2008, ANBIMA 2016.8Source: Euromoney.9Source: Institutional Investor Magazine.10The completion of the transaction is subject to compliance with certain conditions, including obtaining the required regulatory approvals.
6
| ExecutiveSummary | |
 | In 2017, net profit reached its highest level ever, with growth of 35.6% in twelve months, reflecting another year of solid results, underpinned by a more favorable environment of robust commercial activity, with our expanded retail operations accounting for a larger share of the bank's results. We maintain a preemptive risk management approach, alongside a continued focus on productivity. We reiterate ourcommitment to leveraging the generation of results based on a more efficient,productive and customer-centric business model. |
Managerial net profit totaled R$ 9,953 million in 2017, reaching the highest level in our history, growing 35.6 % in twelve months and rising 6.4% in three months, driven by a better commercial environment, thus providing for sustainable and recurring growth. Total revenues amounted to R$ 52,938 million in 2017, advancing 18.3% in twelve months (orR$ 8.179 million) highlighted by the goodperformance of net interest income in volumes and spreads, as well as fee revenues. In three months these revenues remained stable. Net interest income reached R$ 37,327 million in 2017, climbing 18.5% in twelve months, with positive dynamics in all business segments. In three months, net interest income decreased by 3.7%, impacted by lower income from market activities. It is worth noting, though, that over the same period customer margins recorded growth due to higher volumes and spreads. Fees came to R$ 15,611 million, rising 17.7% in twelve months and up 9.5% in three months, thanks to greater loyalty and transactionality of our customers. Credit card revenues, current account services and insurance fees were the highlights. | Profitability The return on average equity (ROAE), adjusted for goodwill, was 16.9% in 2017, 360 bps higher in twelve months, prompted by the strong growth in our revenues. In the quarter, ROAE reached 18.3%. Allowance for loan losses reached R$ 9,708 million in 2017, falling 7.2% in twelve months. This improvement is a testament to our solid risk management,which keeps the quality indicators of the loanportfolio under control. In three months, allowance for loan loss increased by 9.3%,due to strong commercial dynamics and a one-off case in the corporate segment. General expenses totaled R$ 19.167 million in 2017, up 7.0% in twelve months and growing 7.8% in three months, due to higher variable expenses and remuneration, which accompany the dynamics of greater commercial activity. The efficiency ratiofor the year stood at 44.1%, representing the lowest level in the last 5 years, supported by our continued focus on productivity. |
7
 BALANCE SHEET AND INDICATORS BALANCE SHEET AND INDICATORS |
The total loan portfolio amounted to R$ 272,562 million in 2017, meaning an increase of 6.1% in twelve months (or up 5.9%, if we disregard the foreign exchange fluctuation effect).Our strategy has enabled us to outperformmarket growth, which is a major achievementagainst a challenging economic backdrop. In three months, the portfolio grew 3.6% (representing an expansion of 3.2%, disregarding the foreign exchange fluctuation). Among the segments, loans to individuals and the consumer finance portfolio stood out as the top performers. Loans to individuals totaled R$ 108,115 million at the end of December 2017, rising 18.3% in twelve months and increasing 5.7% in three months, driven by credit cards,payroll loans and agricultural loans. The consumer finance portfolio stood at R$ 41,884 million at the end of December 2017, advancing 20.4% in twelve months and expanding by 6.9% in three months, thus exceeding the market growth rate. The SME portfolio came to R$ 34,288 million in December 2017, an increase of 4.5% in twelve months and growth of 4.1% in three months (or rising 4.4% in twelve months and 3.8% in three months, disregarding the foreign exchange rate fluctuation effect).The corporate loan portfolio came toR$ 88,275 million, decreasing by 9.8% in twelve months and down 0.3% in three months (or a decline of 10.2% in twelve months and a 1.6% reduction in three months, disregarding the foreign exchange fluctuation effect). The expanded loan portfolio reached R$ 347,907 million, growing 7.8% in twelve months and increasing 3.4% in three months. | Funding from clients amounted to R$ 307,619 million at the end ofDecember 2017, climbing 3.1% in twelve months and reducing by 0.5% in three months. Savings deposits grew 12.5% in twelve months and increased by 5.2% in three months. Time deposits rose by 57.4% in twelve months, due to a decline in funding through financial bills, as noted earlier. In three months, these deposits fell by 3.0%, given the effect of a one-off transaction occurred in the last quarter. Total equity excluding R$ 631 million related to the goodwill balance, was R$ 58,869 million at theend of December 2017, up 5.9% in twelvemonths and down 4.4% in three months. Quality indicators At the end of December 2017, the over-90-day delinquency ratio reached 3.2% of the total loan portfolio, representing a decline of20 bps in twelve months. The improvement inthis ratio reflects our preemptive risk management, given the effectiveness of our mathematical models, which have been successful in keeping the quality indicators of the loan portfolio under control. On a quarterly basis, this indicator advanced 30 bps, impacted by a one-off case in the corporate segment. The BIS ratio stood at 15.8% in December 2017, decreasing 48 bps in twelve months anda reduction of 35 bps in three months. |
8
MANAGERIAL FINANCIAL STATEMENTS¹ (R$ million) | 2017 | 2016 | Var. 12M | 4Q17 | 3Q17 | Var. 3M |
|
|
|
|
|
|
|
Net Interest Income | 37,327 | 31,497 | 18.5% | 9,498 | 9,863 | -3.7% |
Allowance for Loan Losses | (9,708) | (10,456) | -7.2% | (2,656) | (2,429) | 9.3% |
Net Interest Income after Loan Losses | 27,619 | 21,041 | 31.3% | 6,843 | 7,434 | -8.0% |
Fees | 15,611 | 13,263 | 17.7% | 4,239 | 3,871 | 9.5% |
General Expenses | (19,167) | (17,919) | 7.0% | (5,183) | (4,806) | 7.8% |
Personnel Expenses + Profit Sharing | (9,091) | (8,698) | 4.5% | (2,367) | (2,319) | 2.0% |
Administrative Expenses² | (10,076) | (9,222) | 9.3% | (2,816) | (2,487) | 13.2% |
Tax Expenses | (3,667) | (3,335) | 10.0% | (955) | (914) | 4.4% |
Investments in Affiliates and Subsidiaries | 25 | 7 | n.a. | (1) | 10 | n.a. |
Other Operating Income/Expenses | (5,819) | (4,306) | 35.1% | (1,084) | (1,835) | -40.9% |
Operating Income | 14,602 | 8,750 | 66.9% | 3,859 | 3,760 | 2.6% |
Non Operating Income | (260) | 36 | n.a. | 53 | (35) | n.a. |
Net Profit before Tax | 14,342 | 8,785 | 63.2% | 3,912 | 3,725 | 5.0% |
Income Tax and Social Contribution | (3,996) | (1,330) | n.a. | (1,067) | (1,030) | 3.6% |
Minority Interest | (394) | (117) | n.a. | (93) | (110) | -15.2% |
Net Profit | 9,953 | 7,339 | 35.6% | 2,752 | 2,586 | 6.4% |
1Excluding 100% of the goodwill amortization expense, foreign exchange hedge effect and other adjustments, as described on pages 26 and 27.
2 Excluding 100% of the goodwill amortization expense.
Net Interest Income Net interest income totaled R$ 37,327 million in 2017, growing 18.5% in twelve months (or R$ 5,831 million) and falling 3.7% in three months. Revenues from loan operations advanced 12.1% in twelve months and rose by 6.6% in three months. The increase in revenues, in both periods, is associated with growth in volume and in the average spread. It should be noted that, in twelve months, we had a greater contribution from the segment mix, attributed to stronger growth of the share of individuals in the portfolio. Funding revenues climbed 31.2% in twelve months, asconsequence of the liability management planimplemented in 2016, as previously mentioned. In three months, funding revenues grew 4.3%, mostly caused by an increase in the average volume. The "Other" interest income, which considers the result of the structural gap in the balance sheet interest rate and activities with treasury clients, among others, expanded by 32.9% in twelve months. In three months, these revenues declined by 29.7%, owing to lower income from market activities, which are volatile by nature. |
|

9
NET INTEREST INCOME (R$ million) | 2017 | 2016 | Var.12M | 4Q17 | 3Q17 | Var.3M |
Net Interest Income | 37,327 | 31,497 | 18.5% | 9,498 | 9,863 | -3.7% |
Loan | 24,203 | 21,583 | 12.1% | 6,522 | 6,119 | 6.6% |
Average volume | 258,609 | 246,966 | 4.7% | 266,917 | 259,439 | 2.9% |
Spread (Annualized) | 9.4% | 8.7% | 62 bps | 9.7% | 9.4% | 34 bps |
Funding | 4,009 | 3,055 | 31.2% | 1,054 | 1,010 | 4.3% |
Average volume | 251,725 | 221,099 | 13.9% | 271,981 | 254,796 | 6.7% |
Spread (Annualized) | 1.6% | 1.4% | 21 bps | 1.6% | 1.6% | 4 bps |
Other¹ | 9,115 | 6,858 | 32.9% | 1,922 | 2,733 | -29.7% |
¹ Including other margins and the result from financial transactions.
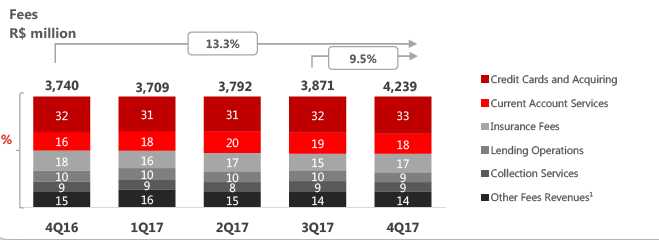
Fees–Revenues from Banking Services Revenues from banking services and fees totaled R$ 15,611 million in 2017, reaching its highest level for the period, driven by greater customer loyalty and transactionality. These revenues grew 17.7% in twelve months (or R$ 2,348 million) and climbed 9.5% in three months (or R$ 368 million), primarily explained by higherrevenues from: (i) credit cards and acquiring; (ii)current account services; and (iii) insurance fees. Credit card and acquiring fees totaled R$ 4,990 million in 2017, meaning growth of 22.2% in twelve months, mostly influenced by higher transaction volumes. In three months, these revenues climbed 13.2%, mainly attributed to higher interchange revenues, given the increase in revenues from year-end sales. Current account service fees came to R$ 2,908 million in the year, rising 30.3% in twelve months, influenced by growth in the loyalty customer base reflected in higher transactionality and the realignment of our products. In three months, these revenues went up 2.3%. |
Insurance fees stood at R$ 2,516 million in 2017, a 13.8% growth in twelve months, owing to the expansion of our product portfolio and credit life insurance, accompanying the credit dynamics. In three months, these fees were 24.2% higher, mostly caused by the seasonal effect of policy renewals, which are concentrated in the fourth quarter of the year. Collection services reached R$ 1,389 million in the year, advancing 13.5% in twelve months. In three months, these revenues increased by 1.5%. Brokerage, custody and placement fees totaledR$ 700 million in 2017, a 29.0% rise in twelve months and growth of 25.6% in three months. This improvement was sparked by higher revenues from securities placement. |
¹ Including Asset Management, Securities Brokerage and Placement Services and Other. For more details, please refer to the Table of Revenues from Banking Services and Fees on page 11.
10
FEES INCOME (R$ million) | 2017 | 2016 | Var. 12M | 4Q17 | 3Q17 | Var. 3M |
Credit Cards and Acquiring | 4,990 | 4,085 | 22.2% | 1,410 | 1,246 | 13.2% |
Insurance fees | 2,516 | 2,211 | 13.8% | 721 | 581 | 24.2% |
Current Account Services | 2,908 | 2,231 | 30.3% | 764 | 747 | 2.3% |
Asset Management | 1,008 | 1,077 | -6.4% | 249 | 251 | -0.7% |
Lending Operations | 1,491 | 1,427 | 4.5% | 373 | 378 | -1.4% |
Collection Services | 1,389 | 1,224 | 13.5% | 365 | 360 | 1.5% |
Securities Brokerage and Placement Services | 700 | 543 | 29.0% | 200 | 159 | 25.6% |
Other | 608 | 465 | 30.7% | 157 | 150 | 4.8% |
Total | 15,611 | 13,263 | 17.7% | 4,239 | 3,871 | 9.5% |
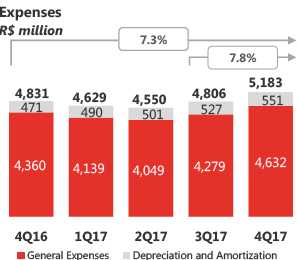
General Expenses (Administrative + Personnel) General expenses, including depreciation and amortization, came to R$ 19,167 million in 2017, registering growth of 7.0% (or R$ 1,248 million) in twelve months and 7.8% in three months,givenhighervariableexpensesandcompensation, accompanying the dynamics of greater commercial activity. Administrative and personnel expenses, excluding depreciation and amortization, totaled R$ 17,099 million in 2017, meaning growth of 5.9% in twelve months and 8.3% higher in three months. Personnel expenses, including profit-sharing, amounted to R$ 9,091 million in 2017, rising 4.5% intwelve months (or R$ 394 million) and up 2.0% inthree months, largely as consequence of higher profit-sharing expenses, due to the meritocracy incentive aligned with the business performance. Expenses were also affected by the collective bargaining agreement that occurred in September 2017. Administrative expenses, excluding depreciation and amortization, totaled R$ 8,007 million in 2017, growing 7.6% in twelve months (or R$ 566 million) and 15.6% in three months (or R$ 306 million). These results mostly reflect higher expenses with: (i) data processing, additional technology expenses due to the | reassessment of a new threshold for transactions; combined with (ii) advertising, promotions and publicity, as consequence of commercial actions in line with the commercial transformation of thebusiness. Depreciation and amortization expenses were R$ 2,069 million, a 16.2% increase in twelve months and a 4.4% growth in three months.
|
11
The efficiency ratio reached 44.1% in 2017, showing an improvement of 418 bps in twelve months, thanks to our continued focus on increasing productivity, primarily influenced by the greater commercial activity. In the quarter, this indicator came to 44.3%, rising 59 bps in three months |
|

EXPENSES' BREAKDOWN (R$ million) | 2017 | 2016 | Var. 12M | 4Q17 | 3Q17 | Var. 3M |
Outsourced and Specialized Services | 2,187 | 2,179 | 0.4% | 494 | 562 | -12.1% |
Advertising, promotions and publicity | 573 | 436 | 31.3% | 218 | 167 | 30.3% |
Data processing | 1,927 | 1,596 | 20.8% | 678 | 418 | 62.1% |
Communications | 434 | 490 | -11.3% | 109 | 112 | -2.6% |
Rentals | 728 | 748 | -2.6% | 180 | 179 | 0.7% |
Transport and Travel | 177 | 210 | -15.7% | 42 | 46 | -8.3% |
Security and Surveillance | 611 | 691 | -11.5% | 159 | 154 | 3.2% |
Maintenance | 233 | 253 | -7.7% | 62 | 56 | 10.0% |
Financial System Services | 283 | 251 | 12.8% | 74 | 70 | 5.9% |
Water, Electricity and Gas | 181 | 207 | -12.2% | 47 | 39 | 21.6% |
Material | 64 | 68 | -6.2% | 18 | 17 | 7.7% |
Other | 609 | 313 | 94.2% | 184 | 139 | 32.3% |
Subtotal | 8,007 | 7,441 | 7.6% | 2,265 | 1,959 | 15.6% |
Depreciation and Amortization¹ | 2,069 | 1,781 | 16.2% | 551 | 527 | 4.4% |
Total Administrative Expenses | 10,076 | 9,222 | 9.3% | 2,816 | 2,487 | 13.2% |
Compensation² | 5,996 | 5,654 | 6.0% | 1,597 | 1,562 | 2.2% |
Charges | 1,638 | 1,571 | 4.3% | 429 | 407 | 5.4% |
Benefits | 1,384 | 1,467 | -5.7% | 316 | 339 | -6.8% |
Training | 60 | 70 | -15.1% | 22 | 17 | 32.4% |
Other | 15 | (65) | n.a. | 3 | (6) | n.a. |
Total Personnel Expenses | 9,091 | 8,698 | 4.5% | 2,367 | 2,319 | 2.0% |
Administrative + Personnel Expenses | 17,099 | 16,139 | 5.9% | 4,632 | 4,279 | 8.3% |
Total General Expenses | 19,167 | 17,919 | 7.0% | 5,183 | 4,806 | 7.8% |
1Excluding 100% of the goodwill amortization expenses, which totaled R$ 166 million in 4Q17, R$ 457 million in 3Q17 and R$ 451 million in 4Q16.
2 Including Profit-Sharing.
12
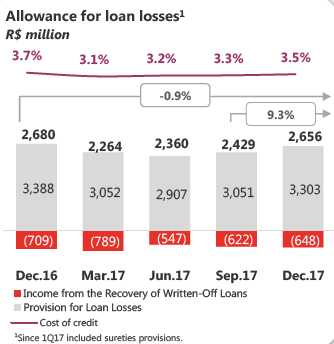
Allowance for Loan Losses Allowance for loan losses totaled R$ 9,708 million in 2017, representing a decrease of7.2% in twelve months (or R$ 748 million)and an increase of 9.3% in three months. Provision for loan losses amounted to R$ 12,314 million in the year, declining by 7.4% in twelve months (or R$ 977 million). This improvementproves the strength of our risk management,which keeps the loan portfolio quality indicators under control. In three months, these expenses reached R$ 3,303 million, advancing 8.3%, influenced by loan portfolio growth, due to strong commercial dynamics and a specific case in the corporate segment. Income from the recovery of written-off loans amounted to R$ 2,605 million in 2017, down 8.1% in twelve months. In three months, these revenueswent up 4.1%. |
|
Other Operating Income and Expenses
Other net operating income and expenses came to R$ 5,819 million in 2017.
OTHER OPERATING INCOME (EXPENSES) (R$ million) | 2017 | 2016 | Var. 12M | 4Q17 | 3Q17 | Var. 3M |
Expenses from credit cards | (1,700) | (1,204) | 41.2% | (507) | (417) | 21.8% |
Net Income from Capitalization | 358 | 320 | 12.0% | 87 | 89 | -2.3% |
Provisions for contingencies¹ | (2,038) | (1,615) | 26.2% | (518) | (375) | 38.3% |
Other | (2,439) | (1,806) | 35.0% | (146) | (1,132) | -87.1% |
Other operating income (expenses) | (5,819) | (4,306) | 35.1% | (1,084) | (1,835) | -40.9% |
13
Balance Sheet
Total assets reached R$ 683,732 million at the end of December 2017, a 2.6% decline in twelve months and a 1.0% rise in three months. Total equity was R$ 59,500 million in the same period. Excluding the goodwill balance, total equity stood at R$ 58,869 million.
ASSETS | Dec/17 | Dec/16 | Var. | Sep/17 | Var. |
(R$ million) |
|
| 12M |
| 3M |
Current Assets and Long-term Assets | 672,561 | 688,673 | -2.3% | 664,984 | 1.1% |
Cash and Cash Equivalents | 11,234 | 5,723 | 96.3% | 7,080 | 58.7% |
Interbank Investments | 46,761 | 59,669 | -21.6% | 49,963 | -6.4% |
Money Market Investments | 34,484 | 47,479 | -27.4% | 43,787 | -21.2% |
Interbank Deposits | 2,862 | 1,191 | 140.4% | 1,503 | 90.4% |
Foreign Currency Investments | 9,415 | 11,000 | -14.4% | 4,673 | 101.5% |
Securities and Derivative Financial Instruments | 171,730 | 169,590 | 1.3% | 182,557 | -5.9% |
Own Portfolio | 59,203 | 60,041 | -1.4% | 69,296 | -14.6% |
Subject to Repurchase Commitments | 71,038 | 70,175 | 1.2% | 73,001 | -2.7% |
Posted to Central Bank of Brazil | 2,368 | 3,045 | -22.2% | 2,179 | 8.6% |
Pledged in Guarantees | 12,483 | 12,250 | 1.9% | 18,007 | -30.7% |
Other | 26,637 | 24,079 | 10.6% | 20,074 | 32.7% |
Interbank Accounts | 82,504 | 62,900 | 31.2% | 68,277 | 20.8% |
Restricted Deposits: | 63,057 | 61,368 | 2.8% | 66,423 | -5.1% |
-Central Bank of Brazil | 62,781 | 61,199 | 2.6% | 66,149 | -5.1% |
-National Housing System | 276 | 170 | 62.6% | 274 | 0.6% |
Other | 19,447 | 1,532 | n.a. | 1,854 | n.a. |
Lending Operations | 255,486 | 239,190 | 6.8% | 246,068 | 3.8% |
Lending Operations | 272,642 | 256,898 | 6.1% | 263,040 | 3.7% |
Lending Operations Related to Assignment | 306 | 624 | -51.0% | 355 | -13.8% |
(Allowance for Loan Losses) | (17,462) | (18,333) | -4.7% | (17,327) | 0.8% |
Other Receivables | 102,540 | 148,992 | -31.2% | 108,572 | -5.6% |
Foreign Exchange Portfolio | 55,048 | 87,044 | -36.8% | 46,004 | 19.7% |
Income Receivable | 26,160 | 26,767 | -2.3% | 26,915 | -2.8% |
Other | 21,332 | 35,181 | -39.4% | 35,654 | -40.2% |
Other Assets | 2,306 | 2,609 | -11.6% | 2,467 | -6.5% |
Permanent Assets | 11,172 | 13,031 | -14.3% | 11,784 | -5.2% |
Temporary Assets | 371 | 178 | 108.6% | 391 | -5.0% |
Fixed Assets | 6,396 | 7,551 | -15.3% | 7,060 | -9.4% |
Intangibles | 4,405 | 5,303 | -16.9% | 4,334 | 1.6% |
Goodwill net of amortization | 631 | 2,174 | -71.0% | 795 | -20.6% |
Other Assets | 3,774 | 3,129 | 20.6% | 3,539 | 6.6% |
Total Assets | 683,732 | 701,705 | -2.6% | 676,768 | 1.0% |
Total Assets (excluding goodwill) | 683,101 | 699,531 | -2.3% | 675,973 | 1.1% |
14
LIABILITIES (R$ million) | Dec/17 | Dec/16 | Var. 12M | Sep/17 | Var. 3M |
Current Liabilities and Long-term Liabilities | 621,824 | 640,843 | -3.0% | 611,637 | 1.7% |
Deposits | 203,532 | 145,705 | 39.7% | 204,118 | -0.3% |
Demand Deposits | 17,177 | 16,006 | 7.3% | 15,980 | 7.5% |
Savings Deposits | 40,572 | 36,051 | 12.5% | 38,570 | 5.2% |
Interbank Deposits | 3,292 | 3,122 | 5.4% | 2,701 | 21.9% |
Time Deposits and Others | 142,491 | 90,525 | 57.4% | 146,867 | -3.0% |
Money Market Funding | 129,962 | 160,924 | -19.2% | 141,526 | -8.2% |
Own Portfolio | 97,173 | 123,578 | -21.4% | 104,607 | -7.1% |
Third Parties | 258 | 5,795 | -95.5% | 2,457 | -89.5% |
Free Portfolio | 32,531 | 31,551 | 3.1% | 34,461 | -5.6% |
Funds from Acceptance and Issuance of Securities | 76,656 | 105,170 | -27.1% | 78,143 | -1.9% |
Resources from Real Estate Credit Notes, Mortgage Notes, Credit and Similar | 71,496 | 95,122 | -24.8% | 72,758 | -1.7% |
Funding from Certificates of Structured Operations | 1,990 | 1,236 | 61.1% | 1,540 | 29.3% |
Securities Issued Abroad | 1,993 | 7,722 | -74.2% | 2,700 | -26.2% |
Other | 1,177 | 1,090 | 8.0% | 1,145 | 2.8% |
Interbank Accounts | 264 | 44 | 501.0% | 1,571 | -83.2% |
Interbranch Accounts | 4,275 | 3,887 | 10.0% | 3,051 | 40.1% |
Borrowings | 33,471 | 30,600 | 9.4% | 26,235 | 27.6% |
Domestic Onlendings - Official Institutions | 16,636 | 16,803 | -1.0% | 16,934 | -1.8% |
National Economic and Social Development Bank (BNDES) | 9,460 | 9,423 | 0.4% | 9,577 | -1.2% |
National Equipment Financing Authority (FINAME) | 6,845 | 7,041 | -2.8% | 7,070 | -3.2% |
Other Institutions | 330 | 339 | -2.6% | 287 | 15.1% |
Derivative Financial Instruments | 20,681 | 19,945 | 3.7% | 18,952 | 9.1% |
Other Payables | 136,347 | 157,766 | -13.6% | 121,107 | 12.6% |
Foreign Exchange Portfolio | 55,318 | 86,753 | -36.2% | 46,426 | 19.2% |
Tax and Social Security | 4,870 | 11,594 | -58.0% | 5,185 | -6.1% |
Subordinated Debts | 519 | 466 | 11.4% | 505 | 2.7% |
Debt Instruments Eligible to Compose Capital | 8,440 | 8,315 | 1.5% | 8,011 | 5.4% |
Other | 67,200 | 50,638 | 32.7% | 60,980 | 10.2% |
Deferred Income | 511 | 565 | -9.4% | 506 | 1.2% |
Minority Interest | 1,897 | 2,526 | -24.9% | 2,268 | -16.4% |
Equity | 59,500 | 57,772 | 3.0% | 62,359 | -4.6% |
Total Liabilities | 683,732 | 701,705 | -2.6% | 676,768 | 1.0% |
Equity (excluding goodwill) | 58,869 | 55,598 | 5.9% | 61,564 | -4.4% |
Securities
Total securities amounted to R$ 171,730 million at the end of December 2017, climbing 1.3% in twelve months, influenced by growth in public securities. In three months, there was a decrease of 5.9%.
SECURITIES (R$ million) | Dec/17 | Dec/16 | Var. 12M | Sep/17 | Var. 3M |
Public securities | 130,106 | 124,965 | 4.1% | 142,346 | -8.6% |
Private securities | 20,080 | 20,549 | -2.3% | 20,139 | -0.3% |
Financial instruments | 21,544 | 24,076 | -10.5% | 20,072 | 7.3% |
Total | 171,730 | 169,590 | 1.3% | 182,557 | -5.9% |
15
Loan Portfolio
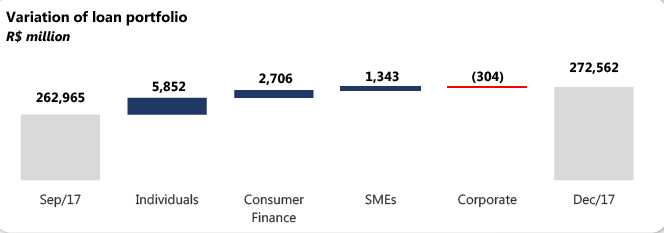
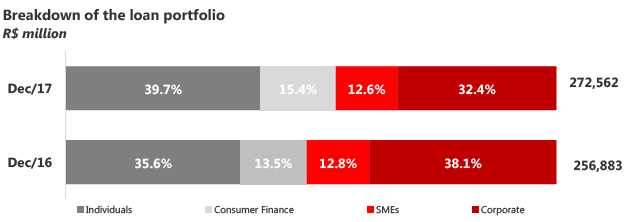
The loan portfolio totaled R$ 272,562 million at the end of December 2017, growing 6.1% in twelve months (or R$ 15,679 million) and expanding by 3.6% in three months. Disregarding the impact of the exchange rate fluctuation, the total loan portfolio would have increased by 5.9% in twelve months and 3.2% in three months.
The balance of the foreign currency portfolio, including dollar-indexed loans, was R$ 28,904 million at the end of December 2017, meaning a reduction of 15.9% relative to the balance of R$ 34,352 million recorded in December 2016 and 4.0% lower compared to the balance of R$ 30,093 million in September 2017.
In three months, growth in the loan portfolio was mostly influenced by the Individuals and Consumer Finance portfolios. The SME portfolio showed growthfor the third consecutive quarter. On the other hand, the Corporate portfolio remained practically stable.
At the end of December 2017, the Corporate portfolio accounted for 32.4% of the total portfolio, a reduction of 570 bps in twelve months. The Individuals portfolio had a 39.7% share of the total portfolio rising 410 bps in twelve months, the Consumer Finance segment represented 15.4% of the portfolio growing 180 bps in comparison with the previous year, while the SME portfolio accounted for 12.6% of the portfolio (down 20 bps in the 12-month period).
16
MANAGERIAL BREAKDOWN OF CREDIT BY SEGMENT (R$ million) | Dec/17 | Dec/16 | Var. 12M | Sep/17 | Var. 3M |
Individuals | 108,115 | 91,414 | 18.3% | 102,263 | 5.7% |
Consumer Finance | 41,884 | 34,777 | 20.4% | 39,178 | 6.9% |
SMEs¹ | 34,288 | 32,799 | 4.5% | 32,945 | 4.1% |
Corporate¹ | 88,275 | 97,893 | -9.8% | 88,579 | -0.3% |
Total portfolio | 272,562 | 256,883 | 6.1% | 262,965 | 3.6% |
Other credit related transactions² | 75,345 | 65,900 | 14.3% | 73,444 | 2.6% |
Total expanded credit portfolio | 347,907 | 322,783 | 7.8% | 336,409 | 3.4% |
¹ As of 1Q17, in light of changes of customers turnover, we reclassified the loan portfolio between SMEs and Corporate segments. We also have changed the 2016 information in order to give better comparison.
² Including debentures, FIDC, CRI, promissory notes, international distribution promissory notes, acquiring-activities related assets and guarantees.
The expanded loan portfolio, which includes other credit risk transactions, acquiring-activities related assets and guarantees, totaled R$ 347,907 million at the end of December 2017, a 7.8% increase in twelve months (or R$ 25,124 million) and a 3.4% growth in three months. Excluding the impact of exchange rate fluctuation, theexpanded loan portfolio would have grown by 7.7% in twelve months and increased 3.1% in three months.
Loans to Individuals Loans to individuals amounted to R$ 108,115 million at the end of December 2017, expandingby 18.3% (or R$ 16,701 million) in twelve monthsand up 5.7% in three months. The portfolio growth in twelve months is largely explained by payroll loans, credit card and agricultural loans. The payroll loans portfolio came to R$ 25,616 million,climbing 36.7% in twelve months (or R$ 6,871 million) and advancing 7.0% in three months. The digital payroll loans platform has supported the growth of this portfolio. This innovation reinforces our strategy of providing a better experience for our customers. The credit card portfolio reached R$ 24,421 million, representing growth of 18.1% in twelve months (or R$ 3,744 million). Throughout 2017 we strengthened our credit card portfolio through innovative solutions and partnerships, consistently enhancing the customer experience. In three months, this portfolio increasedby 11.8%, driven by the seasonal effect of year-endsales. The mortgage loan balance was R$ 28,112 million, expanding by 3.5% in twelve months and rising 3.2% in three months. We remain focused on offering simpler and faster services, with digital solutions to ensure a more delightful customer experience. | The agricultural loan balance was R$ 5,239 million, up 52.9% in twelve months and 7.9% higher in threemonths.
|

17
| Consumer Finance | |
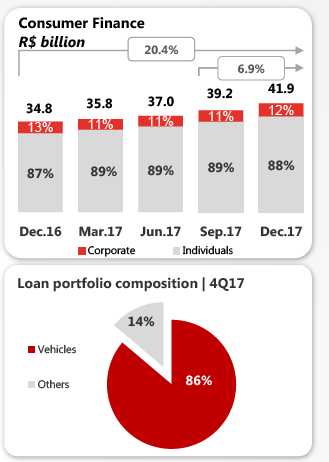
The consumer finance portfolio, which is originatedoutside the branch network, totaled R$ 41,884 millionat the end of December 2017, growing 20.4% intwelve months (or R$ 7,107 million) and rising 6.9% inthree months. Of this total portfolio, R$ 34,387 millionrefers to vehicle financing for individuals, meaning anincrease of 21.4% in twelve months. The total vehicle portfolio for individuals, which includesoperations carried out by both the financial unit(correspondent banks) as well as by Santander's branchnetwork, climbed 20.0% in twelve months and advanced5.3% in three months, amounting to R$ 36,238 million inDecember of 2017. Growth in the portfolio reflects theincrease in our sales, mainly owing to +Negócios. Our digital platform +Negócios, which is focused onvehicle financing, continues to fuel the expansion of ourbusiness, registering growth of 60% in unique simulationscompared to December 2016. Meanwhile, our digital platform +Vezes, which caters tothe consumer goods segment (or "CDC") has alreadyreached 175 thousand unique simulations per month. Thisinnovation places us in a better position to capturebusiness opportunities. |
|
Corporate & SMEs Loans
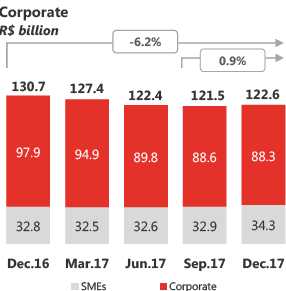
The Corporate & SMEs loan portfolio stood at R$ 122,563 million in December 2017, down 6.2% in twelve months (or R$ 8,129 million) and up 0.9% in three months.
| The Corporate loan portfolio totaled R$ 88,275 million, falling 9.8% (or R$ 9,618 million) in twelve months and a 0.3% reduction in three months (decreasing 10.2% in twelve months and declining 1.6% in three months, disregarding the effect ofexchange rate fluctuation). Loans to the SMEs segment amounted to R$ 34,288 million, representing an increase of 4.5% (or R$ 1,489 million) in twelve months and a 4.1% rise in three months, recording growthfor the 3rdconsecutive quarter. In line with our purpose of helping people and businesses prosper, we continue to strengthen our commitment to this segment with differentiated offerings, such as "Conta Integrada" and "Programa Avançar". On top of that, we also broadened the scope of our specialized services and focused onsector-oriented offers. All these actions, associatedwith the recovery of economic activity, provide us with an even more solid foundation to expand our portfolio and promote growth in our customer baseand loyalty. |
18
Individuals and Corporate & SMEs Loan Portfolio by Product
MANAGERIAL BREAKDOWN OF CREDIT PORTFOLIO BY PRODUCT(R$ million) | Dec/17 | Dec/16 | Var. 12M | Sep/17 | Var. 3M |
Individuals |
|
|
|
|
|
Leasing / Auto Loans¹ | 1,852 | 1,875 | -1.2% | 1,813 | 2.1% |
Credit Card | 24,421 | 20,677 | 18.1% | 21,850 | 11.8% |
Payroll Loans | 25,616 | 18,745 | 36.7% | 23,950 | 7.0% |
Mortgages | 28,112 | 27,153 | 3.5% | 27,251 | 3.2% |
Agricultural Loans | 5,239 | 3,427 | 52.9% | 4,854 | 7.9% |
Personal Loans / Others | 22,875 | 19,537 | 17.1% | 22,546 | 1.5% |
Total Individuals | 108,115 | 91,414 | 18.3% | 102,263 | 5.7% |
- | - | 0 | - | 0 | |
Consumer Finance | 41,884 | 34,777 | 20.4% | 39,178 | 6.9% |
Corporate and SMEs |
|
|
|
|
|
Leasing / Auto Loans | 2,784 | 2,783 | 0.0% | 2,747 | 1.4% |
Real Estate | 6,577 | 9,337 | -29.6% | 7,530 | -12.7% |
Trade Finance | 17,379 | 20,339 | -14.6% | 22,821 | -23.8% |
On-lending | 13,919 | 12,891 | 8.0% | 11,603 | 20.0% |
Agricultural Loans | 6,320 | 5,531 | 14.3% | 7,068 | -10.6% |
Working capital / Others | 75,584 | 79,810 | -5.3% | 69,755 | 8.4% |
Total Corporate and SMEs | 122,563 | 130,692 | -6.2% | 121,523 | 0.9% |
Total Credit | 272,562 | 256,883 | 6.1% | 262,965 | 3.6% |
Other Credit Risk Transactions with customers² | 75,345 | 65,900 | 14.3% | 73,444 | 2.6% |
Total Expanded Credit Portfolio | 347,907 | 322,783 | 7.8% | 336,409 | 3.4% |
1Including consumer finance, the auto loan portfolio for individuals totaled R$ 36,238 million in Dec/17, R$ 34,419 million in Sep/17 and R$ 30,196 million in Dec/16.
2 Including debentures, FIDC, CRI, promissory notes, international distribution promissory notes, acquiring-activities related assets and guarantees.
Coverage Ratio The balance of allowance for loan losses amounted to R$ 17,462 million at the end of December 2017, declining 4.7% in twelve months and up 0.8% in three months. This improvement accompanies the growth rate of our portfolio rate and further confirms that we maintain adequate provisioning levels. The coverage ratio reached 202% at the end of December2017, down 950 bps in twelve months and 2,730 bps lower in three months. These changes were impacted by a one-off case occurred in this quarter in the corporate segment. |

19
Renegotiated Loan Portfolio Loan renegotiations totaled R$ 13,656 million inDecember 2017, increasing by 1.2% in twelve monthsand 0.4% higher in three months. These operationscomprise loan agreements that were renegotiated toenable their payment under conditions agreed uponwith customers, including renegotiations of loans thathad already been written-off in the past. At the end of December, the coverage ratio of therenegotiated portfolio reached 58.0%, a levelconsidered adequate for these types of operations. |
|
| Credit Portfolio by Risk Level We operate in accordance with our risk culture and international best practices, in order to protect our capital and guarantee the profitability of our businesses. Our credit approval process, particularly the approval of new loans and risk monitoring, is structured according to our classification of customers and products, centered around our retail and wholesale segments. At the end of December 2017, portfolios rated“AA”and“A”accounted for 76% of the total loan portfolio. |
NPL Formation NPL Formation came to R$ 3,806 million, increasing by33.2% in twelve months and climbing 14.9% in threemonths. These changes were impacted by a one-off case in the corporate segment. The ratio between NPL Formation and the loan portfolio reached 1.4%, rising 30 bps in twelve months and 10 bps in three months. | |


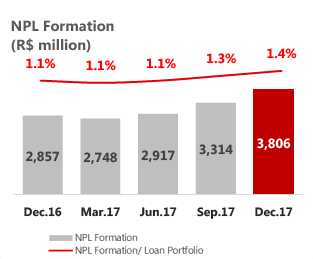
Note: NPL Formation is obtained from the change in balance of the non-performed portfolio over 90 days and the loan book under renegotiation, disregarding the portfolio written-off as loss in the period.
20
Delinquency Ratio (Over-90-Day) The over-90-day delinquency ratio reached 3.2% at the end of December 2017, declining 20 bps in twelve months. The improvement in this ratio reflects our preemptive risk management, given the effectiveness of our mathematical models, which have been successful in keeping the quality indicators of the loan portfolio under control. In the quarter, the ratio increased by 30 bps, impacted by a one-off case in the corporate segment. The Corporate & SMEs segment came to 2.5% in the period. The delinquency ratio among individuals was 3.7%, reaching its lowest level in history, improving by 39 bps in twelve months and remaining stable in three months. | 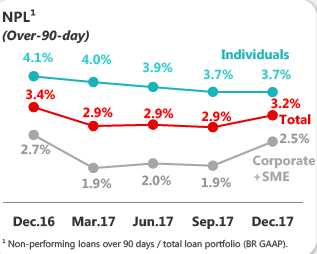 |
| Delinquency Ratio (15-to-90 Day) The 15-to-90-day delinquency ratio stood at 4.2% at the end of December 2017, reducing by 14 bps in twelve months and declining 29 bps in three months. These improvements reflect our active and preemptive risk management, with deeper knowledge of the customer life cycle. Delinquency among individuals decreased by 36 bps in twelve months and went down 9 bps in threemonths, reaching 5.7%, indicating that our risk modelhas been highly effective. In the Corporate & SMEs segment, the ratio dropped by 30 bps in twelve months and was 58 bps lower in three months, at 2.5%. |
21
FUNDING (R$ million) | Dec/17 | Dec/16 | Var. 12M | Sep/17 | Var. 3M |
Demand deposits | 17,177 | 16,006 | 7.3% | 15,980 | 7.5% |
Saving deposits | 40,572 | 36,051 | 12.5% | 38,570 | 5.2% |
Time deposits | 142,481 | 90,525 | 57.4% | 146,867 | -3.0% |
Debenture/LCI/LCA¹ | 70,470 | 90,426 | -22.1% | 68,731 | 2.5% |
Financial Bills² | 36,918 | 65,393 | -43.5% | 39,095 | -5.6% |
Funding from clients | 307,619 | 298,402 | 3.1% | 309,244 | -0.5% |
¹ Repo operations backed by Debentures, Real Estate Credit Notes (LCI) and Agricultural Credit Notes (LCA).
² Including Certificates of Structured Operations (COE).
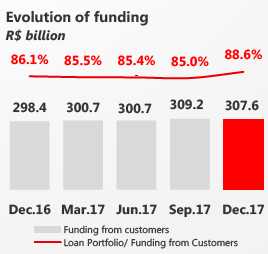
Total customer funding amounted to R$ 307,619 million at the end of December 2017, growing 3.1% in twelve months (or R$ 9,217 million) and declining 0.5% in three months. Saving deposits grew by 12.5% in twelve months and rose 5.2% in three months. Time deposits advanced 57.4% in twelve months, due to a reduction in funding with financial bills, as already noted. In three months, these deposits decreased by 3.0%, given the effect of a one-off operation occurred in the last quarter.
Credit/Funding Ratio
FUNDING VS. CREDIT (R$ million) | Dec/17 | Dec/16 | Var. 12M | Sep/17 | Var. 3M |
Funding from customers (A) | 307,619 | 298,402 | 3.1% | 309,244 | -0.5% |
(-) Reserve Requirements | (62,781) | (61,199) | 2.6% | (66,149) | -5.1% |
Funding Net of Reserve Requirements | 244,838 | 237,204 | 3.2% | 243,095 | 0.7% |
Borrowing and Onlendings | 17,251 | 17,249 | 0.0% | 17,419 | -1.0% |
Subordinated Debts | 8,959 | 8,781 | 2.0% | 8,516 | 5.2% |
Offshore Funding | 34,848 | 37,876 | -8.0% | 28,450 | 22.5% |
Total Funding (B) | 305,895 | 301,110 | 1.6% | 297,481 | 2.8% |
Assets under management¹ | 292,715 | 251,042 | 16.6% | 296,043 | -1.1% |
Total Funding and Asset under management | 598,611 | 552,152 | 8.4% | 593,524 | 0.9% |
Total Credit (C) | 272,562 | 256,883 | 6.1% | 262,965 | 3.6% |
C / B (%) | 89.1% | 85.3% |
| 88.4% |
|
C / A (%) | 88.6% | 86.1% |
| 85.0% |
|
¹ According to ANBIMA criteria.
The loan portfolio to customer funding ratio was88.6% at the end of December 2017, a 252 bpsincrease in twelve months and a 357 bps rise in threemonths. The liquidity metric adjusted for the impact of reserverequirements and medium/long-term funding came to89.1% in December 2017, growing 379 bps in twelvemonths and 71 bps higher in three months. The Bank is in a comfortable liquidity situation, withstable funding sources and an adequate fundingstructure. |
|
22
BIS Ratio
The BIS ratio was 15.8% at the end of December 2017, a reduction of 48 bps in twelve months and a decrease of 35 bps in three months, 533 bps higher than the sum of the minimum Regulatory Capital and Capital Conservation requirements. CET1 stood at 13.6%, down 42 bps in twelve months and 54 bps lower in three months. The change in the three-month period is largely explained by dividends and interest on capital apportioned for payment in the amount of R$ 4.8 billion in December 2017. The twelve-month decline in the ratio is mainly attributed to the increase in RWA for Credit Risk and the impact of capital deductions, according to the Basel III schedule. It is important to note that, as of January 2018, the capital requirement will change from 9.25% to 8.625% + conservation capital of 1.875% + additional CET1 for systemically important financial institutions in the Brazilian market of 0.5%, totaling 11%. For Tier Capital I it is at 8.375%, while for CET1 it is at 6.875%. |  |
OWN RESOURCES AND BIS (R$ million) | Dec/17 | Dec/16 | Var. 12M | Sep/17 | Var. 3M |
Tier I Regulatory Capital | 56,386 | 56,264 | 0.2% | 60,428 | -6.7% |
CET1 | 52,197 | 52,137 | 0.1% | 56,417 | -7.5% |
Additional Tier I | 4,189 | 4,127 | 1.5% | 4,011 | 4.4% |
Tier II Regulatory Capital | 4,250 | 4,281 | -0.7% | 4,000 | 6.3% |
Adjusted Regulatory Capital (Tier I and II) | 60,636 | 60,545 | 0.2% | 64,428 | -5.9% |
Risk Weighted Assets (RWA) | 383,133 | 371,337 | 3.2% | 398,302 | -3.8% |
Required Regulatory Capital | 35,440 | 36,670 | -3.4% | 36,843 | -3.8% |
Adjusted Credit Risk Capital requirement | 30,034 | 31,310 | -4.1% | 30,430 | -1.3% |
Market Risk Capital requirement | 2,392 | 2,389 | 0.1% | 3,399 | -29.6% |
Operational Risk Capital requirement | 3,014 | 2,971 | 1.4% | 3,014 | 0.0% |
Basel Ratio | 15.83% | 16.30% | -48 bps | 16.18% | -35 bps |
Tier I | 14.72% | 15.15% | -43 bps | 15.17% | -45 bps |
CET1 | 13.62% | 14.04% | -42 bps | 14.16% | -54 bps |
Tier II | 1.11% | 1.15% | -4 bps | 1.01% | 10 bps |
23
| Corporate Governance | |
| Santander Brasil has a free float of 10.23% and is currently listedon the traditional segment of B3 - Brasil, Bolsa, Balcão. TheBank adopts the best practices in corporate governance, suchas holding periodic meetings with the market, disclosinginformation on its Investor Relations website, Board of Directorscomprised of 50% independent members, independentcommittees reporting to the board, among others. | 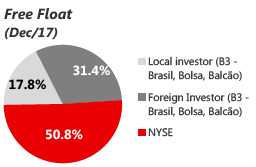 |
Simplified Ownership Structure
Ownership Structure
Santander’sownership structure, as of December 31st, 2017:
OWNERSHIP STRUCTURE | Common shares (thousand) | % | Preferred shares (thousand) | % | Total shares (thousand) | Total % |
Santander Group ¹ | 3,443,237 | 90.17% | 3,276,573 | 89.04% | 6,719,810 | 89.62% |
Treasury Shares | 5,845 | 0.15% | 5,845 | 0.16% | 11,689 | 0.16% |
Free Float | 369,614 | 9.68% | 397,418 | 10.80% | 767,032 | 10.23% |
Total | 3,818,695 | 100.00% | 3,679,836 | 100.00% | 7,498,531 | 100.00% |
¹ Considering the shareholding positions of: Grupo Empresarial Santander S.L. and Sterrebeeck B.V., as well as shares owned by Management.
In 2017, Santander Brasil apportioned R$ 2.5 billion in dividends and R$ 3.8 billion in interest on capital (IoC), totaling R$ 6.3 billion. IoC was paid in three installments1 of R$ 500 million each during the year, while the remaining R$ 2.3 billion will be paid starting on February 26th, 2018, together with dividends amounting to R$ 2.5 billion.
¹ Paid on May 26th, 2017, August 25th, 2017, and October 26th, 2017.
Stock Performance
SANB11 | 2017 | 2016 | Var. | 4Q17 | 3Q17 | Var. |
|
| 12M |
|
| 3M | |
Earnings (annualized) per unit (R$)¹ | 2.64 | 1.95 | 35.0% | 2.85 | 2.76 | 3.4% |
Dividend + Interest on capital per unit (R$)¹ | 1.68 | 1.40 | 20.4% | 1.28 | 0.27 | 380.5% |
Unit closing price (R$)² | 30.66 | 29.53 | 3.8% | 30.66 | 27.64 | 10.9% |
Book Value per unit (R$)¹,³ | 15.73 | 14.80 | 6.2% | 15.73 | 16.43 | -4.3% |
Market Capitalization (R$ bi)4 | 114.77 | 110.91 | 3.5% | 114.77 | 103.58 | 10.8% |
1 Considers the number of Units disregarding treasury shares at the end of the period.
2 Closing price at the end of the period.
3Book Value excludes goodwill.
4Market Capitalization: Total Units (Unit = 1 Common + 1 Preferred) x Unit closing price at the end of the period.

1 Stock Swap Offer completed on October 30th, 2014
24
Rating Agencies
Santander is rated by international rating agencies and the ratings it receives reflect several factors, including the quality of its management, its operational performance and financial strength, as well as other variables related to the financial sector and the economic environment in which the company operates, with its long-term foreign currency rating limited to the sovereign rating. The table below presents the ratings assigned by Standard & Poor's and Moody's:
Global Scale | National Scale | ||||||||
Ratings | Local Currency | Foreign Currency | National | ||||||
Long-term | Short-term | Long-term | Short-term | Long-term | Short-term | ||||
Standard & Poor’s¹ (outlook) | BB- | B | BB- | B | brAA- | brA-1+ | |||
|
|
| |||||||
Moody's² (outlook) |
| Ba1 | NP |
| Ba3 | NP |
| Aaa.br | Br-1 |
|
|
| |||||||
1Latest Credit Rating Analysis: January 11th, 2018.
2Latest Credit Rating Analysis: December 6th, 2017.
25
Accounting and Managerial Results Reconciliation
For a better understanding of BR GAAP results, the reconciliation between the accounting result and the managerial result is presented below.
ACCOUNTING AND MANAGERIAL | 2017 | Reclassifications | 2017 | |||||
RESULTS RECONCILIATION(R$ million) | Accounting | Exchange Hedge¹ | Credit Recovery² | Amort. of goodwill³ | Profit Sharing | FX | Other events5 | Managerial |
Net Interest Income | 38,726 | 808 | (2,605) | - | - | (94) | 492 | 37,327 |
Allowance for Loan Losses | (11,779) | - | 2,619 | - | - | (57) | (492) | (9,708) |
Net Interest Income after Loan Losses | 26,947 | 808 | 14 | - | - | (150) | - | 27,619 |
Fees | 15,611 | - | - | - | - | - | - | 15,611 |
General Expenses | (19,356) | - | - | 1,535 | (1,460) | - | 114 | (19,167) |
Personnel Expenses | (7,631) | - | - | - | (1,460) | - | - | (9,091) |
Administrative Expenses | (11,725) | - | - | 1,535 | - | - | 114 | (10,076) |
Tax Expenses | (3,587) | (79) | - | - | - | - | - | (3,667) |
Investments in Affiliates and Subsidiaries | 25 | - | - | - | - | - | - | 25 |
Other Operating Income/Expenses | (6,252) | - | (14) | - | - | 150 | 296 | (5,819) |
Operating Income | 13,388 | 729 | (0) | 1,535 | (1,460) | - | 410 | 14,602 |
Non Operating Income | (260) | - | - | - | - | - | - | (260) |
Net Profit before Tax | 13,128 | 729 | (0) | 1,535 | (1,460) | - | 410 | 14,342 |
Income Tax and Social Contribution | (3,278) | (729) | - | - | - | - | 12 | (3,996) |
Profit Sharing | (1,460) | - | - | - | 1,460 | - | - | - |
Minority Interest | (394) | - | - | - | - | - | - | (394) |
Net Profit | 7,997 | - | - | 1,535 | - | - | 422 | 9,953 |
ACCOUNTING AND MANAGERIAL | 2016 | Reclassifications | 2016 | |||||
RESULTS RECONCILIATION(R$ million) | Accounting | Exchange Hedge¹ | Credit Recovery² | Amort. of goodwill³ | Profit Sharing | FX | Other events5 | Managerial |
Net Interest Income | 40,033 | (6,715) | (2,835) | - | - | 340 | 673 | 31,497 |
Allowance for Loan Losses | (13,240) | - | 2,835 | - | - | (283) | 231 | (10,456) |
Net Interest Income after Loan Losses | 26,793 | (6,715) | - | - | - | 57 | 905 | 21,041 |
Fees | 13,263 | - | - | - | - | - | - | 13,263 |
General Expenses | (18,516) | - | - | 1,806 | (1,209) | - | - | (17,919) |
Personnel Expenses | (7,489) | - | - | - | (1,209) | - | - | (8,698) |
Administrative Expenses | (11,027) | - | - | 1,806 | - | - | - | (9,222) |
Tax Expenses | (3,991) | 657 | - | - | - | - | - | (3,335) |
Investments in Affiliates and Subsidiaries | 7 | - | - | - | - | - | - | 7 |
Other Operating Income/Expenses | (3,799) | - | - | - | - | (57) | (450) | (4,306) |
Operating Income | 13,756 | (6,058) | - | 1,806 | (1,209) | - | 455 | 8,750 |
Non Operating Income | (414) | - | - | - | - | - | 450 | 36 |
Net Profit before Tax | 13,342 | (6,058) | - | 1,806 | (1,209) | - | 905 | 8,785 |
Income Tax and Social Contribution | (6,484) | 6,058 | - | - | - | - | (905) | (1,330) |
Profit Sharing | (1,209) | - | - | - | 1,209 | - | - | - |
Minority Interest | (117) | - | - | - | - | - | - | (117) |
Net Profit | 5,533 | - | - | 1,806 | - | - | - | 7,339 |
²Credit Recovery:reclassified from revenue from loan operations to allowance for loan losses and, from 2017 onwards, it includes provision for guarantees provided.
³Amortization of Goodwill:reversal of goodwill amortization expenses.
⁴Exchange Rate Fluctuation:includes, in addition to the effect of the exchange rate fluctuation, reclassifications between different lines of the Bank’s results (other operating income/expenses, allowance for loan losses and non-operating result) for better comparability with previous quarters.
5Other events:
2016
4Q16: Net interest income: refers to the adjustment in the valuation of assets related to the impairment of securities.
Allowance for loan losses: refers to the establishment of a complementary allowance for loan losses for Corporate clients.
Income tax: benefit arising from the distribution of Interest on Capital ("IoC").
Reclassification of the constitution of the productivity and efficiency fund from non-operating income to other operating expenses.
2017
3Q17:
Adhesion to the installment payment program for outstanding taxes and social security debts (in accordance with Provisional Measure No. 783/2017).
4Q17:
Net Interest Income and Allowance for Loan Losses: reclassification between the lines referring to the adjustment in the valuation of assets related to the impairment of securities.
Administrative Expenses and Other Operating Income and Expenses: adhesion to the installment payment program by the cities of São Paulo and Rio de Janeiro (R$ 9 million in administrative expenses, R$ 27 million in other operating expenses and R$ 179 million reversal in other operating income) and write-down of intangible assets due to impairment in the amount of R$ 306 million.
26
ACCOUNTING AND MANAGERIAL | 4Q17 | Reclassifications | 4Q17 | |||||
RESULTS RECONCILIATION(R$ million) | Accounting | Exchange Hedge¹ | Credit Recovery² | Amort. of goodwill³ | Profit Sharing | FX | Other events5 | Managerial |
Net Interest Income | 8,435 | 1,469 | (648) | - | - | (250) | 492 | 9,498 |
Allowance for Loan Losses | (2,805) | - | 615 | - | - | 26 | (492) | (2,656) |
Net Interest Income after Loan Losses | 5,630 | 1,469 | (33) | - | - | (224) | - | 6,843 |
Fees | 4,239 | - | - | - | - | - | - | 4,239 |
General Expenses | (5,001) | - | - | 166 | (357) | - | 9 | (5,183) |
Personnel Expenses | (2,009) | - | - | - | (357) | - | - | (2,367) |
Administrative Expenses | (2,991) | - | - | 166 | - | - | 9 | (2,816) |
Tax Expenses | (811) | (144) | - | - | - | - | - | (955) |
Investments in Affiliates and Subsidiaries | (1) | - | - | - | - | - | - | (1) |
Other Operating Income/Expenses | (1,494) | - | 33 | - | - | 224 | 154 | (1,084) |
Operating Income | 2,562 | 1,326 | (0) | 166 | (357) | - | 163 | 3,859 |
Non Operating Income | 53 | - | - | - | - | - | - | 53 |
Net Profit before Tax | 2,615 | 1,326 | (0) | 166 | (357) | - | 163 | 3,912 |
Income Tax and Social Contribution | 334 | (1,326) | - | - | - | - | (75) | (1,067) |
Profit Sharing | (357) | - | - | - | 357 | - | - | - |
Minority Interest | (93) | - | - | - | - | - | - | (93) |
Net Profit | 2,498 | - | (0) | 166 | - | - | 88 | 2,752 |
ACCOUNTING AND MANAGERIAL | 3Q17 | Reclassifications | 3Q17 | |||||
RESULTS RECONCILIATION(R$ million) | Accounting | Exchange Hedge¹ | Credit Recovery² | Amort. of goodwill³ | Profit Sharing | FX | Other events5 | Managerial |
Net Interest Income | 11,799 | (1,359) | (622) | - | - | 45 | - | 9,863 |
Allowance for Loan Losses | (3,013) | - | 620 | - | - | (36) | - | (2,429) |
Net Interest Income after Loan Losses | 8,786 | (1,359) | (2) | - | - | 9 | - | 7,434 |
Fees | 3,871 | - | - | - | - | - | - | 3,871 |
General Expenses | (4,930) | - | - | 457 | (438) | - | 105 | (4,806) |
Personnel Expenses | (1,881) | - | - | - | (438) | - | - | (2,319) |
Administrative Expenses | (3,049) | - | - | 457 | - | - | 105 | (2,487) |
Tax Expenses | (1,047) | 133 | - | - | - | - | - | (914) |
Investments in Affiliates and Subsidiaries | 10 | - | - | - | - | - | - | 10 |
Other Operating Income/Expenses | (1,970) | - | 2 | - | - | (9) | 142 | (1,835) |
Operating Income | 4,720 | (1,227) | 0 | 457 | (438) | - | 247 | 3,760 |
Non Operating Income | (35) | - | - | - | - | - | - | (35) |
Net Profit before Tax | 4,686 | (1,227) | 0 | 457 | (438) | - | 247 | 3,725 |
Income Tax and Social Contribution | (2,343) | 1,227 | - | - | - | - | 87 | (1,030) |
Profit Sharing | (438) | - | - | - | 438 | - | - | - |
Minority Interest | (110) | - | - | - | - | - | - | (110) |
Net Profit | 1,795 | - | - | 457 | - | - | 334 | 2,586 |
¹Foreign Exchange Hedge:under Brazilian tax rules, gains (losses) derived from exchange rate fluctuations on foreign currency investments are not taxable (tax deductible). This tax treatment leads to exchange rate exposure to taxes. An exchange rate hedge position was set up with the purpose of protecting the net profit from the impact of foreign exchange fluctuations related to this tax exposure.
²Credit Recovery:reclassified from revenue from loan operations to allowance for loan losses and, from 2017 onwards, it includes provision for guarantees provided.
³Amortization of Goodwill:reversal of goodwill amortization expenses.
4Exchange Rate Fluctuation:includes, in addition to the effect of the exchange rate fluctuation, reclassifications between different lines of theBank’sresults (other operating income/expenses, allowance for loan losses and non-operating result) for better comparability with previous quarters.
5Other events: 2016
4Q16: Net interest income: refers to the adjustment in the valuation of assets related to the impairment of securities. Allowance for loan losses: refers to the establishment of a complementary allowance for loan losses for Corporate clients. Income tax: benefit arising from the distribution of Interest on Capital ("IoC").
Reclassification of the constitution of the productivity and efficiency fund from non-operating income to other operating expenses.
2017
3Q17:
Adhesion to the installment payment program for outstanding taxes and social security debts (in accordance with Provisional Measure No. 783/2017). 4Q17:
Net Interest Income and Allowance for Loan Losses: reclassification between the lines referring to the adjustment in the valuation of assets related to the impairment of securities. Administrative Expenses and Other Operating Income and Expenses: adhesion to the installment payment program by the cities of São Paulo and Rio de Janeiro (R$ 9 million in administrative expenses, R$ 27 million in other operating expenses and R$ 179 million reversal in other operating income) and write-down of intangible assets due to impairment in the amount of R$ 306 million.
27
¹ Cards turnover do not include withdrawal transactions, it only considers purchase volumes.
² Individuals' origination. ³ Ratio between Loans and Collateral Value.
28
1Vehicle portfolio for Individuals, considers the Individuals' portfolio generated by the internal channel as well as by the Individuals' portfolio from the Consumer Finance segment.
2Brazilian Central Bank. ³ ABECS.
29

Banco Santander (Brasil) S.A. | ||
| By: | /S/ Amancio Acurcio Gouveia | |
Amancio Acurcio Gouveia Officer Without Specific Designation | ||
| By: | /S/ Angel Santodomingo Martell | |
Angel Santodomingo Martell Vice - President Executive Officer | ||