SECURITIES AND EXCHANGE COMMISSION
Commission File Number: 001-34476
Bloco A – Vila Olimpia
São Paulo, SP 04543-011
Federative Republic of Brazil
Indicate by check mark if the registrant is submitting the Form 6-K in paper as permitted by Regulation S-T Rule 101(b)(1):
Yes _______ No ___X____
Indicate by check mark if the registrant is submitting the Form 6-K in paper as permitted by Regulation S-T Rule 101(b)(7):
Yes _______ No ___X____
Indicate by check mark whether by furnishing the information contained in this Form, the Registrant is also thereby furnishing the information to the Commission pursuant to Rule 12g3-2(b) under the Securities Exchange Act of 1934:
Yes _______ No ___X____
If “Yes” is marked, indicate below the file number assigned to the registrant in connection with Rule 12g3-2(b): N/A

(A free translation of the original in Portuguese)
Independent auditor's report
To the Board of Directors and Stockholders
Banco Santander (Brasil) S.A.
Opinion
We have audited the accompanying consolidated financial statements of Banco Santander (Brasil) S.A. ("Bank") and its subsidiaries, which comprise the consolidated balance sheet as at December 31, 2018 and the consolidated statements of income, comprehensive income, changes in equity and cash flows for the year then ended, and notes to the financial statements, including a summary of significant accounting policies.
In our opinion, the consolidated financial statements present fairly, in all material respects, the financial position of Banco Santander (Brasil) S.A. and its subsidiaries as at December 31, 2018, and their consolidated financial performance and cash flows for the year then ended, in accordance with the International Financial Reporting Standards (IFRS) issued by the International Accounting Standards Board (IASB).
Basis for opinion
We conducted our audit in accordance with Brazilian and International Standards on Auditing. Our responsibilities under those standards are further described in the "Auditor's responsibilities for the audit of the consolidated financial statements" section of our report. We are independent of the Bank and its subsidiaries in accordance with the ethical requirements established in the Code of Professional Ethics and Professional Standards issued by the Brazilian Federal Accounting Council, and we have fulfilled our other ethical responsibilities in accordance with these requirements. We believe that the audit evidence we have obtained is sufficient and appropriate to provide a basis for our audit opinion.
Key audit matters
Key audit matters are those matters that, in our professional judgment, were of most significance in our audit of the financial statements of the current period. These matters were addressed in the context of our audit of the consolidated financial statements, taken as a whole, and in forming our opinion thereon, and we do not provide a separate opinion on these matters. Our audit as at and for the year ended December 31, 2018 was planned and performed taking into consideration that the Bank and its subsidiaries' operations did not present significant changes in comparison with prior year. In this respect, the Key Audit Matters, as well as our audit approach, have remained substantially consistent with the prior year, except for the modification in the KAM related to the provision for impairment due to the change in the accounting policy in this area. |  |
PricewaterhouseCoopers, Av. Francisco Matarazzo 1400, Torre Torino, São Paulo, SP, Brasil, 05001-903, Caixa Postal 61005,
T: +55 (11) 3674 2000,www.pwc.com.br
Consolidated Financial Statements - December 31, 2018 3
Banco Santander (Brasil) S.A.
Why it is a key audit matter | How the matter was addressed in the audit |
|
|
Allowance for loan losses considering the implementation of IFRS 9 (Notes 1.c.1, 1.c.2.1.i, 2.i, 9 and 47.b) |
|
|
|
As from January 1, 2018, IFRS 9 - Financial Instruments became effective, which replaced IAS 39 - Financial Instruments; it establishes new requirements for the financial instruments recognition and measurement, among which is a new model of allowance for loan losses on credit risk, which expected loss is used as a basis. IAS 39 used the incurred loss as a basis.
The Bank adopted that standard using the modified retrospective method that allows the initial adjustments to be recognized in the opening balance sheet without modifying the comparative figures, which are still presented in accordance with IAS 39.
The estimate of impairment of credit operations, considering the new requirements of IFRS 9, involves a high level of judgment by Management. The determination of loss considers, among other elements, the existence of an objective evidence of impairment loss of the recoverable amount of the significant credits and, individual or in the aggregate, for assets that are not significant, as well as the deterioration of credit risk and the classification of the receivables as prescribed by IFRS 9. This process involves the use of several assumptions and internal and external factors, including default levels and guarantees of the portfolios, renegotiation policy, and the current and prospective economic scenarios. Therefore, we focused on this area in our audit.
| With respect to the implementation of IFRS 9, we assessed the procedures adopted by the Management to update their processes appropriately, considering the criteria adopted for the classification and measurement of the financial instruments, with a focus on the implementation of the new impairment provision models, as established in IFRS 9.
We understood and tested the relevant internal controls in the calculation and recognition of the expected credit losses, mainly including the following main processes: (i) new models and assumptions adopted by Management to determine the recoverable value of the credits; (ii) measurement of the guarantees in the determination of the recoverable value; (iii) approval and record of the operations renegotiated; (iv) processing and accounting of the losses measured; (v) reconciliation of the accounting balances with the analytical position; (vi) preparation of the explanatory notes.
For the provisions calculated considering the individual evaluation, we assessed and tested the criteria used to determine the recoverable value based on the credit risk.
For the provisions calculated considering the collective assessment, we tested the process of approval and validation of models applied in the determination of the recoverable value of credit. With the support of our specialists, we tested, on a sampling basis, the aforementioned models, considering the parameters developed for the most significant portfolios, as well as the integrity of the database used for the calculations.
We also carried out tests over the classification of the credits as established in IFRS 9. The classification considers the debtor credit risk level, and when applicable, the deterioration of this risk, as well as the financial difficulty of the debtor, delays in their contractual obligations, renegotiations, guarantees, cash flow projections, among other aspects.
We considered that the criteria and assumptions adopted by the Management provides a reasonable basis for the calculation and accounting record of the credit losses based on IFRS 9, in the context of the consolidated financial statements. |
|
|
Consolidated Financial Statements - December 31, 2018 4
Banco Santander (Brasil) S.A.
|
|
|
|
Recognition and recoverable value of the deferred tax assets (Notes 1.c.2.1.ii, 2.aa and 24.d) |
|
|
|
The deferred tax assets comprised by the income tax and social contribution credits arising from temporary differences in the calculation basis of these taxes, as well as income tax and social contribution losses, are recognized in the books based on the expectation that future taxable profits will be available for their realization.
The expectation of tax credit realization is based on projections of future results that require judgment by management, including the use of assumptions.
Considering the subjectivity inherent to this process and the significance of the amounts involved, this remains as a focus area in our audit. | We updated our understanding and tested the significant internal controls over the calculation of these tax credits arising from the temporary differences, income tax and social contribution losses, as well as the estimates of their recoverable value, in accordance with the applicable accounting standards.
We obtained an understanding and assessed the reasonableness of the critical assumptions included in result projections and compared them with both external and internal data. We also performed tests regarding the mathematical accuracy of the amounts estimated. We also compared the historical results projected with those realized.
We performed tests to confirm the nature and amounts of the temporary differences and income tax and social contribution losses that could be deducted from the future tax bases with the assistance of our specialists in the tax area.
We discussed with Management and the Audit Committee and confirmed the approval of the technical study that supports the realization of the tax credits by the proper management bodies.
We consider that the criteria and assumptions that management used to determine and record the aforementioned tax credits are reasonable, in all material respects, in the context of the consolidated financial statements. |
|
|
Consolidated Financial Statements - December 31, 2018 5
Banco Santander (Brasil) S.A.
Why it is a key audit matter | How the matter was addressed in the audit |
|
|
Provisions for legal and administrative proceedings (Notes 1.c.2.1.v, 2.r and 23.c) |
|
|
|
The Bank and its subsidiaries are parties to legal and administrative tax, labor, and civil proceedings arising from the normal course of their activities.
In general, these proceedings are terminated after a long period and involve not only discussions on merits, but also complex procedural aspects, in accordance with applicable legislation.
The decision to recognize a contingent liability and the measurement bases require the judgment of the Management, which is periodically reassessed, including when preparing the consolidated financial statements, and considering new events. In these circumstances, this remains as an area of focus in our audit. | We updated our understanding and tested the relevant internal controls over the identification and recording of contingent liabilities and the disclosures in accompanying notes, including, among others, the internal controls related to the calculation template used to account for the provisions for labor and civil contingencies that are carried out under the historical average loss criteria for actions that are considered as common and similar in nature.
We tested the application of the mathematical models of historical average loss calculation, when applicable, related to labor and civil contingencies. We also tested the ongoing proceedings at the base date of the consolidated financial statements.
We performed confirmation procedures with the law firms responsible for the most significant administrative and legal proceedings to confirm the assessment of the prognosis, also considering the new events that occurred during the year, the completeness of the information, and the correct amount of the provisions.
With the support of our experts, we assessed the reasonableness of the estimate of loss in the significant new proceedings taking into account the individual progress of similar proceedings as well as decisions made, when applicable.
We consider that the criteria and assumptions that management adopted to determine and record the provisions for legal and administrative proceedings are reasonable, in all material respects, in the context of the consolidated financial statements. |
|
|
|
|
Provisions for pension funds and similar obligations (Notes 1.c.2.1.iv, 2.x and 22) |
|
|
|
The Bank has post-employment defined benefit plans arising from existing plans in institutions acquired in former years, whose amounts are significant in the context of the consolidated financial statements. They involve the need to use an adequate database and the establishment of assumptions with a high degree of subjectivity, such as discount, inflation and mortality rates.
This remains as an area of focus in our audit because changes in assumptions may result in significant impacts on the obligations related to defined benefit plans. | We updated our understanding of the methodologies of the effective plans and the corresponding amendments during the year as well as the methodologies and judgments used by Management to determine the assumptions applied in the calculation of the obligations in comparison with market parameters and effective accounting practices.
We updated our understanding and tested the significant internal controls that involve the recording and measurement of liabilities arising from post-employment benefit plans. Among others, our tests considered the controls related to the completeness and adequacy of the databases, the existence and correct amount of the assets of the benefit plans, and the approval of assumptions considered in the actuarial calculations.
We confirmed the consistency of the most significant assumptions adopted in the actuarial calculations with those adopted in the last annual actuarial assessment and evaluated the reasonableness of the changes in assumptions made by Management. Also, on a sampling basis, we tested the existence and recalculation of the fair value of the plan assets.
We consider that the criteria and assumptions that Management adopted allow an appropriate calculation of the provision for pension funds and similar obligations, in all material respects, in the context of the consolidated financial statements. |
Consolidated Financial Statements - December 31, 2018 6
Banco Santander (Brasil) S.A.
|
|
|
|
Financial assets at fair value with low liquidity and without an active market (Notes 1.c.2.1.iii, 2.e, 6, 7, 8 and 30) |
|
|
|
In our audit, the measurement of the financial assets at fair value remains as an area of focus during the current year due to its significance in the context of the consolidated financial statements and the involvement of a high level of judgment by Management, since it depends on the definition of the business models, as required by IFRS 9 as from 2018, and on the valuation techniques carried out through internal models, which are based on certain assumptions for the valuation of financial instruments that meet the business model defined by the Management and in the characteristics of its cash flows (meeting or not the requirements of solely payments of principal and interest (SPPI).
The Bank adopted that standard using the modified retrospective method that allows recognition of the initial adjustments in the opening balance sheet without modification of the comparative figures.
Additionally, as also permitted by IFRS 9, the accounting and disclosure of the hedge accounting structures remain presented in accordance with
The financial instruments classified as fair value through profit and loss (FVTPL) include low liquidity instruments with no active market which are substantially comprised of investments in certain public and private securities, as well as derivative contracts. | We updated our understanding of the internal controls, including those developed by Management to meet the new requirements for classification and measurement of the financial instruments required by IFRS 9.
We carried out tests over the significant internal controls involving the classification, measurement, recognition and disclosure of the fair value of these financial instruments, including derivatives.
With the assistance of our experts in the pricing of financial assets, we updated our understanding of the pricing calculation methodologies, analyzed the reasonableness of the assumptions used by Management to prepare pricing curves and internal models, and also verified the alignment of these assumptions and models with the practices adopted in the market.
We performed independent valuation tests of certain transactions, selected on sampling basis.
We consider that the criteria and assumptions adopted by Management in the measurement of the fair value of these financial assets are reasonable, considering the practices used in the market and the accounting practices in effect in 2018. |
Consolidated Financial Statements - December 31, 2018 7
Banco Santander (Brasil) S.A.
Goodwill recoverable value test (Notes 1.c.2.1.vi, 2.o.i and 13) |
|
|
|
The Bank and its subsidiaries have goodwill recorded referring to acquisitions made in prior years, which amount is significant in relation to the consolidated financial statements.
Management prepares, on an annual basis, tests to verify whether the impairment of goodwill is necessary. Such test involves, among others, significant estimates and judgments related to projections and growth rates.
For these reasons, we considered that this remains as an area of focus in our audit, since different assumptions used by Management in the projection of future results may significantly change the calculation of the recoverable amount of goodwill and, consequently, affect the consolidated financial statements. | We updated our understanding and carried out tests over the significant internal controls related to the impairment test of goodwill carried out by Management.
With the support of our specialists, we updated our understanding of the critical assumptions and projections considered by Management and its external advisors.
We also assessed the methodology used to determine the recoverable value of goodwill, considering that various assumptions were appropriate, among them, the growth rate, the discount rate and the projections made. We compared the projections with the historical results to evaluate the consistency, as well as the macroeconomic data, with the market projections. We also re-performed the calculations of discount rate and present value of the future cash flows used by Management.
We consider that the criteria and assumptions adopted by Management to carry out the impairment tests are consistent and appropriately supported and disclosed, in all material respects, in the context of the financial statements. |
Consolidated Financial Statements - December 31, 2018 8
Banco Santander (Brasil) S.A.
|
|
Information technology environment |
|
|
|
The Bank and its subsidiaries have a business environment that is highly dependent on technology, requiring a complex infrastructure to support the high volume of transactions processed in its several systems on a daily basis.
The risks inherent to information technology, associated with possible deficiencies in processes and controls that support the processing of the technology systems, considering the legacy systems and existing technology environments, could result in the incorrect processing of critical information, including those used in the preparation of the consolidated financial statements. For this reason, this remains as an area of focus in our audit. | With the assistance of our system experts, we updated our evaluation of the design and tested the operating effectiveness of the controls related to the management of the information technology environment, including the compensating controls established, when applicable.
The procedures carried out involved the combination of the control tests, and, when applicable, the testing of compensating controls, as well as the testing of the key processes related to information security, development and maintenance of systems, and operation of computers related to the infrastructure that supports the Bank and its subsidiaries' business.
As a result of this work, we considered that the technology environment processes and controls provided a reasonable basis to determine the nature, period and extent of our audit procedures on the consolidated financial statements. |
|
|
Other information accompanying the consolidated financial statements and the auditor's report
The Bank's management is responsible for the other information that comprises the Management Report.
Our opinion on the consolidated financial statements does not cover the Management Report, and we do not express any form of audit conclusion thereon.
In connection with the audit of the consolidated financial statements, our responsibility is to read the Management Report and, in doing so, consider whether this report is materially inconsistent with the financial statements or with our knowledge obtained in the audit or otherwise appears to be materially misstated. If, based on the work we have realized, we conclude that there is a material misstatement in the Management Report, we are required to report that fact.We have nothing to report in this regard.
Responsibilities of management and those charged with governance for the consolidated financial statements
Management is responsible for the preparation and fair presentation of these consolidated financial statements in accordance with the International Financial Reporting Standards (IFRS), issued by the
Consolidated Financial Statements - December 31, 2018 9
Banco Santander (Brasil) S.A.
International Accounting Standards Board (IASB), and for such internal control as management determines is necessary to enable the preparation of financial statements that are free from material misstatement, whether due to fraud or error.
In preparing the consolidated financial statements, Management is responsible for assessing the Bank's ability to continue as a going concern, disclosing, as applicable, matters related to going concern and using the going concern basis of accounting unless Management either intends to liquidate the Bank or to cease operations, or has no realistic alternative but to do so.
Those charged with governance are responsible for overseeing the financial reporting process of the Bank and its subsidiaries.
Auditor's responsibilities for the audit of the consolidated financial statements
Our objectives are to obtain reasonable assurance about whether the consolidated financial statements as a whole are free from material misstatement, whether due to fraud or error, and to issue an auditor's report that includes our opinion. Reasonable assurance is a high level of assurance, but is not a guarantee that an audit conducted in accordance with Brazilian and International Standards on Auditing will always detect a material misstatement when it exists. Misstatements can arise from fraud or error and are considered material if, individually or in the aggregate, they could reasonably be expected to influence the economic decisions of users taken on the basis of these consolidated financial statements.
As part of an audit in accordance with Brazilian and International Standards on Auditing, we exercise professional judgment and maintain professional skepticism throughout the audit. We also:
• Identify and assess the risks of material misstatement of the consolidated financial statements, whether due to fraud or error, design and perform audit procedures responsive to those risks, and obtain audit evidence that is sufficient and appropriate to provide a basis for our opinion. The risk of not detecting a material misstatement resulting from fraud is higher than for one resulting from error, as fraud may involve collusion, forgery, intentional omissions, misrepresentations, or the override of internal control.
• Obtain an understanding of internal control relevant to the audit in order to design audit procedures that are appropriate in the circumstances, but not for the purpose of expressing an opinion on the effectiveness of the internal control of the Bank and its subsidiaries.
• Evaluate the appropriateness of accounting policies used and the reasonableness of accounting estimates and related disclosures made by Management.
• Conclude on the appropriateness of Management's use of the going concern basis of accounting and, based on the audit evidence obtained, whether a material uncertainty exists related to events or conditions that may cast significant doubt on the Bank's ability to continue as a going concern. If we conclude that a material uncertainty exists, we are required to draw attention in our auditor's report to the related disclosures in the consolidated financial statements or, if such disclosures are inadequate, to modify our opinion. Our conclusions are based on the audit evidence obtained up to the date of our auditor's report. However, future events or conditions may cause the Bank and its subsidiaries to cease to continue as going concerns.
Consolidated Financial Statements - December 31, 2018 10
Banco Santander (Brasil) S.A.
• Evaluate the overall presentation, structure and content of the consolidated financial statements, including the disclosures, and whether the consolidated financial statements represent the underlying transactions and events in a manner that achieves fair presentation.
• Obtain sufficient appropriate audit evidence regarding the financial information of the entities or business activities within the Group to express an opinion on the consolidated financial statements. We are responsible for the direction, supervision and performance of the group audit. We remain solely responsible for our audit opinion.
We communicate with those charged with governance regarding, among other matters, the planned scope and timing of the audit and significant audit findings, including any significant deficiencies in internal controls that we identify during our audit.
We also provide those charged with governance with a statement that we have complied with relevant ethical requirements regarding independence, and to communicate with them all relationships and other matters that may reasonably be thought to bear on our independence, and where applicable, related safeguards.
From the matters communicated to those charged with governance, we determine those matters that were of most significance in the audit of the consolidated financial statements of the current period and are therefore the key audit matters. We describe these matters in our auditor's report unless law or regulation precludes public disclosure about the matter or when, in extremely rare circumstances, we determine that a matter should not be communicated in our report because the adverse consequences of doing so would reasonably be expected to outweigh the public interest benefits of such communication.
São Paulo, February 25, 2019
PricewaterhouseCoopers
Auditores Independentes
CRC 2SP000160/O-5
Edison Arisa Pereira
Contador CRC 1SP127241/O-0
Consolidated Financial Statements - December 31, 2018 11
 | BANCO SANTANDER (BRASIL) S.A. |
| CONSOLIDATED BALANCE SHEETS | |
| (Thousand of Brazilian Reais - R$) | |
Assets | Note | 2018 | 2017 | 2016 |
|
|
|
|
|
Cash and Balances With The Brazilian Central Bank | 4 | 31,716,345 | 34,124,753 | 26,284,569 |
|
|
|
|
|
Financial Assets Held For Trading |
| - | 86,271,097 | 131,245,477 |
Debt instruments | 6 | - | 34,879,681 | 59,994,946 |
Equity instruments | 7 | - | 489,770 | 398,461 |
Trading derivatives | 8.a | - | 17,070,125 | 24,480,256 |
Balances With The Brazilian Central Bank |
| - | 33,831,521 | 46,371,814 |
|
|
|
|
|
Financial Assets Measured At Fair Value Through Profit Or Loss |
| 43,711,800 | - | - |
Debt instruments | 6 | 3,171,746 | - | - |
Balances With The Brazilian Central Bank |
| 40,540,054 | - | - |
|
|
|
|
|
Financial Assets Measured At Fair Value Through Profit Or Loss Held For Trading |
| 68,852,314 | - | - |
Debt instruments | 6 | 50,066,469 | - | - |
Equity instruments | 7 | 766,333 | - | - |
Trading derivatives | 8.a | 18,019,512 | - | - |
|
|
|
|
|
Non-Trading Financial Assets Mandatorily Measured At Fair Value Through Profit Or Loss |
| 917,477 | - | - |
Equity instruments | 7 | 298,297 | - | - |
Loans and advances to customers | 9 | 619,180 | - | - |
|
|
|
|
|
Other Financial Assets At Fair Value Through Profit Or Loss |
| - | 1,692,057 | 1,711,204 |
Debt instruments | 6 | - | 1,658,689 | 1,668,749 |
Equity instruments | 7 | - | 33,368 | 42,455 |
|
|
|
|
|
Available-For-Sale Financial Assets |
| - | 85,823,384 | 57,815,045 |
Debt instruments | 6 | - | 84,716,747 | 55,829,572 |
Equity instruments | 7 | - | 1,106,637 | 1,985,473 |
|
|
|
|
|
Financial Assets Measured At Fair Value Through Other Comprehensive Income | 85,436,677 | - | - | |
Debt instruments | 6 | 85,395,691 | - | - |
Equity instruments | 7 | 40,986 | - | - |
|
|
|
|
|
Held to maturity investments | 6 | - | 10,214,454 | 10,048,761 |
|
|
|
|
|
Loans and Receivables |
| - | 355,246,574 | 333,997,034 |
Loans and amounts due from credit institutions | 5 | - | 65,209,902 | 65,711,001 |
Loans and advances to customers | 9 | - | 272,420,157 | 252,002,774 |
Debt instruments | 6 | - | 17,616,515 | 16,283,259 |
|
|
|
|
|
Financial Assets Measured At Amortized Cost |
| 417,478,717 | - | - |
Loans and amounts due from credit institutions | 5 | 79,607,001 | - | - |
Loans and advances to customers | 9 | 301,072,207 | - | - |
Debt instruments | 6 | 36,799,509 | - | - |
|
|
|
|
|
Hedging Derivatives | 8.a | 343,934 | 192,763 | 222,717 |
|
|
|
|
|
Non-Current Assets Held For Sale | 10 | 1,380,231 | 1,155,456 | 1,337,885 |
|
|
|
|
|
Investments in Associates and Joint Ventures | 11 | 1,053,315 | 866,564 | 990,077 |
|
|
|
|
|
Tax Assets | 24 | 31,565,767 | 28,825,741 | 28,753,184 |
Current |
| 3,885,189 | 4,047,663 | 4,316,072 |
Deferred |
| 27,680,578 | 24,778,078 | 24,437,112 |
|
|
|
|
|
Other Assets | 15 | 4,800,467 | 4,578,270 | 5,104,012 |
|
|
|
|
|
Tangible Assets | 12 | 6,588,975 | 6,509,883 | 6,646,433 |
|
|
|
|
|
Intangible Assets |
| 30,018,988 | 30,202,043 | 30,236,842 |
Goodwill | 13 | 28,378,288 | 28,364,256 | 28,355,039 |
Other intangible assets | 14 | 1,640,700 | 1,837,787 | 1,881,803 |
|
|
|
|
|
TOTAL ASSETS |
| 723,865,007 | 645,703,039 | 634,393,240 |
|
|
|
|
|
The accompanying Notes are an integral part of these consolidated financial statements. | ||||
Consolidated Financial Statements - December 31, 2018 12
Liabilities and Stockholders' Equity | Note | 2018 | 2017 | 2016 |
|
|
|
|
|
Financial Liabilities Held For Trading |
| - | 49,322,546 | 51,619,869 |
Trading derivatives | 8.a | - | 16,514,154 | 19,925,600 |
Short positions | 8.b | - | 32,808,392 | 31,694,269 |
|
|
|
|
|
Financial Liabilities Measured At Fair Value Through Profit Or Loss Held For Trading |
| 50,938,992 | - | - |
Trading derivatives | 8.a | 18,243,315 | - | - |
Short positions | 8.b | 32,695,677 | - | - |
|
|
|
|
|
Financial Liabilities Measured At Fair Value Through Profit Or Loss |
| 1,946,056 | - | - |
Deposits from Brazilian Central Bank and deposits from credit institutions | 21 | 1,946,056 | - | - |
|
|
|
|
|
|
|
|
|
|
Financial Liabilities at Amortized Cost |
| 547,295,169 | 478,880,704 | 471,579,467 |
Deposits from Brazilian Central Bank and deposits from credit institutions | 16 | 99,022,806 | 79,374,685 | 78,634,072 |
Customer deposits | 17 | 304,197,800 | 276,042,141 | 247,445,177 |
Marketable debt securities | 18 | 74,626,232 | 70,247,012 | 99,842,955 |
Subordinated debts | 19 | 9,885,607 | 519,230 | 466,246 |
Debt Instruments Eligible to Compose Capital | 20 | 9,779,944 | 8,436,901 | 8,311,918 |
Other financial liabilities | 21 | 49,782,780 | 44,260,735 | 36,879,099 |
|
|
|
|
|
Hedging Derivatives | 8.a | 223,520 | 163,332 | 311,015 |
|
|
|
|
|
Provisions |
| 14,695,898 | 13,986,916 | 11,776,491 |
Provisions for pensions funds and similar obligations | 22 | 3,357,654 | 3,923,457 | 2,710,627 |
Provisions for judicial and administrative proceedings, commitments and other provisions | 23 | 11,338,244 | 10,063,459 | 9,065,864 |
|
|
|
|
|
Tax Liabilities | 24 | 8,074,764 | 8,248,019 | 6,094,740 |
Current |
| 5,043,375 | 5,751,488 | 4,826,703 |
Deferred |
| 3,031,389 | 2,496,531 | 1,268,037 |
|
|
|
|
|
Other Liabilities | 25 | 9,095,148 | 8,013,921 | 8,199,099 |
|
|
|
|
|
Total Liabilities |
| 632,269,547 | 558,615,438 | 549,580,681 |
|
|
|
|
|
Stockholders' Equity | 28 | 91,881,738 | 87,425,075 | 85,434,855 |
Share capital |
| 57,000,000 | 57,000,000 | 57,000,000 |
Reserves |
| 30,377,693 | 28,966,451 | 27,881,326 |
Treasury shares |
| (461,432) | (148,440) | (514,034) |
Option for Acquisition of Equity Instrument |
| (1,017,000) | (1,017,000) | (1,017,000) |
Profit for the year attributable to the Parent |
| 12,582,477 | 8,924,064 | 7,334,563 |
Less: dividends and remuneration |
| (6,600,000) | (6,300,000) | (5,250,000) |
|
|
|
|
|
Other Comprehensive Income |
| (878,863) | (774,368) | (1,347,800) |
|
|
|
|
|
Stockholders' Equity Attributable to the Parent |
| 91,002,875 | 86,650,707 | 84,087,055 |
|
|
|
|
|
Non - Controlling Interests | 27 | 592,585 | 436,894 | 725,504 |
|
|
|
|
|
Total Stockholders' Equity |
| 91,595,460 | 87,087,601 | 84,812,559 |
Total Liabilities and Stockholders' Equity |
| 723,865,007 | 645,703,039 | 634,393,240 |
The accompanying Notes are an integral part of these consolidated financial statements.
Consolidated Financial Statements - December 31, 2018 13
| BANCO SANTANDER (BRASIL) S.A. |
| CONSOLIDATED INCOME STATEMENTS | |
| (Thousand of Brazilian Reais - R$) | |
| Note | 2018 | 2017 | 2016 |
|
|
|
|
|
Interest and similar income | 32 | 70,478,393 | 71,418,349 | 77,146,077 |
Interest expense and similar charges | 33 | (28,557,051) | (36,471,860) | (46,559,584) |
Net interest income |
| 41,921,342 | 34,946,489 | 30,586,493 |
Income from equity instruments | 34 | 32,623 | 83,120 | 258,545 |
Income from companies accounted for by the equity method | 11 | 65,958 | 71,551 | 47,537 |
Fee and commission income | 35 | 17,728,452 | 15,815,543 | 13,548,481 |
Fee and commission expense | 36 | (3,596,293) | (3,093,675) | (2,570,885) |
Gains (losses) on financial assets and liabilities (net) | 37 | (2,782,802) | 969,090 | 3,016,156 |
Financial assets held for trading |
| - | 1,174,111 | 3,166,399 |
Financial Assets At Fair Value Through Profit Or Loss |
| (138,673) | - | - |
Financial Assets Measured At Fair Value Through Profit Or Loss Held For Trading | (2,764,859) | - | - | |
Non-Trading Financial Assets Mandatorily Measured At Fair Value Through Profit Or Loss | 61,239 | - | - | |
Other financial instruments at fair value through profit or loss |
| - | 30,694 | 82,638 |
Financial instruments not measured at fair value through profit or loss |
| (138,104) | (122,115) | (115,202) |
Other |
| 197,595 | (113,600) | (117,679) |
Exchange differences (net) | 38 | (2,806,471) | 605,056 | 4,574,814 |
Other operating expense (net) | 39 | (1,055,850) | (672,013) | (624,571) |
Total Income |
| 49,506,959 | 48,725,161 | 48,836,570 |
Administrative expenses |
| (16,792,138) | (16,120,595) | (14,920,410) |
Personnel expenses | 40 | (9,206,007) | (8,937,278) | (8,377,265) |
Other administrative expenses | 41 | (7,586,131) | (7,183,317) | (6,543,145) |
Depreciation and amortization |
| (1,739,959) | (1,662,247) | (1,482,639) |
Tangible assets | 12 | (1,216,704) | (1,190,967) | (1,154,588) |
Intangible assets | 14 | (523,255) | (471,280) | (328,051) |
Provisions (net) |
| (1,999,604) | (3,309,239) | (2,724,742) |
Impairment losses on financial assets (net) |
| (12,713,435) | (12,338,300) | (13,301,445) |
Loans and receivables | 9.c | - | (12,338,141) | (13,389,834) |
Financial Assets Measured At Amortized Cost and contingent commitments | (12,713,532) | - | - | |
Gains (losses) due to derecognition of financial assets measured at amortized cost | 97 | (159) | 88,389 | |
Impairment losses on other assets (net) |
| (508,310) | (456,711) | (114,321) |
Other intangible assets | 14 | (300,865) | (306,110) | (5,838) |
Other assets | 14 | (207,445) | (150,601) | (108,483) |
Gains (losses) on disposal of assets not classified as non-current assets held for sale | 42 | (25,476) | (64,302) | 3,816 |
Gains (losses) on non-current assets held for sale not classified as discontinued operations | 43 | 181,734 | (260,083) | 87,073 |
Operating Income Before Tax |
| 15,909,771 | 14,513,684 | 16,383,902 |
Income taxes | 24 | (3,109,853) | (5,375,636) | (8,918,984) |
Consolidated Net income for the period |
| 12,799,918 | 9,138,048 | 7,464,918 |
Profit attributable to the Parent |
| 12,582,477 | 8,924,064 | 7,334,563 |
Profit attributable to non-controlling interests | 27 | 217,441 | 213,984 | 130,355 |
Consolidated Financial Statements - December 31, 2018 14
Earnings Per Share (Brazilian Reais) | 29 |
|
|
|
| ||||
Basic earnings per 1,000 shares (Brazilian Real) |
|
|
|
|
Common shares |
| 1,604.34 | 1,133.43 | 929.93 |
Preferred shares |
| 1,764.78 | 1,246.77 | 1,022.92 |
Diluted earnings per 1,000 shares (Brazilian Real) |
|
|
|
|
Common shares |
| 1,604.34 | 1,132.44 | 929.03 |
Preferred shares |
| 1,764.78 | 1,245.69 | 1,021.93 |
Net Profit attributable - Basic (Brazilian Real) |
|
|
|
|
Common shares |
| 6,108,349 | 4,332,026 | 3,560,288 |
Preferred shares |
| 6,474,128 | 4,592,038 | 3,774,275 |
Net Profit attributable - Diluted (Brazilian Real) |
|
|
|
|
Common shares |
| 6,108,349 | 4,331,955 | 3,560,222 |
Preferred shares |
| 6,474,128 | 4,592,109 | 3,774,341 |
|
|
|
|
|
Weighted average shares outstanding (in thousands) - Basic |
|
|
|
|
Common shares |
| 3,807,386 | 3,822,057 | 3,828,555 |
Preferred shares |
| 3,668,527 | 3,683,145 | 3,689,696 |
Weighted average shares outstanding (in thousands) - Diluted |
|
|
|
|
Common shares |
| 3,807,386 | 3,825,313 | 3,832,211 |
Preferred shares |
| 3,668,527 | 3,686,401 | 3,693,352 |
The accompanying Notes are an integral part of these consolidated financial statements.
Consolidated Financial Statements - December 31, 2018 15
| BANCO SANTANDER (BRASIL) S.A. |
| CONSOLIDATED STATEMENT OF OTHER COMPREHENSIVE INCOME | |
| (Thousand of Brazilian Reais - R$) | |
| 2018 | 2017 | 2016 |
|
|
|
|
Consolidated Profit for the Year | 12,799,918 | 9,138,048 | 7,464,918 |
|
|
|
|
Other Comprehensive Income that will be reclassified subsequently to profit or loss when specific conditions are met: | 558,967 | 1,194,335 | 3,725,565 |
Available-for-sale financial assets | - | 1,147,384 | 3,311,607 |
Valuation adjustments - Gains (Losses) | - | 1,789,286 | 5,458,735 |
Amounts transferred to income statement | - | 30,694 | 82,638 |
Income taxes | - | (672,596) | (2,229,766) |
Financial Assets Measured At Fair Value Through Other Comprehensive Income | 475,809 | - | - |
Financial Assets Measured At Fair Value Through Other Comprehensive Income | 388,481 | - | - |
Gains (Losses) on financial assets previously classified as available-for-sale and reclassified to the income statement (net) | 7,982 | - | - |
Gains (Losses) on financial assets previously classified as available-for-sale and reclassified to reserves (net) | 296,802 | - | - |
Income taxes | (217,456) | - | - |
Cash flow hedges | 83,158 | 46,951 | 413,958 |
Valuation adjustments | 140,811 | 73,238 | 761,423 |
Amounts transferred to income statement | (6,767) | - | 1,580 |
Income taxes | (50,886) | (26,287) | (349,045) |
Net investment hedge | - | - | 634,207 |
Net investment hedge | - | - | 1,209,338 |
Income taxes | - | - | (575,131) |
Translation adjustments investment abroad | - | - | (634,207) |
Exchange on investments Abroad | - | - | (634,207) |
|
|
|
|
Other Comprehensive Income that will not be Reclassified to net Income: | (366,660) | (620,903) | (941,833) |
Defined benefits plan | (366,660) | (620,903) | (941,833) |
Defined benefits plan | (418,768) | (992,156) | (1,568,122) |
Income taxes | 52,108 | 371,253 | 626,289 |
|
|
|
|
Total Comprehensive Income | 12,992,225 | 9,711,480 | 10,248,650 |
Attributable to the parent | 12,774,784 | 9,497,496 | 10,118,295 |
Attributable to non-controlling interests | 217,441 | 213,984 | 130,355 |
Total Comprehensive Income | 12,992,225 | 9,711,480 | 10,248,650 |
The accompanying Notes are an integral part of these consolidated financial statements.
Consolidated Financial Statements - December 31, 2018 16
| BANCO SANTANDER (BRASIL) S.A. |
CONSOLIDATED STATEMENT OF CHANGES IN STOCKHOLDERS' EQUITY | |
| (Thousand of Brazilian Reais - R$) | |
|
| Stockholders´ Equity Attributable to the Parent | Non-controlling | Total | ||||||||||||
|
|
| Other Comprehensive Income | |||||||||||||
| Note | Share | Reserves | Treasury | Option for Acquisition of Equity Instrument | Profit | Dividends and | Total Stockholders´ | Available-for-sale Financial Assets | Financial Assets Measured At Fair Value Through Other Comprehensive Income | Defined | Translation adjustments investment abroad | Gains and losses - Cash flow hedge and Investment | Total | ||
Balance at December 31, 2015 |
| 57,000,000 | 24,388,967 | (423,953) | (1,017,000) | 9,783,740 | (6,200,000) | 83,531,754 | (2,645,417) | - | (1,141,644) | 1,493,577 | (1,838,048) | 79,400,222 | 435,062 | 79,835,284 |
|
|
|
|
|
|
|
|
|
|
|
|
|
|
|
|
|
Total comprehensive income | - | - | - | - | 7,334,563 | - | 7,334,563 | 3,311,607 | - | (941,833) | (634,207) | 1,048,165 | 10,118,295 | 130,355 | 10,248,650 | |
Net profit |
| - | - | - | - | 7,334,563 | - | 7,334,563 | - | - | - | - | - | 7,334,563 | 130,355 | 7,464,918 |
Other comprehensive income | - | - | - | - | - | - | - | 3,311,607 | - | (941,833) | (634,207) | 1,048,165 | 2,783,732 | - | 2,783,732 | |
Financial Assets Measured At Fair Value Through Other Comprehensive Income | - | - | - | - | - | - | - | 3,311,607 | - | - | - | - | 3,311,607 | - | 3,311,607 | |
Pension plans | - | - | - | - | - | - | - | - | - | (941,833) | - | - | (941,833) | - | (941,833) | |
Translation adjustments investment abroad | - | - | - | - | - | - | - | - | - | - | (634,207) | - | (634,207) | - | (634,207) | |
Gain and loss - Cash flow and investment hedge | - | - | - | - | - | - | - | - | - | - | - | 1,048,165 | 1,048,165 | - | 1,048,165 | |
Appropriation of net income from prior years | - | 9,783,740 | - | - | (9,783,740) | - | - | - | - | - | - | - | - | - | - | |
Dividends and interest on capital | 28.b | - | (6,200,000) | - | - | - | 950,000 | (5,250,000) | - | - | - | - | - | (5,250,000) | - | (5,250,000) |
Share based compensation | 40.b | - | (35,463) | - | - | - | - | (35,463) | - | - | - | - | - | (35,463) | - | (35,463) |
Treasury shares | 28.d | - | - | (90,031) | - | - | - | (90,031) | - | - | - | - | - | (90,031) | - | (90,031) |
Capital restructuring |
| - | - | (50) | - | - | - | (50) | - | - | - | - | - | (50) | - | (50) |
Treasury shares income | 28.d | - | (11,574) | - | - | - | - | (11,574) | - | - | - | - | - | (11,574) | - | (11,574) |
Other | 28.a | - | (44,344) | - | - | - | - | (44,344) | - | - | - | - | - | (44,344) | 160,087 | 115,743 |
Balance at December 31, 2016 |
| 57,000,000 |
27,881,326 | (514,034) | (1,017,000) | 7,334,563 | (5,250,000) | 85,434,855 | 666,190 | - | (2,083,477) | 859,370 | (789,883) | 84,087,055 | 725,504 | 84,812,559 |
Consolidated Financial Statements - December 31, 2018 17
|
|
|
|
|
|
|
|
|
|
|
|
|
|
|
|
|
Total comprehensive income | - | - | - | - | 8,924,064 | - | 8,924,064 | 1,147,384 | - | (620,903) | - | 46,951 | 9,497,496 | 213,984 | 9,711,480 | |
Net profit |
| - | - | - | - | 8,924,064 | - | 8,924,064 | - | - | - | - | - | 8,924,064 | 213,984 | 9,138,048 |
Other comprehensive income | - | - | - | - | - | - | - | 1,147,384 | - | (620,903) | - | 46,951 | 573,432 | - | 573,432 | |
Financial Assets Measured At Fair Value Through Other Comprehensive Income | - | - | - | - | - | - | - | 1,147,384 | - | - | - | - | 1,147,384 | - | 1,147,384 | |
Pension plans | - | - | - | - | - | - | - | - | - | (620,903) | - | - | (620,903) | - | (620,903) | |
Gain and loss - Cash flow and investment hedge | - | - | - | - | - | - | - | - | - | - | - | 46,951 | 46,951 | - | 46,951 | |
Appropriation of net income from prior years | - | 7,334,563 | - | - | (7,334,563) | - | - | - | - | - | - | - | - | - | - | |
Dividends and interest on capital | 28.b | - | (5,250,000) | - | - | - | (1,050,000) | (6,300,000) | - | - | - | - | - | (6,300,000) | - | (6,300,000) |
Share based compensation | 40.b | - | 37,161 | - | - | - | - | 37,161 | - | - | - | - | - | 37,161 | - | 37,161 |
Treasury shares | 28.d | - | (744,419) | 365,643 | - | - | - | (378,776) | - | - | - | - | - | (378,776) | - | (378,776) |
Capital restructuring |
| - | - | (49) | - | - | - | (49) | - | - | - | - | - | (49) | - | (49) |
Treasury shares income | 28.d | - | (2,498) | - | - | - | - | (2,498) | - | - | - | - | - | (2,498) | - | (2,498) |
Other |
| - | (289,682) | - | - | - | - | (289,682) | - |
| - | - | - | (289,682) | (502,594) | (792,276) |
Balance at December 31, 2017 |
| 57,000,000 | 28,966,451 | (148,440) | (1,017,000) | 8,924,064 | (6,300,000) | 87,425,075 | 1,813,574 | - | (2,704,380) | 859,370 | (742,932) | 86,650,707 | 436,894 | 87,087,601 |
Consolidated Financial Statements - December 31, 2018 18
|
|
|
|
|
|
|
|
|
|
|
|
|
|
|
|
|
|
| Stockholders´ Equity Attributable to the Parent | Non-controlling | Total | ||||||||||||
|
|
| Other Comprehensive Income | |||||||||||||
| Note | Share | Reserves | Treasury | Option for Acquisition of Equity Instrument | Profit | Dividends and | Total Stockholders´ | Available-for-sale Financial Assets | Financial Assets Measured At Fair Value Through Other Comprehensive Income | Defined Benefits plan | Translation adjustments investment abroad | Gains and losses - Cash flow hedge and Investment | Total | ||
Balance at December 31, 2017 |
| 57,000,000 | 28,966,451 | (148,440) | (1,017,000) | 8,924,064 | (6,300,000) | 87,425,075 | - | 1,813,574 | (2,704,380) | 859,370 | (742,932) | 86,650,707 | 436,894 | 87,087,601 |
Effects of IFRS 9 first adoption |
| - | (1,245,023) | - | - | - | - | (1,245,023) | - | (296,802) | - | - | - | (1,541,825) | - | (1,541,825) |
Balance at January 1, 2018 |
| 57,000,000 | 27,721,428 | (148,440) | (1,017,000) | 8,924,064 | (6,300,000) | 86,180,052 | - | 1,516,772 | (2,704,380) | 859,370 | (742,932) | 85,108,882 | 436,894 | 85,545,776 |
|
|
|
|
|
|
|
|
|
|
|
|
|
|
|
|
|
Total comprehensive income | - | - | - | - | 12,582,477 | - | 12,582,477 | - | 475,809 | (366,660) | - | 83,158 | 12,774,784 | 217,441 | 12,992,225 | |
Net profit |
| - | - | - | - | 12,582,477 | - | 12,582,477 | - | - | - | - | - | 12,582,477 | 217,441 | 12,799,918 |
Other comprehensive income | - | - | - | - | - | - | - | - | 475,809 | (366,660) | - | 83,158 | 192,307 | - | 192,307 | |
Financial Assets Measured At Fair Value Through Other Comprehensive Income | - | - | - | - | - | - | - | - | 475,809 | - | - | - | 475,809 | - | 475,809 | |
Pension plans | - | - | - | - | - | - | - | - | - | (366,660) | - | - | (366,660) | - | (366,660) | |
Gain and loss - Cash flow and investment hedge | - | - | - | - | - | - | - | - | - | - | - | 83,158 | 83,158 | - | 83,158 | |
Consolidated Financial Statements - December 31, 2018 19
Appropriation of net income from prior years | - | 8,924,064 | - | - | (8,924,064) | - | - | - | - | - | - | - | - | - | - | |
| - | 106,440 | - | - | - | - | 106,440 | - | - | - | - | - | 106,440 | (106,440) | - | |
Dividends and interest on capital | 28.b | - | (6,300,000) | - | - | - | (300,000) | (6,600,000) | - | - | - | - | - | (6,600,000) | - | (6,600,000) |
Share based compensation |
| - | (17,854) | - | - | - | - | (17,854) | - | - | - | - | - | (17,854) | - | (17,854) |
Treasury shares | 28.d | - | - | (312,305) | - | - | - | (312,305) | - | - | - | - | - | (312,305) | - | (312,305) |
Capital restructuring | 28.d | - | - | (687) | - | - | - | (687) | - | - | - | - | - | (687) | - | (687) |
Treasury shares income | 28.d | - | (15,868) | - | - | - | - | (15,868) | - | - | - | - | - | (15,868) | - | (15,868) |
Other |
| - | (40,517) | - | - | - | - | (40,517) | - | - | - | - | - | (40,517) | 44,690 | 4,173 |
Balance at December 31, 2018 |
| 57,000,000 | 30,377,693 | (461,432) | (1,017,000) | 12,582,477 | (6,600,000) | 91,881,738 | - | 1,992,581 | (3,071,040) | 859,370 | (659,774) | 91,002,875 | 592,585 | 91,595,460 |
The accompanying Notes are an integral part of these consolidated financial statements.
Consolidated Financial Statements - December 31, 2018 20
| BANCO SANTANDER (BRASIL) S.A. |
CONSOLIDATED STATEMENT OF CASH FLOWS | |
| (Thousand of Brazilian Reais - R$) | |
| Note | 2018 | 2017 | 2016 |
1. Cash Flows From Operating Activities |
|
|
|
|
Consolidated profit for the year |
| 12,799,918 | 9,138,048 | 7,464,918 |
Adjustments to profit |
| 14,765,404 | 17,015,113 | 20,143,702 |
Depreciation of tangible assets | 12 | 1,216,704 | 1,190,967 | 1,154,588 |
Amortization of intangible assets | 14 | 523,255 | 471,280 | 328,051 |
Impairment losses on other assets (net) |
| 508,310 | 456,711 | 114,321 |
Provisions and Impairment losses on financial assets (net) |
| 14,713,039 | 15,647,539 | 16,026,187 |
Net Gains (losses) on disposal of tangible assets, investments and non-current assets held for sale | 42&43 | (156,258) | 324,385 | (90,889) |
Income from companies accounted by the equity method | 11 | (65,958) | (71,551) | (47,537) |
Changes in deferred tax assets and liabilities | 24.d | (1,594,440) | (406,395) | 5,343,885 |
Monetary Adjustment of Escrow Deposits |
| (664,003) | (637,124) | (749,040) |
Recoverable Taxes |
| (222,402) | (210,834) | (215,228) |
Effects of Changes in Foreign Exchange Rates on Cash and Cash Equivalents | - | - | 2,289,849 | |
Effects of Changes in Foreign Exchange Rates on Assets and Liabilities | 1,173,757 | 33,691 | (3,924,662) | |
Other |
| (666,600) | 216,444 | (85,823) |
Net (increase) decrease in operating assets |
| (79,913,313) | (16,745,263) | (59,866,978) |
Balance with the Brazilian Central Bank |
| 16,629,126 | (7,043,255) | 60,163,587 |
Financial assets held for trading |
| - | 44,950,707 | (80,367,944) |
Financial Assets Measured At Fair Value Through Profit Or Loss |
| (8,791,116) | - | - |
Other Financial Assets Measured At Fair Value Through Profit Or Loss | 1,692,154 | 18,988 | 457,419 | |
Financial Assets Measured At Fair Value Through Profit Or Loss Held for Trading | (16,412,738) | - | - | |
Non-Trading Financial Assets Mandatorily Measured at Fair Value Through Profit or Loss | (419,851) | - | - | |
Available-for-sale financial assets |
| - | (27,214,188) | 9,976,210 |
Financial Assets Measured At Fair Value Through Other Comprehensive Income | (4,323,459) | - | - | |
Loans and receivables |
| - | (30,256,590) | (43,422,496) |
Financial Assets Measured At Amortized Cost |
| (75,906,801) | - | - |
Held to maturity investments |
| - | (26,266) | (449,792) |
Other assets |
| 7,619,372 | 2,825,341 | (6,223,962) |
Net increase (decrease) in operating liabilities |
| 64,293,934 | 44,163,382 | 43,247,080 |
Financial liabilities held for trading |
| - | (2,297,323) | 9,232,101 |
Financial Liabilities Measured At Fair Value Through Profit Or Loss held for trading | 1,616,446 | - | - | |
Financial Liabilities Measured At Fair Value Through Profit Or Loss |
| 1,946,056 | - | - |
Financial liabilities at amortized cost |
| 57,833,935 | 43,702,283 | 32,696,894 |
Other liabilities |
| 2,897,497 | 2,758,422 | 1,318,085 |
Tax paid | 24.a | (3,668,571) | (3,280,230) | (4,240,115) |
Total net cash flows from operating activities (1) |
| 8,277,372 | 50,291,050 | 6,748,607 |
|
|
|
|
|
2. Cash Flows From Investing Activities |
|
|
|
|
Investments |
| (3,157,794) | (2,197,918) | (1,945,372) |
Capital increase in Investments in associates and Joint Ventures | 11 | (36,051) | (34,154) | (3,105) |
Acquisition of subsidiary, less net cash in the acquisition |
| (111,224) | (275,091) | (392,998) |
Tangible assets | 12.a | (1,394,299) | (1,106,406) | (873,140) |
Intangible assets |
| (1,616,222) | (738,554) | (670,576) |
Corporate Restructuring | 10 | 2 | (43,713) | (5,553) |
Disposal |
| 797,716 | 744,913 | 677,088 |
Capital reduction of investee in joint control | 11.b | - | - | 76,860 |
Tangible assets | 12&42 | 122,009 | 37,467 | 42,226 |
Non - current assets held for sale | 10 | 563,607 | 434,553 | 208,232 |
Dividends and interest on capital received |
| 112,100 | 272,893 | 349,770 |
Total net cash flows from investing activities (2) |
| (2,360,078) | (1,453,005) | (1,268,284) |
Consolidated Financial Statements - December 31, 2018 21
3. Cash Flows From Financing Activities |
|
|
|
|
Acquisition of own shares | 28.d | (312,305) | (378,776) | (90,031) |
Issuance of Debt Instruments Eligible to Compose Capital | 20 | 9,347,750 | - | - |
Issuance of other long-term financial liabilities | 18 | 73,765,081 | 59,663,420 | 50,313,469 |
Dividends and interest on capital paid |
| (6,076,073) | (5,652,081) | (3,210,762) |
Payments of other long-term financial liabilities | 18 | (78,903,009) | (97,009,957) | (56,164,769) |
Payments of subordinated liabilities | 19 | (544,566) | - | (8,362,652) |
Payments of interest of Debt Instruments Eligible to Compose Capital | 20 | (683,783) | (623,146) | (701,671) |
Net increase in non-controlling interests | 27 | 55,869 | (296,184) | 23,909 |
Capital Increase in Subsidiaries, by Non-Controlling Interests | 27 | 48,000 | - | - |
Total net cash flows from financing activities (3) |
| (3,303,036) | (44,296,724) | (18,192,507) |
Exchange variation on Cash and Cash Equivalents (4) |
| - | - | (2,289,849) |
Net Increase in Cash (1+2+3+4) |
| 2,614,258 | 4,541,321 | (15,002,033) |
Cash and cash equivalents at beginning of year |
| 22,670,902 | 18,129,581 | 33,131,614 |
Cash and cash equivalents at end of year |
| 25,285,160 | 22,670,902 | 18,129,581 |
|
|
|
|
|
Cash and cash equivalents components |
|
|
|
|
Cash and Balances With The Brazilian Central Bank | 4 | 19,463,587 | 20,642,321 | 14,683,735 |
Loans and other | 5 | 5,821,573 | 2,028,581 | 3,445,846 |
Total of cash and cash equivalents |
| 25,285,160 | 22,670,902 | 18,129,581 |
|
|
|
|
|
Non-cash transactions |
|
|
|
|
Foreclosures loans and other assets transferred to non-current assets held for sale | 10 | 785,139 | 524,497 | 834,903 |
Dividends and interest on capital declared but not paid | 28.b | 4,800,000 | 4,455,000 | 4,750,000 |
Supplemental information |
|
|
|
|
Interest received |
| 70,831,205 | 73,094,248 | 75,818,511 |
Interest paid |
| (29,796,455) | (37,948,828) | (46,051,070) |
The accompanying Notes are an integral part of these consolidated financial statements.
Consolidated Financial Statements - December 31, 2018 22
| BANCO SANTANDER (BRASIL) S.A. |
NOTES TO THE CONSOLIDATED FINANCIAL STATEMENTS | |
| (Thousand of Brazilian Reais - R$ - unless otherwise stated) | |
1.Introduction, basis of presentation of the consolidated financial statements and other information
a) Introduction
Banco Santander (Brasil) S.A. (Banco Santander or Bank), directly and indirectly controlled by Banco Santander, S.A., based in Spain (Banco Santander Spain), is the lead institution of the Financial and Prudential Conglomerate (Conglomerate Santander) under the authority of theBrazilian Central Bank (Bacen), established as a corporation, with headquarters at Avenida Presidente Juscelino Kubitschek, 2041 and 2235 - A Block - Vila Olímpia - São Paulo - SP. Banco Santander operates as a multiple service bank, conducting its operations by means of portfolios such as commercial, investment, loans and advances, mortgage loans, leasing, credit card operations and foreign exchange. Through its subsidiaries, the Bank also operates in the payment institution, leasing, shares club management, securities and insurance brokerage operations, capitalization and pension plan. The Bank's activities are conducted within the context of a group of institutions that operate on an integrated basis in the financial market. The corresponding benefits and costs of providing services are absorbed between them, they are conducted in the normal course of business and under commutative conditions.
The consolidated financial statements for the year ended on December 31, 2018, were authorized to be issued by the Board of directors at the meeting held on February 25, 2019.
b) Basis of presentation of the consolidated financial statements
These consolidated financial statements were prepared in accordance with International Financial Reporting Standards (IFRS) issued by the International Accounting Standards Board (IASB), and the interpretations issued by the IFRS Interpretations Committee (Current name of International Financial Reporting Interpretations Committee - IFRIC). All the relevant information specific to Banco Santander's financial statements, and only these, are being evidenced, and correspond to those used by Banco Santander in its management.
c) Other information
c.1) Adoption of new standards and interpretations
Since January 1, 2018, the Bank has adopted the new rule IFRS 9 and IFRS 15.
• IFRS 9 – Financial Instruments: issued in its original format in July 2014, the IASB - International Accounting Standards Board approved the IFRS 9, which replaces the IAS 39 Financial Instruments, according to the guidelines arising from the G-20 (group composed by the finance ministers from 20 of the largest economies in the world) meeting, held in April 2009, establishing the financial instruments recognition and measurement.
i. Transition
As permitted by the transitional provisions of IFRS 9, the Group elected not to restate comparative figures. Any adjustments to the carrying amounts of financial assets and liabilities at the date of transition were recognised in the opening retained earnings and other reserves of the current period. The Group has also elected to continue to apply the hedge accounting requirements of IAS 39 on adoption on IFRS 9.
Consequently, for notes disclosures, the consequential amendments to IFRS 7 disclosures have also only been applied to the current period. The comparative period notes disclosures repeat those disclosures made in the prior year.
ii. Financial assets and liabilities
Initial recognition and measurement
The Bank recognizes initially the loans and advances, deposits, debt instruments issued and subordinated liabilities at the date of origin.
All other financial instruments (including regular financial assets purchases and sales) are recognized at the date of trade which corresponds to when theBank entered into the agreement.
A financial asset or liability is measured initially at fair value, added, in the case of an item not measured at fair value, by transaction cost directly attributable to its acquisition or issuance.
iii. Classification
Financial assets
On the initial recognition a financial asset is classified as measured at amortized cost, fair value through other comprehensive income and fair value through profit or loss.
A financial asset is measured at amortized cost if the following conditions are met and if it is not classified as measured at fair value through profit and loss:
• The asset is held in a business model which its purpose is to hold assets in order to collect their cash flows;
• The agreement terms of the financial asset generate, in specific dates, cash flows which referred exclusively to the payment of principal and interests.
A debt instrument is measured at fair value through other comprehensive income if the following conditions are met and if it is not classified as measured at fair value through profit and loss:
• The asset is held in a business model which its purpose is to hold assets in order to collect their cash flows and the disposal of financial assets; and
• The agreement terms of the financial asset generate, in specific dates, cash flows which referred exclusively to the payment of principal and interests.
On the initial recognition of an equity instrument not held for trading, the Bank may choose in an irrevocable way to recognize the subsequent fair value changes in Other Comprehensive Income (OCI). This option is made considering each investment individually. The option was not used by the Bank.
All other financial assets are classified as measured at fair value through profit and loss (FVPL).
Besides that, on the initial recognition, the Bank may irrevocably classify as measured at fair value through profit and loss a financial asset which, in other way, meet the requirements to be measured at amortized cost or at fair value through other comprehensive income if this classification eliminates or reduces substantially an accounting mismatch that could ever exist. This option was not used by the Bank.
iv. Business model evaluation
The Bank evaluates the purpose of its business models in which the assets are held in the portfolio level to evaluate the way the business is managed and information is provided to the Management. The information considered are:
• Defined policies and goals for the portfolio and the application of such policies. Highlighting, if Management’s strategy is focused on receiving contractual interest income, it should maintain a specific interest rate profile, or to adequate the assets duration;
Consolidated Financial Statements - December 31, 2018 23
• How the portfolio performance is evaluated and how it is reported to the Bank Management;
• The risks that affects the business model performance (and financial assets held in that business model) and how those risks are managed;
• How the business managers are compensated – for example – if the compensation is related to the fair value of the assets or in the contractual cash flows received;
• The frequency, volume and the moment of the sales in previous periods, the reason of such sales and their expectation over future sales. The information regarding sales activity should not be considered in isolation, but as part of a general evaluation of how the goal defined by the Bank to manage the financial assets is being achieved.
The financial assets held for trading or managed, which performance is evaluated based on the fair value, are measured at fair value through profit and loss once they are not held to receive the contractual cash flows nor to receive the contractual cash flows and financial assets sale.
v. Evaluation to determine if the contractual cash flows refer exclusively to principal and interest payments
For the purpose of this evaluation, “principal” is defined as the fair value of financial asset on the initial recognition. “Interests” are defined as the consideration for the value of the currency in time and to the credit risk associated to the amount of principal during a specific period and for other risks and loans basic costs (for example, liquidity risk and administrative costs) as well as for the profit margin.
To evaluate if the contractual cash flows refer exclusively to the payment of principal and interests, the Bank considers the contractual terms of the instrument. This includes evaluating whether the financial asset contains a contractual term that could change its deadline or the contractual cash flows in a way that it would not meet this condition. When carrying out the evaluation, the Bank considers:
• contingent events that could change the cash flows amount and deadline;
• leverage;
• prepayment deadlines and extension;
• terms that limit the Bank rights over the cash flows; and
• resources that modify the consideration of the currency value in time - for example, periodic readjustment of interest rates.
vi. Reclassification of the Financial Assets Categories
Financial assets are not reclassified subsequent to their initial recognition, except in the period after the Bank changes its business model to manage its financial assets.
vii. Financial assets write-off
The Bank writes-off a financial asset when the asset´s contractual cash flow expires or when the Bank transfers the rights to receive the contractual cash flow in a transaction which essentially all risks and benefits of the financial asset property are transferred or that the Bank does not transfer nor keep substantially all risks and benefits of the financial asset property and does not control it.
In the event of a financial asset written-off, the difference between the book value of the asset (or the book value allocated to the part of the asset written-off) and the sum of (i) the payments received (including any other obtained asset, deducted by any liability assumed) and (ii) possible gains or losses accumulated recognized in “Other comprehensive income” is registered in the income statement.
From the aforementioned adoption date of the IFRS, possible gains/losses accumulated and recognized in “Other comprehensive income” related to the equity instruments designated at fair value through other comprehensive income are not registered in the income statement through write-off of such instruments.
The Bank carries out transfer operations of assets recognized in its financial statement but keep all or substantially all risks and benefits of the assets transferred or part of them. In this case, the transferred assets are not written-off. Examples of such operations include assignments of loan portfolios with substantial retention of risks and benefits.
Transfer operations in which the Bank does not maintain or transfer substantially all risks and benefits of a financial asset property or retain its control, the Bank continues to recognize the asset in the extent of its continuous involvement, determined by the extent of the its exposure to changes in the asset value transferred.
viii. Financial Liabilities write-off
The Bank writes-off a financial liability when its contractual obligations are extinct, canceled or expired.
ix. Effective interest rate
The effective interest rate is the rate used to discount exclusively the payments or receipts of estimated cash flow during the expected life time of the financial asset or liability to the gross accounting value of a financial asset (that is, its amortized cost before any impairment provision) or the amortized cost of a financial liability. The calculation includes transaction costs, premium or discounts and interest rates paid or received that are parties of the effective interest rate, such as origin rates.
1. Changes in the financial assets and liabilities
i. Financial assets
If the terms of a financial asset are modified, the Bank assess if the its cash flows are substantially different. If the cash flows are substantially different, the contractual rights to the cash flows of the original financial asset are considered matured. In this case, the original financial asset is written-off and a new financial asset is recognized at fair value.
If the cash flow of the modified asset measured at amortized cost are not substantially different, the modification does not result in the write-off of the financial asset. In this case, the Bank recalculates the gross accounting value of the financial asset and recognizes the value derived from the adjustments to the accounting value as gain or loss from the modification in the income statement. If a modification of this nature is made due to financial difficulties of the debtor, gains or losses are presented in conjunction with impairment losses. In other cases, they are presented as interest income.
Interest income
The interest income is calculated applying the effective interest rate to the gross book value of the financial assets, except:
(a) Impaired financial assets acquired or originated for those which the effective original adjusted interest rate to credit is applied to the amortized cost of the financial asset.
(b) Impaired financial assets acquired or originated, but posteriorly presented a default event (or “stage 3”), for which the interest income is calculatedapplying the effective interest rate to the amortized cost net of provision.
Consolidated Financial Statements - December 31, 2018 24
Equity instruments
Equity instruments are instruments that comply with the definition of equity in the issuer point of view, that is, instruments that do not have contractual obligation of payment and that highlight residual interest in the issuer’s equity. Examples of equity instruments include common shares.
Usually the Bank measures all equity instruments at fair value directly against profit and loss, except in cases where the Bank’s Management chooses, at the moment of the initial recognition, the irrevocable designation as fair value through other comprehensive income. When the Bank’s policy accepts to designate capital investments as FVOCI, when such investments are maintained for other purposes that do not generate investment yield, the fair value gains or losses are recognized in OCI and are not subsequently reclassified to income statement, including when the asset is written off. The impairment losses (and their reversals) are not registered separately from other fair value changes. Dividends, when they represent a yield from such investments, continue to be recognized in the income statement with other yields when the Bank has the right to receive payments.
The gains and losses on equity investments at FVPL are included in the heading “Financial assets at fair value through profit or loss” in the Income Statement.
Financial liabilities
The Bank writes-off a financial liability when its terms are modified, and the cash flows are substantially different. In this case a new financial liability is recognized at fair value based in the modified terms. The difference between the book value of the extinct financial liability and the new financial liability with modified terms is recognized in the income statement.
Offset
The financial assets and liabilities are offset, and the net value presented in the financial statement when, and only when, the Bank currently has the right to legally offset the amounts and the intention to settle them together or realize the asset and liability simultaneously.
Incomes and expenses are presented offset only when it is allowed by IFRS rules or for gains or losses derived from similar group of operations, as in the Bank’s trading activity.
ii. Fair value measurement
The “fair value” corresponds to the price that would be received in the sale of an asset or payment of a liability in a transaction organized between participants of the market at the date of measurement in the main market or, in its absence, in the most advantageous market which the Bank has access at that date. The fair value of a liability reflects its risk of default.
When it is available, the Bank measures the fair value of an instrument based on the price quoted in an active market for that instrument. The market is considered active if the operations regarding the asset or liability occurred regularly and with volume enough to provide information about prices in a continuous way.
If there is no quoted price in an active market, the Bank uses evaluation techniques to maximize the use of relevant observable information and minimize the use of non-observable information. The technique chosen includes all factors that would be considered by the market participants in the pricing of an operation.
The best evidence of the fair value of a financial instrument, at the initial recognition, correspond to the regular price of operation – that is, the fair value of the consideration paid or received. If the Bank determines that the fair value, at the initial recognition, differs from the operation price and the fair value is not a quoted price in an active market for an identical asset or liability nor based on an evaluation technique in which non-observable information are considered irrelevant related to the measurement, the financial instrument will be initially measured at fair value, adjusted to defer the difference between the fair value at the initial recognition and the operation price. This difference is subsequently reorganized in the income statement properly based on the instrument lifetime, but not before the evaluation is fully supported by observable market information or the operation becomes closed.
If an asset or liability measured at fair value has a purchase or sale price, the Bank measures its assets and long positions at the purchase price and the liabilities and short positions at the sale price.
The fair value of an on demand resource financial liability (demand deposit, for example) is not inferior to the value to pay on demand, discounted from the date that the payment could be required.
iii. Impairment
The Bank registers impairment provisions of credit expected related to the following financial instruments not measured at fair value through profit and loss:
• financial assets that are debt instruments;
• lease payments receivable;
• issued financial warranties contracts; and
• issued loan commitments.
No impairment loss is registered for equity instruments.
The Bank measures the loss allowance at a value equal to credit losses during the lifetime, except for the following instruments, for which are registered 12-month expected credit losses:
• debt instruments that present low credit risk at the closing date; and
• other financial instruments (except amounts lease payments receivable) in which the credit risk did not substantially increase since their initial recognition.
The allowance for losses on lease operations are always measured at the value equal to the expected credit loss during their lifetime.
iv. Measurement of expected credit losses
The expected credit losses are a weighted estimate of credit loss probability. They are measured as follows:
• financial assets not subjected to impairment at the closing date: as the present value of all cash insufficiencies that is, the difference between the cashflows due and the cash flows that the Bank expects to receive;
Consolidated Financial Statements - December 31, 2018 25
• financial assets subjected to impairment at the closing date: as the difference between the gross book value and the present value of estimate cash flows;
• loan commitments to be released: as the present value of the difference between the contractual cash flows due for the Bank in case of the totally usage of the commitment and the cash flows that the Bank expects to receive; and
• financial warranty contracts: expected payments to reimburse the owner deducted by the amount that the Bank expects to recover.
v. Modified assets
If the terms of a financial asset are not renegotiated or modified or an existing financial asset is replaced by a new asset due to financial difficulties of the debtor, it is necessary to evaluate if the financial asset should be written-off and the expected credit losses are measured as follow:
• If the expected restructuring results in the write-off of the existing asset, the expected cash flows coming from the modified financial asset are included in the calculation of the cash flow insufficiency of the existing asset.
• If the expected restructuring does not result in the write-off of the existing asset, the expected fair value of the new asset is treated as final cash flow of the existing financial asset at the moment its writte-off.
This amount is included in the calculation of cash insufficiency discounted from the estimate date of write-off until the closing date, using the original effective interest rate of the existing financial asset.
vi. Determining significant increases in credit risk
At each financial statement reporting date, the Bank evaluates whether the financial assets measured at amortized cost and the debt financial instruments measured at fair value through other comprehensive income are subjected to impairment, as others financial instruments subject to such assessment.
.
A financial asset is “subjected to impairment” when one or more events which impact negatively the future cash flows estimate of the financial asset occurs.
The evidence that a financial asset is subject to impairment includes the following observable information:
• significant financial difficulty of the debtor or issuer;
• delays of its contractual obligations;
• breach of contract, like default or delay;
• the restructuring of a loan or advance by the Group in conditions that the Group does not consider as interesting to evaluate;
• the probability that the debtor goes bankrupt or in a financial reorganization; or
• the disappearance of an active market for securities due to financial difficulties.
A financial instrument that has been renegotiated due to the financial deterioration of the borrower is generally considered as subject to impairment unless there might be an evidence that the risk of not receiving the contractual cash flow has been significantly reduced and there is no other impairment indicator.
vii. Presentation of expected credit losses in the financial statements
The allowance for expected credit losses is presented in the financial statements as follow:
• financial assets measured at amortized cost: as a deduction on the gross book amount of the assets;
• loans commitments and financial warranty contracts: generally, as a provision; and
• debt instruments measured at fair value through other comprehensive income: no loss provision is registered in the financial statements, because the book amount of such assets corresponds to the fair value.
viii. Impairment objective evidence
In each closing date, the Bank evaluates the existence of the objective evidence that the financial assets not measured at fair value through profit and loss become impaired. A financial asset or group of financial assets are impaired when objective evidences have shown that the event of loss occurred after the asset’s initial recognition and the event of loss impacted the asset’s future cash flows that could be estimated safely.
Objective evidences that the financial assets are impaired include:
• significative financial difficulty of a debtor or issuer;
• default or arrears by a debtor;
• the restructuring of a loan or advance by the Bank in conditions the Bank would not consider as interesting to evaluate;
• indication that a debtor or issuer could go bankrupt;
• the disappearing of an active market for a financial asset; or
• observable information related to a group of assets, such as changes in the payment status from the borrowers or issuers in the group, or economic conditions correlated to the group’s default.
Loans that has been renegotiated due to the financial deterioration of the borrower is generally considered as impaired unless there might be an evidence that the risk of not receiving the contractual cash flow has been significantly reduced and there is no other impairment indicator.
All loans and advances and investment securities at amortized cost, individually significant were submitted to an impairment test. Loans and advances and investment securities at amortized cost not considered as individually significant were collectively submitted to the impairment test through the grouping of loans and advances and investment securities at amortized cost with similar characteristics of credit risk.
ix. Individual or collective evaluation
An individual impairment measurement was based on the Management’s best estimate of the cash flows present value expected to receive. When estimating these cash flows the Management uses its judgment related to the financial situation of a debtor and to the net realizable value of any underlying collateral. Each impaired asset was evaluated in terms of their merits, since the test strategy and the cash flows estimated considered recoverable were approved by Credit Risk.
When assessing a need for collective allowance for losses, Management considered factors such as credit quality, portfolio size, concentration and economic factors. In order to estimate the provision needed, assumptions were established to define how the inherent losses were modeled and to determine the parameters of necessary information, based on the historic experience and current economic conditions.
Consolidated Financial Statements - December 31, 2018 26
x. Impairment measurement
The impairment losses for assets measured at amortized cost were calculated as the difference between the book value and the present value of the future cash flow estimated, discounted by the asset’s original effective interest rate. The impairment losses for asset classified as available for sale by the other comprehensive income were calculated as the difference between the book value and the fair value.
xi. Impairment reversal
For asset measured at amortized cost: If an event occurred after the impairment caused the reduction in the impairment loss value, the reduction will be reverted in the income statement.
For securities classified as available for sale by the other comprehensive income: If, in a subsequent period, the fair value of a debt security impaired has increased and this event can be reliably linked to an event occurred after the impairment recognition, the impairment loss value reduced was reverted in the income statement; otherwise, any increase in the fair value is recognized in the other comprehensive income.
Any subsequent recovery of the equity instrument fair value classified as available for sale and reduced by impairment was recognized at any time in other comprehensive income.
The conciliation of stockholders' equity resulting from the initial adoption of IFRS 9 is as follows:
Equity conciliation |
|
|
|
Equity before IFRS 9 adjustments - 12/31/2017 | 87,087,601 |
Allowance for loan losses | (2,149,051) |
Provision for contingent liabilities | (674,513) |
Re-measurement of assets arising from the new categories | 17,806 |
Others | 237,867 |
Deferred tax | 1,026,066 |
Equity after IFRS 9 adjustments - 1/01/2018 | 85,545,776 |
2. Designation at fair value through profit and loss
i. Financial Assets
At the initial recognition, the Bank has determined specific financial assets to be measured at fair value through profit or loss, once this determination quits or significantly decreases an accounting mismatch that could occur.
3. Values of expected credit losses
Information, assumptions and techniques used in the impairment estimate
i. Classification of financial instruments by stages
The financial instruments portfolio subject to impairment is divided by three levels, based on the stage of each instrument related to credit risk level:
- Stage 1: It is understood that a financial instrument in this phase has not a significant increase in its risk since the initial recognition. The provision for this asset represents the expected loss resulting from possible non-compliance during the next 12 months from the report date;
- Stage 2: If it is identified a significant increase in the risk since the initial recognition, without materializing deterioration, the financial instrument will be framed within this stage. In this case, the value related to the provision for expected default losses reflects the estimate loss of the financial instrument residual life. For the evaluation of the significant increase of credit risk, quantitative indicators used in the regular management of credit risk will be used, as well as other qualitative variables, such as the indication of an operation not impairment if it is considered as refinancing operations or operations included in a special agreement; and
- Stage 3: A financial instrument is registered in this stage when it shows effective deterioration signals as a result from one or more events already occurred and that materialize them in a loss. In this case, the value referred to the provision for losses reflected the expected losses by credit risk during the expected residual life of the financial instrument.
ii. Impairment estimate methodology
The expected loss measurement is made through the following factors:
- Exposure at Default (EAD): is the amount of the transaction exposed to credit risk including the ratio of current outstanding balance exposure that could be provided at default. Developed models incorporate hypotheses considering possible modifications in the payment schedule.
- Probability of Default (PD): is the likelihood that a counterparty will fail to meet its obligation to pay principal or interest. For the purposes of IFRS 9, this will consider both PD-12 months, which is the probability of the financial instrument entering default within the next 12 months, and also lifetime PD, which is the probability of the transaction entering into default between the reporting date and the transaction’s residual maturity date. Future information of relevance is considered to be needed to estimate these parameters, according to the standard.
- Loss Given Default (LGD): is the loss produced in the event of default. In other words, this reflects the percentage of exposure that could not be recovered in the event of a default. It depends mainly on the collateral, which is considered as credit risk mitigants associated with each financial asset, and the future cash flows that are expected to be recovered. According to the standard, forward-looking information must be taken into account in the estimation.
- Discount rate: the rate applied to the future cash flows estimated during the expected life of the asset, and which is equal to the net present value of the financial instrument at its carrying value.
Consolidated Financial Statements - December 31, 2018 27
In order to estimate the above parameters, the Bank has applied its experience in developing internal models for parameters calculation both for regulatory and management purposes.
iii. Default definition
The Bank considers that a financial asset is defaulted when:
• it is likely that the debtor will not fully pay its credit obligations to the Bank; or
• the debtor has significant credit obligations to the Bank overdue for more than 90 days as a general rule.
Overdrafts are considered overdue if the client violates a recommended limit or has been granted a lower limit than the current outstanding amount.
When assessing whether a debtor is in default, the Bank considers indicators:
• qualitative - for example, violations of restrictive clauses (covenants);
• quantitative - for example, status of past due and non-payment of another obligation of the same issuer to the Bank; and
• based on information collected internally and obtained from external sources.
iv. Allowance for losses
The following tables present the reconciliations of the opening and closing balances of the provision for losses by category of financial instrument. The terms expected credit losses in 12 months, expected credit losses during the useful life and impairment losses are explained in the accounting practices note. The comparative values for 12/31/2017 represent a provision for loan losses and reflect the measurement basis in accordance with IAS 39.
R$ millions | Total |
Allowance for loan losses - Balance 12/31/2017 | 18,261,638 |
Allowance for guarantees - Balance 12/31/2017 | 312,373 |
IAS 39 Balance at 12/31/2017 | 18,574,011 |
Initial adoption effect of IFRS 9 (Note 1.2i) | 2,823,564 |
IFRS 9 Balance at 01/01/2018 | 21,397,575 |
As of January 1, 2018, the Allowance for Loan Losses balance related to IFRS 9 segregated by stages was represented by: Stage 1 – 20%, Stage 2 – 15% and Stage 3 – 65%. There was no significant changes on the segregation for December 31, 2018 (note 9.c).
4. Financial assets and liabilities
A. Classification of financial assets and liabilities at the initial adoption of IFRS 9
The table below shows the financial assets classified in accordance with IAS 39 and the new measurement categories in accordance with IFRS 9.
IFRS 9 adoption first adoption effects on the Financial Assets and Liabilities (In R$ Millions) |
| Original classification in accordance with IAS 39 | Balance 12/31/2017 | Reclassifications | Remeasurement | Balance |
| New classification in accordance with IFRS 9 | |
Financial Assets | IAS 39 |
| Loans and receivables | 355,246,574 | 354,317,416 | - | 354,317,416 |
| Measured at Amortized cost |
| 492,429 | 5,197 | 497,626 |
| Measured Mandatorily Measured At Fair Value Through Profit Or Loss | ||||
| 436,729 | (7,179) | 429,550 |
| Measured at Fair value through other comprehensive income | ||||
| Available-for-sale | 85,823,384 | 4,762,234 | 3,791 | 4,766,025 |
| Measured at Amortized cost | ||
| 79,954,513 | - | 79,954,513 |
| Measured at Fair value through other comprehensive income | ||||
| 1,106,637 | 15,997 | 1,122,634 |
| Measured at Fair value through profit and loss | ||||
| Held to maturity investments | 10,214,454 | 10,214,454 | - | 10,214,454 |
| Measured at Amortized cost | ||
| Held for trading | 86,271,097 | 86,271,097 | - | 86,271,097 |
| Measured at Fair value through profit and loss Held For Trading | ||
| Other financial assets measured at fair value through profit and loss | 1,692,057 | 1,692,057 | - | 1,692,057 |
| Measured at Fair value through profit and loss | ||
Total (1) |
| 539,247,566 | 539,247,566 | 17,806 | 539,265,372 |
|
| ||
(1)Does not include Provision for Losses on contingent liabilities and commitments.
|
|
|
|
|
|
|
|
|
|
|
|
|
|
IFRS 9 adoption first adoption effects on the Financial Assets and Liabilities (In R$ Millions) |
| Original classification in accordance with IAS 39 | Balance 12/31/2017 | Reclassifications | Remeasurement | Balance |
| New classification in accordance with IFRS 9 | |||||
Financial liabilities | IAS 39 |
| Held for trading | 49,322,546 | - | - | 49,322,546 |
| Measured At Fair Value Through Profit Or Loss Held For Trading | ||||
| Amortized cost | 478,880,704 | - | - | 478,880,704 |
| Measured at Amortized cost | ||||||
Total |
| 528,203,250 | - | - | 528,203,250 |
|
| ||||||
Consolidated Financial Statements - December 31, 2018 28
Revenue from Customers Contracts
• IFRS 15 - Revenue from Contracts with Customers: The standard was issued in May 2014 and applies to an annual reporting period beginning on January 1, 2018. This standard specifies how and when an entity will recognize revenue as well as requiring such entities to provide users of financial statements with more informative, relevant disclosures. The standard provides five basic principles to be applied to all contracts with customers, which are: i) identify the contract with the customer; ii) identify the implementing obligations under the contract; iii) determine the transaction price; iv) allocate the transaction price to performance obligations; and v) recognize revenue at the moment (or the extent to which) the entity carrying out an obligation of execution.
• The IFRS 15’s basic principle consists in the fact that an entity recognizes revenues to describe the transference of products or services rendered to clients using the value that reflects the consideration which the entity expects to receive in return of such products or services rendered.
•After the analysis on the commissions/fees applied by the Banco Santander versus the IFRS 15 concepts, it was possible to conclude that there were no significant impact on the revenues current recognized, from the adoption of new norm on January 1, 2018.
Annual Improvements of IFRS
IAS 12 - Income Taxes - The issue relates to the presentation of income tax consequences of payments on, and issuing costs of, financial instruments that are classified as equity, whether an entity recognizes the relevant income tax consequences directly in equity or in profit or loss.
IAS 23 - Borrowing Costs - Clarify whether an entity transfers specific borrowings to the general borrowings pool once the construction of a qualifying asset is complete.
Standards and interpretations that will come into force after December 31, 2018
At the date of preparation of these consolidated financial statements, the following standards and interpretations which effectively will come into force after December 31, 2018 and had not yet been adopted by the Bank are:
• IFRS 16 – Leasing contracts – Issued in January 2016 by IASB with the mandatory enforcement date since January 1st, 2019. As permitted by the specific transition provisions, Banco Santander will apply the standard retrospectively modified.
The Bank has conducted internal evaluation and concluded that the application of the regulations has the following effects:
·The adoption of IFRS 16 will require changes in the Bank's accounting policies and will impact the recognition, measurement and presentation of certain balances recognized in the income statement and in the Financial Statement.
·Banco Santander will choose to present the right of use assets as part of tangible assets and lease liabilities as other liabilities in the Financial Statement.
·Banco Santander does not have rights-of-use assets that fall within the definition of investment properties.
The Bank leases several real estate and equipment. Predominantly, the lease contracts are carried out for fixed periods of about 5 years, however they may include extension options, as described below. The terms of the leases are negotiated individually and contain a wide range of different terms and conditions. Lease agreements do not contain restrictive clauses, but leased assets cannot be used as collateral for loans.
Estimates of time limits may vary according to contractual conditions, considering extension options, and also according to legal provisions. The Bank assumes that the fines for contractual termination charged before the maturity date does not compose a significant portion.
Leases are as a right of use asset and a corresponding liability is the data on which the rent is made available for use by the Group. The lease asset, recorded by the right of use, must be subsequently measured using the cost method. Interest rates decrease and are corrected by some remeasurement of liabilities. The liability, however, is developed by interest analysis and decreased by the amounts paid, with the respective counterparties in the income statement. Interest is calculated by applying an interest rate on the remaining liability balance.
In the first application of this standard, the Bank will use the following relevant items for payment:
·The exclusion of initial direct costs for the measurement of the right to use asset on the date of initial application;
·It was decided not to separate the service rendering component embedded in leasing contracts; and
·The Bank also decided not to apply IFRS 16 to contracts that were not identified as containing a lease under IAS 17 and IFRIC 4 - Determination as to whether a Contract contains a Lease.
In addition, the following recognition exemptions will be adopted:
·Accounting for operating leases with a remaining term of less than 12 months as of January 1, 2019 as short-term leases;
·Accounting for operating leases whose underlying asset is of low value;
Until 2018, leases of fixed assets, in which the Bank, as lessee, held substantially all the risks and benefits of the property were classified as finance leases. The balances presented are immaterial.
In adopting IFRS 16, the Bank will recognize lease liabilities involving leases that have already been classified as "commercial leases" in accordance with the principles of IAS 17 - Leases. These liabilities will be measured at the present value of the remaining lease payments as discounted through the lessee's incremental loan rate on January 1, 2019. The rate used to discount the portfolio was based on the funding cost without directing (of free credits), applied individually to each contract, according to projected estimates. The weighted average rate applied to lease liabilities on January 1, 2019 will be 8.11% p.y, with an estimated effect of the initial adoption is approximately R$2.4 billion in Tangible Assets - For Own Use and Financial Liabilities at Amortized Cost - Other Financial Liabilities .
• IFRS 17 - In May 2017, the Board issued the IFRS for insurance contracts to replace IFRS 4. IFRS 17 is implemented as of January 1, 2021. Thisstandard is intended to demonstrate greater transparency and useful information in the financial statements, one of the main changes being the recognition of profits as the delivery of insurance services, in order to evaluate the performance of insurers over time. Since the implementation will be in 2021, the Management is still evaluating the possible impacts arising from the adoption of the new standard.
Consolidated Financial Statements - December 31, 2018 29
• IFRIC 23 - Published in June 2017 by the IASB, IFRIC 23 Uncertainty on the Treatment of Taxes on Profit has mandatory application as from January 1, 2019 and aims to clarify the procedures for applying the recognition and measurement requirements established in the IAS 12 of Taxes on Profit when there is uncertainty about the treatments to be adopted for the Taxes on Profit.
c.2) Estimates used
The consolidated results and the determination of consolidated equity are influenced by the accounting policies, assumptions, estimates and measurement methods used by the management of the Bank in preparing the consolidated financial statements. The Bank makes estimates and assumptions that affect the reported amounts of assets and liabilities of future periods. All estimates and assumptions required, in conformity with IFRS, are best estimates undertaken in accordance with the applicable standard.
In the consolidated financial statements estimates were made by the management of the Bank and of the consolidated entities in order to quantify certain assets, liabilities, revenues, expenses, and disclosure notes.
c.2.1) Critical estimates
The estimates and critical assumptions that have the most significant impact on the carrying amounts of certain assets, liabilities, revenues and expenses and the disclosure notes, are described below:
i. Allowance for loan losses
The carrying amount of impaired financial assets is adjusted by recording a provision for losses on debts of "Impairment Losses on Financial Assets (Net) - Financial Assets Measured At Amortized Cost" in the consolidated income statement. The reversal of previously recorded losses is recognized in the consolidated income statement in the period in which the impairment decrease and it can be related objectively to an event of recovery.
To determine the balance of “Provision for Impairment Losses”, Banco Santander first assesses whether there is objective evidence of impairment loss individually for financial assets that are significant, and individually or collectively for financial assets that are not significant.
To measure the impairment loss on loans individually evaluated for impairment, the Bank considers the conditions of the borrower, such as their economic and financial situation, level of indebtedness, ability to generate income, cash flow, management, corporate governance and quality of internal controls, payment history, industry expertise, contingencies and credit limits, as well as characteristics of assets, such as its nature and purpose, type, sufficiency and liquidity level guarantees and total amount of credit, as well as based on historical experience of impairment and other circumstances known at the moment of evaluation.
To measure the impairment loss on loans collectively evaluated for impairment, the Bank segregates financial assets into groups considering the characteristics and similarity of credit risk, in other words, according to segment, the type of assets, guarantees and other factors associated as the historical experience of impairment and other circumstances known at the time of assessment.
For further details see Note 2.i.
ii. Income taxes (IRPJ), Social Contribution (CSLL), Social Integration Program (PIS) and Tax for Social Security Financing (COFINS)
The current income tax expense is calculated by sum of the Current Tax, Social Contribution, Pis and Cofins resulting from application of the appropriate tax rate to the taxable profit for the year (net of any deductions allowable for tax purposes), and of the changes in deferred tax assets and liabilities recognized in the consolidated income statement.
Deferred tax assets and liabilities include temporary differences, which are identified as the amounts expected to be payable or recoverable on differences between the carrying amounts of assets and liabilities and their related tax bases, and tax loss and tax credit carryforwards. These amounts are measured at the tax rates that are expected to apply in the period when the asset is carried out or the liability is settled. Deferred tax assets are only recognized for temporary differences to the extent that they are considered probable that the consolidated entities will have sufficient future taxable profits against which the deferred tax assets can be utilized, and the deferred tax assets do not arise from the initial recognition (except in a business combination) of other assets and liabilities in a transaction that affects neither taxable profit or accounting profit. Other deferred tax assets (tax loss and tax credit carryforwards) are only recognized if it is considered probable that the consolidated entities will have sufficient future taxable profits against which they can be utilized.
The deferred tax assets and liabilities recognized are reassessed at each financial statement date in order to ascertain whether they still exist, and the appropriate adjustments are made on the basis of the findings of the assessment performed. Under the current regulation, the expected tax credits carrying out is based on the Bank's projections of future results and based on technical study.
For more details see note 2.aa.
iii. Fair value measurement of certain financial instruments
Financial instruments are initially recognized at fair value, which is considered equivalent to the transaction price and those that are not measured at fair value through income statement are adjusted by the transaction costs.
Financial assets and liabilities are subsequently measured at each period-end by using valuation techniques. This calculation is based on assumptions, which take into consideration management's judgment based on existing information and market conditions at the date of financial statements.
Banco Santander classifies fair value measurements using a fair value hierarchy that reflects the model used in the measurement process, segregating financial instruments between Level I, II or III.
Consolidated Financial Statements - December 31, 2018 30
Notes 2.e & 47.c8 present the sensitivity analysis and accounting policies for Financial Instruments, respectively.
iv. Provisions for pensions
The defined benefit plans are recorded based on an actuarial study, conducted annually by specialized company, at the end of each year to be effective for the subsequent period and the effects of such study are recognized in the headings of the income statement "Interest expense and similar Charges" and "Provisions (net)", during the current period.
The present value of the defined benefit obligation is the present value without any assets deductions of expected future payments required to settle the obligation resulting from employee service in the current and past periods.
Notes 2.x & 22.iii present the accounting policies for Post-employment benefits and sensitivity analysis, respectively.
v. Provisions for judicial and administrative proceedings
Provisions for the lawsuits and administrative proceedings are recorded when their risk of loss are considered probable and the amounts can be reliably measured, based on the nature, complexity and history of lawsuits and the opinion of legal counsel internal and external.
vi. Goodwill
The goodwill recorded is subject to impairment test at least annually or in a short period, if there is any indication of impairment.
The recoverable goodwill amounts are determined from value in use calculations. For this purpose, it is estimated the cash flow for a period of 5 years. The cash flow was prepared considering several factors, including: (i) macro-economic projections, such as interest rates, inflation and exchange rates, among other, (ii) the performance and growth estimates of the Brazilian financial market, (iii) increased costs, returns, synergies and investment plans, (iv) the behavior of customers, and (v) the growth rate and long-term adjustments to cash flows. These estimates rely on assumptions regarding the likelihood of future events, and changing certain factors could result in different outcomes. The estimate of cash flows is based on valuations prepared by independent research company or whenever there is evidence of impairment, which is reviewed and approved by the Executive Board.
For additional details see note 13.
c.3) Capital management
Capital management considers the regulatory and economic information. The objective is to achieve an efficient capital structure in terms of cost and compliance, meeting the requirements of the regulatory body and contributing to achieve the goals of the classification of rating agencies and investors' expectations. The capital management includes securitization, assets disposal, raising capital through issue of shares, subordinated debts and hybrid instruments.
From an economic standpoint, capital management seeks to optimize value creation at the Bank and at its different business segment. To this end, the economic capital, RORAC (return on risk-adjusted capital) and value creation data for each business segment are generated, analyzed and reported to the management committee on a quarterly basis. Within the framework of the internal capital adequacy assessment process (Pillar 2 of the Basel Capital Accord), the Group uses an economic capital measurement model with the objective of ensuring that there is sufficient capital available to support all the risks of its activity in different economic scenarios, with the solvency levels agreed upon by the Bank.
In order to adequately manage the Bank’s capital, it is essential to estimate and analyze future needs, in anticipation of the various phases of the business cycle. Projections of regulatory and economic capital are made based on financial projections (statement of financial position, income statement, etc.) and on macroeconomic scenarios estimated by the Economic Research Service. These estimates are used by the Bank as a reference to plan the management actions (issues, securitizations, etc.) required to achieve its capital targets.
2.Accounting policies and method of measurement
The accounting policies and method of measurement applied in preparing the consolidated financial statements were as follows:
a) Foreign currency transactions
The financial statements are presented in Brazilian Reais, the functional and reporting currency of Banco Santander and its subsidiaries.
The assets and liabilities and foreign subsidiary are converted to Real as follows:
- Assets and liabilities are translated at the exchange rate at the balance sheets date.
- Revenues and expenses are translated at the monthly average exchange rates.
- Gain and losses on translation of net investment are recorded in the statement of comprehensive income, in “exchange rate of investees located abroad”.
b) Basis of consolidation
i. Subsidiaries
“Subsidiaries” are defined as entities over which the Bank has control. Control is based on whether the Bank has: i) power over the investee; ii) exposure, or rights, to variable returns from its involvement with the investee; and iii) the ability to use its power over the investee to affect the amount of the returns, as set forth in the law, the Bylaws or agreement.
Consolidation of a subsidiary begins when the Bank obtains control over the subsidiary and ceases when the Bank loses control of the subsidiary. Specifically, income and expense of a subsidiary acquired or disposed during the year are included in the consolidated income statement and other comprehensive income from the date the Bank gains controls until the date when the Bank ceases to control the subsidiary.
Consolidated Financial Statements - December 31, 2018 31
Profit or loss and each component of Other Comprehensive Income are attributed to the owners of the Bank and to the non-controlling interests even if the effect is attributed to non-controlling interests. Total comprehensive income of subsidiaries is attributed to the owners of the Bank and to the non-controlling interest even if this generates a negative balance for non-controlling interests. All transactions, balances, income and expenses between the companies of the Santander Group are eliminated in the consolidated financial statements.
Changes in the Santander Group’s interest in a subsidiary that do not result in loss of control are registered as equity transactions. Any difference between the amount by which the non-controlling interests are adjusted and the fair value of the consideration paid or received is recognized directly in equity and attributed to owners of the Company.
When the Bank loses control of a subsidiary, the profit or loss on disposal is calculated as the difference between (i) the aggregate fair value of the consideration received and the fair value of any retained interest and (ii) the previous carrying amount of the assets (including goodwill), and liabilities of the subsidiary and any non-controlling interests. Amounts previously recognized in other comprehensive income in relation to the subsidiary are registered (i.e. reclassified to income statement or transferred directly to retained earnings) in the same manner as it would be required if the relevant assets or liabilities are disposed of. The fair value of any investment retained in the former subsidiary at the date when control got lost is considered as the fair value on initial recognition for subsequent accounting under IAS 39 Financial Instruments: Recognition and Measurement or, when applicable, the costs on initial recognition of an investment in an associate or jointly controlled entity.
ii. Interests in joint ventures (jointly controlled entities) and associates
Joint ventures mean interests in entities that are not subsidiaries but which are jointly controlled by two or more unrelated entities. This is evidenced by contractual arrangements whereby two or more entities (“ventures”) acquire interests in entities (jointly controlled entities) so that strategic financial and operating decisions affecting the joint venture require the unanimous consent of the ventures.
Associates are entities over which the Bank is in a position to exercise significant influence (significant influence is the power to participate in the financial and operating decisions of the investee) but it does not control or has joint control over the investee.
In the consolidated financial statements, interest in joint ventures and investments in associates are registered using the equity method, i.e. at the Bank’s share of net assets of the investee, after taking into consideration the dividends received from capital reductions and other related transactions. Relevant information regarding companies registered under the equity method by the Bank is provided in note 11.
iii. Business combinations, acquisitions and disposals
A business combination is the combination of two or more separate entities or economic units into one single entity or group of entities and is registered in accordance with IFRS 3 - “Business Combinations”.
Business combinations are carried out so that the Bank obtains control over an entity and are recognized for accounting purposes as follow:
• The Bank measures the cost of the business combination, defined as the fair value of the assets offered, the liabilities incurred and the equity instruments issued, if any.
• The fair values of the assets, liabilities and contingent liabilities of the acquired entity or business, including any intangible assets which might not have been recognized by the acquiree, are estimated at the acquisition date and recognized in the consolidated financial statement.
• The excess of the acquisition cost over the fair value of the identifiable net assets acquired are recognized as goodwill (note 13). The excess of fair value of the identifiable net assets over the acquisition cost is an advantageous purchase gain and it is recorded as income on the date of the acquisition.
The note 3 includes a description of the most significant transaction carried out in 2018, 2017 and 2016.
iv. Investment Funds
These include investment funds in which the Santander Group companies hold a substantial interest or the entirety of the interests and are therefore exposed to, or have rights, to variable returns and have the ability to affect those returns through power over the fund, in accordance with IFRS 10 - Consolidated Financial Statements and are therefore, consolidated in these financial statements.
c) Definitions and classification of financial instruments
i. Definitions
“Financial instrument” is any contract that gives rise to a financial asset of one entity and, simultaneously, to a financial liability or financial interest of another entity.
“Equity instrument” is any agreement that evidences a residual interest in the asset of the issuing entity after deducting all of its liabilities.
“Financial derivative” is a financial instrument whose value changes in response to the change in an observable market variable (such as an interest rate, foreign exchange rate, financial instrument price, market index or credit rating), whose initial investment is zero or very small compared with other financial instruments with a similar response to changes in market factors, and which is settled at a future date.
“Hybrid financial instruments” are contracts that simultaneously include a non-derivative host contract together with a derivative, known as an embedded derivative, that is not separately transferable and has the effect to make part of the cash flow of the hybrid contract vary similar to a stand-alone derivative.
The following transactions are not treated for accounting purposes as financial instruments:
• Investments in subsidiaries, jointly controlled entities and associates (note 3&11).
• Rights and obligations under employee benefit plans (note 22).
Consolidated Financial Statements - December 31, 2018 32
ii. Classification of financial assets for measurement purposes
Financial assets are initially classified into the various categories used for management and measurement purposes, unless they have to be presented as Non-current assets held for sale or they relate to Cash, cash balances at Central Banks and other deposits on demand, Changes in the fair value of hedged items in portfolio hedges of interest rate risk (asset side), Hedging derivatives and Investments, which are reported separately.
Financial assets are included for measurement purposes in one of the following categories:
• Financial Assets Measured At Fair Value Through Profit Or Loss Held For Trading: this category includes the financial assets acquired to generate short-term profit resulting from the fluctuation of its prices and financial derivatives not classified as hedging instruments, whose primary intention of the Bank is to trade them frequently.
• Financial Assets Measured At Fair Value Through Profit Or Loss: this category includes the financial assets that did not meet the pre-established criteria when evaluating the SPPI Test.
• Non-Trading Financial Assets Mandatorily Measured At Fair Value Through Profit Or Loss: this category includes the financial assets that at the time of initial designation was made the fair value option.
• Other Financial Assets At Fair Value Through Profit Or Loss (applicable for comparatives): this category includes hybrid financial assets not held for trading that are measured entirely at fair value and financial assets not held for trading that are included in this category in order to provide more relevant information, either because this eliminates or significantly reduces recognition or measurement inconsistencies (accounting mismatches) that would otherwise arise from measuring assets or liabilities or recognizing the gains or losses on them on different bases, or because a group of financial assets or financial assets and liabilities is managed and its performance is evaluated on a fair value basis, in accordance with a documented risk management or investment strategy, and information about the group is provided on that basis to the Group's key management personnel.
Financial instruments included in this category (and “Other financial liabilities at fair value through profit or loss”) are permanently subject to a consistent system of measurement, manage and control of all risks and returns that enables all the financial instruments involved to be identified and monitored and allows the effective reduction of risk checked. Financial assets may only be included in this category on the date they are acquired or originated.
• Financial Assets Measured At Fair Value Through Other Comprehensive Income: are stated at fair value. This category does not include debt instruments classified as “Held-to-maturity investments” or “Financial assets at fair value through profit or loss”, and equity instruments issued by entities other than subsidiaries, associates and jointly controlled entities, provided that such instruments have not been classified as “Financial assets held for trading” or as “Other financial assets at fair value through profit or loss”.
The results rising from changes in fair value are recognized at the Financial Assets Measured At Fair Value Through Other Comprehensive Income line in the Shareholders´ equity except for cumulative impairment losses which are recognized in statement of profit or loss. When the investment is sold or has evidences of decreases on the fair value due to impairment, the previously recognized result at the same Shareholders´ Equity line, mentioned above is reclassified to the statement of profit or loss.
• Financial Assets Measured At Amortized Cost: this category includes financing granted to third parties, based on their nature, irrespective of the type of borrower and the form of financing, including finance lease transactions in which the consolidated entities act as lessors. The consolidated entities generally intend to hold the loans and credits granted by them until their final maturity and, therefore, they are presented in the consolidated balance sheets at their amortized cost (which includes the required adjustments to reflect estimated impairment losses).
• Held-to-maturity investments(applicable for comparatives): this category includes debt instruments traded in an active market, with fixed maturity and with fixed or determinable payments, for which the Bank has both the intention and proven ability to hold to maturity. These investments are measured at amortized cost less any impairment, with revenue recognized on an effective yield basis.
iii. Classification of financial assets for presentation purposes
Financial assets are classified by nature into the following headings in the consolidated financial statements:
• Cash and balances with the Bacen: cash balances and balances receivable on demand relating to deposits with Bacen and credit institutions.
• Financial Assets Measured At Amortized Cost: includes the debit balances of all credit and loans granted by the Bank, other than those represented by securities, as well as finance lease receivables and other debit balances of a financial nature in favor of the Bank, such as checks drawn on credit institutions, balances receivable from clearing houses and settlement agencies for transactions on the stock exchange and organized markets, bonds given in cash, capital calls, fees and commissions receivable for financial guarantees and debit balances arising from transactions not originating in banking transactions and services, such as the collection of rentals and similar items.
• Loans and other amounts with credit institutions: credit of any nature in the name of financial institutions.
• Loans and advances to clients: includes debit balances of all the remaining credit and loans granted by the Bank, including money market operations through centralized counterparties.
• Debt instruments: bonds and other securities that represent a debt for their issuer, that generate an interest return, and that are in the form of certificates or book entries.
• Equity instruments: Financial instruments issued by other entities, such as shares, which have the nature of equity instruments for the issuer, other than investments in subsidiaries, joint ventures or associates. Investment fund units are included in this item.
• Trading derivatives: includes the fair value in favor of the Bank of derivatives which do not form part of hedge accounting.
• Hedging derivatives: includes the fair value in favor of the Bank of derivatives designated as hedging instruments in hedge accounting.
• Investments in associates and jointly controlled companies: includes the investments made in the share capital of associates and jointly controlled companies.
iv. Classification of financial liabilities for measurement purposes
Financial liabilities are classified for measurement purposes into one of the following categories:
• Other Financial Assets At Fair Value Through Profit Or Loss: this category includes financial liabilities incurred for the purpose of generating a profit in the near term from fluctuations in their prices, financial derivatives not designated as hedging instruments, and financial liabilities arising from the outright sale of financial assets acquired under reverse repurchase agreements ("reverse repos") or borrowed (short positions).
• Other Financial Assets At Fair Value Through Profit Or Loss: financial liabilities are included in this category when they provide more relevantinformation, either because this eliminates or significantly reduces recognition or measurement inconsistencies (accounting mismatches) that would otherwise arise from measuring assets or liabilities or recognizing the gains or losses on them on different bases, or because a group of financial liabilities or financial assets and liabilities is managed and its performance is evaluated on a fair value basis, in accordance with a documented risk management or investment strategy, and information about the group is provided on that basis to the Group's key management personnel.
Consolidated Financial Statements - December 31, 2018 33
• Financial liabilities at amortized cost: financial liabilities, irrespective of their instrumentation and maturity, not included in any of the above-mentioned categories which arise from the ordinary borrowing activities carried on by financial institutions.
v. Classification of financial liabilities for presentation purposes
Financial liabilities are classified by nature into the following items in the consolidated financial statements:
• Deposits from Bacen: deposits of any nature received from Bacen.
• Deposits from credit institutions: deposits of any nature, including credit received and money market operations in the name of credit institutions.
• Client deposits: includes deposits of any nature such as demand deposits, saving deposits and time deposits including money market operation received from client.
• Marketable debt securities: includes the amount of bonds and other debt represented by marketable securities, other than subordinated liabilities.
• Trading derivatives: includes the fair value, with a negative balance for the Bank, of derivatives which do not form part of hedge accounting.
• Short positions: includes the amount of financial liabilities arising from the outright sale of financial assets purchased under reverse repurchase agreements or borrowed.
• Subordinated liabilities: amount of financing received which, for the purposes of payment priority, ranks behind ordinary debt. This category also includes the financial instruments issued by the Bank which, although equity for legal purposes, do not meet the requirements for classification as equity.
• Other financial liabilities: includes the amount of payment obligations having the nature of financial liabilities not included in other items, and liabilities under financial guarantee contracts, unless they have been classified as non-performing.
• Hedging derivatives: includes the fair value of the Bank's liability in respect of derivatives, including embedded derivatives separated from hybrid financial instruments, designated as hedging instruments in hedge accounting.
•Equity instruments: financial instruments issued by other entities, such as shares, with the nature of equity instruments for the issuer, except investments in subsidiaries, jointly controlled entities or associates. The shares of non-consolidated investment funds are included in this item.
d) Funding, debt notes issued and other liabilities
Funding debt rates and other liabilities Instruments are recognized initially at fair value, considered primarily as the transaction price. They are subsequently measured at amortized cost and its expenses are recognized as a financial cost.
Among the liabilities initial recognition methods, it is important to emphasize those compound financial instruments which are classified as such due to the fact that the instruments contain both, a debt instrument (liability) and an embedded equity component (derivative).
The recognition of a compound instrument consists of a combination of (i) a main instrument, which is recognized as an entity’s genuine liability (debt) and (ii) an equity component (derivative convertible into ordinary share).
The issue of "Notes" must be registered in specific heading liabilities and updated according to the agreed rates and adjusted by the effect of exchange rate variations, when denominated in foreign currency. All remuneration related to these instruments, such as interest and Exchange variation (difference between the functional currency and the currency in which the instrument was named) shall be registered as expenses for the period, according to the accrual basis.
The relevant details of these issued instruments are described in note 20.
e) Measurement of financial assets and liabilities and recognition of fair value changes
In general, financial assets and liabilities are initially recognized at fair value which, in the absence of evidence to the contrary, is deemed to be the transaction price. Financial instruments not measured at fair value through profit or loss, are adjusted by the transaction costs. Financial assets and liabilities are subsequently measured at each period-end as follows:
i. Measurement of financial assets
Financial assets are measured at fair value, without deduction of estimated costs of transaction that may be incurred on their disposal, except for loans and receivables, held-to-maturity investments, equity instruments whose fair value cannot be determined in a sufficiently objective manner and financial derivatives that have as equity instruments subject and are settled by delivery of those instruments.
The fair value of a financial instrument on a given date is taken to be the price that would be received to sell an asset or paid to transfer a liability in an orderly transaction between market participants. The most objective and common reference for the fair value of a financial instrument is the price that would be paid for it on an active, transparent and deep market (quoted price or market price).
If there is no market price for a given financial instrument, its fair value is estimated on the basis of valuation techniques commonly used by the international financial community, according to the specific features of the instrument to be measured and, particularly, the various types of risk associated with it.
All derivatives are recognized in the balance sheets at fair value from the trade date. If the fair value is positive, they are recognized as assets and if thefair value is negative, they are recognized as liabilities. The changes in the fair value of derivatives from the trade date are recognized in “Gains (losses) on financial assets and liabilities” in the consolidated income statement. Specifically, the fair value of standard financial derivatives included in the portfolios of financial assets or liabilities held for trading is deemed to be their daily quoted price and if, for exceptional reasons, the quoted price cannot be determined on a given date, these financial derivatives are measured using methods similar to those used to measure over the counter “OTC” derivatives.
Consolidated Financial Statements - December 31, 2018 34
The fair value of OTC derivatives is taken to be the sum of the future cash flows arising from the instrument, discounted to present value at the date of measurement (“present value” or “theoretical close”) using valuation techniques commonly used by the financial markets: “net present value” (NPV), option pricing models and other methods.
“Financial Assets Measured At Amortized Cost” and “Held-to-maturity investments” are measured at amortized cost using the effective interest method. “Amortized cost” is the acquisition cost of a financial asset or liability plus or minus, as appropriate, the principal repayments and the cumulative amortization (taken to the income statement) between the difference of the initial cost and the maturity amount. In the case of financial assets, amortized cost furthermore includes any reductions for impairment or uncollectibility. In the case of loans and receivables hedged in fair value hedges, the changes in the fair value of these assets related to the risk or risks being hedged are recognized.
The “effective interest rate” is the discount rate that exactly matches the initial amount of a financial instrument to all its estimated cash flows of all kinds over its remaining life. For fixed rate financial instruments, the effective interest rate coincides with the contractual interest rate established on the acquisition date plus, where applicable, the fees and transaction costs that, because of their nature, form part of their financial return. In the case of floating rate financial instruments, the effective interest rate coincides with the rate of return prevailing in all connections until the next benchmark interest reset date.
Equity instruments whose fair value cannot be determined in a sufficiently objective manner are measured at acquisition cost adjusted, where appropriate, by any related impairment loss.
The amounts at which the financial assets are recognized represent, in all material respects, the Bank’s maximum exposure to credit risk at each reporting date. Also, the Bank has received collateral and other credit enhancements to mitigate its exposure to credit risk, which consist mainly of mortgage guarantees, cash collateral, equity instruments and personal security, assets leased out under leasing and renting agreements, assets acquired under repurchase agreements and securities loans and derivatives.
ii. Measurement of financial liabilities
In general, financial liabilities are measured at amortized cost, as defined above, except for those included under “Financial Assets Measured At Fair Value Through Profit Or Loss” and “Other financial liabilities at fair value through profit or loss” and financial liabilities designated as hedge items (or hedging instruments) in fair value hedges, which are measured at fair value.
iii. Recognition of fair value changes
As a general rule, changes in the carrying amount of financial assets and liabilities are recognized in the consolidated income statement, distinguishing between those arising from the accrual of interest and similar items -which are recognized under “Interest and similar income” or “Interest expense and similar charges”, as appropriate - and those arising for other reasons, which are recognized at their net amount in the heading “Gains (losses) on financial assets and liabilities (net)”.
Adjustments due to changes in fair value arising from Available-for-sale financial assets are recognized temporarily in equity in then heading “Other Comprehensive Income”. Items charged or credited to this account remain in the Bank’s consolidated equity until the related assets are written-off, whereupon they are charged to the consolidated income statement.
iv. Hedging transactions
The consolidated entities use financial derivatives for the following purposes: i) to provide these instruments to clients who request them in the management of their market and credit risks; ii) to use these derivatives in the management of the risks of the Bank entities' own positions and assets and liabilities (“hedging derivatives”); and iii) to obtain gains from changes in the prices of these derivatives (“financial derivatives”).
Financial derivatives that do not qualify for hedge accounting are treated for accounting purposes as trading derivatives. Financial derivatives that do not qualify for hedge accounting are treated for accounting purposes as trading derivatives.
A derivative qualifies for hedge accounting if all the following conditions are met:
1. The derivative hedges one of the following three types of exposure:
a. Changes in the fair value of assets and liabilities due to fluctuations, among other, in the interest rate and/or exchange rate to which the position or balance to be hedged is subject (“fair value hedge”);
b. Changes in the estimated cash flows arising from financial assets and liabilities, commitments and highly probable forecast transactions (“cash flow hedge”);
c. The net investment in a foreign operation (hedge of a net investment in a foreign operation).
2. It is effective in offsetting exposure inherent in the hedged item or position throughout the expected term of the hedge, which means that:
a. At the date of arrangement the hedge is expected, under normal conditions, to be highly effective (prospective effectiveness).
b. There is sufficient evidence that the hedge was actually effective during the whole life of the hedged item or position (retrospective effectiveness).
3. There must be adequate documentation evidencing the specific designation of the financial derivative to hedge certain balances or transactions andhow this effective hedge was expected to be achieved and measured, provided that this is consistent with the Bank’s management of own risks.
Consolidated Financial Statements - December 31, 2018 35
The changes in value of financial instruments qualifying for hedge accounting are recognized as follows:
a. In fair value hedges, the gains or losses arising on both the hedging instruments and the hedged items (attributable to the type of risk being hedged) are recognized directly in the consolidated income statement.
b. In cash flow hedges, the effective portion of the change in value of the hedging instrument is recognized temporarily in equity under “Other comprehensive Income - Cash flow hedges” until the forecast transactions occur, when it is recognized in the consolidated income statement, unless, if the forecast transactions result in the recognition of non-financial assets or liabilities, it is included in the cost of the non-financial asset or liability. The ineffective portion of the change in value of hedging derivatives is recognized directly in the consolidated income statement.
c. The ineffective portion of the gains and losses on the hedging instruments of cash flow hedges and hedges of a net investment in a foreign operation are recognized directly under “Gains (losses) on financial assets and liabilities (net)” in the consolidated income statement.
If a derivative designated as a hedge instrument no longer meets the requirements described above due to expiration, ineffectiveness or for any other reason, the derivative is classified as a derivative measured at fair value through profit or loss.
When fair value hedge accounting is discontinued (repealed, expired, sold our no longer meet hedge accounting criteria) the adjustments previously recognized on the hedged item are transferred to profit or loss at the effective interest rate re-calculated at the date of hedge discontinuation. The adjustments must be fully amortized at maturity.
When cash flow hedges are discontinued, any cumulative gain or loss on the hedging instrument recognized in equity in the heading "Other comprehensive Income” (from the period when the hedge was effective) remains recognized in equity until the forecast transaction occurs at which time it is recognized in profit or loss, unless the transaction is no longer expected to occur, in which case any cumulative gain or loss is recognized immediately in profit or loss.
For the accounting and disclosure of the hedge accounting structures as of December 31, 2018, the bank used the faculty of IFRS 9, to maintain the practices determined by IAS 39.
f) Settlement of financial assets and liabilities
The accounting treatment of transfers of financial assets depends on the extent to which the risks and rewards associated with the transferred assets are transferred to third parties:
1. If the Bank transfers substantially all the risks and rewards to third parties-unconditional sale of financial assets, sale of financial assets under an agreement to repurchase them at their fair value at the date of repurchase, sale of financial assets with a purchased call option or written put option that is deeply out of the money, securitization of assets in which the transferor does not retain a subordinated debt or grant any credit enhancement to the new holders, and other similar cases, the transferred financial asset is derecognized and any rights or obligations retained or created in the transfer are recognized simultaneously.
2. If the Bank retains substantially all the risks and rewards associated with the transferred financial asset -sale of financial assets under an agreement to repurchase them at a fixed price or at the sale price plus interest, a securities lending agreement in which the borrower undertakes to return the same or similar assets, and other similar cases, the transferred financial asset is not derecognized and continues to be measured by the same criteria as those used before the transfer. However, the following items are recognized:
a. An associated financial liability, for an amount equal to the consideration received; this liability is subsequently measured at amortized cost.
b. The income from the transferred financial asset not derecognized and any expense incurred on the new financial liability.
3. If the Bank neither transfers or retains substantially all the risks and rewards associated with the transferred financial asset - sale of financial assets with a purchased call option or written put option that is not deeply in or out of the money, securitization of assets in which the transferor retains a subordinated debt or other type of credit enhancement for a portion of the transferred asset, and other similar cases, the following distinction is made:
a. If the transferor does not retain control of the transferred financial asset, the asset is derecognized and any rights or obligations retained or created in the transfer are recognized.
b. If the transferor retains control, it continues to recognize the transferred financial asset for an amount equal to its exposure to changes in value and recognizes a financial liability associated with the transferred financial asset. The net carrying amount of the transferred asset and the associated liability is the amortized cost of the rights and obligations retained, if the transferred asset is measured at amortized cost, or the fair value of the rights and obligations retained, if the transferred asset is measured at fair value.
g) Offsetting of financial instruments
Financial asset and liability balances are offset (i.e. reported in the consolidated balance sheets at their net amount) only if the Bank and their subsidiaries currently have a legally enforceable right to set off the recognized amounts and intend either to settle on a net basis, or to realize the asset and settle the liability simultaneously.
Offsetting Agreements and Obligations Settlement (CMN Resolution 3.263/2005) - The Bank has an agreement for the clearing and settlement of obligations under the National Financial System (SFN), signed with individuals and legal entities, whether or not members of the SFN, resulting in higher financial settlement guarantee, with the parties that have this modality of agreement. These agreements establish that payment obligations to Banco Santander arising from credit and derivative operations, in the event of default by the counterparty, will be offset against Banco Santander's payment obligations with the counterparty.
The following table provides details of financial assets and liabilities subject to offsetting at December 31, 2018, 2017 and 2016:
Consolidated Financial Statements - December 31, 2018 36
Thousand of reais |
|
| 2018 |
Assets: | Financial assets, gross | Financial assets | Financial assets |
Derivatives | 18,667,611 | (304,165) | 18,363,446 |
Repurchase agreements | 44,836,491 | - | 44,836,491 |
|
|
|
|
Liabilities: | Financial liabilities, gross | Financial liabilities | Financial liabilities |
Derivatives | 18,771,000 | (304,165) | 18,466,835 |
Repurchase agreements | 101,647,013 | - | 101,647,013 |
|
|
|
|
Thousand of reais |
|
| 2017 |
Assets: | Financial assets, gross | Financial assets | Financial assets |
Derivatives | 17,262,888 | - | 17,262,888 |
Repurchase agreements | 34,505,671 | - | 34,505,671 |
|
|
|
|
Liabilities: | Financial liabilities, gross | Financial liabilities | Financial liabilities |
Derivatives | 16,677,486 | - | 16,677,486 |
Repurchase agreements | 97,421,579 | - | 97,421,579 |
|
|
|
|
Thousand of reais |
|
| 2016 |
Assets: | Financial assets, gross | Financial assets | Financial assets |
Derivatives | 24,702,973 | - | 24,702,973 |
Repurchase agreements | 47,528,393 | - | 47,528,393 |
|
|
|
|
Liabilities: | Financial liabilities, gross | Financial liabilities | Financial liabilities |
Derivatives | 20,236,615 | - | 20,236,615 |
Repurchase agreements | 129,817,727 | - | 129,817,727 |
h) Regular way of financial assets purchases
Regular way of financial assets purchases are recognized on trade date. The assets are settled when the rights to receive cash flows have expired or the Bank has transferred substantially all the risks and rewards of ownership.
i) Impairment of financial assets
i. Definition
A financial asset is considered impaired when there is objective evidence that events have occurred which:
• Give rise to an adverse impact on the future cash flows that were estimated at the transaction date, in the case of debt instruments (loans and debt securities);
• In the case of equity instruments, mean that their carrying amount may not be fully recovered.
Consolidated Financial Statements - December 31, 2018 37
• Arising from the violation of terms of loans, and
• During the Bankruptcy process.
As a general rule, the adjustment of the value of the impaired financial instruments is recognized in the consolidated income statement for the period in which the impairment becomes evident, and the reversal, if any, of previously recognized impairment loss is recognized in the consolidated income statement for the period in which the impairment is reversed or reduced.
ii. Debt instruments carried at amortized cost
The amount of an impairment loss incurred for determination of the recoverable amount on a debt instrument measured at amortized cost is equal to the difference between its carrying amount and the present value of its estimated future cash flows (excluding future credit losses that have not been incurred) discounted the original effective interest rate of the financial asset (or the effective interest rate computed at initial recognition), and is presented as a reduction of the asset balance and recorded in income statements.
In estimating the future cash flows of debt instruments the following factors are taken into account:
• All the amounts that are expected to be obtained over the remaining life of the instrument, in this case, the provided guarantees. The impairment loss takes into account the likelihood of collecting accrued interest receivable.
• The various types of risk to which each instrument is subject; and
• The circumstances in which collections will foreseeably be made.
These cash flows are subsequently discounted using the instrument's effective interest rate.
Specifically in regards to recoverable amount losses resulting from materialization of the insolvency risk of the obligors (credit risk), a debt instrument is impaired due to insolvency when there is evidence of a deterioration of the obligor's ability to pay, either because it is in arrears or for other reasons.
The Bank has certain policies, methods and procedures for covering its credit risk arising from insolvency allocable to counterparties.
These policies, methods and procedures are applied in the granting, in the examination and to document debt instruments, and contingent liabilities and commitments, the identification of their recoverable amount and the calculation of the amounts necessary to cover the related credit risk.
The procedures applied in the identification, measurement, control and reduction of the exposure to credit risk, are based on an individual basis or grouped by similarity.
• Clients with individual management: Wholesale clients, financial institutions and certain companies. Risk management is performed through an analysis complemented by tools to support the decision-making based in internal risk assessment.
• Clients with standardized management: individuals and companies not classified as individual clients. Risk management models based on automated decision-making and risk assessment procedure, complemented, when the model is not comprehensive or accurate enough, by teams of analysts specialized in this type of risk. The credits related to clients standardized, are usually considered not recoverable when they have historical loss experience and delay greater than 90 days.
Regarding the provision for impairment losses from credit risk, the Bank evaluates all loans. Loans are either individually or collectively evaluated for impairment. Loans accounted as amortized cost, which are not individually evaluated for impairment, are collectively evaluated for impairment, grouping them considering the similarity of risk. Loans individually evaluated for impairment are not included in balances that are collectively evaluated for impairment.
The Bank first assesses whether objective evidence of impairment loss individually for financial assets are individually significant, and individually or collectively for financial assets are not individually significant.
To measure the impairment loss on loans individually evaluated for impairment, the Bank considers the conditions of the borrower, such as his economic and financial situation, level of indebtedness, ability to generate income, cash flow , management, corporate governance and quality of internal controls, payment history, industry expertise, contingencies and credit limits, as well as characteristics of assets, such as their nature and purpose, type, sufficiency and liquidity level guarantees and total amount of credit, as well as based on historical experience of impairment and other circumstances known at the moment of evaluation.
To measure the impairment loss on loans collectively evaluated for impairment, the Bank segregates financial assets into groups considering the characteristics and similarity of credit risk, in other words, according to segment, the type of assets, guarantees and other factors associated as the historical experience of impairment and other circumstances known at the time of assessment.
In some cases the observable data required to estimate the amount of an impairment loss on a financial asset may be limited or no longer fully relevant to current circumstances.
In such cases, an entity uses its experienced judgment to estimate the amount of any impairment loss. Similarly an entity uses its experienced judgment to adjust observable data for a group of financial assets to reflect current circumstances.
The impairment loss is calculated by using statistical models that consider the following factors:
Exposure at default (EAD) is the amount of risk exposure at the date of default by the counterparty.
In accordance with IFRS, the exposure at default used for this calculation is the current exposure, as reported in the balance sheets.
• Probability of default, or “PD”, is the probability of the borrower failing to meet its principal and/or interest payment obligations.
PD is measured using a time horizon of one year; that is, it quantifies the probability of the borrower default in the coming year. A loan will be defaulted if either the principal or interest become past due by ninety days or more or the loan is active but there are doubts about the solvency of the counterparty (subjective doubtful assets).
• Loss given default, or “LGD”, is the loss arising in the event of default.
Consolidated Financial Statements - December 31, 2018 38
LGD calculation is based on the net charge offs on defaulted loans, taking into account the guarantees/collateral associated with the loans, the income and expenses associated with the recovery process and the timing of default.
• Loss identification period, or “LIP,” is the time period between the occurrence of a loss event and the identification of an objective evidence of this loss. In other words, it represents the time horizon from the credit loss occurrence until the effective confirmation of such loss.
• In addition, prior to loans be written-off (which is only done after the Bank have completed all recovery efforts and after about 360 days late), it is registered fully provision of the loan´s remaining balance so this provision (allowance for loan losses) fully covers the losses. Thus, the Bank understands that its loan loss allowance methodology has been developed to meet its risk metrics and capture loans that could potentially become impaired.
iii. Debt or equity instruments classified as financial assets measured at fair value through other comprehensive income
The difference between the amortized cost and fair value of debt or equity instruments classified as available for sale are recorded in equity under "Other Comprehensive Income."
When there is objective evidence that the aforementioned differences are due to a prolonged decline in fair value, they are no longer recognized in equity and are reclassified, at the cumulative amount at that date, to the consolidated income statement. Losses from a prolonged decline in fair value relating to an investment in equity instruments are not reversed in subsequent periods.
j) Repurchase agreements
Purchases (sales) of financial instruments under a non-optional resale (repurchase) agreement at a fixed price (repos) are recognized in the consolidated financial statements as financing granted (received), based on the nature of the debtor (creditor), under Loans and advances with Bacen, Loans and advances to credit institutions or Loans and advances to clients (Deposits from Bacen, Deposits from credit institutions or Client deposits).
Differences between the purchase and sale prices are recognized as interest over the deadline of the contract.
k) Accounting for leases
i. Financial leases
Financial leases are leases that transfer substantially all the risks and rewards incidental to ownership of the leased asset to the lessee.
When the consolidated entities act as the lessors of an asset, the sum of the present value of the lease payments receivable from the lessee, including the exercise price of the lessee’s purchase option at the end of the lease term when such exercise price is sufficiently below fair value at the option date such that it is reasonably certain that the option will be exercised, is recognized as lending to third parties and is therefore included under Financial Assets Measured At Amortized Cost in the consolidated financial statements.
The finance income arising from these contracts is credited in the heading “Interest and similar income” in the consolidated income statement in order to achieve a constant rate of return over the deadline of the lease.
l) Non-current assets held for sale
“Non-current assets held for sale” includes the carrying amount of individual items or disposal groups or items forming part of a business unit earmarked for disposal (“Discontinued operations”), whose sale in their present condition is highly probable and is expected to occur within one year, the property or other non-current assets received by the consolidated entities as total or partial settlement of their debtors' payment obligations to them are deemed to be non-current assets held for sale through the completion of actions which normally occurs up to one year.
Non-current assets held for sale are measured at the lower of fair value less costs to sell and their carrying amount at the date of classification in this category. These assets held for sale are not depreciated.
Impairment losses on an asset or disposal group arising from a reduction in its carrying amount to its fair value (less costs to sell) are recognized in the heading “Gains (losses) on disposal and expenses of non-current assets held for sale not classified as discontinued operations” in the consolidated income statement. The gains on a non-current asset held for sale resulting from subsequent increases in fair value (less costs to sell) increase its carrying amount and are recognized in the consolidated income statement up to an amount equal to the impairment losses previously recognized.
m) Residual maturity periods and average interest rates
The analysis of the maturities of the balances of certain items in the consolidated financial statements at December 31, 2018, 2017 and 2016 is provided in note 44-d.
n) Tangible assets
“Tangible assets” includes the amount of buildings, land, furniture, vehicles, computer hardware and other fixtures owned by the Bank, including tangible assets received by the Bank in full or partial satisfaction of financial assets representing receivables from third parties which are intended to be held for continuing use and tangible assets acquired under finance leases are presented at acquisition cost, less the related accumulated depreciation and any impairment losses (net carrying amount higher than recoverable amount).
Depreciation is calculated, using the straight-line method, on the basis of the acquisition cost of the assets less their residual value. The land on which the buildings and other structures are located has an indefinite life and, therefore, it is not depreciated.
The tangible asset depreciation charge is recognized in the consolidated income statement and is calculated basically using the following depreciation rates (based on the average years of estimated useful life of the various assets):
Consolidated Financial Statements - December 31, 2018 39
| Annual |
|
|
Buildings for own use | 4% |
Furniture | 10% |
Fixtures | 10% |
Office and IT equipment | 20% |
Leasehold improvements | 10% or up to contractual maturity |
The Bank assesses at end of each period, if there is indication that the items of tangible assets carrying amount may be impaired, that is if there is an asset with its carrying amount bigger than its recoverable amount, either for use or sale.
Once an impairment loss of tangible assets is identified, it is adjusted to reach its recoverable amount by recognizing an impairment loss recorded in the heading "Impairment loss on other assets (Net)". Additionally the value of depreciation of that asset is recalculated in order to adjust the value of the life of the asset.
In case of evidence or indication of a recovery of a tangible asset value, the Bank recognizes the reversal of the impairment loss amount recorded in prior years and should adjust the future depreciation expenses according to the lifetime value of the asset. Under no circumstance, a reversal of impairment loss of an asset will increase its carrying amount higher than the amount that it would have had no impairment loss been recognized in prior years.
Upkeep and maintenance expenses relating to property, plant and equipment for own use are recognized as an expense in the period in which they are incurred.
o) Intangible assets
Intangible assets are identifiable non-monetary assets (separable from other assets) without physical substance which arise as a result of a legal transaction or software development. Only assets whose cost can be estimated reliably and from which the consolidated entities consider it probable that future economic benefits will be generated are recognized.
Intangible assets are recognized initially at acquisition or production cost and are subsequently measured deducting any accumulated amortization and any accumulated impairment losses.
i. Goodwill
In the acquisition and/or merger of investment in subsidiary, any difference between the investment cost and the investor's share in net fair value of assets, liabilities and contingent liabilities of the investee (subsidiary or affiliate) is accounted for in accordance with IFRS 3 "Business Combination ".
Goodwill is only recognized when it has been acquired for consideration and represents, therefore, a payment made by the acquirer in anticipation of future economic benefits from assets of the acquired entity that are not capable of being individually identified and separately recognized.
At the end of each annual reporting period or whenever there is any indication of impairment goodwill is reviewed for impairment (i.e. a reduction in its recoverable amount to below its carrying amount) and, if there is any impairment, the goodwill is written down with a charge to Impairment on non financial assets (net) - Intangible assets in the consolidated income statement.
The net fair value adjustments of assets, liabilities and contingent liabilities of the investee in relation to their carrying amount are allocated to individual identifiable assets acquired and liabilities assumed that comprise them based on their respective fair values at the date of purchase.
In the case of a business combination made in stages, prior interest in the acquired is measured again at fair value at the acquisition date when control of the acquired is obtained.
ii. Other intangible assets
Other intangible assets are non-monetary assets without physical substance. Generally arising from software development and acquisition of rights that can generate benefits for the Bank. They can have characteristics of definite or indefinite period.
Other intangible assets can have an indefinite useful life -when, based on an analysis of all the relevant factors, it is concluded that there is no foreseeable limit to the period over which the asset is expected to generate net cash inflows for the consolidated entities- or a finite useful life, in all other cases.
Intangible assets with indefinite useful lives are not amortized, but rather at the end of each reporting period or whenever there is any indication of impairment the consolidated entities review the remaining useful lives of the assets in order to determine whether they continue to be indefinite and, if this is not the case, to take the appropriate steps.
Intangible assets with finite useful lives are amortized over those useful lives using methods similar to those used to depreciate tangible assets. The amortization expense is recognized under "Depreciation and amortization" in the consolidated income statement.
The Bank assesses at the end of each period, if there is any indication that the items of intangible assets may present an impairment loss, i.e. an asset that presents the carrying amount higher than the net realizable value. After identifying any reduction in impairment loss, it is adjusted to reach its fair value.
Measurement of the recoverable amount of other intangible assets - software is made based on the value in use, as well as the analysis of the discontinuity of the asset in relation to the activities of the Bank.
Expenditures for acquisition and development of software are amortized over a maximum period of 5 years.
Consolidated Financial Statements - December 31, 2018 40
p) Other assets
Other Assets include the balances of all prepayments and accrued income (excluding accrued interest), acquired client list, the net amount of the difference between pension plan obligations and the fair value of the plan assets with a balance on the entity’s behalf, when this net amount shall be disclosed in the consolidated financial statements, and the amount of any other assets not included in other items.
The Bank uses the value in use of client relationship as a basis for measuring the impairment since it is not reasonably possible to determine the net value of sales, because there is no basis for making a reliable estimate of the value to be obtained by selling the asset in a transaction at cumulative basis, between knowledgeable, willing parties. The value in use of client lists acquired related to the purchase of the "payroll" will be determined individually. An analyses that aims to demonstrate the expectation of generating future economic benefit and the present value of expected cash flows is prepared by the business areas. Quarterly, these analyses are reviewed based on the actual cash flows of each business (value in use), which are compared with the carrying amount, checking whether there is a need to record a loss on non-recoverability.
q) Liabilities for insurance contracts
The liabilities for insurance contracts are comprised substantially by mathematical provisions for current and future benefits (PMBaC and PMBC). Insurance contracts are contracts under which the Bank accepts a significant risk, other than a financial risk, from a policyholder by agreeing to compensate the beneficiary on the occurrence of an uncertain future event by which the policyholder will be adversely affected.
Insurance liabilities are recognized when the contract is entered into and the premiums are charged. Contracts that have been classified as insurance are not reclassified subsequently. The liability is derecognized when the contract expires or is cancelled.
All valuation methods used by the subsidiaries are based on the general principle that the carrying amount of the net liability must be sufficient to meet any reasonably foreseeable obligation resulting from the insurance contracts. Investment assumptions are either determined by the local regulator and based on management’s future expectations. In the later case, the anticipated future investment yield is set by management, considering the available market information and economic indicators. A significant assumption related to estimated gross profits on variable annuities, is the annual long-term growth rate of the underlying assets.
At each financial statement date an assessment is made in order to verify whether the Mathematical provisions are adequate.
In the years ended December 31, 2018, 2017 and 2016, as determined by IFRS 4 - Contracts classification and subsequent amendments, the adequacy of the technical provisions constituted were evaluated through Liability Adequacy Test (LAP).
At December 31, 2018, the LAT indicated the need for the additional constitution of technical provisions amounted to R$215,754 (12/31/2017 - R$130,307 and 12/31/2016 - R$85,395) for Indemnity Funds for Benefit (FGB) plans.
r) Provisions for legal and administrative proceedings, commitments and other provisions
Banco Santander and its subsidiaries are involved in lawsuits and administrative proceedings related to tax, labor and civil, in the normal course of their activities.
The provisions include legal obligations, lawsuits and administrative proceedings related to tax and social security obligations, whose object is to challenge their legality or constitutionality, regardless of the assessment that the probability of success, the amounts are fully recognized in the financial statements.
Provisions are reviewed at each financial statement date and adjusted to reflect the current best estimate and may be fully or partially reversed or reduced when the outflows of resources and obligations relevant to the process are no longer probable, including decay of legal deadlines, among others.
Provisions for the lawsuits and administrative proceedings are recorded when their risk of loss is considered probable and the amounts can be reliably measured, based on the nature, complexity and history of lawsuits, the legal opinion of the internal and external advisors, based on the best available information. For those lawsuits for which the risk of loss is possible, are not recorded and the information is disclosed in the financial statements and for the lawsuits for which the risk of loss is remote, no disclosure is required.
Contingent assets are not recognized, except when there are guarantees or favorable lawsuits decisions, about which features no longer fit, characterizing the gain as practically certain. Assets with probable success, if any, are only disclosed in the financial statements.
On the favorable decisions to Santander, the counterparty has the right, in the event of specific legal requirements, to file a rescission lawsuit within a period determined by current legislation. Rescission lawsuits are considered as new events and will be evaluated for contingent liability purposes if and when they are filed.
s) Other liabilities
“Other liabilities” includes the balance of all accrued expenses and deferred income, excluding accrued interest, and the amount of any other liabilities not included in other categories.
t) Share-based compensation
The Bank has long-term compensation plans with vesting conditions. The main vesting conditions are: (1) service conditions, since it is necessary that the participant continues to be employed by the Bank during the term of the Plan for his rights to vest; (2) performance conditions, since the number of Units that ultimately vest will be determined according to the result of certain performance parameter of the Bank, such as: total Shareholder Return (TSR) and may be reduced in case of failure to achieve the goals of reducing the Return on Risk Adjusted Capital (RORAC), comparison betweenactual and budget in each year, as determined by the Board of Directors and (3) market conditions, since some parameters are linked to the market price of the Bank´s shares. The Bank measures the fair value of the services rendered by reference to the fair value of the equity instruments granted at the grant date, taking into account the market conditions for each plan when estimating the fair value.
Consolidated Financial Statements - December 31, 2018 41
Settlement in shares
The Bank measures the fair value of the services received by reference to the fair value of the equity instruments granted at the grant date, taking into account the market conditions for each grant when estimating the fair value. In order to recognize the personnel expenses against equity reserves throughout the vesting period, as the services are received, the Bank considers the treatment of service conditions and recognize the amount for the services received during the vesting period based on the best available estimate of the number of equity instruments expected to vest. Semi-annually, the Bank reviews the estimate of the number of equity instruments expected to vest.
Settlement in cash
For cash-settled share-based compensation (in the form of share appreciation rights), the Bank measures the fair value of services rendered and the corresponding liability incurred, based on the fair value of the share appreciation rights at the grant date and until the liability is settled. The Banks remeasures the fair value of the liability at the end of each reporting period and at the date of settlement, with any changes in fair value recognized in profit or loss for the period. In order to recognize the personnel expenses against a provision in “other liabilities” throughout the vesting period, reflecting the period as the services are received, the Bank bases the total liability on the best estimate of the number of share appreciation rights that will vest at the end of the vesting period and recognizes the amount for the services received during the vesting period based on such best available estimate. Periodically, the Bank reviews such estimate of the number of share appreciation rights that will vest at the end of vesting period.
u) Recognition of income and expenses
The most significant criteria used by the Bank to recognize its income and expenses are summarized as follows:
i. Interest income, interest expenses and similar items
Interest income, interest expenses and similar items are generally recognized on an accrual basis using the effective interest method. Dividends received from other companies are recognized as income when the consolidated entities' right to receive them arises.
ii. Commissions, fees and similar items
Fees and commission income and expenses are recognized in the income statement using criteria that vary according to their nature (note 35). The main criteria are as follows:
• Fee and commission income and expenses relating to financial assets and financial liabilities measured at fair value through profit or loss are recognized when paid;
• Those arising from transactions or services that are performed over a period of time are recognized over the life of these transactions or services; and
• Those relating to services provided in a single act are recognized when the single act has been performed.
iii. Non-financial income and expenses
These are recognized for accounting purposes on an accrual basis.
iv. Deferred collections and payments
These are recognized for accounting purposes at the amount resulting from discounting the expected cash flows at market rates.
v. Loan arrangement fees
Loan arrangement fees, mainly loan origination and application fees, are accrued and recognized in the income statement over the term of the loan. In the case of loan origination fees, the portion relating to the associated direct costs incurred in the loan arrangement is recognized immediately in the consolidated income statement.
v) Guarantees
v.1) Financial guarantees
“Financial guarantees” are defined as contracts whereby an entity undertakes to make specific payments for a third party if the latter does not do so, irrespective of the various legal forms they may have, such as guarantees, irrevocable documentary credits issued or confirmed by the entity, among others.
The Bank initially recognizes the commission of the financial guarantees as liability in the consolidated financial statements at fair value, which is generally the present value of the fees, commissions and similar interest receivable from these contracts over their term.
Financial guarantees, regardless of the guarantor, type of instrument or other circumstances, are reviewed periodically so as to determine the credit risk to which they are exposed and, if appropriate, to consider whether a provision is required. The credit risk is determined by application of criteria similar to those established for quantifying impairment losses on debt instruments measured at amortized cost.
The provisions made for these transactions are recognized in the heading “Provisions - Provisions for contingent liabilities, commitments and other provisions” in the consolidated financial statements (note 23).
If a specific provision is required for financial guarantees, the related unearned commissions are recognized in the heading “Financial liabilities atamortized cost – Other financial liabilities” in the consolidated financial statements are reclassified to the appropriate provision.
Consolidated Financial Statements - December 31, 2018 42
v.2) Guarantees and Credit Risk Mitigation Policy
Banco Santander controls the credit risk using the collateral in its operations. Each business unit is responsible for credit risk management and formalizes the use of collateral in its lending policies.
Banco Santander uses guarantees in order to increase its ability to recover operations subject to credit risk. The guarantees can be fiduciary, real, legal structures with power mitigation and compensation agreements. The Bank periodically reviews its policy guarantees through technical parameters, normative and also its historical basis, to determine whether the guarantee is legally valid and enforceable.
Credit limits are continually monitored and changed in client behavior function. Thus, the potential loss values represent a fraction of the amount available.
w) Assets under management and investment and pension funds managed by the Bank
Assets owned by third parties and managed by the consolidated entities are not presented in the consolidated financial statements. Management fees are included in “Fee and commission income” in the consolidated income statement. Note 44-b contains information on the third-party assets managed by the Bank.
The investment funds and pension funds managed by the consolidated entities are not recorded in the consolidated financial statements since the related assets are owned by third parties. The fees and commissions earned in the year for the services rendered by the Bank entities to these funds (asset management and custody services) are recognized in the heading “Fee and commission income” in the consolidated income statement.
x) Post-employment benefits
Post-employment benefit plans include the commitments of the Bank: (i) addition to the benefits of public pension plan; and (ii) healthcare in case of retirement, permanent disability or death for those employees, and their direct beneficiaries.
Defined contribution plans
Defined contribution plans is the post-employment benefit plan which the Bank, and its subsidiaries, as the sponsoring entity pays fixed contributions into a pension fund, not having a legal or constructive obligation to pay further contributions if the fund does not hold sufficient assets to pay all benefits relating to services provided in the current and in previous periods.
The contributions made are recognized in the heading "Interest Expense and Similar Charges" in the income statement.
Defined benefit plans
Defined benefit plan is the post-employment benefit plan which is not a defined contribution plan and is shown in Note 22. For this type of plan, the sponsoring entity's obligation is to provide the benefits agreed with the former employees, assuming the potential actuarial risk that benefits will cost more than expected.
For defined benefit plan, the amendment of IAS 19 established fundamental changes in the accounting for and disclosure of employee post-employment benefits such as removing the corridor approach in the accounting for the obligation of the plans, as well as changes in the criteria for recognition of conventional interest of plan assets (valuation based on the discount rate actuarial liability).
In addition, there is full recognition in liabilities heading of actuarial losses (actuarial deficit) not recognized previously when they occur, which its counterparty is a heading in the stockholders’ equity (Other Comprehensive Income).
Main Definitions
- The present value of the defined benefit obligation is the present value without any deduction from the plan assets, of expected future payments required to settle the obligation resulting from employee service in the current and past periods.
- Deficit or surplus is: (a) the present value of the defined benefit obligation, less (b) the fair value of plan assets.
- The sponsoring entity may recognize the plan assets in the financial statements when they meet the following characteristics: (i) the fund assets are sufficient to meet all employee benefit plan or the sponsor obligations; or (ii) the assets are returned to the sponsoring entity in order to reimburse it for employee benefits already paid.
- Actuarial gains and losses correspond to changes in the present value of defined benefit obligation resulting from: (a) adjustments by experience (the effects of differences between the actuarial assumptions adopted and what has actually occurred); and (b) effects of changes in actuarial assumptions.
- Current service cost is the increase in the present value of the defined benefit obligation resulting from employee service provided in the current period.
- The past service cost is the change in present value of defined benefit obligation for employee service provided in prior periods resulting from a change in the plan or reductions in the number of employees covered.
Post-employment benefits are recognized in income in the headings "Interest expense and similar Charges" and "Provisions (net)".
The defined benefit plans are recorded based on an actuarial study, conducted annually by an external consulting firm, at the end of each year to be effective for the subsequent period.
Consolidated Financial Statements - December 31, 2018 43
y) Other long-term employee benefits
“Other long-term employee benefits”, defined as obligations to early retirees considered as those who have ceased to render services at the entity but who, without being legally retired, continue to have economic rights relating to the entity until they acquire the legal status of retiree, long-service bonuses, obligations for death of spouse or disability before retirement that depend on the employee's length of service at the entity and other similar items, are treated for accounting purposes, where applicable, as established above for defined benefit post-employment plans, except that all past service costs and actuarial gains and losses are recognized immediately (note 22).
z) Termination benefits
Termination benefits are recognized when there is a detailed formal plan identifying the basic changes to be made, provided that implementation of the plan has begun, its main features have been publicly announced or objective facts concerning its implementation have been disclosed.
aa) Income taxes (IRPJ), Social Contribution (CSLL), Social Integration Program (PIS) and Tax for Social Security Financing (COFINS)
Income tax is calculated at the rate of 15% plus a surcharge of 10% levied on the profit, after adjustments determined by tax legislation. The social contribution (CSLL) is calculated at the rate of 20% for financial institutions (15% up to August 2015) and 9% for other companies, levied on the profit, after considering the adjustments determined by tax legislation. The CSLL rate for financial institutions, legal persons of private insurance and capitalization was increased from 15% to 20% for the fiscal period between September 1, 2015 and December 31, 2018, pursuant to Law 13,169/2015 (a result of the conversion into law of Provisional Measure 675/2015).
The expense for corporate income tax is recognized in the consolidated income statement, except when it results from a transaction recognized directly in equity, in which case the tax effect is also recognized in equity.
The current income tax expense is calculated as the sum of the current tax resulting from application of the appropriate tax rate to the taxable profit for the year (net of any deductions allowable for tax purposes), and of the changes in deferred tax assets and liabilities recognized in the consolidated income statement.
Tax assets classified as "Current" are amounts of tax to be recovered within the next twelve months.
Tax liabilities includes the amount of all tax liabilities (except provisions for taxes), which are broken down into “current” amount payable in respect of the income tax on the taxable profit for the year and other taxes in the next twelve months.
Deferred tax assets and liabilities include temporary differences, which are identified as the amounts expected to be payable or recoverable on differences between the carrying amounts of assets and liabilities and their related tax bases, and tax loss and tax credit carry forwards. These amounts are measured at the tax rates that are expected to apply in the period when the asset is realized or the liability is settled.
Deferred tax assets are only recognized as temporary differences to the extent that it is considered probable that the consolidated entities will have sufficient future taxable profits against which the deferred tax assets can be utilized, and the deferred tax assets do not arise from the initial recognition (except in a business combination) of other assets and liabilities in a transaction that affects neither taxable profit or accounting profit. Other deferred tax assets (tax loss and tax credit carry forwards) are only recognized if it is considered probable that the consolidated entities will have sufficient future taxable profits against which they can be utilized.
Due to the change in social contribution tax rate, the group companies made the remeasurement of tax credit assets and deferred liabilities at the rates applicable to the period in which estimates the realization of assets and settlement of liabilities.
Income and expenses recognized directly in stockholders equity are accounted as temporary differences.
The deferred tax assets and liabilities recognized are reassessed at each financial statements date in order to ascertain whether they still exist, and the appropriate adjustments are made on the basis of the findings of the analyses performed.
Under the current regulation, the expected realization of tax credits is based on the Bank's projections of future results and on technical study, as shown in Note 24.
PIS (Social Integration Program) and COFINS (Tax for Social Security Financing) have been computed at a combined rate of 4.65% on certain gross revenues and expenses. Financial institutions may deduct financial expenses in determining the PIS/COFINS tax basis. PIS and COFINS are considered a profit-base component (net basis of certain revenues and expenses), therefore and accordingly to IAS 12 it is recorded as income taxes.
ab) Consolidated cash flow statements
The following terms are used in the consolidated cash flow statements with the following meanings:
• Cash flows: inflows and outflows of cash and cash equivalents, which are short-term, highly liquid investments that are subject to an insignificant risk of changes in value and original maturity of three months or less.
• Operating activities: the primary revenue-generating activities of credit institutions and other activities that are not investing or financing activities.
• Investing activities: the acquisition and disposal of long-term assets and other investments not included in cash and cash equivalents.
• Financing activities: activities that result in changes in the size and composition of the equity and liabilities that are not operating activities.
In preparing the consolidated cash flows statement, the high liquidity investments with insignificant risk of changes in their values were classified as "Cash and cash equivalents". The Bank classifies as cash and cash equivalents balances recorded in the headings "Cash and balance with the Brazilian Central Bank" and "Loans and amounts due from credit institutions" in the consolidated financial statements, except restricted resources and long-term transactions.
Consolidated Financial Statements - December 31, 2018 44
The interest paid and received correspond basically to operating activities of Banco Santander.
Bank's Management began segregating the "Effects of Exchange Rates on Assets and Liabilities". Consequently, the corresponding figures of the Cash Flow Statements were reclassified for the years ended December 31, 16 with the objective of better presentation of this accounting item.
3.Basis of consolidation
Below are highlighted the controlled entities and investment funds included in the consolidated financial statements of Banco Santander. Similar information regarding companies accounted by the equity method by the Bank is provided in Note 11.
|
|
|
|
|
Directly and Indirectly controlled by Banco Santander (Brasil) S.A. |
|
|
| Participation % |
| Activity |
|
| Consolidated |
Banco Bandepe S.A. (1) | Bank |
|
| 100.00% |
Santander Leasing S.A. Arrendamento Mercantil (Santander Leasing) | Leasing |
| - | 99.99% |
Aymoré Crédito, Financiamento e Investimento S.A. (Aymoré CFI) | Financial |
| - | 100.00% |
Santander Brasil Administradora de Consórcio Ltda. (Santander Brasil Consórcio) | Buying club |
| - | 100.00% |
Atual Serviços de Recuperação de Créditos e Meios Digitais S.A. (formerly named as Atual Companhia Securitizadora de Créditos Financeiros) (Atual) (2) | Credit recovery services |
| - | 100.00% |
Santander Corretora de Câmbio e Valores Mobiliários S.A. (Santander CCVM) | Broker |
| - | 100.00% |
Santander Corretora de Seguros, Investimentos e Serviços S.A. (Santander Corretora de Seguros) (formerly named as Santander Participações S.A.) (3)(4)(5) | Other activities |
| - | 100.00% |
Getnet Adquirência e Serviços para Meios de Pagamento S.A. (Getnet) | Payment Institution |
| - | 88.50% |
Sancap Investimentos e Participações S.A. (Sancap) | Holding |
| - | 100.00% |
Santander Brasil Establecimiento Financiero de Crédito S.A. (EFC) | Financial |
| - | 100.00% |
Santander Holding Imobiliária S.A. (formerly named Webcasas S.A.) (10) | Holding |
| - | 100.00% |
Santander Brasil Tecnologia S.A. (formerly named Produban Serviços de Informática S.A.) (21) | Technology |
|
| 100.00% |
Rojo Entretenimento S.A. (20) | Other Activities |
|
| 94.60% |
BEN Benefícios e Serviços S.A (9) | Other Activities |
| - | 100.00% |
Esfera Fidelidade S.A. (22) | Other Activities |
| - | 100.00% |
|
|
|
|
|
|
|
|
|
|
Return Capital Serviços de Recuperação de Créditos e Meios Digitais S.A. (formerly named Ipanema Empreendimentos e Participações S.A.) (11) (12) | Credit Management and Recovery Management |
|
| 70.00% |
|
|
|
|
|
|
|
|
|
|
Return Gestão de Recursos S.A. (formerly named Gestora de Investimentos Ipanema S.A.) (13) | Resource Manager |
| - | 100.00% |
|
|
|
|
|
|
|
|
|
|
Auttar HUT Processamento de Dados Ltda. (Auttar HUT) | Other Activities |
| - | 100.00% |
Integry Tecnologia e Serviços A.H.U Ltda. (Integry Tecnologia) | Other Activities |
| - | 100.00% |
Toque Fale Serviços de Telemarketing Ltda. (Toque Fale) | Other Activities |
| - | 100.00% |
|
|
|
|
|
Controlled by Sancap |
|
|
|
|
Santander Capitalização S.A. (Santander Capitalização) | Savings and annuities |
| - | 100.00% |
Evidence Previdência S.A. | Social Securities |
| - | 100.00% |
Consolidated Financial Statements - December 31, 2018 45
Controlled by Aymoré CFI |
|
|
|
|
Super Pagamentos e Administração de Meios Eletrônicos Ltda. (Super Pagamentos) (14) (8) | Payment Institution |
| - | 100.00% |
Banco Olé Bonsucesso Consignado S.A. (Olé Consignado) (15) | Bank |
| - | 60.00% |
Banco PSA Finance Brasil S.A. | Bank |
| - | 50.00% |
Controlled by Olé Consignado |
|
|
|
|
BPV Promotora de Vendas e Cobrança Ltda. | Other Activities |
| - | 100.00% |
Olé Tecnologia Ltda. | Other Activities |
| - | 100.00% |
|
|
|
|
|
Controlled by Santander Leasing |
|
|
|
|
Si Distribuidora de Títulos e Valores Mobiliários S.A. (formerly named Santander Finance Arrendamento Mercantil) (6) (7) | Leasing |
|
| 100.00% |
Consolidated Investment Funds | Activity |
|
| Participation % |
Santander FIC FI Contract I Referenciado DI | Investment Fund |
|
| (a) |
Santander Fundo de Investimento Unix Multimercado Crédito Privado | Investment Fund |
|
| (a) |
Santander Fundo de Investimento Diamantina Multimercado Crédito Privado de Investimento no Exterior | Investment Fund |
|
| (a) |
Santander Fundo de Investimento Amazonas Multimercado Crédito Privado de Investimento no Exterior | Investment Fund |
|
| (a) |
Santander Fundo de Investimento SBAC Referenciado DI Crédito Privado | Investment Fund |
|
| (a) |
Santander Fundo de Investimento Guarujá Multimercado Crédito Privado de Investimento no Exterior | Investment Fund |
|
| (a) |
Santander Fundo de Investimento Financial Curto Prazo | Investment Fund |
|
| (a) |
Santander Fundo de Investimento Capitalization Renda Fixa | Investment Fund |
|
| (a) |
Santander Paraty QIF PLC (16) | Investment Fund |
|
| (a) |
Santander FI Hedge Strategies Fund (Santander FI Hedge Strategies) (16) | Investment Fund |
|
| (a) |
Prime 16 – Fundo de Investimento Imobiliário (formerly named BRL V - Fundo de Investimento Imobiliário - FII) (17) | Real Estate Investment Fund |
|
| (a) |
Fundo de Investimento em Direitos Creditórios Multisegmentos NPL Ipanema VI - Não Padronizado (Fundo Investimento Ipanema NPL VI) (18) | Investment Fund |
|
| (a) |
Fundo de Investimento em Direitos Creditórios Multisegmentos NPL Ipanema VI - Não Padronizado (Fundo Investimento Ipanema NPL V) (19) | Investment Fund |
|
| (a) |
Santander Hermes Multimercado Crédito Privado Infraestrutura Fundo de Investimentos (23) | Investment Fund |
|
| (a) |
(a) Company over which the Bank is exposed, or has rights, to variable returns and have the ability to affect those returns through the power of decision, in accordance with IFRS 10 - Consolidated Financial Statements. Banco Santander and its subsidiaries holds 100% of the shares of these investment funds.
(1) In the EGM (Extraordinary general meeting) held on December 7, 2018, Banco Bandepe S.A. had its capital stock increased in the amount of R$2,000,000, passing from R$2,787,689 to R$4,787,689, divided into 3,589,334 (three million, five hundred and eighty-nine thousand and three hundred and thirty-four) common nominative shares without par value. The shareholder Banco Santander subscribed all the new issued shares and paid-in the shares corresponding to 50% of the capital increase, being that the shares subscribed and pending of payment will be paid-in pursuant to the conditions and term provided in law.
(2) On March 23, 2018, Atual Companhia Securitizadora de Créditos Financeiros had its name changed to Atual Serviços de Recuperação de Créditos e Meios Digitais S.A., and its share capital increased in R$150,000 passing the share capital to the amount of R$270,000, divided into 265,419,392 (two hundred and sixty-five million, four hundred and nineteen thousand and three hundred and ninety-two) ordinary common shares without par value, entirely held by Banco Santander.
(3) In the ESM (Extraordinary Shareholders' Meeting) held on May 8, 2017, was approved the name change of Santander Participações S.A. to Santander Corretora de Seguros, Investimentos e Serviços S.A. In the same ESM, was approved the amendment to the company's corporate purpose. At the ESM held on August 31, 2017, a capital increase of R$17,652 was approved, in view of the version of the net assets of Santander Microcrédito, based on its book value at the date - based on June 30, 2017, entirely destined to the share capital account of Santander Corretora de Seguros, transferring the capital stock from the current R$1,700,000 to R$1,717,652, through the issuance of a total of 51,776 (fifty-one thousand, seven hundred and seventy-six) registered common shares with no par value that were subscribed and paid by Banco Santander on that date, the issue price was set at R$340.93 per share, calculated
Consolidated Financial Statements - December 31, 2018 46
based on its book value, on the base date of August 31, 2017. On August 31, 2017, the merger and the Private Instrument of Protocol and Justification of Santander Microcrédito by Santander Corretora de Seguros were approved, so that Santander Corretora de Seguros received through their book value, based on the balance sheet drawn up on June 30, 2017, all of the assets, rights and obligations of Santander Microcrédito. With the extinction of Santander Microcrédito the Santander Corretora de Seguros became its successor in all its rights and obligations.
(4) At the ESM (Extraordinary shareholder meeting) held on September 29, 2017, Santander Corretora de Seguros' shareholders' equity increase was approved in the amount of R$12,900, based on the net assets of Santander Brasil Advisory calculated based on its book value at base date of August 31, 2017, of which the amount of R$8,463 was allocated to the share capital account of Santander Corretora de Seguros, increasing the current capital from R$1,717,652 to R$1,726,115, by issuing a total of 37,554 (thirty-seven thousand, five hundred and fifty-four) nominative common shares with no par value that were subscribed and paid-in on that date by Banco Santander, the issue price was set at R$343.50 per share, calculated based on their respective carrying amounts, on the base date of August 31, 2017. On September 29, 2017, the merger and the Private Instrument of Protocol and Justification of Santander Brasil Advisory by Santander Corretora de On September 29, 2017, the merger and the Private Instrument of Protocol and Justification of Santander Brasil Advisory by Santander Corretora de Seguros were approved, so that Santander Corretora de Seguros received through their book value, based on the balance sheet drawn up on August 31, 2017, all of the assets, rights and obligations of Santander Brasil Advisory. With the extinction of Santander Brasil Advisory the Santander Corretora de Seguros became its successor in all its rights and obligations.
(5) On November 17, 2017, was formalized the acquisition by Banco Santander of the participation by Santusa Holding, S.L. (equivalent to 39.35%) in the share capital of Santander Serviços. Thus, Banco Santander becomes the holder of 99.99% of the shares of Santander Serviços. The amount of R$298,978 relating to goodwill was recorded. On November 30, 2017, Santander Serviços was merged into Santander Corretora de Seguros and on December 22, 2017, Santander Corretora de Seguros, Cia. de Ferro Ligas da Bahia - Ferbasa SA and Brazil Wind S.A. executed agreement for the sale of 100% of the shares issued by BW Guirapá I S.A. held by Santander Corretora de Seguros and Brazil Wind to Ferbasa. The basic price of the total sale was R$414,000, and an additional amount of up to R$35,000 may be paid if future targets stipulated in the Contract are met. This investment was written off and, consequently, the assets and liabilities of BW Guirapa I and its subsidiaries are no longer consolidated in the Conglomerate Balance Sheet as of January 1, 2018. On April 2, 2018, the transaction was concluded (Note 10).
(6) In the ESM held on December 17, 2018, was approved the change of corporate name of SI Distribuidora de Títulos e Valores Mobiliários S.A. to PI Distribuidora de Títulos e Valores Mobiliários S.A. On January 22, 2019, Bacen approved the company’s change of corporate name.
(7) In the ESM held on May 3, 2018, the shareholders of Santander Finance Arrendamento Mercantil S.A. approved its conversion into a distributor of bonds and securities, and change of its corporate name to SI Distribuidora de Títulos e Valores Mobiliários S.A. The conversion process of approved by Bacen on November 21, 2018.
(8) In the ESM held on July 21, 2017, was approved the capital increase of Super Pagamentos in the amount of R$20,000, passing the capital stock from R$49,451 to R$69,451, through issuance of 50,724,086 (fifty million, seven hundred and twenty-four thousand and eighty-six) new nominative common shares without par value, by the issuance price of approximately R$394,29 per one thousand shares, based on the accounting net-worth value of Super Pagamento as of June 30, 2017. The issued shares were fully subscribed and paid-in by Aymoré CFI.
(9) BEN Benefícios e Serviços S.A. was incorporated on June 11, 2018.
(10) Through the Private Stock Purchase and Sale Agreement held on October 26, 2017, Santander Serviços sold its interest held in Webcasas S.A. to Banco Santander. The full sale occurred at book value. In ESM held on November 1, 2017, was approved the change of name of Webcasas S.A. to Santander Holding Imobiliária S.A. and the amendment of its corporate purpose to encompass the new activities to be developed.
(11) Investment purchased in October 16, 2017.
(12) On July 12, 2018, the company Ipanema Empreendimentos e Participações S.A. had its name changed to Return Capital Serviços de Recuperação de Créditos S.A..
(13) On July 12, 2018, the company Gestora de Investimentos Ipanema S.A. had its name changed to Return Gestão de Recursos S.A..
(14) On May, 2017, it was approved by Bacen the authorization process for the Company operates as a payment institution.
(15) All the shareholders canceled the ESM held on December 19, 2017, which approved the capital increase of Olé Consignado in the amount of R$120,000. In the ESM held on February 9, 2018, the shareholders fully representing the capital stock of Olé Consignado approved the capital increase in the amount of R$ 120,000, passing the share capital from R$ 400,000 to R$ 520,000, through issuance of 57,089,392 (fifty seven million, eighty-nine thousand, three hundred and ninety two) nominative common shares, without par value, fully subscribed and paid-in by the shareholders, on the ESM date, proportionally to their respective equity interest. The capital increase was approved by Bacen on March 15, 2018.
(16) Banco Santander, through its subsidiaries, holds the risks and benefits of Santander Paraty and the Santander FI Hedge Strategies Subfund, resident in Ireland, and both are fully consolidated in its Consolidated Financial Statements. In the Irish market, an investment fund can not act directly and, for that reason, it was necessary to create another structure (a sub-fund), Santander FI Hedge Strategies. Santander Paraty does not have a financial position, and all position is derived from the financial position of Santander FI Hedge Strategies.
(17) The Banco Santander figured as lender of certain delayed debts (loans) which had real state as guarantees. The process of credit recovery consists in converte into capital contributions by the Real Estate Fund in conjunction concomitant transfer of the same shares to Banco Santander through the process of payment in kind of the above credit operations payments.
(18) This investment fund was formed and started to be consolidated in September of 2017. It refers to a structure where the Bank has sold certain loans agreements which were already written-off (agreements matured over 360 days) and transferred to this fund.Atual Serviços de Recuperação de Créditos e Meios Digitais S.A. (Atual), company controlled by the Banco Santander, holds 100% of the fund´s quotas.
(19) This fund was consolidated in October 2017 and the majority of its quotas indirectly held by Atual.
(20) Investment transferred from non-current assets held for sale accounting item (Note 10) on June 2018.
(21) In the ESM held on March 19, 2018, was approved the capital increase of Santander Brasil Tecnologia S.A. in the amount of R$4,000, through incorporation of the reserve for dividends' equalization, without changing the number of shares, passing the capital stock from the amount of R$91,048 to R$95,048, represented by 45,371,225 (forty-five million, three hundred and seventy-one thousand and two hundred and twenty-five) nominative common shares without par value.
(22) On August 14, 2018, Esfera Fidelidade S.A. was incorporated, with its equity interest fully held by Banco Santander. The company started its
Consolidated Financial Statements - December 31, 2018 47
operations on November 2018.
(23) This fund started being consolidated on November 2018.
Several social movements were implemented in order to reorganize the operations and activities of entities according to the business plan of the Conglomerate Santander, those movements have not affected the segment reporting once the companies are related to the commercial Banking segment and did not lead to a creation of a new segment.
a) Acquisition of residual equity interest in Getnet S.A.
At December 19, 2018, Banco Santander and the minority shareholders of Getnet S.A. entered into an amendment to the Stock Sale and Purchase Agreement and Other Covenants of Getnet S.A., in which Banco Santander committed to purchase all of the shares owned by the minority shareholders, corresponding to 11.5% of the Getnet S.A. stock capital, by the amount of R$1,431 (one billion and four hundred and thirty one million Brazilian Reais). This acquisition was authorized by BACEN on February 18 and closed on February 25, 2019, becoming Banco Santander the holder of 100% of the shares of Getnet S.A.
b) Formation of Esfera Fidelidade S.A.
On August 14, 2018, Esfera Fidelidade was incorporated, with equity fully owned by Banco Santander. Esfera Fidelidade will act in the development and management of customer loyalty programs. On November 26, 2018, Esfera Fidelidade had its capital stock increased in the amount of R$10,000, amounting the full share capital of R$10,000, divided into 10,001,000 (ten million and one thousand) nominative common shares without par value, entirely held by Banco Santander. The company started its operation in November 2018.
c) Investment in Loop Gestão de Pátios S.A.
On June 26, 2018, Webmotors S.A., company with 70% interest indirectly owned by Banco Santander, signed an investment agreement with Allpark Empreendimentos, Participações e Serviços S.A. and Celta LA Participações S.A., in order to acquire an equity interest corresponding to 51% of the capital stock of Loop Gestão de Pátios S.A., through capital increase and issuance of new shares of Loop to be fully subscribed and paid-in by Webmotors. Loop operates in the segment of commercialization and physical and virtual auction of motor vehicles. On September 25, 2018, the transaction was completed with increase of the capital stock, in the amount of R$23,900, through issuance of shares representing 51% of equity interest in Loop, which were fully subscribed and paid-in by Webmotors.
d) Formation of BEN Benefícios e Serviços S.A.
On June 11, 2018,BEN Benefícios,with equity fully owned by Banco Santander,was incorporated, toact in the supply and administration of meal, food, transportation, cultural and similar vouchers, via printed or electronic and magnetic cards. In the EGM held on August 1, 2018, BEN Benefícios had its capital increased in R$ 45,000, passing the capital stock to the amount of R$ 45,001, divided into 45,001,000 (forty-five million and one hundred thousand) registered common shares without par value, fully owned by Banco Santander. Banco Santander estimates that the company’s operations will begin at the first quarter of 2019.
e) Acquisition of Isban Brasil S.A. and Produban Serviços de Informática S.A.
Banco Santander purchased, on February 19, 2018, respectively, the totality of shares of Isban Brasil, formerly held by Ingeniería de Software Bancário, S.L., and of Produban Serviços de Informática, formerly held by Produban Servicios Informáticos Generales, S.L., for the amount of R$61,078 and R$42,731, respectively. The parties involved in the transaction had Banco Santander, S.A. (Santander Spain) as common indirect controller, being certain that such operations were accomplished under market conditions. At the EGM held on February 19, 2018, was approved the capital increase of Isban Brasil in the amount of R$33,000, through the issuance of 11,783,900 (eleven million, seven hundred and eighty-three thousand and nine hundred) shares, without par value, entirely subscribed and paid in by Banco Santander. On February 28, 2018, the company Isban Brasil was merged into Produban Serviços de Informática S.A. and on the same date, Produban Serviços de Informática had its corporate name changed to Santander Brasil Tecnologia S.A. Additionally, on February 28, 2018, Produban Servicios Informáticos Generales, S.L. (currently named Santander Global Technology, S.L.) approved the merger of the spin-off share of Produban Serviços de Informática into Produban Brasil Tecnologia e Serviços de Informática Ltda. (currently named Santander Global Technology Brasil Ltda.).
f) Sale of equity interest in BW Guirapá I S.A.
On December 22, 2017, Santander Corretora de Seguros, Cia. de Ferro Ligas da Bahia - Ferbasa SA and Brazil Wind S.A. executed agreement for the sale of 100% of the shares issued by BW Guirapá I S.A. held by Santander Corretora de Seguros and Brazil Wind to Ferbasa. The basic price of the total sale was R$414,000, and an additional amount of up to R$35,000 may be paid if future targets stipulated in the Contract are met. This investment was written-off and, as consequently, the assets and liabilities of BW Guirapá I and its subsidiaries are no longer consolidated in the Conglomerate Balance Sheet as of January 1, 2018. On April 2, 2018, the transaction was concluded (Notes 15 and 33).
g) Formation of Santander Auto S.A.
On December 20, 2017, Banco Santander and HDI Seguros S.A. (HDI Seguros), executed documents to form a partnership for the issuance, offering and sale of auto insurance, in a 100% digital way, through creation of a new insurance company - Santander Auto, to be held 50% by Sancap, a company controlled by Banco Santander, and 50% by HDI Seguros. On February 2, 2018 the partnership was approved by the Administrative Council of Economic Defense (Conselho Administrativo de Defesa Econômica – CADE), on April, 30, 2018, was approved by the Brazilian Central Bank and, on May, 15, 2018, SUSEP's prior approval was obtained. On October 9, 2018, through transformation of the corporate vehicle L.G.J.S.P.E. Investments and Participations S.A., Sancap and HDI Seguros formed Santander Auto S.A., with capital of R$15,000. On January 9, 2019, Susep granted to Santander Auto the authorization to operate insurance throughout national territory.
h) Formation of Gestora de Inteligência de Crédito S.A.
On April 14, 2017, the definitive documents necessary for the creation of a new credit bureau, Gestora de Inteligência de Crédito, were signed by the stockholders, whose control will be shared among the stockholders who will hold 20% of the its share capital each. In the EGM held on October 5, 2017, the capital increase of Gestora de Crédito was approved in the total amount of R$285,205, so that the capital stock increased from R$65,823 to R$351,028. The Company will develop a database with the objective of aggregating, reconciling and processing registration and credit information of individuals and legal entities, in accordance with the applicable standards, providing a significant improvement in the processes of granting, pricing anddirecting credit lines. The Bank estimates that the Company will be fully operational in 2019.
Consolidated Financial Statements - December 31, 2018 48
i) Formation of Banco Hyundai Capital Brasil S.A.
On April 28, 2016, Aymoré CFI and Banco Santander executed with Hyundai Capital Services, Inc. (Hyundai Capital) the necessary documents for the formation of Banco Hyundai and an insurance brokerage company to provide, respectively, auto finance and insurance brokerage services and products to clients and Hyundai dealerships in Brazil. Banco Hyundai shall have an equity interest of 50% held by Aymoré CFI and 50% held Hyundai Capital. On April 11, 2018, the parties incorporated, with an equity interest of 50% held by Aymoré CFI and 50% held by Hyundai Capital, a non-operational entity named BHJV Assessoria e Consultoria em Gestão Empresarial Ltda. On May 8, 2018, Aymoré CFI and Hyundai Capital took resolution on the conversion of BHJV Assessoria into the non-operational joint-stock corporation named Banco Hyundai Capital Brasil S.A., as well as the capital stock increase in R$99,995, passing to the amount of R$100,000, divided into 100,000,000 (one hundred million) nominative common shares without par value. On December 13, 2018, Banco Hyundai Capital Brasil S.A. incorporation procedure was finalized and its operation as a financial institution is subject to the issuance of an authorization to operate by Bacen. Aymoré CFI holds the operational control of such entity.
On February 21, 2019, the Brazilian Central Bank granted to Banco Hyundai Capital Brasil S.A. the authorization to operate as a banking entity. Expectation is that Banco Hyundai will be able to operate within the first semester of 2019 (Note 11).
j) Creation of PI Distribuidora de Títulos e Valores Mobiliários S.A.
On May 3, 2018, Santander Finance Arrendamento Mercantil S.A., an indirectly controlled subsidiary of Banco Santander, was converted into a distribution company of bonds and securities and had its corporate name changed to SI Distribuidora de Títulos e Valores Mobiliários S.A. The conversion process of approved by Bacen on November 21, 2018. On December 17, 2018, SI Distribuidora de Títulos e Valores Mobiliários S.A. had its corporate name changed to PI Distribuidora de Títulos e Valores Mobiliários S.A., being the corporate name change process approved by Bacen on January 22, 2019. Banco Santander expects to have the company fully operational within the first semester of 2019.
k) Investment Agreement between Banco Santander and current Olé Consignado
Olé Consignado has become the exclusive vehicle of Banco Bonsucesso and its affiliates for the payroll credit supply in Brazil and should consolidate existing payroll loans portfolio in Banco Santander and Olé Consignado, in accordance with the terms of the agreement. Banco Santander will continue to originate payroll loans through their own channels independently.
In the operation context, it was granted between institutions a put option (right of Olé Consignado to sell) and purchase (right of Banco Santander to acquire), relating to the shares held by Banco Bonsucesso, equivalent to 40% of the share capital of this company. According to IAS 32, on the acquisition date, a financial liability was recognized, the balance of which on December 31, 2018 of R$519 million (2017 - 484 and 2016 - R$307 million) by the commitment made in relation to the put option, accounted in Shareholders’ Equity, the amount of R$67 million, non-controlling interests, the amount of R$346 million. In 2018, a tax credit of R$85 million was recognized and an expense in the consolidated statements of income, in the amount of R$21 million.
At the ESM held on March 3, 2016 the change of the corporate name of Banco Bonsucesso Consignado S.A. to Banco Olé Bonsucesso Consignado S.A. was approved, the process was approved by Bacen on June 1, 2016.
The exercise period of the Options is defined between two periods, the first period from February 10, 2019 to February 10, 2021 or, if the exercise does not occur in the first period, the second period will be from February 10, 2023 to February 10, 2025.
4. Cash and balances with the Brazilian Central Bank
Thousand of reais | 2018 |
| 2017 |
| 2016 |
|
|
|
|
|
|
Cash and cash equivalents | 19,463,587 |
| 4,661,348 |
| 3,316,800 |
of which: |
|
|
|
|
|
Cash | 4,235,096 |
| 4,661,348 |
| 3,316,800 |
Cash and Foreign currency application abroad | 15,228,491 |
| 15,980,973 |
| 11,366,935 |
Central Bank compulsory deposits (2) (3) | 12,252,758 |
| 13,482,432 |
| 11,600,834 |
Total | 31,716,345 |
| 34,124,753 |
| 26,284,569 |
(1) Includes securities purchased under agreements to resell, long term and not considered cash equivalents.
(2) Central Bank compulsory deposits relate to a minimum balance that financial institutions are required to maintain with Bacen based on a percentage of deposits received from third parties, considered as restricted use of resources.
(3) In 2018, the balances related to the compulsory depositsof time deposits were reclassified to Loans and amounts due fromcredit institutions for a better presentation and, consequently, the respective comparative balances were also reclassified.
5. Loans and amounts due from credit institutions
The breakdown, by classification, type and currency, of the balances of “Loans and amounts due from credit institutions” in the consolidated financial statements is as follows:
Thousand of reais |
|
|
|
|
|
| 2018 |
| 2017 |
| 2016 |
|
|
|
|
|
|
|
|
|
|
|
|
Classification: |
|
|
|
|
|
|
|
|
|
|
|
Loans and receivables |
|
|
|
|
|
| - |
| 65,209,902 |
| 65,711,001 |
Financial Assets Measured At Amortized Cost |
|
|
| 79,607,001 |
| - |
| - | |||
Of which: |
|
|
|
|
|
|
|
|
|
|
|
Loans and amounts due from credit institutions, gross |
| 79,620,562 |
| 65,278,917 |
| 27,963,914 | |||||
Impairment losses (note 9.c) |
|
|
| (13,561) |
| (69,015) |
| (201,441) | |||
Loans and amounts due from credit institutions, net |
|
|
| 79,607,001 |
| 65,209,902 |
| 65,711,001 | |||
Loans and amounts due from credit institutions, gross |
| 79,620,562 |
| 65,278,917 |
| 65,912,442 | |||||
Consolidated Financial Statements - December 31, 2018 49
Thousand of reais | 2018 |
| 2017 |
| 2016 |
|
|
|
|
|
|
Type: |
|
|
|
|
|
Time deposits (2) (4) | 64,547,525 |
| 53,128,272 |
| 53,213,602 |
Reverse repurchase agreements (1) (2) | 3,728,963 |
| 270,735 |
| 848,096 |
Escrow deposits | 10,182,936 |
| 10,136,079 |
| 9,836,300 |
Other accounts (3) | 1,161,138 |
| 1,743,831 |
| 2,014,444 |
Total | 79,620,562 |
| 65,278,917 |
| 65,912,442 |
(1) Guaranteed by debt instruments.
(2) Includes R$12,793 of short-term transactions with low risk of change in their value, considered cash equivalents.
(3) As per the IFRS9 adoption the balances of the Loan and Pre Payment Export products were reclassified to Financial Assets Measured at Fair Value through Profit and Loss at the amount of R$611,088.
(4) In 2018, the balances related to the compulsory deposits on time deposits were reclassified from Cash and balances with the Brazilian Central Bank for a better presentation and, consequently, the respective comparative balances were also reclassified.
Thousand of reais | 2018 |
| 2017 |
| 2016 |
|
|
|
|
|
|
Currency: |
|
|
|
|
|
Brazilian Real | 79,166,257 |
| 49,914,691 |
| 63,369,993 |
US dollar | 422,247 |
| 15,044,088 |
| 1,658,980 |
Euro | 32,058 |
| 307,633 |
| 779,314 |
Pound sterling | - |
| 3,585 |
| 51,972 |
Other currencies | - |
| 8,920 |
| 52,183 |
Total | 79,620,562 |
| 65,278,917 |
| 65,912,442 |
Thousand of reais | 2018 |
| 2017 |
| 2016 |
|
|
|
|
|
|
Cash equivalents: |
|
|
|
|
|
Short-term transactions and low risk of change in its value | 5,821,573 |
| 2,028,581 |
| 3,445,846 |
(1) Collateralized by debt instruments.
Note 44-d contains a detail of the residual maturity periods of financial assets measured at amortized cost.
6.Debt instruments
The breakdown, by classification, type and currency, of the balances of “Debt instruments” is as follows:
Thousand of reais | 2018 |
| 2017 |
| 2016 |
|
|
|
|
|
|
Classification: |
|
|
|
|
|
Financial assets held for trading (1) | - |
| 34,879,681 |
| 59,994,946 |
Financial Assets Measured At Fair Value Through Profit Or Loss | 3,171,746 |
| - |
| - |
Financial Assets Measured At Fair Value Through Profit Or Loss Held For Trading | 50,066,469 |
| - |
| - |
Other Financial assets designated at fair value through profit or loss | - |
| 1,658,689 |
| 1,668,749 |
Financial assets - available-for-sale | - |
| 84,716,747 |
| 55,829,572 |
Financial Assets Measured At Fair Value Through Other Comprehensive Income (1) | 85,395,691 |
| - |
| - |
Investments Held-to-Maturity | - |
| 10,214,454 |
| 10,048,761 |
Loans and receivables | - |
| 17,616,515 |
| 16,283,259 |
Financial Assets Measured At Amortized Cost | 36,799,509 |
| - |
| - |
Of which: |
|
|
|
|
|
Debt Instruments | 39,513,460 |
| 20,400,082 |
| 17,838,162 |
Impairment losses | (2,713,951) |
| (2,783,567) |
| (1,554,903) |
Total | 175,433,415 |
| 149,086,086 |
| 143,825,287 |
|
|
|
|
|
|
Type: |
|
|
|
|
|
Government securities - Brazil (2) | 116,531,146 |
| 122,362,389 |
| 122,971,854 |
Debentures and Promissory notes | 10,555,952 |
| 12,097,230 |
| 12,922,763 |
Other debt securities | 48,346,317 |
| 14,626,467 |
| 7,930,670 |
Total | 175,433,415 |
| 149,086,086 |
| 143,825,287 |
(1) On December 31, 2018, management decided to change the classification of Financial Treasury Bills – LFT, of the securities portfolio of Getnet Adquirência e Serviços para Meios de Pagamento S.A. (Getnet SA), Banco Bandepe SA and Santander Corretora de Cambio e Valores Mobiliários S.A. (Santander CCVM).The securities were transferred from the Trading to Available for Sale category, in the amounts of R$739,430, R$14,099 and R$375,488, respectively. Such transfers did not impact the amounts of Consolidated and also did not generate effect on the result. The change in the category occurred due to the revaluation of the recent trading history of these assets.
(2) Includes, substantially, National Treasury Bills (LTN), Treasury Bills (LFT) e National Treasury Notes (NTN-A, NTN-B, NTN-C e NTN-F
Consolidated Financial Statements - December 31, 2018 50
Thousand of reais | 2018 |
| 2017 |
| 2016 |
|
|
|
|
|
|
Currency: |
|
|
|
|
|
Brazilian Real | 166,743,410 |
| 137,420,134 |
| 134,037,665 |
US dollar | 8,690,005 |
| 11,665,952 |
| 9,107,513 |
Euro | - |
| - |
| 680,109 |
Total | 175,433,415 |
| 149,086,086 |
| 143,825,287 |
Thousand of reais | 2018 |
| 2017 |
| 2016 |
|
|
|
|
|
|
Debt Instruments linked to: |
|
|
|
|
|
Repo Operations | 90,909,891 |
| 77,781,728 |
| 71,810,310 |
Banco Central Mandatory Deposits | 1,449,207 |
| 2,305,158 |
| 3,044,896 |
Operations guarantees in B3 S.A. - Brasil, Bolsa, Balcão (B3 S.A.) | 17,985,160 |
| 6,273,561 |
| 6,221,046 |
Associated to judiciary deposits and other guarantees | 2,078,042 |
| 4,743,298 |
| 5,358,604 |
Total | 112,422,300 |
| 91,103,745 |
| 86,434,856 |
Note 44-d contains a detail of the residual maturity periods of financial assets measured at amortized cost and financial assets measured at fair value through other comprehensive income.
7.Equity instruments
a) Breakdown
The breakdown, by classification and type, of the balances of “Equity instruments” is as follows:
Thousand of reais | 2018 | 2017 | 2016 |
|
|
|
|
Classification: |
|
|
|
Financial assets held for trading | - | 489,770 | 398,461 |
Financial Assets Measured At Fair Value Through Profit or Loss Held For Trading | 766,333 | - | - |
Non-Trading Financial Assets Mandatorily Measured At Fair Value Through Profit or Loss | 298,297 | - | - |
Other Financial assets designated at fair value through profit or loss | - | 33,368 | 42,455 |
Financial assets available-for-sale | - | 1,106,637 | 1,985,473 |
Financial Assets Measured At Fair Value Through Other Comprehensive Income | 40,986 | - | - |
Total | 1,105,616 | 1,629,775 | 2,426,389 |
|
|
|
|
Type: |
|
|
|
Shares of Brazilian companies | 783,475 | 389,113 | 1,185,653 |
Shares of foreign companies | 1,933 | 5,347 | 3,588 |
Investment funds (1) | 320,208 | 1,235,315 | 1,237,148 |
Total | 1,105,616 | 1,629,775 | 2,426,389 |
(1) Composed mainly by investment on fixed income, public and private securities.
The margin given as collateral for transactions traded on B3 S.A. with derivative financial instruments of its own and of third parties is composed of federal public securities.
b) Changes
The changes in the balance of “Equity instruments – Financial assets measured at fair value through profit or loss held for trading” were as follows:
Thousand of reais | 2018 | 2017 | 2016 |
|
|
|
|
Balance at beginning of year | 489,770 | 398,461 | 404,973 |
Net additions (disposals) | 277,462 | 90,696 | (7,125) |
Valuation adjustments | (899) | 613 | 613 |
Balance at end of year | 766,333 | 489,770 | 398,461 |
Consolidated Financial Statements - December 31, 2018 51
The changes in the balance of “Equity instruments – Non-Trading Financial Assets Mandatorily Measured At Fair Value Through Profit Or Loss” were as follows:
Thousand of reais | 2018 | 2017 | 2016 |
|
|
|
|
Balance at beginning of year | 33,368 | 42,455 | 573,664 |
Net additions (disposals) | 143,291 | (1,586) | (531,209) |
Valuation adjustments | 121,638 | (7,501) | - |
Balance at end of year | 298,297 | 33,368 | 42,455 |
The changes in the balance of “Equity instruments – Financial Assets Measured At Fair Value Through Other Comprehensive Income” were as follows:
Thousand of reais | 2018 | 2017 | 2016 |
|
|
|
|
Balance at beginning of year | 1,106,637 | 1,985,473 | 1,162,332 |
Net additions (disposals) | (1,034,219) | (830,395) | 852,820 |
Valuation adjustments | (31,432) | (48,441) | (29,679) |
Balance at end of year | 40,986 | 1,106,637 | 1,985,473 |
8.Derivative financial instruments and Short positions
The main risk factors associated to derivatives contracted are related to exchange rates, interest rates and stocks. To manage these and other market risk factors the Bank uses practices which include the measurement and follow up of the limit´s usage previously defined on internal committees, as well as the daily follow up of the portfolios values in risk, sensitivities and changes in the interest rate and exchange exposure, liquidity gaps, among other practices which allow the control and follow up on the main risk metrics that can affect the Bank´s position in the several markets which it acts. Based on this management model the Bank has accomplished its goal, using operations with derivatives, in optimize the relation risk/benefits even in situation with great volatility.
The derivatives fair value is determined through quotation of market prices. The swaps contracts fair value is determined using discounted cash flow modeling techniques, reflecting suitable risk factors. The fair value of NDF and Future contracts are also determined based on the quotation of market prices for derivatives traded in specific chamber (i.e.. stock Exchange for example) or using the same methodology applied for swap contracts. The fair value of options derivatives (call and put) is determined based on the mathematical models, such as Black & Scholes, using yield rates, implied volatilities and the fair value of the corresponding asset. The current market prices are used to price the volatilities. For the derivatives which do not have prices directly disclosed by specific chamber, their fair values are obtained through pricing models which use market information, based on disclosed prices of more liquid assets. Interest rate curves and market volatilities are extracted from theses prices to be used as first input in these models.
a) Trading and hedging derivatives
a.1) Derivatives Recorded in the Balance Sheet and Compensation Accounts
Portfolio Summary of Trading Derivative and Used as Hedge
| 2018 |
| 2017 |
| 2016 |
|
|
|
|
|
|
Assets |
|
|
|
|
|
Swap Differentials Receivable (1) | 14,640,289 |
| 15,781,207 |
| 15,321,646 |
Option Premiums to Exercise | 716,936 |
| 553,217 |
| 935,520 |
Forward Contracts and Others | 3,006,221 |
| 928,464 |
| 8,445,807 |
Total | 18,363,446 |
| 17,262,888 |
| 24,702,973 |
|
|
|
|
|
|
Liabilities |
|
|
|
|
|
Swap Differentials Payable (1) | 15,952,283 |
| 14,643,016 |
| 12,267,819 |
Option Premiums Launched | 563,787 |
| 385,183 |
| 1,166,002 |
Forward Contracts and Others | 1,950,765 |
| 1,649,287 |
| 6,802,794 |
Total | 18,466,835 |
| 16,677,486 |
| 20,236,615 |
(1) In 2016, includes swaption (swap + option) and embedded derivatives.
Consolidated Financial Statements - December 31, 2018 52
Summary by Category |
|
|
|
|
|
|
|
|
|
|
|
|
|
Trading | 2018 | 2017 | 2016 | |||
|
|
|
|
|
|
|
| Notional (1) | Fair Value | Notional (1) | Fair Value | Notional (1) | Fair Value |
Swap |
| (1,431,110) |
| 1,108,760 |
| 3,142,125 |
Assets | 177,233,869 | 44,487,274 | 202,081,214 | 57,294,179 | 196,887,188 | 24,311,485 |
CDI (Interbank Deposit Rates) | 36,135,015 | 24,267,591 | 33,289,522 | 22,409,496 | 44,868,680 | 22,759,822 |
Fixed Interest Rate - Real | 47,968,999 | - | 95,700,715 | - | 126,300,261 | - |
Indexed to Price and Interest Rates | 2,581,215 | - | 5,592,892 | - | 9,225,789 | - |
Foreign Currency | 90,495,240 | 20,219,683 | 67,493,635 | 34,884,683 | 16,492,458 | 1,551,663 |
Others | 53,400 | - | 4,450 | - | - | - |
Liabilities | 176,385,349 | (45,918,384) | 199,709,355 | (56,185,419) | 184,350,947 | (21,169,360) |
CDI (Interbank Deposit Rates) | 11,801,600 | - | 16,664,176 | - | 23,178,722 | - |
Fixed Interest Rate - Real | 88,317,044 | (23,075,374) | 114,055,076 | (21,687,884) | 133,185,717 | (17,414,147) |
Indexed to Price and Interest Rates | 24,308,601 | (21,775,017) | 40,146,968 | (34,107,210) | 12,767,212 | (3,518,297) |
Foreign Currency | 50,748,008 | - | 28,420,467 | - | 15,049,776 | (38,836) |
Others | 1,210,096 | (1,067,993) | 422,668 | (390,325) | 169,520 | (198,080) |
Options | 335,073,080 | 153,149 | 190,061,609 | 168,034 | 175,841,405 | (230,482) |
Purchased Position | 149,076,796 | 716,936 | 87,503,833 | 553,217 | 83,883,966 | 935,520 |
Call Option - US Dollar | 14,518,058 | 239,079 | 9,369,821 | 169,542 | 12,693,748 | 181,463 |
Put Option - US Dollar | 8,893,620 | 90,736 | 5,130,392 | 42,389 | 3,788,161 | 392,048 |
Call Option - Other | 3,118,344 | 131,297 | 1,953,481 | 59,220 | 20,115,932 | 62,517 |
Interbank Market | 639,488 | 4,537 | 1,185,310 | 389 | 17,391,500 | 7,062 |
Others(2) | 2,478,856 | 126,760 | 768,171 | 58,831 | 2,724,432 | 55,455 |
Put Option - Other | 122,546,774 | 255,824 | 71,050,139 | 282,066 | 47,286,125 | 299,492 |
Interbank Market | 121,782,816 | 217,726 | 70,295,282 | 257,943 | 46,106,600 | 18,029 |
Others(2) | 763,958 | 38,098 | 754,857 | 24,123 | 1,179,525 | 281,463 |
Sold Position | 185,996,284 | (563,787) | 102,557,776 | (385,183) | 91,957,439 | (1,166,002) |
Call Option - US Dollar | 7,615,856 | (101,034) | 5,595,163 | (117,059) | 4,314,988 | (141,172) |
Put Option - US Dollar | 12,160,912 | (169,431) | 5,919,598 | (77,145) | 7,390,733 | (952,407) |
Call Option - Other | 31,679,919 | (66,002) | 19,880,180 | (35,961) | 30,441,646 | (46,940) |
Interbank Market | 29,609,298 | (13,195) | 19,151,110 | (515) | 27,597,764 | (4,087) |
Others(2) | 2,070,621 | (52,807) | 729,070 | (35,446) | 2,843,882 | (42,853) |
Put Option - Other | 134,539,597 | (227,320) | 71,162,835 | (155,018) | 49,810,072 | (25,483) |
Interbank Market | 133,703,672 | (179,841) | 70,494,622 | (126,743) | 49,245,495 | (5,793) |
Others(2) | 835,925 | (47,479) | 668,213 | (28,275) | 564,577 | (19,690) |
Consolidated Financial Statements - December 31, 2018 53
Futures Contracts | 289,508,200 | - | 161,725,596 | - | 104,651,180 | - |
Purchased Position | 86,203,734 | - | 54,806,022 | - | 40,396,456 | - |
Exchange Coupon (DDI) | 20,590,068 | - | 9,616,936 | - | 14,473,180 | - |
Interest Rates (DI1 and DIA) | 32,690,685 | - | 26,456,303 | - | 23,756,523 | - |
Foreign Currency | 32,456,813 | - | 16,733,437 | - | 1,393,538 | - |
Indexes(3) | 466,168 | - | 1,780,311 | - | 195,160 | - |
Others | - | - | 219,035 | - | 578,055 | - |
Sold Position | 203,304,466 | - | 106,919,574 | - | 64,254,724 | - |
Exchange Coupon (DDI) | 146,948,795 | - | 55,016,928 | - | 15,048,490 | - |
Interest Rates (DI1 and DIA) | 54,160,203 | - | 51,135,994 | - | 29,047,678 | - |
Foreign Currency | 1,992,574 | - | 745,849 | - | 17,384,256 | - |
Indexes(3) | 202,894 | - | 20,803 | - | 185,506 | - |
Treasury Bonds/Notes | - | - | - | - | 2,588,794 | - |
Forward Contracts and Others | 90,910,841 | 1,055,456 | 47,823,561 | (720,823) | 50,853,154 | 1,643,013 |
Purchased Commitment | 38,666,269 | 1,303,561 | 23,506,096 | 647,376 | 20,864,170 | 3,386,347 |
Currencies | 38,095,625 | 1,250,706 | 21,525,220 | 618,007 | 19,951,984 | 3,391,275 |
Others | 570,644 | 52,855 | 1,980,876 | 29,369 | 912,186 | (4,928) |
Sold Commitment | 52,244,572 | (248,105) | 24,317,465 | (1,368,199) | 29,988,984 | (1,743,334) |
Currencies | 51,958,529 | (252,160) | 22,096,104 | (1,364,617) | 29,911,406 | (1,826,965) |
Others | 286,043 | 4,055 | 2,221,361 | (3,582) | 77,578 | 83,631 |
(1) Nominal value of updated contracts.
(2) Includes options of index, mainly being options involving US treasury, shares and stock indexes.
(3) Includes Bovespa and S&P index.
a.2) Derivatives Financial Instruments by Counterparty
Notional |
|
|
| 2018 |
|
| Related | Financial |
|
| Customers | Parties | Institutions(1) | Total |
"Swap" | 34,296,821 | 32,669,900 | 110,267,148 | 177,233,869 |
Options | 14,636,017 | 1,086,323 | 319,350,740 | 335,073,080 |
Futures Contracts | - | - | 289,508,200 | 289,508,200 |
Forward Contracts and Others | 39,024,978 | 48,641,894 | 3,243,969 | 90,910,841 |
(1) Includes trades with B3 S.A. and other securities and commodities exchanges.
Notional |
|
|
| 2017 | 2016 |
|
| Related | Financial |
|
|
| Customers | Parties | Institutions(1) | Total | Total |
"Swap" | 32,912,721 | 19,599,395 | 149,569,098 | 202,081,214 | 196,887,188 |
Options | 11,263,513 | 1,240,309 | 177,557,787 | 190,061,609 | 175,841,405 |
Futures Contracts | - | - | 161,725,596 | 161,725,596 | 104,651,180 |
Forward Contracts and Others | 25,470,287 | 18,816,991 | 3,536,283 | 47,823,561 | 50,853,154 |
(1) Includes trades with B3 S.A. and other securities and commodities exchanges.
a.3) Derivatives Financial Instruments by Maturity
Notional |
|
|
|
| 2018 |
|
| Up to | From 3 to | Over |
|
|
| 3 Months | 12 Months | 12 Months | Total |
"Swap" |
| 12,347,864 | 70,975,477 | 93,910,528 | 177,233,869 |
Options |
| 63,376,042 | 220,982,952 | 50,714,086 | 335,073,080 |
Futures Contracts |
| 159,221,909 | 67,578,078 | 62,708,213 | 289,508,200 |
Forward Contracts and Others |
| 40,186,310 | 31,255,384 | 19,469,147 | 90,910,841 |
Consolidated Financial Statements - December 31, 2018 54
Notional |
|
|
| 2017 | 2016 |
| Up to | From 3 to | Over |
|
|
| 3 Months | 12 Months | 12 Months | Total | Total |
"Swap" | 20,705,247 | 51,021,102 | 130,354,865 | 202,081,214 | 196,887,188 |
Options | 46,139,545 | 89,403,700 | 54,518,364 | 190,061,609 | 175,841,405 |
Futures Contracts | 65,489,476 | 55,490,159 | 40,745,961 | 161,725,596 | 104,651,180 |
Forward Contracts and Others | 25,015,557 | 14,250,495 | 8,557,509 | 47,823,561 | 50,853,154 |
a.4) Derivatives by Market Trading
Notional | Stock Exchange(1) | Over the Counter | 2018 |
| Total | ||
"Swap" | 39,880,578 | 137,353,291 | 177,233,869 |
Options | 307,644,530 | 27,428,550 | 335,073,080 |
Futures Contracts | 289,508,200 | - | 289,508,200 |
Forward Contracts and Others | 323,413 | 90,587,428 | 90,910,841 |
(1) Includes trades with B3 S.A.
Notional | Stock Exchange(1) |
| Over the Counter | 2017 | 2016 |
| Cetip |
| Total | Total | |
"Swap" | - | 67,112,505 | 134,968,709 | 202,081,214 | 196,887,188 |
Options | - | 172,144,700 | 17,916,909 | 190,061,609 | 175,841,405 |
Futures Contracts | - | 161,725,596 | - | 161,725,596 | 104,651,180 |
Forward Contracts and Others | - | 395,212 | 47,428,349 | 47,823,561 | 50,853,154 |
(1) Includes trades with B3 S.A.
a.5) Information on Credit Derivatives
Banco Santander uses credit derivatives with the objectives of performing counterparty risk management and meeting its customers' demands, performing protection purchase and sale transactions through credit default swaps and total return swaps, primarily related to Brazilian sovereign risk securities.
TotalReturn Swaps – TRS
Credit derivatives are where the exchange of the return of the reference obligation occurs through a cash flow and where, in the event of a credit event, the protection buyer is usually entitled to receive from the protection seller the equivalent of the difference between the and the fair value (market value) of the reference obligation on the settlement date of the contract.
Credit Default Swaps – CDS
These are credit derivatives where, in the event of a credit event, the protection buyer is entitled to receive from the protection seller the equivalent of the difference between the face value of the CDS agreement and the fair value (market value) of the reference obligation on the settlement date of the contract. In return, the seller receives compensation for the sale of the protection.
Below, the composition of the Credit Derivatives portfolio shown by its reference value and effect in the calculation of Required Stockholders' Equity.
|
|
|
|
|
|
| 2018 |
|
|
|
|
| Nominal Value |
| Nominal Value |
| Retained Risk |
| Transferred Risk - |
| Total Rate of Return Swap |
| Credit Swap |
Credit Swaps | 1,959,128 |
| 416,541 |
Total | 1,959,128 |
| 416,541 |
Value referring to the premium paid on CDS for use as collateral (transfer of risks) in the amount of R$1,288.
The effect in the Required Stockholder’s Equity of the risk received was R$84,487.
During the period, there was no occurrence of credit event related to the events generated by the contracts.
Consolidated Financial Statements - December 31, 2018 55
|
|
|
|
|
|
| 2018 |
| Over |
|
|
Maximum Potential for Future Payments - Gross | 12 Months |
| Total |
Per Instrument |
|
|
|
CDS | 1,959,128 |
| 1,959,128 |
Total | 1,959,128 |
| 1,959,128 |
Per Risk Classification |
|
|
|
Below Investment Grade | 1,959,128 |
| 1,959,128 |
Total | 1,959,128 |
| 1,959,128 |
Per Reference Entity |
|
|
|
Brazilian Government | 1,959,128 |
| 1,959,128 |
Total | 1,959,128 |
| 1,959,128 |
a.6) Hedge Accounting
There are three types of hedge accounting: Fair Value Hedge, Cash Flow Hedge and Foreing Currency Investments Hedge.
Fair Value Hedge
Banco Santander’s fair value strategy consists of hedging the exposure to changes in fair value related to recognized assets and liabilities.
The adopted fair value management methodology segregates transactions by risk factor (e.g. Real/Dollar foreign exchange risk, fixed Reais interest rate risk, Dollar foreign exchange coupon risk, inflation risk, interest rate risk, etc.). The transactions generate exposures that are consolidated by risk factor and compared with internal pre-established limits.
In order to hedge the changes of fair value in receivables and interest payments, Santander uses interest rate Swap contracts related to pre-fixed assets and liabilities.
Banco Santander applies fair value hedge as follows:
• The Bank contracts Foreign Currency + Coupon against % CDI swaps and designates them as a derivative instrument in a Hedge Accounting structure with foreign currency loans operations as the hedged item in this relationship. The hedging relationships were designated in January 2016 and the related Swaps will mature between March 2019 and 2024.
• The Bank has a portfolio of loan assets issued in foreign currency - Dollar at a fixed rate in the Balance Sheet of the “Santander EFC” (independent subsidiary in Spain), whose functional currency is the euro. In order to manage this mismatch, the Bank designates each Foreign Currency Floating EUR versus Fixed Dollar swap as the fair value hedge of the corresponding loan. The hedging relationships were designated in 2013 and the related Swaps will mature between June 2019 and 2022.
• The Bank has a portfolio of Euro-indexed Assets traded in the Cayman Islands. In the Euro transaction, the value of the Dollar asset will be converted into Euro at the exchange rate in the contract on the date of recorded of the transaction. After the conversion, the principal, already denominated in Euro will be restated by % CDI or a pre-fixed rate. The Assets will be covered by Cross Currency Swaps in order to transfer the risk in Euro to LIBOR + Coupon. The hedging relationships were designated in February 2017 and the related Swaps will mature between 2022 and 2024.
• The Bank has a pre-fixed interest rate risk generated by Government Securities (NTN-F and LTN) in the available for sale portfolio. To manage this mismatch, it contracts DI futures on the BM&FBovespa and designates them as a derivative instrument in a Hedge Accounting structure, with the object of this relationship being fixed-rate government securities (NTN-F and LTN). The hedge relationships were designated in March 2017 and matures in 2027.
• The Bank has an inflation-linked risk generated by Debenture in the available for sale portfolio. To manage this mismatch, it contracts DAP futures on the BM&FBovespa and designates them as a derivative instrument in a Hedge Accounting structure. The hedge relationships were designated in June 2018 and matures in 2028.
In order to assess the effectiveness and measure the ineffectiveness of the strategies, the institution complies with international accounting standard IAS 39, which requires that the effectiveness test be performed at the beginning (prospective test) of the hedge structure and be repeated periodically (prospective and retrospective tests) in order to demonstrate that the hedge ratio remains effective.
a) Prospective test: In accordance with the standard, the prospective test must be performed on the inception date and on a quarterly basis in order to demonstrate that the expectations regarding the effectiveness of the hedge ratio are high.
a.1) Initial prospective test (at inception): it is restricted to a qualitative review of the critical terms and conditions of the hedging instrument and the hedged item in order to conclude whether changes in the fair value of the two instruments are expected to fully offset each other.
a.2) Periodic prospective test: the sensitivity of the fair value of the hedged item and the hedging instrument will be periodically computed at a parallel variation of 10 basis points in the interest rate curve. For the purposes of effectiveness, these two sensitivity ratios should be between 80% and 125%.
b) Retrospective test: the retrospective effectiveness test will be performed by comparing the MTM change of the hedging instrument since the inception date with the MTM change of the hedged item since the inception date.
In fair value hedges, gains or losses, both on hedging instruments and hedged items (attributable to the type of risk being hedged) are recognizeddirectly in the consolidated statement of income.
Consolidated Financial Statements - December 31, 2018 56
|
| 2018 | 2017 | 2016 | |||
| Hedge Structure | Effective Portion Accumulated | Portion Ineffective | Effective Portion Accumulated | Portion Ineffective | Effective Portion Accumulated | Portion Ineffective |
Fair Value Hedge |
|
|
|
|
|
| |
| Brazilian Treasury Bonds (LTN, NTN-F) | (1,381,156) | - | (388,446) | - | - | - |
| Eurobonds | - | - | - | - | 13,163 | - |
| Bonds (LEA) | (191,472) | - | (1,200) | - | - | - |
| Resolution 2770 | 689 | - | 304 | - | - | - |
| Trade Finance Off | (58,020) | - | (57,386) | - | 20,471 | - |
| Total | (1,629,959) | - | (446,728) | - | 33,634 | - |
| 2018 | 2017 | 2016 | |||
| Adjustment |
| Adjustment |
| Adjustment |
|
| to Market | Fair Value | to Market | Fair Value | to Market | Fair Value |
Hedge Instruments |
|
|
|
|
|
|
Swap Contracts | (118,807) | (98,020) | (95,672) | (130,683) | (26,703) | (136,467) |
Assets | 56,633 | 4,398,851 | 12,954 | 3,005,666 | 11,486 | 1,046,012 |
CDI (Interbank Deposit Rates)(5) (8) | (1,057) | 1,722,515 | (357) | 1,818,366 | - | - |
Indexed to Foreign Currency - Pre Dollar (1) | - | - | 320 | 8,742 | 1,103 | 17,678 |
Indexed to Foreign Currency - USD/BRL - Dollar (2)(3) (4) | 24,411 | 2,161,661 | (23,585) | 691,872 | (8,957) | 744,260 |
Indexed to Foreign Currency - Euro(6)(7) | 33,279 | 514,675 | 36,576 | 486,686 | 19,340 | 284,074 |
Liabilities | (175,440) | (4,496,871) | (108,626) | (3,136,349) | (38,189) | (1,182,479) |
Indexed to Foreign Currency - US Dollar (6) | (16,325) | (301,011) | (20,109) | (261,915) | (14,958) | (323,197) |
Indexed to Foreign Currency - Pre Dollar(5) | (10,030) | (201,819) | (16,303) | (225,857) | (1,103) | (17,676) |
CDI (Interbank Deposit Rates)(1)(2) | (63,971) | (1,739,553) | (21,380) | (474,398) | (18,395) | (804,059) |
Fixed Interest Rate - Real(3) (8) | (43,801) | (1,701,759) | 22 | (1,640,708) | (3,733) | (37,547) |
Indexed to Foreign Currency - Colombian Peso (7) | (5,197) | (195,671) | (13,863) | (219,392) | - | - |
Indexed to Foreign Currency - Pre Euro(4) | (36,116) | (357,058) | (36,993) | (314,079) | - | - |
Object of Hedge |
|
|
|
|
|
|
Assets | 84,343 | 4,334,737 | 77,623 | 3,126,828 | 23,165 | 693,132 |
Loans and Receivables | 89,935 | 1,840,614 | 79,496 | 1,382,326 | 15,287 | 546,740 |
Indexed to Foreign Currency - US Dollar(6) | 1,315 | 299,403 | 4,319 | 288,420 | 4,809 | 323,780 |
Indexed to Foreign Currency - Pre Dollar(5) | 10,019 | 200,490 | 16,416 | 224,943 | - | - |
CDI (Interbank Deposit Rates) (2) | 40,150 | 766,399 | 16,401 | 352,071 | 10,478 | 222,960 |
Fixed Interest Rate - Real(3) | 1,533 | 33,063 | 3,900 | 21,077 | - | - |
Indexed to Foreign Currency - Colombian Peso(7) | 64 | 190,558 | (2,898) | 173,990 | - | - |
Indexed to Foreign Currency - Pre Euro(4) | 36,854 | 350,701 | 41,358 | 321,825 | - | - |
Debt instruments | (5,592) | 2,494,123 | (1,873) | 1,744,502 | 7,878 | 146,392 |
Promissory Notes - NP | 31,518 | 852,029 | 445 | 125,973 | 7,878 | 146,392 |
CDI (Interbank Deposit Rates) (1)(2) | 28,046 | 811,906 | 354 | 119,892 | 2,775 | 108,845 |
Fixed Interest Rate - Real(3) | 3,472 | 40,123 | 91 | 6,082 | 5,103 | 37,547 |
National Treasury Notes - NTN F(8) | (37,110) | 1,642,094 | (2,318) | 1,618,529 | - | - |
Liabilities | - | - | - | - | 12,830 | (803,929) |
Foreign Borrowings | - | - | - | - | 12,830 | (803,929) |
Indexed to Foreign Currency - US Dollar (2) | - | - | - | - | 12,830 | (803,929) |
Consolidated Financial Statements - December 31, 2018 57
|
|
|
|
| 2018 | 2017 |
Hedge Instruments |
|
|
|
|
|
|
Swap Contracts |
|
|
|
| 34,513,380 | 22,206,615 |
Interest Rate (DI1 and DIA) |
|
|
|
| 33,861,121 | 22,206,615 |
Indexed to Price - IPCA (DAP) |
|
|
|
| 652,259 | - |
|
|
|
|
|
|
|
|
|
|
|
| 2018 |
|
| 2017 |
|
|
|
| Adjustment |
| Adjustment |
|
Object of Hedge |
|
|
| to Market | Fair Value | to Market | Fair Value |
Assets |
|
|
| 968,329 | 36,985,493 | 364,434 | 24,779,831 |
Securities - Available for Sale |
|
|
|
|
|
|
|
Government Securities |
|
|
| 937,017 | 36,377,478 | 364,434 | 24,779,831 |
National Treasury Bills - LTN |
|
|
| 357,330 | 24,650,965 | 219,611 | 13,893,932 |
National Treasury Notes - NTN F |
|
|
| 517,063 | 10,510,482 | 144,823 | 10,885,899 |
Private Securities |
|
|
| 31,312 | 608,015 | - | - |
Debentures |
|
|
| 31,312 | 608,015 | - | - |
(1) Passive instruments whose hedged items are securities represented by promissory notes indexed in Certificates of Interbank Deposits (CDI) with market value of R$811,906 (12/31/2017 - R$109,538).
(2) These are passive instruments whose hedge items are credit operations and securities represented by promissory notes indexed in interbank deposit certificates (CDI), with market value of credit operations of R$766,399 (12/31/2017 - R$352,071) and in December 31, 2017, promissory notes in the amount of R$10,354.
(3) These are passive instruments whose hedged items are securities and securities represented by promissory notes indexed to Real interest rates with market value of R$40,124 (12/31/2017 - R$6,082 and 12/31/2016 - R$37,547) and credit operations in the amount of R$33,063 (12/31/2017 – R$21,077).
(4) These are passive instruments whose hedged items are credit operations indexed in foreign currency - euro at the market value of R$350,701 (12/31/2017 – R$321,825).
(5) These are passive instruments whose hedged items are credit operations indexed in foreign currency - US dollar in the market value of R$200,491 (12/31/2017 – R$224,943). (6) These are passive instruments whose hedge items are credit operations indexed in foreign currency - US dollar with a market value of R$299,404 (12/31/2017 - R$288,420).
(7) These are passive instruments whose hedged items are credit operations indexed in foreign currency - Colombian peso with market value of R$190,559 (12/31/2017 - R$173,990).
(8) These are obligations over instruments whose hedged items are pre-fixed government securities with a market value e of R$1,624,094 (12/31/2017 - R$1,618,529).
(9) Current value of the instruments as of December 31, 2018 is R$22,206,615.
Cash Flow Hedge
Banco Santander’s cash flow hedge strategies consist of hedging exposure to changes in cash flows, interest payments and the exchange rate, which are attributable to changes in the interest rates related to recognized assets and liabilities and changes in the exchange rate of non-recognized assets and liabilities.
Banco Santander applies cash flow hedges as follows:
• It contracts Fixed Dollar Liabilities and Reais/Euro Asset swaps and designates them as a derivative instrument in a Cash Flow Hedge structure, having Reais/Euro funding operations with third-parties in the Cayman Islands as the hedged item in this relationship. The hedging relationships were designated in May 2018 and the related hedges will mature between February 2019 and 2020.
�� It contracts USD futures or DDI + DI Futures (Synthetic Dollar Futures) and designates them as a derivative instrument in a Cash Flow Hedge structure, having part of its dollar Loan portfolio as the hedged item in this relationship. The hedging relationships were designated in 2007 and the related hedges will mature between January 2019 and 2028.
• The Cash Flow Hedge Futures structure, consisting of futures (DI1F21 and DI1F23) maturing in January 2021 and January 2023, were partially discontinued throughout November 2018. Hedge objects were securities available for sale - Financial Treasury Bills - LFT. The mark-to-market effect of these contracts, net of tax effects, and which are posted in shareholders' equity corresponds to a credit in the amount of R$122,364, of which R$36,846 will be realized against income / expenses in the next twelve months, from January 2019.
In cash flow hedges, the effective portion of the change in the value of the hedging instrument is temporarily recognized in shareholders' equity under"Other comprehensive income - cash flow hedges" until the forecasted transactions occur, when that portion is recognized in the consolidated statements of income, except if the forecasted transactions result in the recognition of non-financial assets or liabilities, this portion will be included in the cost of the financial asset or liability. The non-effective portion of the variation in the value of exchange rate hedge derivatives is recognized directly in the consolidated statements of income. And the non-effective portion of the gains and losses on cash flow hedging instruments in a foreign operation is recognized directly in "Gains (losses) on financial assets and liabilities (net)" in the consolidated statements of income.
Consolidated Financial Statements - December 31, 2018 58
In this hedge strategy the effectiveness tests (prospective and retrospective) are conducted through creation of two hypothetical derivatives, one for the object and another for the instrument.
The hypothetical derivative of the object is a conceptual swap where the liability leg simulates the “stable portion” to be protected and the asset leg is identical to the Pre-fixed leg of the derivative designated as hedge. For the hypothetical derivative of the instrument the asset leg will be set by the number of contracts of the future and the liability leg will be the pre-fixed rate negotiated on the acquisition of these contracts. The hypothetical derivative is stable once the contracts are kept until the maturity. Any ineffectiveness will be recognized in profit or loss.
Any ineffectiveness is recognized in profit or loss.
a)Prospective Test: in accordance with the standard, the prospective test should be performed on the inception date and on a quarterly basis in order to demonstrate that the expectations regarding the effectiveness of the hedge ratio are high. However, the tests are carried out on a monthly basis in order to monitor the projections in a proactive and more efficient manner, in addition to ensuring better maintenance of test-related routines.
a.1) Periodic Prospective Test: According to the agreed process flow, Market Risk performs the projections of three scenarios to the tests, being: 1st 10bps in the curve; 2nd 50bps in the curve and 3rd 100bps in the curve. Using the validated estimates, the VPE Finance Strategy and Quality - Management Information | Products & Segments will perform the prospective tests through the valuation of the two legs variable from operation to market.
a.2) Initial Prospective Test: the methodology of the periodic prospective test should also be applied on the initial date of each new strategy.
b) Retrospective Test: It should be made monthly with historical data to demonstrate cumulatively that the hedge was effective, according to the methodology presented previously. Any ineffectiveness are recognized in profit or loss.
The Ineffective portion is recognized through the prospective hedge test.
Effectiveness should range between 80% and 125%.
In cash flow hedges, the effective portion of changes in the value of the hedging instrument is temporarily recognized in equity under “Other comprehensive income - cash flow hedges” (Note 26) until the expected transactions occur, when this portion is then recognized in the consolidated income statement. However, if the expected transactions result in the recognition of non-financial assets or liabilities, this portfolio will be included in the cost of financial assets or liabilities. The non-effective portion of the change in the value of foreign exchange hedging derivatives is recognized directly in the consolidated income statement. And the non-effective portion of gains and losses on cash flow hedging instruments in a foreign operation is recognized directly in “Gains (losses) with (net) financial assets and liabilities” in the consolidated income statement.
|
| 2018 | 2017 | 2016 | |||
| Hedge Structure | Effective Portion Accumulated | Portion Ineffective | Effective Portion Accumulated | Portion Ineffective | Effective Portion Accumulated | Portion Ineffective |
Cash Flow Hedge |
|
|
|
|
|
| |
| Eurobonds | (8,925) | - | (25,576) | - | (20,535) | - |
| Trade Finance Off | (16,453) | (3,981) | (94,896) | 9,267 | - | - |
| Government Securities (LFT) | 331,922 | - | 129,995 | - | - | - |
| Bank Deposit Certificate - CDB | 1,225 | - | 129,995 | - | - | - |
| Loans and Receivables | - | - | - | - | 174,956 | - |
| Total | 307,769 | (3,981) | 139,518 | 9,267 | 154,421 | - |
| 2018 | 2017 | 2016 | |||
| Adjustment |
| Adjustment |
| Adjustment |
|
| to Fair Value | Fair Value | to Fair Value | Fair Value | to Fair Value | Fair Value |
Hedge Instruments |
|
|
|
|
|
|
Swap Contracts | 12,757 | 218,424 | (25,142) | 160,114 | (27,261) | 48,169 |
Asset | (11,470) | 2,421,200 | 97,846 | 2,361,070 | 137,664 | 1,952,189 |
Indexed to Foreign Currency - Pre Dollar (1) | (123,696) | 1,131,928 | (42,149) | 992,879 | 84,812 | 1,477,821 |
Indexed to Foreign Currency - Euro (3) | 111,124 | 1,122,779 | 134,435 | 1,223,004 | 52,852 | 474,368 |
Indexed to Foreign Currency - USD/BRL - Dollar (2) | 1,102 | 166,493 | 5,560 | 145,187 | - | - |
Liabilities | 24,227 | (2,202,776) | (122,988) | (2,200,956) | (164,925) | (1,904,020) |
CDI (Interbank Deposit Rates) (1) (2) | (504) | (160,754) | (5,735) | (147,925) | (995) | (341,938) |
Indexed to Foreign Currency - Pre Reais (1) | - | - | - | - | (1,288) | (199,954) |
Indexed to Foreign Currency - Pre Euro (1) | 92,505 | (972,290) | 13,639 | (895,399) | (102,998) | (805,326) |
Indexed to Foreign Currency - Dollar (3) | (67,774) | (1,069,732) | (130,892) | (1,157,632) | (59,367) | (548,684) |
Indexed to Foreign Currency - Reais (3) | - | - | - | - | (277) | (8,118) |
Consolidated Financial Statements - December 31, 2018 59
|
|
|
| 2018 | 2017 | 2016 |
|
|
|
| Notional | Notional | Notional |
|
|
|
|
|
|
|
|
|
|
| 44,541,938 | 60,299,595 | 80,149,530 |
Trade Finance Operations(4) |
|
|
| 44,000,952 | 54,995,334 | 80,149,530 |
Foreign Currency – Dollar |
|
|
| 9,408,707 | 3,362,582 | 450,571 |
Interest Rate (DI1 and DIA) |
|
|
| 21,981,748 | 32,344,276 | 46,314,644 |
Interest Rate DDI1 |
|
|
| 12,610,496 | 19,288,476 | 33,384,315 |
Securities-available for sale |
|
|
| 540,987 | 5,304,261 | - |
Interest rate (DI1 and DIA) |
|
|
| 540,987 | 5,304,261 | - |
|
|
|
|
|
|
|
|
|
|
|
|
|
|
|
|
|
| 2018 | 2017 | 2016 |
Hedge Item – Cost |
|
|
|
|
|
|
Assets |
|
|
| 19,678,934 | 25,697,292 | 27,858,923 |
Lending Operations - Financing and Export Credit and Imports (3) (4) |
|
| 10,113,706 | 8,295,191 | 10,816,780 | |
Loans and Receivables (2) (3) (4) |
|
|
| 6,704,113 | 9,972,640 | 13,870,897 |
Financial Assets Measured at Amortized Cost (4) |
|
|
| - | 354,315 | 529,997 |
Brazilian Foreign Debt Bonds (1) |
|
|
| 894,331 | 809,660 | 701,300 |
Available for sale - Promissory Notes - NP (2) (4) |
|
|
| 1,653,969 | 1,194,266 | 1,939,949 |
Government Securities -LFT(5) |
|
|
| 312,815 | 5,071,220 | - |
Liabilities |
|
|
| - | - | (1,332,972) |
Foreign Borrowings (4) |
|
|
| - | - | (1,332,972) |
(1) Operation with maturity date as April 1st, 2021 (12/31/2017 – operation with maturity date as April 1st, 2021), which hedge objects are securities represented by Brazilian external bonds.
(2) Operations with maturity dates between April 2019 and February 2020 (12/31/2017 – operations with maturity dates between January and April, 2018), which hedge objects in 2018 are loans and in 2017 are securities represented by promissory notes.
(3) Operations with maturity dates between January 2019 and February 2022 (12/31/2017 – operations with maturity dates between January 2018 and September 2022 and 12/31/2016 - operations with maturity dates between January 2017 and December 2025), which hedge objects are credit operations with credit entities.
(4) Operations with maturity dates between January 2019 and September 2022 (12/31/2017 – operations with maturity dates between January 2018 and December 2020), which hedge objects are funding operations represented by Certificates of Interfinance Deposits – CDI, Bill of Exchange – LC and Financial Letter - LF.
(5) Operations with maturity dates between February 2019 and December 2028 (12/31/2017 - operations with maturity dates between February 2018 and November 2026 and 12/31/2016 - operations with maturity dates between January 2017 and January 2018) and updated amount of R$16,738,641 (31/12/2017 - R$16,811,747 and 31/12/2016 - R$29,164,917) where the operations are derivatives future contracts in Dolar, DI and DDI. Those derivatives combined with trade finance operations are used to hedge the following objects: credit operations - import and export financing, loans, other credit operations and securities represented by promissory notes.
(6) Operation with maturity date between September 2020 and March 2023 (12/31/2017 – operations with maturity dates between March 2021 and March 2023), which hedge objects are Financial Letters – LFT, booked in the heading of securities.
The effect of marking to market the swaps and future contracts corresponds to a credit in the amount of R$76,534 (2017 - 116,441 and 2016 - R$69,489) accounted on Stockholders equity, net of tax effects, of which R$2,450 (12/31/2017 - R$9,342) will be realized in the next twelve months, starting in 2019.
Hedging of Foreign Investments
Banco Santander reevaluated the investment structure of the wholly-owned subsidiary in Madrid (EFC), as it noted that due to the change in the strategy of the operation in practice, this subsidiary has a business model in which the Bank has a significant influence on driving and decision-making of its activities. According to the concept discussed in IAS 21, Management concluded that the functional currency of this investment is the Real and, therefore, this change becomes effective prospectively as from January 2017. In addition, the Hedge Accounting structure of Foreign investment that Banco Santander had on this investment was discontinued as of the date of change of the functional currency. In this way, the functional currency of Santander EFC and the Cayman agency is Real and the exchange rate differences of operations in foreign currency are recorded in the income statement. In order to hedge the exchange rate exposures, the Bank uses derivatives, and for both investments abroad the Bank does not apply Hedge Accounting. Foreign exchange variations on foreign currency transactions and the effect of derivatives used in economic protection (futures contracts) are recorded in the income statement.
Consolidated Financial Statements - December 31, 2018 60
The margin used as guarantee of the transactions traded on the B3 S.A. with derivative financial instruments from own and third parties portfolios are composed by government securities.
| 2018 | 2017 | 2016 |
|
|
|
|
Financial Treasury Bill - LFT | 7,552,926 | 708,960 | 1,556,804 |
National Treasury Bill - LTN | 3,392,886 | 4,371,286 | 4,636,644 |
National Treasury Notes - NTN | 873,134 | 1,193,315 | 27,598 |
| 11,818,946 | 6,273,561 | 6,221,046 |
b) Short positions
On December 31, 2018 the balance of short positions totaled R$32,695,677 (2017 - R$32,808,392 and 2016 - R$31,694,269) which includes the amount of financial liabilities resulting from the direct sale of financial assets purchased through resale or loan commitments.
9.Loans and advances to clients
a) Breakdown
The breakdown, by classification, of the balances of “Loans and advances to clients” in the consolidated financial statements is as follows:
Thousand of reais |
|
|
|
|
|
|
|
| 2018 |
| 2017 |
| 2016 |
|
|
|
|
|
|
|
|
|
|
|
|
|
|
Classification: |
|
|
|
|
|
|
|
|
|
|
|
|
|
Non-Trading Financial Assets Mandatorily Measured At Fair Value Through Profit Or Loss | 619,180 |
| - |
| - | ||||||||
Loans and Receivables |
|
|
|
|
|
|
|
| - |
| 272,420,157 |
| 252,002,774 |
Financial Assets Measured At Amortized Cost |
|
|
|
|
| 301,072,207 |
| - |
| - | |||
Of which: |
|
|
|
|
|
|
|
|
|
|
|
|
|
Loans and receivables at amortized cost |
|
|
|
|
|
| 321,314,010 |
| 287,829,213 |
| 268,437,556 | ||
Impairment losses |
|
|
|
|
|
|
|
| (20,241,803) |
| (15,409,056) |
| (16,434,782) |
Loans and advances to customers, net |
|
|
|
|
|
| 301,691,387 |
| 272,420,157 |
| 252,002,774 | ||
Loans and advances to customers, gross |
|
|
|
|
|
| 321,933,190 |
| 287,829,213 |
| 268,437,556 | ||
|
|
|
|
|
|
|
|
|
|
|
|
|
|
Thousand of reais |
|
|
|
|
|
| 2018 |
| 2017 |
| 2016 | ||
|
|
|
|
|
|
|
|
|
|
|
|
|
|
Type: |
|
|
|
|
|
|
|
|
|
|
|
|
|
Loans operations(1) |
|
|
|
|
|
|
|
| 308,364,517 |
| 272,561,017 |
| 257,256,452 |
Lease Portfolio |
|
|
|
|
|
|
|
| 1,836,504 |
| 1,888,444 |
| 2,092,882 |
Repurchase agreements |
|
|
|
|
|
|
|
| 509,147 |
| 403,415 |
| 308,483 |
Other receivables(2) |
|
|
|
|
|
|
|
| 11,223,022 |
| 12,976,337 |
| 8,779,739 |
Total |
|
|
|
|
|
|
|
| 321,933,190 |
| 287,829,213 |
| 268,437,556 |
(1) Includes loans and other loans with credit characteristics.
(2) Refers substantially to Foreign Exchange Transactions and Other Receivables with credit granting characteristics.
Note 44-d contains a detail of the residual maturity periods of loans and receivables.
There are no loans and advances to clients for material amounts without fixed maturity dates.
b) Detail
Following is a detail, by loan type and status, borrower sector and interest rate formula, of the loans and advances to clients, which reflect the Bank’s exposure to credit risk in its core business, gross of impairment losses:
Thousand of reais | 2018 | 2017 | 2016 |
Loan borrower sector: |
|
|
|
Commercial, and industrial | 146,293,616 | 140,619,110 | 140,992,900 |
Real estate-construction | 36,515,352 | 34,808,681 | 36,650,011 |
Installment loans to individuals | 137,287,593 | 110,512,978 | 88,701,763 |
Lease financing | 1,836,629 | 1,888,444 | 2,092,882 |
Total | 321,933,190 | 287,829,213 | 268,437,556 |
Thousand of reais | 2018 | 2017 | 2016 | |
Interest rate formula: |
|
|
| |
Fixed interest rate | 240,772,724 | 202,592,491 | 178,231,509 | |
Floating rate | 81,160,466 | 85,236,722 | 90,206,047 | |
Total | 321,933,190 | 287,829,213 | 268,437,556 | |
Consolidated Financial Statements - December 31, 2018 61
|
|
|
|
|
|
|
|
| 2018 |
Debt Sector by Maturity | Less than 1 year | % of total | Between 1 and 5 years | % of total | More than 5 years | % of total | Total | % of total | |
Commercial and industrial | 109,802,828 | 58.92% | 32,538,999 | 32.77% | 3,951,789 | 10.90% | 146,293,616 | 45.44% | |
Real estate | 4,298,925 | 2.31% | 7,964,308 | 8.02% | 24,252,119 | 66.90% | 36,515,352 | 11.34% | |
Installment loans to individuals | 71,433,099 | 38.33% | 57,808,600 | 58.21% | 8,045,894 | 22.20% | 137,287,593 | 42.64% | |
Lease financing | 838,659 | 0.45% | 997,644 | 1.00% | 326 | 0.00% | 1,836,629 | 0.57% | |
Loans and advances to customers, gross | 186,373,511 | 100.00% | 99,309,551 | 100.00% | 36,250,128 | 100.00% | 321,933,190 | 100.00% | |
|
|
|
|
|
|
|
|
|
|
|
|
|
|
|
|
|
|
|
|
|
|
|
|
|
|
|
|
| 2017 |
Debt Sector by Maturity | Less than 1 year | % of total | Between 1 and 5 years | % of total | More than 5 years | % of total | Total | % of total | |
Commercial and industrial | 103,377,571 | 61.65% | 31,262,492 | 37.89% | 5,979,047 | 19.25% | 37,241,539 | 48.85% | |
Real estate | 7,791,753 | 5.35% | 10,970,004 | 13.29% | 16,046,924 | 51.65% | 34,808,681 | 12.09% | |
Installment loans to individuals | 62,078,225 | 32.29% | 39,393,699 | 47.74% | 9,041,054 | 29.10% | 110,512,978 | 38.40% | |
Lease financing | 1,000,418 | 0.71% | 886,833 | 1.07% | 1,193 | 0.00% | 1,888,444 | 0.66% | |
Loans and advances to customers, gross | 174,247,967 | 100.00% | 82,513,028 | 99.99% | 31,068,218 | 100.00% | 184,451,642 | 100.00% | |
|
|
|
|
|
|
|
|
|
|
|
|
|
|
|
|
|
|
| 2016 |
Debt Sector by Maturity | Less than 1 year | % of total | Between 1 and 5 years | % of total | More than 5 years | % of total | Total | % of total | |
Commercial and industrial | 99,657,024 | 61.65% | 35,789,118 | 37.89% | 554675800.00% | 19.25% | 41,335,876 | 48.85% | |
Real estate | 8,648,702 | 5.35% | 11,761,420 | 13.29% | 16,239,889 | 51.65% | 36,650,011 | 12.09% | |
Installment loans to individuals | 52,205,927 | 32.29% | 30,867,880 | 47.74% | 5,627,956 | 29.10% | 88,701,763 | 38.40% | |
Lease financing | 1,152,579 | 0.71% | 937,951 | 1.07% | 2,352 | 0.00% | 2,092,882 | 0.66% | |
Loans and advances to customers, gross | 161,664,232 | 100.00% | 79,356,369 | 99.99% | 27,416,955 | 100.00% | 168,780,532 | 100.00% | |
|
|
|
|
|
|
|
|
|
|
Thousand of reais |
|
|
|
|
| 2018 | 2017 | 2016 | |
|
|
|
|
|
|
|
|
|
|
Maturity |
|
|
|
|
|
|
|
| |
Less than 1 year |
|
|
|
|
| 186,373,511 | 174,247,968 | 161,664,232 | |
Between 1 and 5 years |
|
|
|
|
| 99,309,551 | 82,513,030 | 79,356,369 | |
More than 5 years |
|
|
|
|
| 36,250,128 | 31,068,215 | 27,416,955 | |
Loans and advances to customers, gross |
|
|
|
| 321,933,190 | 287,829,213 | 268,437,556 | ||
|
|
|
|
|
|
|
|
|
|
Internal risk classification |
|
|
|
|
| ||||
Low |
|
|
|
|
| 240,440,294 | 226,098,497 | 207,889,639 | |
Medium-low |
|
|
|
|
| 50,485,682 | 33,635,378 | 32,104,168 | |
Medium |
|
|
|
|
| 11,967,262 | 10,423,293 | 10,940,879 | |
Medium - high |
|
|
|
|
| 7,722,198 | 8,215,024 | 6,976,969 | |
High |
|
|
|
|
| 11,317,754 | 9,457,021 | 10,525,901 | |
Loans and advances to customers, gross |
|
|
|
|
|
| 321,933,190 | 287,829,213 | 268,437,556 |
Consolidated Financial Statements - December 31, 2018 62
c) Impairment losses
The changes in the allowances for the impairment losses on the balances of “Loans and receivables” were as follows:
Thousand of reais |
|
|
| 2018 |
| Stage 1 | Stage 2 | Stage 3 |
|
| Credit losses expected in 12 months | Expected credit losses over a useful life not subject to impairment | Expected credit losses during the useful life subject to impairment | Total |
|
|
|
|
|
Balance at beginning of year | 3,833,553 | 3,767,490 | 13,122,019 | 20,723,062 |
Impairment losses charged to income for the year | 83,725 | 389,100 | 13,067,280 | 13,540,105 |
Transfers between stages | (1,096,539) | (273,048) | 4,502,795 | 3,133,208 |
Movement of the period | 1,180,264 | 662,148 | 8,564,485 | 10,406,897 |
Of which: |
|
|
|
|
Commercial and industrial | (311,546) | (161,669) | 4,093,507 | 3,620,292 |
Real estate-construction | (10,173) | (28,581) | 231,655 | 192,901 |
Installment loans to individuals | 406,011 | 581,068 | 8,721,164 | 9,708,243 |
Lease financing | (567) | (1,718) | 20,954 | 18,669 |
Write-off of impaired balances against recorded impairment allowance | - | (377,471) | (10,916,381) | (11,293,852) |
Of which: |
|
|
|
|
Commercial and industrial | - | (132,770) | (3,848,644) | (3,981,414) |
Real estate-construction | - | (877) | (189,783) | (190,660) |
Installment loans to individuals | - | (243,824) | (6,855,729) | (7,099,553) |
Lease financing | - | - | (22,225) | (22,225) |
|
|
|
|
|
Balance at end of year | 3,917,278 | 3,779,119 | 15,272,918 | 22,969,315 |
Of which: |
|
|
|
|
Loans and advances to customers | 3,831,812 | 3,727,264 | 12,682,727 | 20,241,803 |
Loans and amounts due from credit institutions (Note 5) | - | 13,561 | - | 13,561 |
Provision for Debt Instruments (Note 6) | 85,465 | 38,296 | 2,590,190 | 2,713,951 |
|
|
|
| - |
Recoveries of loans previously charged off | - | - | 826,573 | 826,573 |
Of which: |
|
|
|
|
Commercial and industrial | - | - | 345,085 | 345,085 |
Real estate-construction | - | - | 103,433 | 103,433 |
Installment loans to individuals | - | - | 369,557 | 369,557 |
Lease financing | - | - | 8,498 | 8,498 |
Consolidated Financial Statements - December 31, 2018 63
Thousand of reais |
|
| 2017 | 2016 |
Balance at beginning of year |
|
| 18,191,126 | 15,411,759 |
Impairment losses charged to income for the year |
|
| 13,492,072 | 14,383,935 |
Of which: |
|
|
|
|
Commercial and industrial |
|
| 5,499,018 | 6,523,051 |
Real estate-construction |
|
| 471,366 | 369,431 |
Installment loans to individuals |
|
| 7,460,458 | 7,616,819 |
Lease financing |
|
| 61,230 | (125,366) |
Write-off of impaired balances against recorded impairment allowance |
|
| (13,421,560) | (11,604,568) |
Of which: |
|
|
|
|
Commercial and industrial |
|
| (5,715,903) | (4,553,166) |
Real estate-construction |
|
| (341,804) | (189,625) |
Installment loans to individuals |
|
| (7,312,310) | (6,810,997) |
Lease financing |
|
| (51,543) | (50,780) |
Balance at end of year |
|
| 18,261,638 | 18,191,126 |
Of which: |
|
|
|
|
Loans and advances to customers |
|
| 15,409,056 | 16,434,782 |
Loans and amounts due from credit institutions (Note 5) |
|
| 69,015 | 201,441 |
Provision for Debt Instruments (Note 6) |
|
| 2,783,567 | 1,554,903 |
|
|
|
|
|
Recoveries of loans previously charged off |
|
| 1,153,931 | 994,101 |
Of which: |
|
|
|
|
Commercial and industrial |
|
| 412,514 | 562,393 |
Real estate-construction |
|
| 209,940 | 102,826 |
Installment loans to individuals |
|
| 521,589 | 314,422 |
Lease financing |
|
| 9,888 | 14,460 |
Taking into account these amounts recognized in “Impairment losses charged to income for the year” and the "Recoveries of loans previously charged off", the "Impairment losses on financial assets - Loans and receivables” amounted on December 31, 2018 R$12,713,532 (2017 - R$12,338,141 e 2016 - R$13,389,834).
The balances of the provision for losses due to non-recovery by debtor sector are as follows:
Consolidated Financial Statements - December 31, 2018 64
Thousand of reais | 2018 |
| 2017 |
| 2016 |
|
|
|
|
|
|
Commercial and industrial | 10,791,702 |
| 10,338,225 |
| 10,555,109 |
Real estate - Construction | 358,119 |
| 493,422 |
| 363,859 |
Installment loans to individuals | 11,768,124 |
| 7,373,969 |
| 7,225,822 |
Lease financing | 51,370 |
| 56,022 |
| 46,336 |
Total | 22,969,315 |
| 18,261,638 |
| 18,191,126 |
d) Impaired assets
The details of the changes in the balance of the financial assets classified as “Loans and receivables – loans and advances to clients” (as defined at Note 1.i) and considered to be impaired due to credit risk are as follows:
Thousand of reais | 2018 |
| 2017 |
| 2016 |
|
|
|
|
|
|
Balance at beginning of year on 01/01/2018 after the initial adoption IFRS 9) | 19,847,987 |
| 18,887,132 |
| 18,599,379 |
Net additions | 13,871,666 |
| 13,679,423 |
| 11,892,321 |
Written-off assets | (11,293,852) |
| (13,421,560) |
| (11,604,568) |
Balance at end of year | 22,425,801 |
| 19,144,995 |
| 18,887,132 |
Following is a detail of the financial assets considered to be impaired classified by age of the oldest past-due amount:
Thousand of reais | 2018 |
| 2017 |
| 2016 |
|
|
|
|
|
|
With no Past-Due Balances or Less than 3 Months Past Due | 12,000,867 |
| 10,844,831 |
| 10,550,548 |
With Balances Past Due by |
|
|
|
|
|
3 to 6 Months | 3,473,591 |
| 4,123,796 |
| 2,983,575 |
6 to 12 Months | 4,929,099 |
| 3,791,805 |
| 4,921,527 |
12 to 18 Months | 1,144,035 |
| 271,965 |
| 339,596 |
18 to 24 Months | 325,701 |
| 20,825 |
| 53,578 |
More than 24 Months | 552,508 |
| 91,773 |
| 38,308 |
Total | 22,425,801 |
| 19,144,995 |
| 18,887,132 |
|
|
|
|
|
|
Debt Sector |
|
|
|
|
|
Commercial and industrial | 11,832,302 |
| 11,993,953 |
| 11,628,655 |
Real estate - Construction | 1,035,352 |
| 781,886 |
| 718,514 |
Installment loans to individuals | 9,499,148 |
| 6,304,134 |
| 6,487,717 |
Lease financing | 58,999 |
| 65,022 |
| 52,246 |
Total | 22,425,801 |
| 19,144,995 |
| 18,887,132 |
e) Loan past due for less than 90 days but not classified as impaired
Thousand of reais | 2018 | % of total loans past due for less than 90 days | 2017 | % of total loans past due for less than 90 days | 2016 | % of total loans past due for less than 90 days |
|
|
|
|
|
|
|
Commercial and industrial | 4,424,143 | 19.77% | 3,559,349 | 19.90% | 4,141,349 | 23.79% |
Real estate - Construction | 4,527,432 | 20.23% | 4,879,563 | 27.29% | 5,201,709 | 29.88% |
Installment loans to individuals | 13,255,646 | 59.24% | 9,266,366 | 51.82% | 7,957,294 | 45.71% |
Financial Leasing | 167,741 | 0.75% | 176,528 | 0.99% | 108,607 | 0.62% |
Total(1) | 22,374,962 | 100.00% | 17,881,806 | 100.00% | 17,408,959 | 100.00% |
Consolidated Financial Statements - December 31, 2018 65
f) Lease at present value
As at December 31, 2018, 2017 and 2016 there were no material agreements for lease contracts.
Breakdown by maturity
Gross investment in lease transactions
Thousand of reais | 2018 |
| 2017 |
| 2016 |
|
|
|
|
|
|
Overdue | 4,817 |
| 11,412 |
| 16,051 |
Due to: |
|
|
|
|
|
Up to 1 year | 975,183 |
| 1,057,023 |
| 1,207,473 |
From 1 to 5 years | 1,160,986 |
| 1,101,104 |
| 1,190,844 |
Over 5 years | 1,071 |
| 2,177 |
| 4,079 |
Total | 2,142,057 |
| 2,171,716 |
| 2,418,447 |
g) Transfer of financial assets with retention of risks and benefits
On December 31, 2018, the amount recorded on “Loans and advances to clients” related to loan portfolio assigned is R$122,271 (2017 - R$431,397 and 2016 - R$783,967), and R$126,906 (2017 - R$428,248 and 2016 - R$774,673) of “Other financial liabilities - Financial Liabilities Associated with Assets Transfer” (Note 21).
The foregoing transfer was conducted with a recourse clause and the mandatory repurchase is provided for in the following events:
- agreements in default for longer than 90 consecutive days;
- agreements under renegotiation;
- agreements subject to portability pursuant to Resolution 3,401 of the Brazilian Monetary Council (CMN);
- agreements subject to rights of intervention by certain parties to the contract.
10. Non-current assets held for sale
At December 31, 2018, 2017 and 2016, the total amount of non-current assets held for sale includes foreclosed assets and other tangible assets. The change in the "Non-current assets held for sale" is as follows:
Thousand of reais | 2018 | 2017 | 2016 |
|
|
|
|
Balance at beginning of year | 1,507,548 | 1,418,308 | 1,310,033 |
Loan repayments - repossession of assets | 785,139 | 524,497 | 834,903 |
Capital Increase in Companies held for sale | - | - | 10,462 |
Additions / disposals (net) due to change in the scope of consolidation(1)(3) | (130,713) | - | (497,847) |
Sales | (563,607) | (434,553) | (239,291) |
Others | - | (704) | 48 |
Final balance, gross | 1,598,367 | 1,507,548 | 1,418,308 |
Impairment losses (2) | (218,136) | (352,092) | (80,423) |
Impairment as a percentage of foreclosed assets | 13.65% | 23.37% | 10.52% |
Balance at end of year | 1,380,231 | 1,155,456 | 1,337,885 |
(1) On September 30, 2016, as a result of the non-expectation of sale of investment in BW Guirapá and controlled, from a market period, an administrator transferred the total of this balance to the caption of investments in affiliated and controlled companies in the country (Note 11). In 2017, as described at note 3, this investment was sold.
(2) In 2018, includes the amount of R$133,957 of provisions for devaluations on real estate and which were subsequently sold, constituted from valuation reports prepared by specialized external consulting, recorded as a provision for impairment losses, in 2017, this provision was R$271,670 (Note 43).
(3)On June 30, 2018, The Management of Banco Santander revalued your strategy on the investment in the company Real TJK Empreendimento Imobiliário S.A. (current name for Rojo Entretenimento S.A.), a company that owns the Teatro Santander, and decided to transfer the company from non-current assets held to sale to associates and subsidiaries (Note 11). On December 31, 2018, the amount of this investment was R$0 (12/31/2017- R$130,713) in the Bank and Consolidated.
11. Investments in associates and joint ventures
Jointly controlled
Banco Santander considers investments classified as jointly controlled when they possess a shareholders' agreement, which sets that the strategic, financial and operating decisions requires the unanimous consent of all investors.
Significant Influence
Associates are entities over which the Bank is in a position to exercise significant influence (significant influence is the power to participate in the financial and operating decisions of the investee) but it does not control or has joint control over the investee.
a) Breakdown
Consolidated Financial Statements - December 31, 2018 66
|
|
|
| Participation % | |
Jointly Controlled by Banco Santander | Activity | Country | 2018 | 2017 | 2016 |
Banco RCI Brasil S.A. | Bank | Brazil | 39.89% | 39.89% | 39.89% |
Norchem Participações e Consultoria S.A.(1) | Other Activities | Brazil | 50.00% | 50.00% | 50.00% |
Cibrasec - Companhia Brasileira de Securitização(1) (3) (8) (14) | Securitization | Brazil | 9.72% | 9.72% | 9.72% |
Estruturadora Brasileira de Projetos S.A. - EBP(1) (8) (10) | Other Activities | Brazil | 11.11% | 11.11% | 11.11% |
Gestora de Inteligência de Crédito(4)(9)(11) | Credit Bureau | Brazil | 20.00% | 20.00% | 20.00% |
Campo Grande Empreendimentos (15) | Other Activities | Brazil | 25.32% | 25.32% | 25.32% |
Banco Hyundai Capital Brasil S.A. (formerly named BHJV Assessoria e Consultoria Empresarial Ltda.) (16) | Bank | Brazil | 50.00% | - | - |
Santander Auto S.A. (17) | Other Activities | Brazil | 50.00% | - | - |
Jointly Controlled by Santander Corretora de Seguros (current corporate name of Santander Participações S.A.) | |||||
Webmotors S.A.(6) (7)(11) | Other Activities | Brazil | 70.00% | 70.00% | 70.00% |
Tecnologia Bancária S.A. - TECBAN(1) | Other Activities | Brazil | 19.81% | 19.81% | 19.81% |
PSA Corretora de Seguros e Serviços Ltda.(5)(12)(13) | Insurance Broker | Brazil | 50.00% | 50.00% | 50.00% |
|
|
|
|
|
|
|
|
|
|
|
|
Significant Influence of Banco Santander |
|
|
|
|
|
Norchem Holding e Negócios S.A.(1) | Other Activities | Brazil | 21.75% | 21.75% | 21.75% |
|
|
|
|
|
|
|
|
| Investments | ||
|
|
| 2018 | 2017 | 2016 |
Jointly Controlled by Banco Santander |
|
| 613,366 | 495,264 | 578,761 |
Banco RCI Brasil S.A. | 458,292 | 427,801 | 538,756 | ||
Norchem Participações e Consultoria S.A. | 26,105 | 25,550 | 26,302 | ||
Cibrasec - Companhia Brasileira de Securitização | 7,298 | 7,438 | 7,435 | ||
Estruturadora Brasileira de Projetos S.A. - EBP | 3,690 | 4,707 | 6,268 | ||
Gestora de Inteligência de Crédito | 59,098 | 29,513 | - | ||
Campo Grande Empreendimentos | 255 | 255 | - | ||
Banco Hyundai Capital Brasil S.A. (former named BHJV Assessoria e Consultoria Empresarial Ltda.) |
|
| 51,073 | - | - |
Santander Auto S.A. |
|
| 7,555 | - | - |
|
|
|
|
|
|
Jointly Controlled by Santander Corretora de Seguros (current corporate name of Santander Participações SA) | 419,016 | 350,440 | 390,336 | ||
Webmotors S.A. |
|
| 273,721 | 197,930 | 246,965 |
Tecnologia Bancária S.A. - TECBAN |
|
| 144,090 | 151,019 | 142,713 |
PSA Corretora de Seguros e Serviços Ltda. |
|
| 1,205 | 1,491 | 658 |
|
|
|
|
|
|
Significant Influence of Banco Santander |
|
| 20,933 | 20,860 | 20,980 |
Norchem Holding e Negócios S.A. |
|
| 20,933 | 20,860 | 20,980 |
Total |
|
| 1,053,315 | 866,564 | 990,077 |
|
| Results of Investments | |
| 1/01 to 12/31/2018 | 1/01 to 12/31/2017 | 1/01 to 12/31/2016 |
Jointly Controlled by Banco Santander | 41,212 | 39,904 | 16,748 |
Banco RCI Brasil S.A. | 46,244 | 44,384 | 14,175 |
Norchem Participações e Consultoria S.A. | 1,120 | 1,333 | 2,637 |
Cibrasec - Companhia Brasileira de Securitização | 193 | 389 | 366 |
Estruturadora Brasileira de Projetos S.A. – EBP | (1,017) | (1,560) | (430) |
Gestora de Inteligência de Crédito | (6,466) | (4,642) | - |
Banco Hyundai Capital Brasil S.A. (former named BHJV Assessoria e Consultoria Empresarial Ltda.) | 1,083 | - | - |
Santander Auto S.A. | 55 | - | - |
|
|
|
|
Jointly Controlled by Santander Corretora de Seguros (current corporate name of Santander Participações SA) | 24,161 | 30,430 | 29,538 |
Webmotors S.A. | 30,626 | 21,290 | 23,019 |
Tecnologia Bancária S.A. – TECBAN | (6,929) | 8,307 | 5,971 |
PSA Corretora de Seguros e Serviços Ltda. | 464 | 833 | 548 |
|
|
|
|
Jointly Controlled by Getnet S.A. | - | - | (225) |
iZettle do Brasil Meios de Pagamento S.A. | - | - | (225) |
|
|
|
|
Significant Influence of Banco Santander | 585 | 1,217 | 1,476 |
Norchem Holding e Negócios S.A. | 585 | 1,217 | 1,476 |
Total | 65,958 | 71,551 | 47,537 |
Consolidated Financial Statements - December 31, 2018 67
|
|
| 2018 |
| Total assets | Total liabilities | Total Income(11) |
Jointly Controlled by Banco Santander | 10,500,055 | 8,755,688 | 80,954 |
Banco RCI Brasil S.A. | 9,849,508 | 8,679,715 | 115,928 |
Norchem Participações e Consultoria S.A. | 79,633 | 27,423 | 2,240 |
Cibrasec - Companhia Brasileira de Securitização | 80,300 | 3,893 | 1,989 |
Estruturadora Brasileira de Projetos S.A. - EBP | 33,389 | 176 | (9,151) |
Gestora de Inteligência de Crédito | 338,382 | 42,894 | (32,328) |
Banco Hyundai Capital Brasil S.A. (former named BHJV Assessoria e Consultoria Empresarial Ltda.) | 103,703 | 1,557 | 2,166 |
Santander Auto S.A. | 15,140 | 30 | 110 |
|
|
|
|
Jointly Controlled by Santander Corretora de Seguros (current corporate name of Santander Participações SA) | 2,463,262 | 1,573,082 | 9,703 |
Webmotors S.A. | 221,313 | 60,905 | 43,751 |
Tecnologia Bancária S.A. - TECBAN | 2,238,156 | 1,510,794 | (34,976) |
PSA Corretora de Seguros e Serviços Ltda. | 3,793 | 1,383 | 928 |
|
|
|
|
Significant Influence of Banco Santander | 123,959 | 27,714 | 2,690 |
Norchem Holding e Negócios S.A. | 123,959 | 27,714 | 2,690 |
Total | 13,087,276 | 10,356,484 | 93,347 |
|
|
|
|
|
|
| 2017 |
| Total assets | Total liabilities | Total Income(11) |
Jointly Controlled by Banco Santander | 9,432,738 | 8,043,604 | 43,866 |
Banco RCI Brasil S.A. | 9,057,261 | 7,985,647 | 74,452 |
Norchem Participações e Consultoria S.A. | 78,674 | 27,574 | 2,665 |
Cibrasec - Companhia Brasileira de Securitização | 86,378 | 9,884 | 4,000 |
Estruturadora Brasileira de Projetos S.A. - EBP | 42,627 | 264 | (14,040) |
Gestora de Inteligência de Crédito | 167,798 | 20,235 | (23,211) |
|
|
|
|
Jointly Controlled by Santander Corretora de Seguros (current corporate name of Santander Participações SA) | 1,967,989 | 1,077,782 | 74,861 |
Webmotors S.A. | 490,458 | 50,413 | 31,264 |
Tecnologia Bancária S.A. - TECBAN | 1,472,774 | 1,025,593 | 41,932 |
PSA Corretora de Seguros e Serviços Ltda. | 4,757 | 1,776 | 1,665 |
|
|
|
|
Significant Influence of Banco Santander | 122,176 | 26,267 | 5,597 |
Norchem Holding e Negócios S.A. | 122,176 | 26,267 | 5,597 |
Total | 11,522,903 | 9,147,653 | 124,324 |
|
|
|
|
|
|
| 2016 |
| Total assets | Total liabilities | Total Income(11) |
Jointly Controlled by Banco Santander | 8,831,611 | 7,318,656 | 89,544 |
Banco RCI Brasil S.A. | 8,603,844 | 7,276,320 | 79,223 |
Norchem Participações e Consultoria S.A. | 78,833 | 26,228 | 5,274 |
Cibrasec - Companhia Brasileira de Securitização | 91,083 | 14,659 | 7,011 |
Estruturadora Brasileira de Projetos S.A. – EBP | 57,851 | 1,449 | (1,964) |
|
|
|
|
Jointly Controlled by Santander Corretora de Seguros (current corporate name of Santander Participações SA) | 1,459,826 | 943,028 | 58,595 |
Webmotors S.A. | 145,499 | 35,231 | 29,934 |
Tecnologia Bancária S.A. - TECBAN | 1,310,945 | 905,731 | 27,568 |
PSA Corretora de Seguros e Serviços Ltda. | 3,382 | 2,066 | 1,093 |
|
|
|
|
Significant Influence of Banco Santander | 127,598 | 31,136 | 6,792 |
Norchem Holding e Negócios S.A. | 127,598 | 31,136 | 6,792 |
Total | 10,419,035 | 8,292,820 | 154,931 |
Consolidated Financial Statements - December 31, 2018 68
b) Changes
The changes in the balance of this item were as follows:
|
|
|
|
|
| 2018 | 2017 |
| 2016 |
Jointly Controlled by Banco Santander |
|
|
|
|
|
|
|
|
|
Balance at beginning of year |
|
|
| 845,704 | 969,097 |
| 1,041,239 | ||
Additions / disposals (net) due to change in the scope of consolidation |
|
| - | - |
| (2,926) | |||
Additions /disposals(2) (5) |
|
|
|
|
| 119,557 | 34,154 |
| 3,105 |
Capital reduction(6) |
|
|
|
|
| 36,051 | - |
| (76,860) |
Share of results of entities accounted for using the equity method | 65,373 | 70,334 |
| 46,061 | |||||
Dividends proposed/received |
|
|
|
|
| (35,351) | (200,620) |
| (39,424) |
Others |
|
|
|
|
| 1,048 | (27,261) |
| (2,098) |
Balance at end of year |
|
|
|
|
| 1,032,382 | 845,704 |
| 969,097 |
|
|
|
|
|
|
|
|
|
|
Significant Influence of Banco Santander |
|
|
|
|
|
|
|
|
|
Balance at beginning of year |
|
|
|
|
| 20,860 | 20,980 |
| 19,504 |
Share of results of entities accounted for using the equity method |
|
| 585 | 1,217 |
| 1,476 | |||
Dividends proposed/received |
|
|
|
|
| (512) | (1,337) |
| - |
Balance at end of year |
|
|
|
|
| 20,933 | 20,860 |
| 20,980 |
Consolidated Financial Statements - December 31, 2018 69
(1) Companies with a delay of one month for the equity calculation. To register the equity income it was used on 12/31/2018 the position of 11/30/2018.
(2) In June 2016 the interest held in iZetlle do Brasil S.A was sold.
(3) At the ESM held on April 29, 2016 was approved the reform in the distribution structure of the capital of Cibrasec through the creation of preferred shares issued by the Company with voting rights and the share conversion of the common shares of Company into preferred shares, this reform was ratified at the ESM held on May 30, 2016. Banco Santander became part of their ordinary shares held in the capital of Cibrasec, the corresponding amount to 5,000 (five thousand) common shares issued by Cibrasec 50 (fifty) preferred shares in the proportion of 100 (one hundred) common shares for each one (1) preferred share, and still held 4,000 (four thousand) common shares in the capital of Cibrasec. Each preferred share entitles the holder the right to 100 (one hundred) times the right to dividends of the common shares, so that the economic rights were maintained, however, the conversion resulted in reduction in the percentage shareholding in Cibrasec.
(4) Company incorporated in April 2017 and is in the pre-operational phase. Pursuant to the shareholders' agreement, control is shared between shareholders who hold 20% of their capital stock each. At the Extraordinary General Meeting held on July 6, 2017, the capital increase of Gestora de Crédito was approved in the total amount of R$65,822, so that the capital stock increased from R$1 to R$65,823, through the issue of 6,582,200 (six million, five hundred and eighty-two thousand and two hundred) new shares, of which 3,291,100 (three million, two hundred and ninety-one thousand and one hundred), 1,316,440 (one million, three hundred and sixteen thousand, four hundred and forty) preferred shares Class A and 1,316,440 (one million, three hundred and sixteen thousand, four hundred and forty) preferred shares Class B and 658,220 (six hundred and fifty eight thousand, two hundred and twenty) class C preferred shares, with no par value, at the issue price of R$10.00, corresponding to the equity value of the shares. The shares issued in the capital increase were fully subscribed on the same date by the shareholders in the proportion of 20% of their capital stock each.
(5) In 2017 refers to the incorporation of Gestora de Inteligência de Crédito - partnership between Banco Santander and other banks from brazilian market (according to note 3.d) and in 2016 refers to the acquisition agreement of part of the financial operations from the Group PSA in Brazil and the consequent creation of a Joint Venture.
(6) At the ESM realized in September 26, 2016, was approved the reduction of the capital of Webmotors S.A. without cancellation of shares in the amount of R$109,800 to be considered excessive to maintain its activities, and the capital of R$194,580 to R$84,780.
(7) On December 30, 2016, at the EGM of Webmotors S.A., the merger and the Private Instrument of Protocol and Justification of Incorporation of Virtual Motors by Webmotors S.A. were approved, so that Webmotors S.A. received, for its accounting value, based on the balance sheet drawn up on November 30, 2016, all of the assets, rights and obligations of Virtual Motors, with the extinction of Virtual Motors that will be succeeded by Webmotors S.A. in all its rights and obligations.
(8) Although the participations was less than 20%, the Bank exercises control over the entity together with other major stockholders' through a stockholders' agreement where no business decision can be taken by a single shareholder.
(9) At the EGM held in October 5, 2017, it was approved the share capital increase of the Gestora de Crédito in the amount of R$285,205, that way its share capital increased from R$65,823 to R$351,028, through the issuance of 29.013.700 new shares, being 14,506,850 as ordinary shares, 5,802,740 preferred shares Class A, 5,802,740 preferred shares Class B, and 2,901,370 preferred shares Class C, without par value, at the issuance price of R$ 9,83 per share. It was also approved by unanimous decision the payment timetable of the new shares issuance made by the Management of Gestora de Crédito. That way, the share capital increase was fully subscribed at the same day by the shareholders in the proportion of 20% of each interest which were partially paid.
(10) According to its Bylaws, EBP was formed in order to carry out projects to contribute for the brazilian economic and social development for the period of 10 years. After the conclusion of the timetable set EPB closes its activities this year of 2018. The dissolution of its rights and liquidation were aproved in the EGM held on january 29, 2018.
(11) Although participation exceeds 50%, in accordance with the shareholders' agreement, the control is shared by Santander Corretora de Seguros (Current corporate name of Santander Participações S.A.), and Carsales.com. Investments PTY LTD (Carsales), shareholder based in Australia.
(12) Pursuant to the shareholders' agreement, the control is shared by Santander Corretora de Seguros (current corporate name of Santander Participações SA) and PSA Services LTD.
(13) In December 2017, according to the contractual change, the PSA Corretora de Seguros shareholders decided to increase its share capital in R$401, that way the share capital increased from R$500 to R$901, through the issuance of 400,532 new shares, which each new share has the value of R$1. The new shares issued were subscribed and paid at the same date, in local currency, according to the proportion of each shareholder equivalent to 50% to the company´s share capital, that is, 200.266 shares.
(14) The Bank has a participation of less than 20%, and there is no control block in the company, and business decisions are taken jointly by the stockholders.
(15) Participation resulting from the credit recovery from the Banco Comercial and Investimentos Sudameris S.A. incorporated in 2009 by Banco ABN AMRO Real S.A., which in the same year was incorporated into the Banco Santander (Brasil) S.A., one of the Company partner. The partners are conducting the procedures for extinction of the company, whose depends on the sale of a property. Once it has been sold, the liquidation of the company and each partner will receive its share of the equity.
(16) Company incorporated on December 13, 2018, upon transformation of BHJV Assessoria e Consultoria em Gestão Empresarial Ltda. Aymoré CFI, a wholly-owned subsidiary of Banco Santander, holds the company's operational control. (Note 3.i).
(17) Insurance company incorporated on October 9, 2018, through transformation of the corporate vehicle L.G.J.S.P.E. Empreendimentos e Participações S.A., submitted to Susep to obtain authorization to operate. In accordance with the shareholders' agreement, the control is shared by Sancap and HDI Seguros S.A., (Note 3.g).
(*) The Bank does not have collateral with associates and joint ventures.
(**) The Bank does not have contingent liabilities with significant risk of loss as possible related to investments in affiliates with joint control and significant influence.
(***) As of December 31, 2018, 2017 and 2016, the balances of Assets, Liabilities and Profit refer to 100% of the company balance sheet. There is no balance for the caption "Other Comprehensive Income" in these companies, except for the RCI Bank which recorded R$30,358 (2017- R$40,671 and 2016 - R$5,621).
c) Impairment losses
No impairment losses were recognized on investments in associates and joint ventures in 2018, 2017 and 2016.
d) Other information
Details of the principal jointly controlled entities:
Banco RCI Brasil S.A.: A company incorporated in the form of corporation headquartered in Parana which is primarily engaged in the practice of leasing, credit operations, financing and investment, in order to sustain the growth of automotive brands Renault and Nissan in the Brazilian market by providing credit and leasing operations to the final client. It is a financial institution that is part of the RCI Banque Group and the Santander Group, with operations conducted as part of a set of institutions that operate in the financial market. According to the Shareholders' Agreement, the key decisions that impact this partnership are taken jointly between Banco Santander and other controllers. On July 21, 2015 the Company's transformation into a Multiple Bank was approved, with investment portfolios, leasing and credit, financing and investment and also the change of company name of Companhia de Arrendamento Mercantil RCI Brasil to Banco RCI Brasil S.A. This process was approved by Bacen on October 28, 2015. On January 29,2016, the Companhia de Crédito, Financiamento e Investimento RCI Brasil was merged into its subsidiary Banco RCI Brasil S.A., with this process the interest previously held by RCI Brasil was transferred to Banco Santander.
Consolidated Financial Statements - December 31, 2018 70
Webmotors S.A.: A company incorporated in the form of private limited company with headquarters in São Paulo which is engaged in the design, implementation and / or availability of electronic catalogs, space, products, services or means of marketing products and / or services related to the automotive industry, on the Internet or other means related to e-commerce activities and other Internet uses or applications, as well as the participation in capital in other companies and the management of related business. It is a company of the Economic Conglomerate - Financial Santander (Santander Group) and Carsales.com Investments PTY LTD (Carsales), which its operations are conducted as part of a group of institutions that operate jointly. According to the Shareholders' Agreement, the key decisions that impact this partnership are taken jointly between Banco Santander and other controllers.
|
| 2018 |
| 2017 |
| 2016 |
| Banco RCI Brasil | Webmotors | Banco RCI Brasil | Webmotors | Banco RCI Brasil | Webmotors |
Current assets | 9,849,508 | 221,313 | 9,057,261 | 490,458 | 8,603,844 | 145,499 |
Current liabilities | 8,679,715 | 60,905 | 7,985,647 | 50,413 | 7,276,320 | 35,231 |
Cash and cash equivalents | 37,115 | 1,034 | 47,782 | 1,989 | 23,612 | 1,663 |
Depreciation and amortization | (977) | (7,423) | (1,600) | 16,353 | (911) | (12,295) |
Revenue | 1,316,687 | 167,881 | 1,315,695 | 127,064 | 1,575,550 | 135,242 |
Interest income | 1,290,703 | 4,134 | 1,294,119 | 7,178 | 1,368,643 | 28,047 |
Interest expense | (575,944) | - | (626,654) | - | (903,061) | - |
Tax Income / (expense) | (147,266) | (16,013) | (122,544) | (12,568) | (3,326) | (13,370) |
Current financial liabilities (excluding trade and other payables and provisions) | 3,130,908 | 49,709 | 3,897,010 | 33,320 | 3,629,575 | 31,707 |
Non-current financial liabilities (excluding trade and other payables and provisions) | 4,813,909 | 5,458 | 4,058,986 | 3,247 | 3,646,745 | 1,736 |
12. Tangible assets
Tangible assets of the Bank relate to property, plant and equipment for the its own use. The Bank does not have tangible assets held as investment property nor leased out under operating leases. The Bank is also not a part of any financial lease contracts as of and during fiscal years ended December 31, 2018, 2017 and 2016.
a) Breakdown
The detail, by class of asset, of the tangible assets in the consolidated balance sheets is as follows:
Thousand of reais |
|
|
|
|
|
Cost | Land and buildings | IT equipment and fixtures | Furniture and vehicles | Others | Total |
Balance at December 31, 2015 | 2,724,859 | 3,150,747 | 7,363,491 | 3,759 | 13,242,856 |
Additions | 3,024 | 154,852 | 715,264 | - | 873,140 |
Additions resulting mergers | - | 2,021 | 3,961 | - | 5,982 |
Write-off | (29,174) | (15,011) | (141,442) | - | (185,627) |
Change in scope of consolidation | - | 45 | 257 | - | 302 |
Transfers | 12,484 | 74,361 | (82,650) | - | 4,195 |
Balance at December 31, 2016 | 2,711,193 | 3,367,015 | 7,858,881 | 3,759 | 13,940,848 |
|
|
|
|
|
|
Additions | - | 382,571 | 723,835 | - | 1,106,406 |
Write-off | (52,102) | (180,036) | (31,053) | - | (263,191) |
Transfers | (9,779) | 718,666 | (721,520) | - | (12,633) |
Balance at December 31, 2017 | 2,649,312 | 4,288,216 | 7,830,143 | 3,759 | 14,771,430 |
|
|
|
|
|
|
Additions | 2,534 | 449,489 | 941,895 | 381 | 1,394,299 |
Write-off | (18,230) | (162,497) | (199,877) | - | (380,604) |
Transfers | 45,663 | 32,232 | 640,758 | (3,759) | 714,894 |
Additions by Company Acquisition | - | 1,368 | 463 | - | 1,831 |
Change in scope of consolidation | 99,759 | 19,517 | 17,749 | 1,302 | 138,327 |
Consolidated Financial Statements - December 31, 2018 71
Balance at December 31, 2018 | 2,779,038 | 4,628,325 | 9,231,131 | 1,683 | 16,640,177 |
|
|
|
|
|
|
Accumulated depreciation |
|
|
|
|
|
Balance at December 31, 2015 | (531,546) | (2,092,880) | (3,602,731) | - | (6,227,157) |
Additions | (82,963) | (387,855) | (683,770) | - | (1,154,588) |
Additions resulting mergers | - | (1,594) | (1,234) | - | (2,828) |
Write-off | 13,999 | 13,092 | 121,338 | - | 148,429 |
Change in scope of consolidation | - | (26) | (76) | - | (102) |
Transfers | 6,300 | (39,836) | (5,761) | - | (39,297) |
Balance at December 31, 2016 | (594,210) | (2,509,099) | (4,172,234) | - | (7,275,543) |
|
|
|
|
|
|
Additions | (81,910) | (499,542) | (609,515) | - | (1,190,967) |
Write-off | 37,136 | 154,471 | 22,196 | - | 213,803 |
Transfers | 9,734 | (437,527) | 427,506 | - | (287) |
Balance at December 31, 2017 | (629,250) | (3,291,697) | (4,332,047) | - | (8,252,994) |
|
|
|
|
|
|
Additions | (82,714) | (484,629) | (649,361) | - | (1,216,704) |
Write-off | 8,816 | 140,332 | 109,447 | - | 258,595 |
Transfers | (52,094) | (76,292) | (631,965) | - | (760,351) |
Additions by Company Acquisition | - | (978) | (196) | - | (1,174) |
Change in scope of consolidation | (5,602) | (1,448) | (7,136) | - | (14,186) |
Balance at December 31, 2018 | (760,844) | (3,714,712) | (5,511,258) | - | (9,986,814) |
|
|
|
|
|
|
Losses from non-recovery (impairment) |
|
|
|
|
|
Balance at December 31, 2015 | (9,785) | - | - | - | (9,785) |
Impacts on results | (3,246) | - | (5,841) | - | (9,087) |
Write-off | 23,588 | - | - | - | 23,588 |
Balance at December 31, 2016 | 10,557 | - | (5,841) | - | 4,716 |
|
|
|
|
|
|
Impacts on results | 9,784 | - | 1,047 | - | 10,831 |
Transfers | - | - | (512) | - | (512) |
Balance at December 31, 2017 | 20,341 | - | (5,306) | - | 15,035 |
|
|
|
|
|
|
Impacts on results | (10,607) | - | (49,556) | - | (60,163) |
Transfers | (5) | - | 4,333 | - | 4,328 |
Balance at December 31, 2018 | 9,729 | - | (50,529) | - | (40,800) |
|
|
|
|
|
|
Carrying amount |
|
|
|
|
|
Balance at December 31, 2016 | 2,127,540 | 857,916 | 3,680,806 | 3,759 | 6,670,021 |
Balance at December 31, 2017 | 2,040,403 | 996,519 | 3,492,790 | 3,759 | 6,533,471 |
Balance at December 31, 2018 | 2,027,923 | 913,613 | 3,669,344 | 1,683 | 6,612,563 |
The depreciation expenses has been included in the heading “Depreciation and amortization” in the income statement.
b) Tangible asset purchase commitments
On December 31, 2018 the Bank has contractual commitments for the acquisition of tangible assets amount of R$3.2 million (2017 - R$75.0 million and 2016 R$9.1 million).
13. Intangible assets - Goodwill
Goodwill is the difference between the acquisition cost and the Bank's participation in the net fair value of assets, liabilities and contingent liabilities of the acquired company. When the difference is negative (negative goodwill), it is recognized immediately through income statement. In accordance withIFRS 3 Business Combinations, goodwill is stated at cost and is not amortized but tested annually for impairment or whenever there is an evidence of reduction on the recoverable value of the cash generating unit to which the goodwill was allocated. Goodwill is recognized at cost considering the accumulated impairment losses. Impairment losses related to goodwill are not reversible. Gains and losses related to the sale of an entity include the carrying amount of goodwill relating to the entity sold.
Consolidated Financial Statements - December 31, 2018 72
The goodwill recorded is subject to impairment test (note 2.o.i) and has been allocated according to the operating segments (note 45).
Based on the assumptions described above, no impairment loss was recognized for goodwill at December 31, 2018, 2017 and 2016.
Thousand of reais | 2018 | 2017 | 2016 |
|
|
|
|
Breakdown |
|
|
|
Banco ABN Amro Real S.A. (Banco Real) | 27,217,565 | 27,217,565 | 27,217,565 |
Olé Consignado (Current Company name of Banco Bonsucesso Consignado) | 62,800 | 62,800 | 62,800 |
Super Pagamentos e Administração de Meios Eletrônicos Ltda. (Super) | 13,050 | 13,050 | 13,050 |
Banco PSA Finance Brasil S.A. | 1,557 | 1,557 | - |
Getnet Adquirência e Serviços para Meios de Pagamento S.A. (Santander Getnet) | 1,039,304 | 1,039,304 | 1,039,304 |
BW Guirapá I S.A. | - | - | 22,320 |
Ipanema Empreendimentos e Participações Ltda. | 27,630 | 28,120 | - |
Santander Brasil Tecnologia S.A. | 16,382 | - | - |
Others | - | 1,860 | - |
Total | 28,378,288 | 28,364,256 | 28,355,039 |
|
|
|
|
|
|
|
|
| Commercial Banking | ||
| 2018 | 2017 | 2016 |
Main assumptions: |
|
|
|
Basis of determining recoverable amounts | Value in use: cash flows | ||
Period of the projections of cash flows(1) | 5 years | 5 years | 5 years |
Growth rate perpetual | 5.1% | 8.3% | 8.0% |
Discount rate(2) | 13.6% | 14.6% | 15.2% |
(1) The projections of cash flow are prepared using Management´s growth plans and internal budget, based on historical data, market expectations and conditions such as industry growth, interest rate and inflation.
(2) The discount rate is calculated based on the capital asset pricing model (CAPM). The discount rate before tax is 19.33% (2017 - 20.42% and 2016 - 20.23%).
The changes of goodwill in December 31, 2018, 2017 and 2016 were as follows:
Thousand of reais |
|
|
|
| 2018 | 2017 | 2016 |
|
|
|
|
|
|
|
|
Balance at beginning of the year |
|
|
|
| 28,364,256 | 28,355,039 | 28,332,719 |
Additions (loss): |
|
|
|
|
|
|
|
BW Guirapá (Note 3.c) |
| - | (22,320) | 22,320 | |||
Banco PSA Finance Brasil S.A. |
|
|
|
| - | 1,557 | - |
Ipanema Empreendimentos e Participações Ltda. |
|
|
|
| (490) | 28,120 | - |
Santander Brasil Tecnologia S.A. |
|
|
|
| 16,382 | - | - |
Others |
|
|
|
| (1,860) | 1,860 | - |
Balance at end of the year |
|
|
|
| 28,378,288 | 28,364,256 | 28,355,039 |
14. Intangible assets - Other intangible assets
The details by asset category of the "other intangible assets" of the consolidated financial statements are as follow:
Cost |
| IT developments |
| Other assets |
| Total |
Balance at December 31, 2015 |
| 5,202,500 |
| 397,716 |
| 5,600,216 |
Additions |
| 652,490 |
| 18,395 |
| 670,885 |
Additions resulting mergers |
| 250 |
| 89 |
| 339 |
Write-off |
| (450) |
| (10,202) |
| (10,652) |
Additions / disposals (net) due to change in the scope of consolidation |
| 4 |
| - |
| 4 |
Transfers |
| 12,150 |
| - |
| 12,150 |
Balance at December 31, 2016 |
| 5,866,944 |
| 405,998 |
| 6,272,942 |
|
|
|
|
|
|
|
Additions |
| 824,411 |
| 12,072 |
| 836,483 |
Write-off |
| (125,307) |
| (7,096) |
| (132,403) |
Transfers |
| 4,633 |
| - |
| 4,633 |
Balance at December 31, 2017 |
| 6,570,681 |
| 410,974 |
| 6,981,655 |
|
|
|
|
|
|
|
Additions |
| 804,782 |
| 137 |
| 804,919 |
Write-off |
| (477,434) |
| (40) |
| (477,474) |
Transfers |
| 11,567 |
| - |
| 11,567 |
Additions resulting mergers |
| 590 |
| - |
| 590 |
Additions / disposals (net) due to change in the scope of consolidation |
| 87 |
| - |
| 87 |
Balance at December 31, 2018 |
| 6,910,273 |
| 411,071 |
| 7,321,344 |
Consolidated Financial Statements - December 31, 2018 73
Accumulated amortization |
| IT developments | Other assets | Total | ||
Balance at December 31, 2015 | - | (2,848,994) |
| (266,779) |
| (3,115,773) |
Additions |
| (304,046) |
| (24,005) |
| (328,051) |
Additions resulting mergers |
| (249) |
| - |
| (249) |
Write-off |
| 141 |
| 10,202 |
| 10,343 |
Additions / disposals (net) due to change in the scope of consolidation |
| (1) |
| - |
| (1) |
Transfers |
| 32,167 |
| 3,427 |
| 35,594 |
Balance at December 31, 2016 |
| (3,120,982) |
| (277,155) |
| (3,398,137) |
|
|
|
|
|
|
|
Additions |
| (449,709) |
| (21,571) |
| (471,280) |
Write-off |
| 854 |
| 5,500 |
| 6,354 |
Transfers |
| 17,402 |
| 464 |
| 17,866 |
Balance at December 31, 2017 |
| (3,552,435) |
| (292,762) |
| (3,845,197) |
|
|
|
|
|
|
|
Additions |
| (504,009) |
| (19,246) |
| (523,255) |
Write-off |
| 25,242 |
| - |
| 25,242 |
Transfers |
| (1,000,893) |
| 58 |
| (1,000,835) |
Additions resulting mergers |
| (583) |
| - |
| (583) |
Additions / disposals (net) due to change in the scope of consolidation |
| (15) |
| - |
| (15) |
Balance at December 31, 2018 |
| (5,032,693) |
| (311,950) |
| (5,344,643) |
|
|
|
|
|
|
|
Losses from non-recovery (Impairment) - IT |
|
|
|
|
|
|
Balance at December 31, 2015 |
| (994,802) | - | (8,698) |
| (1,003,500) |
Impact on net profit(1) |
| 898 |
| (6,736) |
| (5,838) |
Write-off |
| 16,193 |
| 143 |
| 16,336 |
Balance at December 31, 2016 |
| (977,711) |
| (15,291) |
| (993,002) |
|
|
|
|
|
|
|
Impact on net profit |
| (306,110) | - | - |
| (306,110) |
Transfers |
| 441 |
| - |
| 441 |
Balance at December 31, 2017 |
| (1,283,380) |
| (15,291) |
| (1,298,671) |
|
|
|
|
|
|
|
Impact on net profit(1) |
| (300,865) |
| - |
| (300,865) |
Write-off |
| 1,263,535 |
| - |
| 1,263,535 |
Balance at December 31, 2018 |
| (320,710) |
| (15,291) |
| (336,001) |
|
|
|
|
|
|
|
Carrying amount |
|
|
|
|
|
|
Balance at December 31, 2016 |
| 1,768,251 |
| 113,552 |
| 1,881,803 |
Balance at December 31, 2017 |
| 1,734,866 |
| 102,921 |
| 1,837,787 |
Balance at December 31, 2018 |
| 1,556,870 |
| 83,830 |
| 1,640,700 |
(1) In 2018, it refers to impairment loss of assets in the acquisition and development of software. The loss in the acquisition and development of software was recorded due to obsolescence function and disruption of these systems.
The amortization expenses has been included in the heading “Depreciation and amortization” in the income statement.
15. Other assets
The breakdown of the balance of “Other assets” is as follows:
Thousand of reais | 2018 | 2017 | 2016 |
|
|
|
|
Customer relationships | 1,674,187 | 1,679,305 | 1,197,278 |
Prepayments and accrued income | 685,755 | 784,456 | 690,814 |
Contractual guarantees of former controlling stockholders (Note 23.c.5) | 605,638 | 707,130 | 814,925 |
Actuarial asset (Note 22) | 273,281 | 198,189 | 153,662 |
Other receivables(1) | 1,561,606 | 1,209,190 | 2,247,333 |
Total | 4,800,467 | 4,578,270 | 5,104,012 |
(1) Corresponds mainly to receivables from third parties.
Consolidated Financial Statements - December 31, 2018 74
16. Deposits from the Brazilian Central Bank and Deposits from credit institutions
The breakdown, by classification, type and currency, of the balances of these items is as follows:
Thousand of reais | 2018 | 2017 | 2016 |
|
|
|
|
Classification: |
|
|
|
Financial liabilities at amortized cost | 99,022,806 | 79,374,685 | 78,634,072 |
Total | 99,022,806 | 79,374,685 | 78,634,072 |
|
|
|
|
Type: |
|
|
|
Deposits on demand(1) | 709,605 | 306,081 | 314,112 |
Time deposits(2) | 47,227,456 | 52,739,163 | 49,548,858 |
Repurchase agreements | 51,085,745 | 26,329,441 | 28,771,102 |
Of which: |
|
|
|
Backed operations with Private Securities(3) | 6,977,766 | - | 446,429 |
Backed operations with Government Securities | 44,107,979 | 26,329,441 | 28,324,673 |
Total | 99,022,806 | 79,374,685 | 78,634,072 |
Thousand of reais | 2018 | 2017 | 2016 |
|
|
|
|
Currency: |
|
|
|
Reais | 74,159,613 | 56,562,950 | 51,339,830 |
Euro | 105,119 | 407,814 | 576,994 |
US dollar | 24,758,074 | 22,156,054 | 26,546,404 |
Other currencies | - | 247,867 | 170,844 |
Total | 99,022,806 | 79,374,685 | 78,634,072 |
(1) Non-interest bearing accounts.
(2) It includes the operation with credit institution arising from export and import financing lines, BNDES and Finame on-lending and abroad and other credit lines abroad.
(3) Refers primarily to repurchase agreements backed by own-issued debentures.
17. Client deposits
The breakdown, by classification and type, of the balance of “Customer deposits” is as follows:
Thousand of reais | 2018 |
| 2017 |
| 2016 |
|
|
|
|
|
|
Classification: |
|
|
|
|
|
Financial liabilities at amortized cost | 304,197,800 |
| 276,042,141 |
| 247,445,177 |
Total | 304,197,800 |
| 276,042,141 |
| 247,445,177 |
|
|
|
|
|
|
Type: |
|
|
|
|
|
Demand deposits |
|
|
|
|
|
Current accounts(1) | 18,853,519 |
| 17,559,985 |
| 15,868,201 |
Savings accounts | 46,068,346 |
| 40,572,369 |
| 36,051,476 |
Time deposits | 190,982,541 |
| 146,817,650 |
| 94,478,875 |
Repurchase agreements | 48,293,394 |
| 71,092,137 |
| 101,046,625 |
Of which: |
|
|
|
|
|
Backed operations with Private Securities(2) | 6,977,766 |
| 33,902,890 |
| 59,460,210 |
Backed operations with Government Securities | 41,315,628 |
| 37,189,247 |
| 41,586,415 |
Total | 304,197,800 |
| 276,042,141 |
| 247,445,177 |
(1) Non-interest bearing accounts.
(2) Refers primarily to repurchase agreements backed by own-issued debentures.
Note 44-d contains a detail of the residual maturity periods of financial liabilities at amortized cost.
18. Marketable debt securities
The breakdown, by classification and type, of the balance of “Marketable debt securities” is as follows:
Thousand of reais | 2018 | 2017 | 2016 |
|
|
|
|
Classification: |
|
|
|
Financial liabilities at amortized cost | 74,626,232 | 70,247,012 | 99,842,955 |
Total | 74,626,232 | 70,247,012 | 99,842,955 |
|
|
|
|
Type: |
|
|
|
Real estate credit notes - LCI (1) | 27,159,982 | 27,713,873 | 23,983,429 |
Eurobonds | 4,516,647 | 1,992,828 | 7,721,646 |
Treasury Bills (2) | 30,721,206 | 31,686,259 | 61,157,037 |
Agribusiness credit notes - LCA | 11,925,018 | 8,854,052 | 6,980,843 |
Guaranteed Real Estate Credit Notes (3) | 303,379 | - | - |
Total | 74,626,232 | 70,247,012 | 99,842,955 |
Indexers: |
| Domestic | Abroad |
|
|
|
|
Treasury Bills |
| 97% to 106% of CDI | - |
|
| 100% of IGPM | - |
|
| 100% of IPCA | - |
|
| Pre fixed: 6.04% to 17.46% | - |
|
| 105,5% of SELIC | - |
Real estate credit notes - LCI |
| 73% to 9.,5% of CDI | - |
|
| Pre fixed: 7,3% of 14% | - |
|
| 100% of IPCA | - |
|
| 100% of TR | - |
Agribusiness credit notes - LCA |
| 84% to 96% of CDI | - |
Guaranteed Real Estate Credit Notes - LIG |
| 95% to 98% of CDI |
|
Eurobonds |
| - | 0.9% to 9% |
Consolidated Financial Statements - December 31, 2018 75
(1) Real Estate Credit Notes are fixed income securities pegged by mortgages and mortgage-backed securities or liens on property. On December 31, 2018, have maturities between 2019 and 2026 (2017 - there are maturities between 2018 to 2026 and 2016 - there are maturities between 2017 to 2026).
(2) The main features of the Treasury Bills are the minimum period of two years, minimum notional of R$300 and permission for early redemption of only 5% of the issued amount. On December 31, 2018, have a maturity between 2019 to 2025 (2017 - have a maturity between 2018 to 2025 and 2016 - there are maturities between 2017 to 2025).
(3) Guaranteed Real Estate Letters are real estate investment securities guaranteed by the issuer and by a pool of real estate credits separated from the other assets of the issuer. As of December 31, 2018 maturity until 2021.
The breakdown, by currency, of the balance of this account is as follows:
Thousand of reais |
| ||
Currency: | 2018 | 2017 | 2016 |
|
|
|
|
Real | 70,109,585 | 68,335,103 | 92,132,195 |
US dollar | 4,516,647 | 1,911,909 | 7,645,542 |
Euro | - | - | 65,218 |
Total | 74,626,232 | 70,247,012 | 99,842,955 |
|
|
|
|
| Average interest (%) | ||
Currency: | 2018 | 2017 | 2016 |
|
|
|
|
Real | 5.5% | 5.5% | 11.7% |
US dollar | 5.9% | 6.8% | 3.7% |
Total | 5.6% | 5.7% | 11.3% |
The changes in the balance of Marketable debt instruments were as follows:
Thousand of reais | 2018 | 2017 | 2016 |
|
|
|
|
Balance at beginning of the year | 70,247,012 | 99,842,955 | 94,658,300 |
Issuances | 73,765,081 | 59,663,420 | 50,313,469 |
Payments | (78,903,009) | (97,009,957) | (56,164,769) |
Interest (Note 33) | 4,606,949 | 7,901,199 | 12,212,922 |
Exchange differences and Others | 4,910,199 | (150,605) | (1,305,204) |
Additions arising from acquisitions of companies | - | - | 128,237 |
Balance at end of the year | 74,626,232 | 70,247,012 | 99,842,955 |
Consolidated Financial Statements - December 31, 2018 76
On December 31, 2018, 2017 and 2016, none of these instruments was convertible into Bank shares or granted privileges or rights which, in certain circumstances, make them convertible into shares.
The note 44-d contains a detail of the residual maturity periods of financial liabilities at amortized cost in each year.
The breakdown of "Bonds and other securities" is as follows:
|
|
|
|
|
| Interest rate (p.y) |
|
|
|
|
| Issuance | Maturity |
| Currency | 2018 | 2017 | 2016 | |
|
|
|
|
|
|
|
|
|
|
Eurobonds |
| 2007 | 2017 |
| BRL | FIDC | - | - | 1,930 |
Eurobonds |
| 2016 | 2017 |
| USD | 0,7% to 2,5% | - | - | 3,408,932 |
Eurobonds |
| 2012 | 2017 |
| USD | 4.6% | - | - | 4,116,309 |
Eurobonds |
| 2017 | 2018 |
| USD | Zero Coupon to 2,4% | - | 1,195,668 | - |
Eurobonds |
| 2017 | 2019 |
| USD | Libor 3M + 1,0% | 194,243 | 165,677 | - |
Eurobonds |
| 2018 | 2019 |
| USD | Zero Coupon to 9% | 855,035 | - | - |
Eurobonds |
| 2018 | 2019 |
| USD | Libor 3M + 0,95% | 19,386 | - | - |
Eurobonds |
| 2018 | 2019 |
| USD | Libor 1M + 1,5% | 197,055 | - | - |
Eurobonds |
| 2018 | 2019 |
| USD | 3.5% | 34,776 | - | - |
Eurobonds |
| 2018 | 2019 |
| USD | 6,6% to 6,7% | 1,211,361 | - | - |
Eurobonds |
| 2018 | 2019 |
| USD | 9.0% | 1,287,821 | - | - |
Eurobonds |
| 2017 | 2024 |
| USD | 6,9% to 10,0% | 639,275 | 541,487 | - |
Others |
|
|
|
|
|
| 77,695 | 89,996 | 194,475 |
Total |
|
|
|
|
|
| 4,516,647 | 1,992,828 | 7,721,646 |
19. Subordinated liabilities
The detail of the balance of “Subordinated liabilities” is as follows:
Thousand of reais |
|
|
|
|
|
|
|
|
|
|
|
|
| Issuance |
| Maturity(1) | Amount (millions) | Interest rate | 2018 |
| 2017 |
| 2016 |
|
|
|
|
|
|
|
|
|
|
|
|
Subordinated Liabilities |
| May-08 |
| May-15 to May-18 | R$283 | CDI (2) | - |
| 109,572 |
| 98,378 |
Subordinated Liabilities |
| May-08 to June-08 |
| May-15 to June-18 | R$268 | IPCA (3) | - |
| 409,658 |
| 367,868 |
Notes (4) |
| January-14 |
| Perpetual | R$3.000 | 7.375% | 4,906,880 |
| - |
| - |
Notes (4) |
| January-14 |
| January-24 | R$3.000 | 6.000% | 4,978,728 |
| - |
| - |
Total |
|
|
|
|
|
| 9,885,608 |
| 519,230 |
| 466,246 |
(1) Subordinated time deposits issued by Banco Santander S.A. with yield paid at the end of the term together with the principal.
(2) Between December 2017 and May 2018, indexed by 100% and 112% of the CDI.
(3) Between December 2017 and June 2018, indexed by the IPCA (extended consumer price index) plus interest of 8.3% p.a. to 8.4% p.a.
(4) On December 18, 2018, the Central Bank of Brazil issued approval for the repurchase of the notes issued on January 29, 2014, this approval led to the reclassification of these instruments from the Debt Instruments Eligible to Compose Capital to Subordinated Debt (Note 20).
The detail by currency, of the balance of “Subordinated liabilities” is as follows:
Thousand of reais |
|
|
| Average Interest Rate (%) | |||||
Currency: |
|
| 2018 | 2017 | 2016 | 2018 | 2017 |
| 2016 |
|
|
|
|
|
|
|
|
|
|
Real |
|
| 9,885,608 | 519,230 | 466,246 | 4.9% | 7.5% |
| 9.6% |
Total |
|
| 9,885,608 | 519,230 | 466,246 | 4.9% | 7.5% |
| 9.6% |
Consolidated Financial Statements - December 31, 2018 77
Changes in the balance of "Subordinated liabilities" in twelve-months period ended December 31, 2018, 2017 and 2016 were as follows:
|
| 2018 |
| 2017 |
| 2016 |
|
|
|
|
|
|
|
Balance at beginning of year |
| 519,230 |
| 466,246 |
| 8,097,304 |
Payments |
| (544,566) |
| - |
| (8,362,652) |
Interest (Note 33) |
| 25,336 |
| 52,984 |
| 731,594 |
Transfers (Note 20) |
| 9,885,608 |
| - |
| - |
Balance at end of year |
| 9,885,608 |
| 519,230 |
| 466,246 |
Note 44-d contains a detail of the residual maturity periods of subordinated liabilities at each year-end in each year.
20. Debt Instruments Eligible to Compose Capital
Details of the balance of "Debt Instruments Eligible to Compose Capital" for the issuance of such instruments to compose the Tier I and Tier II of regulatory capital due to the Regulatory Capital Optimization Plan (Note 28.e), are as follows:
|
|
|
|
|
|
|
|
| 2018 | 2017 | 2016 |
|
| Issuance |
|
|
| Maturity | Issuance Value | Interest Rate (p.a.)(3) |
|
|
|
Tier I (1)(5) |
| jan-14 |
| no maturity (perpetual) | R$3,000 | 7.375% | - | 4,187,531 | 4,125,557 | ||
Tier II (2) (5) |
| jan-14 |
|
|
| jan-24 | R$3,000 | 6.000% | - | 4,249,370 | 4,186,361 |
Tier I(4) |
| nov-18 |
| no maturity (perpetual) | US$1,250 | 7.250% | 4,893,668 | - | - | ||
Tier II (4) |
| nov-18 |
|
|
| nov/18 | US$1,250 | 6.125% | 4,886,276 | - | - |
Total |
|
|
|
|
|
|
| 9,779,944 | 8,436,901 | 8,311,918 | |
(1) Notes repurchased in 2019; As authorized by Bacen on December 17, 2018, as of the date of their issuance, Level I and II of RC must be excluded.
(2) Notes repurchased in 2019; As authorized by Bacen on December 17, 2018, as of the date of their issuance, Level I and II of RC must be excluded.
(3) The debts of January 2014 were made by Banco Santander in Brazil, therefore, as Income Tax at source assumed by the issuer, in the form of a corresponding exchange rate, is 8.676% and 7.059% for the instruments Level I and Level II, respectively. The emissions generated from November 2018 were made through the Cayman Agency and, consequently, there is no incidence of Income Tax at Source.
(4) Interest paid semiannually, as of May 8, 2019.
(5) On December 18, 2018, the Central Bank of Brazil issued the approval for the repurchase of the notes issued on January 29, 2014, this approval led to the reclassification of these instruments from the Debt Instruments Eligible to Compose Capital to Subordinated Debt (Note 19).
Changes in the balance of "Debt Instruments Eligible to Compose Capital" in twelve-months period ended December 31, 2018, 2017 and 2016 were as follows:
|
| 2018 | 2017 | 2016 |
Balance at beginning of the year |
| 8,436,901 | 8,311,918 | 9,959,037 |
Emission of interest - Tier I |
| 4,673,875 | - | - |
Emission of interest - Tier II |
| 4,673,875 | - | - |
Interest payment Tier I (1) |
| 331,677 | 273,123 | 276,587 |
Interest payment Tier II (1) |
| 272,539 | 222,065 | 225,161 |
Exchange differences / Others |
| 1,960,467 | 252,941 | (1,447,196) |
Payments of interest - Tier I |
| (381,008) | (344,867) | (379,039) |
Payments of interest - Tier II |
| (302,775) | (278,279) | (322,632) |
Transfers |
| (9,885,607) | - | - |
Balance at end of the year |
| 9,779,944 | 8,436,901 | 8,311,918 |
(1) The remuneration of interest relating to the Debt Instruments Eligible to Compose Capital Tier I and II was recorded against income for the period as "Interest expense and similar charges" (Note 33).
On November 5, 2018, the Board of Directors approved the issuance of the equity instruments, which was held on November 8, 2018. Such issuance was in the form of Notes issued in US dollars, US$2.5 billion, for payment in Tier I and Tier II of Reference Equity. The offer of these notes was made outside Brazil and the United States of America, for non-US Persons, based on Regulation S under the Securities Act, and was fully paid in by Santander España, controlling shareholder of Banco Santander Brasil. On the same date, the Board of Directors approved the redemption of the Tier I and Tier II notes issued on January 29, 2014, in the total amount of U$2,5 billion (Note 26.e).
The specific characteristics of Notes issued to make up Tier I are: (a) Principal: US$1,250 billion (b) Interest Rate: 7.25% p.a; (c) no maturity (perpetual); (d) Periodicity of payment of interest: semiannually from May 8, 2019.
The specific characteristics of Notes issued to make up Tier II are: (a) Principal: US $ 1,250 billion; (b) Interest Rate: 6.125% p.a.; (c) Maturity Term: on November 8, 2028; and (d) Periodicity of payment of interest: semiannually, as of May 8, 2019.
Notes have the following common characteristics:
(a) Unit value of at least US$150 thousand and in integral multiples of US$1 thousand in excess of such minimum value;
Consolidated Financial Statements - December 31, 2018 78
(b) The Notes may be repurchased or redeemed by Banco Santander after the fifth anniversary as of the date of issue of the Notes, at the sole discretion of the Bank or as a result of changes in the tax legislation applicable to the Notes; or at any time, due to the occurrence of certain regulatory events.
On December 18, 2018, the Bank issued approval for the Notes to comprise Tier I and Tier II of Banco Santander's Reference Equity as of such date, as well as the repurchase of the notes issued on January 29, 2014. As a result, the balance relating to the notes issued on January 29, 2014 were reclassified from Debt Instruments Eligible to Compose Capital to Subordinated Debts (Note 19).
21. Other financial liabilities
The breakdown of the balances of these items is as follows:
Thousand of reais | 2018 |
| 2017 |
| 2016 |
|
|
|
|
|
|
Credit card obligations | 39,761,739 |
| 32,049,712 |
| 25,420,237 |
Unsettled financial transactions(2) | 3,356,871 |
| 3,905,236 |
| 3,829,374 |
Dividends and Interest on Capital payable | 4,508,569 |
| 4,553,914 |
| 4,346,128 |
Tax collection accounts - Tax payables | 1,205,746 |
| 1,077,860 |
| 1,157,386 |
Liability associated with the transfer of assets (Note 9.g) | 126,906 |
| 428,248 |
| 774,673 |
Other financial liabilities(1) | 2,769,005 |
| 2,245,765 |
| 1,351,301 |
Total | 51,728,836 |
| 44,260,735 |
| 36,879,099 |
(1) As of December 31, 2018, the financial liability is included in the total amount of R$519 million (2017 - R$484 million and 2016 - R$307 million), related to the purchase option period of the shares held by Banco Bonsucesso. The exercise period is the defined between two periods, the first from February 10, 2019 to February 10, 2021, if the exercise does not occur in the first period, the second period will be from February 10, 2023 to February 10, 2025 and R$1,427 (2017 - R$1,223 million and 2016 - R$950 million), referring to an option with shares issued by Getnet SA, which was authorized by Bacen on February 18, 2019 and settled on February 25, 2018.
(2) Includes operations to settle with B3 S.A. (Current Company Name of BM&FBovespa) and payment orders in foreign currency.
22. Provisions for pensions and similar obligations
On December 31, 2018 the balance of provisions for pension funds and similar obligations totaled R$3,357,654 (2017 - R$3,923,457 and 2016 - R$2,710,627).
i. Supplemental Pension Plan
Banco Santander and its subsidiaries sponsor the closed pension entities for the purpose of granting pensions and supplementary pensions over those granted by the Social Security, as defined in the basic regulations of each plan.
·Banesprev - Fundo Banespa de Seguridade Social (Banesprev)
- Plan I: defined benefit plan fully sponsored by Banco Santander, it covers employees hired after May 22, 1975 called Participants Recipients, and those hired until May 22, 1975 called Participants Aggregates, who are also entitled to death benefits. This plan is closed to new entrants since March 28, 2005.
- Plan II: defined benefit plan, constituted from July 27, 1994, effective of the new text of the Statute and Regulations of the Basic Plan II, Plan I participants who chose the new plan began to contribute to the rate of 44.9% stipulated by the actuary for funding each year, introduced in April 2012 extraordinary cost to the sponsor and participants, as agreed with the PREVIC - Superintendence of Pension Funds, due to deficit in the plan. This plan is closed to new entrants since June 3, 2005.
- Plan V: defined benefit plan fully sponsored by Banco Santander, it covers employees hired until May 22, 1975, closed and paid off.
- Supplemental Pension Plan Pré 75: defined benefit plan was created in view of the privatization of Banespa and is managed by Banesprev and offered only to employees hired before May 22, 1975, which its effective date is January 1, 2000. This plan is closed to new entrants since April 28, 2000.
- Plan III: variable contribution plan, for employees hired after May 22,1975, previously served by the Plans I and II. This plan receives contributions from the sponsor and the participants. The benefits are in the form of defined contribution during the period of contribution and defined benefit during the receipt of benefit, if paid as monthly income for life. Plan is closed to new entrants since September 1, 2005.
- Plan IV: variable contribution plan, designed for employees hired as of November 27, 2000, in which the sponsor only contributes to the risk benefits and administrative expenses. In this plan the benefit is set in the form of defined contribution during the period of contribution and defined benefit during the receipt of benefits in the form of monthly income for life, in whole or in part of the benefit. The risk benefits of the plan are in defined benefit. This plan is closed to new entrants since July 23, 2010.
- Three plans (DCA, DAB and CACIBAN): additional retirement and former employees associated pension, arising from the process of acquisition of the former Banco Meridional, established under the defined benefit plan. The plans were closed to new participants prior to the acquisition of Grupo Bozano Simonsen by Banco Santander in November 1999.
- Plan Sanprev I: defined benefit plan, established on September 27, 1979, covering employees enrolled in the plan sponsor and it is in process of extinction since June 30, 1996.
- Plan Sanprev II: plan that provides insurance risk, pension supplement temporary, disability retirement annuity and the supplemental death and sickness allowance and birth, including employees enrolled in the plan sponsor and is funded solely by sponsors through monthly contributions, as indicated by the actuary. This plan is closed to new entrants since March 10, 2010.
- Plan Sanprev III: variable contribution plan covering employees of the sponsors who made the choice to contribute, by contribution freely chosen by participants from 2% of their salary. That the benefit plan is a defined contribution during the contribution and defined benefit during the receipt of the benefit, being in the form of monthly income for life, in whole or in part of the benefit. This plan is closed to new entrants since March 10, 2010.
·Sanprev – Santander Associação de Previdência (Sanprev)
Closed-End Private Pension Entity (EFPC) that used to manage three benefit plans, 2 in the Defined Benefit modality and 1 in the modality of Variable Contribution, whose process of management transfer of these plans to Banesprev occurred in January 2017. According to Portaria 389 of PREVIC, of May 8, 2018, it was approved the closure of the authorization of operation of Sanprev.
·Bandeprev - Bandepe Previdência Social (Bandeprev)
Defined benefit plan, sponsored by Banco Bandepe and Banco Santander, managed by Bandeprev. The plans are divided into basic plan and special retirement supplement plan, with different eligibility requirements, contributions and benefits by subgroups of participants. The plans are closed to new entrants since 1999 for Banco Bandepe’s employees and for others since 2011.
·Other Plans
SantanderPrevi - Sociedade de Previdência Privada (SantanderPrevi): it´s a closed-end private pension entity with the purpose of constitution and implementation of social security pension plans, complementary to the social security contribution, in the form of actual legislation.
The Retirement Plan of SantanderPrevi is structured as Defined Contribution and closed to new members since July 2018 as approved by PREVIC, with contributions shared between sponsors and plan participants. The appropriate values by the sponsors in the year of 2018 was R$89,959 (2017 - R$86,449 and 2016 – R$87,603). It has 10 cases of lifetime income with benefits arising from the previous plan.
SBPREV - Santander Brasil Open Pension Plan:As from January 2, 2018, Santander started to offer this new optional supplementary pension plan for new employees hired and for employees who are not enrolled in any other pension plan managed by the Closed Entities Complementary Pension Plan of the Group. This new program includes the PGBL- Free Benefit Generation Plan and VGBL-Free Benefit Generator Life managed by Icatu Seguros, the Open Entity of Complementary Pension Plan, which are open for new accessions, with similar characteristics to SantanderPrevi's plan. the instituting / stipulating companies and the participants in the plans.The appropriated values by the sponsors in the year of 2018 were R$1,597.
ii. Health and Dental Care Plan
• Cabesp - Caixa Beneficente dos Funcionários do Banco do Estado de São Paulo S.A.:
Entity that covers health and dental care expenses of employees hired until Banespa privatization in 2000, as defined in the entity's bylaws.
• HolandaPrevi’s Retirees (current corporate name of SantanderPrevi):
For the health care plan Retirement has lifetime nature and is a closed group. In his termination the employee should have completed 10 years of employment with Banco Real and 55 years of age. In this case it was offered the continuity of health care plan where the employee pays 70% and the Bank pays 30% of the monthly payment. This rule lasted until December, 2002 and after this period that the employee got terminated with the status Retired Holandaprevi, he pays 100% of the health plan monthly payment.
• Former employees of Banco Real S.A. (Retiree by Circulars):
It grants entitlement to healthcare to former employees of Banco Real, with lifetime benefit it was granted in the same condition as the active employee, in this case, with the same coverage and plan design.
Eligible only for basic plans and premium apartment, if the beneficiary chooses for the apartment plan he pays the difference between the plans plus the co-participation in the basic plan. Not allowed new additions of dependents. It is subsidized in 90% of the plan.
• Bandeprev’s retirees:
Health care plan granted to Bandeprev’s retirees as a lifetime benefit, for which Banco Santander is responsible for subsidizing 50% of the benefits of employees retired until November 27, 1998. For whom retired after this date, the subsidy is 30%.
• Directors with Lifetime Benefits (Lifetime Directors):
Lifetime health care benefit granted to a small closed group of former directors coming from Banco Sudameris, being 100% subsidized by the Bank.
• Free Clinic:
Health care plan (free clinic) is offered for a lifetime to retirees who have contributed to the Foundation Sudameris for at least 25 years and has difference in default if the user chooses apartment. The plan is only offered in standard infirmary where the cost is 100% of the Foundation Sudameris.
• Life insurance for Banco Real’s retirees (Life Insurance):
For Retirees from Circulars: indemnity in case of Natural Death, Disease Disability, Accidental Death. The subsidy is 45% of the value. It is a closed group.
• Life Insurance Assistance Boxes (Life Insurance):
Included in the bulk of the life insurance in December 2018 the insurance of the retirees of the DCA, DAB and CACIBAN plans. This insurance was granted to retirees of the former Southern Bank, coverage was according to the choice of retiree at the time of joining the benefit. The Bank's allowance is 50% of the premium amount for the holder and some retirees have the spouse clause bearing 100% of the cost. The plan is closed for new participants.
Additionally, it is assured to retired employees, since they meet to certain legal requirements and fully pay their respective contributions, the right to be maintaining as a beneficiary of the Banco Santander health plan, in the same conditions for healthcare coverage, taken place during their employment contract. Banco Santander provisions related to this retired employees are calculated using actuarial based in the present value of the current cost.
iii. Actuarial Techniques
The amount of the defined benefit obligations was determined by independent actuaries using the following actuarial techniques:
• Valuation method:
Projected unit credit method, which uses each year of service as giving rise to an additional unit of benefit entitlement and measures each unit separately.
• Nominal discount rate for actuarial obligation and calculation of interest on assets:
- Banesprev, Sanprev, SantanderPrevi, Bandeprev and Other Plans – 9.1% (2017 – 9.53% and 2016 – 10.9%).
- Cabesp, Law 9,656 and others obligations – 9.3% (2017 – 9.65% and 2016 – 10.8%).
• Estimated long-term inflation rate:
- Banesprev, Sanprev, SantanderPrevi, Bandeprev and Other Plans – 4.0% (2017 - 4.0% and 2016 - 4.5%).
• Estimate salary increase rate:
- Banesprev, Sanprev, SantanderPrevi, Bandeprev Básico and Other Plans – 5.0% (2017 - 5.0% and 2016 - 5.0%).
The funding status of the defined benefit obligations in 2018 and in the last 2 years are as follows:
|
| 2018 | 2017 | 2016 |
|
|
|
|
|
| Present value of the obligations - Post-employment plans: |
|
|
|
| To current employees | 716,492 | 796,243 | 770,423 |
| Vested obligations to retired employees | 23,296,715 | 21,205,366 | 19,998,703 |
|
| 24,013,207 | 22,001,609 | 20,769,126 |
|
|
|
|
|
| Less: |
|
|
|
| Fair value of plan assets | 22,708,990 | 20,689,637 | 20,116,916 |
| Unrecognized assets(1) | (1,079,808) | (1,090,682) | (969,161) |
| Provisions – Post-employment plans, net | 2,384,025 | 2,402,654 | 1,621,371 |
|
|
|
|
|
| Present value of the obligations - Other similar obligations: |
|
|
|
| To current employees | 184,606 | 228,107 | 200,009 |
| Vested obligations to retired employees | 4,604,466 | 4,815,654 | 4,046,480 |
|
| 4,789,072 | 5,043,761 | 4,246,489 |
|
|
|
|
|
| Less: |
|
|
|
| Fair value of plan assets | 4,157,251 | 3,721,147 | 3,310,895 |
| Unrecognized assets(1) | (68,527) | - | - |
| Provisions – Other similar obligations, net | 700,348 | 1,322,614 | 935,594 |
|
|
|
|
|
| Total provisions for pension plans, net | 3,084,373 | 3,725,268 | 2,556,965 |
| Of which: |
|
|
|
| Actuarial provisions | 3,357,654 | 3,923,457 | 2,710,627 |
| Actuarial assets (note 15) | 273,281 | 198,189 | 153,662 |
(1) Refers to fully funded surplus plans Banesprev I and III, Sanprev I,II and III and Bandeprev.
On the fourth quarter of 2018, the Management settled the actuarial deficit of Banesprev V and DAB in 2017 in the amount of R$ 295,529 and R$ 1,246, respectively, and the contribution in the estimated amount of R$ 152,329 to cover the actuarial deficit from 2018 to Banesprev Pré 75.
In the first half of 2018, there was an increase in the cost contribution established for a post-employment benefit plan, which is calculated as a percentage of the total monthly compensation of members. The increase in the contribution resulted in a decrease in the past service cost due to changes in the plan. The envisaged changes implied a reduction in the present value of the obligations of the defined benefit plan, which is supported by actuarial valuations.
The amounts recognized in the consolidated income statement in relation to the aforementioned defined benefit obligations are as follows:
|
|
|
| Post-Employment Plans | ||||
|
|
|
|
|
| 2018 | 2017 | 2016 |
|
|
|
|
|
|
|
|
|
Staff costs - Current service costs (note 40) |
|
|
|
|
| 3,142 | 14,605 | 15,416 |
Interest and similar income and expenses - Interest cost (net) (notes 32 and 33) |
| 124,754 | 70,429 | 120,524 | ||||
Interest and similar income and expenses - Interest on unrecognized assets (notes 32 and 33) | 104,160 | 105,832 | 117,981 | |||||
Other movements |
|
|
|
|
| 12,432 | 5,323 | 4,355 |
Total |
|
|
|
|
| 244,488 | 196,189 | 258,276 |
|
|
|
|
|
|
|
|
|
|
|
|
| Other Similar Obligations | ||||
|
|
|
|
|
| 2018 | 2017 | 2016 |
|
|
|
|
|
|
|
|
|
Staff costs - Current service costs (note 40) |
|
|
|
|
| 5,797 | 5,476 | 9,064 |
Interest and similar income and expenses - Interest cost (net) (notes 32 and 33) |
| 76,124 | 99,575 | 38,064 | ||||
Interest and similar income and expenses - Interest on unrecognized assets (notes 32 and 33) | 15,521 | - | 14,608 | |||||
Other movements (2) |
|
|
|
|
| (816,230) | - | 55,943 |
Total |
|
|
|
|
| (718,788) | 105,051 | 117,679 |
The changes in the present value of the accrued defined benefit obligations were as follows:
|
|
|
| Post-Employment Plans | ||||
|
|
|
|
|
| 2018 | 2017 | 2016 |
|
|
|
|
|
|
|
|
|
Present value of the obligations at beginning of year |
|
|
| 22,001,609 | 20,769,126 | 17,525,799 | ||
Current service cost (Note 40) |
|
|
|
|
| 3,142 | 14,605 | 15,416 |
Interest cost |
|
|
|
|
| 2,029,099 | 2,170,639 | 2,046,949 |
Benefits paid |
|
|
|
|
| (1,876,014) | (1,834,681) | (1,679,794) |
Actuarial (gains)/losses |
|
|
|
|
| 1,674,908 | 871,308 | 2,844,733 |
Others |
|
|
|
|
| 180,463 | 10,612 | 16,023 |
Present value of the obligations at end of year |
|
|
|
|
| 24,013,207 | 22,001,609 | 20,769,126 |
|
|
|
|
|
|
|
|
|
|
|
|
| Other Similar Obligations | ||||
|
|
|
|
|
| 2018 | 2017 | 2016 |
|
|
|
|
|
|
|
|
|
Present value of the obligations at beginning of year |
|
|
| 5,043,761 | 4,246,489 | 6,034,734 | ||
Current service cost (Note 40) |
|
|
|
|
| 5,797 | 5,476 | 9,064 |
Interest cost |
|
|
|
|
| 438,567 | 447,653 | 703,874 |
Benefits paid |
|
|
|
|
| (346,185) | (339,538) | (465,029) |
Actuarial (gains)/losses |
|
|
|
|
| 455,193 | 683,681 | 1,330,371 |
Other (1) (2) |
|
|
|
|
| (808,061) | - | (3,366,525) |
Present value of the obligations at end of year |
|
|
|
|
| 4,789,072 | 5,043,761 | 4,246,489 |
(1) In the fourth quarter of 2016, Banco Santander updated the procedures for recognizing its obligations to the entity CABESP, in accordance with its bylaws, which establishes the coverage of medical costs in the equality of proportion between associates and sponsor.
(2) In the year ended December 31, 2018 there was an increase in the cost contribution established for a postemployment benefit plan, which is calculated as a percentage of the total monthly compensation of associates. The increase in the contribution resulted in a decrease in the past service cost, due to changes in the plan. The envisaged changes implied a reduction in the present value of the obligations of the defined benefit plan, which is supported by actuarial valuations. In the Consolidated Statements of Income, this amount was recorded under Provision (Net).
The changes in the fair value of the plan assets were as follows:
|
|
|
| Post-Employment Plans | ||||
�� |
|
|
|
|
| 2018 | 2017 | 2016 |
|
|
|
|
|
|
|
|
|
Fair value of plan assets at beginning of year |
|
|
|
|
| 20,689,637 | 20,116,916 | 16,275,269 |
Interest (Expense) Income |
|
|
|
|
| 1,904,345 | 2,100,211 | 1,926,424 |
Remeasurement - Actual return (loss) on plan assets excluding the amounts included in net | 1,347,689 | 268,309 | 1,589,517 | |||||
Contributions/(surrenders) |
|
|
|
|
| 481,959 | 38,883 | 2,001,806 |
Of which: |
|
|
|
|
|
|
|
|
By the Bank |
|
|
|
|
| 472,723 | 27,439 | 1,985,722 |
By plan participants |
|
|
|
|
| 9,236 | 11,444 | 16,084 |
Benefits paid |
|
|
|
|
| (1,876,014) | (1,834,682) | (1,676,116) |
Exchange differences and other items |
|
|
|
|
| 161,374 | - | 16 |
Fair value of plan assets at end of year |
|
|
|
|
| 22,708,990 | 20,689,637 | 20,116,916 |
|
|
|
|
|
|
|
|
|
|
|
|
| Other Similar Obligations | ||||
|
|
|
|
|
| 2018 | 2017 | 2016 |
|
|
|
|
|
|
|
|
|
Fair value of plan assets at beginning of year |
|
|
|
|
| 3,721,147 | 3,310,895 | 5,673,071 |
Interest (Expense) Income |
|
|
|
|
| 362,444 | 348,078 | 665,811 |
Remeasurement - Actual return (loss) on plan assets excluding the amounts included in net interest expense | 304,632 | 303,504 | 718,628 | |||||
Contributions/(surrenders) |
|
|
|
|
| 72,548 | 61,803 | - |
Of which: |
|
|
|
|
|
|
|
|
By the Bank |
|
|
|
|
| 72,548 | 61,803 | - |
Benefits paid |
|
|
|
|
| (310,458) | (303,133) | (3,746,615) |
Exchange differences and other items |
|
|
|
|
| 6,938 | - | - |
Fair value of plan assets at end of year |
|
|
|
|
| 4,157,251 | 3,721,147 | 3,310,895 |
Consolidated Financial Statements - December 31, 2018 79
Breakdown of gains (losses) actuarial by experience, financial assumptions and demographic hypotheses:
|
|
| Post-Employment Plans |
| 2018 | 2017 | 2016 |
Experience Plan | (803,717) | 686,204 | (696,910) |
Changes in Financial Assumptions | (871,176) | (1,557,689) | (2,135,189) |
Changes in Financial Demographic | - | 146 | (12,773) |
Gain (Loss) Actuarial - Obligation | (1,674,893) | (871,339) | (2,844,872) |
Return on Investment, Return Unlike Implied Discount Rate | 1,344,089 | 270,158 | 1,589,446 |
Gain (Loss) Actuarial - Asset | 1,344,089 | 270,158 | 1,589,446 |
Changes in Surplus / Deficit Uncollectible | 117,320 | (15,690) | - |
|
|
|
|
|
|
| Other Similar Obligations |
| 2018 | 2017 | 2016 |
Experience Plan | (79,810) | (303,396) | (1,116,845) |
Changes in Financial Assumptions | (376,949) | (380,285) | (537,952) |
Changes in Financial Demographic | - | - | (379) |
Gain (Loss) Actuarial - Obligation | (456,759) | (683,681) | (1,655,176) |
Return on Investment, Return Unlike Implied Discount Rate | 307,048 | 303,504 | 718,628 |
Gain (Loss) Actuarial - Asset | 307,048 | 303,504 | 718,628 |
Changes in Surplus Uncollectible | (52,604) | - | - |
The experience adjustments arising from plan assets and liabilities are shown bellow:
|
| Post - Employment Plans | ||
|
| 2018 | 2017 | 2016 |
|
|
|
|
|
Experience in Net Assets Adjustments | 1,347,689 | 268,309 | 1,589,517 | |
|
|
|
|
|
| Other Similar Obligations | |||
|
| 2018 | 2017 | 2016 |
|
|
|
| |
Experience in Net Assets Adjustments | 304,632 | 303,504 | 718,628 | |
Consolidated Financial Statements - December 31, 2018 80
The amounts of actuarial obligation of defined benefit plans not covered and defined benefit plans partially or totally covered are shown below:
| 2018 | 2017 | 2016 |
|
|
|
|
|
|
|
|
| 700,347 | 701,551 | 826,963 |
| 28,101,932 | 26,343,818 | 22,734,017 |
The main categories of plan assets as a percentage of total plan assets are as follows:
| 2018 | 2017 | 2016 |
|
|
|
|
Equity instruments | 4.81% | 4.60% | 1.00% |
Debt instruments | 94.59% | 94.70% | 98.16% |
Properties | 0.28% | 0.35% | 0.30% |
Other | 0.32% | 0.35% | 0.54% |
The expected return on plan assets was determined based on the market expectations for returns over the duration of the related obligations.
The actual return on plan assets was R$3,823,004 (2017 – R$3,021,950 and 2016 – R$4,900,380).
The following table shows the estimated benefits payable on December 31, 2018 for the next ten years:
|
|
|
|
2019 | 2,109,187 |
2020 | 2,160,320 |
2021 | 2,209,720 |
2022 | 2,281,827 |
2023 | 2,352,046 |
2024 to 2028 | 12,734,200 |
Total | 23,847,300 |
Assumptions about the rates related to medical care costs have a significant impact on the amounts recognized in income. The change of one percentage point in the medical care cost rates would have the effects as follows:
|
|
|
| Sensitivity | |
| (+) 1,0% | (-) 1,0% |
Effect on current service cost and interest on actuarial liabilities | 69,961 | (62,469) |
Effects on present value of obligation | 761,619 | (680,061) |
The following table shows the duration of the actuarial liabilities of the plans sponsored by Banco Santander:
Plans | Post - Employment Plans |
|
|
| Duration (in years) |
Banesprev Plans I | 11.35 |
Banesprev Plans II | 11.73 |
Banesprev Plans III | 9.39 |
Banesprev Plans IV | 14.00 |
Banesprev Plans V | 8.87 |
Banesprev Pre-75 | 9.62 |
Sanprev I | 6.47 |
Sanprev II | 10.83 |
Sanprev III | 9.66 |
Bandeprev Basic | 9.57 |
Bandeprev Special I | 6.70 |
Bandeprev Special II | 6.52 |
SantanderPrevi | 7.30 |
CACIBAN / DAB / DCA | 6,79/5,79/6,37 |
|
|
Plans | Other Similar Obligations |
|
|
Cabesp | 14.16 |
Bandepe | 14.73 |
Free Clinic | 11.04 |
Lifetime officers | 8.63 |
Circulars(1) | 11,72 e 10,68 |
Life Insurance | 7.82 |
Consolidated Financial Statements - December 31, 2018 81
(1) The duration 11.72 refers to the plan of Former Employees of Banco ABN Amro and 10.68 to the plan of Former Employees of Banco Real.
Actuarial Assumptions Adopted in Calculations
|
|
|
|
| 2018 |
| 2017 |
| 2016 |
|
|
|
| Pension | Health | Pension | Health | Pension | Health |
Nominal Discount Rate for Actuarial Obligation |
| 9.1% | 9.3% | 9.5% | 9.7% | 10.9% | 10.8% | ||
Rate Calculation of Interest Under Assets to the Next Year |
| 9.1% | 9.3% | 9.5% | 9.7% | 10.9% | 10.8% | ||
Estimated Long-term Inflation Rate |
|
| 4.0% | 4.0% | 4.0% | 4.0% | 4.5% | 4.5% | |
Estimated Salary Increase Rate |
|
| 5.0% | 5.0% | 5.0% | 5.0% | 5.0% | 5.0% | |
Mortality tables |
|
| AT2000 | AT2000 | AT2000 | AT2000 | AT2000 | AT2000 | |
23. Provisions for judicial and administrative proceedings, commitments and other provisions
a) Breakdown
The breakdown of the balance of “Provisions” is as follows:
Thousand of reais | 2018 |
| 2017 |
| 2016 |
|
|
|
|
|
|
Judicial and administrative proceedings under the responsibility of former controlling stockholders (Note 15) | 605,638 |
| 707,131 |
| 814,925 |
Judicial and administrative proceedings | 9,507,240 |
| 8,365,320 |
| 7,470,344 |
Of which: |
|
|
|
|
|
Civil | 3,377,338 |
| 2,522,005 |
| 1,842,549 |
Labor | 3,819,107 |
| 3,448,388 |
| 3,138,645 |
Tax and Social Security | 2,310,795 |
| 2,394,927 |
| 2,489,150 |
Provisions for contingent commitments (Note 23.b) | 626,267 |
| - |
| - |
Others provisions(1) | 599,099 |
| 991,008 |
| 780,595 |
Total | 11,338,244 |
| 10,063,459 |
| 9,065,864 |
(1) In 2018, includes R$126.561 (2017 - R$287,446 and 2016 - R$450,284) relating to the expenses of projects aimed at improving operational productivity and efficiency.
b) Changes
The changes in “Provisions” were as follows:
Thousand of reais | 2018 | ||||
|
| ||||
| Pensions (1) |
| Other Provisions |
| Total |
Balance at beginning of year | 3,923,456 |
| 10,063,459 |
| 13,986,915 |
Additions charged to income: |
|
|
|
|
|
Interest expense and similar charges | 320,559 |
| - |
| 320,559 |
Personnel Expenses (Note 40) | 8,939 |
| - |
| 8,939 |
Constitutions / Reversals and Adjustment of provisions | (801,332) |
| 3,556,512 |
| 2,755,180 |
Other Comprehensive Income | 483,058 |
| - |
| 483,058 |
Additions to provisions for contingent commitments | - |
| (48,246) |
| (48,246) |
Payments to external funds | (594,024) |
| - |
| (594,024) |
Amount paid | - |
| (2,247,172) |
| (2,247,172) |
Transfer to other assets - actuarial assets (Note 15) | 16,998 |
| - |
| 16,998 |
Transfers, exchange differences and other changes | - |
| 13,691 |
| 13,691 |
Balance at end of year | 3,357,654 |
| 11,338,244 |
| 14,695,898 |
Consolidated Financial Statements - December 31, 2018 82
Thousand of reais | 2017 | ||||
|
| ||||
| Pensions (1) |
| Other Provisions |
| Total |
Balance at beginning of year | 2,710,626 |
| 9,065,864 |
| 11,776,490 |
Additions charged to income: |
|
|
|
|
|
Interest expense and similar charges | 275,836 |
| - |
| 275,836 |
Personnel Expenses (Note 40) | 20,081 |
| - |
| 20,081 |
Constitutions / Reversals and Adjustment of provisions | 1,723 |
| 3,112,684 |
| 3,114,407 |
Other Comprehensive Income | 1,028,090 |
| - |
| 1,028,090 |
Payments to external funds | (127,357) |
| - |
| (127,357) |
Amount paid | - |
| (2,123,483) |
| (2,123,483) |
Transfer to other assets - actuarial assets (Note 15) | 14,457 |
| - |
| 14,457 |
Transfers, exchange differences and other changes | - |
| 8,394 |
| 8,394 |
Balance at end of year | 3,923,456 |
| 10,063,459 |
| 13,986,915 |
Thousand of reais | 2016 | ||||
|
| ||||
| Pensions (1) |
| Other Provisions |
| Total |
Balance at beginning of year | 2,696,653 |
| 8,713,024 |
| 11,409,677 |
Additions charged to income: |
|
|
|
|
|
Interest expense and similar charges (Note 32 & 33) | 287,576 |
| - |
| 287,576 |
Personnel Expenses (Note 40) | 24,480 |
| - |
| 24,480 |
Constitutions / Reversals and Adjustment of provisions | 60,309 |
| 2,645,764 |
| 2,706,073 |
Payments to pensioners and early retirees with a charge to internal provisions | 1,876,888 |
| - |
| 1,876,888 |
Payments to external funds | (2,074,873) |
| - |
| (2,074,873) |
Amount paid | - |
| (2,330,283) |
| (2,330,283) |
Other Comprehensive Income | (153,595) |
| - |
| (153,595) |
Transfers, exchange differences and other changes | (6,812) |
| 37,359 |
| 30,547 |
Balance at end of year | 2,710,626 |
| 9,065,864 |
| 11,776,490 |
(1) For further information, see note 15. Provisions for pension funds and similar obligations.
Consolidated Financial Statements - December 31, 2018 83
b.1) Provisions for contingent payments
According to note 2.iii.ix, IFRS 9 requires that the provision for expected credit losses be recorded for contracts of financial guarantees rendered, which have not yet been honored. Provision expense reflecting credit risk should be measured and accounted for when the honor of these guarantees occurs and the client accused does not comply with its contractual obligations. The movement of these provisions in 2018 is as follows:
| Thousand of reais |
| 2018 |
|
|
|
|
| Balance at beginning of year (in 1/01/2018 after the initial adoption of the IFRS 9) |
| 674,513 |
| Creation of provision for contingent commitments |
| (48,246) |
| Balance at end of year |
| 626,267 |
c) Provisions for Contingent Civil, Labor, Tax and Social Security
Banco Santander and its subsidiaries are involved in lawsuits and administrative proceedings related to tax, labor, social security and civil arising in the normal course of its activities.
The provisions were constituted based on the nature, complexity, lawsuits historic and company´s assessment of lawsuit losses based on the opinions of internal and external legal advisors. The Santander has the policy to constitute provision of full amount of lawsuits who’s the result of loss assessment is probable. The legal obligation of tax and social security were fully recognized in the financial statements.
Management understands that the provisions recorded are sufficient to meet legal obligations and losses from lawsuits and administrative proceedings as follows:
c.1) Lawsuits and Administrative Proceedings – related to Tax and Social Security
In October 2017, the Bank also joined the Incentive Payment and Installment Programs of the municipalities of São Paulo and Rio de Janeiro. Adhesions to the programs included payment of administrative and legal proceedings related to the ISS, related to the periods 2005 to 2016, in the total of R$292,562. As a consequence, provisions were reversed in the amount of R$435,454. In the Statement of Income of 2017, a reversal of provisions was recorded, net of tax effects, in the total of R$96,129.
In August, 2017, The Bank and its affiliates joined a federal amnesty program established by MP (Law) 783/2017 and reissues.
Adherence to the program included administrative proceedings related to IRPJ, CSLL and Social Security Contributions referring to the base periods from 1999 to 2005, in the total of R$534,001, after the benefits of the installment program, of which R$191,897 was paid in August 2017 and R$299,820 in January 2018. With the conversion of the provisional measure into law, and its amendments, the amount became R$491,717.
Main lawsuits and administrative proceedings related to legal obligations, tax and social security
• PIS and Cofins - R$3,632,467 (2017 - R$3,501,464 and 2016 - R$3,290,900): Banco Santander and its subsidiaries filed lawsuits seeking to eliminate the application of Law 9,718/1998, which modified the calculation basis for PIS and Cofins to cover all revenues of legal entities and not only those arising from the provision of services and sale of goods. Regarding the Banco Santander Process, on April 23, 2015, a STF decision was issued admitting the Extraordinary Appeal filed by the Federal Government regarding PIS and denying the follow-up to the Extraordinary Appeal of the Federal Public Prosecutor regarding Cofins. Both appealed this decision, without any success, so that the suit relating to Cofins is defined, ruling the judgment of the Federal Regional Court of the 4th Region of August 2007, favorable to Banco Santander. Pursuant to the STF, Banco Santander’s PIS and the PIS and Cofins of other subsidiaries are pending final judgment.
• Increase in CSLL Tax Rate - R$0 (2017 - R$905,113 and 2016 - R$851,744): the Bank Santander and its subsidiaries are discussing the increase in the CSLL tax rate, from 9% to 15%, established by Executive Act 413/2008, subsequently converted into Law 11,727/2008, as from April 2008. In 2018, given the classification of success and unfavorable scenario in the Courts, we opted to pay the amounts discussed.
Main lawsuits and administrative proceedings with probable loss risk
Banco Santander and its subsidiaries are parties in lawsuits and administrative proceedings related to tax and social security matters, which their risk of loss are classified as probable, based on the opinion of legal counsel.
• Provisional Contribution on Financial Transactions (CPMF) on Customer Operations - R$729,919 (2017 - R$714,604 and 2016 - R$689,987): in May 2003, the Federal Revenue Service issued a tax assessment against Santander Distribuidora de Títulos e Valores Mobiliários Ltda. (Santander DTVM) and another tax assessment against Banco Santander Brasil S.A. The tax assessments refer to the collection of CPMF tax on transactions conducted by Santander DTVM in the cash management of its customers’ funds and clearing services provided by Banco to Santander DTVM in 2000, 2001 and 2002. Based on the risk assessment of legal counsel, the tax treatment was accurate. Santander DTVM had a favorable decision at the Board of Tax Appeals (CARF). Banco Santander had a unfavorable decision and was considered responsible for the collection of the CPMF tax. Both decisions were appealed by the respective losing party to the highest jurisdiction of CARF. In June 2015, Bank and DTVM had obtained a non favorable decision at CARF. On July 3, 2015 Bank and Produban Serviços de Informática S.A. filed lawsuit aiming to cancel both tax charges on the period ended on December 31, 2018 amounting R$1,462.5 million. Based on the evaluation of legal advisors, were consisted provision to the probable loss.
• Social Security Contribution (INSS) - R$273,233 (2017 - R$265,022 and 2016 - R$266,391): Banco Santander and its subsidiaries are involved in administrative and judicial proceedings regarding the collection of income tax on social security and education allowance contributions over several funds that, according to the evaluation of legal advisors, do not have nature of salary.
• Tax on Services (ISS) - Financial Institutions - R$228,403 (2017 - R$714,604 and 2016 - R$621,437): Banco Santander and its subsidiaries discuss administrative and legal requirements, by several municipalities, of the payment of ISS on various revenues arising from operations that areusually not classified as services (Note 23.c.4 – Possible Risk Loss).
Consolidated Financial Statements - December 31, 2018 84
c.2) Lawsuits and Administrative Proceedings of Labor
These are lawsuits filed by labor Unions, Associations, Public Prosecutors and former employees claiming labor rights they believe are due, especially payment for overtime and other labor rights, including retirement benefit lawsuits.
For claims considered to be similar and usual, provisions are recognized based on the payments and successes historic. Claims that do not fit the previous criteria have their provisions constituted according to individual assessment performed, and provisions being constituted based on the risk of loss as probable, the law and jurisprudence according to the assessment of loss made by legal counsel.
c.3) Lawsuits and Administrative Proceedings of Civil
These contingencies are generally caused by: (1) Lawsuits with a request for revision of contractual terms and conditions or requests for monetary adjustments, including supposed effects of the implementation of various government economic plans, (2) lawsuits deriving of financing agreements, (3) lawsuits of execution; and (4) lawsuits of indemnity by loss and damage. For civil lawsuits considered common and similar in nature, provisions are recorded based on the average of cases closed. Claims that do not fit the previous criteria are provisioned according to individual assessment performed, and provisions are based on the risk of loss as probable, the law and jurisprudence according to the assessment of loss made by legal counsel.
The main processes with the classification of risk of loss as probable are described below:
• Lawsuits for Indemnity - seeking indemnity for material and emotional damage, regarding the consumer relationship on matters related to credit cards, consumer credit, bank accounts, collection and loans and other operations. In the civil lawsuits considered to be similar and usual, provisions are recorded based on the average of cases closed. Civil lawsuits that do not fit into the previous criteria are provisioned according to the individual assessment made, being the provisions recognized based on the risk of loss as probable, the law and jurisprudence according to the assessment of loss made by legal counsel.
• Economic Plans – they referred to lawsuits filed by savings accountholders, related to supposed inflation purge arising from the Economic Plans (Bresser, Verão, Collor I and II), based on the understanding that such plans violated acquired rights relating to the application of inflation indexes on Saving Accounts, Lawsuits Deposits and Time Deposits (CDB). Provisions arising from such lawsuits are recorded based on the individual evaluation of loss made by external legal consultants.
The Banco Santander is also party in public class lawsuits on the same matter filed by consumer rights organizations, Public Prosecutor’s Offices and Public Defender’s Offices. The provision is made for the lawsuits with the classification of risk as probable, based on the individual execution orders. The STF is still analyzing the subject and has already ordered the suspension of all the procedures except those that were not already decided in courts or in phase of definitive execution. There are decisions favorable to banks at the STF with regard to the economic phenomenon similar to the savings accounts, as in the case of monetary restatement of time deposits - CDB and agreements (present value table).
However, the Supreme Court´s jurisprudence has not come to a conclusion regarding the constitutionality of the norms that changed Brazil’s monetary standard. On April 14, 2010, the STJ was recently decided that the deadline for the filing of civil lawsuits that argue the government's purge is five years, but this decision has not been handed down on the lawsuits yet. Thus, with this decision, a majority lawsuits, as they were filed after the period of five years is likely to be rejected, reducing the values involved. Still, the STF decided that the deadline for individual savers to become party on the public civil litigations, is also five years, counted from the final unappealable sentence. Banco Santander believes in the success of the arguments defended in these courts based on their content and the legal basis.
At the end of 2017, the General Union Law (AGU), Bacen, Institute of Consumer Protection (Idec), the Brazilian Front of the Money savers (Febrapo), the Brazilian Banks Federation (Febraban) have signed an agreement with the purpose to close all lawsuits related to Economic Plans.
The discussions focused on the definition of the amount that would be paid to each person according to the outstanding balance in the saving account. The total amount of the payments will depend on the number of the additional clients, and also on the number of money savers that approved in the courts the existance of their account and balance in the birthday date of the indexes changes. The term of agreement negotiated between the parties was submitted to the STF, which approved the terms of the agreement.
Recently, the STF ordered the suspension of all economic plan (in the country), for two years considering the judicial homologation.
The Management considers that the accrued provisions are due to charge interest in accordance with the plans, including considering the agreement approved by the STF.
c.4) Civil, Labor, Tax, and Security Social Liabilities Contingent Classified with Loss Risk as Possible:
Refer to lawsuits and administrative proceedings involving tax, labor and civil matters classified by legal counsels with loss risk as possible, which they were not recorded.
The tax lawsuits classification with loss risk as possible totaled R$24,929 million, being the main lawsuits as follow:
• INSS on Profits or Results (PLR) - Bank and the subsidiaries have several lawsuits and administrative proceedings arising from questioning tax authorities in connection with the taxation for social security purposes of certain items which are not considered to be employee remuneration. As of December 31, 2018, the amounts related to these proceedings totaled approximately R$5,354 million.
• Tax on Services (ISS) - Financial Institutions - Banco Santander and its subsidiaries discuss administrative and legal requirements, by several municipalities, of the payment of ISS on various revenues arising from operations that are usually not classified as services. On December 31, 2018, the amounts related to these proceedings totaled approximately R$3,662 million.
• Unapproved Compensation – The Bank and its affiliates discuss administrative and legal proceedings with the Federal Revenue, Office to grant tax relief with credits arising from overpayments. On December 31, 2018, the amounts related to these proceedings totaled approximately R$2,505 million.
Consolidated Financial Statements - December 31, 2018 85
• Goodwill Amortization of Banco Real - the Federal Tax Office of Brazil issued infraction notices against the Bank to require the income tax and social payments, including late charges, for the period of 2009. The Tax Authorities considered that the goodwill related to acquisition of Banco Real, amortized for accounting purposes prior to the merger, could not be deduced by Banco Santander for tax purposes. The infraction notice was contested. On July 14, 2015, the Police Judging RFB decided favorably to Banco Santander, fully canceling the tax debt. On November 10, 2016, the appeal was filed, prompting the Bank to lodge an appeal with CARF, which is awaiting judgment. On December 31, 2018, the balance was approximately R$1,377 million.
• Credit Losses - Bank and its subsidiaries challenged the tax assessments issued by the Federal Revenue Services claiming the deduction for credit losses because they fail to meet the relevant requirements under applicable law. As of December 31, 2018 the amount related to this claim is approximately R$1,039 million.
• Use of CSLL Tax and Negative Tax Loss -Tax assessments issued by the Federal Revenue Service in 2009 for alleged undue compensation of tax loss carryforwards and negative basis of CSLL, as a consequence of tax assessments drawn up in previous periods. Judgment is pending at the administrative level. As of December 31, 2018, the amount was R$1,022 million.
• Goodwill Amortization of Banco Sudameris – the Tax Authorities have issued infraction notices to require the income tax and social contribution payments, including late charges, relating to tax deduction of amortization of goodwill from the acquisition of Banco Sudameris, related to the period of 2007 to 2012. Banco Santander timely presented its appeals, which are pending. On December 31, 2018, the amounts related to these proceedings totaled approximately R$615 million.
• IRPJ and CSLL - Capital Gain - the Federal Tax Office of Brazil issued infraction notices against Santander Seguros, successor company of ABN AMRO Brasil Dois Participações S.A. (AAB Dois Par), charging income Tax and Social Contribution to related base year 2005. The Federal Tax Office of Brazil claims that capital gain in sales of shares from Real Seguros S.A and Real Vida Previdência S.A. by AAB Dois Par should be taxed by the rate of 34% instead 15%. The assessment was contested administratively based on understanding that tax treatment adopted at the transaction was in compliance with tax laws and capital gain was taxed properly. The administrative lawsuit is awaiting trial. The Banco Santander is responsible for any adverse outcome in this lawsuit as former Zurich Santander Brasil Seguros e Previdência S.A. stockholder. As of December 31, 2018, the amount related to this lawsuit is approximately R$300 million.
The labor claims with classification of loss risk as possible totaled R$62 million, excluding the lawsuits below:
Semiannual Bonus or PLR - a labor lawsuit relating to the payment of a semiannual bonus or, alternatively, profit sharing, to retired employees from Banco do Estado de São Paulo S.A. - Banespa, that had been hired up to May 22, 1975, filed by Banespa’s Retirees Association. This lawsuit was dismissed against the Bank by the Superior Labor Court. The STF rejected the extracommon appeal of the Bank by a monocratic decision maintaining the earlier condemnation. Santander filed a Regimental Appeal which holds STF´s decision. The Regimental Appeal is an internal appeal filed in the STF, in order to refer the monocratic decision to a group of five ministers. The 1st Class of the Supreme Court upheld the appeal by the Bank and denied the Afabesp. The subjects of the extracommon appeal of the Bank will move forward to the Supreme Court for judgment. The amount related to this claim is not disclosed due to the current stage of the lawsuit and such disclosure may impact the progress of the claim.
Readjustment of Banesprev retirement complements by the IGPDI- lawsuit filed in 2002 in Federal Court by the Association of Retired Employees of the Banco do Estado de São Paulo S.A. - Banespa, requesting the readjustment of the retirement supplementation by the IGPDI for Banespa retirees who have been admitted until May 22, 1975. The judgment granted the correction but only in the periods in which no other form of adjustment could be applied. The Bank and Banesprev have appealed this decision and although the appeals have not yet been judged, the Bank's success rate in this matter in the High Courts is around 90%. In Provisional Execution, calculations were presented by the Bank and Banesprev with "zero" result due to the exclusion of participants who, among other reasons, are listed as authors in other lawsuits or have already had some type of adjustment. The amount related to this claim is not disclosed due to the current stage of the lawsuit and such disclosure may impact the progress of the claim.
The liabilities related to civil lawsuits with classification of loss risk as possible totaled R$1.467 million, being the main lawsuits as follow:
Indemnity Lawsuit Arising of the Banco Bandepe - related to mutual agreement on appeal to the Justice Superior Court (STJ - Superior Tribunal de Justiça).
Indemnity Lawsuit Related to Custody Services - provided by Banco Santander at an early stage which was not handed down yet.
Lawsuit Arising from a Contractual Dispute - the acquisition of Banco Geral do Comércio S.A. on appeal to the Court of the State of São Paulo (TJSP - Tribunal de Justiça do Estado de São Paulo).
c.5) Other Lawsuits Under the Responsibility of Former Controlling Stockholders
Refer to tax, labor and civil lawsuits in the amounts of R$598,544, R$327 and R$6,767 (2017 - R$698,141, R$2,607 and R$6,381 and 2016 - R$810,383, R$712 and R$3,830), respectively, which the responsible people were the former controlling stockholders of the Bank and acquired companies. Based on the agreement signed, these lawsuits have guaranteed reimbursement from part of the former controllers, whose respective duties were recorded in other receivables – others.
Consolidated Financial Statements - December 31, 2018 86
24. Tax assets and liabilities
a) Income and Social Contribution Taxes
The total charge for the year can be reconciled to accounting profit as follows:
Thousand of reais |
|
|
|
|
|
|
|
| 2018 | 2017 | 2016 |
|
|
|
|
|
|
|
|
|
|
|
|
Operating Profit Before Tax |
|
|
|
|
|
| 15,909,771 | 14,513,684 | 16,383,902 | ||
Interest on capital(1) |
|
|
|
|
|
|
|
| (4,080,000) | (3,800,000) | (3,850,000) |
Operating Profit Before Tax |
|
|
|
|
|
| 11,829,771 | 10,713,684 | 12,533,902 | ||
Rates (25% income tax and 20% social contribution tax) |
| (5,323,397) | (4,821,158) | (5,640,256) | |||||||
PIS and COFINS (net of income and social contribution taxes)(2) (7) |
|
|
| (1,490,190) | (1,427,960) | (1,641,181) | |||||
Non-taxable/Non-deductible: |
|
|
|
|
|
|
|
|
| ||
Equity in affiliates |
|
|
|
|
|
|
|
| 29,681 | 32,198 | 21,392 |
Goodwill(3) |
|
|
|
|
|
|
|
| (101,305) | (669,963) | (734,952) |
Exchange variation - foreign branches(4) |
|
|
|
|
| 2,792,995 | 440,857 | (3,561,133) | |||
Net Indeductible Expenses of Non-Taxable Income(7) |
|
|
|
|
| 384,554 | 194,737 | - | |||
Adjustments: |
|
|
|
|
|
|
|
|
|
|
|
Constitution of income and social contribution taxes on temporary differences |
|
| 136,353 | 1,138,005 | 605,058 | ||||||
Effects of change in rate of social contribution taxes(5)(6) |
|
|
| (90,013) | (1,427,667) | (613,202) | |||||
Other adjustments(6) |
|
|
|
|
|
| 551,469 | 1,165,315 | 2,645,290 | ||
Income taxes |
|
|
|
|
|
|
|
| (3,109,853) | (5,375,636) | (8,918,984) |
Of which: |
|
|
|
|
|
|
|
|
|
|
|
Current tax(7) |
|
|
|
|
|
|
|
| (4,704,293) | (4,969,241) | (3,575,099) |
Deferred taxes |
|
|
|
|
|
|
|
| 1,594,440 | (406,395) | (5,343,885) |
Taxes paid in the year |
|
|
|
|
|
|
| (3,668,571) | (3,280,230) | (4,240,115) | |
(2) PIS and COFINS are considered a profit-base component (net basis of certain revenues and expenses), therefore and accordingly to IAS 12 they are recorded as income taxes.
(3) The difference between the tax basis and accounting basis of goodwill on acquisition of Banco ABN Amro Real S.A. is a permanent and definitive difference. Administration in this case the possibility of loss on impairment or disposal is remote and only applies to the entity as a whole and according to the characteristics of the business combination performed, it is not possible to segregate and identify the business originally acquired. Therefore deferred tax liability is not record.
(4) Permanent difference related of foreign currency exchange variation on investments abroad nontaxable/ deductible (see details below).
(5) Effect of the rate differential for other non-financial corporations, with a social contribution rate of 9%, as well as the effect of the additional 5% applicable to financial institutions, valid until the end of 2018.
(6) In 2016, includes the IAS 21 amounted to R$575.131 (see Hedge of Investments Abroad below) and non-taxable income/non-deductible expenses R$349.120.
(7) Includes mainly the tax effect on expenses with donations, revenues from judicial deposit updates and other income and expenses that do not qualify as temporary differences.
Exchange Hedge of Grand Cayman, branch in Luxembourg and of Santander Brasil EFC
Banco Santander operates an agency in the Cayman Islands, a branch in Luxembourg, and a subsidiary called Santander Brasil Establecimiento Financiero de Credito, EFC, or "Santander Brasil EFC" (an independent subsidiary in Spain), which are used primarily to raise funds in the capital and financial markets to provide the Bank with credit lines that are extended to its clients for foreign trade and working capital financing.
To hedge the exposure to exchange rate variations, the Bank uses derivatives and funding. In accordance with Brazilian tax rules, gains or losses arising from the impact of the appreciation or depreciation of the Real on foreign investments are not taxable or deductible for PIS / Cofins / IR / CSLL purposes, while the gains or losses of the derivatives used as hedges are taxable or deductible. The purpose of these derivatives is to protect net income after taxes.
Tax distinct treatment from such exchange rate differences results in volatility in "Operating Income Before Tax" and "Income taxes". The foreign exchange variations recorded as a result of foreign investments in the years ended on December 31, 2018, 2017 and 2016.
|
|
|
|
|
|
|
|
|
| 2018 | 2017 | 2016 |
Exchange differences (net) |
|
|
|
|
|
|
|
|
| |||
Result generated by the exchange rate variations on the Bank's investment in the Cayman, Luxemburg and EFC Branch |
| 6,673,535 | 892,863 | (7,407,231) | ||||||||
Gains (losses) on financial assets and liabilities (net) |
|
|
|
|
|
|
|
| ||||
Result generated by derivative contracts used as hedge |
| (12,540,855) | (1,702,557) | 14,124,481 | ||||||||
Income Taxes |
|
|
|
|
|
|
|
|
|
|
| |
Tax effect of derivative contracts used as hedge - PIS / COFINS |
| 255,481 | 80,170 | (656,788) | ||||||||
Tax effect of derivative contracts used as hedge - IR / CS |
| 5,611,839 | 729,524 | (6,060,462) | ||||||||
|
|
|
|
|
|
|
|
|
|
|
|
|
Consolidated Financial Statements - December 31, 2018 87
b) Effective tax rate calculation
The effective tax rate is as follows:
Thousand of reais |
|
|
|
|
|
|
|
| 2018 | 2017 | 2016 |
|
|
|
|
|
|
|
|
|
|
|
|
Operating Profit Before Tax |
|
|
|
|
|
| 15,909,771 | 14,513,684 | 16,383,902 | ||
Income tax |
|
|
|
|
|
|
|
| 3,109,853 | 5,375,636 | 8,918,984 |
Effective tax rate |
|
|
|
|
|
|
|
| 19.55% | 37.04% | 54.44% |
c) Tax recognized in equity
In addition to the income tax recognized in the consolidated income statement, the Bank recognized the following amounts in consolidated equity:
Thousand of reais |
|
|
|
|
|
|
|
| 2018 | 2017 | 2016 |
|
|
|
|
|
|
|
|
|
|
|
|
Tax credited to equity |
|
|
|
|
|
|
|
| 2,785,330 | 3,373,984 | 2,955,552 |
Measurement of available-for-sale securities |
|
|
|
|
| - | 1,016,121 | 963,990 | |||
Measurement at fair value through other comprehensive income |
|
|
| 369,805 | - | - | |||||
Measurement of cash flow hedges |
|
|
|
|
|
| 2,081 | 1,063 | 4,145 | ||
Measurement of investment hedges |
|
|
|
|
|
| 562,353 | 562,353 | 562,353 | ||
Defined benefit plan |
|
|
|
|
|
|
|
| 1,851,091 | 1,794,447 | 1,425,064 |
Tax charged to equity |
|
|
|
|
|
|
|
| (2,168,758) | (2,541,177) | (1,795,115) |
Measurement of available-for-sale securities |
|
|
|
|
| - | (2,426,459) | (1,701,732) | |||
Measurement at fair value through other comprehensive income |
|
|
| (1,997,600) | - | - | |||||
Measurement of cash flow hedges |
|
|
|
|
|
| (163,038) | (111,134) | (87,929) | ||
Defined benefit plan |
|
|
|
|
|
|
|
| (8,120) | (3,584) | (5,454) |
Total |
|
|
|
|
|
|
|
| 616,572 | 832,807 | 1,160,437 |
d) Deferred taxes
The detail of the balances of “Tax assets – Deferred” and “Tax liabilities – Deferred” is as follows:
Thousand of reais |
|
|
|
|
|
|
|
| 2018 | 2017 | 2016 |
|
|
|
|
|
|
|
|
|
|
|
|
Tax assets: |
|
|
|
|
|
|
|
| 27,680,578 | 24,778,078 | 24,437,112 |
Of which: |
|
|
|
|
|
|
|
|
|
|
|
Temporary differences(1) |
|
|
|
|
|
| 26,416,527 | 23,375,600 | 23,398,886 | ||
Tax loss carry forwards |
|
|
|
|
|
| 846,587 | 866,579 | 382,867 | ||
Social contribution taxes 18% |
|
|
|
|
|
| 417,464 | 535,899 | 655,359 | ||
Total deferred tax assets |
|
|
|
|
|
|
|
| 27,680,578 | 24,778,078 | 24,437,112 |
|
|
|
|
|
|
|
|
|
|
|
|
Tax liabilities: |
|
|
|
|
|
|
|
| 3,031,389 | 2,496,531 | 1,268,037 |
Of which: |
|
|
|
|
|
|
|
|
|
|
|
Excess depreciation of leased assets |
|
|
|
|
| 123,257 | 124,909 | 144,623 | |||
Adjustment to fair value of trading securities and derivatives |
|
|
| 2,908,132 | 2,371,622 | 1,123,414 | |||||
Total deferred tax liabilities |
|
|
|
|
|
| 3,031,389 | 2,496,531 | 1,268,037 | ||
(1) Temporary differences relate mainly to impairment losses on loans and receivables and provisions for lawsuits and administrative proceedings, and the effect of the fair value of financial instruments.
The changes in the balances of “Tax Assets – Deferred” and “Tax Liabilities – Deferred” in the last three years were as follows:
Consolidated Financial Statements - December 31, 2018 88
Thousand of reais |
|
| Balances at December 31, 2017 |
| Adjustment to |
| Valuation adjustments(1) |
| Other(2) | Acquisition / Merger | Balance at December 31, 2018 |
|
|
|
|
|
|
|
|
|
|
|
|
Tax assets: |
|
| 24,778,078 |
| 1,674,317 |
| (186,260) |
| 1,369,934 | 44,509 | 27,680,578 |
Temporary differences | 23,375,600 |
| 1,812,744 |
| (186,260) |
| 1,369,934 | 44,509 | 26,416,527 | ||
Tax loss carry forwards | 866,579 |
| (19,992) |
| - |
| - | - | 846,587 | ||
Social contribution taxes 18% | 535,899 |
| (118,435) |
| - |
| - | - | 417,464 | ||
Tax liabilities: |
|
| 2,496,531 |
| 79,877 |
| 607,773 |
| (153,623) | 831 | 3,031,389 |
Temporary differences | 2,496,531 |
| 79,877 |
| 607,773 |
| (153,623) | 831 | 3,031,389 | ||
Total |
|
| 22,281,547 |
| 1,594,440 |
| (794,033) |
| 1,523,557 | 43,678 | 24,649,189 |
|
|
|
|
|
|
|
|
|
|
|
|
Thousand of reais |
|
| Balances at December 31, 2016 |
| Adjustment to |
| Valuation adjustments(1) |
| Other(2) | Acquisition / Merger | Balance at December 31, 2017 |
|
|
|
|
|
|
|
|
|
|
|
|
Tax assets: |
|
| 24,437,112 |
| 668,483 |
| 254,733 |
| (620,401) | 38,151 | 24,778,078 |
Temporary differences | 23,398,886 |
| 304,231 |
| 254,733 |
| (620,401) | 38,151 | 23,375,600 | ||
Tax loss carry forwards | 382,867 |
| 483,712 |
| - |
| - | - | 866,579 | ||
Social contribution taxes 18% | 655,359 |
| (119,460) |
| - |
| - | - | 535,899 | ||
Tax liabilities: |
|
| 1,268,037 |
| 262,088 |
| 582,363 |
| 378,693 | 5,350 | 2,496,531 |
Temporary differences | 1,268,037 |
| 262,088 |
| 582,363 |
| 378,693 | 5,350 | 2,496,531 | ||
Total |
|
| 23,169,075 |
| 406,395 |
| (327,630) |
| (999,094) | 32,801 | 22,281,547 |
|
|
|
|
|
|
|
|
|
|
|
|
Thousand of reais |
|
| Balances at December 31, 2015 |
| Adjustment to |
| Valuation adjustments(1) |
| Other(2) | Acquisition / Merger | Balance at December 31, 2016 |
|
|
|
|
|
|
|
|
|
|
|
|
Tax assets: |
|
| 30,575,504 |
| (5,318,219) |
| (1,580,025) |
| 652,599 | 107,253 | 24,437,112 |
Temporary differences | 29,538,257 |
| (5,319,198) |
| (1,580,025) |
| 652,599 | 107,253 | 23,398,886 | ||
Tax loss carry forwards | 381,888 |
| 979 |
| - |
| - | - | 382,867 | ||
Social contribution taxes 18% | 655,359 |
| - |
| - |
| - | - | 655,359 | ||
|
|
| 312,420 |
| (551,692) |
| 962,406 |
| 93,991 | - | 817,125 |
Temporary differences | 312,420 |
| (551,692) |
| 962,406 |
| 93,991 | - | 817,125 | ||
Total |
|
| 30,263,084 |
| (4,766,527) |
| (2,542,431) |
| 558,608 | 107,253 | 23,619,987 |
(1) It relates to tax recognized in equity.
(2) In 2018, it mainly refers to net of deferred taxes amounted to R$1,216,311 (2017 - R$241,708 and 2016 - R$129,147), which have the same counterparty and realization period.
e) Expected realization of deferred tax assets
|
|
| Tax assets |
| Tax liabilities | ||||||
Year |
|
| Temporary differences |
| Tax loss carry forwards |
| Social contribution taxes 18% |
| Total | Temporary differences | Total |
|
|
|
|
|
|
|
|
|
|
|
|
2019 |
|
| 8,288,397 |
| 390,185 |
| 390,185 |
| 8,288,397 | 390,185 | 390,185 |
2020 |
|
| 7,034,807 |
| 402,875 |
| 402,875 |
| 7,034,807 | 402,875 | 402,875 |
2021 |
|
| 7,416,682 |
| 341,120 |
| 341,120 |
| 7,416,682 | 341,120 | 341,120 |
2022 |
|
| 855,891 |
| 236,583 |
| 236,583 |
| 855,891 | 236,583 | 236,583 |
2023 a 2025 |
|
| 1,588,828 |
| 236,583 |
| 236,583 |
| 1,588,828 | 236,583 | 236,583 |
2026 a 2027 |
|
| 1,474,574 |
| 854,424 |
| 854,424 |
| 1,474,574 | 854,424 | 854,424 |
2028 a 2032 |
|
| 1,021,399 |
| 569,619 |
| 569,619 |
| 1,021,399 | 569,619 | 569,619 |
Total |
|
| 27,680,578 |
| 3,031,389 |
| 3,031,389 |
| 27,680,578 | 3,031,389 | 3,031,389 |
Consolidated Financial Statements - December 31, 2018 89
25. Other liabilities
The breakdown of the balance of “Other Liabilities” is as follows:
Thousand of reais | 2018 |
| 2017 |
| 2016 |
|
|
|
|
|
|
Accrued expenses and deferred income (1) | 3,193,291 |
| 3,036,374 |
| 2,925,598 |
Transactions in transit (3) | 925,336 |
| 980,501 |
| 916,844 |
Provision for share-based payment | 260,739 |
| 270,626 |
| 212,384 |
Liabilities for insurance contracts | 1,797,167 |
| 1,587,603 |
| 1,584,303 |
Other(2) | 2,918,615 |
| 2,138,817 |
| 2,559,970 |
Total | 9,095,148 |
| 8,013,921 |
| 8,199,099 |
(1) Corresponds, mainly, to payments to be made - personnel expenses.
(2) Includes credits for funds to be released, such as Administratives expenses, amounts due to associates and suppliers.
(3) Includes mainly the amounts to transfer to the credit card companies (resources in transit) and amount to release referred to the real estate credits.
26. Other Comprehensive Income
The balances of Other Comprehensive Income include the amounts, net of the related tax effect, of the adjustments to assets and liabilities recognized temporarily in equity stated in the Consolidated Statement of Changes in Equity and Consolidated Statements of Comprehensive Income until they are extinguished or realized, when they are recognized in the consolidated income statement. The amounts attributable to subsidiaries, investments in associates and joint ventures are presented, on a line by line basis, in the appropriate items based on their nature.
It should be noted that the consolidated Statements of Comprehensive Income includes the changes to Other Comprehensive Income as follows:
- Revaluation gains (losses): This includes the amount of the gains, net of losses incurred in the year, recognized directly in equity. The amounts recognized in equity in the year remain under this heading, even if in the same year they are transferred to the income statement or to the initial carrying amount of the assets or liabilities or are reclassified to another heading.
- Amounts transferred to income statement: This includes the amount of the revaluation gains (losses) previously recognized in equity, even in the same year, which are subsequently recognized in the income statement.
- Amounts transferred to the initial carrying amount of hedged objects: This includes the amount of the revaluation gains (losses) previously recognized in Equity, even in the same year, which are recognized in the initial carrying amount of assets or liabilities as a result of cash flow hedges.
- Other transfers: This includes the amount of the transfers made in the year between the various Other Comprehensive Income items.
In the Consolidated Statements of Comprehensive Income the amounts in "Other Comprehensive Income" are recognized gross, including the amount relating to non-controlling interests, and the corresponding tax effect is presented under a separate heading, except in the case of entities accounted for using the equity method, the amounts for which are presented net of the tax effect.
a) Financial assets measured at fair value through other comprehensive income
a.1) Financial assets measured at fair value through other comprehensive income
Other Comprehensive Income – Financial assets measured at fair value through other comprehensive income includes the net amount of unrealized changes in the fair value of assets classified as available-for-sale financial assets (see Notes 6 and 7), net of taxes.
The breakdown, by type of instrument and geographical origin of the issuer, of Other Comprehensive Income Financial assets measured at fair value through other comprehensive income (IFRS 9) on December 31, 2018 is as follows:
Thousand of reais | 2018 | ||||||
| Revaluation gains |
| Revaluation losses |
| Net revaluation gains (losses) |
| Fair value |
Debt Instruments |
|
|
|
|
|
|
|
Government debt securities | 3,917,451 |
| (1,608,673) |
| 2,308,778 |
| 85,395,136 |
Private-sector debt securities | 1,546,895 |
| (1,863,092) |
| (316,197) |
| 555 |
Total | 5,464,346 |
| (3,471,765) |
| 1,992,581 |
| 85,395,691 |
a.2) Financial assets - available-for-sale
Other Comprehensive Income – Financial assets measured at fair value through other comprehensive income includes the net amount of unrealized changes in the fair value of assets classified as available-for-sale financial assets (see Notes 6 and 7), net of taxes.
The breakdown, by type of instrument and geographical origin of the issuer, of Other Comprehensive Income – available-for-sale (IAS 39) on December 31 2017 and 2016 is as follows:
Thousand of reais |
|
|
|
| 2017 | ||
| Revaluation gains |
| Revaluation losses |
| Net revaluation gains |
| Fair value |
Debt Instruments |
|
|
|
|
|
|
|
Government debt securities | 1,616,486 |
| (6,942) |
| 1,609,544 |
| 79,462,303 |
Private-sector debt securities | 10,694 |
| (2,227) |
| 8,467 |
| 5,254,444 |
|
|
|
|
|
|
|
|
Equity instruments |
|
|
|
|
|
|
|
Domestic | 230,722 |
| (35,159) |
| 195,563 |
| 1,106,637 |
Of which: |
|
|
|
|
|
|
|
Listed | 156,236 |
| (5,322) |
| 150,914 |
| 965,547 |
Unlisted | 74,486 |
| (29,837) |
| 44,649 |
| 141,090 |
Total | 1,857,902 |
| (44,328) |
| 1,813,574 |
| 85,823,384 |
|
|
|
|
|
|
|
|
Thousand of reais |
|
|
|
| 2016 | ||
| Revaluation gains |
| Revaluation losses |
| Net revaluation gains |
| Fair value |
Debt Instruments |
|
|
|
|
|
|
|
Government debt securities | 454,609 |
| (31,288) |
| 423,321 |
| 50,384,382 |
Private-sector debt securities | 101,593 |
| (6,501) |
| 95,092 |
| 5,445,190 |
|
|
|
|
|
|
|
|
Equity instruments |
|
|
|
|
|
|
|
Domestic | 220,535 |
| (72,758) |
| 147,777 |
| 1,985,473 |
Of which: |
|
|
|
|
|
|
|
Listed | 147,844 |
| (50,269) |
| 97,575 |
| 1,024,505 |
Unlisted | 72,691 |
| (22,489) |
| 50,202 |
| 960,968 |
Total | 776,737 |
| (110,547) |
| 666,190 |
| 57,815,045 |
Consolidated Financial Statements - December 31, 2018 90
At each reporting date, the Bank assesses whether there is any objective evidence indicating that the available-for-sale financial assets (debt securities and equity instruments) are impaired.
b) Cash flow hedges
Other Comprehensive Income—Cash flow hedges includes the gains or losses attributable to hedge instruments that qualify as effective hedges. These amounts will remain under this heading until they are recognized in the consolidated income statement in the periods in which the hedged items affect them (see Note 8).
Accordingly, amounts representing valuation losses will be offset in the future by gains generated by the hedged objects.
c) Hedges of net investments in foreign operations and Translation adjustments foreign investment
Other Comprehensive Incomes—Hedges of net investments in foreign operations includes the net amount of changes in the value of hedging instruments in hedges of net investments in foreign operations. In 2017 this hedge was discontinued (Note 8.a5). In 2016, no ineffective portion was identified (Note 8.a5).
Other Comprehensive Income—Exchange differences includes the net amount of the differences arising on the translation to Reais of the balances of the consolidated entities whose functional currency is not the Reais (Note 2.a).
27. Non-controlling interests
a) Breakdown
The detail, by company, of the balance of “Equity - Non-controlling interests” is as follows:
Thousand of reais | 2018 |
| 2017 |
| 2016 |
|
|
|
|
|
|
Santander Leasing S.A. Arrendamento Mercantil | 447 |
| 395 |
| 441 |
Santander Brasil Advisory Services S.A | - |
| - |
| 529 |
Getnet S.A. | 249,007 |
| 206,105 |
| 168,863 |
Olé Consignado S.A. | 116,967 |
| 82,432 |
| 30,425 |
Santander Serviços Técnicos, Administrativos e de Corretagem de Seguros | - |
| - |
| 318,498 |
BW Guirapá S.A. | - |
| - |
| 68,691 |
Banco PSA Finance Brasil S.A. | 155,399 |
| 147,295 |
| 138,057 |
Santander FI SBAC (1) | 62,595 |
| - |
| - |
Rojo Entretenimento S.A. | 7,015 |
| - |
| - |
Return Capital Serviços de Recuperação de Créditos S.A. (Current name of Ipanema Empreendimentos e Participações Ltda.) | 1,155 |
| 667 |
| - |
Total | 592,585 |
| 436,894 |
| 725,504 |
|
|
|
|
|
|
Thousand of reais | 2018 |
| 2017 |
| 2016 |
|
|
|
|
|
|
Profit attributable to non-controlling interests | 217,441 |
| 213,984 |
| 130,355 |
Of which: |
|
|
|
|
|
Santander Leasing S.A. Arrendamento Mercantil | 25 |
| 48 |
| 41 |
Santander Brasil Advisory Services S.A | - |
| - |
| 34 |
Getnet S.A. | 55,518 |
| 48,842 |
| 27,209 |
Olé Consignado S.A. | 138,527 |
| 53,286 |
| 5,432 |
Santander Serviços Técnicos, Administrativos e de Corretagem de Seguros | - |
| 92,365 |
| 98,717 |
BW Guirapá S.A. | - |
| (776) |
| (2,957) |
Banco PSA Finance Brasil S.A. | 17,914 |
| 19,884 |
| 1,879 |
Santander FI SBAC | 4,141 |
| - |
| - |
Rojo Entretenimento S.A. | 166 |
| - |
| - |
Return Capital Serviços de Recuperação de Créditos S.A. (Current name of Ipanema Empreendimentos e Participações Ltda.) | 1,150 |
| 335 |
| - |
Consolidated Financial Statements - December 31, 2018 91
(1) The SBAC Fund, is an exclusive investment fund of the Consolidated Santander and many companies has their investments on it. As some companies has a parcel ofnon-controlling shareholders, this amount refers to the valuation of the equity of that Fund and as a consequence the effect on each company.
b) Changes
The changes in the balance of “Non-controlling interests” are summarized as follows:
Thousand of reais | 2018 |
| 2017 |
| 2016 |
|
|
|
|
|
|
Balance at beginning of year | 436,894 |
| 725,504 |
| 435,062 |
Additions / disposals (net) due to change in the scope of consolidation (1) (2) | 6,849 |
| (660,230) |
| 159,469 |
Incorporation / Acquisition (4) | - |
| 296,184 |
| - |
Dividends paid / Interest on Capital | (60,936) |
| (133,641) |
| (18,140) |
Capital increase (3) | 48,000 |
| - |
| 20,000 |
Profit attributable to non-controlling interests | 217,441 |
| 213,984 |
| 130,355 |
Transition Adjustments to the amendments to the IAS 19 | - |
| (1,790) |
| (1,604) |
| (106,440) |
| - |
| - |
Update of SBAC Fund Quotas | 58,454 |
| - |
| - |
Others | (7,677) |
| (3,117) |
| 362 |
Balance at end of year | 592,585 |
| 436,894 |
| 725,504 |
(1) In 2017 refers mainly to the participation of non-controlling shareholders of BW Guirapá, in 2016 refers to BW Guirapá.
(2) In 2017 refers mainly to the balance of Non-controlling Shareholding of Santander Corretora de Seguros.
(3) Increase in the share capital of Olé Consignado.
(4) In 2017, it refers mainly to the balance of non-controlling interests of Santander Corretora de Seguros, prior to the merger events (Note 3).
Consolidated Financial Statements - December 31, 2018 92
28. Shareholders’ equity
a) Capital
According to the by-laws, Banco Santander's share capital may be increased up to the limit of its authorized capital, regardless of statutory reform, by resolution of the Board of Directors and through the issuance of up to 9,090,909,090 (nine billion, ninety million, nine hundred and nine thousand and ninety) shares, subject to the established legal limits on the number of preferred shares. Any capital increase that exceeds this limit will require shareholders` approval.
The capital stock, fully subscribed and paid, is divided into registered book-entry shares with no par value.
|
|
| Thousand of shares | ||||||||||
|
|
| 2018 |
| 2017 | ||||||||
|
|
|
|
| Common | Preferred | Total |
| Common |
| Preferred |
| Total |
| Brazilian residents |
|
|
| 82,043 | 107,699 | 189,742 |
| 66,207 |
| 91,779 |
| 157,986 |
| Foreign residents |
|
|
| 3,736,652 | 3,572,137 | 7,308,789 |
| 3,752,488 |
| 3,588,057 |
| 7,340,545 |
| Total shares |
|
|
| 3,818,695 | 3,679,836 | 7,498,531 |
| 3,818,695 |
| 3,679,836 |
| 7,498,531 |
| (-) Treasury shares |
|
|
| (13,317) | (13,317) | (26,634) |
| (5,845) |
| (5,845) |
| (11,690) |
| Total outstanding |
|
|
| 3,805,378 | 3,666,519 | 7,471,897 |
| 3,812,850 |
| 3,673,991 |
| 7,486,841 |
|
|
|
|
|
|
|
|
|
|
|
|
|
|
|
|
| Thousand of shares | ||||||||||
|
|
|
|
| 2016 | ||||||||
|
|
|
|
|
|
|
|
| Common |
| Preferred |
| Total |
| Brazilian residents |
|
|
|
|
|
|
| 67,498 |
| 92,949 |
| 160,447 |
| Foreign residents |
|
|
|
|
|
|
| 3,783,473 |
| 3,619,163 |
| 7,402,636 |
| Total shares |
|
|
|
|
|
|
| 3,850,971 |
| 3,712,112 |
| 7,563,083 |
| (-) Treasury shares |
|
|
|
|
|
|
| (25,786) |
| (25,786) |
| (51,572) |
| Total outstanding |
|
|
|
|
|
|
| 3,825,185 |
| 3,686,326 |
| 7,511,511 |
b) Dividends and Interest on Capital
According to the Bank’s by-laws, shareholders are entitled to a minimum dividend equivalent to 25% of net income for the year, adjusted according to legislation. Preferred shares are nonvoting and nonconvertible, but have the same rights and advantages granted to common shares, in addition to priority in the payment of dividends at a rate that is 10% higher than those paid on common shares, and in the capital reimbursement, without premium, in the event of liquidation of the Bank.
Dividend payments have been calculated and paid in accordance with Brazilian Corporate Law.
Prior to the annual shareholders meeting, the Board of Directors may resolve on the declaration and payment of dividends on earnings based on (i) financial statements or earning reserves shown in the last financial statement; or (ii) financial statements issued in the period shorter than 6 months, since the total dividends paid in each half of the fiscal year shall do not exceed the amount of capital reserves. These dividends are fully attributed to the mandatory dividend.
| 2018 | ||||||
| Thousand of reais |
| Real per Thousand Shares / Units | ||||
|
| Common |
| Preferred |
| Units | |
|
|
|
|
|
|
|
|
Interest on Capital(1) (6) | 600,000 |
| 76.3304 |
| 83.9634 |
| 160.2938 |
Intercalary Dividends(2) (6) | 600,000 |
| 76.4956 |
| 84.1451 |
| 160.6407 |
Interest on Capital(3) (6) | 600,000 |
| 76.4985 |
| 84.1484 |
| 160.6469 |
Interest on Capital(4) (6) | 2,880,000 |
| 367.4149 |
| 404.1564 |
| 771.5713 |
Intercalary Dividends(5) (6) | 1,920,000 |
| 244.9433 |
| 269.4376 |
| 514.3809 |
Total | 6,600,000 |
|
|
|
|
|
|
(1) Established by the Board of Directors in March 27, 2018, Common Shares - R$64.8808, preferred - R$71.3689 e Units - R$136.2497 net of taxes and were be paid in April 26, 2018, without any remuneration for monetary restatement.
(2) Established by the Board of Directors in June 2018, and were be paid on July 27, 2018 without any compensation as monetary correction.
(3) Established by the Board of Directors in September 28, 2018, Common Shares - R$65.0237, preferred - R$71.5261 e Units - R$136.5498 net of taxes and were be paid in October 26, 2018, without any remuneration for monetary restatement.
(4) Established by the Board of Directors in December 28, 2018, Common Shares - R$312.3027, preferred - R$343.5329 e Units - R$655.8356 net of taxes and will be paid in February 26, 2019, without any remuneration for monetary restatement.
(5) Established by the Board of Directors in December 28, 2018, and will be paid on February 26, 2019 without any compensation as monetary correction.
(6) The amount of interest on stockholders' equity will be fully charged to the mandatory minimum dividends to be distributed by the Bank for the year 2018.
| 2017 | ||||||
| Thousand of reais |
| Real per Thousand Shares / Units | ||||
|
| Common |
| Preferred |
| Units | |
|
|
|
|
|
|
|
|
Interest on Capital(1) (6) | 500,000 |
| 63.3780 |
| 69.7158 |
| 133.0938 |
Interest on Capital(2) (6) | 500,000 |
| 63.5280 |
| 69.8808 |
| 133.4088 |
Interest on Capital(3) (6) | 500,000 |
| 63.5917 |
| 69.9509 |
| 133.5426 |
Intercalary Dividends (4) (6) | 2,500,000 |
| 318.2994 |
| 350.1293 |
| 668.4287 |
Interest on Capital (5) (6) | 2,300,000 |
| 292.8354 |
| 322.1190 |
| 614.9544 |
Total | 6,300,000 |
|
|
|
|
|
|
(1) Established by the Board of Directors in April 2017, Common Shares - R$53.8713, preferred - R$59.2584 and Units - R$113.1297 net of taxes, and was paid on May 26, 2017 without any compensation as monetary correction.
(2) Established by the Board of Directors in July 2017, Common Shares - R$53.9988, preferred - R$59.3987 and Units - R$113.3975 net of taxes, and was paid on August 25, 2017 without any compensation as monetary correction.
(3) Established by the Board of Directors in September 2017, Common Shares - R$54.0530, preferred - R$59.4583 and Units - R$113.5113 net of taxes, and was paid on October 26, 2017 without any compensation as monetary correction.
(4) Established by the Board of Directors in December 2017, and was paid on February 26, 2018 without any compensation as monetary correction.
(5) Established by the Board of Directors in December 2017, Common Shares - R$248.9101, preferred - R$273.8011 and Units - R$522.7112 net of taxes, was paid on February 26, 2018 without any compensation as monetary correction.
(6) The amount of interest on shareholders' equity and interim dividends was fully charged to the mandatory dividends for the year 2017.
Consolidated Financial Statements - December 31, 2018 93
| 2016 | ||||||
| Thousand of reais |
| Reais per Thousand Shares / Units | ||||
|
| Common |
| Preferred |
| Units | |
|
|
|
|
|
|
|
|
Intercalary Dividends (1) (5) | 500,000 |
| 63.4290 |
| 69.7719 |
| 133.2009 |
Intermediary Dividends (2) (5) | 700,000 |
| 88.8309 |
| 97.7140 |
| 186.5449 |
Intercalary Dividends (2) (5) | 700,000 |
| 88.8309 |
| 97.7140 |
| 186.5449 |
Interest on Capital (3) (5) | 3,350,000 |
| 425.1192 |
| 467.6311 |
| 892.7503 |
Total | 5,250,000 |
|
|
|
|
|
|
(1) Established by the Board of Directors in June 2016, Common Shares - R$53.9146, preferred - R$59.3061 and Units - R$113.2207 net of taxes. |
(2) Established by the Board of Directors in December 2016. |
(3) Established by the Board of Directors in December 2016, Common Shares- R$361.3513, preferred - R$397.4864 and Units - R$758.8377 net of taxes. |
(4) 'The amount of the interest on capital were fully input into the mandatory dividends for the year 2016 and were be paid from August 26, 2016 without any compensation as monetary correction. |
(5) The amount of intermediate, intercalary dividends and interest on capital will be fully attributed to supplementary and mandatory dividends for the year 2016 and waspaid on February 23, 2017, without any compensation to the restatement. |
c) Reserves
The reserves are allocated as follows after the deductions and statutory provisions, from the net income:
Legal reserve
In accordance with Brazilian Corporate Law, 5% is transferred to the legal reserve, until it reaches 20% of the share capital. This reserve is designed to ensure the integrity of the capital and can only be used to offset losses or increase capital.
Capital reserve
The Bank´s capital reserve consists of: goodwill reserve for subscription of shares and other capital reserves, and can only be used to absorb losses that exceed retained earnings and profit reserves, redemption, reimbursement or acquisition of shares for the Bank´s own issue; capital increase, or payment of dividends to preferred shares under certain circumstances.
Reserve for equalization dividend
After the allocation of dividends, the remaining balance if any, may, upon proposal of the Executive Board and approved by the Board of Directors, be allocated to reserve for equalization of dividends, which will be limited to 50% of the capital. This reserve aims to ensure funds for the payment of dividends, including as interest on own capital, or any interim payment to maintain the flow of shareholders remuneration.
d) Treasury shares
In the meeting held on November 1, 2018, the Bank’s Board of Directors approved, in continuation of the buyback program that expired on November 1, 2017, the buyback program of its Units and ADRs, by the Bank or its agency in Cayman, to be held in treasury or subsequently sold.
The Buyback Program will cover the acquisition up to 37,753,760 Units, representing 37,753,760 common shares and 37,753,760 preferred shares, or the ADRs, which, on December 31, 2018, corresponded to approximately 1% of the Bank’s share capital. On December 31, 2018, the Bank held 362,227,661 common shares and 390,032,076 preferred shares being traded.
The Buyback has the purpose to (1) maximize the value creation to stockholders by means of an efficient capital structure management; and (2) enable the payment of officers, management level employees and others Bank’s employees and companies under its control, according to the Long Term Incentive Plans. The term of the Buyback Program is 12 months counted from November 6, 2018, and will expire on November 5, 2019.
Consolidated Financial Statements - December 31, 2018 94
|
| 2018 |
| 2017 |
|
|
| 2016 |
|
| Quantity |
| Quantity |
| Quantity | ||
|
| Units |
| Units |
| Units |
| ADRs |
Treasury shares at beginning of the period |
| 1,773 |
| 25,786 |
| 7,080 |
| 13,138 |
Shares Acquisitions |
| 15,816 |
| 12,768 |
| 14,284 |
| - |
Cancellation of Shares(1)(2)(3) |
| - |
| (32,276) |
| 13,138 |
| (13,138) |
Payment - Share-based compensation |
| (4,272) |
| (4,505) |
| (8,716) |
| - |
Treasury shares at end of the period |
| 13,317 |
| 1,773 |
| 25,786 |
| - |
Balance of Treasury Shares in thousand of reais(2) |
| R$ 460,550 |
| R$ 148,246 |
| R$ 513,889 |
| R$ 0 |
|
| R$ 882 |
| R$ 194 |
| R$ 145 |
| R$ 0 |
Balance of Treasury Shares in thousands of reais |
| R$ 461,432 |
| R$ 148,440 |
| R$ 514,034 |
| R$ 0 |
|
|
|
|
|
|
|
|
|
Cost/Share Price |
| Units |
| Units |
| Units |
| ADRs |
Minimum cost |
| R$7.55 |
| R$7.55 |
| R$7.55 |
| US$ 4,37 |
Weighted average cost |
| R$28.59 |
| R$24.41 |
| R$19.93 |
| US$ 6,17 |
Maximum cost |
| R$43.84 |
| R$32.29 |
| R$26.81 |
| US$ 10,21 |
Share Price |
| R$42.70 |
| R$31.88 |
| R$28.32 |
| US$ 8,58 |
(1) In January 2016 was the transformation of all ADRs that were held in treasury for UNIT's.
(2)At the EGM held on September, 18, 2017, it was approved the cancellation of 64,551,366 treasury shares (equivalent to 32,276 thousand Units) with the counterparty headings Capital Reserves and Profit Reserves, which represent the total of treasury shares registered in the book of common shares at that date, without reduction of the capital and consequent change in the clause 5th from the Bylaws in order to reflect the new quantities of common and preferred shares, nominatives and without value which represent the Banco Santander´s capital.
Additionally, in the year ended December 31, 2018, treasury shares were sold, that resulted in a loss of R$15,868 (2017 - R$2,498 and 2016 - R$11,574) recorded directly in equity in capital reserves.
29. Earnings per share
a) Basic earnings per share
Basic earnings per share is calculated by dividing the net profit attributable to the Parent by the weighted average outstanding shares during the year average number, excluding the average number of own shares held during the year and held in treasury.
|
| 2018 |
| 2017 |
| 2016 |
|
|
|
|
|
|
|
Profit attributable to the Parent |
| 12,582,477 |
| 8,924,064 |
| 7,334,563 |
|
|
|
|
|
|
|
Earnings per share (Brazilian Reais) |
|
|
|
|
|
|
Basic earnings per 1,000 shares (Brazilian Reais) |
|
|
|
|
|
|
Common shares |
| 1,604.34 |
| 1,133.43 |
| 929.93 |
Preferred shares |
| 1,764.78 |
| 1,246.77 |
| 1,022.92 |
Net Profit attributable - Basic (Brazilian Reais) |
|
|
|
|
|
|
Common shares |
| 6,108,349 |
| 4,332,026 |
| 3,560,288 |
Preferred shares |
| 6,474,128 |
| 4,592,038 |
| 3,774,275 |
|
|
|
|
|
|
|
Weighted average shares outstanding - Basic |
|
|
|
|
|
|
Common shares |
| 3,807,386 |
| 3,822,057 |
| 3,828,555 |
Preferred shares |
| 3,668,527 |
| 3,683,145 |
| 3,689,696 |
b) Diluted earning per share
Consolidated Financial Statements - December 31, 2018 95
The diluted earnings per share is calculated by dividing the net profit attributable to the Parent by the weighted average outstanding shares during the year average number, excluding the average number of own shares held during the year and held in treasury, including the effect of dilutive potential programs long-term compensation.
| 2018 |
| 2017 |
| 2016 |
|
|
|
|
|
|
Profit attributable to the Parent | 12,582,477 |
| 8,924,064 |
| 7,334,563 |
|
|
|
|
|
|
Earnings per share (Brazilian Reais) |
|
|
|
|
|
Diluted earnings per 1,000 shares (Brazilian Reais) |
|
|
|
|
|
Common shares | 1,604.34 |
| 1,132.44 |
| 929.03 |
Preferred shares | 1,764.78 |
| 1,245.69 |
| 1,021.93 |
Net Profit attributable - Basic (Brazilian Reais) |
|
|
|
|
|
Common shares | 6,108,349 |
| 4,331,955 |
| 3,560,222 |
Preferred shares | 6,474,128 |
| 4,592,109 |
| 3,774,341 |
|
|
|
|
|
|
Weighted average shares outstanding (in thousand) - Diluted |
|
|
|
|
|
Common shares | 3,807,386 |
| 3,825,313 |
| 3,832,211 |
Incremental shares from stock options granted under Stock Option Plan - Units (1) | - |
| 3,257 |
| 3,656 |
|
|
|
|
|
|
Preferred shares | 3,668,527 |
| 3,686,401 |
| 3,693,352 |
Incremental shares from stock options granted under Stock Option Plan - Units (1) | - |
| 3,257 |
| 3,656 |
(1) The exercise period of the SOP 2013 Long Term Incentive Plan purchase option ended in June 2018. The Bank does not have stock-based compensation plans in force (Note 40) and consequently has no anti-dilution items.
30. Fair value of financial assets and liabilities
Under IFRS 13, the fair value measurement uses a fair value hierarchy that reflects the model used in the measurement process which should be in accordance with the following hierarchical levels:
Level 1: Determined on the basis of public (unadjusted) quoted prices in active markets for identical assets and liabilities, these include public debt securities, stocks, derivatives listed.
Level 2: They are those derived from inputs other than quoted prices included within Level 1 that are observable for the asset or liability, either directly (as prices) or indirectly (derived from prices).
Level 3: They are those derived from valuation techniques that include inputs for the asset or liability that are not based on observable market data (unobservable inputs).
Trading Financial Assets, Other financial assets at fair value on through income statement, Available-for-sale financial assets and Financial liabilities held for trading.
Level 1: The securities with high liquidity and quoted prices in active market are classified as level 1. At this level there were classified most of the Brazilian Government Securities (mainly LTN, LFT, NTN-B, NTN-C and NTN-F), shares in stock exchange and other securities traded in the active market.
Level 2: When quoted price cannot be observed, the Management, using its own internal models, make its best estimate of the price that would be set by the market. These models use data based on observable market parameters as an important reference. Various techniques are used to make these estimates, including the extrapolation of observable market data and extrapolation techniques. The best evidence of fair value of a financial instrument on initial recognition is the transaction price, unless the fair value of the instrument can be obtained from other market transactions carried out with the same instrument or similar instruments or can be measured using a valuation technique in which the variables used include only data from observable market, especially interest rates. These securities are classified within Level 2 of the fair value hierarchy and are composed mainly by Private Securities (highlighting the Debenture portfolio) in a market with less liquidity than those classified at Level 1.
Level 3: When there is information that is not based on observable market data, Banco Santander uses internally developed models, from curves generated according to the internal model. Level 3 comprises mainly unlisted shares.
Derivatives
Level 1: Derivatives traded on stock exchanges are classified in Level 1 of the hierarchy.
Level 2: For derivatives traded over the counter, the valuation (primarily swaps and options) usually uses observable market data, such as: exchange rates, interest rates, volatility, correlation between indexes and market liquidity.
When pricing the financial instruments aforementioned, it is used the Black-Scholes Model (exchange rate options, interest rate options; caps and floors) and the present value method (discount of future values by market curves).
Level 3: Derivatives not traded in the stock exchange and that do not have an observable data in a active market were classified as Level 3. These are composed by exotic derivatives.
The new Banco Santander´s policy related to instrument classification in the fair value hierarchy existing since September/2018, introduced detailedprocedures about the instrument classification process. Definitions were included related to instruments, risk factors and deadlines as well as observability degree of market prices and its importance in the fair value measurement model. The application of such definitions since September 2018 resulted in reclassifications of certain financial instruments, as shown in the section “Changes of Fair Value Level 3”.
Consolidated Financial Statements - December 31, 2018 96
The following table shows a summary of the fair values of financial assets and liabilities for the period ended December 31, 2018, 2017 and 2016, classified based on several measurement methods adopted by the Bank to determine their fair value:
Thousand of reais |
|
|
| 2018 | ||||||||
|
|
|
|
|
| Level 1 (1) |
| Level 2 |
| Level 3 |
| Total |
|
|
|
|
|
|
|
|
|
|
|
|
|
Financial Assets Measured At Fair Value Through Profit Or Loss |
| 2,660,859 |
| 40,540,054 |
| 510,887 |
| 43,711,800 | ||||
Debt instruments |
|
|
|
|
| 2,660,859 |
| - |
| 510,887 |
| 3,171,746 |
Equity instruments |
|
|
|
|
| - |
| 40,540,054 |
| - |
| 40,540,054 |
Financial Assets Measured At Fair Value Through Profit Or Loss Held For Trading |
|
|
|
|
| 49,855,112 |
| 17,626,932 |
| 1,370,270 |
| 68,852,314 |
Debt instruments |
|
|
|
|
| 49,094,924 |
| 432,910 |
| 538,635 |
| 50,066,469 |
Equity instruments |
|
|
|
|
| 757,843 |
| 8,490 |
| - |
| 766,333 |
Derivatives |
|
|
|
|
| 2,345 |
| 17,185,532 |
| 831,635 |
| 18,019,512 |
Non-Trading Financial Assets Mandatorily Measured At Fair Value Through Profit Or Loss |
|
|
|
|
| 142,732 |
| 619,798 |
| 154,947 |
| 917,477 |
Loans and advances to customers |
|
|
| - |
| 619,180 |
| - |
| 619,180 | ||
Equity instruments |
|
|
|
|
| 142,732 |
| 618 |
| 154,947 |
| 298,297 |
Financial Assets Measured At Fair Value Through Other Comprehensive Income |
| 83,283,924 |
| 1,442,797 |
| 709,956 |
| 85,436,677 | ||||
Debt instruments |
|
|
|
|
| 83,253,117 |
| 1,442,797 |
| 699,777 |
| 85,395,691 |
Equity instruments |
|
|
|
|
| 30,807 |
| - |
| 10,179 |
| 40,986 |
Hedging derivatives (assets) |
| - |
| 343,934 |
| - |
| 343,934 | ||||
Financial Liabilities Measured At Fair Value Through Profit Or Loss |
| 32,697,510 |
| 17,600,024 |
| 641,458 |
| 50,938,992 | ||||
Derivatives |
|
|
|
|
| 1,833 |
| 17,600,024 |
| 641,458 |
| 18,243,315 |
Short positions |
|
|
|
|
| 32,695,677 |
| - |
| - |
| 32,695,677 |
Hedging derivatives (liabilities) |
| - |
| 223,520 |
| - |
| 223,520 | ||||
| Thousand of reais |
|
| 2017 | |||||
|
|
|
|
| Level 2 |
| Level 3 |
| Total |
|
|
|
|
|
|
|
|
|
|
| Financial assets held for trading |
| 34,380,542 |
| 18,059,034 |
| - |
| 52,439,576 |
| Debt instruments |
| 33,891,360 |
| 988,321 |
| - |
| 34,879,681 |
| Equity instruments |
| 489,182 |
| 588 |
| - |
| 489,770 |
| Trading derivatives |
| - |
| 17,070,125 |
| - |
| 17,070,125 |
| Financial assets designated at fair value through profit or loss |
| 1,593,951 |
| 64,738 |
| 33,368 |
| 1,692,057 |
| Debt instruments |
| 1,593,951 |
| 64,738 |
| - |
| 1,658,689 |
| Equity instruments |
| - |
| - |
| 33,368 |
| 33,368 |
| Financial assets - available-for-sale |
| 79,301,016 |
| 6,382,225 |
| 140,143 |
| 85,823,384 |
| Debt instruments |
| 78,335,629 |
| 6,381,118 |
| - |
| 84,716,747 |
| Equity instruments |
| 965,387 |
| 1,107 |
| 140,143 |
| 1,106,637 |
| Hedging derivatives (assets) |
| - |
| 192,763 |
| - |
| 192,763 |
| Financial liabilities held for trading |
| 32,808,392 |
| 16,514,154 |
| - |
| 49,322,546 |
| Derivatives |
| - |
| 16,514,154 |
| - |
| 16,514,154 |
| Short positions |
| 32,808,392 |
| - |
| - |
| 32,808,392 |
| Hedging derivatives (liabilities) |
| - |
| 163,332 |
| - |
| 163,332 |
|
|
|
|
|
|
|
|
|
|
| Thousand of reais |
|
| 2016 | |||||
|
|
|
|
| Level 2 |
| Level 3 |
| Total |
|
|
|
|
|
|
|
|
|
|
| Financial assets held for trading |
| 59,410,908 |
| 25,462,755 |
| - |
| 84,873,663 |
| Debt instruments |
| 59,034,363 |
| 960,583 |
| - |
| 59,994,946 |
| Equity instruments |
| 376,545 |
| 21,916 |
| - |
| 398,461 |
| Derivatives |
| - |
| 24,480,256 |
| - |
| 24,480,256 |
| Financial assets designated at fair value through profit or loss |
| 1,597,660 |
| 76,035 |
| 37,509 |
| 1,711,204 |
| Debt instruments |
| 1,592,714 |
| 76,035 |
| - |
| 1,668,749 |
| Equity instruments |
| 4,946 |
| - |
| 37,509 |
| 42,455 |
| Financial assets - available-for-sale |
| 51,160,044 |
| 5,703,389 |
| 951,612 |
| 57,815,045 |
| Debt instruments |
| 50,172,609 |
| 5,656,963 |
| - |
| 55,829,572 |
| Equity instruments |
| 987,435 |
| 46,426 |
| 951,612 |
| 1,985,473 |
| Hedging derivatives (assets) |
| - |
| 222,717 |
| - |
| 222,717 |
| Financial liabilities held for trading |
| 31,694,269 |
| 19,925,600 |
| - |
| 51,619,869 |
| Derivatives |
| - |
| 19,925,600 |
| - |
| 19,925,600 |
| Short positions |
| 31,694,269 |
| - |
| - |
| 31,694,269 |
| Hedging derivatives (liabilities) |
| - |
| 311,015 |
| - |
| 311,015 |
Consolidated Financial Statements - December 31, 2018 97
Movements in fair value of Level 3
The following tables demonstrate the movements during 2018, 2017 and 2016 for the financial assets and liabilities classified as Level 3 in the fair value hierarchy:
Thousand of reais |
| Fair Value |
| Gains/ losses (Realized-Not Realized) |
| Transfers in and/ or out of Level 3 |
| Additions / Settled |
| Impact of IFRS 9 |
| Fair value |
|
|
|
|
|
|
|
|
|
|
|
|
|
Financial Assets Measured At Fair Value Through Profit Or Loss | 33,368 |
| 60,887 |
| - |
| 445,991 |
| (29,359) |
| 510,887 | |
Financial Assets Measured At Fair Value Through Profit Or Loss Held For Trading |
| - |
| (181,355) |
| 1,264,576 |
| 246,051 |
| 40,998 |
| 1,370,270 |
Non-Trading Financial Assets Mandatorily Measured At Fair Value Through Profit Or Loss |
| - |
| (7,280) | - | - |
| - |
| 162,227 |
| 154,947 |
Financial Assets Measured At Fair Value Through Other Comprehensive Income |
| 140,143 |
| 47,773 |
| 645,708 |
| - |
| (123,668) |
| 709,956 |
Financial Liabilities Measured At Fair Value Through Profit Or Loss | - |
| 115,212 |
| 710,219 |
| (183,973) |
| - |
| 641,458 | |
|
|
|
|
|
|
|
|
|
|
|
|
|
Thousand of reais |
| Fair Value |
| Gains/ losses (Realized-Not Realized) |
| Transfers in and/ or out of Level 3 |
| Additions |
| Settled |
| Fair value |
|
|
|
|
|
|
|
|
|
|
|
|
|
Financial assets designated at fair value through profit or loss | 37,509 |
| (2,555) |
| - |
| (1,586) |
| (1,586) |
| 31,782 | |
Financial assets - available-for-sale | 951,612 |
| 18,474 |
| - |
| (829,943) |
| (829,943) |
| (689,800) | |
|
|
|
|
|
|
|
|
|
|
|
|
|
Thousand of reais |
| Fair Value |
| Gains/ losses (Realized-Not Realized) |
| Transfers in and/ or out of Level 3 |
| Additions |
| Settled |
| Fair value |
|
|
|
|
|
|
|
|
|
|
|
|
|
Financial assets held for trading | - |
| - |
| - |
| - |
| - |
| - | |
Financial assets designated at fair value through profit or loss | 573,664 |
| 2,806 |
| (14,345) |
| 111 |
| (524,727) |
| 37,509 | |
Financial assets - available-for-sale | 857,817 |
| (60,934) |
| (3,085) |
| 461,185 |
| (303,371) |
| 951,612 | |
Consolidated Financial Statements - December 31, 2018 98
Fair value movements linked to credit risk
Changes in fair value attributable to changes in credit risk are determined on the basis of changes in the prices of credit default swaps compared to similar obligations of the same obligor when such prices are observable, since these credit swaps better reflect the market risk assessment for a specific financial asset. When such prices are not observable, changes in fair value attributable to changes in credit risk are determined as the total value of changes in fair value not attributable to changes in the underlying interest rate or other observed market rates. In the absence of specific observable data, this approach provides a reasonable approximation of changes attributable to credit risk, as it estimates the margin change above the reference value that the market may require for the financial asset. In 2018, there were no significant changes between the fair value categories due to changes in credit risk.
Financial assets and liabilities not measured at fair value
The financial assets owned by the Bank are measured at fair value in the accompanying consolidated balance sheets, except for loans and receivables.
Similarly, the Bank’s financial liabilities except for financial liabilities held for trading and those measured at fair value - are measured at amortized cost in the consolidated balance sheets.
i) Financial assets measured at other than fair value
Below is a comparison of the carrying amounts of financial assets of the Bank measured by a value other than the fair value and their respective fair values on December 31, 2018, 2017 and 2016:
| Thousand of reais |
|
|
|
| 2018 | |||||
|
|
| Carrying Amount |
| Fair Value |
| Level 1 |
| Level 2 |
| Level 3 |
| Assets |
|
|
|
|
| |||||
|
|
|
|
|
|
|
|
|
|
|
|
| Money market investments - Brazilian Central Bank (note 4) | 15,228,491 |
| 15,269,809 |
| - |
| 15,269,809 |
| - | |
| Financial Assets Measured At Amortized Cost: |
|
|
|
|
|
|
|
|
|
|
| Loans and amounts due from credit institutions (note 5) | 79,607,001 |
| 79,607,197 |
| - |
| 79,607,197 |
| - | |
| Loans and advances to customers (note 9) | 301,702,207 |
| 303,495,240 |
| - |
| - |
| 303,495,240 | |
| Financial Assets Measured At Amortized Cost - Debt instruments (note 6) | 36,799,509 |
| 38,927,356 |
| 9,766,162 |
| 29,161,194 |
| - | |
| Total |
| 433,337,208 |
| 437,299,602 |
| 9,766,162 |
| 124,038,200 |
| 303,495,240 |
|
|
|
|
|
|
|
|
|
|
|
|
| Thousand of reais |
|
|
|
| 2017 | |||||
|
|
| Carrying Amount |
| Fair Value |
| Level 1 |
| Level 2 |
| Level 3 |
| Assets |
|
|
|
|
| |||||
|
|
|
|
|
|
|
|
|
|
|
|
| Money market investments - Brazilian Central Bank (note 5) | 33,831,521 |
| 33,914,021 |
| - |
| 33,914,021 |
| - | |
| Investments Held-to-Maturity (note 6) | 10,214,454 |
| 10,587,117 |
| 7,251,246 |
| 3,335,871 |
| - | |
| Loans and receivables: |
|
|
|
|
|
|
|
|
|
|
| Loans and amounts due from credit institutions (note 5) | 65,209,902 |
| 65,209,902 |
| - |
| 65,209,902 |
| - | |
| Loans and advances to customers (note 9) | 272,420,157 |
| 275,647,324 |
| - |
| - |
| 275,647,324 | |
| Loans and receivables - Debt instruments (note 6) | 17,616,515 |
| 17,127,511 |
| - |
| 17,127,511 |
| - | |
| Total |
| 399,292,549 |
| 402,485,875 |
| 7,251,246 |
| 119,587,305 |
| 275,647,324 |
|
|
|
|
|
|
|
|
|
|
|
|
| Thousand of reais |
|
|
|
| 2016 | |||||
|
|
| Carrying Amount |
| Fair Value |
| Level 1 |
| Level 2 |
| Level 3 |
| Assets |
|
|
|
|
| |||||
|
|
|
|
|
|
|
|
|
|
|
|
| Money market investments - Brazilian Central Bank (note 4) | 46,371,814 |
| 46,341,971 |
| - |
| 46,341,971 |
| - | |
| Investments Held-to-Maturity (note 6) | 10,048,761 |
| 10,555,437 |
| 6,942,173 |
| 3,613,264 |
| - | |
| Loans and receivables: |
|
|
|
|
|
|
|
|
|
|
| Loans and amounts due from credit institutions (note 5) |
| 65,711,001 |
| 65,711,001 |
| - |
| 65,711,001 |
| - |
| Loans and advances to customers (note 9) |
| 252,002,774 |
| 253,860,027 |
| - |
| - |
| 253,860,027 |
Loans and receivables - Debt instruments (note 6) |
| 16,283,259 |
| 16,003,885 |
| - |
| 16,003,885 |
| - | |
| Total |
| 390,417,609 |
| 392,472,321 |
| 6,942,173 |
| 72,530,121 |
| 253,860,027 |
Consolidated Financial Statements - December 31, 2018 99
ii) Financial liabilities measured at other than fair value
Following is a comparison of the carrying amounts of Bank´s financial liabilities measured by a value other than fair value and their respective fair values on December 31 , 2018, 2017 and 2016:
Thousand of reais |
|
|
|
|
| 2018 | |||||
|
|
| Carrying Amount |
| Fair Value |
| Level 1 |
| Level 2 |
| Level 3 |
Liabilities |
|
|
|
|
|
| |||||
|
|
|
|
|
|
|
|
|
|
|
|
Financial liabilities at amortized cost: |
|
|
|
|
|
|
|
|
| ||
Deposits from Bacen and credit institutions (note 16) | 98,716,735 |
| 98,713,988 |
| - |
| 98,713,988 |
| - | ||
Customer deposits (note 17) | 285,344,281 |
| 285,417,696 |
| - |
| 285,417,696 |
| - | ||
Marketable debt securities (note 18) | 74,626,232 |
| 74,783,289 |
| - |
| 4,599,204 |
| 70,184,085 | ||
Subordinated liabilities (note 19) | 9,885,607 |
| 9,853,157 |
| - |
| 9,853,157 |
| - | ||
Debt Instruments Eligible to Compose Capital (note 20) | 9,779,944 |
| 9,782,373 |
| - |
| 9,782,373 |
| - | ||
Other financial liabilities (note 21) | 49,782,780 |
| 49,782,780 |
| - |
| - |
| 49,782,780 | ||
Total |
|
| 528,135,579 |
| 528,333,283 |
| - |
| 408,366,418 |
| 119,966,865 |
|
|
|
|
|
|
|
|
|
|
|
|
Thousand of reais |
|
|
|
|
| 2017 | |||||
|
|
| Carrying Amount |
| Fair Value |
| Level 1 |
| Level 2 |
| Level 3 |
Liabilities |
|
|
|
|
|
| |||||
|
|
|
|
|
|
|
|
|
|
|
|
Financial liabilities at amortized cost: |
|
|
|
|
|
|
|
|
| ||
Centrals banks (note 16) |
|
| 79,068,604 |
| 79,068,564 |
| - |
| - |
| 79,068,564 |
Customers (note 17) |
|
| 258,482,156 |
| 258,576,177 |
| - |
| - |
| 258,576,177 |
Marketable debt securities (note 18) | 70,247,012 |
| 70,245,820 |
| - |
| 2,000,552 |
| 68,245,268 | ||
Subordinated liabilities (note 19) | 519,230 |
| 528,799 |
| - |
| - |
| 528,799 | ||
Debt Instruments Eligible to Compose Capital (note 20) | 8,436,901 |
| 8,436,901 |
| - |
| 8,436,901 |
| - | ||
Other financial liabilities (note 21) | 44,260,735 |
| 43,003,735 |
| - |
| - |
| 43,003,735 | ||
Total |
|
| 461,014,638 |
| 459,859,996 |
| - |
| 10,437,453 |
| 449,422,543 |
|
|
|
|
|
|
|
|
|
|
|
|
Thousand of reais |
|
|
|
|
| 2016 | |||||
|
|
| Carrying Amount |
| Fair Value |
| Level 1 |
| Level 2 |
| Level 3 |
Liabilities |
|
|
|
|
|
| |||||
|
|
|
|
|
|
|
|
|
|
|
|
Financial liabilities at amortized cost: |
|
|
|
|
|
|
|
|
| ||
Centrals banks (note 16) |
|
| 78,319,960 |
| 78,323,271 |
| - |
| - |
| 78,323,271 |
Customers (note 17) |
|
| 231,079,303 |
| 231,125,526 |
| - |
| - |
| 231,125,526 |
Marketable debt securities (note 18) | 99,842,955 |
| 99,671,288 |
| - |
| 7,321,870 |
| 92,349,418 | ||
Subordinated liabilities (note 19) | 466,246 |
| 452,439 |
| - |
| - |
| 452,439 | ||
Debt Instruments Eligible to Compose Capital (note 20) | 8,311,918 |
| 8,311,918 |
| - |
| 8,311,918 |
| - | ||
Other financial liabilities (note 21) | 36,879,099 |
| 35,622,099 |
| - |
| - |
| 35,622,099 | ||
Total |
|
| 454,899,481 |
| 453,506,541 |
| - |
| 15,633,788 |
| 437,872,753 |
Consolidated Financial Statements - December 31, 2018 100
The methods and assumptions used to estimate the fair values summarized in the tables above are set forth below:
- Loans and amounts due from credit institutions and from clients – Fair value are estimated for groups of loans with similar characteristics. The fair value was measured by discounting estimated cash flow using the average interest rate of new contracts. That is, the future cash flow of the current loan portfolio is estimated using the contractual rates, and then the new loans spread over the risk free interest rate are incorporated to the risk free yield curve in order to calculate the loan portfolio fair value. In terms of behavior assumptions, it is important to highlight that a prepayment rate is applied to the loan portfolio, thus a more realistic future cash flow is achieved.
- Deposits from Bacen and credit institutions and Client deposits – The fair value of deposits was calculated by discounting the difference between the cash flows on a contractual basis and current market rates for instruments with similar maturities. For variable-rate deposits, the carrying amount was considered to approximates fair value.
- Debt and Subordinated Securities and Debt Instruments Eligible to Compose Capital – The fair value of long-term loans were estimated by cash flow discounted at the interest rate offered on the market with similar terms and maturities.
The valuation techniques used to estimate each level are defined in note 2.e.
31. Operational Ratios
Financial institutions are required to maintain Regulatory Capital (RC), Tier I and Principal Capital consistent with their risk activities, higher than the minimum requirement of the Regulatory Capital Requirement, represented by the sum of the partial credit, market and operational risk.
The minimum Regulatory Capital requirement was 11% until December 31, 2015, until December 31, 2016 was 9.875%, reducing gradually to 8% on January 1, 2019.. The minimum Total Capital Tier I requirement is 6% from January 1, 2015 and the minimum Principal Capital requirement is 4.5% from October 1, 2013.
In July 2008, the regulations governing the measurement of regulatory capital came into force under the Basel II Standardized Approach. These regulations were revoked by Resolution 4,192/2013 and Resolution 4,278/2013, which came into effect in October 2013. Also, Resolutions 4,193 and 4,281 of 2013, which establish the model for calculating minimum requirements for Reference Equity (PR), of Level I and Principal Capital. These Resolutions determine that the composition of the Referential Equity be made through equity, subordinated debt, hybrid capital instruments.
The index is calculated on a consolidated basis, as shown below:
| Financial Conglomerate | ||||
Thousand of reais | 2018 (1) |
| 2017 (1) |
| 2016 (1) |
|
|
|
|
|
|
Tier I Regulatory Capital | 61,476,715 |
| 56,386,001 |
| 56,264,021 |
Principal Capital | 56,581,518 |
| 52,196,893 |
| 52,136,837 |
Supplementary capital | 4,895,197 |
| 4,189,108 |
| 4,127,184 |
Tier II Regulatory Capital | 4,887,175 |
| 4,250,447 |
| 4,280,864 |
Regulatory Capital (Tier I and II) | 66,363,890 |
| 60,636,448 |
| 60,544,885 |
Required Regulatory Capital | 440,562,919 |
| 383,132,693 |
| 36,669,570 |
Portion of Credit Risk | 358,955,592 |
| 324,696,458 |
| 31,309,944 |
Market Risk Portions (2) | 39,231,773 |
| 25,857,109 |
| 2,388,626 |
Operational Risk Portion (3) | 42,375,554 |
| 32,579,126 |
| 2,971,000 |
Basel I Ratio | 13.95 |
| 14.72 |
| 15.15 |
Basel Principal Capital | 12.84 |
| 13.62 |
| 14.04 |
Basel | 15.06 |
| 15.83 |
| 16.30 |
(1) Amounts calculated based on the consolidated information provided by the Consolidated Prudential.
(2) To calculate the capital allocation for credit risk were considered modifications and inclusions of Bacen Circular 3,714 of August 20, 2014, Bacen Circular 3,770 of October 29,2015, which amending Circular 3,644 of March 4, 2013.
(3) Includes portions for market risk exposures subject to variations in rates of foreign currency coupons (PJUR2), price indexes (PJUR3) and interest rate (PJUR1/PJUR4), the price of commodities (PCOM), the price of shares classified as trading portfolios (PACS), and portions for gold exposure and foreign currency transactions subject to foreign exchange (PCAM).
Banco Santander, quarterly disclose information relating to risk management, a brief description of the Recovery Plan and Required Regulatory Capital (PRE) which is not an extension of the Financial Statements and it isn't audited. A report with further details of the structure and methodology will be disclosed at the website www.santander.com.br/ri.
Consolidated Financial Statements - December 31, 2018 101
Financial institutions are required to maintain investments in tangible assets compatible with adjusted regulatory capital. Funds invested in tangible assets, calculated on a consolidated basis, are limited to 50% of adjusted regulatory capital, as per prevailing regulation.On December 31, 2018, 2017 and 2016 Banco Santander classifies for said index.
32. Interest and similar income
“Interest and similar income” in the consolidated income statement comprises the interest accruing in the year on all financial assets with an implicit or explicit return, calculated by applying the effective interest method, regardless the fair value measurement; and the rectifications of income as a result of hedge accounting. Interest is recognized through its gross value, without deducting any tax withheld at source.
The breakdown of the main items of interest and similar charges accrued in 2018, 2017 and 2016 is as follows:
Thousand of reais | 2018 |
| 2017 |
| 2016 |
|
|
|
|
|
|
Cash and balances with the Brazilian Central Bank | 5,095,828 |
| 5,953,765 |
| 7,315,570 |
Loans and advances - Credit institutions | 2,977,670 |
| 5,107,355 |
| 7,472,729 |
Loans and advances - Customers | 46,471,507 |
| 44,507,217 |
| 43,977,981 |
Debt instruments | 13,629,167 |
| 13,456,802 |
| 14,783,164 |
Other interest | 2,304,221 |
| 2,393,210 |
| 3,596,633 |
Total | 70,478,393 |
| 71,418,349 |
| 77,146,077 |
33. Interest expense and similar charges
“Interest expense and similar charges” in the consolidated income statement includes the interest accruing in the year on all financial liabilities with an implicit or explicit return, including remuneration in kind, calculated by applying the effective interest method, regardless the fair value measurement; the rectifications of cost as a result of hedge accounting; and the interest cost attributable to pension funds.
The breakdown of the main items of interest expense and similar charges accrued in 2018, 2017 and 2016 is as follows:
Thousand of reais | 2018 |
| 2017 |
| 2016 |
|
|
|
|
|
|
Credit institutions deposits | 5,367,471 |
| 3,782,781 |
| 3,369,931 |
Debt securities issued | 13,576,866 |
| 19,490,807 |
| 25,693,236 |
Marketable debt securities and subordinated liabilities: |
|
|
|
|
|
Marketable debt securities (note 18) | 4,606,949 |
| 7,901,199 |
| 12,212,922 |
Subordinated liabilities (note 19) | 25,336 |
| 52,984 |
| 731,594 |
Debt Instruments Eligible to Compose Capital (note 20) | 604,216 |
| 495,188 |
| 501,748 |
Pension Plans (note 22.b) | 343,137 |
| 292,628 |
| 290,920 |
Other interest(1) | 4,033,076 |
| 4,456,273 |
| 3,759,233 |
Total | 28,557,051 |
| 36,471,860 |
| 46,559,584 |
(1) In December 31, 2016, includes R$2,057 million related to the reversal of legal obligations.
34. Income from equity instruments
“Income from equity instruments” includes the dividends and payments on equity instruments out of profits generated by investees after the acquisition of the equity interest.
The breakdown of the balance of this item is as follows:
Thousand of reais |
|
|
|
|
|
| 2018 |
| 2017 |
| 2016 |
|
|
|
|
|
|
|
|
|
|
|
|
Equity instruments classified as: | |||||||||||
Financial assets held for trading |
|
|
| - |
| 18,458 |
| 21,489 | |||
Financial Assets Measured At Fair Value Through Profit Or Loss |
| 27,047 |
| - |
| - | |||||
Financial assets - available-for-sale |
|
|
| - |
| 64,662 |
| 237,056 | |||
Financial Assets Measured At Fair Value Through Other Comprehensive Income | 5,576 |
| - |
| - | ||||||
Total |
|
|
|
|
|
| 32,623 |
| 83,120 |
| 258,545 |
35. Fee and commission income
“Fee and commission income” comprises the amount of all fees and commissions accruing in favor of the Bank in the year, except those that form an integral part of the effective interest rate on financial instruments.
The breakdown of the balance of this item is as follows:
Thousand of reais |
| 2018 |
| 2017 |
| 2016 |
|
|
|
|
|
|
|
Collection and payment services: |
|
|
|
|
|
|
Bills |
| 1,070,258 |
| 970,293 |
| 789,996 |
Demand accounts |
| 2,311,925 |
| 2,156,384 |
| 1,786,175 |
Cards (Credit and Debit) and Acquiring Services |
| 5,854,503 |
| 4,985,306 |
| 4,090,766 |
Checks and other |
| 169,872 |
| 172,718 |
| 169,100 |
Orders |
| 622,405 |
| 471,763 |
| 364,102 |
Total |
| 10,028,962 |
| 8,756,464 |
| 7,200,139 |
|
|
|
|
|
|
|
Marketing of non-Banking financial products: |
|
|
|
|
|
|
Investment funds |
| 717,924 |
| 819,748 |
| 1,014,401 |
Insurance |
| 2,975,661 |
| 2,414,478 |
| 2,114,316 |
Capitalization |
| 402,859 |
| 363,516 |
| 325,531 |
Total |
| 4,096,444 |
| 3,597,742 |
| 3,454,248 |
|
|
|
|
|
|
|
Securities services: |
|
|
|
|
|
|
Securities underwriting and placement |
| 448,914 |
| 513,727 |
| 357,513 |
Securities trading |
| 137,617 |
| 114,015 |
| 115,334 |
Administration and custody |
| 41,794 |
| 191,987 |
| 65,667 |
Asset management |
| 2,173 |
| 2,353 |
| 1,863 |
Total |
| 630,497 |
| 822,082 |
| 540,377 |
|
|
|
|
|
|
|
Other: |
|
|
|
|
|
|
Foreign exchange |
| 934,801 |
| 742,676 |
| 722,912 |
Financial guarantees |
| 708,819 |
| 672,801 |
| 634,375 |
Other fees and commissions |
| 1,328,928 |
| 1,223,778 |
| 996,430 |
Total |
| 2,972,549 |
| 2,639,255 |
| 2,353,717 |
|
|
|
|
|
|
|
Total |
| 17,728,452 |
| 15,815,543 |
| 13,548,481 |
Consolidated Financial Statements - December 31, 2018 102
36. Fee and commission expense
Fee and commission expense” shows the amount of all fees and commissions paid or payable in the year, except those that form an integral part of the effective interest rate on financial instruments.
The breakdown of the balance of this item is as follows:
Thousand of reais |
| 2018 |
| 2017 |
| 2016 |
|
|
|
|
|
|
|
Commissions assigned to third parties(1) |
| 2,364,119 |
| 1,975,379 |
| 1,620,812 |
Other fees and commissions |
| 1,232,174 |
| 1,118,296 |
| 950,073 |
Total |
| 3,596,293 |
| 3,093,675 |
| 2,570,885 |
(1) Composed, mainly, by credit cards.
37. Gains or losses on financial assets and liabilities
Gains (losses) on financial assets and liabilities (net) includes the amount of the valuation adjustments of financial instruments, except those attributable to interest accrued as a result of application of the effective interest method and to allowances, and the gains or losses derived from the sale and purchase thereof.
The breakdown of the balance of this item, by type of instrument, is as follows:
Thousand of reais |
| 2018 |
| 2017 |
| 2016 |
|
|
|
|
|
|
|
Financial Assets Held For Trading (1) |
| - |
| 1,174,111 | - | 3,166,399 |
Financial Assets Measured At Fair Value Through Profit Or Loss |
| (138,673) |
| - |
| - |
Financial Assets Measured At Fair Value Through Profit Or Loss Held For Trading (1) | (2,764,859) |
| - |
| - | |
Non-Tranding Financial Assets Mandatorily Measured At Fair Value Through Profit Or Loss | 61,239 |
| - |
| - | |
Other Financial Assets At Fair Value Through Profit Or Loss (2) |
| - |
| 30,694 |
| 82,638 |
Financial Assets Not Measured At Fair Value Through Profit Or Loss |
| (138,104) |
| (122,115) |
| (115,202) |
Financial Assets available-for-sale |
|
|
|
|
|
|
Debt instruments |
| (111,750) |
| (156,802) |
| (108,318) |
Equity instruments |
| (26,354) |
| 34,687 |
| (6,884) |
Financial Assets Measured At Fair Value Through Other Comprehensive Income |
|
|
|
| ||
Gains or losses from hedge accounting, net |
| 197,595 |
| (113,600) |
| (117,679) |
Total |
| (2,782,802) |
| 969,090 |
| 3,016,156 |
(1) Includes the exchange hedge of the Bank’s interest in Cayman (note 24).
(2) Includes the net gain arising from transactions involving debt securities, equity instruments and derivatives included in this portfolio, since the Bank manages its risk in these instruments on a global basis.
Consolidated Financial Statements - December 31, 2018 103
38. Exchange differences (net)
Exchange differences" demonstrate the gains or losses on foreign currency transactions, the differences that arise on translations of monetary items in foreign currencies to the functional currency, and those disclosed on non-monetary assets in foreign currency at the time of their disposal.
Thousand of Reais |
| 2018 |
| 2017 |
| 2016 |
|
|
|
|
|
|
|
Revenue with Exchange variations |
| 12,752,765 |
| 24,008,382 |
| 16,634,809 |
Expenses with Exchange Variations |
| (15,559,237) |
| (23,403,326) |
| (12,059,995) |
Total |
| (2,806,471) |
| 605,056 |
| 4,574,814 |
39. Other operating income and expenses
The breakdown of "Other operating income (expense)" is as follows:
Thousand of reais |
| 2018 |
| 2017 |
| 2016 |
|
|
|
|
|
|
|
Other operating income (1) |
| 556,715 |
| 896,279 |
| 690,310 |
Other operating expense (1) |
| (1,281,764) |
| (1,259,338) |
| (1,067,560) |
Contributions to the Guarantee of Credit Fund - FGC |
| (330,801) |
| (308,954) |
| (247,321) |
Total |
| (1,055,850) |
| (672,013) |
| (624,571) |
(1) On December 31, 2018, it consists mainly of Data Processing Expenses in the balance of R$ 67,724 (2017 - 73,664 and 2016 - R$ 61,186), Services Expenses in balance of R$ 26,852 (2017 - revenue of R$ 87,199 and 2016 - R$ 74,322), Indemnity Funds for Benefit - FGB R$ 34,996 (2017 - 5,334 and 2016 - R$ 172,699), Interest on Capital Income R$ 38,006 (2017 - 20,826 and 2016 - R$ 305) and Recovery of Charges and Expenses R$ 92,408 (2017 - 89,409 and 2016 - 72,360).
40. Personnel expenses
a) Breakdown
The breakdown of “Personnel expenses” is as follows:
Thousand of reais |
| 2018 |
| 2017 |
| 2016 |
|
|
|
|
|
|
|
Wages and salaries |
| 5,812,688 |
| 5,713,702 |
| 5,377,284 |
Social security costs |
| 1,404,537 |
| 1,381,229 |
| 1,273,486 |
Benefits |
| 1,387,078 |
| 1,309,314 |
| 1,277,781 |
Defined benefit pension plans (note 22) |
| 8,939 |
| 20,081 |
| 24,480 |
Contributions to defined contribution pension plans |
| 131,388 |
| 87,099 |
| 86,576 |
Share-based compensation |
| 58,050 |
| 87,293 |
| 86,963 |
Training |
| 62,756 |
| 58,338 |
| 62,518 |
Other personnel expenses |
| 340,571 |
| 280,222 |
| 188,177 |
Total |
| 9,206,007 |
| 8,937,278 |
| 8,377,265 |
b) Share-Based Compensation
Banco Santander has long-terms compensation plans linked to the market price of the shares. The members of the Executive Board of Banco Santander are eligible for these plans, as well as other members selected by the Board of Directors, whose selection will take into account seniority of the group. For the Board of Directors members in order to be eligible, it is necessary to exercise Executive Board functions. These amounts are recorded under Other liabilities (note 26) and personnel expenses (Note 40(a)).
b.1) Local Program
On June 30, 2018, the Stock Option Certificate Purchase Plan (SOP 2013), approved at the EGM of April 29, 2013, was terminated. In 2018, that remains open is the Private Ultra High Long Term Incentive Plan for the Private Banking segment.
(i) Share purchase plans
Consolidated Financial Statements - December 31, 2018 104
Long-Term Incentive Plan – SOP 2013: It is a call option plan with 3 years of duration. The period for the exercise comprised the period between June 30, 2016 to June 30, 2018. The number of Units to be exercised by the participants were determined according to the result of measurement of a performance parameter of the Bank: Total Shareholder Return (TSR) and adjusted by the indicator Return on Assets by Risk (RoRWA), comparison between realized and budgeted in each year. The final result of the plan was 89.61%.
b.1.1) Fair Value and Plans Performance Parameters
For accounting of the Local Program plans, an independent consultant promoted simulations based on Monte Carlo methodology, as presented the performance parameters used to calculate the shares to be granted. Such parameters are associated with their respective probabilities of occurrence, which are updated at the close of each year.
| SOP 2013 (1) |
Total Shareholder Return (TSR) rank | % of Exercisable Shares |
1st | 100% |
2nd | 75% |
3th | 50% |
(1) The percentage of shares determined at the position of TSR is subject to a penalty according to the implementation of the RoRWA.
For fair value measurement the following premises was used:
|
|
|
|
| SOP 2013 |
Method of Assessment |
| Black&Scholes |
Volatility |
| 40.00% |
Rate of Dividends |
| 3.00% |
Vesting Period |
| 3 years |
Average Exercise Time |
| 5 years |
Risk-Free Rate |
| 11.80% |
Probability of Occurrence |
| 60.27% |
Fair Value of the Option Shares |
| R$5,96 |
The average value of shares SANB11(Shares of the Bank in B3 S.A.) (Current Company Name of BM&FBovespa) in the exercise ended on December 31, 2018 is R$36.25 (12/31/2017 - R$28.47 and 12/31/2016 - R$19.94).
On 2018, no pro rata expenses were recorded (2017- no pro rata expenses were recorded and 2016 - R$15,789), related to the Stock Option Certificate (SOP).
|
|
|
|
|
|
|
|
| Date of |
|
|
|
|
|
|
|
|
|
|
| Commencement |
| Expiration |
| Number of |
| Exercise |
|
|
|
|
| of Fiscal |
| Date ofFiscal |
| Units |
| Price in Reais |
| Year Granted |
| Employees |
| Year |
| Year |
Final Balance on December 31, 2016 | 1,986,258 |
|
|
|
|
|
|
|
|
|
|
Exercised options (SOP - 2013) | (869,247) |
| 12.84 |
| 2013 |
| Executives |
| 06/30/16 |
| 06/30/18 |
Final Balance on December 31, 2017 | 1,117,011 |
|
|
|
|
|
|
|
|
|
|
Exercised options (SOP - 2013) | (732,169) |
| 12.84 |
| 2013 |
| Executives |
| 06/30/16 |
| 06/30/18 |
Cancelled options (SOP - 2013) | (384,842) |
| 12.84 |
| 2013 |
| Executives |
| 06/30/16 |
| 06/30/18 |
Final Balance on December 31, 2018 | - |
|
|
|
|
|
|
|
|
|
|
(ii) Local Long-Term Incentive Plan - Cash
Long-Term Incentive Plan - Private Ultra High: aims to align the interests of Banco Santander and the Participant with views, on the one hand, to the growth and profitability of the Private business and, on the other hand, recognition of the Participant's contribution . The Plan has as its objective the payment by the Bank to the Participants as Variable Remuneration.
Each participant has a target reference in Reais and the exact amount of the bonus will be determined by the measurement of the following performance indicators, with payments made in two installments: the first in March 2020 and the second in March 2021.
Indicators - Phase 1 (Reference Value)
• BAI of 2017.
Indicators - Phase 2 (Calculation of Cash Incentive)
• BAI - 50% (Benefit Indicator before Private Ultra High Segment Taxes);
• MOL - 25% (Private Ultra High Segment Net Margin Indicator); and
• AUM - 25% (Assets Under Management Indicator of Private Ultra High Segment).
Consolidated Financial Statements - December 31, 2018 105
In December 2018, the reversal of the recorded provision related to the local long-term incentive plan - Private Ultra High due to the probability of non-compliance with the acquisition condition related to the performance target. Management will follow the performance parameter of the plan until December 2019. The amount of the expense with the provision related to this plan registered in 2017 was R$ 2,935.
b.2) Global Program
Long-Term Incentive Policy
In 2014, a share delivery plan called Long Term Incentive Global CRDIV - Grant 2014 was released. This plan was subject to achievement of performance indicator Total Shareholder Return (TSR) of the Santander Group, comparing the evolution of the Group in this indicator for the main global competitors and the settlement would be in the Group Santander Spain shares.
In 2016, a stock delivery plan called Plan 2nd Global Long -Term Incentive CRDIV - Grant 2015 was launched.
Global Plan Fair Value
1st Long-Term Incentive Global Plan Grant 2014 - ILP CRDIV
It is assumed that the grantee would not leave the Bank’s employment during the term of each plan. The fair value of the 50% linked to the Bank’s relative TSR position was calculated, on the grant date, on the basis of the report provided by external valuators whose assessment was carried out using a Monte Carlo valuation model, performing 10 thousand simulations to determine the TSR of each of the companies in the Benchmark Group, taking into account the variables set forth below. The results (each of which represents the delivery of a number of shares) were classified in decreasing order by calculating the weighted average and discounting the amount at the risk-free interest rate.
In view of the high correlation between RTA and LPA, it can be considered (in a high percentage of cases) feasible to extrapolate that the RTA value is also valid for LPA. Therefore, it was initially determined that the fair value of the portion of the plans linked to the Bank’s relative LPA position, of the remaining 50% of the options granted, was the same as that of the 50% corresponding to the TSR. This valuation was reviewed and adjusted on a yearly basis, since its refers to a non-market condition.
Long Term Incentive Global CRDIV - Grant 2014
| 2 years |
| 3 years |
| 4 years |
Future income Dividend | 11.1% |
| 10,80% |
| 9,50% |
Expected Volatility | 32.7% |
| 34,70% |
| 36,90% |
Volatility comparator | 12% - 52% |
| 16% - 56% |
| 16% - 52% |
Risk-free interest rate | 1.7% |
| 2,10% |
| 2,50% |
Correlation | 0.55% |
| 0.55% |
| 0.55% |
The indicator used to measure the achievement of targets was the comparison of the Total Shareholder Return (TSR) of the Santander Group with the RTA of fifteen leading the Group's global competitors.
The indicator was calculated in two stages: initially for program verification in 2014 and a second time in the annual payment of each installment (2015, 2016 and 2017).
Each executive had a target in reais that was converted to shares of Santander Group, by the price of R$19.2893. These shares would be delivered in the years, 2017 and 2018, with sale restriction of one year after each delivery.
2nd Long -Term Incentive Global Plan CRDIV - Grant 2015.
The agreed ILP values for each participant will be obtained from the verification of the achievement of indicators in two moments: the first time to determine the eligibility (2015-2016) and a second time to calculate the number of actions due (2016, 2017 and 2018).
Indicators - First time
• RTA versus Competitors; and
• ROTE Bank versus Budget.
Indicators - Second time
• RTA versus Competitors;
• ROTE Bank versus Budget;
• Employee satisfaction;
• Customer satisfaction; and
• Corporate main bank costumer indicator versus Budget.
Each executive has a target in reais that was converted to shares of Santander Bank Spain by the price of R$17.473. These shares will be delivered in 2019, with sale restriction of one (1) year after the delivery.
|
| Number of Shares |
| Granted Year |
| Employees |
| Data of Commencement of theFiscalYear |
| Data of Expiry of FiscalYear |
|
|
|
|
|
| |||||
1st Long Term Incentive Global CRDIV - Grant 2014 |
| 1,613,057 |
| 2014 |
| Executives |
| jan - 2014 |
| dec - 2017 |
Cancelled Shares (Grantec - 2014) |
| (1,613,057) |
| 2014 |
| Executives |
| jan - 2014 |
| dec - 2017 |
2nd Long -Term Incentive Global Plan CRDIV - Grant 2015 |
| 1,775,049 |
| 2016 |
| Executives |
| jan - 2015 |
| dec - 2017 |
Balance Plans on December 31, 2017 |
| 1,775,049 |
|
|
|
|
|
|
|
|
In 2018, were recognized daily pro-rata expenses amounted to R$5,624 (2017 – R$4.797 and 2016 - no expenses registered), related to costs to the respective dates of the above cycles, for total plans of the Global Program.
Plans do not result in dilution of the share capital of the Bank, because they are paid in shares of Banco Santander Spain.
b.3) Variable Remuneration based in shares
On September 29, 2015, the Board of Directors approved the proposed new incentive plan (deferral) for payment of the variable compensation ofdirectors and certain employees, which was approved in EGM of December 14, 2015.
Consolidated Financial Statements - December 31, 2018 106
The approval of the proposal of the current incentive plan (deferment) to pay the variable remuneration of administrators and certain employees occurred on October 25, 2016, as approved by the EGM held on December 21, 2016.
In this proposal, certain requirements for future deferred payment of a portion of the variable compensation due to its managers and other employees were considered, considering the long-term sustainable financial bases and adjustments in future payments based on the risks assumed and the changes in the cost of capital.
The Banco Santander´s variable compensation plan has been assessed and became divided into two programs: (i) Collective Identified and (ii) Collective unidentified.
a) Collective Identified - Participants of the Executive Committee, Statutory Directors and other executives who take significant risks in the Bank and are responsible for the control areas. The deferral will be half in cash, indexed by 100% of CDI and half in shares (SANB11). On the exercise ended on December 31, 2018, was recorded loss amounted to R$50,896 (2017 - R$81,838 and 2016 - R$52,500), regarding the provision of the deferral plan in shares.
b) Collective Unidentified - managerial employees and other employees of the organization that will be benefited from the deferral plan. The deferred amount will be paid 100% cash, indexed by 100% of CDI. On the year ended on December 31, 2018, there were expense of R$74,871 (2017 - R$124,926 and 2016 - R$79,794).
41. Other general administrative expenses
a) Breakdown
The detail of other general administrative expenses is as follows:
| Thousand of reais | 2018 |
| 2017 |
| 2016 |
|
|
|
|
|
|
|
| Property, fixtures and supplies | 1,330,549 |
| 1,284,490 |
| 1,278,556 |
| Technology and systems | 1,786,416 |
| 1,364,720 |
| 1,246,809 |
| Advertising | 621,645 |
| 617,563 |
| 486,772 |
| Communications | 457,323 |
| 593,272 |
| 488,799 |
| Per diems and travel expenses | 127,277 |
| 106,956 |
| 133,123 |
| Taxes other than income tax | 88,977 |
| 122,570 |
| 84,932 |
| Surveillance and cash courier services | 617,129 |
| 630,466 |
| 622,362 |
| Insurance premiums | 29,434 |
| 27,289 |
| 21,308 |
| Specialized and technical services | 2,089,614 |
| 1,901,056 |
| 1,744,726 |
| Technical reports | 359,468 |
| 370,546 |
| 437,683 |
| Others specialized and technical services | 1,730,146 |
| 1,530,510 |
| 1,307,043 |
| Other administrative expenses (1) | 437,767 |
| 534,935 |
| 435,758 |
| Total | 7,586,131 |
| 7,183,317 |
| 6,543,145 |
(1) In December 31, 2018, includes mainly Data Processing Expenses in the balance of R$ 67.724 (2017 – 73.664 and 2016 - R $ 61.186), Service Expenses in the balance of R$ 26.852 (2017 - revenue of R$ 87.199 and 2016 - R$ 74.322), Expenses with Benefit Guarantor Fund - FGB R$ 34.996 (2017 – R$ 5.334 and 2016 - R$ 172.699), Interest on Own Capital R$ 38,006 (2017 – R$ 20.826 and 2016 - R$ 305) and Recovery of Charges and Expenses R $ 92.408 (2017 – R$ 89.409 and 2016 – R$ 72.360).
b) Other information
The balance of “Technical reports” includes the fees paid by the consolidated companies to their respective auditors, the detail are as follows:
Millions of Reais | 2018 |
| 2017 |
| 2016 |
|
|
|
|
|
|
Audit of the annual financial statements of the companies audited by external audit(1)(2) (constant scope of consolidation) | 19.9 |
| 17.5 |
| 9.2 |
|
| ||||
Audit Related | 0.5 |
| 3.9 |
| 0.1 |
Others | 0.1 |
| 1.3 |
| 0.7 |
Total | 20.5 |
| 22.7 |
| 10.0 |
(1) In 2017, includes R$2.3 million referring to auditing work for the 2016 fiscal year.
The approximate value of taxes according to law 12,741/2012 totaled R$2.9 million (2017 – R$3.7 million and 2016 - R$1.8 million).
Services provided by other audit firms totaled R$1.3 million (2017 – R$13.2 million and 2016 - R$4.9 million).
42. Gains or losses on non financial assets and investments, net
The breakdown of the balance of this item is as follows:
Thousand of reais |
| 2018 |
| 2017 |
| 2016 |
|
|
|
|
|
|
|
Gains |
| 11,627 |
| 1,798 |
| 12,584 |
Tangible and intangible assets |
| 11,627 |
| 1,798 |
| 12,575 |
Investments |
| - |
| - |
| 9 |
Losses |
| (37,103) |
| (66,100) |
| (8,768) |
Tangible and intangible assets |
| (37,103) |
| (13,719) |
| (7,547) |
Investments (1) |
| - |
| (52,381) |
| (1,221) |
Total |
| (25,476) |
| (64,302) |
| 3,816 |
Consolidated Financial Statements - December 31, 2018 107
(1) In 2017, includes the amount of R$41,999 related to the sale of BW Guirapá I S.A.
43. Gains (losses) on disposal and expenses of non-current assets held for sale not classified as discontinued operations
As of December 31, 2018, income of R$181 million is mainly comprised of R$104 million of income from the reversal of the provision for impairment of properties and R$78 million from the sale of assets received in the recovery of credits with clients, and at December 31, 2017, includes, mainly, R$272 million provisions for devaluations on real estate, constituted from appraisal reports prepared by specialized external consulting and at December 31, 2016, basically refers to the result on disposal of assets received in the processes of recovery of loans with customers and the provision for the recoverable amount of these assets.
44. Other disclosures
a) Guarantees and commitments
The Bank provides a variety of guarantees to its clients to improve their credit standing and allow them to compete The following table summarizes at December 31, 2018, 2017 and 2016 all of the guarantees.
As required, the “maximum potential amount of future payments” represents the notional amounts that could be considered as a loss if there were a total default by the guaranteed parties, without consideration of possible recoveries from collateral held or pledged, or recoveries under recourse provisions. There is no relationship between these amounts and probable losses on these guarantees. In fact, "maximum potential amount of future payments" significantly exceeds inherent losses.
Thousand of reais | 2018 |
| 2017 |
| 2016 |
|
|
|
|
|
|
Maximum potential amount of future payments |
|
|
|
|
|
|
|
|
|
|
|
Contingent liabilities |
|
|
|
|
|
Guarantees and other sureties | 39,081,803 |
| 40,729,544 |
| 32,629,975 |
Financial guarantees | 27,216,418 |
| 37,007,057 |
| 24,475,507 |
Performance guarantees | 907,856 |
| 486,091 |
| 532,232 |
Financial letters of credit | 10,860,425 |
| 3,110,918 |
| 7,462,761 |
Other | 97,104 |
| 125,478 |
| 159,475 |
Other contingent exposures | 3,178,671 |
| 1,915,492 |
| 635,055 |
Documentary Credits | 3,178,671 |
| 1,915,492 |
| 635,055 |
Total Contingent Liabilities | 42,260,474 |
| 42,645,036 |
| 33,265,030 |
|
|
|
|
|
|
Commitments |
|
|
|
|
|
Loan commitments drawable by third parties(1) | 122,652,229 |
| 106,913,219 |
| 91,251,198 |
Total Commitments | 122,652,229 |
| 106,913,219 |
| 91,251,198 |
|
|
|
|
|
|
Total | 164,912,704 |
| 149,558,255 |
| 124,516,228 |
(1) Includes the approved limits and unused overdraft, credit card and others.
Financial guarantees are provided to Bank´s clients in respect of their obligations to third parties. The Bank has the right to seek reimbursement from the clients for any amount it shall have to pay under such guarantee. Additionally, the Bank may hold cash or other highly liquid collateral for these guarantees.
These guarantees are subject to the same credit evaluation performed on the origination of loans.
The Bank´s expectation is that many of these guarantees to expire without the need of cash disbursement in advance. Therefore, in the ordinary courseof business, the Bank expects that these guarantees will have virtually no impact on its liquidity.
Performance guarantees are issued to guaranteed clients obligations such as to make contractually specified investments, to supply specified products, commodities, or maintenance or warranty services to a third party, completion of projects in accordance with contract terms, etc. Financial standby letters of credit include guarantees of payment of loans, credit facilities, promissory notes and trade acceptances. The Bank always requires collateral to grant this kind of financial guarantees. In Documentary Credits, the Bank acts as a payment intermediary between trading companies located in different countries (import-export transactions). Under a documentary credit transaction, the parties involved deal with the documents rather than the commodities to which the documents may relate. Usually the traded commodities are used as collateral to the transaction and the Bank may provide some credit facilities. Loan commitments draw able by third parties include mostly credit card lines and commercial commitments. Credit card lines are unconditionally cancelable by the issuer. Commercial commitments are mostly 1 year facilities subject to information requirements to be provided by Banks´s clients.
The risk criteria followed to issue all kinds of guarantees, financial standby letters of credit, documentary credits and any risks of signature are in general the same as those used for other products of credit risk, and therefore subject to the same admission and monitoring standards. The guarantees granted on behalf of Bank´s clients are subject to the same credit quality review process as any other risk product. On a regular basis, at least once a year, the solvency of the mentioned clients is checked as well as the probability of those guarantees to be executed. In case that any doubt on the client’s solvency may arise we create allowances with charge to net income, by the amount of the inherent losses even if there is no claim to us.
The provision for losses on the non-recovery guarantees and other securities (Note 9.c) is recorded as "Impairment losses on financial assets (net)” on consolidated income statement and its calculation is described in note 2.i.
Additionally, the liability recognized as deferred revenue for the premium received for providing the above guarantees, which is being amortized into income over the life of the related guarantees is R$330,018 (2017 - R$446,143 and 2016- R$476,564).
b) Off-balance funds under management
Banco Santander has under its management investment funds for which it does not hold any substantial participation interests and does not act as principal over the funds, and it does not own any shares of such funds. Based on the contractual relationship governing the management of such funds, third parties who hold the participation interests in such funds are those who are exposed to, or have rights, to variable returns and have the ability toaffect those returns through power over the fund. Moreover, though Santander Brasil acts as fund manager, in analyzing the fund manager’s remuneration regime, the remuneration regime is proportionate to the service rendered, and therefore does not create exposure of such importance to indicate that the fund manager is acting as the principal (Note 2.w).
Consolidated Financial Statements - December 31, 2018 108
The funds managed by Banco Santander not recorded in the balance sheet are as follows:
Thousand of reais |
| 2018 |
| 2017 |
| 2016 |
|
|
|
|
|
|
|
Funds under management |
| 1,896,689 |
| 1,747,623 |
| 1,533,620 |
Managed Funds |
| 200,366,261 |
| 188,728,634 |
| 158,734,032 |
Total |
| 202,262,950 |
| 190,476,257 |
| 160,267,652 |
c) Third-party securities held in custody
On December 31, 2018, the Bank held in custody debt securities and equity instruments totaling R$34,040,742 (2017- R$40,459,429 and 2016 - R$27,772,714) entrusted to it by third parties.
d) Residual maturity
The breakdown, by maturity, of the balances of certain items in the consolidated balance sheets is as follows:
|
|
|
|
|
|
|
|
|
|
|
|
| 2018 |
|
|
|
|
|
|
|
|
|
|
|
|
| Thousand of reais |
| On |
| Up to |
| 3 to |
| 1 to |
| 3 to |
| After 5 |
| Total |
Assets: |
|
|
|
|
|
|
|
|
|
|
|
|
|
Cash and balances with the Brazilian Central Bank | 31,323,554 |
| 392,791 |
| - |
| - |
| - |
| - |
| 31,716,345 |
Debt instruments | 27,402 |
| 51,255,820 |
| 25,903,428 |
| 13,186,253 |
| 26,367,903 |
| 58,692,609 |
| 175,433,415 |
Equity instruments | 839,620 |
| 34,420 |
| 231,576 |
| - |
| - |
| - |
| 1,105,616 |
Loans and amounts due from credit institutions | 57,528,022 |
| 8,449,138 |
| 844,658 |
| 12,739,730 |
| 11,371 |
| 34,082 |
| 79,607,001 |
Loans and advances to customers | - |
| 111,595,396 |
| 75,100,836 |
| 63,043,973 |
| 21,397,689 |
| 29,934,313 |
| 301,072,207 |
Derivatives | - |
| 13,815,791 |
| 1,240,161 |
| 1,114,446 |
| 1,074,875 |
| 1,118,173 |
| 18,363,446 |
Total | 89,718,598 |
| 185,543,356 |
| 103,320,659 |
| 90,084,402 |
| 48,851,838 |
| 89,779,177 |
| 607,298,030 |
|
|
|
|
|
|
|
|
|
|
|
|
|
|
|
|
|
|
|
|
|
|
|
|
|
|
| 2018 |
|
|
|
|
|
|
|
|
|
|
|
|
| Thousand of reais |
| On |
| Up to |
| 3 to |
| 1 to |
| 3 to |
| After 5 |
| Total |
Liabilities: |
|
|
|
|
|
|
|
|
|
|
|
|
|
Financial liabilities at amortized cost: |
|
|
|
|
|
|
|
|
|
|
|
|
|
Deposits from credit institutions(1) | 1,139 |
| 55,872,675 |
| 18,564,342 |
| 19,850,530 |
| 2,598,172 |
| 2,135,948 |
| 99,022,806 |
Customer deposits(1) | 65,241,618 |
| 102,942,180 |
| 76,987,570 |
| 42,399,934 |
| 16,624,469 |
| 2,029 |
| 304,197,800 |
Marketable debt securities(1) | - |
| 11,104,594 |
| 26,741,036 |
| 22,479,019 |
| 5,854,091 |
| 8,447,492 |
| 74,626,232 |
Subordinated liabilities | 9,885,607 |
| - |
| - |
| - |
| - |
| - |
| 9,885,607 |
Debt Instruments Eligible to Compose Capital | - |
| - |
| - |
| - |
| - |
| 9,779,944 |
| 9,779,944 |
Other financial liabilities | 66,265 |
| 31,566,995 |
| 35,648 |
| 18,086,272 |
| - |
| 27,600 |
| 49,782,780 |
Financial liabilities held for trading: | 206,423 |
| 7,639,956 |
| 8,863,577 |
| 32,195,605 |
| 604,593 |
| 1,428,838 |
| 50,938,992 |
Short positions | 206,423 |
| - |
| 1,139,847 |
| 31,349,407 |
| - |
| - |
| 32,695,677 |
Derivatives | - |
| 7,639,956 |
| 7,723,730 |
| 1,069,718 |
| 604,593 |
| 1,428,838 |
| 18,466,835 |
Total | 75,401,052 |
| 209,126,400 |
| 131,192,173 |
| 167,430,485 |
| 25,681,325 |
| 21,821,851 |
| 649,396,673 |
Difference (assets less liabilities) | 14,317,546 |
| (22,963,864) |
| (27,871,514) |
| (45,150,478) |
| 23,170,513 |
| 67,957,326 |
| 9,459,529 |
|
|
|
|
|
|
|
|
|
|
|
|
|
|
|
|
|
|
|
|
|
|
|
|
|
|
| 2017 |
|
|
|
|
|
|
|
|
|
|
|
|
| Thousand of reais |
| On |
| Up to |
| 3 to |
| 1 to |
| 3 to |
| After 5 |
| Total |
Assets: |
|
|
|
|
|
|
|
|
|
|
|
|
|
Cash and balances with the Brazilian Central Bank | 20,642,321 |
| 13,482,432 |
| - |
| - |
| - |
| - |
| 34,124,753 |
Debt instruments | 609,220 |
| 1,887,278 |
| 21,978,394 |
| 31,669,850 |
| 19,379,308 |
| 45,731,067 |
| 121,255,117 |
Equity instruments | 66,187 |
| 124,304 |
| 305,073 |
| 842,090 |
| - |
| 292,121 |
| 1,629,775 |
Loans and amounts due from credit institutions | 38,137,344 |
| 15,235,629 |
| 182,721 |
| 10,382,061 |
| 18,166 |
| 1,253,981 |
| 65,209,902 |
Loans and advances to customers | 31,065,824 |
| 70,301,530 |
| 61,286,539 |
| 63,375,203 |
| 17,796,364 |
| 28,594,697 |
| 272,420,157 |
Derivatives | - |
| 426,577 |
| 1,034,248 |
| 9,470,073 |
| 4,357,636 |
| 1,974,354 |
| 17,262,888 |
Total | 90,520,896 |
| 101,457,750 |
| 84,786,975 |
| 115,739,277 |
| 41,551,474 |
| 77,846,220 |
| 511,902,592 |
|
|
|
|
|
|
|
|
|
|
|
|
|
|
Liabilities: |
|
|
|
|
|
|
|
|
|
|
|
|
|
Financial liabilities at amortized cost: |
|
|
|
|
|
|
|
|
|
|
|
|
|
Deposits from credit institutions(1) | 394,396 |
| 21,636,392 |
| 44,696,680 |
| 6,797,838 |
| 2,717,941 |
| 3,131,438 |
| 79,374,685 |
Customer deposits(1) | 64,512,105 |
| 103,511,031 |
| 48,339,761 |
| 42,494,421 |
| 17,176,009 |
| 8,814 |
| 276,042,141 |
Marketable debt securities(1) | - |
| 14,315,305 |
| 35,636,549 |
| 17,923,372 |
| 1,491,866 |
| 879,920 |
| 70,247,012 |
Subordinated liabilities | - |
| - |
| 519,230 |
| - |
| - |
| - |
| 519,230 |
Debt Instruments Eligible to Compose Capital | - |
| 114,104 |
| - |
| - |
| - |
| 8,322,797 |
| 8,436,901 |
Other financial liabilities | 11,710,943 |
| 30,985,465 |
| 1,537,689 |
| 26,638 |
| - |
| - |
| 44,260,735 |
Financial liabilities held for trading: |
|
|
|
|
|
|
|
|
|
|
|
|
|
Short positions | - |
| - |
| 466,000 |
| 8,960,806 |
| 7,476,079 |
| 15,905,507 |
| 32,808,392 |
Derivatives | - |
| 769,619 |
| 975,945 |
| 8,244,193 |
| 4,239,198 |
| 2,448,531 |
| 16,677,486 |
Total | 76,617,444 |
| 171,331,916 |
| 132,171,854 |
| 84,447,268 |
| 33,101,093 |
| 30,697,007 |
| 528,366,582 |
Difference (assets less liabilities) | 13,903,452 |
| (69,874,166) |
| (47,384,879) |
| 31,292,009 |
| 8,450,381 |
| 47,149,213 |
| (16,463,990) |
|
|
|
|
|
|
|
|
|
|
|
|
|
|
|
|
|
|
|
|
|
|
|
|
|
|
| 2016 |
|
|
|
|
|
|
|
|
|
|
|
|
| Thousand of reais |
| On |
| Up to |
| 3 to |
| 1 to |
| 3 to |
| After 5 |
| Total |
Assets: |
|
|
|
|
|
|
|
|
|
|
|
|
|
Cash and balances with the Brazilian Central Bank | 14,683,735 |
| 11,600,834 |
| - |
| - |
| - |
| - |
| 26,284,569 |
Debt instruments | - |
| 21,709,350 |
| 10,136,133 |
| 26,674,215 |
| 28,135,295 |
| 30,838,274 |
| 117,493,267 |
Equity instruments | 593,594 |
| 48,054 |
| 252,087 |
| 486,408 |
| 21,313 |
| 1,024,933 |
| 2,426,389 |
Loans and amounts due from credit institutions | 39,961,892 |
| 14,450,530 |
| 923,308 |
| 532,399 |
| 34,458 |
| 9,808,414 |
| 65,711,001 |
Loans and advances to customers | 30,408,851 |
| 68,218,474 |
| 60,047,442 |
| 54,558,381 |
| 17,357,244 |
| 21,412,382 |
| 252,002,774 |
Loans and Receivables - Debt instruments | 822,874 |
| 1,287,372 |
| 2,960,099 |
| 5,044,803 |
| 4,472,758 |
| 1,695,353 |
| 16,283,259 |
Investments Held-to-Maturity | - |
| - |
| 12,378 |
| 371,621 |
| 1,173,360 |
| 8,491,402 |
| 10,048,761 |
Derivatives | 620,422 |
| 9,209,421 |
| 3,571,126 |
| 3,813,687 |
| 5,481,210 |
| 2,007,107 |
| 24,702,973 |
Total | 87,091,368 |
| 126,524,035 |
| 77,902,573 |
| 91,481,514 |
| 56,675,638 |
| 75,277,865 |
| 514,952,993 |
|
|
|
|
|
|
|
|
|
|
|
|
|
|
Liabilities: |
|
|
|
|
|
|
|
|
|
|
|
|
|
Financial liabilities at amortized cost: |
|
|
|
|
|
|
|
|
|
|
|
|
|
Deposits from credit institutions(1) | 770,467 |
| 40,581,025 |
| 23,315,006 |
| 8,215,378 |
| 2,818,095 |
| 2,934,101 |
| 78,634,072 |
Customer deposits(1) | 60,919,032 |
| 64,154,475 |
| 68,505,808 |
| 39,630,274 |
| 14,003,821 |
| 231,767 |
| 247,445,177 |
Marketable debt securities(1) | - |
| 21,833,927 |
| 56,637,880 |
| 20,620,077 |
| 312,143 |
| 438,928 |
| 99,842,955 |
Subordinated liabilities | - |
| - |
| - |
| 466,246 |
| - |
| - |
| 466,246 |
Debt Instruments Eligible to Compose Capital | - |
| 113,995 |
| - |
| - |
| - |
| 8,197,923 |
| 8,311,918 |
Other financial liabilities | 3,004,041 |
| 33,559,710 |
| 356 |
| 7,992 |
| - |
| 307,000 |
| 36,879,099 |
Financial liabilities held for trading: |
|
|
|
|
|
|
|
|
|
|
|
|
|
Short positions | - |
| 743 |
| 2,887,723 |
| 8,333,584 |
| 3,344,083 |
| 17,128,136 |
| 31,694,269 |
Derivatives | 333,287 |
| 8,052,349 |
| 2,506,131 |
| 2,523,506 |
| 5,376,180 |
| 1,445,162 |
| 20,236,615 |
Total | 65,026,827 |
| 168,296,224 |
| 153,852,904 |
| 79,797,057 |
| 25,854,322 |
| 30,683,017 |
| 523,510,351 |
Difference (assets less liabilities) | 22,064,541 |
| (41,772,189) |
| (75,950,331) |
| 11,684,457 |
| 30,821,316 |
| 44,594,848 |
| (8,557,358) |
(1) Includes obligations which may be subject to early payment, being: demand and time deposits, repurchase agreements with clients, LCI and LCA.
Consolidated Financial Statements - December 31, 2018 109
e) Equivalent value in Reais of assets and liabilities
The main foreign currency balances in the consolidated financial statements, based on the nature of the related items, are as follows:
Equivalent Value in Thousand of Reais | 2018 |
| 2017 |
| 2016 | ||||||
| Assets |
| Liabilities |
| Assets |
| Liabilities |
| Assets |
| Liabilities |
|
|
|
|
|
|
|
|
|
|
|
|
Cash and reserves at the Central Bank of Brazil | 6,947,282 |
| - |
| 126,022 |
| - |
| 174,605 |
| - |
Financial asset/liabilities for trading | - |
| - |
| 626,101 |
| 2,982,336 |
| 402,186 |
| 371,100 |
Financial ssets/liabilities measured at fair value through profit or loss held for trading | 1,211,296 |
| 101,833 |
| - |
| - |
| - |
| - |
Available-for-sale financial assets | - |
| - |
| 11,665,952 |
| - |
| 9,787,622 |
| - |
Financial assets measured at fair value through other comprehensive income | 7,049,727 |
| - |
| - |
| - |
| - |
| - |
Loans and receivables | - |
| - |
| 18,703,454 |
| - |
| 28,061,831 |
| - |
Financial assets/liabilities measured at amortized cost | 17,912,203 |
| 35,567,194 |
| - |
| 36,306,000 |
| - |
| 39,465,409 |
Total | 33,120,508 |
| 35,669,027 |
| 31,121,529 |
| 39,288,336 |
| 38,426,244 |
| 39,836,509 |
Consolidated Financial Statements - December 31, 2018 110
f) Other Obligations
The Banco Santander rents properties, mainly used for branches, based on a standard contract which may be cancelled at its own criterion and includes the right to opt for renewals and adjustment clauses. The leases are classified as operating leases.
The total of the future minimum payments of non-cancellable operating leases is shown below:
|
| 2018 |
| 2017 |
| 2016 |
|
|
|
|
|
|
|
Up to 1 Year |
| 670.553 |
| 624.424 |
| 646.804 |
Between1 to 5 Years |
| 1.435.970 |
| 1.545.101 |
| 1.789.670 |
More than 5 Years |
| 167.868 |
| 288.420 |
| 496.802 |
|
| 2.274.391 |
| 2.457.945 |
| 2.933.276 |
Additionally, Banco Santander has contracts for a matures indeterminate, totaling R$674 (2017- R$934 and 2016 - R$1,013) monthly rent corresponding to the contracts with this feature. Payment of operating leases recognized as expenses in 2018 fiscal year were R$683,011 (2017- R$655,949 and 2016 - R$663,801).
Monthly rental contracts will be adjusted on an annual basis, as per prevailing legislation, at Índice Geral de Preços do Mercado (IGPM) variation. The lessee is entitled to unilaterally rescind the agreement, at any time, as contractual clauses and legislation.
g) Contingent assets
On December 31, 2018, 2017 and 2016 no contingent assets were recorded.
45. Business segment reporting
In accordance with IFRS 8, an operating segment is a component of an entity:
(a) that engages in business activities from which it may earn revenues and incur expenses (including revenues and expenses relating to transactions with other components of the same entity),
(b) whose operating results are regularly reviewed by the entity’s Management responsible to make decisions about resources to be allocated to the segment and assess its performance, and
(c) For which different financial information are available.
Based on these guidelines, the Bank has identified the following reportable operating segments:
• Commercial Banking,
• Global Wholesale Banking,
The Bank has two segments, the commercial (except for the Corporate Banking business managed globally using the Global Relationship Model) and the Global Wholesale Banking segment includes the Investment Banking and Markets operations, including departments cash and stock trades.
The Bank operates in Brazil and abroad, through the Cayman branch, Luxembourg branch and its subsidiary in Spain, with Brazilian clients and therefore has no geographical segments.
The income statements and other significant data are as follows:
Thousand of reais | 2018 | |||||
|
| |||||
(Condensed) Income Statement |
| Commercial Banking |
| Global Wholesale Banking |
| Total |
|
|
|
|
|
|
|
NET INTEREST INCOME |
| 39,390,512 |
| 2,530,830 |
| 41,921,342 |
Income from equity instruments |
| 9,974 |
| 22,649 |
| 32,623 |
Income from companies accounted for by the equity method |
| 65,958 |
| - |
| 65,958 |
Net fee and commission income |
| 12,537,112 |
| 1,595,047 |
| 14,132,159 |
Gains (losses) on financial assets and liabilities (net) and Exchange differences (net)(1) |
| (6,752,093) |
| 1,162,820 |
| (5,589,273) |
Other operating expense (net) |
| (965,466) |
| (90,384) |
| (1,055,850) |
TOTAL INCOME |
| 44,285,998 |
| 5,220,961 |
| 49,506,959 |
Personnel expenses |
| (8,404,198) |
| (801,809) |
| (9,206,007) |
Other administrative expenses |
| (7,186,035) |
| (400,096) |
| (7,586,131) |
Depreciation and amortization |
| (1,637,484) |
| (102,475) |
| (1,739,959) |
Provisions (net) |
| (1,947,578) |
| (52,026) |
| (1,999,604) |
Impairment losses on financial assets (net) |
| (12,419,979) |
| (293,456) |
| (12,713,435) |
Impairment losses on non-financial assets (net) |
| (450,201) |
| (58,109) |
| (508,310) |
Other non-financial gains (losses) |
| 156,258 |
| - |
| 156,258 |
OPERATING PROFIT BEFORE TAX(1) |
| 12,396,779 |
| 3,512,992 |
| 15,909,771 |
|
| 5,867,320 |
| - |
| 5,867,320 |
ADJUSTED OPERATING INCOME BEFORE TAX(1) |
| 18,264,099 |
| 3,512,992 |
| 21,777,091 |
|
|
|
|
|
|
|
Thousand of reais | 2017 | |||||
|
| |||||
(Condensed) Income Statement |
| Commercial Banking |
| Global Wholesale Banking |
| Total |
|
|
|
|
|
|
|
NET INTEREST INCOME |
| 32,392,239 |
| 2,554,250 |
| 34,946,489 |
Income from equity instruments |
| 83,120 |
| - |
| 83,120 |
Income from companies accounted for by the equity method |
| 71,551 |
| - |
| 71,551 |
Net fee and commission income |
| 11,261,952 |
| 1,459,916 |
| 12,721,868 |
Gains (losses) on financial assets and liabilities (net) and Exchange differences (net)(1) |
| (25,628) |
| 1,599,774 |
| 1,574,146 |
Other operating expense (net) |
| (640,522) |
| (31,491) |
| (672,013) |
TOTAL INCOME |
| 43,142,712 |
| 5,582,449 |
| 48,725,161 |
Personnel expenses |
| (8,166,562) |
| (770,716) |
| (8,937,278) |
Other administrative expenses |
| (7,011,740) |
| (171,577) |
| (7,183,317) |
Depreciation and amortization |
| (1,560,465) |
| (101,782) |
| (1,662,247) |
Provisions (net) |
| (3,190,388) |
| (118,851) |
| (3,309,239) |
Impairment losses on financial assets (net) |
| (11,232,902) |
| (1,105,398) |
| (12,338,300) |
Impairment losses on non-financial assets (net) |
| (435,960) |
| (20,751) |
| (456,711) |
Other non-financial gains (losses) |
| (324,385) |
| - |
| (324,385) |
OPERATING PROFIT BEFORE TAX(1) |
| 11,220,310 |
| 3,293,374 |
| 14,513,684 |
Foreign Exchange Hedge(1) |
| 809,694 |
| - |
| 809,694 |
ADJUSTED OPERATING INCOME BEFORE TAX(1) |
| 12,030,004 |
| 3,293,374 |
| 15,323,378 |
|
|
|
|
|
|
|
Thousand of reais | 2016 | |||||
|
| |||||
(Condensed) Income Statement |
| Commercial Banking |
| Global Wholesale Banking |
| Total |
|
|
|
|
|
|
|
NET INTEREST INCOME |
| 27,365,857 |
| 3,220,636 |
| 30,586,493 |
Income from equity instruments |
| 258,545 |
| - |
| 258,545 |
Income from companies accounted for by the equity method |
| 47,537 |
| - |
| 47,537 |
Net fee and commission income |
| 9,580,332 |
| 1,397,264 |
| 10,977,596 |
Gains (losses) on financial assets and liabilities (net) and Exchange differences (net)(1) |
| 5,619,356 |
| 1,971,614 |
| 7,590,970 |
Other operating expense (net) |
| (611,051) |
| (13,520) |
| (624,571) |
TOTAL INCOME |
| 42,260,576 |
| 6,575,994 |
| 48,836,570 |
Personnel expenses |
| (7,638,124) |
| (739,141) |
| (8,377,265) |
Other administrative expenses |
| (6,272,987) |
| (270,158) |
| (6,543,145) |
Depreciation and amortization |
| (1,381,742) |
| (100,897) |
| (1,482,639) |
Provisions (net) |
| (2,685,278) |
| (39,464) |
| (2,724,742) |
Impairment losses on financial assets (net) |
| (11,607,468) |
| (1,693,977) |
| (13,301,445) |
Impairment losses on non-financial assets (net) |
| (114,154) |
| (167) |
| (114,321) |
Other non-financial gains (losses) |
| 90,889 |
| - |
| 90,889 |
OPERATING PROFIT BEFORE TAX(1) |
| 12,651,712 |
| 3,732,190 |
| 16,383,902 |
Foreign Exchange Hedge(1) |
| (6,717,250) |
| - |
| (6,717,250) |
ADJUSTED OPERATING INCOME BEFORE TAX(1) |
| 5,934,462 |
| 3,732,190 |
| 9,666,652 |
(1) Includes, in the Commercial Bank, the currency hedge of the investment in dollars (a strategy to mitigate the tax effects and the variation of the exchange rate of offshore investments on net income), the result of which is recorded under " on financial assets and liabilities "fully offset in the line of Taxes.
Consolidated Financial Statements - December 31, 2018 111
| 2018 | |||||
Other aggregates: |
| Commercial Banking |
| Global Wholesale Banking |
| Total |
Total assets |
| 646,128,672 |
| 77,736,335 |
| 723,865,007 |
Loans and advances to customers |
| 236,792,060 |
| 64,280,147 |
| 301,072,207 |
Customer deposits |
| 227,689,079 |
| 76,508,721 |
| 304,197,800 |
|
|
|
|
|
|
|
| 2017 | |||||
Other aggregates: |
| Commercial Banking |
| Global Wholesale Banking |
| Total |
Total assets |
| 580,090,402 |
| 65,612,637 |
| 645,703,039 |
Loans and advances to customers |
| 217,539,344 |
| 54,880,813 |
| 272,420,157 |
Customer deposits |
| 225,926,433 |
| 50,115,708 |
| 276,042,141 |
|
|
|
|
|
|
|
| 2016 | |||||
Other aggregates: |
| Commercial Banking |
| Global Wholesale Banking |
| Total |
Total assets |
| 557,624,385 |
| 76,768,855 |
| 634,393,240 |
Loans and advances to customers |
| 191,433,209 |
| 60,569,565 |
| 252,002,774 |
Customer deposits |
| 228,923,947 |
| 18,521,230 |
| 247,445,177 |
46. Related party transactions
The parties related to the Bank are deemed to include, in addition to its subsidiaries, associates and jointly controlled entities, the Bank’s key management personnel and the entities over which the key management personnel may exercise significant influence or control.
Banco Santander has the Policy on Related Party Transactions approved by the Board of Directors, which aim to ensure that all transactions are made on the policy typified in view the interests of Banco Santander and its stockholders'. The policy defines powers to approve certain transactions by the Board of Directors. The rules laid down are also applied to all employees and directors of Banco Santander and its subsidiaries.
The transactions and remuneration of services with related parties are carried out in the ordinary course of business and under commutative conditions, including interest rates, terms and guarantees, and do not involve risks greater than normal collection or present other disadvantages.
a) Key-person management compensation
The Board of Directors' meeting, held on March 27, 2018 approved, in accordance with the Compensation Committee the maximum global compensation proposal for the directors (Board of Directors and Executive Officers) overall amounting to R$300,000 for the 2018 financial year, covering fixed remuneration, variable and equity-based and other benefits. The proposal was approved by the extraordinary stockholders' meeting (ESM) held on April 27, 2018.
i) Long-term benefits
The Banco Santander as well as Banco Santander Spain, as other subsidiaries of Santander Group, have long-term compensation programs tied to their share's performance, based on the achievement of goals.
Consolidated Financial Statements - December 31, 2018 112
ii) Short-term benefits
The following table shows the Board of Directors’ and Executive Board’s:
Thousand of reais |
| 2018 |
| 2017 |
| 2016 |
|
|
|
|
|
|
|
Fixed Compensation |
| 90,580 |
| 83,633 |
| 90,169 |
Variable Compensation - in cash |
| 48,526 |
| 42,718 |
| 37,479 |
Variable Compensation - in shares |
| 34,155 |
| 34,567 |
| 31,802 |
Others (1) |
| 54,494 |
| 11,919 |
| 14,580 |
Total Short-Term Benefits |
| 227,755 |
| 172,837 |
| 174,030 |
Variable Compensation - in cash |
| 31,797 |
| 31,268 |
| 25,581 |
Variable Compensation - in shares |
| 30,060 |
| 34,455 |
| 75,069 |
Total Long-Term Benefits |
| 61,857 |
| 65,723 |
| 100,650 |
Total (2) |
| 289,612 |
| 238,560 |
| 274,680 |
(1) In the first half of 2018, the Management of Banco Santander decided to carry out an early initiative, which was practiced by the Bank's liberality.
(2) Refers to the amount paid by Banco Santander and its subsidiaries to their Managers for positions they hold at Banco and other companies in the Conglomerate Santander.
Additionally, in the exercise ended on December 31, 2018, withholding taxes were collected on management compensation in the amount of R$36,356 (2017 - R$30,713 and 2016 - R$30,312).
iii) Contract termination
The termination of the employment relationship for non-fulfillment of obligations or voluntarily does not entitle executives to any financial compensation.
b) Lending operations
Under current law, it is not granted loans or advances involving:
I - directors, members of board of directors and audit committee as well as their spouses and relatives up to the second degree;
II - individuals or legal entities of Banco Santander, which hold more than 10% of the share capital;
III - Legal entities which hold more than 10% of the share capital, Banco Santander and its subsidiaries; and
IV - legal entities in which any of the officers, members of the Board of Directors and Audit Committee, as well as their spouses or relatives up to the second degree, hold more than 10% of the share capital.
c) Ownership Interest
The table below shows the direct interest (common shares and preferred shares) as of December 31, 2018, 2017 and 2016:
|
| 2018 | ||||||||||
|
| Common |
|
|
| Preferred |
|
|
| Total |
|
|
|
| Shares |
| Common |
| Shares |
| Preferred |
| Shares |
| Total |
Stockholders' |
| (thousand) | Shares (%) |
| (thousand) |
| Shares (%) |
| (thousand) |
| Shares (%) | |
Grupo Empresarial Santander, S.L.(1) | 1,107,673 |
| 29.0% |
| 1,019,645 |
| 27.7% |
| 2,127,318 |
| 28.4% | |
Sterrebeeck B.V.(1) |
| 1,809,583 |
| 47.4% |
| 1,733,644 |
| 47.1% |
| 3,543,227 |
| 47.2% |
Banco Santander, S.A.(1) | 521,964 |
| 13.7% |
| 519,268 |
| 14.1% |
| 1,041,232 |
| 13.9% | |
Employees |
| 2,986 |
| 0.1% |
| 2,987 |
| 0.1% |
| 5,973 |
| 0.1% |
Directors (*) |
| 3,930 |
| 0.1% |
| 3,930 |
| 0.1% |
| 7,860 |
| 0.1% |
Other |
| 359,242 |
| 9.4% |
| 387,045 |
| 10.5% |
| 746,287 |
| 9.9% |
Total |
| 3,805,378 |
| 99.7% |
| 3,666,519 |
| 99.6% |
| 7,471,897 |
| 99.6% |
Treasury shares |
| 13,317 |
| 0.3% |
| 13,317 |
| 0.4% |
| 26,634 |
| 0.4% |
Total |
| 3,818,695 |
| 100.0% |
| 3,679,836 |
| 100.0% |
| 7,498,531 |
| 100.0% |
Free Float(2) | 362,228 |
| 9.5% |
| 390,032 |
| 10.6% |
| 752,260 |
| 10.0% | |
|
|
|
|
|
|
|
|
|
|
|
|
|
|
| 2017 | ||||||||||
|
| Common |
|
|
| Preferred |
|
|
| Total |
|
|
|
| Shares |
| Common |
| Shares |
| Preferred |
| Shares |
| Total |
Stockholders' |
| (thousand) | Shares (%) |
| (thousand) |
| Shares (%) |
| (thousand) |
| Shares (%) | |
Grupo Empresarial Santander, S.L.(1) | 1,107,673 |
| 29.0% |
| 1,019,645 |
| 27.7% |
| 2,127,318 |
| 28.4% | |
Sterrebeeck B.V.(1) |
| 1,809,583 |
| 47.4% |
| 1,733,644 |
| 47.1% |
| 3,543,227 |
| 47.2% |
Banco Santander, S.A.(1) |
| 521,964 |
| 13.6% |
| 519,268 |
| 14.1% |
| 1,041,232 |
| 13.9% |
Employees |
| 3,551 |
| 0.1% |
| 3,556 |
| 0.1% |
| 7,107 |
| 0.1% |
Directors (*) |
| 4,016 |
| 0.1% |
| 4,016 |
| 0.1% |
| 8,032 |
| 0.1% |
Other |
| 366,063 |
| 9.6% |
| 393,862 |
| 10.7% |
| 759,925 |
| 10.1% |
Total |
| 3,812,850 |
| 99.8% |
| 3,673,991 |
| 99.8% |
| 7,486,841 |
| 99.8% |
Treasury shares |
| 5,845 |
| 0.2% |
| 5,845 |
| 0.2% |
| 11,690 |
| 0.2% |
Total |
| 3,818,695 |
| 100.0% |
| 3,679,836 |
| 100.0% |
| 7,498,531 |
| 100.0% |
Free Float(2) | 369,614 |
| 9.7% |
| 397,418 |
| 10.8% |
| 767,032 |
| 10.2% | |
|
|
|
|
|
|
|
|
|
|
|
|
|
|
| 2016 | ||||||||||
|
| Common |
|
|
| Preferred |
|
|
| Total |
|
|
|
| Shares |
| Common |
| Shares |
| Preferred |
| Shares |
| Total |
Stockholders' |
| (thousand) | Shares (%) |
| (thousand) |
| Shares (%) |
| (thousand) |
| Shares (%) | |
Grupo Empresarial Santander, S.L.(1) | 1,107,673 |
| 28.8% |
| 1,019,645 |
| 27.5% |
| 2,127,318 |
| 28.1% | |
Sterrebeeck B.V.(1) |
| 1,809,583 |
| 47.0% |
| 1,733,644 |
| 46.7% |
| 3,543,227 |
| 46.9% |
Banco Santander, S.A.(1) | 521,965 |
| 13.6% |
| 519,268 |
| 14.0% |
| 1,041,233 |
| 13.8% | |
Qatar Holding, LLC |
| 207,812 |
| 5.4% |
| 207,812 |
| 5.6% |
| 415,624 |
| 5.5% |
Employees |
| 3,914 |
| 0.1% |
| 3,929 |
| 0.1% |
| 7,843 |
| 0.1% |
Members of the Board of Directors | (*) |
| (*) |
| (*) |
| (*) |
| (*) |
| (*) | |
Members of the Executive Board | (*) |
| (*) |
| (*) |
| (*) |
| (*) |
| (*) | |
Other |
| 174,238 |
| 4.5% |
| 202,028 |
| 5.5% |
| 376,266 |
| 5.0% |
Total |
| 3,825,185 |
| 99.4% |
| 3,686,326 |
| 99.4% |
| 7,511,511 |
| 99.4% |
Treasury shares |
| 25,786 |
| 0.6% |
| 25,786 |
| 0.6% |
| 51,572 |
| 0.6% |
Total |
| 3,850,971 |
| 100.0% |
| 3,712,112 |
| 100.0% |
| 7,563,083 |
| 100.0% |
Free Float(2) | 385,964 |
| 10.0% |
| 413,769 |
| 11.1% |
| 799,733 |
| 10.6% | |
(1) Companies of the Santander Spain Group.
(2) Composed by Employees, Qatar Holding and other.
(*) None of the members of the Board of Directors and the Executive Board holds 1.0% or more of any class of shares.
Consolidated Financial Statements - December 31, 2018 113
c.1) Qatar Holding LLC's Public Offering
On April 11, 2017, Banco Santander in Brazil informed its shareholders and the market in general, in furtherance of the material facts disclosed on March 28, 2017 and April 6, 2017, the settlement of the secondary public offering for the distribution of 80,000,000 units issued by Banco Santander in Brazil and held by Qatar Holding LLC (Selling Shareholder), including in the form of American Depositary Shares (ADSs), having been allocated 22,000,000 Units for the Brazilian offering and 58,000,000 ADSs for the international offering. The price per Unit was set at R$25, resulting on a total amount of R$2 billion. Additionally, the amount of Units of the international offering initially offered was increased by an additional batch of 12,000,000 Units, exclusively in the form of ADSs also held by the Selling Shareholder.
d) Related-Party Transactions
Santander has a Policy for Related Party Transactions approved by the Board of Directors, which aims to ensure that all transactions typified by the policy to take effect in view of the interests of Banco Santander and its stockholders. The policy defines the power to approve certain transactions by the Board of Directors. The planned rules also apply to all employees and officers of Banco Santander and its subsidiaries.
Operations and charges for services with related parties are carried out in the ordinary course of business and under reciprocal conditions, including interest rates, terms and guarantees, and do not entail greater risk than the normal collection or have other disadvantages.
Beginning in 2018, transactions and balances with key management personnel are shown.The main transactions and balance are as follows:
Thousand of reais |
| 2018 | ||||
|
| Parent(1) |
| Joint-controlled |
| Other Related-Party(2) |
|
|
|
| |||
Assets |
| 8,169,537 |
| 3,112,734 |
| 1,381,770 |
Financial assets for trading |
| (72,815) |
| 205,337 |
| 266,027 |
Banco Santander, S.A. - Spain |
| (72,815) |
| - |
| - |
Abbey National Treasury Services Plc(2) |
| - |
| - |
| - |
Real Fundo de Investimento Multimercado Santillana Credito Privado(2) |
| - |
| - |
| 266,027 |
Banco RCI Brasil S.A. |
| - |
| 205,337 |
| - |
Loans and other values with credit institutions - Cash and overnight operations in foreign currency | 8,194,590 |
| - |
| 146,988 | |
Banco Santander, S.A. – Spain (3) (5) |
| 8,194,590 |
| - |
| - |
Banco Santander Totta, S.A.(2) |
| - |
| - |
| 7,883 |
Abbey National Treasury Services Plc(2) |
| - |
| - |
| 87,260 |
Bank Zachodni(2) |
| - |
| - |
| 193 |
Santander UK plc |
| - |
| - |
| 46,615 |
Banco Santander, S.A. – Mexico(2) |
| - |
| - |
| 5,037 |
Loans and advances to customers |
| 347 |
| - |
| 966,462 |
Zurich Santander Brasil Seguros e Previdência S.A. |
| - |
| - |
| 913,875 |
Zurich Santander Brasil Seguros S.A. |
| - |
| - |
| 45,851 |
Abbey National Treasury Services Plc (2) |
| - |
| - |
| - |
Banco Santander Espanha (1) |
| 347 |
| - |
| - |
Isban Mexico, S.A. de C.V. |
| - |
| - |
| 122 |
Ingeniería de Software Bancario, S.L. |
| - |
| - |
| - |
Gesban Servicios Administrativos Globales, S.L. |
| - |
| - |
| 23 |
Santander Brasil Gestão de Recursos Ltda |
| - |
| - |
| 169 |
Santander Securities Services Brasil Participações S.A.(2) |
| - |
| - |
| 927 |
Key Management Personnel (8) |
| - |
| - |
| 5,495 |
Loans and other values with credit institutions(1) |
| 15,143 |
| 2,905,947 |
| 2,293 |
Banco Santander – Spain |
| 15,143 |
| - |
| - |
Produban Servicios Informáticos Generales, S.L. (Produban Espanha) (2) |
| - |
| - |
| - |
Banco RCI Brasil S.A. |
| - |
| 2,905,947 |
| - |
BHJV Assessoria e Consultoria em Gestão Empresarial LTDA |
| - |
| - |
| 10 |
Produban Brasil Tecnologia |
| - |
| - |
| 2,091 |
Santander Global Technology, S.L., SOCI |
| - |
| - |
| 192 |
Banco Santander, S.A. – Uruguay(2) |
| - |
| - |
| - |
Other Assets |
| 32,272 |
| 1,450 |
| - |
Banco Santander – Spain |
| 32,272 |
| - |
| - |
Banco RCI Brasil S.A. |
| - |
| 1,450 |
| - |
Consolidated Financial Statements - December 31, 2018 114
Liabilities |
|
|
|
|
|
|
| (23,166,005) |
| (38,380) |
| (2,975,342) |
Deposits of Brazil Central Bank and deposits of credit institutions |
| (107,084) |
| (36,871) |
| (1,410,619) | ||||||
Banco Santander, S.A. – Spain(4) |
| (107,084) |
| - |
| - | ||||||
Santander Securities Services Brasil DTVM S.A. |
| - |
| - |
| - | ||||||
Santander Brasil Asset(2) |
| - |
| - |
| - | ||||||
Real Fundo de Investimento Multimercado Santillana Credito Privado (2) |
| - |
| - |
| (1,151,399) | ||||||
Banco Santander, S.A. – Uruguay(2) |
| - |
| - |
| - | ||||||
Banco Santander Río S.A. (2) |
|
|
|
|
|
|
| - |
| - |
| (259,220) |
Banco RCI Brasil S.A. |
| - |
| (36,871) |
| - | ||||||
Securities |
|
|
|
|
|
|
| - |
| - |
| (96,133) |
Key Management Personnel |
| - |
| - |
| (96,133) | ||||||
Customer deposits |
|
|
|
|
|
|
| - |
| (1,509) |
| (1,134,675) |
Santander Securities Services Brasil Participações S.A.(2) |
| - |
| - |
| (58,968) | ||||||
Zurich Santander Brasil Seguros e Previdência S.A.(1) |
| - |
| - |
| (234,249) | ||||||
Gestora de Inteligência de Crédito |
| - |
| - |
| (190,674) | ||||||
Santander Brasil Gestão de Recursos Ltda |
| - |
| - |
| (126,988) | ||||||
Webmotors S.A. |
| - |
| (1,509) |
| - | ||||||
Santander Securities Services Brasil DTVM S.A. |
| - |
| - |
| (427,209) | ||||||
Santander Brasil Asset(2) |
| - |
| - |
| (18,639) | ||||||
Key Management Personnel |
| - |
| - |
| (37,889) | ||||||
Others |
|
|
|
|
|
|
| - |
| - |
| (40,059) |
Other financial liabilities - Dividends and interest on capital Payable |
| (3,922,473) |
| - |
| (5,544) | ||||||
Banco Santander – Spain |
| (609,159) |
| - |
| - | ||||||
Grupo Empresarial Santander, S.L.(1) |
| (1,242,259) |
| - |
| - | ||||||
Sterrebeeck B.V.(1) |
| (2,071,055) |
| - |
| - | ||||||
Banco Madesant |
|
|
|
|
|
|
| - |
| - |
| (1,112) |
Key Management Personnel(7) |
| - |
| - |
| (4,432) | ||||||
Other Payables |
|
|
|
|
|
|
| (9,603) |
| - |
| (424,504) |
Banco Santander, S.A. – Spain |
| (9,603) |
| - |
| - | ||||||
Santander Brasil Asset(2) |
| - |
| - |
| (14,476) | ||||||
Produban Servicios Informáticos Generales, S.L. (Produban Espanha)(2) |
| - |
| - |
| - | ||||||
Ingeniería de Software Bancário, S.L. (2) |
| - |
| - |
| - | ||||||
Santander Securities Services Brasil DTVM S.A. |
| - |
| - |
| (4,291) | ||||||
Zurich Santander Brasil Seguros e Previdência S.A. |
| - |
| - |
| (16,924) | ||||||
Key Management Personnel |
|
|
|
|
|
|
| - |
| - |
| (381,292) |
Others |
| - |
| - |
| (7,521) | ||||||
Debt Instruments Eligible to Compose Capital |
|
|
| (19,126,845) |
| - |
| - | ||||
Banco Santander – Spain |
| (19,126,845) |
| - |
| - | ||||||
|
|
|
|
|
|
|
|
|
|
|
|
|
Thousand of Reais |
|
|
|
|
|
|
| 2017 | ||||
|
|
|
|
|
|
|
| Parent(1) |
| Joint-controlled |
| Other Related-Party(2) |
|
|
|
|
|
|
|
|
|
| |||
Assets |
|
|
|
|
|
|
| 8,214,739 |
| 1,214,312 |
| 926,994 |
Financial assets for trading - Derivatives net |
|
|
| (173,065) |
| - |
| (74,873) | ||||
Banco Santander, S.A. – Spain |
| (173,065) |
| - |
| - | ||||||
Abbey National Treasury Services Plc(2) |
| - |
| - |
| (71,672) | ||||||
Real Fundo de Investimento Multimercado Santillana Credito Privado(2) |
| - |
| - |
| (3,201) | ||||||
Loans and other values with credit institutions - Cash and overnight operations in foreign currency | 8,363,038 |
| - |
| 76,009 | |||||||
Banco Santander, S.A. – Spain (3) (5) |
| 8,363,038 |
| - |
| - | ||||||
Banco Santander Totta, S.A.(2) |
| - |
| - |
| 2,733 | ||||||
Abbey National Treasury Services Plc(2) |
| - |
| - |
| 71,751 | ||||||
Bank Zachodni(2) |
| - |
| - |
| 177 | ||||||
Banco Santander, S.A. – Mexico(2) |
| - |
| - |
| 1,348 | ||||||
Loans and advances to customers |
| 132 |
| 9,661 |
| 925,858 | ||||||
Zurich Santander Brasil Seguros e Previdência S.A. |
| - |
| - |
| 925,835 | ||||||
Abbey National Treasury Services Plc (2) |
| - |
| - |
| 23 | ||||||
Banco Santander Espanha(1) |
| 132 |
| - |
| - | ||||||
Webmotors S.A. |
| - |
| 9,661 |
| - | ||||||
Loans and other values with credit institutions(1) |
| 23,896 |
| 1,203,032 |
| - | ||||||
Banco Santander – Spain |
| 23,896 |
| - |
| - | ||||||
Banco RCI Brasil S.A. |
| - |
| 1,203,032 |
| - | ||||||
Other Assets |
|
|
|
|
|
|
| 738 |
| 1,619 |
| - |
Banco Santander – Spain |
| 738 |
| - |
| - | ||||||
Banco RCI Brasil S.A. |
| - |
| 1,619 |
| - | ||||||
|
|
|
|
|
|
|
|
|
|
|
|
|
Liabilities |
|
|
|
|
|
|
| (12,360,383) |
| (57,221) | - | (2,107,677) |
Deposits of Brazil Central Bank and deposits of credit institutions |
| (387,937) |
| (47,423) |
| (1,862,058) | ||||||
Banco Santander, S.A. – Spain(4) |
| (387,937) |
| - |
| - | ||||||
Santander Securities Services Brasil DTVM S.A. |
| - |
| - |
| (300,074) | ||||||
Santander Brasil Asset |
| - |
| - |
| (16,766) | ||||||
Real Fundo de Investimento Multimercado Santillana Credito Privado(2) |
| - |
| - |
| (1,543,752) | ||||||
Banco Santander, S.A. – Uruguay(2) |
| - |
| - |
| (1,466) | ||||||
Banco RCI Brasil S.A. |
| - |
| (47,423) |
| - | ||||||
Customer deposits |
|
|
|
|
|
|
| - |
| (9,798) |
| (222,473) |
ISBAN Brasil S.A.(2) |
| - |
| - |
| (20,893) | ||||||
Santander Securities Services Brasil Participações S.A.(2) |
| - |
| - |
| (71,947) | ||||||
Santander Brasil Tecnologia S.A. (current name of Produban Serviços de Informática S.A.)(2) |
| - |
| - |
| (34,410) | ||||||
Zurich Santander Brasil Seguros e Previdência S.A. |
| - |
| - |
| (55,935) | ||||||
Santander Brasil Gestão de Recursos Ltda |
| - |
| - |
| (32,334) | ||||||
Webmotors S.A. |
| - |
| (9,798) |
| - | ||||||
Others |
| - |
| - |
| (6,954) | ||||||
Other financial liabilities - Dividends and interest on capital Payable |
| (3,992,820) |
| - |
| (1,132) | ||||||
Banco Santander – Spain |
| (620,264) |
| - |
| - | ||||||
Grupo Empresarial Santander, S.L.(1)(2) |
| (1,264,470) |
| - |
| - | ||||||
Sterrebeeck B.V.(1) (2) |
| (2,108,086) |
| - |
| - | ||||||
Banco Madesant (2) |
| - |
| - |
| (1,132) | ||||||
Other Payables |
|
|
|
|
|
|
| (2,050) |
| - |
| (22,014) |
Banco Santander – Spain |
| (2,050) |
| - |
| - | ||||||
Santander Brasil Asset |
| - |
| - |
| (69) | ||||||
ISBAN Brasil S.A.(2) |
| - |
| - |
| 237 | ||||||
Produban Servicios Informáticos Generales, S.L. (Produban Espanha)(2) |
| - |
| - |
| (905) | ||||||
Santander Securities Services Brasil DTVM S.A. |
| - |
| - |
| 6,762 | ||||||
Zurich Santander Brasil Seguros e Previdência S.A. |
| - |
| - |
| (27,748) | ||||||
Others |
|
|
|
|
|
|
| - |
| - |
| (291) |
Debt Instruments Eligible to Compose Capital |
|
|
| (7,977,576) |
| - |
| - | ||||
Banco Santander – Spain |
| (7,977,576) |
| - |
| - | ||||||
Consolidated Financial Statements - December 31, 2018 115
Thousand of Reais |
|
|
|
|
|
|
| 2016 | ||||
|
|
|
|
|
|
|
| Parent(1) |
| Joint-controlled |
| Other Related-Party(2) |
|
|
|
|
|
|
|
|
|
| |||
Assets |
|
|
|
|
|
|
| 10,919,116 |
| 794,800 |
| 556,778 |
Financial assets for trading - Derivatives net |
|
|
| (184,304) |
| - |
| (400,570) | ||||
Banco Santander, S.A. – Spain |
|
|
|
|
| (184,304) |
| - |
| - | ||
Abbey National Treasury Services Plc(2) |
|
|
| - |
| - |
| (91,828) | ||||
Real Fundo de Investimento Multimercado Santillana Credito Privado (2) |
| - |
| - |
| (308,742) | ||||||
Loans and other values with credit institutions - Cash and overnight operations in foreign currency | 10,900,941 |
| - |
| 94,530 | |||||||
Banco Santander, S.A. – Spain(3) (5) |
| 10,900,941 |
| - |
| - | ||||||
Banco Santander Totta, S.A. (2) |
| - |
| - |
| 1,261 | ||||||
Abbey National Treasury Services Plc (2) |
| - |
| - |
| 92,118 | ||||||
Bank Zachodni (2) |
| - |
| - |
| 117 | ||||||
Banco Santander, S.A. – México (2) |
| - |
| - |
| 1,034 | ||||||
Loans and advances to customers |
| - |
| 136,354 |
| 862,818 | ||||||
Zurich Santander Brasil Seguros e Previdência S.A. |
| - |
| - |
| 862,553 | ||||||
Webmotors S.A. |
| - |
| 136,354 |
| - | ||||||
Santander Brasil Gestão de Recursos Ltda |
| - |
| - |
| 265 | ||||||
Loans and other values with credit institutions(1) |
| 25,546 |
| 656,806 |
| - | ||||||
Banco Santander – Spain |
| 25,546 |
| - |
| - | ||||||
Banco RCI Brasil S.A. |
| - |
| 656,806 |
| - | ||||||
Other Assets |
|
|
|
|
|
|
| 176,933 |
| 1,640 |
| - |
Banco Santander – Spain |
| 176,933 |
| - |
| - | ||||||
Banco RCI Brasil S.A. |
| - |
| 1,640 |
| - | ||||||
|
|
|
|
|
|
|
|
|
|
|
|
|
Liabilities |
|
|
|
|
|
|
| (11,984,199) |
| (106,527) |
| (1,222,556) |
Deposits of Brazil Central Bank and deposits of credit institutions |
| (327,466) |
| (40,202) |
| (980,702) | ||||||
Banco Santander Espanha(4) |
| (327,466) |
| - |
| - | ||||||
Santander Securities Services Brasil DTVM S.A. |
| - |
| - |
| (208,059) | ||||||
Santander Brasil Asset |
| - |
| - |
| (12,079) | ||||||
Real Fundo de Investimento Multimercado Santillana Credito Privado (2) |
| - |
| - |
| (757,874) | ||||||
Banco Santander, S.A. – Uruguay (2) |
| - |
| - |
| (2,158) | ||||||
Banco RCI Brasil S.A. |
| - |
| (40,202) |
| - | ||||||
Others |
|
|
|
|
|
|
| - |
| - |
| (532) |
Customer deposits |
|
|
|
|
|
|
| - |
| (66,325) |
| (189,794) |
ISBAN Brasil S.A. (2) |
| - |
| - |
| (22,232) | ||||||
Santander Securities Services Brasil Participações S.A. (2) |
| - |
| - |
| (52,484) | ||||||
Santander Brasil Tecnologia S.A. (current name of Produban Serviços de Informática S.A.) (2) |
| - |
| - |
| (19,653) | ||||||
Zurich Santander Brasil Seguros e Previdência S.A. |
| - |
| - |
| (44,840) | ||||||
Santander Brasil Gestão de Recursos Ltda |
| - |
| - |
| (39,361) | ||||||
Webmotors S.A. |
| - |
| (66,325) |
| - | ||||||
Others |
| - |
| - |
| (11,224) | ||||||
Other financial liabilities - Dividends and interest on capital Payable |
| (3,794,130) |
| - |
| (16,494) | ||||||
Banco Santander, S.A. – Spain |
| (589,227) |
| - |
| - | ||||||
Grupo Empresarial Santander, S.L.(1) (2) |
| (1,201,612) |
| - |
| - | ||||||
Sterrebeeck B.V.(1) (2) |
| (2,003,291) |
| - |
| - | ||||||
Banco Madesant (2) |
| - |
| - |
| (1,075) | ||||||
Santusa Holding, S.L.(2) |
| - |
| - |
| (15,419) | ||||||
Other Payables |
|
|
|
|
|
|
| (2,954) |
| - |
| (35,566) |
Banco Santander – Espanha |
| (2,954) |
| - |
| - | ||||||
Santander Brasil Asset |
| - |
| - |
| (70) | ||||||
ISBAN Brasil S.A.(2) |
| - |
| - |
| (339) | ||||||
Santander Securities Services Brasil DTVM S.A. |
| - |
| - |
| (4,430) | ||||||
Zurich Santander Brasil Seguros e Previdência S.A. |
| - |
| - |
| (30,684) | ||||||
Outros |
| - |
| - |
| (43) | ||||||
Debt Instruments Eligible to Compose Capital |
|
|
| (7,859,649) |
| - |
| - | ||||
Banco Santander – Spain |
| (7,859,649) |
| - |
| - | ||||||
(*) All loans and other amounts with related parties were made in the ordinary course of business and on sustainable basis, including interest rates and collateral and did not involve more than the normal risk of collectability or present other unfavorable features.
(1) Banco Santander (Brasil) S.A. is indirectly controlled by Banco Santander Spain (note 1-a), through its subsidiary Grupo Empresarial Santander, S.L. and Sterrebeeck B.V.
(2) Refers to the Company's subsidiaries (Banco Santander Spain).
(3) In December 31, 2018, refers to the cash of R$1,515,437 (2017 - R$587,531 and 2016 - R$582,571).
(4) On December 31, 2018, include foreign currency investments (overnight applications) due on January 2, 2019 in the amount of R$6,583,716 (2017 - R$7,384,335 and 2016 - R$10,269,812) and interest of 2.38% p.a held at Santander Brasil EFC, Banco Santander Brasil and its Grand Cayman Branch.
(5) Refers the emissions of Eurobonds of Grand Cayman Branch, maturing between from January 16, 2016 to February 13, 2017 and interest of 3.152% p.a and 4.625% p.a.
(6) In February, 2016 the Cia de Crédito, Financiamento e Investimentos Renault was acquired by Banco RCI Brasil.
(7) Of the total dividends resolved in 2018, R$ 10,502 is allocated to the Key Management Personnel, remaining to pay the provisioned amount.
(8) The balance with key management personnel refers to operations contracted before the term of the mandates.
Consolidated Financial Statements - December 31, 2018 116
Thousand of Reais |
|
|
| 2018 | ||||||||
|
|
|
|
|
|
|
| Parent(1) |
| Joint-controlled |
| Other Related-Party(2) |
|
|
|
|
|
|
|
|
|
| |||
Income |
|
|
|
|
|
|
| (972,799) |
| 192,889 |
| 1,323,622 |
Interest and similar income - Loans and advances to customers |
|
|
|
|
|
|
| - |
| - |
| 461 |
Key Management Personnel |
| - |
| - |
| 461 | ||||||
Interest and similar income - Loans and amounts due from credit institutions |
| 136,250 |
| 136,666 |
| 1,080 | ||||||
Banco Santander, S.A. – Spain |
| 136,250 |
| - |
| - | ||||||
Banco RCI Brasil S.A. (6) |
| - |
| 136,666 |
| - | ||||||
Abbey National Treasury Services Plc |
| - |
| - |
| 157 | ||||||
Cibrasec |
| - |
| - |
| 923 | ||||||
Interest expense and similar charges - Customer deposits |
|
| - |
| (92) |
| (23,146) | |||||
ISBAN Brasil S.A. |
| - |
| - |
| (90) | ||||||
Santander Brasil Gestão de Recursos Ltda |
| - |
| - |
| (8,329) | ||||||
Santander Cultural |
| - |
| - |
| (36) | ||||||
Gestora de Inteligência de Crédito |
| - |
| - |
| (5,743) | ||||||
Webmotors S.A. |
| - |
| (92) |
| - | ||||||
Santander Brasil Tecnologia S.A. (current name of Produban Serviços de Informática S.A.) |
| - |
| - |
| (215) | ||||||
Key Management Personnel |
| - |
| - |
| (8,707) | ||||||
Others |
| - |
| - |
| (27) | ||||||
Interest expense and similar charges - Deposits from credit institutions |
| (6,889) |
| (5,871) |
| (134,896) | ||||||
Banco Santander, S.A. – Spain |
| (6,889) |
| - |
| - | ||||||
Banco RCI Brasil S.A.(6) |
| - |
| (5,871) |
| - | ||||||
Santander Securities Services Brasil Participações S.A.(2) |
| - |
| - |
| (26,378) | ||||||
SAM Brasil Participações |
| - |
| - |
| (47) | ||||||
Real Fundo de Investimento Multimercado Santillana Credito Privado |
| - |
| - |
| (102,928) | ||||||
Santander Securities Services Brasil DTVM S.A.(2) |
| - |
| - |
| (4,442) | ||||||
Santander Asset Management, S.A. SGIIC. |
| - |
| - |
| (1,101) | ||||||
Fee and commission income (expense) |
|
|
| 6,213 |
| 32,960 |
| 2,653,014 | ||||
Banco Santander, S.A. – Spain |
| 6,213 |
| - |
| - | ||||||
Banco RCI Brasil S.A. (6) |
| - |
| 31,981 |
| - | ||||||
Banco Santander International |
| - |
| - |
| 30,789 | ||||||
Webmotors S.A. |
| - |
| 979 |
| - | ||||||
Zurich Santander Brasil Seguros S.A. |
| - |
| - |
| 300,868 | ||||||
Zurich Santander Brasil Seguros e Previdência S.A. |
| - |
| - |
| 2,302,295 | ||||||
Key Management Personnel |
| - |
| - |
| 355 | ||||||
Others |
| - |
| - |
| 18,707 | ||||||
Gains (losses) on financial assets and liabilities (net) and exchange differences (net) |
| (680,903) |
| 29,226 |
| (199,985) | ||||||
Banco Santander, S.A. – Spain |
| (680,903) |
| - |
| - | ||||||
Real Fundo de Investimento Multimercado Santillana Credito Privado |
| - |
| - |
| (210,324) | ||||||
Abbey National Treasury Services Plc |
| - |
| - |
| (17,726) | ||||||
Santander Securities Services Brasil DTVM S.A.(2) |
| - |
| - |
| 1,312 | ||||||
Zurich Santander Brasil Seguros e Previdência S.A. |
| - |
| - |
| 40,305 | ||||||
Zurich Santander Brasil Seguros S.A. |
| - |
| - |
| - | ||||||
Banco RCI Brasil S.A.(6) |
| - |
| 29,226 |
| - | ||||||
Key Management Personnel |
| - |
| - |
| 239 | ||||||
Others |
| - |
| - |
| (13,791) | ||||||
Administrative expenses and Amortization |
|
|
| - |
| - |
| (952,432) | ||||
Banco Santander, S.A. – Spain |
| - |
| - |
| - | ||||||
ISBAN Brasil S.A. |
| - |
| - |
| (14,210) | ||||||
Santander Brasil Tecnologia S.A. (current name of Produban Serviços de Informática S.A.) |
| - |
| - |
| (33,567) | ||||||
ISBAN Chile S.A. |
| - |
| - |
| (24) | ||||||
Aquanima Brasil Ltda. |
| - |
| - |
| (30,021) | ||||||
TECBAN - Tecnologia Bancaria Brasil |
| - |
| - |
| (313,433) | ||||||
Produban Servicios Informaticos Generales, S.L. |
| - |
| - |
| - | ||||||
Ingeniería de Software Bancario, S.L. |
| - |
| - |
| - | ||||||
Santander Securities Services Brasil DTVM S.A. (2) |
| - |
| - |
| (46,884) | ||||||
Santander Global Technology, S.L., SOCI |
| - |
| - |
| (175,466) | ||||||
Key Management Personnel |
| - |
| - |
| (289,612) | ||||||
Others |
| - |
| - |
| (49,216) | ||||||
Others Administrative expenses - Donation |
|
|
| - |
| - |
| (20,013) | ||||
Santander Cultural |
| - |
| - |
| (2,748) | ||||||
Fundacao Santander |
| - |
| - |
| (1,330) | ||||||
Instituto Escola Brasil |
| - |
| - |
| - | ||||||
Fundação Sudameris |
| - |
| - |
| (15,935) | ||||||
Debt Instruments Eligible to Compose Capital |
|
|
| (427,470) |
| - |
| - | ||||
Banco Santander Espanha (2)(8) |
| (427,470) |
| - |
| - | ||||||
|
|
|
|
|
|
|
|
|
|
|
|
|
Thousand of Reais |
|
|
| 2017 | ||||||||
|
|
|
|
|
|
|
| Parent(1) |
| Joint-controlled |
| Other Related-Party(2) |
|
|
|
|
|
|
|
|
|
| |||
Income |
|
|
|
|
|
|
| 389,663 |
| 126,781 |
| 1,210,444 |
Interest and similar income - Loans and amounts due from credit institutions |
| 87,217 |
| 87,381 |
| 1,417 | ||||||
Banco Santander, S.A. – Spain |
| 87,217 |
| - |
| - | ||||||
Banco RCI Brasil S.A. (6) |
| - |
| 87,381 |
| - | ||||||
Abbey National Treasury Services Plc |
| - |
| - |
| 879 | ||||||
Cibrasec |
| - |
| - |
| 538 | ||||||
Interest expense and similar charges - Customer deposits |
|
| - |
| (4,486) |
| (41,026) | |||||
ISBAN Brasil S.A. |
| - |
| - |
| (2,145) | ||||||
Banco Santander, S.A. – Spain |
| - |
| - |
| (6,190) | ||||||
Santander Brasil Gestão de Recursos Ltda |
| - |
| - |
| (6,636) | ||||||
Santander Cultural |
|
|
|
|
|
|
| - |
| - |
| (24,344) |
Real Fundo de Investimento Multimercado Santillana Credito Privado |
| - |
| - |
| (69) | ||||||
Webmotors S.A. |
| - |
| (4,486) |
| - | ||||||
Santander Brasil Tecnologia S.A. (current name of Produban Serviços de Informática S.A.) |
| - |
| - |
| (1,547) | ||||||
Others |
| - |
| - |
| (95) | ||||||
Interest expense and similar charges - Deposits from credit institutions |
| (13,038) |
| (3,026) |
| (113,569) | ||||||
Banco Santander, S.A. – Spain |
| (13,038) |
| - |
| - | ||||||
Banco RCI Brasil S.A.(6) |
| - |
| (3,026) |
| - | ||||||
Santander Securities Services Brasil DTVM S.A. |
| - |
| - |
| (95) | ||||||
SAM Brasil Participações |
| - |
| - |
| (112,211) | ||||||
Real Fundo de Investimento Multimercado Santillana Credito Privado |
| - |
| - |
| (1,263) | ||||||
Fee and commission income (expense) |
|
|
| (5,099) |
| 14,999 |
| 2,453,179 | ||||
Banco Santander – Espanha |
| (5,099) |
| - |
| - | ||||||
Banco RCI Brasil S.A.(6) |
| - |
| 14,996 |
| - | ||||||
Banco Santander International |
| - |
| - |
| 20,480 | ||||||
Webmotors S.A. |
| - |
| 3 |
| - | ||||||
Zurich Santander Brasil Seguros S.A. |
| - |
| - |
| 295,508 | ||||||
Zurich Santander Brasil Seguros e Previdência S.A. |
| - |
| - |
| 2,134,755 | ||||||
Others |
| - |
| - |
| 2,436 | ||||||
Gains (losses) on financial assets and liabilities (net) and exchange differences (net) |
| 592,919 |
| 31,913 |
| (39,534) | ||||||
Banco Santander, S.A. – Spain |
| 592,919 |
| - |
| - | ||||||
Real Fundo de Investimento Multimercado Santillana Credito Privado |
| - |
| - |
| (79,480) | ||||||
Abbey National Treasury Services Plc |
| - |
| - |
| 23,843 | ||||||
Banco RCI Brasil S.A.(6) |
| - |
| 31,913 |
| - | ||||||
Santander Securities Services Brasil DTVM S.A. (2) |
| - |
| - |
| (26,102) | ||||||
Santander Investment Securities Inc. |
| - |
| - |
| (13,492) | ||||||
Zurich Santander Brasil Seguros e Previdência S.A. |
| - |
| - |
| 52,981 | ||||||
Zurich Santander Brasil Seguros S.A. |
| - |
| - |
| 1,788 | ||||||
Others |
| - |
| - |
| 928 | ||||||
Administrative expenses and Amortization |
|
|
| (50,271) |
| - |
| (1,028,750) | ||||
Banco Santander, S.A. – Espanha |
| (50,271) |
| - |
| - | ||||||
ISBAN Brasil S.A. |
| - |
| - |
| (337,161) | ||||||
Santander Brasil Tecnologia S.A. (current name of Produban Serviços de Informática S.A.) |
| - |
| - |
| (242,191) | ||||||
ISBAN Chile S.A. |
|
|
|
|
|
|
| - |
| - |
| (23) |
Aquanima Brasil Ltda. |
|
|
|
|
|
|
| - |
| - |
| (25,638) |
TECBAN - Tecnologia Bancaria Brasil |
|
|
|
| - |
| - |
| (262,046) | |||
Produban Servicios Informaticos Generales, S.L. |
|
|
| - |
| - |
| (46,494) | ||||
Ingeniería de Software Bancario, S.L. |
|
|
|
| - |
| - |
| (70,385) | |||
Santander Securities Services Brasil DTVM S.A.(2) |
|
|
| - |
| - |
| (42,603) | ||||
Outros |
|
|
|
|
|
|
| - |
| - |
| (2,209) |
Others Administrative expenses - Donation |
|
|
| - |
| - |
| (21,273) | ||||
Santander Cultural |
| - |
| - |
| (3,513) | ||||||
Fundacao Santander |
| - |
| - |
| (1,837) | ||||||
Instituto Escola Brasil |
| - |
| - |
| (873) | ||||||
Fundação Sudameris |
| - |
| - |
| (15,050) | ||||||
Debt Instruments Eligible to Compose Capital |
|
|
| (222,065) |
| - |
| - | ||||
Banco Santander Espanha (2)(8) |
| (222,065) |
| - |
| - | ||||||
Consolidated Financial Statements - December 31, 2018 117
Thousand of Reais |
| 2016 | ||||
|
| Parent(1) |
| Joint-controlled |
| Other Related-Party(2) |
|
|
|
|
|
|
|
Income |
| (798,022) |
| 136,111 |
| 1,197,489 |
Interest and similar income - Loans and amounts due from credit institutions |
| 39,677 |
| 114,909 |
| 396 |
Banco Santander, S.A. – Spain |
| 39,677 |
| - |
| - |
Banco RCI Brasil S.A. (6) |
| - |
| 114,909 |
| - |
Abbey National Treasury Services Plc |
| - |
| - |
| 396 |
Interest expense and similar charges - Customer deposits |
| (4,192) |
| (26,996) |
| (49,420) |
ISBAN Brasil S.A. |
| - |
| - |
| (3,560) |
Banco Santander Espanha |
| (4,192) |
| - |
| - |
Santander Brasil Gestão de Recursos Ltda |
| - |
| - |
| (12,417) |
Santander Cultural |
| - |
| - |
| (11) |
Real Fundo de Investimento Multimercado Santillana Credito Privado |
| - |
| - |
| (31,097) |
Webmotors S.A. |
| - |
| (26,996) |
| - |
Santander Brasil Tecnologia S.A. (current name of Produban Serviços de Informática S.A.) |
| - |
| - |
| (2,117) |
Others |
| - |
| - |
| (218) |
Interest expense and similar charges - Deposits from credit institutions |
| (512) |
| (10,959) |
| (115,458) |
Banco Santander, S.A. – Spain |
| (512) |
| - |
| - |
Banco RCI Brasil S.A.(6) |
| - |
| (10,959) |
| - |
Santander Securities Services Brasil DTVM S.A. |
| - |
| - |
| (20,979) |
SAM Brasil Participações |
| - |
| - |
| (133) |
Real Fundo de Investimento Multimercado Santillana Credito Privado |
| - |
| - |
| (88,467) |
Santander Securities Services Brasil Participações S.A. (2) |
| - |
| - |
| (4,119) |
Santander Asset Management, S.A. SGIIC. |
| - |
| - |
| (1,760) |
Fee and commission income (expense) |
| 5,334 |
| 20,133 |
| 1,955,255 |
Banco Santander – Espanha |
| 5,334 |
| - |
| - |
Banco RCI Brasil S.A.(6) |
| - |
| 19,211 |
| - |
Banco Santander International |
| - |
| - |
| 20,959 |
Santander Securities Services Brasil DTVM S.A. |
| - |
| - |
| 1,896 |
Webmotors S.A. |
| - |
| 922 |
| - |
Zurich Santander Brasil Seguros S.A. |
| - |
| - |
| 218,773 |
Zurich Santander Brasil Seguros e Previdência S.A. |
| - |
| - |
| 1,711,138 |
Others |
| - |
| - |
| 2,489 |
Gains (losses) on financial assets and liabilities (net) and exchange differences (net) |
| (613,168) |
| 39,024 |
| 267,983 |
Banco Santander, S.A. – Spain |
| (613,168) |
| - |
| - |
Real Fundo de Investimento Multimercado Santillana Credito Privado |
| - |
| - |
| 257,475 |
Abbey National Treasury Services Plc |
| - |
| - |
| 38,274 |
Banco RCI Brasil S.A. (6) |
| - |
| 39,024 |
| - |
Santander Securities Services Brasil DTVM S.A. |
| - |
| - |
| (16,038) |
Santander Investment Securities Inc. |
| - |
| - |
| (15,115) |
Others |
| - |
| - |
| 3,387 |
Administrative expenses and Amortization |
| - |
| - |
| (840,739) |
ISBAN Brasil S.A. |
| - |
| - |
| (290,430) |
Santander Brasil Tecnologia S.A. (current name of Produban Serviços de Informática S.A.) |
| - |
| - |
| (209,253) |
ISBAN Chile S.A. |
| - |
| - |
| (26) |
Aquanima Brasil Ltda. |
| - |
| - |
| (24,557) |
TECBAN - Tecnologia Bancaria Brasil |
| - |
| - |
| (213,194) |
Produban Servicios Informaticos Generales, S.L. |
| - |
| - |
| (21,525) |
Ingeniería de Software Bancario, S.L. |
| - |
| - |
| (42,519) |
Santander Securities Services Brasil DTVM S.A. |
| - |
| - |
| (35,882) |
Others |
| - |
| - |
| (3,353) |
Others Administrative expenses - Donation |
| - |
| - |
| (20,528) |
Santander Cultural |
| - |
| - |
| (2,737) |
Fundacao Santander |
| - |
| - |
| (3,452) |
Instituto Escola Brasil |
| - |
| - |
| (939) |
Fundação Sudameris |
| - |
| - |
| (13,400) |
Debt Instruments Eligible to Compose Capital |
| (225,161) |
| - |
| - |
Banco Santander, S.A. – Spain (2) |
| (225,161) |
| - |
| - |
(1) Banco Santander (Brasil) S.A. is indirectly controlled by Banco Santander Spain, through its subsidiary Grupo Empresarial Santander, S.L. and Sterrebeeck B.V.
(2) Refers to the Company's subsidiaries (Banco Santander, S.A .- Spain).
(3) Refers the profit on disposal of the company MS Participações.
(4) Refers the profit on disposal of the company Santander Brasil Asset Management.
(5) Refers the profit on disposal of the company Santander Securities Services Brasil DTVM S.A.
(6) In February, 2016 the Cia de Crédito, Financiamento e Investimentos Renault was acquired by Banco RCI Brasil.
47. Risk management
Risk management at Banco Santander is based on the following principles:
A. Independence of the management activities related to the business;
B. Involvement of the Senior Management in decision-making;
C. Consensus in the decision making on credit operations between the Risk and Business departments;
D. Collegiate decision-making, which includes the branch network, aiming to encourage diversity of opinions and avoiding the attribution of individual decisions;
E. The use of statistical tools to estimate default, which includes internal rating, credit scoring and behavior scoring, RORAC (Return on Risk Adjusted Capital), VaR (Value at Risk), economic capital, scenario assessment, among others;
F. Global approach, which an integrated treatment of risk factors in the business departments and the concept of economic capital as a consistent metric for risk undertaken and for business management;
G. Common management tools
H. Organizational structure
I. Scopes and responsibilities
J. Risk limitation
K. Recognition
L. Effective information channel
M. Maintenance of a medium-low risk profile, and low volatility by:
• The portfolio diversification, limiting concentration in clients, groups, sectors, products or geographically speaking; the complexity level of market operations reduction; the analysis of social and environmental risks of businesses and projects financed by the bank; continuous follow up to prevent the portfolios from deteriorating.
• Policies and procedures definition that are part of the Regulatory Framework Risk, which regulates the risk activities and processes. They follow the instructions of the Board of Directors, the regulations of the BACEN and the international best practices in order to protect the capital and ensure business' profitability.
At Banco Santander, the risk management and control process is structured using as reference the framework defined at corporate level and described according to the following phases:
I. Adaptation of corporate management frameworks and policies that reflect Banco Santander’s risk management principles.
Within this regulatory framework, the Corporate Risk Management Framework, regulates the principles and standards governing Banco Santander´s risk activities, based on the corporate organization and a management models, meeting the necessary regulatory requirements for credit management.
The organizational model comprises the management map, which defines the risk function and governance, and the regulatory framework itself.
II. Identification of risks through the constant review and monitoring of exposures, the assessment of new products, businesses and deals (singular transactions);
III. Risks measurement using methods and models periodically tested.
IV. Preparation and distribution of a complete set of reports that are reviewed daily by the heads at all levels of Banco Santander management.
V. Implementation of a risk control system which checks, on a daily basis, the degree to which the Bank´s risk profile matches the risk policies approved and the risk limits set. The most noteworthy corporate tools and techniques (aforementioned) already in use at Banco Santander are in different stages of maturity regarding the level of implementation and use in the Bank. For wholesale segment, these techniques are in line with the corporate level development. For local segments, internal ratings and scorings based models, VaR and market risk scenario analysis and stress testing were already embedded in risk management routine while Expected loss, Economic Capital and RORAC have been integrated in risk management.
VI. Internal ratings- and scorings-based models which, by assessing the various qualitative and quantitative risk components by client and transaction, making it possible to estimate, firstly, the probability of default and, subsequently, the expected loss, based on Loss Given Default (LGD) estimates.
VII. Economic capital, as a homogeneous measurement of the assumed risk and the basis for the measurement of the performance management.
VIII. RORAC, used both as a transaction pricing tool in the whole sale segment (more precisely in global ranking and markets - bottom-up approach) as for in the analysis of portfolios and units (top-down approach).
IX. VaR, which is used for controlling and setting the market risk limits for the various treasury portfolios.
X. Scenario analysis and stress testing to supplement the analysis market and credit risk in order to assess the impact of alternative scenarios, even over provisions and capital.
Consolidated Financial Statements - December 31, 2018 118
a) Corporate Governance of the Risk Function
The structure of Banco Santander’s Risk Committee is defined in accordance with the highest standards of prudent management, while respecting local legal and regulatory environment.
Its main responsibilities are:
A. Integrate and adapt the Bank's risk to local level, further than the risk management strategy, tolerance level and predisposition to the risk, previously approved by the executive committee and board of directors, all matched with corporate standards of Banco Santander Spain;
B. Approve the proposals, operations and limits of clients and portfolio;
C. Regularly monitor all the risks inherent to the business, proving if your profile is adequate to what was established in the risk appetite.
D. Authorize the use of management tools and local risk models and being aware of the result of their internal validation.
E. Keeping updated, assessing and monitoring any observations and recommendations periodically formulated by the supervisory authorities regarding their functions.
The organizational structure of the executive vice-presidency consists of areas which are responsible for credit risk management, market and structural, operational and risk model. The credit risk management structure is composed by directors who act from the point of view of retail and wholesale portfolios management. A specific area has the mission to consolidate the portfolios and their respective risks, supporting the management with the integrated risk vision. In addition to this task, it is also responsible for the attendance to regulators, external and internal auditors, as well as the Group's headquarters in Spain.
It has a department called risk architecture, which includes a set of transverse functions of all risk factors necessary for the construction of an advanced management model. Methodology (development, parameterization models that reach all areas of risk), Governance, Policy and Risk Culture, Capital, Stress Test and Risk MI (responsible for the generation, exploitation and dissemination of information beyond the project information systems) are areas part of this structure.
Further details of the structure, methodologies and control system related to risk management is described in the report available on the website www.santander.com.br.
b) Credit Risk
b.1) Introduction to the treatment of credit risk
The Credit Risk Management provides subsidies to define strategies as risk appetite, to establish limits, including exposure analysis and trends as well as the effectiveness of the credit policy. The goal is to maintain a risk profile and adequate minimum profitability to offset the estimated default, both client and portfolio, as defined by the Executive Committee and Board of Directors. Additionally, it is responsible for the risk management systems applied in the identification, measurement, control and reduction of exposure to risk in individual or clustered by similar operations.
The Risk Management is specialized according to each clients' characteristics, being segregated between individual clients (with the accompanied of dedicated analysts) and customers with similar characteristics (standardized).
• Individualized management: It is performed by a defined risk analyst, which prepares the analysis, and forwards it to the Risk Committee and monitors the client's progress. It covers the Wholesale segment clients (Corporate and GB&M), Retail (Companies 3 and Governments, Institutions and Universities);
• Standardized management: Aimed at individuals and companies not classified as individualized clients. Based on automated models of decision-making and internal risk assessment, complemented by commercial heave and analysts specialized teams to handle exceptions.
Macroeconomic aspects and market conditions, sectored and geographical concentration, as well as client profiling and economic prospects are also evaluated and considered in the appropriate measuring of credit risk.
b.2) Measures and measurement tools
Rating tools
The Bank uses proprietary internal rating models to measure the credit quality of a given customer or transaction. Each rating relates to a certain probability of default or non-payment, determined on the basis of the customer's historical experience, to predict default. Rating/Scores models are used in the Bank’s loan approval and risk monitoring process.
The classification of loans into different categories is made according to the analysis of economic and financial situation of the client and any other registratered information updated frequently. New modes of operation are subject to credit risk evaluation, verification and adaptation to the controls adopted by the Bank.
Ratings assigned to customers are reviewed periodically to include any new financial information available and the experience in the Banking relationship. The frequency of the reviews is increased in case of customers that reach certain levels in the automatic warning systems and of customers classified as requiring special monitoring. The own rating tools are reviewed to qualifications by them awarded are progressively enhanced.
Credit risk parameters
The estimative of the risk parameters Probability of Default (PD) and Loss Given Default (LGD) are based on internal experience, i.e. on default observations and on the experience in defaulted loan recoveries during a defined credit cycle.
For low risk portfolios, such as banks, sovereign risk or global wholesale clients, the parameters are based on CDS market data and with global broadness, using Group Santander´s world presence.
For the other portfolios, parameter estimative are based on the Bank’s internal experience.
In addition to the Probability of Default (PD), the Bank is managing its credit portfolio, seeking to make loans to borrowers that have higher volumes of guarantees associated with the operations and also works constantly on strengthening its credit recovery department. These and other actions combined, are responsible for ensuring the adequacy of LGD parameters (Loss Given Default, the loss resulting from the borrower's default event to honor the principal and/or interest payments).
LGD calculation is based on net losses of non-performing loans, considering the guarantees associated with the transaction, revenues and expenses related to the recovery process and also the timing default.
Besides that , the Loss identification period, or “LIP,” is also considered in the estimation of the risk parameters that is represented by the time period between the occurrence of a loss event and the identification of an objective evidence of this loss. In other words, it represents the time horizon from the credit loss occurrence until the effective confirmation of such loss.
The Bank use proprietary internal rating models to measure the credit quality of a given client or transaction. Each rating relates to a certain probability of default or non-payment, determined on the basis of the client's history, with the exception of certain portfolios classified as “low default portfolios”. These ratings and models are used in loan approval and risk monitoring processes.
The table shown in note 9.b shows the portfolio by the internal risk rating levels and their probability of default.
Thousand of reais |
| 2018 |
| 2017 |
| 2016 |
|
|
|
|
|
|
|
By maturity |
|
|
|
|
|
|
Less than 1 Year |
| 186,373,511 |
| 174,247,968 |
| 161,664,232 |
Between 1 and 5 years |
| 99,309,551 |
| 82,513,030 |
| 79,356,369 |
More than 5 years |
| 36,250,128 |
| 31,068,215 |
| 27,416,955 |
Loans and advances to customers, gross |
| 321,933,190 |
| 287,829,213 |
| 268,437,556 |
|
|
|
|
|
|
|
By internal classification of risk |
|
|
|
|
|
|
Low |
| 240,440,294 |
| 226,098,497 |
| 207,889,639 |
Medium-low |
| 50,485,682 |
| 33,635,378 |
| 32,104,168 |
Medium |
| 11,967,262 |
| 10,423,293 |
| 10,940,879 |
Medium-High |
| 7,722,198 |
| 8,215,024 |
| 6,976,969 |
High |
| 11,317,754 |
| 9,457,021 |
| 10,525,901 |
Loans and advances to customers, gross |
| 321,933,190 |
| 287,829,213 |
| 268,437,556 |
Consolidated Financial Statements - December 31, 2018 119
To the portfolios which the Bank presents limited historic data, reference external information are used to complement internal available data. The portfolios for which reference external information represent significant data to measure the expected credit losses are present below.
|
|
|
|
|
|
| 2018 |
|
|
|
|
|
|
|
|
|
|
| Exposure |
| Probability of default |
| Default loss |
| Commercial and industrial |
| 146,293,616 |
| 8% |
| 42% |
| Real Estate Credit - construction |
| 36,515,352 |
| 4% |
| 12% |
| Individual loans |
| 137,287,593 |
| 8% |
| 64% |
| Leasing |
| 1,836,629 |
| 5% |
| 32% |
The exposure above are related to the credit operations. The Bank understands that the exposure related to the avals and sureties and other financial assets at amortized cost have low risk.
b.3) Observed loss: measures of credit cost
The Bank monthly estimate losses related to credit risk and then we compare those estimates with actual losses of the month. Periodically conduct tests in order to monitor and maintain control over credit risk.
To complement the use of admission and rating, the Bank use other measures that supports the prudent and effective management of credit risk, based on the loss observed.
The cost of credit is measured by the sum of credit losses and to the average loans portfolio of the same year.
b.4) Credit risk cycle
Banco Santander has a global view of its credit portfolio throughout the various phases of the risk cycle, with a level of detail that allows us to evaluate the current situation of risk and any movements. This mapping is followed by the Board of Directors and the Executive Committee of the bank that no only sets policies and risk procedures, limits and delegates responsibilities. It also approves and supervises the activities of the area.
The risk management process consists of identifying, measuring, analyzing, controlling, negotiating and deciding on, as appropriate, the risks incurred in the Bank’s operations and companies of the conglomerate. The risk cycle comprises three different phases:
• Pre-sale: this phase includes the risk planning and setting targets, determination of the Bank’s risk appetite, approval of new products, risk analysis and credit rating process, and limit setting.
• Sale: this is the decision-making phase for both pre-classified and specific transactions.
• Post-sale: this phase comprises the risk monitoring, measurement and control processes and the recovery process.
Planning and setting risk limits
Risk limit setting is a dynamic process that identifies Banco Santander’s risk appetite by assessing business proposals and its risk attitude. This process is defined through the risk appetite approved by the Bank's Management and the units.
In the case of individualized risks, the most basic level is the customer, for which individual limits are set.
For GCB clients, a pre-classification model is used based on a system of measurement and monitoring of economic capital. In relation to the Corporate segment, the operational limit model is used in maximum nominal credit amounts.
To the risks of customers with standardized management, the limits of the portfolios are planned using credit management programs (SGP) agreed document for the areas of business and risks, and approved by the Executive Committee. This document contains the results expected for the business in terms of risk and return, beyond the limits which govern the activity and risk management. This client group has a more automated treatment in risks.
Risk analysis and rating process
Risk analysis is a pre-requisite for the approval of loans to clients by the Bank. This analysis consists of examining the counterparty’s ability on meeting its contractual obligations to the Banco Santander, which involves analyzing the client’s credit quality, its risk transactions, solvency, and sustainability of business and the return to be obtained in view of the risk assumed.
The risk analysis is conducted annually, at least, and can be held shortly when client profile indicates (through systems with centralized alerts, managers visits to clients or specific credit analysis), or when operations are not covered by pre-classification.
Decision-Making on Operations
The process of decision making on operations aims to analyze and adopt adopt in accordance with pre-established policies, taking into account risk appetite and any elements of the operation that are important in assessing risk and return.
The Banco Santander uses, among others, the RORAC methodology (profitability on risk-adjusted capital), for risk analysis and pricing in the decision-making process on transactions and deals.
Risk monitoring and control
The preventive detection of the operation’s credit quality is from the commercial manager responsibility in conjunction with the risk analyst. Additionally, the risk monitoring is made through a permanent observation process in order to anticipate the identification of incidents which can occur in the evolution of the operations, clients and environment.
This monitoring process may result in the client’s classification in SCAN. This is a system which allows the differentiation of the management level and the action to be taken case-by-case.
Consolidated Financial Statements - December 31, 2018 120
Risk control function
The control function is performed by assessing risks from various complementary perspectives, the main pillars are the control by geographical location, business area, management model, product and process, facilitating thus the detection of specific areas requiring measures for which decisions should be taken. To obtain an overview of the bank's loan portfolio over the various phases of the credit cycle, with a level of detail that allows the assessment of the current risk situation and any movements.
Any changes in the Bank’s risk exposure are controlled on an ongoing and systematic basis. The impacts of these changes in certain future situations, both of an exogenous nature and those arising from strategic decisions, are assessed in order to establish measures that place the profile and amount of the loss portfolio within the parameters set by Executive Commission.
b.5) Credit recovery
"Strategies and action channels are defined according to the days of past due loans and the amounts, that result in a Map of Responsibilities and always look as the first alternative, the client's recovery.
The Bank uses tools as behavioral scoring to study the collection performance of certain groups, in order to reduce costs and increase recoveries. These models seek to measure the probability of clients becoming overdue adjusting collection efforts so that clients less likely to recover, receive timely actions. In cases the payments is most likely to happen, the focus is given in maintaining a healthy relationship with clients. All clients with severe or rescheduled credits delays values have internal restrictions.
Clients with high risk index have a model of recovery, with a commercial follow-up and a recovery specialist.
b.6) Credit risk from other perspective
Certain areas and specific views of credit risk deserve a specialist’s attention, complementary to global risk management.
Concentration risk
Concentration risk is an essential factor in the area of credit risk management. The Bank constantly monitors the degree of concentration of its credit risk portfolios, by geographical area/country, economic sector, product and client group.
The risk committee establishes the risk policies and reviews the exposure limits required to ensure adequate management of credit risk portfolio concentration.
From the sectorial standpoint, the distribution of the corporate portfolio is adequately diversified.
The Bank’s Risk Area works closely with the Finance Area in the active management of credit portfolios, which includes reducing the concentration of exposures through several techniques, such as the arrangement of credit derivatives for hedge purposes or the performance of securitization transactions, in order to optimize the risk/return ratio of the total portfolio.
Credit risk from financial market operations
This heading includes the credit risk arising in treasury operations with clients, mainly credit institutions. These operations are performed both via money market financing products with different financial institutions and via derivative instruments arranged for the purpose of serving our clients.
Risk control is performed using an integrated, real-time system that enables the Bank to know at any time the unused exposure limit with respect to any counterparty, any product and maturity and at any Bank unit.
Credit risk is measured at its current market value and its potential value (exposure value considering the future variation in the underlying market factors). Therefore, the equivalent credit risk (CRE) is defined as the sum of net replacement value plus the maximum potential value of the contracts in the future.
Environmental risk
The Banco Santander's Social and Environmental Responsibility Policy (PRSA), which follows the guidelines of CMN Resolution 3232/2014 and the SARB Regulation Nº. 14 of Febraban, establishes guidelines and consolidates specific policies for socio-environmental practices in business and in relationships with stakeholders. These practices include the management of socio-environmental risks, impacts and opportunities related to topics such as adequacy in credit granting and use, supplier management and socio-environmental risk analysis, which is carried out through the analysis of clients' socio-environmental practices. and Varejo, of the Corporate segment 3 (one of the Corporate Retail segments of the Bank), which have limits or credit risk above R $ 5 million and which are part of the 14 socio-environmental care sectors. In this case, the socio-environmental risk is analyzed in order to mitigate the issues of operational risk, capital risk, credit risk and reputational risk. Since 2009, Santander has been a signatory to the Equator Principles and this set of guidelines is used to mitigate socio-environmental risks in the financing of large projects.
The commitments assumed in the PRSA are detailed in other Bank policies, such as the Anti-Corruption Policy, Supplier Relationships and Homologation Policies and Social and Environmental Risk Policies, as well as the Private Social Investment Policy, which aims to guide the strategy in this area. and to present guidelines for social programs that strengthen this strategy.
b.7) Credit Management - Main changes
The trends observed in 2018 were consistent with those of 2017, where in a challenging economic scenario, the Bank model proved to be effective. The Bank was able to preserve the good quality of the business and did not present large variations in its default rate. In December 2018, this index was 7.0% against 6.6%, on December 31, 2017 and 7.0% on December 31, 2016.
This income was possible thanks to a combination of factors. Among them, a credit mix with focus on safer lines; partnerships; a deep knowledge and monitoring of the client’s financial life; and the deployment of strong debt renegotiation campaigns.
The involvement of senior management in decision making (held collectively at our Committees), besides independence Risks relating to the business, allow more assertive decisions and credit risk reduction.
The analysis of credit for projects and companies in the Wholesale segment, continue to integrate opinions of our area of Environmental Risk.
Below is a table showing the evolution of the main credit indicators.
|
| 2018 |
| 2017 |
| 2016 |
|
|
|
|
|
|
|
Credit risk exposure - customers (Thousand of Reais) |
| 364,193,664 |
| 330,474,249 |
| 301,702,586 |
Loans and advances to customers, gross (note 9) |
| 321,933,190 |
| 287,829,213 |
| 268,437,556 |
Contingent Liabilities - Guarantees and other sureties (note 44.a) |
| 42,260,474 |
| 42,645,036 |
| 33,265,030 |
Non-performing loans ratio (%) - unaudited |
| 6.98% |
| 6.65% |
| 7.04% |
Impairment coverage ratio (%) - unaudited |
| 102.42% |
| 95.39% |
| 96.31% |
Specific credit loss provisions, net of RAWO (*) (Thousand of Reais) - unaudited | 22,969,315 |
| 18,261,638 |
| 18,191,126 | |
Cost of credit (% of risk) - unaudited |
| 3.90% |
| 3.98% |
| 4.52% |
Data prepared on the basis of management criteria and the accounting criteria of the controller unit. |
|
| ||||
(*) RAWO = Recoveries of Assets Derecognized. | ||||||
The Bank incorporates information about the future both in its assessment if the credit risk of an instrument has increased substantially since the initialrecognition and in its measurement of the expected credit losses. Based on guidance from its internal committees and economic experts and considering a range of actual and anticipated external information, the Bank develops a base scenario as well as other possible scenarios. This process involves the projection of two or more additional economic scenarios and considers the respective probabilities of each result. External information includes economic data and forecasts published by government agencies and monetary authorities and selected private sector analysts and academics.
Consolidated Financial Statements - December 31, 2018 121
The base case represents the most likely result and is in line with the information used by the Bank for other purposes, such as strategic planning and budgeting. The other scenarios represent more optimistic and pessimistic results. Periodically, the Bank conducts more extreme stress tests to adjust its determination of these other representative scenarios.
The Bank identified and documented the main determinants of credit risk and credit losses for each portfolio of financial instruments and, using a historical data analysis, estimated the relationships between macroeconomic variables and credit risks and credit losses.
|
| 2018 |
|
|
|
| Unemployment rates | 11.4% |
| Interest Rates | 6.5% |
| increase in GDP | 1.8% |
The expected relation between key-indicators and default rates and several financial assets losses were predicted based on the historic analysis data of recent years.
c) Market Risk
Market risk is the exposure to risks such as interest rates, exchange rates, prices of goods, prices in the stock market and others values, according to the type of product, volume of operations, term and conditions of the agreement and underlying volatility.
The Bank operates according to global policies, within the Group’s risk tolerance level, aligned with the objectives in Brazil and in the world.
With this purpose, it has developed its own Risk Management model, according to the following principles:
· Functional independence;
· Executive capacity sustained by knowledge and proximity with the client;
· Global reach of the function (different types of risks);
· Collective decision-making, that evaluates a variety of possible scenarios and do not compromise the results with individual decision (including Brazil Executive Risk Committee - Comitê Executivo de Riscos Brasil). This Comitee delimits and approves the operations. The Asset and Liabilities Committee, which responds for the capital management and structural risks, including country-risk, liquidity and interest rates.
· Management and improvement of the equation risk/return; and
· Advanced methodologies for risk management, such as Value at Risk – VaR (historical simulation of 521 days with a confidence level of 99% and time horizon of one day), scenarios, financial margin sensibility, equity value and contingency plan.
The Market Risks structure is part of the Vice Presidency of Credit and Market Risks, an independent area that applies risk policies taking into consideration the guidelines of the Board of Directors and the Risks Division of Santander in Spain.
c.1) Activities subject to market risk
The measurement, control and monitoring of the market risk area comprises all operations in which net worth risk is assumed. This risk arises from changes in the risk factors –interest rate, exchange rate, equities, commodity prices and the volatility thereof– and from the solvency and liquidity risk of the various products and markets in which the Bank operates.
The activities are segmented by risk type as follows:
I. Trading: this item includes financial services for clients, trading operations and positioning mainly in fixed-income, equity , foreign currency products and shares.
II. Balance sheets management: A risk management assessment aims to give stability to interest income from the commercial and economic value of the Bank, maintaining adequate levels of liquidity and solvency. The risk is measured by the balance sheets exposure to movements in interest rates and level of liquidity.
III. Structural risks:
· Structural foreign currency risk/hedges of results: foreign currency risk arising from the currency in which investments in consolidable and non-consolidable companies are made (structural exchange rate). This item also includes the positions taken to hedge the foreign currency risk on future results generated in currencies other than the Real (hedges of results).
· Structural equities risk: this item includes equity investments in non-consolidated financial and non-financial companies that give rise to equities risk.
The Financial Management area is responsible for the balance sheet management risk and structural risks through the application of uniform methodologies adapted to the situation of each market in which the Bank operates. Thus, in the convertible currencies area, Financial Management directly manages the Parent's risks and coordinates the management of the other units operating in these currencies. Decisions affecting the management of these risks are taken through the ALCO (Asset Liability Control committees) in the respective countries.
The Financial Management goal is to ensure the stability and recurring nature of both the net interest margin of the commercial activity and the Bank’s economic value, whilst maintaining adequate liquidity and solvency levels.
Each of these activities is measured and analyzed using different tools in order to reflect their risk profiles as accurately as possible.
Interest rate Risk
The following table aggregates by product the cash flows of the operations of our perimeter of companies that have interest income. The transactions are presented by the book balance at the closing date of the years 2018, 2017 and 2016. It is not associated with the risk management of changes in interest rates or indexer mismatches, which is done by monitoring metrics of Marketplace. However, it allows to evaluate the concentrations of term and possible risks and below it, the balances of the same products are presented at the redemption value at maturity, except for the line dealing with receivables and obligations linked to derivative contracts.
Consolidated Financial Statements - December 31, 2018 122
|
|
|
|
|
|
|
|
|
|
| 2018 | ||
Position of accounts subject to interest rate risk |
|
|
|
|
| In millions of Reais | |||||||
|
|
| 0 to 30 days |
| 31 to 180 days |
| 181 to 365 days |
| 1 to 5 years |
| Above 5 years |
| Total |
|
|
|
|
|
|
|
|
|
|
|
|
|
|
Interest-earning assets: |
|
|
|
|
|
|
|
|
|
|
| ||
|
|
|
|
|
|
|
|
|
|
|
|
|
|
| Financial Assets Held For Trading | 8,193 |
| 6,155 |
| 12,013 |
| 67,606 |
| 25,964 |
| 119,931 | |
| Debt instruments | 5,359 |
| 5,192 |
| 8,294 |
| 58,363 |
| 23,460 |
| 100,668 | |
| Equity instruments | 807 |
| - |
| - |
| - |
| - |
| 807 | |
| Trading derivatives | 2,027 |
| 963 |
| 3,719 |
| 9,243 |
| 2,504 |
| 18,456 | |
| Other Financial Assets At Fair Value Through Profit Or Loss | 677 |
| 9,091 |
| 368 |
| 16,702 |
| 3,577 |
| 30,415 | |
| Debt instruments | 379 |
| 9,091 |
| 368 |
| 16,702 |
| 3,577 |
| 30,117 | |
| Equity instruments | 298 |
| - |
| - |
| - |
| - |
| 298 | |
| Non-Current Assets Held For Sale | 24 |
| 521 |
| 89 |
| 3,603 |
| 3,826 |
| 8,063 | |
| Reserves from Brazilian Central Bank | 70,103 |
| - |
| - |
| - |
| - |
| 70,103 | |
| Loans and Receivables | 27,387 |
| 101,441 |
| 35,900 |
| 85,318 |
| 60,966 |
| 311,012 | |
| Total |
| 106,384 |
| 117,208 |
| 48,370 |
| 173,229 |
| 94,333 |
| 539,524 |
|
|
|
|
|
|
|
|
|
|
|
|
|
|
Interest-bearing liabilities: |
|
|
|
|
|
|
|
|
|
|
| ||
|
|
|
|
|
|
|
|
|
|
|
|
|
|
| Deposits from credit institutions | 200,818 |
| 47,172 |
| 65,606 |
| 71,413 |
| 5,343 |
| 390,352 | |
| Subordinated debts | 9,857 |
| - |
| - |
| - |
| 9,687 |
| 19,544 | |
| Marketable debt securities | 13,353 |
| 20,875 |
| 14,612 |
| 30,138 |
| 9,715 |
| 88,693 | |
| Trading derivatives | 1,104 |
| 1,370 |
| 3,257 |
| 9,673 |
| 3,322 |
| 18,726 | |
| Short positions | 32,440 |
| - |
| - |
| - |
| - |
| 32,440 | |
| Total |
| 257,572 |
| 69,417 |
| 83,475 |
| 111,224 |
| 28,067 |
| 549,755 |
|
|
|
|
|
|
|
|
|
|
|
|
|
|
|
|
|
|
|
|
|
|
|
|
| 2017 | ||
Position of accounts subject to interest rate risk |
|
|
|
|
| In millions of Reais | |||||||
|
|
| 0 to 30 days |
| 31 to 180 days |
| 181 to 365 days |
| 1 to 5 years |
| Above 5 years |
| Total |
|
|
|
|
|
|
|
|
|
|
|
|
|
|
Interest-earning assets: |
|
|
|
|
|
|
|
|
|
|
| ||
|
|
|
|
|
|
|
|
|
|
|
|
|
|
| Financial Assets Held For Trading | 5,541 |
| 1,779 |
| 6,556 |
| 29,968 |
| 10,194 |
| 54,038 | |
| Debt instruments | 653 |
| 890 |
| 5,739 |
| 16,709 |
| 8,148 |
| 32,139 | |
| Equity instruments | 490 |
| - |
| - |
| - |
| - |
| 490 | |
| Trading derivatives | 4,398 |
| 889 |
| 818 |
| 13,259 |
| 2,046 |
| 21,410 | |
| Available-For-Sale Financial Assets | 2,032 |
| 1,272 |
| 17,092 |
| 46,502 |
| 23,711 |
| 90,609 | |
| Debt instruments | 925 |
| 1,272 |
| 17,092 |
| 46,502 |
| 23,711 |
| 89,503 | |
| Equity instruments | 1,107 |
| - |
| - |
| - |
| - |
| 1,107 | |
| Other Financial Assets At Fair Value Through Profit Or Loss | 72 |
| 13 |
| 50 |
| 479 |
| 1,008 |
| 1,622 | |
| Debt instruments | 38 |
| 13 |
| 50 |
| 479 |
| 1,008 |
| 1,589 | |
| Equity instruments | 33 |
| - |
| - |
| - |
| - |
| 33 | |
| Non-Current Assets Held For Sale | 80 |
| 168 |
| 222 |
| 3,082 |
| 7,040 |
| 10,593 | |
| Reserves from Brazilian Central Bank | 59,051 |
| - |
| - |
| - |
| - |
| 59,051 | |
| Loans and Receivables | 22,033 |
| 81,275 |
| 34,430 |
| 86,645 |
| 71,453 |
| 295,835 | |
| Total |
| 88,809 |
| 84,507 |
| 58,351 |
| 166,677 |
| 113,406 |
| 511,750 |
|
|
|
|
|
|
|
|
|
|
|
|
|
|
Interest-bearing liabilities: |
|
|
|
|
|
|
|
|
|
|
| ||
|
|
|
|
|
|
|
|
|
|
|
|
|
|
| Deposits from credit institutions | 150,719 |
| 46,254 |
| 62,605 |
| 69,778 |
| 5,119 |
| 334,474 | |
| Subordinated debts | - |
| 789 |
| 257 |
| 7,784 |
| - |
| 8,829 | |
| Marketable debt securities | 4,436 |
| 36,208 |
| 12,313 |
| 15,544 |
| 847 |
| 69,348 | |
| Trading derivatives | 4,618 |
| 659 |
| 504 |
| 12,243 |
| 2,285 |
| 20,310 | |
| Short positions | 32,531 |
| - |
| - |
| - |
| - |
| 32,531 | |
| Total |
| 192,304 |
| 83,909 |
| 75,679 |
| 105,349 |
| 8,251 |
| 465,492 |
|
|
|
|
|
|
|
|
|
|
|
|
|
|
|
|
|
|
|
|
|
|
|
|
| 2016 | ||
Position of accounts subject to interest rate risk |
|
|
|
|
| In millions of Reais | |||||||
|
|
| 0 to 30 days |
| 31 to 180 days |
| 181 to 365 days |
| 1 to 5 years |
| Above 5 years |
| Total |
|
|
|
|
|
|
|
|
|
|
|
|
|
|
Interest-earning assets: |
|
|
|
|
|
|
|
|
|
|
| ||
|
|
|
|
|
|
|
|
|
|
|
|
|
|
| Financial Assets Held For Trading | 26,960 |
| 5,242 |
| 4,593 |
| 31,938 |
| 14,917 |
| 83,650 | |
| Debt instruments | 20,232 |
| 2,370 |
| 2,711 |
| 23,479 |
| 10,335 |
| 59,127 | |
| Equity instruments | 397 |
| - |
| - |
| - |
| - |
| 397 | |
| Trading derivatives | 6,331 |
| 2,872 |
| 1,882 |
| 8,459 |
| 4,582 |
| 24,126 | |
| Available-For-Sale Financial Assets | 2,939 |
| 1,350 |
| 1,761 |
| 42,683 |
| 11,046 |
| 59,779 | |
| Debt instruments | 954 |
| 1,350 |
| 1,761 |
| 42,683 |
| 11,046 |
| 57,794 | |
| Equity instruments | 1,985 |
| - |
| - |
| - |
| - |
| 1,985 | |
| Other Financial Assets At Fair Value Through Profit Or Loss | 80 |
| 14 |
| 50 |
| 486 |
| 981 |
| 1,611 | |
| Debt instruments | 38 |
| 14 |
| 50 |
| 486 |
| 981 |
| 1,569 | |
| Equity instruments | 42 |
| - |
| - |
| - |
| - |
| 42 | |
| Non-Current Assets Held For Sale | 79 |
| 168 |
| 220 |
| 2,920 |
| 6,549 |
| 9,936 | |
| Reserves from Brazilian Central Bank | 58,594 |
| - |
| - |
| - |
| - |
| 58,594 | |
| Loans and Receivables | 16,435 |
| 99,924 |
| 32,590 |
| 79,467 |
| 68,120 |
| 296,536 | |
| Total |
| 105,087 |
| 106,698 |
| 39,214 |
| 157,494 |
| 101,613 |
| 510,106 |
|
|
|
|
|
|
|
|
|
|
|
|
|
|
Interest-bearing liabilities: |
|
|
|
|
|
|
|
|
|
|
| ||
|
|
|
|
|
|
|
|
|
|
|
|
|
|
| Deposits from credit institutions | 135,457 |
| 49,973 |
| 46,686 |
| 69,605 |
| 4,987 |
| 306,708 | |
| Subordinated debts | - |
| 268 |
| 255 |
| 8,260 |
| - |
| 8,783 | |
| Marketable debt securities | 6,214 |
| 40,229 |
| 33,336 |
| 23,647 |
| 495 |
| 103,921 | |
| Trading derivatives | 6,046 |
| 1,308 |
| 1,268 |
| 7,123 |
| 4,167 |
| 19,912 | |
| Short positions | 31,551 |
| - |
| - |
| - |
| - |
| 31,551 | |
| Total |
| 179,268 |
| 91,778 |
| 81,545 |
| 108,635 |
| 9,649 |
| 470,875 |
Consolidated Financial Statements - December 31, 2018 123
Currency Risk
|
|
|
|
|
| 2018 | ||
|
|
|
|
|
| In millions of Reais | ||
|
|
|
|
|
|
|
|
|
|
|
|
|
|
|
|
|
|
Asset: |
| Dollar |
| Euro |
| Others |
| Total |
|
|
|
|
|
|
|
|
|
Cash/Applications/Debt Instruments |
| 348,797 |
| - |
| - |
| 348,797 |
Loans and advances to customers |
| 4,505 |
| 155 |
| - |
| 4,660 |
Investments in Foreign Subsidiaries and Dependence |
| 45,345 |
| 3,390 |
| - |
| 48,735 |
Derivatives |
| 231,240 |
| 18,163 |
| 2,490 |
| 251,893 |
Others |
| 23,619 |
| 1,974 |
| 42 |
| 25,635 |
Total |
| 653,506 |
| 23,682 |
| 2,532 |
| 679,720 |
|
|
|
|
|
|
|
|
|
Liabilities: |
| Dólar |
| Euro |
| Outros |
| Total |
|
|
|
|
|
|
|
|
|
Funding in foreign currency |
| 390,418 |
| 462 |
| 145 |
| 391,025 |
Derivatives |
| 262,396 |
| 24,809 |
| 2,391 |
| 289,596 |
Others |
| 1,007 |
| - |
| - |
| 1,007 |
Total |
| 653,821 |
| 25,271 |
| 2,536 |
| 681,628 |
|
|
|
|
|
|
|
|
|
|
|
|
|
|
| 2017 | ||
|
|
|
|
|
| In millions of Reais | ||
|
|
|
|
|
|
|
|
|
|
|
|
|
|
|
|
|
|
Asset: |
| Dollar |
| Euro |
| Others |
| Total |
|
|
|
|
|
|
|
|
|
Cash/Applications/Debt Instruments |
| 54,380 |
| 11,684 |
| 10,377 |
| 76,442 |
Loans and advances to customers |
| 3,818 |
| 321 |
| - |
| 4,139 |
Investments in Foreign Subsidiaries and Dependence |
| 36,613 |
| 3,010 |
| - |
| 39,623 |
Derivatives |
| 262,092 |
| 45,317 |
| 9,640 |
| 317,049 |
Others |
| 46,200 |
| 13,028 |
| 6,237 |
| 65,465 |
Total |
| 403,102 |
| 73,361 |
| 26,254 |
| 502,717 |
|
|
|
|
|
|
|
|
|
Liabilities: |
| Dólar |
| Euro |
| Outros |
| Total |
|
|
|
|
|
|
|
|
|
Funding in foreign currency |
| 32,962 |
| 3,047 |
| 17 |
| 36,025 |
Derivatives |
| 277,358 |
| 54,633 |
| 9,294 |
| 341,284 |
Others |
| 93,821 |
| 15,975 |
| 17,068 |
| 126,864 |
Total |
| 404,140 |
| 73,654 |
| 26,378 |
| 504,173 |
|
|
|
|
|
|
|
|
|
|
|
|
|
|
| 2016 | ||
|
|
|
|
|
| In millions of Reais | ||
|
|
|
|
|
|
|
|
|
|
|
|
|
|
|
|
|
|
Asset: |
| Dollar |
| Euro |
| Others |
| Total |
|
|
|
|
|
|
|
|
|
Cash/Applications/Debt Instruments |
| 4,839 |
| - |
| - |
| 4,839 |
Loans and advances to customers |
| 3,485 |
| - |
| - |
| 3,485 |
Investments in Foreign Subsidiaries and Dependence |
| 34,337 |
| 2,662 |
| - |
| 36,999 |
Derivatives |
| 166,626 |
| 24,173 |
| 11,241 |
| 202,040 |
Others |
| 25,273 |
| 1,020 |
| - |
| 26,293 |
Total |
| 234,560 |
| 27,855 |
| 11,241 |
| 273,656 |
|
|
|
|
|
|
|
|
|
Liabilities: |
| Dólar |
| Euro |
| Outros |
| Total |
|
|
|
|
|
|
|
|
|
Funding in foreign currency |
| 32,255 |
| 640 |
| - |
| 32,895 |
Derivatives |
| 183,277 |
| 27,973 |
| 11,426 |
| 222,676 |
Others |
| 19,198 |
| - |
| 104 |
| 19,302 |
Total |
| 234,730 |
| 28,613 |
| 11,530 |
| 274,873 |
Consolidated Financial Statements - December 31, 2018 124
c.2) Methodologies
Trading
The Bank calculates its market risk capital requirement using a standard model provided by Bacen and the Internal Model.
The standard methodology applied to trading activities by the Banco Santander in 2018, 2017 and 2016 was the value at risk (VaR), which measures the maximum expected loss with a given confidence level and time horizon. This methodology was based on a standard historical simulation with a 99% confidence level and a one-day time horizon. Statistical adjustments were made to enable the efficient incorporation of the most recent events thatcondition the level of risk assumed.
Consolidated Financial Statements - December 31, 2018 125
Specifically, the Bank uses a time window of two years or 521 daily data obtained retrospectively from the reference date of the VaR calculation. Two figures are calculated each day, one by applying an exponential decline factor which gives a lesser weighting to more distant observations in time, and another with uniform weightings for all observations. The VaR reported is the higher of these two figures.
VaR is not the only measure. It is used because it is easy to calculate and because it provides a good reference of the level of risk incurred by the Bank. However, other measures are simultaneously being implemented to enable the Bank to exercise greater risk control in all the markets in which it operates.
One of these measures is scenario analysis, which consists of defining behavior scenarios for various financial variables and determining the impact on results of applying them to the Bank’s activities. These scenarios can replicate past events (such as crisis) or, conversely, determine plausible scenarios that are unrelated to past events. A minimum of three types of scenarios are defined (plausible, severe and extreme) which, together with VaR, make it possible to obtain a much more complete view of the risk profile.
The positions are monitored daily through an exhaustive control of changes in the portfolios, aiming to detect possible incidents and correct them immediately. The daily calculation of the result is also an excellent indicator of the risk, as it allows the Bank to observe and detect the impact of changes in financial variables in the portfolios.
Lastly, due to their atypical nature, derivatives and credit trading management (actively traded credit – Trading Book) activities are controlled by assessing specific measures on a daily basis. In the case of derivatives, these measures are sensitive to fluctuations in the price of the underlying (delta and gamma), in volatility (vega) and in time (theta). For credit trading management activities, the measures controlled include sensitivity to spread, jump-to-default and position concentrations by rating level.
In respect to the credit risk inherent in the trading portfolios (Credit Trading portfolios), and in keeping with the recommendations made by the Basel Committee of Banking Supervision, an additional measure has been introduced, the Incremental Risk Charge (IRC), in order to cover the default risk which is not properly captured in the VaR, through the variation of the related market prices of credit spreads. The instruments affected are basically fixed-income bonds, , derivatives on bonds (forwards, options, etc.) and credit derivatives (credit default swaps, asset-backed securities, etc.). The method used to calculate the IRC, is defined globally at Group level.
c.3) Balance-sheet management
Interest rate risk
The Bank analyses the sensitivity of the net interest margin and market value of equity to changes in interest rates. This sensitivity arises from maturity and interest rate repricing gaps in the various balance sheets items.
On the basis of the balance-sheets interest rate position, and considering the market situation and outlook, the necessary financial measures are adopted to align this position with that desired by the Bank. These measures can range from the taking of positions on markets to the definition of the interest rate features of commercial products.
The measures used by the Bank to control interest rate risk in these activities are the interest rate gap, the sensitivity of net interest margin (NIM) and market value of equity (MVE) to changes in interest rates, the duration of capital, value at risk (VaR), the EaR (Earning At Risk) and scenario analysis.
Interest rate gap of assets and liabilities
The interest rate gap analysis focuses on the mismatches between the reevaluation deadlines of on-balance-sheets assets and liabilities and off-balance-sheets items. This analysis facilitates a basic snapshot of the balance sheet structure and enables concentrations of interest rate risk in the various maturities to be detected. Additionally, it is a useful tool for estimating the possible impact of potential changes in interest rates on the entity's net interest margin and market value of equity.
The flows of all the on and off-balance sheet headings must be broken down and placed at the point of repricing or maturity. The duration and sensitivity of contracts that do not have a maturity date they are analyzed and estimated using an internal model.
Net interest margin (NIM) sensitivity
The sensitivity of the net interest margin measures the change in the expected accruals for a specific period (12 months) given a shift in the interest rate curve.
The sensitivity of the net interest margin is calculated by simulating the margin both for a scenario of changes in the interest rate curve and for the current scenario. The sensitivity is the difference between the two margins calculated.
Market value of equity (MVE) sensitivity
The sensitivity of the market value of equity is a complementary measure to the sensitivity of the net interest margin.
This sensitivity measures the interest rate risk implicit in the market value of equity based on the effect of changes in interest rates on the present values of financial assets and liabilities.
Value at risk (VaR) and Earnings at Risk (EaR)
It is defined with 99% base points of the MVE’s loss distribution function, calculated considering the market value of the positions, based on the payback obtained in the last two years and with degree of statistical certainty (level of trust) to a defined time horizon.
It is also applied a similar methodology to calculate the maximum loss in NII (EaR), in order to consider the interest rate risk even in economic value impact as in financial margin.
The unit sums the return vectors of the VAR with the return vectors of EaR, resulting the total return vector. The composition is made considering in the metric of EaR the losses in financial margin that occur between the initial moment (reference date) and the holding period of the not-trading portfolio. The losses in the economic value takes in consideration the impact of the ending positions after the holding period.
c.4) Liquidity risk
Liquidity risk is associated with the Bank's ability to finance purchase commitments at reasonable market prices and to carry out its business plans with stable sources of financing.
Consolidated Financial Statements - December 31, 2018 126
Liquidity Management of Santander Bank
For the control and liquidity management, the bank Santander uses short and long-term metrics and stress metrics that are capable of measuring the safe liquidity buffer so that the bank comfortably honors its obligations to the market and shareholders.
Then, we can cite:
Short-term metrics and liquidity stress:
a.LCR
The Santander Bank uses the Liquidity Coverage Ratio (LCR) in its liquidity risk management. LCR is a short-term index for a 30 days stress scenario, results from the division of high quality assets and net outflows in 30 days.
The Total High Liquidity Assets – HQLA is composed mainly of Brazilian federal government bonds and compulsory returns. The net outflows are composed mainly of losses of deposits, offset in part by inflows, mainly loans.
b.Liquidity stress scenarios:
The Liquidity management requires the analysis of financial scenarios in which potential problems whit liquidity are assessed, for which is necessary to construct and study scenarios in crisis situations. The model used for this analysis is the Stress Test
The stress test evaluate the financial structure of the institution and its capacity to resist and react to more extreme situations.
The purpose of the Liquidity Stress Test is to allow the simulation of adverse market conditions, making it possible to evaluate the impacts on the institution´s liquidity and ability to payments, in order to anticipate the solutions or even avoid positions that excessively liquidity in stress scenarios.
The scenarios are define from the analysis of market behavior during previous crisis, as well as future estimates. Four crisis scenarios are develop, with different intensities.
From the stress models analysis, the concept of minimum liquidity was define, which is sufficient to support liquidity losses for a determined day horizon in all simulated crisis scenarios.
Long-term metrics
Its objective is to measure the stability of sources of financing against the assets committed. The NSFR Metrics developed by BIS and adapted by the local regulator, which objective through determined percentages, to verify if the institution has stable source of funding to sustain its assets. This metrics has different weights by term and even with deployment in 2019, is calculate quarterly by the institution.
This metric has different weights by term and even with deployment in 2019, is calculate quarterly by the institution.
c.Liquidity indicators
For to help management, some liquidity indicators are calculated on a monthly like a Concentration indexes of counterparties and by segments.
Clients Funding
The Bank has different funding sources, both in products and mix of clients, with a healthy distribution between the segments. The total of clients resources is currently in R$ 395 billion and presented an increase comparing with 2017 amount, highlighting the increasing of time deposit funding and the keeping of financial letters inventory.
|
|
|
|
|
|
|
|
|
| In millions of Reais | ||
Customers Funding |
| 2018 |
| 2017 | ||||||||
|
| 0 a 30 days |
| Total |
| % |
| 0 a 30 days |
| Total |
| % |
Demand deposits |
| 18,854 |
| 18,854 |
| 100% |
| 15,252 |
| 15,252 |
| 100% |
Savings accounts |
| 46,068 |
| 46,068 |
| 100% |
| 40,570 |
| 40,570 |
| 100% |
Time deposits |
| 49,771 |
| 190,971 |
| 26% |
| 39,549 |
| 170,570 |
| 23% |
Interbank deposit |
| 863 |
| 4,118 |
| 21% |
| 622 |
| 3,244 |
| 19% |
Funds from acceptances and issuance of securities | 3,681 |
| 70,110 |
| 5% |
| 4,436 |
| 69,348 |
| 6% | |
Borrowings and Onlendings |
| 5,181 |
| 45,936 |
| 11% |
| 5,606 |
| 48,304 |
| 12% |
Subordinated Debts / Debt Instruments Eligible to Compose Capital |
| 9,857 |
| 19,666 |
| 50% |
| - |
| 8,829 |
| 0% |
Total |
| 134,275 |
| 395,723 |
| 34% |
| 106,035 |
| 356,117 |
| 30% |
|
|
|
|
|
|
|
|
|
|
|
|
|
|
|
|
|
|
|
|
|
|
| In millions of Reais | ||
Customers Funding |
|
|
| 2016 | ||||||||
|
|
|
|
|
|
|
| 0 a 30 days |
| Total |
| % |
Demand deposits |
|
|
|
|
|
|
| 15,794 |
| 15,794 |
| 100% |
Savings accounts |
|
|
|
|
|
|
| 35,901 |
| 35,901 |
| 100% |
Time deposits |
|
|
|
|
|
|
| 24,452 |
| 150,686 |
| 16% |
Interbank deposit |
|
|
|
|
|
|
| 944 |
| 2,379 |
| 40% |
Funds from acceptances and issuance of securities |
|
|
|
|
|
| 6,304 |
| 105,120 |
| 6% | |
Borrowings and Onlendings |
|
|
|
|
|
|
| 4,114 |
| 46,124 |
| 9% |
Subordinated Debts / Debt Instruments Eligible to Compose Capital |
|
|
|
|
|
|
| - |
| 8,784 |
| 0% |
Total |
|
|
|
|
|
|
| 87,509 |
| 364,788 |
| 23% |
Consolidated Financial Statements - December 31, 2018 127
Assets and liabilities in accordance with the remaining contractual maturities, considering the undiscounted flows are as follows:
|
|
|
|
|
|
|
|
|
| 2018 | ||
Non-Discounted Future Flows Except Derivatives |
|
|
|
|
| In millions of Reais | ||||||
|
| 0 to 30 days |
| 31 to 180 days |
| 181 to 365 days |
| 1 to 5 years |
| Above 5 years |
| Total |
|
|
|
|
|
|
|
|
|
|
|
|
|
Interest-earning assets: |
|
|
|
|
|
|
|
|
|
|
|
|
|
|
|
|
|
|
|
|
|
|
|
|
|
Financial Assets Held For Trading | 7,388 |
| 6,199 |
| 12,162 |
| 80,590 |
| 52,584 |
| 158,923 | |
Debt instruments | 5,361 |
| 5,236 |
| 8,443 |
| 71,347 |
| 50,080 |
| 140,467 | |
Trading derivatives | 2,027 |
| 963 |
| 3,719 |
| 9,243 |
| 2,504 |
| 18,456 | |
Other Financial Assets At Fair Value Through Profit Or Loss | 379 |
| 9,230 |
| 379 |
| 18,666 |
| 6,037 |
| 34,691 | |
Debt instruments | 379 |
| 9,230 |
| 379 |
| 18,666 |
| 6,037 |
| 34,691 | |
Non-Current Assets Held For Sale | 24 |
| 558 |
| 126 |
| 3,904 |
| 5,119 |
| 9,731 | |
Reserves from Brazilian Central Bank | 70,103 |
| - |
| - |
| - |
| - |
| 70,103 | |
Loans and Receivables | 29,234 |
| 111,216 |
| 45,564 |
| 116,107 |
| 85,637 |
| 387,758 | |
Total |
| 107,128 |
| 127,203 |
| 58,231 |
| 219,267 |
| 149,377 |
| 661,206 |
|
|
|
|
|
|
|
|
|
|
|
|
|
Interest-bearing liabilities: |
|
|
|
|
|
|
|
|
|
|
|
|
|
|
|
|
|
|
|
|
|
|
|
|
|
Deposits from credit institutions | 198,259 |
| 46,926 |
| 67,142 |
| 79,161 |
| 8,819 |
| 400,307 | |
Subordinated Debts / Debt Instruments Eligible to Compose Capital | 9,857 |
| - |
| - |
| - |
| 9,687 |
| 19,544 | |
Marketable debt securities | 13,395 |
| 21,343 |
| 15,290 |
| 33,627 |
| 9,717 |
| 93,372 | |
Trading derivatives | 1,104 |
| 1,370 |
| 3,257 |
| 9,673 |
| 3,322 |
| 18,726 | |
Short positions | 32,440 |
| - |
| - |
| - |
| - |
| 32,440 | |
Total |
| 255,055 |
| 69,639 |
| 85,689 |
| 122,461 |
| 31,545 |
| 564,389 |
|
|
|
|
|
|
|
|
|
|
|
|
|
|
|
|
|
|
|
|
|
|
|
|
|
|
|
|
|
|
|
|
|
|
|
| 2017 | ||
Non-Discounted Future Flows Except Derivatives |
|
|
|
|
| In millions of Reais | ||||||
|
| 0 to 30 days |
| 31 to 180 days |
| 181 to 365 days |
| 1 to 5 years |
| Above 5 years |
| Total |
|
|
|
|
|
|
|
|
|
|
|
|
|
Interest-earning assets: |
|
|
|
|
|
|
|
|
|
|
|
|
|
|
|
|
|
|
|
|
|
|
|
|
|
Financial Assets Held For Trading | 5,051 |
| 1,788 |
| 6,737 |
| 32,841 |
| 18,848 |
| 65,265 | |
Debt instruments | 654 |
| 899 |
| 5,919 |
| 19,582 |
| 16,801 |
| 43,856 | |
Trading derivatives | 4,398 |
| 889 |
| 818 |
| 13,259 |
| 2,046 |
| 21,410 | |
Available-For-Sale Financial Assets | 925 |
| 1,283 |
| 12,695 |
| 56,167 |
| 50,329 |
| 121,399 | |
Debt instruments | 925 |
| 1,283 |
| 12,695 |
| 56,167 |
| 50,329 |
| 121,399 | |
Other Financial Assets At Fair Value Through Profit Or Loss | 38 |
| 13 |
| 51 |
| 543 |
| 1,994 |
| 2,640 | |
Debt instruments | 38 |
| 13 |
| 51 |
| 543 |
| 1,994 |
| 2,640 | |
Non-Current Assets Held For Sale | 81 |
| 169 |
| 227 |
| 3,370 |
| 9,573 |
| 13,419 | |
Reserves from Brazilian Central Bank | 59,051 |
| - |
| - |
| - |
| - |
| 59,051 | |
Loans and Receivables | 74,887 |
| 93,587 |
| 45,397 |
| 117,084 |
| 84,560 |
| 415,515 | |
Total |
| 140,034 |
| 96,840 |
| 65,107 |
| 210,005 |
| 165,304 |
| 677,290 |
|
|
|
|
|
|
|
|
|
|
|
|
|
Interest-bearing liabilities: |
|
|
|
|
|
|
|
|
|
|
|
|
|
|
|
|
|
|
|
|
|
|
|
|
|
Deposits from credit institutions | 150,979 |
| 50,936 |
| 66,571 |
| 84,274 |
| 8,191 |
| 360,951 | |
Subordinated Debts / Debt Instruments Eligible to Compose Capital | - |
| 807 |
| 257 |
| 7,784 |
| - |
| 8,848 | |
Marketable debt securities | 4,445 |
| 36,855 |
| 12,904 |
| 18,421 |
| 866 |
| 73,491 | |
Trading derivatives | 4,618 |
| 659 |
| 504 |
| 12,243 |
| 2,285 |
| 20,310 | |
Short positions | 32,531 |
| - |
| - |
| - |
| - |
| 32,531 | |
Total |
| 192,573 |
| 89,257 |
| 80,236 |
| 122,722 |
| 11,342 |
| 496,130 |
|
|
|
|
|
|
|
|
|
|
|
|
|
|
|
|
|
|
|
|
|
|
|
|
|
|
|
|
|
|
|
|
|
|
|
| 2016 | ||
Non-Discounted Future Flows Except Derivatives |
|
|
|
|
| In millions of Reais | ||||||
|
| 0 to 30 days |
| 31 to 180 days |
| 181 to 365 days |
| 1 to 5 years |
| Above 5 years |
| Total |
|
|
|
|
|
|
|
|
|
|
|
|
|
Interest-earning assets: |
|
|
|
|
|
|
|
|
|
|
|
|
|
|
|
|
|
|
|
|
|
|
|
|
|
Financial Assets Held For Trading | 27,093 |
| 5,262 |
| 4,749 |
| 36,135 |
| 25,573 |
| 98,812 | |
Debt instruments | 20,762 |
| 2,390 |
| 2,867 |
| 27,676 |
| 20,991 |
| 74,686 | |
Trading derivatives | 6,331 |
| 2,872 |
| 1,882 |
| 8,459 |
| 4,582 |
| 24,126 | |
Available-For-Sale Financial Assets | 1,492 |
| 1,373 |
| 1,819 |
| 55,056 |
| 29,854 |
| 89,594 | |
Debt instruments | 1,492 |
| 1,373 |
| 1,819 |
| 55,056 |
| 29,854 |
| 89,594 | |
Other Financial Assets At Fair Value Through Profit Or Loss | 38 |
| 14 |
| 52 |
| 586 |
| 1,824 |
| 2,514 | |
Debt instruments | 38 |
| 14 |
| 52 |
| 586 |
| 1,824 |
| 2,514 | |
Non-Current Assets Held For Sale | 79 |
| 170 |
| 227 |
| 3,307 |
| 9,979 |
| 13,762 | |
Reserves from Brazilian Central Bank | 58,594 |
| - |
| - |
| - |
| - |
| 58,594 | |
Loans and Receivables | 18,151 |
| 112,337 |
| 42,763 |
| 106,518 |
| 82,770 |
| 362,539 | |
Total |
| 105,447 |
| 119,156 |
| 49,610 |
| 201,602 |
| 150,000 |
| 625,815 |
|
|
|
|
|
|
|
|
|
|
|
|
|
Interest-bearing liabilities: |
|
|
|
|
|
|
|
|
|
|
|
|
|
|
|
|
|
|
|
|
|
|
|
|
|
Deposits from credit institutions | 135,725 |
| 51,098 |
| 50,024 |
| 86,535 |
| 7,444 |
| 330,826 | |
Subordinated Debts / Debt Instruments Eligible to Compose Capital | - |
| 347 |
| 330 |
| 10,633 |
| - |
| 11,310 | |
Marketable debt securities | 6,234 |
| 41,431 |
| 35,390 |
| 27,344 |
| 521 |
| 110,920 | |
Trading derivatives | 6,046 |
| 1,308 |
| 1,268 |
| 7,123 |
| 4,167 |
| 19,912 | |
Short positions | 31,551 |
| - |
| - |
| - |
| - |
| 31,551 | |
Total |
| 179,556 |
| 94,184 |
| 87,012 |
| 131,635 |
| 12,132 |
| 504,519 |
Consolidated Financial Statements - December 31, 2018 128
Scenario analysis / Contingency plan
Based on the results obtained in the Stress Test, the bank draws up the Liquidity Contingency Plan, which constitutes a formal set of preventive and corrective actions to be trigger in times of liquidity crisis. The activation of the Plan results from the monitoring of internal parameters relate to the Bank´s market and liquidity conditions. These parameters serve identify different levels of crisis severity and, then, determine if there need to start the activation process.
After the crisis is identifies, a communication is established between the internal areas capable of carrying out the corrective actions and mitigating the problems originated.
These corrective actions are measures capable of generating liquidity to solve or mitigate the effects of the crisis and are decide into account their complexities, implementation deadlines and the term of the desired liquidity impact.
The parameters and measures of this Plan is review at any time, when necessary, however its maximum period of review is annual.
c.5) Structural foreign currency risk / Hedges of results / Structural equities risk
These activities are monitored by measuring positions, VaR and results.
c.5.1) Complementary measures
Calibration and test measures
Back-testing consists of performing a comparative analysis between VaR estimates and daily “clean” results (profit or loss on the portfolios at the end of the preceding day valued at following-day prices) and “dirty” (managerial income taking into account also the costs, intraday results and loading). The aim of these tests is to verify and provide a measure of the accuracy of the models used to calculate VaR.
Back-testing analyses performed at Banco Santander comply, at the very least, with the BIS recommendations regarding the verification of the internal systems used to measure and manage financial risks. Additionally, the Santander Bank also conducts hypothesis tests: excess tests, normality tests, Spearman’s rank correlation, average excess measures, etc.
The assessment models are regularly calibrated and tested by a specialized unit.
c.6) Control system
Limit setting
The limit setting process is performed together with the budgeting activity and is the tool used to establish the assets and liabilities available to each business activity. Limit setting is a dynamic process that responds to the level of risk considered acceptable by management.
The limits structure requires a process to be performed that pursues, among others, the following objectives:
1. To identify and delimit, in an efficient and comprehensive manner, the main types of financial risk incurred, so that they are consistent with business management and the defined strategy.
2. To quantify and communicate to the business areas the risk levels and profile deemed acceptable by senior management so as to avoid undesired risks.
3. To provide flexibility to the business areas for the efficient and timely assumption of financial risks, due to changes in the market and business strategy, and within the risks level considered acceptable by the Bank.
4. To allow business makers to assume risks which, although prudent, are sufficient to obtain the budgeted results.
5. To delimit the range of products and underlying assets with which each Treasury unit can operate, considering features such as assessment model and systems, liquidity of the instruments involved, etc.
c.7) Risks and results
Financial Intermediation Activities
The average VaR from the Bank´s trading portfolio in 2018 ended in R$30.3 million. The dynamic management of this profile allows the Bank to change its strategy to capitalize the opportunities offered by a uncertain environment.
c.7.1) Asset and liability management (1)
Interest rate risk
Convertible currencies
At 2018 year-end, the sensitivity of the net interest margin at one year to parallel increases of 100 basis points applied to Banco Santander portfolios was concentrated on the BRL interest rate curve was positive by R$200 million.
Also at 2018 year-end, the sensitivity market value of equity to parallel increases of 100 basis points applied to the Banco Santander in the BRL interest rate curve was positive by R$1,861 million.
Quantitative risk analysis
The interest rate risk in balance sheets management portfolios, measured in terms of sensitivity of the net interest margin (NIM) at one year to a parallel increase of 100 b.p. in the interest rate curve, was at the beginning of 2018 and 2017, reaching a maximum of R$292 million in January 2018. The sensitivity value decreased R$205 million during 2018, reaching a maximum of R$1,981 million in January. The main factors that occurred in 2017 and influenced in sensitivity were the volatility of the exchange rate (convexity effect), portfolio’s decayment update of implicit methodology on cash flow ofthe Bank’s products and liquidity.
Consolidated Financial Statements - December 31, 2018 129
Million of Reais |
|
|
|
|
|
|
|
| 2018 |
| 2017 |
| 2016 |
Sensibilities |
|
|
|
|
|
|
Net Interest Margin |
| 200 |
| 378 |
| 385 |
Market Value of Equity |
| 1,861 |
| 2,066 |
| 1,680 |
Value at Risk - Balance |
|
|
|
|
|
|
VaR |
| 1,744 |
| 1,380 |
| 804 |
c.8) Sensitivity analysis
The risk management is focused on portfolios and risk factors pursuant to the requirements of regulators and good international practices.
Financial instruments are segregated into trading and Banking portfolios, as in the management of market risk exposure, according to the best market practices and the transaction classification and capital management criteria of the New Standardized Approach of regulators. The trading portfolio consists of all transactions with financial instruments and products, including derivatives, held for trading, and the Banking portfolio consists of core business transactions arising from the different Banco Santander business lines and their possible hedges. Accordingly, based on the nature of Banco Santander’s activities, the sensitivity analysis was presented for trading and Banking portfolios.
Banco Santander performs the sensitivity analysis of the financial instruments in accordance with requirements of regulatory bodies and international best practices, considering the market information and scenarios that would adversely affect the positions and the income of the Bank.
The table below summarizes the stress amounts generated by Banco Santander’s corporate systems, related to the Banking and trading portfolio, for each one of the portfolio scenarios as of December 31, 2018.
Trading portfolio
|
|
|
|
|
|
| 2018 | |||||
Risk Factor |
|
| Description |
|
|
|
| Scenario 1 |
| Scenario 2 |
| Scenario 3 |
Interest Rate - Reais |
|
| Exposures subject to changes in interest fixed rate |
|
| (752) |
| (11,854) |
| (23,708) | ||
Coupon Interest Rate |
|
| Exposures subject to changes in coupon rate of interest rate |
| (1,091) |
| (15,747) |
| (31,494) | |||
Inflation |
|
| Exposures subject to change in coupon rates of price indexes |
| (4,344) |
| (45,686) |
| (91,371) | |||
Coupon - US Dollar |
|
| Exposures subject to changes in coupon US Dollar rate |
| (2,229) |
| (60,518) |
| (121,036) | |||
Coupon - Other Currencies | Exposures subject to changes in coupon foreign currency rate | (5,030) |
| (5,349) |
| (10,697) | ||||||
Foreign currency |
|
| Exposures subject to foreign exchange |
|
| (10,926) |
| (273,156) |
| (546,313) | ||
Eurobond/Treasury/Global |
|
| Exposures subject to changes in interest rate negotiated roles in international market |
| (328) |
| (2,138) |
| (4,277) | |||
Shares and Indexes |
|
| Exposures subject to change in shares price |
|
| (3,028) |
| (75,711) |
| (151,422) | ||
Commodities |
|
| Exposures subject to change in commodities' prices |
|
| (2) |
| (42) |
| (84) | ||
Total(1) |
|
|
|
|
|
|
| (27,730) |
| (490,201) |
| (980,402) |
(1) Amounts net of taxes.
Scenario 1: a shock of 10 base points on the interest curves and 1% to price changes (currency and stocks);
Scenario 2: a shock of +25% and -25% in all risk factors, are considered the greatest losses per risk factor;
Scenario 3: a shock of +50% and -50% in all risk factors, are considered the greatest losses per risk factor.
Portfolio Banking
|
|
|
|
|
|
| 2018 | |||||
Risk Factor |
|
| Description |
|
|
|
| Scenario 1 |
| Scenario 2 |
| Scenario 3 |
Interest Rate - Reais |
|
| Exposures subject to changes in interest fixed rate |
|
| (48,019) |
| (821,285) |
| (1,636,606) | ||
TR and Long-Term Interest Rate - (TJLP) | Exposures subject to changes in Exchange of TR in TJLP |
| (22,042) |
| (364,231) |
| (551,674) | |||||
Inflation |
|
| Exposures subject to change in coupon rates of price indexes | (37,400) |
| (475,444) |
| (948,607) | ||||
Coupon - US Dollar |
|
| Exposures subject to changes in coupon US Dollar rate |
|
| (2,721) |
| (43,693) |
| (71,662) | ||
Coupon - Other Currencies | Exposures subject to changes in coupon foreign currency rate | (4,241) |
| (63,970) |
| (128,421) | ||||||
Interest Rate Markets International | Exposures subject to changes in interest rate negotiated roles in international market |
| (3,692) |
| (80,702) |
| (141,043) | |||||
Foreign Currency |
|
| Exposures subject to Foreign Exchange | (2,513) |
| (62,821) |
| (125,642) | ||||
Total(1) |
|
|
|
|
|
|
| (120,628) |
| (1,912,146) |
| (3,603,655) |
(1) Amounts net of taxes.
Consolidated Financial Statements - December 31, 2018 130
Scenario 1: a shock of +10bps and -10bps in interest rate curves and 1% price variance (currency and stocks); are considered the greatest losses per risk factor;
Scenario 2: a shock of +25% and -25% in all risk factors, are considered the greatest losses per risk factor;
Scenario 3: a shock of +50% and -50% in all risk factors, are considered the greatest losses per risk factor.
d) Independent Structure
The Operational Risk & Internal Control area, subordinated to the Executive Vice-Presidency of Risks, operates independently as a second line of defense, supporting and challenging the first line of defense. They maintain persons, structure, standards, methodologies and tools to ensure the conduction and adequacy of the Operational Risk Control and Management Model in Santander.
The Management is an acting part and is aligned with the mission of the areas, recognizing, participating and sharing responsibility for the continuous improvement of the operational and technological risk management culture. Then they can ensure compliance with the established objectives and goals, as well as the security and quality of the products and services provided by the Bank.
The Bank's Board of Directors chose to adopt the Alternative Standardized Approach (ASA) to calculate the installment of Required Reference Equity (PRE) related to operational risk.
d.1) Operational Risks & Internal Control
Its mission to Banco Santander is: To corroborate the fulfillment of the strategic objectives and the decision-making process, in the adaptation and fulfillment of the obligatory requirements, in maintaining the solidity, reliability, reduction and mitigation of losses due to operational risks, besides the implementation, dissemination of culture of operational risks.
Acts in preventing the operational risk and supports for the continued strengthening of the internal control system, attending the requirements of regulatory agencies, New Basel Agreement – BIS II and resolutions of the National Monetary Council. This model also follows the guidelines established by Santander Spain, which was based on COSO-Committee of Sponsoring Organizations of the Tread way Commission-Internal Control – Integrated Framework 2013.
The procedures developed and adopted are intended to ensure Bank´s continuous presence among the select group of financial institutions recognized as having the best operational risk management practices, thereby helping to continuously improve its reputation, solidity and reliability in the local and international markets.
In the second half of 2014, was consolidated the adoption if the approaches by lines of defense, approved in the Executive Committee.
Defense Line Model
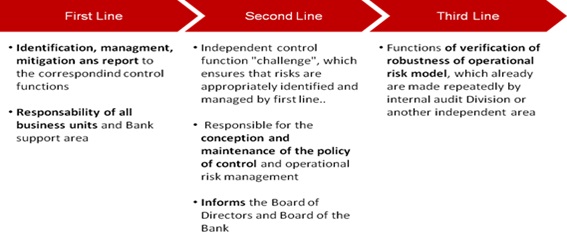
Operational Risks & Internal Control is the second line of defense in Santander's model and aims to maintain the fulfillment, alignment and compliance with corporate guidelines of the Santander group, the Basle Accord and resolutions of the National Monetary Council. Also acts in the control and challenge of the activities performed by the first line of Defense, contributing to its strengthening, vision of an integrated approach to risk management.
d.2) Comprehensiveness and Sustainability
The scope of operational risk control and management exceeds the allocation of regulatory capital, ensuring its sustainable development, including:
• Improvement of operational efficiency and productivity in the activities and processes.
• Compliance with existing regulations: Bacen, Susep, CVM, SEC, B³ and BIS, as well as new requirements and monitoring the timely fulfillment of requests from regulators.
• Strengthening of the reputation and improvement in the relation of Risk x Return to the public with whom the Bank maintains relationship.
• Maintenance and preservation of the quality and reliability of products and services.
• Identifying and addressing timely the corrections of identified vulnerabilities in processes.
• Dissemination of culture of advanced management and control of Operational Risks, by means of internal communication (intranet, on-site courses, "online" courses and monthly communication by “Boletim de RO” and “Boletim Flash de RO”), with reinforcement in the "Accountability".
This solid and efficient structure permits the continuous enhancement of existing methodologies and the further dissemination of the culture of responsibility in regard to the advanced management of operational risk.
d.3) Differential factor
The Operational Risks & Internal Control area invests in the development, training and updating of its professionals so they can keep up with changes in the business environment, in addition to offering training programs for other professionals through the intranet and on-site courses. Among the personal course, we highlight the achievement of training aimed at increasing culture of RO management, training for the capture of operational losses, among others.
This has made a significant contribution to the Bank consistently achieve its strategic and operational goals, by providing knowledge of the exposure to assumed operational risks and the controlled environment, maintaining the Bank’s low-risk profile and ensuring the sustainable development of its operations.
The Bank highlights:
• Mandatory training for all Banco Santander employees through e-learnings ("NetCursos"), addressing the issue of operational risks;
• The creation, dissemination and maintenance of Instruction Manuals, promoting corporate values and commitment;
• Coordination of the annual process for projecting losses caused by operational risks, defining action plans to reduce these losses and for accountability;
• Development of key risk indicators, aiming to monitor the main operational risks;
Consolidated Financial Statements - December 31, 2018 131
• Composition of lines of defense creating new functions for the role of ORM Networks: "“RPO-Risk Pro Officer” whose function is to report to the executive the follow-up of the topics of Operational Risk at the strategic level of the Executive Board, “RPA-Risk Pro Agent " and "OR Assist" covering the perimeter of RO and "experts" in cases where the operational risk is transverse to the organization.
d.4) Communication Policy
The Operational Risks & Internal Control area is part of Santander’s governance structure and produces a series of specific monthly reports for management detailing events that occurred, the main activities undertaken, and the corrective and precautionary action plans identified and monitored, ensuring transparency and providing knowledge for governance forums.
e) Reputational Risk
e.1) Reputational Risk
The reputational risk is defined as a risk of a negative economic impact, current and potential, due to a perception unfavorable of the Bank by its employees, clients, shareholders/investors and society in general.
The reputational risk may arise from multiple sources and, in many cases, is derived from other risk events. In general, these sources might be related to the business and other support activities that are realized by the Bank, the economic context, social or politic, or even by other events arising from other competitors that might affect the Bank.
e.2) Compliance
It is defined as legal risk, of regulatory sanctions, financial loss or reputation that an institution may suffer as a result of failures in the compliance with laws, rules, ethics and conduct codes and good bank practices. The compliance risk management has the goal of being preventive and includes the monitoring, educative processes, Consulting, risk evaluation and corporative communication related to the rules and legislation applicable to each business department.
e.3) Directives
a. Compliance principles – Ethics and Conduct in the Securities Markets
The Bank’s ethical principles and conduct parameters are established in internal policies which are made available to all employees. Conduct Code in the Securities Markets and its formal acknowledgement is mandatory to all staff working close to securities markets. Proper communication channels are in place to clarify doubts and complaints from employees, the monitoring and controlling of these information are conducted in a way that adherence to the rules established is secured.
b. Money Laundering Prevention
The Bank’s money Laundering Prevention policies and terrorism financing prevention are based on the knowledge and rigorousness of the acceptance of new clients, complemented by the continuous scrutiny of all transactions where the Bank are involved in. The importance given to the theme is reflected on the direct involvement of management, namely the Operational Money Laundering Prevention and Compliance Committee, which meets each month to deliberate on issues regarding the theme and to be directly involved with new clients acceptance and suspicious transactions reporting.
c. New products and services and suitability
All new products and services are debated/analyzed internally at various levels until their risks have been fully mitigated, and subsequently approved by the Commercialization Local Committee (CLC), composed of Bank executives. After review and approval, the new products and services are monitored trying to identify them so timely events that may pose reputational risk, which if identified, are reported to the CLC.
f) Compliance with the new regulatory framework
The Banco Santander has assumed a firm commitment to the principles underlying the “Revised Framework of International Convergence of Capital Measurement and Capital Standards” (Basel II). This framework allows entities to make internal estimates of the capital they are required to hold in order to safeguard their solvency against events caused by various types of risk. As a result of this commitment, the Bank has devoted all the human and material resources required to ensure the success of the Basel II implementation plan. For this purpose, a Basel II team was created in the past, consisting of qualified professionals from the Bank’s different departments: mainly Finance, Risks, Technology and Operations, Internal Audit −to verify the whole process, as the last layer of control at the entity−, and Business −particularly as regards the integration of the internal models into management. Additionally, specific work teams have been set up to guarantee the proper management of the most complex aspects of the implementation.
Supplementing the efforts of the Basel II operating team, the Bank management has displayed total involvement from the very beginning. Thus, the progress of the project and the implications of the implementation of the New Capital Accord by the Banco Santander have been reported to the management committee and to the board of directors on a regular basis.
In the specific case of credit risk, the implementation of Basel II entails the recognition, for regulatory capital purposes, of the internal models that have been used for management purposes.
The institution has applied the internal models based ratings methodology (AIRB) of Basel II in part of its portfolios, in compliance with regulatory requirements.
The additional capital requirements derived from the self-assessment process (Pillar II) should be compensated by the risk profile that characterizes the Bank's business activities (low average risk), due to its focus on Commercial Bank (small and medium-sized enterprises and Individuals) and the diversification of the business. The Pillar II which considers the impact of risks not addressed under Pillar I (regulatory capital) and the benefits arising
Consolidated Financial Statements - December 31, 2018 132
from the diversification among risks, businesses and geographical locations.
Regarding the other risks addressed under Pillar I of Basel II, Banco Santander was approved for the use of internal models for market risk and will remain using the standardized method for operational risk, since it considers the premature use of advanced models (AMA) for this purpose . Regarding the Market Risk, Banco Santander was approved to the use of Internal Models in February 2018 and started to disclose the capital by this method from May 2018.
Pillar II is another significant line of action under the Basel Corporate Framework. In addition to the methodology supporting the economic capital model review and strengthening, the technology was brought into line with the platform supporting Pillar I, so that all the information on credit risk will come from this source.
Besides the Basel II implementations, Banco Santander complies with the new regulations of Basel III, according to the standards issued by Bacen.
According to the definition proposed by the Basel Committee (Basel III), Credit Valuation Adjustment (CVA) is an adjustment to the fair value of derivative financial instruments in order to measure the credit risk of a counterparty. Thus, the CVA depends on the credit spread of the counterparty, as well as the market risk factors that drives the values of the derivatives and, therefore, their exposure. In an analytical way, the CVA can be defined by the following expression:
CVA = EE * PD * DF * LGD(1)
(1) EE=Expected Exposure; PD=Probability of Default; DF=Discount Factor; LGD=Loss Given Default
Expected Exposure (EE) is the future exposure of the derivative based on the counterparty's market risk. The probability of default (PD) is calculated based on credit spreads and is also marked to market. The discount factor (DF) is the factor that brings to the present value the projected exposure weighted by its respective probability of default. A Loss Given Default (LGD) is the estimated loss in the event of a credit.
f.1) Internal validation of risk models
Internal validation is a pre-requisite for the supervisory validation process by Basel II implementation. A specialized team of the Entity, with sufficient independence, obtains a technical opinion on the adequacy of the internal models for the intended internal or regulatory purposes, and concludes on their usefulness and effectiveness. This team must also assess whether the risk management and control procedures are adequate for the Entity’s risk strategy and profile.
In addition to the regulatory requirement compliance, the internal validation department provides an essential support to the risk committee and management, as they are responsible for ensuring that appropriate procedures and systems are in place to monitor and control the entity's risks. In this case, the internal validation area is responsible for providing a qualified and independent opinion so that the responsible authorities decide on the authorization of the use of models (for management purposes as well as regulatory use).
Internal model validation at Banco Santander encompasses credit risk models, market risk models, ALM, pricing models, stress test models, the economic capital model and other models related to the exercise of ICAAP. The scope of the validation includes not only the more theoretical or methodological aspects, but also the technology systems and the quality of the data they provide, on which their effective operation relies, and, in general, all the relevant aspects of advanced risk management (controls, reporting, uses, involvement of management, etc.). Therefore, the goal of internal validation is to review quantitative, qualitative, technological and corporate governance related to regulatory and management aspects concerning the model risk control.
Among the main functions of the Internal Model Validation department are the following:
i. Establish general validation principles, conducting an independent evaluation process including (I) data quality, (II) use of the methodology and (III) functioning of the models;
ii. Propose documents and model validation guides;
iii. Evaluate the methodology and data used in the development of the model and challenge the model and its use, stating the implications and limitations of the model, as well as the associated risks;
iv. Issue a technical opinion on the adequacy of internal models for the intended internal and regulatory effects, concluding on their usefulness and effectiveness; and
v. Provide essential support to risk committees and management of the Bank, through a qualified and independent opinion for responsible decision-making on the authorization of the use of models (for management purposes as well as regulatory use).
It is important to note that Banco Santander's internal validation function is fully consistent with the independent validation criteria for advanced approach issued by the Basel Committee, the European supervisor 'home regulator' (Banco de España and the European Central Bank) and the Bacen in compliance with the rules Circular 3,648 dated March 4, 2013 (Chapter III), Circular Letter 3,565 of September 6, 2012 and Circular 3,547 of July 2011. In this case, the Bank maintains a Segregation of functions between internal validation and internal audit, which is the last layer of Bank control validation.
The Internal Audit is responsible for evaluating and reviewing the internal validation methodology and work and issues opinions with an effective level of autonomy. Internal Audit (third line of defense), as the ultimate control function in the Group, should (i) periodically assess the adequacy of policies, methods and procedures and (ii) confirm that they are effectively implemented in the management .
f.2) Capital Management
Capital management considers the regulatory and economic aspects and its objective is to achieve an efficient capital structure in terms of cost and compliance, meeting the requirements of the regulatory authorities and supporting to accomplish the goals of the classification of rating agencies and investors' expectations. Details regarding the capital management process can be found at www.ri.santander.com.br Corporate Governance -> Risk Management -> Risk and Capital Management Structure.
g) Economic capital
g.1) Main objectives
The development of economic capital models in finance aims to solve a fundamental problem of regulatory capital, Sensitivity Risk.
In this context, the economic capital models are essentially designed to generate risk-sensitive estimative, allowing greater precision in risk management, as well as better allocation of economic capital by business units of Banco Santander.
Consolidated Financial Statements - December 31, 2018 133
The Banco Santander has directed efforts to build a model of robust and integrated economic capital to the business management.
The main objectives of the structure of economic capital of the Banco Santander are:
1 - Consolidate Pillar I and other risks which affect business in a single quantitative model, and determine estimates of capital by establishing correlations between different risks;
2 - Quantify and monitor different types of variations in risk;
3 - Distribute capital consumption between the different portfolios and manage the efficiency of return on capital (RORAC);
4 - Estimating the Economic Value Added for each business unit. Economic profit must exceed the cost of the Bank's capital;
5 - Accordance with the regulation in locations where the Bank operates in the review process of Pillar II by supervisors.
g.2) The Economic Capital Model
In calculating the economic capital, it is the Bank's definition of losses to be covered. Thus, it is used a confidence interval necessary to ensure business continuity. The confidence interval for the Banco Santander is 99.90% higher than required by Basel II.
The risk profile in Brazil is distributed by Credit risk, Market, ALM, Business, Operations and materials assets. However, to successfully anticipate the changes proposed in Basel III, new risks have been incorporated to model: Intangibles, pension funds (defined benefit) and deferred tax assets, which allow the Bank to adopt a position even more conservative and prudent.
% Capital |
| 2018 |
| 2017 |
| 2016 |
Risk Type |
| New Methodology |
| New Methodology |
| New Methodology |
Credit |
| 72% |
| 70% |
| 62% |
Market |
| 2% |
| 4% |
| 5% |
ALM |
| 8% |
| 4% |
| 9% |
Business |
| 6% |
| 8% |
| 8% |
Operational |
| 5% |
| 6% |
| 6% |
Fixed Assets |
| 1% |
| 2% |
| 2% |
Intangible Assets |
| 0% |
| 1% |
| 1% |
Pension Funds |
| 1% |
| 1% |
| 1% |
Deferred Tax Assets |
| 5% |
| 4% |
| 6% |
TOTAL |
| 100% |
| 100% |
| 100% |
Still, for being a commercial Bank, credit is the main source of risk in Banco Santander and the evolution of this portfolio is a leading factor for oscillation.
Banco Santander periodically evaluates the level and evolution of RORAC of the main business units. The RORAC is the quotient of the profit generated on allocated capital, using the following formula:
RoRAC=Profit/Economic Capital
Banco Santander also makes the planning of capital in order to obtain future projections of economic and regulatory capital. The estimative obtained for the Bank are incorporated to different scenarios consistently, including its strategic objectives (organic growth, M & A, payout ratio, credits, etc.). Possible management strategies leading to optimize capital and solvency return of the Bank are identified.
RoRAC
Banco Santander has used the RORAC, with the following objectives:
1 – Analyze and set a minimum price for operations (admission) and clients (monitoring).
2 – Estimate capital consumption of each client, economic groups, portfolio or business segment, in order to optimize the allocation of economic capital, maximizing the efficiency of the Bank.
3 – Measure and monitor business performance.
To evaluate the operations of global clients, the calculation of economic capital considers some variables used in the calculation of expected and unexpected losses.
Among these variables are:
1 – Counterparty rating;
2 – Maturity;
3 – Guarantees;
4 – Type of financing;
The economic value added is determined by the cost of capital. To create value for shareholders, the minimum return operation must exceed the cost of capital of Banco Santander.
APPENDIX I – RECONCILIATION OF STOCKHOLDERS' EQUITY AND NET INCOME - BRGAAP vs IFRS
The table below presents a conciliation of stockholders' equity and net income attributed to the parent between standards adopted in Brazil (BRGAAP) and IFRS, with the conceptual description of the main adjustments:
Thousand of Reais | Note | 2018 | 2017 | 2016 |
|
|
|
|
|
Shareholders' equity attributed under to the Parent Brazilian GAAP |
| 65,233,743 | 59,499,954 | 57,771,524 |
IFRS adjustments, net of taxes, when applicable: |
|
|
|
|
Reclassification of financial instruments at fair value through profit or loss | i | 8,344 | 18,301 | 643 |
Reclassification of available-for-sale financial instruments | j | - | 34,818 | 23,180 |
Reclassification of fair value through other comprehensive income | k | 72,980 | - | - |
Impairment of loans and receivables | a | - | (71,091) | 124,787 |
Impairment of financial assets measured at amortized cost | a | (1,483,043) | - | - |
Remensurations, Debt instruments, due to reclassifications IFRS 9 |
| 26,274 | - | - |
Category transfers - IAS 39 | b | - | 351,132 | 608,897 |
Category transfers - IFRS 9 | b | (619) | - | - |
Deferral of financial fees, commissions and inherent costs under effective interest rate method |
|
|
|
|
c | 851,629 | 664,204 | 297,720 | |
Reversal of goodwill amortization | d | 26,764,529 | 26,592,852 | 25,122,573 |
Realization on purchase price adjustments | e | 631,120 | 702,436 | 778,882 |
Recognition of fair value in the partial sale in subsidiaries | f | 112,052 | 112,052 | 112,052 |
Option for Acquisition of Equity Instrument | g | (1,323,994) | (1,287,240) | (1,017,000) |
Goodwill acquisition Santander Services (Santusa) | h | (269,158) | (298,978) | - |
Tax Credit with realization over 10 years |
| 322,539 | 62,539 | - |
Others |
| 56,479 | 269,728 | 263,797 |
Shareholders' equity attributed to the parent under IFRS |
| 91,002,875 | 86,650,707 | 84,087,055 |
Non-controlling interest under IFRS |
| 592,585 | 436,894 | 725,504 |
Shareholders' equity (including non-controlling interest) under IFRS |
| 91,595,460 | 87,087,601 | 84,812,559 |
|
|
|
|
|
Thousand of Reais | Note | 2018 | 2017 | 2016 |
|
|
|
|
|
Net income attributed to the Parent under Brazilian GAAP |
| 12,166,145 | 7,996,577 | 5,532,962 |
IFRS adjustments, net of taxes, when applicable: |
|
|
|
|
Reclassification of financial instruments at fair value through profit or loss | i | (11,974) | 18,775 | 7,960 |
| j | - | (46,160) | (39,234) |
Reclassification of fair value through other comprehensive income | k | 28,419 | - | - |
Impairment on loans and receivables | a | - | (195,878) | (8,091) |
Impairment of financial assets measured at amortized cost | a | 140,557 | - | - |
Remensurations, Debt instruments, due to reclassifications IFRS 9 |
| (5,360) | - | - |
Category transfers - IAS 39 | b | - | (219,829) | (45,314) |
Category transfers - IFRS 9 | b | (16,195) | - | - |
Deferral of financial fees, commissions and inherent costs under effective interest rate method |
|
|
|
|
c | 187,425 | 366,484 | 148,450 | |
Reversal of goodwill amortization | d | 171,677 | 1,470,279 | 1,755,750 |
Realization on purchase price adjustments | e | (71,316) | (76,446) | (76,247) |
Option to Acquire Own Equity Instrument | g | (143,194) | (270,240) | - |
Goodwill acquisition Santander Services (Santusa) | h | 29,820 | - | - |
Others |
| (153,527) | (182,037) | 58,327 |
Net income attributed to the parent under IFRS |
| 12,322,477 | 8,861,525 | 7,334,563 |
Non-controlling interest under IFRS |
| 217,441 | 213,984 | 130,355 |
Net income (including non-controlling interest) under IFRS |
| 12,539,918 | 9,075,509 | 7,464,918 |
Consolidated Financial Statements - December 31, 2018 134
a) Impairment on loans and receivables and financial assets measured at amortized cost:
In 2018, refers to the adjustment resulting from the estimate of the expected loss and losses on the portfolio of loans and receivables subject to impairment, loan commitments to be released and financial guarantee contracts, which was determined based on the criteria described in the accounting practice and compliance in the history of impairment and other circumstances known at the time of the evaluation, in accordance with the guidance provided by IAS 39 and IFRS 9 (in 2016 and 2017 refer to the resulting adjustment of the estimate of loss incurred in accordance with IAS 39, normative then effective.) "Financial Instruments: Recognition and Measurement". These criteria differ in certain aspects from the criteria adopted by BRGAAP, which use certain regulatory limits defined by the Central Bank (Bacen), in addition to the difference in the scope of calculation of these losses, which for the purposes of IFRS considers assets other than those In the Financial Statements under IFRS, this effect considers the impact related to the provisions of certain debt instruments, which for the purposes of BRGAAP are treated as Securities.
b) Categories of financial assets
As detailed in the accounting practices note, IFRS9 provides for the definition of the business models associated with each portfolio, as well as the performance of the SPPI test - if the returns of that asset are exclusively principal and interest, for classification in the categories of financial assets. BRGAAP provides for certain differences in the categorization of these financial assets, as well as establishing as an indicator the Management's intention for classification to be made. The criteria for reclassification between categories are also different between the two accounting practices.
c) Deferral of financial fees, commissions and other costs under effective interest rate method:
Under IFRS, financial fees, commissions and other costs that are integral part of effective interest rate of financial instruments measured at amortized cost are recognized in the income statement over the term of the corresponding contracts. Under BRGAAP these fees and expenses are recognized directly as income when received or paid.
d) Reversal of goodwill amortization:
Under BRGAAP, goodwill is systematically amortized over a period of up to 10 years, subject to the impairment test at least once a year or in a shorter period, in the event of any additional evidence. Under IFRS, in accordance with IAS 38 “Intangible Assets”, goodwill is not amortized, but instead, istested for impairment, at least annually, and whenever there is an indication that the goodwill may be impaired. The tax amortization of goodwill of Banco ABN Amro Real SA represents a difference between book and tax basis of a permanent nature and definitive as the possibility of future use of resources to settle a tax liability is considered remote by management, supported by the opinion of expert external advisors. The tax amortization of goodwill is permanent and definitive, and therefore does not apply to the recognition of a deferred tax liability in accordance with IAS 12, on temporary differences.
Consolidated Financial Statements - December 31, 2018 135
e) Realization on purchase price adjustments:
As part of the allocation of the purchase price related to the acquisition of Banco Real, following the requirements of IFRS 3, the Bank has recognized the assets and liabilities of the acquiree to fair value, including identifiable intangible assets with finite lives. Under BRGAAP, in a business combination, the assets and liabilities are kept at their book value. This purchase price adjustment relates substantially to the allocation related to the value of assets in the loan portfolio. The initial recognition of value of the loans at fair value, adjustment to the yield curve of the loan portfolio in comparison to its nominal value, which is recognized by its average realization period.
The amortization of the identified intangible assets with finite lives over their estimated useful lives.
f) Recognition of fair value in the partial disposal of investments in subsidiaries
Under IFRS 10 "Consolidated Financial Statements" on partial disposal of a permanent investment when control is lost, the fair value is recognized over the remaining portion is remeasured at its fair value, the effect of this update being recognized in result (Webmotors). Under BRGAAP, this type of operation, ongoing participation is registered by its book value.
g) Option for Acquisition of Equity Instrument
Within the context of transaction, Banco Santander has granted to the members of Getnet S.A. and Banco Olé Consignado a put option over all shares of Getnet S.A. and Banco Olé Consignado held by them. The overall out in IAS 32, a financial liability was recognized for this commitment, with a specific charge in a heading in stockholders' equity in the amount of R$950 million and R$67 million, respectively. Subsequently, the options have been updated and their effect is recognized in income.
h) Santander Serviços goodwill (Santusa)
According to the IFRS 3 "Business Combination", when the owner acquires more shares or other equity instruments of an entity already controlled, it shall consider such amount as an equity reduction. According to the BRGAAP this amount shall be registered in the asset as goodwill or discount on the acquisition f the investment, which is the difference between the acquision cost and the equity amount of the shares.
i) Reclassification of financial instruments at fair value through profit or loss
Under BRGAAP, all loans, financing and deposits are recorded at amortized cost. In IFRS, in accordance with IFRS 9 "Financial Instruments: Recognition and Measurement", financial assets may be measured at fair value and included in the category "Other financial assets at fair value through profit or loss", in order to eliminate or significantly reduce accounting mismatches ( accounting mismatch) of recognition or measurement derived from the measurement of assets or liabilities or from the recognition of gains or losses on these assets / liabilities on a number of bases, which are managed and their performances valued at fair value. Accordingly, the Bank classified loans, financing and deposits that meet these parameters as "fair value through profit or loss", as well as certain debt instruments classified as "available for sale" in BRGAAP. The Bank opted for this classification base in IFRS, since it eliminates an accounting mismatch in the recognition of revenues and expenses.
j) Reclassification of available-for-sale financial instruments
According to the BRGAAP, the Bank registers some investments, for example, debt instruments initially measured at amortized cost and equity instruments at cost. At the time of this balance sheet, the management reviewed the managing strategy of its investments and according to Bacen Circular 3.068, the debt instruments were reclassified to "trading" measured at fair value with changes in the income statement. According to the IFRS, the Bank is classifying this investments as available for sale measuring them at fair value with changes in "other comprehensive income", in line with IAS 39 "Financial Instruments: Recognition and Measurement", which does not allow the reclassification of any financial instrument to fair value with changes in the income statement after the initial recognition.
k) Reclassification of financial assets measured at fair value through other comprehensive income
According to the BRGAAP, the Bank registers some investments, for example, debt instruments initially measured at amortized cost and equity instruments at cost. At the time of this balance sheet, the management reviewed the managing strategy of its investments and according to Bacen Circular 3.068, the debt instruments were reclassified to "trading" measured at fair value with changes in the income statement. According to the IFRS, the Bank is classifying this investments as financial assets measured at fair value through other comprehensive income them at fair value with changes in "other comprehensive income", in line with IFRS 9 "Financial Instruments ", which does not allow the reclassification of any financial instrument to fair value with changes in the income statement after the initial recognition.
APPENDIX II – STATEMENTS OF VALUE ADDED
The following Statements of value added is not required under IFRS but being presented as supplementary information as required by Brazilian Corporate Law for publicly-held companies, and has been derived from the Bank´s consolidated financial statements prepared in accordance with IFRS.
|
| 2018 |
| 2017 |
| 2016 | ||||||
Thousand of Reais |
|
|
|
|
|
|
|
|
|
|
|
|
Interest and similar income |
| 70,478,393 |
|
|
| 71,418,349 |
|
|
| 77,146,077 |
|
|
Net fee and commission income |
| 14,132,159 |
|
|
| 12,721,868 |
|
|
| 10,977,596 |
|
|
Impairment losses on financial assets (net) |
| (12,713,435) |
|
|
| (12,338,300) |
|
|
| (13,301,445) |
|
|
Other income and expense |
| (6,861,406) |
|
|
| (3,043,565) |
|
|
| (751,727) |
|
|
Interest expense and similar charges |
| (28,557,051) |
|
|
| (36,471,860) |
|
|
| (46,559,584) |
|
|
Third-party input |
| (7,219,152) |
|
|
| (6,728,881) |
|
|
| (5,804,939) |
|
|
Materials, energy and others |
| (544,237) |
|
|
| (495,913) |
|
|
| (510,961) |
|
|
Third-party services |
| (5,572,127) |
|
|
| (5,107,077) |
|
|
| (4,589,468) |
|
|
Impairment of assets |
| (508,310) |
|
|
| (456,711) |
|
|
| (114,321) |
|
|
Other |
| (594,478) |
|
|
| (669,180) |
|
|
| (590,189) |
|
|
Gross added value |
| 29,259,508 |
|
|
| 25,557,611 |
|
|
| 21,705,978 |
|
|
Retention |
|
|
|
|
|
|
|
|
|
|
|
|
Depreciation and amortization |
| (1,739,959) |
|
|
| (1,662,247) |
|
|
| (1,482,639) |
|
|
Added value produced |
| 27,519,549 |
|
|
| 23,895,364 |
|
|
| 20,223,339 |
|
|
Added value received from transfer |
|
|
|
|
|
|
|
|
|
|
|
|
Investments in affiliates and subsidiaries |
| 65,958 |
|
|
| 71,551 |
|
|
| 47,537 |
|
|
Added value to distribute |
| 27,585,507 |
|
|
| 23,966,915 |
|
|
| 20,270,876 |
|
|
Added value distribution |
|
|
|
|
|
|
|
|
|
|
|
|
Employee |
| 8,185,896 |
| 29.7% |
| 7,908,746 |
| 33.0% |
| 7,378,374 |
| 36.4% |
Compensation |
| 5,863,584 |
|
|
| 5,795,579 |
|
|
| 5,455,374 |
|
|
Benefits |
| 1,534,560 |
|
|
| 1,421,910 |
|
|
| 1,397,711 |
|
|
Government severance indemnity funds for employees - FGTS | 448,699 |
|
|
| 413,871 |
|
|
| 352,939 |
|
| |
Other |
| 339,053 |
|
|
| 277,386 |
|
|
| 172,350 |
|
|
Taxes |
| 5,813,381 |
| 21.1% |
| 6,131,544 |
| 25.6% |
| 4,659,989 |
| 23.0% |
Federal |
| 4,864,176 |
|
|
| 5,481,969 |
|
|
| 4,101,629 |
|
|
State |
| 224 |
|
|
| 1,260 |
|
|
| 717 |
|
|
Municipal |
| 948,981 |
|
|
| 648,315 |
|
|
| 557,643 |
|
|
Compensation of third-party capital - rental |
| 786,312 |
| 2.9% |
| 788,577 |
| 3.3% |
| 767,595 |
| 3.8% |
Remuneration of interest on capital |
| 12,799,918 |
| 46.4% |
| 9,138,048 |
| 38.1% |
| 7,464,918 |
| 36.8% |
Dividends and interest on capital |
| 6,600,000 |
|
|
| 6,300,000 |
|
|
| 4,550,000 |
|
|
Profit Reinvestment |
| 5,982,477 |
|
|
| 2,624,064 |
|
|
| 2,784,563 |
|
|
Profit (loss) attributable to non-controlling interests |
| 217,441 |
|
|
| 213,984 |
|
|
| 130,355 |
|
|
Total |
| 27,585,507 |
| 100.0% |
| 23,966,915 |
| 100.0% |
| 20,270,876 |
| 100.0% |
Consolidated Financial Statements - December 31, 2018 136
| BANCO SANTANDER (BRASIL) S.A. |
| MANAGEMENT REPORT |
Dear Stockholders:
We present the Management Report to the Consolidated Financial Statements of Banco Santander (Brasil) S.A. (Banco Santander or Bank) for the period ended December 31, 2018, prepared in accordance with the International Financial Reporting Standards (IFRS) issued by the International Accounting Standards Board (IASB), and the interpretations issued by the IFRS Interpretations Committee (Current name of International Financial Reporting Interpretations Committee (IFRIC)).
1) Macroeconomic Environment
The Brazilian financial assets registered a smaller volatility in the last three months of 2018 as compared with their performance in the quarter before. However, exchange and interest rates as well as equity market prices oscillated within a still relatively wide range. The Bank considers that these oscillations had to do with the continuation of turbulences on the international front and the maintenance of an elevated level of uncertainty regarding economic policy guidelines that the newly elected Brazilian government is going to carry out. Nonetheless, Banco Santander reminds that Brazilian financial assets ended December 2018 at far better levels than those observed in September 2018.
As far as the international environment is concerned, Santander believes that some factors played a substantial role and thwarted a retreat in the risk aversion regarding emerging economies – except for Brazil, which registered an improvement on the back of the end of electoral process. The Bank notes that, notwithstanding the fact that the US and China have reached a verbal agreement about their trade relationship, the materialization of a formal document continues to be uncertain. Consequently, the fear that such an imbroglio may foster a slowdown in the world economic growth continued to be alive. On top of that, despite US economic data have continued to register favorable economic readings of late, first signs that the rhythm of expansion would have peaked have appeared and raised concerns that a significant slowdown may be on its way – especially due to lagged effects of prior interest rate hikes. Incidentally, Banco Santander highlights that market players have already started assigning higher chances of a slower interest rate hike process in the US throughout 2019. On the one hand, if such a backdrop would mean a slower narrowing of the interest rate differential to other economies – which, would mean less pressure over their currencies – on the other hand, it would reinforce the perception that a stronger slowdown in the US economy may be closer than previously thought. The impact of such a circumstance for the world is much more critical than the first one, in Santander’s opinion. Additionally, the Bank saw this factor as the seemingly reason for part of the weakening that the USD registered against other currencies.
For Banco Santander, both factors have kept global financial conditions far from their best moments and they have continued to weigh on the performance of emerging economies. The Bank believes that such a setback has hit less intensely the Brazilian financial assets because the country’s balance of payments continues to bear a sound position (high level of international reserves and sizeable net inflows of foreign direct investments, in tandem with a low level of external indebtedness). Santander Bank considers that such a mix explains part of the strengthening that the BRL has shown of late. The Bank emphasizes that attributes a positive bias regarding the perception of risk towards the Brazilian economy, as it consider that there is a mounting chance of fiscal improvements to materialize. However, the Bank reckons that the international environment should remain as a source of concern on the back of new key events that may potentially add nervousness to market participants – e.g., Brexit’s denouement and presidential elections in Argentina. Due to that, the Santander Bank believes the jittery international front should prevail slightly over the domestic milieu, thus leading to a mild increase in the risk aversion. As a result, the Bank foresees the FX rate to end 2019 at R$4.00 per US$.
Regarding the Brazilian economy, Banco Santander perception that the deterioration in the balance of risks on the international front and uncertainties referring to the domestic environment would hit both consumers and entrepreneurs’ confidence proved right, as activity indicators ran at a slow beat in the last three months of 2018. As a result, the Bank revised downwards its forecast for the GDP growth in 2018 once again (to 1.3% from 1.5% previously).
Notwithstanding this mild expansion observed in the last quarter of 2018, the Bank’s expectation for the Brazilian GDP growth in 2019 points towards an outcome in the 3.0% vicinity – a marginal review as compared with the previous 3.2% growth projection – on the back of solid macroeconomic fundamentals and spikes shown by consumer and entrepreneurs’ confidence indicators in the last months. Banco Santander reinforces that inflation remains under control (it ended 2018 below the targeted level and it is likely to do it so in 2019), balance of payments is favorable and there are incipient signs of a credit recovery. On the back of these factors, Santander Bank believes that the base interest rate should continue to run at low levels – for the Brazilian standards – for more than a while, especially as inflation expectations remains anchored and the level of idle capacity still runs high. Indeed, the Bank expects the base interest rate to become higher than now only by 2020, which means the Selic target rate should remain unchanged at 6.50% pa throughout 2019.
Banco Santander forecasts for growth, inflation and low interest rates are based on the continuity of the reform agenda in the Brazilian economy, especially in the fiscal field. Banco Santander reiterates the assessment that the willingness and commitment of the newly elected government to seek stabilization of the public debt as well as to maintain a sustainable economic policy will be fundamental for the country to achieve long-term economic and social development.
2) Performance
2.1) Net Income
CONSOLIDATED INCOME STATEMENTS | 12M18 | 12M17 | annual changes% | 4Q18 | 3Q18 | quarter changes % |
Interest Net Income (2) | 41,921.3 | 34,946.5 | 20.0 | 10,723.8 | 11,057.0 | -3.0 |
Income from equity instruments | 32.6 | 83.1 | -60.8 | 6.3 | 4.6 | 35.8 |
Income from companies accounted for by the equity method | 66.0 | 71.6 | -7.8 | 9.7 | 23.3 | -58.2 |
Fees and Comission (net) | 14,132.2 | 12,721.9 | 11.1 | 3,789.6 | 3,369.6 | 12.5 |
Gains (losses) on financial assets and liabilities (net) + Exchange | (5,589.3) | 1,574.1 | -455.1 | 1,673.6 | (1,602.7) | -204.4 |
Other operating expense (net) | (1,055.9) | (672.0) | 57.1 | (614.8) | (51.5) | 1,094.4 |
Total Income | 49,507.0 | 48,725.2 | 1.6 | 15,588.1 | 12,800.3 | 21.8 |
Administrative and personnel expenses | (16,792.1) | (16,120.6) | 4.2 | (4,340.5) | (4,257.0) | 2.0 |
Depreciation and amortization | (1,740.0) | (1,662.2) | 4.7 | (439.7) | (437.2) | 0.6 |
Provisions (net) | (1,999.6) | (3,309.2) | -39.6 | (517.6) | (747.1) | -30.7 |
Impairment losses on financial assets and other assets (net) | (13,221.7) | (12,795.0) | 3.3 | (3,622.1) | (3,007.0) | 20.5 |
Gains (losses) on disposal of assets not classified as non-current | (25.5) | (64.3) | -60.4 | (7.5) | (6.4) | 17.6 |
Gains (losses) on non-current assets held for sale not classified | 181.7 | (260.1) | -169.9 | 141.8 | 11.4 | 1,143.8 |
Operating Profit Before Tax (1) | 15,909.8 | 14,513.7 | 9.6 | 6,802.5 | 4,357.0 | 56.1 |
Income taxes | (3,109.9) | (5,375.6) | -42.1 | (3,036.6) | (1,116.2) | 172.0 |
Consolidated Net Income | 12,799.9 | 9,138.0 | 40.1 | 3,765.9 | 3,240.8 | 16.2 |
Consolidated Financial Statements - December 31, 2018 137
For a better understanding of the results in IFRS, below is the Operating Profit Before Tax and Income taxes, disregarding the hedge effect (according to item 1):
ADJUSTED OPERATING PROFIT BEFORE TAXES | 12M18 | 12M17 | annual changes% | 4Q18 | 3Q18 | quarter changes % |
Operating Profit Before Tax | 15,909.8 | 14,513.7 | 9.6 | 6,802.5 | 4,357.0 | 56.1 |
Income Tax and Social Contribution (hedge) | 5,611.8 | 729.5 | 669.2 | (1,393.2) | 1,584.5 | -187.9 |
PIS/Cofins (hedge) | 255.5 | 80.2 | 218.7 | (151.0) | (69.9) | 116.1 |
Adjusted Operating Profit Before Tax | 21,777.1 | 15,323.4 | 42.1 | 5,258.3 | 5,871.6 | 170.9 |
|
|
|
|
|
|
|
INCOME TAXES | 12M18 | 12M17 | annual changes% | 4Q18 | 3Q18 | quarter changes % |
Income taxes | (3,109.9) | (5,375.6) | -42.1 | (3,036.6) | (1,116.2) | 172.0 |
Income Tax and Social Contribution (hedge) | (5,611.8) | (729.5) | 669.2 | 1,393.2 | (1,584.5) | -187.9 |
PIS/Cofins (hedge) | (255.5) | (80.2) | 218.7 | 151.0 | 69.9 | 116.1 |
Adjusted Income taxes | (8,977.2) | (6,185.4) | 45.1 | (1,492.4) | (2,630.8) | -43.3 |
2.1.1) Foreign Exchange Hedge of the Grand Cayman Branch and the Subsidiary Santander Brasil EFC
Banco Santander operates branches in the Cayman Islands and Luxembourg and the subsidiary Santander Brasil Establecimiento Financiero de Credito, EFC, or “Santander Brasil EFC” which are used, mainly, to raise funds in the capital and financial foreign markets, providing credit lines that are extended to clients for trade-related financings and working capital. To protect the exposures to foreign exchange rate variations, the Bank uses derivatives. According to Brazilian tax rules, the gains or losses resulting from the impact of appreciation or depreciation of the local currency (Real) in foreign investments are nontaxable to PIS/Cofins/IR/CSLL, while gains or losses from derivatives used as hedges are taxable or deductible. The purpose of these derivatives is to protect the after-tax net income.
The different tax treatment of such foreign exchange rate differences results in a volatility on the operational earnings or losses and on the gross revenue tax expense (PIS/Cofins) and income taxes (IR/CSLL), as demonstrated below:
FOREIGN EXCHANGE HEDGE OF THE GRAND CAYMAN BRANCHES | 12M18 | 12M17 | annual changes% | 4Q18 | 3Q18 | quarter changes % |
Exchange Variation | 6,673.5 | 892.9 | 647.4 | (1,702.7) | 1,810.1 | -194.1 |
Derivative Financial Instruments | (12,540.9) | (1,702.6) | 636.6 | 3,246.7 | (3,324.7) | -197.7 |
Income Tax and Social Contribution | 5,611.8 | 729.5 | 669.2 | (1,393.2) | 1,584.5 | -187.9 |
PIS/Cofins - Tax Expenses | 255.5 | 80.2 | 218.7 | (151.0) | (69.9) | 116.1 |
2.1.2) Interest Net Income
At December 31, 2018, the increase compared to the previous year was mainly due to volume growth and average spread, customer funding and market activities.
2.1.3) Other Events
a) Post-employment Benefit Plan
On June 30, 2018, there was an increase in the cost contribution established in the Post-Employment Benefit Plan, which is calculated as a percentage of the total monthly compensation of members. The increase in the contribution resulted in a decrease in the past service cost, due to changes in the plan. The changes proposed in the Post-Employment Benefit imply a reduction in the present value of the obligations of the defined benefit plan, which is supported by actuarial valuations.
b) Recoverable Value Assessment
In the first half of 2018, Banco Santander recognized impairment losses in the amount of R$341 million on intangible assets in the acquisition and development of systems. The loss was recorded based on the performance of technical analysis, which demonstrated a significant reduction in expected future economic benefits on these assets.
Analysis of Income by Segment
The Bank has two segments, Commercial and the Global Wholesale Banking segment, which includes the Investment Banking and Markets operations, including departments cash and stock trades.
Below, the Bank presents table by segment:
Consolidated Financial Statements - December 31, 2018 138
OPERATING INCOME BEFORE TAXES BY SEGMENT | 12M18 | % in profit before tax | 12M17 | annual changes % | 3Q18 | % in profit before tax | 2Q18 | quarter changes % |
Commercial Bank (1) | 12,396.8 | 77.9 | 11,220.4 | 10.5 | 5,942.9 | 87.4 | 3,582.9 | -65.9 |
Global Wholesale Banking | 3,513.0 | 22.1 | 3,293.4 | 6.7 | 859.7 | 12.6 | 774.1 | -11.1 |
Operating Profit Before Tax | 15,909.8 | 100.0 | 14,513.8 | 9.6 | 6,802.6 | 100.0 | 4,357.0 | -56.1 |
(1)On December 31, 2018 and 2017, includes in the Commercial Bank, the foreign exchange hedge of investment in US Dollar, and excluding this effect, the Operating Income before taxation Adjusted for this segment was R$18,264.1 million and R$12,030.7 million, respectively.
General Expenses -The other administrative expenses totaled R$7,586.1 million and R$7,183.3 million in the fiscal year ended on December 31, 2018 and 2017, respectively. The personnel expenses totaled R$9,206.0 million and R$8,937.3 million in the fiscal year ended on December 31, 2018 and 2017, respectively. The other administrative expenses increased 5.6% and the personnel expenses increased 3.0% YoY. Changes in administrative expenses are mainly due to the increase in expenses with data processing, associated with greater transactionality and growth in the customer base and expenses with specialized technical services and third parties, mainly through the contracting of technology services.
GENERAL EXPENSES | 12M18 | 12M17 | annual changes% | 4Q18 | 3Q18 | quarter changes % |
Other Administrative Expenses | (7,586.1) | (7,183.3) | 5.6 | (1,983.2) | (1,954.0) | 1.5 |
Personnel Expenses | (9,206.0) | (8,937.3) | 3.0 | (2,357.3) | (2,303.0) | 2.4 |
Total General Expenses | (16,792.1) | (16,120.6) | 4.2 | (4,340.5) | (4,257.0) | 2.0 |
2.2) Assets and Liabilities
BALANCE SHEET |
|
|
| dec/18 | dec/17 | sep/18 vs. dec/17 changes % |
Cash and Balances with the Brazilian Central Bank |
|
|
| 31,716.3 | 34,124.8 | -7.1 |
Financial Assets Held For Trading |
|
|
| - | 86,271.1 | -100.0 |
Financial Assets Measured At Fair Value Through Profit Or Loss |
|
|
| 43,711.8 | - | 100.0 |
Financial Assets Measured At Fair Value Through Profit Or Loss Held For Trading |
|
|
| 68,852.3 | - | 100.0 |
Non-Trading Financial Assets Mandatorily Measured At Fair Value Through Profit Or Loss |
|
|
| 917.5 | - | 100.0 |
Other Financial Assets at Fair Value in Results |
|
|
| - | 1,692.1 | -100.0 |
Available-For-Sale Financial Assets |
|
|
| - | 85,823.4 | -100.0 |
Financial Assets Measured At Fair Value Through Other Comprehensive Income |
|
|
| 85,436.7 | - | 100.0 |
Held to maturity investments |
|
|
| - | 10,214.5 | -100.0 |
Loans and Receivables |
|
|
| - | 355,246.6 | -100.0 |
Financial Assets Measured At Amortized Cost |
|
|
| 417,478.7 | - | 100.0 |
Hedging Derivatives |
|
|
| 343.9 | 192.8 | 78.4 |
Non-Current Assets Held For Sale |
|
|
| 1,380.2 | 1,155.5 | 19.5 |
Investments in Associates and Joint Ventures |
|
|
| 1,053.3 | 866.6 | 21.6 |
Tax Assets |
|
|
| 31,565.8 | 28,825.7 | 9.5 |
Other Assets |
|
|
| 4,800.5 | 4,578.3 | 4.9 |
Tangible Asset |
|
|
| 6,589.0 | 6,509.9 | 1.2 |
Intangible Asset |
|
|
| 30,019.0 | 30,202.0 | -0.6 |
TOTAL ASSETS |
|
|
| 723,865.0 | 645,703.0 | 12.1 |
Financial Liabilities Held For Trading |
|
|
| - | 49,322.5 | -100.0 |
Financial Liabilities Measured At Fair Value Through Profit Or Loss Held For Trading |
|
|
| 50,939.0 | - | 100.0 |
Financial Liabilities Measured At Fair Value Through Profit Or Loss |
|
|
| 1,946.1 | - | 100.0 |
Financial Liabilities at Amortized Cost |
|
|
| 547,295.2 | 478,880.7 | 14.3 |
Hedge Derivatives |
|
|
| 223.5 | 163.3 | 36.9 |
Provisions |
|
|
| 14,695.9 | 13,986.9 | 5.1 |
Tax Liabilities |
|
|
| 8,074.8 | 8,248.0 | -2.1 |
Other Liabilities |
|
|
| 9,095.1 | 8,013.9 | 13.5 |
TOTAL LIABILITIES |
|
|
| 632,269.5 | 558,615.4 | 13.2 |
Total Equity |
|
|
| 91,595.5 | 87,087.6 | 5.2 |
TOTAL LIABILITIES AND STOCKHOLDERS' EQUITY |
|
|
| 723,865.0 | 645,703.0 | 12.1 |
Initial Adoption - IFRS 9
The quarterly statements, in accordance with IFRS, were prepared on March 31, 2018 for the first time in accordance with the requirements of IFRS9, with prospective adoption as allowed by the referred rule. The statements include special information for the registration of the new standard, such as:
- revision of the main balance sheet and demonstration headline nomenclatures in 2010;
- Detail of the new practices adopted by the Bank;
- for the power of the provision of the date of the financial instruments;
The reconciliation of inputs and equity effects of January 1, 2018 (opening) after the acquisition of the new accounting standard, is shown in item 2.4 Stockholders' Equity.
Consolidated Financial Statements - December 31, 2018 139
Funding
Total funding (deposits of Brazil Central Bank and deposits of credit institutions, deposits from clients, marketable debt securities, subordinated liabilities and debt instruments eligible to compose capital) reached R$497,512.4 million on December 31, 2018 and R$434,620.0 on December 31, 2017, increasing 14.5% in the fiscal year.
FUNDING | dec/18 | dec/17 | sep/18 vs. dec/17 changes % |
Deposits of Brazil Central Bank and Deposits of Credit Institutions | 99,022.8 | 79,374.7 | 24.8 |
Deposits from Clients | 304,197.8 | 276,042.1 | 10.2 |
Marketable Debt Securities | 74,626.2 | 70,247.0 | 6.2 |
Subordinated Liabilities | 9,885.6 | 519.2 | 1,803.9 |
Debt Instruments Eligible to Compose Capital | 9,779.9 | 8,436.9 | 15.9 |
Total Funding | 497,512.4 | 434,620.0 | 14.5 |
2.3) Loan Portfolio
LOANS AND RECEIVABLES |
|
|
| dec/18 | dec/17 | sep/18 vs. dec/17 changes % |
Loans and amounts due from credit institutions, gross |
|
|
| 79,620.6 | 65,278.9 | 22.0 |
Impairment losses |
|
|
| (13.6) | (69.0) | -80.4 |
Loans and amounts due from credit institutions, net |
|
|
| 79,607.0 | 65,209.9 | 22.1 |
Loans and advances to customers, gross |
|
|
| 321,314.0 | 287,829.2 | 11.6 |
Impairment losses |
|
|
| (20,241.8) | (15,409.1) | 31.4 |
Loans and advances to customers, net |
|
|
| 301,072.2 | 272,420.2 | 10.5 |
Debt instruments |
|
|
| 39,513.5 | 20,400.1 | 93.7 |
Impairment losses |
|
|
| (2,714.0) | (2,783.6) | -2.5 |
Debt instruments, net |
|
|
| 36,799.5 | 17,616.5 | 108.9 |
Total Loans and Receivables |
|
|
| 417,478.7 | 355,246.6 | 17.5 |
Impairment losses on financial assets (net)
The expenses for impairment losses, reduced by loans previously charged off, totaled R$12,713.5 million and R$12,338.1 million in the fiscal year ended on December 31, 2018 and 2017, respectively, decreasing 3.0%
2.4) Issuance of Debt Instruments Eligible to Compose Capital
On November 5, 2018, the Board of Directors approved the issuance of the equity instruments, which was held on November 8, 2018. Such issuance was in the form of Notes issued in US dollars, US$2,5 Billion, for payment in Tier I and Tier II of Reference Equity. The offer of these notes was made outside Brazil and the United States of America, for non-US Persons, based on Regulation S under the Securities Act, and was fully paid in by Santander España, controlling shareholder of Banco Santander Brasil. On the same date, the Board of Directors approved the redemption of the Tier I and Tier II notes issued on January 29, 2014, in the total amount of U$ 2,5 billion.
The specific characteristics of Notes issued to make up Tier I are: (a) Principal: US$1,250 Billion (b) Interest Rate: 7.25% p.a; (c) no maturity (perpetual); (d) Periodicity of payment of interest: semiannually from May 8, 2019.
The specific characteristics of Notes issued to make up Tier II are: (a) Principal: US $ 1,250 Billion; (b) Interest Rate: 6.125% p.a.; (c) Maturity Term: on November 8, 2028; and (d) Periodicity of payment of interest: semiannually, as of May 8, 2019.
Notes have the following common characteristics
(a) Unit value of at least US$150 thousand and in integral multiples of US$1 thousand in excess of such minimum value.
(b) The Notes may be repurchased or redeemed by Banco Santander after the fifth anniversary as of the date of issue of the Notes, at the sole discretion of the Company or as a reult of changes in the tax legislation applicable to the Notes; or at any time, due to the occurrence of certain regulatory events.
On December 18, 2018, the Bank issued an approval for the Notes to comprise Tier I and Tier II of Banco Santander's Referential Equity, as of that date, as well as the repurchase of the notes issued on January 29, 2014.
2.5) Stockholders’ Equity
In December 2018, Banco Santander consolidated stockholders’ equity presented an increase of 5.2%, compared to December, 2017.
The variance of stockholders’ equity is due, mainly, to the increase of other comprehensive income in the amount of R$192.3 million and which includes as the main event the changes in fair value of certain operations, the net income of the period in the amount of R$12,799.9 million and reduced by the effects of the first adoption of IFRS 9 in the amount of R$1,541.8 million and the highlight of Interest on Capital in the amount ofR$4,080.0 million and Dividends in the amount of R$2,520.0 million.
Consolidated Financial Statements - December 31, 2018 140
Initial Adoption - IFRS 9
Reconciliation of the effects on Stockholders' Equity of January 1, 2018 (opening) after the adoption of the new accounting standard.
Reconciliation of Stockholders' Equity |
|
Stockholders' equity before adjustments to IFRS 9 (12/31/2017) | 87,088 |
Allowance for doubtful accounts | (2,149) |
Provision for contingent commitments | (675) |
Remesuration of assets arising from the new categories | 18 |
Others | 238 |
Deferred income tax | 1,026 |
Stockholders' equity after adjustments to IFRS 9 (01/01/2018) | 85,546 |
Treasury Shares
In the meeting held on November 1, 2018, the Bank’s Board of Directors approved, in continuation of the buyback program that expired on November 1, 2017, the buyback program of its Units and ADRs, by the Bank or its agency in Cayman, to be held in treasury or subsequently sold.
The Buyback Program will cover the acquisition up to 37,753,760 Units, representing 37,753,760 common shares and 37,753,760 preferred shares, or the ADRs, which, on December 31, 2018, corresponded to approximately 1% of the Bank’s share capital. On December 31, 2018, the Bank held 362,227,661 common shares and 390,032,076 preferred shares being traded.
The Buyback has the purpose to (1) maximize the value creation to stockholders by means of an efficient capital structure management; and (2) enable the payment of officers, management level employees and others Bank’s employees and companies under its control, according to the Long Term Incentive Plans. The term of the Buyback Program is 12 months counted from November 6, 2018, and will expire on November 5, 2019.
|
|
|
|
| dec/18 | dec/17 |
|
|
|
|
| Quantity | Quantity |
|
|
|
|
| Units | Units |
Treasury shares at beginning of the period |
|
|
|
| 1,773 | 25,786 |
Cancellation |
|
|
|
| - | (32,276) |
Shares Acquisitions |
|
|
|
| 15,816 | 12,768 |
Payment - Share-based compensation |
|
|
|
| (4,272) | (4,505) |
Treasury shares at end of the period |
|
|
|
| 13,317 | 1,773 |
Subtotal - Treasury Shares in thousands of reais |
|
|
|
| R$ 460,550 | R$ 148,246 |
|
|
|
|
| R$ 882 | R$ 194 |
Balance of Treasury Shares in thousands of reais |
|
|
|
| R$ 461,432 | R$ 148,440 |
Cost/Share Price |
|
|
|
| Units | Units |
Minimum cost |
|
|
|
| R$ 7.55 | R$ 7.55 |
Weighted average cost |
|
|
|
| R$ 28.59 | R$ 24.41 |
Maximum cost |
|
|
|
| R$ 43.84 | R$ 32.29 |
Share Price |
|
|
|
| R$ 42.70 | R$ 31.88 |
In the fiscal year ended on December 31, 2018 there were highlights of Dividends and Interest on Capital, as below:
DIVIDENDS AND INTEREST ON CAPITAL | 12M18 | 12M17 |
Interest on capital | 4,080.0 | 3,800.0 |
Intercalary Dividends | 2,520.0 | 2,500.0 |
Total | 6,600.0 | 6,300.0 |
2.6) Basel Index
Financial institutions are required by Bacen to maintain Regulatory Capital (PR), Tier I and Principal Capital consistent with their risk activities, higher than the minimum requirement of the Regulatory Capital Requirement, represented by the sum of the partial credit risk, market risk and operational risk.
As required by Resolution CMN 4,193/2013, the requirement for Regulatory Capital for the base year 2017 was 10.5%, composed by 9.25% of Minimum Regulatory Capital plus 1.25% of Additional Conservation Buffer. Considering this additional, the Tier I increased to 7.25% and the Minimum Main Capital to 5.75%.
For the base year 2018, the requirement for Regulatory Capital increased to 11.0%, including 8.625% of Minimum Regulatory Capital and a further 2.375% of Principal Capital Additional, being 1.875% of the additional conservation portion and 0.5% of the additional systemic portion. The Tier I reaches 8.375% and the Minimum Principal Capital 6.875%.
Consolidated Financial Statements - December 31, 2018 141
The Basel ratio is determined in accordance with the Financial Statements of the Prudential Conglomerate prepared in accordance with accounting practices adopted in Brazil, applicable to institutions authorized to operate by Bacen, as shown bellow:
BASEL INDEX % | dec/18 | dec/17 |
Basel Index - consolidated | 15.06 | 15.83 |
2.7) Main Subsidiaries
The table below presents the balances of total assets, net assets, net income and credit operations for the period ended December 31, 2018 the principal subsidiaries of Banco Santander portfolio:
SUBSIDIARIES | Total | Stockholders' Equity | Net | Loan Portfolio(1) | Ownership/Interest (%) |
Aymoré Crédito, Financiamento e Investimento S.A. | 45,107.1 | 2,293.8 | 806.3 | 39,163.2 | 100.00% |
Getnet Adquirência e Serviços para Meios de Pagamento S.A. | 27,139.2 | 2,414.3 | 482.8 | 0.0 | 88.50% |
Santander Leasing S.A. Arrendamento Mercantil | 7,090.6 | 6,126.9 | -48.1 | 1,836.5 | 99.99% |
Banco Bandepe S.A. | 6,339.1 | 4,385.8 | 6.0 | 0.0 | 100.00% |
Santander Brasil, Establecimiento Financiero de Credito, S.A. | 3,599.1 | 3,531.0 | 96.3 | 1,624.0 | 100.00% |
Santander Corretora de Seguros, Investimento e Serviços S.A. | 2,760.8 | 2,575.7 | 366.6 | 0.0 | 100.00% |
Santander Corretora de Câmbio e Valores Mobiliários S.A. | 1,061.1 | 632.2 | 31.6 | 0.0 | 100.00% |
Balances reported above are in accordance with accounting practices established by Brazilian Corporate Law and standards established by the CMN, the Bacen and document template provided in the Accounting National Financial System Institutions (Cosif) and the CVM, that does not conflict with the rules of Bacen.
3) Other Events
3.1) Post-employment Benefit Plan
On June 30, 2018, there was an increase in the cost contribution established in the Post-Employment Benefit Plan, which is calculated as a percentage of the total monthly compensation of members. The increase in the contribution resulted in a decrease in the past service cost, due to changes in the plan. The changes proposed in the Post-Employment Benefit imply a reduction in the present value of the obligations of the defined benefit plan, which is supported by actuarial valuations.
3.2) Recoverable Value Assessment
In the first half of 2018, Banco Santander recognized impairment losses in the amount of R$341 million on intangible assets in the acquisition and development of systems. The loss was recorded based on the performance of technical analysis, which demonstrated a significant reduction in expected future economic benefits on these assets.
3.3) Non-Current Assets Held for Sale
On June 30, 2018, the Management of Banco Santander revalued its strategy on the investment in the company Real TJK Empreendimento Imobiliário SA (currently called Rojo Entretenimento SA), a company that owns the Santander Theater, and decided to transfer the item non-current assets held for sale to interests in affiliates and subsidiaries. As of December 31, 2018, the amount of this item was R$0 (12/31/2017 - R$131 million).
3.4) Opening of the branch in Luxembourg
On June 9, 2017, Banco Santander obtained authorization from the Central Bank to set up an agency in Luxembourg with a capital of US $ 1 billion, with the objective of complementing the foreign trade strategy for corporate clients (large Brazilian companies and their operations abroad) and offer financial products and services through an offshore entity that is not established in a jurisdiction with favored taxation and that allows for the increase of funding capacity. The opening of the agency was authorized by the Luxembourg Minister of Finance on March 5, 2018. On April 3, 2018, after the reduction of the capital of the Cayman agency in the equivalent amount, the value of US$1 billion was allocated to capital of the Luxembourg branch.
3.5) Adhesion to Tax Debt Installment Programs
In October 2017 the Bank also joined the Incentive Payment Programs and Installments issued by the cities Rio de Janeiro and São Paulo. Accessions to the programs include lawsuits and administrative proceedings related to ISS of the periods from 2005 to 2016, in the total amount of R$293 million. As a consequence were registered income of R$435 million. The result recorded a reversal of provisions, net of tax effects, in the amount of R$96 million.
In August 2017, Banco Santander adhered to the program for the payment of tax and social security debts (in accordance with MP 783/2017).
Adherence to the program included administrative proceedings related to IRPJ, CSLL and Social Security Contributions referring to the base periods from 1999 to 2005, in the total of R$534 million, after the benefits of the installment program, of which R$192 million was paid in August 2017 and R$300 million in January 2018.
3.6) Market Maker Services
On December 28, 2017, the Bank announced the hiring of BTG Pactual Corretora de Títulos e Valores Mobiliários S.A. as the market makerservices provider for the Stocks Deposits Certificates (Units) issuance by the Bank, under the code SANB11, traded by B3 – Brasil, Bolsa, Balcão S.A. (B3 S.A.)(current name of BM&Bovespa – Bolsa de Valores, Mercadorias e Futuros), which is replacing Brasil Plural Corretora de Câmbio, Títulos e Valores Mobiliários S.A..The new market maker has began its activities on January 2, 2018.
Consolidated Financial Statements - December 31, 2018 142
3.7) Public offering of Qatar Holding LLC
On April 11, 2017, Banco Santander in Brasil informed its stockholders and the market in general, in furtherance of the material facts disclosed on March 28, 2017 and April 6, 2017, the settlement of the secondary public offering for the distribution of 80,000,000 units issued by Banco Santander in Brasil and held by Qatar Holding LLC (Selling Stockholder), including in the form of American Depositary Shares (ADSs), having been allocated 22,000,000 Units for the Brazilian offering and 58,000,000 ADSs for the international offering. The price per Unit was set at R$25.00, resulting on a total amount of R$2 billion. Additionally, the amount of Units of the international offering initially offered was increased by an additional batch of 12,000,000 Units, exclusively in the form of ADSs also held by the Selling Stockholder.
3.8) Corporate Restructuring
Several social movements were implemented in order to reorganize the operations and activities of entities according to the business plan of the Conglomerate Santander.
a) Acquisition of residual equity interest in Getnet S.A.
At December 19, 2018, Banco Santander and the minority shareholders of Getnet S.A. entered into an amendment to the Stock Sale and Purchase Agreement and Other Covenants of Getnet S.A., in which Banco Santander committed to purchase all of the shares owned by the minority shareholders, corresponding to 11.5% of the Getnet S.A. stock capital, by the amount of R$1,431 (one billion and four hundred and thirty one million Brazilian Reais). This acquisition was authorized by BACEN on February 18 and closed on February 25, 2019, becoming Banco Santander the holder of 100% of the shares of Getnet S.A.
b) Formation of Esfera Fidelidade S.A.
On August 14, 2018, Esfera Fidelidade was incorporated, with equity fully owned by Banco Santander. Esfera Fidelidade will act in the development and management of customer loyalty programs. On November 26, 2018, Esfera Fidelidade had its capital stock increased in the amount of R$10,000, amounting the full share capital of R$10,001 (ten million and one thousand), divided into 10,001,000 (ten million and one thousand) nominative common shares without par value, entirely held by Banco Santander. The company started its operation in November 2018.
c) Investment in Loop Gestão de Pátios S.A.
On June 26, 2018, Webmotors S.A., company with 70% interest indirectly owned by Banco Santander, signed an investment agreement with Allpark Empreendimentos, Participações e Serviços S.A. and Celta LA Participações S.A., in order to acquire an equity interest corresponding to 51% of the capital stock of Loop Gestão de Pátios S.A., through capital increase and issuance of new shares of Loop to be fully subscribed and paid-in by Webmotors. Loop operates in the segment of commercialization and physical and virtual auction of motor vehicles. On September 25, 2018, the transaction was completed with increase of the capital stock, in the amount of R$23,900, through issuance of shares representing 51% of equity interest in Loop, which were fully subscribed and paid-in by Webmotors.
d) Formation of BEN Benefícios e Serviços S.A.
On June 11, 2018, BEN Benefícios, with equity fully owned by Banco Santander, was incorporated, to act in the supply and administration of meal, food, transportation, cultural and similar vouchers, via printed or electronic and magnetic cards. In the EGM held on August 1, 2018, BEN Benefícios had its capital increased in R$ 45,000, passing the capital stock to the amount of R$45,001, divided into 45,001,000 (forty-five million and one hundred thousand) registered common shares without par value, fully owned by Banco Santander. Banco Santander estimates that the company’s operations will begin at the first quarter of 2019.
e) Acquisition of Isban Brasil S.A. and Produban Serviços de Informática S.A.
Banco Santander purchased, on February 19 and, 2018, respectively, the totality of shares of Isban Brasil, formerly held by Ingeniería de Software Bancário, S.L., and of Produban Serviços de Informática, formerly held by Produban Servicios Informáticos Generales, S.L., for the amount of R$61 million and R$4 million, respectively. The parties involved in the transaction had Banco Santander, S.A. (Santander Spain) as common indirect controller, being certain that such operations were accomplished under market conditions. At the EGM held on February 19, 2018, was approved the capital increase of Isban Brasil in the amount of R$33 million, through the issuance of 11,783,900 shares, without par value, entirely subscribed and paid in by Banco Santander. On February 28, 2018, the company Isban Brasil was merged into Produban Serviços de Informática S.A. and on the same date, Produban Serviços de Informática had its corporate name changed to Santander Brasil Tecnologia S.A. Additionally, on February 28, 2018, Produban Servicios Informáticos Generales, S.L. (currently named Santander Global Technology, S.L.) approved the merger of the spin-off share of Produban Serviços de Informática into Produban Brasil Tecnologia e Serviços de Informática Ltda. (currently named Santander Global Technology Brasil Ltda.).
f) Sale of equity interest in BW Guirapá I S.A.
On December 22, 2017, Santander Corretora de Seguros, Cia. de Ferro Ligas da Bahia - Ferbasa SA and Brazil Wind S.A. executed agreement for the sale of 100% of the shares issued by BW Guirapá I S.A. held by Santander Corretora de Seguros and Brazil Wind to Ferbasa. The basic price of the total sale was R$414 million, and an additional amount of up to R$35 million may be paid if future targets stipulated in the Contract are met. This investment was written-off and, as consequently, the assets and liabilities of BW Guirapá I and its subsidiaries are no longer consolidated in the Conglomerate Balance Sheet as of January 1, 2018. On April 2, 2018, the transaction was concluded.
g) Formation of Santander Auto S.A.
On December 20, 2017, Banco Santander and HDI Seguros S.A. (HDI Seguros), executed documents to form a partnership for the issuance, offering and sale of auto insurance, in a 100% digital way, through creation of a new insurance company - Santander Auto, to be held 50% by Sancap, a company controlled by Banco Santander, and 50% by HDI Seguros. On February 2, 2018 the partnership was approved by the Administrative Council of Economic Defense (Conselho Administrativo de Defesa Econômica – CADE), on April, 30, 2018, was approved by the Brazilian Central Bank and, on May, 15, 2018, SUSEP's prior approval was obtained. On October 9, 2018, through transformation of the corporate vehicle L.G.J.S.P.E. Investments and Participations S.A., Sancap and HDI Seguros formed Santander Auto S.A., with capital of R$15 million. On January 9, 2019, Susep granted to Santander Auto the authorization to operate insurance throughout national territory.
h) Formation of Gestora de Inteligência de Crédito S.A.
On April 14, 2017, the definitive documents necessary for the creation of a new credit bureau, Gestora de Inteligência de Crédito, were signed by the stockholders, whose control will be shared among the stockholders who will hold 20% of the its share capital each. In the EGM held onOctober 5, 2017, the capital increase of Gestora de Crédito was approved in the total amount of R$285 million, so that the capital stock increased from R$65 million to R$351 million. The Company will develop a database with the objective of aggregating, reconciling and processing registration and credit information of individuals and legal entities, in accordance with the applicable standards, providing a significant improvement in the processes of granting, pricing and directing credit lines. The Bank estimates that the Company will be fully operational in 2019.
Consolidated Financial Statements - December 31, 2018 143
i) Formation of Banco Hyundai Capital Brasil S.A.
On April 28, 2016, Aymoré CFI and Banco Santander executed with Hyundai Capital Services, Inc. (Hyundai Capital) the necessary documents for the formation of Banco Hyundai and an insurance brokerage company to provide, respectively, auto finance and insurance brokerage services and products to clients and Hyundai dealerships in Brazil. Banco Hyundai shall have an equity interest of 50% held by Aymoré CFI and 50% held Hyundai Capital. On April 11, 2018, the parties incorporated, with an equity interest of 50% held by Aymoré CFI and 50% held by Hyundai Capital, a non-operational entity named BHJV Assessoria e Consultoria em Gestão Empresarial Ltda. On May 8, 2018, Aymoré CFI and Hyundai Capital took resolution on the conversion of BHJV Assessoria into the non-operational joint-stock corporation named Banco Hyundai Capital Brasil S.A., as well as the capital stock increase in R$99,995, passing to the amount of R$100,000, divided into 100,000,000 (one hundred million) nominative common shares without par value. On December 13, 2018, Banco Hyundai Capital Brasil S.A. incorporation procedure was finalized and its operation as a financial institution is subject to the issuance of an authorization to operate by Bacen. Aymoré CFI holds the operational control of such entity.
On February 21, 2019, the Brazilian Central Bank granted to Banco Hyundai Capital Brasil S.A. the authorization to operate as a banking entity. Expectation is that Banco Hyundai will be able to operate within the first semester of 2019 (Note 11).
j) Creation of PI Distribuidora de Títulos e Valores Mobiliários S.A.
On May 3, 2018, Santander Finance Arrendamento Mercantil S.A., an indirectly controlled subsidiary of Banco Santander, was converted into a distribution company of bonds and securities and had its corporate name changed to SI Distribuidora de Títulos e Valores Mobiliários S.A. The conversion process of approved by Bacen on November 21, 2018. On December 17, 2018, SI Distribuidora de Títulos e Valores Mobiliários S.A. had its corporate name changed to PI Distribuidora de Títulos e Valores Mobiliários S.A., being the corporate name change process approved by Bacen on January 22, 2019.. Banco Santander expects to have the company fully operational within the first quarter of 2019.
k) Other Corporate Movements
The following corporate acts were also carried out:
• In the EGM held on March 23rd, 2018, the company Atual Companhia Securitizadora de Créditos Financeiros had its name changed to Atual Serviços de Recuperação de Créditos e Meios Digitais S.A. In the same EGM, was resolved the company’s capital increase in the amount of R$150 million, amounting the full share capital of R$270 million, divided into 265,419,392 nominative common shares and without par value, entirely held by Banco Santander.
• On November 30, 2017, the merger of Merger Santander Serviços by Santander Corretora de Seguros was approved. With the extinction of Santander Serviços, Santander Corretora de Seguros became its successor in all its rights and obligations. On November 17, 2017, was formalized the acquisition by Banco Santander of the participation by Santusa Holding, S.L. (equivalent to 39.35%) in the share capital of Santander Serviços. Thus, Banco Santander becomes the holder of 99.99% of the shares of Santander Serviços.
• On October 26, 2017, after the Brazilian Central Bank issued an official letter with its positive manifestation in favor of the transaction, the acquisition by Banco Santander from all of the shares of Webcasas S.A. held by Santander Serviços was formalized. On November 1st, 2017, Webcasas S.A. was renamed to Santander Holding Imobiliária S.A. and had its corporate purpose altered to include activities related to real estate business.
• On September 29, 2017, the merger of Santander Brasil Advisory by Santander Corretora de Seguros was approved. With the extinction of Santander Brasil Advisory, the Santander Corretora de Seguros became its successor in all its rights and obligations. On August 31, 2017, the merger of Santander Microcrédito by Santander Corretora de Seguros was approved. With the extinction of Santander Microcrédito, Santander Corretora de Seguros became its successor in all its rights and obligations.
4) Strategy
Banco Santander Brasil is the only international bank with scale in the country. The Bank is convinced that the best way to grow in a profitable, recurring and sustainable manner is by providing excellent services to enhance customer satisfaction levels and attract more customers, making them more loyal. The actions are based on establishing close and long-lasting relationships with customers, suppliers and shareholders. To accomplish that goal, the purpose is to help people and businesses prosper by being a Simple, Personal and Fair Bank, guided by the following strategic priorities:
• Increase customer preference and loyalty by offering targeted, simple, digital and innovative products and services through a multi-channel platform.
• Improve the profitability, recurrence and sustainability of the results by growing in businesses with greater revenue diversification, aiming to strike a balance betthe Bank en loan, funding and services, while maintaining a preemptive risk management approach and rigorous cost control.
• Be disciplined with capital and liquidity to preserve the solidity, face regulatory changes and seize growth opportunities.
• Achieve profitable market share gains through the robust portfolio, optimize the ecosystem and launch new ventures consistently improving the customer experience.
Consolidated Financial Statements - December 31, 2018 144
The Bank ended 2018 with another year of solid results, which allothe Bank d the Bank to achieve higher profitability. This remarkable performance can be attributed to the expansion of the customer base, thanks to improved experience and satisfaction, greater operational efficiency and a high level of employee engagement, providing sustainability for the business. The Bank believes that, based on the clearly-defined business model, the Bank has have room to keep capturing market opportunities. The Bank highlights the following accomplishments in the past quarter:
People
The people are the brand. Throughout the year, the Bank reached important milestones that reflect the commitment to engaging the employees and strengthening the internal culture:
Horizontal management: in 2018, the monthly “Breakfast with Rial” had the attendance of approximately 40% of the employee base per event (via the Santander Now app and the intranet).
Santander Academy: enctheages employees to assume a proactive role in technical training and has 67% of total employees who are internal multipliers.
Santander Star: non-financial recognition program that rewards employees who make exceptional achievements in five categories – Result, Innovation, Collaboration, Service and Risk Pro.
3rd consecutive year among the Best Companies to Work For in Brazil, according to the GPTW survey (+14 positions YoY).
Customer loyalty
In 2018, the Bank was pioneers in the Brazilian financial industry in announcing the NPS (Net Promoter Score), which reached 57 points this quarter, up 14 points YoY.
As a result of the actions, the Bank continued to expand the customer base, highlighted by active account holders, who have been growing for the last 43 consecutive months.
Retail
Cards: the Bank closed 4Q18 with strong growth of 20.4% YoY in total turnover. In the quarter, the Bank promoted campaigns to stimulate card usage, such as the “Hit & Win Promotion” and “Ping Pong of Prizes.” In 2018, the Bank further bolstered the offering: Santander Way remained top rated in app stores (4.8 stars in Apple Store and 4.6 stars in Google Play), while the Bank also launched Santander Pass with NFC technology for contactless payments, and “Supercrédito” to enable access to personal loans by non-account holders. Additionally, customers can get the cards either digitally or at the branches. All these actions contributed to the increase in the loan portfolio market share, which reached 13.1% (Brazilian Central Bank, as of November/18), +1.1 p.p. YoY.
Payroll Loans: the Bank continues to enjoy market share gains in the loan portfolio, which reached 9.9% (Brazilian Central Bank, as of November/18), + 1.8 p.p. YoY. The Bank highlights origination through digital channels, which saw the number of contracts grow 1.1x QoQ in this quarter.
Real Estate: over the these of the year the Bank intensified the commercial exposure of this product in the media. At the same time, the Bank enhanced the experience through a fully-digital channel that allows the customer to close the deal. Moreover, the industrialization of the internal processes is already showing results, bringing greater efficiency and agility. As consequence, retail origination advanced 2.1x YoY (Brazilian Central Bank, cumulative figures from January to November 2018).
Agro: In line with the process of expanding into Brazil's countryside and the goal of being the best agribusiness bank in the country, the Bank inaugurated 4 Agro stores this quarter, totaling 21 spaces. In parallel, the Bank refined the service with exclusive managers and became more efficient – the lead time, dropped by 46% in 2018. Finally, the Bank improved the position in agribusiness credit notes (“LCA”), with a market share of 7.8% (Brazilian Central Bank, as of November/18), +2.4 p.p. YoY.
Getnet: the specialized business model, which is integrated with the bank, coupled with quality service and innovations have been the greatest assets. During the year, the Bank developed a second-to-none e-commerce platform modeled on the “one-stop shop” concept. The Bank launched the digital POS, which helps customers run their own businesses. Within the scope of SuperGet, the Bank began offering the bank slip payment option at the time of purchase and intensified the commercialization of the product for self-employed workers and entrepreneurs. All these factors contributed to the 32% growth in total revenues in 2018. The market share reached 14.4% (ABECS - Acquirers, as of September 2018), +2.9 p.p. YoY.
SME: The strategy of developing sector-oriented offerings, with personalized service, combined with the “Avançar” Program, places the Bank in a prime position to keep growing the customer base and loyalty in a consistent manner. These drivers have enabled the Bank to grow to more than 1 million customers, while the market share in loan portfolio expanded by 0.4 p.p. in tthe Bank lve months to 11.4% (Brazilian Central Bank, as of September/18).
Strengthening leading businesses
Santander Financiamentos: the Bank remains leaders in this segment, with a market share of 23.7% (Brazilian Central Bank, as of November/18), +0.6 p.p. in tthe Bank lve months. The digital platform “+Negócios,” couple with the good performance of the partnerships andthe commercial service, are the main driving forces behind this evolution. In order to consolidate the relationship with customers, the Bank has articulated initiatives, such as the creation of the “+Fidelidade” program, an incentive model for shop owners based on loyalty level, and the improvement of the after-sales jtheney for end-customers. In this quarter, the Bank started integrating the same digital experience from the Financing unit into Retail, with the goal of enhancing efficiency in the loan application process for the account holders.
Consolidated Financial Statements - December 31, 2018 145
Webmotors: the Cockpit tool continues to generate positive results, such as a 25% increase in the volume of contacts by sellers, allied to a 15% decrease in the time of these contacts with end-customers. With that, the Bank experienced a 30% growth in the number of dealerships with a high level of engagement with us.
Santander Corporate & Investment Banking (SCIB) - The Bank is still recognized as leaders:
Financial advisory for financing and concession auctions and finance structuring, according to Anbima (Financial Advisory – leadership since 2008, ANBIMA 2017) advisor in Americas and Project Finance (MLA) in LATAM according to Dealogic (Dealogic as of 2018).
In the foreign exchange market according to the Brazilian Central Bank (Cumulative figures from January to November 2018).
Santander Corretora ranked 1st (considering the performance from January to December 2018) in stock picking in 2018 by Valor Econômico.
Innovations
Santander On: a new free feature was made available on the app, with the purpose of being transparent with customers and providing financial education – Santander On, which shows the best way to use credit lines, offers details on financial commitments with the bank, provides information on Taxpayer ID (“CPF”) regularity, makes it easier to update personal income information and simplifies credit limit management.
Black Week Santander: In November the second edition of the campaign was carried out with more than 45 types of products and services offered for the PF and PJ segments. The campaign is in line with the repositioning of the brand and has brought remarkable results. Sales grew in all channels, mainly in real estate and working capital products, which expanded, on average, over 200% over the same period of the previous month. Among the sales in the digital channels, payroll-deductible loans performed outstandingly.
Work Café: the Bank inaugurated Work Café, which is completely different from traditional branches, as it integrates the concepts of digital branch and modern architecture. The space provides a groundbreaking interaction experience with banking services, offering free Wi-Fi, cafeteria, coworking area and recycling ATM, among others. The goal is to build closer relationships with customers and prospects in the individuals (middle and high income) and SME segments.
New ventures
Ben Benefícios e Serviços: it will operate in the benefits industry, starting with food and meal vouchers, contributing to the optimization of the ecosystem. The proposal is to offer a better experience for end-customers, in addition to making partnerships with companies’ HR departments and commercial establishments. Ben will use the Visa Vale brand, which is widely recognized in this segment and brings the Bank innovation. Furthermore, the Bank see potential synergies with the wholesale, SME and individuals segments, as the Bank all as with Getnet.
Pi: the Bank started the pilot of the digital investment platform that caters to customers looking for more autonomy and practicality in the purchase of investment products. Pi has access to products from several institutions and complements the investment offering, reaching both account and non-account holders.
Sustainability
Among the results related to Sustainability, the Bank highlights the leadership in microcredit through the “Prospera” program, whose loan portfolio grew 51% YoY at the end of December 2018, reaching R$642 million. In Higher Education, the Bank reinforced the social responsibility through “Preparadão Universia,” an event that brought together more than 7,000 students. In Brazil, the Bank has awarded over 14,000 scholarships since 2015. In the field of socio-environmental financing, the Bank was the first bank to launch an exclusive financing line for electric bicycles, the mobility CDC, which provides funding for up to 100% of its acquisition cost, with a maximum term of 48 months, for individuals.
5) Rating Agencies
Banco Santander is rated by international ratings agencies and the ratings assigned reflect many factors including management quality, operating performance and financial strength, as well as other factors related to the financial sector and economic environment in which the Bank is inserted, having the long-term foreign currency rating limited to the sovereign rating. The table below presents the ratings assigned by the rating agencies Standard & Poor's and Moody's:
Consolidated Financial Statements - December 31, 2018 146
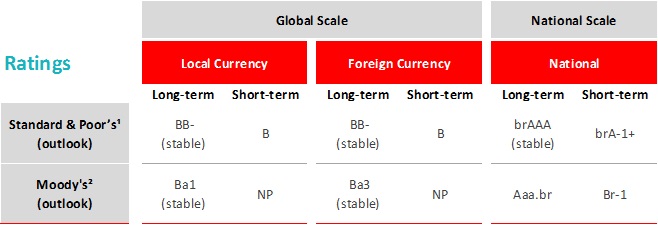
1) Last updated November 29, 2018.
2) Last updated February 18, 2019.
6) Corporate Governance
The Board of Directors of Banco Santander has met and resolved:
On January 29, 2019, to approve the Individual and Consolidated Financial Statements of Banco Santander, prepared in accordance with accounting practices adopted in Brazil, applicable to institutions authorized to operate by Central Bank, respect to the period ended December 31, 2018.
On December 28, 2018, to approve the proposal for declaration and payment of dividends, in the gross amount of R$1,920 million, for payment as of February 26, 2019, without any indexation.
On January 28, 2019, approve the proposal for a maximum variable remuneration to be paid to the executive officers for the year ended December 31, 2011 and the proposal of the maximum amount to be distributed to the managers as profit sharing, pursuant to article 152 of the Law nº 6.404/76.
On January 23, 2019, approve the declaration and annual review of the Risk Appetite of Banco Santander and its subsidiaries, both in relation to the proposed new limits and in relation to the Risk Appetite review.
On December 28, 2018, to approve the proposal for declaration and payment of interest on equity, in the gross amount of R$2,880 million, for payment as of February 26, 2019, without any indexation.
On December 20, 2018, to approve the (i) appointment of Ms. Patricia Souto Audi to the position of Officer without specific designation, for a complementary term of office; and (ii) transition of Mr. Alberto Monteiro de Queiroz Netto to the position of Executive Vice-President of the Company.
On November 30, 2018, to approve the dismissal of Mr. Roberto de Oliveira Campos Neto from position of Company’s Officer without specific designation.
On November 1, 2018, to approve the new repurchase program of shares depositary receipts (“Units”) or American Depositary Receipts (“ADRs”) issued by Banco Santander (“Repurchase Program”), pursuant to CVM Normative Instruction No. 567, of September 17, 2015.
On October 30, 2018, to approve the Individual and Consolidated Financial Statements of Banco Santander, prepared in accordance with accounting practices adopted in Brazil, applicable to institutions authorized to operate by the Central Bank and the Interim Financial Statements prepared in accordance with the International Financial Reporting Standards (IFRS), IASB and interpretations of the IFRS Interpretation Committee respect to the period ended September 30, 2018.
On September 28, 2018, to approve the proposal for declaration and payment of interest on equity, in the gross amount of R$600 million, for payment as of October 26, 2018, without any indexation.
On August 28, 2018, to approve the appointment of Ms. Monique Silvano Arantes Bernardes as Company's Ombudsman for a one (1) year term of office.
On July 24, 2018, to approve the Individual and Consolidated Financial Statements of Banco Santander, prepared in accordance with accounting practices adopted in Brazil, applicable to institutions authorized to operate by the Central Bank and the Interim Financial Statements prepared in accordance with the International Financial Reporting Standards (IFRS), IASB and interpretations of the IFRS Interpretation Committee respect to the period ended June 30, 2018.
On July 24, 2018, to approve the appointment of Mr. Fernando Carvalho Botelho de Miranda to the position of Company’s Officer without specific designation, for a complementary term of office.
On July 3, 2018, to approve the appointment of Mr. Ramon Sanchez Santiago to the position of Company’s Officer without specific designation, for a complementary term of office.
On June 26, 2018, to approve the proposal for declaration and payment of dividends, in the gross amount of R$600 million, for payment as of July 27, 2018, without any indexation.
On May 29, 2018, to approve the appointment of Mr. Valdemir Moreira de Lima as Company's Ombudsman for a one (1) year term, with effect as of May 9, 2018.
On June 14, 2018, to approve the appointment of Mr. Alberto Monteiro de Queiroz Netto to the position of Company’s Officer without specific designation, for a complementary term of office.
On May 10, 2018, to approve the appointment of the Company's Audit Committee members for a one (1) year term, namely: Ms. Deborah Stern Vieitas, as Coordinator; Mr. Luiz Carlos Nannini, as a qualified technical member; Ms. Maria Elena Cardoso Figueira and Mr. Júlio Sergio de Souza Cardozo, as members.
On April 24, 2018, to approve the Individual and Consolidated Financial Statements of Banco Santander, prepared in accordance with accounting practices adopted in Brazil, applicable to institutions authorized to operate by the Central Bank and the Interim Financial Statements prepared in accordance with the International Financial Reporting Standards (IFRS), IASB and interpretations of the IFRS Interpretation Committee, respect to the period ended March 31, 2018.
Consolidated Financial Statements - December 31, 2018 147
On April 18, 2018, to approve the dismissal of Mr. Cassius Schymura from the position of Company’s Officer without specific designation.
On April 10, 2018, to approve the (i) appointment of Mrs. Deborah Stern Vieitas as Coordinator of the Company's Audit Committee, for a complementary term of office, in replacement of Mr. José Luciano Duarte Penido; (ii) dismissal of Mrs. Deborah Stern Vieitas from the role of Coordinator of the Company's Risk and Compliance Committee; and (iii) appointment of Mr. Bernardo Parnes as Coordinator of the Company's Risk and Compliance Committee, for a term of office valid until the investiture of those elected at the first Board of Directors’ meeting held after the 2019 Ordinary General Meeting.
On March 27, 2018, to approve the proposal for declaration and payment of interest on equity, in the gross amount of R$ 600 million, for payment as of April 26, 2018, without any indexation.
On March 16, 2018, to acknowledge the resignation of Mr. Felipe Pires Guerra de Carvalho from the position of Office without specific designation.
On March 5, 2018, to acknowledge the resignation of Mr. Marcelo Zerbinatti from the position of Officer without specific designation.
On February 26, 2018, to ratify the dismissal of Mrs. Maria Eugênia Andrade Lopez Santos, occurred on February 9, 2018, from the position of Company's Executive Officer.
On February 26, 2018 to (i) acknowledge the resignation of Mr. Alexandre Silva D'Ambrosio from the position of Executive Vice-President; and (ii) approve the appointment of Mr. Alessandro Tomao as Executive Vice-President of the Company, for a complementary term of office.
On February 15, 2018, to approve the Individual and Consolidated Financial Statements of Banco Santander, prepared in accordance with the International Financial Reporting Standards (IFRS), respect to the year ended December 31, 2017.
On February 1, 2018, to approve the (i) appointment, for a complementary term of office, of Mr. Carlos Aguiar Neto, Mrs. Claudenice Lopes Duarte, Mrs. Germanuela de Almeida de Abreu, Mrs. Gustavo Alejo Viviani, Mr. José Teixeira de Vasconcelos Neto and Mr. Rodrigo Cury, as Officers without specific designation; and (ii) appointment of Mr. René Luiz Grande, as member of the Company's Risk and Compliance Committee, for a complementary term of office.
On January 29, 2018, to approve the Individual and Consolidated Financial Statements of Banco Santander, prepared in accordance with accounting practices adopted in Brazil, applicable to institutions authorized to operate by the Central Bank, respect to the year ended on December 31, 2017.
On January 3, 2018, to approve the dismissal of Mr. Conrado Engel from the position of Senior Executive Vice-President of the Company.
7) Risk Management
On February 23, 2017, Bacen published CMN Resolution 4,557, which provides for the risk and capital management structure (GIRC) and entered into force 180 days from the date of its publication. The resolution highlights the need to implement an integrated risk and capital management framework, definition of integrated stress testing program and Risk Appetite Statement (RAS), constitution of Risk Committee and appointment of director for management and director of capital. Banco Santander is continuously and progressively developing necessary actions aiming at adherence to the new resolution. We haven´t identified relevant impacts resulting from this standard up to the date of publication of this note.
For further information, see explanatory note nº 47 of this publication.
Structure of Capital Management
Banco Santander’s structure of capital management has a robust governance framework that supports the process related to this theme and establishes the attributions of each teams involved. Furthermore, there is a clear definition that should be adopted to effective capital management. More details can be consult in “Structure Capital and Risk Management”, available on Investor Relations website.
Internal Audit
Internal Audit reports directly to the Board of Directors, whose activities are supervised by the Audit Committee.
Internal Audit is a permanent function, independent of any other functions or units, whose objective is to provide the Management Body and the senior management with independent assurance on the quality and effectiveness of internal control, risk management (current or emerging) and governance processes and systems, thereby helping to protect the company’s value, solvency and reputation. The Internal Audit has quality certificate issued by the Institute of Internal Auditors (IIA).
In order to perform its duties and reduce coverage risks inherent to Banco Santander's activities, the Internal Audit area has internally developed tools that are updated when necessary. These include the risk matrix, used as a planning tool, prioritizing each unit’s risk level, considering, among others, its inherent risks, the last audit rating, level of compliance with recommendations and their size. The work programs, which describe the audit tests to be performed, are reviewed periodically.
The Audit Committee and the Board of Directors favorably reviewed and approved the work plan of the Internal Audit for the year 2018.
In the year ended on December of 2018, internal control procedures and controls on the information systems of the selected units were evaluated according to the work plan for the year, considering the effectiveness of the design and its operation. The Internal Audit informed the Audit Committeeand the Board of Directors about the conclusions of the works done during that period, according to its annual plan.
Consolidated Financial Statements - December 31, 2018 148
8) People
When the discussion is about the growth and development of Banco Santander, a force stands out: the People. Having a motivated and dedicated employees is a decisive factor in making the Bank in the best bank for clients and the best company for employees.
Employees are the strongest link between the Bank and clients and so, day after day, Banco Santander enhances their management practices because it knows that only with dedicated employees, well trained and with full professional development, the Bank will manage to get more and better clients, satisfied, proud to do business with Banco Santander and the Santander brand.
The daily performance of Banco Santander with clients, employees, stockholders and society is guided by the purpose of the Bank to contribute to people and businesses to prosper and their way of act.
The Bank has a talented team of 48,012 employees only in Brazil. The Bank seeks professionals who identified with the Corporate Culture, to be a Simple Bank (with uncomplicated and easy services to operate), Personal (with solutions and channels that meet clients needs and preferences) and Fair (promoting business and relationships that are good for clients, stockholders and employees). In addition to identifying with the culture, the Banco Santander's employees act in their day to day aligned to it.
9) Sustainable Development
Santander’s Sustainability Strategy is based on three pillars: (i) Efficient and strategic use of Natural Capital, (ii) Potential Development and (iii) Resilient and Inclusive Economy. The Bank's vision of the future, through these pillars, is to support Brazilian society in its transformation to Brazil of the 21st Century, maintaining excellence and responsibility in internal management, with ethical values as the basis and technology at the service of people and business.
Some of the Sustainability awards and recognitions received in 2018 which demonstrate the consistency of environmental, social and governance practices are: inclusion of Santander Brazil as a constituent of the FTSE4Good Index Series; inclusion of Santander Brasil in Vigeo Eiris Best Emerging Markets Performers Ranking; with the case of Prospera Santander Microcredit, Santander was recognized by the United Nations during the event Sustainable Development Goals in Brazil - The Role of the Private Sector; the Santander Group was recognized as one of the three best banks in the world and the first in Europe by the DJSI (Dow Jones Sustainability Index).
Among the highlights of the year is the launch of CDC Solar, which aims to finance systems for the generation of photovoltaic solar energy with attractive interest rates, long-term, among other special conditions, enabling financing of up to 100% of the value. Through Responsible Agribusiness until December 31, 2018, 230 people were trained during events related to Sustainability. In Project Finance financial advisory, the Bank financed in 2018 approximately R$ 1.2 billion related to renewable energy. Regarding the major operations, in 2018 Santander participated in Green Bonds issues in the amount of R$ 621 million for infrastructure projects for power transmission systems.
Prospera Santander Microcredit resulted in more than R$ 1 billion of production (49% above 2017), with more than 250 thousand active clients. Through the Parceiros em Ação Program, we trained more than 2,000 entrepreneurs, clients and non-clients, in low-income communities where Prospera Santander Microcredit is present..
Through Santander Universities, more than 4,600 scholarships were been granted with an investment of R$ 29.9 million until 12/31/2018. The Amigo de Valor Program allows Banco Santander, as well as our employees and clients, to direct part of the income tax due directly to the Funds for the Rights of Children and Adolescents. In 2018, this program raised funds totaling more than R$ 13 million, which were directed to 67 projects in Brazil.
10) Independent Audit
Banco Santander's policy of including its subsidiaries in contracting services not related to the external audit of its independent auditors is based on Brazilian and international auditing standards that preserve the auditor's independence. This reasoning provides as follows: (i) the auditor should not audit his own work, (ii) the auditor should not perform managerial duties on his client, (iii) the auditor should not promote the interests of his client, and (iv) need for approval of any services by the Bank's Audit Committee.
In compliance with the Instruction of the Securities Commission 381/2003, Banco Santander informs that in the fiscal year ended December 31, 2018, PricewaterhouseCoopers did not provide services not related to the independent audit of the Financial Statements of Banco Santander and subsidiaries above 5% of total fees related to independent auditing services.
In addition, the Bank confirms that PricewaterhouseCoopers has procedures, policies and controls to ensure its independence, which include an evaluation of the work performed, covering any service that is not independent of the Financial Statements of Banco Santander and its subsidiaries. This evaluation is based on the applicable regulations and accepted principles that preserve the independence of the auditor. The acceptance and provision of professional services not related to the external audit in the fiscal year ended December 31, 2018 did not affect the independence and objectivity in conducting the external audits carried out in Banco Santander and other entities of the Group, since the above principles were observed.
The Board of Directors
The Executive
(Authorized at the Meeting of the Board of February 25, 2019).
Consolidated Financial Statements - December 31, 2018 149
(Free Translation into English from the Original Previously Issued in Portuguese)
|
BANCO SANTANDER (BRASIL) S.A. |
Executive’s Report of Financial Statements |
For purposes of compliance with Article 25, § 1, VI, CVM Instruction 480, of December 7, 2009, the Executives' of Banco Santander (Brasil) S.A. (Banco Santander) (Company) state that they have discussed, reviewed and agreed with the Banco Santander's Financial Statements for the period ended December 31, 2018, prepared in accordance with International Financial Reporting Standards (IFRS) and the documents that comprise it, being: Management Reports, consolidated balance sheets, consolidated income statements, consolidated statements of comprehensive income, consolidated cash flow statements, consolidated statements of changes in equity and notes to the consolidated financial statements, prepared according IFRS issued by the International Accounting Standards Board (IASB). These financial statements and the documents that comprise it, have been the object of an unqualified review report of the Independent Auditors and the recommendation for approval issued by the Audit Committee of the Company.
Banco Santander Executives on December 31, 2018:
CEO
Sergio Agapito Lires Rial
Senior Vice-President Executive Officer
José de Paiva Ferreira
Vice-President Executive and Investor Relations Officer
Angel Santodomingo Martell
Vice-President Executive Officers
Alberto Monteiro de Queiroz Netto
Alessandro Tomao
Antonio Pardo de Santayana Montes
Carlos Rey de Vicente
Jean Pierre Dupui
Juan Sebastian Moreno Blanco
Mário Roberto Opice Leão
Patrícia Souto Audi*
Vanessa de Souza Lobato Barbosa
(*) Possession pending authorization from Bacen
Executive Officer
José Roberto Machado Filho
Officers Without Designation
Alexandre Grossmann Zancani
Amancio Acúrcio Gouveia
André de Carvalho Novaes
Carlos Aguiar Neto
Cassio Schmitt
Claudenice Lopes Duarte
Ede Ilson Viani
Fernando Carvalho Botelho de Miranda
Germanuela de Almeida de Abreu
Gilberto Duarte de Abreu Filho
Gustavo Alejo Viviani
Igor Mario Puga
José Teixeira de Vasconcelos Neto
Leopoldo Martinez Cruz
Luis Guilherme Mattos de Oliem Bittencourt
Luiz Masagão Ribeiro Filho
Marcelo Malanga
Marino Alexandre Calheiros Aguiar
Nilton Sergio Silveira Carvalho
Rafael Bello Noya
Ramón Sanchez Díez
Ramon Sanchez Santiago
Reginaldo Antonio Ribeiro
Robson de Souza Rezende
Rodrigo Cury
Sérgio Gonçalves
Thomas Gregor Ilg
Ulisses Gomes Guimarães
Consolidated Financial Statements - December 31, 2018 150
(Free Translation into English from the Original Previously Issued in Portuguese)
|
BANCO SANTANDER (BRASIL) S.A. |
Executive’s Report of Independent Auditors' Report |
For purposes of compliance with Article 25,§ 1, V,CVM Instruction 480, of December 7, 2009, the Executives of Banco Santander (Brasil) S.A. (Banco Santander) (Company) state that they have discussed, reviewed and agreed with Financial Statements prepared in accordance with International Financial Reporting Standards (IFRS) of Banco Santander which includes the Independent Auditors' Report for the period ended December 31, 2018, prepared in accordance with International Financial Reporting Standards (IFRS) and the documents that comprise it, being: Management Reports, consolidated balance sheets, consolidated income statements, consolidated statements of comprehensive income, consolidated cash flow statements, consolidated statements of changes in equity and notes to the consolidated financial statements, prepared according IFRS issued by the International Accounting Standards Board (IASB). These financial statements and the documents that comprise it, have been the object of an unqualified review report of the Independent Auditors and the recommendation for approval issued by Audit Committee of the Company.
Banco Santander Executives on December 31, 2018:
CEO
Sergio Agapito Lires Rial
Senior Vice-President Executive Officer
José de Paiva Ferreira
Vice-President Executive and Investor Relations Officer
Angel Santodomingo Martell
Vice-President Executive Officers
Alberto Monteiro de Queiroz Netto
Alessandro Tomao
Antonio Pardo de Santayana Montes
Carlos Rey de Vicente
Jean Pierre Dupui
Juan Sebastian Moreno Blanco
Mário Roberto Opice Leão
Patrícia Souto Audi*
Vanessa de Souza Lobato Barbosa
(*) Possession pending authorization from Bacen
Executive Officer
José Roberto Machado Filho
Officers Without Designation
Alexandre Grossmann Zancani
Amancio Acúrcio Gouveia
André de Carvalho Novaes
Carlos Aguiar Neto
Cassio Schmitt
Claudenice Lopes Duarte
Ede Ilson Viani
Fernando Carvalho Botelho de Miranda
Germanuela de Almeida de Abreu
Gilberto Duarte de Abreu Filho
Gustavo Alejo Viviani
Igor Mario Puga
José Teixeira de Vasconcelos Neto
Leopoldo Martinez Cruz
Luis Guilherme Mattos de Oliem Bittencourt
Luiz Masagão Ribeiro Filho
Marcelo Malanga
Marino Alexandre Calheiros Aguiar
Nilton Sergio Silveira Carvalho
Rafael Bello Noya
Ramón Sanchez Díez
Ramon Sanchez Santiago
Reginaldo Antonio Ribeiro
Robson de Souza Rezende
Rodrigo Cury
Sérgio Gonçalves
Thomas Gregor Ilg
Ulisses Gomes Guimarães
Consolidated Financial Statements - December 31, 2018 151
| BANCO SANTANDER (BRASIL) S.A. |
| SUMMARY OF THE REPORT OF THE AUDIT COMMITTEE |
The Audit Committee of Banco Santander (Brasil) S.A. ("Santander"), lead institution of the Santander´s Economic and Financial Conglomerate ("Conglomerate”), acts as single entity for all the institutions part of the Conglomerate, including those entities under the supervision of the Superintendence of Private Insurance - Susep. In compliance with the U.S. Securities and Exchange Commission, the Audit Committee acts as the Audit Committee of Santander in accordance with the provisions of the Sarbanes-Oxley Act.
According to its Charter, available on Santander´s Investors Relations website (www.ri.santander.com.br), the Audit Committee, among its attributions, advises the Board of Directors on the oversight of the quality of the financial statements, its compliance with the applicable rules and legislation, the effectiveness and independence of the work performed by the internal and independent auditors, as well as on the effectiveness of the internal control system and operational risk management. Besides that, the Audit Committee also recommends amendments and improvements on policies, practices and procedures identified in the course of its duties, whenever deemed necessary.
The Audit Committee is currently composed by four independent members, appointed at the Board of Directors´ meeting of May 10, 2018. It acts through meetings with executives, auditors and specialists, conducts analyzes based on the reading of documents and information submitted to it, as well as taking initiatives in relation to other procedures deemed necessary. The Audit Committee's evaluations are primarily based on information received from Management, internal and independent auditors and the areas responsible for monitoring internal controls and operational risks. The Committee also monitors and acts on the results of inspections and appointments of the regulatory and self-regulatory bodies and the corresponding measures adopted by Management to handle such appointments, and holds specific meetings with Central Bank representatives.
The Committee's minutes and reports are regularly sent to the Board of Directors, with which the Audit Committee met regularly on the second half of 2018.
With regard to its attributions, the Audit Committee performed the following activities:
I –Financial Statements
IFRS - The Audit Committee reviewed the financial statements of the institutions and companies that comprise the Conglomerate, confirming its adequacy, in compliance with Brazilian corporate law, accounting practices, the rules of the Brazilian Securities and Exchange Commission (CVM) and the International Financial Reporting Standards (IFRS) issued by the International Accounting Standards Board (IASB) and, as listed on the NYSE, issued by the SEC and Sarbanes-Oxley Act. In this regard, it acknowledged the results recorded in the second half and the fiscal year ended December 31, 2018, meeting with the independent auditors and professionals responsible for the accounting and preparation of the financial statements, prior to their disclosure.
Consolidated Financial Statements - December 31, 2018 152
II –Internals Controls and Operational Risks Management
The Audit Committee received information and held meetings with the Executive Vice-Presidency of Risks - including attending meetings of the Risk and Compliance Committee, the Executive Vice-Presidency of Tactics, Technology and Operations, the Compliance area and the relevant professionals responsible for the management, implementation and dissemination of the Conglomerate's internal controls and risk management culture and infrastructure. It also verified cases dealt by the “Canal Aberto” (Whistleblowing channel) and by the Information Security and Anti-Fraud areas. Such verifications were conducted in accordance with Resolutions CMN nºs. 2,554/98 and 4,557/17, Sarbanes-Oxley Act (SOX) and Circular Susep 249/04.
III –Internal Audit
The Committee met formally with the Officer responsible for the area and with other Internal Audit professionals on several occasions during the second half of 2018, to discuss the audit works performed, the reports issued and their respective conclusions and recommendations, focusing on recommendations for improvements in areas where controls were considered "To be improved" or "Unsatisfactory". On other occasions, Internal Audit professionals participated in the meetings of the Audit Committee.
IV –Independent Audit
Regarding the Independent Audit work performed by PricewaterhouseCoopers Auditores Independentes ("PwC"), the Audit Committee met formally on several occasions in the second half of 2018. At these meetings, discussions involved the financial statements for the second half and the fiscal year ended December 31, 2018, accounting practices, the business continuity plan, and any deficiencies and recommendations raised in the internal control report. The Audit Committee evaluated the proposals submitted by PwC for the performance of other services, in order to verify the absence of conflicts of interest or potential risk of loss of independence.
V -Ombudsman
In accordance with Resolution CMN 4,433/15 and CNSP Resolution 279/13, specific works were carried out in the second half of 2018, which were presented to the Audit Committee that discussed and evaluated them.
VI –Others Activities
Besides the activities described above, as part of the work inherent to its attributions, the Audit Committee met with management and several areas of the Conglomerate, furthering its analysis, with emphasis on the following topics: (i) the adequacy of Pension Plans; (ii) inspections reports and appointments from regulators, ongoing inspections and the correspondent action plans adopted to meet the requests; (iii) cyber security monitoring; (iv) follow-up on the adoption and impacts of IFRS 9 - Financial Instruments; (v) review of the Technical Study on the Realization of Tax Credits; and (vi) monitoring of tax, labor and civil litigation.
Consolidated Financial Statements - December 31, 2018 153
During the period, members of the Audit Committee also participated in training, lectures and programs on topics related to its activities, and on regulations of interest and impact to the Conglomerate.
VII –Conclusion
Based on the work and assessments carried out, and considering the context and scope in which it carries out its activities, the Audit Committee concluded that the work carried out isappropriate andprovides transparency andquality to the Financial Statements of the Conglomerate, for the semester and fiscal year ended on December 31, 2018, recommending its approval by the Board of Directors of Santander.
São Paulo, February25, 2019.
Audit Committee
Deborah Stern Vieitas – Coordinator
Luiz Carlos Nannini – Financial Expert
Maria Elena Cardoso Figueira
Julio Sergio de Souza Cardozo
Consolidated Financial Statements - December 31, 2018 154
Banco Santander (Brasil) S.A. | ||
| By: | /S/ Amancio Acúrcio Gouveia | |
Amancio Acúrcio Gouveia Officer Without Specific Designation | ||
| By: | /S/ Carlos Rey de Vicente | |
Carlos Rey de Vicente Vice - President Executive Officer | ||