SECURITIES AND EXCHANGE COMMISSION
Commission File Number: 001-34476
Bloco A – Vila Olimpia
São Paulo, SP 04543-011
Federative Republic of Brazil
Indicate by check mark if the registrant is submitting the Form 6-K in paper as permitted by Regulation S-T Rule 101(b)(1):
Yes _______ No ___X____
Indicate by check mark if the registrant is submitting the Form 6-K in paper as permitted by Regulation S-T Rule 101(b)(7):
Yes _______ No ___X____
Indicate by check mark whether by furnishing the information contained in this Form, the Registrant is also thereby furnishing the information to the Commission pursuant to Rule 12g3-2(b) under the Securities Exchange Act of 1934:
Yes _______ No ___X____
If “Yes” is marked, indicate below the file number assigned to the registrant in connection with Rule 12g3-2(b): N/A
![]()
Table of Contents
Managerial Analysis of Results–BR GAAP
2
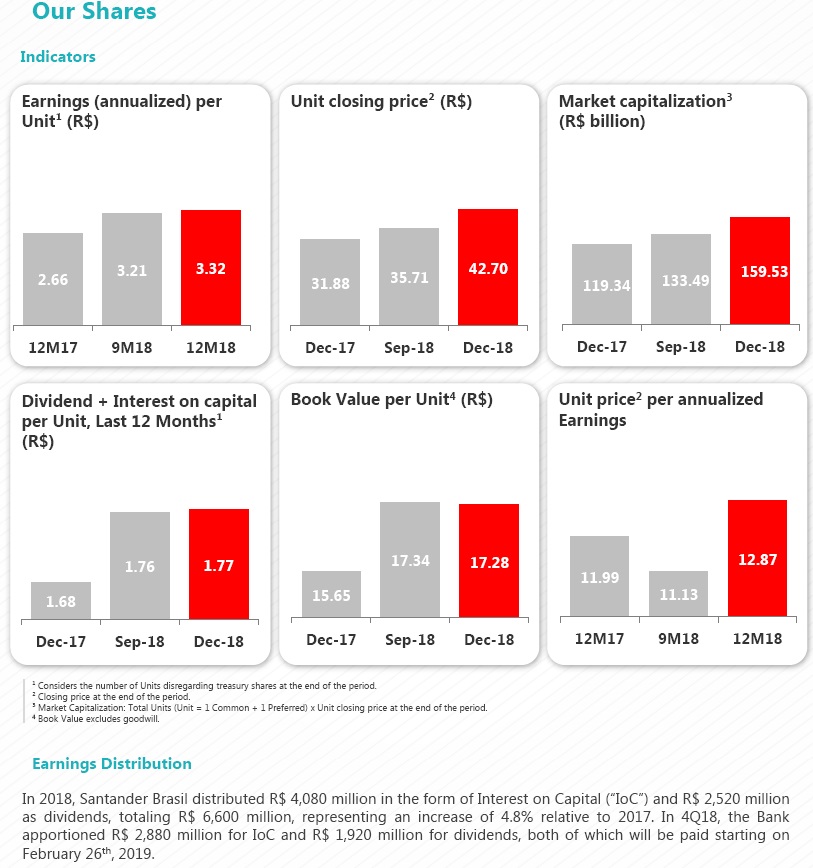
Data Summary for the Period
The information presented in this report excludes the non-recurring events that can be found on pages 27 and 28 (Accounting and Managerial Results Reconciliation).
MANAGERIAL¹ ANALYSIS - BR GAAP | 2018 | 2017 | Var. | 4Q18 | 3Q18 | Var. |
|
| 12M |
|
| 3M |
RESULTS (R$ million) |
|
|
|
|
|
|
Net interest income | 42,000 | 37,327 | 12.5% | 10,747 | 10,629 | 1.1% |
Fees | 17,269 | 15,611 | 10.6% | 4,725 | 4,135 | 14.3% |
Allowance for loan losses | (10,860) | (9,708) | 11.9% | (2,986) | (2,618) | 14.0% |
General Expenses² | (20,179) | (19,167) | 5.3% | (5,487) | (5,020) | 9.3% |
Personnel Expenses | (9,313) | (9,091) | 2.4% | (2,387) | (2,331) | 2.4% |
Administrative Expenses | (10,867) | (10,076) | 7.8% | (3,100) | (2,690) | 15.2% |
Managerial net profit³ | 12,398 | 9,953 | 24.6% | 3,405 | 3,108 | 9.5% |
Accounting net profit | 12,166 | 7,997 | 52.1% | 3,336 | 3,039 | 9.8% |
|
|
|
|
|
|
|
BALANCE SHEET (R$ million) |
|
|
|
|
|
|
Total assets | 805,819 | 683,732 | 17.9% | 805,819 | 769,990 | 4.7% |
Securities and Derivative Financial Instruments | 194,465 | 171,730 | 13.2% | 194,465 | 179,682 | 8.2% |
Loan portfolio | 305,260 | 272,562 | 12.0% | 305,260 | 298,433 | 2.3% |
Individuals | 132,565 | 108,115 | 22.6% | 132,565 | 125,336 | 5.8% |
Consumer finance | 50,066 | 41,884 | 19.5% | 50,066 | 47,274 | 5.9% |
SMEs | 37,546 | 34,288 | 9.5% | 37,546 | 36,269 | 3.5% |
Corporate | 85,083 | 88,275 | -3.6% | 85,083 | 89,554 | -5.0% |
Expanded Loan Portfolio⁴ | 386,736 | 347,907 | 11.2% | 386,736 | 380,713 | 1.6% |
Funding from Clients⁵ | 332,254 | 307,619 | 8.0% | 332,254 | 336,997 | -1.4% |
Deposits (demand, saving and time) | 248,998 | 200,230 | 24.4% | 248,998 | 246,476 | 1.0% |
Equity⁶ | 64,572 | 58,570 | 10.2% | 64,572 | 64,824 | -0.4% |
|
|
|
|
|
|
|
PERFORMANCE INDICATORS (%) |
|
|
|
|
|
|
Return on average equity excluding goodwill⁶ - annualized | 19.9% | 16.9% | 3.0 p.p. | 21.1% | 19.5% | 1.6 p.p. |
Return on average asset excluding goodwill⁶ - annualized | 1.7% | 1.5% | 0.2 p.p. | 1.7% | 1.6% | 0.1 p.p. |
Efficiency ratio⁷ | 40.5% | 44.1% | -3.6 p.p. | 42.6% | 39.7% | 2.9 p.p. |
Recurrence ratio⁸ | 85.6% | 81.4% | 4.1 p.p. | 86.1% | 82.4% | 3.7 p.p. |
BIS ratio | 15.1% | 15.8% | -0.8 p.p. | 15.1% | 15.3% | -0.2 p.p. |
Tier I | 14.0% | 14.7% | -0.8 p.p. | 14.0% | 14.1% | -0.2 p.p. |
Tier II | 1.1% | 1.1% | 0.0 p.p. | 1.1% | 1.1% | 0.0 p.p. |
CET1 - Fully Loaded | 12.5% | 12.7% | -0.2 p.p. | 12.5% | 12.6% | -0.1 p.p. |
|
|
|
|
|
|
|
PORTFOLIO QUALITY INDICATORS (%) |
|
|
|
|
|
|
Delinquency ratio (over 90 days) | 3.1% | 3.2% | -0.1 p.p. | 3.1% | 2.9% | 0.2 p.p. |
Individuals | 3.9% | 3.7% | 0.2 p.p. | 3.9% | 3.8% | 0.1 p.p. |
Corporate & SMEs | 1.9% | 2.5% | -0.6 p.p. | 1.9% | 1.9% | 0.0 p.p. |
Coverage ratio (over 90 days) | 201.0% | 202.5% | -1.5 p.p. | 201.0% | 207.1% | -6.1 p.p. |
Delinquency ratio (over 60 days) | 3.8% | 4.0% | -0.2 p.p. | 3.8% | 3.7% | 0.1 p.p. |
|
|
|
|
|
|
|
OTHER DATA |
|
|
|
|
|
|
Assets under management9 - AUM (R$ million) | 295,916 | 292,715 | 1.1% | 295,916 | 301,541 | -1.9% |
Branches | 2,283 | 2,255 | 28 | 2,283 | 2,276 | 7 |
PABs (mini branches) | 1,267 | 1,211 | 56 | 1,267 | 1,281 | (14) |
Own ATMs | 13,641 | 13,522 | 119 | 13,641 | 13,607 | 34 |
Shared ATMs | 23,049 | 21,195 | 1,854 | 23,049 | 22,447 | 602 |
Employees10 | 48,012 | 47,404 | 608 | 48,012 | 47,836 | 176 |
¹ Excluding 100% of the goodwill amortization expense, the foreign exchange hedge effect and other adjustments, as described on pages 27 and 28.² Administrative expenses exclude 100% of the goodwill amortization expense. Personnel expenses include profit-sharing.
³ Managerial net profit corresponds to the corporate net profit, excluding the extraordinary result and the 100% reversal of the goodwill amortization expense that occurred in the period. Goodwill amortization expenses were R$ 70 million in 4Q18, R$ 70 million in 3Q18 and R$ 166 million in 4Q17.
⁴ Including other credit risk transactions (debentures, FDIC, CRI, promissory notes, international distribution promissory notes, acquiring-activities related assets and guarantees).
⁵ Including Savings, Demand Deposits, Time Deposits, Debentures, LCA, LCI, Financial Bills, Certificates of Structured Operations ("COE") andSecured Real Estate Notes (“LIG”).
⁶ Excluding 100% of the goodwill balance (net of amortization), which amounted to R$ 662 million in 4Q18, R$ 727 million in 3Q18 and R$ 930 million in 4Q17.
⁷ Efficiency Ratio: General Expenses / (Net Interest Income + Fees + Tax Expenses + Other Operating Income/Expenses).
⁸ Recurrence Ratio: Fees / General Expenses.
⁹ According to ANBIMA (Brazilian Financial and Capital Markets Association) criteria.
⁺ As of 1Q18, it includes technology companies Produban and Isban.
3
| Earnings Release (BR GAAP) | 4Q18 |
Strategy
Banco Santander Brasil is the only international bank with scale in the country. We are convinced that the best way to grow in a profitable, recurring and sustainable manner is by providing excellent services to enhance customer satisfaction levels and attract more customers, making them more loyal.Our actions are based on establishing close and long-lasting relationships with customers, suppliers and shareholders. To accomplishthat goal, our purpose is to help people and businesses prosper by being a Simple, Personal and Fair Bank,guided by the following strategic priorities:
 |  |  |  |
Increase customer preference and loyalty by offering targeted, simple,digital andinnovative products and services through a multi-channel platform. | Improve theprofitability, recurrence and sustainability of our results by growing in businesses with greater revenue diversification, aiming to strike a balance between loan, funding and services, while maintaining a preemptive risk management approach and rigorous cost control. | Be disciplined with capital and liquidity to preserve our solidity, face regulatory changes and seize growth opportunities. | Achieve profitable market share gains through our robust portfolio, optimize the ecosystem and launch new ventures, consistentlyimproving thecustomer experience. |
We ended 2018 with another year of solid results, which allowed us to achieve higher profitability. Thisremarkable performance can be attributed to the expansion of our customer base, thanks to improved experience and satisfaction, greater operational efficiency and a high level of employee engagement, providing sustainability for our business. We believe that, based on our clearly-defined business model, we have room to keep capturing market opportunities. We highlight the following accomplishments in the past quarter:
•Horizontal management: in 2018, the monthly“Breakfastwith Rial”had the attendance of approximately 40% of our employee base perevent (via theSantander Now app and theintranet). •Santander Academy: encourages employees toassume a proactive role in technical training andhas 67% of total employees who are internal multipliers. •Santander Star: non-financial recognition program that rewards employees who make exceptional achievements in five categories –Result, Innovation, Collaboration, Service and Risk Pro. |  In 2018, we were pioneers in the Brazilian financialindustry in announcing our NPS (Net Promoter Score), which reached 57 points this quarter, up 14 points YoY. As a result of our actions, we continued to expand our customer base, highlighted by active account holders, who have been growingfor the last 43 consecutive months. 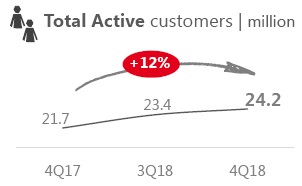 | ||
| 3rdconsecutive year among the BestCompanies to Work For in Brazil, according to the GPTW survey (+14 positions YoY). | ||


4
| Earnings Release (BR GAAP) | 4Q18 |
•Cards:we closed 4Q18 with strong growth of 20.4% YoY in total turnover. In the quarter, we promoted campaigns to stimulate card usage, such as the“Hit& WinPromotion”and“PingPong of Prizes.”In 2018, we further bolstered our offering:SantanderWay remained top rated in app stores (4.8 stars in Apple Store and 4.6 stars in Google Play), while we also launched Santander Pass with NFC technology for contactless payments, and“Supercrédito”to enable access to personal loans by non-account holders. Additionally, customers can get ourcards either digitally or at our branches. Allthese actions contributed to the increase in our loan portfolio market share, which reached 13.1%¹ (+1.1 p.p. YoY). •Payroll Loans:we continue to enjoy market share gains in the loan portfolio, which reached 9.9%¹ (+ 1.8 p.p. YoY). We highlight origination through digital channels, which saw the number of contracts grow 10% QoQ in this quarter. •Real Estate:over the course of the year weintensified the commercial exposure of this product in the media. At the same time, we enhanced the experience through a fully-digital channel that allows the customer to close the deal. Moreover, the industrialization of our internal processes is already showing results, bringing greater efficiency and agility.As consequence, retail origination advanced2.1²x YoY. |
In line with our process of expanding into Brazil's countryside and the goal of being the best agribusiness bank in the country, we inaugurated 4 Agro stores this quarter, totaling 21 spaces. In parallel, we refined our service with exclusive managers and became more efficient – our lead time, dropped by 46% in 2018. Finally, we improved our position in agribusiness credit notes (“LCA”), with a market share of 7.8%¹ (+2.4 p.p. YoY).
Our specialized business model, which is integrated with the bank, coupled with quality service and innovations, have been our greatest assets. During the year, we developed a second-to-none e-commerce platform modeled on the “one-stop shop” concept. We launched the digital POS, which helps customers run their own businesses. Within the scope of SuperGet, we began offering the bank slip payment option at the time of purchase and intensified the commercialization of the product for self-employed workers and entrepreneurs. All these factors contributed to the 32% growth in total revenues in 2018. The market share reached 14.4%³ (+2.9 p.p. YoY).
The strategy of developing sector-oriented offerings, with personalized service, combined with the “Avançar” Program, places us in a prime position to keep growing our customer base and loyalty in a consistent manner. These drivers have enabled us to grow to more than 1 million customers, while our market share in loan portfolio expanded by 0.4 p.p. in twelve months to 11.4%4.
•Consumer Finance:we remain leaders in this segment, with a market share of of 23.7%5(+0.6 p.p. in twelve months). Our digital platform “+Negócios,” couple with the good performance of our partnerships and our commercial service, are the main driving forces behind this evolution. In order to consolidate our relationship with customers, we have articulated initiatives, such as the creation of the “+Fidelidade” program, anincentive model for shop owners based on loyalty level, and the improvement of the after-sales journey for end-customers. In this quarter, we started integrating the same digital experience from the Consumer Finance unit into Retail, with the goal of enhancing efficiency in the loan application process for our account holders. |


¹ Source: Brazilian Central Bank, as of November/18.2Source: Brazilian Central Bank, cumulative figures from January to November 2018.3Source ABECS - Acquirers, as of September 2018.4Source: Brazilian Central Bank, as of September/185Source: Brazilian Central Bank, as of November/18. Total market share in vehicles (considering individuals and companies).
5
| Earnings Release (BR GAAP) | 4Q18 |
•Webmotors:the Cockpit tool continues to generate positive results, such as a 25% increase in the volume of contacts by sellers, allied to a 15% decrease in the time of these contacts with end-customers. With that, we experienced a 30% growth in the number of dealerships with a high level of engagement with us.
•Santander Corporate & Investment Banking (SCIB): We are still recognized as leaders: oFinancial advisory for financing and concession auctions and finance structuring, according to Anbima6, advisor in Americas and Project Finance (MLA) in Latam according to Dealogic6. oIn the foreign exchange market according to the Brazilian Central Bank7.
 •Santander On:a new free feature was made available on our app, with the purpose of being transparent with customers and providing financial education–Santander On, which shows the best way to use credit lines, offers details on financial commitments with the bank, provides information on Taxpayer ID(“CPF”)regularity, makes it easier to update personal income information and simplifies credit limit management. •Black Week Santander:in November we held the 2ndedition of“BlackWeekSantander”with the offering of over 45 types of products and services for individuals and companies. The campaign is in line with the repositioning of our brand and brought good results. We saw sales growth across all channels, especially of mortgages and working capital loans, whichexpanded by an average of more than 200%relative to the same period of the previous month. Within our digital channels, payroll loans had the most remarkable performance. | •Work Café:we inaugurated Work Café, which is completely different from traditional branches, as it integrates the concepts of digital branch and modern architecture. The space provides a groundbreaking interaction experience with banking services, offering free Wi-Fi, cafeteria, coworking area and recycling ATM, among others. The goal is to build closer relationshipswith customers and prospects in the individuals(middle and high income) and SME segments.  •Ben Benefits and Services:it will operate in the benefits industry, starting with food and meal vouchers, contributing to the optimization of our ecosystem. The proposal is to offer a better experience for end-customers, in addition tomaking partnerships withcompanies’HRdepartments and commercial establishments. Ben will use the Visa Vale brand, which is widely recognized in this segment and brings us innovation. Furthermore, we see potential synergies with the wholesale, SME and individuals segments, as well as with Getnet. •Pi:we started the pilot of our digital investment platform that caters to customers looking for more autonomy and practicality in the purchase of investment products. Pi has access to products from several institutions andcomplements our investment offering, reachingboth account and non-account holders.
Among the results related to Sustainability, we highlight our leadership in microcredit through the “Prospera” program, whose loan portfolio grew 51% YoY at the end of December 2018, reaching R$ 642 million. In Higher Education, we reinforced our social responsibility through “Preparadão Universia,” an event that brought together more than 7,000 students. In Brazil, we have awarded over 14,000 scholarships since 2015. In the field of socio-environmental financing, we were the first bank to launch an exclusive financing line for electric bicycles, the mobility CDC, which provides funding for up to 100% of its acquisition cost, with a maximum term of 48 months, for individuals.
¹ Source: Brazilian Central Bank, as of November/18.2Source: Brazilian Central Bank, cumulative figures from January to November 2018.3Source ABECS - Acquirers, as of September 2018.4Source: Brazilian Central Bank, as of September/18.5Source: Brazilian Central Bank, as of November/18. Total market share in vehicles (considering individuals and companies).6Dealogic as of 2018 and Financial Advisory–leadership since 2008, ANBIMA 2017.7Cumulative figures from January to November 2018.8Considering the performance from January to December 2018. | ||
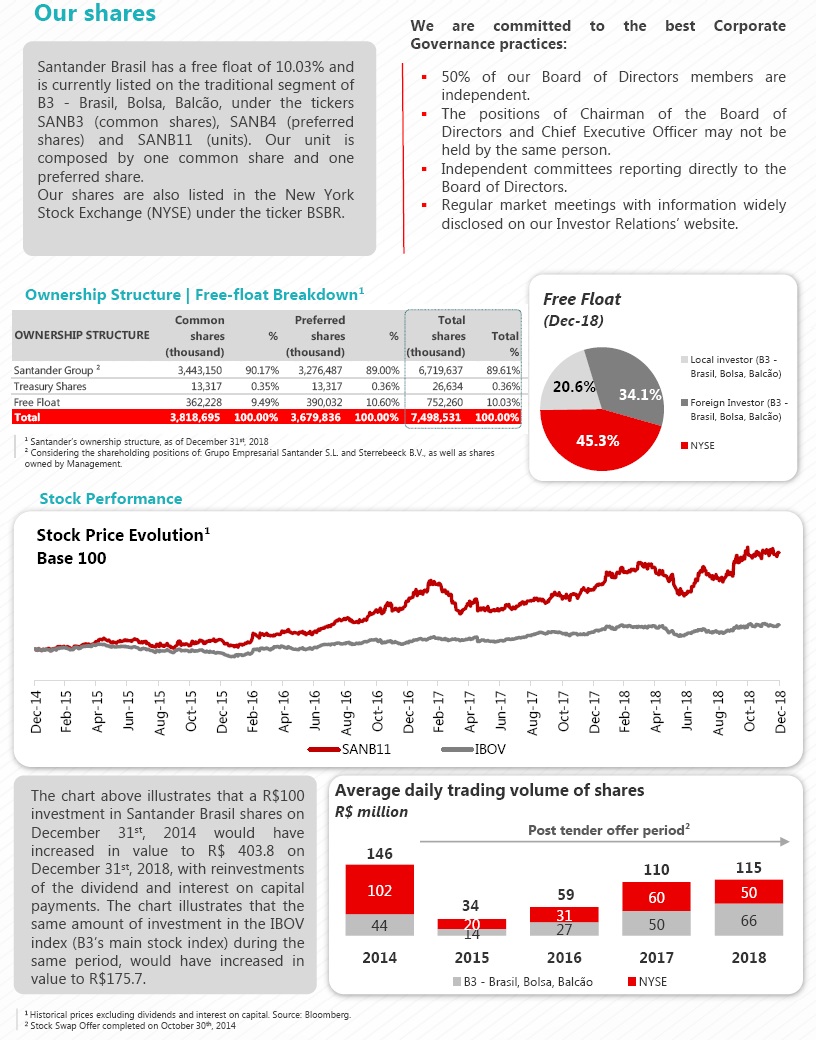
 Santander Corretora ranked81stin stock picking in 2018 byValor Econômico.
6
| Earnings Release (BR GAAP) | 4Q18 |
Executive Summary
 | In less than four years we managed to reposition our organization by implementing a clearly defined strategy, which allowed us to achieve higher profitability. In 2018, despite moderate growth in economic activity indicators, we were able to expand our loan portfolio by double digits relative to 2017, while also increasing our market share in a profitable manner. This annual expansion of our loan balance derived from solid risk management, allied to the effectiveness of our models, which have kept qualityindicators at controlled levels. As a result, total revenue experienced double-digitgrowthfor thesecond consecutive year, with positive contributions from net interest income and fees. The consistency of our revenues, combined with our unwavering pursuit of operational excellence, based on an industrial operating model, enabled us to record our best efficiency ratio ever on a yearly comparison. |
Managerial net profit totaled R$ 12,398 million in the year,growing 24.6% in twelve months and 9.5% in three months. Total revenues amounted to R$ 59,268 million in 2018, rising 12.0% in twelve months (or R$ 6,330million) and 4.8% in three months. Net interest income came to R$ 42,000 million in the year, up 12.5% compared to 2017, largely attributed to the loan NII, which saw higher volume, and especially due to a stronger contribution from retail segments. In three months, net interest income recorded a 1.1% rise, registering expansion across all lines: loan, funding and other NII. Fees reached R$ 17,269 million in 2018,growing at a double-digit rate for the third consecutive year, +10.6% in comparison with the previous year. The key reasons behind this performance are growth in our customer base and greater loyalty, highlighted by credit cards and acquiring activities, as well as current account services and insurance fees. In three months, fees climbed 14.3%, with higher revenues from card and acquiring services due to the year-end shopping season, stronger insurance fees given the concentration of policyrenewals in 4Q18 and securities placement,custody and brokerage services, on the back of increased capital market activities. | Profitability The return on average equity (ROAE), adjusted for goodwill, was 19.9% in 2018, advancing 3.0 p.p. in twelve months. In this quarter, the profitability reached 21.1%, expanding 1.5 p.p. in three months. Allowance for loan losses totaled R$ 10,860 million in the year, representing a 11.9% rise, in line with the performance of our loan portfolio in the period, which reflects the effectiveness of our risk management procedures. In three months, allowance for loan losses went up 14.0%, owing to the asset valuation effect in the period (more information on pages 27 and 28). General expenses amounted to R$ 20,179 million in 2018, an increase of 5.3% in twelve months, lower than the 12.0% growth in total revenues. In three months, general expenses rose 9.3%,influenced by higher expenses fromspecialized technical and third-party services, data processing and marketing, the latter impacted by seasonality in the period. The efficiency ratio stood at 40.5% in the year 2018, a decrease of 3.6 p.p. in twelve months. This performance stems from our industrial operating model. In three months, the ratio went up by 2.9 p.p. given the seasonal effect of expenses in 4Q18. |
7
| Earnings Release (BR GAAP) | 4Q18 |

The total loan portfolio reached R$ 305,260 million at the end ofDecember 2018, meaning an expansion of12.0% (or growth of 10.3%, disregarding the exchange rate fluctuation effect). The individuals and consumer finance segments remain the biggest contributors, climbing 22.6% and 19.5% in twelve months, respectively. We highlight our rising share in the credit market, which came to 9.3% in November/18, advancing 0.7 p.p. in twelve months. On this front, retail is showing a remarkable performance, with market share gains in several products, such as payroll loans, cards and SMEs. In three months, thetotal portfolio grew 2.3%. The expanded loan portfolio totaled R$ 386,736 million, growing 11.2% in twelve months and 1.6% in three months. Funding from clients amounted to R$ 332,254 million at the end of December 2018, up 8.0% in twelve months, primarily due to the increase in time and savings deposits, which rose by 29.2% and 13.5% relative to 2017, respectively. In three months, customer funding declined by 1.4%, owing todebentures and time deposits. | Total equity excluding R$ 662 million related to thegoodwill balance was R$ 64,572 million at the end of December 2018, climbing 10.2% in twelve months and decreasing 0.4% in three months. Quality indicators The over-90-day delinquency ratio stood at 3.1% at the end of December 2018, down 0.1 p.p. in twelve months and up 0.2 p.p. in three months, in line with the larger share of the individuals segment in the loan portfolio. The cost of credit hit 3.5% in the fourth quarter of 2018, remaining stable in twelve months and 0,4 p.p. higher in three months. This quarter, the indicator was impacted by the asset valuation effect, which was mentioned earlier. The coverage ratio came to 201% in December 2018, a 1.5 p.p. decline in twelve months and 6.1 p.p. in three months. Portfolio quality indicators remain undercontrol, owing to the effectiveness of ourmodels and the strength of our risk management. Capital indicators The BIS ratio reached 15.1% in December2018, representing reductions of 0.8 p.p. intwelve months and 0.2 p.p. in three months. The fully-loaded CET1 ratio stood at 12.5% in the same period, down 0.2 p.p. in twelve months and 0.1 p.p. in three months.Our capital indicators remain at comfortable levels and support our growth. |
8
| Earnings Release (BR GAAP) | 4Q18 |
Next, we present our analysis of the managerial results.
MANAGERIAL FINANCIAL STATEMENTS¹ | 2018 | 2017 | Var. | 4Q18 | 3Q18 | Var. |
(R$ million) |
|
| 12M |
|
| 3M |
Net Interest Income | 42,000 | 37,327 | 12.5% | 10,747 | 10,629 | 1.1% |
Allowance for Loan Losses | (10,860) | (9,708) | 11.9% | (2,986) | (2,618) | 14.0% |
Net Interest Income after Loan Losses | 31,140 | 27,619 | 12.7% | 7,761 | 8,011 | -3.1% |
Fees | 17,269 | 15,611 | 10.6% | 4,725 | 4,135 | 14.3% |
General Expenses | (20,179) | (19,167) | 5.3% | (5,487) | (5,020) | 9.3% |
Personnel Expenses + Profit Sharing | (9,313) | (9,091) | 2.4% | (2,387) | (2,331) | 2.4% |
Administrative Expenses² | (10,867) | (10,076) | 7.8% | (3,100) | (2,690) | 15.2% |
Tax Expenses | (4,034) | (3,667) | 10.0% | (1,041) | (1,004) | 3.7% |
Investments in Affiliates and Subsidiaries | 19 | 25 | -25.2% | 5 | 5 | 2.8% |
Other Operating Income/Expenses | (5,433) | (5,819) | -6.6% | (1,555) | (1,113) | 39.8% |
Operating Income | 18,781 | 14,602 | 28.6% | 4,408 | 5,014 | -12.1% |
Non Operating Income | 193 | (260) | -174.4% | 160 | 6 | n.a. |
Net Profit before Tax | 18,974 | 14,342 | 32.3% | 4,567 | 5,020 | -9.0% |
Income Tax and Social Contribution | (6,192) | (3,996) | 55.0% | (1,038) | (1,825) | -43.1% |
Minority Interest | (385) | (394) | -2.2% | (124) | (87) | 42.1% |
Net Profit | 12,398 | 9,953 | 24.6% | 3,405 | 3,108 | 9.5% |
¹ Excluding 100% of the goodwill amortization expense, foreign exchange hedge effect and other adjustments, as described on page 27 and 28.
² Excluding 100% of the goodwill amortization expense.
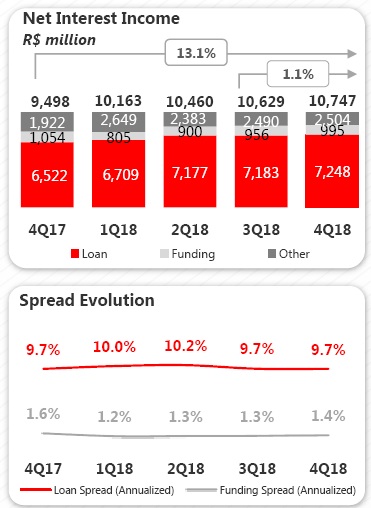
Net Interest Income Net interest income totaled R$ 42,000 million in 2018, growing 12.5% in twelve months (or R$ 4,673 million) and 1.1% in three months. Revenues from loan operations advanced 17.0% in 2018, mostly fueled by growth in theportfolio’saverage volume and larger share of retail segments. In three months, these revenues increased by 0.9%, with the positive effect from the segment mix. Funding revenues fell by 8.8% in the year, due to the lower interest rate level in the period, partially neutralized by the higher average balance (+14.0% in twelve months). In three months, these revenues climbed 4.1% thanks to the higher average volume and spread. “Other”interest income, which comprises the result of the structural gap in the balance sheet interest rate and activities with treasury clients, among others, expanded by 10.0% in 2018, owing to stronger revenues from market activities. In three months, these revenues increased by 0.5%. |
|
9
| Earnings Release (BR GAAP) | 4Q18 |
NET INTEREST INCOME | 2018 | 2017 | Var. | 4Q18 | 3Q18 | Var. |
(R$ million) |
|
| 12M |
|
| 3M |
Net Interest Income | 42,000 | 37,327 | 12.5% | 10,747 | 10,629 | 1.1% |
Loan | 28,317 | 24,203 | 17.0% | 7,248 | 7,183 | 0.9% |
Average volume | 286,188 | 258,609 | 10.7% | 296,668 | 293,568 | 1.1% |
Spread (Annualized) | 9.9% | 9.4% | 0.5 p.p | 9.7% | 9.7% | 0.0 p.p |
Funding | 3,657 | 4,009 | -8.8% | 995 | 956 | 4.1% |
Average volume | 287,058 | 251,725 | 14.0% | 298,196 | 295,135 | 1.0% |
Spread (Annualized) | 1.3% | 1.6% | -0.3 p.p | 1.4% | 1.3% | 0.1 p.p |
Other¹ | 10,026 | 9,115 | 10.0% | 2,504 | 2,490 | 0.5% |
¹ Including other margins and the result from financial transactions.
Fees–Revenues from Banking Services Revenues from banking services and fees totaled R$ 17,269 million in 2018, meaning a 10.6% rise in twelve months (or R$ 1,658 million), primarily driven by credit cards and acquiring activities, current account services and insurance fees. In the quarter, these revenues registered growth of 14.3%. Cards and acquiring fees amounted to R$ 5,877 million in the year, climbing 17.8% relative to 2017. This performance is attributed to higher card and acquiring turnover volume in the period. In the quarter, these revenues went up by 13.0%, owing to the increase in turnover, arising from the year-end shopping season. Current account service fees came to R$ 3,360 million in 2018, growing 15.5% in twelve months and 4.0% in three months, largely explained by greater transactionality and increase in the base of active current account holders. | Insurance fees stood at R$ 2,798 million in the year, a 11.2% rise in twelve months, due to credit life insurance, associated with the loan portfolio dynamics. In three months, these revenues expanded by 24.1% thanks to the concentration of policy renewals in the period. Collection service fees reached R$ 1,519 million in 2018, climbing 9.4% in twelve months. In three months, these revenues advanced by 8.6%. Lending fees were R$ 1,408 million in the year, down 5.6% in twelve months, given fee revisions according to market guidelines. In the quarter, these revenues increased by 10.4%. Securities placement, custody and brokerage fees totaled R$ 709 million in 2018, growing 1.3% in twelve months. In the quarter, these fees experienced a 120.6% rise, influenced by the increase in securities placement income, on the back of higher capital market activities. |
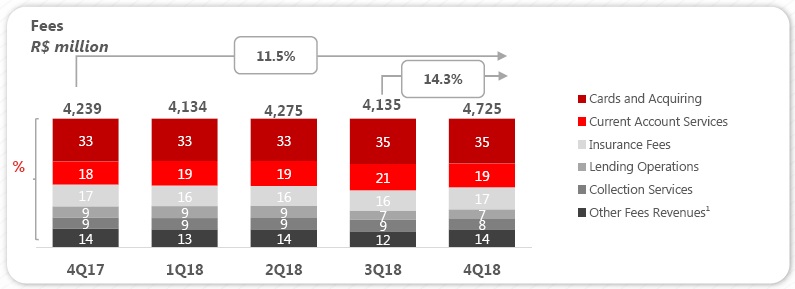
¹ Including Revenues from Asset Management, Securities Placement, Custody and Brokerage Services and Others. For more details, please refer to the Table of Revenues fromBanking Services and Fees on page 11.
10
| Earnings Release (BR GAAP) | 4Q18 |
FEES INCOME | 2018 | 2017 | Var. | 4Q18 | 3Q18 | Var. |
(R$ million) |
|
| 12M |
|
| 3M |
Cards and Acquiring | 5,877 | 4,990 | 17.8% | 1,650 | 1,460 | 13.0% |
Insurance fees | 2,798 | 2,516 | 11.2% | 808 | 651 | 24.1% |
Current Account Services | 3,360 | 2,908 | 15.5% | 885 | 851 | 4.0% |
Asset Management | 1,003 | 1,008 | -0.5% | 246 | 248 | -0.9% |
Lending Operations | 1,408 | 1,491 | -5.6% | 327 | 296 | 10.4% |
Collection Services | 1,519 | 1,389 | 9.4% | 399 | 367 | 8.6% |
Placement, Custody and Brokerage of Securities | 709 | 700 | 1.3% | 245 | 111 | 120.6% |
Other | 595 | 608 | -2.1% | 165 | 150 | 9.9% |
Total | 17,269 | 15,611 | 10.6% | 4,725 | 4,135 | 14.3% |
General Expenses (Administrative + Personnel)
General expenses, including depreciation and amortization, amounted to R$ 20,179 million in the year, growing 5.3% in comparison with 2017 (or R$ 1,012 million), lower than the 12.0% rise in our total revenues. In three months, these expenses increased by 9.3% particularly influenced by expenses from specializedtechnical and third-party services, as well asdata processing and marketing, due to seasonality in the period. Administrative and personnel expenses, excluding depreciation and amortization, came to R$ 17,918 million in the year, recording expansions of 4.8% in twelve months and 10.0% in three months. Personnel expenses, including profit-sharing, were R$ 9,313 million in 2018, advancing 2.4%, both in twelve months and in three months. This performance can be attributed to higher laborcharges and compensation expenses, which are inline with our meritocratic culture and the performance of our business. In the quarterly comparison, these expenses were impacted by the collective bargaining agreement that took place in September 2018. Administrative expenses, excluding depreciation and amortization, stood at R$ 8,605 million in the year, meaning growth of 7.5% in twelve months and 18.4% in three months due to: (i) data processing expenses, associated with greater transactionality and expansion of our customer base, and (ii) expenses from specialized technical and third-partyservices, especially technology services. | Additionally, in the quarter, these expenses were also impacted by higher advertising, promotions and marketing expenses owing to the concentration of commercial actions in the fourth quarter of the year. Depreciation and amortization expenses totaled R$ 2,261 million in the year, expanding by 9.3% in twelve months and 3.6% in three months.  |
11
| Earnings Release (BR GAAP) | 4Q18 |
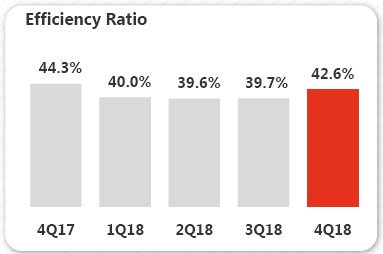
The efficiency ratio reached 42.6% in the fourth quarter of 2018, up 2.9 p.p. in three months. In the year, the ratio fell 3.6 p.p. to 40.5%, which is the best level in our history on an annual comparison, thanks to our operating model and increased revenues, influenced by intense commercial activity. |
|
EXPENSES' BREAKDOWN | 2018 | 2017 | Var. | 4Q18 | 3Q18 | Var. |
(R$ million) |
|
| 12M |
|
| 3M |
Outsourced and Specialized Services | 2,307 | 2,187 | 5.5% | 668 | 543 | 23.1% |
Advertising, promotions and publicity | 609 | 573 | 6.3% | 243 | 134 | 81.1% |
Data processing³ | 2,287 | 1,927 | 18.7% | 703 | 585 | 20.3% |
Communications | 423 | 434 | -2.7% | 111 | 108 | 2.9% |
Rentals | 730 | 728 | 0.3% | 184 | 184 | -0.1% |
Transport and Travel | 170 | 177 | -3.6% | 45 | 43 | 5.2% |
Security and Surveillance | 596 | 611 | -2.5% | 144 | 147 | -2.5% |
Maintenance | 239 | 233 | 2.4% | 54 | 61 | -11.5% |
Financial System Services | 351 | 283 | 24.0% | 99 | 93 | 6.0% |
Water, Electricity and Gas | 192 | 181 | 6.0% | 51 | 45 | 12.0% |
Material | 67 | 64 | 5.0% | 25 | 16 | 58.9% |
Other | 634 | 609 | 4.1% | 185 | 163 | 13.5% |
Subtotal | 8,605 | 8,007 | 7.5% | 2,511 | 2,121 | 18.4% |
Depreciation and Amortization¹ | 2,261 | 2,069 | 9.3% | 589 | 569 | 3.6% |
Total Administrative Expenses | 10,867 | 10,076 | 7.8% | 3,100 | 2,690 | 15.2% |
Compensation² | 6,062 | 5,996 | 1.1% | 1,591 | 1,487 | 7.0% |
Charges | 1,740 | 1,638 | 6.2% | 416 | 459 | -9.3% |
Benefits | 1,436 | 1,384 | 3.8% | 355 | 366 | -3.0% |
Training | 66 | 60 | 10.5% | 22 | 17 | 33.2% |
Other | 9 | 15 | -37.6% | 2 | 2 | -2.8% |
Total Personnel Expenses³ | 9,313 | 9,091 | 2.4% | 2,387 | 2,331 | 2.4% |
Administrative + Personnel Expenses | 17,918 | 17,099 | 4.8% | 4,898 | 4,452 | 10.0% |
Total General Expenses | 20,179 | 19,167 | 5.3% | 5,487 | 5,020 | 9.3% |
¹ Excluding 100% of the goodwill amortization expenses, which totaled R$ 70 million in 4Q18, R$ 70 million in 3Q18 and R$ 166 million in 4Q17.
² Including Profit-Sharing.
³ As of 1Q18, expenses for Isban Brasil S.A. and Produban Serviços de Informática S.A., which were previously consolidated in the Data processing expense line, will be recorded as Personnel and Administrative Expenses under the General Expenses line. For more information, please refer to the Material Fact - Acquisition of Isban Brasil S.A. and Produban Serviços de Informática S.A., released on February 20th, 2018.
12
| Earnings Release (BR GAAP) | 4Q18 |
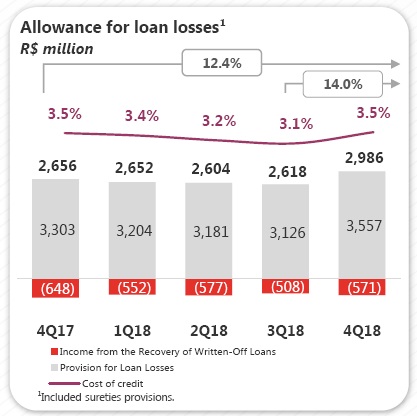
Allowance for Loan Losses Allowance for loan losses amounted to R$ 10,860 million in the year, rising 11.9% in twelve months (or R$ 1,152 million),affected by higher provision expenses. In thequarter, allowance for loan losses recorded an increase of 14.0%, mainly due to the effect of R$ 321 million derived from asset valuation in the period. Excluding this effect, allowance for loan losses would have grown 1.8%, lower than the growth of our loan portfolio in the same period. Provision for loan losses totaled R$ 13,068 million in 2018, an increase of 6.1% in twelve months. This performance reflects the strength of our risk models, which allow us to better manage the customer's life cycle. In the quarter, these expenses went up by 13.8%, impacted by the aforementioned effect. Income from the recovery of written-off loans came to R$ 2,208 million in the year, declining 15.3% in twelve months and rising 12.4% in three months. |
|

Other net operating income and expenses reached R$ 5,433 million in 2018, a decrease of 6.6% in twelve months. In the quarter, this net result was 39.8% higher.
OTHER OPERATING INCOME (EXPENSES) | 2018 | 2017 | Var. | 4Q18 | 3Q18 | Var. |
(R$ million) |
|
| 12M |
|
| 3M |
Expenses from credit cards | (2,441) | (1,700) | 43.6% | (786) | (595) | 32.0% |
Net Income from Capitalization | 416 | 358 | 16.3% | 124 | 106 | 17.0% |
Provisions for contingencies¹ | (1,438) | (2,038) | -29.5% | (491) | (484) | 1.5% |
Other | (1,971) | (2,439) | -19.2% | (402) | (139) | 188.6% |
Other operating income (expenses) | (5,433) | (5,819) | -6.6% | (1,555) | (1,113) | 39.8% |
¹ Including tax, civil and labor provisions.
13
| Earnings Release (BR GAAP) | 4Q18 |
Balance Sheet
Total assets stood at R$ 805,819 million at the end of December 2018, growing 17.9% in twelve months and 4.7% in three months. Total equity was R$ 65,234 million in the same period. Disregarding the goodwill balance, total equity reached R$ 64,572 million.
ASSETS | Dec-18 | Dec-17 | Var. | Sep-18 | Var. |
(R$ million) |
|
| 12M |
| 3M |
Current Assets and Long-term Assets | 794,664 | 672,561 | 18.2% | 759,235 | 4.7% |
Cash and Cash Equivalents | 11,629 | 11,234 | 3.5% | 14,945 | -22.2% |
Interbank Investments | 56,812 | 46,761 | 21.5% | 56,923 | -0.2% |
Money Market Investments | 44,826 | 34,484 | 30.0% | 44,892 | -0.1% |
Interbank Deposits | 4,118 | 2,862 | 43.9% | 3,729 | 10.4% |
Foreign Currency Investments | 7,869 | 9,415 | -16.4% | 8,302 | -5.2% |
Securities and Derivative Financial Instruments | 194,465 | 171,730 | 13.2% | 179,682 | 8.2% |
Own Portfolio | 68,170 | 59,203 | 15.1% | 69,809 | -2.3% |
Subject to Repurchase Commitments | 85,853 | 71,038 | 20.9% | 70,049 | 22.6% |
Posted to Central Bank of Brazil | 1,548 | 2,368 | -34.6% | 918 | 68.6% |
Pledged in Guarantees | 18,788 | 12,483 | 50.5% | 18,353 | 2.4% |
Other | 20,105 | 26,637 | -24.5% | 20,553 | -2.2% |
Interbank Accounts | 92,443 | 82,504 | 12.0% | 92,619 | -0.2% |
Restricted Deposits: | 70,384 | 63,057 | 11.6% | 70,162 | 0.3% |
-Central Bank of Brazil | 70,103 | 62,781 | 11.7% | 69,891 | 0.3% |
-National Housing System | 282 | 276 | 2.1% | 271 | 3.8% |
Other | 22,058 | 19,447 | 13.4% | 22,457 | -1.8% |
Lending Operations | 287,129 | 255,486 | 12.4% | 280,894 | 2.2% |
Lending Operations | 305,895 | 272,642 | 12.2% | 299,079 | 2.3% |
Lending Operations Related to Assignment | 23 | 306 | -92.5% | 39 | -41.7% |
(Allowance for Loan Losses) | (18,789) | (17,462) | 7.6% | (18,224) | 3.1% |
Other Receivables | 149,507 | 102,540 | 45.8% | 131,545 | 13.7% |
Foreign Exchange Portfolio | 101,248 | 55,048 | 83.9% | 80,947 | 25.1% |
Income Receivable | 27,664 | 26,160 | 5.8% | 28,974 | -4.5% |
Other | 20,595 | 21,332 | -3.5% | 21,624 | -4.8% |
Other Assets | 2,680 | 2,306 | 16.2% | 2,626 | 2.1% |
Permanent Assets | 11,155 | 11,172 | -0.1% | 10,754 | 3.7% |
Temporary Assets | 469 | 371 | 26.5% | 477 | -1.7% |
Fixed Assets | 6,498 | 6,396 | 1.6% | 6,266 | 3.7% |
Intangibles | 4,187 | 4,405 | -4.9% | 4,011 | 4.4% |
Goodwill net of amortization | 662 | 930 | -28.9% | 727 | -9.0% |
Other Assets | 3,526 | 3,475 | 1.5% | 3,284 | 7.4% |
Total Assets | 805,819 | 683,732 | 17.9% | 769,990 | 4.7% |
| |||||
Total Assets (excluding goodwill) | 805,158 | 682,802 | 17.9% | 769,263 | 4.7% |
14
| Earnings Release (BR GAAP) | 4Q18 |
LIABILITIES | Dec-18 | Dec-17 | Var. | Sep-18 | Var. |
(R$ million) |
|
| 12M |
| 3M |
Current Liabilities and Long-term Liabilities | 738,179 | 621,824 | 18.7% | 701,989 | 5.2% |
Deposits | 252,072 | 203,532 | 23.8% | 250,593 | 0.6% |
Demand Deposits | 18,832 | 17,177 | 9.6% | 17,421 | 8.1% |
Savings Deposits | 46,068 | 40,572 | 13.5% | 44,429 | 3.7% |
Interbank Deposits | 3,065 | 3,292 | -6.9% | 4,111 | -25.4% |
Time Deposits and Others | 184,107 | 142,491 | 29.2% | 184,631 | -0.3% |
Money Market Funding | 131,820 | 129,962 | 1.4% | 117,545 | 12.1% |
Own Portfolio | 85,178 | 97,173 | -12.3% | 77,356 | 10.1% |
Third Parties | 14,201 | 258 | n.a. | 14,003 | 1.4% |
Free Portfolio | 32,440 | 32,531 | -0.3% | 26,187 | 23.9% |
Funds from Acceptance and Issuance of Securities | 82,113 | 76,656 | 7.1% | 82,221 | -0.1% |
Resources from Real Estate Credit Notes, Mortgage Notes, Credit and Similar | 73,631 | 71,496 | 3.0% | 73,391 | 0.3% |
Funding from Certificates of Structured Operations | 2,646 | 1,990 | 33.0% | 2,481 | 6.7% |
Securities Issued Abroad | 4,517 | 1,993 | 126.6% | 5,045 | -10.5% |
Other | 1,319 | 1,177 | 12.0% | 1,304 | 1.2% |
Interbank Accounts | 284 | 264 | 7.6% | 1,918 | -85.2% |
Interbranch Accounts | 3,466 | 4,275 | -18.9% | 3,593 | -3.6% |
Borrowings | 32,672 | 33,471 | -2.4% | 50,697 | -35.6% |
Domestic Onlendings - Official Institutions | 13,267 | 16,636 | -20.2% | 13,531 | -2.0% |
National Economic and Social Development Bank (BNDES) | 7,408 | 9,460 | -21.7% | 7,612 | -2.7% |
National Equipment Financing Authority (FINAME) | 5,384 | 6,845 | -21.3% | 5,413 | -0.5% |
Other Institutions | 475 | 330 | 43.9% | 506 | -6.1% |
Derivative Financial Instruments | 18,900 | 20,681 | -8.6% | 16,932 | 11.6% |
Other Payables | 203,584 | 136,347 | 49.3% | 164,958 | 23.4% |
Foreign Exchange Portfolio | 100,345 | 55,318 | 81.4% | 80,422 | 24.8% |
Tax and Social Security | 5,644 | 4,870 | 15.9% | 4,050 | 39.4% |
Subordinated Debts | 9,886 | 519 | n.a. | - | n.a. |
Debt Instruments Eligible to Compose Capital | 9,782 | 8,440 | 15.9% | 10,125 | -3.4% |
Other | 77,926 | 67,200 | 16.0% | 70,362 | 10.8% |
Deferred Income | 337 | 511 | -34.1% | 355 | -5.0% |
Minority Interest | 2,070 | 1,897 | 9.1% | 2,095 | -1.2% |
Equity | 65,234 | 59,500 | 9.6% | 65,551 | -0.5% |
Total Liabilities | 805,819 | 683,732 | 17.9% | 769,990 | 4.7% |
|
|
|
|
|
|
Equity (excluding goodwill) | 64,572 | 58,570 | 10.2% | 64,824 | -0.4% |
Securities
Total securities amounted to R$ 194,465 million at the end of December 2018, an expansion of 13.2% in twelve months largely explained by growth in public securities. In three months, the securities balance saw a 8.2% increase.
SECURITIES | Dec-18 | Dec-17 | Var. | Sep-18 | Var. |
(R$ million) |
|
| 12M |
| 3M |
Public securities | 151,503 | 130,106 | 16.4% | 137,417 | 10.3% |
Private securities | 24,934 | 20,080 | 24.2% | 22,953 | 8.6% |
Financial instruments | 18,027 | 21,544 | -16.3% | 19,312 | -6.7% |
Total | 194,465 | 171,730 | 13.2% | 179,682 | 8.2% |
15
| Earnings Release (BR GAAP) | 4Q18 |
Loan Portfolio
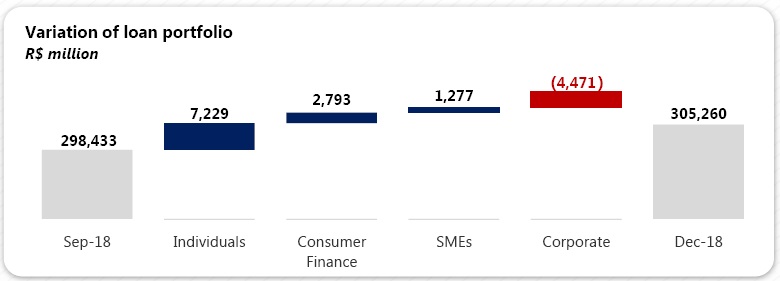
The loan portfolio totaled R$ 305,260 million at the end of December 2018, expanding by 12.0% in twelve months (or an increase of 10.3% disregarding the exchange rate fluctuation effect) and 2.3% in three months. The highlights continue to be the individuals and consumer finance segments, which have been beating the performance of the total portfolio in annual growth terms over the last thirteen and nine consecutive quarters, respectively. This has allowed us to gain market share in the last few quarters.
The expanded loan portfolio, which includes other credit risk transactions, acquiring-activities related assets and guarantees, amounted to R$ 386,736 million at the end of December 2018, rising 11.2% in twelve months (or a 9.8% increase disregarding the exchange rate fluctuation effect) and 1.6% in three months.
The balance of the foreign currency portfolio, including dollar-indexed loans, was R$ 31,779 million at the end of December 2018, climbing 9.9% relative to the balance of R$ 28,904 million in December of 2017 and decreasing 18.4% compared to the balance of R$ 38,961 million in September 2018.
MANAGERIAL BREAKDOWN OF CREDIT BY SEGMENT | Dec-18 | Dec-17 | Var. | Sep-18 | Var. |
(R$ million) |
|
| 12M |
| 3M |
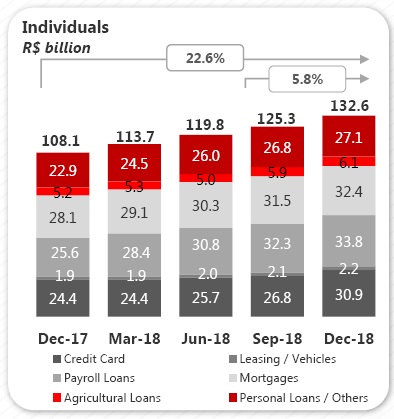
Individuals | 132,565 | 108,115 | 22.6% | 125,336 | 5.8% |
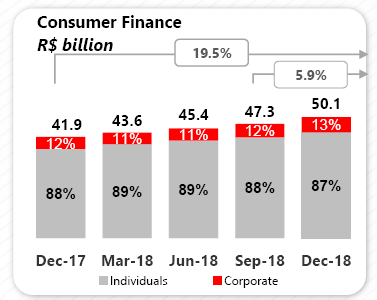
Consumer Finance | 50,066 | 41,884 | 19.5% | 47,274 | 5.9% |
SMEs | 37,546 | 34,288 | 9.5% | 36,269 | 3.5% |
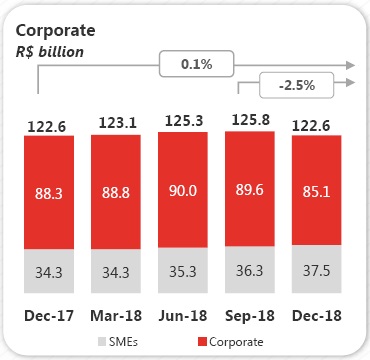
Corporate | 85,083 | 88,275 | -3.6% | 89,554 | -5.0% |
Total portfolio | 305,260 | 272,562 | 12.0% | 298,433 | 2.3% |
Other credit related transactions¹ | 81,476 | 75,345 | 8.1% | 82,280 | -1.0% |
Total expanded credit portfolio | 386,736 | 347,907 | 11.2% | 380,713 | 1.6% |
¹ Including debentures, FIDC, CRI, promissory notes, international distribution promissory notes, acquiring-activities related assets and guarantees.
In the quarter, growth in our loan portfolio was especially influenced by the individual and consumer finance portfolios, as stated above. The SME segment made a positive contributionfor the seventh consecutive quarter. In the same period, the corporate portfolio recorded a decrease in comparison with September 2018.
16
| Earnings Release (BR GAAP) | 4Q18 |
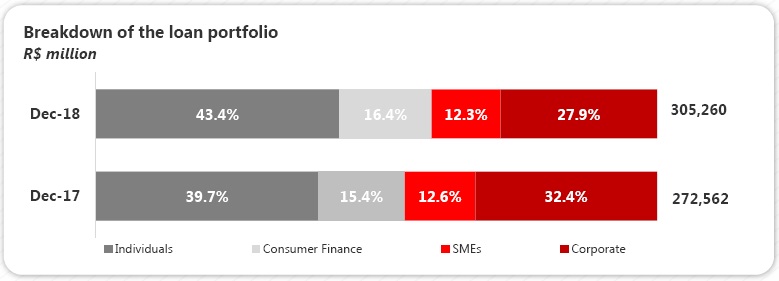
At the end of December 2018, the individuals portfolio accounted for 43.4% of the total portfolio, representing a 3.7 p.p. growth in twelve months. Furthermore, the consumer finance segment, whose balance reached 16.4% of the total portfolio at the end of December 2018, also expanded its share, +1.0 p.p. in twelve months. The corporate portfolio, however, saw a 4.5 p.p. reduction in twelve months to 27.9%, while the SME portfolio fell by 0.3 p.p. to 12.3%.
Loans to Individuals Loans to individuals amounted to R$ 132,565 million at the end of December 2018, meaning growth of 22.6% in twelve months (or R$ 24,450 million) and 5.8% in three months. The products that contributed the most to this evolution in both periods were payroll loans, credit card and mortgages. The payroll loans portfolio came to R$ 33,782 million in December 2018, climbing 31.9% in twelve months (or R$ 8,166 million) and 4.5% in three months. We attribute this performance to good customer acceptance of our digital channels and strong commercial dynamics in our network. The credit card portfolio reached R$ 30,892 million, advancing 26.5% in twelve months (or R$ 6,471 million), mostly explained by the increase in ourcustomer base and broadening range of innovativesolutions. In three months, the portfolio balance grew 15.4%. The mortgage loan portfolio totaled R$ 32,438 million, growing 15.4% in twelve months (or R$ 4,326 million) and 3.0% in three months. |
|
17
| Earnings Release (BR GAAP) | 4Q18 |
Consumer Finance The consumer finance portfolio, which is originated outside the branch network, stood at R$ 50,066 million at the end of December 2018, rising 19.5% in twelve months (or R$ 8,182 million) and 5.9% in three months. Of this total portfolio, R$ 41,254 million refers to vehicle financing for individuals, meaning growth of 20.0% in twelve months. The total vehicle portfolio for individuals, whichincludes operations carried out both by the financing unit (correspondent banks) as well as by Santander's branch network, rose 20.0% in twelve months and 5.4% in three months, amounting to R$ 43,483 million at the end of December 2018. The performance of this portfolio can be partially attributed to the +Negócios platform, focused on the vehicle segment, on which we offer a better experience throughout the customer journey. |
|
Corporate & SMEs Loans
The corporate & SME loan portfolio reached R$ 122,628 million in December 2018, rising 0.1% in twelve months (or R$ 66 million) and declining 2.5% in three months.
| The corporate loan portfolio totaled R$ 85,083 million, down 3.6% in twelve months (or R$ 3,192 million) and5.0% in three months. Disregarding the exchange ratefluctuation effect, the portfolio decreased by 8.3% in twelve months and 4.0% in three months. The SME loan portfolio amounted to R$ 37,546 million, which represents expansions of 9.5% in twelve months (or R$ 3,258 million) and 3.5% in three months. We maintain our positioning of providing sector-oriented offers and a non-financial proposal through the“Avançar”Program. In doing so, we have been able to grow our customer base and enhance our customer loyalty. |
18
| Earnings Release (BR GAAP) | 4Q18 |

MANAGERIAL BREAKDOWN OF CREDIT | Dec-18 | Dec-17 | Var. | Sep-18 | Var. |
PORTFOLIO BY PRODUCT(R$ million) |
|
| 12M |
| 3M |
Individuals |
|
|
|
|
|
Leasing / Auto Loans¹ | 2,229 | 1,852 | 20.4% | 2,114 | 5.4% |
Credit Card | 30,892 | 24,421 | 26.5% | 26,771 | 15.4% |
Payroll Loans | 33,782 | 25,616 | 31.9% | 32,329 | 4.5% |
Mortgages | 32,438 | 28,112 | 15.4% | 31,495 | 3.0% |
Agricultural Loans | 6,101 | 5,239 | 16.5% | 5,850 | 4.3% |
Personal Loans / Others | 27,122 | 22,875 | 18.6% | 26,777 | 1.3% |
Total Individuals | 132,565 | 108,115 | 22.6% | 125,336 | 5.8% |
- | - | 0.0% | - | 0.0% | |
Consumer Finance | 50,066 | 41,884 | 19.5% | 47,274 | 5.9% |
|
|
|
|
|
|
Corporate and SMEs |
|
|
|
|
|
Leasing / Auto Loans | 3,149 | 2,784 | 13.1% | 3,125 | 0.8% |
Real Estate | 4,099 | 6,577 | -37.7% | 4,734 | -13.4% |
Trade Finance | 25,806 | 17,379 | 48.5% | 28,821 | -10.5% |
On-lending | 9,531 | 13,919 | -31.5% | 9,734 | -2.1% |
Agricultural Loans | 5,733 | 6,320 | -9.3% | 6,061 | -5.4% |
Working capital / Others | 74,310 | 75,584 | -1.7% | 73,349 | 1.3% |
Total Corporate and SMEs | 122,628 | 122,563 | 0.1% | 125,823 | -2.5% |
|
|
|
|
|
|
Total Credit | 305,260 | 272,562 | 12.0% | 298,433 | 2.3% |
Other Credit Risk Transactions with customers² | 81,476 | 75,345 | 8.1% | 82,280 | -1.0% |
Total Expanded Credit Portfolio | 386,736 | 347,907 | 11.2% | 380,713 | 1.6% |
¹ Including consumer finance, the auto loan portfolio for individuals totaled R$ 43,483 million in Dec-18, R$ 41,256 million in Sept-18 and R$ 36,238 million in Dec-17.
² Including debentures, FIDC, CRI, promissory notes, international distribution promissory notes, acquiring-activities related assets and guarantees.
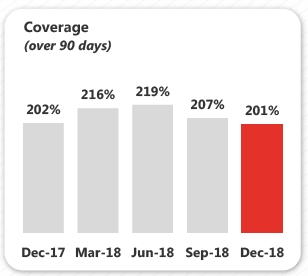
Coverage Ratio The balance of allowance for loan losses came to R$ 18,789million at the end of December 2018, increasing 7.6% intwelve months, below the expansion of our loan portfolio. In three months, this balance went up 3.1%. The coverage ratio stood at 201% at the end of December 2018, down 1.5 p.p. in twelve months and 6.1 p.p. in three months. These coverage figures show that our provisioning levels are adequate. |
|
19
| Earnings Release (BR GAAP) | 4Q18 |
Renegotiated Loan Portfolio Loan renegotiations totaled R$ 15,021 million at the end of December 2018, increasing by 10.0% in twelve months, below the expansion of our loan portfolio. In three months, the renegotiated portfolio increased 5.9%. These operations comprise loan agreements that have been renegotiated to enable their payment under conditions agreed upon with customers, including renegotiations of loans that had already been written-off in the past. In December 2018, the coverage ratio of the renegotiated portfolio stayed at an adequate level for these operations, reaching 53.7%, down 4.3 p.p. in twelve months and remaining stable in the quarter. | 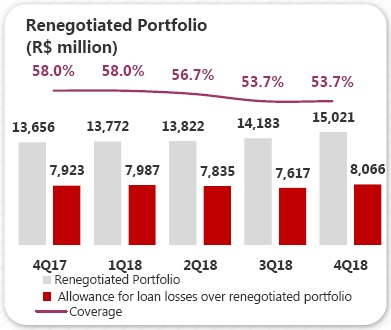 |
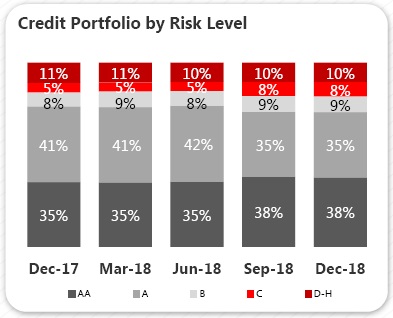 | Credit Portfolio by Risk Level We operate in accordance with our risk culture and international best practices, in order to protect our capital and guarantee the profitability of our businesses. Our credit approval process, particularly the approval of new loans and risk monitoring, is structured according to our classification of customers and products, centered around our retail and wholesale segments. At the end of December of 2018, portfolios rated “AA” and “A” accounted for 73% of the total loan portfolio. |
NPL Formation NPL formation was R$ 4,050 million in December 2018, rising 6.4% in twelve months and 8.0% in three months. The ratio between the NPL formation and the loan portfolio reached 1.3%, a reduction of 0.1 p.p. in twelve months and stable relative to September 2018. | 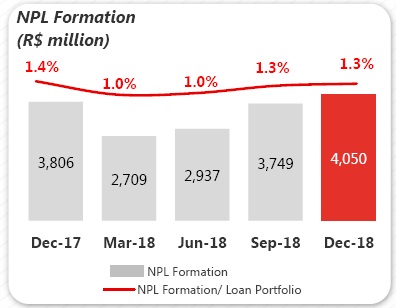 |
Note: NPL Formation is obtained from the change in balance of the non-performed portfolio over 90 days and the loan book under renegotiation, disregarding the portfolio written-off as loss in the period.
20
| Earnings Release (BR GAAP) | 4Q18 |
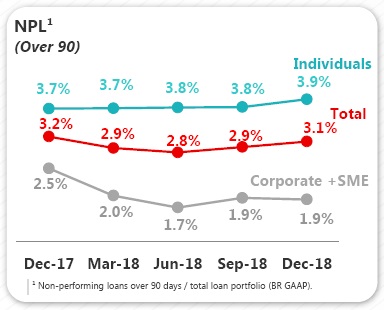
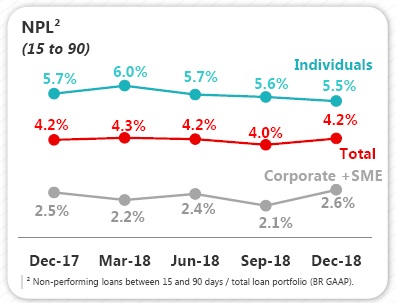
Delinquency Ratio over-90-Day The over-90-day delinquency ratio hit 3.1% in December 2018, a decline of 0.1 p.p. in twelve months and a rise of 0.2 p.p. in three months, in line with the larger share of the individuals segment in the loan portfolio. We maintained our ratio at a controlled level, thanks to our preventive risk management and effective models. Delinquency in the individuals segment was 3.9% in the period, advancing 0.2 p.p. in twelve months and 0.1 p.p. in three months, affected by the product mix. Delinquency in the corporate and SME segment came to 1.9% at the end of December 2018, down 0.6 p.p. in twelve months, due to a one-off case in the corporate segment in 4Q17. In three months, this ratio remained stable. |
| |
|
| |
| Delinquency Ratio 15-to-90-day The 15-to-90-day delinquency ratio reached 4.2% at the end of December 2018, stable in twelve months and 0.2 p.p. higher in three months. In the Individuals segment, the ratio stood at 5.5% in December 2018, down 0.2 p.p. in twelve months and 0.1 p.p. in three months. In the corporate & SME segment, this ratio came to 2.6%, advancing 0.1 p.p. in twelve months. In the quarterly comparison, it grew 0.5 p.p. due to specificcases in the corporate segment. |
21
| Earnings Release (BR GAAP) | 4Q18 |

FUNDING | Dec-18 | Dec-17 | Var. | Sep-18 | Var. |
(R$ million) |
|
| 12M |
| 3M |
Demand deposits | 18,832 | 17,177 | 9.6% | 17,421 | 8.1% |
Saving deposits | 46,068 | 40,572 | 13.5% | 44,429 | 3.7% |
Time deposits | 184,098 | 142,481 | 29.2% | 184,626 | -0.3% |
Debenture/LCI/LCA/LIG¹ | 46,366 | 70,470 | -34.2% | 54,472 | -14.9% |
Financial Bills² | 36,889 | 36,918 | -0.1% | 36,050 | 2.3% |
Funding from clients | 332,254 | 307,619 | 8.0% | 336,997 | -1.4% |
¹ Repo operations backed by Debentures, Real Estate Credit Notes (LCI) Agricultural Credit Notes (LCA) and Secured Real Estate Notes (“LIG”).
² Including Certificates of Structured Operations (COE).
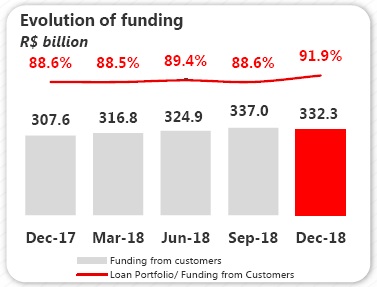
Total customer funding amounted to R$ 332,254 million at the end of December 2018, growing 8.0% in twelve months (or R$ 24,635 million), fueled by the expansion of time deposits, which registered a 29.2% increase compared to December 2017, followed by savings deposits and demand deposits, which recorded annual growth of 13.5% and 9.6%, respectively. In three months, total customer funding decreased by 1.4%, mostly impacted by debentures.
Credit/Funding Ratio
FUNDING VS. CREDIT | Dec-18 | Dec-17 | Var. | Sep-18 | Var. |
(R$ million) |
|
| 12M |
| 3M |
Funding from customers (A) | 332,254 | 307,619 | 8.0% | 336,997 | -1.4% |
(-) Reserve Requirements | (70,103) | (62,781) | 11.7% | (69,891) | 0.3% |
Funding Net of Reserve Requirements | 262,151 | 244,838 | 7.1% | 267,106 | -1.9% |
Borrowing and Onlendings | 13,364 | 17,251 | -22.5% | 13,639 | -2.0% |
Subordinated Debts | 19,668 | 8,959 | 119.5% | 10,125 | 94.3% |
Offshore Funding | 37,092 | 34,848 | 6.4% | 55,634 | -33.3% |
Total Funding (B) | 332,274 | 305,895 | 8.6% | 346,504 | -4.1% |
Assets under management¹ | 295,916 | 292,715 | 1.1% | 301,541 | -1.9% |
Total Funding and Asset under management | 628,190 | 598,611 | 4.9% | 648,046 | -3.1% |
Total Credit (C) | 305,260 | 272,562 | 12.0% | 298,433 | 2.3% |
C / B (%) | 91.9% | 89.1% |
| 86.1% |
|
C / A (%) | 91.9% | 88.6% |
| 88.6% |
|
¹ According to ANBIMA criteria.
The loan portfolio to customer funding ratio was 91.9% in December 2018, meaning growth of 3.3 p.p. in both periods, twelve and three months. The liquidity metric adjusted for the impact of reserve requirements and medium/long-term funding reached 91.9% in December 2018, rising 2.8 p.p. in twelve months and 5.8 p.p. in three months. The Bank is in a comfortable liquidity situation, withstable funding sources and adequate funding structure. |
|
22
| Earnings Release (BR GAAP) | 4Q18 |

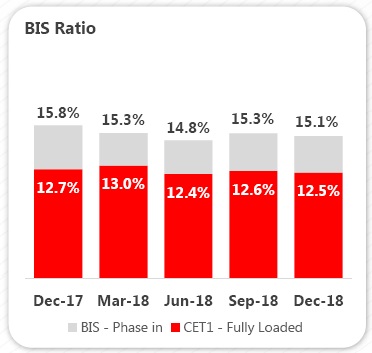
The BIS ratio stood at 15.1% in December 2018, a reduction of 0.76 p.p. in the last 12 months. This change is primarily explained by the impact on the capital deductions under the Basel III schedule, which went from 80% in 2017 to 100% in 2018. In addition to that, we saw a rise in credit risk, as consequence of the expansion of our loan portfolio, and in market risk, due to an increase in interest rate positions. In the quarter, this ratio fell by 0.19 p.p., owing to the reduction of Additional Tier I Capital and Tier II, both impacted by the exchange rate fluctuation in the period. It is worth noting that the ratio exceeds by 4.1 p.p. the sum of the minimum Regulatory Capital and Capital Conservation requirements. Since January 2018, the capital requirement has been changed from 9.25% to 8.625% + conservation capital of 1.875% + additional CET1 for systemically important financial institutions in the Brazilian market of 0.5%, totaling 11%. Tier I Capital is 8.375% and CET1 is 6.875%. |
|
In this quarter, we issued new instruments in the form of Notes, for the composition of Regulatory Capital in the amount of US$ 2.5 billion. Moreover, we announced the redemption of Notes issued on January 29thof 2014. In doing that, we optimized our capital structure by reducing the debt financial cost. In December 2018, the Brazilian Central Bank approved the use of the new Notes to compose Tier I and Tier II of our Regulatory Capital, as well as authorized the repurchase of the Notes issued in 2014.
The fully-loaded CET1 ratio reached 12.5% in December 2018, decreasing 0.2 p.p. in twelve months and 0.1 p.p. in the quarter, mainly impacted by changes in credit and market risk parameters, similar to those observed under the phase-in rules.
OWN RESOURCES AND BIS | Dec-18 | Dec-17 | Var. | Sep-18 | Var. |
(R$ million) |
|
| 12M |
| 3M |
Tier I Regulatory Capital | 61,477 | 56,386 | 9.0% | 62,042 | -0.9% |
CET1 | 56,582 | 52,197 | 8.4% | 56,973 | -0.7% |
Additional Tier I | 4,895 | 4,189 | 16.9% | 5,069 | -3.4% |
Tier II Regulatory Capital | 4,887 | 4,250 | 15.0% | 5,055 | -3.3% |
Adjusted Regulatory Capital (Tier I and II) | 66,364 | 60,636 | 9.4% | 67,098 | -1.1% |
Risk Weighted Assets (RWA) | 440,563 | 383,133 | 15.0% | 439,784 | 0.2% |
Credit Risk Capital requirement | 358,956 | 324,696 | 10.6% | 371,254 | -3.3% |
Market Risk Capital requirement | 39,232 | 25,857 | 51.7% | 26,155 | 50.0% |
Operational Risk Capital requirement | 42,376 | 32,579 | 30.1% | 42,376 | 0.0% |
Basel Ratio | 15.06% | 15.83% | -0.76 p.p. | 15.26% | -0.19 p.p. |
Tier I | 13.95% | 14.72% | -0.76 p.p. | 14.11% | -0.15 p.p. |
CET1 | 12.84% | 13.62% | -0.78 p.p. | 12.95% | -0.11 p.p. |
Tier II | 1.11% | 1.11% | 0.00 p.p. | 1.15% | -0.04 p.p. |
23
| Earnings Release (BR GAAP) | 4Q18 |
24
| Earnings Release (BR GAAP) | 4Q18 |
25
| Earnings Release (BR GAAP) | 4Q18 |
Rating Agencies
Santander is rated by international rating agencies and the ratings it receives reflect several factors, including the quality of its management, its operational performance and financial strength, as well as other variables related to the financial sector and the economic environment in which the company operates, with its long-term foreign currency rating limited to the sovereign rating. The table below presents the ratings assigned by Standard & Poor's and Moody's:
|
| Global Scale |
| National Scale | |||||
| |||||||||
Ratings |
| Local Currency | Foreign Currency | National | |||||
| Long-term | Short-term |
| Long-term | Short-term |
| Long-term | Short-term | |
Standard & Poor’s¹ | BB- | B |
| BB- | B |
| brAAA | brA-1+ | |
|
|
| |||||||
Moody's² (outlook) |
| Ba1 | NP |
| Ba3 | NP |
| Aaa.br | Br-1 |
|
|
| |||||||
¹ Last update on November 29th, 2018.
² Last update on August 20th, 2018.
26
| Earnings Release (BR GAAP) | 4Q18 |
Accounting and Managerial Results Reconciliation
For a better understanding of BRGAAP results, the reconciliation between the accounting result and the managerial result is presented below.
ACCOUNTING AND MANAGERIAL | 2018 | Reclassifications | 2018 | |||||
RESULTS RECONCILIATION(R$ million) | Accounting | Exchange Hedge¹ | Credit Recovery² | Amort. of goodwill³ | Profit Sharing | FX | Other events5 | Managerial |
Net Interest Income | 37,719 | 5,867 | (2,208) | - | - | - | 621 | 42,000 |
Allowance for Loan Losses | (12,684) | - | 2,319 | - | - | - | (495) | (10,860) |
Net Interest Income after Loan Losses | 25,035 | 5,867 | 111 | - | - | - | 127 | 31,140 |
Fees | 17,269 | - | - | - | - | - | - | 17,269 |
General Expenses | (18,846) | - | - | 279 | (1,612) | - | - | (20,179) |
Personnel Expenses | (7,701) | - | - | - | (1,612) | - | - | (9,313) |
Administrative Expenses | (11,145) | - | - | 279 | - | - | 0.1 | (10,867) |
Tax Expenses | (3,778) | (255) | - | - | - | - | - | (4,034) |
Investments in Affiliates and Subsidiaries | 19 | - | - | - | - | - | - | 19 |
Other Operating Income/Expenses | (4,993) | - | (111) | - | - | - | (329) | (5,433) |
Operating Income | 14,705 | 5,612 | - | 279 | (1,612) | - | (203) | 18,781 |
Non Operating Income | 193 | - | - | - | - | - | - | 193 |
Net Profit before Tax | 14,898 | 5,612 | - | 279 | (1,612) | - | (203) | 18,974 |
Income Tax and Social Contribution | (735) | (5,612) | - | - | - | - | 155 | (6,192) |
Profit Sharing | (1,612) | - | - | - | 1,612 | - | - | - |
Minority Interest | (385) | - | - | - | - | - | - | (385) |
Net Profit | 12,166 | (0) | - | 279 | - | - | (47) | 12,398 |
ACCOUNTING AND MANAGERIAL | 2017 | Reclassifications | 2017 | |||||
RESULTS RECONCILIATION(R$ million) | Accounting | Exchange Hedge¹ | Credit Recovery² | Amort. of goodwill³ | ProfitSharing | FX | Other events5 | Managerial |
Net Interest Income | 38,726 | 808 | (2,605) | - | - | (94) | 492 | 37,327 |
Allowance for Loan Losses | (11,779) | - | 2,619 | - | - | (57) | (492) | (9,708) |
Net Interest Income after Loan Losses | 26,947 | 808 | 14 | - | - | (150) | - | 27,619 |
Fees | 15,611 | - | - | - | - | - | - | 15,611 |
General Expenses | (19,356) | - | - | 1,535 | (1,460) | - | 114 | (19,167) |
Personnel Expenses | (7,631) | - | - | - | (1,460) | - | - | (9,091) |
Administrative Expenses | (11,725) | - | - | 1,535 | - | - | 114 | (10,076) |
Tax Expenses | (3,587) | (79) | - | - | - | - | - | (3,667) |
Investments in Affiliates and Subsidiaries | 25 | - | - | - | - | - | - | 25 |
Other Operating Income/Expenses | (6,252) | - | (14) | - | - | 150 | 296 | (5,819) |
Operating Income | 13,388 | 729 | - | 1,535 | (1,460) | - | 410 | 14,602 |
Non Operating Income | (260) | - | - | - | - | - | - | (260) |
Net Profit before Tax | 13,128 | 729 | - | 1,535 | (1,460) | - | 410 | 14,342 |
Income Tax and Social Contribution | (3,278) | (729) | - | - | - | - | 12 | (3,996) |
Profit Sharing | (1,460) | - | - | - | 1,460 | - | - | - |
Minority Interest | (394) | - | - | - | - | - | - | (394) |
Net Profit | 7,997 | - | - | 1,535 | - | - | 422 | 9,953 |
27
| Earnings Release (BR GAAP) | 4Q18 |
ACCOUNTING AND MANAGERIAL | 4Q18 | Reclassifications | 4Q18 | |||||
RESULTS RECONCILIATION(R$ million) | Accounting | Exchange Hedge¹ | Credit Recovery² | Amort. of goodwill³ | Profit Sharing | FX | Other events5 | Managerial |
Net Interest Income | 12,541 | (1,544) | (571) | - | - | - | 321 | 10,747 |
Allowance for Loan Losses | (3,230) | - | 565 | - | - | - | (321) | (2,986) |
Net Interest Income after Loan Losses | 9,311 | (1,544) | (5) | - | - | - | - | 7,761 |
Fees | 4,725 | - | - | - | - | - | - | 4,725 |
General Expenses | (5,297) | - | - | 70 | (260) | - | - | (5,487) |
Personnel Expenses | (2,127) | - | - | - | (260) | - | - | (2,387) |
Administrative Expenses | (3,170) | - | - | 70 | - | - | - | (3,100) |
Tax Expenses | (1,192) | 151 | - | - | - | - | - | (1,041) |
Investments in Affiliates and Subsidiaries | 5 | - | - | - | - | - | - | 5 |
Other Operating Income/Expenses | (1,560) | - | 5 | - | - | - | - | (1,555) |
Operating Income | 5,991 | (1,393) | - | 70 | (260) | - | - | 4,408 |
Non Operating Income | 160 | - | - | - | - | - | - | 160 |
Net Profit before Tax | 6,150 | (1,393) | - | 70 | (260) | - | - | 4,567 |
Income Tax and Social Contribution | (2,431) | 1,393 | - | - | - | - | - | (1,038) |
Profit Sharing | (260) | - | - | - | 260 | - | - | - |
Minority Interest | (124) | - | - | - | - | - | - | (124) |
Net Profit | 3,336 | - | - | 70 | - | - | - | 3,405 |
ACCOUNTING AND MANAGERIAL | 3Q18 | Reclassifications | 3Q18 | |||||
RESULTS RECONCILIATION(R$ million) | Accounting | Exchange Hedge¹ | Credit Recovery² | Amort. of goodwill³ | Profit Sharing | FX | Other events5 | Managerial |
Net Interest Income | 9,323 | 1,515 | (508) | - | - | - | 300 | 10,629 |
Allowance for Loan Losses | (2,964) | - | 519 | - | - | - | (173) | (2,618) |
Net Interest Income after Loan Losses | 6,359 | 1,515 | 11 | - | - | - | 127 | 8,011 |
Fees | 4,135 | - | - | - | - | - | - | 4,135 |
General Expenses | (4,638) | - | - | 70 | (452) | - | - | (5,020) |
Personnel Expenses | (1,879) | - | - | - | (452) | - | - | (2,331) |
Administrative Expenses | (2,759) | - | - | 70 | - | - | - | (2,690) |
Tax Expenses | (1,074) | 70 | - | - | - | - | - | (1,004) |
Investments in Affiliates and Subsidiaries | 5 | - | - | - | - | - | - | 5 |
Other Operating Income/Expenses | (975) | - | (11) | - | - | - | (127) | (1,113) |
Operating Income | 3,812 | 1,585 | - | 70 | (452) | - | (0) | 5,014 |
Non Operating Income | 6 | - | - | - | - | - | - | 6 |
Net Profit before Tax | 3,818 | 1,585 | - | 70 | (452) | - | (0) | 5,020 |
Income Tax and Social Contribution | (240) | (1,585) | - | - | - | - | - | (1,825) |
Profit Sharing | (452) | - | - | - | 452 | - | - | - |
Minority Interest | (87) | - | - | - | - | - | - | (87) |
Net Profit | 3,039 | - | - | 70 | - | - | (0) | 3,108 |
¹ Foreign Exchange Hedge:under Brazilian tax rules, gains (losses) derived from exchange rate fluctuations on foreign currency investments are not taxable (tax deductible). This tax treatment leads to exchange rate exposure to taxes. An exchange rate hedge position was set up with the purpose of protecting the net profit from the impact of foreign exchange fluctuations related to this tax exposure.
² Credit Recovery:reclassified from revenue from loan operations to allowance for loan losses and, from 2017 onwards, it includes provision for guarantees provided.
³ Amortization of Goodwill:reversal of goodwill amortization expenses.
⁴ Exchange Rate Fluctuation:includes, in addition to the effect of the exchange rate fluctuation, reclassifications between different lines of the Bank’s results (other operating income/expenses, allowance for loan losses and non-operating result) for better comparability with previous quarters.
5Other events:
2017
3Q17: Adhesion effect to the installment payment program for outstanding taxes and social security debts (in accordance with Provisional Measure No. 783/2017).
4Q17:
Net Interest Income and Allowance for Loan Losses: reclassification between the lines referring to the adjustment in the valuation of assets related to the impairment of securities.
Administrative Expenses and Other Operating Income and Expenses: adhesion to the installment payment program by the cities of São Paulo and Rio de Janeiro (R$ 9 million in administrative expenses, R$ 27 million in other operating expenses and R$ 179 million reversal in other operating income) and write-down of intangible assets due to impairment in the amount of R$ 306 million.
2018
1Q18: Adhesion effect to the installment payment program for outstanding taxes and social security debts (in accordance with Provisional Measure No. 783/2017).
2Q18: Includes a gain of R$ 816 MM from the adjustment of post-employment benefits, additional provisions for contingencies in the amount of R$ 358 MM, impairment of intangible assets (systems acquisition and development) in the amount of R$ 306 MM and a write-off of tax credits in the amount of R$ 74 MM.
3Q18: Net Interest Income, Allowance for Loan Losses and Other Operating Income and Expenses: reclassifications between the lines referring to adjustments in the valuation of assets related to the impairment of securities (R$ 173 MM) and derivative instruments (R$ 127 MM).
4Q18: Net Interest Income and Allowance for Loan Losses: reclassification between the lines referring to the adjustment in the valuation of assets related to the impairment of securities.
28
| Earnings Release (BR GAAP) | 4Q18 |
¹ Cards turnover do not include withdrawal transactions, it only considers purchase volumes.
² Individuals' origination. ³ Ratio between Loans and Collateral Value.
29
| Earnings Release (BR GAAP) | 4Q18 |
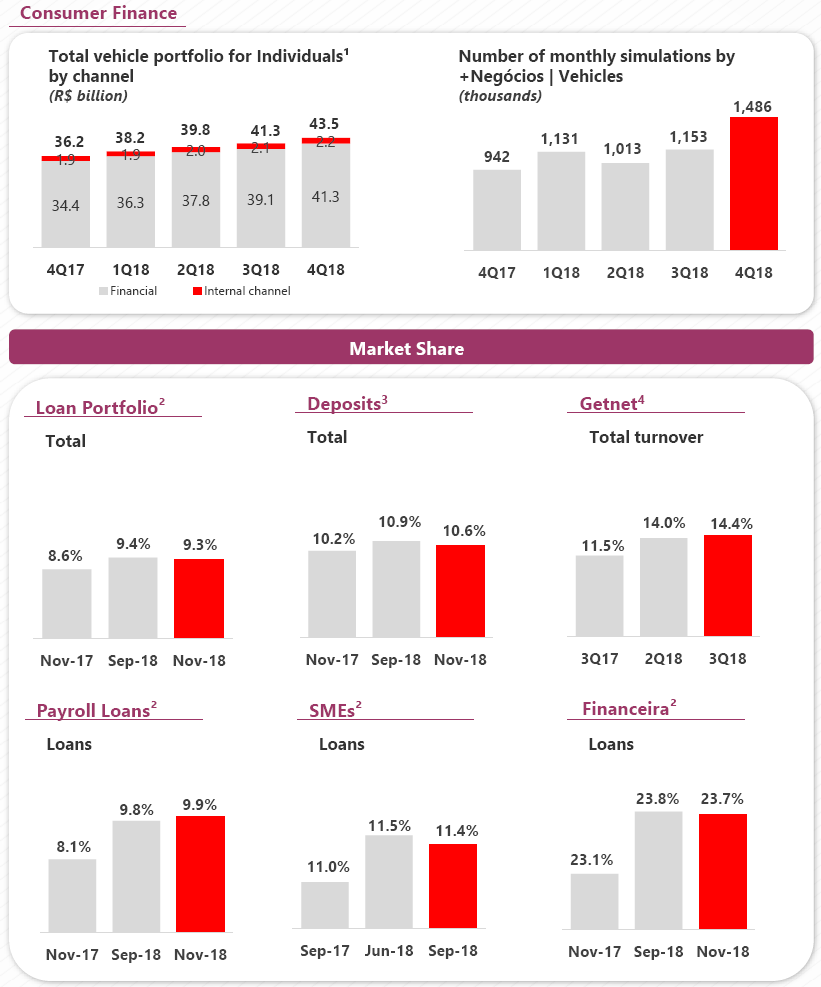
¹ Vehicle portfolio for Individuals and Companies, Individuals' portfolio is generated by the internal channel as well as by the Individuals' portfolio from the Consumer Finance segment.² Brazilian Central Bank. ³ Brazilian Central Bank. It includes demand deposits, time deposits, savings deposits, Real Estate Credit Notes (LCI) and Agricultural Credit Notes (LCA)4ABECS - Acquiring.
30
| Earnings Release (BR GAAP) | 4Q18 |

31
Banco Santander (Brasil) S.A. | ||
| By: | /S/ Amancio Acurcio Gouveia | |
Amancio Acurcio Gouveia Officer Without Specific Designation | ||
| By: | /S/ Angel Santodomingo Martell | |
Angel Santodomingo Martell Vice - President Executive Officer | ||