UNITED STATES
SECURITIES AND EXCHANGE COMMISSION
Washington, D.C. 20549
FORM N-CSR
CERTIFIED SHAREHOLDER REPORT OF REGISTERED
MANAGEMENT INVESTMENT COMPANIES
Investment Company Act file number | 811-22329 |
|
Nuveen Mortgage Opportunity Term Fund |
(Exact name of registrant as specified in charter) |
|
Nuveen Investments
333 West Wacker Drive
Chicago, IL 60606 |
(Address of principal executive offices) (Zip code) |
|
Kevin J. McCarthy
Nuveen Investments
333 West Wacker Drive
Chicago, IL 60606 |
(Name and address of agent for service) |
|
Registrant’s telephone number, including area code: | (312) 917-7700 | |
|
Date of fiscal year end: | December 31 | |
|
Date of reporting period: | December 31, 2009 | |
| | | | | | |
Form N-CSR is to be used by management investment companies to file reports with the Commission not later than 10 days after the transmission to stockholders of any report that is required to be transmitted to stockholders under Rule 30e-1 under the Investment Company Act of 1940 (17 CFR 270.30e-1). The Commission may use the information provided on Form N-CSR in its regulatory, disclosure review, inspection, and policymaking roles.
A registrant is required to disclose the information specified by Form N-CSR, and the Commission will make this information public. A registrant is not required to respond to the collection of information contained in Form N-CSR unless the Form displays a currently valid Office of Management and Budget (“OMB”) control number. Please direct comments concerning the accuracy of the information collection burden estimate and any suggestions for reducing the burden to Secretary, Securities and Exchange Commission, 450 Fifth Street, NW, Washington, DC 20549-0609. The OMB has reviewed this collection of information under the clearance requirements of 44 U.S.C. ss. 3507.
ITEM 1. REPORTS TO STOCKHOLDERS.

Closed-End Funds
Nuveen Investments
Closed-End Funds
Attractive Distribution and Return Potential from a Portfolio
Consisting Primarily of Mortgage-Backed Securities
Annual Report
December 31, 2009

Nuveen Mortgage Opportunity Term Fund
JLS
LIFE IS COMPLEX.
Nuveen makes things e-simple.
It only takes a minute to sign up for e-Reports. Once enrolled, you'll receive an e-mail as soon as your Nuveen Investments Fund information is ready—no more waiting for delivery by regular mail. Just click on the link within the e-mail to see the report and save it on your computer if you wish.
Free e-Reports right to your e-mail!
www.investordelivery.com
If you receive your Nuveen Fund dividends and statements from your financial advisor or brokerage account.
OR
www.nuveen.com/accountaccess
If you receive your Nuveen Fund dividends and statements directly from Nuveen.

Chairman's
Letter to Shareholders

Dear Shareholder,
The financial markets in which your Fund operates continue to reflect the larger economic crosscurrents. The illiquidity that infected global credit markets over the last year continues to recede but there is concern about the impact of a reduction in official liquidity support programs. The major institutions that are the linchpin of the international financial system have strengthened their capital structures, but many still struggle with losses in their various portfolios. Global trends include increasing trade and concern about the ability of the U.S. government to address its substantial budgetary deficits.
While the fixed-income and equity markets have recovered from the lows recorded in late 2008 and early 2009, identifying those developments that will define the future is never easy, and rarely is it more difficult than at present. A fundamental component of a successful investment program is a commitment to remain focused on long-term investment goals even during periods of heightened market uncertainty. Another component is to re-evaluate investment disciplines and tactics and to confirm their validity following periods of extreme volatility and market dislocation, such as we have recently experienced. Your Board carried out an intensive review of investment performance with these objectives in mind during October of 2009 as part of the annual management contract renewal process. I encourage you to read the description of this process in the Annual Investment Management Agreement Approval Process section of this report. Confir ming the appropriateness of a long term investment strategy is as important for our shareholders as it is for our professional investment managers. For that reason, I again encourage you to remain in communication with your financial consultant on this subject.
On behalf of the other members of your Fund's Board, we look forward to continuing to earn your trust in the months and years ahead.
Sincerely,

Robert P. Bremner
Chairman of the Board and Lead Independent Director
February 22, 2010
Nuveen Investments
1
Portfolio Managers' Comments
Certain statements in this report are forward-looking statements. Discussions of specific investments are for illustration only and are not intended as recommendations of individual investments. The forward-looking statements and other views expressed herein are those of the portfolio managers as of the date of this report. Actual future results or occurrences may differ significantly from those anticipated in any forward-looking statements and the views expressed herein are subject to change at any time, due to numerous market and other factors. The Fund disclaims any obligation to update publicly or revise any forward-looking statements or views expressed herein.
Nuveen Mortgage Opportunity Term Fund (JLS)
Nuveen Asset Management (NAM), an affiliate of Nuveen Investments, is the Fund's investment adviser, and is responsible for determining the Fund's overall investment strategy and monitoring the performance of the sub-adviser. Wellington Management Company, LLP, the Fund's sub-adviser, responsible for managing the Fund's direct investments in mortgage-backed securities (MBS) and other permitted investments.
Michael F. Garrett, Senior Vice President and Fixed Income Portfolio Manager of Wellington Management, leads that firm's mortgage-backed investment team and serves as portfolio manager of the Fund. He has more than 18 years of investment management experience.
John V. Miller, CFA, Chief Investment Officer and Managing Director of NAM, serves as portfolio manager of the Fund and is responsible for determining whether and to what extent to invest a portion of the Fund's assets in the U.S. Treasury's Public-Private Investment Program (PPIP). John has 15 years of investment management experience.
Here Michael and John talk about economic and market conditions, their management strategies and the performance of the Fund for the short period from its inception on November 25, 2009, through the end of its fiscal year on December 31, 2009.
What were the general market conditions during the reporting period ending December 31, 2009?
Overall, economic and market conditions were generally—but not universally—favorable in December 2009. The Standard & Poor's (S&P) 500 Stock Index was up about 1.7% during the month, and finished the year up about 26.5%. U.S. Government bond yields declined across most of the yield curve during the month and the Federal Reserve kept the fed funds rate at historically low levels. Real estate prices rose in some markets, although the threat of future foreclosures remained. The national unemployment rate at year end was 10% and the general credit markets were still constricted, suggesting that the road to recovery would not be quick or easy.
Within securitized markets, non-agency MBS rallied in price during the month primarily due to renewed dealer interest. A move away from ratings-based capital charges by the National Association of Insurance Commissioners also increased demand and reduced selling pressure from insurance companies. In addition, the extension of Basel II guidance, which postponed the transition to tighter capital requirements and delayed the need for European banks to sell large amounts of non-agency bonds in the near term, buoyed the non-agency MBS sector. Improving economic trends and well-received new
Nuveen Investments
2
issues buoyed the commercial mortgage-backed securities (CMBS) sector. Demand was robust as buyers of corporate bonds looked to the CMBS market for yield. Agency MBS pass-throughs were the notable underperformer in December, as heavy selling and growing issuance weighed on the sector.
What key strategies were used to manage the Fund during this period?
The Fund's investment objective is to generate attractive total returns through opportunistic investments in MBS. Through these investments, the Fund seeks to capitalize on the potential for recovery in the U.S. residential and commercial real estate markets, and a corresponding recovery in valuations of mortgage securities, over an investment horizon of ten years.
Under normal circumstances, the Fund invests at least 80% of its assets in MBS, consisting primarily of non-agency residential mortgage-backed securities (RMBS) and CMBS, directly and indirectly by investing in a private feeder fund (Feeder PPIP Fund) which in turn invests in a private master fund (Master PPIP Fund) organized to invest directly in MBS and other assets eligible for purchase under the PPIP. MBS represent interests in diversified pools of residential or commercial mortgage loans, and typically take the form of pass-through securities or collateralized mortgage obligations.
During December 2009 we began investing the proceeds raised in the Fund's initial public offering in liquid agency mortgage pass-through securities and other agency debt while we sought attractive investment opportunities in the non-agency MBS and CMBS markets.
Residential mortgages continue to experience elevated levels of default as the weak economy, high level of unemployment, and sluggish housing market weigh on borrowers. Voluntary prepayments have slowed materially for the sector as refinancing options remain limited for many borrowers. Though delinquencies continue to rise, severity rates have stabilized in recent months. December's improvement in the sector did not bring it back to October's levels. With difficult fundamentals and growing supply, we anticipate that prices will be volatile. In December, we focused on the segment of the non-agency market where we believed valuations remained attractive.
Commercial real estate fundamentals remain decidedly negative across all property types. Delinquencies are accelerating and we do not anticipate a peak until late 2011. We are also seeing greater divergence in performance between recent (2006, 2007, 2008) and more seasoned issues. Given the more aggressive underwriting of recent loans, we expect recent issues to continue to underperform more seasoned issues and for this divergence to become more pronounced in 2010. Access to capital is beginning to improve for the sector, although supply of new issue CMBS remains very low. Similar to the non-agency MBS market, December's improvement in the CMBS sector did not bring it back to October's levels. With challenging fundamentals and growing supply, we anticipate that prices will be volatile. We focused purchases on very specific tranches of selected deals.
On December 8, 2009, the Fund's subscription for an investment of $95,000,000 in the Feeder PPIP Fund was accepted. As of December 31, 2009, the Fund had a remaining
Nuveen Investments
3
Past performance does not guarantee future results. Current performance may be higher or lower than the data shown.
Returns do not reflect the deduction of taxes that shareholders may have to pay on Fund distributions or upon the sale of Fund shares. For additional information, see the individual Performance Overview for the Fund in this report.
1. The Barclays Capital U.S. Aggregate Bond Index is an unmanaged index that includes all investment-grade, publicly issued, fixed-rate, dollar denominated, nonconvertible debt issues and commercial mortgage backed securities with maturities of at least one year and outstanding par values of $150 million or more. Index returns do not include the effects of any sales charges or management fees. It is not possible to invest directly in an index.
undrawn capital commitment to the Feeder PPIP Fund of $75,958,525. NAM has delegated management of assets that have been committed to but not yet called by the Feeder PPIP Fund to Wellington Management.
How did the Fund perform over this period?
The performance of JLS, as well as a general market index, is presented in the accompanying table.
Cumulative Total Returns on Net Asset Value
For the period ended 12/31/09
| | | Since
Inception* | |
| JLS | | | +0.06 | % | |
| Barclays Capital U.S. Aggregate Bond Index1 | | | -1.56 | % | |
*JLS since inception return is cumulative from 11/25/09. The index return is cumulative from 11/30/09.
For this approximately one-month reporting period, the Fund outperfromed the Barclays Capital U.S. Aggregate Bond Index.
During December 2009, the Fund's prime and alt A non-agency MBS holdings contributed positively to performance. In addition, the Fund benefited from the income generated by its allocation to agency MBS pass-through securities and agency debt which was duration-hedged.
The Fund's allocation to the Feeder PPIP Fund and CMBS holdings modestly detracted from performance. Given that bid/ask spreads remained wide in the less liquid sectors of the securitized markets, transaction costs had a negative impact on short-term performance results.
We look forward to providing a more complete report on the Fund's initial investment process and results in the next shareholder report.
As of December 31, 2009, the Fund was trading at a +4.65% premium to its net asset value.
Nuveen Investments
4
JLS
Performance
OVERVIEW
Nuveen Mortgage Opportunity Term Fund
as of December 31, 2009
Portfolio Allocation (as a % of total Fund investments)1

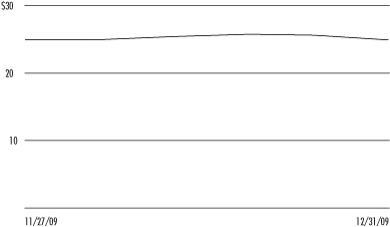
Share Price Performance — Weekly Closing Price
1 Total Fund Investments has been reduced by $107 million in Payable for Investments Purchased reflected on the Statement of Assets and Liabilities as Short-Term Investments will be utilized to settle such amounts.
2 The Fund is a limited partner in a private feeder fund (the "Feeder PPIP Fund") organized by Wellington Management Company, LLP ("Wellington Management"). The Feeder PPIP Fund invests all of its assets in a master fund (the "Master PPIP Fund") that has been organized by Wellington Management to invest directly in mortgage-backed securities and other assets eligible for purchase under the Public-Private Investment Program ("PPIP") established by the U.S. Department of Treasury.
3 Nominal spread duration is a measure of a mortgage-backed security's or fund's susceptibility to price changes resulting from changes in interest rates in the open market for that type of security or fund. The Fund's average spread duration is the market value weighted average of the spread duration of each fund portfolio investment, excluding cash equivalents, leverage and investments in derivatives. A bond's spread duration is defined as the projected percent price change of the bond given a 100 basis point move in its yield spread relative to a comparable maturity Treasury security. Spreads can "widen" or "tighten" relative to comparable duration Treasury securities. A "widening" occurs when spreads increase and would likely result in a price decline for a security (or portfolio) with positive spread duration. A "tightening" occurs when spreads decrease and would likely result in a price increase for a security (or portfoli o) with positive spread duration. The Fund relies on holding-specific spread durations as projected and reported by the Fund's sub-adviser, Wellington Management. The Fund's average spread duration reflects the spread durations of bonds held in the Master PPIP Fund, in which the Fund has indirectly invested. Spread duration is merely a projection and may not accurately reflect a bond's or a fund's actual price changes as a result of changes in market interest rates.
4 The Fund's average credit quality is the market value weighted average of the numerical equivalent of the lower of either Standard & Poor's or Moody's credit rating, as available, of each rated bond. This figure excludes cash equivalents, leverage and investments in derivatives. The Fund's average credit quality includes the impact of the Fund's pro-rated indirect ownership of bonds held in the Master PPIP Fund. Holdings and their ratings will change over time. The average rating does not reflect the broader variation of ratings in the portfolio.
Fund Snapshot
| Share Price | | $ | 25.00 | | |
| Net Asset Value (NAV) | | $ | 23.89 | | |
| Premium/(Discount) to NAV | | | 4.65 | % | |
| Net Assets (000) | | $ | 358,525 | | |
Fund Cumulative Total Return
(Inception 11/25/09)
| | | On Share Price | | On NAV | |
| Since Inception | | | 0.00 | % | | | 0.06 | % | |
Key Portfolio Statistics
| Average Coupon | | | 5.19 | % | |
| Average Life (Years) | | | 5.39 | | |
| Spread Duration (Years)3 | | | 4.54 | | |
| Average Credit Quality4 | | | A2 | | |
Aggregate Sector Allocation
(as a % of total investment exposure)
Residential Mortgage-Backed
Securities | | | 26.0 | % | |
Commercial Mortgage-Backed
Securities | | | 8.9 | % | |
| Agency Debt | | | 26.9 | % | |
| Agency Pass-Throughs | | | 28.9 | % | |
| Cash Equivalents | | | 9.3 | % | |
Nuveen Investments
5
Report of INDEPENDENT REGISTERED
PUBLIC ACCOUNTING FIRM
To the Board of Trustees and Shareholders of
Nuveen Mortgage Opportunity Term Fund:
In our opinion, the accompanying statement of assets and liabilities, including the portfolio of investments, and the related statements of operations, of changes in net assets, of cash flows and the financial highlights present fairly, in all material respects, the financial position of Nuveen Mortgage Opportunity Term Fund (the "Fund") at December 31, 2009, and the results of its operations, the changes in its net assets, its cash flows and the financial highlights for the period November 25, 2009 (commencement of operations) through December 31, 2009, in conformity with accounting principles generally accepted in the United States of America. These financial statements and financial highlights (hereafter referred to as "financial statements") are the responsibility of the Fund's management; our responsibility is to express an opinion on these financial statements based on our audit. We conducted our audit of these financial s tatements in accordance with the standards of the Public Company Accounting Oversight Board (United States). Those standards require that we plan and perform the audit to obtain reasonable assurance about whether the financial statements are free of material misstatement. An audit includes examining, on a test basis, evidence supporting the amounts and disclosures in the financial statements, assessing the accounting principles used and significant estimates made by management, and evaluating the overall financial statement presentation. We believe that our audit, which included confirmation of securities at December 31, 2009 by correspondence with the custodian and brokers, provides a reasonable basis for our opinion.
PricewaterhouseCoopers LLP
Chicago, IL
February 25, 2010
Nuveen Investments
6
JLS
Nuveen Mortgage Opportunity Term Fund
Portfolio of INVESTMENTS
December 31, 2009
Principal
Amount (000) | | Description (1) | | Coupon | | Maturity | | Ratings (2) | | Value | |
| | | Mortgage-Backed Securities – 59.5% | |
| | | Residential – 59.5% | |
| $ | 4,242 | | | Bear Stearns Adjustable Rate Mortgage Trust, Mortgage Pass-Through | | | 5.975 | % | | 6/25/47 | | CCC | | $ | 3,091,566 | | |
| | | | | Certificate Series 2007-4 | | | | | | | | | | | | | |
| | 8,178 | | | Bear Stearns Adjustable Rate Mortgage Trust, Pass Through Certificates,
Series 2006-4 | | | 5.669 | % | | 10/25/36 | | B- | | | 5,669,477 | | |
| | 6,837 | | | Bear Stearns ARM Trust, Mortgage Pass Through Certificates, Series 2007-1 | | | 5.410 | % | | 2/25/47 | | CCC | | | 4,469,973 | | |
| | 5,000 | | | Carrington Securities LP, Mortgage Loan Trust Asset-Backed Pass-Through
Certificates Series 2007-HE1 | | | 0.381 | % | | 6/25/37 | | AAA | | | 2,855,051 | | |
| | 5,518 | | | Citigroup Mortgage Loan Trust Inc., Mortgage Pass-Through Certificates,
Series 2007-AR4 | | | 5.605 | % | | 3/25/37 | | CCC | | | 3,920,638 | | |
| | 2,322 | | | Citigroup Mortgage Loan Inc., Mortgage Pass Through Certificates,
Series 2006- AR2 | | | 5.621 | % | | 3/25/36 | | B3 | | | 1,711,066 | | |
| | 6,507 | | | Citigroup Mortgage Loan Trust, Mortgage Pass-Through Certificates,
Series 2006-AR7 | | | 5.581 | % | | 11/25/36 | | CCC | | | 3,796,985 | | |
| | 3,886 | | | Citigroup Mortgage Loan Trust, Mortgage Pass-Through Certificates,
Series 2007-AR8 | | | 5.877 | % | | 7/25/37 | | BB | | | 2,844,235 | | |
| | 1,618 | | | Countrywide Alternative Loan Trust, Mortgage Pass-Through Certificates,
Series 2005-J11 | | | 6.000 | % | | 10/25/35 | | B2 | | | 1,133,696 | | |
| | 612 | | | Countrywide Alternative Loan Trust, Securitization Pass-Through Certificates
Series 2007-HY5R | | | 5.544 | % | | 3/25/47 | | B | | | 530,799 | | |
| | 6,166 | | | Credit Suisse First Boston Mortgage Acceptance Corporation, Adjustable Rate
Mortgage-Backed Pass Through Certifcates Series 2005-12 | | | 5.606 | % | | 3/25/36 | | B3 | | | 4,052,476 | | |
| | 50,000 | | | Federal National Mortgage Association (WI/DD) | | | 6.000 | % | | TBA | | AAA | | | 52,960,950 | | |
| | 50,000 | | | Federal National Mortgage Association (WI/DD) | | | 6.500 | % | | TBA | | AAA | | | 53,554,700 | | |
| | 7,860 | | | First Horizon Alternative Mortgage Securities Trust, Mortgage Pass-Through
Certificates Series 2006-FA3 | | | 6.000 | % | | 7/25/36 | | Caa1 | | | 6,346,651 | | |
| | 5,258 | | | First Horizon Alternative Mortgage Securities, Mortage Pass-Through Certificates,
Series 2006-FA3 | | | 6.000 | % | | 7/25/36 | | Caa1 | | | 3,857,337 | | |
| | 5,000 | | | Greenwich Capital Commercial Funding Corporation, Commercial Mortgage
Pass- Through Certificates, Series 2005-GG5.11 | | | 5.224 | % | | 4/10/37 | | Aaa | | | 4,745,064 | | |
| | 5,442 | | | GSR Mortgage Loan Trust, Mortgage Pass- Through Certificates, Series 2006-AR2 | | | 5.696 | % | | 4/25/36 | | B- | | | 4,005,375 | | |
| | 1,092 | | | GSR Mortgage Securities Corporation, Mortgage Pass-Through Certificates,
Series 2007-AR2 | | | 5.750 | % | | 5/25/47 | | CCC | | | 719,383 | | |
| | 8,000 | | | J.P. Morgan Chase Commercial Mortgage Securities Corporation, Commercial
Mortgage Pass-Through Certificates, Series 2005-LDP4 | | | 4.918 | % | | 10/15/42 | | AAA | | | 7,704,160 | | |
| | 4,183 | | | JP Morgan Chase Commercial Mortgage Securities Corporation, Commercial
Mortgage Pass-Through Certificates, Series 2006-LDP8 | | | 5.440 | % | | 5/15/45 | | Aaa | | | 3,211,820 | | |
| | 6,579 | | | LB UBS Commercial Mortgage Trust Series 2007-C2, Pass Through Certificates | | | 5.493 | % | | 2/15/40 | | BBB | | | 4,462,524 | | |
| | 4,350 | | | LB UBS Commercial Mortgage Trust, Series 2005-C5 | | | 5.017 | % | | 9/15/40 | | A+ | | | 3,574,857 | | |
| | 2,061 | | | Merrill Lynch Mortgage Backed Securities Trust, Mortgage Loan Asset Backed Notes,
Series 2007-2 | | | 5.800 | % | | 8/25/36 | | B3 | | | 1,473,746 | | |
| | 748 | | | Merrill Lynch Mortgage Backed Securities Trust, Mortgage Loan Asset Backed Notes,
Series 2007-3 | | | 5.513 | % | | 6/25/37 | | CCC | | | 496,266 | | |
| | 4,600 | | | Morgan Stanley Capital I Trust, Commercial Mortgage Pass-Through Certificates,
Series 2007-TOP25 | | | 5.544 | % | | 11/12/49 | | Aaa | | | 3,421,859 | | |
| | 2,839 | | | Nomura Asset Acceptance Corporation, Alternative Loan Trust Mortgage
Pass-Through Certificates Series 2005-AR4 | | | 3.774 | % | | 8/25/35 | | Baa3 | | | 1,889,522 | | |
| | 4,009 | | | Residential Accredit Loans Inc., Mortgage Asset-Backed Pass-Through Certificates,
Series 2005-QA6 | | | 5.525 | % | | 5/25/35 | | B3 | | | 2,379,336 | | |
| | 4,986 | | | Residential Funding Mortgage Securities I, Mortgage Pass-Through Securities
Series 2006-S1 | | | 5.750 | % | | 1/25/36 | | BB- | | | 3,691,985 | | |
Nuveen Investments
7
JLS
Nuveen Mortgage Opportunity Term Fund (continued)
Portfolio of Investments December 31, 2009
Principal
Amount (000) | | Description (1) | | Coupon | | Maturity | | Ratings (2) | | Value | |
| | | Residential (continued) | |
| $ | 5,143 | | | Residential Funding Mortgage Securities Inc. Mortgage Pass-Through Certificates | | | 5.859 | % | | 8/25/36 | | CCC | | $ | 3,672,159 | | |
| | | | | Series 2006-SA2 | | | | | | | | | | | | | |
| | 5,566 | | | Sequoia Mortgage Trust, Mortgage Pass-Through Certificates, Series 2007-1 | | | 5.729 | % | | 2/20/47 | | B+ | | | 4,156,739 | | |
| | 625 | | | Wachovia Bank Commercial Mortgage Trust, Commericial Mortgage Pass-Through
Certificates, Series 2007-C31 | | | 5.509 | % | | 4/15/47 | | Aaa | | | 503,146 | | |
| | 5,859 | | | WaMu Mortgage Pass-Through Certificates, Series 2006-AR16 | | | 5.563 | % | | 12/25/36 | | CCC | | | 4,167,988 | | |
| | 1,302 | | | Washington Mutual Mortgage Securities Corporation, Mortgage Pass-Through
Certificates, Series 2003-MS9 | | | 7.468 | % | | 4/25/33 | | A | | | 1,170,840 | | |
| | 2,549 | | | Wells Fargo Alternative Loan Trust, Mortgage Asset-Backed Pass-Through
Certificates Series 2007-PA6 | | | 6.535 | % | | 12/28/37 | | CCC | | | 1,644,299 | | |
| | 2,645 | | | Wells Fargo Mortgage Securities Trust, Mortgage Pass Through Certificates,
Series 2006-AR10 | | | 5.556 | % | | 7/25/36 | | CCC | | | 2,038,619 | | |
| | 1,551 | | | Wells Fargo Mortgage Securities Trust, Mortgage Pass Through Certificates,
Series 2006-AR12 | | | 6.024 | % | | 9/25/36 | | B3 | | | 1,213,699 | | |
| | 2,626 | | | Wells Fargo Mortgage Securities Trust, Mortgage Pass Through Certificates,
Series 2006-AR8 | | | 5.241 | % | | 4/25/36 | | BBB+ | | | 2,127,891 | | |
| | 245,579 | | | Total Residential | | | | | | | | | | | 213,266,877 | | |
| $ | 245,759 | | | Total Mortgage-Backed Securities (cost $214,051,156) | | | | | | | | | | | 213,266,877 | | |
| | | U.S. Government and Agency Obligations – 27.4% | |
| $ | 100,000 | | | Federal Home Loan Mortgage Corporation, Medium Term Notes | | | 3.750 | % | | 3/27/19 | | AAA | | $ | 98,231,500 | | |
| $ | 100,000 | | | Total U.S. Government and Agency Obligations (cost $100,148,471) | | | | | | | | | | | 98,231,500 | | |
| | | PPIP Limited Partnership – 5.3% | |
| $ | – | | | Wellington Management Legacy Securities PPIF, LP (3) | | | N/A | | | N/A | | N/A | | $ | 18,829,211 | | |
| $ | – | | | Total PPIP Limited Partnership (cost $19,172,171) | | | | | | | | | | | 18,829,211 | | |
Principal
Amount (000) | | Description (1) | | Coupon | | Maturity | | | | Value | |
| | | Short-Term Investments – 36.8% | |
| $ | 132,046 | | | Repurchase Agreement with State Street Bank, dated 12/31/09,
repurchase price $132,045,573, collateralized by $134,825,000
U.S. Treasury Bills, 0.000%, due 7/01/10, value $134,690,175 | | | 0.000 | % | | 1/04/10 | | | | $ | 132,045,573 | | |
| | | | | Total Short-Term Investments (cost $132,045,573) | | | | | | | | | | | 132,045,573 | | |
| | | | | Total Investments (cost $465,417,371) – 129.0% | | | | | | | | | | | 462,373,161 | | |
| | | | | Other Assets Less Liabilities – (29.0)% | | | | | | | | | | | (103,847,933 | ) | |
| | | | | Net Assets – 100% | | | | | | | | | | $ | 358,525,228 | | |
Investments in Derivatives
Futures Contracts outstanding at December 31, 2009:
| Type | | Contract
Position | | Number of
Contracts | | Contract
Expiration | | Value | | Unrealized
Appreciation
(Depreciation) | |
| U.S. 5-Year Treasury Note | | Short | | | (1,081 | ) | | 3/10 | | $ | (123,647,821 | ) | | $ | 2,212,773 | | |
| U.S. 10-Year Treasury Note | | Short | | | (545 | ) | | 3/10 | | | (62,921,953 | ) | | | 1,551,165 | | |
| | | | | | | | | | | $ | 3,763,938 | | |
(1) All percentages shown in the Portfolio of Investments are based on net assets.
(2) Ratings (not covered by the report of independent registered public accounting firm): Using the higher of Standard & Poor's Group ("Standard & Poor's") or Moody's Investor Service, Inc. ("Moody's") rating. Ratings below BBB by Standard & Poor's or Baa by Moody's are considered to be below investment grade.
(3) For fair value measurement disclosure purposes, investment categorized as Level 3. See Notes to Financial Statements, Footnote 2 — Fair Value Measurements for more information.
PPIP Public-Private Investment Program.
TBA To be announced. Maturity date not known prior to settlement of this transaction.
WI/DD Purchased on a when-issued or delayed delivery basis.
N/A Not applicable.
See accompanying notes to financial statements.
Nuveen Investments
8
Statement of
ASSETS & LIABILITIES
December 31, 2009
| Assets | |
| Investments, at value (cost $314,199,627) | | $ | 311,498,377 | | |
| PPIP Limited Partnership, at value (cost $19,172,171) | | | 18,829,211 | | |
| Short-term investments (at cost, which approximates value) | | | 132,045,573 | | |
| Cash | | | 259,421 | | |
| Deposit with brokers for open futures contracts | | | 1,682,300 | | |
| Receivables: | |
| Interest | | | 1,622,633 | | |
| Variation margin on futures contracts | | | 525,367 | | |
| Total assets | | | 466,462,882 | | |
| Liabilities | |
| Payables: | | | | | |
| Due to broker | | | 258,988 | | |
| Investments purchased | | | 107,255,859 | | |
| Accrued expenses: | |
| Management fees | | | 332,798 | | |
| Other | | | 90,009 | | |
| Total liabilities | | | 107,937,654 | | |
| Net assets | | $ | 358,525,228 | | |
| Shares outstanding | | | 15,004,200 | | |
| Net asset value per share outstanding | | $ | 23.89 | | |
| Net assets consist of: | |
| Shares, $.01 par value per share | | $ | 150,042 | | |
| Paid-in surplus | | | 357,325,233 | | |
| Undistributed (Over-distribution of) net investment income | | | 330,225 | | |
| Accumulated net realized gain (loss) from investments and derivative transactions | | | — | | |
| Net unrealized appreciation (depreciation) of investments and derivative transactions | | | 719,728 | | |
| Net assets | | $ | 358,525,228 | | |
| Authorized shares | | | Unlimited | | |
See accompanying notes to financial statements.
Nuveen Investments
9
Statement of
OPERATIONS
For the Period November 25, 2009
(commencement of operations) through
December 31, 2009
| Investment Income | | $ | 748,669 | | |
| Expenses | |
| Management fees | | | 343,137 | | |
| Shareholders' servicing agent fees and expenses | | | 701 | | |
| Custodian's fees and expenses | | | 5,850 | | |
| Trustees' fees and expenses | | | 976 | | |
| Professional fees | | | 43,677 | | |
| Shareholders' reports – printing and mailing expenses | | | 20,685 | | |
| Investor relations expense | | | 2,820 | | |
| Other expenses | | | 598 | | |
| Total expenses | | | 418,444 | | |
| Net investment income | | | 330,225 | | |
| Unrealized Gain (Loss) | |
| Net unrealized appreciation (depreciation) of: | |
| Investments | | | (3,044,210 | ) | |
| Futures contracts | | | 3,763,938 | | |
| Net unrealized gain (loss) | | | 719,728 | | |
| Net increase (decrease) in net assets from operations | | $ | 1,049,953 | | |
See accompanying notes to financial statements.
Nuveen Investments
10
Statement of
CHANGES in NET ASSETS
For the Period November 25, 2009
(commencement of operations) through
December 31, 2009
| Operations | |
| Net investment income | | $ | 330,225 | | |
| Net unrealized appreciation (depreciation) of: | |
| Investments | | | (3,044,210 | ) | |
| Futures contracts | | | 3,763,938 | | |
| Net increase (decrease) in net assets from operations | | | 1, 049,953 | | |
| Capital Share Transactions | |
| Proceeds from sale of shares, net of offering costs | | | 357,375,000 | | |
| Net increase (decrease) in net assets applicable to shares from capital share transactions | | | 357,375,000 | | |
| Net increase (decrease) in net assets | | | 358,424,953 | | |
| Net assets at the beginning of period | | | 100,275 | | |
| Net assets at the end of period | | $ | 358,525,228 | | |
| Undistributed (Over-distribution of) net investment income at the end of period | | $ | 330,225 | | |
See accompanying notes to financial statements.
Nuveen Investments
11
Statement of
CASH FLOWS
For the Period November 25, 2009
(commencement of operations) through
December 31, 2009
| Cash Flows from Operating Activities | |
| Net Increase (Decrease) In Net Assets from Operations | | $ | 1,049,953 | | |
Adjustments to reconcile the net increase (decrease) in net assets from
operations to net cash provided (used in) operating activities: | |
| Purchases of investments | | | (333,304,348 | ) | |
| Proceeds from (Purchase of) short-term investments, net | | | (132,045,573 | ) | |
| Amortization / (Accretion) of premiums and discounts, net | | | (67,450 | ) | |
| (Increase) Decrease in deposits with brokers for open future contracts | | | (1,682,300 | ) | |
| (Increase) Decrease in receivable for interest | | | (1,622,633 | ) | |
| (Increase) Decrease in receivable for variation margin on futures contracts | | | (525,367 | ) | |
| Increase (Decrease) in payable due to broker | | | 258,988 | | |
| Increase (Decrease) in payable for investments purchased | | | 107,255,859 | | |
| Increase (Decrease) in accrued management fees | | | 332,798 | | |
| Increase (Decrease) in accrued other liabilities | | | 90,009 | | |
| Net unrealized (appreciation) depreciation of investments | | | 3,044,210 | | |
| Net cash provided by (used in) operating activities | | | (357,215,854 | ) | |
| Cash Flows from Financing Activities | |
| Proceeds from sale of shares | | | 358,125,000 | | |
| Offering costs | | | (750,000 | ) | |
| Net cash provided by (used in) financing activities | | | 357,375,000 | | |
| Net Increase (Decrease) in Cash | | | 159,146 | | |
| Cash at beginning of period | | | 100,275 | | |
| Cash at End of Period | | $ | 259,421 | | |
See accompanying notes to financial statements.
Nuveen Investments
12
Notes to
FINANCIAL STATEMENTS
1. General Information and Significant Accounting Policies
Nuveen Mortgage Opportunity Term Fund (the "Fund") is a newly organized, non-diversified, closed-end management investment company registered under the Investment Company Act of 1940, as amended (the "1940 Act"). The Fund's shares are listed on the New York Stock Exchange and trade under the ticker symbol "JLS." It is anticipated that the Fund will terminate on November 30, 2019, although it could terminate sooner or later than such date. Upon termination, the Fund will distribute all of its net assets to shareholders of record as of the date of termination.
Prior to commencement of operations, the Fund had no operations other than those related to organizational matters, the initial capital contribution of $100,275 by Nuveen Asset Management ("NAM" or the "Adviser"), a wholly-owned subsidiary of Nuveen Investments, Inc. ("Nuveen"), and the recording of the Fund's organizational expenses ($16,000) and their reimbursement by NAM.
The Fund's investment objective is to generate attractive total returns through opportunistic investments in mortgage-backed securities ("MBS"). The Fund seeks to achieve its investment objective by investing primarily in non-agency residential mortgage-backed securities ("RMBS") and commercial mortgage-backed securities ("CMBS"). The Fund invests in MBS directly, and indirectly through a separate investment as a limited partner in a private feeder fund (the "Feeder PPIP Fund"). The Feeder PPIP Fund invests in a master fund (the "Master PPIP Fund") that has been organized to invest directly in MBS and other assets eligible for purchase under the Public-Private Investment Program ("PPIP") established by the U.S. Department of the Treasury (the "UST"). The Fund may also invest up to 20% of its Managed Assets (as defined in Footnote 7) in other permitted investments, including cash and cash equivalents, UST securities, non-mortgage related asset-backed securities, inverse floating rate securities, municipal securities, interest rate futures, interest rate swaps and swaptions, non-MBS credit default swaps (including swaps based on a credit default swap index, such as the CMBX index) and other synthetic mortgage-related exposure, including equity investments in mortgage real estate investment trusts ("REITs"), as permitted by the 1940 Act. Wellington Management Company, LLP ("Wellington Management" or the "Subadviser") has day-to-day responsibility for managing the Fund's direct investments in MBS and other permitted investments. Wellington Management is also the investment adviser to both the Feeder PPIP Fund and the Master PPIP Fund.
The following is a summary of significant accounting policies followed by the Fund in the preparation of its financial statements in accordance with accounting principles generally accepted in the United States.
Public-Private Investment Program
On March 23, 2009, the UST, in conjunction with the Federal Deposit Insurance Corporation and the Board of Governors of the United States Federal Reserve, announced the creation of PPIP. PPIP is designed to encourage the transfer of certain illiquid legacy real estate-related assets off the balance sheets of financial institutions, restarting the market for these assets and supporting the flow of credit and other capital into the broader economy. PPIP calls for the creation of public-private investment partnerships, such as the Master PPIP Fund, through which privately raised capital and the UST capital are pooled together to facilitate the purchase of PPIP Eligible Assets. PPIP Eligible Assets include RMBS and CMBS issued prior to 2009 that were originally rated AAA or that received an equivalent rating by two or more nationally recognized statistical rating organizations without ratings enhancement and that are secured directl y by actual mortgage loans, leases or other assets and not other securities (other than certain swap positions, as determined by the UST). A significant portion of PPIP Eligible Assets are now rated below investment grade.
PPIP Investment
The Feeder PPIP Fund and Master PPIP Fund are Delaware limited partnerships, organized to provide qualified institutional investors with access to PPIP. The Fund is a limited partner of the Feeder PPIP Fund. The Fund's interests in the Feeder PPIP Fund are substantially identical to those of the other investors in the Feeder PPIP Fund in all material respects, except the Fund is not subject to the Feeder PPIP Fund's management fee. Investors in the Fund, however, pay a management fee on the Fund's Managed Assets, which includes total assets attributable to the Fund's direct investments and its indirect investment in the leveraged Master PPIP Fund. The Feeder PPIP Fund invests all of its assets in the Master PPIP Fund. The Master PPIP Fund invests directly in a portfolio of PPIP Eligible Assets and borrows from the UST through a senior secured term loan facility. Neither the Feeder PPIP Fund nor the Master PPIP Fund is registered with the Securities and Exchange Commission ("SEC") as an investment company under the 1940 Act, and neither fund's interests are registered under the Securities Act of 1933, as amended. The Feeder PPIP Fund and
Nuveen Investments
13
Notes to
FINANCIAL STATEMENTS (continued)
Master PPIP Fund are expected to terminate on October 1, 2017, but may be continued with the prior written consent of the UST for up to two consecutive one-year periods.
On December 8, 2009 (the "Commitment Date"), the Fund's subscription for an investment of $95,000,000 in the Feeder PPIP Fund was accepted. As of December 31, 2009, the Fund had a remaining undrawn capital commitment to the Feeder PPIP Fund of $75,958,525. The Adviser has delegated management of assets that have been committed to, but not yet called by, the Feeder PPIP Fund to the Subadviser.
The Fund, as an additional new investor in the Feeder PPIP Fund, paid to the Feeder PPIP Fund an interest equivalent on the Fund's pro rata share of previously called capital pursuant to the partnership agreement. This interest equivalent or "equalization" payment, which totaled $130,696, compensated prior investors for the use of their previously contributed capital and was recorded as a component of the Fund's cost in the Feeder PPIP Fund.
The partnership agreements of the Feeder PPIP Fund and the Master PPIP Fund, which govern the Fund's investment, treat the Fund as if it had made its investment at the inception of the Master PPIP Fund. This means that the Fund, as a new investor, participated in losses of $217,735 on its investment as of the Commitment Date, representing the Fund's pro rata share of the Master PPIP Fund's losses as of that date.
The Feeder PPIP Fund generally may not withdraw from the Master PPIP Fund, and the Feeder PPIP Fund may not, directly or indirectly, sell, assign, pledge, exchange or otherwise transfer its interest in the Master PPIP Fund, in whole or in part, without the prior written consent of the UST. Similarly, the Fund generally may not withdraw from the Feeder PPIP Fund, and the Fund may not, directly or indirectly, sell, assign, pledge, exchange or otherwise transfer its interest in the Feeder PPIP Fund, in whole or in part, without written consent of the general partner of the Feeder PPIP Fund and the Master PPIP Fund. As a result, the Fund's investment in the Feeder PPIP Fund considered illiquid.
Investment Valuation
In determining the value of the Fund's direct investments, securities and other assets for which market quotations are available are valued at market value. The prices of the Fund's direct investments (which consist primarily of MBS) are provided by pricing services approved by the Fund's Board of Trustees. Exchange-listed securities are generally valued at the last sales price on the securities exchange on which such securities are primarily traded. Securities traded on a securities exchange for which there are no transactions on a given day or securities not listed on a securities exchange are valued at the mean of the closing bid and asked prices if such prices are known. Futures contracts are valued using the closing settlement price or, in the absence of such a price, at the mean of the bid and asked prices. When market price quotes are not readily available (which is usually the case for MBS), the pricing service may estab lish a fair market value using a wide variety of market data, including yields or prices of securities of comparable quality, type of issue, coupon, maturity and rating, market quotes or indications of value from securities dealers, evaluations of anticipated cash flows and collateral quality, general market conditions and other information and analysis considered relevant by the pricing service. Short-term investments are valued at amortized cost, which approximates market value.
If the pricing service is unable to provide a price for a security, if the price provided by the pricing service is deemed unreliable, or if events occurring after the close of the market for a security but before the time as of which the Fund values its common shares would materially affect the Fund's net asset value, such security will be valued at its fair value as determined in good faith under the Fund's valuation procedures. The determination of a security's fair value involves subjective judgments, and it is possible that the fair value determination for a security is materially different than the value that could be realized upon the sale of the security.
The Fund's investment in the Feeder PPIP Fund is valued by determining the Fund's pro rata ownership interest in the net assets of the Feeder PPIP Fund. On a daily basis, the Fund receives an indication of the net asset value of the Master PPIP Fund, which the Adviser uses along with other inputs to derive a value for the Fund's investment in the Feeder PPIP Fund.
Investment Transactions
Investment transactions are recorded on a trade date basis. Realized gains and losses from investment transactions are determined on the specific identification method. Investments purchased on a when-issued/delayed delivery basis may have extended settlement
Nuveen Investments
14
periods. Any investments so purchased are subject to market fluctuation during this period. The Fund has instructed the custodian to segregate assets with a current value at least equal to the amount of the when-issued/delayed delivery purchase commitments. At December 31, 2009, the Fund had outstanding when-issued/delayed delivery purchase commitments of $107,255,859.
Investment Income
Interest income, which includes the amortization of premiums and accretion of discounts for financial reporting purposes, is recorded on an accrual basis. Interest income also includes paydown gains and losses, if any.
Income Taxes
The Fund intends to distribute substantially all of its net investment income and net capital gains to shareholders and to otherwise comply with the requirements of Subchapter M of the Internal Revenue Code applicable to regulated investment companies. Therefore, no federal income tax provision is required.
For all open tax years and all major taxing jurisdictions, management of the Fund has concluded that there are no significant uncertain tax positions that would require recognition in the financial statements. Open tax years are those that are open for examination by taxing authorities (i.e., generally the last four tax year ends and the interim tax period since then). Furthermore, management of the Fund is also not aware of any tax positions for which it is reasonably possible that the total amounts of unrecognized tax benefits will significantly change in the next twelve months.
Dividends and Distributions to Shareholders
Dividends to shareholders are declared monthly. Net realized capital gains from investment transactions, if any, are declared and distributed to shareholders at least annually. Furthermore, capital gains are distributed only to the extent they exceed available capital loss carryforwards.
Distributions to shareholders are recorded on the ex-dividend date. The amount and timing of distributions are determined in accordance with federal income tax regulations, which may differ from accounting principles generally accepted in the United States.
Leverage
The Fund intends to use leverage to enhance the total return potential of its overall investment strategy. The Fund expects its indirect investment in the Master PPIP Fund will be leveraged by borrowings by the Master PPIP Fund under a credit agreement with the UST in an amount equal to approximately 50% of the Master PPIP Fund's total assets immediately after giving effect to the borrowing. The Master PPIP Fund's borrowing is non-recourse to the Fund. Although the Master PPIP Fund's borrowing will not constitute actual borrowing of the Fund for purposes of the 1940 Act, it will constitute effective leverage for the Fund. The Fund may also employ leverage at the Fund level through borrowings from a qualified government sponsored program or from banks, the issuance of preferred shares, reverse repurchase agreements or other leverage financing. The Fund intends to limit its combined effective leverage ratio (measured by the aggreg ate dollar amount of all leverage facilities, whether direct or indirect) to 33% of its Managed Assets. As of December 31, 2009, the Master PPIP Fund had drawn a portion of its available borrowings from the UST. The Fund did not employ the use of direct leverage during the period November 25, 2009 (commencement of operations) through December 31, 2009.
Dollar Roll Transactions
The Fund is authorized to enter into dollar roll transactions ("dollar rolls") in which a Fund purchases or sells mortgage-backed securities for delivery in the future and simultaneously contracts to sell or repurchase substantially similar (same type, coupon, and maturity) securities on a different specified future date. Dollar rolls are identified in the Portfolio of Investments as "MDR" for the Fund, when applicable. During the roll period, the Fund foregoes principal and interest paid on the mortgage-backed securities. The Fund is compensated by fee income or the difference between the current sales price and the lower forward price for the future purchase. Such compensation is amortized over the life of the dollar rolls and included in "Investment Income" on the Statement of Operations. Dollar rolls are valued daily.
Futures Contracts
The Fund is subject to interest rate risk in the normal course of pursuing its investment objectives and is authorized to invest in futures contracts in attempt to manage such risk. Upon entering into a futures contract, the Fund is required to deposit with the broker an amount of cash or liquid securities equal to a specified percentage of the contract amount. This is known as the "initial margin." Cash held by the broker to cover initial margin requirements on open futures contracts, if any, is recognized as "Deposits with brokers for open futures contracts" on the Statement of Assets and Liabilities. Subsequent payments ("variation margin") are made or received by a Fund each day, depending on the daily fluctuation of the value of the contract. Variation margin is recognized as a receivable or payable for "Variation margin on futures contracts" on the Statement of Assets and Liabilities, when applicable.
During the period the futures contract is open, changes in the value of the contract are recorded as an unrealized gain or loss by "marking-to-market" on a daily basis to reflect the changes in market value of the contract and is recognized as "Net unrealized appreciation (depreciation) of futures contracts" on the Statement of Operations. When the contract is closed or expired, the Fund records a realized gain or loss equal to the difference between the value of the contract on the closing date and value of the contract when originally entered into and is recognized as "Net realized gain (loss) from futures contracts" on the Statement of Operations.
Risks of investments in futures contracts include the possible adverse movement of the securities or indices underlying the contracts, the possibility that there may not be a liquid secondary market for the contracts and/or that a change in the value of the contract may not correlate with a change in the value of the underlying securities or indices.
Nuveen Investments
15
Notes to
FINANCIAL STATEMENTS (continued)
The average number of futures contracts outstanding during the period November 25, 2009 (commencement of operations) through December 31, 2009, was 1,626. Refer to Footnote 3 — Derivative Instruments and Hedging Activities for further details on futures contract activity.
Market and Counterparty Credit Risk
In the normal course of business the Fund may invest in financial instruments and enter into financial transactions where risk of potential loss exists due to changes in the market (market risk) or failure of the other party to the transaction to perform (counterparty credit risk). The potential loss could exceed the value of the financial assets recorded on the financial statements. Financial assets, which potentially expose the Fund to counterparty credit risk, consist principally of cash due from counterparties on forward, option and swap transactions. The extent of the Fund's exposure to counterparty credit risk in respect to these financial assets approximates their carrying value as recorded on the Statement of Assets and Liabilities. Futures contracts expose the Fund to minimal counterparty credit risk as they are exchange traded and the exchange's clearinghouse, which is counterparty to all exchange traded futures, guara ntees the futures contracts against default.
Each Fund helps manage counterparty credit risk by entering into agreements only with counterparties the Adviser believes have the financial resources to honor their obligations and by having the Adviser monitor the financial stability of the counterparties. Additionally, counterparties may be required to pledge collateral daily (based on the daily valuation of the financial asset) on behalf of the Fund with a value approximately equal to the amount of any unrealized gain above a pre-determined threshold. Reciprocally, when the Fund has an unrealized loss, the Fund has instructed the custodian to pledge assets of the Fund as collateral with a value approximately equal to the amount of the unrealized loss above a pre-determined threshold. Collateral pledges are monitored and subsequently adjusted if and when the valuations fluctuate, either up or down, by at least the predetermined threshold amount.
Organizational and Offering Costs
NAM has agreed to reimburse all organizational expenses (approximately $16,000) and to pay all offering costs (other than the sales load) that exceed $.05 per share. The Fund's share of offering costs of $750,000 was recorded as a reduction of proceeds from the sale of shares.
Repurchase Agreements
In connection with transactions in repurchase agreements, it is the Fund's policy that its custodian take possession of the underlying collateral securities, the fair value of which exceeds the principal amount of the repurchase transaction, including accrued interest, at all times. If the seller defaults, and the fair value of the collateral declines, realization of the collateral may be delayed or limited.
Custodian Fee Credit
The Fund has an arrangement with the custodian bank whereby certain custodian fees and expenses are reduced by net credits earned on the Fund's cash on deposit with the bank. Such deposit arrangements are an alternative to overnight investments. Credits for cash balances may be offset by charges for any days on which the Fund overdraws its account at the custodian bank.
Indemnifications
Under the Fund's organizational documents, its officers and trustees are indemnified against certain liabilities arising out of the performance of their duties to the Fund. In addition, in the normal course of business, the Fund enters into contracts that provide general indemnifications to other parties. The Fund's maximum exposure under these arrangements is unknown as this would involve future claims that may be made against the Fund that have not yet occurred. However, the Fund has not had prior claims or losses pursuant to these contracts and expects the risk of loss to be remote.
Use of Estimates
The preparation of financial statements in conformity with accounting principles generally accepted in the United States requires management to make estimates and assumptions that affect the reported amounts of assets and liabilities at the date of the financial statements and the reported amounts of increases and decreases in net assets from operations during the reporting period. Actual results may differ from those estimates.
Nuveen Investments
16
2. Fair Value Measurements
In determining the value of the Fund's investments, various inputs are used. These inputs are summarized in the three broad levels listed below:
Level 1 — Quoted prices in active markets for identical securities.
Level 2 — Other significant observable inputs (including quoted prices for similar securities, interest rates, prepayment speeds, credit risk, etc.).
Level 3 — Significant unobservable inputs (including management's assumptions in determining the fair value of investments).
The inputs or methodology used for valuing securities are not an indication of the risk associated with investing in those securities. The following is a summary of the Fund's fair value measurements as of December 31, 2009:
| | | Level 1 | | Level 2 | | Level 3 | | Total | |
| Investments: | |
| Asset-Backed and Mortgage-Backed Securities | | $ | — | | | $ | 213,266,877 | | | $ | — | | | $ | 213,266,877 | | |
| PPIP Limited Partnership | | | — | | | | — | | | | 18,829,211 | | | | 18,829,211 | | |
| U.S. Government and Agency Obligations | | | — | | | | 98,231,500 | | | | — | | | | 98,231,500 | | |
| Short-Term Investments | | | 132,045,573 | | | | — | | | | — | | | | 132,045,573 | | |
| Derivatives: | |
| Futures Contracts* | | | 3,763,938 | | | | — | | | | — | | | | 3,763,938 | | |
| Total | | $ | 135,809,511 | | | $ | 311,498,377 | | | $ | 18,829,211 | | | $ | 466,137,099 | | |
* Represents net unrealized appreciation (depreciation).
The following is a reconciliation of the Fund's Level 3 investments held at the beginning and end of the measurement period:
| | | Level 3
PPIP Limited
Partnership | |
| Balance at beginning of period | | $ | — | | |
| Gains (losses): | |
| Net realized gains (losses) | | | — | | |
| Net change in unrealized appreciation (depreciation) | | | (342,960 | ) | |
| Net purchases at cost (sales at proceeds) | | | 19,172,171 | | |
| Net discounts (premiums) | | | — | | |
| Net transfers in to (out of) at end of period fair value | | | — | | |
| Balance at end of period | | $ | 18,829,211 | | |
"Net unrealized appreciation (depreciation) of investments" presented on the Statement of Operations includes $(342,960) of net unrealized appreciation (depreciation) related to the PPIP Limited Partnership classified as Level 3 at period end.
3. Derivative Instruments and Hedging Activities
The Fund records derivative instruments at fair value, with changes in fair value recognized on the Statement of Operations, when applicable. Even though the Fund's investments in derivatives may represent economic hedges, they are considered to be non-hedge transactions for financial reporting purposes. For additional information on the derivative instruments in which the Fund was invested during and at the end of the reporting period, refer to the Portfolio of Investments, Financial Statements and Footnote 1 — General Information and Significant Accounting Policies.
The following table presents the fair value of all derivative instruments held by the Fund as of December 31, 2009, the location of these instruments on the Statement of Assets and Liabilities, and the primary underlying risk exposure.
| | | | | Location on the Statement of Assets and Liabilities | |
| | | | | Asset Derivatives | | Liability Derivatives | |
Underlying Risk
Exposure | | Derivative
Instrument | | Location | | Value | | Location | | Value | |
| Interest Rate | | Futures Contracts | | Deposits with brokers for open
futures contracts and
Receivable for variation margin
on futures contracts* | | $ | 3,763,938 | | | | — | | | $ | — | | |
* Value represents cumulative unrealized appreciation (depreciation) of futures contracts as reported in the Portfolio of Investments and not the deposits with brokers, if any, or the receivable or payable for variation margin on futures contracts presented on the Statement of Assets and Liabilities.
Nuveen Investments
17
Notes to
FINANCIAL STATEMENTS (continued)
The following table presents the amount of net unrealized appreciation (depreciation) recognized for the period November 25, 2009 (commencement of operations) through December 31, 2009, on derivative instruments, as well as the primary risk exposure associated with each.
| Net Unrealized Appreciation (Depreciation) of Futures Contracts | |
| Risk Exposure | |
| Interest Rate | | $ | 3,763,938 | | |
4. Fund Shares
Transactions in Fund shares for the period November 25, 2009 (commencement of operations) through December 31, 2009, were as follows:
5. Investment Transactions
Purchases and sales (including maturities but excluding short-term investments and derivative transactions) during the period November 25, 2009 (commencement of operations) through December 31, 2009, were as follows:
| Purchases: | | | | | |
| Investment Securities and contribution to the PPIP Limited Partnership | | $ | 233,154,748 | | |
| U.S. Government and Agency Obligations | | | 100,149,600 | | |
| Sales and maturities: | | | | | |
| Investment Securities and distributions to the PPIP Limited Partnership | | | — | | |
| U.S. Government and Agency Obligations | | | — | | |
6. Income Tax Information
The following information is presented on an income tax basis based on the information currently available to the Fund. Differences between amounts for financial statement and federal income tax purposes are primarily due to recognition of taxable income from the Feeder PPIP Fund investment, premium amortization, recognition of unrealized gain or loss for tax (mark-to-market) on futures contracts and timing differences in recognizing certain gains and losses on investment transactions. To the extent that differences arise that are permanent in nature, such amounts are reclassified within the capital accounts on the Statement of Assets and Liabilities presented in the annual report, based on their federal tax basis treatment; temporary differences do not require reclassification. Temporary and permanent differences do not impact the net asset value of the Fund.
At December 31, 2009, the cost of investments was as follows:
| Cost of investments | | $ | 465,417,371 | | |
Gross unrealized appreciation and gross unrealized depreciation of investments at December 31, 2009, were as follows:
| Gross unrealized: | |
| Appreciation | | $ | 1,040,200 | | |
| Depreciation | | | (4,084,410 | ) | |
| Net unrealized appreciation (depreciation) of investments | | $ | (3,044,210 | ) | |
The tax components of undistributed net ordinary income and net long-term capital gains at December 31, 2009, the Fund's tax year end, were as follows:
| Undistributed net ordinary income* | | $ | 2,074,909 | | |
| Undistributed net long-term capital gains | | | 2,258,363 | | |
* Net ordinary income consists of net taxable income derived from dividends, interest and net short-term capital gains, if any.
Nuveen Investments
18
The tax character of distributions paid during the Fund's tax period November 25, 2009 (commencement of operations) through December 31, 2009, was designated for purposes of the dividends paid deduction as shown in the following table. The Fund made no distributions to its shareholders.
| Distributions from net ordinary income * | | $ | — | | |
| Distributions from net long-term capital gains | | | — | | |
| Tax return of capital | | | — | | |
* Net ordinary income consists of net taxable income derived from dividends, interest and net short-term capital gains, if any.
7. Management Fees and Other Transactions with Affiliates
The Fund's management fee is comprised of two components – a fund-level fee, based only on the managed assets of the Fund, and a complex-level fee, based on the aggregate amount of all fund assets managed by the Adviser. This pricing structure enables Fund shareholders to benefit from growth in the assets within the Fund as well as from growth in the amount of complex-wide assets managed by the Adviser.
The annual fund-level fee, payable monthly, is applied according to the following schedule:
| Fund-Level Average Daily Managed Assets (1) | | Fund-Level Fee Rate | |
| For the first $125 million | | | .9500 | % | |
| For the next $125 million | | | .9375 | | |
| For the next $150 million | | | .9250 | | |
| For Managed Assets over $400 million | | | .9125 | | |
The annual complex-level fee, payable monthly, is applied according to the following schedule. As of December 31, 2009, the complex-level fee rate was .1887%.
| Complex-Level Asset Breakpoint Level (2) | | Effective Rate at Breakpoint Level | |
| $55 billion | | | .2000 | % | |
| $56 billion | | | .1996 | | |
| $57 billion | | | .1989 | | |
| $60 billion | | | .1961 | | |
| $63 billion | | | .1931 | | |
| $66 billion | | | .1900 | | |
| $71 billion | | | .1851 | | |
| $76 billion | | | .1806 | | |
| $80 billion | | | .1773 | | |
| $91 billion | | | .1691 | | |
| $125 billion | | | .1599 | | |
| $200 billion | | | .1505 | | |
| $250 billion | | | .1469 | | |
| $300 billion | | | .1445 | | |
(1) "Managed Assets" means the total assets of the Fund, minus the sum of its accrued liabilities (other than the Fund liabilities incurred for the express purpose of creating effective leverage). Total assets for this purpose shall include assets attributable to the Fund's use of effective leverage (whether or not those assets are reflected in the Fund's financial statements for the purposes of generally accepted accounting principles in the United States), such as, but not limited to, leverage at the Master PPIP Fund level attributable to the Fund's investment in the Feeder PPIP Fund.
(2) The complex-level fee is based on the aggregate daily managed assets (as "managed assets" is defined in each Nuveen fund's investment management agreement with NAM, which generally includes assets attributable to any preferred shares that may be outstanding and any borrowings (including the issuance of commercial paper or notes)) of the Nuveen funds. As of December 31, 2009, the complex-level fee rate was .1887%.
Pursuant to an investment management agreement between the Fund and the Adviser, the Adviser receives 40% of the Fund's total annual management fee. The Adviser's portion of the management fee compensates the Adviser for overall investment advisory and administrative services provided to the Fund and general office facilities. Pursuant to an investment sub-advisory agreement between the Fund and the Sub-Adviser, the Sub-Adviser receives 60% of the Fund's total annual management fee. The Sub-Adviser's portion of the management fee compensates the Sub-Adviser for the investment advisory services it provides with respect to the Fund's direct investments in MBS and other permitted investments.
The Fund pays no compensation directly to those of its trustees who are affiliated with the Adviser or to its officers, all of whom receive remuneration for their services to the Fund from the Adviser or its affiliates. The Board of Trustees has adopted a deferred compensation plan for independent trustees that enable trustees to elect to defer receipt of all or a portion of the annual compensation they are entitled to receive from certain Nuveen funds. Under the plan, deferred amounts are treated as though equal dollar amounts had been invested in shares of select Nuveen funds.
At December 31, 2009, Nuveen owned 4,200 shares of the Fund.
Nuveen Investments
19
Notes to
FINANCIAL STATEMENTS (continued)
8. New Accounting Pronouncements
On January 21, 2010, FASB issued changes to the authoritative guidance under GAAP for fair value measurements. The objective of which is to provide guidance on how investment assets and liabilities are to be valued and disclosed. Specifically, the amendment requires reporting entities to disclose i) the input and valuation techniques used to measure fair value for both recurring and nonrecurring fair value measurements, for both Level 2 and Level 3 positions, ii) transfers between all levels (including Level 1 and Level 2) on a gross basis (i.e., transfers out must be disclosed separately from transfers in) as well as the reason(s) for the transfer and iii) purchases, sales, issuances and settlements in the Level 3 rollforward must be shown on a gross basis rather than as one net number. The effective date of the amendment is for interim and annual periods beginning after December 15, 2009, however, the requirement to provide th e Level 3 activity for purchases, sales, issuances and settlements on a gross basis will be effective for interim and annual periods beginning after December 15, 2010. At this time the Fund is evaluating the implications of this guidance and the impact it will have to the financial statement amounts and footnote disclosures, if any.
9. Subsequent Events
Distributions to Shareholders
The Fund declared its initial common share distribution which is payable on March 1, 2010, to shareholders of record on February 15, 2010, as follows:
| Distribution per share | | $ | .1725 | | |
Sale of Fund Shares
On January 8, 2010, the Fund sold an additional 800,000 shares with an exercise by the underwriters of the over-allotment option.
Nuveen Investments
20
Intentionally Left Blank
Nuveen Investments
21
Financial
HIGHLIGHTS
Selected data for a share outstanding throughout the period:
| | | | |
| | | | | Investment Operations | | Less Distributions | | | |
| | | Beginning
Net Asset
Value | | Net
Investment
Income(a) | | Net
Realized/
Unrealized
Gain (Loss) | | Total | | Net
Investment
Income | | Capital
Gains | | Total | | Offering
Costs | | Ending
Net
Asset
Value | | Ending
Market
Value | |
| Year ended 12/31: | |
| | 2009 | (b) | | $ | 23.88 | | | $ | .02 | | | $ | .04 | | | $ | 0.06 | | | $ | — | | | $ | — | | | $ | — | | | $ | (.05 | ) | | $ | 23.89 | | | $ | 25.00 | | |
(a) Per share Net Investment Income is calculated using the average daily shares method.
(b) For the period November 25, 2009 (commencement of operations) through December 31, 2009.
Nuveen Investments
22
| | | | | Ratios/Supplemental Data | |
| | | Total Returns | | | | Ratios to Average Net Assets | | | |
| | | Based on
Market
Value* | | Based on
Net Asset
Value* | | Ending Net
Assets (000) | | Expenses | | Net
Investment
Income | | Portfolio
Turnover
Rate | |
| Year ended 12/31: | |
| | 2009 | (b) | | | .00 | % | | | .06 | % | | $ | 358,525 | | | | 1.21 | %** | | | .96 | %** | | | 0 | % | |
* Total Return Based on Market Value is the combination of changes in the market price per share and the effect of reinvested dividend income and reinvested capital gains distributions, if any, at the average price paid per share at the time of reinvestment. The last dividend declared in the period, which is typically paid on the first business day of the following month, is assumed to be reinvested at the ending market price. The actual reinvestment for the last dividend declared in the period may take place over several days, and in some instances may not be based on the market price, so the actual reinvestment price may be different from the price used in the calculation. Total returns are not annualized.
Total Return Based on Net Asset Value is the combination of changes in net asset value, reinvested dividend income at net asset value and reinvested capital gains distributions at net asset value, if any. The last dividend declared in the period, which is typically paid on the first business day of the following month, is assumed to be reinvested at the ending net asset value. The actual reinvest price for the last dividend declared in the period may often be based on the Fund's market price (and not its net asset value), and therefore may be different from the price used in the calculation. Total returns are not annualized.
** Annualized.
See accompanying notes to financial statements.
Nuveen Investments
23
Board Members & Officers
The management of the Funds, including general supervision of the duties performed for the Funds by the Adviser, is the responsibility of the Board Members of the Funds. The number of board members of the Fund is currently set at nine. None of the board members who are not "interested" persons of the Funds (referred to herein as "independent board members") has ever been a director or employee of, or consultant to, Nuveen or its affiliates. The names and business addresses of the board members and officers of the Funds, their principal occupations and other affiliations during the past five years, the number of portfolios each oversees and other directorships they hold are set forth below.
Name, Birthdate
and Address | | Position(s) Held with
the Fund | | Year First
Elected or
Appointed
and Term(1) | | Principal Occupation(s)
Including other Directorships
During Past 5 Years | | Number of Portfolios
in Fund Complex
Overseen by
Board Member | |
| INDEPENDENT BOARD MEMBERS: | | | |
|
| g ROBERT P. BREMNER | | | |
|
8/22/40
333 W. Wacker Drive
Chicago, IL 60606 | | Chairman of
the Board
and Board Member | | 1997
Class III | | Private Investor and Management Consultant; Treasurer and Director, Humanities Council of Washington, D.C. | | | 199 | | |
|
| g JACK B. EVANS | | | |
|
10/22/48
333 W. Wacker Drive
Chicago, IL 60606 | | Board Member | | 1999
Class III | | President, The Hall-Perrine Foundation, a private philanthropic corporation (since 1996); Director and Chairman, United Fire Group, a publicly held company; President Pro Tem of the Board of Regents for the State of Iowa University System; Director, Gazette Companies; Life Trustee of Coe College and the Iowa College Foundation; formerly, Director, Alliant Energy; formerly, Director, Federal Reserve Bank of Chicago; formerly, President and Chief Operating Officer, SCI Financial Group, Inc., a regional financial services firm. | | | 199 | | |
|
| g WILLIAM C. HUNTER | | | |
|
3/6/48
333 W. Wacker Drive
Chicago, IL 60606 | | Board Member | | 2004
Class I | | Dean, Tippie College of Business, University of Iowa (since 2006); Director (since 2004) of Xerox Corporation; Director (since 2005), Beta Gamma Sigma International Honor Society; formerly, Dean and Distinguished Professor of Finance, School of Business at the University of Connecticut (2003-2006); previously, Senior Vice President and Director of Research at the Federal Reserve Bank of Chicago (1995-2003); Director, SS&C Technologies, Inc. (May 2005-October 2005); formerly, Director (1997- 2007), Credit Research Center at Georgetown University. | | | 199 | | |
|
Nuveen Investments
24
Name, Birthdate
and Address | | Position(s) Held with
the Fund | | Year First
Elected or
Appointed
and Term(1) | | Principal Occupation(s)
Including other Directorships
During Past 5 Years | | Number of Portfolios
in Fund Complex
Overseen by
Board Member | |
| INDEPENDENT BOARD MEMBERS (continued): | | | |
|
| g DAVID J. KUNDERT | | | |
|
10/28/42
333 W. Wacker Drive
Chicago, IL 60606 | | Board Member | | 2005
Class II | | Director, Northwestern Mutual Wealth Management Company; retired (since 2004) as Chairman, JPMorgan Fleming Asset Management, President and CEO, Banc One Investment Advisors Corporation, and President, One Group Mutual Funds; prior thereto, Executive Vice President, Banc One Corporation and Chairman and CEO, Banc One Investment Management Group; Member, Board of Regents, Luther College; member of the Wisconsin Bar Association; member of Board of Directors, Friends of Boerner Botanical Gardens; member of Investment Committee, Greater Milwaukee Foundation. | | | 199 | | |
|
| g WILLIAM J. SCHNEIDER | | | |
|
9/24/44
333 W. Wacker Drive
Chicago, IL 60606 | | Board Member | | 1997
Class III | | Chairman of Miller-Valentine Partners Ltd., a real estate investment company; formerly, Senior Partner and Chief Operating Officer (retired, 2004) of Miller- Valentine Group; member, University of Dayton Business School Advisory Council; member, Dayton Philharmonic Orchestra Association formerly, member, Business Advisory Council, Cleveland Federal Reserve Bank; formerly, Director, Dayton Development Coalition. | | | 199 | | |
|
| g JUDITH M. STOCKDALE | | | |
|
12/29/47
333 W. Wacker Drive
Chicago, IL 60606 | | Board Member | | 1997
Class I | | Executive Director, Gaylord and Dorothy Donnelley Foundation (since 1994); prior thereto, Executive Director, Great Lakes Protection Fund (from 1990 to 1994). | | | 199 | | |
|
| g CAROLE E. STONE | | | |
|
6/28/47
333 W. Wacker Drive
Chicago, IL 60606 | | Board Member | | 2007
Class I | | Director, Chicago Board Options Exchange (since 2006); Director, C2 Options Exchange, Incorporated (since 2009); Commissioner, New York State Commission on Public Authority Reform (since 2005); formerly, Chair, New York Racing Association Oversight Board (2005-2007). | | | 199 | | |
|
| g TERENCE J. TOTH | | | |
|
9/29/59
333 W. Wacker Drive
Chicago, IL 60606 | | Board Member | | 2008
Class II | | Director, Legal & General Investment Management America, Inc. (since 2008); Managing Partner, Musso Capital Management (since 2008); CEO and President, Northern Trust Investments (2004-2007); Executive Vice President, Quantitative Management & Securities Lending (2004-2007); prior thereto, various positions with Northern Trust Company (since 1994); Member: Goodman Theatre Board (since 2004); Chicago Fellowship Boards (since 2005), University of Illinois Leadership Council Board (since 2007) and Catalyst Schools of Chicago Board (since 2008); formerly Member: Northern Trust Mutual Funds Board (2005-2007), Northern Trust Investments Board (2004-2007), Northern Trust Japan Board (2004-2007), Northern Trust Securities Inc. Board (2003-2007) and Northern Trust Hong Kong Board (1997-2004). | | | 199 | | |
|
Nuveen Investments
25
Name, Birthdate
and Address | | Position(s) Held with
the Fund | | Year First
Elected or
Appointed
and Term(1) | | Principal Occupation(s)
Including other Directorships
During Past 5 Years | | Number of Portfolios
in Fund Complex
Overseen by
Board Member | |
| INTERESTED BOARD MEMBER: | | | |
|
| g JOHN P. AMBOIAN(2) | | | |
|
6/14/61
333 W. Wacker Drive
Chicago, IL 60606 | | Board Member | | | 2008
Class II | | | Chief Executive Officer (since July 2007) and Director (since 1999) of Nuveen Investments, Inc.; Chief Executive Officer (since 2007) of Nuveen Asset Management, Nuveen Investments Advisors, Inc. | | | 199 | | |
|
Name, Birthdate
and Address | | Position(s) Held with
the Fund | | Year First
Elected or
Appointed(3) | | Principal Occupation(s)
During Past 5 Years | | Number of Portfolios
in Fund Complex
Overseen by
Officer | |
| OFFICERS of the FUND: | | | |
|
| g GIFFORD R. ZIMMERMAN | | | |
|
9/9/56
333 W. Wacker Drive
Chicago, IL 60606 | | Chief
Administrative
Officer | | | 1988 | | | Managing Director (since 2002), Assistant Secretary and Associate General Counsel of Nuveen Investments, LLC; Managing Director, Associate General Counsel and Assistant Secretary, of Nuveen Asset Management (since 2002); and of Symphony Asset Management LLC, (since 2003); Vice President and Assistant Secretary of NWQ Investment Management Company, LLC. (since 2002), Nuveen Investments Advisers Inc. (since 2002), Tradewinds Global Investors, LLC, and Santa Barbara Asset Management, LLC (since 2006), Nuveen HydePark Group LLC and Nuveen Investment Solutions, Inc. (since 2007); Managing Director (since 2004) and Assistant Secretary (since 1994) of Nuveen Investments, Inc.; Chartered Financial Analyst. | | | 199 | | |
|
| g WILLIAM ADAMS IV | | | |
|
6/9/55
333 W. Wacker Drive
Chicago, IL 60606 | | Vice President | | | 2007 | | | Executive Vice President of Nuveen Investments, Inc.; Executive Vice President, U.S. Structured Products of Nuveen Investments, LLC, (since 1999), prior thereto, Managing Director of Structured Investments. | | | 123 | | |
|
| g MARK J.P. ANSON | | | |
|
6/10/59
333 W. Wacker Drive
Chicago, IL 60606 | | Vice President | | | 2009 | | | President and Executive Director of Nuveen Investments, Inc. (since 2007); President of Nuveen Investments Institutional Services Group LLC (since 2007); previously, Chief Executive Officer of the British Telecom Pension Scheme (2006-2007) and Chief Investment Officer of Calpers (1999-2006); PhD, Chartered Financial Analyst Chartered Alternative Investment Analyst, Certified Public Accountant, Certified Management Accountant and Certified Internal Auditor. | | | 199 | | |
|
| g CEDRIC H. ANTOSIEWICZ | | | |
|
1/11/62
333 W. Wacker Drive
Chicago, IL 60606 | | Vice President | | | 2007 | | | Managing Director, (since 2004) previously, Vice President (1993-2004) of Nuveen Investments, LLC. | | | 123 | | |
|
Nuveen Investments
26
Name, Birthdate
and Address | | Position(s) Held with
the Fund | | Year First
Elected or
Appointed(3) | | Principal Occupation(s)
During Past 5 Years | | Number of Portfolios
in Fund Complex
Overseen by
Officer | |
| OFFICERS of the FUND (continued): | | | |
|
| g NIZIDA ARRIAGA | | | |
|
6/1/68
333 W. Wacker Drive
Chicago, IL 60606 | | Vice President | | | 2009 | | | Vice President (since 2007) of Nuveen Investments, LLC; previously, Portfolio Manager, Allstate Investments, LLC (1996-2006); Chartered Financial Analyst. | | | 199 | | |
|
| g MICHAEL T. ATKINSON | | | |
|
2/3/66
333 W. Wacker Drive
Chicago, IL 60606 | | Vice President and
Assistant Secretary | | | 2000 | | | Vice President (since 2002) of Nuveen Investments, LLC; Vice President of Nuveen Asset Management (since 2005). | | | 199 | | |
|
| g MARGO L. COOK | | | |
|
4/11/64
333 W. Wacker Drive
Chicago, IL 60606 | | Vice President | | | 2009 | | | Executive Vice President (since Oct 2008) of Nuveen Investments, Inc.; previously, Head of Institutional Asset Management (2007-2008) of Bear Stearns Asset Management; Head of Institutional Asset Mgt (1986-2007) of Bank of NY Mellon; Chartered Financial Analyst. | | | 199 | | |
|
| g LORNA C. FERGUSON | | | |
|
10/24/45
333 W. Wacker Drive
Chicago, IL 60606 | | Vice President | | | 1998 | | | Managing Director (since 2004) of Nuveen Investments, LLC and Managing Director (since 2005) of Nuveen Asset Management. | | | 199 | | |
|
| g STEPHEN D. FOY | | | |
|
5/31/54
333 W. Wacker Drive
Chicago, IL 60606 | | Vice President
and Controller | | | 1998 | | | Vice President (since 1993) and Funds Controller (since 1998) of Nuveen Investments, LLC; Vice President (since 2005) of Nuveen Asset Management; Certified Public Accountant. | | | 199 | | |
|
| g SCOTT S. GRACE | | | |
|
8/20/70
333 W. Wacker Drive
Chicago, IL 60606 | | Vice President
and Treasurer | | | 2009 | | | Managing Director, Corporate Finance & Development, Treasurer (since September 2009) of Nuveen Investments, LLC, formerly, Treasurer (2006-2009), Senior Vice President (2008-2009), previously, Vice President (2006-2008) of Janus Capital Group, Inc,; formerly. Senior Associate in Morgan Stanley's Global Financial Services Group (2000-2003); Chartered Accountant Designation. | | | 199 | | |
|
| g WILLIAM T. HUFFMAN | | | |
|
5/7/69
333 W. Wacker Drive
Chicago, IL 60606 | | Vice President | | | 2009 | | | Chief Operating Officer, Municipal Fixed Income (since 2008) of Nuveen Asset Management; previously, Chairman, President and Chief Executive Officer (2002-2007) of Northern Trust Global Advisors, Inc. and Chief Executive Officer (2007) of Northern Trust Global Investments Limited; Certified Public Accountant. | | | 134 | | |
|
| g WALTER M. KELLY | | | |
|
2/24/70
333 W. Wacker Drive
Chicago, IL 60606 | | Chief Compliance
Officer and
Vice President | | | 2003 | | | Senior Vice President (since 2008), Vice President (2006-2008) formerly, Assistant Vice President and Assistant General Counsel (2003-2006) of Nuveen Investments, LLC; Vice President (since 2006) and Assistant Secretary (since 2008) of Nuveen Asset Management. | | | 199 | | |
|
Nuveen Investments
27
Name, Birthdate
and Address | | Position(s) Held with
the Fund | | Year First
Elected or
Appointed(3) | | Principal Occupation(s)
During Past 5 Years | | Number of Portfolios
in Fund Complex
Overseen by
Officer | |
| OFFICERS of the FUND (continued): | | | |
|
| g DAVID J. LAMB | | | |
|
3/22/63
333 W. Wacker Drive
Chicago, IL 60606 | | Vice President | | | 2000 | | | Senior Vice President (since 2009), formerly, Vice President (2000-2009) of Nuveen Investments, LLC; Vice President (since 2005) of Nuveen Asset Management; Certified Public Accountant. | | | 199 | | |
|
| g TINA M. LAZAR | | | |
|
8/27/61
333 W. Wacker Drive
Chicago, IL 60606 | | Vice President | | | 2002 | | | Senior Vice President (since 2009), formerly, Vice President of Nuveen Investments, LLC (1999-2009); Vice President of Nuveen Asset Management (since 2005). | | | 199 | | |
|
| g LARRY W. MARTIN | | | |
|
7/27/51
333 W. Wacker Drive
Chicago, IL 60606 | | Vice President
and Assistant Secretary | | | 1988 | | | Vice President, Assistant Secretary and Assistant General Counsel of Nuveen Investments, LLC; Vice President (since 2005) and Assistant Secretary of Nuveen Investments, Inc.; Vice President (since 2005) and Assistant Secretary (since 1997) of Nuveen Asset Management; Vice President and Assistant Secretary of Nuveen Investments Advisers Inc. (since 2002); NWQ Investment Management Company, LLC (since 2002), Symphony Asset Management LLC (since 2003), Tradewinds Global Investors, LLC, Santa Barbara Asset Management LLC (since 2006) and of Nuveen HydePark Group, LLC and Nuveen Investment Solutions, Inc. (since 2007). | | | 199 | | |
|
| g KEVIN J. MCCARTHY | | | |
|
3/26/66
333 W. Wacker Drive
Chicago, IL 60606 | | Vice President
and Secretary | | | 2007 | | | Managing Director (since 2008), formerly, Vice President (2007-2008), Nuveen Investments, LLC; Managing Director (since 2008), formerly, Vice President, and Assistant Secretary, Nuveen Asset Management, and Nuveen Investment Holdings, Inc.; Vice President (since 2007) and Assistant Secretary, Nuveen Investment Advisers Inc., Nuveen Investment Institutional Services Group LLC, NWQ InvestmentManagement Company, LLC, Tradewinds Global Investors LLC, NWQ Holdings, LLC, Symphony Asset Management LLC, Santa Barbara Asset Management LLC, Nuveen HydePark Group, LLC and Nuveen Investment Solutions, Inc. (since 2007); prior thereto, Partner, Bell, Boyd & Lloyd LLP (1997-2007). | | | 199 | | |
|
| g JOHN V. MILLER | | | |
|
4/10/67
333 W. Wacker Drive
Chicago, IL 60606 | | Vice President | | | 2007 | | | Chief Investment Officer and Managing Director (since 2007), formerly, Vice President (2002-2007) of Nuveen Asset Management and Managing Director (since 2007), formerly, Vice President (2002-2007) of Nuveen Investments, LLC; Chartered Financial Analyst. | | | 134 | | |
|
| g GREGORY MINO | | | |
|
1/4/71
333 W. Wacker Drive
Chicago, IL 60606 | | Vice President | | | 2009 | | | Vice President of Nuveen Investments, LLC (since 2008); previously, Director (2004-2007) and Executive Director (2007-2008) of UBS Global Asset Management; previously, Vice President (2000-2003) and Director (2003-2004) of Merrill Lynch Investment Managers; Chartered Financial Analyst. | | | 199 | | |
|
Nuveen Investments
28
Name, Birthdate
and Address | | Position(s) Held with
the Fund | | Year First
Elected or
Appointed(3) | | Principal Occupation(s)
During Past 5 Years | | Number of Portfolios
in Fund Complex
Overseen by
Officer | |
| OFFICERS of the FUND (continued): | | | |
|
| g CHRISTOPHER M. ROHRBACHER | | | |
|
8/1/71
333 W. Wacker Drive
Chicago, IL 60606 | | Vice President
and Assistant
Secretary | | | 2008 | | | Vice President, Nuveen Investments, LLC (since 2008); Vice President and Assistant Secretary, Nuveen Asset Management (since 2008); prior thereto, Associate, Skadden, Arps, Slate Meagher & Flom LLP (2002-2008). | | | 199 | | |
|
| g JAMES F. RUANE | | | |
|
7/3/62
333 W. Wacker Drive
Chicago, IL 60606 | | Vice President
and Assistant
Secretary | | | 2007 | | | Vice President, Nuveen Investments, LLC (since 2007); prior thereto, Partner, Deloitte & Touche USA LLP (2005-2007), formerly, senior tax manager (2002-2005); Certified Public Accountant. | | | 199 | | |
|
| g MARK L. WINGET | | | |
|
12/21/68
333 W. Wacker Drive
Chicago, IL 60606 | | Vice President
and Assistant
Secretary | | | 2008 | | | Vice President, Nuveen Investments, LLC (since 2008); Vice President and Assistant Secretary, Nuveen Asset Management (since 2008); prior thereto, Counsel, Vedder Price P.C. (1997-2007). | | | 199 | | |
|
(1) Board Members serve three year terms. The Board of Trustees is divided into three classes, Class I, Class II, and Class III, with each being elected to serve until the third succeeding annual shareholders' meeting subsequent to its election or thereafter in each case when its respective successors are duly elected or appointed. The first year elected or appointed represents the year in which the Board Member was first elected or appointed to any fund in the Nuveen Complex.
(2) Mr. Amboian is an interested trustee because of his position with Nuveen Investments, Inc. and certain of its subsidiaries, which are affiliates of the Nuveen Funds.
(3) Officers serve one year terms through July of each year. The year first elected or appointed represents the year in which the Officer was first elected or appointed to any fund in the Nuveen Complex.
Nuveen Investments
29
Annual Investment Management
Agreement Approval Process
The Board of Trustees of the Fund (the "Board," and each Trustee, a "Board Member") is responsible for approving advisory arrangements and, at a meeting held on October 2, 2009 (the "Meeting"), was asked to approve the advisory arrangements on behalf of the Fund. At the Meeting, the Board Members, including the Board Members who are not parties to the advisory agreements or "interested persons" of any parties ( "Independent Board Members"), approved the investment management agreement (the "Investment Management Agreement") between the Fund and Nuveen Asset Management ("NAM") and the investment sub-advisory agreement (the "Sub-Advisory Agreement") between the Fund and Wellington Management Company, LLP (the "Sub-Adviser"), on behalf of the Fund. Th e Sub-Adviser and NAM are each hereafter a "Fund Adviser." The Investment Management Agreement and the Sub-Advisory Agreement are each hereafter an "Advisory Agreement."
To assist the Board in its evaluation of an Advisory Agreement with a Fund Adviser at the Meeting, the Independent Board Members had received, in adequate time in advance of the Meeting or at prior meetings, materials which outlined, among other things:
• the nature, extent and quality of services expected to be provided by the Fund Adviser;
• the organization of the Fund Adviser, including the responsibilities of various departments and key personnel;
• the expertise and background of the Fund Adviser with respect to the Fund's investment strategy;
• certain performance-related information (as described below);
• the profitability of Nuveen Investments, Inc. ("Nuveen") (which incorporated Nuveen's wholly-owned affiliated sub-advisers other than Winslow Capital Management, Inc. ("Winslow Capital") which was acquired in December 2008);
• the proposed management fees of the Fund Adviser, including comparisons of such fees with the management fees of comparable funds;
• the expected expenses of the Fund, including comparisons of the Fund's expected expense ratio with the expense ratios of comparable funds; and
• the soft dollar practices of the Fund Adviser, if any.
At the Meeting, NAM made a presentation to and responded to questions from the Board. During the Meeting, the Independent Board Members also met privately with their legal counsel to review the Board's duties under the Investment Company Act of 1940 (the "1940 Act"), the general principles of state law in reviewing and approving
Nuveen Investments
30
advisory contracts, the standards used by courts in determining whether investment company boards of directors have fulfilled their duties, factors to be considered in voting on advisory contracts and an adviser's fiduciary duty with respect to advisory agreements and compensation. It is with this background that the Independent Board Members considered the Advisory Agreements with the Fund Advisers for the Fund. As outlined in more detail below, the Independent Board Members considered all factors they believed relevant with respect to the Fund, including the following: (a) the nature, extent and quality of the services to be provided by the Fund Adviser; (b) investment performance, as described below; (c) the profitability of Nuveen and its affiliates; (d) the extent to which economies of scale would be realized; and (e) whether fee levels reflect these economies of scale for the benefit of Fund investors.
A. Nature, Extent and Quality of Services
The Independent Board Members considered the nature, extent and quality of the respective Fund Adviser's services, including advisory services and administrative services. As NAM and the Sub-Adviser already serve as adviser and sub-adviser, respectively, to other Nuveen funds overseen by the Board Members, the Board has a good understanding of each such Fund Adviser's organization, operations and personnel. As the Independent Board Members meet regularly throughout the year to oversee the Nuveen funds, including funds currently advised by the Fund Advisers, the Independent Board Members have relied upon their knowledge from their meetings and any other interactions throughout the year of the respective Fund Adviser and its services in evaluating the Advisory Agreements.
At the Meeting and at prior meetings, the Independent Board Members reviewed materials outlining, among other things, the respective Fund Adviser's organization and business; the types of services that such Fund Adviser or its affiliates provide to the Nuveen funds and are expected to provide to the Fund; and the experience of the respective Fund Adviser with applicable investment strategies. Further, the Independent Board Members have evaluated the background, experience and track record of the Fund Adviser's investment personnel.
In addition to advisory services, the Independent Board Members considered the quality of any administrative or non-advisory services to be provided. In this regard, NAM is expected to provide the Fund with such administrative and other services (exclusive of, and in addition to, any such services provided by others for the Fund) and officers and other personnel as are necessary for the operations of the Fund. In addition to investment management services, NAM and its affiliates will provide the Fund with a wide range of services, including, among other things, product management, fund administration, oversight of service providers, shareholder services, administration of Board relations, regulatory and portfolio compliance and legal support. The Independent Board Members also recognized that NAM would oversee the Sub-Adviser.
In addition to the foregoing services, the Independent Board Members also noted the additional services that NAM or its affiliates provide to closed-end funds, including, in particular, Nuveen's continued commitment to supporting the secondary market for the
Nuveen Investments
31
Annual Investment Management Agreement
Approval Process (continued)
common shares of its closed-end funds through a variety of programs designed to raise investor and analyst awareness and understanding of closed-end funds. These efforts include maintaining an investor relations program to provide timely information and education to financial advisers and investors; providing advertising and marketing for the closed-end funds; maintaining websites; and providing educational seminars.
In evaluating the services of the Sub-Adviser, the Independent Board Members noted that the Sub-Advisory Agreement was essentially an agreement for portfolio management services only and the Sub-Adviser was not expected to supply other significant administrative services to the Fund. The Board Members, however, recognized the Sub-Adviser's experience in the mortgage-backed securities market and its selection by the U.S. Treasury ("UST") as an eligible manager to establish certain public-private investment funds pursuant to the UST's Public-Private Investment Program (the "PPIP") described in further detail below. The Sub-Adviser als o serves as investment adviser to the Feeder PPIP Fund and Master PPIP Fund (each, as defined below).
Based on their review, the Independent Board Members found that, overall, the nature, extent and quality of services expected to be provided to the Fund under each Advisory Agreement were satisfactory.
B. Investment Performance
The Fund is new and therefore does not have its own performance history. However, the Independent Board Members are familiar with each Fund Adviser's performance record on other Nuveen funds. The Independent Board Members also were provided with certain cash flow projections, including projections relating to income distribution and excess cash flow for an eight-year period based on certain assumptions and projected returns.
C. Fees, Expenses and Profitability
1. Fees and Expenses
In evaluating the management fees and expenses that the Fund was expected to bear, the Independent Board Members considered, among other things, the Fund's proposed management fee structure, its proposed sub-advisory fee arrangement, and its expected expense ratios in absolute terms as well as compared with the fees and expense ratios of comparable funds. In reviewing the comparative information for the Fund, the Independent Board Members recognized that there were no funds that are directly comparable to the Fund given the unique nature of the PPIP and the Fund's novel structure. In this regard, the Independent Board Members noted the unique structure of the Fund, which is expected to invest in mortgage-backed securities ("MBS") directly, and indirectly through a separate investm ent as a limited partner in a private feeder fund (the "Feeder PPIP Fund"). The Feeder PPIP Fund intends to invest alongside the UST in a master fund that has been organized to invest directly in MBS and other assets eligible for purchase under the PPIP (the "Master PPIP Fund"). The Independent Board Members considered that the Fund's total management fee reflected the fact that, among other things, although the
Nuveen Investments
32
Fund will be investing in income investments, the portfolio strategy will have an equity-like component given the distressed nature of the assets. The Fund also has been structured with a limited term.
In addition to the foregoing, the Fund's management fees will be applied to its total managed assets, which are the Fund's total assets invested both directly and indirectly through the Feeder PPIP Fund, including leverage proceeds at both the Master PPIP Fund level attributable to the Fund's investment in the Feeder PPIP and the Fund level. Accordingly, the Independent Board Members recognized that because a decision to increase the Fund's leverage would have the effect of increasing managed assets and, therefore, NAM's and the Sub-Adviser's management fees, NAM may have an incentive to effect, and the Sub-Adviser may have an incentive to recommend, an increase in the Fund's use of leverage; however, the Independent Board Members considered that NAM, in consultation with the Sub-Adviser, would seek to manage that incentive by only increasing the Fund's use of leverage when it determines that such increase is consistent with the Fund's investment objective, and by periodically reviewing the Fund's performance and use of leverage with the Board. In addition, the Independent Board Members recognized that all management fees paid to NAM and the Sub-Adviser will be charged at the Fund level, and that the Sub-Adviser would not charge a fee on any assets attributable to the Fund's investment in the Feeder PPIP Fund or indirect investment in the Master PPIP Fund.
The Independent Board Members also considered the fund-level breakpoint schedule and the complex-wide breakpoint schedule (described in further detail below) and any applicable fee waivers and expense reimbursements expected to be provided. Based on their review of the fee and expense information provided, the Independent Board Members determined that the Fund's management fees and net total expense ratio were reasonable in light of the nature, extent and quality of services to be provided to the Fund.
2. Comparisons with the Fees of Other Clients
Due to their experience with other Nuveen funds, the Board Members were familiar with the fees NAM assesses to other clients. Such other clients include separately managed accounts (both retail and institutional accounts) and funds that are not offered by Nuveen but are sub-advised by one of Nuveen's investment management teams. In evaluating the comparisons of fees, the Independent Board Members have noted, at the Meeting or at prior meetings, that the fee rates charged to a fund (such as the Fund) and charged to other clients vary, among other things, because of the different services involved and the additional regulatory and compliance requirements associated with registered investment companies, such as the Fund. Accordingly, the Independent Board Members have considered the differences in the product types, including, but not limited to, the services to be provided, the structure and operations, product distribution and co sts thereof, portfolio investment policies, investor profiles, account sizes and regulatory requirements. The Independent Board Members have noted, in particular, that the range of services as described above to
Nuveen Investments
33
Annual Investment Management Agreement
Approval Process (continued)
be provided to a fund (such as the Fund) is much more extensive than that provided to separately managed accounts. Given the inherent differences in the products, particularly the extensive services to be provided to the Fund, the Independent Board Members believe such facts justify the different levels of fees.
In considering the advisory fees of the Sub-Adviser, the Independent Board Members are familiar with the pricing schedule the Sub-Adviser charges for similar investment management services for other clients (such as retail and/or institutional managed accounts) as applicable. More specifically, the Independent Board Members considered that fees paid by the Fund's investors were expected to be less than the fees paid by the Sub-Adviser's institutional PPIP investors.
3. Profitability of Nuveen
In conjunction with its review of fees at prior meetings, the Independent Board Members have considered the profitability of Nuveen for its advisory activities (which incorporated Nuveen's wholly-owned affiliated sub-advisers other than Winslow Capital) and its financial condition. At the Meeting or prior meetings, the Independent Board Members reviewed the revenues and expenses of Nuveen's advisory activities, the allocation methodology used in preparing the profitability data and an analysis of the key drivers behind the changes in revenues and expenses that impacted profitability in 2008. They also reviewed the Form 8-K filed by Nuveen on July 9, 2009 (relating to, among other things, certain operations results and proposed financing and amendments to Nuveen's credit facility). The Independent Board Members have also considered, at the Meeting or at prior meetings, Nuveen's revenues for advisory activities, expenses, and prof it margin compared to that of various unaffiliated management firms with similar amounts of assets under management and relatively comparable asset composition prepared by Nuveen.
In reviewing profitability, the Independent Board Members have recognized the subjective nature of determining profitability, which may be affected by numerous factors, including the allocation of expenses. Further, the Independent Board Members have recognized the difficulties in making comparisons as the profitability of other advisers generally is not publicly available and the profitability information that is available for certain advisers or management firms may not be representative of the industry and may be affected by, among other things, the adviser's particular business mix, capital costs, types of funds managed and expense allocations. Notwithstanding the foregoing, the Independent Board Members reviewed Nuveen's methodology and assumptions for allocating expenses across product lines to determine profitability. In reviewing profitability, the Independent Board Members recognized Nuveen's investment in its fund busi ness. Based on their review, the Independent Board Members concluded that Nuveen's level of profitability for its advisory activities was reasonable in light of the services to be provided.
In evaluating the reasonableness of the compensation, the Independent Board Members also considered any other amounts expected to be paid to a Fund Adviser as well as any indirect benefits (such as soft dollar arrangements, if any) the respective Fund Adviser and its affiliates are expected to receive that are directly attributable to
Nuveen Investments
34
their management of the Fund, if any. See Section E below for additional information on indirect benefits a Fund Adviser may receive as a result of its relationship with the Fund. Based on their review of the overall fee arrangements of the Fund, the Independent Board Members determined that the advisory fees and expected expenses of the Fund were reasonable.
D. Economies of Scale and Whether Fee Levels Reflect These Economies of Scale
With respect to economies of scale, the Independent Board Members have recognized the potential benefits resulting from the costs of a fund being spread over a larger asset base, although economies of scale are difficult to measure and predict with precision, particularly on a fund-by-fund basis. The Independent Board Members therefore considered whether the Fund could be expected to benefit from any economies of scale. One method to help ensure that shareholders share in these benefits is to include breakpoints in the advisory fee schedule. Generally, management fees for funds in the Nuveen complex are comprised of a fund-level component and a complex-level component. Accordingly, the Independent Board Members received and reviewed the schedule of proposed advisory fees for the Fund, including fund-level breakpoints thereto. In this regard, however, given that the Fund is a closed-end fund, the Independent Board Members recogni zed that although the Fund may from time to time make additional share offerings, the growth in its assets will occur primarily through appreciation of its investment portfolio.
In addition to fund-level advisory fee breakpoints, the Board also considered the Fund's complex-wide fee arrangement. Pursuant to the complex-wide fee arrangement, the fees of the funds in the Nuveen complex, including the Fund, are generally reduced as the assets in the fund complex reach certain levels. In evaluating the complex-wide fee arrangement, the Independent Board Members have considered that the complex-wide fee arrangement seeks to provide the benefits of economies of scale to fund shareholders when total fund complex assets increase, even if assets of a particular fund are unchanged or have decreased. The approach reflects the notion that some of Nuveen's costs are attributable to services provided to all its funds in the complex and therefore all funds benefit if these costs are spread over a larger asset base. Based on their review, the Independent Board Members concluded that the breakpoint schedules and complex - -wide fee arrangement were acceptable and reflect economies of scale to be shared with the Fund's shareholders.
E. Indirect Benefits
In evaluating fees, the Independent Board Members also considered information regarding potential "fall out" or ancillary benefits that a Fund Adviser or its affiliates may receive as a result of its relationship with the Fund. In this regard, the Independent Board Members considered any revenues received by affiliates of NAM for serving as agent at Nuveen's trading desk.
Nuveen Investments
35
Annual Investment Management Agreement
Approval Process (continued)
In addition to the above, the Independent Board Members considered whether the Fund Advisers will receive any benefits from soft dollar arrangements whereby a portion of the commissions paid by the Fund for brokerage may be used to acquire research that may be useful to a Fund Adviser in managing the assets of the Fund and other clients. With respect to NAM, the Independent Board Members noted that NAM does not currently have any soft dollar arrangements; however, to the extent certain bona fide agency transactions that occur on markets that traditionally trade on a principal basis and riskless principal transactions are considered as generating "commissions," NAM intends to comply with the applicable safe harbor provisions. With respect to the Sub-Adviser, the Independent Board Members noted that while the Sub-Adviser does have some soft dollar arrangements with respect to some of its agency trades, trades on fixed income secur ities would be done on a principal basis and generally would not generate soft dollar credits. The Independent Board Members noted that the Sub-Adviser's profitability may be lower if it were required to pay for research that is subject to soft dollar arrangements with hard dollars.
Based on their review, the Independent Board Members concluded that any indirect benefits received by a Fund Adviser as a result of its relationship with the Fund were reasonable and within acceptable parameters.
F. Approval
The Independent Board Members did not identify any single factor discussed previously as all-important or controlling. The Board Members, including a majority of the Independent Board Members, concluded that the terms of the Investment Management Agreement and the Sub-Advisory Agreement were fair and reasonable, that the respective Fund Adviser's fees are reasonable in light of the services to be provided to the Fund and that the Investment Management Agreement and Sub-Advisory Agreement should be and were approved on behalf of the Fund.
Nuveen Investments
36
Reinvest Automatically
Easily and Conveniently
Nuveen makes reinvesting easy. A phone call is all it takes to set up your reinvestment account.
Nuveen Closed-End Funds Dividend Reinvestment Plan
Your Nuveen Closed-End Fund allows you to conveniently reinvest dividends and/or capital gains distributions in additional Fund shares.
By choosing to reinvest, you'll be able to invest money regularly and automatically, and watch your investment grow through the power of compounding. Just like dividends or distributions in cash, there may be times when income or capital gains taxes may be payable on dividends or distributions that are reinvested.
It is important to note that an automatic reinvestment plan does not ensure a profit, nor does it protect you against loss in a declining market.
Easy and convenient
To make recordkeeping easy and convenient, each month you'll receive a statement showing your total dividends and distributions, the date of investment, the shares acquired and the price per share, and the total number of shares you own.
How shares are purchased
The shares you acquire by reinvesting will either be purchased on the open market or newly issued by the Fund. If the shares are trading at or above net asset value at the time of valuation, the Fund will issue new shares at the greater of the net asset value or 95% of the then-current market price. If the shares are trading at less than net asset value, shares for your account will be purchased on the open market. If the Plan Agent begins purchasing Fund shares on the open market while shares are trading below net asset value, but the Fund's shares subsequently trade at or above their net asset value before the Plan Agent is able to complete its purchases, the Plan Agent may cease open-market purchases and may invest the uninvested portion of the distribution in newly-issued Fund shares at a price equal to the greater of the shares' net asset value or 95% of the shares' market value on the last business day immediately prior to the purchase date. Dividends and distributions received to purchase shares in the open market will normally be invested shortly after the dividend payment date. No interest will be paid on dividends and distributions awaiting reinvestment. Because the market price of the shares may increase before purchases are completed, the average purchase price per share may exceed the market price at the time of valuation, resulting in the acquisition of fewer shares than if the dividend or distribution had been paid in shares issued by the Fund. A pro rata portion of any applicable brokerage commissions on
Nuveen Investments
37
Reinvest Automatically
Easily and Conveniently (continued)
open market purchases will be paid by Plan participants. These commissions usually will be lower than those charged on individual transactions.
Flexible
You may change your distribution option or withdraw from the Plan at any time, should your needs or situation change. Should you withdraw, you can receive a certificate for all whole shares credited to your reinvestment account and cash payment for fractional shares, or cash payment for all reinvestment account shares, less brokerage commissions and a $2.50 service fee.
You can reinvest whether your shares are registered in your name, or in the name of a brokerage firm, bank, or other nominee. Ask your financial advisor if his or her firm will participate on your behalf. Participants whose shares are registered in the name of one firm may not be able to transfer the shares to another firm and continue to participate in the Plan.
The Fund reserves the right to amend or terminate the Plan at any time. Although the Fund reserves the right to amend the Plan to include a service charge payable by the participants, there is no direct service charge to participants in the Plan at this time.
Call today to start reinvesting dividends and/or distributions
For more information on the Nuveen Automatic Reinvestment Plan or to enroll in or withdraw from the Plan, speak with your financial advisor or call us at (800) 257-8787.
Nuveen Investments
38
Glossary of Terms
Used in this Report
• Average Annual Total Return: This is a commonly used method to express an investment's performance over a particular, usually multi-year time period. It expresses the return that would have been necessary each year to equal the investment's actual cumulative performance (including change in NAV or market price and reinvested dividends and capital gains distributions, if any) over the time period being considered.
• Current Distribution Rate (also known as Market Yield, Dividend Yield or Current Yield): Current distribution rate is based on the Fund's current annualized monthly distribution divided by the Fund's current market price.
• Net Asset Value (NAV): A Fund's NAV per common share is calculated by subtracting the liabilities of the Fund (including any debt or preferred shares issued in order to leverage the Fund) from its total assets and then dividing the remainder by the number of common shares outstanding. Fund NAVs are calculated at the end of each business day.
Nuveen Investments
39
Notes
Nuveen Investments
40
Other Useful Information
Board of Trustees
John P. Amboian
Robert P. Bremner
Jack B. Evans
William C. Hunter
David J. Kundert
William J. Schneider
Judith M. Stockdale
Carole E. Stone
Terence J. Toth
Fund Manager
Nuveen Asset Management
333 West Wacker Drive
Chicago, IL 60606
Custodian
State Street Bank & Trust Company
Boston, MA
Transfer Agent and
Shareholder Services
State Street Bank & Trust Company
Nuveen Funds
P.O. Box 43071
Providence, RI 02940-3071
(800) 257-8787
Legal Counsel
Chapman and Cutler LLP
Chicago, IL
Independent Registered
Public Accounting Firm
PricewaterhouseCoopers LLP
Chicago, IL
Nuveen Funds' Quarterly Portfolio of Investments and Proxy Voting Information
You may obtain (i) each Fund's quarterly portfolio of investments, (ii) information regarding how the Funds voted proxies relating to portfolio securities held during the most recent twelve-month period ended June 30, 2009, and (iii) a description of the policies and procedures that the Funds used to determine how to vote proxies relating to portfolio securities without charge, upon request, by calling Nuveen Investments toll-free at (800) 257-8787 or on Nuveen's website at www.nuveen.com.
You may also obtain this and other Fund information directly from the Securities and Exchange Commission ("SEC"). The SEC may charge a copying fee for this information. Visit the SEC on-line at http://www.sec.gov or in person at the SEC's Public Reference Room in Washington, D.C. Call the SEC at (202) 942-8090 for room hours and operation. You may also request Fund information by sending an e-mail request to publicinfo@sec.gov or by writing to the SEC's Public Reference Section at 100 F Street NE, Washington, D.C. 20549.
CEO Certification Disclosure
The Fund's Chief Executive Officer has submitted to the New York Stock Exchange ("NYSE") the annual CEO certification as required by Section 303A.12(a) of the NYSE Listed Company Manual.
The Fund has filed with the SEC the certification of its Chief Executive Officer and Chief Financial Officer required by Section 302 of the Sarbanes-Oxley Act.
Common Share Information
The Fund intends to repurchase shares of its own common stock in the future at such times and in such amounts as is deemed advisable. During the period covered by this report, the Fund repurchased shares of their common stock as shown in the accompanying table.
Common Shares
Repurchased | |
| | — | | |
Any future repurchases will be reported to shareholders in the next annual or semi-annual report.
Nuveen Investments
41
Nuveen Investments:
Serving Investors for Generations
Since 1898, financial advisors and their clients have relied on Nuveen Investments to provide dependable investment solutions through continued adherence to proven, long-term investing principles. Today, we offer a range of high quality equity and fixed-income solutions designed to be integral components of a well-diversified core portfolio.
Focused on meeting investor needs.
Nuveen Investments is a global investment management firm that seeks to help secure the long-term goals of institutions and high net worth investors as well as the consultants and financial advisors who serve them. We market our growing range of specialized investment solutions under the high-quality brands of HydePark, NWQ, Nuveen, Santa Barbara, Symphony, Tradewinds and Winslow Capital. In total, Nuveen Investments managed approximately $141 billion of assets on September 30, 2009.
Find out how we can help you.
To learn more about how the products and services of Nuveen Investments may be able to help you meet your financial goals, talk to your financial advisor, or call us at (800) 257-8787. Please read the information provided carefully before you invest.
Investors should consider the investment objective and policies, risk considerations, charges and expenses of any investment carefully. Where applicable, be sure to obtain a prospectus, which contains this and other relevant information. To obtain a prospectus, please contact your securities representative or Nuveen Investments, 333 W. Wacker Dr., Chicago, IL 60606. Please read the prospectus carefully before you invest or send money.
Learn more about Nuveen Funds at: www.nuveen.com/cef
• Share prices
• Fund details
• Daily financial news
• Investor education
• Interactive planning tools
Distributed by
Nuveen Investments, LLC
333 West Wacker Drive
Chicago, IL 60606
www.nuveen.com
EAN-K-1209D
ITEM 2. CODE OF ETHICS.
As of the end of the period covered by this report, the registrant has adopted a code of ethics that applies to the registrant’s principal executive officer, principal financial officer, principal accounting officer or controller, or persons performing similar functions. There were no amendments to or waivers from the Code during the period covered by this report. The registrant has posted the code of ethics on its website at www.nuveen.com/CEF/Info/Shareholder/. (To view the code, click on Fund Governance and then click on Code of Conduct.)
ITEM 3. AUDIT COMMITTEE FINANCIAL EXPERT.
The registrant’s Board of Directors or Trustees (“Board”) determined that the registrant has at least one “audit committee financial expert” (as defined in Item 3 of Form N-CSR) serving on its Audit Committee. The registrant’s audit committee financial expert is Jack B. Evans, who is “independent” for purposes of Item 3 of Form N-CSR.
Mr. Evans was formerly President and Chief Operating Officer of SCI Financial Group, Inc., a full service registered broker-dealer and registered investment adviser (“SCI”). As part of his role as President and Chief Operating Officer, Mr. Evans actively supervised the Chief Financial Officer (the “CFO”) and actively supervised the CFO’s preparation of financial statements and other filings with various regulatory authorities. In such capacity, Mr. Evans was actively involved in the preparation of SCI’s financial statements and the resolution of issues raised in connection therewith. Mr. Evans has also served on the audit committee of various reporting companies. At such companies, Mr. Evans was involved in the oversight of audits, audit plans, and the preparation of financial statements. Mr. Evans also formerly chaired the audit committee of the Federal Reserve Bank of Chicago.
ITEM 4. PRINCIPAL ACCOUNTANT FEES AND SERVICES.
Nuveen Mortgage Opportunity Term Fund
The following tables show the amount of fees that PricewaterhouseCoopers LLP, the Fund’s auditor, billed to the Fund during the Fund’s last two full fiscal years. For engagements with PricewaterhouseCoopers LLP the Audit Committee approved in advance all audit services and non-audit services that PricewaterhouseCoopers LLP provided to the Fund, except for those non-audit services that were subject to the pre-approval exception under Rule 2-01 of Regulation S-X (the “pre-approval exception”). The pre-approval exception for services provided directly to the Fund waives the pre-approval requirement for services other than audit, review or attest services if: (A) the aggregate amount of all such services provided constitutes no more than 5% of the total amount of revenues paid by the Fund to its accountant during the fiscal year in which the services are provided; (B) the Fund did not recognize the services as non-audit services at the time of the engagement; and (C) the services are promptly brought to the Audit Committee’s attention, and the Committee (or its delegate) approves the services before the audit is completed.
The Audit Committee has delegated certain pre-approval responsibilities to its Chairman (or, in his absence, any other member of the Audit Committee).
SERVICES THAT THE FUND’S AUDITOR BILLED TO THE FUND
| | Audit Fees Billed | | Audit-Related Fees | | Tax Fees | | All Other Fees | |
Fiscal Year Ended | | to Fund (1) | | Billed to Fund (2) | | Billed to Fund (3) | | Billed to Fund | |
December 31, 2009 (4) | | $ | 36,500 | | $ | 0 | | $ | 0 | | $ | 0 | |
| | | | | | | | | |
Percentage approved pursuant to pre-approval exception | | 0 | % | 0 | % | 0 | % | 0 | % |
| | | | | | | | | |
December 31, 2008 | | N/A | | N/A | | N/A | | N/A | |
| | | | | | | | | |
Percentage approved pursuant to pre-approval exception | | 0 | % | 0 | % | 0 | % | 0 | % |
| | | | | | | | | | | | | |
(1) “Audit Fees” are the aggregate fees billed for professional services for the audit of the Fund’s annual financial statements and services provided in connection with statutory and regulatory filings or engagements.
(2) “Audit Related Fees” are the aggregate fees billed for assurance and related services reasonably related to the performance of the audit or review of financial statements and are not reported under “Audit Fees”.
(3) “Tax Fees” are the aggregate fees billed for professional services for tax advice, tax compliance, and tax planning.
(4) The fund commenced operations on November 25, 2009.
SERVICES THAT THE FUND’S AUDITOR BILLED TO THE
ADVISER AND AFFILIATED FUND SERVICE PROVIDERS
The following tables show the amount of fees billed by PricewaterhouseCoopers LLP to Nuveen Asset Management (“NAM” or the “Adviser”), and any entity controlling, controlled by or under common control with NAM that provides ongoing services to the Fund (“Affiliated Fund Service Provider”), for engagements directly related to the Fund’s operations and financial reporting, during the Fund’s last two full fiscal years.
The tables also show the percentage of fees subject to the pre-approval exception. The pre-approval exception for services provided to the Adviser and any Affiliated Fund Service Provider (other than audit, review or attest services) waives the pre-approval requirement if: (A) the aggregate amount of all such services provided constitutes no more than 5% of the total amount of revenues paid to PricewaterhouseCoopers LLP by the Fund, the Adviser and Affiliated Fund Service Providers during the fiscal year in which the services are provided that would have to be pre-approved by the Audit Committee; (B) the Fund did not recognize the services as non-audit services at the time of the engagement; and (C) the services are promptly brought to the Audit Committee’s attention, and the Committee (or its delegate) approves the services before the Fund’s audit is completed.
| | Audit-Related Fees | | Tax Fees Billed to | | All Other Fees | |
| | Billed to Adviser and | | Adviser and | | Billed to Adviser | |
| | Affiliated Fund | | Affiliated Fund | | and Affiliated Fund | |
Fiscal Year Ended | | Service Providers | | Service Providers | | Service Providers | |
December 31, 2009 (1) | | $ | 0 | | $ | 0 | | $ | 0 | |
| | | | | | | |
Percentage approved pursuant to pre-approval exception | | 0 | % | 0 | % | 0 | % |
| | | | | | | |
December 31, 2008 | | N/A | | N/A | | N/A | |
| | | | | | | |
Percentage approved pursuant to pre-approval exception | | 0 | % | 0 | % | 0 | % |
| | | | | | | | | | |
(1) The fund commenced operations November 25, 2009.
NON-AUDIT SERVICES
The following table shows the amount of fees that PricewaterhouseCoopers LLP billed during the Fund’s last two full fiscal years for non-audit services. The Audit Committee is required to pre-approve non-audit services that PricewaterhouseCoopers LLP provides to the Adviser and any Affiliated Fund Services Provider, if the engagement related directly to the Fund’s operations and financial reporting (except for those subject to the pre-approval exception described above). The Audit Committee requested and received information from PricewaterhouseCoopers LLP about any non-audit services that PricewaterhouseCoopers LLP rendered during the Fund’s last fiscal year to the Adviser and any Affiliated Fund Service Provider. The Committee considered this information in evaluating PricewaterhouseCoopers LLP’s independence.
| | | | Total Non-Audit Fees | | | | | |
| | | | billed to Adviser and | | | | | |
| | | | Affiliated Fund Service | | Total Non-Audit Fees | | | |
| | | | Providers (engagements | | billed to Adviser and | | | |
| | | | related directly to the | | Affiliated Fund Service | | | |
| | Total Non-Audit Fees | | operations and financial | | Providers (all other | | | |
Fiscal Year Ended | | Billed to Fund | | reporting of the Fund) | | engagements) | | Total | |
December 31, 2009 (1) | | $ | 0 | | $ | 0 | | $ | 0 | | $ | 0 | |
December 31, 2008 | | N/A | | N/A | | N/A | | N/A | |
| | | | | | | | | | | | | |
“Non-Audit Fees billed to Fund” for both fiscal year ends represent “Tax Fees” and “All Other Fees” billed to Fund in their respective amounts from the previous table.
(1) The fund commenced operations November 25, 2009.
Audit Committee Pre-Approval Policies and Procedures. Generally, the Audit Committee must approve (i) all non-audit services to be performed for the Fund by the Fund’s independent accountants and (ii) all audit and non-audit services to be performed by the Fund’s independent accountants for the Affiliated Fund Service Providers with respect to operations and financial reporting of the Fund. Regarding tax and research projects conducted by the independent accountants for the Fund and Affiliated Fund Service Providers (with respect to operations and financial reports of the Fund) such engagements will be (i) pre-approved by the Audit Committee if they are expected to be for amounts greater than $10,000; (ii) reported to the Audit Committee chairman for his verbal approval prior to engagement if they are expected to be for amounts under $10,000 but greater than $5,000; and (iii) reported to the Audit Committee at the next Audit Committee meeting if they are expected to be for an amount under $5,000.
ITEM 5. AUDIT COMMITTEE OF LISTED REGISTRANTS.
The registrant’s Board has a separately designated Audit Committee established in accordance with Section 3(a)(58)(A) of the Securities Exchange Act of 1934, as amended (15 U.S.C. 78c(a)(58)(A)). The members of the audit committee are Robert P. Bremner, Jack B. Evans, David J. Kundert, William J. Schneider and Terence J. Toth.
ITEM 6. SCHEDULE OF INVESTMENTS.
(a) See Portfolio of Investments in Item 1.
(b) Not applicable.
ITEM 7. DISCLOSURE OF PROXY VOTING POLICIES AND PROCEDURES FOR CLOSED-END MANAGEMENT INVESTMENT COMPANIES.
Nuveen Asset Management (NAM) is the registrant’s investment adviser. The registrant primarily invests in MBS. In the rare event that an issuer of a security held by the registrant were to issue a proxy or that the registrant were to receive a proxy issued by a cash management security, NAM would either engage an independent third party to determine how the proxy should be voted or vote the proxy with the consent, or based on the instructions, of the registrant’s Board of Trustees or its representative. A member of NAM’s legal department would oversee the administration of the voting and ensure that records maintained in accordance with Rule 206(4)-6 of the Investment Advisers Act of 1940, as amended, were filed with the Securities and Exchange Commission on Form N-PX, provided to the registrant’s Board of Trustees and made available to shareholders as required by applicable rules.
In the event of a conflict of interest that might arise when voting proxies for the registrant, NAM will defer to the recommendation of an independent third party engaged to determine how the proxy should be voted, or, alternatively, members of NAM’s legal and compliance departments, in consultation with the Board of Trustees, will examine the conflict of interest and seek to resolve such conflict in the best interest of the registrant. If a member of NAM’s legal or compliance department or the Board of Trustees has a personal conflict of interest, that member will refrain from participating in the consultation.
ITEM 8. PORTFOLIO MANAGERS OF CLOSED-END MANAGEMENT INVESTMENT COMPANIES.
Nuveen Asset Management (“NAM” or the “Adviser”) is the registrant’s investment adviser and Wellington Management Company, LLC (“Wellington Management” or the “Subadviser”) is the registrant’s subadviser. NAM is responsible for determining the registrant’s overall investment strategy and on-going monitoring of the Subadviser. NAM is also responsible for determining whether and to what extent the registrant invests in a public-private investment partnership established pursuant to the U.S. Treasury’s Public-Private Investment Program. NAM also manages the registrant’s business affairs and provides certain clerical, bookkeeping and administrative services. The registrant has engaged Wellington Management to exercise day-to-day responsibility for managing the registrant’s direct investments in mortgage-backed securities and other permitted investments. The following section provides information on the persons at the Adviser and the Sub-Adviser who are primarily responsible for the day-to-day management of the registrant’s portfolio:
NAM
Item 8(a)(1). PORTFOLIO MANAGER BIOGRAPHY
John V. Miller, CFA, Chief Investment Officer and Managing Director of NAM, has served as a portfolio manager of the registrant since its inception. Mr. Miller joined Nuveen in 1996 as a municipal credit analyst and moved into portfolio management in 2000. He became a managing director and head of NAM’s portfolio managers in 2006, and he became NAM’s Chief Investment Officer in 2007, supervising all of NAM’s fixed-income investment activities. Mr. Miller earned his BA in economics and political science from Duke University, an MA in economics from Northwestern University, and an MBA with honors in finance from the University of Chicago.
Item 8(a)(2). OTHER ACCOUNTS MANAGED BY PORTFOLIO MANAGER
Portfolio Manager | | Type of Account
Managed | | Number of
Accounts | | Assets* | |
John V. Miller | | Registered Investment Company | | 3 | | $ | 5.05 billion | |
| | Other Pooled Investment Vehicles | | 1 | | $ | 99 million | |
| | Other Accounts | | 9 | | $ | 1.5 million | |
* Assets are as of December 31, 2009. None of the assets in these accounts are subject to an advisory fee based on performance.
POTENTIAL MATERIAL CONFLICTS OF INTEREST
The portfolio manager’s simultaneous management of the registrant and the other accounts noted above may present actual or apparent conflicts of interest with respect to the allocation and aggregation of securities orders placed on behalf of the registrant and the other accounts. NAM, however, believes that such potential conflicts are mitigated by the fact that NAM has adopted several policies that address potential conflicts of interest, including best execution and trade allocation policies that are designed to ensure (1) that portfolio management is seeking the best price for portfolio securities under the circumstances, (2) fair and equitable allocation of investment opportunities among accounts over time and (3) compliance with applicable regulatory requirements. All accounts are to be treated in a non-preferential manner, such that allocations are not based upon account performance, fee structure or preference of the portfolio manager. In addition, NAM has adopted a Code of Conduct that sets forth policies regarding conflicts of interest.
Item 8(a)(3). PORTFOLIO MANAGER COMPENSATION
Compensation. The compensation of NAM’s portfolio manager consists of three basic elements—base salary, cash bonus and long-term incentive compensation. The compensation strategy is to annually compare overall compensation to the market in order to create a compensation structure that is competitive and consistent with similar financial services companies. As discussed below, several factors are considered in determining the portfolio manager’s total compensation. In any year these factors may include, among others, the effectiveness of the investment strategies recommended by the portfolio manager’s investment team, the investment performance of the accounts managed by the portfolio manager, and the overall performance of Nuveen Investments (the parent company of NAM). Although investment performance is a factor in determining the portfolio manager’s compensation, it is not necessarily a decisive factor.
Base salary. The portfolio manager is paid a base salary that is set at a level determined by NAM in accordance with its overall compensation strategy discussed above. NAM is not under any current contractual obligation to increase a portfolio manager’s base salary.
Cash bonus. The portfolio manager is also eligible to receive an annual cash bonus. The level of this bonus is based upon evaluations and determinations made by each portfolio manager’s supervisors, along with reviews submitted by his peers. These reviews and evaluations often take into account a number of factors, including the effectiveness of the investment strategies recommended to NAM’s investment team, the performance of the accounts for which he serves as portfolio manager relative to any benchmarks established for those accounts, his effectiveness in communicating investment performance to stockholders and their representatives, and his contribution to NAM’s investment process and to the execution of investment strategies. The cash bonus component is also impacted by the overall performance of Nuveen Investments in achieving its business objectives.
Long-term incentive compensation. In connection with the acquisition of Nuveen Investments by a group of investors lead by Madison Dearborn Partners, LLC in November 2007, certain employees, including the portfolio manager, received profit interests in Nuveen Investments. These profit interests entitle the holders to participate in the appreciation in the value of Nuveen Investments beyond the issue date and vest over five to seven years, or earlier in the case of a liquidity event. In addition, in July 2009, Nuveen Investments created and funded a trust, as part of a newly-established incentive program, which purchased shares of certain Nuveen mutual funds and awarded such shares, subject to vesting, to certain employees, including the portfolio manager.
Item 8(a)(4). OWNERSHIP OF REGISTRANT’S SECURITIES AS OF DECEMBER 31, 2009
Name of Portfolio
Manager | | None | | $1 -
$10,000 | | $10,001
-
$50,000 | | $50,001-
$100,000 | | $100,001-
$500,000 | | $500,001-
$1,000,000 | | Over
$1,000,000 |
John Miller | | X | | | | | | | | | | | | |
Wellington Management
Item 8(a)(1). PORTFOLIO MANAGER BIOGRAPHY
Michael F. Garrett, Senior Vice President and Fixed Income Portfolio Manager of Wellington Management, has served as a portfolio manager of the registrant since its inception. Mr. Garrett joined Wellington Management as an investment professional in 1999. Mr. Garrett is responsible for managing mortgage and government bond portfolios for Wellington Management’s mutual fund and institutional clients. Mr. Garrett leads the firm’s Mortgage-Backed investment team. Prior to joining Wellington Management in 1999, Mr. Garrett was a fixed income securities trader with Credit Suisse First Boston (1996-1999), a mortgage portfolio manager with MetLife Investment Management Co. (1995-1996), and the senior securities trader for First Federal Savings & Loan Association (1991-1995). Mr. Garrett received his BA in economics from Yale University (1991).
Item 8(a)(2). OTHER ACCOUNTS MANAGED BY PORTFOLIO MANAGER
| | All Accounts | | Accounts with Performance Fees |
| | Registered
Investment
Companies | | Other Pooled Investment
Vehicles | | Other Accounts | | Registered
Investment
Companies | | Other Pooled
Investment
Vehicles | | Other Accounts |
Portfolio
Manager | | Number
of
Accounts | | Total
Assets
($millions) | | Number
of
Accounts | | Total
Assets
($millions) | | Number
of
Accounts | | Total Assets
($millions) | | Number of
Accounts | | Total
Assets | | Number
of
Accounts | | Total
Assets
($millions) | | Number of
Accounts | | Total Assets
($millions) |
| | | | | | | | | | | | | | | | | | | | | | | | |
Michael F. Garrett | | 3 | | $ | 604.5 | | 5 | | $ | 2,366.8 | | 10 | | $ | 1,927.8 | | 0 | | $ | 0 | | 1 | | $ | 605.4 | | 1 | | $ | 489.3 |
| | | | | | | | | | | | | | | | | | | | | | | | | | | | | | |
POTENTIAL MATERIAL CONFLICTS OF INTEREST
Individual investment professionals at Wellington Management manage multiple accounts for multiple clients. These accounts may include mutual funds, separate accounts (assets managed on behalf of institutions, such as pension funds, insurance companies, foundations, or separately managed account programs sponsored by financial intermediaries), bank common trust accounts, and hedge funds. The person at Wellington Management who is primarily responsible for the day-to-day management of the registrant (“Portfolio Manager”) generally manages accounts in several different investment styles. These accounts may have investment objectives, strategies, time horizons, tax considerations and risk profiles that differ from those of the registrant. The Portfolio Manager makes investment decisions for each account, including the registrant, based on the investment objectives, policies, practices, benchmarks, cash flows, tax and other relevant investment considerations applicable to that account. Consequently, the Portfolio Manager may purchase or sell securities, including IPOs, for one account and not another account, and the performance of securities purchased for one account may vary from the performance of securities purchased for other accounts. Alternatively, these accounts may be managed in a similar fashion to the registrant and thus the accounts may have similar, and in some cases nearly identical, objectives, strategies and/or holdings to that of the registrant.
The Portfolio Manager or other investment professionals at Wellington Management may place transactions on behalf of other accounts that are directly or indirectly contrary to investment decisions made on behalf of the registrant, or make investment decisions that are similar to those made for the registrant, both of which have the potential to adversely impact the registrant depending on market conditions. For example, an investment professional may purchase a security in one account while appropriately selling that same security in another account. Similarly, the Portfolio Manager may purchase the same security for the registrant and one or more other accounts at or about the same time, and in those instances the other accounts will have access to their respective holdings prior to the public disclosure of the registrant’s holdings. In addition, some of these accounts have fee structures, including performance fees, which are or have the potential to be higher, in some cases significantly higher, than the fees Wellington Management receives for managing the registrant. Because incentive payments paid by Wellington Management to the Portfolio Manager are tied to revenues earned by Wellington Management and, where noted, to the performance achieved by the manager in each account, the incentives associated with any given account may be significantly higher or lower than those associated with other accounts managed by the Portfolio Manager. Finally, the Portfolio Manager may hold shares or investments in the other pooled investment vehicles and/or other accounts identified above.
Wellington Management’s goal is to meet its fiduciary obligation to treat all clients fairly and provide high quality investment services to all of its clients. Wellington Management has adopted and implemented policies and procedures, including brokerage and trade allocation policies and procedures, which it believes address the conflicts associated with managing multiple accounts for multiple clients. In addition, Wellington Management monitors a variety of areas, including compliance with primary account guidelines, the allocation of IPOs, and compliance with the firm’s Code of Ethics, and places additional investment restrictions on investment professionals who manage hedge funds and certain other accounts. Furthermore, senior investment and business personnel at Wellington Management periodically review the performance of Wellington Management’s investment professionals. Although Wellington Management does not track the time an investment professional spends on a single account, Wellington Management does periodically assess whether an investment professional has adequate time and resources to effectively manage the investment professional’s various client mandates.
Item 8(a)(3). PORTFOLIO MANAGER COMPENSATION
Wellington Management receives a fee based on the assets under management of the registrant as set forth in the Investment Subadvisory Agreement between Wellington Management and the Fund. Wellington Management pays its investment professionals out of its total revenues and other resources, including the advisory fees earned with respect to the registrant. The following information relates to the fiscal year ended December 31, 2009.
Wellington Management’s compensation structure is designed to attract and retain high-caliber investment professionals necessary to deliver high quality investment management services to its clients. Wellington Management’s compensation of the Portfolio Manager includes a base salary and incentive components. The base salary for Mr. Garrett, who is a partner of Wellington Management, is determined by the Managing Partners of the firm. A partner’s base salary is generally a fixed amount that may change as a result of an annual review. The Portfolio Manager is eligible to receive an incentive payment based on the revenues earned by Wellington Management from the registrant and generally each other account managed by the Portfolio Manager. The incentive paid to the Portfolio Manager is based on the revenues earned by Wellington Management, which have no performance-related component. Wellington
Management applies similar incentive structures to other accounts managed by the Portfolio Manager, including accounts with performance fees.
Portfolio-based incentives across all accounts managed by an investment professional can, and typically do, represent a significant portion of an investment professional’s overall compensation; incentive compensation varies significantly by individual and can vary significantly from year to year. The Portfolio Manager may also be eligible for bonus payments based on his overall contribution to Wellington Management’s business operations. Senior management at Wellington Management may reward individuals as it deems appropriate based on factors other than account performance. Each partner of Wellington Management is eligible to participate in a partner-funded tax qualified retirement plan, the contributions to which are made pursuant to an actuarial formula. Mr. Garrett is a partner of the firm.
Item 8(a)(4). OWNERSHIP OF REGISTRANT’S SECURITIES AS OF DECEMBER 31, 2009
Name of Portfolio Manager | | None | | $1 - $10,000 | | $10,001-
$50,000 | | $50,001-
$100,000 | | $100,001-
$500,000 | | $500,001-
$1,000,000 | | Over $1,000,000 |
Michael F. Garrett | | X | | | | | | | | | | | | |
ITEM 9. PURCHASES OF EQUITY SECURITIES BY CLOSED-END MANAGEMENT INVESTMENT COMPANY AND AFFILIATED PURCHASERS.
Not applicable.
ITEM 10. SUBMISSION OF MATTERS TO A VOTE OF SECURITY HOLDERS.
There have been no material changes to the procedures by which shareholders may recommend nominees to the registrant’s Board implemented after the registrant last provided disclosure in response to this Item.
ITEM 11. CONTROLS AND PROCEDURES.
(a) | The registrant’s principal executive and principal financial officers, or persons performing similar functions, have concluded that the registrant’s disclosure controls and procedures (as defined in Rule 30a-3(c) under the Investment Company Act of 1940, as amended (the “1940 Act”) (17 CFR 270.30a-3(c))) are effective, as of a date within 90 days of the filing date of this report that includes the disclosure required by this paragraph, based on their evaluation of the controls and procedures required by Rule 30a-3(b) under the 1940 Act (17 CFR 270.30a-3(b)) and Rules 13a-15(b) or 15d-15(b) under the Securities Exchange Act of 1934, as amended (the “Exchange Act”) (17 CFR 240.13a-15(b) or 240.15d-15(b)). |
| |
(b) | There were no changes in the registrant’s internal control over financial reporting (as defined in Rule 30a-3(d) under the 1940 Act (17 CFR 270.30a-3(d)) that occurred during the second fiscal quarter of the period covered by this report that has materially affected, or is reasonably likely to materially affect, the registrant’s internal control over financial reporting. |
ITEM 12. EXHIBITS.
File the exhibits listed below as part of this Form. Letter or number the
exhibits in the sequence indicated.
(a)(1) Any code of ethics, or amendment thereto, that is the subject of the disclosure required by Item 2, to the extent that the registrant intends to satisfy the Item 2 requirements through filing of an exhibit: Not applicable because the code is posted on registrant’s website at www.nuveen.com/CEF/Info/Shareholder/ and there were no amendments during the period covered by this report. (To view the code, click on Fund Governance and then Code of Conduct.)
(a)(2) A separate certification for each principal executive officer and principal financial officer of the registrant as required by Rule 30a-2(a) under the 1940 Act (17 CFR 270.30a-2(a)) in the exact form set forth below: Ex-99.CERT Attached hereto.
(a)(3) Any written solicitation to purchase securities under Rule 23c-1 under the 1940 Act (17 CFR 270.23c-1) sent or given during the period covered by the report by or on behalf of the registrant to 10 or more persons. Not applicable.
(b) If the report is filed under Section 13(a) or 15(d) of the Exchange Act, provide the certifications required by Rule 30a-2(b) under the 1940 Act (17 CFR 270.30a-2(b)); Rule 13a-14(b) or Rule 15d-14(b) under the Exchange Act (17 CFR 240.13a-14(b) or 240.15d-14(b)), and Section 1350 of Chapter 63 of Title 18 of the United States Code (18 U.S.C. 1350) as an exhibit. A certification furnished pursuant to this paragraph will not be deemed “filed” for purposes of Section 18 of the Exchange Act (15 U.S.C. 78r), or otherwise subject to the liability of that section. Such certification will not be deemed to be incorporated by reference into any filing under the Securities Act of 1933 or the Exchange Act, except to the extent that the registrant specifically incorporates it by reference. Ex-99.906 CERT attached hereto.
SIGNATURES
Pursuant to the requirements of the Securities Exchange Act of 1934 and the Investment Company Act of 1940, the registrant has duly caused this report to be signed on its behalf by the undersigned, thereunto duly authorized.
(Registrant) Nuveen Mortgage Opportunity Term Fund
By (Signature and Title) | /s/ Kevin J. McCarthy | |
| Kevin J. McCarthy | |
| Vice President and Secretary | |
Date: March 10, 2010
Pursuant to the requirements of the Securities Exchange Act of 1934 and the Investment Company Act of 1940, this report has been signed below by the following persons on behalf of the registrant and in the capacities and on the dates indicated.
By (Signature and Title) | /s/ Gifford R. Zimmerman | |
| Gifford R. Zimmerman | |
| Chief Administrative Officer | |
| (principal executive officer) | |
Date: March 10, 2010
By (Signature and Title) | /s/ Stephen D. Foy | |
| Stephen D. Foy | |
| Vice President and Controller | |
| (principal financial officer) | |
Date: March 10, 2010