UNITED STATES
SECURITIES AND EXCHANGE COMMISSION
Washington, D.C. 20549
FORM N-CSR
CERTIFIED SHAREHOLDER REPORT OF REGISTERED
MANAGEMENT INVESTMENT COMPANIES
Investment Company Act file number | 811-22329 |
Nuveen Mortgage and Income Fund
(Exact name of registrant as specified in charter)
Nuveen Investments
333 West Wacker Drive
Chicago, IL 60606
(Address of principal executive offices) (Zip code)
Mark L. Winget
Nuveen Investments
333 West Wacker Drive
Chicago, IL 60606
(Name and address of agent for service)
Registrant’s telephone number, including area code: (312) 917-7700
Date of fiscal year end: December 31
Date of reporting period: December 31, 2021
Form N-CSR is to be used by management investment companies to file reports with the Commission not later than 10 days after the transmission to stockholders of any report that is required to be transmitted to stockholders under Rule 30e-1 under the Investment Company Act of 1940 (17 CFR 270.30e-1). The Commission may use the information provided on Form N-CSR in its regulatory, disclosure review, inspection, and policymaking roles.
A registrant is required to disclose the information specified by Form N-CSR, and the Commission will make this information public. A registrant is not required to respond to the collection of information contained in Form N-CSR unless the Form displays a currently valid Office of Management and Budget (“OMB”) control number. Please direct comments concerning the accuracy of the information collection burden estimate and any suggestions for reducing the burden to Secretary, Securities and Exchange Commission, 450 Fifth Street, NW, Washington, DC 20549-0609. The OMB has reviewed this collection of information under the clearance requirements of 44 U.S.C. ss. 3507.
ITEM 1. REPORTS TO STOCKHOLDERS.

Closed-End Funds
31 December
2021
Nuveen Closed-End Funds
| JGH | Nuveen Global High Income Fund | |
| NPCT | Nuveen Core Plus Impact Fund | |
| JLS | Nuveen Mortgage and Income Fund |
As permitted by regulations adopted by the Securities and Exchange Commission, paper copies of the Fund’s annual and semi-annual shareholder reports will not be sent to you by mail unless you specifically request paper copies of the reports. Instead, the reports will be made available on the Fund’s website (www.nuveen.com), and you will be notified by mail each time a report is posted and provided with a website link to access the report.
You may elect to receive shareholder reports and other communications from the Fund electronically at any time by contacting the financial intermediary (such as a broker-dealer or bank) through which you hold your Fund shares or, if you are a direct investor, by enrolling at www.nuveen.com/e-reports.
You may elect to receive all future shareholder reports in paper free of charge at any time by contacting your financial intermediary or, if you are a direct investor, by calling 800-257-8787 and selecting option #2 or (ii) by logging into your Investor Center account at www.computershare.com/investor and clicking on “Communication Preferences”. Your election to receive reports in paper will apply to all funds held in your account with your financial intermediary or, if you are a direct investor, to all your directly held Nuveen Funds and any other directly held funds within the same group of related investment companies.
Annual Report
Life is Complex.
Nuveen makes things e-simple.
It only takes a minute to sign up for e-Reports. Once enrolled, you’ll receive an e-mail as soon as your Nuveen Fund information is ready—no more waiting for delivery by regular mail. Just click on the link within the e-mail to see the report and save it on your computer if you wish.
Free e-Reports right to your e-mail!
www.investordelivery.com
If you receive your Nuveen Fund distributions and statements from your financial professional or brokerage account.
or
www.nuveen.com/client-access
If you receive your Nuveen Fund dividends and statements directly from Nuveen.
NOT FDIC INSURED MAY LOSE VALUE NO BANK GUARANTEE
| 4 | ||||
| 5 | ||||
| 9 | ||||
| 11 | ||||
| 14 | ||||
| 20 | ||||
| 21 | ||||
| 45 | ||||
| 46 | ||||
| 47 | ||||
| 49 | ||||
| 50 | ||||
| 54 | ||||
| 70 | ||||
| 101 | ||||
| 102 | ||||
| 104 | ||||
3
Chair’s Letter to Shareholders

Dear Shareholders,
We have seen a nearly full recovery in the economy and began to approach more normalcy in our daily lives, enabled by unprecedented help from governments and central banks and the development of effective COVID-19 vaccines and therapies.
As crisis-related monetary and fiscal supports are phasing out, global economic growth is expected to moderate from post-pandemic peak growth toward a more sustainable pace of expansion. In the U.S., the rapid rebound in the economy has pushed consumer prices higher, and ongoing supply chain disruptions have kept the inflation rate elevated for longer than expected. With the economy and employment on strong footing, the Federal Reserve is ending its pandemic bond buying program and will begin raising short-term interest rates in 2022 to help keep inflation in check. The Fed now faces the challenge of counteracting inflation pressures without stifling economic growth, which the markets will be watching closely. On the fiscal side, government spending will be lower from here, but the U.S. will begin funding projects with the $1.2 trillion Infrastructure Investment and Jobs Act enacted on November 15, 2021, and Europe, Japan and China are also expected to roll out fiscal support in 2022.
Inflation levels, the timing of monetary policy normalization and the global economy’s response to tighter financial conditions will be a key focus in the markets. We anticipate periodic volatility as markets digest incoming data on these impacts, as well as COVID-19 headlines, as there is still uncertainty about the course of the pandemic. Short-term market fluctuations can provide your Fund opportunities to invest in new ideas as well as upgrade existing positioning while providing long-term value for shareholders. For more than 120 years, the careful consideration of risk and reward has guided Nuveen’s focus on delivering long-term results to our shareholders.
To learn more about how your portfolio can take advantage of new opportunities arising from the normalizing global economy, we encourage you to review your time horizon, risk tolerance and investment goals with your financial professional.
On behalf of the other members of the Nuveen Fund Board, I look forward to continuing to earn your trust in the months and years ahead.
Sincerely,

Terence J. Toth
Chair of the Board
February 22, 2022
4
Nuveen Global High Income Fund (JGH)
Nuveen Core Plus Impact Fund (NPCT)
Nuveen Mortgage and Income Fund (JLS)
Nuveen Global High Income Fund (JGH) features portfolio management by Nuveen Asset Management, LLC (NAM) an affiliate of Nuveen Fund Advisors, LLC, the Fund’s investment adviser. The Fund’s portfolio managers are Kevin Lorenz, CFA, Anders S. Persson, CFA, and Jacob J. Fitzpatrick, CFA.
Nuveen Core Plus Impact Fund (NPCT) features portfolio management by Nuveen Asset Management, LLC (NAM) an affiliate of Nuveen Fund Advisors, LLC, the Fund’s investment adviser. The Fund’s portfolio managers are Stephen Liberatore, CFA, Jessica Zarzycki, CFA and Kristal Seales, CFA.
Nuveen Mortgage and Income Fund (JLS) features portfolio management by Teachers Advisors, LLC (TAL), an affiliate of Nuveen Fund Advisors, LLC, the Fund’s investment adviser. The Fund’s portfolio managers are Aashh Parekh, CFA, Nick Travaglino and Stephen Virgilio.
Here the Funds’ portfolio management teams review economic and financial market conditions, key investment strategies and the performance of the Funds for the twelve-month reporting period ended December 31, 2021. For more information on the Funds’ investment objectives and policies, please refer to the Shareholder Update section at the end of the report.
What factors affected the economy and financial markets during the twelve-month reporting period ended December 31, 2021?
The U.S. economic recovery remained on course over the twelve-month reporting period, despite setbacks from the COVID-19 virus and higher-than-expected inflation readings. Since the pandemic reached the U.S. in early 2020, the federal government has enacted $5.3 trillion in crisis-related aid and the U.S. Federal Reserve (Fed) has kept borrowing rates low for businesses and individuals and kept the credit system stable. These measures, along with increasing vaccinations and improved treatments, helped the economy to reopen and activity to rebound during 2021, despite additional COVID-19 surges caused by new, more contagious variants. U.S. gross domestic product (GDP) rose at an annualized 6.9% in the fourth quarter of 2021, accelerating from 2.3% in the third quarter when the delta variant
This material is not intended to be a recommendation or investment advice, does not constitute a solicitation to buy, sell or hold a security or an investment strategy and is not provided in a fiduciary capacity. The information provided does not take into account the specific objectives or circumstances of any particular investor, or suggest any specific course of action. Investment decisions should be made based on an investor’s objectives and circumstances and in consultation with his or her advisors.
Certain statements in this report are forward-looking statements. Discussions of specific investments are for illustration only and are not intended as recommendations of individual investments. The forward-looking statements and other views expressed herein are those of the portfolio managers as of the date of this report. Actual future results or occurrences may differ significantly from those anticipated in any forward-looking statements and the views expressed herein are subject to change at any time, due to numerous market and other factors. The Funds disclaim any obligation to update publicly or revise any forward-looking statements or views expressed herein.
Each Fund uses credit quality ratings for its portfolio securities provided by Moody’s Investors Service, Inc. (Moody’s), Standard & Poor’s (S&P) and Fitch, Inc. (Fitch). For JGH and NPCT, if all three of Moody’s, S&P, and Fitch provide a rating for a security, the middle rating is used; if two of the three agencies rate a security, the lower rating is used; and if only one rating agency rates a security, that rating is used. For JLS, the highest rating given by Moody’s, S&P and Fitch is used. This treatment of split-rated securities may differ from that used for other purposes, such as for Fund investment policies. AAA, AA, A, and BBB are investment grade ratings; BB, B, CCC/CC/C and D are below-investment grade ratings. Holdings designated N/R are not rated by these national rating agencies. Refer to the Glossary of Terms Used in this Report for further definition of the terms used within this section.
5
Portfolio Managers’ Comments (continued)
weighed on economic activity, according to the Bureau of Economic Analysis “advance” estimate. Also according to the “advance” estimate, in 2021 overall, GDP grew 5.7%, rebounding from the contraction of -3.4% in 2020.
The return of consumer demand to the economy put upward pressure on inflation in 2021. However, as supply chains remained under stress and labor shortages continued, in part because of resurgences of the virus around the world, inflation appeared to be more durable than initially expected. The Fed responded by reducing its pandemic-era support programs and signaled that rate increases were likely in 2022. Financial markets grew more concerned about the timing and size of these monetary policy shifts and their implications for the broader economic outlook, which led to short-term volatility in interest rates and stock prices. However, strong corporate earnings and a lessening economic impact from each subsequent wave of the virus supported a more optimistic view that ultimately drove stock prices and interest rates higher over 2021.
Nuveen Global High Income Fund (JGH)
What key strategies were used to manage the Fund during the twelve-month reporting period ended December 31, 2021?
The Fund seeks to deliver high current income through a diversified portfolio of global high-income securities that may span the capital structure and credit spectrum, including high yield bonds from the U.S. and developed and emerging markets, as well as preferred and convertible securities. The Fund uses leverage. Leverage is discussed in more detail later in the Fund Leverage Section of this report.
Throughout the reporting period, the Fund’s portfolio management team continued to favor taking prudent credit risk versus duration (interest rate) risk in the portfolio through key overweights in B-rated debt, senior loans and preferred securities. The portfolio maintained overweights in service-based industries like technology, health care and banking driven by the outlook for higher interest rates, energy producers and midstream operators. Key underweights included BB-rated securities given their higher interest rate risk relative to the rest of the high yield market, as well as the communications sector and cyclical issuers, where valuations have tightened significantly. The portfolio also underweighted emerging market (EM) sovereign debt because of policy and fiscal overhang involving a number of sovereign issuers.
How did the Fund perform during the twelve-month reporting period ended December 31, 2021?
For the twelve-month reporting period ended December 31, 2021, the Fund’s portfolio outperformed the Bloomberg Global High Yield Index (USD Hedged). For the purposes of this Performance Commentary, references to relative performance are in comparison to the Bloomberg Global High Yield Index (USD Hedged).
The portfolio broadly benefited from its allocation to and security selection within the high yield corporate segment, which performed strongly throughout the reporting period. Within the high yield corporate segment, security selection was strong in the communications sector, including outdoor advertising company Clear Channel Holdings, which saw its bonds rally based on improvement in bookings across billboards, digital and transit in the U.S. and Europe. Also, overweight positions in Swiss cable company UPC Broadband and U.K. communications provider Virgin Media aided relative performance. The portfolio management team maintains exposure to all three issuers because their bonds continue to provide attractive yields, which helps the Fund achieve its objective of delivering high current income to shareholders.
The portfolio’s emerging market (EM) corporate bond segment also benefited from security selection. Specifically, the lack of exposure to two Chinese real estate developers found in the index, China Evergrande Group and Kaisa Group Holdings, which both saw the value of their bonds drop sharply during the reporting period, was particularly beneficial. Chinese regulators implemented a significant policy change in August 2020 that contributed to a major liquidity crisis this year at China Evergrande Group, one of the country’s largest and most indebted residential real estate developers. The company ultimately defaulted on its bonds in December 2021.
6
The portfolio’s outperformance was partially offset by security selection within oilfield services, which detracted from performance, specifically an underweight to lower quality service companies. These issuers have benefited from a stronger commodity price environment and open capital markets and significantly outperformed the benchmark. Similarly, security selection in the metals and mining industry proved detrimental to performance because of an underweight to lower-quality producers, which rallied during the reporting period.
Nuveen Core Plus Impact Fund (NPCT)
What key strategies were used to manage the Fund during the abbreviated reporting period ended December 31, 2021?
The Fund seeks total return through high current income and capital appreciation, investing primarily in fixed income investments while giving special consideration to certain impact and environmental, social and governance (“ESG”) criteria.
During the abbreviated reporting period since its inception on April 27, 2021, the Fund’s common assets have been fully invested in attractively valued, yield-producing fixed income assets. The Fund also began to strategically deploy leverage to enhance the income and total return of the portfolio in the prevailing low rate environment. As of December 31, 2021, the portfolio held approximately 58% in impact investments and 42% in ESG (environmental, social and governance) leaders. Impact investing is focused on an outcome where capital is used to make a tangible impact while ESG focuses on companies that are implementing better standards in their business practices. As the portfolio management team continued to seek attractive candidates to increase exposure to impact holdings, the portfolio was broadly diversified across impact categories as of December 31, 2021. At the sector level, the portfolio was focused primarily on corporate bonds, with opportunistic allocations to commercial mortgage-backed securities (CMBS), preferred securities, bank loans, asset-backed securities (ABS), emerging markets debt and taxable municipal bonds. As noted above, the Fund uses leverage. Leverage is discussed in more detail later in the Fund Leverage Section of this report.
How did the Fund perform during the abbreviated reporting period ended December 31, 2021?
For the abbreviated reporting period since the Fund’s inception on April 27, 2021, the Fund’s portfolio performed in-line with the NPCT Blended Benchmark, which consists of 60% Bloomberg MSCI U.S. Green Bond and 40% Bloomberg U.S. Corporate High Yield Index. For the purposes of this Performance Commentary, references to relative performance are in comparison to the NPCT Blended Benchmark.
The “risk on” sentiment driving fixed income markets in 2021 provided a tailwind to the portfolio’s relative performance during the abbreviated reporting period. Spread sectors, where the portfolio had overweight exposure generally outperformed U.S. Treasuries, in which the portfolio does not make long-term investments. Most of the portfolio’s positive relative performance was driven by its corporate bond exposure. Within this sector, the portfolio’s security selection in banking, communications, transportation and electric utilities contributed positively to relative performance. The portfolio’s corporate bond outperformers included securities in the lower part of the capital structure and higher beta project finance securities that benefited from the market’s risk-on tone (higher beta holdings are those with greater return potential but also greater volatility).
The portfolio’s outperformance was partially offset by the energy sector positions in the portfolio, which were of relatively higher quality and lagged given investors’ search for yield and risk appetite that favored lower-rated investments. A relatively small cash position also detracted during the Fund’s invest-up phase, as the portfolio management team worked to fully invest the Fund into its longer-term holdings. The rising interest rate environment was a headwind to the portfolio’s longer duration positioning relative to the NPCT Blended Benchmark. The portfolio’s longer overall duration is the natural result of portfolio management’s focus on longer maturity bonds, which better align with the longer term nature of the impacts focused on and also offer greater incremental yield.
7
Portfolio Managers’ Comments (continued)
During the current fiscal period, the Fund used cross currency swaps and foreign exchange forwards to hedge its Euro exposure to U.S. dollars and hedge exposure to EUR denominated positions. The cross currency swaps and foreign exchange forwards both had a negligible impact on performance during the reporting period.
Nuveen Mortgage and Income Fund (JLS)
What key strategies were used to manage the Fund during the twelve-month reporting period ended December 31, 2021?
The Fund’s objective is to generate high current income through opportunistic investments in securitized credit. The Fund invests in mortgage-backed securities (MBS), including residential MBS and commercial MBS, and non-mortgage related asset-backed securities (ABS), including but not limited to any asset that generates reliable cash flows, including collateralized loan obligations as well as pools of consumer auto loans, credit card receivables, aircraft leases and maintenance agreements, timeshare agreements, and solar photovoltaics. The Fund uses leverage. Leverage is discussed in more detail later in the Fund Leverage Section of this report.
While the Fund’s core portfolio remained largely intact during the reporting period, the portfolio management team found attractive opportunities to add value, searching for tactical trades and investing proceeds from calls and redemptions in credit risk transfer (CRT) securities (credit risk transfer (CRT) use subordination structures to reduce public risk on mortgage-related securities, offering partial guarantees for loans based on the credit quality of the loan pools), single asset single borrower (SASB) CMBS and collateralized loan obligations (CLOs). The portfolio management team continued to maintain exposure to these relative value opportunities at the end of the reporting period. Additionally, at the end of the reporting period, the portfolio management team placed a greater emphasis on floating rate securities given the outlook for higher rates.
How did the Fund perform during the twelve-month reporting period ended December 31, 2021?
For the twelve-month reporting period ended December 31, 2021, the Fund’s portfolio outperformed the JLS Blended Benchmark, which consists of a 50/50 blend of USD-denominated, investment grade fixed and floating-rate asset backed securities (ABS) and fixed-rate commercial mortgage backed securities (CMBS). For the purposes of this Performance Commentary, references to relative performance are in comparison to the JLS Blended Benchmark.
The main factors that contributed to the portfolio’s relative performance were asset-backed securities (ABS), commercial mortgage-backed securities (CMBS) and residential mortgage-backed securities (RMBS), with CMBS holdings contributing the most to the Fund’s outperformance. While CMBS was the best performing sector, both ABS and RMBS benefited from expectations of a strong post-COVID-19 economic recovery as investors moved into securities expected to benefit from accelerating economic growth. By early February 2021, most credit spreads had reached pre-COVID-19 levels and, in some cases, surpassed those levels. Credit risk transfer (CRT) and non-agency mortgage-backed securities (MBS) were also contributors as credit spreads tightened significantly during the first half of the reporting period, reflecting the market’s conviction in the strength of the U.S. housing market and the likelihood of further credit de-levering through home appreciation and prepayments. Performance moderated during the second half of the reporting period as interest rates increased, the yield curve moved higher and credit spreads narrowed.
8
IMPACT OF THE FUND’S LEVERAGE STRATEGY ON PERFORMANCE
One important factor impacting the common share returns of the Funds relative to their comparative benchmarks was the use of leverage through bank borrowings and reverse repurchase agreements (for NPCT and JLS). The Funds use leverage because our research has shown that, over time, leveraging provides opportunities for additional income. The opportunity arises when short-term rates that the Fund pays on its leveraging instruments are lower than the interest the Fund earns on its portfolio securities that it has bought with the proceeds of that leverage. This has been particularly true in the recent market environment where short-term rates have been low by historical standards.
However, use of leverage can expose Fund common shares to additional price volatility. When a Fund uses leverage, the Fund’s common shares will experience a greater increase in their net asset value if the securities acquired through the use of leverage increase in value, but will also experience a correspondingly larger decline in their net asset value if the securities acquired through leverage decline in value. All this will make the shares’ total return performance more variable over time.
In addition, common share income in levered funds will typically decrease in comparison to unlevered funds when short-term interest rates increase and increase when short-term interest rates decrease. In recent quarters, fund leverage expenses have generally tracked the overall movement of short-term interest rates. While fund leverage expenses are somewhat higher than their recent lows, leverage nevertheless continues to provide the opportunity for incremental common share income, particularly over longer-term periods.
The Funds use of leverage had a positive impact on total return performance during this reporting period.
JGH also continued to use interest rate swap contracts to partially hedge its future interest cost of leverage. The impact of the swap contracts on total return performance was positive during this reporting period largely due to the improvement in mark-to-market values driven by the increase in long-term rates.
9
Fund Leverage (continued)
As of December 31, 2021, the Funds’ percentages of leverage are shown in the accompanying table.
JGH | NPCT | JLS | ||||||||||
Effective Leverage* | 29.20 | % | 35.03 | % | 25.95 | % | ||||||
Regulatory Leverage* | 29.20 | % | 22.81 | % | 6.49 | % | ||||||
| * | Effective leverage is a Fund’s effective economic leverage, and includes both regulatory leverage and the leverage effects of reverse repurchase agreements, certain derivative and other investments in a Fund’s portfolio that increase the Fund’s investment exposure. Regulatory leverage consists of preferred shares issued or borrowings of the Fund. Both of these are part of a Fund’s capital structure. A Fund, however, may from time to time borrow on a typically transient basis in connection with its day-to-day operations, primarily in connection with the need to settle portfolio trades. Such incidental borrowings are excluded from the calculation of a Fund’s effective leverage ratio. Regulatory leverage is subject to asset coverage limits set forth in the Investment Company Act of 1940. |
THE FUND’S LEVERAGE
Bank Borrowings
As noted previously, the Funds employ leverage through the use of bank borrowings. The Funds’ bank borrowing activities are as shown in the accompanying table.
| Current Reporting Period | Subsequent to the Close of the Reporting Period | |||||||||||||||||||||||||||||||||||
| Fund | Outstanding Balance as of January 1, 2021 | Draws | Paydowns | Outstanding Balance as of December 31, 2021 | Average Balance Outstanding | Draws | Paydowns | Outstanding Balance as of February 25, 2022 | ||||||||||||||||||||||||||||
JGH | $ | 149,200,000 | $ | 9,800,000 | — | $ | 159,000,000 | $ | 157,023,014 | $ | — | $ | (7,000,000 | ) | $ | 152,000,000 | ||||||||||||||||||||
NPCT | $ | — | $ | 167,000,000 | — | $ | 167,000,000 | $ | 136,487,805 | $ | — | $ | — | $ | 167,000,000 | |||||||||||||||||||||
JLS | $ | 15,505,000 | $ | 750,000 | $ | (7,800,000 | ) | $ | 8,455,000 | $ | 12,417,740 | $ | 1,750,000 | $ | (1,960,000 | ) | $ | 8,245,000 | ||||||||||||||||||
Refer to Notes to Financial Statements, Note 8 – Fund Leverage for further details.
Reverse Repurchase Agreements
As noted previously, JLS and NPCT use reverse repurchase agreements, in which the Fund sells to a counterparty a security that it holds with a contemporaneous agreement to repurchase the same security at an agreed-upon price and date. The Funds’ transactions in reverse repurchase agreements are as shown in the accompanying table.
| Current Reporting Period | Subsequent to the Close of the Reporting Period | |||||||||||||||||||||||||||||||||||
| Fund | Outstanding Balance as of January 1, 2021 | Sales | Purchases | Outstanding Balance as of December 31, 2021 | Average Balance Outstanding | Sales | Purchases | Outstanding Balance as of February 25, 2022 | ||||||||||||||||||||||||||||
NPCT | $ | — | $ | 432,850,000 | $ | (295,050,000 | ) | $ | 137,800,000 | $ | 89,783,051 | $ | 170,300,000 | $ | (170,300,000 | ) | $ | 137,800,000 | ||||||||||||||||||
JLS | $ | 25,198,132 | $ | 134,213,879 | $ | (125,181,011 | ) | $ | 34,231,000 | $ | 27,726,200 | $ | 23,674,000 | $ | (25,566,000 | ) | $ | 32,339,000 | ||||||||||||||||||
Refer to Notes to Financial Statements, Note 8 – Fund Leverage for further details.
10
Information
COMMON SHARE DISTRIBUTION INFORMATION FOR JGH AND JLS
The following information regarding the distributions for JGH and JLS are current as of December 31, 2021, the Funds’ fiscal and tax year end and may differ from previously issued distribution notifications.
Effective with each Fund’s March 2021 distribution, the Funds implemented a level distribution program. The goal of the level distribution program is to provide shareholders with stable, but not guaranteed, cash flow, independent of the amount or timing of income earned or capital gains realized by the Funds. The Funds intend to distribute all or substantially all of their net investment income through their regular monthly distribution and to distribute realized capital gains at least annually. In any monthly period, in order to maintain its level distribution amount, each Fund may pay out more or less than its net investment income during the period. As a result, regular distributions throughout the year are expected to include net investment income and potentially a return of capital or capital gains for tax purposes. You should not draw any conclusions about the Fund’s investment performance from the amount of the distribution or from the terms of the level distribution program. A return of capital is a non-taxable distribution of a portion of a Fund’s capital. A return of capital distribution does not necessarily reflect a Fund’s investment performance and should not be confused with “yield” or “income.”
The amounts and sources of distributions reported in this notice are for financial reporting purposes and are not being provided for tax reporting purposes. The actual amounts and character of the distributions for tax reporting purposes will be reported to shareholders on Form 1099-DIV, which will be sent to shareholders shortly after calendar year-end. Because distribution source estimates are updated throughout the current fiscal year based on a Fund’s performance, those estimates may differ from both the tax information reported to you in your Fund’s 1099 statement, as well as the ultimate economic sources of distributions over the life of your investment. The figures in the table below provide the sources of distributions and may include amounts attributed to realized gains and/or returns of capital. More details about each Fund’s distributions are available on www.nuveen.com/en-us/closed-end-funds.
Data as of December 31, 2021
| Current Month Percentage of Distributions |
| Fiscal YTD Per Share Amounts | ||||||||||||||||||||||||||||||
| Fund | Net Investment Income | Realized Gains | Return of Capital | Total Distributions | Net Investment Income | Realized Gains | Return of Capital | |||||||||||||||||||||||||
JGH | 75.38 | % | 0.00 | % | 24.62 | % | $ | 1.3010 | $ | 0.9807 | $ | 0.0000 | $ | 0.3203 | ||||||||||||||||||
JLS | 87.46 | % | 0.00 | % | 12.54 | % | $ | 0.9660 | $ | 0.8449 | $ | 0.0000 | $ | 0.1211 | ||||||||||||||||||
11
Common Share Information (continued)
The following table provides information regarding Fund distributions and total return performance over various time periods. This information is intended to help you better understand whether Fund returns for the specified time periods were sufficient to meet Fund distributions.
Data as of December 31, 2021
| Annualized | Cumulative | |||||||||||||||||||||||||||||||||||
| Fund | Inception Date | Latest Monthly | Current Distribution on NAV | 1-Year Return on NAV | 5-Year Return on NAV | Fiscal YTD Distributions on NAV | Fiscal YTD Return on NAV | |||||||||||||||||||||||||||||
JGH | 11/24/2014 | $0.1130 | 8.15% | 5.82% | 6.23% | 7.82% | 5.82% | |||||||||||||||||||||||||||||
JLS | 11/25/2009 | $0.0830 | 4.49% | 4.47% | 4.96% | 4.35% | 4.47% | |||||||||||||||||||||||||||||
COMMON SHARE DISTRIBUTION INFORMATION FOR NPCT
The following information regarding the Fund’s distributions is current as of December 31, 2021, the Fund’s fiscal and tax year end, and may differ from previously issued distribution notifications. This notice provides shareholders with information regarding fund distributions, as required by current securities laws. You should not draw any conclusions about the Fund’s investment performance from the amount of the distribution or from the terms of the Fund’s Managed Distribution Policy.
The Fund may in certain periods distribute more than its income and net realized capital gains, and the Fund currently estimates that it has done so for the fiscal year-to-date period. In such instances, a portion of the distribution may be a return of capital. A return of capital may occur, for example, when some or all of the money that you invested in the Fund is paid back to you. A return of capital distribution does not necessarily reflect the Fund’s investment performance and should not be confused with “yield” or “income.”
The amounts and sources of distributions reported in this notice are for financial reporting purposes and are not being provided for tax reporting purposes. The actual amounts and character of the distributions for tax reporting purposes will be reported to shareholders on Form 1099-DIV which will be sent to shareholders shortly after calendar year-end. More details about the Fund’s distributions and the basis for these estimates are available on www.nuveen.com/cef.
The following tables provide information regarding the Fund’s common share distributions and total return performance for the fiscal year ended December 31, 2021. This information is intended to help you better understand whether the Funds’ returns for the specified time period were sufficient to meet its distributions.
Data as of December 31, 2021
| Fiscal YTD | |||||||||||||||||||||||||||||||||||||||||||
| Per Share Sources of Distribution |
| Percentage of the Distribution | |||||||||||||||||||||||||||||||||||||||||
| Fund | Per Share Distribution | Net Investment Income | Long-Term Gains | Short-Term Gains | Return of Capital1 | Net Investment Income | Long-Term Gains | Short-Term Gains | Return of Capital1 | |||||||||||||||||||||||||||||||||||
NPCT (FYE 12/31) | $0.7210 | $0.3584 | $0.0000 | $0.0322 | $0.3304 | 49.70% | 0.00% | 4.47% | 45.83% | |||||||||||||||||||||||||||||||||||
| Annualized |
| Cumulative | |||||||||||||||||||||||||||||||||||||
| Fund | Inception Date | Latest Monthly Distribution | Fiscal YTD Distribution | Net Asset Value (NAV) | Since Inception Return on NAV | Fiscal YTD Distribution Rate on NAV | Fiscal YTD Return on NAV | Fiscal YTD Distribution Rate on NAV | ||||||||||||||||||||||||||||||||
NPCT (FYE 12/31) | 4/27/2021 | $0.1030 | $0.7210 | $19.66 | 1.90% | 3.67% | 1.90% | 3.67% | ||||||||||||||||||||||||||||||||
| 1 | Return of Capital may represent unrealized gains, return of shareholder’s principal, or both. In certain circumstances, all or a portion of the return of capital may be characterized as ordinary income under federal tax law. The actual tax characterization will be provided to shareholders on Form 1099-DIV shortly after calendar year-end. |
12
NUVEEN CLOSED-END FUND DISTRIBUTION AMOUNTS
The Nuveen Closed-End Funds’ monthly and quarterly periodic distributions to shareholders are posted on www.nuveen.com and can be found on Nuveen’s enhanced closed-end fund resource page, which is at https://www.nuveen.com/resource-center-closed-end-funds, along with other Nuveen closed-end fund product updates. To ensure timely access to the latest information, shareholders may use a subscribe function, which can be activated at this web page (https://www.nuveen.com/subscriptions).
COMMON SHARE REPURCHASES
During August 2021, the Funds’ Board of Trustees reauthorized JGH and JLS and authorized NPCT to participate in an open-market common share repurchase program, allowing each Fund to repurchase an aggregate of up to approximately 10% of its outstanding common shares.
As of December 31, 2021, and since the inception of the Funds’ repurchase program, the Funds have cumulatively repurchased and retired its outstanding common shares as shown in the accompanying table.
| JGH | NPCT | JLS | ||||||||||
Common shares cumulatively repurchased and retired | 900,000 | — | — | |||||||||
Common shares authorized for repurchase | 2,315,000 | 2,875,000 | 545,000 | |||||||||
During the current reporting period, the Funds did not repurchase any of their outstanding common shares.
OTHER COMMON SHARE INFORMATION
As of December 31, 2021, the Funds’ common share prices were trading at a premium/(discount) to their common share NAVs and trading at an average premium/(discount) to NAV during the current reporting period, as follows:
| JGH | NPCT | JLS | ||||||||||
Common share NAV | $ | 16.63 | $ | 19.66 | $ | 22.19 | ||||||
Common share price | $ | 15.88 | $ | 18.30 | $ | 20.96 | ||||||
Premium/(Discount) to NAV | (4.51 | )% | (6.92 | )% | (5.54 | )% | ||||||
Average premium/(discount) to NAV | (6.62 | )% | (4.18 | )% | (7.42 | )% | ||||||
13
| JGH | Nuveen Global High Income Fund Performance Overview and Holding Summaries as of December 31, 2021 |
Refer to the Glossary of Terms Used in this Report for further definition of the terms used within this section.
Average Annual Total Returns as of December 31, 2021
| Average Annual | ||||||||||||
| 1-Year | 5-Year | Since Inception | ||||||||||
| JGH at Common Share NAV | 5.82% | 6.23% | 5.25% | |||||||||
| JGH at Common Share Price | 10.84% | 8.48% | 6.93% | |||||||||
| Bloomberg Global High Yield Index (USD Hedged)1 | 2.53% | 5.32% | 5.48% | |||||||||
Since inception returns are from 11/24/14. Past performance is not predictive of future results. Current performance may be higher or lower than the data shown. Returns do not reflect the deduction of taxes that shareholders may have to pay on Fund distributions or upon the sale of Fund shares. Returns at NAV are net of Fund expenses, and assume reinvestment of distributions. Comparative index return information is provided for the Fund’s shares at NAV only. Indexes are not available for direct investment.
Daily Common Share NAV and Share Price
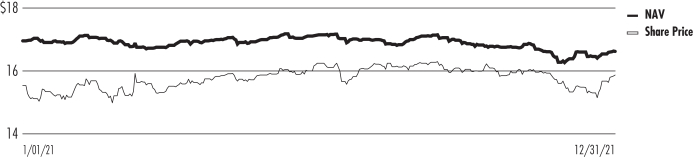
Growth of an Assumed $10,000 Investment as of December 31, 2021 — Common Share Price
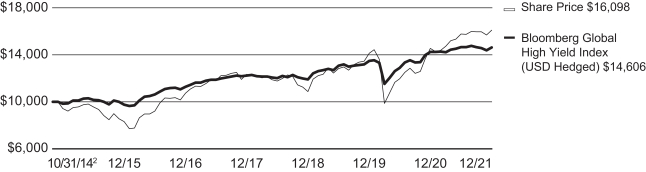
| 1 | For purposes of Fund performance, relative results are measured against this benchmark/index. |
| 2 | Value on 10/31/14 is $20, which represents the Fund’s public offering price. Nuveen Fund Advisors, LLC reimbursed the Fund for any sales load and offering expenses. |
14
This data relates to the securities held in the Fund’s portfolio of investments as of the end of the reporting period. It should not be construed as a measure of performance for the Fund itself. Holdings are subject to change.
The Fund uses credit quality ratings for its portfolio securities provided by Standard & Poor’s Group, Moody’s Investors Service, Inc. and Fitch, Inc. If all three provide a rating for a security, the middle is used; if two of the three agencies rate a security, the lower rating is used; and if only one rating agency rates a security, that rating is used. This treatment of split-rated securities may differ from that used for other purposes, such as for Fund investment policies. Credit ratings are subject to change. AAA, AA, A and BBB are investment grade ratings; BB, B, CCC, CC, C and D are below-investment grade ratings. Holdings designated N/R are not rated by these national rating agencies.
Fund Allocation
(% of net assets)
| Corporate Bonds | 91.0% | |||
| Sovereign Debt | 16.3% | |||
| Variable Rate Senior Loan Interests | 12.8% | |||
| $1,000 Par (or similar) Institutional Preferred | 8.3% | |||
| Contingent Capital Securities | 6.4% | |||
| $25 Par (or similar) Retail Preferred | 1.5% | |||
| Repurchase Agreements | 2.8% | |||
| Other Assets Less Liabilities | 2.1% | |||
Net Assets Plus Borrowings | 141.2% | |||
| Borrowings | (41.2)% | |||
Net Assets | 100.0% |
Top Five Issuers
(% of total investments)
| Albion Financing 2SARL | 1.0% | |||
| Presidio Holdings Inc | 1.0% | |||
| Petroleos Mexicanos | 0.9% | |||
| SunCoke Energy Inc | 0.8% | |||
| Ferrellgas LP / Ferrellgas Finance Corp | 0.8% |
Portfolio Composition
(% of total investments)
| Oil, Gas & Consumable Fuels | 12.3% | |||
| Sovereign Debt | 11.8% | |||
| Banks | 6.0% | |||
| Specialty Retail | 5.1% | |||
| Health Care Providers & Services | 4.0% | |||
| Chemicals | 4.0% | |||
| Commercial Services & Supplies | 4.0% | |||
| Media | 3.5% | |||
| Diversified Telecommunication Services | 3.5% | |||
| IT Services | 3.3% | |||
| Insurance | 3.2% | |||
| Auto Components | 2.7% | |||
| Capital Markets | 2.6% | |||
| Pharmaceuticals | 2.5% | |||
| Metals & Mining | 2.4% | |||
| Hotels, Restaurants & Leisure | 2.3% | |||
| Software | 2.1% | |||
| Beverages | 1.6% | |||
| Independent Power & Renewable Electricity Producers | 1.5% | |||
| Real Estate Management & Development | 1.4% | |||
| Other1 | 18.2% | |||
| Repurchase Agreements | 2.0% | |||
Total | 100.0% |
Portfolio Credit Quality
(% of total long-term investments)
| BBB | 5.9% | |||
| BB or Lower | 93.2% | |||
| N/R (not rated) | 0.9% | |||
Total | 100% |
Country Allocation2
(% of total investments)
| United States | 57.9% | |||
| Canada | 4.4% | |||
| Brazil | 2.7% | |||
| Mexico | 2.2% | |||
| United Kingdom | 2.1% | |||
| France | 2.1% | |||
| Turkey | 1.9% | |||
| Colombia | 1.6% | |||
| Spain | 1.6% | |||
| Luxembourg | 1.4% | |||
| Israel | 1.2% | |||
| Germany | 1.1% | |||
| Dominican Republic | 1.1% | |||
| Oman | 1.0% | |||
| Other3 | 17.7% | |||
Total | 100.0% |
| 1 | See Portfolio of Investments for the remaining industries comprising “other” and not listed in the Portfolio Composition above. |
| 2 | Includes 23.5% (as a percentage of total investments) in emerging market countries. |
| 3 | “Other” countries include Forty-one countries that individually constitute less than 1% as a percentage of total investments. |
15
| NPCT | Nuveen Core Plus Impact Fund Performance Overview and Holding Summaries as of December 31, 2021 |
Refer to Glossary of Terms Used in this Report for further definition of terms used in this section.
Cumulative Total Returns as of December 31, 2021
| Since Inception | ||||
| NPCT at Common Share NAV | 1.90% | |||
| NPCT at Common Share Price | (4.96)% | |||
| Bloomberg U.S. Aggregate Bond Index | 1.19% | |||
| NPCT Blended Benchmark1,2 | 1.91% | |||
Since inception returns are from 4/27/21. Past performance is not predictive of future results. Current performance may be higher or lower than the data shown. Returns do not reflect the deduction of taxes that shareholders may have to pay on Fund distributions or upon the sale of Fund shares. Returns at NAV are net of Fund expenses, and assume reinvestment of distributions. Comparative index return information is provided for the Fund’s shares at NAV only. Indexes are not available for direct investment.
Daily Common Share NAV and Share Price
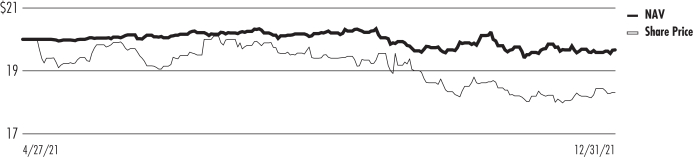
Growth of an Assumed $10,000 Investment as of December 31, 2021 — Common Share Price

| 1 | For purposes of Fund performance, relative results are measured against this benchmark/index. |
| 2 | NPCT Blended Benchmark consists of: 1) 60% of the return of the Bloomberg MSCI U.S. Green Bond Index and 2) 40% of the return of the Bloomberg U.S. Corporate High Yield Bond Index. |
| 3 | Value on 4/27/21 is $20, which represents the Fund’s public offering price. Nuveen Fund Advisors, LLC reimbursed the Fund for any sales load and offering expenses. |
16
This data relates to the securities held in the Fund’s portfolio of investments as of the end of the reporting period. It should not be construed as a measure of performance for the Fund itself. Holdings are subject to change.
The Fund uses credit quality ratings for its portfolio securities provided by Standard & Poor’s Group, Moody’s Investors Service, Inc. and Fitch, Inc. If all three provide a rating for a security, the middle is used; if two of the three agencies rate a security, the lower rating is used; and if only one rating agency rates a security, that rating is used. This treatment of split-rated securities may differ from that used for other purposes, such as for Fund investment policies. Credit ratings are subject to change. AAA, AA, A and BBB are investment grade ratings; BB, B, CCC, CC, C and D are below-investment grade ratings. Holdings designated N/R are not rated by these national rating agencies.
Fund Allocation
(% of net assets)
| Corporate Bonds | 90.8% | |||
| $1,000 Par (or similar) Institutional Preferred | 23.3% | |||
| Asset-Backed Securities | 10.3% | |||
| $25 Par (or similar) Retail Preferred | 9.3% | |||
| Mortgage-Backed Securities | 7.3% | |||
| Sovereign Debt | 6.9% | |||
| Municipal Bonds | 2.5% | |||
| Variable Rate Senior Loan Interests | 2.4% | |||
| Repurchase Agreements | 0.2% | |||
| Other Assets Less Liabilities | 0.9% | |||
| Net Assets Plus Borrowings and Reverse Repurchase Agreements | 153.9% | |||
| Borrowings | (29.5)% | |||
| Reverse Repurchase Agreements | (24.4)% | |||
Net Assets | 100% |
Portfolio Composition
(% of total investments)
| Electric Utilities | 12.9% | |||
| Banks | 12.3% | |||
| Independent Power & Renewable Electricity Producers | 8.5% | |||
| Mortgage-Backed Securities | 6.2% | |||
| Asset-Backed Securities | 5.3% | |||
| Trading Companies & Distributors | 4.6% | |||
| Gas Utilities | 4.0% | |||
| Sovereign Debt | 3.9% | |||
| Oil, Gas & Consumable Fuels | 3.8% | |||
| Equity Real Estate Investment Trust | 3.8% | |||
| Insurance | 3.4% | |||
| Multi-Utilities | 3.1% | |||
| Road & Rail | 2.6% | |||
| Automobiles | 2.3% | |||
| Chemicals | 2.2% | |||
| Capital Markets | 1.8% | |||
| Communications Equipment | 1.8% | |||
| Other1 | 17.4% | |||
| Repurchase Agreements | 0.1% | |||
Total | 100% |
Portfolio Credit Quality
(% of total long-term investments)
| AA | 0.8% | |||
| A | 6.3% | |||
| BBB | 51.6% | |||
| BB or Lower | 33.0% | |||
| N/R (not rated) | 8.3% | |||
Total | 100% |
Country Allocation2
(% of total investments)
| United States | 62.4% | |||
| Italy | 3.9% | |||
| Chile | 3.9% | |||
| United Kingdom | 3.8% | |||
| Canada | 3.0% | |||
| India | 2.8% | |||
| Australia | 2.4% | |||
| Indonesia | 2.3% | |||
| Bermuda | 2.0% | |||
| Switzerland | 1.9% | |||
| Mexico | 1.8% | |||
| Other3 | 9.8% | |||
Total | 100% |
| 1 | See Portfolio of Investments for the remaining industries comprising “other” and not listed in the Portfolio Composition above. |
| 2 | Includes 16.3% (as a percentage of total investments) in emerging market countries. |
| 3 | “Other” countries include Seven countries that individually constitute less than 1.8% as a percentage of total investments. |
17
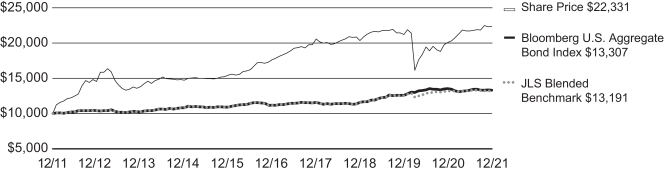
| JLS | Nuveen Mortgage and Income Fund Performance Overview and Holding Summaries as of December 31, 2021 |
Refer to Glossary of Terms Used in this Report for further definition of terms used in this section.
Average Annual Total Returns as of December 31, 2021
| Average Annual | ||||||||||||
| 1-Year | 5-Year | 10-Year | ||||||||||
| JLS at Common Share NAV | 4.47% | 4.96% | 7.80% | |||||||||
| JLS at Common Share Price | 11.02% | 4.83% | 8.37% | |||||||||
| Bloomberg U.S. Aggregate Bond Index | (1.54)% | 3.57% | 2.90% | |||||||||
| JLS Blended Benchmark1,2 | 0.05% | 3.39% | 2.81% | |||||||||
Performance prior to October 14, 2019, reflects the Fund’s performance under the management of a sub-adviser using investment strategies that differed from those currently in place. Past performance is not predictive of future results. Current performance may be higher or lower than the data shown. Returns do not reflect the deduction of taxes that shareholders may have to pay on Fund distributions or upon the sale of Fund shares. Returns at NAV are net of Fund expenses, and assume reinvestment of distributions. Comparative index return information is provided for the Fund’s shares at NAV only. Indexes are not available for direct investment.
Daily Common Share NAV and Share Price
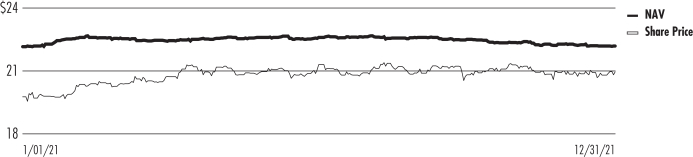
Growth of an Assumed $10,000 Investment as of December 31, 2021 — Common Share Price
| 1 | For purposes of Fund performance, relative results are measured against this benchmark/index. |
| 2 | JLS Blended Benchmark (ICE BofA U.S. ABS & CMBS Index) consists of a 50/50 blend of USD-denominated, investment grade fixed and floating-rate asset backed securities (ABS) and fixed-rate commercial mortgage backed securities (CMBS) publicly issued in the U.S. Prior to October 14, 2019, the Fund’s performance was measured against the Bloomberg U.S. Aggregate Bond Index. |
18
This data relates to the securities held in the Fund’s portfolio of investments as of the end of the reporting period. It should not be construed as a measure of performance for the Fund itself. Holdings are subject to change.
For financial reporting purposes, the ratings disclosed are the highest rating given by one of the following national rating agencies: Standard & Poor’s Group, Moody’s Investors Service, Inc. or Fitch, Inc. This treatment of split-rated securities may differ from that used for other purposes, such as for Fund investment policies. Credit ratings are subject to change. AAA, AA, A and BBB are investment grade ratings; BB, B, CCC, CC, C and D are below-investment grade ratings. Holdings designated N/R are not rated by these national rating agencies.
Fund Allocation
(% of net assets)
| Mortgage-Backed Securities | 93.5% | |||
| Asset-Backed Securities | 41.5% | |||
| U.S. Government and Agency Obligations | 0.2% | |||
| Other Assets Less Liabilities | (0.1)% | |||
Net Assets Plus Borrowings and Reverse Repurchase Agreements | 135.1% | |||
| Borrowings | (6.9)% | |||
| Reverse Repurchase Agreements | (28.2)% | |||
Net Assets | 100% |
Portfolio Credit Quality
(% of total investments)
| U.S. Treasury/Agency | 0.1% | |||
| AAA | 2.9% | |||
| AA | 1.6% | |||
| A | 10.3% | |||
| BBB | 18.7% | |||
| BB or Lower | 36.3% | |||
| N/R (not rated) | 30.1% | |||
Total | 100% |
19
Report of Independent Registered Public Accounting Firm
To the Board of Trustees and Shareholders of
Nuveen Global High Income Fund,
Nuveen Core Plus Impact Fund and
Nuveen Mortgage and Income Fund
Opinions on the Financial Statements
We have audited the accompanying statements of assets and liabilities, including the portfolios of investments, of Nuveen Global High Income Fund, Nuveen Core Plus Impact Fund and Nuveen Mortgage and Income Fund (hereafter collectively referred to as the “Funds”) as of December 31, 2021, the related statements of operations and cash flows for the year ended December 31, 2021 (or for Nuveen Core Plus Impact Fund, for the period April 27, 2021 (commencement of operations) through December 31, 2021), the statements of changes in net assets for each of the two years in the period ended December 31, 2021 (or for Nuveen Core Plus Impact Fund, for the period April 27, 2021 (commencement of operations) through December 31, 2021), including the related notes, and the financial highlights for each of the periods indicated therein (collectively referred to as the “financial statements”). In our opinion, the financial statements present fairly, in all material respects, the financial position of each of the Funds as of December 31, 2021, the results of each of their operations and each of their cash flows for the year then ended (or for Nuveen Core Plus Impact Fund, for the period April 27, 2021 (commencement of operations) through December 31, 2021), the changes in each of their net assets for each of the two years in the period ended December 31, 2021 (or for Nuveen Core Plus Impact Fund, for the period April 27, 2021 (commencement of operations) through December 31, 2021) and each of the financial highlights for each of the periods indicated therein in conformity with accounting principles generally accepted in the United States of America.
Basis for Opinions
These financial statements are the responsibility of the Funds’ management. Our responsibility is to express an opinion on the Funds’ financial statements based on our audits. We are a public accounting firm registered with the Public Company Accounting Oversight Board (United States) (PCAOB) and are required to be independent with respect to the Funds in accordance with the U.S. federal securities laws and the applicable rules and regulations of the Securities and Exchange Commission and the PCAOB.
We conducted our audits of these financial statements in accordance with the standards of the PCAOB. Those standards require that we plan and perform the audit to obtain reasonable assurance about whether the financial statements are free of material misstatement, whether due to error or fraud.
Our audits included performing procedures to assess the risks of material misstatement of the financial statements, whether due to error or fraud, and performing procedures that respond to those risks. Such procedures included examining, on a test basis, evidence regarding the amounts and disclosures in the financial statements. Our audits also included evaluating the accounting principles used and significant estimates made by management, as well as evaluating the overall presentation of the financial statements. Our procedures included confirmation of securities owned as of December 31, 2021 by correspondence with the custodian, brokers and agent banks; when replies were not received from brokers or agent banks, we performed other auditing procedures. We believe that our audits provide a reasonable basis for our opinions.
/s/ PricewaterhouseCoopers LLP
Chicago, Illinois
February 28, 2022
We have served as the auditor of one or more investment companies in Nuveen Funds since 2002.
20
| JGH | Nuveen Global High Income Fund
Portfolio of Investments December 31, 2021 |
| Principal Amount (000) | Description (1) | Coupon | Maturity | Ratings (2) | Value | |||||||||||||||||||||||
LONG-TERM INVESTMENTS – 136.3% (98.0% of Total Investments) |
| |||||||||||||||||||||||||||
CORPORATE BONDS – 91.0% (65.4% of Total Investments) |
| |||||||||||||||||||||||||||
| Aerospace & Defense – 0.1% | ||||||||||||||||||||||||||||
| $ | 475 | Embraer Netherlands Finance BV, 144A | 6.950% | 1/17/28 | BB+ | $ | 524,400 | |||||||||||||||||||||
| Air Freight & Logistics – 0.1% | ||||||||||||||||||||||||||||
| 500 | Cargo Aircraft Management Inc, 144A | 4.750% | 2/01/28 | BB | 508,860 | |||||||||||||||||||||||
| Airlines – 0.3% | ||||||||||||||||||||||||||||
| 1,000 | Aerovias de Mexico SA de CV, 144A, (3) | 7.000% | 2/05/25 | D | 957,500 | |||||||||||||||||||||||
| 3,000 | Virgin Australia Holdings Pty Ltd, 144A, (3) | 7.875% | 10/15/22 | N/R | 127,500 | |||||||||||||||||||||||
| 4,000 | Total Airlines | 1,085,000 | ||||||||||||||||||||||||||
| Auto Components – 3.1% | ||||||||||||||||||||||||||||
| 2,000 | Adient Global Holdings Ltd, 144A | 4.875% | 8/15/26 | B | 2,040,000 | |||||||||||||||||||||||
| 650 | Dana Inc | 4.250% | 9/01/30 | BB+ | 658,937 | |||||||||||||||||||||||
| 1,025 | Goodyear Tire & Rubber Co, 144A | 5.000% | 7/15/29 | BB– | 1,101,055 | |||||||||||||||||||||||
| 3,000 | Goodyear Tire & Rubber Co | 5.250% | 4/30/31 | BB– | 3,261,030 | |||||||||||||||||||||||
| 3,000 | IHO Verwaltungs GmbH, 144A, (cash 6.375%, PIK 7.125%) | 6.375% | 5/15/29 | Ba2 | 3,225,000 | |||||||||||||||||||||||
| 1,610 | PECF USS Intermediate Holding III Corp, 144A | 8.000% | 11/15/29 | CCC | 1,667,155 | |||||||||||||||||||||||
| 11,285 | Total Auto Components | 11,953,177 | ||||||||||||||||||||||||||
| Banks – 1.1% | ||||||||||||||||||||||||||||
| 875 | Access Bank PLC, 144A | 6.125% | 9/21/26 | B2 | 870,625 | |||||||||||||||||||||||
| 1,000 | Akbank TAS, 144A | 6.800% | 2/06/26 | B+ | 962,860 | |||||||||||||||||||||||
| 1,250 | Grupo Aval Ltd, 144A | 4.375% | 2/04/30 | BB+ | 1,198,438 | |||||||||||||||||||||||
| 1,525 | Turkiye Vakiflar Bankasi TAO, 144A | 5.500% | 10/01/26 | B+ | 1,354,834 | |||||||||||||||||||||||
| 4,650 | Total Banks | 4,386,757 | ||||||||||||||||||||||||||
| Beverages – 1.8% | ||||||||||||||||||||||||||||
| 3,500 | Primo Water Holdings Inc, 144A | 4.375% | 4/30/29 | B1 | 3,465,000 | |||||||||||||||||||||||
| 3,425 | Triton Water Holdings Inc, 144A | 6.250% | 4/01/29 | CCC+ | 3,284,917 | |||||||||||||||||||||||
| 6,925 | Total Beverages | 6,749,917 | ||||||||||||||||||||||||||
| Biotechnology – 0.4% | ||||||||||||||||||||||||||||
| 1,500 | Emergent BioSolutions Inc, 144A | 3.875% | 8/15/28 | BB– | 1,439,655 | |||||||||||||||||||||||
| Building Products – 0.5% | ||||||||||||||||||||||||||||
| 625 | Cemex SAB de CV, 144A | 5.125% | 9/08/70 | B+ | 646,875 | |||||||||||||||||||||||
| 1,265 | SRS Distribution Inc, 144A | 6.000% | 12/01/29 | CCC | 1,271,325 | |||||||||||||||||||||||
| 1,890 | Total Building Products | 1,918,200 | ||||||||||||||||||||||||||
| Capital Markets – 1.0% | ||||||||||||||||||||||||||||
| 1,500 | Banco BTG Pactual SA/Cayman Islands, 144A | 2.750% | 1/11/26 | Ba2 | 1,423,140 | |||||||||||||||||||||||
| 600 | Compass Group Diversified Holdings LLC, 144A | 5.250% | 4/15/29 | B+ | 628,500 | |||||||||||||||||||||||
| 1,900 | LPL Holdings Inc, 144A | 4.375% | 5/15/31 | BB | 1,943,481 | |||||||||||||||||||||||
| 4,000 | Total Capital Markets | 3,995,121 | ||||||||||||||||||||||||||
| Chemicals – 5.4% | ||||||||||||||||||||||||||||
| 1,000 | Calumet Specialty Products Partners LP / Calumet Finance Corp, 144A | 11.000% | 4/15/25 | B– | 1,078,750 | |||||||||||||||||||||||
| 2,275 | Consolidated Energy Finance SA, 144A | 5.625% | 10/15/28 | B+ | 2,223,812 | |||||||||||||||||||||||
| 1,905 | EverArc Escrow Sarl, 144A | 0.000% | 10/30/29 | B+ | 1,906,410 | |||||||||||||||||||||||
| 600 | OCP SA, 144A | 5.125% | 6/23/51 | BB+ | 565,929 | |||||||||||||||||||||||
| 1,960 | Olympus Water US Holding Corp, 144A | 4.250% | 10/01/28 | B2 | 1,948,985 | |||||||||||||||||||||||
| 2,160 | Olympus Water US Holding Corp, 144A | 6.250% | 10/01/29 | CCC+ | 2,106,000 | |||||||||||||||||||||||
| 2,711 | Rayonier AM Products Inc, 144A | 7.625% | 1/15/26 | B+ | 2,873,660 | |||||||||||||||||||||||
| 1,500 | Sasol Financing USA LLC | 5.500% | 3/18/31 | BB | 1,512,750 | |||||||||||||||||||||||
21
| JGH | Nuveen Global High Income Fund (continued) | |
| Portfolio of Investments December 31, 2021 | ||
| Principal Amount (000) | Description (1) | Coupon | Maturity | Ratings (2) | Value | |||||||||||||||||||||||
| Chemicals (continued) | ||||||||||||||||||||||||||||
| $ | 2,000 | Trinseo Materials Operating SCA / Trinseo Materials Finance Inc, 144A | 5.125% | 4/01/29 | B | $ | 2,040,000 | |||||||||||||||||||||
| 1,600 | Tronox Inc, 144A | 4.625% | 3/15/29 | B | 1,598,000 | |||||||||||||||||||||||
| 905 | Unifrax Escrow Issuer Corp, 144A | 5.250% | 9/30/28 | BB | 914,729 | |||||||||||||||||||||||
| 525 | Unifrax Escrow Issuer Corp, 144A | 7.500% | 9/30/29 | CCC+ | 530,250 | |||||||||||||||||||||||
| 380 | WR Grace Holdings LLC, 144A | 4.875% | 6/15/27 | BB+ | 390,309 | |||||||||||||||||||||||
| 1,005 | WR Grace Holdings LLC, 144A | 5.625% | 8/15/29 | B+ | 1,028,869 | |||||||||||||||||||||||
| 20,526 | Total Chemicals | 20,718,453 | ||||||||||||||||||||||||||
| Commercial Services & Supplies – 4.5% | ||||||||||||||||||||||||||||
| 1,750 | ADT Security Corp, 144A | 4.125% | 8/01/29 | BB– | 1,723,750 | |||||||||||||||||||||||
| 1,275 | ADT Security Corp, 144A | 4.875% | 7/15/32 | BB– | 1,301,769 | |||||||||||||||||||||||
| 2,000 | Allied Universal Holdco LLC/Allied Universal Finance Corp/Atlas Luxco 4 Sarl, 144A | 4.625% | 6/01/28 | B | 1,998,760 | |||||||||||||||||||||||
| 500 | Covert Mergeco Inc, 144A | 4.875% | 12/01/29 | B1 | 507,500 | |||||||||||||||||||||||
| 1,500 | Garda World Security Corp, 144A | 4.625% | 2/15/27 | BB+ | 1,492,500 | |||||||||||||||||||||||
| 2,170 | GFL Environmental Inc, 144A | 4.750% | 6/15/29 | B– | 2,188,987 | |||||||||||||||||||||||
| 1,400 | LABL Inc, 144A | 5.875% | 11/01/28 | B2 | 1,442,875 | |||||||||||||||||||||||
| 1,000 | LABL Inc, 144A | 8.250% | 11/01/29 | CCC+ | 1,005,550 | |||||||||||||||||||||||
| 2,000 | Pitney Bowes Inc, 144A | 6.875% | 3/15/27 | N/R | 2,077,000 | |||||||||||||||||||||||
| 2,500 | Pitney Bowes Inc, 144A | 7.250% | 3/15/29 | BB | 2,568,750 | |||||||||||||||||||||||
| 1,100 | Prime Security Services Borrower LLC / Prime Finance Inc, 144A | 6.250% | 1/15/28 | B– | 1,146,750 | |||||||||||||||||||||||
| 17,195 | Total Commercial Services & Supplies | 17,454,191 | ||||||||||||||||||||||||||
| Communications Equipment – 0.3% | ||||||||||||||||||||||||||||
| 1,325 | Gray Television Inc, 144A | 4.750% | 10/15/30 | BB– | 1,316,719 | |||||||||||||||||||||||
| Construction Materials – 0.6% | ||||||||||||||||||||||||||||
| 900 | Cemex SAB de CV, 144A | 7.375% | 6/05/27 | BB | 990,909 | |||||||||||||||||||||||
| 750 | Cemex SAB de CV, 144A | 3.875% | 7/11/31 | BB | 747,247 | |||||||||||||||||||||||
| 450 | Volcan Cia Minera SAA, 144A | 4.375% | 2/11/26 | BB | 433,688 | |||||||||||||||||||||||
| 2,100 | Total Construction Materials | 2,171,844 | ||||||||||||||||||||||||||
| Consumer Finance – 0.5% | ||||||||||||||||||||||||||||
| 2,010 | Capital One Financial Corp | 3.950% | 9/01/70 | Baa3 | 2,020,050 | |||||||||||||||||||||||
| Containers & Packaging – 0.5% | ||||||||||||||||||||||||||||
| 900 | Ardagh Metal Packaging Finance USA LLC / Ardagh Metal Packaging Finance PLC, 144A | 4.000% | 9/01/29 | BB– | 891,675 | |||||||||||||||||||||||
| 945 | Pactiv Evergreen Group Issuer Inc/Pactiv Evergreen Group Issuer LLC/Reynolds Gro, 144A | 4.375% | 9/30/28 | B+ | 937,913 | |||||||||||||||||||||||
| 1,845 | Total Containers & Packaging | 1,829,588 | ||||||||||||||||||||||||||
| Diversified Financial Services – 1.0% | ||||||||||||||||||||||||||||
| 2,000 | Compass Group Diversified Holdings LLC, 144A | 5.000% | 1/15/32 | B+ | 2,050,000 | |||||||||||||||||||||||
| 1,125 | Genesis Energy LP / Genesis Energy Finance Corp | 7.750% | 2/01/28 | B | 1,133,437 | |||||||||||||||||||||||
| 815 | Mexico Remittances Funding Fiduciary Estate Management Sarl, 144A | 4.875% | 1/15/28 | BB+ | 759,996 | |||||||||||||||||||||||
| 3,940 | Total Diversified Financial Services | 3,943,433 | ||||||||||||||||||||||||||
| Diversified Telecommunication Services – 4.9% | ||||||||||||||||||||||||||||
| 3,825 | Altice France SA/France, 144A | 5.125% | 7/15/29 | B | 3,731,096 | |||||||||||||||||||||||
| 1,830 | Altice France SA/France, 144A | 5.500% | 10/15/29 | B | 1,802,550 | |||||||||||||||||||||||
| 2,285 | Directv Financing LLC / Directv Financing Co-Obligor Inc, 144A | 5.875% | 8/15/27 | BBB– | 2,339,177 | |||||||||||||||||||||||
| 1,905 | Frontier Communications Holdings LLC, 144A | 6.000% | 1/15/30 | BB– | 1,914,525 | |||||||||||||||||||||||
| 1,155 | Iliad Holding SASU, 144A | 6.500% | 10/15/26 | BB– | 1,213,593 | |||||||||||||||||||||||
| 2,375 | Iliad Holding SASU, 144A | 7.000% | 10/15/28 | BB– | 2,497,479 | |||||||||||||||||||||||
| 2,000 | Telecom Italia Capital SA | 7.200% | 7/18/36 | BB+ | 2,293,120 | |||||||||||||||||||||||
| 2,880 | Vmed O2 UK Financing I PLC, 144A | 4.750% | 7/15/31 | BB+ | 2,916,000 | |||||||||||||||||||||||
| 18,255 | Total Diversified Telecommunication Services | 18,707,540 | ||||||||||||||||||||||||||
22
| Principal Amount (000) | Description (1) | Coupon | Maturity | Ratings (2) | Value | |||||||||||||||||||||||
| Electric Utilities – 1.0% | ||||||||||||||||||||||||||||
| $ | 1,000 | AES Andres BV, 144A | 5.700% | 5/04/28 | BB– | $ | 1,017,500 | |||||||||||||||||||||
| 800 | Electricidad Firme de Mexico Holdings SA de CV, 144A |
| 4.900% | 11/20/26 | Ba2 | 793,008 | ||||||||||||||||||||||
| 1,400 | Eskom Holdings SOC Ltd, 144A | 6.350% | 8/10/28 | Ba2 | 1,508,500 | |||||||||||||||||||||||
| 750 | NPC Ukrenergo, 144A | 6.875% | 11/09/26 | B | 654,488 | |||||||||||||||||||||||
| 3,950 | Total Electric Utilities | 3,973,496 | ||||||||||||||||||||||||||
| Electronic Equipment, Instruments & Components – 1.0% | ||||||||||||||||||||||||||||
| 735 | II-VI Inc, 144A | 5.000% | 12/15/29 | BB | 750,597 | |||||||||||||||||||||||
| 3,125 | Imola Merger Corp, 144A | 4.750% | 5/15/29 | BB+ | 3,206,406 | |||||||||||||||||||||||
| 3,860 | Total Electronic Equipment, Instruments & Components |
| 3,957,003 | |||||||||||||||||||||||||
| Energy Equipment & Services – 0.8% | ||||||||||||||||||||||||||||
| 1,200 | Archrock Partners LP / Archrock Partners Finance Corp, 144A |
| 6.875% | 4/01/27 | B+ | 1,260,000 | ||||||||||||||||||||||
| 1,625 | Archrock Partners LP / Archrock Partners Finance Corp, 144A |
| 6.250% | 4/01/28 | B+ | 1,694,420 | ||||||||||||||||||||||
| 2,825 | Total Energy Equipment & Services | 2,954,420 | ||||||||||||||||||||||||||
| Entertainment – 0.3% | ||||||||||||||||||||||||||||
| 1,070 | Cinemark USA Inc, 144A | 8.750% | 5/01/25 | BB+ | 1,134,200 | |||||||||||||||||||||||
| Equity Real Estate Investment Trust – 0.4% | ||||||||||||||||||||||||||||
| 700 | RLJ Lodging Trust LP, 144A | 4.000% | 9/15/29 | BB– | 692,524 | |||||||||||||||||||||||
| 880 | XHR LP, 144A | 4.875% | 6/01/29 | B1 | 895,400 | |||||||||||||||||||||||
| 1,580 | Total Equity Real Estate Investment Trust | 1,587,924 | ||||||||||||||||||||||||||
| Food & Staples Retailing – 0.5% | ||||||||||||||||||||||||||||
| 750 | BRF SA, 144A | 5.750% | 9/21/50 | Ba2 | 746,250 | |||||||||||||||||||||||
| 1,065 | Performance Food Group Inc, 144A | 4.250% | 8/01/29 | B+ | 1,056,544 | |||||||||||||||||||||||
| 1,815 | Total Food & Staples Retailing | 1,802,794 | ||||||||||||||||||||||||||
| Food Products – 0.3% | ||||||||||||||||||||||||||||
| 1,225 | Amaggi Luxembourg International Sarl, 144A | 5.250% | 1/28/28 | BB | 1,237,262 | |||||||||||||||||||||||
| Gas Utilities – 0.1% | ||||||||||||||||||||||||||||
| 250 | Suburban Propane Partners LP/Suburban Energy Finance Corp, 144A |
| 5.000% | 6/01/31 | BB– | 252,813 | ||||||||||||||||||||||
| Health Care Providers & Services – 4.0% | ||||||||||||||||||||||||||||
| 1,110 | AHP Health Partners Inc, 144A | 5.750% | 7/15/29 | CCC+ | 1,098,900 | |||||||||||||||||||||||
| 450 | CHS/Community Health Systems Inc, 144A | 5.625% | 3/15/27 | BB– | 476,249 | |||||||||||||||||||||||
| 125 | CHS/Community Health Systems Inc, 144A | 6.000% | 1/15/29 | BB– | 133,281 | |||||||||||||||||||||||
| 2,075 | CHS/Community Health Systems Inc, 144A | 6.875% | 4/15/29 | CCC | 2,113,906 | |||||||||||||||||||||||
| 275 | CHS/Community Health Systems Inc, 144A | 6.125% | 4/01/30 | CCC | 272,063 | |||||||||||||||||||||||
| 475 | CHS/Community Health Systems Inc, 144A | 4.750% | 2/15/31 | BB– | 479,156 | |||||||||||||||||||||||
| 1,910 | LifePoint Health Inc, 144A | 5.375% | 1/15/29 | CCC+ | 1,900,450 | |||||||||||||||||||||||
| 3,000 | Team Health Holdings Inc, 144A | 6.375% | 2/01/25 | CCC | 2,823,750 | |||||||||||||||||||||||
| 3,500 | Tenet Healthcare Corp, 144A | 6.125% | 10/01/28 | B | 3,696,735 | |||||||||||||||||||||||
| 2,400 | Tenet Healthcare Corp, 144A | 4.375% | 1/15/30 | B+ | 2,431,356 | |||||||||||||||||||||||
| 15,320 | Total Health Care Providers & Services | 15,425,846 | ||||||||||||||||||||||||||
| Health Care Technology – 0.6% | ||||||||||||||||||||||||||||
| 2,225 | MPH Acquisition Holdings LLC, 144A | 5.500% | 9/01/28 | Ba3 | 2,255,594 | |||||||||||||||||||||||
| Hotels, Restaurants & Leisure – 3.0% | ||||||||||||||||||||||||||||
| 375 | Arcos Dorados Holdings Inc, 144A | 5.875% | 4/04/27 | Ba2 | 387,191 | |||||||||||||||||||||||
| 1,980 | Cinemark USA Inc, 144A | 5.250% | 7/15/28 | B | 1,930,500 | |||||||||||||||||||||||
| 2,210 | Constellation Merger Sub Inc, 144A | 8.500% | 9/15/25 | CCC– | 2,099,500 | |||||||||||||||||||||||
| 830 | Hilton Grand Vacations Borrower Escrow LLC / Hilton Grand Vacations Borrower Esc, 144A | 5.000% | 6/01/29 | BB– | 850,750 | |||||||||||||||||||||||
| 400 | International Game Technology PLC, 144A | 5.250% | 1/15/29 | BB | 423,820 | |||||||||||||||||||||||
| 1,700 | Life Time Inc, 144A | 5.750% | 1/15/26 | B | 1,759,500 | |||||||||||||||||||||||
| 425 | Marriott Ownership Resorts Inc, 144A | 4.500% | 6/15/29 | B1 | 427,771 | |||||||||||||||||||||||
| 1,175 | MGM China Holdings Ltd, 144A | 5.875% | 5/15/26 | Ba3 | 1,177,938 | |||||||||||||||||||||||
| 600 | Playtika Holding Corp, 144A | 4.250% | 3/15/29 | B | 588,000 | |||||||||||||||||||||||
23
| JGH | Nuveen Global High Income Fund (continued) | |
| Portfolio of Investments December 31, 2021 | ||
| Principal Amount (000) | Description (1) | Coupon | Maturity | Ratings (2) | Value | |||||||||||||||||||||||
| Hotels, Restaurants & Leisure (continued) | ||||||||||||||||||||||||||||
| $ | 2,000 | Wynn Macau Ltd, 144A | 5.500% | 10/01/27 | B+ | $ | 1,860,000 | |||||||||||||||||||||
| 215 | Wynn Resorts Ltd, 144A | 5.125% | 10/01/29 | B+ | 218,225 | |||||||||||||||||||||||
| 11,910 | Total Hotels, Restaurants & Leisure | 11,723,195 | ||||||||||||||||||||||||||
| Household Durables – 1.9% | ||||||||||||||||||||||||||||
| 1,175 | Kronos Acquisition Holdings Inc / KIK Custom Products Inc, 144A |
| 5.000% | 12/31/26 | B2 | 1,160,700 | ||||||||||||||||||||||
| 2,325 | Kronos Acquisition Holdings Inc / KIK Custom Products Inc, 144A |
| 7.000% | 12/31/27 | CCC | 2,191,312 | ||||||||||||||||||||||
| 3,625 | WASH Multifamily Acquisition Inc, 144A | 5.750% | 4/15/26 | B– | 3,809,694 | |||||||||||||||||||||||
| 7,125 | Total Household Durables | 7,161,706 | ||||||||||||||||||||||||||
| Independent Power & Renewable Electricity Producers – 1.4% | ||||||||||||||||||||||||||||
| 2,815 | Atlantica Sustainable Infrastructure PLC, 144A | 4.125% | 6/15/28 | BB+ | 2,836,113 | |||||||||||||||||||||||
| 1,000 | EnfraGen Energia Sur SA / EnfraGen Spain SA / Prime Energia SpA, 144A | 5.375% | 12/30/30 | BBB– | 912,500 | |||||||||||||||||||||||
| 825 | Investment Energy Resources Ltd, 144A | 6.250% | 4/26/29 | BB– | 885,852 | |||||||||||||||||||||||
| 654 | UEP Penonome II SA, 144A | 6.500% | 10/01/38 | BB | 684,362 | |||||||||||||||||||||||
| 5,294 | Total Independent Power & Renewable Electricity Producers |
| 5,318,827 | |||||||||||||||||||||||||
| Industrial Conglomerates – 0.7% | ||||||||||||||||||||||||||||
| 1,275 | Icahn Enterprises LP / Icahn Enterprises Finance Corp |
| 5.250% | 5/15/27 | BB | 1,311,248 | ||||||||||||||||||||||
| 1,550 | Icahn Enterprises LP / Icahn Enterprises Finance Corp |
| 4.375% | 2/01/29 | BB | 1,511,250 | ||||||||||||||||||||||
| 2,825 | Total Industrial Conglomerates | 2,822,498 | ||||||||||||||||||||||||||
| Insurance – 2.9% | ||||||||||||||||||||||||||||
| 1,125 | Acrisure LLC / Acrisure Finance Inc, 144A | 10.125% | 8/01/26 | CCC+ | 1,238,906 | |||||||||||||||||||||||
| 2,475 | Acrisure LLC / Acrisure Finance Inc, 144A | 4.250% | 2/15/29 | B | 2,406,938 | |||||||||||||||||||||||
| 100 | Alliant Holdings Intermediate LLC / Alliant Holdings Co-Issuer, 144A | 4.250% | 10/15/27 | B | 100,000 | |||||||||||||||||||||||
| 520 | AmWINS Group Inc, 144A | 4.875% | 6/30/29 | B– | 525,200 | |||||||||||||||||||||||
| 725 | Antero Resources Corp, 144A | 5.375% | 3/01/30 | BB | 775,025 | |||||||||||||||||||||||
| 4,200 | BroadStreet Partners Inc, 144A | 5.875% | 4/15/29 | CCC+ | 4,126,500 | |||||||||||||||||||||||
| 1,000 | Fidelis Insurance Holdings Ltd, 144A | 6.625% | 4/01/41 | BB+ | 1,050,000 | |||||||||||||||||||||||
| 1,000 | SBL Holdings Inc, 144A | 6.500% | 12/30/49 | BB | 985,000 | |||||||||||||||||||||||
| 11,145 | Total Insurance | 11,207,569 | ||||||||||||||||||||||||||
| Interactive Media & Services – 0.4% | ||||||||||||||||||||||||||||
| 250 | Arches Buyer Inc, 144A | 6.125% | 12/01/28 | CCC+ | 251,561 | |||||||||||||||||||||||
| 1,225 | Rackspace Technology Global Inc, 144A | 3.500% | 2/15/28 | B+ | 1,166,164 | |||||||||||||||||||||||
| 1,475 | Total Interactive Media & Services | 1,417,725 | ||||||||||||||||||||||||||
| Internet & Direct Marketing Retail – 0.2% | ||||||||||||||||||||||||||||
| 650 | B2W Digital Lux Sarl, 144A | 4.375% | 12/20/30 | Ba1 | 585,819 | |||||||||||||||||||||||
| IT Services – 3.6% | ||||||||||||||||||||||||||||
| 3,200 | Ahead DB Holdings LLC, 144A | 6.625% | 5/01/28 | CCC+ | 3,176,000 | |||||||||||||||||||||||
| 3,000 | Austin BidCo Inc, 144A | 7.125% | 12/15/28 | CCC+ | 3,097,500 | |||||||||||||||||||||||
| 2,225 | CA Magnum Holdings, 144A | 5.375% | 10/31/26 | BB– | 2,300,094 | |||||||||||||||||||||||
| 5,000 | Presidio Holdings Inc, 144A | 8.250% | 2/01/28 | CCC+ | 5,325,000 | |||||||||||||||||||||||
| 13,425 | Total IT Services | 13,898,594 | ||||||||||||||||||||||||||
| Media – 4.9% | ||||||||||||||||||||||||||||
| 100 | CCO Holdings LLC / CCO Holdings Capital Corp, 144A |
| 4.500% | 8/15/30 | BB+ | 102,319 | ||||||||||||||||||||||
| 1,050 | Clear Channel Outdoor Holdings Inc, 144A | 7.750% | 4/15/28 | CCC | 1,123,500 | |||||||||||||||||||||||
| 1,665 | Clear Channel Outdoor Holdings Inc, 144A | 7.500% | 6/01/29 | CCC | 1,777,387 | |||||||||||||||||||||||
| 1,250 | CSC Holdings LLC, 144A | 5.375% | 2/01/28 | BB | 1,294,213 | |||||||||||||||||||||||
| 1,190 | DISH DBS Corp, 144A | 5.250% | 12/01/26 | Ba3 | 1,208,784 | |||||||||||||||||||||||
| 1,095 | DISH DBS Corp, 144A | 5.750% | 12/01/28 | Ba3 | 1,105,950 | |||||||||||||||||||||||
| 2,550 | DISH DBS Corp | 5.125% | 6/01/29 | B– | 2,320,500 | |||||||||||||||||||||||
| 2,000 | Getty Images Inc, 144A | 9.750% | 3/01/27 | CCC+ | 2,118,500 | |||||||||||||||||||||||
| 1,545 | Gray Escrow Inc, 144A | 5.375% | 11/15/31 | BB– | 1,589,419 | |||||||||||||||||||||||
| 1,275 | LCPR Senior Secured Financing DAC, 144A | 5.125% | 7/15/29 | BB+ | 1,281,375 | |||||||||||||||||||||||
| 1,500 | UPC Broadband Finco BV, 144A | 4.875% | 7/15/31 | BB+ | 1,530,000 | |||||||||||||||||||||||
24
| Principal Amount (000) | Description (1) | Coupon | Maturity | Ratings (2) | Value | |||||||||||||||||||||||
| Media (continued) | ||||||||||||||||||||||||||||
| $ | 2,500 | UPC Holding BV, 144A | 5.500% | 1/15/28 | B | $ | 2,593,750 | |||||||||||||||||||||
| 925 | Virgin Media Secured Finance PLC, 144A | 5.500% | 5/15/29 | BB+ | 976,698 | |||||||||||||||||||||||
| 18,645 | Total Media | 19,022,395 | ||||||||||||||||||||||||||
| Metals & Mining – 3.4% | ||||||||||||||||||||||||||||
| 1,205 | Allegheny Technologies Inc | 4.875% | 10/01/29 | B | 1,206,205 | |||||||||||||||||||||||
| 1,075 | Allegheny Technologies Inc | 5.125% | 10/01/31 | B | 1,083,062 | |||||||||||||||||||||||
| 3,000 | AngloGold Ashanti Holdings PLC | 6.500% | 4/15/40 | Baa3 | 3,637,500 | |||||||||||||||||||||||
| 700 | Cia de Minas Buenaventura SAA, 144A | 5.500% | 7/23/26 | BB | 683,200 | |||||||||||||||||||||||
| 875 | Constellium SE, 144A | 3.750% | 4/15/29 | B | 860,908 | |||||||||||||||||||||||
| 1,750 | First Quantum Minerals Ltd, 144A | 6.875% | 3/01/26 | B | 1,817,813 | |||||||||||||||||||||||
| 1,500 | Gold Fields Orogen Holdings BVI Ltd, 144A | 6.125% | 5/15/29 | Baa3 | 1,721,250 | |||||||||||||||||||||||
| 1,945 | Warrior Met Coal Inc, 144A | 7.875% | 12/01/28 | BB | 1,993,625 | |||||||||||||||||||||||
| 12,050 | Total Metals & Mining | 13,003,563 | ||||||||||||||||||||||||||
| Oil, Gas & Consumable Fuels – 16.4% | ||||||||||||||||||||||||||||
| 1,800 | Antero Midstream Partners LP / Antero Midstream Finance Corp, 144A | 7.875% | 5/15/26 | BB | 1,983,672 | |||||||||||||||||||||||
| 1,335 | Antero Midstream Partners LP / Antero Midstream Finance Corp, 144A | 5.375% | 6/15/29 | BB | 1,408,445 | |||||||||||||||||||||||
| 244 | Antero Resources Corp, 144A | 8.375% | 7/15/26 | BB | 277,811 | |||||||||||||||||||||||
| 1,500 | Calumet Specialty Products Partners LP / Calumet Finance Corp | 7.750% | 4/15/23 | B– | 1,494,375 | |||||||||||||||||||||||
| 1,875 | Cosan SA, 144A | 5.500% | 9/20/29 | BB | 1,952,362 | |||||||||||||||||||||||
| 1,900 | Crestwood Midstream Partners LP / Crestwood Midstream Finance Corp, 144A | 5.625% | 5/01/27 | BB– | 1,935,625 | |||||||||||||||||||||||
| 625 | Ecopetrol SA | 6.875% | 4/29/30 | Baa3 | 697,663 | |||||||||||||||||||||||
| 1,000 | Ecopetrol SA | 5.875% | 11/02/51 | Baa3 | 936,940 | |||||||||||||||||||||||
| 2,351 | Energean Israel Finance Ltd, 144A, Reg S | 5.875% | 3/30/31 | BB– | 2,303,746 | |||||||||||||||||||||||
| 200 | EnLink Midstream LLC, 144A | 5.625% | 1/15/28 | BB+ | 208,000 | |||||||||||||||||||||||
| 425 | EQM Midstream Partners LP, 144A | 4.500% | 1/15/29 | BB | 442,000 | |||||||||||||||||||||||
| 525 | EQM Midstream Partners LP, 144A | 4.750% | 1/15/31 | BB | 555,188 | |||||||||||||||||||||||
| 500 | Genesis Energy LP / Genesis Energy Finance Corp | 6.500% | 10/01/25 | B | 493,750 | |||||||||||||||||||||||
| 500 | Hilcorp Energy I LP / Hilcorp Finance Co, 144A | 6.000% | 2/01/31 | BB | 516,250 | |||||||||||||||||||||||
| 525 | Kosmos Energy Ltd, 144A | 7.750% | 5/01/27 | B+ | 500,063 | |||||||||||||||||||||||
| 3,000 | Laredo Petroleum Inc | 9.500% | 1/15/25 | B | 3,060,000 | |||||||||||||||||||||||
| 1,500 | Leviathan Bond Ltd, 144A, Reg S | 6.500% | 6/30/27 | BB | 1,606,680 | |||||||||||||||||||||||
| 500 | Medco Laurel Tree Pte Ltd, 144A | 6.950% | 11/12/28 | B+ | 495,603 | |||||||||||||||||||||||
| 1,000 | Medco Oak Tree Pte Ltd, 144A | 7.375% | 5/14/26 | B1 | 1,035,000 | |||||||||||||||||||||||
| 4,000 | MEG Energy Corp, 144A | 5.875% | 2/01/29 | BB– | 4,187,720 | |||||||||||||||||||||||
| 2,500 | Moss Creek Resources Holdings Inc, 144A | 10.500% | 5/15/27 | B | 2,521,950 | |||||||||||||||||||||||
| 1,600 | Murphy Oil Corp | 5.875% | 12/01/27 | BB+ | 1,651,952 | |||||||||||||||||||||||
| 2,645 | New Fortress Energy Inc, 144A | 6.500% | 9/30/26 | BB– | 2,625,162 | |||||||||||||||||||||||
| 700 | NGL Energy Operating LLC / NGL Energy Finance Corp, 144A | 7.500% | 2/01/26 | BB– | 721,910 | |||||||||||||||||||||||
| 1,325 | Parkland Corp, 144A | 4.500% | 10/01/29 | BB | 1,326,047 | |||||||||||||||||||||||
| 1,890 | Parkland Corp/Canada, 144A | 4.625% | 5/01/30 | BB | 1,878,187 | |||||||||||||||||||||||
| 1,250 | Petrobras Global Finance BV | 5.093% | 1/15/30 | Ba1 | 1,300,088 | |||||||||||||||||||||||
| 1,350 | Petrobras Global Finance BV | 5.600% | 1/03/31 | Ba1 | 1,429,650 | |||||||||||||||||||||||
| 980 | Petrobras Global Finance BV | 6.900% | 3/19/49 | Ba1 | 1,043,700 | |||||||||||||||||||||||
| 550 | Petrobras Global Finance BV | 5.500% | 6/10/51 | Ba1 | 510,125 | |||||||||||||||||||||||
| 4,671 | Petroleos Mexicanos, 144A | 6.700% | 2/16/32 | BBB | 4,717,710 | |||||||||||||||||||||||
| 1,335 | Saka Energi Indonesia PT, 144A | 4.450% | 5/05/24 | B+ | 1,295,524 | |||||||||||||||||||||||
| 1,500 | SierraCol Energy Andina LLC, 144A | 6.000% | 6/15/28 | B1 | 1,410,000 | |||||||||||||||||||||||
| 2,000 | SM Energy Co | 5.625% | 6/01/25 | B | 2,015,000 | |||||||||||||||||||||||
| 1,000 | SM Energy Co | 6.750% | 9/15/26 | B | 1,027,500 | |||||||||||||||||||||||
| 4,270 | SunCoke Energy Inc, 144A | 4.875% | 6/30/29 | BB | 4,248,650 | |||||||||||||||||||||||
| 475 | Sunoco LP / Sunoco Finance Corp | 4.500% | 5/15/29 | BB | 482,374 | |||||||||||||||||||||||
| 1,410 | Sunoco LP / Sunoco Finance Corp, 144A | 4.500% | 4/30/30 | BB | 1,445,130 | |||||||||||||||||||||||
| 1,000 | TransMontaigne Partners LP / TLP Finance Corp | 6.125% | 2/15/26 | B– | 988,750 | |||||||||||||||||||||||
| 1,250 | Tullow Oil PLC, 144A | 10.250% | 5/15/26 | B2 | 1,262,988 | |||||||||||||||||||||||
| 3,000 | USA Compression Partners LP / USA Compression Finance Corp |
| 6.875% | 9/01/27 | BB– | 3,168,750 | ||||||||||||||||||||||
| 62,006 | Total Oil, Gas & Consumable Fuels | 63,162,040 | ||||||||||||||||||||||||||
| Personal Products – 0.8% | ||||||||||||||||||||||||||||
| 3,000 | HFC Prestige Products Inc/HFC Prestige International US LLC, 144A |
| 4.750% | 1/15/29 | B+ | 3,048,750 | ||||||||||||||||||||||
25
| JGH | Nuveen Global High Income Fund (continued) | |
| Portfolio of Investments December 31, 2021 | ||
| Principal Amount (000) | Description (1) | Coupon | Maturity | Ratings (2) | Value | |||||||||||||||||||||||
| Pharmaceuticals – 3.2% | ||||||||||||||||||||||||||||
| $ | 1,000 | Bausch Health Cos Inc, 144A | 5.000% | 1/30/28 | B | $ | 920,000 | |||||||||||||||||||||
| 2,740 | Bausch Health Cos Inc, 144A | 4.875% | 6/01/28 | BB | 2,794,800 | |||||||||||||||||||||||
| 1,000 | Bausch Health Cos Inc, 144A |
| 7.250% | 5/30/29 | B | 990,000 | ||||||||||||||||||||||
| 1,000 | Endo Dac / Endo Finance LLC / Endo Finco Inc, 144A | 9.500% | 7/31/27 | Caa2 | 1,017,920 | |||||||||||||||||||||||
| 2,650 | Organon & Co, 144A | 5.125% | 4/30/31 | BB– | 2,768,402 | |||||||||||||||||||||||
| 1,500 | Par Pharmaceutical Inc, 144A | 7.500% | 4/01/27 | B– | 1,532,895 | |||||||||||||||||||||||
| 1,800 | Teva Pharmaceutical Finance Netherlands III BV | 6.750% | 3/01/28 | Ba2 | 1,917,000 | |||||||||||||||||||||||
| 495 | Teva Pharmaceutical Finance Netherlands III BV | 5.125% | 5/09/29 | Ba2 | 485,253 | |||||||||||||||||||||||
| 12,185 | Total Pharmaceuticals | 12,426,270 | ||||||||||||||||||||||||||
| Professional Services – 0.6% | ||||||||||||||||||||||||||||
| 2,285 | Dun & Bradstreet Corp, 144A | 5.000% | 12/15/29 | BB– | 2,337,624 | |||||||||||||||||||||||
| Real Estate Management & Development – 1.9% | ||||||||||||||||||||||||||||
| 975 | Howard Hughes Corp, 144A | 4.125% | 2/01/29 | BB | 988,016 | |||||||||||||||||||||||
| 1,050 | Howard Hughes Corp, 144A | 4.375% | 2/01/31 | BB | 1,060,500 | |||||||||||||||||||||||
| 2,000 | Hunt Cos Inc, 144A | 5.250% | 4/15/29 | BB– | 1,970,000 | |||||||||||||||||||||||
| 1,125 | Kennedy-Wilson Inc | 4.750% | 3/01/29 | BB | 1,150,313 | |||||||||||||||||||||||
| 2,175 | Kennedy-Wilson Inc | 5.000% | 3/01/31 | BB | 2,240,250 | |||||||||||||||||||||||
| 7,325 | Total Real Estate Management & Development | 7,409,079 | ||||||||||||||||||||||||||
| Road & Rail – 0.5% | ||||||||||||||||||||||||||||
| 1,340 | First Student Bidco Inc / First Transit Parent Inc, 144A |
| 4.000% | 7/31/29 | BB+ | 1,302,480 | ||||||||||||||||||||||
| 750 | Rumo Luxembourg Sarl, 144A | 5.250% | 1/10/28 | BB | 771,750 | |||||||||||||||||||||||
| 2,090 | Total Road & Rail | 2,074,230 | ||||||||||||||||||||||||||
| Software – 1.3% | ||||||||||||||||||||||||||||
| 1,125 | Avaya Inc, 144A | 6.125% | 9/15/28 | BB | 1,192,500 | |||||||||||||||||||||||
| 4,000 | Rocket Software Inc, 144A | 6.500% | 2/15/29 | CCC | 3,902,400 | |||||||||||||||||||||||
| 5,125 | Total Software | 5,094,900 | ||||||||||||||||||||||||||
| Specialty Retail – 6.5% | ||||||||||||||||||||||||||||
| 2,090 | Albion Financing 1 SARL / Aggreko Holdings Inc, 144A |
| 6.125% | 10/15/26 | BB+ | 2,110,900 | ||||||||||||||||||||||
| 5,470 | Albion Financing 2SARL, 144A | 8.750% | 4/15/27 | BB– | 5,560,255 | |||||||||||||||||||||||
| 1,035 | Asbury Automotive Group Inc, 144A | 4.625% | 11/15/29 | BB | 1,054,406 | |||||||||||||||||||||||
| 2,605 | Asbury Automotive Group Inc, 144A | 5.000% | 2/15/32 | BB | 2,703,208 | |||||||||||||||||||||||
| 4,425 | Ferrellgas LP / Ferrellgas Finance Corp, 144A | 5.875% | 4/01/29 | B– | 4,248,000 | |||||||||||||||||||||||
| 945 | LCM Investments Holdings II LLC, 144A | 4.875% | 5/01/29 | BB– | 971,158 | |||||||||||||||||||||||
| 750 | Michaels Cos Inc, 144A | 5.250% | 5/01/28 | Ba3 | 750,330 | |||||||||||||||||||||||
| 3,900 | Michaels Cos Inc, 144A | 7.875% | 5/01/29 | B3 | 3,841,500 | |||||||||||||||||||||||
| 1,500 | Staples Inc, 144A | 7.500% | 4/15/26 | B | 1,541,250 | |||||||||||||||||||||||
| 2,250 | Superior Plus LP / Superior General Partner Inc, 144A |
| 4.500% | 3/15/29 | BB– | 2,312,640 | ||||||||||||||||||||||
| 24,970 | Total Specialty Retail | 25,093,647 | ||||||||||||||||||||||||||
| Technology Hardware, Storage & Peripherals – 0.8% | ||||||||||||||||||||||||||||
| 3,000 | Diebold Nixdorf Inc | 8.500% | 4/15/24 | Caa1 | 3,000,000 | |||||||||||||||||||||||
| Textiles, Apparel & Luxury Goods – 0.2% | ||||||||||||||||||||||||||||
| 725 | Wolverine World Wide Inc, 144A | 4.000% | 8/15/29 | Ba2 | 704,896 | |||||||||||||||||||||||
| Transportation Infrastructure – 0.3% | ||||||||||||||||||||||||||||
| 1,000 | Aeropuertos Dominicanos Siglo XXI SA, 144A | 6.750% | 3/30/29 | B+ | 1,028,750 | |||||||||||||||||||||||
| Wireless Telecommunication Services – 1.0% | ||||||||||||||||||||||||||||
| 1,550 | C&W Senior Financing DAC, 144A | 6.875% | 9/15/27 | BB– | 1,612,000 | |||||||||||||||||||||||
| 900 | Millicom International Cellular SA, 144A | 5.125% | 1/15/28 | BB+ | 932,040 | |||||||||||||||||||||||
| 250 | Millicom International Cellular SA, 144A | 4.500% | 4/27/31 | BB+ | 251,878 | |||||||||||||||||||||||
| 1,050 | Oztel Holdings SPC Ltd, 144A | 6.625% | 4/24/28 | Ba3 | 1,143,618 | |||||||||||||||||||||||
| 3,750 | Total Wireless Telecommunication Services |
| 3,939,536 | |||||||||||||||||||||||||
| $ | 348,546 | Total Corporate Bonds (cost $349,431,804) |
| 350,785,870 | ||||||||||||||||||||||||
26
| Principal Amount (000) | Description (1) | Coupon | Maturity | Ratings (2) | Value | |||||||||||||||||||||||
| SOVEREIGN DEBT – 16.3% (11.8% of Total Investments) | ||||||||||||||||||||||||||||
| Angola – 0.6% | ||||||||||||||||||||||||||||
| $ | 1,500 | Angolan Government International Bond, 144A | 8.250% | 5/09/28 | B3 | $ | 1,504,800 | |||||||||||||||||||||
| 900 | Angolan Government International Bond, 144A | 8.000% | 11/26/29 | B3 | 886,284 | |||||||||||||||||||||||
| 2,400 | Total Angola | 2,391,084 | ||||||||||||||||||||||||||
| Argentina – 0.2% | ||||||||||||||||||||||||||||
| 169 | Argentine Republic Government International Bond | 1.000% | 7/09/29 | CCC+ | 61,200 | |||||||||||||||||||||||
| 548 | Argentine Republic Government International Bond | 0.500% | 7/09/30 | CCC+ | 191,785 | |||||||||||||||||||||||
| 544 | Argentine Republic Government International Bond | 2.500% | 7/09/41 | CCC+ | 191,760 | |||||||||||||||||||||||
| 1,050 | Provincia de Buenos Aires/Government Bonds, 144A |
| 3.900% | 9/01/37 | CCC+ | 446,250 | ||||||||||||||||||||||
| 2,311 | Total Argentina | 890,995 | ||||||||||||||||||||||||||
| Armenia – 0.3% | ||||||||||||||||||||||||||||
| 1,250 | Republic of Armenia International Bond, 144A | 3.950% | 9/26/29 | Ba3 | 1,212,500 | |||||||||||||||||||||||
| Bahrain – 0.4% | ||||||||||||||||||||||||||||
| 1,450 | Bahrain Government International Bond, 144A | 7.000% | 10/12/28 | B+ | 1,571,661 | |||||||||||||||||||||||
| Brazil – 0.6% | ||||||||||||||||||||||||||||
| 1,250 | Brazilian Government International Bond | 3.875% | 6/12/30 | Ba2 | 1,212,500 | |||||||||||||||||||||||
| 1,200 | Brazilian Government International Bond | 5.000% | 1/27/45 | Ba2 | 1,124,400 | |||||||||||||||||||||||
| 2,450 | Total Brazil | 2,336,900 | ||||||||||||||||||||||||||
| Colombia – 0.5% | ||||||||||||||||||||||||||||
| 2,150 | Colombia Government International Bond | 3.250% | 4/22/32 | Baa2 | 1,932,313 | |||||||||||||||||||||||
| Costa Rica – 0.5% | ||||||||||||||||||||||||||||
| 2,050 | Costa Rica Government International Bond, 144A | 6.125% | 2/19/31 | B | 2,067,938 | |||||||||||||||||||||||
| Dominican Republic – 1.0% | ||||||||||||||||||||||||||||
| 1,000 | Dominican Republic International Bond, 144A | 4.500% | 1/30/30 | BB– | 1,016,250 | |||||||||||||||||||||||
| 1,500 | Dominican Republic International Bond, 144A | 4.875% | 9/23/32 | BB– | 1,524,375 | |||||||||||||||||||||||
| 1,175 | Dominican Republic International Bond, 144A | 5.300% | 1/21/41 | BB– | 1,160,312 | |||||||||||||||||||||||
| 3,675 | Total Dominican Republic | 3,700,937 | ||||||||||||||||||||||||||
| Ecuador – 0.5% | ||||||||||||||||||||||||||||
| 1,768 | Ecuador Government International Bond, 144A | 5.000% | 7/31/30 | B– | 1,464,816 | |||||||||||||||||||||||
| 80 | Ecuador Government International Bond, 144A | 0.000% | 7/31/30 | B– | 45,141 | |||||||||||||||||||||||
| 371 | Ecuador Government International Bond, 144A | 1.000% | 7/31/35 | B– | 243,780 | |||||||||||||||||||||||
| 2,219 | Total Ecuador | 1,753,737 | ||||||||||||||||||||||||||
| Egypt – 0.9% | ||||||||||||||||||||||||||||
| 1,300 | Egypt Government International Bond, 144A | 5.875% | 6/11/25 | B+ | 1,335,173 | |||||||||||||||||||||||
| 2,300 | Egypt Government International Bond, 144A | 7.053% | 1/15/32 | B+ | 2,119,680 | |||||||||||||||||||||||
| 3,600 | Total Egypt | 3,454,853 | ||||||||||||||||||||||||||
| El Salvador – 0.1% | ||||||||||||||||||||||||||||
| 725 | El Salvador Government International Bond, 144A | 7.650% | 6/15/35 | B– | 408,719 | |||||||||||||||||||||||
| Ghana – 0.7% | ||||||||||||||||||||||||||||
| 3,325 | Ghana Government International Bond, 144A | 8.125% | 3/26/32 | B | 2,714,098 | |||||||||||||||||||||||
| Guatemala – 0.6% | ||||||||||||||||||||||||||||
| 1,980 | Guatemala Government Bond, 144A | 6.125% | 6/01/50 | Ba1 | 2,267,120 | |||||||||||||||||||||||
| Honduras – 0.2% | ||||||||||||||||||||||||||||
| 725 | Honduras Government International Bond, 144A | 6.250% | 1/19/27 | BB– | 783,007 | |||||||||||||||||||||||
| Iraq – 0.6% | ||||||||||||||||||||||||||||
| 2,519 | Iraq International Bond, 144A | 5.800% | 1/15/28 | N/R | 2,405,910 | |||||||||||||||||||||||
27
| JGH | Nuveen Global High Income Fund (continued) | |
| Portfolio of Investments December 31, 2021 | ||
| Principal Amount (000) | Description (1) | Coupon | Maturity | Ratings (2) | Value | |||||||||||||||||||||||
| Jamaica – 0.6% | ||||||||||||||||||||||||||||
| $ | 1,700 | Jamaica Government International Bond | 7.875% | 7/28/45 | B+ | $ | 2,352,375 | |||||||||||||||||||||
| Jordan – 0.5% | ||||||||||||||||||||||||||||
| 1,000 | Jordan Government International Bond, 144A | 4.950% | 7/07/25 | BB– | 1,031,300 | |||||||||||||||||||||||
| 825 | Jordan Government International Bond, 144A | 5.850% | 7/07/30 | BB– | 833,357 | |||||||||||||||||||||||
| 1,825 | Total Jordan | 1,864,657 | ||||||||||||||||||||||||||
| Kenya – 0.8% | ||||||||||||||||||||||||||||
| 2,000 | Republic of Kenya Government International Bond, 144A |
| 7.000% | 5/22/27 | B+ | 2,109,500 | ||||||||||||||||||||||
| 825 | Republic of Kenya Government International Bond, 144A |
| 6.300% | 1/23/34 | B+ | 808,450 | ||||||||||||||||||||||
| 2,825 | Total Kenya | 2,917,950 | ||||||||||||||||||||||||||
| Mongolia – 0.2% | ||||||||||||||||||||||||||||
| 675 | Mongolia Government International Bond, 144A | 4.450% | 7/07/31 | B | 638,713 | |||||||||||||||||||||||
| Morocco – 0.2% | ||||||||||||||||||||||||||||
| 775 | Morocco Government International Bond, 144A | 3.000% | 12/15/32 | BB+ | 738,606 | |||||||||||||||||||||||
| Nigeria – 0.7% | ||||||||||||||||||||||||||||
| 1,200 | Nigeria Government International Bond, 144A | 6.125% | 9/28/28 | B2 | 1,156,392 | |||||||||||||||||||||||
| 1,425 | Nigeria Government International Bond, 144A | 7.875% | 2/16/32 | B2 | 1,401,459 | |||||||||||||||||||||||
| 2,625 | Total Nigeria | 2,557,851 | ||||||||||||||||||||||||||
| Oman – 1.1% | ||||||||||||||||||||||||||||
| 1,000 | Oman Government International Bond, 144A | 4.750% | 6/15/26 | Ba3 | 1,028,494 | |||||||||||||||||||||||
| 800 | Oman Government International Bond, 144A | 6.750% | 10/28/27 | Ba3 | 896,000 | |||||||||||||||||||||||
| 1,500 | Oman Government International Bond, 144A | 6.000% | 8/01/29 | Ba3 | 1,614,330 | |||||||||||||||||||||||
| 800 | Oman Sovereign Sukuk Co, 144A | 4.875% | 6/15/30 | Ba3 | 850,000 | |||||||||||||||||||||||
| 4,100 | Total Oman | 4,388,824 | ||||||||||||||||||||||||||
| Pakistan – 0.6% | ||||||||||||||||||||||||||||
| 1,000 | Pakistan Government International Bond, 144A | 6.000% | 4/08/26 | B3 | 998,300 | |||||||||||||||||||||||
| 1,450 | Pakistan Government International Bond, 144A | 6.875% | 12/05/27 | B– | 1,460,875 | |||||||||||||||||||||||
| 2,450 | Total Pakistan | 2,459,175 | ||||||||||||||||||||||||||
| Rwanda – 0.7% | ||||||||||||||||||||||||||||
| 2,450 | Rwanda International Government Bond, 144A | 5.500% | 8/09/31 | B+ | 2,468,130 | |||||||||||||||||||||||
| Senegal – 0.4% | ||||||||||||||||||||||||||||
| 1,500 | Senegal Government International Bond, 144A | 6.250% | 5/23/33 | Ba3 | 1,542,252 | |||||||||||||||||||||||
| Sri Lanka – 0.2% | ||||||||||||||||||||||||||||
| 1,500 | Sri Lanka Government International Bond, 144A | 6.125% | 6/03/25 | CCC+ | 780,000 | |||||||||||||||||||||||
| Turkey – 2.0% | ||||||||||||||||||||||||||||
| 1,800 | Turkey Government International Bond | 5.750% | 3/22/24 | BB– | 1,755,000 | |||||||||||||||||||||||
| 1,500 | Turkey Government International Bond | 5.125% | 2/17/28 | BB– | 1,342,140 | |||||||||||||||||||||||
| 1,250 | Turkey Government International Bond | 5.875% | 6/26/31 | BB– | 1,108,575 | |||||||||||||||||||||||
| 1,500 | Turkey Government International Bond | 6.500% | 9/20/33 | BB– | 1,360,650 | |||||||||||||||||||||||
| 1,250 | Turkey Government International Bond | 6.625% | 2/17/45 | BB– | 1,103,675 | |||||||||||||||||||||||
| 1,000 | Turkiye Ihracat Kredi Bankasi AS, 144A | 5.750% | 7/06/26 | B+ | 915,640 | |||||||||||||||||||||||
| 8,300 | Total Turkey | 7,585,680 | ||||||||||||||||||||||||||
| Ukraine – 0.6% | ||||||||||||||||||||||||||||
| 675 | Ukraine Government International Bond, 144A | 7.750% | 9/01/25 | B | 646,515 | |||||||||||||||||||||||
| 500 | Ukraine Government International Bond, 144A | 6.876% | 5/21/29 | B | 441,725 | |||||||||||||||||||||||
| 1,500 | Ukraine Government International Bond, 144A | 7.253% | 3/15/33 | B | 1,320,000 | |||||||||||||||||||||||
| 2,675 | Total Ukraine | 2,408,240 | ||||||||||||||||||||||||||
| Uzbekistan – 0.1% | ||||||||||||||||||||||||||||
| 450 | Republic of Uzbekistan International Bond, 144A | 3.700% | 11/25/30 | BB– | 431,550 | |||||||||||||||||||||||
| $ | 66,679 | Total Sovereign Debt (cost $65,819,275) | 63,025,775 | |||||||||||||||||||||||||
28
| Principal Amount (000) | Description (1) | Coupon (4) | Reference Rate (4) | Spread (4) | Maturity (5) | Ratings (2) | Value | |||||||||||||||||||||
VARIABLE RATE SENIOR LOAN INTERESTS – 12.8% (9.2% of Total Investments) (4) |
| |||||||||||||||||||||||||||
| Airlines – 1.0% | ||||||||||||||||||||||||||||
| $ | 750 | AAdvantage Loyalty IP Ltd., Term Loan | 5.500% | 3-Month LIBOR | 4.750% | 4/20/28 | Ba2 | $ | 778,459 | |||||||||||||||||||
| 3,170 | Air Canada, Term Loan B | 4.250% | 3-Month LIBOR | 3.500% | 8/11/28 | Ba2 | 3,171,696 | |||||||||||||||||||||
| 12 | SkyMiles IP Ltd., Term Loan B | 4.750% | 3-Month LIBOR | 3.750% | 10/20/27 | Baa1 | 13,117 | |||||||||||||||||||||
| 3,932 | Total Airlines | 3,963,272 | ||||||||||||||||||||||||||
| Auto Components – 0.7% | ||||||||||||||||||||||||||||
| 1,097 | Autokiniton US Holdings, Inc., Term Loan B | 5.000% | 3-Month LIBOR | 4.500% | 4/06/28 | B | 1,100,299 | |||||||||||||||||||||
| 1,465 | Truck Hero Inc, Term Loan B, (DD1) | 4.000% | 1-Month LIBOR | 3.250% | 1/31/28 | B2 | 1,459,954 | |||||||||||||||||||||
| 2,562 | Total Auto Components | 2,560,253 | ||||||||||||||||||||||||||
| Beverages – 0.5% | ||||||||||||||||||||||||||||
| 1,991 | Triton Water Holdings, Inc, Term Loan | 4.000% | 3-Month LIBOR | 3.500% | 3/31/28 | B1 | 1,971,787 | |||||||||||||||||||||
| Capital Markets – 0.7% | ||||||||||||||||||||||||||||
| 2,740 | Astra Acquisition Corp., Term Loan, First Lien, (WI/DD) | TBD | TBD | TBD | TBD | BB– | 2,696,626 | |||||||||||||||||||||
| Chemicals – 0.2% | ||||||||||||||||||||||||||||
| 375 | Diamond (BC) B.V., Term Loan B | 3.500% | 3-Month LIBOR | 3.000% | 9/29/28 | Ba3 | 374,325 | |||||||||||||||||||||
| 285 | W.R. Grace & Co.-Conn., Term Loan B | 4.250% | 3-Month LIBOR | 3.750% | 9/22/28 | BB+ | 285,855 | |||||||||||||||||||||
| 660 | Total Chemicals | 660,180 | ||||||||||||||||||||||||||
| Commercial Services & Supplies – 1.0% | ||||||||||||||||||||||||||||
| 668 | PAE Holding Corporation, Term Loan B | 5.250% | 1-Month LIBOR | 4.500% | 10/19/27 | B | 669,921 | |||||||||||||||||||||
| 3,060 | Spin Holdco Inc., Term Loan | 4.750% | 3-Month LIBOR | 4.000% | 3/04/28 | B– | 3,073,225 | |||||||||||||||||||||
| 3,728 | Total Commercial Services & Supplies | 3,743,146 | ||||||||||||||||||||||||||
| Food & Staples Retailing – 0.6% | ||||||||||||||||||||||||||||
| 2,267 | H Food Holdings LLC, Term Loan B | 6.000% | 1-Month LIBOR | 5.000% | 5/31/25 | B2 | 2,273,166 | |||||||||||||||||||||
| Health Care Equipment & Supplies – 1.0% | ||||||||||||||||||||||||||||
| 1,945 | Auris Luxembourg III S.a.r.l., Term Loan B2 | 3.854% | 1-Month LIBOR | 3.750% | 2/21/26 | B | 1,933,464 | |||||||||||||||||||||
| 1,985 | Viant Medical Holdings, Inc., Term Loan, First Lien | 3.854% | 1-Month LIBOR | 3.750% | 7/02/25 | B3 | 1,879,183 | |||||||||||||||||||||
| 3,930 | Total Health Care Equipment & Supplies | 3,812,647 | ||||||||||||||||||||||||||
| Health Care Providers & Services – 1.6% | ||||||||||||||||||||||||||||
| 993 | ADMI Corp., Term Loan B2 | 3.875% | 1-Month LIBOR | 3.375% | 12/23/27 | B | 987,537 | |||||||||||||||||||||
| 2,861 | Onex TSG Intermediate Corp., Term Loan B | 5.500% | 3-Month LIBOR | 4.750% | 2/26/28 | B | 2,863,614 | |||||||||||||||||||||
| 1,518 | RegionalCare Hospital Partners Holdings, Inc., Term Loan B | 3.852% | 1-Month LIBOR | 3.750% | 11/16/25 | B1 | 1,519,211 | |||||||||||||||||||||
| 744 | US Radiology Specialists, Inc.,Term Loan | 6.250% | 3-Month LIBOR | 5.500% | 12/15/27 | B– | 744,375 | |||||||||||||||||||||
| 6,116 | Total Health Care Providers & Services | 6,114,737 | ||||||||||||||||||||||||||
| Hotels, Restaurants & Leisure – 0.2% | ||||||||||||||||||||||||||||
| 644 | Life Time Fitness Inc , Term Loan B | 5.750% | 3-Month LIBOR | 4.750% | 12/15/24 | B | 659,545 | |||||||||||||||||||||
| Industrial Conglomerates – 0.7% | ||||||||||||||||||||||||||||
| 2,590 | U.S. Renal Care, Inc., Term Loan B | 5.104% | 1-Month LIBOR | 5.000% | 7/26/26 | B2 | 2,525,952 | |||||||||||||||||||||
| Insurance – 0.2% | ||||||||||||||||||||||||||||
| 199 | Alliant Holdings Intermediate, LLC, Term Loan B3, (WI/DD) | TBD | TBD | TBD | TBD | B | 199,037 | |||||||||||||||||||||
| 662 | Hub International Limited, Term Loan B | 4.000% | 3-Month LIBOR | 3.250% | 4/25/25 | B | 662,358 | |||||||||||||||||||||
| 861 | Total Insurance | 861,395 | ||||||||||||||||||||||||||
| IT Services – 1.0% | ||||||||||||||||||||||||||||
| 995 | Ahead DB Holdings, LLC, Term Loan B | 4.500% | 3-Month LIBOR | 3.750% | 10/16/27 | B+ | 997,801 | |||||||||||||||||||||
| 998 | Magenta Buyer LLC, Term Loan, First Lien | 5.750% | 3-Month LIBOR | 5.000% | 7/27/28 | BB– | 996,408 | |||||||||||||||||||||
| 1,979 | Syniverse Holdings, Inc., Term Loan, First Lien | 6.000% | 3-Month LIBOR | 5.000% | 3/09/23 | CCC+ | 1,970,774 | |||||||||||||||||||||
| 3,972 | Total IT Services | 3,964,983 | ||||||||||||||||||||||||||
| Paper & Forest Products – 0.6% | ||||||||||||||||||||||||||||
| 2,278 | Sylvamo Corporation, Term Loan B | 5.000% | 1-Month LIBOR | 4.500% | 9/13/28 | BB+ | 2,293,437 | |||||||||||||||||||||
29
| JGH | Nuveen Global High Income Fund (continued) | |
| Portfolio of Investments December 31, 2021 | ||
| Principal Amount (000) | Description (1) | Coupon (4) | Reference Rate (4) | Spread (4) | Maturity (5) | Ratings (2) | Value | |||||||||||||||||||||
| Personal Products – 0.2% | ||||||||||||||||||||||||||||
| $ | 796 | Journey Personal Care Corp., Term Loan B | 5.500% | 3-Month LIBOR | 4.250% | 3/01/28 | B | $ | 796,665 | |||||||||||||||||||
| Pharmaceuticals – 0.2% | ||||||||||||||||||||||||||||
| 894 | Endo Luxembourg Finance Company I S.a r.l., Term Loan | 5.750% | 3-Month LIBOR | 5.000% | 3/25/28 | B– | 872,059 | |||||||||||||||||||||
| Professional Services – 0.1% | ||||||||||||||||||||||||||||
| 444 | Da Vinci Purchaser Corp., Term Loan | 5.000% | 3-Month LIBOR | 4.000% | 11/26/26 | B | 445,472 | |||||||||||||||||||||
| Software – 1.5% | ||||||||||||||||||||||||||||
| 1,995 | Apttus Corporation, Term Loan | 5.000% | 3-Month LIBOR | 4.250% | 5/06/28 | BB | 2,002,481 | |||||||||||||||||||||
| 3,483 | Finastra USA, Inc., Term Loan, First Lien | 4.500% | 3-Month LIBOR | 3.500% | 6/13/24 | BB– | 3,472,687 | |||||||||||||||||||||
| 474 | RealPage, Inc, Term Loan, First Lien | 3.750% | 1-Month LIBOR | 3.250% | 4/22/28 | B+ | 473,000 | |||||||||||||||||||||
| 5,952 | Total Software | 5,948,168 | ||||||||||||||||||||||||||
| Specialty Retail – 0.6% | ||||||||||||||||||||||||||||
| 1,995 | PetSmart, Inc., Term Loan B | 4.500% | 3-Month LIBOR | 3.750% | 2/12/28 | BB– | 2,000,616 | |||||||||||||||||||||
| 223 | WOOF Holdings, Inc, Term Loan, First Lien | 4.500% | 3-Month LIBOR | 3.750% | 12/21/27 | B2 | 223,801 | |||||||||||||||||||||
| 2,218 | Total Specialty Retail | 2,224,417 | ||||||||||||||||||||||||||
| Wireless Telecommunication Services – 0.2% | ||||||||||||||||||||||||||||
| 746 | GOGO Intermediate Holdings LLC, Term Loan B | 4.500% | 3-Month LIBOR | 3.750% | 4/30/28 | B | 747,116 | |||||||||||||||||||||
| $ | 49,321 | Total Variable Rate Senior Loan Interests (cost $48,875,593) |
| 49,135,023 | ||||||||||||||||||||||||
| Principal Amount (000) | Description (1) | Coupon | Maturity | Ratings (2) | Value | |||||||||||||||||||||||
$1,000 PAR (OR SIMILAR) INSTITUTIONAL PREFERRED – 8.3% (6.0% of Total Investments) |
| |||||||||||||||||||||||||||
| Automobiles – 0.7% | ||||||||||||||||||||||||||||
| $ | 905 | General Motors Financial Co Inc | 5.700% | N/A (6) | BB+ | $ | 1,031,700 | |||||||||||||||||||||
| 1,473 | General Motors Financial Co Inc | 5.750% | N/A (6) | BB+ | 1,576,110 | |||||||||||||||||||||||
| 2,378 | Total Automobiles | 2,607,810 | ||||||||||||||||||||||||||
| Banks – 1.5% | ||||||||||||||||||||||||||||
| 2,500 | Citigroup Inc | 5.000% | N/A (6) | BBB– | 2,575,000 | |||||||||||||||||||||||
| 1,000 | Huntington Bancshares Inc/OH | 5.625% | N/A (6) | Baa3 | 1,141,250 | |||||||||||||||||||||||
| 1,000 | NBK Tier 1 Ltd, 144A | 3.625% | N/A (6) | Baa3 | 987,800 | |||||||||||||||||||||||
| 770 | SVB Financial Group | 4.100% | N/A (6) | Baa2 | 761,530 | |||||||||||||||||||||||
| 475 | Turkiye Garanti Bankasi AS, 144A | 6.125% | 5/24/27 | B | 465,500 | |||||||||||||||||||||||
| 5,745 | Total Banks | 5,931,080 | ||||||||||||||||||||||||||
| Capital Markets – 0.5% | ||||||||||||||||||||||||||||
| 1,500 | Dresdner Funding Trust I, 144A | 8.151% | 6/30/31 | Ba1 | 2,116,170 | |||||||||||||||||||||||
| Communications Equipment – 0.9% | ||||||||||||||||||||||||||||
| 3,500 | Vodafone Group PLC | 4.125% | 6/04/81 | BB+ | 3,464,860 | |||||||||||||||||||||||
| Consumer Finance – 0.4% | ||||||||||||||||||||||||||||
| 1,500 | Ally Financial Inc | 4.700% | N/A (6) | Ba2 | 1,556,250 | |||||||||||||||||||||||
| Electric Utilities – 0.5% | ||||||||||||||||||||||||||||
| 2,000 | Edison International | 5.375% | N/A (6) | BB+ | 2,095,200 | |||||||||||||||||||||||
| Food Products – 0.7% | ||||||||||||||||||||||||||||
| 1,500 | Land O’ Lakes Inc, 144A | 8.000% | N/A (6) | BB | 1,623,675 | |||||||||||||||||||||||
| 1,000 | Land O’ Lakes Inc, 144A | 7.000% | N/A (6) | BB | 1,065,000 | |||||||||||||||||||||||
| 2,500 | Total Food Products | 2,688,675 | ||||||||||||||||||||||||||
| Independent Power & Renewable Electricity Producers – 0.7% | ||||||||||||||||||||||||||||
| 600 | AES Andes SA, 144A | 7.125% | 3/26/79 | BB | 621,000 | |||||||||||||||||||||||
| 2,000 | Vistra Corp, 144A | 7.000% | N/A (6) | BB– | 2,025,780 | |||||||||||||||||||||||
| 2,600 | Total Independent Power & Renewable Electricity Producers |
| 2,646,780 | |||||||||||||||||||||||||
30
| Principal Amount (000) | Description (1) | Coupon | Maturity | Ratings (2) | Value | |||||||||||||||||||||||
| Insurance – 0.8% | ||||||||||||||||||||||||||||
| $ | 1,750 | Assurant Inc | 7.000% | 3/27/48 | BB+ | $ | 1,992,812 | |||||||||||||||||||||
| 1,250 | Enstar Finance LLC | 5.750% | 9/01/40 | BB+ | 1,282,913 | |||||||||||||||||||||||
| 3,000 | Total Insurance | 3,275,725 | ||||||||||||||||||||||||||
| Oil, Gas & Consumable Fuels – 0.4% | ||||||||||||||||||||||||||||
| 1,400 | Energy Transfer LP | 6.500% | N/A (6) | BB | 1,424,500 | |||||||||||||||||||||||
| Trading Companies & Distributors – 0.8% | ||||||||||||||||||||||||||||
| 1,000 | AerCap Global Aviation Trust, 144A | 6.500% | 6/15/45 | BB+ | 1,080,000 | |||||||||||||||||||||||
| 1,750 | AerCap Holdings NV | 5.875% | 10/10/79 | BB+ | 1,811,250 | |||||||||||||||||||||||
| 2,750 | Total Trading Companies & Distributors | 2,891,250 | ||||||||||||||||||||||||||
| Wireless Telecommunication Services – 0.4% | ||||||||||||||||||||||||||||
| 1,300 | Network i2i Ltd, 144A | 5.650% | N/A (6) | BB | 1,365,000 | |||||||||||||||||||||||
| $ | 30,173 | Total $1,000 Par (or similar) Institutional Preferred (cost $30,287,104) |
| 32,063,300 | ||||||||||||||||||||||||
| Principal Amount (000) | Description (1), (7) | Coupon | Maturity | Ratings (2) | Value | |||||||||||||||||||||||
| CONTINGENT CAPITAL SECURITIES – 6.4% (4.6% of Total Investments) | ||||||||||||||||||||||||||||
| Banks – 5.1% | ||||||||||||||||||||||||||||
| $ | 1,900 | Banco Bilbao Vizcaya Argentaria SA | 6.500% | N/A (6) | Ba2 | $ | 2,016,375 | |||||||||||||||||||||
| 1,980 | Banco Mercantil del Norte SA/Grand Cayman, 144A | 6.750% | N/A (6) | Ba2 | 2,050,310 | |||||||||||||||||||||||
| 1,000 | Banco Santander SA, Reg S | 7.500% | N/A (6) | Ba1 | 1,075,000 | |||||||||||||||||||||||
| 1,500 | Banco Santander SA | 4.750% | N/A (6) | Ba1 | 1,498,935 | |||||||||||||||||||||||
| 1,000 | Bancolombia SA | 4.625% | 12/18/29 | Ba3 | 1,000,000 | |||||||||||||||||||||||
| 1,500 | Barclays PLC | 6.125% | N/A (6) | BBB– | 1,623,150 | |||||||||||||||||||||||
| 1,500 | Barclays PLC | 4.375% | N/A (6) | BBB– | 1,469,250 | |||||||||||||||||||||||
| 1,000 | BNP Paribas SA, 144A | 7.000% | N/A (6) | BBB | 1,170,450 | |||||||||||||||||||||||
| 1,500 | Danske Bank A/S, Reg S | 4.375% | N/A (6) | BBB– | 1,496,250 | |||||||||||||||||||||||
| 1,425 | Intesa Sanpaolo SpA, 144A | 7.700% | N/A (6) | BB– | 1,596,000 | |||||||||||||||||||||||
| 2,000 | Macquarie Bank Ltd/London, 144A | 6.125% | N/A (6) | BB+ | 2,134,160 | |||||||||||||||||||||||
| 1,000 | NatWest Group PLC | 4.600% | N/A (6) | BBB– | 980,000 | |||||||||||||||||||||||
| 900 | Societe Generale SA, 144A | 4.750% | N/A (6) | BB+ | 913,869 | |||||||||||||||||||||||
| 485 | UniCredit SpA, Reg S | 8.000% | N/A (6) | BB– | 531,075 | |||||||||||||||||||||||
| 18,690 | Total Banks | 19,554,824 | ||||||||||||||||||||||||||
| Capital Markets – 1.3% | ||||||||||||||||||||||||||||
| 1,500 | Credit Suisse Group AG, 144A | 7.500% | N/A (6) | BB+ | 1,586,250 | |||||||||||||||||||||||
| 750 | Credit Suisse Group AG, 144A | 6.375% | N/A (6) | BB+ | 808,350 | |||||||||||||||||||||||
| 2,650 | Deutsche Bank AG | 6.000% | N/A (6) | BB– | 2,752,687 | |||||||||||||||||||||||
| 4,900 | Total Capital Markets | 5,147,287 | ||||||||||||||||||||||||||
| 23,590 | Total Contingent Capital Securities (cost $23,564,877) |
| 24,702,111 | |||||||||||||||||||||||||
| Shares | Description (1) | Coupon | Ratings (2) | Value | ||||||||||||||||||||||||
| $25 PAR (OR SIMILAR) RETAIL PREFERRED – 1.5% (1.0% of Total Investments) | ||||||||||||||||||||||||||||
| Banks – 0.5% | ||||||||||||||||||||||||||||
| 25,200 | Western Alliance Bancorp | 4.250% | Ba1 | $ | 660,240 | |||||||||||||||||||||||
| 54,400 | Wintrust Financial Corp | 6.875% | BB | 1,485,664 | ||||||||||||||||||||||||
Total Banks | 2,145,904 | |||||||||||||||||||||||||||
| Insurance – 0.5% | ||||||||||||||||||||||||||||
| 38,288 | Assurant Inc | 5.250% | BB+ | 1,032,627 | ||||||||||||||||||||||||
| 30,000 | Enstar Group Ltd | 7.000% | BB+ | 886,800 | ||||||||||||||||||||||||
Total Insurance | 1,919,427 | |||||||||||||||||||||||||||
| Oil, Gas & Consumable Fuels – 0.4% | ||||||||||||||||||||||||||||
| 60,000 | NuStar Energy LP | 6.969% | B2 | 1,518,000 | ||||||||||||||||||||||||
Total $25 Par (or similar) Retail Preferred (cost $5,257,890) |
| 5,583,331 | ||||||||||||||||||||||||||
Total Long-Term Investments (cost $523,236,543) |
| 525,295,410 | ||||||||||||||||||||||||||
31
| JGH | Nuveen Global High Income Fund (continued) | |
| Portfolio of Investments December 31, 2021 | ||
| Principal Amount (000) | Description (1) | Coupon | Maturity | Value | ||||||||||||||||||||||||
| SHORT-TERM INVESTMENTS – 2.8% (2.0% of Total Investments) | ||||||||||||||||||||||||||||
| REPURCHASE AGREEMENTS – 2.8% (2.0% of Total Investments) | ||||||||||||||||||||||||||||
| $ | 10,777 | Repurchase Agreement with Fixed Income Clearing Corporation, dated 12/31/21, repurchase price $10,776,811, collateralized by $9,519,000, U.S. Treasury Inflation Index Notes, 0.125%, due 4/15/22, value $10,992,349 | 0.000% | 1/03/22 | $ | 10,776,811 | ||||||||||||||||||||||
Total Short-Term Investments (cost $10,776,811) |
| 10,776,811 | ||||||||||||||||||||||||||
Total Investments (cost $534,013,354) – 139.1% |
| 536,072,221 | ||||||||||||||||||||||||||
Borrowings – (41.2)% (8), (9) |
| (159,000,000 | ) | |||||||||||||||||||||||||
Other Assets Less Liabilities – 2.1% (10) |
| 8,401,611 | ||||||||||||||||||||||||||
Net Assets Applicable to Common Shares – 100% |
| $ | 385,473,832 | |||||||||||||||||||||||||
Investments in Derivatives
Interest Rate Swaps – OTC Uncleared
| Counterparty | Notional Amount | Fund Pay/Receive Floating Rate | Floating Rate Index | Fixed Rate (Annualized) | Fixed Rate Payment Frequency | Effective Date (11) | Optional Termination Date | Maturity Date | Value | Unrealized Appreciation (Depreciation) | ||||||||||||||||||||||||||
Morgan Stanley Capital Services LLC | $ | 87,400,000 | Receive | 1-Month LIBOR | 1.994 | % | Monthly | 6/1/2018 | 7/1/2025 | 7/1/2027 | $ | (4,236,587 | ) | $ | (4,236,587 | ) | ||||||||||||||||||||
32
For Fund portfolio compliance purposes, the Fund’s industry classifications refer to any one or more of the industry sub-classifications used by one or more widely recognized market indexes or ratings group indexes, and/or as defined by Fund management. This definition may not apply for purposes of this report, which may combine industry sub-classifications into sectors for reporting ease.
| (1) | All percentages shown in the Portfolio of Investments are based on net assets applicable to common shares unless otherwise noted. |
| (2) | The Fund uses credit quality ratings for its portfolio securities provided by Standard & Poor’s Group (“Standard & Poor’s”), Moody’s Investors Service, Inc. (“Moody’s”) and Fitch, Inc. (“Fitch”). If all three provide a rating for a security, the middle is used; if two of the three agencies rate a security, the lower rating is used; and if only one rating agency rates a security, that rating is used. This treatment of split-rated securities may differ from that used for other purposes, such as for Fund investment policies. Ratings below BBB by Standard & Poor’s, Baa by Moody’s or BBB by Fitch are considered to be below investment grade. Holdings designated N/R are not rated by any of these national rating agencies. |
| (3) | Defaulted security. A security whose issuer has failed to fully pay principal and/or interest when due, or is under the protection of bankruptcy. |
| (4) | Senior loans generally pay interest at rates which are periodically adjusted by reference to a base short-term, floating lending rate (Reference Rate) plus an assigned fixed rate (Spread). These floating lending rates are generally (i) the lending rate referenced by the London Inter-Bank Offered Rate (“LIBOR”), or (ii) the prime rate offered by one or more major United States banks. Senior loans may be considered restricted in that the Fund ordinarily is contractually obligated to receive approval from the agent bank and/or borrower prior to the disposition of a senior loan. The rate shown is the coupon as of the end of the reporting period. |
| (5) | Senior Loans generally are subject to mandatory and/or optional prepayment. Because of these mandatory prepayment conditions and because there may be significant economic incentives for a borrower to prepay, prepayments of senior loans may occur. As a result, the actual remaining maturity of senior loans held may be substantially less than the stated maturities shown. |
| (6) | Perpetual security. Maturity date is not applicable. |
| (7) | Contingent Capital Securities (“CoCos”) are hybrid securities with loss absorption characteristics built into the terms of the security for the benefit of the issuer. For example, the terms may specify an automatic write-down of principal or a mandatory conversion into the issuer’s common stock under certain adverse circumstances, such as the issuer’s capital ratio falling below a specified level. |
| (8) | Borrowings as a percentage of Total Investments is 29.6%. |
| (9) | The Fund may pledge up to 100% of its eligible investments (excluding any investments separately pledged as collateral for specific investments in derivatives, when applicable) in the Portfolio of Investments as collateral for borrowings. |
| (10) | Other assets less liabilities includes the unrealized appreciation (depreciation) of certain over-the-counter (“OTC”) derivatives as well as the OTC cleared and exchange-traded derivatives, when applicable. The unrealized appreciation (depreciation) of OTC cleared and exchange-traded derivatives is recognized as part of the cash collateral at brokers and/or the receivable or payable for variation margin as presented on the Statement of Assets and Liabilities, when applicable. |
| (11) | Effective date represents the date on which both the Fund and counterparty commence interest payment accruals on each contract. |
| 144A | Investment is exempt from registration under Rule 144A of the Securities Act of 1933, as amended. These investments may only be resold in transactions exempt from registration, which are normally those transactions with qualified institutional buyers. |
| DD1 | Portion of investment purchased on a delayed delivery basis. |
| LIBOR | London Inter-Bank Offered Rate |
| N/A | Not Applicable. |
| PIK | Payment-in-kind (“PIK”) security. Depending on the terms of the security, income may be received in the form of cash, securities, or a combination of both. The PIK rate shown, where applicable, represents the annualized rate of the last PIK payment made by the issuer as of the end of the reporting period. |
| Reg S | Regulation S allows U.S. companies to sell securities to persons or entities located outside of the United States without registering those securities with the Securities and Exchange Commission. Specifically, Regulation S provides a safe harbor from the registration requirements of the Securities Act for the offers and sales of securities by both foreign and domestic issuers that are made outside the United States. |
| TBD | Senior loan purchased on a when-issued or delayed-delivery basis. Certain details associated with this purchase are not known prior to the settlement date of the transaction. In addition, senior loans typically trade without accrued interest and therefore a coupon rate is not available prior to settlement. At settlement, if still unknown, the borrower or counterparty will provide the Fund with the final coupon rate and maturity date. |
| WI/DD | Purchased on a when-issued or delayed delivery basis. |
See accompanying notes to financial statements.
33
| NPCT | Nuveen Core Plus Impact Fund
Portfolio of Investments December 31, 2021 |
| Principal Amount (000) | Description (1) | Coupon | Maturity | Ratings (2) | Value | |||||||||||||||
LONG-TERM INVESTMENTS – 152.8% (99.9% of Total Investments) |
| |||||||||||||||||||
| CORPORATE BONDS – 90.8% (59.4% of Total Investments) | ||||||||||||||||||||
| Airlines – 0.4% | ||||||||||||||||||||
| $ | 2,000 | Delta Air Lines Inc | 3.750% | 10/28/29 | Baa3 | $ | 2,049,683 | |||||||||||||
| Auto Components – 0.9% | ||||||||||||||||||||
| 5,000 | Dana Inc, (3) | 4.250% | 9/01/30 | BB+ | 5,068,750 | |||||||||||||||
| Automobiles – 3.5% | ||||||||||||||||||||
| 3,510 | Ford Motor Co | 3.250% | 2/12/32 | BB+ | 3,594,240 | |||||||||||||||
| 15,300 | Harley-Davidson Inc, (3) | 4.625% | 7/28/45 | BBB+ | 16,261,044 | |||||||||||||||
| 18,810 | Total Automobiles | 19,855,284 | ||||||||||||||||||
| Banks – 10.0% | ||||||||||||||||||||
| 5,000 | Alimentation Couche-Tard Inc, 144A | 3.625% | 5/13/51 | BBB | 5,258,695 | |||||||||||||||
| 5,000 | Barclays PLC | 3.811% | 3/10/42 | BBB+ | 5,330,489 | |||||||||||||||
| 17,000 | Intesa Sanpaolo SpA, 144A | 4.950% | 6/01/42 | BB+ | 17,465,783 | |||||||||||||||
| 10,000 | Standard Chartered PLC, 144A, (3) | 5.300% | 1/09/43 | BBB+ | 12,136,873 | |||||||||||||||
| 15,000 | UniCredit SpA, 144A | 5.459% | 6/30/35 | Baa3 | 16,342,979 | |||||||||||||||
| 52,000 | Total Banks | 56,534,819 | ||||||||||||||||||
| Building Products – 0.9% | ||||||||||||||||||||
| 5,000 | Carrier Global Corp, (3) | 3.577% | 4/05/50 | BBB | 5,316,136 | |||||||||||||||
| Capital Markets – 1.5% | ||||||||||||||||||||
| 9,000 | Banco BTG Pactual SA/Cayman Islands, 144A | 2.750% | 1/11/26 | Ba2 | 8,538,840 | |||||||||||||||
| Chemicals – 3.4% | ||||||||||||||||||||
| 5,000 | LG Chem Ltd, 144A | 2.375% | 7/07/31 | BBB+ | 4,916,034 | |||||||||||||||
| 5,000 | LYB International Finance III LLC | 3.800% | 10/01/60 | BBB | 5,277,608 | |||||||||||||||
| 8,387 | Star Energy Geothermal Wayang Windu Ltd, 144A | 6.750% | 4/24/33 | Ba3 | 9,183,765 | |||||||||||||||
| 18,387 | Total Chemicals | 19,377,407 | ||||||||||||||||||
| Commercial Services & Supplies – 0.5% | ||||||||||||||||||||
| 2,040 | New York Public Library Astor Lenox & Tilden Foundations | 4.305% | 7/01/45 | AA– | 2,552,671 | |||||||||||||||
| Communications Equipment – 1.8% | ||||||||||||||||||||
| 10,000 | Vodafone Group PLC | 5.125% | 6/04/81 | BB+ | 10,225,000 | |||||||||||||||
| Diversified Consumer Services – 1.1% | ||||||||||||||||||||
| 6,160 | YMCA of Greater New York | 2.303% | 8/01/26 | BBB | 6,104,359 | |||||||||||||||
| Diversified Financial Services – 1.5% | ||||||||||||||||||||
| 2,400 | Community Preservation Corp | 2.867% | 2/01/30 | AA– | 2,479,727 | |||||||||||||||
| 5,400 | Power Finance Corp Ltd, Reg S | 1.841% | 9/21/28 | Baa3 | 6,123,129 | |||||||||||||||
| 7,800 | Total Diversified Financial Services | 8,602,856 | ||||||||||||||||||
| Diversified Telecommunication Services – 1.0% | ||||||||||||||||||||
| 5,000 | Verizon Communications Inc | 3.700% | 3/22/61 | A– | 5,421,085 | |||||||||||||||
| Electric Utilities – 17.3% | ||||||||||||||||||||
| 2,765 | Consolidated Edison Co of New York Inc | 4.500% | 5/15/58 | A– | 3,381,861 | |||||||||||||||
| 5,000 | EDP – Energias de Portugal SA, Reg S | 1.875% | 3/14/82 | BB+ | 5,415,160 | |||||||||||||||
| 9,000 | India Cleantech Energy, 144A | 4.700% | 8/10/26 | Ba3 | 9,136,350 | |||||||||||||||
| 6,650 | Interchile SA, 144A | 4.500% | 6/30/56 | Baa1 | 7,065,625 | |||||||||||||||
| 10,890 | Inversiones Latin America Power Ltda, 144A | 5.125% | 6/15/33 | Ba1 | 10,444,817 | |||||||||||||||
| 2,000 | Leeward Renewable Energy Operations LLC, 144A | 4.250% | 7/01/29 | Ba3 | 2,020,000 | |||||||||||||||
| 7,330 | Liberty Utilities Finance GP 1, 144A, (3) | 2.050% | 9/15/30 | BBB+ | 6,987,978 | |||||||||||||||
| 7,000 | Pattern Energy Operations LP / Pattern Energy Operations Inc, 144A, (3) | 4.500% | 8/15/28 | BB– | 7,262,500 | |||||||||||||||
| 2,831 | Solar Star Funding LLC, 144A | 5.375% | 6/30/35 | BBB | 3,263,415 | |||||||||||||||
| 13,000 | Southern California Edison Co, (3) | 3.650% | 6/01/51 | A– | 14,084,838 | |||||||||||||||
34
| Principal Amount (000) | Description (1) | Coupon | Maturity | Ratings (2) | Value | |||||||||||||||
| Electric Utilities (continued) | ||||||||||||||||||||
| $ | 5,000 | Star Energy Geothermal Darajat II / Star Energy Geothermal Salak, 144A | 4.850% | 10/14/38 | Baa3 | $ | 5,525,000 | |||||||||||||
| 4,579 | Topaz Solar Farms LLC, 144A, (3) | 5.750% | 9/30/39 | BB | 5,441,129 | |||||||||||||||
| 10,358 | Topaz Solar Farms LLC, 144A | 4.875% | 9/30/39 | BB | 11,680,143 | |||||||||||||||
| 5,800 | Vena Energy Capital Pte Ltd, Reg S | 3.133% | 2/26/25 | BBB– | 5,912,404 | |||||||||||||||
| 92,203 | Total Electric Utilities | 97,621,220 | ||||||||||||||||||
| Electronic Equipment, Instruments & Components – 0.9% | ||||||||||||||||||||
| 5,000 | SK Battery America Inc, Reg S | 2.125% | 1/26/26 | Baa3 | 4,894,588 | |||||||||||||||
| Equity Real Estate Investment Trust – 4.0% | ||||||||||||||||||||
| 9,915 | HAT Holdings I LLC / HAT Holdings II LLC, 144A | 3.375% | 6/15/26 | BB+ | 10,014,150 | |||||||||||||||
| 2,000 | HAT Holdings I LLC / HAT Holdings II LLC, 144A | 3.750% | 9/15/30 | BB+ | 1,995,000 | |||||||||||||||
| 5,000 | Scentre Group Trust 2, 144A | 5.125% | 9/24/80 | BBB+ | 5,356,250 | |||||||||||||||
| 2,000 | Starwood Property Trust Inc, 144A, (3) | 5.500% | 11/01/23 | BB+ | 2,070,000 | |||||||||||||||
| 3,075 | Vornado Realty LP | 3.400% | 6/01/31 | Baa2 | 3,144,737 | |||||||||||||||
| 21,990 | Total Equity Real Estate Investment Trust | 22,580,137 | ||||||||||||||||||
| Gas Utilities – 6.1% | ||||||||||||||||||||
| 15,000 | Brooklyn Union Gas Co, 144A, (3) | 4.273% | 3/15/48 | BBB+ | 17,143,978 | |||||||||||||||
| 17,825 | Southern Co Gas Capital Corp, (3) | 3.150% | 9/30/51 | BBB+ | 17,600,292 | |||||||||||||||
| 32,825 | Total Gas Utilities | 34,744,270 | ||||||||||||||||||
| Health Care Providers & Services – 1.8% | ||||||||||||||||||||
| 10,000 | HCA Inc, (3) | 3.500% | 7/15/51 | BBB– | 10,194,717 | |||||||||||||||
| Household Durables – 1.0% | ||||||||||||||||||||
| 5,000 | Arcelik AS, Reg S | 3.000% | 5/27/26 | BB+ | 5,545,610 | |||||||||||||||
| Independent Power & Renewable Electricity Producers – 11.0% | ||||||||||||||||||||
| 5,000 | AES Corp | 2.450% | 1/15/31 | BBB– | 4,871,528 | |||||||||||||||
| 6,270 | Atlantica Sustainable Infrastructure PLC, 144A | 4.125% | 6/15/28 | BB+ | 6,317,025 | |||||||||||||||
| 7,000 | Azure Power Energy Ltd, 144A | 3.575% | 8/19/26 | BB+ | 7,056,000 | |||||||||||||||
| 2,400 | Clearway Energy Operating LLC, 144A | 4.750% | 3/15/28 | BB | 2,523,000 | |||||||||||||||
| 5,100 | Clearway Energy Operating LLC, 144A | 3.750% | 1/15/32 | BB | 5,061,750 | |||||||||||||||
| 7,050 | Colbun SA, 144A | 3.150% | 1/19/32 | BBB+ | 6,975,975 | |||||||||||||||
| 1,985 | Continuum Energy Levanter Pte Ltd, 144A | 4.500% | 2/09/27 | BB+ | 2,029,662 | |||||||||||||||
| 2,000 | NextEra Energy Operating Partners LP, 144A | 4.500% | 9/15/27 | Ba1 | 2,160,000 | |||||||||||||||
| 13,375 | Renewable Energy Group Inc, 144A, (3) | 5.875% | 6/01/28 | BB | 13,742,813 | |||||||||||||||
| 8,075 | Sunnova Energy Corp, 144A, (3) | 5.875% | 9/01/26 | B1 | 8,236,500 | |||||||||||||||
| 2,886 | UEP Penonome II SA, 144A | 6.500% | 10/01/38 | BB | 3,019,246 | |||||||||||||||
| 61,141 | Total Independent Power & Renewable Electricity Producers | 61,993,499 | ||||||||||||||||||
| Machinery – 1.3% | ||||||||||||||||||||
| 5,000 | Mueller Water Products Inc, 144A, (3) | 4.000% | 6/15/29 | Ba1 | 5,050,000 | |||||||||||||||
| 2,305 | YMCA of Greater New York | 5.021% | 8/01/38 | BBB | 2,554,137 | |||||||||||||||
| 7,305 | Total Machinery | 7,604,137 | ||||||||||||||||||
| Media – 1.9% | ||||||||||||||||||||
| 10,000 | Discovery Communications LLC, (3) | 4.000% | 9/15/55 | BBB– | 10,564,701 | |||||||||||||||
| Metals & Mining – 1.0% | ||||||||||||||||||||
| 5,000 | Teck Resources Ltd | 5.200% | 3/01/42 | BBB– | 5,880,924 | |||||||||||||||
| Mortgage Real Estate Investment Trust – 1.8% | ||||||||||||||||||||
| 4,195 | Starwood Property Trust Inc, 144A | 3.750% | 12/31/24 | BB+ | 4,240,138 | |||||||||||||||
| 5,745 | Starwood Property Trust Inc, 144A | 3.625% | 7/15/26 | BB+ | 5,716,275 | |||||||||||||||
| 9,940 | Total Mortgage Real Estate Investment Trust | 9,956,413 | ||||||||||||||||||
| Multiline Retail – 1.6% | ||||||||||||||||||||
| 10,000 | Nordstrom Inc | 5.000% | 1/15/44 | BBB– | 9,325,000 | |||||||||||||||
35
| NPCT | Nuveen Core Plus Impact Fund (continued) | |
| Portfolio of Investments December 31, 2021 | ||
| Principal Amount (000) | Description (1) | Coupon | Maturity | Ratings (2) | Value | |||||||||||||||
| Multi-Utilities – 0.5% | ||||||||||||||||||||
| $ | 2,244 | Consolidated Edison Co of New York Inc | 4.300% | 12/01/56 | A– | $ | 2,666,449 | |||||||||||||
| Oil, Gas & Consumable Fuels – 5.9% | ||||||||||||||||||||
| 14,828 | Kinder Morgan Inc, (3) | 5.300% | 12/01/34 | BBB | 17,843,977 | |||||||||||||||
| 15,000 | Santos Finance Ltd, 144A, (3) | 3.649% | 4/29/31 | BBB | 15,272,772 | |||||||||||||||
| 29,828 | Total Oil, Gas & Consumable Fuels | 33,116,749 | ||||||||||||||||||
| Pharmaceuticals – 0.9% | ||||||||||||||||||||
| 5,000 | Takeda Pharmaceutical Co Ltd | 3.375% | 7/09/60 | BBB+ | 5,176,792 | |||||||||||||||
| Real Estate Management & Development – 0.4% | ||||||||||||||||||||
| 2,250 | GTC Aurora Luxembourg SA, Reg S | 2.250% | 6/23/26 | BBB– | 2,516,476 | |||||||||||||||
| Road & Rail – 4.0% | ||||||||||||||||||||
| 5,000 | Kansas City Southern/Old | 4.200% | 11/15/69 | BBB | 5,883,459 | |||||||||||||||
| 15,000 | Norfolk Southern Corp | 4.100% | 5/15/21 | BBB+ | 16,958,350 | |||||||||||||||
| 20,000 | Total Road & Rail | 22,841,809 | ||||||||||||||||||
| Trading Companies & Distributors – 2.9% | ||||||||||||||||||||
| 10,800 | GATX Corp, (3) | 3.100% | 6/01/51 | BBB | 10,490,692 | |||||||||||||||
| 6,000 | Triton Container International Ltd, 144A | 3.150% | 6/15/31 | BBB– | 6,050,974 | |||||||||||||||
| 16,800 | Total Trading Companies & Distributors | 16,541,666 | ||||||||||||||||||
| $ | 487,723 | Total Corporate Bonds (cost $511,508,269) | 513,412,047 | |||||||||||||||||
| Principal Amount (000) | Description (1) | Coupon | Maturity | Ratings (2) | Value | |||||||||||||||
$1,000 PAR (OR SIMILAR) INSTITUTIONAL PREFERRED – 23.3% (15.2% of Total Investments) |
| |||||||||||||||||||
| Banks – 7.2% | ||||||||||||||||||||
| $ | 10,375 | Banco Nacional de Comercio Exterior SNC/Cayman Islands, 144A | 2.720% | 8/11/31 | Baa3 | $ | 10,245,416 | |||||||||||||
| 6,250 | Citigroup Inc | 4.150% | N/A (4) | BBB– | 6,351,563 | |||||||||||||||
| 6,250 | JPMorgan Chase & Co | 3.650% | N/A (4) | BBB+ | 6,234,375 | |||||||||||||||
| 11,195 | PNC Financial Services Group Inc | 3.400% | N/A (4) | Baa2 | 11,018,567 | |||||||||||||||
| 6,820 | SVB Financial Group | 4.000% | N/A (4) | Baa2 | 6,854,100 | |||||||||||||||
| 40,890 | Total Banks | 40,704,021 | ||||||||||||||||||
| Communications Equipment – 0.9% | ||||||||||||||||||||
| 5,000 | Vodafone Group PLC | 4.125% | 6/04/81 | BB+ | 4,949,800 | |||||||||||||||
| Consumer Finance – 2.5% | ||||||||||||||||||||
| 3,000 | Ally Financial Inc | 4.700% | N/A (4) | Ba2 | 3,112,500 | |||||||||||||||
| 11,200 | American Express Co | 3.550% | N/A (4) | Baa2 | 11,219,600 | |||||||||||||||
| 14,200 | Total Consumer Finance | 14,332,100 | ||||||||||||||||||
| Electric Utilities – 1.3% | ||||||||||||||||||||
| 2,500 | CMS Energy Corp | 3.750% | 12/01/50 | BBB– | 2,456,250 | |||||||||||||||
| 5,000 | Southern Co, (3) | 3.750% | 9/15/51 | BBB– | 5,000,000 | |||||||||||||||
| 7,500 | Total Electric Utilities | 7,456,250 | ||||||||||||||||||
| Independent Power & Renewable Electricity Producers – 1.0% | ||||||||||||||||||||
| 4,331 | AES Andes SA, 144A | 6.350% | 10/07/79 | BB | 4,408,958 | |||||||||||||||
| 1,500 | Vistra Corp, 144A | 7.000% | N/A (4) | BB– | 1,519,335 | |||||||||||||||
| 5,831 | Total Independent Power & Renewable Electricity Producers | 5,928,293 | ||||||||||||||||||
| Insurance – 5.3% | ||||||||||||||||||||
| 12,400 | Prudential Financial Inc | 5.625% | 6/15/43 | BBB+ | 12,902,304 | |||||||||||||||
| 15,000 | Swiss Re Finance Luxembourg SA, 144A, (3) | 5.000% | 4/02/49 | A | 16,781,250 | |||||||||||||||
| 27,400 | Total Insurance | 29,683,554 | ||||||||||||||||||
36
| Principal Amount (000) | Description (1) | Coupon | Maturity | Ratings (2) | Value | |||||||||||||||
| Multi-Utilities – 2.9% | ||||||||||||||||||||
| $ | 2,500 | CMS Energy Corp | 4.750% | 6/01/50 | BBB– | $ | 2,718,750 | |||||||||||||
| 8,000 | Engie SA, Reg S | 1.875% | N/A (4) | BBB | 9,031,581 | |||||||||||||||
| 4,600 | Sempra Energy | 4.125% | 4/01/52 | BBB– | 4,658,358 | |||||||||||||||
| 15,100 | Total Multi-Utilities | 16,408,689 | ||||||||||||||||||
| Trading Companies & Distributors – 2.2% | ||||||||||||||||||||
| 12,000 | Air Lease Corp | 4.650% | N/A (4) | BB+ | 12,435,000 | |||||||||||||||
| $ | 127,921 | Total $1,000 Par (or similar) Institutional Preferred (cost $133,160,492) | 131,897,707 | |||||||||||||||||
| Principal Amount (000) | Description (1) | Coupon | Maturity | Ratings (2) | Value | |||||||||||||||
ASSET-BACKED SECURITIES – 10.3% ( 6.7% of Total Investments) | ||||||||||||||||||||
| $ | 6,500 | Alen 2021-ACEN Mortgage Trust, 144A, (1-Month LIBOR reference rate + 4.000% spread), (5) | 4.110% | 4/15/34 | BB– | $ | 6,487,304 | |||||||||||||
| 5,000 | BAMLL Commercial Mortgage Securities Trust 2021-JACX, 144A, (1-Month LIBOR reference rate + 3.750% spread), (5) | 3.860% | 9/15/38 | Ba3 | 4,989,339 | |||||||||||||||
| 66,084 | Freddie Mac Multifamily ML Certificates, (I/O), 144A | 0.667% | 3/25/38 | N/R | 4,522,919 | |||||||||||||||
| 46,663 | Freddie Mac Multifamily ML Certificates | 1.219% | 7/25/41 | N/R | 6,116,655 | |||||||||||||||
| 2,273 | GoodLeap Sustainable Home Solutions Trust 2021-3, 144A | 3.500% | 5/20/48 | N/R | 2,185,820 | |||||||||||||||
| 2,750 | GoodLeap Sustainable Home Solutions Trust 2021-4, 144A | 3.500% | 7/20/48 | BB | 2,685,256 | |||||||||||||||
| 10,000 | MFT Trust 2020-ABC, 144A | 3.477% | 2/10/42 | N/R | 9,332,847 | |||||||||||||||
| 6,240 | Mosaic Solar Loan Trust 2020-1, 144A | 0.000% | 4/20/46 | N/R | 5,491,261 | |||||||||||||||
| 5,045 | Mosaic Solar Loans LLC, 144A | 0.000% | 9/20/40 | N/R | 3,329,638 | |||||||||||||||
| 5,661 | Natixis Commercial Mortgage Securities Trust 2019-MILE, 144A, (1-Month LIBOR reference rate + 2.750% spread), (5) | 2.860% | 7/15/36 | N/R | 5,652,506 | |||||||||||||||
| 700 | Natixis Commercial Mortgage Securities Trust 2019-MILE, 144A, (1-Month LIBOR reference rate + 3.500% spread), (5) | 3.610% | 7/15/36 | N/R | 698,439 | |||||||||||||||
| 7,420 | NYC Commercial Mortgage Trust 2021-909, 144A | 3.206% | 4/10/43 | N/R | 6,800,832 | |||||||||||||||
| $ | 164,336 | Asset-Backed Securities (cost $59,168,605) | 58,292,816 | |||||||||||||||||
| Shares | Description (1) | Coupon | Ratings (2) | Value | ||||||||||||||||
$25 PAR (OR SIMILAR) RETAIL PREFERRED – 9.3% (6.1% of Total Investments) |
| |||||||||||||||||||
| Banks – 1.7% | ||||||||||||||||||||
| 300,000 | First Republic Bank/CA | 4.000% | BBB– | $ | 7,350,000 | |||||||||||||||
| 75,000 | First Republic Bank/CA | 4.250% | BBB– | 1,927,500 | ||||||||||||||||
Total Banks | 9,277,500 | |||||||||||||||||||
| Capital Markets – 1.3% | ||||||||||||||||||||
| 300,000 | Affiliated Managers Group Inc | 4.200% | Baa1 | 7,416,000 | ||||||||||||||||
| Equity Real Estate Investment Trust – 1.9% | ||||||||||||||||||||
| 400,000 | Hudson Pacific Properties Inc, (6) | 4.750% | Baa3 | 10,436,000 | ||||||||||||||||
| Independent Power & Renewable Electricity Producers – 0.9% | ||||||||||||||||||||
| 200,000 | Brookfield Renewable Partners LP | 5.250% | BBB– | 5,288,000 | ||||||||||||||||
Multi-Utilities – 1.3% | ||||||||||||||||||||
| 100,426 | Brookfield Infrastructure Partners LP | 5.125% | BBB– | 2,541,782 | ||||||||||||||||
| 200,000 | CMS Energy Corp | 4.200% | BBB– | 5,000,000 | ||||||||||||||||
Total Multi-Utilities | 7,541,782 | |||||||||||||||||||
| Real Estate Management & Development – 0.3% | ||||||||||||||||||||
| 77,904 | Brookfield Property Partners LP | 5.750% | BB | 1,835,418 | ||||||||||||||||
| Trading Companies & Distributors – 1.9% | ||||||||||||||||||||
| 404,000 | Triton International Ltd | 5.750% | BB | 10,956,480 | ||||||||||||||||
Total $25 Par (or similar) Retail Preferred (cost $51,815,556) | 52,751,180 | |||||||||||||||||||
37
| NPCT | Nuveen Core Plus Impact Fund (continued) | |
| Portfolio of Investments December 31, 2021 | ||
| Principal Amount (000) | Description (1) | Coupon | Maturity | Ratings (2) | Value | |||||||||||||||
| MORTGAGE-BACKED SECURITIES – 7.3% (4.8% of Total Investments) | ||||||||||||||||||||
| $ | 3,840 | BENCHMARK 2019-B10 Mortgage Trust, 144A | 3.899% | 3/15/62 | N/R | $ | 3,716,217 | |||||||||||||
| 7,887 | COMM 2020-CX Mortgage Trust, (I/O), 144A | 2.684% | 11/10/46 | N/R | 7,310,001 | |||||||||||||||
| 28,878 | Freddie Mac Multifamily ML Certificates | 2.055% | 1/25/38 | N/R | 5,986,397 | |||||||||||||||
| 5,000 | J.P. Morgan Chase Commercial Mortgage Securities Trust 2018-AON, 144A | 4.613% | 7/05/31 | B | 4,958,811 | |||||||||||||||
| 80,369 | SLG Office Trust 2021-OVA, (I/O), 144A | 0.258% | 7/15/41 | AA– | 1,637,100 | |||||||||||||||
| 3,860 | SLG Office Trust 2021-OVA, 144A | 2.851% | 7/15/41 | N/R | 3,656,439 | |||||||||||||||
| 8,000 | SLG Office Trust 2021-OVA, 144A | 2.851% | 7/15/41 | N/R | 7,192,549 | |||||||||||||||
| 7,000 | VNDO Trust 2016-350P, 144A | 3.903% | 1/10/35 | BB– | 6,683,144 | |||||||||||||||
| $ | 144,834 | Total Mortgage-Backed Securities (cost $42,044,883) | 41,140,658 | |||||||||||||||||
| Principal Amount (000) | Description (1) | Coupon | Maturity | Ratings (2) | Value | |||||||||||||||
| SOVEREIGN DEBT – 6.9% (4.5% of Total Investments) | ||||||||||||||||||||
| Benin – 1.9% | ||||||||||||||||||||
| $ | 10,000 | Benin Government International Bond, 144A | 4.950% | 1/22/35 | B+ | $ | 10,845,105 | |||||||||||||
| Chile – 0.9% | ||||||||||||||||||||
| 5,000 | Chile Government International Bond | 3.100% | 5/07/41 | A1 | 4,892,500 | |||||||||||||||
| Egypt – 0.5% | ||||||||||||||||||||
| 2,500 | Egypt Government International Bond, 144A | 5.250% | 10/06/25 | B+ | 2,518,850 | |||||||||||||||
| Indonesia – 0.9% | ||||||||||||||||||||
| 5,000 | Perusahaan Penerbit SBSN Indonesia III, 144A | 3.550% | 6/09/51 | BBB | 5,100,200 | |||||||||||||||
| Mexico – 1.0% | ||||||||||||||||||||
| 5,000 | Mexico Government International Bond | 2.250% | 8/12/36 | BBB | 5,486,733 | |||||||||||||||
| Peru – 1.7% | ||||||||||||||||||||
| 9,870 | Peruvian Government International Bond | 3.000% | 1/15/34 | BBB+ | 9,830,520 | |||||||||||||||
| $ | 37,370 | Total Sovereign Debt (cost $39,862,424) | 38,673,908 | |||||||||||||||||
| Principal Amount (000) | Description (1) | Optional Call Provisions (7) | Ratings (2) | Value | ||||||||||||||||
MUNICIPAL BONDS – 2.5% (1.6% of Total Investments) |
| |||||||||||||||||||
Arizona – 0.1% | ||||||||||||||||||||
| $ | 810 | Arizona Industrial Development Authority, Arizona, Education Revenue Bonds, KIPPC NYC Public Charter Schools – Gerard Facility Project, Series 2021C, 3.250%, 7/01/31 | No Opt. Call | BBB– | $ | 813,900 | ||||||||||||||
| District of Columbia – 0.1% | ||||||||||||||||||||
| 220 | District of Columbia Water and Sewer Authority, Public Utility Revenue Bonds, Taxable Senior Lien Green Series 2014A, 4.814%, 10/01/14 | No Opt. Call | AAA | 331,513 | ||||||||||||||||
| Michigan – 1.0% | ||||||||||||||||||||
City of Detroit MI: | ||||||||||||||||||||
| 1,000 | 2.960%, 4/01/27 | No Opt. Call | BB– | 998,264 | ||||||||||||||||
| 500 | 3.110%, 4/01/28 | No Opt. Call | BB– | 496,786 | ||||||||||||||||
| 2,245 | 3.244%, 4/01/29 | No Opt. Call | BB– | 2,224,688 | ||||||||||||||||
| 425 | 3.344%, 4/01/30 | No Opt. Call | BB– | 421,074 | ||||||||||||||||
| 1,575 | Detroit, Wayne County, Michigan, General Obligation Bonds, Taxable Series 2021B, 3.644%, 4/01/34 | 4/31 at 100.00 | BB– | 1,571,479 | ||||||||||||||||
| 5,745 | Total Michigan | 5,712,291 | ||||||||||||||||||
New York – 1.3% |
| |||||||||||||||||||
| 5,300 | Metropolitan Transportation Authority, New York, Transportation Revenue Bonds, Taxable Green Climate Certified Series 2020C–2, 5.175%, 11/15/49 | No Opt. Call | A3 | 7,290,945 | ||||||||||||||||
| $ | 12,075 | Total Municipal Bonds (cost $14,018,132) | 14,148,649 | |||||||||||||||||
38
| Principal Amount (000) | Description (1) | Coupon (8) | Reference Rate (8) | Spread (8) | Maturity (9) | Ratings (2) | Value | |||||||||||||||||||||
VARIABLE RATE SENIOR LOAN INTERESTS – 2.4% (1.6% of Total Investments) (8) |
| |||||||||||||||||||||||||||
| Airlines – 0.4% | ||||||||||||||||||||||||||||
| $ | 2,388 | SkyMiles IP Ltd., Term Loan B, (WI/DD) | TBD | TBD | TBD | TBD | Baa1 | $ | 2,530,750 | |||||||||||||||||||
| Commercial Services & Supplies – 0.8% | ||||||||||||||||||||||||||||
| 4,477 | Liberty Tire Recycling Holdco, LLC, Term Loan | 5.500% | 3-Month LIBOR | 4.500% | 5/07/28 | B– | 4,460,732 | |||||||||||||||||||||
| Electric Utilities – 1.2% | ||||||||||||||||||||||||||||
| 6,502 | ExGen Renewables IV, LLC, Term Loan | 3.500% | 3-Month LIBOR | 2.500% | 12/15/27 | BB– | 6,513,062 | |||||||||||||||||||||
| $ | 13,367 | Total Variable Rate Senior Loan Interests (cost $13,489,889) |
| 13,504,544 | ||||||||||||||||||||||||
Total Long-Term Investments (cost $865,068,250) |
| 863,821,509 | ||||||||||||||||||||||||||
| Principal Amount (000) | Description (1) | Coupon | Maturity | Value | ||||||||||||||||||||||||
SHORT-TERM INVESTMENTS – 0.2% (0.1% of Total Investments) |
| |||||||||||||||||||||||||||
REPURCHASE AGREEMENTS – 0.2% (0.1% of Total Investments) |
| |||||||||||||||||||||||||||
| $ | 1,091 | Repurchase Agreement with Fixed Income Clearing Corporation, dated 12/31/21, repurchase price $1,090,714, collateralized by $1,120,100, U.S. Treasury Bonds, 1.875%, due 2/15/41, value $1,112,618 |
| 0.000% | 1/03/22 | $ | 1,090,714 | |||||||||||||||||||||
Total Short-Term Investments (cost $1,090,714) | 1,090,714 | |||||||||||||||||||||||||||
Total Investments (cost $866,158,964) – 153.0% | 864,912,223 | |||||||||||||||||||||||||||
Borrowings – (29.5)% (10), (11) | (167,000,000 | ) | ||||||||||||||||||||||||||
Reverse Repurchase Agreements, including accrued interest – (24.4)% (12) |
| (137,913,878 | ) | |||||||||||||||||||||||||
Other Assets Less Liabilities – 0.9% (13) | 5,277,706 | |||||||||||||||||||||||||||
Net Assets – 100% | $ | 565,276,051 | ||||||||||||||||||||||||||
Investments in Derivatives
Forward Foreign Currency Contracts
| Currency Purchased | Notional Amount (Local Currency) | Currency Sold | Notional Amount (Local Currency) | Counterparty | Settlement Date | Unrealized Appreciation (Depreciation) | ||||||||||||||
U.S. Dollar | 11,147,338 | Euro | 9,638,918 | Morgan Stanley Capital Services LLC | 1/14/2022 | $ | 171,275 | |||||||||||||
Total | $ | 171,275 | ||||||||||||||||||
Total unrealized appreciation on forward foreign currency contracts | $ | 171,275 | ||||||||||||||||||
Total unrealized depreciation on forward foreign currency contracts | $ | — | ||||||||||||||||||
Cross Currency Swaps – OTC Uncleared
| Counterparty | Terms of payments to be paid | Terms of payments to be received | Currency | Maturity Date | Notional Amount (Local Currency) | Value | Upfront Premiums Paid (Received) | Unrealized Appreciation (Depreciation) | ||||||||||||||||||||||||
Citibank N.A. | Fixed semi-annual 3.562 | % | USD | 6/23/26 | 2,725,875 | 126,630 | 24,562 | 102,068 | ||||||||||||||||||||||||
| Fixed annual 2.250 | % | EUR | 2,250,000 | |||||||||||||||||||||||||||||
Morgan Stanley Capital Services LLC | Fixed annual 3.337 | % | | USD | | 9/21/28 | | 6,376,320 | | 254,430 | (3 | ) | 254,433 | |||||||||||||||||||
| Fixed semi-annual 1.841 | % | EUR | 5,400,000 | |||||||||||||||||||||||||||||
Morgan Stanley Capital Services LLC | Fixed annual 4.330 | % | USD | 5/27/26 | 6,088,500 | 326,364 | 4,250 | 322,114 | ||||||||||||||||||||||||
| Fixed semi-annual 3.000 | % | EUR | 5,000,000 | |||||||||||||||||||||||||||||
J.P. Morgan Securities Inc. | Fixed annual 3.431 | % | USD | 6/14/29 | 5,905,000 | 262,719 | (4,177 | ) | 266,896 | |||||||||||||||||||||||
| Fixed semi-annual 1.875 | % | EUR | 5,000,000 | |||||||||||||||||||||||||||||
Citibank N.A. | Fixed annual 3.775 | % | USD | 8/12/36 | 5,909,000 | 324,352 | 12,242 | 312,110 | ||||||||||||||||||||||||
| Fixed semi-annual 2.250 | % | EUR | 5,000,000 | |||||||||||||||||||||||||||||
Citibank N.A. | Fixed annual 3.472 | % | USD | 7/2/31 | 5,904,500 | 318,803 | 16,825 | 301,978 | ||||||||||||||||||||||||
| Fixed semi-annual 1.875 | % | EUR | 5,000,000 | |||||||||||||||||||||||||||||
Citibank N.A. | Fixed annual 3.493 | % | USD | 7/2/31 | 3,543,900 | 199,487 | (6,661 | ) | 206,148 | |||||||||||||||||||||||
| Fixed semi-annual 1.875 | % | EUR | 3,000,000 | |||||||||||||||||||||||||||||
Total | $ | 1,812,785 | $ | 47,038 | $ | 1,765,747 | ||||||||||||||||||||||||||
39
| NPCT | Nuveen Core Plus Impact Fund (continued) | |
| Portfolio of Investments December 31, 2021 | ||
For Fund portfolio compliance purposes, the Fund’s industry classifications refer to any one or more of the industry sub-classifications used by one or more widely recognized market indexes or ratings group indexes, and/or as defined by Fund management. This definition may not apply for purposes of this report, which may combine industry sub-classifications into sectors for reporting ease.
| (1) | All percentages shown in the Portfolio of Investments are based on net assets applicable to common shares unless otherwise noted. |
| (2) | The Fund uses credit quality ratings for its portfolio securities provided by Standard & Poor’s Group (“Standard & Poor’s”), Moody’s Investors Service, Inc. (“Moody’s”) and Fitch, Inc. (“Fitch”). If all three provide a rating for a security, the middle is used; if two of the three agencies rate a security, the lower rating is used; and if only one rating agency rates a security, that rating is used. This treatment of splitrated securities may differ from that used for other purposes, such as for Fund investment policies. Ratings below BBB by Standard & Poor’s, Baa by Moody’s or BBB by Fitch are considered to be below investment grade. Holdings designated N/R are not rated by any of these national rating agencies. |
| (3) | Investment, or portion of investment, has been pledged to collateralize the net payment obligations for investments in reverse repurchase agreements. As of the end of the reporting period, investments with a value of $166,318,259 have been pledged as collateral for reverse repurchase agreements. |
| (4) | Perpetual security. Maturity date is not applicable. |
| (5) | Variable rate security. The rate shown is the coupon as of the end of the reporting period. |
| (6) | Non-income producing; issuer has not declared an ex-dividend date within the past twelve months. |
| (7) | Optional Call Provisions: Dates (month and year) and prices of the earliest optional call or redemption. There may be other call provisions at varying prices at later dates. Certain mortgage-backed securities may be subject to periodic principal paydowns. Optional Call Provisions are not covered by the report of independent registered public accounting firm. |
| (8) | Senior loans generally pay interest at rates which are periodically adjusted by reference to a base short-term, floating lending rate (Reference Rate) plus an assigned fixed rate (Spread). These floating lending rates are generally (i) the lending rate referenced by the London Inter-Bank Offered Rate (“LIBOR”), or (ii) the prime rate offered by one or more major United States banks. Senior loans may be considered restricted in that the Fund ordinarily is contractually obligated to receive approval from the agent bank and/or borrower prior to the disposition of a senior loan. The rate shown is the coupon as of the end of the reporting period. |
| (9) | Senior Loans generally are subject to mandatory and/or optional prepayment. Because of these mandatory prepayment conditions and because there may be significant economic incentives for a borrower to prepay, prepayments of senior loans may occur. As a result, the actual remaining maturity of senior loans held may be substantially less than the stated maturities shown. |
| (10) | Borrowings as a percentage of Total Investments is 19.3%. |
| (11) | The Fund may pledge up to 100% of its eligible investments (excluding any investments separately pledged as collateral for specific investments in derivatives, when applicable) in the Portfolio of Investments as collateral for borrowings. |
| (12) | Reverse Repurchase Agreements as a percentage of Total Investments is 15.9%. |
| (13) | Other assets less liabilities includes the unrealized appreciation (depreciation) of certain over-the-counter (“OTC”) derivatives as well as the OTC cleared and exchange-traded derivatives, when applicable. The unrealized appreciation (depreciation) of OTC cleared and exchange-traded derivatives is recognized as part of the cash collateral at brokers and/or the receivable or payable for variation margin as presented on the Statement of Assets and Liabilities, when applicable. |
| 144A | Investment is exempt from registration under Rule 144A of the Securities Act of 1933, as amended. These investments may only be resold in transactions exempt from registration, which are normally those transactions with qualified institutional buyers. |
| I/O | Interest only security |
| LIBOR | London Inter-Bank Offered Rate |
| N/A | Not Applicable. |
| Reg S | Regulation S allows U.S. companies to sell securities to persons or entities located outside of the United States without registering those securities with the Securities and Exchange Commission. Specifically, Regulation S provides a safe harbor from the registration requirements of the Securities Act for the offers and sales of securities by both foreign and domestic issuers that are made outside the United States. |
| TBD | Senior loan purchased on a when-issued or delayed-delivery basis. Certain details associated with this purchase are not known prior to the settlement date of the transaction. In addition, senior loans typically trade without accrued interest and therefore a coupon rate is not available prior to settlement. At settlement, if still unknown, the borrower or counterparty will provide the Fund with the final coupon rate and maturity date. |
| WI/DD | Purchased on a when-issued or delayed delivery basis. |
See accompanying notes to financial statements.
40
| JLS | Nuveen Mortgage and Income Fund
Portfolio of Investments December 31, 2021 |
| Principal Amount (000) | Description (1) | Coupon | Maturity | Ratings (2) | Value | |||||||||||||||
LONG-TERM INVESTMENTS – 135.0% (99.9% of Total Investments) |
| |||||||||||||||||||
MORTGAGE-BACKED SECURITIES – 93.5% (69.2% of Total Investments) |
| |||||||||||||||||||
| $ | 1,500 | ACRE Commercial Mortgage 2021-FL4 Ltd, 144A, (1-Month LIBOR reference rate + 2.600% spread), (3), (4) | 2.704% | 12/18/37 | N/R | $ | 1,492,695 | |||||||||||||
| 500 | Alen 2021-ACEN Mortgage Trust, 144A, (1-Month LIBOR reference rate + 4.000% spread), (4) | 4.110% | 4/15/34 | BB– | 499,023 | |||||||||||||||
| 1,000 | Angel Oak Mortgage Trust 2019-5, 144A | 3.957% | 10/25/49 | BB | 996,688 | |||||||||||||||
| 1,000 | BANK 2017-BNK6, (3) | 3.851% | 7/15/60 | A | 1,038,399 | |||||||||||||||
| 1,000 | BANK 2019-BNK21, 144A | 2.500% | 10/17/52 | BBB | 877,646 | |||||||||||||||
| 1,000 | BBCMS Mortgage Trust 2020-C6, 144A | 3.688% | 2/15/53 | N/R | 1,030,037 | |||||||||||||||
| 2,673 | BCAP LLC Trust 2007-AA1, (1-Month LIBOR reference rate + 0.180% spread), (4) | 0.282% | 3/25/37 | Caa3 | 2,630,704 | |||||||||||||||
| 1,500 | Benchmark 2020-B18 Mortgage Trust, 144A, (3) | 4.139% | 7/15/53 | B– | 1,490,677 | |||||||||||||||
| 230 | Benchmark 2020-B22 Mortgage Trust, (3) | 2.697% | 1/15/54 | A– | 222,774 | |||||||||||||||
| 1,250 | BX Commercial Mortgage Trust 2021-XL2, 144A, (1-Month LIBOR reference rate + 1.846% spread), (4) | 1.956% | 10/15/38 | N/R | 1,242,244 | |||||||||||||||
| 845 | CD 2016-CD1 Mortgage Trust, (3) | 3.631% | 8/10/49 | A– | 847,851 | |||||||||||||||
| 1,500 | CD 2016-CD2 Mortgage Trust | 3.983% | 11/10/49 | A– | 1,511,122 | |||||||||||||||
| 1,028 | CD 2017-CD3 Mortgage Trust, (3) | 4.555% | 2/10/50 | A– | 1,040,174 | |||||||||||||||
| 25 | CF 2020-P1 Mortgage Trust, 144A | 2.840% | 4/15/25 | N/R | 25,454 | |||||||||||||||
| 750 | CF 2020-P1 Mortgage Trust, 144A | 10.010% | 4/15/52 | N/R | 782,910 | |||||||||||||||
| 557 | CHL Mortgage Pass-Through Trust 2006-HYB1 | 2.652% | 3/20/36 | Caa3 | 561,171 | |||||||||||||||
| 500 | Citigroup Commercial Mortgage Trust 2021-PRM2, 144A, (1-Month LIBOR reference rate + 2.400% spread), (4) | 2.510% | 10/15/36 | N/R | 499,108 | |||||||||||||||
| 1,500 | COMM 2013-LC13 Mortgage Trust, 144A | 5.261% | 8/10/46 | BB– | 1,447,945 | |||||||||||||||
| 700 | COMM 2014-CCRE15 Mortgage Trust, 144A | 4.691% | 2/10/47 | Baa3 | 716,193 | |||||||||||||||
| 1,469 | COMM 2014-CCRE19 Mortgage Trust, 144A, (3) | 4.703% | 8/10/47 | BBB– | 1,441,164 | |||||||||||||||
| 1,500 | COMM 2014-UBS3 Mortgage Trust, 144A, (3) | 4.767% | 6/10/47 | N/R | 1,459,520 | |||||||||||||||
| 1,000 | COMM 2015-CCRE22 Mortgage Trust, 144A | 3.000% | 3/10/48 | BB– | 888,666 | |||||||||||||||
| 1,750 | COMM 2015-CCRE23 Mortgage Trust, (3) | 4.286% | 5/10/48 | N/R | 1,733,599 | |||||||||||||||
| 1,500 | COMM 2015-CCRE24 Mortgage Trust, (3) | 3.463% | 8/10/48 | BBB– | 1,385,096 | |||||||||||||||
| 800 | COMM 2015-CCRE25 Mortgage Trust, (3) | 4.530% | 8/10/48 | A– | 828,986 | |||||||||||||||
| 1,245 | COMM 2015-CCRE25 Mortgage Trust | 3.780% | 8/10/48 | BB | 1,157,190 | |||||||||||||||
| 3,030 | Connecticut Avenue Securities Trust 2021-R01, 144A, (SOFR30A reference rate + 3.100% spread), (4) | 3.150% | 10/25/41 | B+ | 3,061,488 | |||||||||||||||
| 3,000 | Connecticut Avenue Securities Trust 2021-R01, 144A, (SOFR30A reference rate + 6.000% spread), (4) | 6.050% | 10/25/41 | N/R | 3,067,462 | |||||||||||||||
| 625 | Connecticut Avenue Securities Trust 2021-R03, 144A, (SOFR30A reference rate + 5.500% spread), (4) | 5.550% | 12/25/41 | N/R | 626,936 | |||||||||||||||
| 800 | CPT MORTGAGE TRUST, 144A | 2.997% | 11/13/39 | N/R | 761,512 | |||||||||||||||
| 33,000 | DOLP Trust 2021-NYC, (I/O), 144A | 0.665% | 5/10/41 | A– | 1,615,941 | |||||||||||||||
| 1,324 | Fannie Mae Connecticut Avenue Securities, (1-Month LIBOR reference rate + 3.000% spread), (4), (5) | 3.103% | 7/25/24 | Aaa | 1,344,322 | |||||||||||||||
| 3,353 | Fannie Mae Connecticut Avenue Securities, (1-Month LIBOR reference rate + 2.100% spread), (4), (5) | 2.203% | 3/25/31 | Aaa | 3,379,170 | |||||||||||||||
| 1,400 | Fannie Mae Connecticut Avenue Securities, 144A, (SOFR30A reference rate + 3.300% spread), (4) | 3.350% | 11/25/41 | B+ | 1,410,473 | |||||||||||||||
| 738 | Farmer Mac Agricultural Real Estate Trust 1992-A, 144A | 3.249% | 1/25/51 | N/R | 653,323 | |||||||||||||||
| 660 | First Horizon Alternative Mortgage Securities Trust 2005-AA7 | 2.347% | 9/25/35 | N/R | 643,060 | |||||||||||||||
| 1,368 | First Horizon Alternative Mortgage Securities Trust 2006-FA3 | 6.000% | 7/25/36 | N/R | 876,866 | |||||||||||||||
| 91 | Flagstar Mortgage Trust 2017-2, 144A | 4.080% | 10/25/47 | A3 | 91,924 | |||||||||||||||
| 7,777 | Freddie Mac Multifamily ML Certificates | 1.219% | 7/25/41 | N/R | 1,019,442 | |||||||||||||||
| 2,970 | Freddie Mac Stacr Remic Trust 2020-DNA1, 144A, (1-Month LIBOR reference rate + 2.300% spread), (4) | 2.403% | 12/25/49 | B | 2,968,205 | |||||||||||||||
| 4,900 | Freddie Mac STACR Remic Trust 2020-DNA2, 144A, (1-Month LIBOR reference rate + 2.500% spread), (3), (4) | 2.603% | 2/25/50 | B | 4,909,101 | |||||||||||||||
| 1,650 | Freddie Mac STACR REMIC Trust 2020-DNA6, 144A, (SOFR30A reference rate + 3.000% spread), (4) | 3.050% | 12/25/50 | B+ | 1,661,172 | |||||||||||||||
| 3,000 | Freddie Mac STACR REMIC Trust 2021-DNA5, 144A, (SOFR30A reference rate + 3.050% spread), (3), (4) | 3.100% | 1/25/34 | BB– | 3,013,221 | |||||||||||||||
| 2,000 | Freddie Mac STACR REMIC Trust 2021-DNA6, 144A, (SOFR30A reference rate + 7.500% spread), (4) | 7.550% | 10/25/41 | N/R | 2,074,831 | |||||||||||||||
| 2,000 | Freddie Mac STACR REMIC Trust 2021-HQA1, 144A, (SOFR30A reference rate + 2.250% spread), (3), (4) | 2.300% | 8/25/33 | Ba1 | 2,013,229 | |||||||||||||||
41
| JLS | Nuveen Mortgage and Income Fund (continued) | |
| Portfolio of Investments December 31, 2021 | ||
| Principal Amount (000) | Description (1) | Coupon | Maturity | Ratings (2) | Value | |||||||||||||||
| $ | 3,000 | Freddie Mac STACR REMIC Trust 2021-HQA2, 144A, (SOFR30A reference rate + 2.050% spread), (3), (4) | 2.100% | 12/25/33 | Ba1 | $ | 3,005,707 | |||||||||||||
| 3,300 | Freddie Mac STACR REMIC Trust 2021-HQA4, 144A, (SOFR30A reference rate + 3.750% spread), (3), (4) | 3.800% | 12/25/41 | N/R | 3,318,587 | |||||||||||||||
| 3,000 | Freddie Mac STACR Trust 2019-DNA4, 144A, (1-Month LIBOR reference rate + 2.700% spread), (4) | 2.803% | 10/25/49 | B | 3,017,923 | |||||||||||||||
| 164 | Freddie Mac Strips, (1-Month LIBOR reference rate + 5.920% spread), (I/O), (4) | 5.810% | 3/15/44 | N/R | 28,144 | |||||||||||||||
| 1,500 | Freddie Mac Structured Agency Credit Risk Debt Notes, (1-Month LIBOR reference rate + 2.350% spread), (3), (4) | 2.453% | 4/25/30 | A3 | 1,523,859 | |||||||||||||||
| 1,020 | Freddie Mac Structured Agency Credit Risk Debt Notes, 144A, (SOFR30A reference rate + 4.000% spread), (4) | 4.050% | 11/25/50 | Ba3 | 1,065,124 | |||||||||||||||
| 1,400 | GS Mortgage Securities Corp II, 144A, (1-Month LIBOR reference rate + 3.350% spread), (4) | 3.460% | 11/15/36 | N/R | 1,396,893 | |||||||||||||||
| 1,500 | GS Mortgage Securities Corp Trust 2017-SLP, 144A | 4.591% | 10/10/32 | B | 1,490,410 | |||||||||||||||
| 1,000 | GS Mortgage Securities Corp Trust 2018-TWR, 144A, (1-Month LIBOR reference rate + 1.450% spread), (3), (4) | 1.560% | 7/15/31 | A– | 974,803 | |||||||||||||||
| 1,100 | GS Mortgage Securities Corp Trust 2018-TWR, 144A, (1-Month LIBOR reference rate + 1.600% spread), (4) | 1.710% | 7/15/31 | BBB– | 1,061,206 | |||||||||||||||
| 700 | GS Mortgage Securities Corp Trust 2018-TWR, 144A, (1-Month LIBOR reference rate + 2.100% spread), (4) | 2.210% | 7/15/31 | BB– | 675,517 | |||||||||||||||
| 700 | GS Mortgage Securities Corp Trust 2018-TWR, 144A, (1-Month LIBOR reference rate + 2.800% spread), (4) | 2.910% | 7/15/31 | B– | 666,123 | |||||||||||||||
| 700 | GS Mortgage Securities Corp Trust 2018-TWR, 144A, (1-Month LIBOR reference rate + 3.925% spread), (4) | 4.035% | 7/15/31 | N/R | 608,801 | |||||||||||||||
| 1,250 | GS Mortgage Securities Trust 2016-GS4, (3) | 3.961% | 11/10/49 | A– | 1,223,502 | |||||||||||||||
| 500 | GS Mortgage Securities Trust 2019-GC40, 144A | 3.550% | 7/10/52 | BBB– | 504,582 | |||||||||||||||
| 546 | Hudson Yards, 144A | 2.943% | 12/10/41 | Baa3 | 535,759 | |||||||||||||||
| 1,000 | Hudson Yards, 144A | 2.943% | 12/10/41 | N/R | 925,081 | |||||||||||||||
| 1,590 | IndyMac INDX Mortgage Loan Trust 2005-AR11 | 2.961% | 8/25/35 | Caa3 | 1,448,342 | |||||||||||||||
| 287 | JP Morgan Chase Commercial Mortgage Securities Trust 2019-ICON UES, 144A | 4.452% | 5/05/32 | BBB– | 289,479 | |||||||||||||||
| 441 | JP Morgan Chase Commercial Mortgage Securities Trust 2019-ICON UES, 144A | 4.452% | 5/05/32 | BB– | 435,213 | |||||||||||||||
| 366 | JP Morgan Chase Commercial Mortgage Securities Trust 2020-NNN, 144A | 3.972% | 1/16/37 | N/R | 358,544 | |||||||||||||||
| 500 | JP Morgan Chase Commercial Mortgage Securities Trust 2020-NNN, 144A | 3.620% | 1/16/37 | BBB– | 496,000 | |||||||||||||||
| 755 | JP Morgan Mortgage Trust 2006-A6 | 2.931% | 10/25/36 | N/R | 659,373 | |||||||||||||||
| 913 | JP Morgan Mortgage Trust 2018-6, 144A | 3.917% | 12/25/48 | Baa3 | 903,739 | |||||||||||||||
| 1,600 | JPMBB Commercial Mortgage Securities Trust 2014-C22, (3) | 4.553% | 9/15/47 | BBB | 1,555,468 | |||||||||||||||
| 1,000 | JPMBB Commercial Mortgage Securities Trust 2015-C27, (3) | 3.898% | 2/15/48 | N/R | 1,027,962 | |||||||||||||||
| 760 | JPMBB Commercial Mortgage Securities Trust 2015-C29, (3) | 4.118% | 5/15/48 | AA– | 774,920 | |||||||||||||||
| 400 | JPMBB Commercial Mortgage Securities Trust 2015-C29 | 4.199% | 5/15/48 | A– | 387,695 | |||||||||||||||
| 1,189 | JPMBB Commercial Mortgage Securities Trust 2016-C1, (3) | 4.732% | 3/15/49 | A– | 1,258,085 | |||||||||||||||
| 1,500 | JPMCC Commercial Mortgage Securities Trust 2017-JP7, 144A, (3) | 4.396% | 9/15/50 | BBB | 1,486,780 | |||||||||||||||
| 600 | Morgan Stanley Bank of America Merrill Lynch Trust 2014 C19, (3) | 4.000% | 12/15/47 | N/R | 618,356 | |||||||||||||||
| 226 | Morgan Stanley Capital I Trust 2015-MS1 | 4.031% | 5/15/48 | N/R | 237,578 | |||||||||||||||
| 217 | Morgan Stanley Mortgage Loan Trust 2007-15AR | 2.790% | 11/25/37 | CCC | 184,153 | |||||||||||||||
| 2,000 | MRCD Mortgage Trust, 144A | 2.718% | 12/15/36 | N/R | 1,949,291 | |||||||||||||||
| 1,000 | Natixis Commercial Mortgage Securities Trust 2019-MILE, 144A, (1-Month LIBOR reference rate + 2.750% spread), (3), (4) | 2.860% | 7/15/36 | N/R | 998,500 | |||||||||||||||
| 1,050 | Natixis Commercial Mortgage Securities Trust 2019-MILE, 144A, (1-Month LIBOR reference rate + 4.250% spread), (4) | 4.360% | 7/15/36 | N/R | 1,042,866 | |||||||||||||||
| 2,000 | OPG Trust 2021-PORT, 144A, (1-Month LIBOR reference rate + 1.529% spread), (4) | 1.639% | 10/15/36 | N/R | 1,961,951 | |||||||||||||||
| 1,000 | PKHL Commercial Mortgage Trust 2021-MF, 144A, (1-Month LIBOR reference rate + 2.000% spread), (4) | 2.110% | 7/15/38 | BBB– | 998,557 | |||||||||||||||
| 1,505 | RALI Series 2007-QS2 Trust | 6.250% | 1/25/37 | Caa3 | 1,444,636 | |||||||||||||||
| 40,180 | SLG Office Trust 2021-OVA, (I/O), 144A | 0.258% | 7/15/41 | AA– | 818,459 | |||||||||||||||
| 1,000 | SLG Office Trust 2021-OVA, 144A | 2.851% | 7/15/41 | N/R | 899,069 | |||||||||||||||
| 1,500 | Spruce Hill Mortgage Loan Trust 2020-SH1, 144A | 3.827% | 1/28/50 | BB | 1,496,124 | |||||||||||||||
| 1,000 | UBS-Barclays Commercial Mortgage Trust 2013-C5, 144A, (3) | 3.649% | 3/10/46 | Aa3 | 1,001,549 | |||||||||||||||
| 200 | Verus Securitization Trust 2019-3, 144A | 4.043% | 7/25/59 | BB | 201,387 | |||||||||||||||
| 1,500 | VNDO Trust 2016-350P, 144A | 3.903% | 1/10/35 | BB– | 1,432,102 | |||||||||||||||
| 1,190 | Wells Fargo Commercial Mortgage Trust 2012-LC5, 144A, (3) | 4.757% | 10/15/45 | Baa3 | 1,201,652 | |||||||||||||||
| 1,300 | Wells Fargo Commercial Mortgage Trust 2015-NXS1, (3) | 4.145% | 5/15/48 | BBB– | 1,306,648 | |||||||||||||||
| 193,157 | Total Mortgage-Backed Securities (cost $114,242,536) | 113,935,213 | ||||||||||||||||||
42
| Principal Amount (000) | Description (1) | Coupon | Maturity | Ratings | Value | |||||||||||||||
ASSET-BACKED SECURITIES – 41.5% ( 30.7% of Total Investments) |
| |||||||||||||||||||
| $ | 1,024 | AASET 2020-1 Trust, 144A | 6.413% | 1/16/40 | B | $ | 475,524 | |||||||||||||
| 919 | Adams Outdoor Advertising LP, 144A | 4.810% | 11/15/48 | A | 947,852 | |||||||||||||||
| 1,500 | Adams Outdoor Advertising LP, 144A | 7.356% | 11/15/48 | BB | 1,543,851 | |||||||||||||||
| 1,093 | Air Canada 2020-2 Class A Pass Through Trust, 144A, (3) | 5.250% | 4/01/29 | A | 1,189,304 | |||||||||||||||
| 1,028 | Air Canada 2020-2 Class B Pass Through Trust, 144A, (3) | 9.000% | 10/01/25 | BBB– | 1,141,474 | |||||||||||||||
| 638 | Avis Budget Rental Car Funding AESOP LLC, 144A | 4.530% | 3/20/23 | BBB | 640,498 | |||||||||||||||
| 225 | Avis Budget Rental Car Funding AESOP LLC, 144A | 4.950% | 3/20/25 | Baa1 | 238,222 | |||||||||||||||
| 1,300 | Avis Budget Rental Car Funding AESOP LLC, 144A | 4.080% | 2/20/28 | Ba2 | 1,288,815 | |||||||||||||||
| 1,000 | Bojangles Issuer LLC, 144A | 3.832% | 10/20/50 | N/R | 1,022,388 | |||||||||||||||
| 500 | Bonanza RE Ltd, 144A, (3-Month U.S. Treasury Bill reference rate + 4.750% spread), (4) | 4.778% | 12/23/24 | N/R | 506,150 | |||||||||||||||
| 574 | British Airways 2020-1 Class A Pass Through Trust, 144A, (3) | 4.250% | 11/15/32 | A+ | 610,864 | |||||||||||||||
| 540 | British Airways 2020-1 Class B Pass Through Trust, 144A, (3) | 8.375% | 11/15/28 | BBB | 619,807 | |||||||||||||||
| 750 | Caelus Re VI Ltd, 144A, (3-Month U.S. Treasury Bill reference rate + 5.380% spread), (4) | 5.408% | 6/07/23 | N/R | 770,175 | |||||||||||||||
| 1,000 | Cajun Global LLC, 144A | 3.931% | 11/20/51 | N/R | 995,290 | |||||||||||||||
| 2,000 | Cars Net Lease Mortgage Notes Series 2020-1, 144A | 4.690% | 12/15/50 | BBB | 2,126,947 | |||||||||||||||
| 775 | CARS-DB4 LP, 144A | 4.520% | 2/15/50 | BBB | 798,559 | |||||||||||||||
| 3 | Carvana Auto Receivables Trust, 144A | 1.000% | 5/10/28 | N/R | 1,229,100 | |||||||||||||||
| 250 | Cayuga Park CLO Ltd, 144A, (3-Month LIBOR reference rate + 6.000% spread), (4) | 6.122% | 7/17/34 | BB– | 248,579 | |||||||||||||||
| 385 | CIFC Funding 2020-II Ltd, 144A, (3-Month LIBOR reference rate + 6.500% spread), (4) | 6.638% | 10/20/34 | BB– | 382,796 | |||||||||||||||
| 411 | DB Master Finance LLC, 144A | 4.021% | 5/20/49 | BBB | 424,950 | |||||||||||||||
| 48 | Domino’s Pizza Master Issuer LLC, 144A | 4.118% | 7/25/47 | BBB+ | 50,361 | |||||||||||||||
| 965 | DRIVEN BRANDS FUNDING LLC, 144A | 4.739% | 4/20/48 | BBB– | 1,002,236 | |||||||||||||||
| 500 | GoldenTree Loan Opportunities IX Ltd, 144A, (3-Month LIBOR reference rate + 5.660% spread), (4) | 5.789% | 10/29/29 | BB– | 482,698 | |||||||||||||||
| 1,980 | Hardee’s Funding LLC, 144A | 3.981% | 12/20/50 | BBB | 2,072,517 | |||||||||||||||
| 644 | Hilton Grand Vacations Trust 2020-A, 144A | 6.420% | 2/25/39 | BBB | 703,890 | |||||||||||||||
| 461 | HIN Timeshare Trust 2020-A, 144A | 5.500% | 10/09/39 | BB | 476,205 | |||||||||||||||
| 329 | HIN Timeshare Trust 2020-A, 144A | 6.500% | 10/09/39 | B | 337,302 | |||||||||||||||
| 1,250 | Hotwire Funding LLC, 144A | 4.459% | 11/20/51 | BB | 1,252,769 | |||||||||||||||
| 529 | Jack in the Box Funding LLC, 144A | 3.982% | 8/25/49 | BBB | 531,575 | |||||||||||||||
| 651 | Jack in the Box Funding LLC, 144A | 4.476% | 8/25/49 | BBB | 675,809 | |||||||||||||||
| 293 | LUNAR AIRCRAFT 2020-1 LTD, 144A | 4.335% | 2/15/45 | BB | 266,012 | |||||||||||||||
| 1,125 | Magnetite XXIII Ltd, 144A, (3-Month LIBOR reference rate + 6.300% spread), (4) | 6.421% | 1/25/35 | BB– | 1,119,567 | |||||||||||||||
| 1,630 | Mexico Remittances Funding Fiduciary Estate Management Sarl, 144A | 4.875% | 1/15/28 | BB+ | 1,519,991 | |||||||||||||||
| 363 | Mosaic Solar Loan Trust 2020-1, 144A | 4.470% | 4/20/46 | N/R | 367,635 | |||||||||||||||
| 364 | Mosaic Solar Loan Trust 2020-1, 144A | 6.910% | 4/20/46 | N/R | 372,039 | |||||||||||||||
| 967 | Mosaic Solar Loan Trust 2020-1, 144A | 0.000% | 4/20/46 | N/R | 851,358 | |||||||||||||||
| 1,302 | Mosaic Solar Loan Trust 2020-2, 144A | 5.420% | 8/20/46 | N/R | 1,328,649 | |||||||||||||||
| 1,404 | Mosaic Solar Loans LLC, 144A | 0.000% | 9/20/40 | N/R | 926,376 | |||||||||||||||
| 689 | MVW 2020-1 LLC, 144A | 4.210% | 10/20/37 | BBB | 705,794 | |||||||||||||||
| 440 | MVW 2020-1 LLC, 144A | 7.140% | 10/20/37 | BB | 462,469 | |||||||||||||||
| 300 | NBC Funding LLC, 144A | 4.970% | 7/30/51 | N/R | 298,492 | |||||||||||||||
| 250 | Oportun Funding XIV LLC, 144A | 3.440% | 3/08/28 | N/R | 251,767 | |||||||||||||||
| 500 | Oportun Funding XIV LLC, 144A | 5.400% | 3/08/28 | N/R | 503,185 | |||||||||||||||
| 350 | Oportun Issuance Trust 2021-C, 144A | 5.570% | 10/08/31 | N/R | 347,842 | |||||||||||||||
| 250 | Purchasing Power Funding 2021-A LLC, 144A | 4.370% | 10/15/25 | N/R | 250,176 | |||||||||||||||
| 1,700 | Purewest Funding LLC, 144A | 4.091% | 12/22/36 | BBB+ | 1,695,532 | |||||||||||||||
| 250 | Putnam RE PTE Ltd, 144A, (1-Month U.S. Treasury Bill reference rate + 5.500% spread), (4) | 5.528% | 6/07/24 | N/R | 255,175 | |||||||||||||||
| 400 | Residential Reinsurance 2020 Ltd, 144A, (3-Month U.S. Treasury Bill reference rate + 6.510% spread), (4) | 6.510% | 12/06/24 | N/R | 409,600 | |||||||||||||||
| 250 | Sanders Re Ltd, 144A, (3-Month U.S. Treasury Bill reference rate + 5.500% spread), (4) | 5.528% | 4/07/22 | N/R | 200,000 | |||||||||||||||
| 500 | SD Re Ltd, 144A, (3-Month U.S. Treasury Bill reference rate + 9.250% spread), (4) | 9.278% | 11/19/24 | N/R | 499,450 | |||||||||||||||
| 1,299 | SERVPRO Master Issuer LLC, 144A | 3.882% | 10/25/49 | BBB– | 1,325,649 | |||||||||||||||
| 582 | Sesac Finance LLC, 144A | 5.216% | 7/25/49 | N/R | 603,700 | |||||||||||||||
| 210 | Sierra Timeshare 2019-3 Receivables Funding LLC, 144A | 4.180% | 8/20/36 | BB | 210,723 | |||||||||||||||
| 631 | Sierra Timeshare 2020-2 Receivables Funding LLC, 144A | 6.590% | 7/20/37 | BB | 658,429 | |||||||||||||||
| 760 | Sonic Capital LLC, 144A | 3.845% | 1/20/50 | BBB | 785,134 | |||||||||||||||
| 647 | START Ireland, 144A | 5.095% | 3/15/44 | BB | 591,544 | |||||||||||||||
43
| JLS | Nuveen Mortgage and Income Fund (continued) | |
| Portfolio of Investments December 31, 2021 | ||
| Principal Amount (000) | Description (1) | Coupon | Maturity | Ratings | Value | |||||||||||||||
| $ | 501 | Taco Bell Funding LLC, 144A | 4.970% | 5/25/46 | BBB | $ | 523,111 | |||||||||||||
| 1,000 | TCW CLO 2021-2 Ltd, 144A, (3-Month LIBOR reference rate + 6.860% spread), (4) | 6.985% | 7/25/34 | BB– | 971,484 | |||||||||||||||
| 1,000 | TES 2017-1 LLC, 144A | 7.740% | 10/20/47 | N/R | 958,097 | |||||||||||||||
| 710 | Tesla Auto Lease Trust 2019-A, 144A | 5.480% | 5/22/23 | Ba3 | 730,117 | |||||||||||||||
| 1,500 | Tesla Auto Lease Trust 2020-A, 144A | 4.640% | 8/20/24 | Ba2 | 1,547,510 | |||||||||||||||
| 1,445 | United Airlines 2020-1 Class A Pass Through Trust, (3) | 5.875% | 10/15/27 | A | 1,583,120 | |||||||||||||||
| 250 | Ursa Re II Ltd, 144A, (3-Month U.S. Treasury Bill reference rate + 6.250% spread), (4) | 6.278% | 12/07/23 | N/R | 255,600 | |||||||||||||||
| 1,650 | Vivint Solar Financing V LLC, 144A | 7.370% | 4/30/48 | N/R | 1,725,984 | |||||||||||||||
| 649 | VR Funding LLC, 144A | 6.420% | 11/15/50 | N/R | 649,423 | |||||||||||||||
| $ | 49,433 | Asset-Backed Securities (cost $50,021,120) | 50,537,241 | |||||||||||||||||
Total Long-Term Investments (cost $164,263,656) | 164,472,454 | |||||||||||||||||||
| Principal Amount (000) | Description (1) | Coupon | Maturity | Ratings (2) | Value | |||||||||||||||
SHORT-TERM INVESTMENTS – 0.2% (0.1% of Total Investments) | ||||||||||||||||||||
U.S. GOVERNMENT AND AGENCY OBLIGATIONS – 0.2% (0.1% of Total Investments) |
| |||||||||||||||||||
| $ | 215 | Federal Home Loan Bank Discount Notes | 0.000% | 1/04/22 | N/R | $ | 215,000 | |||||||||||||
| $ | 215 | Total Short-Term Investments (cost $215,000) | 215,000 | |||||||||||||||||
Total Investments (cost $164,478,656) – 135.2% | 164,687,454 | |||||||||||||||||||
Borrowings – (6.9)% (6), (7) | (8,455,000 | ) | ||||||||||||||||||
Reverse Repurchase Agreements, including accrued interest – (28.2)% (8) |
| (34,288,981 | ) | |||||||||||||||||
Other Assets Less Liabilities – (0.1)% | (158,971 | ) | ||||||||||||||||||
Net Assets – 100% | $ | 121,784,502 | ||||||||||||||||||
For Fund portfolio compliance purposes, the Fund’s industry classifications refer to any one or more of the industry sub-classifications used by one or more widely recognized market indexes or ratings group indexes, and/or as defined by Fund management. This definition may not apply for purposes of this report, which may combine industry sub-classifications into sectors for reporting ease.
| (1) | All percentages shown in the Portfolio of Investments are based on net assets applicable to common shares unless otherwise noted. |
| (2) | For financial reporting purposes, the ratings disclosed are the highest of Standard & Poor’s Group (“Standard & Poor’s”), Moody’s Investors Service, Inc. (“Moody’s”) or Fitch, Inc. (“Fitch”) rating. This treatment of split-rated securities may differ from that used for other purposes, such as for Fund investment policies. Ratings below BBB by Standard & Poor’s, Baa by Moody’s or BBB by Fitch are considered to be below investment grade. Holdings designated N/R are not rated by any of these national rating agencies. Ratings are not covered by the report of independent registered public accounting firm. |
| (3) | Investment, or portion of investment, has been pledged to collateralize the net payment obligations for investments in reverse repurchase agreements. As of the end of the reporting period, investments with a value of $47,712,466 have been pledged as collateral for reverse repurchase agreements. |
| (4) | Variable rate security. The rate shown is the coupon as of the end of the reporting period. |
| (5) | Investment, or portion of investment, is hypothecated. The total value of investments hypothecated as of the end of the reporting period was $4,723,492. |
| (6) | Borrowings as a percentage of Total Investments is 5.1%. |
| (7) | The Fund may pledge up to 100% of its eligible investments (excluding any investments separately pledged as collateral for specific investments in derivatives, when applicable) in the Portfolio of Investments as collateral for borrowings. As of the end of the reporting period, investments with a value of $52,040,949 have been pledged as collateral for borrowings. |
| (8) | Reverse Repurchase Agreements as a percentage of Total Investments is 20.8%. |
| 144A | Investment is exempt from registration under Rule 144A of the Securities Act of 1933, as amended. These investments may only be resold in transactions exempt from registration, which are normally those transactions with qualified institutional buyers. |
| I/O | Interest only security |
| LIBOR | London Inter-Bank Offered Rate |
| SOFR30A | 30 Day Average Secured Overnight Financing Rate |
See accompanying notes to financial statements.
44
Statement of Assets and Liabilities
December 31, 2021
| JGH | NPCT(1) | JLS | ||||||||||
Assets | ||||||||||||
Long-term investments, at value (cost $523,236,543, $865,068,250 and $164,263,656, respectively) | $ | 525,295,410 | $ | 863,821,509 | $ | 164,472,454 | ||||||
Short-term investments, at value (cost approximates value) | 10,776,811 | 1,090,714 | 215,000 | |||||||||
Cash | 2,165,823 | 92,657 | — | |||||||||
Cash collateral at broker for investments in swaps(2) | 4,237,306 | — | — | |||||||||
Swaps premiums paid | — | 47,038 | — | |||||||||
Unrealized appreciation on: | ||||||||||||
Cross currency swaps | — | 1,765,747 | — | |||||||||
Forward foreign currency exchange contracts | — | 171,275 | — | |||||||||
Receivable for: | ||||||||||||
Dividends | 35,938 | 53,534 | — | |||||||||
Interest | 6,931,560 | 6,600,502 | 571,370 | |||||||||
Investments sold | 2,859,197 | 11,250 | — | |||||||||
Reclaims | 16,498 | 125,274 | 1,155 | |||||||||
Other assets | 188,441 | 45,551 | 64,956 | |||||||||
Total assets | 552,506,984 | 873,825,051 | 165,324,935 | |||||||||
Liabilities | ||||||||||||
Cash overdraft | — | — | 445,250 | |||||||||
Borrowings | 159,000,000 | 167,000,000 | 8,455,000 | |||||||||
Reverse repurchase agreements, including accrued interest | — | 137,913,878 | 34,288,981 | |||||||||
Unrealized depreciation on interest rate swaps | 4,236,587 | — | — | |||||||||
Payable for Investments purchased – when-issued/delayed-delivery settlement | 3,113,995 | 2,505,383 | — | |||||||||
Accrued expenses: | ||||||||||||
Interest on borrowings | 5,791 | 144,333 | 13,462 | |||||||||
Management fees | 391,577 | 696,556 | 133,338 | |||||||||
Trustees fees | 121,520 | 11,763 | 65,194 | |||||||||
Other | 163,682 | 277,087 | 139,208 | |||||||||
Total liabilities | 167,033,152 | 308,549,000 | 43,540,433 | |||||||||
Net assets applicable to common shares | $ | 385,473,832 | $ | 565,276,051 | $ | 121,784,502 | ||||||
Common shares outstanding | 23,177,393 | 28,755,000 | 5,487,440 | |||||||||
Net asset value (“NAV”) per common share outstanding | $ | 16.63 | $ | 19.66 | $ | 22.19 | ||||||
Net assets applicable to common shares consist of: | ||||||||||||
Common shares, $0.01 par value per share | $ | 231,774 | $ | 287,550 | $ | 54,874 | ||||||
Paid-in surplus | 476,260,206 | 565,295,626 | 122,987,839 | |||||||||
Total distributable earnings (loss) | (91,018,148 | ) | (307,125 | ) | (1,258,211 | ) | ||||||
Net assets applicable to common shares | $ | 385,473,832 | $ | 565,276,051 | $ | 121,784,502 | ||||||
Authorized common shares | Unlimited | Unlimited | Unlimited | |||||||||
| (1) | Consolidated Statement of Assets and Liabilities (as disclosed in Note 1). |
| (2) | Cash pledged to collateralize the net payment obligations for investments in derivatives is in addition to the Fund’s securities pledged as collateral as noted in the Portfolio of Investments. |
See accompanying notes to financial statements.
45
Year Ended December 31, 2021
| JGH | NPCT(1) | JLS | ||||||||||
| Investment Income | ||||||||||||
Dividends | $ | 393,712 | $ | 882,707 | $ | — | ||||||
Interest | 30,338,915 | 13,858,493 | 6,852,332 | |||||||||
Rehypothecation income | — | — | 4,030 | |||||||||
Tax withheld | (3,366 | ) | (33,255 | ) | — | |||||||
Total Investment Income | 30,729,261 | 14,707,945 | 6,856,362 | |||||||||
Expenses | ||||||||||||
Management fees | 4,674,717 | 4,501,506 | 1,555,224 | |||||||||
Interest expense | 1,376,062 | 732,193 | 556,105 | |||||||||
Custodian fees | 93,401 | 168,106 | 42,678 | |||||||||
Trustees fees | 33,156 | 19,590 | 4,771 | |||||||||
Professional fees | 139,783 | 199,948 | 85,761 | |||||||||
Shareholder reporting expenses | 166,333 | 104,764 | 22,527 | |||||||||
Shareholder servicing agent fees | 1,326 | 8,034 | 1,019 | |||||||||
Stock exchange listing fees | 6,635 | — | 6,635 | |||||||||
Investor relations expense | 61,031 | 35,660 | 23,191 | |||||||||
Other | 28,936 | 2,368 | 10,197 | |||||||||
Total expenses | 6,581,380 | 5,772,169 | 2,308,108 | |||||||||
Net investment income (loss) | 24,147,881 | 8,935,776 | 4,548,254 | |||||||||
Realized and Unrealized Gain (Loss) | ||||||||||||
Net realized gain (loss) from: | ||||||||||||
Investments and foreign currency | 23,207,067 | 848,644 | 1,064,856 | |||||||||
Forward foreign currency exchange contracts | — | 283,146 | — | |||||||||
Swaps | (1,646,145 | ) | 156,234 | — | ||||||||
Change in net unrealized appreciation (depreciation) of: | ||||||||||||
Investments and foreign currency | (27,936,191 | ) | (1,252,416 | ) | (170,240 | ) | ||||||
Forward foreign currency exchange contracts | — | 171,275 | — | |||||||||
Swaps | 4,556,301 | 1,765,747 | — | |||||||||
Net realized and unrealized gain (loss) | (1,818,968 | ) | 1,972,630 | 894,616 | ||||||||
Net increase (decrease) in net assets applicable to common shares from operations | 22,328,913 | 10,908,406 | 5,442,870 | |||||||||
| (1) | Consolidated Statement of Operations (as disclosed in Note 1) for the period April 27, 2021 (commencement of operations) through December 31, 2021. |
See accompanying notes to financial statements.
46
Statement of Changes in Net Assets
| JGH | NPCT(1) | |||||||||||
| Year Ended 12/31/21 | Year Ended | For the period 4/27/21 (commencement of operations) through 12/31/21 | ||||||||||
Operations | ||||||||||||
Net investment income (loss) | $ | 24,147,881 | $ | 25,562,839 | $ | 8,935,776 | ||||||
Net realized gain (loss) from: | ||||||||||||
Investments and foreign currency | 23,207,067 | (31,101,930 | ) | 848,644 | ||||||||
Forward foreign currency exchange contracts | — | 283,146 | ||||||||||
Swaps | (1,646,145 | ) | (1,074,313 | ) | 156,234 | |||||||
Change in net unrealized appreciation (depreciation) of: | ||||||||||||
Investments and foreign currency | (27,936,191 | ) | 11,238,560 | (1,252,416 | ) | |||||||
Forward foreign currency exchange contracts | — | 171,275 | ||||||||||
Swaps | 4,556,301 | (6,114,136 | ) | 1,765,747 | ||||||||
Net increase (decrease) in net assets applicable to common shares from operations | 22,328,913 | (1,488,980 | ) | 10,908,406 | ||||||||
Distributions to Common Shareholders | ||||||||||||
Dividends | (22,729,429 | ) | (24,735,572 | ) | (11,231,531 | ) | ||||||
Return of capital | (7,424,359 | ) | (956,568 | ) | (9,500,824 | ) | ||||||
Decrease in net assets applicable to common shares from distributions to common shareholders | (30,153,788 | ) | (25,692,140 | ) | (20,732,355 | ) | ||||||
Capital Share Transactions | ||||||||||||
Common shares: | ||||||||||||
Proceeds from sale of shares | — | — | 575,000,000 | |||||||||
Net increase (decrease) in net assets applicable to common shares from capital share transactions | — | — | 575,000,000 | |||||||||
Net increase (decrease) in net assets applicable to common shares | (7,824,875 | ) | (27,181,120 | ) | 565,176,051 | |||||||
Net assets applicable to common shares at the beginning of period | 393,298,707 | 420,479,827 | 100,000 | |||||||||
Net assets applicable to common shares at the end of period | $ | 385,473,832 | $ | 393,298,707 | $ | 565,276,051 | ||||||
| (1) | Consolidated Statement of Changes in Net Assets (as disclosed in Note 1). |
See accompanying notes to financial statements.
47
Statement of Changes in Net Assets (continued)
| JLS | ||||||||
Year Ended 12/31/21 | Year Ended 12/31/20 | |||||||
Operations | ||||||||
Net investment income (loss) | $ | 4,548,254 | $ | 4,692,908 | ||||
Net realized gain (loss) from: | ||||||||
Investments and foreign currency | 1,064,856 | (1,266,642 | ) | |||||
Forward foreign currency exchange contracts | — | |||||||
Swaps | — | — | ||||||
Change in net unrealized appreciation (depreciation) of: | ||||||||
Investments and foreign currency | (170,240 | ) | (1,680,688 | ) | ||||
Forward foreign currency exchange contracts | — | |||||||
Swaps | — | — | ||||||
Net increase (decrease) in net assets applicable to common shares from operations | 5,442,870 | 1,745,578 | ||||||
Distributions to Common Shareholders | ||||||||
Dividends | (4,636,388 | ) | (4,012,755 | ) | ||||
Return of capital | (664,479 | ) | (1,342,986 | ) | ||||
Decrease in net assets applicable to common shares from distributions to common shareholders | (5,300,867 | ) | (5,355,741 | ) | ||||
Capital Share Transactions | ||||||||
Common shares: | ||||||||
Proceeds from sale of shares | — | — | ||||||
Net increase (decrease) in net assets applicable to common shares from capital share transactions | — | — | ||||||
Net increase (decrease) in net assets applicable to common shares | 142,003 | (3,610,163 | ) | |||||
Net assets applicable to common shares at the beginning of period | 121,642,499 | 125,252,662 | ||||||
Net assets applicable to common shares at the end of period | $ | 121,784,502 | $ | 121,642,499 | ||||
See accompanying notes to financial statements.
48
Year Ended December 31, 2021
| JGH | NPCT For the period of operations) through 12/31/21 | JLS | ||||||||||
Cash Flows from Operating Activities: | ||||||||||||
Net Increase (Decrease) in Net Assets Applicable to Common Shares from Operations | $ | 22,328,913 | $ | 10,908,406 | $ | 5,442,870 | ||||||
Adjustments to reconcile the net increase (decrease) in net assets applicable to common shares from operations to net cash provided by (used in) operating activities: | ||||||||||||
Purchases of investments | (461,254,704 | ) | (931,350,736 | ) | (119,945,415 | ) | ||||||
Proceeds from sales and maturities of investments | 459,630,237 | 66,684,207 | 125,090,517 | |||||||||
Proceeds from (Purchase of) short-term investments, net | 128,014 | (1,090,714 | ) | 4,286,973 | ||||||||
Proceeds from (Purchases of) closed foreign currency spot contracts | — | 141,031 | — | |||||||||
Premiums received (paid) for interest rate swaps | — | (47,038 | ) | — | ||||||||
Amortization (Accretion) of premiums and discounts, net | (22,576 | ) | 368,233 | (198,185 | ) | |||||||
(Increase) Decrease in: | ||||||||||||
Receivable for interest | 284,876 | (6,600,502 | ) | 31,131 | ||||||||
Receivable for dividends | (12,288 | ) | (53,534 | ) | — | |||||||
Receivable for investments sold | 1,962,470 | (11,250 | ) | — | ||||||||
Receivable for reclaims | (16,498 | ) | (125,274 | ) | 287 | |||||||
Other assets | (33,670 | ) | (45,551 | ) | 20,965 | |||||||
Increase (Decrease) in: | ||||||||||||
Investments purchased – regular settlement | — | — | (953,056 | ) | ||||||||
Investments purchased – when-issued/delayed-delivery settlement | (1,252,241 | ) | 2,505,383 | (9,387,066 | ) | |||||||
Accrued management fees | 1,243 | 696,556 | 6,042 | |||||||||
Accrued interest on borrowings | (5,596 | ) | 258,211 | (24,303 | ) | |||||||
Accrued Trustees fees | 32,517 | 11,763 | 15,011 | |||||||||
Accrued other expenses | 11,370 | 277,087 | (33,521 | ) | ||||||||
Net realized (gain) loss from: | ||||||||||||
Investments and foreign currency | (23,207,067 | ) | (848,644 | ) | (1,064,856 | ) | ||||||
Paydowns | (234,913 | ) | (68,016 | ) | (215,055 | ) | ||||||
Change in net unrealized appreciation (depreciation) of: | ||||||||||||
Investments and foreign currency | 27,936,191 | 1,252,416 | 170,240 | |||||||||
Forward foreign currency contracts | — | (171,275 | ) | — | ||||||||
Swaps | (4,556,301 | ) | (1,765,747 | ) | — | |||||||
Net cash provided by (used in) operating activities | 21,719,977 | (859,074,988 | ) | 3,242,579 | ||||||||
Cash Flow from Financing Activities: | ||||||||||||
Proceeds from borrowings | 9,800,000 | 167,000,000 | 750,000 | |||||||||
(Repayments of) borrowings | — | — | (7,800,000 | ) | ||||||||
Proceeds from reverse repurchase agreements | — | 432,850,000 | 134,213,879 | |||||||||
(Repayments of) reverse repurchase agreements | — | (295,050,000 | ) | (125,181,011 | ) | |||||||
Increase (Decrease) in cash overdraft | — | — | 75,420 | |||||||||
Proceeds from sales of common shares | — | 575,000,000 | — | |||||||||
Cash distributions paid to common shareholders | (30,153,788 | ) | (20,732,355 | ) | (5,300,867 | ) | ||||||
Net cash provided by (used in) financing activities | (20,353,788 | ) | 859,067,645 | (3,242,579 | ) | |||||||
| Net Increase (Decrease) in Cash and Cash Collateral at Brokers | 1,366,189 | (7,343 | ) | — | ||||||||
Cash and cash collateral at brokers at the beginning of period | 5,036,940 | 100,000 | — | |||||||||
Cash and cash collateral at brokers at the end of period | 6,403,129 | 92,657 | — | |||||||||
| The following table provides a reconciliation of cash and cash collateral at brokers to the statement of assets and liabilities: | ||||||||||||
Cash | 2,165,823 | 92,657 | — | |||||||||
Cash collateral at brokers for investments in swaps | 4,237,306 | — | — | |||||||||
Total cash and cash collateral at brokers | 6,403,129 | 92,657 | — | |||||||||
| Supplemental Disclosure of Cash Flow Information | ||||||||||||
Cash paid for interest | $ | 1,285,428 | $ | 436,423 | $ | 549,751 | ||||||
See accompanying notes to financial statements.
49
Selected data for a share outstanding throughout each period:
| Investment Operations | Less Distributions to Common Shareholders | Common Share | ||||||||||||||||||||||||||||||||||||||||||
| Beginning Common Share NAV | Net Investment Income (Loss)(a) | Net Realized/ Unrealized Gain (Loss) | Total | From Net Investment Income | From Accumulated Net Realized Gains | Return of Capital | Total | Discount from Retired | Ending NAV | Ending Share Price | ||||||||||||||||||||||||||||||||||
JGH |
| |||||||||||||||||||||||||||||||||||||||||||
Year Ended 12/31: |
| |||||||||||||||||||||||||||||||||||||||||||
2021 | $ | 16.97 | $ | 1.04 | $ | (0.08 | ) | $ | 0.96 | $ | (0.98 | ) | $ | — | $ | (0.32 | ) | $ | (1.30 | ) | $ | — | $ | 16.63 | $ | 15.88 | ||||||||||||||||||
2020 | 18.14 | 1.10 | (1.16 | ) | (0.06 | ) | (1.07 | ) | — | (0.04 | ) | (1.11 | ) | — | 16.97 | 15.55 | ||||||||||||||||||||||||||||
2019 | 16.01 | 1.19 | 2.17 | 3.36 | (1.20 | ) | — | (0.03 | ) | (1.23 | ) | — | 18.14 | 16.38 | ||||||||||||||||||||||||||||||
2018 | 18.51 | 1.26 | (2.42 | ) | (1.16 | ) | (1.27 | ) | — | (0.08 | ) | (1.35 | ) | 0.01 | 16.01 | 13.65 | ||||||||||||||||||||||||||||
2017 | 17.82 | 1.42 | 0.71 | 2.13 | (1.34 | ) | — | (0.10 | ) | (1.44 | ) | — | 18.51 | 16.91 | ||||||||||||||||||||||||||||||
NPCT(e) |
| |||||||||||||||||||||||||||||||||||||||||||
Period Ended 12/31: |
| |||||||||||||||||||||||||||||||||||||||||||
2021(f) | 20.00 | 0.31 | 0.07 | 0.38 | (0.36 | ) | (0.03 | ) | (0.33 | ) | (0.72 | ) | — | 19.66 | 18.30 | |||||||||||||||||||||||||||||
| Borrowings at the End of Period | ||||||||
| Aggregate Amount Outstanding (000) | Asset Coverage Per $1,000 | |||||||
JGH |
| |||||||
Year Ended 12/31: |
| |||||||
2021 | $ | 159,000 | $ | 3,424 | ||||
2020 | 149,200 | 3,636 | ||||||
2019 | 175,200 | 3,400 | ||||||
2018 | 175,200 | 3,118 | ||||||
2017 | 175,200 | 3,455 | ||||||
| Borrowings at the Period Ended | ||||||||
| Aggregate Amount Outstanding (000) | Asset Coverage Per $1,000 | |||||||
NPCT |
| |||||||
Period Ended 12/31: |
| |||||||
2021(f) | $ | 167,000 | $ | 4,385 | ||||
50
| Common Share Supplemental Data/ Ratios Applicable to Common Shares | ||||||||||||||||||||||
| Common Share Total Returns | Ratios to Average Net Assets(c) | |||||||||||||||||||||
| Based on NAV(b) | Based on | Ending Net Assets (000) | Expenses | Net Investment Income (Loss) | Portfolio Turnover | |||||||||||||||||
| 5.82 | % | 10.84 | % | $ | 385,474 | 1.68 | % | 6.16 | % | 87 | % | |||||||||||
| 0.39 | 2.88 | 393,299 | 1.87 | 6.94 | 35 | |||||||||||||||||
| 21.54 | 29.93 | 420,480 | 2.64 | 6.84 | 43 | |||||||||||||||||
| (6.67 | ) | (11.97 | ) | 371,082 | 2.51 | 7.10 | 61 | |||||||||||||||
| 12.25 | 15.14 | 430,058 | 2.08 | 7.70 | 77 | |||||||||||||||||
| 1.90 | (4.96 | ) | 565,276 | 1.47 | * | 2.28 | * | 17 | ||||||||||||||
| (a) | Per share Net Investment Income (Loss) is calculated using the average daily shares method. |
| (b) | Total Return Based on Common Share NAV is the combination of changes in common share NAV, reinvested dividend income at NAV and reinvested capital gains distributions at NAV, if any. The last dividend declared in the period, which is typically paid on the first business day of the following month, is assumed to be reinvested at the ending NAV. The actual reinvest price for the last dividend declared in the period may often be based on the Fund’s market price (and not its NAV), and therefore may be different from the price used in the calculation. Total returns are not annualized. |
Total Return Based on Common Share Price is the combination of changes in the market price per common share and the effect of reinvested dividend income and reinvested capital gains distributions, if any, at the average price paid per common share at the time of reinvestment. The last dividend declared in the period, which is typically paid on the first business day of the following month, is assumed to be reinvested at the ending market price. The actual reinvestment for the last dividend declared in the period may take place over several days, and in some instances may not be based on the market price, so the actual reinvestment price may be different from the price used in the calculation. Total returns are not annualized.
| (c) | • | Net Investment Income (Loss) ratios reflect income earned and expenses incurred on assets attributable to reverse repurchase agreements and/or borrowings, where applicable, (as described in Note 8 – Borrowing Arrangements). | ||
| • | Each ratio includes the effect of all interest expense paid and other costs related to reverse repurchase agreements and/or borrowings, where applicable, as follows: |
| Ratios of Interest Expense to Average Net Assets Applicable to Common Shares | ||||
JGH | ||||
Year Ended 12/31: |
| |||
2021 | 0.35 | % | ||
2020 | 0.59 | |||
2019 | 1.33 | |||
2018 | 1.19 | |||
2017 | 0.78 | |||
| Ratios of Interest Expense to Average Net Assets Applicable to Common Shares | ||||
NPCT | ||||
2021(f) | 0.18 | %* | ||
| (d) | Portfolio Turnover Rate is calculated based on the lesser of long-term purchases or sales (as disclosed in Note 4 – Portfolio Securities and Investments in Derivatives) divided by the average long-term market value during the period. |
| (e) | Consolidated Financial Highlights (as disclosed in Note 1). |
| (f) | For the period April 27, 2021 (commencement of operations) through December 31, 2021. |
| * | Annualized. |
See accompanying notes to financial statements.
51
Financial Highlights (continued)
Selected data for a common share outstanding throughout each period:
| Investment Operations | Less Distributions to Common Shareholders | Common Share | ||||||||||||||||||||||||||||||||||||||
| Beginning Common Share NAV | Net Investment Income (Loss)(a) | Net Realized/ Unrealized Gain (Loss) | Total | From Net Investment Income | From Accumulated Net Realized Gains | Return of Capital | Total | Ending NAV | Ending Share Price | |||||||||||||||||||||||||||||||
JLS |
| |||||||||||||||||||||||||||||||||||||||
Year Ended 12/31: | ||||||||||||||||||||||||||||||||||||||||
2021 | $ | 22.17 | $ | 0.83 | $ | 0.16 | $ | 0.99 | $ | (0.85 | ) | $ | — | $ | (0.12 | ) | $ | (0.97 | ) | $ | 22.19 | $ | 20.96 | |||||||||||||||||
2020 | 22.83 | 0.86 | (0.55 | ) | 0.31 | (0.73 | ) | — | (0.24 | ) | (0.97 | ) | 22.17 | 19.77 | ||||||||||||||||||||||||||
2019 | 23.02 | 0.76 | 0.41 | 1.17 | (0.92 | ) | — | (0.44 | ) | (1.36 | ) | 22.83 | 21.96 | |||||||||||||||||||||||||||
2018 | 24.70 | 1.16 | (0.76 | ) | 0.40 | (1.52 | ) | (0.49 | ) | (0.07 | ) | (2.08 | ) | 23.02 | 22.35 | |||||||||||||||||||||||||
2017 | 25.02 | 1.34 | 1.65 | 2.99 | (1.94 | ) | (1.37 | ) | — | (3.31 | ) | 24.70 | 24.69 | |||||||||||||||||||||||||||
| Borrowings at the End of Period | ||||||||
| Aggregate Amount Outstanding (000) | Asset Coverage Per $1,000 | |||||||
JLS | ||||||||
Year Ended 12/31: |
| |||||||
2021 | $ | 8,455 | $ | 15,404 | ||||
2020 | 15,505 | 8,845 | ||||||
2019 | — | — | ||||||
2018 | 147,200 | 3,485 | ||||||
2017 | 147,200 | 3,666 | ||||||
52
| Ratios/Supplemental Data Applicable to Common Shares | ||||||||||||||||||||||||||||||
| Common Share Total Returns | Ratios to Average Net Assets Before Reimbursement(c) | Ratios to Average Net Assets After Reimbursement(c)(d) | ||||||||||||||||||||||||||||
| Based on NAV(b) | Based on | Ending Net Assets (000) | Expenses | Net Investment Income (Loss) | Expenses | Net Investment Income (Loss) | Portfolio Turnover | |||||||||||||||||||||||
| 4.47 | % | 11.02 | % | $ | 121,785 | 1.87 | % | 3.69 | % | N/A | N/A | 73 | % | |||||||||||||||||
| 1.69 | (5.36 | ) | 121,642 | 2.46 | 3.11 | 1.54 | % | 4.04 | % | 117 | ||||||||||||||||||||
| 5.16 | 4.27 | 125,253 | 2.72 | 3.08 | 2.53 | 3.26 | 100 | |||||||||||||||||||||||
| 1.63 | (1.06 | ) | 365,810 | 2.89 | 4.77 | N/A | N/A | 44 | ||||||||||||||||||||||
| 12.21 | 16.79 | 392,453 | 2.51 | 5.12 | N/A | N/A | 85 | |||||||||||||||||||||||
| (a) | Per share Net Investment Income (Loss) is calculated using the average daily shares method. |
| (b) | Total Return Based on Common Share NAV is the combination of changes in common share NAV, reinvested dividend income at NAV and reinvested capital gains distributions at NAV, if any. The last dividend declared in the period, which is typically paid on the first business day of the following month, is assumed to be reinvested at the ending NAV. The actual reinvest price for the last dividend declared in the period may often be based on the Fund’s market price (and not its NAV), and therefore may be different from the price used in the calculation. Total returns are not annualized. |
Total Return Based on Common Share Price is the combination of changes in the market price per share and the effect of reinvested dividend income and reinvested capital gains distributions, if any, at the average price paid per common share at the time of reinvestment. The last dividend declared in the period, which is typically paid on the first business day of the following month, is assumed to be reinvested at the ending market price. The actual reinvestment for the last dividend declared in the period may take place over several days, and in some instances may not be based on the market price, so the actual reinvestment price may be different from the price used in the calculation. Total returns are not annualized.
| (c) | • | Net Investment Income (Loss) ratios reflect income earned and expenses incurred on assets attributable to reverse repurchase agreements and/or borrowings, where applicable, (as described in Note 8 – Fund Leverage). | ||
| • | Each ratio includes the effect of all interest expense paid and other costs related to reverse repurchase agreements and/or to borrowings, where applicable, as follows: |
| Ratios of Interest Expense to Average Net Assets Applicable to Common Shares | ||||
JLS | ||||
Year Ended 12/31: |
| |||
2021 | 0.45 | % | ||
2020 | 0.91 | |||
2019 | 1.15 | |||
2018 | 1.26 | |||
2017 | 0.93 | |||
| (d) | During the fiscal year ended December 31, 2019, the Adviser voluntarily reimbursed the Fund for certain expenses incurred in connection with its restructuring. |
| (e) | Portfolio Turnover Rate is calculated based on the lesser of long-term purchases or sales (as disclosed in Note 4 – Portfolio Securities and Investments in Derivatives) divided by the average long-term market value during the period. |
| N/A | Fund did not have a contractual reimbursement with the Adviser. |
53
See accompanying notes to financial statements.
1. General Information
Fund Information
The funds covered in this report and their corresponding New York Stock Exchange (“NYSE”) symbols are as follows (each a “Fund” and collectively, the “Funds”):
| • | Nuveen Global High Income Fund (JGH) |
| • | Nuveen Core Plus Impact Fund (NPCT) |
| • | Nuveen Mortgage and Income Fund (JLS) |
The Funds are registered under the Investment Company Act of 1940 (the “1940 Act”), as amended, as diversified closed-end management investment companies. JGH, NPCT and JLS were organized as Massachusetts business trusts on August 5, 2014, December 4, 2020 and September 10, 2009, respectively.
The end of the reporting period for the Funds is December 31, 2021. The period covered by these Notes to Financial Statements for JGH and JLS is for the fiscal year ended December 31, 2021, and the reporting period for NPCT is the period April 27, 2021 (commencement of operations) through December 31, 2021 (collectively the “current fiscal period”).
Investment Adviser and Sub-Adviser
The Funds’ investment adviser is Nuveen Fund Advisors, LLC (the “Adviser”), a subsidiary of Nuveen, LLC (“Nuveen”). Nuveen is the investment management arm of Teachers Insurance and Annuity Association of America (TIAA). The Adviser has overall responsibility for management of the Funds, oversees the management of the Funds’ portfolio, manages the Funds’ business affairs and provides certain clerical, bookkeeping and other administrative services, and, if necessary, asset allocation decisions. The Adviser has entered into a sub-advisory agreement with Nuveen Asset Management, LLC (“NAM”), a subsidiary of the Adviser and Teachers Advisors, LLC (“TAL”), an affiliate of the Adviser, (each a “Sub-Adviser” and collectively, the “Sub-Advisers”). NAM manages the investment portfolios of JGH and NPCT, while TAL manages the investment portfolio of JLS.
Developments Regarding JGH’s Control Share By-Law
On January 14, 2021, the Fund’s Board of Trustees (the “Trustees”) received a shareholder demand letter (the “Demand Letter”) from Saba Capital CEF Opportunities 1, Ltd. and Saba Capital Management, L.P. (collectively, “Saba”) demanding that the Fund (i) rescind the Fund’s by-law provisions pursuant to which, in summary, a shareholder who obtains beneficial ownership of common shares in a Control Share Acquisition (as defined in the by-laws) shall have the same voting rights as other common shareholders only to the extent authorized by the other disinterested shareholders (the “Control Share By-Law”) and (ii) commence judicial action against the Trustees to ensure that the Control Share By-Law is withdrawn. Following review of the Demand Letter, the Trustees determined that it would not be in the best interests of the Fund or the Fund’s shareholders to take the actions requested in the Demand Letter. Also on January 14, 2021, Saba filed a civil complaint in the U.S. District Court for the Southern District of New York (the “District Court”) against the Fund, certain other Nuveen funds and the Trustees, seeking a declaration that the Control Share By-Law violates the 1940 Act, rescission of the Control Share By-Law and a permanent injunction against applying the Control Share By-Law. On February 18, 2022, the District Court granted judgment in favor of Saba’s claim for rescission of the Control Share By-Law and Saba’s declaratory judgment claim, and declared that the Control Share By-Law violates Section 18(i) of the 1940 Act. Following review of the judgment of the District Court, on February 22, 2022, the Trustees amended the Fund’s by-laws to provide that the Control Share By-Law shall be of no force and effect for so long as the judgment of the District Court is effective and that if the judgment of the District Court is reversed, overturned, vacated, stayed, or otherwise nullified, the Control Share By-Law will be automatically reinstated and apply to any beneficial owner of common shares acquired in a Control Share Acquisition, regardless of whether such Control Share Acquisition occurs before or after such reinstatement, for the duration of the stay or upon issuance of the mandate reversing, overturning, vacating or otherwise nullifying the judgment of the District Court.
Other Matters
The outbreak of the novel coronavirus (“COVID-19”) and subsequent global pandemic began significantly impacting the U.S. and global financial markets and economies during the calendar quarter ended March 31, 2020. The worldwide spread of COVID-19 has created significant uncertainty in the global economy. The duration and extent of COVID-19 over the long term cannot be reasonably estimated at this time. The ultimate impact of COVID-19 and the extent to which COVID-19 impacts the Funds’ normal course of business, results of operations, investments, and cash flows will depend on future developments, which are highly uncertain and difficult to predict. Management continues to monitor and evaluate this situation.
Basis for Consolidation
NPCT is presented on a consolidated basis with the Nuveen Core Plus Impact Fund Offshore Limited (the “Subsidiary”), a wholly-owned subsidiary of NPCT organized under the laws of the Cayman Islands. The Subsidiary commenced operations on April 27, 2021 and is intended to provide the Fund with
54
exposure to Regulation S fixed-income securities. Regulation S securities are securities of U.S. and non-U.S. issuers that are issued through private placement transactions with the SEC pursuant to Regulation S under the Securities Act of 1933, as amended. The Subsidiary is advised by the Adviser and has the same investment objective as NPCT, but unlike NPCT, it may invest in Regulation S securities without limitation. As of the end of the reporting period, the net assets of the Subsidiary were $28,914,863 representing 5% of the Fund’s consolidated net assets. All inter-company transactions and balances have been eliminated.
Select financial information related to the Subsidiary is as follows:
| NPCT | ||||
Total long-term investments at value | $ | 28,631,955 | ||
Net assets applicable to Common Shares | 28,914,863 | |||
Net investment income (loss) | 339,165 | |||
Net realized gain (loss) from investments and foreign currency | (80,866 | ) | ||
Change in net unrealized appreciation (depreciation) from investments and foreign currency | (1,908,904 | ) | ||
2. Significant Accounting Policies
The accompanying financial statements were prepared in accordance with accounting principles generally accepted in the United States of America (“U.S. GAAP”), which may require the use of estimates made by management and the evaluation of subsequent events. Actual results may differ from those estimates. Each Fund is an investment company and follows the accounting guidance in the Financial Accounting Standards Board (“FASB”) Accounting Standards Codification 946, Financial Services – Investment Companies. The net asset value (“NAV”) for financial reporting purposes may differ from the NAV for processing security and common share transactions. The NAV for financial reporting purposes includes security and common share transactions through the date of the report. Total return is computed based on the NAV used for processing security and common share transactions. The following is a summary of the significant accounting policies consistently followed by the Funds.
Compensation
The Funds pay no compensation directly to those of their trustees who are affiliated with the Adviser or to their officers, all of whom receive remuneration for their services to the Funds from the Adviser or its affiliates. The Funds’ Board of Trustees (the “Board”) has adopted a deferred compensation plan for independent trustees that enables trustees to elect to defer receipt of all or a portion of the annual compensation they are entitled to receive from certain Nuveen-advised funds. Under the plan, deferred amounts are treated as though equal dollar amounts had been invested in shares of select Nuveen-advised funds.
Distributions to Common Shareholders
Distributions to common shareholders are recorded on the ex-dividend date. The amount, character and timing of distributions are determined in accordance with federal income tax regulations, which may differ from U.S. GAAP.
Effective in conjunction with the declaration of the March 2021 distribution, each Fund has implemented a level distribution program to provide shareholders with stable, but not guaranteed, cash flow, independent of the amount or timing of income earned or capital gains realized by the Fund. Under this program, the Fund’s regular monthly distribution, in order to maintain its level distribution amount, may include net investment income, return of capital and potentially capital gains for tax purposes. The amounts and sources of distributions are reported for financial reporting purposes and are not being provided for tax reporting purposes. The actual amounts and character of the distributions for tax reporting purposes will be reported to shareholders on Form 1099-DIV which will be sent to shareholders shortly after calendar year-end.
NPCT makes monthly cash distributions to common shareholders of a stated dollar amount per share. Subject to approval and oversight by the Board, the Fund seeks to maintain a stable distribution level designed to deliver the long-term return potential of the Fund’s investment strategy through regular monthly distributions (a “Managed Distribution Program”). Total distributions during a calendar year generally will be made from the Fund’s net investment income, net realized capital gains and net unrealized capital gains in the Fund’s portfolio, if any. The portion of distributions paid attributed to net unrealized gains, if any, is distributed from the Fund’s assets and is treated by common shareholders as a nontaxable distribution (“return of capital”) for tax purposes. In the event that total distributions during a calendar year exceed the Fund’s total return on NAV, the difference will reduce NAV per share. If the Fund’s total return on NAV exceeds total distributions during a calendar year, the excess will be reflected as an increase in NAV per share. The amounts and sources of distributions reported for financial reporting purposes and are not being provided for tax reporting purposes. The actual amounts and character of the distributions for tax reporting purposes will be reported to shareholders on Form 1099-DIV which will be sent to shareholders shortly after calendar year-end.
Foreign Currency Transactions and Translation
To the extent that JGH and NPCT invests in securities and/or contracts that are denominated in a currency other than U.S. dollars, the Funds will be subject to currency risk, which is the risk that an increase in the U.S. dollar relative to the foreign currency will reduce returns or portfolio value. Generally, when the U.S. dollar rises in value against a foreign currency, the Funds’ investments denominated in that currency will lose value because their currency is worth fewer
55
Notes to Financial Statements (continued)
U.S. dollars; the opposite effect occurs if the U.S. dollar falls in relative value. Investments and other assets and liabilities denominated in foreign currencies are converted into U.S. dollars on a spot (i.e. cash) basis at the spot rate prevailing in the foreign currency exchange market at the time of valuation. Purchases and sales of investments and income denominated in foreign currencies are translated into U.S. dollars on the respective dates of such transactions.
The books and records of the Funds are maintained in U.S. dollars. Assets, including investments, and liabilities denominated in foreign currencies are translated into U.S. dollars at the end of each day. Purchases and sales of securities, income and expenses are translated into U.S. dollars at the prevailing exchange rate on the respective dates of the transactions.
Net realized foreign currency gains and losses resulting from changes in exchange rates associated with (i) foreign currency, (ii) investments and (iii) derivatives include foreign currency gains and losses between trade date and settlement date of the transactions, foreign currency transactions, and the difference between the amounts of interest and dividends recorded on the books of the Funds and the amounts actually received are recognized as a component of “Net realized gain (loss) from investments and foreign currency” on the Statement of Operations, when applicable.
The unrealized gains and losses resulting from changes in foreign currency exchange rates and changes in foreign exchange rates associated with (i) investments and (ii) other assets and liabilities are recognized as a component of “Change in net unrealized appreciation (depreciation) of investments and foreign currency” on the Statement of Operations, when applicable. The unrealized gains and losses resulting from changes in foreign exchange rates associated with investments in derivatives are recognized as a component of the respective derivative’s related “Change in net unrealized appreciation (depreciation)” on the Statement of Operations, when applicable.
As of the end of the reporting period, the following Funds’ investments in non-U.S. securities were as follows:
| JGH | Value | % of Total Investments | ||||||
Country: | ||||||||
Canada | $ | 23,374,790 | 4.4 | % | ||||
Brazil | 14,248,638 | 2.7 | ||||||
Mexico | 11,663,555 | 2.2 | ||||||
United Kingdom | 11,429,958 | 2.1 | ||||||
France | 11,329,037 | 2.1 | ||||||
Turkey | 10,368,874 | 1.9 | ||||||
Colombia | 8,359,270 | 1.6 | ||||||
Spain | 8,338,923 | 1.6 | ||||||
Luxembourg | 7,671,155 | 1.4 | ||||||
Israel | 6,312,680 | 1.2 | ||||||
Germany | 5,977,688 | 1.1 | ||||||
Dominican Republic | 5,747,188 | 1.1 | ||||||
Oman | 5,532,442 | 1.0 | ||||||
Other | 95,365,067 | 17.7 | ||||||
Total non-U.S. securities | $ | 225,719,265 | 42.1 | % | ||||
| NPCT | ||||||||
Country: | ||||||||
Italy | $ | 33,808,762 | 3.9 | % | ||||
Chile | 33,787,875 | 3.9 | ||||||
United Kingdom | 32,642,162 | 3.8 | ||||||
Canada | 25,957,380 | 3.0 | ||||||
India | 24,345,141 | 2.8 | ||||||
Australia | 20,629,022 | 2.4 | ||||||
Indonesia | 19,808,965 | 2.3 | ||||||
Bermuda | 17,007,454 | 2.0 | ||||||
Switzerland | 16,781,250 | 1.9 | ||||||
Mexico | 15,732,149 | 1.8 | ||||||
Other | 84,478,231 | 9.8 | ||||||
Total non-U.S. securities | $ | 324,978,391 | 37.6 | % | ||||
Indemnifications
Under the Funds’ organizational documents, their officers and trustees are indemnified against certain liabilities arising out of the performance of their duties to the Funds. In addition, in the normal course of business, the Funds enter into contracts that provide general indemnifications to other parties. The Funds’ maximum exposure under these arrangements is unknown as this would involve future claims that may be made against the Funds that have not yet occurred. However, the Funds have not had prior claims or losses pursuant to these contracts and expects the risk of loss to be remote.
56
Investments and Investment Income
Securities transactions are accounted for as of the trade date for financial reporting purposes. Trade date for senior and subordinated loans purchased in the “primary market” is considered the date on which the loan allocations are determined. Trade date for senior and subordinated loans purchased in the “secondary market” is the date on which the transaction is entered into. Realized gains and losses on securities transactions are based upon the specific identification method. Dividend income is recorded on the ex-dividend date, or for foreign securities, when information is available. Non-cash dividends received in the form of stock, if any, are recognized on the ex-dividend date and recorded at fair value. Interest income, which is recorded on an accrual basis and includes accretion of discounts and amortization of premiums for financial reporting purposes. Interest income also reflects payment-in-kind (“PIK”) interest, fee income, if any and paydown gains and losses, if any. PIK interest represents income received in the form of securities in lieu of cash. Fee income consists primarily of amendment fees. Amendment fees are earned as compensation for evaluating and accepting changes to an original senior loan agreement and are recognized when received. Rehypothecation income is comprised of fees earned in connection with the rehypothecation of pledged collateral as further described in Note 8 – Borrowing Arrangements.
Netting Agreements
In the ordinary course of business, the Funds may enter into transactions subject to enforceable master repurchase agreements, International Swaps and Derivatives Association, Inc. (ISDA) master agreements or other similar arrangements (“netting agreements”). Generally, the right to offset in netting agreements allows each Fund to offset certain securities and derivatives with a specific counterparty, when applicable, as well as any collateral received or delivered to that counterparty based on the terms of the agreements. Generally, each Fund manages its cash collateral and securities collateral on a counterparty basis.
The Funds’ investments subject to netting agreements as of the end of the reporting period, if any, are further described in Note 4 – Portfolio Securities and Investments in Derivatives.
Organizational Expenses for NPCT
Prior to the commencement of operations on April 27, 2021, NPCT had no operations other than those related to organizational matters and the Fund’s initial contribution of $100,000 by the Adviser, and the recording of the Fund’s organizational expenses ($16,000) and its reimbursement by the Adviser.
New Accounting Pronouncements and Rule Issuances
Reference Rate Reform
In March 2020, FASB issued Accounting Standards Update (“ASU”) 2020-04, Reference Rate Reform: Facilitation of the Effects of Reference Rate Reform on Financial Reporting. The main objective of the new guidance is to provide relief to companies that will be impacted by the expected change in benchmark interest rates, when participating banks will no longer be required to submit London Interbank Offered Rate (LIBOR) quotes by the UK Financial Conduct Authority (FCA). The new guidance allows companies to, provided the only changes to existing contracts are a change to an approved benchmark interest rate, account for modifications as a continuance of the existing contract without additional analysis. For new and existing contracts, the Funds may elect to apply the amendments as of March 12, 2020 through December 31, 2022. Management has not yet elected to apply the amendments, is continuously evaluating the potential effect a discontinuation of LIBOR could have on the Funds’ investments and has currently determined that it is unlikely the ASU’s adoption will have a significant impact on the Funds’ financial statements and various filings.
Securities and Exchange Commission (“SEC”) Adopts New Rules to Modernize Fund Valuation Framework
In December 2020, the SEC voted to adopt a new rule governing fund valuation practices. New Rule 2a-5 under the 1940 Act establishes requirements for determining fair value in good faith for purposes of the 1940 Act. Rule 2a-5 will permit fund boards to designate certain parties to perform fair value determinations, subject to board oversight and certain other conditions. Rule 2a-5 also defines when market quotations are “readily available” for purposes of Section 2(a)(41) of the 1940 Act, which requires a fund to fair value a security when market quotations are not readily available. The SEC also adopted new Rule 31a-4 under the 1940 Act, which sets forth the recordkeeping requirements associated with fair value determinations. Finally, the SEC is rescinding previously issued guidance on related issues, including the role of a board in determining fair value and the accounting and auditing of fund investments. Rule 2a-5 and Rule 31a-4 became effective on March 8, 2021, with a compliance date of September 8, 2022. A fund may voluntarily comply with the rules after the effective date, and in advance of the compliance date, under certain conditions. Management is currently assessing the impact of these provisions on the Funds’ financial statements.
3. Investment Valuation and Fair Value Measurements
The Funds’ investments in securities are recorded at their estimated fair value utilizing valuation methods approved by the Board. Fair value is defined as the price that would be received upon selling an investment or transferring a liability in an orderly transaction to an independent buyer in the principal or most advantageous market for the investment. U.S. GAAP establishes the three-tier hierarchy which is used to maximize the use of observable market data and minimize the use of unobservable inputs and to establish classification of fair value measurements for disclosure purposes. Observable inputs reflect the assumptions market participants would use in pricing the asset or liability. Observable inputs are based on market data obtained from sources
57
Notes to Financial Statements (continued)
independent of the reporting entity. Unobservable inputs reflect management’s assumptions about the assumptions market participants would use in pricing the asset or liability. Unobservable inputs are based on the best information available in the circumstances. The following is a summary of the three-tiered hierarchy of valuation input levels.
| Level 1 – | Inputs are unadjusted and prices are determined using quoted prices in active markets for identical securities. | |
| Level 2 – | Prices are determined using other significant observable inputs (including quoted prices for similar securities, interest rates, credit spreads, etc.). | |
| Level 3 – | Prices are determined using significant unobservable inputs (including management’s assumptions in determining the fair value of investments). |
A description of the valuation techniques applied to the Funds’ major classifications of assets and liabilities measured at fair value follows:
Equity securities and exchange-traded funds listed or traded on a national market or exchange are valued based on their sale price at the official close of business of such market or exchange on the valuation date. Foreign equity securities and registered investment companies that trade on a foreign exchange are valued at the last sale price or official closing price reported on the exchange where traded and converted to U.S. dollars at the prevailing rates of exchange on the date of valuation. To the extent these securities are actively traded and that valuation adjustments are not applied, they are generally classified as Level 1. If there is no official close of business, then the latest available sale price is utilized. If no sales are reported, then the mean of the latest available bid and ask prices is utilized and these securities are generally classified as Level 2.
Prices of fixed-income securities are generally provided by an independent pricing service (“pricing service”) approved by the Board. The pricing service establishes a security’s fair value using methods that may include consideration of the following: yields or prices of investments of comparable quality, type of issue, coupon, maturity and rating, market quotes or indications of value from security dealers, evaluations of anticipated cash flows or collateral, general market conditions and other information and analysis, including the obligor’s credit characteristics considered relevant. In pricing certain securities, particularly less liquid and lower quality securities, the pricing service may consider information about a security, its issuer or market activity provided by the Adviser. These securities are generally classified as Level 2.
Repurchase agreements are valued at contract amount plus accrued interest, which approximates market value. These securities are generally classified as Level 2.
Swap contracts are marked-to-market daily based upon a price supplied by a pricing service. Swaps are generally classified as Level 2.
For events affecting the value of foreign securities between the time when the exchange on which they are traded closes and the time when the Funds’ net assets are calculated, such securities will be valued at fair value in accordance with procedures adopted by the Board. These foreign securities are generally classified as Level 2.
Any portfolio security or derivative for which market quotations are not readily available or for which the above valuation procedures are deemed not to reflect fair value are valued at fair value, as determined in good faith using procedures approved by the Board. As a general principle, the fair value of a security would appear to be the amount that the owner might reasonably expect to receive for it in a current sale. A variety of factors may be considered in determining the fair value of such securities, which may include consideration of the following: yields or prices of investments of comparable quality, type of issue, coupon, maturity and rating, market quotes or indications of value from security dealers, evaluations of anticipated cash flows or collateral, general market conditions and other information and analysis, including the obligor’s credit characteristics considered relevant. To the extent the inputs are observable and timely, the values would be classified as Level 2 of the fair value hierarchy; otherwise they would be classified as Level 3.
The following table summarizes the market value of the Funds’ investments as of the end of the reporting period, based on the inputs used to value them:
| JGH | Level 1 | Level 2 | Level 3 | Total | ||||||||||||
Long-Term Investments*: | ||||||||||||||||
Corporate Bonds | $ | — | $ | 350,785,870 | $ | — | $ | 350,785,870 | ||||||||
Sovereign Debt | — | 63,025,775 | — | 63,025,775 | ||||||||||||
Variable Rate Senior Loan Interests | — | | 49,135,023 | | — | 49,135,023 | ||||||||||
$1,000 Par (or similar) Institutional Preferred | — | 32,063,300 | — | 32,063,300 | ||||||||||||
Contingent Capital Securities | — | 24,702,111 | — | 24,702,111 | ||||||||||||
$25 Par (or similar) Retail Preferred | 5,583,331 | — | — | 5,583,331 | ||||||||||||
Short-Term Investments: | ||||||||||||||||
Repurchase Agreements | — | 10,776,811 | — | 10,776,811 | ||||||||||||
Investments in Derivatives: | ||||||||||||||||
Interest Rate Swaps** | — | (4,236,587 | ) | — | (4,236,587 | ) | ||||||||||
Total | $ | 5,583,331 | $ | 526,252,303 | $ | — | $ | 531,835,634 | ||||||||
58
| NPCT | Level 1 | Level 2 | Level 3 | Total | ||||||||||||
Long-Term Investments*: | ||||||||||||||||
Corporate Bonds | $ | — | $ | 513,412,047 | $ | — | $ | 513,412,047 | ||||||||
$1,000 Par (or similar) Institutional Preferred | — | 131,897,707 | — | 131,897,707 | ||||||||||||
Asset-Backed Securities | — | 58,292,816 | — | 58,292,816 | ||||||||||||
$25 Par (or similar) Retail Preferred | 52,751,180 | — | — | 52,751,180 | ||||||||||||
Mortgage-Backed Securities | — | 41,140,658 | — | 41,140,658 | ||||||||||||
Sovereign Debt | — | 38,673,908 | — | 38,673,908 | ||||||||||||
Municipal Bonds | — | 14,148,649 | — | 14,148,649 | ||||||||||||
Variable Rate Senior Loan Interests | — | 13,504,544 | — | 13,504,544 | ||||||||||||
Short-Term Investments: | ||||||||||||||||
Repurchase Agreements | — | 1,090,714 | — | 1,090,714 | ||||||||||||
Investments in Derivatives: | ||||||||||||||||
Forward Foreign Currency Contracts** | — | 171,275 | — | 171,275 | ||||||||||||
Cross Currency Swaps** | — | 1,765,747 | — | 1,765,747 | ||||||||||||
Total | $ | 52,751,180 | $ | 814,098,065 | $ | — | $ | 866,849,245 | ||||||||
| JLS | ||||||||||||||||
Long-Term Investments*: | ||||||||||||||||
Mortgage-Backed Securities | $ | — | $ | 113,935,213 | $ | — | $ | 113,935,213 | ||||||||
Asset-Backed Securities | — | 50,537,241 | — | 50,537,241 | ||||||||||||
Short-Term Investments: | ||||||||||||||||
U.S. Government And Agency Obligations | — | 215,000 | — | 215,000 | ||||||||||||
Total | $ | — | $ | 164,687,454 | $ | — | $ | 164,687,454 | ||||||||
| * | Refer to the Fund’s Portfolio of Investments for industry and country classifications, where applicable. |
| ** | Represents net unrealized appreciation (depreciation) as reported in the Fund’s Portfolio of Investments. |
4. Portfolio Securities and Investments in Derivatives
Portfolio Securities
Unfunded Commitments for JGH and NPCT
Pursuant to the terms of certain of the variable rate senior loan agreements, JGH and NPCT may have unfunded senior loan commitments. Each Fund will maintain with its custodian, cash, liquid securities and/or liquid senior loans having an aggregate value at least equal to the amount of unfunded senior loan commitments. As of the end of the reporting period, JGH and NPCT had no such outstanding unfunded senior loan commitments.
Participation Commitments for JGH and NPCT
With respect to the senior loans held in JGH’s and NPCT’s portfolio, the Funds may: 1) invest in assignments; 2) act as a participant in primary lending syndicates; or 3) invest in participations. If a Fund purchases a participation of a senior loan interest, the Fund would typically enter into a contractual agreement with the lender or other third party selling the participation, rather than directly with the borrower. As such, the Fund not only assumes the credit risk of the borrower, but also that of the selling participant or other persons interpositioned between the Fund and the borrower. As of the end of the reporting period, JGH and NPCT had no such outstanding participation commitments.
Repurchase Agreements
In connection with transactions in repurchase agreements, it is the Funds’ policy that its custodian take possession of the underlying collateral securities, the fair value of which exceeds the principal amount of the repurchase transaction, including accrued interest, at all times. If the counterparty defaults, and the fair value of the collateral declines, realization of the collateral may be delayed or limited.
The following table presents the repurchase agreements for the Funds that are subject to netting agreements as of the end of the reporting period, and the collateral delivered related to those repurchase agreements.
| Fund | Counterparty | Short-Term Investments, at Value | Collateral Pledged (From) Counterparty | |||||||
| JGH | Fixed Income Clearing Corporation | $ | 10,776,811 | $ | (10,992,349 | ) | ||||
NPCT | Fixed Income Clearing Corporation | 1,090,714 | (1,112,618 | ) | ||||||
59
Notes to Financial Statements (continued)
Zero Coupon Securities
A zero coupon security does not pay a regular interest coupon to its holders during the life of the security. Income to the holder of the security comes from accretion of the difference between the original purchase price of the security at issuance and the par value of the security at maturity and is effectively paid at maturity. The market prices of zero coupon securities generally are more volatile than the market prices of securities that pay interest periodically.
Investment Transactions
Long-term purchases and sales (including maturities but excluding derivative transactions) during the current fiscal period were as follows:
| JGH | NPCT | JLS | ||||||||||
Purchases | $ | 461,254,704 | $ | 931,350,736 | $ | 119,945,415 | ||||||
Sales and maturities | 459,630,237 | 66,684,207 | 125,090,517 | |||||||||
The Funds may purchase securities on a when-issued or delayed-delivery basis. Securities purchased on a when-issued or delayed-delivery basis may have extended settlement periods; interest income is not accrued until settlement date. Any securities so purchased are subject to market fluctuation during this period. The Funds have earmarked securities in their portfolio with a current value at least equal to the amount of the when-issued/delayed-delivery purchase commitments. If a Fund has outstanding when-issued/delayed-delivery purchases commitments as of the end of the reporting period, such amounts are recognized on the Statement of Assets and Liabilities.
Investments in Derivatives
Each Fund is authorized to invest in certain derivative instruments, such as futures, options and swap contracts. Each Fund limits its investments in futures, options on futures and swap contracts to the extent necessary for the Adviser to claim the exclusion from registration by the Commodity Futures Trading Commission as a commodity pool operator with respect to the Fund. The Funds record derivative instruments at fair value, with changes in fair value recognized on the Statement of Operations, when applicable. Even though the Funds’ investments in derivatives may represent economic hedges, they are not considered to be hedge transactions for financial reporting purposes.
Forward Foreign Currency Contracts
NPCT is authorized to enter into forward foreign currency contracts (“forward contracts”) under two circumstances: (i) when the Fund enters into a contract for the purchase or sale of a security denominated in a foreign currency to “lock in” the U.S. exchange rate of the transaction, with such period being a short-dated contract covering the period between transaction date and settlement date or (ii) when the Sub-Adviser believes that the currency of a particular foreign country may experience a substantial movement against the U.S. dollar or against another foreign currency.
A forward contract is an agreement between two parties to purchase or sell a specified quantity of a currency at or before a specified date in the future at a specified price. Forward contracts are typically traded in the OTC markets and all details of the contract are negotiated between the counterparties to the agreement. Accordingly, the forward contracts are valued by reference to the contracts traded in the OTC markets. The contractual obligations of a buyer or seller may generally be satisfied by taking or making physical delivery of the underlying currency, establishing an opposite position in the contract and recognizing the profit or loss on both positions simultaneously on the delivery date or, in some instances, paying a cash settlement before the designated date of delivery.
Forward contracts are valued daily at the forward rate. The net amount recorded on these transactions is recognized as a component of “Unrealized appreciation and/or depreciation on forward foreign currency contracts” on the Statement of Assets and Liabilities. The change in value of the forward contracts during the reporting period is recognized as a component of “Change in net unrealized appreciation (depreciation) of forward foreign currency contracts” on the Statement of Operations. When the contract is closed or offset with the same counterparty, the Fund recognizes the difference between the value of the contract at the time it was entered and the value at the time it was closed or offset as a component of “Net realized gain (loss) from forward foreign currency contracts” on the Statement of Operations.
Forward contracts will generally not be entered into for terms greater than three months, but may have maturities of up to six months or more. The use of forward contracts does not eliminate fluctuations in the underlying prices of the Fund’s investment securities; however, it does establish a rate of exchange that can be achieved in the future. The use of forward contracts involves the risk that anticipated currency movements will not be accurately predicted. A forward contract would limit the risk of loss due to a decline in the value of a particular currency; however, it also would limit any potential gain that might result should the value of the currency increase instead of decrease. These contracts may involve market risk in excess of the unrealized appreciation or depreciation reflected on the Statement of Assets and Liabilities. Forward contracts are subject to counterparty risk if the counterparty fails to perform as specified in the contract due to financial impairment or other reason.
60
During the current fiscal period, NPCT used forward foreign currency contracts to hedge exposure to Euro denominated positions.
The average notional amount of forward foreign currency contracts outstanding during the current fiscal period was as follows
| NPCT | ||||
Average notional amount of forward foreign currency contracts outstanding* | $ | 7,554,113 | ||
| * | The average notional amount is calculated based on the outstanding notional at the beginning of the current fiscal period and at the end of each fiscal quarter within the current fiscal period. |
The following table presents the fair value of forward foreign currency contracts held by the Fund as of the end of the reporting period, the location of these instruments on the Statement of Assets and Liabilities and the primary underlying risk exposure.
Location on the Statement of Assets and Liabilities | ||||||||||||||||||
| Underlying Risk Exposure | Derivative | Assets Derivatives | (Liablity)Derivatives | |||||||||||||||
| Location | Value | Location | Value | |||||||||||||||
| NPCT | ||||||||||||||||||
Foreign currency exchange rate | Forward contracts | Unrealized appreciation on forward foreign currency contracts | $ | 171,275 | — | $ | — | |||||||||||
The following table presents the forward foreign currency contracts subject to netting agreements and the collateral delivered related to those forward foreign currency contracts as of the end of the reporting period.
| Counterparty | Gross Unrealized Appreciation on Forward Foreign Currency Contracts* | Gross Unrealized Depreciation) on Forward Foreign Currency Contracts* | Net Unrealized Appreciation Depreciation) on Forward Foreign Currency Contracts | Collateral Pledged to (from) Counterparty | Net Exposure | |||||||||||||||
Morgan Stanley Capital Services LLC | $ | 171,275 | $ | — | $ | 171,275 | $ | — | $ | 171,275 | ||||||||||
| * | Represents gross unrealized appreciation (depreciation) for the counterparty as reported in the Funds’ Portfolio of Investments. |
The following table presents the amount of net realized gain (loss) and change in net unrealized appreciation (depreciation) recognized on forward foreign currency contracts on the Statement of Operations during the current fiscal period, and the primary underlying risk exposure.
| Underlying Risk Exposure | Derivative Instrument | Net Realized Gain (Loss) | Change in Net Unrealized Appreciation (Depreciation) of Forward Foreign Currency Contracts | |||||||
Foreign currency rate | Forward contracts | $ | 283,146 | $ | 171,275 | |||||
Interest Rate Swap Contracts
Interest rate swap contracts involve a Fund’s agreement with the counterparty to pay or receive a fixed rate payment in exchange for the counterparty receiving or paying a variable rate payment. Forward interest rate swap contracts involve a Fund’s agreement with a counterparty to pay, in the future, a fixed or variable rate payment in exchange for the counterparty paying the Fund a variable or fixed rate payment, the accruals for which would begin at a specified date in the future (the “effective date”).
The amount of the payment obligation for an interest rate swap is based on the notional amount and the termination date of the contract. Interest rate swap contracts do not involve the delivery of securities or other underlying assets or principal. Accordingly, the risk of loss with respect to the swap counterparty on such transactions is limited to the net amount of interest payments that the Fund is to receive.
Interest rate swap contracts are valued daily. Upon entering into an interest rate swap contract (and beginning on the effective date for a forward interest rate swap contract), the Fund accrues the fixed rate payment expected to be paid or received and the variable rate payment expected to be received or paid on the interest rate swap contracts on a daily basis, and recognizes the daily change in the fair value of the Fund’s contractual rights and obligations under the contracts. For an over-the-counter (“OTC”) swap that is not cleared through a clearing house (“OTC Uncleared”), the amount recorded on these transactions is recognized on the Statement of Assets and Liabilities as a component of “Unrealized appreciation or depreciation on interest rate swaps.”
61
Notes to Financial Statements (continued)
Upon the execution of an OTC swap cleared through a clearing house (“OTC Cleared”), the Fund is obligated to deposit cash or eligible securities, also known as “initial margin,” into an account at its clearing broker equal to a specified percentage of the contract amount. Cash deposited by the Fund to cover initial margin requirements on open swap contracts, if any, is recognized as a component of “Cash collateral at brokers for investments in swaps” on the Statement of Assets and Liabilities. Investments in OTC Cleared swaps obligate the Fund and the clearing broker to settle monies on a daily basis representing changes in the prior day’s “mark-to-market” of the swap contract. If the Fund has unrealized appreciation, the clearing broker will credit the Fund’s account with an amount equal to the appreciation. Conversely, if the Fund has unrealized depreciation, the clearing broker will debit the Fund’s account with an amount equal to the depreciation. These daily cash settlements are also known as “variation margin.” Variation margin for OTC Cleared swaps is recognized as a receivable and/or payable for “Variation margin on swap contracts” on the Statement of Assets and Liabilities. Upon the execution of an OTC Uncleared swap, neither the Fund nor the counterparty is required to deposit initial margin as the trades are recorded bilaterally between both parties to the swap contract, and the terms of the variation margin are subject to a predetermined threshold negotiated by the Fund and the counterparty. Variation margin for OTC Uncleared swaps is recognized as a component of “Unrealized appreciation or depreciation on interest rate swaps” as described in the preceding paragraph.
The net amount of periodic payments settled in cash are recognized as a component of “Net realized gain (loss) from swaps” on the Statement of Operations, in addition to the net realized gain or loss recorded upon the termination of the swap contract. For tax purposes, payments expected to be received or paid on the swap contracts are treated as ordinary income or expense, respectively. Changes in the value of the swap contracts during the fiscal period are recognized as a component of “Change in net unrealized appreciation (depreciation) of swaps” on the Statement of Operations. In certain instances, payments are made or received upon entering into the swap contract to compensate for differences between the stated terms of the swap agreements and prevailing market conditions (credit spreads, currency exchange rates, interest rates, and other relevant factors). Payments received or made at the beginning of the measurement period, if any, are recognized as “Interest rate swaps premiums received and/or paid” on the Statement of Assets and Liabilities.
During the current fiscal period, JGH continued to use interest rate swap contracts to partially hedge its future interest cost of leverage, which is through the use of bank borrowings.
Cross Currency Swap Contracts
NPCT uses cross currency swap contracts to gain or mitigate exposure to foreign exchange markets. A cross currency swap is an agreement between two parties to exchange two different currencies with the understanding that the exchange will be reversed at a later date at specified exchange rates.
Risks may arise upon entering into these contracts from the potential of default by counterparty and, depending on their terms, may be subject to foreign exchange risk.
Cross currency swap contracts are valued daily. Upon entering into a cross currency swap contract the exchange of currencies takes place at the current spot rate. For an OTC Uncleared swap not cleared through a clearing house, the amount recorded on these transactions is recognized on the Statement of Assets and Liabilities as a component of “Unrealized appreciation or deprecation on cross currency swaps.”
Upon the execution of an OTC Cleared swap, the Fund is obligated to deposit cash or eligible securities, also known as “initial margin,” into an account at its clearing broker equal to a specified percentage of the contract amount. Cash held by the broker to cover initial margin requirements on open swap contracts, if any, is recognized as “Cash collateral at brokers for investments in swaps” on the Statement of Assets and Liabilities. Investments in OTC Cleared swaps obligate a Fund and the clearing broker to settle monies on a daily basis representing changes in the prior day’s “mark-to-market” of the swap. If a Fund has unrealized appreciation, the clearing broker would credit the Fund’s account with an amount equal to the appreciation and conversely if a Fund has unrealized depreciation, the clearing broker will debit a Fund’s account with an amount equal to the depreciation. These daily cash settlements are also known as “variation margin.” Variation margin for OTC Cleared swaps is recognized as a receivable and/or payable for “Variation margin on swap contracts” on the Statement of Assets and Liabilities. Upon the execution of an OTC Uncleared swap, neither the Fund nor the counterparty is required to deposit initial margin as the trades are recorded bilaterally between both parties to the swap contract, and the terms of the variation margin are subject to a predetermined threshold negotiated by the Fund and the counterparty. Variation margin for OTC Uncleared swaps is recognized as a component of “Unrealized appreciation or depreciation on cross currency swaps” as described in the preceding paragraph.
Interest payments, if applicable, are made between the parties based on interest rates available in the two currencies at the inception of the contract and recognized as a component of “Realized gain (loss) from swaps” on the Statement of Operations, in addition to the net realized gain or loss recorded upon the termination of the swap contract. At maturity, the re-exchange may take place at the same exchange rate, a specified rate, or the then current spot rate. Changes in value of the swap contracts during the fiscal period are recognized as a component of “Change in unrealized appreciation (depreciation) of swaps” on the Statement of the Operations. In certain instances, payments are made or received upon entering into the swap contract to compensate for differences between the stated terms of the swap agreements and prevailing market conditions (credit spreads, currency exchange rates, interest rates, and other relevant factors). Payments received or made at the beginning of the measurement period, if any, are recognized as “Cross currency swaps premiums received and/or paid” on the Statement of Assets and Liabilities.
62
During the current fiscal period, NPCT utilized cross currency swaps to hedge its Euro exposure to U.S. dollars
The average notional amount of each Fund’s respective swap contracts outstanding during the current fiscal period was as follows:
| JGH | NPCT | |||||||
Average notional amount of swap contracts outstanding* | $ | 87,400,000 | $ | 27,238,382 | ||||
| * | The average notional amount is calculated based on the outstanding notional at the beginning of the current fiscal period and at the end of each fiscal quarter within the current fiscal period. |
The following table presents the fair value of all swap contracts held by JGH and NPCT as of the end of the reporting period, the location of these instruments on the Statement of Assets and Liabilities and the primary underlying risk exposure.
Location on the Statement of Assets and Liabilities | ||||||||||||||||||
Underlying Risk Exposure | Derivative Instrument | Asset Derivatives | (Liability) Derivatives | |||||||||||||||
| Location | Value | Location | Value | |||||||||||||||
| JGH | ||||||||||||||||||
| Interest rate | Swaps (OTC Uncleared) | — | $ | — | Unrealized depreciation on interest rate swaps** | $ | (4,236,587 | ) | ||||||||||
| NPCT | ||||||||||||||||||
| Foreign currency exchange rate | Swaps (OTC Uncleared) | Unrealized appreciation on cross currency swaps** | $ | 1,765,747 | — | $ | — | |||||||||||
| ** | Some swaps contracts require a counterparty to pay or receive a premium, which is disclosed on the Statement of Assets and Liabilities, when applicable, and is not reflected in the cumulative unrealized appreciation (depreciation) presented above. |
The following table presents the swap contracts subject to netting agreements and the collateral delivered related to those swap contracts as of the end of the reporting period.
| Gross Amount Net Offset on the Statement of Assets and Liabilities | ||||||||||||||||||||||||||
| Fund | Counterparty | Gross Unrealized Appreciation on Swaps*** | Gross Unrealized (Depreciation) on Swaps*** | Net Unrealized Appreciation (Depreciation) on Swaps*** | Swaps Premiums Paid | Collateral Pledged to (from) Counterparty | Net Exposure | |||||||||||||||||||
| JGH | Morgan Stanley Capital Services LLC | $ | — | $ | (4,236,587 | ) | $ | (4,236,587 | ) | $ | — | $ | 4,237,306 | $ | 719 | |||||||||||
| NPCT | Citibank N.A. | $ | 922,304 | $ | — | $ | 922,304 | $ | 46,968 | $ | — | $ | 969,272 | |||||||||||||
J.P. Morgan Securities Inc. | 266,896 | $ | — | 266,896 | (4,177 | ) | — | 262,719 | ||||||||||||||||||
Morgan Stanley Capital Services LLC | 576,547 | $ | — | 576,547 | 4,247 | — | 580,794 | |||||||||||||||||||
| $ | 1,765,747 | $ | — | $ | 1,765,747 | $ | 47,038 | $ | — | $ | 1,812,785 | |||||||||||||||
| *** | Represents gross unrealized appreciation (depreciation) for the counterparty as reported in the Fund’s Portfolio of Investments. |
The following table presents the amount of net realized gain (loss) and change in net unrealized appreciation (depreciation) recognized on swap contracts on the Statement of Operations during the current fiscal period, and the primary underlying risk exposure.
| Fund | Underlying Risk Exposure | Derivative Instrument | Net Realized Gain (Loss) from Swaps | Change in Net Unrealized Appreciation (Depreciation) of Swaps | ||||||||
| JGH | Interest rate | Swaps | $ | (1,646,145 | ) | $ | 4,556,301 | |||||
| NPCT | Foreign currency exchange rate | Swaps | 156,234 | 1,765,747 | ||||||||
Market and Counterparty Credit Risk
In the normal course of business each Fund may invest in financial instruments and enter into financial transactions where risk of potential loss exists due to changes in the market (market risk) or failure of the other party to the transaction to perform (counterparty credit risk). The potential loss could exceed the value of the financial assets recorded on the financial statements. Financial assets, which potentially expose each Fund to counterparty credit risk, consist principally of cash due from counterparties on forward, option and swap transactions, when applicable. The extent of each Fund’s exposure to counterparty credit risk in respect to these financial assets approximates its carrying value as recorded on the Statement of Assets and Liabilities.
63
Notes to Financial Statements (continued)
Each Fund helps manage counterparty credit risk by entering into agreements only with counterparties the Adviser believes have the financial resources to honor their obligations and by having the Adviser monitor the financial stability of the counterparties. Additionally, counterparties may be required to pledge collateral daily (based on the daily valuation of the financial asset) on behalf of each Fund with a value approximately equal to the amount of any unrealized gain above a pre-determined threshold. Reciprocally, when each Fund has an unrealized loss, the Funds have instructed the custodian to pledge assets of the Funds as collateral with a value approximately equal to the amount of the unrealized loss above a pre-determined threshold. Collateral pledges are monitored and subsequently adjusted if and when the valuations fluctuate, either up or down, by at least the pre-determined threshold amount.
5. Fund Shares
Common Share Transactions
Transactions in common shares during the Funds’ current and prior fiscal period, where applicable, were as follows:
| NPCT* | ||||
| For the period 4/27/21 (commencement of operations) through 12/31/2021 | ||||
Common shares: | ||||
Sold | 28,750,000 | |||
| * | Prior to the commencement of operations, the Adviser purchased 5,000 shares, which are still held as of the end of the current fiscal period. |
6. Income Tax Information
Each Fund is a separate taxpayer for federal income tax purposes. Each Fund intends to distribute substantially all of its net investment company taxable income to common shareholders and to otherwise comply with the requirements of Subchapter M of the Internal Revenue Code applicable to regulated investment companies. In any year when the Funds realize net capital gains, each Fund may choose to distribute all or a portion of its net capital gains to common shareholders, or alternatively, to retain all or a portion of its net capital gains and pay federal corporate income taxes on such retained gains.
For all open tax years and all major taxing jurisdictions, management of the Funds have concluded that there are no significant uncertain tax positions that would require recognition in the financial statements. Open tax years are those that are open for examination by taxing authorities (i.e., generally the last four tax year ends and the interim tax period since then). Furthermore, management of the Funds is also not aware of any tax positions for which it is reasonably possible that the total amounts of unrecognized tax benefits will significantly change in the next twelve months.
The following information is presented on an income tax basis. Differences between amounts for financial statement and federal income tax purposes are primarily due to recognition of market discount accretion on investments, recognition of premium amortization and timing differences in recognizing certain gains and losses on investment transactions. To the extent that differences arise that are permanent in nature, such amounts are reclassified within the capital accounts as detailed below. Temporary differences do not require reclassification. Temporary and permanent differences do not impact the NAV of the Funds.
The table below presents the cost and unrealized appreciation (depreciation) of each Fund’s investment portfolio, as determined on a federal income tax basis, as of December 31, 2021.
For purposes of this disclosure, derivative tax cost is generally the sum of any upfront fees or premiums exchanged and any amounts unrealized for income statement reporting but realized in income and/or capital gains for tax reporting. If a particular derivative category does not disclose any tax unrealized appreciation or depreciation, the change in value of those derivatives have generally been fully realized for tax purposes.
| JGH | NPCT | JLS | ||||||||||
Tax cost of investments | $ | 534,150,152 | $ | 867,131,261 | $ | 164,777,556 | ||||||
Gross unrealized: | ||||||||||||
Appreciation | 11,989,632 | 11,396,181 | 2,451,179 | |||||||||
Depreciation | (14,304,150 | ) | (11,631,159 | ) | (2,541,281 | ) | ||||||
Net unrealized appreciation (depreciation) of investments | $ | (2,314,518 | ) | $ | (234,978 | ) | $ | (90,102 | ) | |||
Permanent differences, primarily due to foreign currency transactions, treatment of notional principal contracts, complex securities character adjustments, investments in MBS, nondeductible offering costs, distribution reallocations, paydowns, and bond premium amortization adjustments, resulted in reclassifications among the Funds’ components of net assets as of December 31, 2021, the Funds’ tax year end.
64
The tax components of undistributed net ordinary income and net long-term capital gains as of December 31, 2021, the Funds’ tax year end, were as follows:
| JGH | NPCT | JLS | ||||||||||
Undistributed net ordinary income | $ | — | $ | — | $ | — | ||||||
Undistributed net long-term capital gains | — | — | — | |||||||||
The tax character of distributions paid during the Funds’ tax years ended December 31, 2021 and December 31, 2020 was designated for purposes of the dividends paid deduction as follows:
| 2021 | JGH | NPCT2 | JLS | |||||||||
Distributions from net ordinary income¹ | $ | 22,729,429 | $ | 11,231,531 | $ | 4,636,388 | ||||||
Distributions from net long-term capital gains | — | — | — | |||||||||
Return of capital | 7,424,359 | 9,500,824 | 664,479 | |||||||||
| 2020 | JGH | JLS | ||||||
Distributions from net ordinary income¹ | $ | 24,735,572 | $ | 4,012,755 | ||||
Distributions from net long-term capital gains | — | — | ||||||
Return of capital | 956,568 | 1,342,986 | ||||||
| 1 | Net ordinary income consists of net taxable income derived from dividends, interest, and net short-term capital gains, if any. |
| 2 | For the period April 27, 2021 (commencement of operations) through December 31, 2021. |
As of December 31, 2021, the Funds’ tax year end, the following Funds had unused capital losses carrying forward available for federal income tax purposes to be applied against future capital gains, if any. The capital losses are not subject to expiration.
| JGH | JLS | |||||||
Not subject to expiration: | ||||||||
Short-term | $ | 25,221,422 | $ | 1,168,110 | ||||
Long-term | 63,501,825 | — | ||||||
Total | $ | 88,723,247 | $ | 1,168,110 | ||||
During the Funds’ tax year ended December 31, 2021, the following Funds utilized capital loss carryforwards as follows:
| JGH | JLS | |||||||
Utilized capital loss carryforwards | $ | 22,895,508 | $ | 960,630 | ||||
7. Management Fees and Other Transactions with Affiliates
Each Fund’s management fee compensates the Adviser for overall investment advisory and administrative services and general office facilities. The Sub-Advisers are compensated for its services to the Funds from the management fees paid to the Adviser.
Each Fund’s management fee consists of two components – a fund-level fee, based only on the amount of assets within each individual Fund, and a complex-level fee, based on the aggregate amount of all eligible fund assets managed by the Adviser. This pricing structure enables Fund shareholders to benefit from growth in the assets within their respective Fund as well as from growth in the amount of complex-wide assets managed by the Adviser.
The annual fund-level fee, payable monthly, for each Fund is calculated according to the following schedule:
| JGH | NPCT | |||||||
| Average Daily Managed Assets | Fund-Level Fee Rate | Fund-Level Fee Rate | ||||||
For the first $500 million | 0.7000 | % | 0.8000 | % | ||||
For the next $500 million | 0.6750 | 0.7750 | ||||||
For the next $500 million | 0.6500 | 0.7500 | ||||||
For the next $500 million | 0.6250 | 0.7250 | ||||||
For managed assets over $2 billion | 0.6000 | 0.7000 | ||||||
| JLS | ||||
| Average Daily Managed Assets1 | Fund-Level Fee Rate | |||
For the first $125 million | 0.8000 | % | ||
For the next $125 million | 0.7875 | |||
For the next $150 million | 0.7750 | |||
For the next $600 million | 0.7625 | |||
For managed assets over $1 billion | 0.7500 | |||
65
Notes to Financial Statements (continued)
The annual complex-level fee, payable monthly, for each Fund is calculated by multiplying the current complex-wide fee rate, determined according to the following schedule by the Fund’s daily managed assets:
| Complex-Level Eligible Asset Breakpoint Level2 | Effective Complex-Level Fee Rate at Breakpoint Level | |||
$55 billion | 0.2000 | % | ||
$56 billion | 0.1996 | |||
$57 billion | 0.1989 | |||
$60 billion | 0.1961 | |||
$63 billion | 0.1931 | |||
$66 billion | 0.1900 | |||
$71 billion | 0.1851 | |||
$76 billion | 0.1806 | |||
$80 billion | 0.1773 | |||
$91 billion | 0.1691 | |||
$125 billion | 0.1599 | |||
$200 billion | 0.1505 | |||
$250 billion | 0.1469 | |||
$300 billion | 0.1445 | |||
| 1 | “Managed assets” means the total assets of the Fund, minus the sum of its accrued liabilities (other than the Fund liabilities incurred for the express purpose of creating effective leverage). Total assets for this purpose shall include assets attributable to the Fund’s use of effective leverage (whether or not those assets are reflected in the Fund’s financial statements for the purposes of U.S. GAAP). |
| 2 | For the complex-level fees, managed assets include closed-end fund assets managed by the Adviser that are attributable to certain types of leverage. For these purposes, leverage includes the fund’s use of preferred stock and borrowings and certain investments in the residual interest certificates (also called inverse floating rate securities) in tender option bond (TOB) trusts, including the portion of assets held by a TOB trust that has been effectively financed by the trust’s issuance of floating rate securities, subject to an agreement by the Adviser as to certain funds to limit the amount of such assets for determining managed assets in certain circumstances. The complex-level fee is calculated based upon the aggregate daily managed assets of all Nuveen open-end and closed-end funds that constitute “eligible assets.” Eligible assets do not include assets attributable to investments in other Nuveen funds or assets in excess of a determined amount (originally $2 billion) added to the Nuveen fund complex in connection with the Adviser’s assumption of the management of the former First American Funds effective January 1, 2011, but do not include certain assets of certain Nuveen funds that were reorganized into funds advised by an affiliate of the Adviser during the 2019 calendar year. As of December 31, 2021, the complex-level fee for each Fund was 0.1531%. |
8. Borrowing Arrangements
Borrowings
JGH, NPCT and JLS have entered into a borrowing arrangement (“Borrowings”) as a means of leverage.
Borrowings Information for JGH
The Fund has entered into a 364-day revolving line of credit. As of the end of the reporting period, the Fund’s maximum commitment amount under its Borrowings is as follows:
| JGH | ||||
Maximum commitment amount | $ | 165,000,000 | ||
As of the end of the reporting period, the Fund’s outstanding balance on its Borrowings was as follows:
| JGH | ||||
Outstanding balance on Borrowings | $ | 159,000,000 | ||
Interest is charged on the Borrowings drawn amount at a rate per annum equal to one-month LIBOR (London Inter-Bank Offered Rate) plus 0.70% for LIBOR loans or Federal Funds rate plus 0.80% for Base Rate Loans. The Fund also accrued a 0.15% per annum commitment fee based on the undrawn balance based on the maximum commitment amount of the Borrowings to the extent the unused portion of the Borrowings is less than 50% of the maximum commitment amount otherwise the per annum commitment fee is 0.25%.
On November 15, 2021, the Fund renewed its Borrowings through November 14, 2022. The Fund also accrued a 0.05% amendment fee based on the maximum commitment amount. All other terms of the Borrowings remain unchanged.
During the Fund’s utilization period(s) during the current fiscal period, the average daily balance outstanding (which was for the entire current reporting period) and average annual interest rate on the Fund’s Borrowings were as follows:
| JGH | ||||
Average daily balance outstanding | $ | 157,023,014 | ||
Average annual interest rate | 0.81 | % | ||
66
Borrowings Information for NPCT
The Fund has entered into a committed financing agreement. As of the end of the reporting period, the Fund’s maximum commitment amount under its Borrowings is as follows:
| NPCT | ||||
Maximum commitment amount | $ | 185,000,000 | ||
As of the end of the reporting period, the Fund’s outstanding balance on its Borrowings was as follows:
| NPCT | ||||
Outstanding balance on Borrowings | $ | 167,000,000 | ||
Interest is charged on these Borrowings at Fed Funds plus 0.65% per annum on the amount borrowed and 0.25% per annum on the undrawn balance (which was waived for the initial 30 days) and a one-time upfront fee of 0.05% (0.025% paid at closing of the Borrowings and 0.025% due at the one year anniversary) per annum of the maximum commitment amount.
During the current fiscal period, the average daily balance outstanding and average annual interest rate on the Fund’s Borrowings were as follows:
| NPCT | ||||
Utilization period (days outstanding) | 123 | |||
Average daily balance outstanding | $ | 136,487,805 | ||
Average annual interest rate | 0.83 | % | ||
Borrowings Information for JLS
The Fund has entered into a committed financing agreement. As of the end of the reporting period, the Fund’s maximum commitment amount under its Borrowings is as follows:
| JLS | ||||
Maximum commitment amount | $ | 22,500,000 | ||
As of the end of the reporting period, the Fund’s outstanding balance on its Borrowings was as follows:
| JLS | ||||
Outstanding balance on Borrowings | $ | 8,455,000 | ||
Interest is charged on these Borrowings at 3-Month LIBOR (London Inter-Bank Offered Rate) plus 1.50% (2.00% prior to February 18, 2021) per annum on the amount borrowed and 0.50% per annum on the undrawn balance (which was waived for the reporting period).
During the Fund’s utilization period(s) during the current fiscal period, the average daily balance outstanding (which was for the entire current reporting period) and average annual interest rate on the Fund’s Borrowings were as follows:
| JLS | ||||
Average daily balance outstanding | $ | 12,417,740 | ||
Average annual interest rate | 1.77 | % | ||
Other Borrowings Information for the Funds
In order to maintain their Borrowings, the Funds must meet certain collateral, asset coverage and other requirements. Each Fund’s Borrowings outstanding is fully secured by eligible securities held in its portfolio of investments.
Each Fund’s Borrowings outstanding is recognized as “Borrowings” on the Statement of Assets and Liabilities. Interest expense incurred on the borrowed amount, undrawn balance and initial fees are recognized as a component of “Interest expense” on the Statement of Operations.
Rehypothecation
JLS has entered into a Rehypothecation Side Letter (“Side Letter”) with its prime brokerage lender, allowing it to re-register the Pledged Collateral in its own name or in a name other than the Fund’s to pledge, repledge, hypothecate, rehyphothecate, sell, lend or otherwise transfer or use the Pledged Collateral (the “Hypothecated Securities”) with all rights of ownership as described in the Side Letter. Subject to certain conditions, the total value of the outstanding Hypothecated Securities shall not exceed the lesser of (i) 98% of the outstanding balance on the Borrowings to which the Pledged Collateral relates and (ii) 331/3% of the Fund’s total assets. The Fund may designate any Pledged Collateral as ineligible for rehypothecation. The Fund may also recall Hypothecated Securities on demand.
67
Notes to Financial Statements (continued)
The Fund also has the right to apply and set-off an amount equal to one-hundred percent (100%) of the then-current fair market value of such Pledged Collateral against the current Borrowings under the Side Letter in the event that prime brokerage lender fails to timely return the Pledged Collateral and in certain other circumstances. In such circumstances, however, the Fund may not be able to obtain replacement financing required to purchase replacement securities and, consequently, the Fund’s income generating potential may decrease. Even if the Fund is able to obtain replacement financing, it might not be able to purchase replacement securities at favorable prices.
The Fund will receive a fee in connection with the Hypothecated Securities (“Rehypothecation Fees”) in addition to any principal, interest, dividends and other distributions paid on the Hypothecated Securities.
As of the end of the reporting period, the Fund had Hypothecated Securities totaling $4,723,492. During the current fiscal period, the Fund earned Rehypothecation Fees of $4,030, which is recognized as “Rehypothecation income” on the Statement of Operations.
Reverse Repurchase Agreements
During the current fiscal period, NPCT and JLS used reverse repurchase agreements as a means of leverage.
The Fund may enter into a reverse repurchase agreement with brokers, dealers, banks or other financial institutions that have been determined by the Adviser to be creditworthy. In a reverse repurchase agreement, a Fund sells to the counterparty a security that it holds with a contemporaneous agreement to repurchase the same security at an agreed-upon price and date, reflecting the interest rate effective for the term of the agreement. It may also be viewed as the borrowing of money by the Fund. Cash received in exchange for securities delivered, plus accrued interest payments to be made by the Fund to a counterparty, are reflected as a liability on the Statement of Assets and Liabilities. Interest payments made by the Fund to counterparties are recognized as a component of “Interest expense” on the Statement of Operations.
In a reverse repurchase agreement, the Fund retains the risk of loss associated with the sold security. In order to minimize risk, the Fund pledges and/or segregates securities and cash as collateral with a fair value at least equal to its purchase obligations under these agreements (including accrued interest). Reverse repurchase agreements also involve the risk that the purchaser fails to return the securities as agreed upon, files for bankruptcy or becomes insolvent. Upon a bankruptcy or insolvency of a counterparty, the Fund is considered to be an unsecured creditor with respect to excess collateral and as such the return of excess collateral may be delayed. A Fund will pledge assets determined to be liquid by the Adviser to cover its obligations under reverse repurchase agreements.
As of the end of the reporting period, the Funds’ outstanding balances on its reverse repurchase agreement were as follows:
NPCT
| Counterparty | Coupon | Principal Amount | Maturity | Value | Value and Accrued Interest | |||||||||||||||
TD Securities (USA), LLC | 0.47% | $ | (35,000,000 | ) | 1/27/22 | $ | (35,000,000 | ) | $ | (35,030,159) | ||||||||||
RBC Capital Markets, LLC | 0.49% | (32,500,000 | ) | 2/1/22 | (32,500,000 | ) | (32,513,713) | |||||||||||||
Societe Generale | 0.69% | (24,050,000 | ) | 2/1/22 | (24,050,000 | ) | (24,077,971) | |||||||||||||
Societe Generale | 0.54% | (46,250,000 | ) | 2/1/22 | (46,250,000 | ) | (46,292,035) | |||||||||||||
| $ | (137,800,000 | ) | $ | (137,800,000 | ) | $ | (137,913,878) | |||||||||||||
JLS
| Counterparty | Coupon | Principal Amount | Maturity | Value | Value and Accrued Interest | |||||||||||||||
Morgan Stanley Bank, N.A. | 1.09% | $ | (10,729,000 | ) | 3/2/22 | $ | (10,729,000 | ) | $ | (10,740,778 | ) | |||||||||
Royal Bank of Canada | 1.01% | (15,135,000 | ) | 1/10/22 | (15,135,000 | ) | (15,166,554 | ) | ||||||||||||
Societe Generale | 0.96% | (8,367,000 | ) | 1/14/22 | (8,367,000 | ) | (8,381,649 | ) | ||||||||||||
| $ | (34,231,000 | ) | $ | (34,231,000 | ) | $ | (34,288,981 | ) | ||||||||||||
During the current fiscal period, the average daily balance outstanding and average interest rate on the Funds’ reverse repurchase agreement were as follows:
| NPCT | JLS | |||||||
Utilization period (days outstanding) | 177 | 365 | ||||||
Average daily balance outstanding | $ | (89,783,051 | ) | $ | (27,726,200 | ) | ||
Weighted average interest rate | 0.53 | % | 1.13 | % | ||||
68
The following table presents the reverse repurchase agreements subject to netting agreements and the collateral delivered related to those reverse repurchase agreements.
NPCT
| Counterparty | Reverse Repurchase Agreements* | Collateral Pledged to Counterparty | ||||||
TD Securities (USA), LLC | $ | (35,030,159 | ) | $ | (39,251,248 | ) | ||
RBC Capital Markets, LLC | (32,513,713 | ) | (35,430,343 | ) | ||||
Societe Generale | (24,077,971 | ) | (36,656,983 | ) | ||||
Societe Generale | (46,292,035 | ) | (54,979,685 | ) | ||||
JLS
| Counterparty | Reverse Repurchase Agreements* | Collateral Pledged to Counterparty | ||||||
Morgan Stanley Bank, N.A. | $ | (10,740,778 | ) | $ | (14,487,832 | ) | ||
Royal Bank of Canada | (15,166,554 | ) | (22,149,342 | ) | ||||
Societe Generale | (8,381,649 | ) | (11,075,292 | ) | ||||
| * | Represents gross value and accrued interest for the counterparty as reported in the preceding table. |
Inter-Fund Borrowing and Lending
The SEC has granted an exemptive order permitting registered open-end and closed-end Nuveen funds to participate in an inter-fund lending facility whereby the Nuveen funds may directly lend to and borrow money from each other for temporary purposes (e.g., to satisfy redemption requests or when a sale of securities “fails,” resulting in an unanticipated cash shortfall) (the “Inter-Fund Program”). The closed-end Nuveen funds, including the Fund covered by this shareholder report, will participate only as lenders, and not as borrowers, in the Inter-Fund Program because such closed-end funds rarely, if ever, need to borrow cash to meet redemptions. The Inter-Fund Program is subject to a number of conditions, including, among other things, the requirements that (1) no fund may borrow or lend money through the Inter-Fund Program unless it receives a more favorable interest rate than is typically available from a bank or other financial institution for a comparable transaction; (2) no fund may borrow on an unsecured basis through the Inter-Fund Program unless the fund’s outstanding borrowings from all sources immediately after the inter-fund borrowing total 10% or less of its total assets; provided that if the borrowing fund has a secured borrowing outstanding from any other lender, including but not limited to another fund, the inter-fund loan must be secured on at least an equal priority basis with at least an equivalent percentage of collateral to loan value; (3) if a fund’s total outstanding borrowings immediately after an inter-fund borrowing would be greater than 10% of its total assets, the fund may borrow through the inter-fund loan on a secured basis only; (4) no fund may lend money if the loan would cause its aggregate outstanding loans through the Inter-Fund Program to exceed 15% of its net assets at the time of the loan; (5) a fund’s inter-fund loans to any one fund shall not exceed 5% of the lending fund’s net assets; (6) the duration of inter-fund loans will be limited to the time required to receive payment for securities sold, but in no event more than seven days; and (7) each inter-fund loan may be called on one business day’s notice by a lending fund and may be repaid on any day by a borrowing fund. In addition, a Nuveen fund may participate in the Inter-Fund Program only if and to the extent that such participation is consistent with the fund’s investment objective and investment policies. The Board is responsible for overseeing the Inter-Fund Program.
The limitations detailed above and the other conditions of the SEC exemptive order permitting the Inter-Fund Program are designed to minimize the risks associated with Inter-Fund Program for both the lending fund and the borrowing fund. However, no borrowing or lending activity is without risk. When a fund borrows money from another fund, there is a risk that the loan could be called on one day’s notice or not renewed, in which case the fund may have to borrow from a bank at a higher rate or take other actions to payoff such loan if an inter-fund loan is not available from another fund. Any delay in repayment to a lending fund could result in a lost investment opportunity or additional borrowing costs.
During the current reporting period, none of the Funds covered by this shareholder report have entered into any inter-fund loan activity.
69
(Unaudited)
CURRENT INVESTMENT OBJECTIVE, INVESTMENT POLICIES AND PRINCIPAL RISKS OF THE FUND
NUVEEN GLOBAL HIGH INCOME FUND (JGH)
Investment Objective
The Fund’s investment objective is to provide a high level of current income.
Investment Policies
Under normal conditions, the Fund will invest at least 80% of its Managed Assets (as defined below) in global income-producing securities including, but not limited to, corporate debt securities, U.S. and foreign government debt securities, mortgage- and asset-backed securities, preferred securities, secured and unsecured loans, convertible debt securities and contingent capital securities.
The Fund will pursue its investment objective by following the sub-adviser’s global high-income strategy, which invests in a portfolio of high yield (below investment grade) bonds and other income producing securities from around the world and across the capital structure and credit spectrum.
“Managed Assets” mean the total assets of the Fund, minus the sum of its accrued liabilities (other than Fund liabilities incurred for the express purpose of creating leverage). Total assets for this purpose shall include assets attributable to the Fund’s use of leverage (whether or not those assets are reflected in the Fund’s financial statements for purposes of generally accepted accounting principles), and derivatives will be valued at their market value.
Under normal market conditions:
| • | The Fund will invest at least 65% of its Managed Assets in securities that, at the time of investment, are rated below the four highest grades (those rated BB/Ba or lower) by at least one nationally recognized statistical rating organization (“NRSRO”) or are unrated but judged to be of comparable quality by the Fund’s sub-adviser. |
| • | The Fund will invest at least 40% of its Managed Assets in securities of issuers located outside of the United States; however, no more than 25% of its Managed Assets may be invested in securities of issuers located in emerging market countries. |
| • | No more than 15% of the Fund’s Managed Assets may be exposed to currencies other than the U.S. dollar, net of any currency hedging transactions. |
| • | The Fund will invest no more than 10% of its Managed Assets in U.S. dollar cash or cash equivalents. |
The foregoing policies apply only at the time of any new investment.
Approving Changes in Investment Policies
The Board of Trustees of the Fund may change the policies described above without a shareholder vote. However, with respect to the Fund’s policy of investing at least 80% of its Managed Assets in global income-producing securities including, but not limited to, corporate debt securities, U.S. and foreign government debt securities, mortgage- and asset-backed securities, preferred securities, secured and unsecured loans, convertible debt securities and contingent capital securities, such policy may not be changed without 60 days’ prior written notice to shareholders.
Portfolio Contents
The Fund generally invests in corporate debt securities and debt securities of governmental issuers in all countries, including emerging market countries. The Fund will classify an issuer of a security as being a U.S. or non-U.S. issuer based on the determination of an unaffiliated, recognized financial data provider. Such determinations are based on a number of criteria, such as the issuer’s country of domicile, the primary exchange on which the security predominately trades, the location from which the majority of the issuer’s revenue comes, and the issuer’s reporting currency. Furthermore, a country is considered to be an “emerging market” if it has a relatively low gross national product per capita compared to the world’s major economies and the potential for rapid economic growth. The Fund considers a country an emerging market country based on the determination of an international organization, such as the International Monetary Fund (“IMF”), or an unaffiliated, recognized financial data provider.
Corporate debt securities are fully taxable debt obligations issued by corporations. These securities fund capital improvements, expansions, debt refinancing or acquisitions that require more capital than would ordinarily be available from a single lender. Investors in corporate debt securities lend money to the issuing corporation in exchange for interest payments and repayment of the principal at a set maturity date. Rates on corporate debt securities are set according to prevailing interest rates at the time of the issue, the credit rating of the issuer, the length of the maturity and other terms of the security, such as a call feature. Corporate debt securities are subject to the risk of an issuer’s inability to meet principal and interest payments on the obligations and may also be subject to price volatility due to such factors as market interest rates, market perception of the creditworthiness of the issuer and general market liquidity. In addition, corporate restructurings, such as mergers, leveraged buyouts, takeovers or similar corporate transactions are
70
often financed by an increase in a corporate issuer’s debt securities. As a result of the added debt burden, the credit quality and market value of an issuer’s existing debt securities may decline significantly.
Debt securities of governmental issuers in all countries, including emerging market countries, may include: fixed-income securities issued or guaranteed by governments and governmental agencies or instrumentalities; fixed-income securities issued by government owned, controlled or sponsored entities; interests in entities organized and operated for the purpose of restructuring the investment characteristics of instruments issued by any of the above issuers; Brady Bonds, which are debt securities issued under the framework of the Brady Plan as a means for debtor nations to restructure their outstanding external indebtedness; participations in loans between governments and financial institutions; or fixed income securities issued by supranational entities such as the World Bank or the European Economic Community. A supranational entity is a bank, commission or company established or financially supported by the national governments of one or more countries to promote reconstruction or development.
The Fund invests in convertible securities, which may include convertible debt, convertible preferred stock, synthetic convertible securities and may also include secured and unsecured debt, based upon the judgment of the Fund’s sub-adviser. Convertible securities may pay interest or dividends that are based on a fixed or floating rate. A convertible security is a preferred stock, warrant or other security that may be converted into or exchanged for a prescribed amount of common stock or other security of the same or a different issuer or into cash within a particular period of time at a specified price or formula.
The Fund invests in contingent capital securities (sometimes referred to as “CoCos”). CoCos are hybrid securities, issued primarily by non-U.S. financial institutions, which have loss absorption mechanisms benefitting the issuer built into their terms. CoCos generally provide for mandatory conversion into the common stock of the issuer or a write-down of the principal amount or value of the CoCos upon the occurrence of certain triggers linked to regulatory capital thresholds. In addition, they may provide for mandatory conversion or a principal write-down upon the occurrence of certain events such as regulatory actions calling into question the issuing banking institution’s continued viability as a going-concern. Equity conversion or principal write-down features are tailored to the issuer and its regulatory requirements and, unlike traditional convertible securities, conversions are not voluntary.
The Fund may invest in mortgage-backed securities (“MBS”) guaranteed by, or secured by collateral that is guaranteed by, the United States government, its agencies, instrumentalities or sponsored corporations. MBS are structured debt obligations collateralized by pools of commercial or residential mortgages. Pools of mortgage loans and mortgage-related loans, such as mezzanine loans, are assembled into pools of assets that secure or back securities sold to investors by various governmental, government-related and private organizations. MBS in which the Fund may invest include those with fixed, floating or variable interest rates, those with interest rates that change based on a specified index of interest rates and those with interest rates that change inversely to changes in interest rates, as well as those that do not bear interest.
The Fund may invest in commercial mortgage-backed securities (“CMBS”). CMBS generally are multi-class debt or pass-through certificates secured or backed by mortgage loans on commercial properties. CMBS generally are structured to provide protection to the senior class investors against potential losses on the underlying mortgage loans. This protection generally is provided by having the holders of subordinated classes of securities take the first loss if there are defaults on the underlying commercial mortgage loans. Other protection, which may benefit all of the classes or particular classes, may include issuer guarantees, reserve funds, cross-collateralization and over-collateralization. The Fund may invest in CMBS issued or sponsored by commercial banks, savings and loan institutions, mortgage bankers, private mortgage insurance companies and other non-governmental issuers. CMBS have no governmental guarantee.
The Fund may also invest in asset-backed securities (“ABS”). ABS are securities that are primarily serviced by the cash flows of a discrete pool of receivables or other financial assets, either fixed or revolving, that by their terms convert into cash within a finite time period. Asset-backed securitization is a financing technique in which financial assets, in many cases themselves less liquid, are pooled and converted into instruments that may be offered and sold in the capital markets. While residential mortgages were the first financial assets to be securitized in the form of MBS, non-mortgage related securitizations have grown to include many other types of financial assets, such as credit card receivables, auto loans and student loans.
The Fund may invest in preferred securities. Traditional preferred securities are generally equity securities of the issuer that have priority over the issuer’s common shares as to the payment of dividends (i.e., the issuer cannot pay dividends on its common shares until the dividends on the preferred shares are current) and as to the payout of proceeds of a bankruptcy or other liquidation, but are subordinate to an issuer’s senior debt and junior debt as to both types of payments. Additionally, in a bankruptcy or other liquidation, traditional preferred securities are generally subordinate to an issuer’s trade creditors and other general obligations. Traditional preferred securities may be perpetual or have a term, and typically have a fixed liquidation (or “par”) value. The term “preferred securities” also includes certain hybrid securities and other types of preferred securities that do not have the traditional features described above.
The Fund may invest in fixed and floating rate loans. Loans may include senior loans and secured and unsecured junior loans, including subordinated loans, second lien or more junior loans and bridge loans. Loans are typically arranged through private negotiations between borrowers in the United States or in foreign or emerging markets which may be corporate issuers or issuers of sovereign debt obligations and one or more financial institutions
71
Shareholder Update (continued)
(Unaudited)
and other lenders. The Fund may invest in loans by purchasing assignments of all or a portion of loans or loan participations from third parties. Loan participations are loans that are shared by a group of lenders.
The Fund may invest in Real Estate Investment Trusts (“REITs”). A common type of real estate company, a REIT, is a company that pools investors’ funds for investment primarily in income-producing real estate or in real estate related loans (such as mortgages) or other interests. Therefore, a REIT normally derives its income from rents or from interest payments, and may realize capital gains by selling properties that have appreciated in value. REITs generally pay relatively high dividends (as compared to other types of companies) and the Fund intends to use these REIT dividends in an effort to meet its primary objective of high current income.
The Fund’s investments include investment grade and below investment grade securities. Below investment grade securities (such securities are commonly referred to as “high yield” or “junk”) generally provide high income in an effort to compensate investors for their higher risk of default, which is the failure to make required interest or principal payments.
The Fund may invest in zero coupon bonds. A zero coupon bond is a bond that typically does not pay interest for the entire life of the obligation or for an initial period after the issuance of the obligation.
The Fund may invest in illiquid securities (i.e., securities that are not readily marketable), including, but not limited to, restricted securities (securities the disposition of which is restricted under the federal securities laws), securities that may be resold only pursuant to Rule 144A under the Securities Act of 1933, as amended (the “1933 Act”), and repurchase agreements with maturities in excess of seven days.
The Fund may enter into certain derivative instruments in pursuit of its investment objective, including to seek to enhance return, to hedge certain risks of its investments in fixed-income securities or as a substitute for a position in the underlying asset. Such instruments include options, financial futures contracts, swap contracts (including interest rate, credit default swaps and currency swaps), options on financial futures, options on swap contracts, forward foreign currency contracts and options on foreign currencies or other derivative instruments. The Fund’s use of currency-related derivative instruments will be limited to hedging purposes only.
The Fund may also invest in securities of other open- or closed-end investment companies (including exchange-traded funds (“ETFs”)) that invest primarily in securities of the types in which the Fund may invest directly, to the extent permitted by the Investment Company Act of 1940, as amended (the “1940 Act”), the rules and regulations issued thereunder and applicable exemptive orders issued by the Securities and Exchange Commission (“SEC”).
Use of Leverage
The Fund uses leverage to pursue its investment objective. The Fund may use leverage to the extent permitted by the 1940 Act. The Fund may source leverage through a number of methods including the issuance of preferred shares of beneficial interest and borrowings. In addition, the Fund may also use certain derivatives that have the economic effect of leverage by creating additional investment exposure. The amount and sources of leverage will vary depending on market conditions.
Temporary Defensive Periods
During temporary defensive periods the Fund may deviate from its investment objective and policies, and in order to keep the Fund’s cash fully invested, the Fund may invest any percentage of its total assets in U.S. dollar cash or cash equivalents, including obligations issued or guaranteed by the U.S. government, its agencies and instrumentalities. The Fund may not achieve its investment objective during such periods.
72
NUVEEN CORE PLUS IMPACT FUND (NPCT)
Investment Objective
The Fund’s investment objective is to seek total return through high current income and capital appreciation, while giving special consideration to certain impact and environmental, social and governance (“ESG”) criteria.
Investment Policies
Under normal market conditions, the Fund will invest at least 80% of its net assets plus the amount of any borrowings for investment purposes in fixed-income investments of any type, which are subject to the Impact Criteria (as defined below) or Nuveen’s ESG criteria.
The Fund seeks to achieve its investment objective by investing in fixed-income investments of any type, including asset-backed securities, corporate bonds, preferred securities, residential and commercial mortgage-backed securities, taxable and tax-exempt municipal bonds, senior loans and loan participations and assignments, sovereign debt instruments, debt securities issued by supranational agencies, and U.S. government securities (securities issued or guaranteed by the U.S. government or its agencies or instrumentalities).
The Fund’s investment in fixed-income investments of any type is subject to Nuveen’s proprietary public market impact framework criteria (the “Impact Criteria”) or Nuveen’s ESG criteria. The Impact Criteria are designed to identify investments that will generate positive, measurable social and environmental impact alongside a competitive financial return. These investments provide direct access to issuers and/or individual projects across four social and environmental themes: Affordable Housing, Community and Economic Development, Renewable Energy and Climate Change, and Natural Resources. The portion of the Fund invested in accordance with the Impact Criteria is not required to meet ESG criteria provided by a third party.
The Fund may seek to provide exposure to certain Regulation S securities by investing in Core Plus Impact Fund, Ltd. (the “Subsidiary”), a wholly owned subsidiary of the Fund, which will invest primarily in Regulation S securities.
“Managed Assets” mean the total assets of the Fund, minus the sum of its accrued liabilities (other than Fund liabilities incurred for the express purpose of creating leverage). Total assets for this purpose shall include assets attributable to the Fund’s use of leverage (whether or not those assets are reflected in the Fund’s financial statements for purposes of generally accepted accounting principles), and derivatives will be valued at their market value.
Under normal market conditions:
| • | The Fund will invest at least 80% of its net assets plus the amount of any borrowings for investment purposes in fixed-income investments of any type, which are subject to the Impact Criteria or Nuveen’s ESG criteria. |
| • | The Fund may invest up to 50% of its Managed Assets (as defined above) in below investment grade investments (investments rated BB+/Ba1 or lower at the time of investment or are unrated but judged by the Fund’s sub-adviser to be of comparable quality). |
| • | The Fund may invest no more than 10% of its Managed Assets in investments rated CCC/Caa or lower at the time of investment (or are unrated but judged by the Fund’s sub-adviser to be of comparable quality), including defaulted investments. |
| • | The Fund may invest without limitation in investments of foreign issuers, with no more than 30% of its Managed Assets in investments of foreign issuers that are located in emerging market countries. |
| • | The Fund may invest without limitation in restricted and illiquid investments (including investments that may only be resold pursuant to Rule 144A under the 1933 Act. |
The foregoing policies apply only at the time of any new investment.
Approving Changes in Investment Policies
The Board of Trustees of the Fund may change the policies described above without a shareholder vote. However, with respect to the Fund’s policy to invest at least 80% of its net assets plus the amount of any borrowings for investment purposes in fixed-income investments of any type, which are subject to the Impact Criteria or Nuveen’s ESG criteria, such policy may not be changed without 60 days’ prior written notice to shareholders.
Portfolio Contents
The Fund generally invests in a portfolio of fixed-income investments of any type, including asset-backed securities, corporate bonds, preferred securities, residential and commercial mortgage-backed securities, taxable and tax-exempt municipal bonds, senior loans and loan participations and assignments, sovereign debt instruments, debt securities issued by supranational agencies, and U.S. government securities (securities issued or guaranteed by the U.S. government or its agencies or instrumentalities).
Corporate bonds are fully taxable debt obligations issued by corporations. These securities fund capital improvements, expansions, debt refinancing or acquisitions that require more capital than would ordinarily be available from a single lender. Investors in corporate bonds lend money to the issuing corporation in exchange for interest payments and repayment of the principal at a set maturity date. Rates on corporate bonds are set according to prevailing interest rates at the time of the issue, the credit rating of the issuer, the length of the maturity and other terms of the security, such as a call feature.
73
Shareholder Update (continued)
(Unaudited)
Corporate bonds come in many varieties and may differ in the way that interest is calculated, the amount and frequency of payments, the type of collateral, if any, and the presence of special features (e.g., conversion rights). The Fund’s investments in corporate bonds may include, but are not limited to, senior, junior, secured and unsecured bonds, notes and other debt securities, and may be fixed rate, variable rate or floating rate, among other things. Holders of corporate bonds, as creditors, have a prior legal claim over common and preferred stockholders as to both income and assets of the issuer for the principal and interest due to them, and may have a prior claim over other creditors, but are generally subordinate to any existing lenders in the issuer’s capital structure.
The Fund will invest in investments of emerging market issuers. The Fund’s emerging market investments include a broad range of investments of emerging market issuers such as government bonds, corporate bonds, and other sovereign or quasi-sovereign debt instruments. The Fund will classify an issuer of an investment based on the issuer’s country of origin, generally as determined by an unaffiliated, recognized financial data provider. An issuer’s country or origin is based on a number of criteria, such as the issuer’s country of domicile or country in which the issuer conducts its primary operations, the primary exchange on which its securities trade, the location from which the majority of the issuer’s revenue comes, and the issuer’s reporting currency. The term “emerging market” describes any country or market that is generally considered to be emerging or developing by major organizations in the international financial community, such as the International Finance Corporation, or by financial industry analysts like MSCI, Inc., which compiles the MSCI Emerging Markets Index, and J.P. Morgan Chase & Co., which compiles several fixed-income emerging markets benchmarks; or other countries or markets with similar emerging characteristics. Emerging markets can include every nation in the world except the United States, Canada, Japan, Australia, New Zealand and most nations located in Western Europe. Notwithstanding the foregoing, the fixed-income portfolio management team generally views Israel as an emerging market.
The Fund may invest in sovereign securities. Sovereign securities are issued or guaranteed by foreign sovereign governments or their agencies, authorities, political subdivisions or instrumentalities, and supranational agencies. A supranational agency is a multinational union or association in which member countries cede authority and sovereignty on a limited number of matters to the group, whose decisions are binding upon its members. Quasi-sovereign securities typically are issued by companies or agencies that may receive financial support or backing from a local government or in which the government owns a majority of the issuer’s voting shares. The ability of a foreign sovereign issuer, especially in an emerging market country, to make timely and ultimate payments on its debt obligations will be strongly influenced by the sovereign issuer’s balance of payments, including export performance, its access to international credits and investments, fluctuations of interest rate and the extent of its foreign reserves. A country whose exports are concentrated in a few commodities or whose economy depends on certain strategic imports could be vulnerable to fluctuations in international prices of these commodities or imports. To the extent that a country receives payment for its export in currencies other than dollars, its ability to make debt payments denominated in dollars could be adversely affected. If a sovereign issuer cannot generate sufficient earnings from foreign trade to service its external debt, it may need to depend on continuing loans and aid from foreign governments, commercial banks and multinational organizations. There may be no bankruptcy proceedings similar to those in the U.S. by which defaulted interest may be collected.
The Fund may invest in taxable and tax-exempt municipal securities, including municipal bonds, and notes and other securities issued by states, cities and local authorities and certain possessions and territories of the United States (such as Puerto Rico and Guam) to finance or refinance public purpose projects such as roads, schools, and water supply systems. Municipal bonds may also be issued to finance and refinance privately owned facilities or projects deemed to serve a public purpose. Municipal bonds may be issued on a long-term basis to provide long-term financing. The repayment of such debt may be secured generally by a pledge of the full faith and credit taxing power of the issuer, a limited or special tax, or any other revenue source, including project revenue. Municipal bonds may also be issued to finance projects on a short-term interim basis, anticipating repayment with the proceeds of long-term debt.
The Fund may invest in asset-backed securities (“ABS”). ABS are securities that are primarily serviced by the cash flows of a discrete pool of receivables or other financial assets, either fixed or revolving, that by their terms convert into cash within a finite time period. Asset-backed securitization is a financing technique in which financial assets, in many cases themselves less liquid, are pooled and converted into instruments that may be offered and sold in the capital markets. In a basic securitization structure, an entity, often a financial institution, originates or otherwise acquires a pool of financial assets, either directly or through an affiliate. It then sells the financial assets, again either directly or through an affiliate, to a specially created investment vehicle that issues securities “backed” or supported by those financial assets, which securities are ABS. Payment on the ABS depends primarily on the cash flows generated by the assets in the underlying pool and other rights designed to assure timely payment, such as liquidity facilities, guarantees or other features generally known as credit enhancements.
The Fund may invest in U.S. government obligations. Securities issued or guaranteed by U.S. government agencies and instrumentalities include obligations that are supported by: (a) the full faith and credit of the U.S. Treasury (e.g., direct pass-through certificates of the Government National Mortgage Association); (b) the limited authority of the issuer or guarantor to borrow from the U.S. Treasury (e.g., obligations of Federal Home Loan Banks); or (c) only the credit of the issuer or guarantor (e.g., obligations of the Federal Home Loan Mortgage Corporation). In the case of obligations not backed by the full faith and credit of the U.S. Treasury, the agency issuing or guaranteeing the obligation is principally responsible for ultimate repayment.
74
The Fund may invest in mortgage-backed securities (“MBS”), including commercial mortgage-backed securities (“CMBS”). MBS is a type of pass-through security, which is a security representing pooled debt obligations repackaged as interests that pass income through an intermediary to investors. In the case of mortgage-backed securities, the ownership interest is in a pool of mortgage loans. CMBS are backed by a pool of mortgages on commercial property.
The Fund may invest in preferred securities. Traditional preferred securities are generally equity securities of the issuer that have priority over the issuer’s common shares as to the payment of dividends (i.e., the issuer cannot pay dividends on its common shares until the dividends on the preferred shares are current) and as to the payout of proceeds of a bankruptcy or other liquidation, but are subordinate to an issuer’s senior debt and junior debt as to both types of payments. Additionally, in a bankruptcy or other liquidation, traditional preferred securities are generally subordinate to an issuer’s trade creditors and other general obligations. Traditional preferred securities may be perpetual or have a term, and typically have a fixed liquidation (or “par”) value.
The term “preferred securities” also includes certain hybrid securities and other types of preferred securities that do not have the traditional features described above. Preferred securities that are hybrid securities often behave similarly to investments in traditional preferred securities and are regarded by market investors as being part of the preferred securities market. Such hybrid securities possess varying combinations of features of both debt and traditional preferred securities and as such they may constitute senior debt, junior debt or preferred shares in an issuer’s capital structure. Thus, they may not be subordinate to a company’s debt securities (as are traditional preferred securities).
The Fund may invest in loans, including senior secured loans, unsecured and/or subordinated loans, loan participations, unfunded contracts and assignments. These loans are typically made by or issued to corporations primarily to finance acquisitions, refinance existing debt, support organic growth, or pay out dividends, and are typically originated by large banks and are then syndicated out to institutional investors as well as to other banks. Loans typically bear interest at a floating rate, although some loans pay a fixed rate. Floating rate loans have interest rates that reset periodically, typically monthly or quarterly. The interest rates on floating rate loans are generally based on a percentage above the London Inter-Bank Offered Rate (“LIBOR”), a U.S. bank’s prime or base rate, the overnight federal funds rate or another rate. Due to their lower place in the borrower’s capital structure, unsecured and/or subordinated loans involve a higher degree of overall risk than senior bank loans of the same borrower. Loan participations are loans that are shared by a group of lenders. Unfunded commitments are contractual obligations by lenders (such as the Fund) to loan an amount in the future or that is due to be contractually funded in the future. Assignments may be arranged through private negotiations between potential assignees and potential assignors, and the rights and obligations acquired by the purchaser of an assignment may differ from, and be more limited than, those held by the assigning lender.
Loans may have restrictive covenants limiting the ability of a borrower to further encumber its assets. The types of covenants included in loan agreements generally vary depending on market conditions, the creditworthiness of the borrower, the nature of the collateral securing the loan and other factors. Such restrictive covenants normally allow for early intervention and proactive mitigation of credit risk by providing lenders with the ability to (1) intervene and either prevent or restrict actions that may potentially compromise the borrower’s ability to repay the loan and/or (2) obtain concessions from the borrower in exchange for waiving or amending a particular covenant. Loans with fewer or weaker restrictive covenants may limit the Fund’s ability to intervene or obtain additional concessions from borrowers.
The Fund’s portfolio may contain restricted and illiquid investments (i.e., investments that are not readily marketable), including, but not limited to, restricted investments (investments the disposition of which is restricted under the federal securities laws), investments that may be resold only pursuant to Rule 144A under the 1933 Act that are deemed to be illiquid, and certain repurchase agreements. Restricted investments may be sold only in privately negotiated transactions or in a public offering with respect to which a registration statement is in effect under the 1933 Act.
The Fund may also invest directly in Regulation S securities that are freely tradable in the U.S. Regulation S securities are debt or equity securities of U.S. and foreign issuers offered through private offerings exempt from registration with the SEC pursuant to Regulation S of the 1933 Act. Offerings of Regulation S securities may be conducted outside of the United States, and Regulation S securities may be relatively less liquid as a result of legal or contractual restrictions on resale.
The Fund may seek to provide exposure to Regulation S securities that are not freely tradable in the U.S. by investing in the Subsidiary, which will invest primarily in Regulation S securities.
The Fund may invest in securities of other open-end or closed-end investment companies, including ETFs, that invest primarily in the types of investments in which the Fund may invest directly.
The Fund may invest without limitation in credit default swaps, and may enter into credit default swaps as either a buyer or a seller. The credit default swaps in which the Fund may invest include credit default swap indices (“CDX”) and those in which the underlying reference instrument is the debt obligation of a single reference issuer (“single-name CDS”). A CDX is a portfolio of credit default swaps with similar characteristics, such as credit default swaps on high-yield bonds. Certain CDX instruments are subject to mandatory central clearing and exchange trading, which may reduce counterparty
75
Shareholder Update (continued)
(Unaudited)
credit risk and increase liquidity compared to other credit default swaps or CDX transactions. Unlike other types of credit default swaps, single-name CDS do not have the benefit of diversification across many issuers.
In addition to credit default swaps, the Fund also may invest in certain derivative instruments in pursuit of its investment objective. Such instruments include financial futures contracts and options thereon, forward contracts, swaps (with varying terms, including interest rate swaps), options on swaps and other fixed-income derivative instruments. The Fund’s sub-adviser may use derivative instruments to attempt to hedge some of the risk of the Fund’s investments, to limit exposure to losses due to changes to foreign currency exchange rates or as a substitute for a position in the underlying asset.
Use of Leverage
The Fund uses leverage to pursue its investment objective. The Fund may use leverage to the extent permitted by the 1940 Act. The Fund may source leverage through a number of methods including through borrowings, issuing preferred shares of beneficial interest, the issuance of debt securities, entering into reverse repurchase agreements (effectively a borrowing), and investing in residual interest certificates of tender option bond trusts, also called inverse floating rate securities, that have the economic effect of leverage because the Fund’s investment exposure to the underlying bonds held by the trust have been effectively financed by the trust’s issuance of floating rate certificates. In addition, the Fund may use derivatives that may have the economic effect of leverage by creating additional investment exposure. The amount and sources of leverage will vary depending on market conditions.
Temporary Defensive Periods
During temporary defensive periods the Fund may deviate from investment objective and policies. During such periods, the Fund may invest up to 100% of its Managed Assets in short-term investments, including high quality, short-term securities or may invest in short-, intermediate-, or long-term U.S. Treasury securities. The Fund may not achieve its investment objective during such periods.
76
NUVEEN MORTGAGE AND INCOME FUND (JLS)
Investment Objective
The Fund’s investment objective is to generate high current income through opportunistic investments in securitized credit.
Investment Policies
Under normal market circumstances, the Fund invests at least 65% of its Managed Assets (as defined below) in MBS, including residential MBS (“RMBS”) and CMBS. As a fundamental policy, the Fund concentrates its investments in MBS and expressly treats MBS as a single industry or group of industries.
“Managed Assets” mean the total assets of the Fund, minus the sum of its accrued liabilities (other than Fund liabilities incurred for the express purpose of creating leverage). Total assets for this purpose shall include assets attributable to the Fund’s use of leverage (whether or not those assets are reflected in the Fund’s financial statements for purposes of generally accepted accounting principles), and derivatives will be valued at their market value.
Under normal market conditions:
| • | The Fund may invest up to 35% of its Managed Assets in non-mortgage related ABS, including but not limited to any asset that generates reliable cash flows including collateralized loan obligations (“CLOs”) as well as pools of consumer auto loans, credit card receivables, aircraft leases and maintenance agreements, timeshare agreements, and solar photovoltaics. |
| • | The Fund may investment up to 5% of its Managed Assets in catastrophe bonds. |
| • | The Fund may not enter into futures contracts or related options or forward contracts, if more than 30% of the Fund’s Managed Assets would be represented by futures contracts or more than 5% of the Fund’s Managed Assets would be committed to initial margin deposits and premiums on futures contracts and related options. |
| • | The Fund may not sell securities short, unless the Fund owns or has the right to obtain securities equivalent in kind and amount to the securities sold at no added cost, and provided that transactions in options, futures contracts, options on futures contracts, or other derivative instruments are not deemed to constitute selling securities short. |
The foregoing policies apply only at the time of any new investment.
Approving Changes in Investment Policies
The Board of Trustees of the Fund may change the policies described above without a shareholder vote. However, with respect to the Fund’s policy of concentrating its investments in MBS such policy may not be changed without the approval of the holders of a majority of the outstanding common shares and preferred shares voting together as a single class, and the approval of the holders of a majority of the outstanding preferred shares, voting separately as a single class. A “majority of the outstanding” shares means (i) 67% or more of the shares present at a meeting, if the holders of more than 50% of the shares are present or represented by proxy or (ii) more than 50% of the shares, whichever is less.
Portfolio Contents
The Fund generally invests in MBS. MBS are structured debt obligations collateralized by pools of commercial or residential mortgages. Pools of mortgage loans and mortgage-related loans, such as mezzanine loans, are assembled into pools of assets that secure or back securities sold to investors by various governmental, government-related and private organizations. MBS in which the Fund may invest include those with fixed, floating or variable interest rates, those with interest rates that change based on a specified index of interest rates and those with interest rates that change inversely to changes in interest rates, as well as those that do not bear interest. The Fund may invest in subprime mortgages or MBS that are backed by subprime mortgages.
The Fund may invest in RMBS. RMBS are securities with payments which depend (except for rights or other assets designed to assure the servicing or timely distribution of proceeds to holders of such securities) primarily on the cash flow from residential mortgage loans made to borrowers that are secured on a first priority basis or second priority basis, subject to permitted liens, easements and other encumbrances by residential real estate (one-to four-family properties) the proceeds of which are used to purchase real estate and purchase or construct dwellings thereon (or to refinance indebtedness previously so used). Residential mortgage loans are obligations of the borrowers thereunder only and are not typically insured or guaranteed by any other person or entity. The ability of a borrower to repay a loan secured by residential property is dependent upon the income or assets of the borrower. A number of factors, including a general economic downturn, acts of God, terrorism, social unrest and civil disturbances, may impair borrowers’ abilities to repay their loans.
The non-agency RMBS in which the Fund may invest are issued by, among others, commercial banks, investment banks, and mortgage originators. Timely payment of principal and interest on mortgage-related securities backed by pools created by non-governmental issuers often is supported partially by various forms of insurance or guarantees, including individual loan, title, pool and hazard insurance. The insurance and guarantees are issued by private insurers.
77
Shareholder Update (continued)
(Unaudited)
The agency RMBS in which the Fund may invest represent participations in, are secured by or payable from, mortgage loans secured by real residential property. Agency RMBS may include agency mortgage pass-through certificates issued or guaranteed by the Government National Mortgage Association (“GNMA”), the Federal National Mortgage Association (“FNMA”) and/or the Federal Home Loan Mortgage Corporation (“FHLMC”). These mortgage pass-through certificates provide for the pass-through to investors of their pro rata share of monthly payments (including any prepayments) made by the individual borrowers on the pooled mortgage loans, net of any fees paid to the guarantor of such securities and the servicer of the underlying loans. GNMA, FNMA and FHLMC guarantee timely distributions of interest and principal to shareholders. Agency RMBS may also include agency collateralized mortgage obligations (“CMOs”), which are debt obligations issued by GNMA, FNMA or FHLMC.
The Fund may invest in CMBS. CMBS generally are multi-class debt or pass-through certificates secured or backed by mortgage loans on commercial properties. CMBS generally are structured to provide protection to the senior class investors against potential losses on the underlying mortgage loans. This protection generally is provided by having the holders of subordinated classes of securities take the first loss if there are defaults on the underlying commercial mortgage loans. Other protection, which may benefit all of the classes or particular classes, may include issuer guarantees, reserve funds, cross-collateralization and over-collateralization. The Fund may invest in CMBS issued or sponsored by commercial banks, savings and loan institutions, mortgage bankers, private mortgage insurance companies and other non-governmental issuers. CMBS have no governmental guarantee.
The Fund also may invest in stripped MBS (“Stripped MBS”). Stripped MBS are created by segregating the cash flows from underlying mortgage loans or mortgage securities to create two or more new securities, each with a specified percentage of the underlying security’s principal or interest payments. Mortgage securities may be partially stripped so that each investor class receives some interest and some principal. When securities are completely stripped, however, all of the interest is distributed to holders of one type of security, known as an interest-only security (“IO”), and all of the principal is distributed to holders of another type of security known as a principal-only security (“PO”). Strips can be created in a pass-through structure or as tranches of a CMO. The yields to maturity on IOs and POs are very sensitive to the rate of principal payments (including prepayments) on the related underlying mortgage assets.
The Fund may also invest in ABS. ABS are securities that are primarily serviced by the cash flows of a discrete pool of receivables or other financial assets, either fixed or revolving, that by their terms convert into cash within a finite time period. Asset-backed securitization is a financing technique in which financial assets, in many cases themselves less liquid, are pooled and converted into instruments that may be offered and sold in the capital markets. While residential mortgages were the first financial assets to be securitized in the form of MBS, non-mortgage related securitizations have grown to include many other types of financial assets, such as credit card receivables, auto loans and student loans.
The Fund may invest in catastrophe bonds. Catastrophe bonds, which typically are backed by a secured collateral account, are a relatively new type of financial instrument. As such, there is no significant trading history for many of these securities, and there can be no assurance that a liquid market in these instruments will develop. Exposure to catastrophe bonds results in gains or losses that typically are contingent upon, or formulaically related to, defined trigger events. Examples of trigger events include hurricanes, earthquakes, weather-related phenomena or statistics relating to such events. If a trigger event, as defined within the terms of the bond, involves losses or other metrics exceeding a specific magnitude in the geographic region and/or time period specified therein, the Fund may lose a portion or all of its investments in such security, including accrued interest and/or principal invested in such security. If no trigger event occurs, the Fund would typically recover its principal plus interest.
The Fund may invest in CLOs and other collateralized debt obligations (“CDOs”). CLOs and other CDOs are types of asset-backed securities. A CLO is a trust typically collateralized by a pool of loans, which may include, among others, domestic and foreign senior secured loans, senior unsecured loans, and subordinate corporate loans, including loans that may be rated below investment grade or equivalent unrated loans. Other CDOs are trusts backed by other types of assets representing obligations of various parties. CLOs and other CDOs may charge management fees and administrative expenses.
The Fund’s may invest in below investment securities. Below investment securities (such securities are commonly referred to as “high yield” or “junk”) generally provide high income in an effort to compensate investors for their higher risk of default, which is the failure to make required interest or principal payments.
The Fund may enter into repurchase agreements (the purchase of a security coupled with an agreement to resell that security at a higher price) with respect to its permitted investments. The Fund’s repurchase agreements will provide that the value of the collateral underlying the repurchase agreement will always be at least equal to the repurchase price, including any accrued interest earned on the agreement, and will be marked-to-market daily. The Fund may also utilize reverse repurchase agreements when it is anticipated that the interest income to be earned from the investment of the proceeds of the transaction is greater than the interest expense of the transaction.
The Fund may invest in illiquid securities (i.e., securities that are not readily marketable), including, but not limited to, restricted securities (securities the disposition of which is restricted under the federal securities laws), securities that may be resold only pursuant to Rule 144A under the 1933 Act, and repurchase agreements with maturities in excess of seven days.
78
The Fund may enter into certain derivative instruments in pursuit of its investment objective, including to seek to enhance return, to hedge certain risks of its investments in fixed-income securities or as a substitute for a position in the underlying asset. Such instruments include financial futures contracts, swap contracts (including interest rate and credit default swaps), options on financial futures, options on swap contracts or other derivative instruments.
The Fund may also invest in securities of other open- or closed-end investment companies (including ETFs) that invest primarily in securities of the types in which the Fund may invest directly, to the extent permitted by the 1940 Act, the rules and regulations issued thereunder and applicable exemptive orders issued by the SEC.
Use of Leverage
The Fund uses leverage to pursue its investment objective. The Fund may use leverage to the extent permitted by the 1940 Act. The Fund may source leverage through a number of methods including the issuance of preferred shares of beneficial interest, entering into reverse repurchase agreements (effectively a secured borrowing) and borrowings. In addition, the Fund may also use certain derivatives that have the economic effect of leverage by creating additional investment exposure. The amount and sources of leverage will vary depending on market conditions.
Temporary Defensive Periods
During temporary defensive periods the Fund may deviate from its investment objective and policies, and in order to keep the Fund’s cash fully invested, the Fund may invest any percentage of its total assets in high quality investments. The Fund may not achieve its investment objective during such periods.
79
Shareholder Update (continued)
(Unaudited)
PRINCIPAL RISKS OF THE FUNDS
The factors that are most likely to have a material effect on a particular Fund’s portfolio as a whole are called “principal risks.” Each Fund is subject to the principal risks indicated below, whether through direct investment or derivative positions. Each Fund may be subject to additional risks other than those identified and described below because the types of investments made by a Fund can change over time.
| Risks | Nuveen Global Fund (JGH) | Nuveen Core Plus Impact Fund (NPCT) | Nuveen Mortgage and Income Fund (JLS) | |||
| Portfolio Level Risks | ||||||
Asset-Backed Securities (“ABS”) Risk | X | X | X | |||
Below Investment Grade Risk | X | X | X | |||
Bond Market Liquidity Risk | X | X | — | |||
Call Risk | X | X | X | |||
Catastrophe Bond Risk | — | — | X | |||
Certain Risks of Holding Fund Assets Outside the United States | X | — | — | |||
Collateralized Debt Obligation (“CDO”) Risk | — | — | X | |||
Collateralized Loan Obligation (“CLO”) Risk | — | — | X | |||
Commercial Mortgage-Backed Securities (“CMBS”) and Mortgage-Backed Securities (“MBS”) Risk | X | X | X | |||
Concentration Risk | X | — | — | |||
Contingent Capital Securities (“CoCos”) Risk | X | — | — | |||
Convertible Securities Risk | X | — | — | |||
Credit Risk | X | X | X | |||
Credit Risk Associated with Originators and Servicers of Residential and Commercial Mortgage Loans | — | X | X | |||
Credit Spread Risk | X | X | X | |||
Debt Securities Risk | X | X | X | |||
Defaulted and Distressed Investments Risk | — | X | — | |||
Deflation Risk | X | — | X | |||
Derivatives Risk | X | X | X | |||
Duration Risk | X | X | X | |||
Emerging Markets Risk | X | — | — | |||
Extension Risk | — | — | X | |||
Financial Futures and Options Transactions Risk | X | X | X | |||
Foreign/Emerging Markets Issuer Risk | — | X | — | |||
Foreign Currency Risk | X | X | — | |||
Forward Currency Contracts Risk | X | — | — | |||
Hedging Risk | X | X | X | |||
Illiquid Investments Risk | X | X | X | |||
Impact Criteria and Environmental, Social and Governance (“ESG”) Criteria Investing Risk | — | X | — | |||
Income Risk | X | — | X | |||
Inflation Risk | X | X | X | |||
Interest Rate Risk | X | X | X | |||
Interest Rate Risk Associated with Non-Agency Residential Mortgage-Backed Securities (“RMBS”) and Commercial Mortgage-Backed Securities (“CMBS”) | — | X | X | |||
Inverse Floating Rate Securities Risk | — | X | — | |||
80
| Risks | Nuveen Global Fund (JGH) | Nuveen Core Plus Impact Fund (NPCT) | Nuveen Mortgage and Income Fund (JLS) | |||
Issuer Credit Risk | — | X | — | |||
Loan Participation Risk | X | — | — | |||
Loan Risk | X | X | — | |||
London Inter-Bank Offered Rate (“LIBOR”) Replacement Risk | X | X | X | |||
Mortgage-Backed Securities (“MBS”) Prepayment Risk | — | X | X | |||
Non-Agency Residential Mortgage-Backed Securities (“RMBS”) Risk | — | X | X | |||
Non-Mortgage Related Asset-Backed Securities (“ABS”) Risk | — | X | X | |||
Non-U.S. Securities Risk | X | — | — | |||
Non-U.S. Settlement Risk | X | — | — | |||
Other Investment Companies Risk | X | X | X | |||
Preferred Securities Risk | X | — | — | |||
Real Estate Related Securities Risk | X | — | — | |||
Regulation S Securities Risk | — | X | — | |||
Reinvestment Risk | X | X | X | |||
Senior Loan Risk | X | X | — | |||
Senior Loan Agent Risk | X | — | — | |||
Structural Risks Associated with Commercial Mortgage-Backed Securities (“CMBS”) and Non-Agency Residential Mortgage-Backed Securities (“RMBS”) | — | X | X | |||
Subordination Risk Associated with Commercial Mortgage-Backed Securities (“CMBS”) and Non-Agency Residential Mortgage-Backed Securities (“RMBS”) | — | X | X | |||
Subprime Mortgage Market Risk | — | — | X | |||
Sovereign Government and Supranational Debt Risk | — | X | — | |||
Swap Transactions Risk | X | X | X | |||
Unrated Securities Risk | X | X | X | |||
U.S. Government Securities Risk | — | X | X | |||
Valuation Risk | X | X | X | |||
When-Issued and Delayed-Delivery Transactions Risk | X | — | — | |||
“Widening” Risk | — | — | X | |||
Zero Coupon Bonds Risk | X | — | — | |||
| Fund Level and Other Risks | ||||||
Anti-Takeover Provisions | X | X | X | |||
Borrowing Risk | X | X | X | |||
Counterparty Risk | X | — | X | |||
Cybersecurity Risk | X | — | X | |||
Distribution Risk | — | X | — | |||
Frequent Trading Risk | — | X | — | |||
Global Economic Risk | X | X | X | |||
Investment and Market Risk | X | X | X | |||
| Portfolio Level Risks | ||||||
Legislation and Regulatory Risk | X | X | X | |||
Leverage Risk | X | X | X | |||
81
Shareholder Update (continued)
(Unaudited)
| Risks | Nuveen Global Fund (JGH) | Nuveen Core Plus Impact Fund (NPCT) | Nuveen Mortgage and Income Fund (JLS) | |||
Limited Term and Tender Offer Risks | — | X | — | |||
Market Discount from Net Asset Value | X | X | X | |||
Recent Market Conditions | X | X | X | |||
Reverse Repurchase Agreement Risk | X | X | X | |||
Risk of Taxable Income in Excess of Economic Income | — | — | X | |||
Subsidiary Risk | — | X | — | |||
Tax Risk | X | X | X |
Portfolio Level Risks:
Asset-Backed Securities (“ABS”) Risk. Asset-backed securities represent participations in, or are secured by and payable from, pools of assets including company receivables, truck and auto loans, leases and credit card receivables. These securities may be in the form of pass-through instruments or asset-backed bonds. Asset-backed securities are issued by non-governmental entities and carry no direct or indirect government guarantee; the asset pools that back asset-backed securities are securitized through the use of privately-formed trusts or special purpose corporations. Payments on asset-backed securities depend upon assets held by the issuer and collections of the underlying loans. The value of these securities depends on many factors, including changing interest rates, the availability of information about the pool and its structure, the credit quality of the underlying assets, the market’s perception of the servicer of the pool, and any credit enhancement provided. In certain market conditions, asset-backed securities may experience volatile fluctuations in value and periods of illiquidity.
Below Investment Grade Risk. Securities of below investment grade quality are regarded as having speculative characteristics with respect to the issuer’s capacity to pay interest and repay principal, and may be subject to higher price volatility and default risk than investment grade securities of comparable terms and duration. Issuers of lower grade securities may be highly leveraged and may not have available to them more traditional methods of financing. The prices of these lower grade securities are typically more sensitive to negative developments, such as a decline in the issuer’s revenues or a general economic downturn. The secondary market for lower rated securities may not be as liquid as the secondary market for more highly rated securities, a factor which may have an adverse effect on the Fund’s ability to dispose of a particular security. If a below investment grade security goes into default, or its issuer enters bankruptcy, it might be difficult to sell that security in a timely manner at a reasonable price.
Bond Market Liquidity Risk. Dealer inventories of bonds, which provide an indication of the ability of financial intermediaries to “make markets” in those bonds, are at or near historic lows in relation to market size. This reduction in market making capacity has the potential to decrease liquidity and increase price volatility in the fixed income markets in which the Fund invests, particularly during periods of economic or market stress. In addition, recent federal banking regulations may cause certain dealers to reduce their inventories of bonds, which may further decrease the Fund’s ability to buy or sell bonds. As a result of this decreased liquidity, the Fund may have to accept a lower price to sell a security, sell other securities to raise cash, or give up an investment opportunity, any of which could have a negative effect on performance. If the Fund needed to sell large blocks of bonds to meet shareholder redemption requests or to raise cash, those sales could further reduce the bonds’ prices and hurt performance.
Call Risk. The Fund may invest in securities that are subject to call risk. Such securities may be redeemed at the option of the issuer, or “called,” before their stated maturity or redemption date. In general, an issuer will call its instruments if they can be refinanced by issuing new instruments that bear a lower interest rate. The Fund is subject to the possibility that during periods of falling interest rates, an issuer will call its high yielding securities. The Fund would then be forced to invest the unanticipated proceeds at lower interest rates, resulting in a decline in the Fund’s income.
Catastrophe Bonds Risk. Exposure to catastrophe bonds results in gains or losses that typically are contingent upon, or formulaically related to, defined trigger events. Examples of trigger events include hurricanes, earthquakes, weather-related phenomena or statistics relating to such events. Catastrophe bonds carry large uncertainties and major risk exposures to adverse conditions. If a trigger event, as defined within the terms of the bond, involves losses or other metrics exceeding a specific magnitude in the geographic region and/or time period specified therein, the Fund may lose a portion or all of its investments in such security, including accrued interest and/or principal invested in such security. Such losses may be substantial. If no trigger event occurs, the Fund typically would recover its principal plus interest.
The rating, if any, of catastrophe bonds, reflects the rating agency’s calculated probability that a pre-defined trigger event will occur. Thus, lower-rated bonds have a greater likelihood of a triggering event occurring and resulting in a loss to the Fund. Catastrophe bonds often provide for an extension of maturity to process and audit loss claims when a trigger event has, or possibly has, occurred. An extension of maturity may increase volatility. Event-linked
82
exposure also may expose the Fund to certain other risks including credit risk, counterparty risk, adverse regulatory or jurisdictional interpretations and adverse tax consequences. Catastrophe bonds may also be illiquid.
Certain Risks of Holding Fund Assets Outside the United States. The Fund may hold investments in non-U.S. banks and securities depositories. Some non-U.S. banks and securities depositories may be recently organized or new to the foreign custody business, and there may be limited or no regulatory oversight of their operations. The laws of certain countries limit the Fund’s ability to recover its assets if a non-U.S. bank or depository, or any of its agents, goes bankrupt. In addition, it is often more expensive for the Fund to purchase, sell and hold securities in certain non-U.S. markets than in the United States. The increased expense of investing in non-U.S. markets reduces the amount the Fund can earn on its investments and typically results in a higher operating expense ratio for the Fund than for investment companies invested only in the United States.
Collateralized Debt Obligation (“CDO”) Risk. The risks of an investment in CDOs depend largely on the type of the collateral securities and the class of the CDO in which the Fund invests. In addition to the normal risks associated with fixed-income securities, CDOs carry additional risks including, but not limited to, the risk that: (1) distributions from collateral securities may not be adequate to make interest or other payments; (2) the quality of the collateral may decline in value or default; (3) the fact that the CDOs may be subordinate to other classes; and (4) the complex structure of the security may not be fully understood at the time of investment and may produce disputes with the issuer or unexpected investment results.
Collateralized Loan Obligation (“CLO”) Risk. A CLO is an asset-backed security whose underlying collateral is a pool of loans, which may include, among others, domestic and foreign floating rate and fixed rate senior secured loans, senior unsecured loans, and subordinate corporate loans, including loans that may be rated below investment grade or equivalent unrated loans. In addition to the risks associated with loans, illiquid investments and high-yield securities described below, investments in CLOs carry additional risks including, but not limited to, the risk that: (1) distributions from the collateral may not be adequate to make interest or other payments; (2) the quality of the collateral may decline in value or default; (3) the Fund may invest in tranches of CLOs that are subordinate to other tranches; (4) the complex structure of the CLO may not be fully understood at the time of investment and may produce disputes with the issuer or unexpected investment results; and (5) the CLO’s manager may perform poorly. CLOs may charge management and other administrative fees, which are in addition to those of the Fund.
Commercial Mortgage-Backed Securities (“CMBS”) and Mortgage-Backed Securities (“MBS”) Risk. CMBS and MBS, including collateralized debt obligations and collateralized mortgage obligations, differ from conventional debt securities because principal is paid back over the life of the security rather than at maturity. CMBS and MBS are subject to prepayment or call risk, which is the risk that a borrower’s payments may be received earlier than expected due to changes in prepayment rates on underlying loans. Faster prepayments often happen when interest rates are falling. As a result, the Fund may reinvest these early payments at lower interest rates, thereby reducing the Fund’s income. CMBS and MBS also are subject to extension risk. An unexpected rise in interest rates could reduce the rate of prepayments and extend the life of the CMBS and MBS, causing the price of the CMBS and MBS and the Fund’s share price to fall and would make the CMBS and MBS more sensitive to interest rate changes. An unexpectedly high rate of defaults on the mortgages held by a mortgage pool will adversely affect the value of CMBS and MBS and will result in losses to the Fund. Privately issued mortgage-related securities are not subject to the same underwriting requirements for the underlying mortgages that are applicable to those mortgage-related securities that have government or government-sponsored entity guarantee. As a result, the mortgage loans underlying privately issued mortgage-related securities may, and frequently do, have less favorable collateral, credit risk or other underwriting characteristics than government or government-sponsored mortgage-related securities and have wider variances in a number of terms including interest rate, term, size, purpose and borrower characteristics.
Concentration Risk. The Fund’s investments are concentrated in issuers of one or a few specific economic sectors, so the Fund may be subject to more risks than if it were broadly diversified across the economy.
Contingent Capital Securities (“CoCos”) Risk. A loss absorption mechanism trigger event for CoCos would likely be the result of, or related to, the deterioration of the issuer’s financial condition (e.g., a decrease in the issuer’s capital ratio) and status as a going concern. In such a case, with respect to CoCos that provide for conversion into common stock upon the occurrence of the trigger event, the market price of the issuer’s common stock received by the Fund will have likely declined, perhaps substantially, and may continue to decline, which may adversely affect the Fund’s net asset value. Further, the issuer’s common stock would be subordinate to the issuer’s other classes of securities and therefore would worsen the Fund’s standing in a bankruptcy proceeding. In addition, because the common stock of the issuer may not pay a dividend, investors in these instruments could experience a reduced income rate, potentially to zero. In view of the foregoing, CoCos are often rated below investment grade and are subject to the risks of below investment grade securities.
CoCos may be subject to an automatic write-down (i.e., the automatic write-down of the principal amount or value of the securities, potentially to zero, and the cancellation of the securities) under certain circumstances, which could result in the Fund losing a portion or all of its investment in such securities. In addition, the Fund may not have any rights with respect to repayment of the principal amount of the securities that has not become due or the payment of interest or dividends on such securities for any period from (and including) the interest or dividend payment date falling immediately prior to the occurrence of such automatic write-down. An automatic write-down could also result in a reduced income rate if the dividend or interest payment is based on the security’s par value. Coupon payments on CoCos may be discretionary and may be cancelled by the issuer for any reason or may be subject to approval by the issuer’s regulator and may be suspended in the event there are insufficient distributable reserves.
83
Shareholder Update (continued)
(Unaudited)
In certain scenarios, investors in CoCos may suffer a loss of capital ahead of equity holders or when equity holders do not. There is no guarantee that the Fund will receive a return of principal on CoCos. Any indication that an automatic write-down or conversion event may occur can be expected to have a material adverse effect on the market price of CoCos.
The prices of CoCos may be volatile. Additionally, the trading behavior of a given issuer’s CoCo may be strongly impacted by the trading behavior of other issuers’ CoCos, such that negative information from an unrelated CoCo may cause a decline in value of one or more CoCos held by afund. Accordingly, the trading behavior of CoCos may not follow the trading behavior of other similarly structured securities.
CoCos are issued primarily by financial institutions. Therefore, CoCos present substantially increased risks at times of financial turmoil, which could affect financial institutions more than companies in other sectors and industries.
Convertible Securities Risk. Convertible securities have characteristics of both equity and debt securities and, as a result, are exposed to certain additional risks that are typically associated with debt, including but not limited to Interest Rate Risk, Credit Risk, Below Investment Grade Risk and Unrated Securities Risk. The value of a convertible security is influenced by both the yield of non-convertible securities of comparable issuers and by the value of the underlying common stock. Convertible securities generally offer lower interest or dividend yields than non-convertible securities of similar credit quality. The market values of convertible securities tend to decline as interest rates increase and, conversely, to increase as interest rates decline. However, the convertible security’s market value tends to reflect the market price of the common stock of the issuing company when that stock price is greater than the convertible security’s “conversion price.” The conversion price is defined as the predetermined price at which the convertible security could be exchanged for the associated common stock. As the market price of the underlying common stock declines, the price of the convertible security tends to be influenced more by the yield of the convertible security. Thus, the convertible security may not decline in price to the same extent as the underlying common stock. Convertible securities fall below debt obligations of the same issuer in order of preference or priority in the event of a liquidation and are typically unrated or rated lower than such debt obligations.
Credit Risk. Issuers of securities in which the Fund may invest may default on their obligations to pay principal or interest when due. This non-payment would result in a reduction of income to the Fund, a reduction in the value of a security experiencing non-payment and potentially a decrease in the net asset value (“NAV”) of the Fund. To the extent that the credit rating assigned to a security in the Fund’s portfolio is downgraded, the market price and liquidity of such security may be adversely affected.
Credit Risk Associated with Originators and Servicers of Residential and Commercial Mortgage Loans. In the past, a number of originators and servicers of residential and commercial mortgage loans, including some of the largest originators and servicers in the residential and commercial mortgage loan market, experienced serious financial difficulties. These difficulties resulted from many factors, including increased competition among originators for borrowers, decreased originations by such originators of mortgage loans and increased delinquencies and defaults on such mortgage loans, as well as increases in claims for repurchases of mortgage loans previously sold by them under agreements that require repurchase in the event of breaches of representations regarding loan quality and characteristics. Such difficulties may affect the performance of non-agency RMBS and CMBS backed by mortgage loans. Furthermore, the inability of the originator to repurchase such mortgage loans in the event of loan representation breaches or the servicer to repurchase such mortgage loans upon a breach of its servicing obligations also may affect the performance of related non-agency RMBS and CMBS. Delinquencies and losses on mortgage loans originated by mortgage lenders may arise or increase as a result of inadequate underwriting procedures and policies, including inadequate due diligence, failure to comply with predatory and other lending laws and, particularly in the case of any “no documentation” or “limited documentation” mortgage loans that may support non-agency RMBS, inadequate verification of income and employment history. Delinquencies and losses on, and claims for repurchase of, mortgage loans originated by mortgage lenders also may arise from fraudulent activities of borrowers, lenders, appraisers, and other residential mortgage industry participants such as mortgage brokers, including misstatements of income and employment history, identity theft and overstatements of the appraised value of mortgaged properties. Many of these originators and servicers are highly leveraged. These difficulties may also increase the chances that these entities may default on their warehousing or other credit lines or become insolvent or bankrupt and thereby increase the likelihood that repurchase obligations will not be fulfilled and the potential for loss to holders of non-agency RMBS, CMBS and subordinated security holders.
The servicers of non-agency RMBS and CMBS are often the same entities as, or affiliates of, the originators of these mortgage loans. Accordingly, the financial risks relating to originators of non-agency RMBS and CMBS described immediately above also may affect the servicing of non-agency RMBS and CMBS. In the case of such servicers, and other servicers, financial difficulties may have a negative effect on the ability of servicers to pursue collection on mortgage loans that are experiencing increased delinquencies and defaults and to maximize recoveries on sale of underlying properties following foreclosure.
Non-agency RMBS and CMBS typically provide that the servicer is required to make advances in respect of delinquent mortgage loans. However, servicers experiencing financial difficulties may not be able to perform these obligations or obligations that they may have to other parties of transactions involving these securities. Like originators, these entities are typically highly leveraged. Such difficulties may cause servicers to default under their financing arrangements. In certain cases, such entities may be forced to seek bankruptcy protection. Due to the application of the provisions of
84
bankruptcy law, servicers who have sought bankruptcy protection may not be required to advance such amounts. Even if a servicer were able to advance amounts in respect of delinquent mortgage loans, its obligation to make such advances may be limited to the extent that it does not expect to recover such advances due to the deteriorating credit of the delinquent mortgage loans or declining value of the related mortgaged properties. Moreover, servicers may over advance against a particular mortgage loan or charge too many costs of resolution or foreclosure of a mortgage loan to a securitization, which could increase the potential losses to holders of non-agency RMBS and CMBS. In such transactions, a servicer’s obligation to make such advances may also be limited to the amount of its servicing fee. In addition, if an issue of non-agency RMBS and CMBS provides for interest on advances made by the servicer, in the event that foreclosure proceeds or payments by borrowers are not sufficient to cover such interest, such interest will be paid to the servicer from available collections or other mortgage income, thereby reducing distributions made on the non-agency RMBS and CMBS and, in the case of senior-subordinated non-agency RMBS and CMBS described below, first from distributions that would otherwise be made on the most subordinated non-agency RMBS and CMBS of such issue. Any such financial difficulties may increase the possibility of a servicer termination and the need for a transfer of servicing and any such liabilities or inability to assess such liabilities may increase the difficulties and costs in affecting such transfer and the potential loss, through the allocation of such increased cost of such transfer, to subordinated security holders.
There can be no assurance that originators and servicers of mortgage loans will not experience serious financial difficulties, including becoming subject to bankruptcy or insolvency proceedings, or that underwriting procedures and policies and protections against fraud will be sufficient in the future to prevent such financial difficulties or significant levels of default or delinquency on mortgage loans.
Credit Spread Risk. Credit spread risk is the risk that credit spreads (i.e., the difference in yield between securities that is due to differences in their credit quality) may increase when the market believes that securities generally have a greater risk of default. Increasing credit spreads may reduce the market values of the Fund’s securities. Credit spreads often increase more for lower rated and unrated securities than for investment grade securities. In addition, when credit spreads increase, reductions in market value will generally be greater for longer-maturity securities.
Debt Securities Risk. Issuers of debt instruments in which the Fund may invest may default on their obligations to pay principal or interest when due. This non-payment would result in a reduction of income to the Fund, a reduction in the value of a debt instrument experiencing non-payment and, potentially, a decrease in the NAV of the Fund. There can be no assurance that liquidation of collateral would satisfy the issuer’s obligation in the event of non-payment of scheduled interest or principal or that such collateral could be readily liquidated. In the event of bankruptcy of an issuer, the Fund could experience delays or limitations with respect to its ability to realize the benefits of any collateral securing a security. To the extent that the credit rating assigned to a security in the Fund’s portfolio is downgraded, the market price and liquidity of such security may be adversely affected.
Defaulted and Distressed Investments Risk. The Fund may invest in investments of an issuer that is in default or that is in bankruptcy or insolvency proceedings at the time of purchase. In addition, the Fund may hold investments that at the time of purchase are not in default or involved in bankruptcy or insolvency proceedings, but may later become so. Moreover, the Fund may invest in investments either rated CCC or lower, or unrated but judged by the Fund’s sub-adviser to be of comparable quality. Some or many of these low-rated investments, although not in default, may be “distressed,” meaning that the issuer is experiencing financial difficulties or distress at the time of acquisition. Such investments would present a substantial risk of future default which may cause the Fund to incur losses, including additional expenses, to the extent it is required to seek recovery upon a default in the payment of principal or interest on those investments. In any reorganization or liquidation proceeding relating to a portfolio investment, the Fund may lose its entire investment or may be required to accept cash or investments with a value less than its original investment. Defaulted or distressed investments may be subject to restrictions on resale.
Deflation Risk. Deflation risk is the risk that prices throughout the economy decline over time. Deflation may have an adverse effect on the creditworthiness of issuers and may make issuer default more likely, which may result in a decline in the value of the Fund’s portfolio.
Derivatives Risk. The use of derivatives involves additional risks and transaction costs which could leave the Fund in a worse position than if it had not used these instruments. Derivative instruments can be used to acquire or to transfer the risk and returns of a security or other asset without buying or selling the security or asset. These instruments may entail investment exposures that are greater than their cost would suggest. As a result, a small investment in derivatives can result in losses that greatly exceed the original investment. Derivatives can be highly volatile, illiquid and difficult to value. An over-the-counter derivative transaction between the Fund and a counterparty that is not cleared through a central counterparty also involves the risk that a loss may be sustained as a result of the failure of the counterparty to the contract to make required payments. The payment obligation for a cleared derivative transaction is guaranteed by a central counterparty, which exposes the Fund to the creditworthiness of the central counterparty.
It is possible that developments in the derivatives market, including changes in government regulation, could adversely impact the Fund’s ability to invest in certain derivatives.
Duration Risk. Duration is the sensitivity, expressed in years, of the price of a fixed-income security to changes in the general level of interest rates (or yields). Securities with longer durations tend to be more sensitive to interest rate (or yield) changes, which typically corresponds to increased volatility and risk, than securities with shorter durations. For example, if a security or portfolio has a duration of three years and interest rates increase by 1%, then the security or portfolio would decline in value by approximately 3%. Duration differs from maturity in that it considers potential changes to interest rates, and
85
Shareholder Update (continued)
(Unaudited)
a security’s coupon payments, yield, price and par value and call features, in addition to the amount of time until the security matures. The duration of a security will be expected to change over time with changes in market factors and time to maturity.
Emerging Markets Risk. Risks of investing in securities of emerging markets issuers include: smaller market capitalization of securities markets, which may suffer periods of relative illiquidity; significant price volatility; restrictions on foreign investment; and possible restrictions on repatriation of investment income and capital. In addition, foreign investors may be required to register the proceeds of sales; and future economic or political crises could lead to price controls, forced mergers, expropriation or confiscatory taxation, seizure, nationalization, or creation of government monopolies. Certain emerging markets also may face other significant internal or external risks, including a heightened risk of war, and ethnic, religious and racial conflicts. In addition, governments in many emerging market countries participate to a significant degree in their economies and securities markets, which may impair investment and economic growth, and which may in turn diminish the value of the securities in those markets. The considerations noted below in “Non-U.S. Securities Risk” are generally intensified for investments in emerging market countries.
Extension Risk. Extension risk is the flip side of call or prepayment risk. Extension, or slower prepayments of the underlying mortgage loans, would extend the time it would take to receive cash flows and would generally compress the yield on non-agency RMBS and CMBS. Rising interest rates can cause the average maturity of the Fund to lengthen due to a drop in mortgage prepayments. This will increase both the sensitivity to rising interest rates and the potential for price declines of the Fund.
Financial Futures and Options Transactions Risk. The Fund may use certain transactions for hedging the portfolio’s exposure to credit risk and the risk of increases in interest rates, which could result in poorer overall performance for the Fund. There may be an imperfect correlation between price movements of the futures and options and price movements of the portfolio securities being hedged.
If the Fund engages in futures transactions or in the writing of options on futures, it will be required to maintain initial margin and maintenance margin and may be required to make daily variation margin payments in accordance with applicable rules of the exchanges and the Commodity Futures Trading Commission (“CFTC”). If the Fund purchases a financial futures contract or a call option or writes a put option in order to hedge the anticipated purchase of securities, and if the Fund fails to complete the anticipated purchase transaction, the Fund may have a loss or a gain on the futures or options transaction that will not be offset by price movements in the securities that were the subject of the anticipatory hedge. There can be no assurance that a liquid market will exist at a time when the Fund seeks to close out a derivatives or futures or a futures option position, and the Fund would remain obligated to meet margin requirements until the position is closed.
Foreign/Emerging Markets Issuer Risk. Investments in foreign issuers involve special risks not presented by investments in U.S. issuers, including the following: (i) less publicly available information about foreign issuers or markets due to less rigorous disclosure or accounting standards or regulatory practices; (ii) many foreign markets are smaller, less liquid and more volatile; (iii) potential adverse effects of fluctuations in currency exchange rates or controls on the value of the Fund’s investments; (iv) the economies of foreign countries may grow at slower rates than expected or may experience a downturn or recession; (v) the impact of economic, political, social or diplomatic events; (vi) possible seizure of a company’s assets; (vii) restrictions imposed by foreign countries limiting the ability of foreign issuers to make payments of principal and/or interest due to blockages of foreign currency exchanges or otherwise and (viii) withholding and other foreign taxes may decrease the Fund’s return. These risks are more pronounced to the extent that the Fund invests in issuers in emerging market countries.
Foreign Currency Risk. Because the Fund may invest in securities denominated or quoted in currencies other than the U.S. dollar, changes in foreign currency exchange rates may affect the value of securities held by the Fund and the unrealized appreciation or depreciation of investments. Currencies of certain countries may be volatile and therefore may affect the value of securities denominated in such currencies, which means that the Fund’s NAV could decline as a result of changes in the exchange rates between foreign currencies and the U.S. dollar. In addition, certain countries, particularly emerging market countries, may impose foreign currency exchange controls or other restrictions on the transferability, repatriation or convertibility of currency.
Forward Currency Contracts Risk. Forward currency contracts are not standardized; rather, banks and dealers act as principals in these markets, negotiating each transaction on an individual basis. Forward and “cash” trading is substantially unregulated; there is no limitation on daily price movements and speculative position limits are not applicable. The principals who deal in the forward currency markets are not required to continue to make markets in the securities they trade and these markets can experience periods of illiquidity, sometimes of significant duration. There have been periods during which certain participants in these markets have refused to quote prices for certain securities or have quoted prices with an unusually wide spread between the price at which they were prepared to buy and that at which they were prepared to sell. Market illiquidity or disruption could result in major losses to the Fund. In addition, trading forward currency contracts can have the effect of financial leverage by creating additional investment exposure.
Hedging Risk. The Fund’s use of derivatives or other transactions to reduce risk involves costs and will be subject to the investment adviser’s and/or the sub-adviser’s ability to predict correctly changes in the relationships of such hedge instruments to the Fund’s portfolio holdings or other factors. No assurance can be given that the investment adviser’s and/or the sub-adviser’s judgment in this respect will be correct, and no assurance can be given that the Fund will enter into hedging or other transactions at times or under circumstances in which it may be advisable to do so. Hedging activities may reduce the Fund’s opportunities for gain by offsetting the positive effects of favorable price movements and may result in net losses.
86
Illiquid Investments Risk. Illiquid investments are investments that are not readily marketable and may include restricted securities, which are securities that may not be resold unless they have been registered under the 1933 Act or that can be sold in a private transaction pursuant to an available exemption from such registration. Illiquid investments involve the risk that the investments will not be able to be sold at the time desired by the Fund or at prices approximating the value at which the Fund is carrying the investments on its books from time to time.
Impact Criteria and Environmental, Social and Governance (“ESG”) Criteria Investing Risk. Because the Impact Criteria and/or Nuveen’s ESG investment criteria may exclude investments of certain issuers for non-financial reasons, the Fund may forgo some market opportunities available to funds that do not use these criteria. This may cause the Fund to underperform the market as a whole or other funds that do not use an Impact Criteria or ESG investment strategy or that use a different methodology or different factors to determine an investment’s impact and/or ESG investment criteria. In addition, there is a risk that the companies identified by the Impact Criteria or Nuveen’s ESG investment criteria do not operate as expected when addressing social and environmental impact and ESG issues. A company’s social and environmental impact and ESG performance or the Fund’s sub-adviser’s assessment of a company’s social and environmental impact and ESG performance could vary over time, which could cause the Fund to be temporarily invested in companies that do not comply with the Fund’s approach towards considering Impact Criteria or ESG investment criteria. There are significant differences in interpretations of what it means for a company to have positive Impact Criteria or ESG investment criteria. While the Fund’s sub-adviser believes its evaluation of Impact Criteria and/or ESG investment criteria is reasonable, the portfolio decisions it makes may differ with other investors’ or advisers’ views. In making investment decisions, the Fund’s sub-adviser relies on information and data that could be incomplete or erroneous, which could cause the Fund’s sub-adviser to incorrectly assess a company’s Impact Criteria and/or ESG investment criteria. The third-party data providers may differ in the data they provide for a given investment or between industries, or may only take into account one of many ESG-related components of a company. Accordingly, the information used by the Fund’s sub-adviser to evaluate the ESG criteria of the Fund’s investments may not be complete or accurate, and may vary across providers and issuers, as ESG is not a uniformly defined characteristic. Furthermore, data availability and reporting with respect to Impact Criteria or the ESG investment criteria may not always be available or may become unreliable.
Income Risk. The Fund’s income could decline due to falling market interest rates. This is because, in a falling interest rate environment, the Fund generally will have to invest the proceeds from maturing portfolio securities in lower-yielding securities.
Inflation Risk. Inflation risk is the risk that the value of assets or income from investments will be worth less in the future as inflation decreases the value of money. As inflation increases, the real value of the common shares and distributions can decline.
Interest Rate Risk. Interest rate risk is the risk that securities in the Fund’s portfolio will decline in value because of changes in market interest rates. Generally, when market interest rates rise, the market value of such securities will fall, and vice versa. As interest rates decline, issuers of securities may prepay principal earlier than scheduled, forcing the Fund to reinvest in lower-yielding securities and potentially reducing the Fund’s income. As interest rates increase, slower than expected principal payments may extend the average life of securities, potentially locking in a below-market interest rate and reducing the Fund’s value. In typical market interest rate environments, the prices of longer-term securities generally fluctuate more than prices of shorter-term securities as interest rates change.
Interest Rate Risk Associated with Non-Agency Residential Mortgage-Backed Securities (“RMBS”) and Commercial Mortgage-Backed Securities (“CMBS”). The rate of interest payable on certain non-agency RMBS and CMBS may be set or effectively capped at the weighted average net coupon of the underlying mortgage loans themselves, often referred to as an “available funds cap.” As a result of this cap, the return to the holder of such non-agency RMBS and CMBS is dependent on the relative timing and rate of delinquencies and prepayments of mortgage loans bearing a higher rate of interest. In general, early prepayments will have a greater negative impact on the yield to the holder of such non-agency RMBS and CMBS.
The value of fixed rate debt securities can be expected to vary inversely with changes in prevailing interest rates. Fixed rate debt securities with longer maturities, which tend to produce higher yields, are subject to potentially greater capital appreciation and depreciation than securities with shorter maturities.
Inverse Floating Rate Securities Risk. The Fund may invest in inverse floating rate securities. In general, income on inverse floating rate securities will decrease when short-term interest rates increase and increase when short-term interest rates decrease. Investments in inverse floating rate securities may subject the Fund to the risks of reduced or eliminated interest payments and losses of principal. In addition, inverse floating rate securities may increase or decrease in value at a greater rate than the underlying interest rate, which effectively leverages the Fund’s investment. As a result, the market value of such securities generally will be more volatile than that of fixed rate securities.
The Fund may invest in inverse floating rate securities issued by special purpose trusts that have recourse to the Fund. In such instances, the Fund may be at risk of loss that exceeds its investment in the inverse floating rate securities.
87
Shareholder Update (continued)
(Unaudited)
The Fund may be required to sell its inverse floating rate securities at less than favorable prices, or liquidate other Fund portfolio holdings in certain circumstances, including, but not limited to, the following:
| • | If the Fund has a need for cash and the securities in a special purpose trust are not actively trading due to adverse market conditions; |
| • | If special purpose trust sponsors (as a collective group or individually) experience financial hardship and consequently seek to terminate their respective outstanding special purpose trusts; and |
| • | If the value of an underlying security declines significantly and if additional collateral has not been posted by the Fund. |
Issuer Credit Risk. Issuers of investments in which the Fund may invest may default, or may be in default at the time of purchase, on their obligations to pay, principal or interest when due. This non-payment would result in a reduction of income to the Fund, a reduction in the value of a debt security experiencing non-payment and, potentially, a decrease in the NAV of the Fund. With respect to the Fund’s investments that are secured, there can be no assurance that liquidation of collateral would satisfy the issuer’s obligation in the event of non-payment of scheduled dividend, interest or principal or that such collateral could be readily liquidated. In the event of the bankruptcy of an issuer, the Fund could experience delays or limitations with respect to its ability to realize the benefits of any collateral securing an investment. To the extent that the credit rating assigned to an investment in the Fund’s portfolio is downgraded, the market price and liquidity of such investment may be adversely affected.
London Inter-Bank Offered Rate (“LIBOR”) Replacement Risk. The use of LIBOR will begin to be phased out in the near future, which may adversely affect the Fund’s investments whose value is tied to LIBOR. There remains uncertainty regarding the future use of LIBOR and the nature of any replacement reference rate. Actions by regulators have resulted in the establishment of alternative reference rates to LIBOR in most major currencies and markets are slowly developing in response to these new rates. The transition process away from LIBOR may involve, among other things, increased volatility in markets for instruments that currently rely on LIBOR. The potential effect of a discontinuation of LIBOR on the Fund’s investments will vary depending on, among other things: (1) existing fallback provisions that provide a replacement reference rate if LIBOR is no longer available; (2) termination provisions in individual contracts; and (3) whether, how, and when industry participants develop and adopt new reference rates and fallbacks for both legacy and new products and instruments held by the Fund. Accordingly, it is difficult to predict the full impact of the transition away from LIBOR until it is clearer how the Fund’s products an instruments will be impacted by this transition.
Loan Participation Risk. The Fund may purchase a participation interest in a loan and by doing so acquire some or all of the interest of a bank or other lending institution in a loan to a borrower. A participation typically will result in the Fund having a contractual relationship only with the lender, not the borrower. As a result, the Fund assumes the credit risk of the lender selling the participation in addition to the credit risk of the borrower. By purchasing a participation, the Fund will have the right to receive payments of principal, interest and any fees to which it is entitled only from the lender selling the participation and only upon receipt by the lender of the payments from the borrower. In the event of insolvency or bankruptcy of the lender selling the participation, the Fund may be treated as a general creditor of the lender and may not have a senior claim to the lender’s interest in the loan. If the Fund only acquires a participation in the loan made by a third party, the Fund may not be able to control the exercise of any remedies that the lender would have under the loan. Such third party participation arrangements are designed to give loan investors preferential treatment over high yield investors in the event of a deterioration in the credit quality of the borrower. Even when these arrangements exist, however, there can be no assurance that the principal and interest owed on the loan will be repaid in full.
Loan Risk. The lack of an active trading market for certain loans may impair the ability of the Fund to realize full value in the event of the need to sell a loan and may make it difficult to value such loans. Portfolio transactions in loans may settle in as short as seven days but typically can take up to two or three weeks, and in some cases much longer. As a result of these extended settlement periods, the Fund may incur losses if it is required to sell other investments or temporarily borrow to meet its cash needs, including satisfying redemption requests. The risks associated with unsecured loans, which are not backed by a security interest in any specific collateral, are higher than those for comparable loans that are secured by specific collateral. For secured loans, there is a risk that the value of any collateral securing a loan in which the Fund has an interest may decline and that the collateral may not be sufficient to cover the amount owed on the loan. Interests in loans made to finance highly leveraged companies or transactions such as corporate acquisitions may be especially vulnerable to adverse changes in economic or market conditions. Loans may have restrictive covenants limiting the ability of a borrower to further encumber its assets. However, in periods of high demand by lenders like the Fund for loan investments, borrowers may limit these covenants and weaken a lender’s ability to access collateral securing the loan; reprice the credit risk associated with the borrower; and mitigate potential loss. The Fund may experience relatively greater realized or unrealized losses or delays and expenses in enforcing its rights with respect to loans with fewer restrictive covenants. Additionally, loans may not be considered “securities” and, as a result, the Fund may not be entitled to rely on the anti-fraud protections of the securities laws. Because junior loans have a lower place in an issuer’s capital structure and may be unsecured, junior loans involve a higher degree of overall risk than senior loans of the issuer.
Mortgage-Backed Securities (“MBS”) Prepayment Risk. MBS represent an interest in a pool of mortgages. These mortgages typically permit borrowers to prepay amounts owing, often with no penalty. In periods of falling interest rates, the rate of prepayments tends to increase, forcing the Fund to reinvest in lower-yielding securities. However, MBS prepayment risk may not be the same as call risk for a corporate bond of similar maturity, making this risk difficult to estimate.
88
Non-Agency Residential Mortgage-Backed Securities (“RMBS”) Risk. Non-agency RMBS are securities issued by non-governmental issuers, the payments on which depend (except for rights or other assets designed to assure the servicing or timely distribution of proceeds to holders of such securities) primarily on the cash flow from residential mortgage loans made to borrowers that are secured (on a first priority basis or second priority basis, subject to permitted liens, easements and other encumbrances) by residential real estate (one- to four- family properties) the proceeds of which are used to purchase real estate and purchase or construct dwellings thereon (or to refinance indebtedness previously so used). Non-agency RMBS have no direct or indirect government guarantees of payment and are subject to various risks as described herein.
Non-Mortgage Related Asset-Backed Securities (“ABS”) Risk. Investing in ABS entails various risks, including credit risks, liquidity risks, interest rate risks, market risks and legal risks. Credit risk is an important issue in ABS because of the significant credit risks inherent in the underlying collateral and because issuers are primarily private entities. The structure of ABS and the terms of the investors’ interest in the collateral can vary widely depending on the type of collateral, the desires of investors and the use of credit enhancements. Although the basic elements of all ABS are similar, individual transactions can differ markedly in both structure and execution. Important determinants of the risk associated with issuing or holding the securities include the process by which principal and interest payments are allocated and distributed to investors, how credit losses affect the issuing vehicle and the return to investors in such ABS, whether collateral represents a fixed set of specific assets or accounts, whether the underlying collateral assets are revolving or closed-end, under what terms (including the maturity of the ABS itself) any remaining balance in the accounts may revert to the issuing entity and the extent to which the entity that is the actual source of the collateral assets is obligated to provide support to the issuing vehicle or to the investors in such ABS. The Fund may invest in ABS that are subordinate in right of payment and rank junior to other securities that are secured by or represent an ownership interest in the same pool of assets. In addition, many of the transactions in which such securities are issued have structural features that divert payments of interest and/or principal to more senior classes when the delinquency or loss experience of the pool exceeds certain levels. As a result, such securities have a higher risk of loss as a result of delinquencies or losses on the underlying assets.
Non-U.S. Securities Risk. Investments in securities of non-U.S. issuers involve special risks, including: less publicly available information about non-U.S. issuers or markets due to less rigorous disclosure or accounting standards or regulatory practices; many non-U.S. markets are smaller, less liquid and more volatile; the economies of non-U.S. countries may grow at slower rates than expected or may experience a downturn or recession; the impact of economic, political, social or diplomatic events; and withholding and other non-U.S. taxes may decrease the Fund’s return. These risks are more pronounced to the extent that the Fund invests a significant amount of its assets in issuers located in one region.
Non-U.S. Settlement Risk. Settlement and clearance procedures in certain non-U.S. markets differ significantly from those in the United States. Non-U.S. settlement and clearance procedures and trade regulations also may involve certain risks (such as delays in payment for or delivery of securities) not typically associated with the settlement of U.S. investments. Communications between the United States and emerging market countries may be unreliable, increasing the risk of delayed settlements or losses of security certificates. At times, settlement in certain non-U.S. countries have not kept pace with the number of securities transactions. These problems may make it difficult for the Fund to carry out transactions. If the Fund cannot settle or is delayed in settling a purchase of securities, it may miss attractive investment opportunities and certain of its assets may be uninvested with no return earned thereon for some period. If the Fund cannot settle or is delayed in settling a sale of securities, it may lose money if the value of the security then declines or, if it has contracted to sell the security to another party, the Fund could be liable for any losses incurred.
Other Investment Companies Risk. The Fund may invest in the securities of other investment companies, including ETFs. Investing in an investment company exposes the Fund to all of the risks of that investment company’s investments. The Fund, as a holder of the securities of other investment companies, will bear its pro rata portion of the other investment companies’ expenses, including advisory fees. These expenses are in addition to the direct expenses of the Fund’s own operations. As a result, the cost of investing in investment company shares may exceed the costs of investing directly in its underlying investments. In addition, securities of other investment companies may be leveraged. As a result, the Fund may be indirectly exposed to leverage through an investment in such securities and therefore magnify the Fund’s leverage risk.
With respect to ETF’s, an ETF that is based on a specific index may not be able to replicate and maintain exactly the composition and relative weighting of securities in the index. The value of an ETF based on a specific index is subject to change as the values of its respective component assets fluctuate according to market volatility. ETFs typically rely on a limited pool of authorized participants to create and redeem shares, and an active trading market for ETF shares may not develop or be maintained. The market value of shares of ETFs and closed-end funds may differ from their NAV.
Preferred Securities Risk. Preferred securities are subordinated to bonds and other debt instruments in a company’s capital structure, and therefore are subject to greater credit risk. In addition, preferred stockholders (such as the Fund, to the extent it invests in preferred stocks of other issuers) generally have no voting rights with respect to the issuing company unless preferred dividends have been in arrears for a specified number of periods, at which time the preferred stockholders may elect a number of directors to the issuer’s board. Generally, once all the arrearages have been paid, the preferred stockholders no longer have voting rights. In the case of certain taxable preferred stocks, holders generally have no voting rights, except (i) if the issuer fails to pay dividends for a specified period of time or (ii) if a declaration of default occurs and is continuing. In such an event, rights of preferred stockholders generally would include the right to appoint and authorize a trustee to enforce the trust or special purpose entity’s rights as a creditor under the agreement with its operating company. In certain varying circumstances, an issuer of preferred stock may redeem the securities prior to a specified
89
Shareholder Update (continued)
(Unaudited)
date. For instance, for certain types of preferred stock, a redemption may be triggered by a change in U.S. federal income tax or securities laws. As with call provisions, a redemption by the issuer may negatively impact the return of the security held by the Fund.
Real Estate Related Securities Risk. Real estate companies have been subject to substantial fluctuations and declines on a local, regional and national basis in the past and may continue to be in the future. Real property values and incomes from real property may decline due to general and local economic conditions, overbuilding and increased competition for tenants, increases in property taxes and operating expenses, changes in zoning laws, casualty or condemnation losses, regulatory limitations on rents, changes in neighborhoods and in demographics, increases in market interest rates, or other factors. Factors such as these may adversely affect companies that own and operate real estate directly, companies that lend to them, and companies that service the real estate industry. Equity REITs may be affected by changes in the values of and incomes from the properties they own, while mortgage REITs may be affected by the credit quality of the mortgage loans they hold. REITs are subject to other risks as well, including the fact that REITs are dependent on specialized management skills, which may affect their ability to generate cash flow for operating purposes and to make distributions to shareholders or unitholders. REITs may have limited diversification and are subject to the risks associated with obtaining financing for real property. A U.S. domestic REIT can pass its income through to shareholders or unitholders without any U.S. federal income tax at the entity level if it complies with various requirements under the Code. There is the risk that a REIT held by the Fund will fail to qualify for this tax-free pass-through treatment of its income, in which case the REIT would become subject to U.S. federal income tax. Similarly, REITs formed under the laws of non-U.S. countries may fail to qualify for corporate tax benefits made available by the governments of such countries. The Fund, as a holder of a REIT, will bear its pro rata portion of the REIT’s expenses.
Regulation S Securities Risk. The risk that Regulation S securities may be less liquid than publicly traded securities. Regulation S securities may not be subject to the disclosure and other investor protection requirements that would be applicable to publicly traded securities. As a result, Regulation S securities may involve a high degree of business and financial risk and may result in losses.
Reinvestment Risk. Reinvestment risk is the risk that income from the Fund’s portfolio will decline if and when the Fund invests the proceeds from matured, traded or called securities at market interest rates that are below the portfolio’s current earnings rate. A decline in income could affect the common shares’ market price, NAV and/or a common shareholder’s overall returns.
Senior Loan Risk. Senior loans typically hold the most senior position in the capital structure of a business entity, are typically secured with specific collateral and have a claim on the assets and/or stock of the issuer that is senior to that held by subordinated debt holders and stockholders of the issuer. Senior loans are usually rated below investment grade, and share the same risks of other below investment grade debt instruments.
Although the Fund may invest in senior loans that are secured by specific collateral, there can be no assurance that the liquidation of such collateral would satisfy an issuer’s obligation to the Fund in the event of issuer default or that such collateral could be readily liquidated under such circumstances. If the terms of a senior loan do not require the issuer to pledge additional collateral in the event of a decline in the value of the already pledged collateral, the Fund will be exposed to the risk that the value of the collateral will not at all times equal or exceed the amount of the issuer’s obligations under the senior loan.
In the event of bankruptcy of an issuer, the Fund could also experience delays or limitations with respect to its ability to realize the benefits of any collateral securing a senior loan. Some senior loans are subject to the risk that a court, pursuant to fraudulent conveyance or other similar laws, could subordinate the senior loans to presently existing or future indebtedness of the issuer or take other action detrimental to lenders, including the Fund. Such court action could under certain circumstances include invalidation of senior loans.
Senior Loan Agent Risk. A financial institution’s employment as an agent under a senior loan might be terminated in the event that it fails to observe a requisite standard of care or becomes insolvent. A successor agent would generally be appointed to replace the terminated agent, and assets held by the agent under the loan agreement would likely remain available to holders of such indebtedness. However, if assets held by the terminated agent for the benefit of the Fund were determined to be subject to the claims of the agent’s general creditors, the Fund might incur certain costs and delays in realizing payment on a senior loan or loan participation and could suffer a loss of principal and/or interest. In situations involving other interposed financial institutions (e.g., an insurance company or government agency) similar risks may arise.
Structural Risks Associated with Commercial Mortgage-Backed Securities (“CMBS”) and Non-Agency Residential Mortgage-Backed Securities (“RMBS”). Because non-agency RMBS generally are ownership or participation interests in pools of mortgage loans secured by a pool of one- to four-family residential properties underlying the mortgage loan pool, the non-agency RMBS are entitled to payments provided for in the underlying agreement only when and if funds are generated by the underlying mortgage loan pool. This likelihood of the return of interest and principal may be assessed as a credit matter. However, the holders of non-agency RMBS do not have the legal status of secured creditors, and cannot accelerate a claim for payment on their securities, or force a sale of the mortgage loan pool in the event that insufficient funds exist to pay such amounts on any date designated for such payment. The holders of non-agency RMBS do not typically have any right to remove a servicer solely as a result of a failure of the mortgage pool to perform as expected. A similar risk is associated with CMBS.
90
Subordination Risk Associated with Non-Agency Residential Mortgage-Backed Securities (“RMBS”) and Commercial Mortgage Backed Securities (“CMBS”). Non-agency RMBS and CMBS may be subordinated to one or more other senior classes of securities of the same series for purposes of, among other things, offsetting losses and other shortfalls with respect to the related underlying mortgage loans. For example, in the case of certain non-agency RMBS and CMBS, no distributions of principal will generally be made with respect to any class until the aggregate principal balances of the corresponding senior classes of securities have been reduced to zero. As a result, non-agency RMBS and CMBS may be more sensitive to risk of loss, writedowns, the non-fulfillment of repurchase obligations, overadvancing on a pool of loans and the costs of transferring servicing than senior classes of securities.
Subprime Mortgage Market Risk. The residential mortgage market in the United States in the recent past experienced difficulties that, should similar conditions occur in the future, may adversely affect the performance and market value of certain mortgages and mortgage-related securities. Delinquencies and losses on residential mortgage loans (especially subprime and second-line mortgage loans) may increase, and a decline in or flattening of housing values may exacerbate such delinquencies and losses. Borrowers with adjustable rate mortgage loans are more sensitive to changes in interest rates, which affect their monthly mortgage payments, and may be unable to secure replacement mortgages at comparably low interest rates. Any significant reduction in investor demand for mortgage loans and mortgage-related securities or increase in investor yield requirements may cause limited liquidity in the secondary market for mortgage-related securities, which could adversely affect the market value of mortgage-related securities. If the economy of the United States were to deteriorate, the incidence of mortgage foreclosures, especially subprime mortgages, could increase, which may adversely affect the value of any MBS owned by the Fund.
Sovereign Government and Supranational Debt Risk. Investments in sovereign debt, including supranational debt, involves special risks. Foreign governmental issuers of debt or the governmental authorities that control the repayment of the debt may be unable or unwilling to repay principal or pay interest when due. In the event of default, there may be limited or no legal recourse in that, generally, remedies for defaults must be pursued in the courts of the defaulting party. Political conditions, especially a sovereign entity’s willingness to meet the terms of its debt obligations, are of considerable significance. The ability of a foreign sovereign issuer, especially an emerging market country, to make timely payments on its debt obligations will also be strongly influenced by the sovereign issuer’s balance of payments, including export performance, its access to international credit facilities and investments, fluctuations of interest rates and the extent of its foreign reserves. A country whose exports are concentrated in a few commodities or whose economy depends on certain strategic imports could be vulnerable to fluctuations in international prices of these commodities or imports. If a sovereign issuer cannot generate sufficient earnings from foreign trade to service its external debt, it may need to depend on continuing loans and aid from foreign governments, commercial banks, and multinational organizations. The cost of servicing external debt will also generally be adversely affected by rising international interest rates, as many external debt obligations bear interest at rates which are adjusted based upon international interest rates. Foreign investment in certain sovereign debt is restricted or controlled to varying degrees, including requiring governmental approval for the repatriation of income, capital or proceeds of sales by foreign investors. There are no bankruptcy proceedings similar to those in the U.S. by which defaulted sovereign debt may be collected.
Swap Transactions Risk. The Fund may enter into debt-related derivative instruments such as credit default swap contracts and interest rate swaps. Like most derivative instruments, the use of swaps is a highly specialized activity that involves investment techniques and risks different from those associated with ordinary portfolio securities transactions. In addition, the use of swaps requires an understanding by the adviser and/or the sub-adviser of not only the referenced asset, rate or index, but also of the swap itself. If the investment adviser and/or the sub-adviser is incorrect in its forecasts of default risks, market spreads or other applicable factors or events, the investment performance of the Fund would diminish compared with what it would have been if these techniques were not used.
Unrated Securities Risk. The Fund may purchase securities that are not rated by any rating organization. The investment adviser may, after assessing such securities’ credit quality, internally assign ratings to certain of those securities in categories similar to those of rating organizations. Some unrated securities may not have an active trading market or may be difficult to value, which means the Fund might have difficulty selling them promptly at an acceptable price. To the extent that the Fund invests in unrated securities, the Fund’s ability to achieve its investment objectives will be more dependent on the investment adviser’s credit analysis than would be the case when the Fund invests in rated securities.
U.S. Government Securities Risk. U.S. government securities are guaranteed only as to the timely payment of interest and the payment of principal when held to maturity. Accordingly, the current market values for these securities will fluctuate with changes in interest rates. Securities issued or guaranteed by U.S. government agencies and instrumentalities are supported by varying degrees of credit but generally are not backed by the full faith and credit of the U.S. government. No assurance can be given that the U.S. government will provide financial support to its agencies and instrumentalities if it is not obligated by law to do so.
Valuation Risk. The securities in which the Fund invests typically are valued by a pricing service utilizing a range of market-based inputs and assumptions, including readily available market quotations obtained from broker-dealers making markets in such instruments, cash flows and transactions for comparable instruments. There is no assurance that the Fund will be able to sell a portfolio security at the price established by the pricing service, which could result in a loss to the Fund. Pricing services generally price securities assuming orderly transactions of an institutional “round lot” size, but some trades may occur in smaller, “odd lot” sizes, often at lower prices than institutional round lot trades. Different pricing services may incorporate different
91
Shareholder Update (continued)
(Unaudited)
assumptions and inputs into their valuation methodologies, potentially resulting in different values for the same securities. As a result, if the Fund were to change pricing services, or if the Fund’s pricing service were to change its valuation methodology, there could be a material impact, either positive or negative, on the Fund’s NAV.
When-Issued and Delayed-Delivery Transactions Risk. The Fund may invest in securities on a “when-issued” or “delayed-delivery” basis. When-issued and delayed-delivery transactions may involve an element of risk because no interest accrues on the securities prior to settlement and, because securities are subject to market fluctuations, the value of the securities at time of delivery may be less (or more) than their cost. A separate account of the Fund will be established with its custodian consisting of cash equivalents or liquid securities having a market value at all times at least equal to the amount of any delayed payment commitment.
“Widening” Risk. The prices of non-agency RMBS or CMBS may decline substantially, for reasons that may not be attributable to any of the other risks described herein. In particular, purchasing assets at what may appear to be “undervalued” levels is no guarantee that these assets will not be trading at even more “undervalued” levels at a time of valuation or at the time of sale. It may not be possible to predict, or to protect against, such “spread widening” risk.
Zero Coupon Bonds Risk. Because interest on zero coupon bonds is not paid on a current basis, the values of zero coupon bonds will be more volatile in response to interest rate changes than the values of bonds that distribute income regularly. Although zero coupon bonds generate income for accounting purposes, they do not produce cash flow, and thus the Fund could be forced to liquidate securities at an inopportune time in order to generate cash to distribute to shareholders as required by tax laws.
Fund Level and Other Risks:
Anti-Takeover Provisions. The Fund’s organizational documents include provisions that could limit the ability of other entities or persons to acquire control of the Fund or convert the Fund to open-end status. These provisions could have the effect of depriving the common shareholders of opportunities to sell their common shares at a premium over the then-current market price of the common shares.
Borrowing Risk. In addition to borrowing for leverage, the Fund may borrow for temporary or emergency purposes, to pay dividends, repurchase its shares, or clear portfolio transactions. Borrowing may exaggerate changes in the NAV of the Fund’s shares and may affect the Fund’s net income. When the Fund borrows money, it must pay interest and other fees, which will reduce the Fund’s returns if such costs exceed the returns on the portfolio securities purchased or retained with such borrowings. Any such borrowings are intended to be temporary. However, under certain market circumstances, such borrowings might be outstanding for longer periods of time.
Counterparty Risk. Changes in the credit quality of the companies that serve as the Fund’s counterparties with respect to derivatives or other transactions supported by another party’s credit will affect the value of those instruments. Certain entities that have served as counterparties in the markets for these transactions have incurred or may incur in the future significant financial hardships including bankruptcy and losses as a result of exposure to sub-prime mortgages and other lower-quality credit investments. As a result, such hardships have reduced these entities’ capital and called into question their continued ability to perform their obligations under such transactions. By using such derivatives or other transactions, the Fund assumes the risk that its counterparties could experience similar financial hardships. In the event of the insolvency of a counterparty, the Fund may sustain losses or be unable to liquidate a derivatives position.
Cybersecurity Risk. The Fund and its service providers are susceptible to operational and information security risk resulting from cyber incidents. Cyber incidents refer to both intentional attacks and unintentional events including: processing errors, human errors, technical errors including computer glitches and system malfunctions, inadequate or failed internal or external processes, market-wide technical-related disruptions, unauthorized access to digital systems (through “hacking” or malicious software coding), computer viruses, and cyber-attacks which shut down, disable, slow or otherwise disrupt operations, business processes or website access or functionality (including denial of service attacks). Cyber incidents could adversely impact the Fund and cause the Fund to incur financial loss and expense, as well as face exposure to regulatory penalties, reputational damage, and additional compliance costs associated with corrective measures. In addition, substantial costs may be incurred in order to prevent any cyber incidents in the future. Furthermore, the Fund cannot control the cybersecurity plans and systems put in place by its service providers or any other third parties whose operations may affect the Fund.
Distribution Risk. The Fund’s distributions will be composed of net investment income and a supplemental amount generally representing the potential for capital appreciation, which will take the form of realized capital gains and/or a return of capital. The return of capital component of a Fund distribution may (but will not necessarily) represent unrealized capital gains. A return of capital is a non-taxable distribution of a portion of the Fund’s capital. If over the life of a shareholder’s investment, the total return of the Fund’s overall strategy is less than the distribution rate, a return of capital will represent a portion of a shareholder’s original principal (in effect a partial return of the amount a shareholder invested in the Fund). A return of capital reduces a shareholder’s tax cost basis (but not below zero) in Fund shares, which could result in more taxable gain or less taxable loss when the shareholder sells their shares. This may cause the shareholder to pay taxes even if he or she sells shares for less than the original price. The Fund’s distribution policy, rate
92
of distributions on the Common Shares and the portion of distributions composed of net investment income, realized capital gain and return of capital may vary over time. Shareholders who periodically receive the payment of a distribution consisting of a return of capital may be under the impression that they are receiving net income or profits when they are not. Shareholders should not assume that the source of a return of capital distribution from the Fund is net income or profit.
Frequent Trading Risk. The Fund may engage in active and frequent trading of its portfolio investments, which may result in the Fund having high portfolio turnover. Effects of frequent trading may include high transaction costs, which may lower the Fund’s return, and realization of greater short-term capital gains, distributions of which are taxable as ordinary income to taxable shareholders.
Global Economic Risk. National and regional economies and financial markets are becoming increasingly interconnected, which increases the possibilities that conditions in one country, region or market might adversely impact issuers in a different country, region or market. Changes in legal, political, regulatory, tax and economic conditions may cause fluctuations in markets and securities prices around the world, which could negatively impact the value of the Fund’s investments. Major economic or political disruptions, particularly in large economies like China’s, may have global negative economic and market repercussions. Additionally, events such as war, terrorism, natural and environmental disasters and the spread of infectious illnesses or other public health emergencies may adversely affect the global economy and the markets and issuers in which the Fund invests. Recent examples of such events include the outbreak of a novel coronavirus known as COVID-19 that was first detected in China in December 2019 and heightened concerns regarding North Korea’s nuclear weapons and long-range ballistic missile programs. These events could reduce consumer demand or economic output, result in market closure, travel restrictions or quarantines, and generally have a significant impact on the economy. These events could also impair the information technology and other operational systems upon which the Fund’s service providers, including the investment adviser and sub-adviser, rely, and could otherwise disrupt the ability of employees of the Fund’s service providers to perform essential tasks on behalf of the Fund. Governmental and quasi-governmental authorities and regulators throughout the world have in the past responded to major economic disruptions with a variety of significant fiscal and monetary policy changes, including but not limited to, direct capital infusions into companies, new monetary programs and dramatically lower interest rates. An unexpected or quick reversal of these policies, or the ineffectiveness of these policies, could increase volatility in securities markets, which could adversely affect the Fund’s investments.
Investment and Market Risk. An investment in the Fund’s common shares is subject to investment risk, including the possible loss of the entire principal amount that you invest. Common shares frequently trade at a discount to their NAV. An investment in common shares represents an indirect investment in the securities owned by the Fund. Common shares at any point in time may be worth less than your original investment, even after taking into account the reinvestment of Fund dividends and distributions.
Legislation and Regulatory Risk. At any time after the date of this report, legislation or additional regulations may be enacted that could negatively affect the assets of the Fund, securities held by the Fund or the issuers of such securities. Fund shareholders may incur increased costs resulting from such legislation or additional regulation. There can be no assurance that future legislation, regulation or deregulation will not have a material adverse effect on the Fund or will not impair the ability of the Fund to achieve its investment objectives.
The SEC recently adopted rules governing the use of derivatives by registered investment companies, which could affect the nature and extent of derivatives used by the Fund. The full impact of such rules is uncertain at this time. It is possible that such rules, as interpreted, applied and enforced by the SEC, could limit the implementation of the Fund’s use of derivatives, which could have an adverse impact on the Fund.
Leverage Risk. The use of leverage creates special risks for common shareholders, including potential interest rate risks and the likelihood of greater volatility of NAV and market price of, and distributions on, the common shares. The use of leverage in a declining market will likely cause a greater decline in the Fund’s NAV, which may result at a greater decline of the common share price, than if the Fund were not to have used leverage.
The Fund will pay (and common shareholders will bear) any costs and expenses relating to the Fund’s use of leverage, which will result in a reduction in the Fund’s NAV. The investment adviser may, based on its assessment of market conditions and composition of the Fund’s holdings, increase or decrease the amount of leverage. Such changes may impact the Fund’s distributions and the price of the common shares in the secondary market.
The Fund may seek to refinance its leverage over time, in the ordinary course, as current forms of leverage mature or it is otherwise desirable to refinance; however, the form that such leverage will take cannot be predicted at this time. If the Fund is unable to replace existing leverage on comparable terms, its costs of leverage will increase. Accordingly, there is no assurance that the use of leverage may result in a higher yield or return to common shareholders.
The amount of fees paid to the investment adviser and the sub-advisor for investment advisory services will be higher if the Fund uses leverage because the fees will be calculated based on the Fund’s Managed Assets — this may create an incentive for the investment adviser and the sub-advisor to leverage the Fund or increase the Fund’s leverage.
Limited Term and Tender Offer Risks. Because the assets of the Fund will be liquidated in connection with its termination or to pay for Common Shares tendered in an Eligible Tender Offer, the Fund may be required to sell portfolio securities when it otherwise would not, including at times when market conditions are not favorable, or at a time when a particular security is in default or bankruptcy, or otherwise in severe distress, which may cause the Fund to lose money.
93
Shareholder Update (continued)
(Unaudited)
The Fund may be required to dispose of portfolio investments in connection with any reduction in its outstanding leverage necessary in order to maintain its desired leverage ratios following an Eligible Tender Offer. It is likely that during the pendency of an Eligible Tender Offer, and possibly for a time thereafter, the Fund will hold a greater than normal percentage of its total assets in money market mutual funds, cash, cash equivalents, securities issued or guaranteed by the U.S. government or its instrumentalities or agencies, high quality, short-term money market instruments, short-term debt securities, certificates of deposit, bankers’ acceptances and other bank obligations, commercial paper or other liquid debt securities, which may adversely affect the Fund’s investment performance. If the tax basis for the portfolio investments sold is less than the sale proceeds, the Fund will recognize capital gains, which it will be required to distribute to Common Shareholders. In addition, the Fund’s purchase of tendered Common Shares pursuant to an Eligible Tender Offer will have tax consequences for tendering Common Shareholders and may have tax consequences for non-tendering Common Shareholders. All Common Shareholders remaining after an Eligible Tender Offer will be subject to proportionately higher expenses due to the reduction in the Fund’s total assets resulting from payment for the tendered Common Shares. Such reduction in the Fund’s total assets also may result in less investment flexibility, reduced diversification and greater volatility for the Fund, and may have an adverse effect on the Fund’s investment performance.
If the Fund conducts an Eligible Tender Offer, there can be no assurance that the number of tendered Common Shares would not result in the Fund’s net assets totaling less than the Termination Threshold, in which case the Eligible Tender Offer will be terminated, no Common Shares will be repurchased pursuant to the Eligible Tender Offer and the Fund will terminate on the Termination Date. The investment adviser may have a conflict of interest in recommending to the Board of Trustees that the Fund have a continued existence without limitation of time. The Fund is not required to conduct additional tender offers following an Eligible Tender Offer and conversion to a continued existence without limitation of time. Therefore, remaining Common Shareholders may not have another opportunity to participate in a tender offer.
A Fund portfolio holding default may significantly reduce net investment income and, therefore, Common Share dividends; and may prevent or inhibit the Fund from fully being able to liquidate its portfolio at or prior to the Termination Date.
Market Discount from Net Asset Value. Shares of closed-end investment companies like the Fund frequently trade at prices lower than their NAV. This characteristic is a risk separate and distinct from the risk that the Fund’s NAV could decrease as a result of investment activities. Whether investors will realize gains or losses upon the sale of the common shares will depend not upon the Fund’s NAV but entirely upon whether the market price of the common shares at the time of sale is above or below the investor’s purchase price for the common shares. Furthermore, management may have difficulty meeting the Fund’s investment objectives and managing its portfolio when the underlying securities are redeemed or sold during periods of market turmoil and as investors’ perceptions regarding closed-end funds or their underlying investments change. Because the market price of the common shares will be determined by factors such as relative supply of and demand for the common shares in the market, general market and economic circumstances, and other factors beyond the control of the Fund, the Fund cannot predict whether the common shares will trade at, below or above NAV. The common shares are designed primarily for long-term investors, and you should not view the Fund as a vehicle for short-term trading purposes.
Recent Market Conditions. In response to the financial crisis and recent market events, policy and legislative changes by the United States government and the Federal Reserve to assist in the ongoing support of financial markets, both domestically and in other countries, are changing many aspects of financial regulation. The impact of these changes on the markets, and the practical implications for market participants, may not be fully known for some time. Withdrawal of government support, failure of efforts in response to the crisis, or investor perception that such efforts are not succeeding, could adversely impact the value and liquidity of certain securities. The severity or duration of adverse economic conditions may also be affected by policy changes made by governments or quasi-governmental organizations, including changes in tax laws and the imposition of trade barriers. The impact of new financial regulation legislation on the markets and the practical implications for market participants may not be fully known for some time. Changes to the Federal Reserve policy may affect the value, volatility and liquidity of dividend and interest paying securities. In addition, the contentious domestic political environment, as well as political and diplomatic events within the United States and abroad, such as the U.S. government’s inability at times to agree on a long-term budget and deficit reduction plan, the threat of a federal government shutdown and threats not to increase the federal government’s debt limit, may affect investor and consumer confidence and may adversely impact financial markets and the broader economy, perhaps suddenly and to a significant degree.
Interest rates have been unusually low in recent years in the United States and abroad but there is consensus that interest rates will increase during the life of the Fund, which could negatively impact the price of debt securities. Because there is little precedent for this situation, it is difficult to predict the impact of a significant rate increase on various markets.
The current political climate has intensified concerns about a potential trade war between China and the United States, as each country has recently imposed tariffs on the other country’s products. These actions may trigger a significant reduction in international trade, the oversupply of certain manufactured goods, substantial price reductions of goods and possible failure of individual companies and/or large segments of China’s export industry, which could have a negative impact on the Fund’s performance.
The impact of these developments in the near- and long-term is unknown and could have additional adverse effects on economies, financial markets and asset valuations around the world.
94
Reverse Repurchase Agreement Risk. A reverse repurchase agreement, in economic essence, constitutes a securitized borrowing by the Fund from the security purchaser. The Fund may enter into reverse repurchase agreements for the purpose of creating a leveraged investment exposure and, as such, their usage involves essentially the same risks associated with a leveraging strategy generally since the proceeds from these agreements may be invested in additional portfolio securities. Reverse repurchase agreements tend to be short-term in tenor, and there can be no assurances that the purchaser (lender) will commit to extend or “roll” a given agreement upon its agreed-upon repurchase date or an alternative purchaser can be identified on similar terms. Reverse repurchase agreements also involve the risk that the purchaser fails to return the securities as agreed upon, files for bankruptcy or becomes insolvent. The Fund may be restricted from taking normal portfolio actions during such time, could be subject to loss to the extent that the proceeds of the agreement are less than the value of securities subject to the agreement and may experience adverse tax consequences.
Risk of Taxable Income in Excess of Economic Income. The Fund expects to acquire debt instruments in the secondary market for less than their stated redemption price at maturity. The discount at which such debt instruments are acquired may reflect doubts about their ultimate collectability rather than current market interest rates. The amount of such discount will nevertheless generally be treated as “market discount” for federal income tax purposes. Market discount on a debt instrument accrues ratably on a daily basis, unless an election is made to accrue market discount on the basis of the constant yield to maturity of the debt instrument, based generally on the assumption that all future payments on the debt instrument will be made. Absent an election to accrue currently, accrued market discount is reported as income when, and to the extent that, any payment of principal of the debt instrument is made. Payments on residential mortgage loans are ordinarily made monthly, and consequently accrued market discount may have to be included in income each month as if the debt instrument were assured of ultimately being collected in full.
Similarly, many of the debt instruments (including MBS) that the Fund may purchase will likely have been issued with original issue discount (“OID”), which discount might reflect doubt as to whether the entire principal amount of such debt instruments will ultimately prove to be collectible. The Fund will be required to report such OID based on a constant yield method and income will be accrued and be currently taxable based on the assumption that all future projected payments due on such debt instruments will be made.
Finally, in the event that any debt instruments (including MBS) acquired by the Fund are delinquent as to mandatory principal and interest payments, or in the event payments with respect to a particular debt instrument are not made when due, the Fund may nonetheless be required to continue to recognize the unpaid interest as taxable income as it accrues, despite doubt as to its ultimate collectability. Similarly, the Fund may be required to accrue interest income with respect to subordinate MBS at its stated rate regardless of whether corresponding cash payments are received or are ultimately collectible.
Subsidiary Risk. By investing in the Subsidiary, the Fund is indirectly exposed to the risks associated with the Subsidiary’s investments in Regulation S securities that are not freely tradable in the U.S. Regulation S securities are debt or equity securities of U.S. and foreign issuers offered through private offerings exempt from registration with the SEC pursuant to Regulation S of the 1933 Act. Offerings of Regulation S securities may be conducted outside of the United States, and Regulation S securities may be relatively less liquid as a result of legal or contractual restrictions on resale. Although Regulation S securities may be resold in privately negotiated transactions, the price realized from these sales could be less than the price originally paid by the Fund. Further, companies whose securities are not publicly traded may not be subject to the disclosure of other investor protection requirements that would be applicable if their securities were publicly traded. Accordingly, Regulation S securities may involve a high degree of business and financial risk and may result in substantial losses. There can be no assurance that the investment objective of the Subsidiary will be achieved. The Subsidiary is not registered under the 1940 Act, and, unless otherwise noted in this prospectus, is not subject to all the investor protections of the 1940 Act. However, the Fund wholly owns and controls the Subsidiary, and the Fund and the Subsidiary are both managed by the Fund’s sub-adviser making it unlikely that the Subsidiary will take action contrary to the interests of the Fund and its Common Shareholders. The Board of Trustees has oversight responsibility for the investment activities of the Fund, including its investment in the Subsidiary, and the Fund’s role as sole shareholder of the Subsidiary. The Subsidiary is subject to the same investment restrictions and limitations, and follows the same compliance policies and procedures, as the Fund. Changes in the laws of the United States and/or the Cayman Islands could result in the inability of the Fund and/or the Subsidiary to operate anticipated and could adversely affect the Fund.
Tax Risk. The Fund has elected to be treated and intends to qualify each year as a Regulated Investment Company (“RIC”) under the Internal Revenue Code of 1986, as amended (the “Code”). As a RIC, the Fund is not expected to be subject to U.S. federal income tax to the extent that it distributes its investment company taxable income and net capital gains. To qualify for the special tax treatment available to a RIC, the Fund must comply with certain investment, distribution, and diversification requirements. Under certain circumstances, the Fund may be forced to sell certain assets when it is not advantageous in order to meet these requirements, which may reduce the Fund’s overall return. If the Fund fails to meet any of these requirements, subject to the opportunity to cure such failures under applicable provisions of the Code, the Fund’s income would be subject to a double level of U.S. federal income tax. The Fund’s income, including its net capital gain, would first be subject to U.S. federal income tax at regular corporate rates, even if such income were distributed to shareholders and, second, all distributions by the Fund from earnings and profits, including distributions of net capital gain (if any), would be taxable to shareholders as dividends.
95
Shareholder Update (continued)
(Unaudited)
EFFECTS OF LEVERAGE
The following table is furnished in response to requirements of the SEC. It is designed to illustrate the effects of leverage through the use of senior securities, as that term is defined under Section 18 of the 1940 Act, as well as certain other forms of leverage, such as reverse repurchase agreements and investments in inverse floating rate securities, on common share total return, assuming investment portfolio total returns (consisting of income and changes in the value of investments held in a Fund’s portfolio) of -10%, -5%, 0%, 5% and 10%. The table below reflects each Fund’s (i) continued use of leverage as of December 31, 2021 as a percentage of Managed Assets (including assets attributable to such leverage), (ii) the estimated annual effective interest expense rate payable by the Funds on such instruments (based on actual leverage costs incurred during the fiscal year ended December 31, 2021) as set forth in the table, and (iii) the annual return that the Fund’s portfolio must experience (net of expenses) in order to cover such costs of leverage based on such estimated annual effective interest expense rate. The information below does not reflect any Fund’s use of certain derivative instruments.
The numbers are merely estimates, used for illustration. The costs of leverage may vary frequently and may be significantly higher or lower than the estimated rate. The assumed investment portfolio returns in the table below are hypothetical figures and are not necessarily indicative of the investment portfolio returns experienced or expected to be experienced by the Funds. Your actual returns may be greater or less than those appearing below.
Nuveen Global (JGH) | Nuveen Core Plus Impact Fund (NPCT) | Nuveen Mortgage (JLS) | ||||||||||
| Estimated Leverage as a Percentage of Managed Assets (Including Assets Attributable to Leverage) | 29.20% | 35.03% | 25.95% | |||||||||
| Estimated Annual Effective Leverage Expense Rate Payable by Fund on Leverage | 0.88% | 0.68% | 1.31% | |||||||||
Annual Return Fund Portfolio Must Experience (net of expenses) to Cover Estimated Annual Effective Interest Expense Rate on Leverage | 0.26% | 0.24% | 0.34% | |||||||||
| Common Share Total Return for (10.00)% Assumed Portfolio Total Return | (14.49)% | (15.76)% | (13.96)% | |||||||||
| Common Share Total Return for (5.00)% Assumed Portfolio Total Return | (7.42)% | (8.06)% | (7.21)% | |||||||||
| Common Share Total Return for 0.00% Assumed Portfolio Total Return | (0.36)% | (0.36)% | (0.46)% | |||||||||
| Common Share Total Return for 5.00% Assumed Portfolio Total Return | 6.70% | 7.33% | 6.29% | |||||||||
| Common Share Total Return for 10.00% Assumed Portfolio Total Return | 13.76% | 15.03% | 13.04% | |||||||||
Common Share total return is composed of two elements — the distributions paid by the Fund to holders of common shares (the amount of which is largely determined by the net investment income of the Fund after paying dividend payments on any preferred shares issued by the Fund and expenses on any forms of leverage outstanding) and gains or losses on the value of the securities and other instruments the Fund owns. As required by SEC rules, the table assumes that the Funds are more likely to suffer capital losses than to enjoy capital appreciation. For example, to assume a total return of 0%, the Fund must assume that the income it receives on its investments is entirely offset by losses in the value of those investments. This table reflects hypothetical performance of the Fund’s portfolio and not the actual performance of the Fund’s common shares, the value of which is determined by market forces and other factors. Should the Fund elect to add additional leverage to its portfolio, any benefits of such additional leverage cannot be fully achieved until the proceeds resulting from the use of such leverage have been received by the Fund and invested in accordance with the Fund’s investment objectives and policies. As noted above, the Fund’s willingness to use additional leverage, and the extent to which leverage is used at any time, will depend on many factors.
96
DIVIDEND REINVESTMENT PLAN
Nuveen Closed-End Funds Automatic Reinvestment Plan
Your Nuveen Closed-End Fund allows you to conveniently reinvest distributions in additional Fund shares. By choosing to reinvest, you’ll be able to invest money regularly and automatically, and watch your investment grow through the power of compounding. Just like distributions in cash, there may be times when income or capital gains taxes may be payable on distributions that are reinvested. It is important to note that an automatic reinvestment plan does not ensure a profit, nor does it protect you against loss in a declining market.
Easy and convenient
To make recordkeeping easy and convenient, each quarter you’ll receive a statement showing your total distributions, the date of investment, the shares acquired and the price per share, and the total number of shares you own.
How shares are purchased
The shares you acquire by reinvesting will either be purchased on the open market or newly issued by the Fund. If the shares are trading at or above NAV at the time of valuation, the Fund will issue new shares at the greater of the NAV or 95% of the then-current market price. If the shares are trading at less than NAV, shares for your account will be purchased on the open market. If Computershare Trust Company, N.A. (the “Plan Agent”) begins purchasing Fund shares on the open market while shares are trading below NAV, but the Fund’s shares subsequently trade at or above their NAV before the Plan Agent is able to complete its purchases, the Plan Agent may cease open-market purchases and may invest the uninvested portion of the distribution in newly-issued Fund shares at a price equal to the greater of the shares’ NAV or 95% of the shares’ market value on the last business day immediately prior to the purchase date. Distributions received to purchase shares in the open market will normally be invested shortly after the distribution payment date. No interest will be paid on distributions awaiting reinvestment. Because the market price of the shares may increase before purchases are completed, the average purchase price per share may exceed the market price at the time of valuation, resulting in the acquisition of fewer shares than if the distribution had been paid in shares issued by the Fund. A pro rata portion of any applicable brokerage commissions on open market purchases will be paid by Dividend Reinvestment Plan (the “Plan”) participants. These commissions usually will be lower than those charged on individual transactions.
Flexible
You may change your distribution option or withdraw from the Plan at any time, should your needs or situation change. You can reinvest whether your shares are registered in your name, or in the name of a brokerage firm, bank, or other nominee. Ask your investment advisor if his or her firm will participate on your behalf. Participants whose shares are registered in the name of one firm may not be able to transfer the shares to another firm and continue to participate in the Plan. The Fund reserves the right to amend or terminate the Plan at any time. Although the Fund reserves the right to amend the Plan to include a service charge payable by the participants, there is no direct service charge to participants in the Plan at this time.
Call today to start reinvesting distributions
For more information on the Nuveen Automatic Reinvestment Plan or to enroll in or withdraw from the Plan, speak with your financial professional or call us at (800) 257-8787.
97
Shareholder Update (continued)
(Unaudited)
CHANGES OCCURRING DURING THE FISCAL YEAR
The following information in this annual report is a summary of certain changes during the most recent fiscal year. This information may not reflect all of the changes that have occurred since you purchased shares of the Fund.
During the most recent fiscal year, there have been no changes to: (i) the Fund’s investment objective and principal investment policies that have not been approved by shareholders, (ii) the principal risks of the Fund, (iii) the portfolio managers of the Fund; (iv) the Fund’s charter or by-laws that would delay or prevent a change of control of the Fund that have not been approved by shareholders, except as follows:
Principal Risks
The following principal risk has been added for each of the Nuveen Global High Income Fund (JGH) and Nuveen Mortgage and Income Fund (JLS):
London Inter-Bank Offered Rate (“LIBOR”) Replacement Risk. The use of LIBOR will begin to be phased out in the near future, which may adversely affect the Fund’s investments whose value is tied to LIBOR. There remains uncertainty regarding the future use of LIBOR and the nature of any replacement reference rate. Actions by regulators have resulted in the establishment of alternative reference rates to LIBOR in most major currencies and markets are slowly developing in response to these new rates. The transition process away from LIBOR may involve, among other things, increased volatility in markets for instruments that currently rely on LIBOR. The potential effect of a discontinuation of LIBOR on the Fund’s investments will vary depending on, among other things: (1) existing fallback provisions that provide a replacement reference rate if LIBOR is no longer available; (2) termination provisions in individual contracts; and (3) whether, how, and when industry participants develop and adopt new reference rates and fallbacks for both legacy and new products and instruments held by the Fund. Accordingly, it is difficult to predict the full impact of the transition away from LIBOR until it is clearer how the Fund’s products an instruments will be impacted by this transition.
The following principal risks have been added for the Nuveen Core Plus Impact Fund (NPCT):
Credit Risk. Issuers of securities in which the Fund may invest may default on their obligations to pay principal or interest when due. This non-payment would result in a reduction of income to the Fund, a reduction in the value of a security experiencing non-payment and potentially a decrease in the net asset value (“NAV”) of the Fund. To the extent that the credit rating assigned to a security in the Fund’s portfolio is downgraded, the market price and liquidity of such security may be adversely affected.
Credit Risk Associated with Originators and Servicers of Residential and Commercial Mortgage Loans. In the past, a number of originators and servicers of residential and commercial mortgage loans, including some of the largest originators and servicers in the residential and commercial mortgage loan market, experienced serious financial difficulties. These difficulties resulted from many factors, including increased competition among originators for borrowers, decreased originations by such originators of mortgage loans and increased delinquencies and defaults on such mortgage loans, as well as increases in claims for repurchases of mortgage loans previously sold by them under agreements that require repurchase in the event of breaches of representations regarding loan quality and characteristics. Such difficulties may affect the performance of non-agency RMBS and CMBS backed by mortgage loans. Furthermore, the inability of the originator to repurchase such mortgage loans in the event of loan representation breaches or the servicer to repurchase such mortgage loans upon a breach of its servicing obligations also may affect the performance of related non-agency RMBS and CMBS. Delinquencies and losses on mortgage loans originated by mortgage lenders may arise or increase as a result of inadequate underwriting procedures and policies, including inadequate due diligence, failure to comply with predatory and other lending laws and, particularly in the case of any “no documentation” or “limited documentation” mortgage loans that may support non-agency RMBS, inadequate verification of income and employment history. Delinquencies and losses on, and claims for repurchase of, mortgage loans originated by mortgage lenders also may arise from fraudulent activities of borrowers, lenders, appraisers, and other residential mortgage industry participants such as mortgage brokers, including misstatements of income and employment history, identity theft and overstatements of the appraised value of mortgaged properties. Many of these originators and servicers are highly leveraged. These difficulties may also increase the chances that these entities may default on their warehousing or other credit lines or become insolvent or bankrupt and thereby increase the likelihood that repurchase obligations will not be fulfilled and the potential for loss to holders of non-agency RMBS, CMBS and subordinated security holders.
The servicers of non-agency RMBS and CMBS are often the same entities as, or affiliates of, the originators of these mortgage loans. Accordingly, the financial risks relating to originators of non-agency RMBS and CMBS described immediately above also may affect the servicing of non-agency RMBS and CMBS. In the case of such servicers, and other servicers, financial difficulties may have a negative effect on the ability of servicers to pursue collection on mortgage loans that are experiencing increased delinquencies and defaults and to maximize recoveries on sale of underlying properties following foreclosure.
Non-agency RMBS and CMBS typically provide that the servicer is required to make advances in respect of delinquent mortgage loans. However, servicers experiencing financial difficulties may not be able to perform these obligations or obligations that they may have to other parties of transactions involving these securities. Like originators, these entities are typically highly leveraged. Such difficulties may cause servicers to default
98
under their financing arrangements. In certain cases, such entities may be forced to seek bankruptcy protection. Due to the application of the provisions of bankruptcy law, servicers who have sought bankruptcy protection may not be required to advance such amounts. Even if a servicer were able to advance amounts in respect of delinquent mortgage loans, its obligation to make such advances may be limited to the extent that it does not expect to recover such advances due to the deteriorating credit of the delinquent mortgage loans or declining value of the related mortgaged properties. Moreover, servicers may over advance against a particular mortgage loan or charge too many costs of resolution or foreclosure of a mortgage loan to a securitization, which could increase the potential losses to holders of non-agency RMBS and CMBS. In such transactions, a servicer’s obligation to make such advances may also be limited to the amount of its servicing fee. In addition, if an issue of non-agency RMBS and CMBS provides for interest on advances made by the servicer, in the event that foreclosure proceeds or payments by borrowers are not sufficient to cover such interest, such interest will be paid to the servicer from available collections or other mortgage income, thereby reducing distributions made on the non-agency RMBS and CMBS and, in the case of senior-subordinated non-agency RMBS and CMBS described below, first from distributions that would otherwise be made on the most subordinated non-agency RMBS and CMBS of such issue. Any such financial difficulties may increase the possibility of a servicer termination and the need for a transfer of servicing and any such liabilities or inability to assess such liabilities may increase the difficulties and costs in affecting such transfer and the potential loss, through the allocation of such increased cost of such transfer, to subordinated security holders.
There can be no assurance that originators and servicers of mortgage loans will not experience serious financial difficulties, including becoming subject to bankruptcy or insolvency proceedings, or that underwriting procedures and policies and protections against fraud will be sufficient in the future to prevent such financial difficulties or significant levels of default or delinquency on mortgage loans.
Duration Risk. Duration is the sensitivity, expressed in years, of the price of a fixed-income security to changes in the general level of interest rates (or yields). Securities with longer durations tend to be more sensitive to interest rate (or yield) changes, which typically corresponds to increased volatility and risk, than securities with shorter durations. For example, if a security or portfolio has a duration of three years and interest rates increase by 1%, then the security or portfolio would decline in value by approximately 3%. Duration differs from maturity in that it considers potential changes to interest rates, and a security’s coupon payments, yield, price and par value and call features, in addition to the amount of time until the security matures. The duration of a security will be expected to change over time with changes in market factors and time to maturity.
Interest Rate Risk Associated with Non-Agency Residential Mortgage-Backed Securities (“RMBS”) and Commercial Mortgage-Backed Securities (“CMBS”). The rate of interest payable on certain non-agency RMBS and CMBS may be set or effectively capped at the weighted average net coupon of the underlying mortgage loans themselves, often referred to as an “available funds cap.” As a result of this cap, the return to the holder of such non-agency RMBS and CMBS is dependent on the relative timing and rate of delinquencies and prepayments of mortgage loans bearing a higher rate of interest. In general, early prepayments will have a greater negative impact on the yield to the holder of such non-agency RMBS and CMBS.
The value of fixed rate debt securities can be expected to vary inversely with changes in prevailing interest rates. Fixed rate debt securities with longer maturities, which tend to produce higher yields, are subject to potentially greater capital appreciation and depreciation than securities with shorter maturities.
Mortgage-Backed Securities (“MBS”) Prepayment Risk. MBS represent an interest in a pool of mortgages. These mortgages typically permit borrowers to prepay amounts owing, often with no penalty. In periods of falling interest rates, the rate of prepayments tends to increase, forcing the Fund to reinvest in lower-yielding securities. However, MBS prepayment risk may not be the same as call risk for a corporate bond of similar maturity, making this risk difficult to estimate.
Non-Agency Residential Mortgage-Backed Securities (“RMBS”) Risk. Non-agency RMBS are securities issued by non-governmental issuers, the payments on which depend (except for rights or other assets designed to assure the servicing or timely distribution of proceeds to holders of such securities) primarily on the cash flow from residential mortgage loans made to borrowers that are secured (on a first priority basis or second priority basis, subject to permitted liens, easements and other encumbrances) by residential real estate (one- to four- family properties) the proceeds of which are used to purchase real estate and purchase or construct dwellings thereon (or to refinance indebtedness previously so used). Non-agency RMBS have no direct or indirect government guarantees of payment and are subject to various risks as described herein.
Non-Mortgage Related Asset-Backed Securities (“ABS”) Risk. Investing in ABS entails various risks, including credit risks, liquidity risks, interest rate risks, market risks and legal risks. Credit risk is an important issue in ABS because of the significant credit risks inherent in the underlying collateral and because issuers are primarily private entities. The structure of ABS and the terms of the investors’ interest in the collateral can vary widely depending on the type of collateral, the desires of investors and the use of credit enhancements. Although the basic elements of all ABS are similar, individual transactions can differ markedly in both structure and execution. Important determinants of the risk associated with issuing or holding the securities include the process by which principal and interest payments are allocated and distributed to investors, how credit losses affect the issuing vehicle and the return to investors in such ABS, whether collateral represents a fixed set of specific assets or accounts, whether
99
Shareholder Update (continued)
(Unaudited)
the underlying collateral assets are revolving or closed-end, under what terms (including the maturity of the ABS itself) any remaining balance in the accounts may revert to the issuing entity and the extent to which the entity that is the actual source of the collateral assets is obligated to provide support to the issuing vehicle or to the investors in such ABS. The Fund may invest in ABS that are subordinate in right of payment and rank junior to other securities that are secured by or represent an ownership interest in the same pool of assets. In addition, many of the transactions in which such securities are issued have structural features that divert payments of interest and/or principal to more senior classes when the delinquency or loss experience of the pool exceeds certain levels. As a result, such securities have a higher risk of loss as a result of delinquencies or losses on the underlying assets.
Structural Risks Associated with Commercial Mortgage-Backed Securities (“CMBS”) and Non-Agency Residential Mortgage-Backed Securities (“RMBS”). Because non-agency RMBS generally are ownership or participation interests in pools of mortgage loans secured by a pool of one- to four-family residential properties underlying the mortgage loan pool, the non-agency RMBS are entitled to payments provided for in the underlying agreement only when and if funds are generated by the underlying mortgage loan pool. This likelihood of the return of interest and principal may be assessed as a credit matter. However, the holders of non-agency RMBS do not have the legal status of secured creditors, and cannot accelerate a claim for payment on their securities, or force a sale of the mortgage loan pool in the event that insufficient funds exist to pay such amounts on any date designated for such payment. The holders of non-agency RMBS do not typically have any right to remove a servicer solely as a result of a failure of the mortgage pool to perform as expected. A similar risk is associated with CMBS.
Subordination Risk Associated with Non-Agency Residential Mortgage-Backed Securities (“RMBS”) and Commercial Mortgage Backed Securities (“CMBS”). Non-agency RMBS and CMBS may be subordinated to one or more other senior classes of securities of the same series for purposes of, among other things, offsetting losses and other shortfalls with respect to the related underlying mortgage loans. For example, in the case of certain non-agency RMBS and CMBS, no distributions of principal will generally be made with respect to any class until the aggregate principal balances of the corresponding senior classes of securities have been reduced to zero. As a result, non-agency RMBS and CMBS may be more sensitive to risk of loss, writedowns, the non-fulfillment of repurchase obligations, overadvancing on a pool of loans and the costs of transferring servicing than senior classes of securities.
100
Additional Fund Information (Unaudited)
| Board of Trustees | ||||||||||
| Jack B. Evans | William C. Hunter | Amy B. R. Lancellotta | Joanne T. Medero | Albin F. Moschner | John K. Nelson | |||||
| Judith M. Stockdale | Carole E. Stone | Matthew Thornton III | Terence J. Toth | Margaret L. Wolff | Robert L. Young |
Investment Adviser Nuveen Fund Advisors, LLC 333 West Wacker Drive Chicago, IL 60606 | Custodian State Street Bank Boston, MA 02111 | Legal Counsel Chapman and Cutler LLP Chicago, IL 60603 | Independent Registered PricewaterhouseCoopers LLP Chicago, IL 60606 | Transfer Agent and Computershare Trust Company, N.A. 150 Royall Street Canton, MA 02021 (800) 257-8787 | ||||
Distribution Information
The Funds hereby designate their percentages of dividends paid from net ordinary income as dividends qualifying for the dividends received deduction (“DRD”) for corporations and their percentages as qualified dividend income (“QDI”) for individuals under Section 1(h)(11) of the Internal Revenue Code as shown in the accompanying table. The actual qualified dividend income distributions will be reported to shareholders on Form 1099-DIV which will be sent to shareholders shortly after calendar year end.
| JGH | NPCT | JLS | ||||||||||
% DRD | 5.4% | 3.4% | 0.0% | |||||||||
% QDI | 16.0% | 3.4% | 0.0% | |||||||||
The Funds hereby designate their percentage of dividends paid from net ordinary income as dividends qualifying as Interest-Related Dividends and/or short-term capital gain dividends as defined in Internal Revenue Code Section 871(k) for the taxable year ended December 31, 2021.
| JGH | NPCT | JLS | ||||||||||
% of Interest-Related Dividends | 54.2% | 47.4% | 85.9% | |||||||||
The Funds had the following percentages, or maximum amount allowable, of ordinary dividends treated as Section 163(j) interest dividends pursuant to Section 163(j) of the Internal Revenue Code for the taxable year ended December 31, 2021:
| JGH | NPCT | JLS | ||||||||||
% of Section 163(j) Interest Dividends | 93.2% | 74.2% | 99.9% | |||||||||
Portfolio of Investments Information
The Fund is required to file its complete schedule of portfolio holdings with the Securities and Exchange Commission (SEC) for the first and third quarters of each fiscal year as an exhibit to its report on Form N-PORT. You may obtain this information on the SEC’s website at http://www.sec.gov.
Nuveen Funds’ Proxy Voting Information
You may obtain (i) information regarding how each fund voted proxies relating to portfolio securities held during the most recent twelve-month period ended June 30, without charge, upon request, by calling Nuveen toll-free at (800) 257-8787 or on Nuveen’s website at www.nuveen.com and (ii) a description of the policies and procedures that each fund used to determine how to vote proxies relating to portfolio securities without charge, upon request, by calling Nuveen toll free at (800) 257-8787. You may also obtain this information directly from the SEC. Visit the SEC on-line at http://www.sec.gov.
CEO Certification Disclosure
The Fund’s Chief Executive Officer (CEO) has submitted to the New York Stock Exchange (NYSE) the annual CEO certification as required by Section 303A.12(a) of the NYSE Listed Company Manual. The Fund has filed with the SEC the certification of its CEO and Chief Financial Officer required by Section 302 of the Sarbanes-Oxley Act.
Common Share Repurchases
The Fund intends to repurchase, through its open-market share repurchase program, shares of its own common stock at such times and in such amounts as is deemed advisable. During the period covered by this report, the Fund repurchased shares of its common stock, as shown in the accompanying table. Any future repurchases will be reported to shareholders in the next annual or semi-annual report.
| JGH | NPCT | JLS | ||||||||||
Common shares repurchased | 0 | 0 | 0 | |||||||||
FINRA BrokerCheck
The Financial Industry Regulatory Authority (FINRA) provides information regarding the disciplinary history of FINRA member firms and associated investment professionals. This information as well as an investor brochure describing FINRA BrokerCheck is available to the public by calling the FINRA BrokerCheck Hotline number at (800) 289-9999 or by visiting www.FINRA.org.
101
Glossary of Terms Used in this Report
(Unaudited)
| ∎ | Asset-Backed Securities (ABS): Securities whose value and income payments are derived from and collateralized by a specific pool of underlying assets. The pool of assets typically is a group of small and/or illiquid assets that may be difficult to sell individually. The underlying pools of asset-backed securities often include payments from credit cards, auto loans or mortgage loans. |
| ∎ | Average Annual Total Return: This is a commonly used method to express an investment’s performance over a particular, usually multi-year time period. It expresses the return that would have been necessary each year to equal the investment’s actual cumulative performance (including change in NAV or market price and reinvested dividends and capital gains distributions, if any) over the time period being considered. |
| ∎ | Bloomberg Global High Yield Index (USD Hedged): An index designed to measure the performance of the fixed-rate high yield debt of companies in the U.S., developed markets and emerging markets. Index returns assume reinvestment of distributions, but do not reflect any applicable sales charges or management fees. |
| ∎ | Bloomberg U.S. Aggregate Bond Index: An index designed to measure the performance of the USD-denominated, fixed-rate investment grade taxable bond market. The index includes Treasuries, government-related and corporate securities, mortgage-backed securities (MBS), asset-backed securities (ABS) and commercial mortgage-backed securities (CMBS). Index returns assume reinvestment of distributions, but do not reflect any applicable sales charges or management fees. |
| ∎ | Commercial Mortgage-Backed Securities (CMBS): Commercial mortgage-backed securities are backed by cash flows of a mortgage or pool of mortgages on commercial real estate. CMBS generally are structured to provide protection to the senior class investors against potential losses on the underlying mortgage loans. CMBS are typically characterized by the following: i) loans on multifamily housing, non-residential property, ii) payments based on the amortization schedule of 25-30 years with a balloon payment due usually after 10 years, and iii) restrictions on prepayments. |
| ∎ | Contingent Capital Securities (CoCos): CoCos are debt or capital securities of primarily non-U.S. issuers with loss absorption contingency mechanisms built into the terms of the security, for example a mandatory conversion into common stock of the issuer, or a principal write-down, which if triggered would likely cause the CoCos investment to lose value. Loss absorption mechanisms would become effective upon the occurrence of a specified contingency event, or at the discretion of a regulatory body. Specified contingency events, as identified in the CoCo’s governing documents, usually reference a decline in the issuer’s capital below a specified threshold level, and/or certain regulatory events. A loss absorption contingency event for CoCos would likely be the result of, or related to, the deterioration of the issuer’s financial condition and/or its status as a going concern. In such a case, with respect to CoCos that provide for conversion into common stock upon the occurrence of the contingency event, the market price of the issuer’s common stock received by the Acquiring Fund will have likely declined, perhaps substantially, and may continue to decline after conversion. CoCos rated below investment grade should be considered high yield securities, or “junk,” but often are issued by entities whose more senior securities are rated investment grade. CoCos are a relatively new type of security; and there is a risk that CoCo security issuers may suffer the sort of future financial distress that could materially increase the likelihood (or the market’s perception of the likelihood) that an automatic write-down or conversion event on those issuers’ CoCos will occur. Additionally, the trading behavior of a given issuer’s CoCos may be strongly impacted by the trading behavior of other issuers’ CoCos, such that negative information from an unrelated CoCo security may cause a decline in value of one or more CoCos held by the Fund. Accordingly, the trading behavior of CoCos may not follow the trading behavior of other types of debt and preferred securities. Despite these concerns, the prospective reward vs. risk characteristics of at least certain CoCos may be very attractive relative to other fixed-income alternatives. |
102
| ∎ | Duration: Duration is a measure of the expected period over which a bond’s principal and interest will be paid, and consequently is a measure of the sensitivity of a bond’s or bond fund’s value to changes when market interest rates change. Generally, the longer a bond’s or fund’s duration, the more the price of the bond or fund will change as interest rates change. |
| ∎ | Effective Leverage: Effective leverage is a fund’s effective economic leverage, and includes both regulatory leverage (see below) and the leverage effects of certain derivative investments in the fund’s portfolio. |
| ∎ | JLS Blended Benchmark (effective October 14, 2019): The ICE BofA U.S. ABS & CMBS Index consists of a 50/50 blend of USD-denominated, investment grade fixed and floating-rate asset backed securities (ABS) and fixed-rate commercial mortgage backed securities (CMBS) publicly issued in the U.S. Prior to October 14, 2019, the Fund’s performance was measured against the Bloomberg U.S. Aggregate Bond Index. Index returns assume reinvestment of distributions, but do not reflect any applicable sales charges or management fees. |
| ∎ | Leverage: Leverage is created whenever a fund has investment exposure (both reward and/or risk) equivalent to more than 100% of the investment capital. |
| ∎ | Mortgage-Backed Securities (MBS): Mortgage-backed securities (MBS) are bonds backed by pools of mortgages, usually with similar characteristics, and which return principal and interest in each payment. MBS are composed of residential mortgages (RMBS) or commercial mortgages (CMBS). RMBS are further divided into agency RMBS and non-agency RMBS, depending on the issuer. |
| ∎ | Net Asset Value (NAV) Per Share: A fund’s Net Assets is equal to its total assets (securities, cash, accrued earnings and receivables) less its total liabilities. NAV per share is equal to the fund’s Net Assets divided by its number of shares outstanding. |
| ∎ | NPCT Blended Benchmark: Consists of: 1) 60% Bloomberg MSCI U.S. Green Bond Index, which is designed to measure the performance of USD-denominated fixed income securities issued to fund projects with direct environmental benefits, and 2) 40% Bloomberg U.S. Corporate High Yield Bond Index, which is designed to measure the USD-denominated, fixed-rate corporate high yield bond market. Index returns assume reinvestment of distributions, but do not reflect any applicable sales charges or management fees. |
| ∎ | Regulatory Leverage: Regulatory leverage consists of preferred shares issued by or borrowings of a fund. Both of these are part of a fund’s capital structure. Regulatory leverage is subject to asset coverage limits set in the Investment Company Act of 1940. |
| ∎ | Residential Mortgage-Backed Securities (RMBS): Residential mortgage-backed securities are securities the payments on which depend primarily on the cash flow from residential mortgage loans made to borrowers that are secured by residential real estate. RMBS consist of agency and non-agency RMBS. Agency RMBS have agency guarantees that assure investors that they will receive timely payment of interest and principal, regardless of delinquency or default rates on the underlying loans. Agency RMBS include securities issued by the Government National Mortgage Association, the Federal National Mortgage Association and the Federal Home Loan Mortgage Corporation, and other federal agencies, or issues guaranteed by them. Non-agency RMBS do not have agency guarantees. Non-agency RMBS have credit enhancement built into the structure to shield investors from borrower delinquencies. The spectrum of non-agency residential mortgage loans includes traditional jumbo loans (prime), alternative-A loans (Alt-A), and home equity loans (subprime). |
103
(Unaudited)
The management of the Funds, including general supervision of the duties performed for the Funds by the Adviser, is the responsibility of the Board of Trustees of the Funds. None of the trustees who are not “interested” persons of the Funds (referred to herein as “independent board members”) has ever been a director or employee of, or consultant to, Nuveen or its affiliates. The names and business addresses of the trustees and officers of the Funds, their principal occupations and other affiliations during the past five years, the number of portfolios each Trustee oversees and other directorships they hold are set forth below.
Name, Year of Birth & Address | Position(s) Held with the Funds | Year First Elected or Appointed and Term(1) | Principal Occupation(s) Including other Directorships During Past 5 Years | Number of Portfolios in Fund Complex Overseen by Board Member | ||||
| Independent Board Members: | ||||||||
∎ TERENCE J. TOTH | Formerly, a Co-Founding Partner, Promus Capital (investment advisory firm) (2008-2017); Director, Quality Control Corporation (manufacturing) (since 2012); member: Catalyst Schools of Chicago Board (since 2008) and Mather Foundation Board (philanthropy) (since 2012), and chair of its Investment Committee; formerly, Member, Chicago Fellowship Board (philanthropy) (2005-2016); formerly, Director, Fulcrum IT Services LLC (information technology services firm to government entities) (2010-2019); formerly, Director, LogicMark LLC (health services) (2012-2016); formerly, Director, Legal & General Investment Management America, Inc. (asset management) (2008-2013); formerly, CEO and President, Northern Trust Global Investments (financial services) (2004-2007): Executive Vice President, Quantitative Management & Securities Lending (2000-2004); prior thereto, various positions with Northern Trust Company (financial services) (since 1994); formerly, Member, Northern Trust Mutual Funds Board (2005-2007), Northern Trust Global Investments Board (2004-2007), Northern Trust Japan Board (2004-2007), Northern Trust Securities Inc. Board (2003-2007) and Northern Trust Hong Kong Board (1997-2004). | |||||||
1959 333 W. Wacker Drive Chicago, IL 6o6o6 | Chairman and Board Member | 2008 Class II | 142 | |||||
∎ JACK B. EVANS | Chairman (since 2019), formerly, President (1996-2019), The Hall-Perrine Foundation, (private philanthropic corporation); Life Trustee of Coe College; formerly, Member and President Pro-Tem of the Board of Regents for the State of Iowa University System (2007- 2013); Director and Chairman (2009-2021), United Fire Group, a publicly held company; Director, Public Member, American Board of Orthopaedic Surgery (2015-2020); Director (2000-2004), Alliant Energy; Director (1996-2015), The Gazette Company (media and publishing); Director (1997- 2003), Federal Reserve Bank of Chicago; President and Chief Operating Officer (1972-1995), SCI Financial Group, Inc., (regional financial services firm). | |||||||
1948 333 W. Wacker Drive Chicago, IL 6o6o6 | Board Member | 1999 Class III | 142 | |||||
∎ WILLIAM C. HUNTER | Dean Emeritus, formerly, Dean, Tippie College of Business, University of (2006-2012); Director of Wellmark, Inc. (since 2009); past Director (2005- 2015), and past President (2010-2014) Beta Gamma Sigma, Inc., The International Business Honor Society; formerly, Director (2004-2018) of Xerox Corporation; formerly, Dean and Distinguished Professor of Finance, School of Business at the University of Connecticut (2003-2006); previously, Senior Vice President and Director of Research at the Federal Reserve Bank of Chicago (1995-2003); formerly, Director (1997-2007), Credit Research Center at Georgetown University. | |||||||
1948 333 W. Wacker Drive Chicago, IL 6o6o6 | Board Member | 2003 Class I | 142 | |||||
∎ AMY B. R. LANCELLOTTA | Formerly, Managing Director, Independent Directors Council (IDC) (supports the fund independent director community and is part of the Investment Company Institute (ICI), which represents regulated investment companies) (2006-2019); formerly, various positions with ICI (1989-2006); Member of the Board of Directors, Jewish Coalition Against Domestic Abuse (JCADA) (since 2020). | |||||||
1959 333 W. Wacker Drive Chicago, IL 6o6o6 | Board Member | 2021 Class II | 142 | |||||
104
Name, Year of Birth & Address | Position(s) Held with the Funds | Year First Elected or Appointed and Term(1) | Principal Occupation(s) Including other Directorships During Past 5 Years | Number of Portfolios in Fund Complex Overseen by Board Member | ||||
| Independent Board Members (continued): | ||||||||
∎ JOANNE T. MEDERO | Formerly, Managing Director, Government Relations and Public Policy (2009-2020) and Senior Advisor to the Vice Chairman (2018-2020), BlackRock, Inc. (global investment management firm); formerly, Managing (Director, Global Head of Government Relations and Public Policy, Barclays Group (IBIM) (investment banking, investment management and wealth management businesses) (2006-2009); formerly, Managing Director, Global General Counsel and Corporate Secretary, Barclays Global Investors (global investment management firm) (1996-2006); formerly, Partner, Orrick, Herrington & Sutcliffe LLP (law firm) (1993-1995); formerly, General Counsel, Commodity Futures Trading Commission (government agency overseeing U.S. derivatives markets) (1989-1993); formerly, Deputy Associate Director/ Associate Director for Legal and Financial Affairs, Office of Presidential Personnel, The White House (1986-1989); Member of the Board of Directors, Baltic-American Freedom Foundation (seeks to provide opportunities for citizens of the Baltic states to gain education and professional development through exchanges in the U.S.) (since 2019). | |||||||
1954 333 W. Wacker Drive Chicago, IL 6o6o6 | Board Member | 2021 Class III | 142 | |||||
∎ ALBIN F. MOSCHNER | Founder and Chief Executive Officer, Northcroft Partners, LLC, (management consulting) (since 2012); formerly, Chairman (2019), and Director (2012-2019), USA Technologies, Inc., (provider of solutions and services to facilitate electronic payment transactions); formerly, Director, Wintrust Financial Corporation (1996-2016); previously, held positions at Leap Wireless International, Inc., (consumer wireless services) including Consultant (2011- 2012), Chief Operating Officer (2008-2011), and Chief Marketing Officer (2004- 2008); formerly, President, Verizon Card Services division of Verizon Communications, Inc. (2000-2003); formerly, President, One Point Services at One Point Communications (telecommunication services) (1999-2000); formerly, Vice Chairman of the Board, Diba, Incorporated (internet technology provider) (1996-1997); formerly, various executive positions (1991-1996) including Chief Executive Officer (1995-1996) of Zenith Electronics Corporation (consumer electronics). | |||||||
1952 333 W. Wacker Drive Chicago, IL 6o6o6 | Board Member | 2016 Class III | 142 | |||||
∎ JOHN K. NELSON | Member of Board of Directors of Core12 LLC. (private firm which develops branding, marketing and communications strategies for clients) (since 2008); served on The President’s Council of Fordham University (2010-2019) and previously a Director of the Curran Center for Catholic American Studies (2009- 2018); formerly, senior external advisor to the Financial Services practice of Deloitte Consulting LLP. (2012-2014); former Chair of the Board of Trustees of Marian University (2010-2014 as trustee, 2011-2014 as Chair); formerly Chief Executive Officer of ABN AMRO Bank N.V., North America, and Global Head of the Financial Markets Division (2007-2008), with various executive leadership roles in ABN AMRO Bank N.V. between 1996 and 2007. | |||||||
1962 333 W. Wacker Drive Chicago, IL 6o6o6 | Board Member | 2013 Class II | 142 | |||||
∎ JUDITH M. STOCKDALE | Board Member, Land Trust Alliance (national public charity addressing natural land and water conservation in the U.S.) (since 2013); formerly, Board Member, U.S. Endowment for Forestry and Communities (national endowment addressing forest health, sustainable forest production and markets, and economic health of forest-reliant communities in the U.S.) (2013-2019); formerly, Executive Director (1994-2012), Gaylord and Dorothy Donnelley Foundation (private foundation endowed to support both natural land conservation and artistic vitality); prior thereto, Executive Director, Great Lakes Protection Fund (endowment created jointly by seven of the eight Great Lake states’ Governors to take a regional approach to improving the health of the Great Lakes) (1990-1994). | |||||||
1947 333 W. Wacker Drive Chicago, IL 6o6o6 | Board Member | 1997 Class I | 142 | |||||
105
Board Members & Officers (continued)
(Unaudited)
Name, Year of Birth & Address | Position(s) Held with the Funds | Year First Elected or Appointed and Term(1) | Principal Occupation(s) Including other Directorships During Past 5 Years | Number of Portfolios in Fund Complex Overseen by Board Member | ||||
| Independent Board Members (continued): | ||||||||
∎ CAROLE E. STONE | Former Director, Chicago Board Options Exchange, Inc. (2006-2017); and C2 Options Exchange, Incorporated (2009-2017); formerly Director, Cboe, Global Markets, Inc., (2010-2020) formerly named CBOE Holdings, Inc.; formerly, Commissioner, New York State Commission on Public Authority Reform (2005-2010). | |||||||
1947 333 W. Wacker Drive Chicago, IL 6o6o6 | Board Member | 2007 Class I | 142 | |||||
∎ MATTHEW THORNTON III | Formerly, Executive Vice President and Chief Operating Officer (2018-2019), FedEx Freight Corporation, a subsidiary of FedEx Corporation (“FedEx”) (provider of transportation, e-commerce and business services through its portfolio of companies); formerly, Senior Vice President, U.S. Operations (2006-2018), Federal Express Corporation, a subsidiary of FedEx; formerly, Member of the Board of Directors (2012-2018), Safe Kids Worldwide® (a non-profit organization dedicated to preventing childhood injuries). Member of the Board of Directors (since 2014), The Sherwin-Williams Company (develops, manufactures, distributes and sells paints, coatings and related products); Director (since 2020), Crown Castle International (provider of communications infrastructure). | |||||||
1958 333 West Wacker Drive Chicago, IL 60606 | Board Member | 2020 Class III | 142 | |||||
∎ MARGARET L. WOLFF | Formerly, member of the Board of Directors (2013-2017) of Travelers Insurance Company of Canada and The Dominion of Canada General Insurance Company (each, a part of Travelers Canada, the Canadian operation of The Travelers Companies, Inc.); formerly, Of Counsel, Skadden, Arps, Slate, Meagher & Flom LLP (Mergers & Acquisitions Group) (legal services) (2005-2014); Member of the Board of Trustees of New York-Presbyterian Hospital (since 2005); Member (since 2004) and Chair (since 2015) of the Board of Trustees of The John A. Hartford Foundation (philanthropy dedicated to improving the care of older adults); formerly, Member (2005-2015) and Vice Chair (2011-2015) of the Board of Trustees of Mt. Holyoke College. | |||||||
1955 333 W. Wacker Drive Chicago, IL 6o6o6 | Board Member | 2016 Class I | 142 | |||||
∎ ROBERT L. YOUNG | Formerly, Chief Operating Officer and Director, J.P.Morgan Investment Management Inc. (financial services) (2010-2016); formerly, President and Principal Executive Officer (2013-2016), and Senior Vice President and Chief Operating Officer (2005-2010), of J.P.Morgan Funds; formerly, Director and various officer positions for J.P.Morgan Investment Management Inc. (formerly, JPMorgan Funds Management, Inc. and formerly, One Group Administrative Services) and JPMorgan Distribution Services, Inc. (financial services) (formerly, One Group Dealer Services, Inc.) (1999-2017). | |||||||
1963 333 W. Wacker Drive Chicago, IL 6o6o6 | Board Member | 2017 Class II | 142 | |||||
106
Name, Year of Birth & Address | Position(s) Held with the Funds | Year First Elected or Appointed(2) | Principal Occupation(s) During Past 5 Years | |||
| Officers of the Funds: | ||||||
∎ DAVID J. LAMB | Man1aging Director of Nuveen Fund Advisors, LLC (since 2019) Senior Managing Director (since 2021), formerly, Managing Director (2020-2021) of Nuveen Securities, LLC; Senior Managing Director (since 2021), formerly, Managing Director (2017-2021), Senior Vice President of Nuveen (2006-2017), Vice President prior to 2006. | |||||
1963 333 W. Wacker Drive Chicago, IL 6o6o6 | Chief Administrative Officer | 2015 | ||||
∎ MARK J. CZARNIECKI | Vice President and Assistant Secretary of Nuveen Securities, LLC (since 2016) and Nuveen Fund Advisors (since 2017); Managing Director and Associate General Counsel (since January 2022), formerly, Vice President and Associate General Counsel of Nuveen (2013-2021) and Vice President, Assistant Secretary and Associate General Counsel of Nuveen Asset Management LLC (since 2018). | |||||
1979 901 Marquette Avenue Minneapolis, MN 55402 | Vice President and Assistant Secretary | 2013 | ||||
∎ DIANA R. GONZALEZ | Vice President and Assistant Secretary of Nuveen Fund Advisors, LLC (since 2017); Vice President and Associate General Counsel of Nuveen (since 2017); formerly, Associate General Counsel of Jackson National Asset Management (2012-2017). | |||||
1978 333 W. Wacker Drive Chicago, IL 6o6o6 | Vice President and Assistant Secretary | 2017 | ||||
∎ NATHANIEL T. JONES | Senior Managing Director (since 2021), formerly, Managing Director (2017-2021), Senior Vice President (2016-2017), Vice President (2011-2016) of Nuveen; Managing Director (since 2015) of Nuveen Fund Advisors, LLC; Chartered Financial Analyst. | |||||
1979 333 W. Wacker Drive Chicago, IL 6o6o6 | Vice President and Treasurer | 2016 | ||||
∎ TINA M. LAZAR | Managing Director (since 2017), formerly, Senior Vice President (2014-2017) of Nuveen Securities, LLC. | |||||
1961 333 W. Wacker Drive Chicago, IL 6o6o6 | Vice President | 2002 | ||||
∎ BRIAN J. LOCKHART | Managing Director (since 2019) of Nuveen Fund Advisors, LLC; Senior Managing Director (since 2021), formerly, Managing Director (2017-2021), Vice President (2010-2017) of Nuveen; Head of Investment Oversight (since 2017), formerly, Team Leader of Manager Oversight (2015-2017); Chartered Financial Analyst and Certified Financial Risk Manager. | |||||
1974 333 W. Wacker Drive Chicago, IL 6o6o6 | Vice President | 2019 | ||||
∎ JACQUES M. LONGERSTAEY | Senior Managing Director, Chief Risk Officer, Nuveen, LLC (since May 2019); Senior Managing Director (since May 2019) of Nuveen Fund Advisors, LLC; formerly, Chief Investment and Model Risk Officer, Wealth & Investment Management Division, Wells Fargo Bank (NA) (2013-2019). | |||||
1963 8500 Andrew Carnegie Blvd. Charlotte, NC 28262 | Vice President | 2019 | ||||
∎ KEVIN J. MCCARTHY | Senior Managing Director (since 2017) and Secretary and General Counsel (since 2016) of Nuveen Investments, Inc., formerly, Executive Vice President (2016-2017) and Managing Director and Assistant Secretary (2008-2016); Senior Managing Director (since 2017) and Assistant Secretary (since 2008) of Nuveen Securities, LLC, formerly Executive Vice President (2016-2017) and Managing Director (2008- 2016); Senior Managing Director (since 2017), and Secretary (since 2016) of Nuveen Fund Advisors, LLC, formerly, Co-General Counsel (2011-2020), Executive Vice President (2016-2017), Managing Director (2008-2016) and Assistant Secretary (2007-2016); Senior Managing Director (since 2017), Secretary (since 2016) of Nuveen Asset Management, LLC, formerly, Associate General Counsel (2011-2020), Executive Vice President (2016-2017) and Managing Director and Assistant Secretary (2011- 2016); Vice President (since 2007) and Secretary (since 2016), formerly, Assistant Secretary, of NWQ Investment Management Company, LLC, Santa Barbara Asset Management, LLC and Winslow Capital Management, LLC (since 2010). Senior Managing Director (since 2017) and Secretary (since 2016) of Nuveen Alternative Investments, LLC. | |||||
1966 333 W. Wacker Drive Chicago, IL 6o6o6 | Vice President and Assistant Secretary | 2007 | ||||
107
Board Members & Officers (continued)
(Unaudited)
Name, Year of Birth & Address | Position(s) Held with the Funds | Year First Elected or Appointed(2) | Principal Occupation(s) During Past 5 Years | |||
| Officers of the Funds (continued): | ||||||
∎ JON SCOTT MEISSNER | Managing Director of Mutual Fund Tax and Financial Reporting groups at Nuveen (since 2017); Managing Director of Nuveen Fund Advisors, LLC (since 2019); Senior Director of Teachers Advisors, LLC and TIAA-CREF Investment Management, LLC (since 2016); Senior Director (since 2015) Mutual Fund Taxation to the TIAA-CREF Funds, the TIAA-CREF Life Funds, the TIAA Separate Account VA-1 and the CREF Accounts; has held various positions with TIAA since 2004. | |||||
1973 8500 Andrew Charlotte, NC 28262 | Vice President and Assistant Secretary | 2019 | ||||
∎ DEANN D. MORGAN | President, Nuveen Fund Advisors, LLC (since 2020); Executive Vice President, Global Head of Product at Nuveen (since 2019); Co-Chief Executive Officer of Nuveen Securities, LLC since 2020); Managing Member of MDR Collaboratory LLC (since 2018); formerly, Managing Director, (Head of Wealth Management Product Structuring & COO Multi Asset Investing. The Blackstone Group (2013-2017). | |||||
1969 730 Third Avenue New York, NY 10017 | Vice President | 2020 | ||||
∎ CHRISTOPHER M. ROHRBACHER | Managing Director and Assistant Secretary (since 2017) of Nuveen Securities, LLC; Managing Director (since 2017) General Counsel (since 2020), and Assistant Secretary (since 2016), formerly, Senior Vice President (2016-2017), of Nuveen Fund Advisors, LLC; Managing Director, Associate General Counsel and Assistant Secretary of Nuveen Asset Management, LLC (since 2020); Managing Director (since 2017), and Associate General Counsel (since 2016), formerly, Senior Vice President (2012-2017) and Assistant General Counsel (2008-2016) of Nuveen. | |||||
1971 333 W. Wacker Drive Chicago, IL 6o6o6 | Vice President and Assistant Secretary | 2008 | ||||
∎ WILLIAM A. SIFFERMANN | Managing Director (since 2017), formerly Senior Vice President (2016-2017) and Vice President (2011-2016) of Nuveen. | |||||
1975 333 W. Wacker Drive Chicago, IL 6o6o6 | Vice President | 2017 | ||||
∎ E. SCOTT WICKERHAM | Senior Managing Director, Head of Public Investment Finance at Nuveen (since 2019), formerly, Managing Director; Senior Managing Director (since 2019) of Nuveen Fund Advisers, (LLC; Principal Financial Officer, Principal Accounting Officer and Treasurer (since 2017) of the TIAA-CREF Funds, the TIAA-CREF Life Funds, the TIAA Separate Account VA-1 and Principal Financial Officer, Principal Accounting Officer (since 2020) and Treasurer (since 2017) to the CREF Accounts; formerly, Senior Director, TIAA-CREF Fund Administration (2014-2015); has held various positions with TIAA since 2006. | |||||
1973 8500 Andrew Charlotte, NC 28262 | Vice President and Controller | 2019 | ||||
∎ MARK L. WINGET | Vice President and Assistant Secretary of Nuveen Securities, LLC (since 2008), and Nuveen Fund Advisors, LLC (since 2019); Vice President, Associate General Counsel and Assistant Secretary of Nuveen Asset Management, LLC (since 2020); Vice President (since 2010) and Associate General Counsel (since 2019), formerly, Assistant General Counsel (2008-2016) of Nuveen. | |||||
1968 333 W. Wacker Drive Chicago, IL 60606 | Vice President and Secretary | 2008 | ||||
∎ GIFFORD R. ZIMMERMAN | Formerly, Managing Director (2002-2020) and Assistant Secretary (2002-2020) of Nuveen Securities, LLC; formerly, Managing Director (2002-2020), Assistant Secretary (1997-2020) and Co-General Counsel (2011- 2020) of Nuveen Fund Advisors, LLC; formerly, Managing Director (2004-2020) and Assistant Secretary (1994-2020) of Nuveen Investments, Inc.; formerly, Managing Director, Assistant Secretary and Associate General Counsel of Nuveen Asset Management, LLC (2011-2020); formerly, Vice President and Assistant Secretary of NWQ Investment Management Company, LLC (2002-2020), Santa Barbara Asset Management, LLC (2006-2020) and Winslow Capital Management, LLC (2010-2020); Chartered Financial Analyst. | |||||
1956 333 W. Wacker Drive Chicago, IL 60606 | Vice President and Chief Compliance Officer | 1988 | ||||
| (1) | The Board of Trustees is divided into three classes, Class I, Class II, and Class III, with each being elected to serve until the third succeeding annual shareholders’ meeting subsequent to its election or thereafter in each case when its respective successors are duly elected or appointed, except two board members are elected by the holders of Preferred Shares, when applicable, to serve until the next annual shareholders’ meeting subsequent to its election or thereafter in each case when its respective successors are duly elected or appointed. The year first elected or appointed represents the year in which the board member was first elected or appointed to any fund in the Nuveen complex. |
| (2) | Officers serve indefinite terms until their successor has been duly elected and qualified, their death or their resignation or removal. The year first elected or appointed represents the year in which the Officer was first elected or appointed to any fund in the Nuveen complex. |
108
Notes
109
Notes
110
Notes
111
Nuveen:
Serving Investors for Generations
Since 1898, financial professional and their clients have relied on Nuveen to provide
dependable investment solutions through continued adherence to proven, long-term investing
principles. Today, we offer a range of high quality solutions designed to
be integral components of a well-diversified core portfolio.
Focused on meeting investor needs.
Nuveen is the investment manager of TIAA. We have grown into one of the world’s premier global asset managers, with specialist knowledge across all major asset classes and particular strength in solutions that provide income for investors and that draw on our expertise in alternatives and responsible investing. Nuveen is driven not only by the independent investment processes across the firm, but also the insights, risk management, analytics and other tools and resources that a truly world-class platform provides. As a global asset manager, our mission is to work in partnership with our clients to create solutions which help them secure their financial future.
Find out how we can help you.
To learn more about how the products and services of Nuveen may be able to help you meet your financial goals, talk to your financial professional, or call us at (800) 257-8787. Please read the information provided carefully before you invest. Investors should consider the investment objective and policies, risk considerations, charges and expenses of any investment carefully. Where applicable, be sure to obtain a prospectus, which contains this and other relevant information. To obtain a prospectus, please contact your securities representative or Nuveen, 333 W. Wacker Dr., Chicago, IL 60606. Please read the prospectus carefully before you invest or send money.
Learn more about Nuveen Funds at: www.nuveen.com/closed-end-funds
| Nuveen Securities, LLC, member FINRA and SIPC | 333 West Wacker Drive Chicago, IL 60606 | www.nuveen.com | EAN-B-1221D 2007062-INV-Y-02/23 |
ITEM 2. CODE OF ETHICS.
As of the end of the period covered by this report, the registrant has adopted a code of ethics that applies to the registrant’s principal executive officer, principal financial officer, principal accounting officer or controller, or persons performing similar functions. There were no amendments to or waivers from the Code during the period covered by this report. The registrant has posted the code of ethics on its website at www.nuveen.com/fund-governance. (To view the code, click on Code of Conduct.)
ITEM 3. AUDIT COMMITTEE FINANCIAL EXPERT.
As of the end of the period covered by this report, the registrant’s Board of Directors or Trustees (“Board”) determined that the registrant has at least one “audit committee financial expert” (as defined in Item 3 of Form N-CSR) serving on its Audit Committee. The registrant’s audit committee financial experts are Carole E. Stone, Jack B. Evans, William C. Hunter and Albin F. Moschner who are “independent” for purposes of Item 3 of Form N-CSR.
Ms. Stone served for five years as Director of the New York State Division of the Budget. As part of her role as Director, Ms. Stone was actively involved in overseeing the development of the State’s operating, local assistance and capital budgets, its financial plan and related documents; overseeing the development of the State’s bond-related disclosure documents and certifying that they fairly presented the State’s financial position; reviewing audits of various State and local agencies and programs; and coordinating the State’s system of internal audit and control. Prior to serving as Director, Ms. Stone worked as a budget analyst/examiner with increasing levels of responsibility over a 30 year period, including approximately five years as Deputy Budget Director. Ms. Stone has also served as Chair of the New York State Racing Association Oversight Board, as Chair of the Public Authorities Control Board, as a Commissioner on the New York State Commission on Public Authority Reform and as a member of the Boards of Directors of several New York State public authorities. These positions have involved overseeing operations and finances of certain entities and assessing the adequacy of project/entity financing and financial reporting. Currently, Ms. Stone is on the Board of Directors of CBOE Holdings, Inc., of the Chicago Board Options Exchange, and of C2 Options Exchange. Ms. Stone’s position on the boards of these entities and as a member of both CBOE Holdings’ Audit Committee and its Finance Committee has involved, among other things, the oversight of audits, audit plans and preparation of financial statements.
Mr. Evans was formerly President and Chief Operating Officer of SCI Financial Group, Inc., a full service registered broker-dealer and registered investment adviser (“SCI”). As part of his role as President and Chief Operating Officer, Mr. Evans actively supervised the Chief Financial Officer (the “CFO”) and actively supervised the CFO’s preparation of financial statements and other filings with various regulatory authorities. In such capacity, Mr. Evans was actively involved in the preparation of SCI’s financial statements and the resolution of issues raised in connection therewith. Mr. Evans has also served on the audit committee of various reporting companies. At such companies, Mr. Evans was involved in the oversight of audits, audit plans, and the preparation of financial statements. Mr. Evans also formerly chaired the audit committee of the Federal Reserve Bank of Chicago.
Mr. Hunter was formerly a Senior Vice President at the Federal Reserve Bank of Chicago. As part of his role as Senior Vice President, Mr. Hunter was the senior officer responsible for all operations of each of the Economic Research, Statistics, and Community and Consumer Affairs units at the Federal Reserve Bank of Chicago. In such capacity, Mr. Hunter oversaw the subunits of the Statistics and Community and Consumer Affairs divisions responsible for the analysis and evaluation of bank and bank holding company financial statements and financial filings. Prior to serving as Senior Vice President at the Federal Reserve Bank of Chicago, Mr. Hunter was the Vice President of the Financial Markets unit at the Federal Reserve Bank of Atlanta where he supervised financial staff and bank holding company analysts who analyzed and evaluated bank and bank holding company financial statements. Mr. Hunter also currently serves on the Boards of Directors of Xerox Corporation and Wellmark, Inc. as well as on the Audit Committees of such Boards. As an Audit Committee member, Mr. Hunter’s responsibilities include, among other things, reviewing financial statements, internal audits and internal controls over financial reporting. Mr. Hunter also formerly was a Professor of Finance at the University of Connecticut School of Business and has authored numerous scholarly articles on the topics of finance, accounting and economics.
Mr. Moschner, Founder and Chief Executive Officer, Northcroft Partners, LLC, (management consulting) (since 2012); formerly, Chairman (2019), and Director (2012-2019), USA Technologies, Inc., (provider of solutions and services to facilitate electronic payment transactions); formerly, Director, Wintrust Financial Corporation (1996-2016); previously, held positions at Leap Wireless International, Inc., (consumer wireless services) including Consultant (2011-2012), Chief Operating Officer (2008-2011), and Chief Marketing Officer (2004-2008); formerly, President, Verizon Card Services division of Verizon Communications, Inc. (2000-2003); formerly, President, One Point Services at One Point Communications (telecommunication services) (1999-2000); formerly, Vice Chairman of the Board, Diba, Incorporated (internet technology provider) (1996-1997); formerly, various executive positions (1991-1996), including Chief Executive Officer (1995-1996) of Zenith Electronics Corporation (consumer electronics).
ITEM 4. PRINCIPAL ACCOUNTANT FEES AND SERVICES.
The following tables show the amount of fees that PricewaterhouseCoopers LLP, the Fund’s auditor, billed to the Fund during the Fund’s last two full fiscal years. For engagements with PricewaterhouseCoopers LLP the Audit Committee approved in advance all audit services and non-audit services that PricewaterhouseCoopers LLP provided to the Fund, except for those non-audit services that were subject to the pre-approval exception under Rule 2-01 of Regulation S-X (the “pre-approval exception”). The pre-approval exception for services provided directly to the Fund waives the pre-approval requirement for services other than audit, review or attest services if: (A) the aggregate amount of all such services provided constitutes no more than 5% of the total amount of revenues paid by the Fund to its accountant during the fiscal year in which the services are provided; (B) the Fund did not recognize the services as non-audit services at the time of the engagement; and (C) the services are promptly brought to the Audit Committee’s attention, and the Committee (or its delegate) approves the services before the audit is completed.
The Audit Committee has delegated certain pre-approval responsibilities to its Chair (or, in her absence, any other member of the Audit Committee).
Fiscal Year Ended | Audit Fees Billed to Fund 1 | Audit-Related Fees Billed to Fund 2 | Tax Fees Billed to Fund 3 | All Other Fees Billed to Fund 4 | ||||||||||||
December 31, 2021 | $ | 54,935 | $ | 0 | $ | 5,800 | 0 | |||||||||
|
|
|
|
|
|
|
| |||||||||
| ||||||||||||||||
Percentage approved pursuant to pre-approval exception | 0 | % | 0 | % | 0 | % | 0 | % | ||||||||
|
|
|
|
|
|
|
| |||||||||
| ||||||||||||||||
December 31, 2020 | $ | 53,905 | $ | 0 | $ | 112,140 | $ | 0 | ||||||||
|
|
|
|
|
|
|
| |||||||||
| ||||||||||||||||
Percentage approved pursuant to pre-approval exception | 0 | % | 0 | % | 0 | % | 0 | % | ||||||||
|
|
|
|
|
|
|
| |||||||||
1 “Audit Fees” are the aggregate fees billed for professional services for the audit of the Fund’s annual financial statements and services provided in connection with statutory and regulatory filings or engagements.
2 “Audit Related Fees” are the aggregate fees billed for assurance and related services reasonably related to the performance of the audit or review of financial statements that are not reported under “Audit Fees”. These fees include offerings related to the Fund’s common shares and leverage.
3 “Tax Fees” are the aggregate fees billed for professional services for tax advice, tax compliance, and tax planning. These fees include: all global withholding tax services; excise and state tax reviews; capital gain, tax equalization and taxable basis calculation performed by the principal accountant.
4 “All Other Fees” are the aggregate fees billed for products and services other than “Audit Fees”, “Audit-Related Fees” and “Tax Fees”. These fees represent all “Agreed-Upon Procedures” engagements pertaining to the Fund’s use of leverage.
SERVICES THAT THE FUND’S AUDITOR BILLED TO THE
ADVISER AND AFFILIATED FUND SERVICE PROVIDERS
The following tables show the amount of fees billed by PricewaterhouseCoopers LLP to Nuveen Fund Advisors, LLC (formerly Nuveen Fund Advisors, Inc.) (the “Adviser”), and any entity controlling, controlled by or under common control with the Adviser that provides ongoing services to the Fund (“Affiliated Fund Service Provider”), for engagements directly related to the Fund’s operations and financial reporting, during the Fund’s last two full fiscal years.
The tables also show the percentage of fees subject to the pre-approval exception. The pre-approval exception for services provided to the Adviser and any Affiliated Fund Service Provider (other than audit, review or attest services) waives the pre-approval requirement if: (A) the aggregate amount of all such services provided constitutes no more than 5% of the total amount of revenues paid to PricewaterhouseCoopers LLP by the Fund, the Adviser and Affiliated Fund Service Providers during the fiscal year in which the services are provided that would have to be pre-approved by the Audit Committee; (B) the Fund did not recognize the services as non-audit services at the time of the engagement; and (C) the services are promptly brought to the Audit Committee’s attention, and the Committee (or its delegate) approves the services before the Fund’s audit is completed.
Fiscal Year Ended | Audit-Related Fees Billed to Adviser and Affiliated Fund Service Providers | Tax Fees Billed to Adviser and Affiliated Fund Service Providers | All Other Fees Billed to Adviser and Affiliated Fund Service Providers | |||||||||
December 31, 2021 | $ | 0 | $ | 0 | $ | 0 | ||||||
|
|
|
|
|
| |||||||
| ||||||||||||
Percentage approved pursuant to pre-approval exception | 0 | % | 0 | % | 0 | % | ||||||
|
|
|
|
|
| |||||||
| ||||||||||||
December 31, 2020 | $ | 0 | $ | 0 | $ | 0 | ||||||
|
|
|
|
|
| |||||||
| ||||||||||||
Percentage approved pursuant to pre-approval exception | 0 | % | 0 | % | 0 | % | ||||||
|
|
|
|
|
| |||||||
NON-AUDIT SERVICES
The following table shows the amount of fees that PricewaterhouseCoopers LLP billed during the Fund’s last two full fiscal years for non-audit services. The Audit Committee is required to pre-approve non-audit services that PricewaterhouseCoopers LLP provides to the Adviser and any Affiliated Fund Services Provider, if the engagement related directly to the Fund’s operations and financial reporting (except for those subject to the pre-approval exception described above). The Audit Committee requested and received information from PricewaterhouseCoopers LLP about any non-audit services that PricewaterhouseCoopers LLP rendered during the Fund’s last fiscal year to the Adviser and any Affiliated Fund Service Provider. The Committee considered this information in evaluating PricewaterhouseCoopers LLP’s independence.
Fiscal Year Ended | Total Non-Audit Fees Billed to Fund | Total Non-Audit Fees billed to Adviser and Affiliated Fund Service Providers (engagements related directly to the operations and financial reporting of the Fund) | Total Non-Audit Fees billed to Adviser and Affiliated Fund Service Providers (all other engagements) | Total | ||||||||||||
December 31, 2021 | $ | 5,800 | $ | 0 | $ | 0 | $ | 5,800 | ||||||||
December 31, 2020 | $ | 112,140 | $ | 0 | $ | 0 | $ | 112,140 | ||||||||
“Non-Audit Fees billed to Fund” for both fiscal year ends represent “Tax Fees” and “All Other Fees” billed to Fund in their respective amounts from the previous table.
Less than 50 percent of the hours expended on the principal accountant’s engagement to audit the registrant’s financial statements for the most recent fiscal year were attributed to work performed by persons other than the principal accountant’s full-time, permanent employees.
Audit Committee Pre-Approval Policies and Procedures. Generally, the Audit Committee must approve (i) all non-audit services to be performed for the Fund by the Fund’s independent accountants and (ii) all audit and non-audit services to be performed by the Fund’s independent accountants for the Affiliated Fund Service Providers with respect to operations and financial reporting of the Fund. Regarding tax and research projects conducted by the independent accountants for the Fund and Affiliated Fund Service Providers (with respect to operations and financial reports of the Fund) such engagements will be (i) pre-approved by the Audit Committee if they are expected to be for amounts greater than $10,000; (ii) reported to the Audit Committee chair for her verbal approval prior to engagement if they are expected to be for amounts under $10,000 but greater than $5,000; and (iii) reported to the Audit Committee at the next Audit Committee meeting if they are expected to be for an amount under $5,000.
ITEM 5. AUDIT COMMITTEE OF LISTED REGISTRANTS.
The registrant’s Board has a separately designated Audit Committee established in accordance with Section 3(a)(58)(A) of the Securities Exchange Act of 1934, as amended (15 U.S.C. 78c(a)(58)(A)). As of the end of the period covered by this report, the members of the audit committee are Jack B. Evans, William C. Hunter, John K. Nelson, Judith M. Stockdale, Albin F. Moschner and Carole E. Stone, Chair.
ITEM 6. SCHEDULE OF INVESTMENTS.
(a) See Portfolio of Investments in Item 1.
(b) Not applicable.
ITEM7. DISCLOSURE OF PROXY VOTING POLICIES AND PROCEDURES FOR CLOSED-END MANAGEMENT INVESTMENT COMPANIES.
Proxy Voting Guidelines
The Trust has adopted policies and procedures to govern the Fund’s voting of proxies of portfolio companies. The Trust seeks to use proxy voting as a tool to promote positive returns for long-term shareholders. The Trust believes that sound corporate governance practices and responsible corporate behavior create the framework from which public companies can be managed in the long-term interests of shareholders.
As a general matter, the Trust’s Board has delegated to Teachers Advisors responsibility for voting proxies of the Fund’s portfolio companies in accordance with Trust’s Board approved Guidelines for voting proxy proposals are articulated in the TIAA Policy Statement on Responsible Investing, attached as an Appendix.
Teachers Advisors has a dedicated team of professionals responsible for reviewing and voting proxies. In analyzing a proposal, in addition to exercising their professional judgment, these professionals utilize various sources of information to enhance their ability to evaluate the proposal. These sources may include research from third party proxy advisory firms and other consultants, various corporate governance-focused organizations, related publications and TIAA investment professionals. Based on their analysis of proposals and guided by the TIAA Policy Statement on Responsible Investing, these professionals then vote in a manner intended solely to advance the best interests of the Funds’ shareholders. Occasionally, when a proposal relates to issues not addressed in the TIAA Policy Statement on Responsible Investing, Teachers Advisors may seek guidance from the Trust’s Board or a designated committee thereof.
The Trust and Teachers Advisors believes that they have implemented policies, procedures and processes designed to prevent conflicts of interest from influencing proxy voting decisions. These include (i) oversight by TIAA’s Board of Trustees and or a designated committee thereof; (ii) a clear separation of proxy voting functions from external client relationship and sales functions; and (iii) the active monitoring of required annual disclosures of potential conflicts of interest by individuals who have direct roles in executing or influencing the Funds’ proxy voting (e.g., Teachers Advisors’ proxy voting professionals, a Trustee, or a senior executive of the Trust, Teachers Advisors or Teachers Advisors’ affiliates) by Teachers Advisors’ legal and compliance professionals.
There could be rare instances in which an individual who has a direct role in executing or influencing the Funds’ proxy voting (e.g., Teachers Advisors’ proxy voting professionals, a Trustee or a senior executive of the Trust, Teachers Advisors or Teachers Advisors’ affiliates) is either a director or executive of a portfolio company or may have some other association with a portfolio company. In such cases, this individual is required to recuse himself or herself from all decisions related to proxy voting for that portfolio company.
A record of all proxy votes cast for the Funds for the 12-month period ended June 30 can be obtained, free of charge, at www.tiaa.org, and on the SEC’s website at www.sec.gov.
ITEM 8. PORTFOLIO MANAGERS OF CLOSED-END MANAGEMENT INVESTMENT COMPANIES
Nuveen Fund Advisors, LLC (“NFALLC”) is the registrant’s investment adviser (NFALLC is also referred to as the “Adviser”.) NFALLC is responsible for the selection and on-going monitoring of the Fund’s investment portfolio, managing the Fund’s business affairs and providing certain clerical, bookkeeping and administrative services. The Adviser has engaged Teachers Advisors LLC (“Teachers Advisors”) also referred to as the (“Sub-Adviser”) since October 14, 2019, as sub-adviser to provide discretionary investment advisory services. The following section provides information on the portfolio managers of the Sub-Adviser.
| Item 8(a)(1). | PORTFOLIO MANAGER BIOGRAPHIES |
As of the date of filing this report, the following individuals at the Sub-Adviser (the “Portfolio Managers”) have primary responsibility for the day-to-day implementation of the Fund’s investment strategy.
Aashh Parekh (a “Portfolio Manager”) is a portfolio manager for Nuveen’s global fixed income and a member of the securitized sector team, specializing in asset-backed securities. He manages portfolios across a variety of asset-backed transaction (ABS) types, including Consumer ABS, Commercial ABS, CDOs/CLOs, and insurance-linked securities as well as other esoteric securitizations. Prior to joining the firm in 2005, he held a variety of analyst roles in the telecom industry. Aashh graduated with a B.S. in Economics and International Business from Pennsylvania State University and an M.B.A from the University of North Carolina at Chapel Hill. He is a member of the CFA Institute and a board member of the Structured Finance Industry Group.
Nicholas Travaglino (a “Portfolio Manager”) is a portfolio manager for Nuveen’s global fixed income team and leads the securitized sector team, which selects residential mortgage-backed, commercial mortgage-backed and asset-backed securities for all portfolios. He is also the co-manager of the Inflation-Linked Bond strategies. Nick is also a member of the Investment Committee, which establishes investment policy for all global fixed income products. Prior to joining the firm in 2014, Nicholas worked for Royal Bank of Canada Capital Markets, where he managed a $2 billion Agency MBS position within RBC’s proprietary trading unit. He also worked for Citigroup Global Markets, where he was responsible for positioning and trading Citi’s long duration CMO book. Nicholas began his career in portfolio management at Freddie Mac and entered the investment industry since 1997.
Stephen Virgilio (a “Portfolio Manager”) is a trader for Nuveen’s global fixed income team and member of the securitized sector team. He is responsible for managing the organization’s structured product fixed income best execution initiatives, along with trading ABS, CMBS and Non-Agency MBS securities in both the primary and secondary markets. Prior to joining the firm in 2007, he worked at Standard & Poor’s providing securities pricing evaluations on securitized products, and at Citigroup Global Markets where he was a member of the asset backed finance group working on the origination and structuring of consumer ABS debt transactions.
| Item 8(a)(2). | OTHER ACCOUNTS MANAGED BY PORTFOLIO MANAGERS |
In addition to serving as portfolio managers to the Fund, the portfolio managers are also primarily responsible for the day-to-day portfolio management of the following accounts. Information is provided as of December 31, 2021.
Portfolio Manager | Type of Account Managed | Number of Accounts | Assets | Number of Accounts with Performance- Based Fees | Assets of Accounts with Performance- Based Fees | |||||||||||||
Aashh Parekh | Registered Investment Companies | 1 | $ | 135 million | 0 | $ | 0 | |||||||||||
| Other Pooled Investment Vehicles | 0 | �� | 0 | 0 | 0 | |||||||||||||
| Other Accounts | 0 | 0 | 0 | 0 | ||||||||||||||
Nicholas Travaglino | Registered Investment Companies | 3 | $ | 12,483 billion | 0 | 0 | ||||||||||||
| Other Pooled Investment Vehicles | 0 | 0 | 0 | 0 | ||||||||||||||
| Other Accounts | 3 | $ | 1,514 billion | 0 | 0 | |||||||||||||
Stephen Virgilio | Registered Investment Companies | 0 | 0 | 0 | 0 | |||||||||||||
| Other Pooled Investment Vehicles | 0 | 0 | 0 | 0 | ||||||||||||||
| Other Accounts | 0 | 0 | 0 | 0 | ||||||||||||||
POTENTIAL MATERIAL CONFLICTS OF INTEREST
Certain portfolio managers of the Fund also manage other registered investment companies or unregistered investment pools and investment accounts, including accounts for TIAA, its affiliated investment advisers, or other client or proprietary accounts (collectively, “Accounts”), which may raise potential conflicts of interest. Teachers Advisors and its affiliated investment advisers have put in place policies and procedures designed to mitigate any such conflicts. Additionally, TIAA or its affiliates, may be involved in certain investment opportunities that have the effect of restricting or limiting the Fund’s participation in such investment opportunities. Such conflicts and mitigating policies and procedures include the following:
TIAA or its affiliates, including Nuveen and Teachers Advisors, sponsor an array of financial products for retirement and other investment goals, and provide services worldwide to a diverse customer base. Accordingly, from time to time, the Fund may be restricted from purchasing or selling securities, or from engaging in other investment activities because of regulatory, legal or contractual restrictions that arise due to an Account’s investments and/or the internal policies of TIAA or its affiliates, designed to comply with such restrictions. As a result, there may be periods, for example, when Teachers Advisors will not initiate or recommend certain types of transactions in certain securities or instruments with respect to which investment limits have been reached.
The investment activities of TIAA or its affiliates, may also limit the investment strategies and rights of the Fund. For example, in certain circumstances where the Fund invests in securities issued by companies that operate in certain regulated industries, in certain emerging or international markets, or are subject to corporate or regulatory ownership definitions, or invest in certain futures and derivative transactions, there may be limits on the aggregate amount invested by TIAA or its affiliates, for the Fund and Accounts that may not be exceeded without the grant of a license or other regulatory or corporate consent. If certain aggregate ownership thresholds are reached or certain transactions undertaken, the ability of Teachers Advisors, on behalf of the Fund or Accounts, to purchase or dispose of investments or exercise rights or undertake business transactions may be restricted by regulation or otherwise impaired. As a result, Teachers Advisors, on behalf of the Fund or Accounts, may limit purchases, sell existing investments, or otherwise restrict or limit the exercise of rights (including voting rights) when Teachers Advisors, in its sole discretion, deems it appropriate in light of potential regulatory or other restrictions on ownership or other consequences resulting from reaching investment thresholds.
Conflicting Positions. Investment decisions made for the Fund may differ from, and may conflict with, investment decisions made by Teachers Advisors or any of its affiliated investment advisers for Accounts due to differences in investment objectives, investment strategies, account benchmarks, client risk profiles and other factors. As a result of such differences, if an Account were to sell a significant position in a security while the Fund maintained its position in that security, the market price of such security could decrease and adversely impact the Fund’s performance. In the case of a short sale, the selling Account would benefit from any decrease in price.
Conflicts may also arise in cases where one or more Funds or Accounts are invested in different parts of an issuer’s capital structure. For example, a Fund (or an Account) could acquire debt obligations of a company while an Account (or a Fund) acquires an equity investment in the same company. In negotiating the terms and conditions of any such investments, Teachers Advisors (or, in the case of an Account, an affiliated investment adviser) may find that the interests of the debt-holding fund (or Account) and the
equity-holding Account (or Fund) may conflict. If that issuer encounters financial problems, decisions over the terms of the workout could raise conflicts of interest (including, for example, conflicts over proposed waivers and amendments to debt covenants). For example, a debt-holding Fund (or Account) may be better served by a liquidation of an issuer in which they could be paid in full, while an equity-holding Account (or Fund) might prefer a reorganization of the issuer that would have the potential to retain value for the equity holders. As another example, holders of an issuer’s senior securities may be able to act to direct cash flows away from junior security holders, and both the junior and senior security holders may be a Fund (or an Account). Any of the foregoing conflicts of interest will be discussed and resolved on a case-by-case basis pursuant to policies and procedures designed to mitigate any such conflicts. Any such discussions will factor in the interests of the relevant parties and applicable laws and regulations. Teachers Advisors may seek to avoid such conflicts, and, as a result, Teachers Advisors may choose not to make such investments on behalf of the Fund, which may adversely affect the Fund’s performance if similarly attractive opportunities are not available or identified.
Allocation of Investment Opportunities. Even where Accounts have similar investment mandates as the Fund, Teachers Advisors or its affiliated investment advisers may determine that investment opportunities, strategies or particular purchases or sales are appropriate for one or more Accounts, but not for the Fund, or are appropriate for the Fund but in different amounts, terms or timing than is appropriate for an Account. As a result, the amount, terms or timing of an investment by the Fund may differ from, and performance may be lower than, investments and performance of an Account.
Aggregation and Allocation of Orders. Teachers Advisors and its affiliated investment advisers may aggregate orders of the Funds and Accounts, in each case consistent with the applicable adviser’s policy to seek best execution for all orders. Although aggregating orders is a common means of reducing transaction costs for participating Accounts and Funds, Teachers Advisors or its affiliated investment advisers may be perceived as causing one Fund or Account to participate in an aggregated transaction in order to increase Teachers Advisors’ or its affiliated investment advisers’ overall allocation of securities in that transaction or future transactions. Allocations of aggregated trades may also be perceived as creating an incentive for Teachers Advisors to disproportionately allocate securities expected to increase in value to certain Accounts at the expense of a Fund. In addition, a Fund may bear the risk of potentially higher transaction costs if aggregated trades are only partially filled or if orders are not aggregated at all.
Teachers Advisors and its affiliated investment advisers have adopted procedures designed to mitigate the foregoing conflicts of interest by treating each Fund and Account they advise fairly and equitably over time in the allocation of investment opportunities and the aggregation and allocation of orders. The procedures also are designed to mitigate conflicts in potentially inconsistent trading and provide guidelines for trading priority. Moreover, Teachers Advisors’ or its affiliated investment advisers’ trading activities are subject to supervisory review and compliance monitoring to help address and mitigate conflicts of interest and ensure that Funds and Accounts are being treated fairly and equitably over time.
For example, in allocating investment opportunities, a portfolio manager considers an Account’s or Fund’s investment objectives, investment restrictions, cash position, need for liquidity, sector concentration and other objective criteria. In addition, orders for the same single security are generally aggregated with other orders for the same single security received at the same time. If aggregated orders are fully executed, each participating Account or Fund is allocated its pro rata share on an average price and trading cost basis. In the event the order is only partially filled, each participating Account or Fund receives a pro rata share. Portfolio managers are also subject to restrictions on potentially inconsistent trading of single securities, although a portfolio manager may sell a single security short if the security is included in an Account’s or Fund’s benchmark and the portfolio manager is underweight in that security relative to the applicable Account’s or Fund’s benchmark. Moreover, the procedures set forth guidelines under which trading for long sales of single securities over short sales of the same or closely related securities are monitored to ensure that the trades are treated fairly and equitably. Additionally, the Funds’ portfolio managers’ decisions for executing those trades are also monitored.
Teachers Advisors’ procedures also address basket trades (trades in a wide variety of securities—on average approximately 100 different issuers) used in quantitative strategies. However, basket trades are generally not aggregated or subject to the same types of restrictions on potentially inconsistent trading as single-security trades because basket trades are tailored to a particular index or model portfolio based on the risk profile of a particular Account or Fund pursuing a particular quantitative strategy. In addition, basket trades are not subject to the same monitoring as single-security trades because an automated and systematic process is used to execute trades; however, the Funds’ portfolio managers’ decisions for executing those trades are monitored.
Research. Teachers Advisors allocates brokerage commissions to brokers who provide execution and research services for the Funds and some or all of Teachers Advisors’ other clients. Such research services may not always be utilized in connection with the Funds or other client Accounts that may have provided the commission or a portion of the commission paid to the broker
providing the services. Teachers Advisors is authorized to pay, on behalf of the Funds, higher brokerage fees than another broker might have charged in recognition of the value of brokerage or research services provided by the broker. Teachers Advisors has adopted procedures with respect to these so-called “soft dollar” arrangements, including the use of brokerage commissions to pay for brokers’ in-house and non-proprietary research, the process for allocating brokerage, and Teachers Advisors’ practices regarding the use of third-party soft dollars.
IPO Allocation. Teachers Advisors has adopted procedures designed to ensure that it allocates initial public offerings to the Funds and Teachers Advisors’ other clients in a fair and equitable manner, consistent with its fiduciary obligations to its clients.
Compensation. The compensation paid to Teachers Advisors for managing Funds, as well as certain other clients, is based on a percentage of assets under management, whereas the compensation paid to Teachers Advisors for managing certain other clients is based on cost. However, no client currently pays Teachers Advisors a performance-based fee. Nevertheless, Teachers Advisors may be perceived as having an incentive to allocate securities that are expected to increase in value to accounts in which Teachers Advisors has a proprietary interest or to certain other accounts in which Teachers Advisors receives a larger asset-based fee.
| Item 8(a)(3). | FUND MANAGER COMPENSATION |
As of the most recently completed fiscal year end, the primary portfolio managers’ compensation is as follows:
Fixed-income portfolio managers are compensated through a combination of base salary, annual performance awards, long-term compensation awards and, for certain portfolio managers, equity-like performance based plans. Currently, the annual performance awards and long-term compensation awards are determined using both quantitative (75%) and qualitative factors (25%) including, but not limited to, Investment Ratio, ranking versus Morningstar peers, risk-adjusted variation in return vs. benchmark and, management/peer reviews.
The variable component of a portfolio manager’s compensation is remunerated as: (1) a current year cash bonus; and (2) a long-term performance award, which is on a 3-year cliff vesting cycle and (3) an equity-like profits interest plan. Fifty percent (50%) of the long-term award is based on the Fund(s) managed by the portfolio manager during the 3-year vesting period, while the value of the long-term award is based on the performance of the TIAA organization as a whole. The equity-like profits interest vests over time and entitles participants to a percentage of Teachers Advisors’ annual profits and the profits of its affiliate Nuveen Asset Management. The equity-like profits interest is allocated to individual portfolio managers based on such person’s overall contribution to Teachers Advisors and Nuveen Asset Management.
Risk-adjusted investment performance is calculated, where records are available, over one, three, and five years, each ending December 31. For each year, the gross excess return (on a before-tax basis) of a portfolio manager’s mandate(s) is calculated versus each mandate’s assigned benchmark. For managers with less than a 5-year track record, there is a 50% weighting for the 1-year return and a 50% weighting for the 3-year return. Please see the Funds’ Prospectuses for more information regarding their benchmark indices. An Information Ratio is then calculated utilizing the gross excess return in the numerator and the 52-week realized Active Risk (tracking error), in the denominator to generate risk-adjusted investment performance. Investment performance relative to industry peers is evaluated using Morningstar percentile rankings with equal weighting to each of the 1-, 3-, and 5-year rankings.
Utilizing the quantitative and qualitative factors discussed above, total compensation is calculated and then compared to the compensation data obtained from surveys that include comparable investment firms. It should be noted that the total compensation can be increased or decreased based on the performance of the fixed-income group as a unit and the relative success of the TIAA organization in achieving its financial and operational objectives.
| Item 8(a)(4). | OWNERSHIP OF JLS SECURITIES AS OF DECEMBER 31, 2021 |
Name of Portfolio Manager | None | $1 - $10,000 | $10,001- $50,000 | $50,001- $100,000 | $100,001- $500,000 | $500,001- $1,000,000 | Over $1,000,000 | |||||||||||||||||||||
Aashh Parekh | X | |||||||||||||||||||||||||||
Nicholas Travaglino | X | |||||||||||||||||||||||||||
Stephen Virgilio | X | |||||||||||||||||||||||||||
ITEM 9. PURCHASES OF EQUITY SECURITIES BY CLOSED-END MANAGEMENT INVESTMENT COMPANY AND AFFILIATED PURCHASERS.
Not applicable.
ITEM 10. SUBMISSION OF MATTERS TO A VOTE OF SECURITY HOLDERS.
There have been no material changes to the procedures by which shareholders may recommend nominees to the registrant’s Board implemented after the registrant last provided disclosure in response to this Item.
ITEM 11. CONTROLS AND PROCEDURES.
| (a) | The registrant’s principal executive and principal financial officers, or persons performing similar functions, have concluded that the registrant’s disclosure controls and procedures (as defined in Rule 30a-3(c) under the Investment Company Act of 1940, as amended (the “1940 Act”) (17 CFR 270.30a-3(c))) are effective, as of a date within 90 days of the filing date of this report that includes the disclosure required by this paragraph, based on their evaluation of the controls and procedures required by Rule 30a-3(b) under the 1940 Act (17 CFR 270.30a-3(b)) and Rules 13a-15(b) or 15d-15 (b) under the Securities Exchange Act of 1934, as amended (the “Exchange Act”) (17 CFR 240.13a-15(b) or 240.15d-15 (b)). |
| (b) | There were no changes in the registrant’s internal control over financial reporting (as defined in Rule 30a-3(d) under the 1940 Act (17 CFR 270.30a-3(d)) that occurred during the period covered by this report that has materially affected, or is reasonably likely to materially affect, the registrant’s internal control over financial reporting. |
ITEM 12. DISCLOSURE OF SECURITIES LENDING ACTIVITIES FOR CLOSED-END MANAGEMENT INVESTMENT COMPANIES.
Not applicable.
ITEM 13. EXHIBITS.
File the exhibits listed below as part of this Form.
(a)(1) Any code of ethics, or amendment thereto, that is the subject of the disclosure required by Item 2, to the extent that the registrant intends to satisfy the Item 2 requirements through filing of an exhibit: Not applicable because the code is posted on registrant’s website at www.nuveen.com/fund-governance and there were no amendments during the period covered by this report. (To view the code, click on Code of Conduct.)
(a)(3) Any written solicitation to purchase securities under Rule 23c-1 under the 1940 Act (17 CFR 270.23c-1) sent or given during the period covered by the report by or on behalf of the registrant to 10 or more persons. Not applicable.
(a)(4) Change in registrant’s independent public accountant. Not applicable.
SIGNATURES
Pursuant to the requirements of the Securities Exchange Act of 1934 and the Investment Company Act of 1940, the registrant has duly caused this report to be signed on its behalf by the undersigned, thereunto duly authorized.
(Registrant) Nuveen Mortgage and Income Fund
| By (Signature and Title) | /s/ Mark L. Winget | |||
| Mark L. Winget | ||||
| Vice President and Secretary | ||||
| Date: March 9, 2022 | ||||
Pursuant to the requirements of the Securities Exchange Act of 1934 and the Investment Company Act of 1940, this report has been signed below by the following persons on behalf of the registrant and in the capacities and on the dates indicated.
| By (Signature and Title) | /s/ David J. Lamb | |||
| David J. Lamb | ||||
| Chief Administrative Officer | ||||
| (principal executive officer) | ||||
| Date: March 9, 2022 | ||||
| By (Signature and Title) | /s/ E. Scott Wickerham | |||
| E. Scott Wickerham | ||||
| Vice President and Controller | ||||
| (principal financial officer) | ||||
| Date: March 9, 2022 | ||||