UNITED STATES
SECURITIES AND EXCHANGE COMMISSION
WASHINGTON, D.C. 20549
________________________
FORM 8-K
________________________
CURRENT REPORT
Pursuant to Section 13 or 15(d) of the
Securities Exchange Act of 1934
Date of Report (Date of earliest event reported): February 17, 2022
____________
R1 RCM Inc.
(Exact Name of Registrant as Specified in Charter)
____________
| | | | | | | | |
| Delaware | 001-34746 | 02-0698101 |
(State or Other Jurisdiction
of Incorporation) | (Commission
File Number) | (IRS Employer
Identification No.) |
| | | | | |
| 434 W. Ascension Way | 84123 |
| 6th Floor |
| Murray |
| Utah |
| (Address of Principal Executive Offices) | (Zip Code) |
Registrant’s telephone number, including area code: (312) 324-7820
(Former Name or Former Address, if Changed Since Last Report)
Check the appropriate box below if the Form 8-K filing is intended to simultaneously satisfy the filing obligation of the registrant under any of the following provisions:
☒ Written communications pursuant to Rule 425 under the Securities Act (17 CFR 230.425)
☐ Soliciting material pursuant to Rule 14a-12 under the Exchange Act (17 CFR 240.14a-12)
☐ Pre-commencement communications pursuant to Rule 14d-2(b) under the Exchange Act (17 CFR 240.14d-2(b))
☐ Pre-commencement communications pursuant to Rule 13e-4(c) under the Exchange Act (17 CFR 240.13e-4(c))
Securities registered pursuant to Section 12(b) of the Act:
| | | | | | | | |
| Title of each class | Trading Symbol(s) | Name of each exchange on which registered |
| Common stock, par value $0.01 per share | RCM | NASDAQ |
Indicate by check mark whether the registrant is an emerging growth company as defined in Rule 405 of the Securities Act of 1933 (17 CFR §230.405) or Rule 12b-2 of the Securities Exchange Act of 1934 (17 CFR §240.12b-2).
Emerging growth company ☐
If an emerging growth company, indicate by check mark if the registrant has elected not to use the extended transition period for complying with any new or revised financial accounting standards provided pursuant to Section 13(a) of the Exchange Act. ☐
Item 2.02 Results of Operations and Financial Condition
On February 17, 2022, R1 RCM Inc. (the “Company”) announced its financial results for the three months and fiscal year ended December 31, 2021. The full text of the press release issued in connection with the announcement is furnished as Exhibit 99.1 to this Current Report on Form 8-K.
Item 7.01 Regulation FD Disclosure
The Company is hosting an investor conference call on February 17, 2022 regarding its financial results for the three months and fiscal year ended December 31, 2021. The slide presentation to be used in conjunction with the investor conference call is furnished as Exhibit 99.2 to this Current Report on Form 8-K and will be posted on the Company’s website.
The information in this Form 8-K (including Exhibits 99.1 and 99.2) shall not be deemed “filed” for purposes of Section 18 of the Securities Exchange Act of 1934 (the “Exchange Act”) or otherwise subject to the liabilities of that section, nor shall it be deemed incorporated by reference in any filing under the Securities Act of 1933 or the Exchange Act, except as expressly set forth by specific reference in such a filing.
Additional Information and Where to Find It
This Current Report on Form 8-K includes information regarding the proposed transaction between the Company and Cloudmed, a leader in Revenue IntelligenceTM solutions for healthcare providers. This Current Report on Form 8-K does not constitute an offer to sell or exchange, or the solicitation of an offer to buy or exchange, any securities, nor shall there be any sale of securities in any jurisdiction in which such offer, sale or exchange would be unlawful prior to registration or qualification under the securities laws of any such jurisdiction. The Company intends to file a registration statement on Form S-4 with the U.S. Securities and Exchange Commission (the “SEC”), which will include a document that serves as a prospectus and proxy statement of the Company, referred to as a proxy statement / prospectus. A proxy statement / prospectus will be sent to all shareholders of the Company. The Company also will file other documents regarding the proposed transaction with the SEC. Before making any voting decision, investors and security holders of the Company are urged to read the registration statement, the proxy statement / prospectus, and all other relevant documents filed or that will be filed with the SEC in connection with the proposed transaction as they become available because they will contain important information about the proposed transaction.
Investors and security holders will be able to obtain free copies of the registration statement, the proxy statement / prospectus, and all other relevant documents filed or that will be filed with the SEC by the Company through the website maintained by the SEC at www.sec.gov.
The documents filed by the Company with the SEC also may be obtained free of charge at the Company’s website at www.r1rcm.com or upon written request to 434 W. Ascension Way, 6th Floor, Murray, Utah 84123.
Participants in Solicitation
The Company and its directors and executive officers may be deemed to be participants in the solicitation of proxies from the Company’s shareholders in connection with the proposed transaction. A list of the names of such directors and executive officers and information regarding their interests in the proposed transaction will be contained in the proxy statement / prospectus when available. You may obtain free copies of these documents as described in the preceding paragraph.
Forward-Looking Statements
This Current Report on Form 8-K includes information that may constitute “forward-looking statements” made pursuant to the safe harbor provisions of the Private Securities Litigation Reform Act of 1995 and Section 21E of the Securities Exchange Act of 1934, as amended. Forward-looking statements generally relate to future events and relationships, plans, future growth and future performance, including, but not limited to, statements about the expected timing, completion and effects of the proposed transaction, the Company's strategic initiatives, capital plans, costs, ability to successfully implement new technologies, future financial and operational performance, and liquidity. These statements are often identified by the use of words such as “anticipate,” “believe,” “estimate,” “expect,” “intend,” “designed,” “may,” “plan,” “predict,” “project,” “target,” “contemplate,” “would,” “seek,” “see,” and similar expressions or variations or negatives of these words, although not all forward-looking statements contain these identifying words. These statements are based on various assumptions, whether or not identified in this presentation, and on the current expectations of the Company’s and Cloudmed’s management and are not predictions of actual performance. These forward-looking statements are provided for illustrative purposes only and are not intended to serve as, and must not be relied on by any investor as, a guarantee, assurance, prediction or definitive statement of fact or probability. Actual outcomes and results may differ materially from those contemplated by these forward-looking statements as a result of uncertainties, risks, and changes in circumstances, including but not limited to risk and uncertainties related to: (i) the Company's ability to retain existing customers or acquire new customers; (ii) the development of markets for the Company's revenue cycle management offering; (iii) variability in the lead time of prospective customers; (iv) competition within the market; (v) breaches or failures of the Company's information security measure or unauthorized access to a customer's data; (vi) delayed or unsuccessful implementation of the Company's technologies or services, or unexpected implementation costs; (vii) disruptions in or damages to the Company's global business services centers and third-party operated data centers; (viii) the impact of the COVID-19 pandemic on the Company's business, operating results, and financial condition; (ix) the ability of the parties to consummate the proposed transaction in a timely manner or at all; (x) satisfaction of the conditions precedent to the consummation of the proposed transaction, including the receipt of required regulatory and shareholder approvals; and (xi) the Company’s ability to timely and successfully achieve the anticipated benefits and potential synergies of the proposed transaction. Additional risks and uncertainties that could cause actual outcomes and results to differ materially from those contemplated by the forward-looking statements are included under the heading “Risk Factors” in the Company's most recent annual report on Form 10-K, quarterly reports on Form 10-Q, the registration statement on Form S-4 and the proxy statement included therein that will be filed relating to the transactions described herein, and any other periodic reports that the Company files with the SEC. The foregoing list of factors is not exhaustive. All forward-looking statements included herein are expressly qualified in their entirety by these cautionary statements as of the date hereof and involve many risks and uncertainties that could cause the Company's actual results to differ materially from those expressed or implied in the Company's forward-looking statements. Subsequent events and developments, including actual results or changes in the Company's assumptions, may cause the Company's views to change. The Company assumes no obligation and does not intend to update these forward-looking statements, except as required by law. You are cautioned not to place undue reliance on such forward-looking statements.
This Current Report on Form 8-K shall not constitute a solicitation of a proxy, consent or authorization with respect to any securities or in respect of the proposed transactions.
Item 9.01 Financial Statements and Exhibits
| | | | | | | | |
| (d) | Exhibit Number | Description |
| 99.1 | Press Release dated February 17, 2022 |
| 99.2 | Presentation dated February 17, 2022 |
| 104 | Cover Page Interactive Data File - the cover page iXBRL tags are embedded within the Inline XBRL document |
SIGNATURES
Pursuant to the requirements of the Securities Exchange Act of 1934, the Registrant has duly caused this report to be signed on its behalf by the undersigned hereunto duly authorized.
| | | | | | | | | | | |
| | R1 RCM INC. |
| | | |
| Date: February 17, 2022 | | |
| | | |
| | By: /s/ Rachel Wilson |
| | Name: Rachel Wilson |
| | Title: Chief Financial Officer |
R1 RCM Reports Fourth Quarter and Full Year 2021 Results
Murray, Utah - February 17, 2022 - R1 RCM Inc. (NASDAQ: RCM), a leading provider of technology-driven solutions that transform the patient experience and financial performance of healthcare providers, today announced results for the three months and year ended December 31, 2021.
Fourth Quarter 2021 Results:
•Revenue of $398.9 million, up $70.5 million or 21.5% compared to the same period last year
•GAAP net income of $36.0 million, down $42.6 million or 54.2% compared to the same period last year due to a $55.7 million gain on business disposition in the fourth quarter of 2020. Excluding this gain, GAAP net income would have increased 57.2% compared to the same period last year.
•Adjusted EBITDA of $95.1 million, up $32.4 million or 51.7% compared to the same period last year
Full Year 2021 Results:
•Revenue of $1,474.6 million, up $203.8 million or 16.0% compared to 2020
•GAAP net income of $97.2 million, down $19.9 million or 17.0% compared to 2020 due to a $55.7 million gain on business disposition in 2020. Excluding this gain, GAAP net income would have increased 58.3% compared to 2020.
•Adjusted EBITDA of $343.6 million, up $103.6 million or 43.2% compared to 2020
“I am very pleased with the progress our team made in 2021. We delivered financial results significantly ahead of our expectations at the start of the year, grew our customer base, and launched innovative new solutions which will better serve healthcare providers, their patients, and the communities they serve,” said Joe Flanagan, president and chief executive officer of R1. “We are optimistic about our prospects and continued strong growth in 2022, fueled by market demand, our ongoing innovation, and the pending acquisition of Cloudmed.”
“Our 2021 results once again demonstrate strong commitment and execution by our team. Our cash generation profile improved significantly in 2021 and we applied a balanced approach to capital deployment, enabling us to fund investments to drive sustainable long-term growth for the company,” added Rachel Wilson, chief financial officer and treasurer. “We enter 2022 with strong momentum across the business and are positioning the company to meet customer demand while delivering on our commitments to our stakeholders.”
2022 Outlook
For 2022, on a standalone basis, R1 expects to generate:
•Revenue of between $1,660 million and $1,700 million
•GAAP operating income of $200 million to $220 million
•Adjusted EBITDA of $385 million to $405 million
The company plans to update guidance after completion of the Cloudmed acquisition, which is expected to occur in the second quarter of 2022.
Conference Call and Webcast Details
R1’s management team will host a conference call today at 8:00 a.m. Eastern Time to discuss its financial results and business outlook. To participate, please dial 888-330-2022 (646-960-0690 outside the U.S. and Canada) using conference code number 5681952. A live webcast and replay of the call will be available at the Investor Relations section of the Company’s web site at ir.r1rcm.com.
Non-GAAP Financial Measures
In order to provide a more comprehensive understanding of the information used by R1’s management team in financial and operational decision making, the Company supplements its GAAP consolidated financial statements with certain non-GAAP financial performance measures, including adjusted EBITDA, non-GAAP cost of services, non-GAAP selling, general and administrative expenses, and net debt. Adjusted EBITDA is defined as GAAP net income before net interest income/expense, income tax provision/benefit, depreciation and amortization expense, share-based compensation expense, expense arising from debt extinguishment, strategic initiatives costs, customer employee transition and restructuring expense, and certain other items. Non-GAAP cost of services is defined as GAAP cost of services less share-based compensation expense and depreciation and amortization expense attributed to cost of services. Non-GAAP selling, general and administrative expenses is defined as GAAP selling, general and administrative expenses less share-based compensation expense and depreciation and amortization expense attributed to selling, general and administrative expenses. Net debt is defined as debt less cash and cash equivalents, inclusive of restricted cash. Adjusted EBITDA guidance is reconciled to operating income guidance, the most closely comparable available GAAP measure.
Our board of directors and management team use adjusted EBITDA as (i) one of the primary methods for planning and forecasting overall expectations and for evaluating actual results against such expectations and (ii) a performance evaluation metric in determining achievement of certain executive incentive compensation programs, as well as for incentive compensation programs for employees. Non-GAAP cost of services and non-GAAP selling, general and administrative expenses are used to calculate adjusted EBITDA. Net debt is used as a supplemental measure of our liquidity.
Tables 4 through 9 present a reconciliation of GAAP financial measures to non-GAAP financial measures, including adjusted EBITDA. Non-GAAP measures should be considered in addition to, but not as a substitute for, the information prepared in accordance with GAAP.
Forward Looking Statements
This press release includes information that may constitute “forward-looking statements,” made pursuant to the safe harbor provisions of the Private Securities Litigation Reform Act of 1995. Forward-looking statements relate to future, not past, events and often address our expected future growth, plans, and performance or forecasts. These forward-looking statements are often identified by the use of words such as “anticipate,” “believe,” “designed,” “estimate,” “expect,” “forecast,” “intend,” “may,” “plan,” “predict,” “project,” “target,” “will,” or “would,” and similar expressions or variations, although not all forward-looking statements contain these identifying words. Such forward-looking statements include, among other things, statements about our potential acquisition of Cloudmed, our strategic initiatives, our capital plans, our costs, our ability to successfully implement new technologies, our future financial performance, and our liquidity. Such forward-looking statements are based on management’s current expectations about future events as of the date hereof and involve many risks and uncertainties that could cause our actual results to differ materially from those expressed or implied in our forward-looking statements. Subsequent events and developments, including actual results or changes in our assumptions, may cause our views to change. We do not undertake to update our forward-looking statements except to the extent required by applicable law. Readers are cautioned not to place undue reliance on such forward-looking statements. All forward-looking statements included herein are expressly qualified in their entirety by these cautionary statements. Our actual results and outcomes could differ materially from those included in these forward-looking statements as a result of various factors, including, but not limited to, our ability to retain existing customers or acquire new customers; the development of markets for our revenue cycle management offering; variability in the lead time of prospective customers; failure to consummate the potential Cloudmed acquisition within the expected timeframe or at all; our ability to integrate Cloudmed's business into our operations in a timely and efficient manner; failure to realize the anticipated benefits of the potential Cloudmed acquisition; volatility in our stock price in connection with the announcement of the potential Cloudmed acquisition; competition within the market; breaches or failures of our information security measures or unauthorized access to a customer's data; delayed or unsuccessful implementation of our technologies or services, or unexpected implementation costs; disruptions in or damages to our global business services centers and third-party operated data centers; the impact of the COVID-19 pandemic on our business, operating results, and financial condition; and the factors discussed under the heading “Risk Factors” in our most recent annual report on Form 10-K, our quarterly reports on Form 10-Q, and any other periodic reports that the Company files with the Securities and Exchange Commission.
Additional Information and Where to Find It
This press release includes information regarding the proposed transaction between R1 and Cloudmed, a leader in Revenue IntelligenceTM solutions for healthcare providers. This press release does not constitute an offer to sell or exchange, or the solicitation of an offer to buy or exchange, any securities, nor shall there be any sale of securities in any jurisdiction in which such offer, sale or exchange would be unlawful prior to registration or qualification under the securities laws of any such jurisdiction. R1 intends to file a registration statement on Form S-4 with the U.S. Securities and Exchange Commission (the “SEC”), which will include a document that serves as a prospectus and proxy statement of R1, referred to as a proxy statement / prospectus. A proxy statement / prospectus will be sent to all shareholders of R1. R1 also will file other documents regarding the proposed transaction with the SEC. Before making any voting decision, investors and security holders of R1 are urged to read the registration statement, the proxy statement / prospectus, and all other relevant documents filed or that will be filed with the SEC in connection with the proposed transaction as they become available because they will contain important information about the proposed transaction.
Investors and security holders will be able to obtain free copies of the registration statement, the proxy statement / prospectus, and all other relevant documents filed or that will be filed with the SEC by R1 through the website maintained by the SEC at www.sec.gov.
The documents filed by R1 with the SEC also may be obtained free of charge at our website at www.r1rcm.com or upon written request to 434 W. Ascension Way, 6th Floor, Murray, Utah 84123.
Participants in Solicitation
R1 and its directors and executive officers may be deemed to be participants in the solicitation of proxies from R1’s shareholders in connection with the proposed transaction. A list of the names of such directors and executive officers and information regarding their interests in the proposed transaction will be contained in the proxy statement / prospectus when available. You may obtain free copies of these documents as described in the preceding paragraph.
About R1 RCM
R1 is a leading provider of technology-driven solutions that transform the patient experience and financial performance of healthcare providers. R1’s proven and scalable operating models seamlessly complement a healthcare organization’s infrastructure, quickly driving sustainable improvements to net patient revenue and cash flows while reducing operating costs and enhancing the patient experience. To learn more, visit: r1rcm.com.
Contact:
R1 RCM Inc.
Investor Relations:
Atif Rahim
312-324-5476
investorrelations@r1rcm.com
Media Relations:
Laura Kelly
312-719-3257
media@r1rcm.com
| | | | | | | | | | | | | | |
| Table 1 |
| R1 RCM Inc. |
| Consolidated Balance Sheets |
| (In millions) |
| | (Unaudited) | | |
| | | December 31, |
| | | 2021 | | 2020 |
| Assets | | | | |
| Current assets: | | | | |
| Cash and cash equivalents | | $ | 130.1 | | | $ | 173.8 | |
| | | | |
| Accounts receivable, net of $2.4 million and $3.7 million allowance | | 131.3 | | | 91.3 | |
| Accounts receivable, net of $0.1 million and $0.1 million allowance - related party | | 26.1 | | | 30.9 | |
| Prepaid expenses and other current assets | | 77.2 | | | 59.4 | |
| Total current assets | | 364.7 | | | 355.4 | |
| Property, equipment and software, net | | 94.7 | | | 93.7 | |
| Operating lease right-of-use assets | | 48.9 | | | 57.8 | |
| Non-current portion of deferred contract costs | | 23.4 | | | 19.6 | |
| Intangible assets, net | | 265.4 | | | 171.1 | |
| Goodwill | | 554.7 | | | 375.3 | |
| Non-current deferred tax assets | | 51.8 | | | 73.7 | |
| Non-current portion of restricted cash equivalents | | — | | | 1.0 | |
| Other assets | | 45.7 | | | 41.4 | |
| Total assets | | $ | 1,449.3 | | | $ | 1,189.0 | |
| | | | |
| Liabilities | | | | |
| Current liabilities: | | | | |
| Accounts payable | | $ | 17.7 | | | $ | 18.2 | |
| Current portion of customer liabilities | | 41.5 | | | 16.7 | |
| Current portion of customer liabilities - related party | | 7.9 | | | 15.3 | |
| Accrued compensation and benefits | | 97.0 | | | 51.9 | |
| Current portion of operating lease liabilities | | 13.5 | | | 12.2 | |
| Current portion of long-term debt | | 17.5 | | | 32.3 | |
| Accrued expenses and other current liabilities | | 59.1 | | | 59.7 | |
| Total current liabilities | | 254.2 | | | 206.3 | |
| Non-current portion of customer liabilities | | 3.3 | | | — | |
| Non-current portion of customer liabilities - related party | | 15.4 | | | 16.3 | |
| Non-current portion of operating lease liabilities | | 53.4 | | | 71.0 | |
| Long-term debt | | 754.9 | | | 519.7 | |
| | | | |
| Other non-current liabilities | | 21.4 | | | 36.3 | |
| Total liabilities | | 1,102.6 | | | 849.6 | |
| | | | |
| Preferred stock | | — | | | 251.5 | |
| Stockholders’ equity: | | | | |
| Common stock | | 3.0 | | | 1.4 | |
| Additional paid-in capital | | 628.5 | | | 393.7 | |
| Accumulated deficit | | (64.3) | | | (161.5) | |
| Accumulated other comprehensive loss | | (5.3) | | | (6.5) | |
| Treasury stock | | (215.2) | | | (139.2) | |
| Total stockholders’ equity | | 346.7 | | | 87.9 | |
| Total liabilities and stockholders’ equity | | $ | 1,449.3 | | | $ | 1,189.0 | |
| | | | | | | | | | | | | | | | | | | | | | | | | | |
| Table 2 |
| R1 RCM Inc. |
| Consolidated Statements of Operations |
| (In millions, except share and per share data) |
| | | | |
| | (Unaudited) | | (Unaudited) | | (Unaudited) | | |
| | | Three Months Ended December 31, | | Year Ended December 31, |
| | | 2021 | | 2020 | | 2021 | | 2020 |
| Net operating fees | | $ | 332.0 | | | $ | 271.4 | | | $ | 1,211.8 | | | $ | 1,093.8 | |
| Incentive fees | | 35.8 | | | 27.4 | | | 143.8 | | | 70.6 | |
| Other | | 31.1 | | | 29.6 | | | 119.0 | | | 106.4 | |
| Net services revenue | | 398.9 | | | 328.4 | | | 1,474.6 | | | 1,270.8 | |
| Operating expenses: | | | | | | | | |
| Cost of services | | 304.6 | | | 263.7 | | | 1,162.8 | | | 1,021.1 | |
| Selling, general and administrative | | 32.2 | | | 27.9 | | | 120.0 | | | 102.4 | |
| Other | | 11.9 | | | 24.9 | | | 46.1 | | | 67.3 | |
| Total operating expenses | | 348.7 | | | 316.5 | | | 1,328.9 | | | 1,190.8 | |
| Income from operations | | 50.2 | | | 11.9 | | | 145.7 | | | 80.0 | |
| Gain on business disposition | | — | | | 55.7 | | | — | | | 55.7 | |
| | | | | | | | |
| Net interest expense | | (5.1) | | | (4.3) | | | (18.9) | | | (17.3) | |
| Income before income tax provision (benefit) | | 45.1 | | | 63.3 | | | 126.8 | | | 118.4 | |
| Income tax provision (benefit) | | 9.1 | | | (15.3) | | | 29.6 | | | 1.3 | |
| Net income | | $ | 36.0 | | | $ | 78.6 | | | $ | 97.2 | | | $ | 117.1 | |
| | | | | | | | |
| Net income (loss) per common share: | | | | | | | | |
| Basic | | $ | 0.13 | | | $ | 0.31 | | | $ | (1.86) | | | $ | 0.41 | |
| Diluted | | $ | 0.11 | | | $ | 0.25 | | | $ | (1.86) | | | $ | 0.33 | |
| Weighted average shares used in calculating net income (loss) per common share: | | | | | | | | |
| Basic | | 277,974,898 | | | 117,412,406 | | | 266,183,565 | | | 115,729,645 | |
| Diluted | | 321,412,307 | | | 180,530,133 | | | 266,183,565 | | | 174,573,270 | |
| | | | | | | | | | | | | | | | | | | | | | | | | | |
| Basic: | | | | | | | | |
| Net income | | $ | 36.0 | | | $ | 78.6 | | | $ | 97.2 | | | $ | 117.1 | |
| Less dividends on preferred shares | | — | | | (5.8) | | | (592.3) | | | (22.4) | |
| Less income allocated to preferred shareholders | | — | | | (36.1) | | | — | | | (47.3) | |
| Net income (loss) available/allocated to common shareholders - basic | | $ | 36.0 | | | $ | 36.7 | | | $ | (495.1) | | | $ | 47.4 | |
| Diluted: | | | | | | | | |
| Net income | | $ | 36.0 | | | $ | 78.6 | | | $ | 97.2 | | | $ | 117.1 | |
| Less dividends on preferred shares | | — | | | (5.8) | | | (592.3) | | | (22.4) | |
| Less income allocated to preferred shareholders | | — | | | (28.4) | | | — | | | (37.7) | |
| Net income (loss) available/allocated to common shareholders - diluted | | $ | 36.0 | | | $ | 44.4 | | | $ | (495.1) | | | $ | 57.0 | |
| | | | | | | | | | | | | | |
| Table 3 |
| R1 RCM Inc. |
| Consolidated Statements of Cash Flows |
| (In millions) |
| | (Unaudited) | | |
| | | Year Ended December 31, |
| | | 2021 | | 2020 |
| Operating activities | | | | |
| Net income | | $ | 97.2 | | | $ | 117.1 | |
| Adjustments to reconcile net income to net cash provided by operations: | | | | |
| Depreciation and amortization | | 77.5 | | | 68.7 | |
| Amortization of debt issuance costs | | 1.2 | | | 1.0 | |
| Share-based compensation | | 74.3 | | | 24.1 | |
| Gain on sale of Emergency Medical Services business | | — | | | (55.7) | |
| (Gain)/loss on disposal and right-of-use asset write-downs | | (0.4) | | | 17.0 | |
| | | | |
| Provision for credit losses | | 0.7 | | | 0.6 | |
| Deferred income taxes | | 23.0 | | | (1.2) | |
| Non-cash lease expense | | 9.7 | | | 7.3 | |
| Change in value of contingent consideration | | (2.2) | | | 4.7 | |
| Other | | 0.3 | | | — | |
| Changes in operating assets and liabilities: | | | | |
| Accounts receivable and related party accounts receivable | | (33.2) | | | (56.5) | |
| Prepaid expenses and other assets | | (18.0) | | | (12.9) | |
| Accounts payable | | 0.1 | | | (3.4) | |
| Accrued compensation and benefits | | 42.0 | | | (40.3) | |
| Lease liabilities | | (12.7) | | | (13.6) | |
| Other liabilities | | (13.3) | | | 25.3 | |
| Customer liabilities and customer liabilities - related party | | 18.6 | | | (20.4) | |
| Net cash provided by operating activities | | 264.8 | | | 61.8 | |
| Investing activities | | | | |
| Purchases of property, equipment, and software | | (51.7) | | | (49.3) | |
| | | | |
| | | | |
| Payment for business acquisitions, net of cash acquired | | (294.7) | | | (196.0) | |
| | | | |
| | | | |
| Proceeds from sale of Emergency Medical Services business, net of cash disposed | | — | | | 128.3 | |
| Proceeds from disposal of assets | | 6.0 | | | — | |
| Net cash used in investing activities | | (340.4) | | | (117.0) | |
| Financing activities | | | | |
| | | | |
| Issuance of senior secured debt, net of discount and issuance costs | | 698.6 | | | 190.6 | |
| | | | |
| Borrowings on revolver | | 120.0 | | | 50.0 | |
| Payment of debt issuance costs | | (1.9) | | | — | |
| Repayment of senior secured debt | | (488.9) | | | (23.4) | |
| | | | |
| Repayments on revolver | | (110.0) | | | (20.0) | |
| | | | |
| Payment of contingent consideration liability | | (4.8) | | | — | |
| Deferred payment related to acquisition of RevWorks | | (12.5) | | | — | |
| Inducement of preferred stock conversion | | (105.0) | | | — | |
| Exercise of vested stock options | | 8.9 | | | 18.4 | |
| | | | |
| Purchase of treasury stock | | (56.5) | | | — | |
| Shares withheld for taxes | | (16.3) | | | (71.9) | |
| | | | |
| Other | | (0.2) | | | (5.8) | |
| Net cash provided by financing activities | | 31.4 | | | 137.9 | |
| Effect of exchange rate changes in cash | | (0.5) | | | (0.4) | |
| Net (decrease) increase in cash, cash equivalents, and restricted cash | | (44.7) | | | 82.3 | |
| Cash, cash equivalents, and restricted cash at beginning of period | | 174.8 | | | 92.5 | |
| Cash, cash equivalents, and restricted cash at end of period | | $ | 130.1 | | | $ | 174.8 | |
| | | | | | | | | | | | | | | | | | | | | | | | | | | | | | | | | | | | | | | | | | | | | | | | | | |
| Table 4 |
| R1 RCM Inc. |
| Reconciliation of GAAP Net Income to Non-GAAP Adjusted EBITDA (Unaudited) |
| (In millions) |
| | | | | | | | |
| | Three Months Ended December 31, | | 2021 vs. 2020 Change | | Year Ended December 31, | | 2021 vs. 2020 Change |
| | 2021 | | 2020 | | Amount | | % | | 2021 | | 2020 | | Amount | | % |
| Net income | | $ | 36.0 | | | $ | 78.6 | | | $ | (42.6) | | | (54) | % | | $ | 97.2 | | | $ | 117.1 | | | $ | (19.9) | | | (17) | % |
| Net interest expense | | 5.1 | | | 4.3 | | | 0.8 | | | 19 | % | | 18.9 | | | 17.3 | | | 1.6 | | | 9 | % |
| Income tax provision (benefit) | | 9.1 | | | (15.3) | | | 24.4 | | | 159 | % | | 29.6 | | | 1.3 | | | 28.3 | | | n.m. |
| Depreciation and amortization expense | | 20.7 | | | 17.8 | | | 2.9 | | | 16 | % | | 77.5 | | | 68.7 | | | 8.8 | | | 13 | % |
| Share-based compensation expense | | 12.3 | | | 8.1 | | | 4.2 | | | 52 | % | | 74.3 | | | 24.0 | | | 50.3 | | | 210 | % |
| Gain on business disposition (1) | | — | | | (55.7) | | | 55.7 | | | (100) | % | | — | | | (55.7) | | | 55.7 | | | (100) | % |
| | | | | | | | | | | | | | | | |
| Other (2) | | 11.9 | | | 24.9 | | | (13.0) | | | (52) | % | | 46.1 | | | 67.3 | | | (21.2) | | | (32) | % |
| Adjusted EBITDA (non-GAAP) | | $ | 95.1 | | | $ | 62.7 | | | $ | 32.4 | | | 52 | % | | $ | 343.6 | | | $ | 240.0 | | | $ | 103.6 | | | 43 | % |
n.m. - not meaningful
(1) Gain on business disposition represents the gain associated with the Emergency Medical Services business disposition.
(2) Other costs are comprised of strategic initiatives costs, facility-exit charges, severance and related employee benefits, and certain other costs.
| | | | | | | | | | | | | | | | | | | | | | | | | | |
| Table 5 |
| R1 RCM Inc. |
| Reconciliation of GAAP Cost of Services to Non-GAAP Cost of Services (Unaudited) |
| (In millions) |
| | | | | | | | |
| | Three Months Ended December 31, | | Year Ended December 31, |
| | 2021 | | 2020 | | 2021 | | 2020 |
| Cost of services | | $ | 304.6 | | | $ | 263.7 | | | $ | 1,162.8 | | | $ | 1,021.1 | |
| Less: | | | | | | | | |
| Share-based compensation expense | | 5.4 | | | 3.8 | | | 44.2 | | | 9.9 | |
| Depreciation and amortization expense | | 20.1 | | | 17.0 | | | 74.7 | | | 64.7 | |
| Non-GAAP cost of services | | $ | 279.1 | | | $ | 242.9 | | | $ | 1,043.9 | | | $ | 946.5 | |
| | | | | | | | | | | | | | | | | | | | | | | | | | |
| Table 6 |
| R1 RCM Inc. |
| Reconciliation of GAAP Selling, General and Administrative to Non-GAAP Selling, General and Administrative (Unaudited) |
| (In millions) |
| | | | | | | | |
| | Three Months Ended December 31, | | Year Ended December 31, |
| | 2021 | | 2020 | | 2021 | | 2020 |
| Selling, general and administrative | | $ | 32.2 | | | $ | 27.9 | | | $ | 120.0 | | | $ | 102.4 | |
| Less: | | | | | | | | |
| Share-based compensation expense | | 6.9 | | | 4.3 | | | 30.1 | | | 14.1 | |
| Depreciation and amortization expense | | 0.6 | | | 0.8 | | | 2.8 | | | 4.0 | |
| Non-GAAP selling, general and administrative | | $ | 24.7 | | | $ | 22.8 | | | $ | 87.1 | | | $ | 84.3 | |
| | | | | | | | | | | | | | | | | | | | | | | | | | |
| Table 7 |
| R1 RCM Inc. |
| Consolidated Non-GAAP Financial Information (Unaudited) |
| (In millions) |
| | | | | | | | |
| | | Three Months Ended December 31, | | Year Ended December 31, |
| | | 2021 | | 2020 | | 2021 | | 2020 |
| Net operating fees | | $ | 332.0 | | | $ | 271.4 | | | $ | 1,211.8 | | | $ | 1,093.8 | |
| Incentive fees | | 35.8 | | | 27.4 | | | 143.8 | | | 70.6 | |
| Other | | 31.1 | | | 29.6 | | | 119.0 | | | 106.4 | |
| Net services revenue | | 398.9 | | | 328.4 | | | 1,474.6 | | | 1,270.8 | |
| | | | | | | | |
| Operating expenses: | | | | | | | | |
| Cost of services (non-GAAP) | | 279.1 | | | 242.9 | | | 1,043.9 | | | 946.5 | |
| Selling, general and administrative (non-GAAP) | | 24.7 | | | 22.8 | | | 87.1 | | | 84.3 | |
| Sub-total | | 303.8 | | | 265.7 | | | 1,131.0 | | | 1,030.8 | |
| | | | | | | | |
| Adjusted EBITDA | | $ | 95.1 | | | $ | 62.7 | | | $ | 343.6 | | | $ | 240.0 | |
| | | | | |
| Table 8 |
| R1 RCM Inc. |
| Reconciliation of GAAP Operating Income Guidance to Non-GAAP Adjusted EBITDA Guidance (Unaudited) |
| (In millions) |
| |
| | 2022 |
| GAAP Operating Income Guidance | $200-220 |
| Plus: | |
| Depreciation and amortization expense | $85-95 |
| Share-based compensation expense | $45-55 |
| Strategic initiatives, severance and other costs | $40-50 |
| Adjusted EBITDA Guidance | $385-405 |
| | | | | | | | | | | | | | |
| Table 9 |
| R1 RCM Inc. |
| Reconciliation of Total Debt to Net Debt (Unaudited) |
| (In millions) |
| | | | |
| | December 31, | | December 31, |
| | | 2021 | | 2020 |
| Senior Revolver | | $ | 80.0 | | | $ | 70.0 | |
| Senior Term Loan | | 695.6 | | | 484.6 | |
| | | | |
| Total debt | | 775.6 | | | 554.6 | |
| | | | |
| Less: | | | | |
| Cash and cash equivalents | | 130.1 | | | 173.8 | |
| | | | |
| Non-current portion of restricted cash equivalents | | — | | | 1.0 | |
| Net Debt | | $ | 645.5 | | | $ | 379.8 | |

• January 10, 2022February 17, 2 22 Fourth Quarter and Full Year 2021 Earnings Call NEED NEW IMAGE THAT WE SENT Exhibit 99.2
2 Forward-Looking Statements This presentation includes information that may constitute “forward-looking statements,” made pursuant to the safe harbor provisions of the Private Securities Litigation Reform Act of 1995 and Section 21E of the Securities Exchange Act of 1934, as amended. Forward-looking statements generally relate to future events and relationships, plans, future growth and future performance, including, but not limited to, statements about our strategic initiatives, our capital plans, our costs, our ability to successfully implement new technologies, our future financial and operational performance, our liquidity and the expected timing, completion and effects of the proposed transaction. These forward-looking statements are often identified by the use of words such as “anticipate,” “believe,” “estimate,” “expect,” “intend,” “designed,” “may,” “plan,” “predict,” “project,” “target,” “contemplate,” “would,” “seek,” “see” and similar expressions or variations or negatives of these words, although not all forward-looking statements contain these identifying words. These statements are based on various assumptions, whether or not identified in this presentation, and on the current expectations of R1’s and Cloudmed’s management and are not predictions of actual performance. These forward-looking statements are provided for illustrative purposes only and are not intended to serve as, and must not be relied on by any investor as, a guarantee, assurance, prediction or definitive statement of fact or probability. Actual outcomes and results may differ materially from those contemplated by these forward-looking statements as a result of uncertainties, risks, and changes in circumstances, including but not limited to risks and uncertainties related to: (i) our ability to retain existing customers or acquire new customers; (ii) the development of markets for our revenue cycle management ("RCM") offering; (iii) variability in the lead time of prospective customers; (iv) competition within the market; (v) breaches or failures of our information security measures or or unauthorized access to a customer's data; (vi) delayed or unsuccessful implementation of our technologies or services, or unexpected implementation costs; (vii) disruptions in or damages to our global business services centers and third-party operated data centers; (viii) the impact of the COVID-19 pandemic on our business, operating results, and financial condition; (ix) the ability of the parties to consummate the proposed transaction in a timely manner or at all; (x) satisfaction of the conditions precedent to the consummation of the proposed transaction, including the receipt of required regulatory and shareholder approvals; and (xi) R1’s ability to timely and successfully achieve the anticipated benefits and potential synergies of the proposed transaction. Additional risks and uncertainties that could cause actual outcomes and results to differ materially from those contemplated by the forward-looking statements are included under the heading “Risk Factors” in our most recent annual report on Form 10-K, our quarterly reports on Form 10-Q, the registration statement on Form S-4 and the proxy statement included therein that R1 intends to file relating to the transactions described herein and any other periodic reports that we file with the SEC. The foregoing list of factors is not exhaustive. All forward-looking statements included herein are expressly qualified in their entirety by these cautionary statements as of the date hereof and involve many risks and uncertainties that could cause our actual results to differ materially from those expressed or implied in our forward-looking statements. Subsequent events and developments, including actual results or changes in our assumptions, may cause our views to change. R1 assumes no obligation and does not intend to update these forward-looking statements, except as required by law. You are cautioned not to place undue reliance on such forward-looking statements.
3 Disclaimer Additional Information and Where to Find It In connection with the proposed transaction and plan of merger (the “Transaction Agreement”) by and among R1 RCM Inc. (“R1”), Project Roadrunner Parent Inc., a wholly owned subsidiary of R1 (“New Pubco”), Project Roadrunner Merger Sub Inc., a wholly owned subsidiary of New Pubco (“R1 Merger Sub”), Coyco 1, L.P. (“Coyco 1”) and Coyco 2, L.P. (“Coyco 2”, and together with Coyco 1, the “Sellers”) and other parties thereto, pursuant to which R1 Merger Sub will merge with and into R1, with R1 surviving as a direct, wholly-owned subsidiary of New Pubco, and Sellers will contribute equity in their subsidiaries constituting the Cloudmed business (“Cloudmed”) to New Pubco in exchange for shares of New Pubco common stock, R1 will file a registration statement on Form S-4 with the U.S. Securities and Exchange Commission (the “SEC”), which will constitute a prospectus and proxy statement of R1. The proxy statement/prospectus described above will contain important information about R1, the Cloudmed business, the proposed transaction and related matters. A proxy statement/prospectus will be sent to all shareholders of R1. R1 also will file other documents regarding the proposed transaction with the SEC. Before making any voting decision, investors and security holders of R1 are urged to read the registration statement, the proxy statement/prospectus and all other relevant documents filed or that will be filed with the SEC in connection with the proposed transaction as they become available because they will contain important information about the proposed transaction. Investors and security holders will be able to obtain free copies of these documents, and other documents filed with the SEC, by R1 through the website maintained by the SEC at www.sec.gov. In addition, investors and security holders will be able to obtain free copies of these documents from R1 by visiting its website at www.r1rcm.com, or upon written request to 434 W. Ascension Way, 6th Floor, Murray, Utah 84123. No Offer or Sale of Securities This presentation is for informational purposes only and is not intended to and does not constitute an offer to subscribe for, buy or sell, or the solicitation of an offer to subscribe for, buy or sell, or an invitation to subscribe for, buy or sell any securities or a solicitation of any vote or approval in any jurisdiction, nor shall there be any sale, issuance or transfer of securities in any jurisdiction in which such offer, invitation, sale or solicitation would be unlawful prior to registration or qualification under the securities laws of any such jurisdiction. No offer of securities shall be made except by means of a prospectus meeting the requirements of Section 10 of the Securities Act of 1933, as amended, and otherwise in accordance with applicable law. No representations or warranties, express or implied, are given in, or in respect of, this presentation. To the fullest extent permitted by law, in no circumstances with R1, the Sellers, Cloudmed or any of their respective subsidiaries, equityholders, affiliates, representatives, partners, directors, officers, employees, advisors or agents be responsible or liable for any direct, indirect or consequential loss or loss of profit arising from the use of this presentation, its contents, its omissions, reliance on the information contained within it, or on opinions communicated in relation thereto or otherwise arising in connection therewith.
4 Disclaimer Financial Projections All financial projections in this presentation are forward-looking statements that are based on assumptions that are inherently subject to significant uncertainties and contingencies, many of which are beyond R1’s control. No independent registered public accounting firm has audited, reviewed, compiled or performed any procedures with respect to the combined financial information of R1 contained herein, and, accordingly R1 expresses no opinion or otherwise provides any form of assurance with respect thereto for the purposes of this presentation. Such information may not be included, may be adjusted or may be presented differently in, any registration statement or proxy statement or other relevant documents to be filed by R1 with the SEC. The inclusion of projections in this presentation should not be regarded as an indication that R1, or its representatives, considered or consider the projections to be a reliable prediction of future events. Non-GAAP Financial Information Some of the financial information and data contained in this presentation, including Adjusted EBITDA (and related measures), have not been prepared in accordance with U.S. generally accepted accounting principles (“GAAP”). Adjusted EBITDA may be calculated differently from, and therefore may not be comparable to, similarly titled measures used by other companies. This non-GAAP financial measure should not be considered in isolation or as a substitute for analysis of our results of operations as reported under GAAP. Please refer to the Appendix located at the end of this presentation for a reconciliation of the non-GAAP financial measure to the most directly comparable GAAP financial measure. Participants in the Solicitation The directors and executive officers of R1 may be deemed to be participants in the solicitation of proxies from R1’s shareholders. Information regarding R1’s directors and executive officers, including a description of their direct interests, by security holdings or otherwise, in respect of the transaction described herein will be included in the proxy statement/prospectus described above.
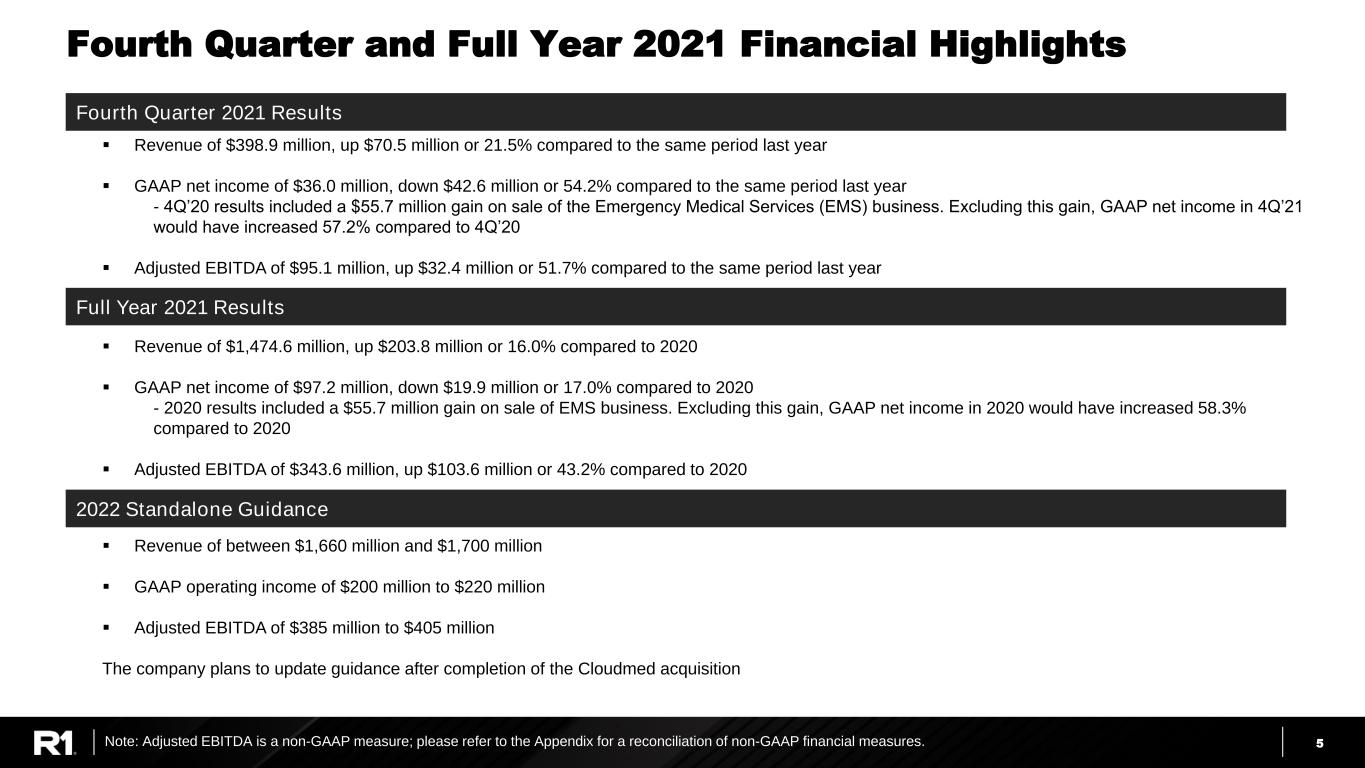
5 Fourth Quarter and Full Year 2021 Financial Highlights ▪ Revenue of $398.9 million, up $70.5 million or 21.5% compared to the same period last year ▪ GAAP net income of $36.0 million, down $42.6 million or 54.2% compared to the same period last year - 4Q’20 results included a $55.7 million gain on sale of the Emergency Medical Services (EMS) business. Excluding this gain, GAAP net income in 4Q’21 would have increased 57.2% compared to 4Q’20 ▪ Adjusted EBITDA of $95.1 million, up $32.4 million or 51.7% compared to the same period last year ▪ Revenue of $1,474.6 million, up $203.8 million or 16.0% compared to 2020 ▪ GAAP net income of $97.2 million, down $19.9 million or 17.0% compared to 2020 - 2020 results included a $55.7 million gain on sale of EMS business. Excluding this gain, GAAP net income in 2020 would have increased 58.3% compared to 2020 ▪ Adjusted EBITDA of $343.6 million, up $103.6 million or 43.2% compared to 2020 ▪ Revenue of between $1,660 million and $1,700 million ▪ GAAP operating income of $200 million to $220 million ▪ Adjusted EBITDA of $385 million to $405 million The company plans to update guidance after completion of the Cloudmed acquisition Note: Adjusted EBITDA is a non-GAAP measure; please refer to the Appendix for a reconciliation of non-GAAP financial measures. Fourth Quarter 2021 Results Full Year 2021 Results 2022 Standalone Guidance
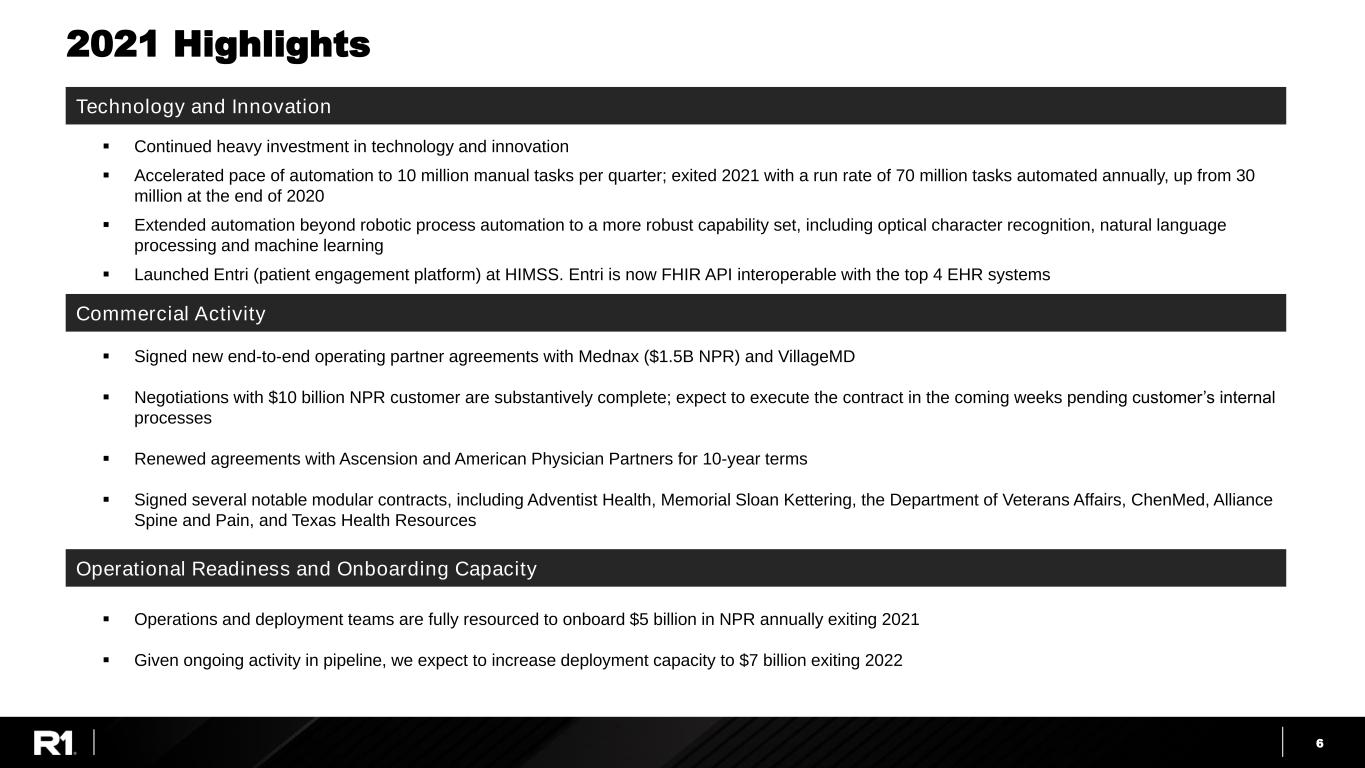
6 2021 Highlights ▪ Continued heavy investment in technology and innovation ▪ Accelerated pace of automation to 10 million manual tasks per quarter; exited 2021 with a run rate of 70 million tasks automated annually, up from 30 million at the end of 2020 ▪ Extended automation beyond robotic process automation to a more robust capability set, including optical character recognition, natural language processing and machine learning ▪ Launched Entri (patient engagement platform) at HIMSS. Entri is now FHIR API interoperable with the top 4 EHR systems ▪ Signed new end-to-end operating partner agreements with Mednax ($1.5B NPR) and VillageMD ▪ Negotiations with $10 billion NPR customer are substantively complete; expect to execute the contract in the coming weeks pending customer’s internal processes ▪ Renewed agreements with Ascension and American Physician Partners for 10-year terms ▪ Signed several notable modular contracts, including Adventist Health, Memorial Sloan Kettering, the Department of Veterans Affairs, ChenMed, Alliance Spine and Pain, and Texas Health Resources ▪ Operations and deployment teams are fully resourced to onboard $5 billion in NPR annually exiting 2021 ▪ Given ongoing activity in pipeline, we expect to increase deployment capacity to $7 billion exiting 2022 Technology and Innovation Commercial Activity Operational Readiness and Onboarding Capacity

7 Additional Color on Cloudmed1 ▪ Robust data-driven platform with deep revenue intelligence functionality to holistically address complex reimbursement challenges that providers face ▪ Deep dataset, fueled by 500 million patient encounters annually and 10x more data than R1, enables predictive analytics and machine learning to identify patterns/errors in clinical documentation, claims submission, and payer denials, and create automated rules to generate value for customers ▪ Cloudmed’s solutions are expected to significantly enhance R1’s existing functionality and results in areas such as underpayments, complex claims and charge capture ▪ Cloudmed is also expected to add new functionality R1 has not developed historically: DRG validation, 340B reimbursement, automation solutions sold to providers ▪ Strong value proposition, with $1.7 billion in incremental revenue for customers in 2021 ▪ High visibility with ~95% recurring revenue and 20%+ year-over-year top-line growth in 2021 ▪ Processed over $800 billion in NPR for more that 400 health systems in all 50 states, including 87 of the top 100 health systems ▪ Pathway to expected 20% medium-term growth for modular channel post-acquisition is supported by: ▪ Increased attach rate: majority of customers use only one out of Cloudmed’s nine solutions ▪ New footprints: available opportunity and market share wins at $1.2 trillion of NPR at health systems and physician offices not served by Cloudmed today ▪ 2021 bookings provide visibility to 20%+ growth in 2021, and R1’s legacy modular solutions (PAS, Entri, Visitpay) support growth beyond 2021 ▪ Cloudmed’s commercial engine has a multi-year track record of increasing attach rate and developing new customer relationships Platform and Technology Financial Profile and Commercial Engine Note1: Information related to Cloudmed is based on data available to R1, has not been audited and is subject to change.
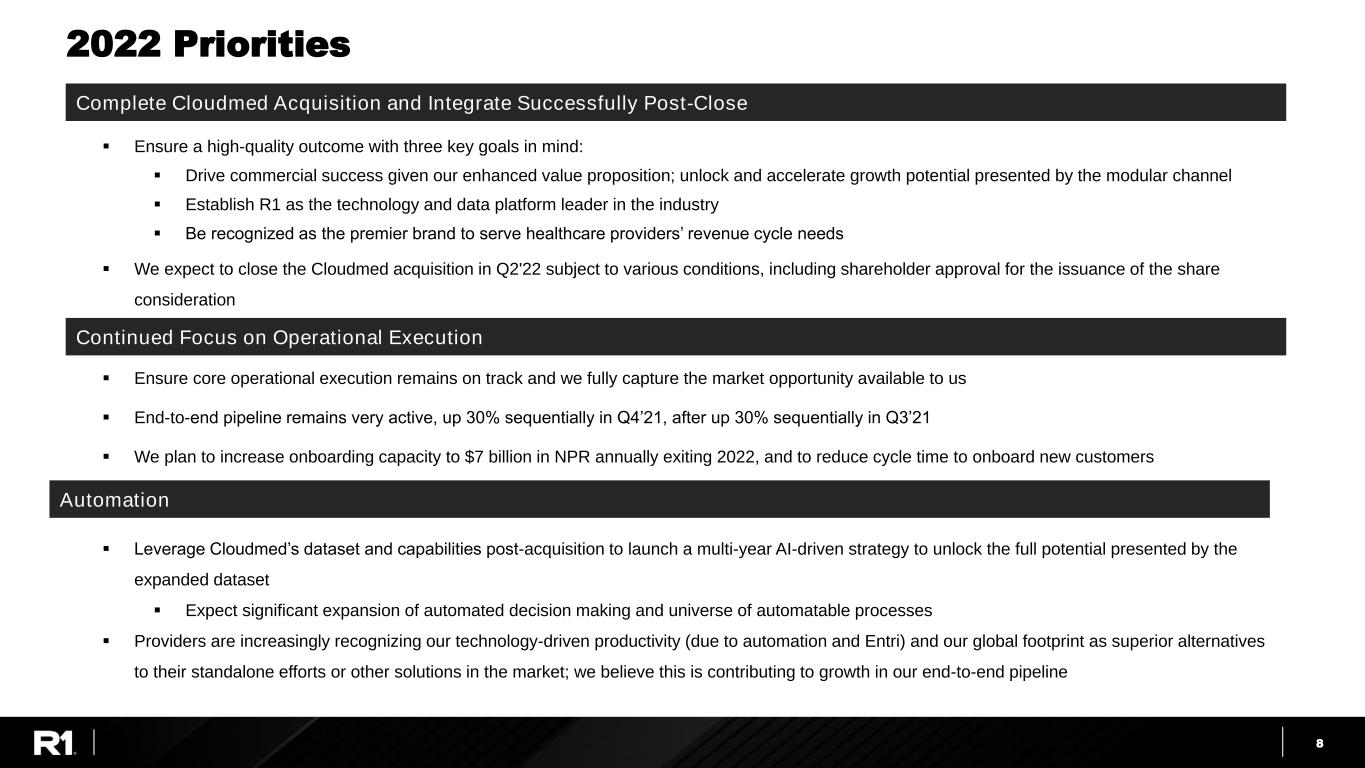
8 2022 Priorities ▪ Ensure a high-quality outcome with three key goals in mind: ▪ Drive commercial success given our enhanced value proposition; unlock and accelerate growth potential presented by the modular channel ▪ Establish R1 as the technology and data platform leader in the industry ▪ Be recognized as the premier brand to serve healthcare providers’ revenue cycle needs ▪ We expect to close the Cloudmed acquisition in Q2'22 subject to various conditions, including shareholder approval for the issuance of the share consideration ▪ Ensure core operational execution remains on track and we fully capture the market opportunity available to us ▪ End-to-end pipeline remains very active, up 30% sequentially in Q4’21, after up 30% sequentially in Q3’21 ▪ We plan to increase onboarding capacity to $7 billion in NPR annually exiting 2022, and to reduce cycle time to onboard new customers ▪ Leverage Cloudmed’s dataset and capabilities post-acquisition to launch a multi-year AI-driven strategy to unlock the full potential presented by the expanded dataset ▪ Expect significant expansion of automated decision making and universe of automatable processes ▪ Providers are increasingly recognizing our technology-driven productivity (due to automation and Entri) and our global footprint as superior alternatives to their standalone efforts or other solutions in the market; we believe this is contributing to growth in our end-to-end pipeline Complete Cloudmed Acquisition and Integrate Successfully Post-Close Continued Focus on Operational Execution Automation
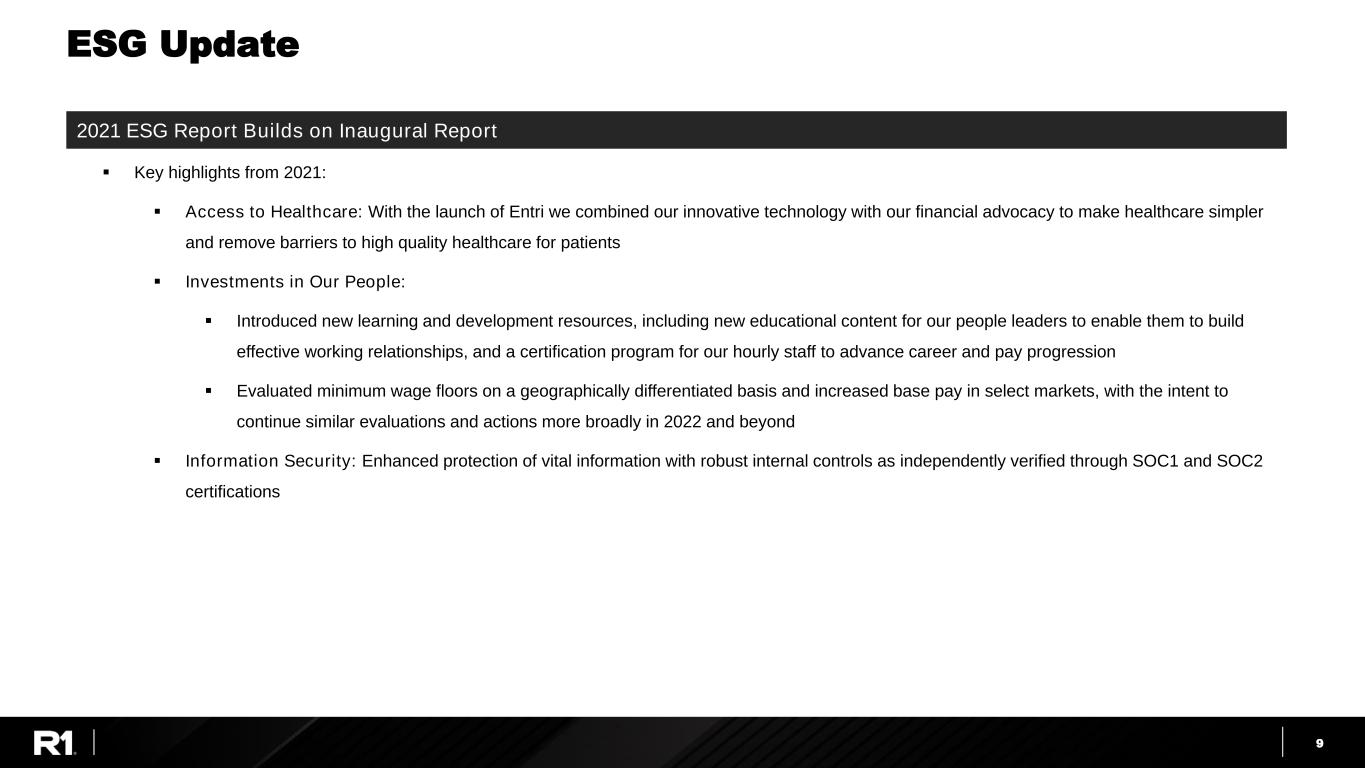
9 ESG Update ▪ Key highlights from 2021: ▪ Access to Healthcare: With the launch of Entri we combined our innovative technology with our financial advocacy to make healthcare simpler and remove barriers to high quality healthcare for patients ▪ Investments in Our People: ▪ Introduced new learning and development resources, including new educational content for our people leaders to enable them to build effective working relationships, and a certification program for our hourly staff to advance career and pay progression ▪ Evaluated minimum wage floors on a geographically differentiated basis and increased base pay in select markets, with the intent to continue similar evaluations and actions more broadly in 2022 and beyond ▪ Information Security: Enhanced protection of vital information with robust internal controls as independently verified through SOC1 and SOC2 certifications 2021 ESG Report Builds on Inaugural Report
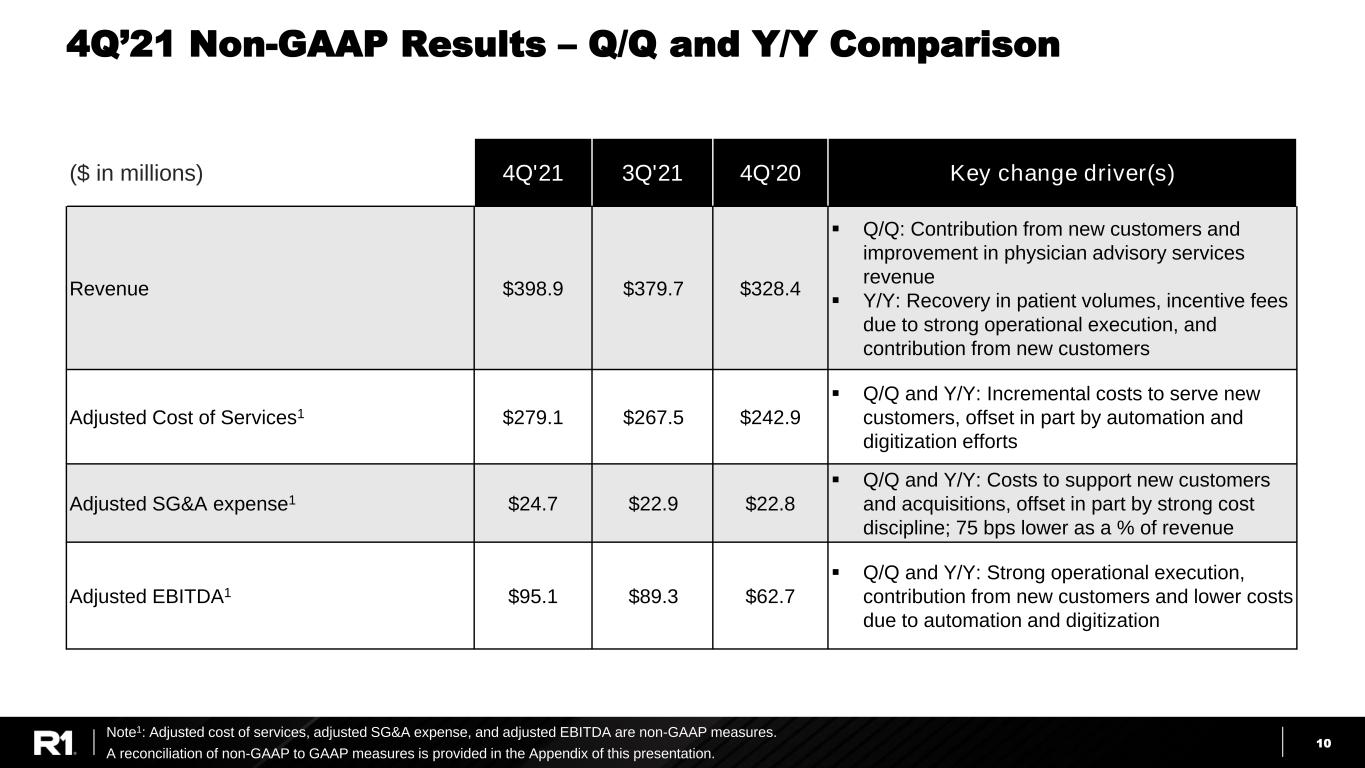
10 4Q’21 Non-GAAP Results – Q/Q and Y/Y Comparison Note1: Adjusted cost of services, adjusted SG&A expense, and adjusted EBITDA are non-GAAP measures. A reconciliation of non-GAAP to GAAP measures is provided in the Appendix of this presentation. ($ in millions) 4Q'21 3Q'21 4Q'20 Key change driver(s) Revenue $398.9 $379.7 $328.4 ▪ Q/Q: Contribution from new customers and improvement in physician advisory services revenue ▪ Y/Y: Recovery in patient volumes, incentive fees due to strong operational execution, and contribution from new customers Adjusted Cost of Services1 $279.1 $267.5 $242.9 ▪ Q/Q and Y/Y: Incremental costs to serve new customers, offset in part by automation and digitization efforts Adjusted SG&A expense1 $24.7 $22.9 $22.8 ▪ Q/Q and Y/Y: Costs to support new customers and acquisitions, offset in part by strong cost discipline; 75 bps lower as a % of revenue Adjusted EBITDA1 $95.1 $89.3 $62.7 ▪ Q/Q and Y/Y: Strong operational execution, contribution from new customers and lower costs due to automation and digitization
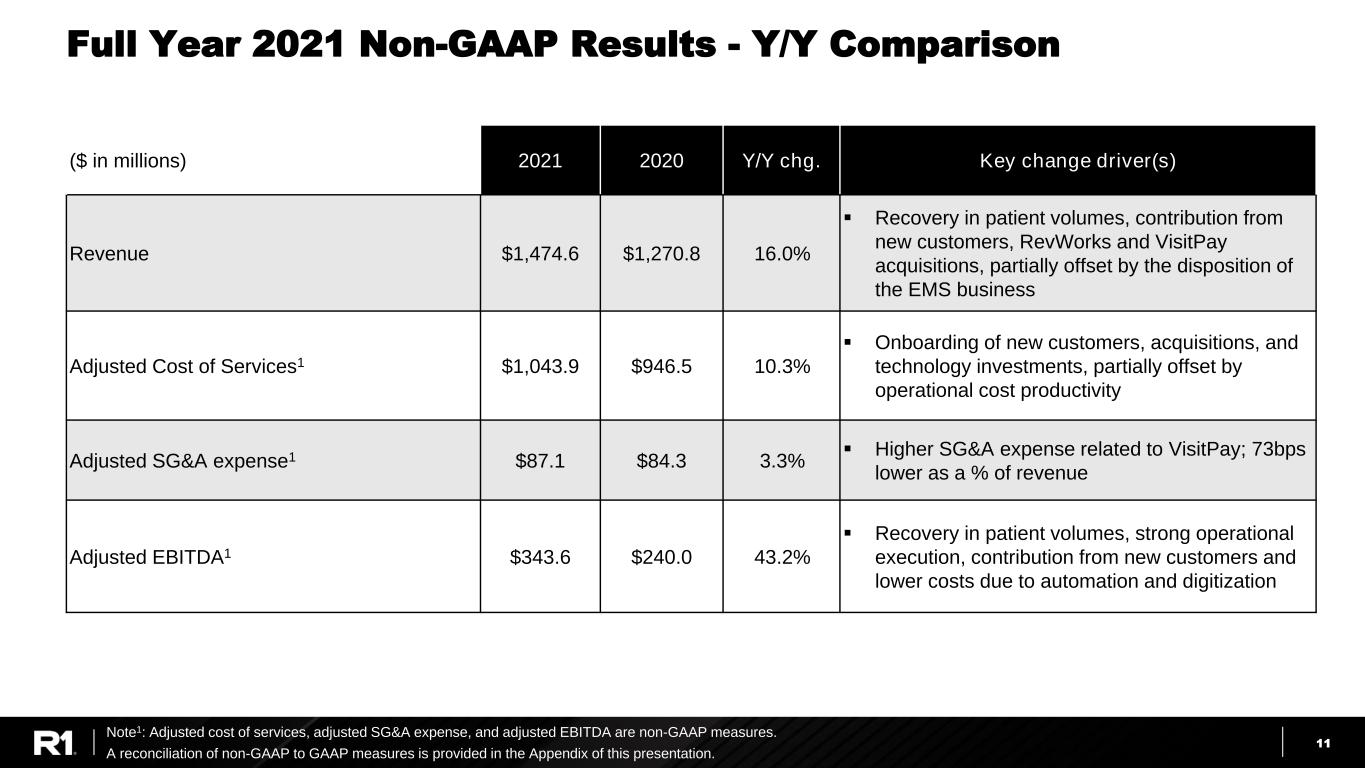
11 Full Year 2021 Non-GAAP Results - Y/Y Comparison Note1: Adjusted cost of services, adjusted SG&A expense, and adjusted EBITDA are non-GAAP measures. A reconciliation of non-GAAP to GAAP measures is provided in the Appendix of this presentation. ($ in millions) 2021 2020 Y/Y chg. Key change driver(s) Revenue $1,474.6 $1,270.8 16.0% ▪ Recovery in patient volumes, contribution from new customers, RevWorks and VisitPay acquisitions, partially offset by the disposition of the EMS business Adjusted Cost of Services1 $1,043.9 $946.5 10.3% ▪ Onboarding of new customers, acquisitions, and technology investments, partially offset by operational cost productivity Adjusted SG&A expense1 $87.1 $84.3 3.3% ▪ Higher SG&A expense related to VisitPay; 73bps lower as a % of revenue Adjusted EBITDA1 $343.6 $240.0 43.2% ▪ Recovery in patient volumes, strong operational execution, contribution from new customers and lower costs due to automation and digitization
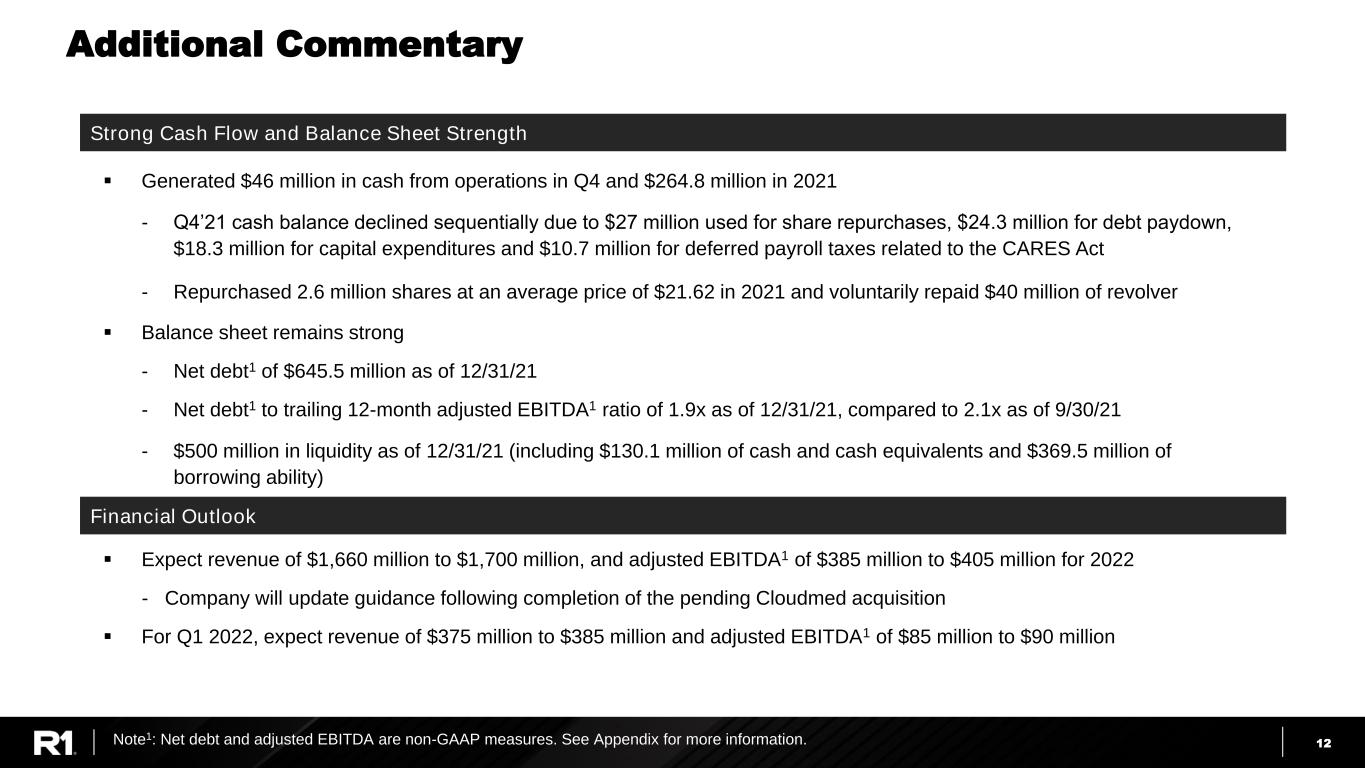
12 Additional Commentary ▪ Generated $46 million in cash from operations in Q4 and $264.8 million in 2021 - Q4’21 cash balance declined sequentially due to $27 million used for share repurchases, $24.3 million for debt paydown, $18.3 million for capital expenditures and $10.7 million for deferred payroll taxes related to the CARES Act - Repurchased 2.6 million shares at an average price of $21.62 in 2021 and voluntarily repaid $40 million of revolver ▪ Balance sheet remains strong - Net debt1 of $645.5 million as of 12/31/21 - Net debt1 to trailing 12-month adjusted EBITDA1 ratio of 1.9x as of 12/31/21, compared to 2.1x as of 9/30/21 - $500 million in liquidity as of 12/31/21 (including $130.1 million of cash and cash equivalents and $369.5 million of borrowing ability) ▪ Expect revenue of $1,660 million to $1,700 million, and adjusted EBITDA1 of $385 million to $405 million for 2022 - Company will update guidance following completion of the pending Cloudmed acquisition ▪ For Q1 2022, expect revenue of $375 million to $385 million and adjusted EBITDA1 of $85 million to $90 million Strong Cash Flow and Balance Sheet Strength Financial Outlook Note1: Net debt and adjusted EBITDA are non-GAAP measures. See Appendix for more information.

13JPM Healthcare Conference 2022 Appendix
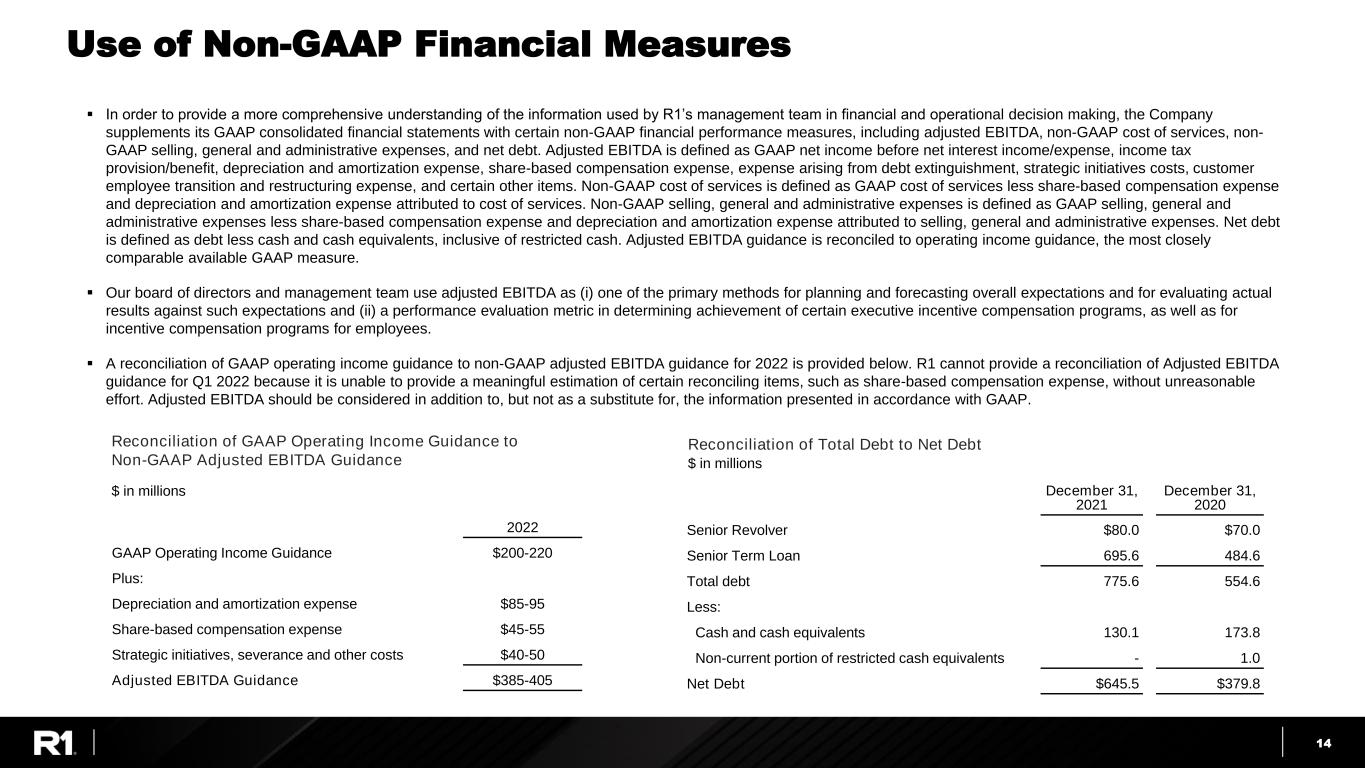
14 Use of Non-GAAP Financial Measures ▪ In order to provide a more comprehensive understanding of the information used by R1’s management team in financial and operational decision making, the Company supplements its GAAP consolidated financial statements with certain non-GAAP financial performance measures, including adjusted EBITDA, non-GAAP cost of services, non- GAAP selling, general and administrative expenses, and net debt. Adjusted EBITDA is defined as GAAP net income before net interest income/expense, income tax provision/benefit, depreciation and amortization expense, share-based compensation expense, expense arising from debt extinguishment, strategic initiatives costs, customer employee transition and restructuring expense, and certain other items. Non-GAAP cost of services is defined as GAAP cost of services less share-based compensation expense and depreciation and amortization expense attributed to cost of services. Non-GAAP selling, general and administrative expenses is defined as GAAP selling, general and administrative expenses less share-based compensation expense and depreciation and amortization expense attributed to selling, general and administrative expenses. Net debt is defined as debt less cash and cash equivalents, inclusive of restricted cash. Adjusted EBITDA guidance is reconciled to operating income guidance, the most closely comparable available GAAP measure. ▪ Our board of directors and management team use adjusted EBITDA as (i) one of the primary methods for planning and forecasting overall expectations and for evaluating actual results against such expectations and (ii) a performance evaluation metric in determining achievement of certain executive incentive compensation programs, as well as for incentive compensation programs for employees. ▪ A reconciliation of GAAP operating income guidance to non-GAAP adjusted EBITDA guidance for 2022 is provided below. R1 cannot provide a reconciliation of Adjusted EBITDA guidance for Q1 2022 because it is unable to provide a meaningful estimation of certain reconciling items, such as share-based compensation expense, without unreasonable effort. Adjusted EBITDA should be considered in addition to, but not as a substitute for, the information presented in accordance with GAAP. 2022 GAAP Operating Income Guidance $200-220 Plus: Depreciation and amortization expense $85-95 Share-based compensation expense $45-55 Strategic initiatives, severance and other costs $40-50 Adjusted EBITDA Guidance $385-405 Reconciliation of GAAP Operating Income Guidance to Non-GAAP Adjusted EBITDA Guidance $ in millions Reconciliation of Total Debt to Net Debt December 31, 2021 December 31, 2020 Senior Revolver $80.0 $70.0 Senior Term Loan 695.6 484.6 Total debt 775.6 554.6 Less: Cash and cash equivalents 130.1 173.8 Non-current portion of restricted cash equivalents - 1.0 Net Debt $645.5 $379.8 $ in millions
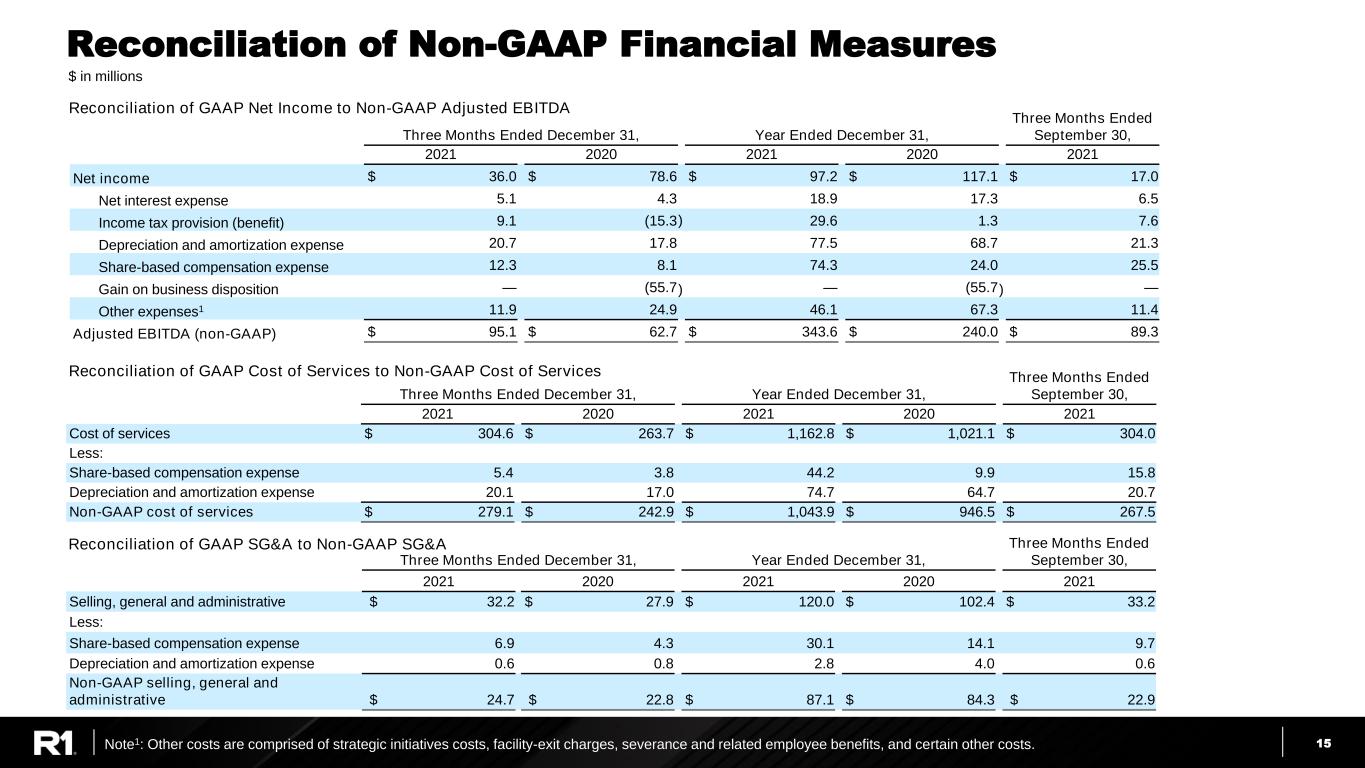
15 Reconciliation of Non-GAAP Financial Measures $ in millions Reconciliation of GAAP Net Income to Non-GAAP Adjusted EBITDA Reconciliation of GAAP SG&A to Non-GAAP SG&A Reconciliation of GAAP Cost of Services to Non-GAAP Cost of Services Note1: Other costs are comprised of strategic initiatives costs, facility-exit charges, severance and related employee benefits, and certain other costs. Three Months Ended December 31, Year Ended December 31, Three Months Ended September 30, 2021 2020 2021 2020 2021 Selling, general and administrative $ 32.2 $ 27.9 $ 120.0 $ 102.4 $ 33.2 Less: Share-based compensation expense 6.9 4.3 30.1 14.1 9.7 Depreciation and amortization expense 0.6 0.8 2.8 4.0 0.6 Non-GAAP selling, general and administrative $ 24.7 $ 22.8 $ 87.1 $ 84.3 $ 22.9 Three Months Ended December 31, Year Ended December 31, Three Months Ended September 30, 2021 2020 2021 2020 2021 Cost of services $ 304.6 $ 263.7 $ 1,162.8 $ 1,021.1 $ 304.0 Less: Share-based compensation expense 5.4 3.8 44.2 9.9 15.8 Depreciation and amortization expense 20.1 17.0 74.7 64.7 20.7 Non-GAAP cost of services $ 279.1 $ 242.9 $ 1,043.9 $ 946.5 $ 267.5 Three Months Ended December 31, Year Ended December 31, Three Months Ended September 30, 2021 2020 2021 2020 2021 Net income $ 36.0 $ 78.6 $ 97.2 $ 117.1 $ 17.0 Net interest expense 5.1 4.3 18.9 17.3 6.5 Income tax provision (benefit) 9.1 (15.3) 29.6 1.3 7.6 Depreciation and amortization expense 20.7 17.8 77.5 68.7 21.3 Share-based compensation expense 12.3 8.1 74.3 24.0 25.5 Gain on business disposition — (55.7) — (55.7) — Other expenses1 11.9 24.9 46.1 67.3 11.4 Adjusted EBITDA (non-GAAP) $ 95.1 $ 62.7 $ 343.6 $ 240.0 $ 89.3
