UNITED STATES
SECURITIES AND EXCHANGE COMMISSION
Washington, D.C. 20549
FORM N-CSR
CERTIFIED SHAREHOLDER REPORT OF REGISTERED
MANAGEMENT INVESTMENT COMPANIES
Investment Company Act file number (811-22335)
Evermore Funds Trust
(Exact name of registrant as specified in charter)
89 Summit Avenue
Summit, New Jersey 07901
(Address of principal executive offices) (Zip code)
Eric LeGoff
89 Summit Ave, 3rd Floor
Summit, New Jersey 07901
(Name and address of agent for service)
(866) 383-7667
Registrant's telephone number, including area code
Date of fiscal year end: December 31
Date of reporting period: December 31, 2014
Item 1. Reports to Stockholders.
| Annual Report | |||||
| December 31, 2014 | |||||
| Evermore Global Value Fund |
Table of Contents
| Shareholder Letter & Management Discussion | |||
| of Fund Performance | 1 | ||
| Sector Allocation | 14 | ||
| Expense Example | 15 | ||
| Performance Information | 17 | ||
| Schedule of Investments | 18 | ||
| Statement of Assets and Liabilities | 22 | ||
| Statement of Operations | 25 | ||
| Statement of Changes in Net Assets | 26 | ||
| Financial Highlights | 28 | ||
| Notes to Financial Statements | 32 | ||
| Report of Independent Registered Public Accounting Firm | 47 | ||
| Approval of Investment Advisory Agreement | 48 | ||
| Trustees and Officers | 50 | ||
| Additional Information | 53 | ||
| Privacy Notice | 55 | ||
Evermore Global Value Fund
Elements of Our Investment Approach
At Evermore Global Advisors, we seek to leverage our deep operating and investing experience and extensive global relationships to identify and invest in special situations – companies around the world that have compelling valuations and are undergoing strategic changes which we believe will unlock value.
Seeking to Generate Value . . .
| • | Catalyst-Driven Investing. We do more than pick undervalued stocks and hope for their prices to rise. We invest in companies where we’ve determined a series of catalysts exist to unlock value. The catalysts we look for are not broadly recognized, but they are likely to have a significant impact on a stock’s performance over time. Examples of catalysts include management changes, financial and operational restructurings, spin-offs, breakups, mergers, acquisitions, etc. |
Supporting Our Active Value Orientation . . .
| • | Original Fact-Based Research. We do not rely on brokerage reports to research companies. We conduct our own, original fact-based research to validate management’s stated objectives and identify catalysts to unlock value. We also perform detailed business segment analysis on each company we research. |
| • | Business Operating Experience. Our senior team has hands-on business operating experience; including starting and managing businesses, sitting on company boards, and assisting management of multi-national corporations restructure their businesses. We rely on this experience to better evaluate investment opportunities. |
| • | A Global Network of Strategic Relationships. Over the past 20 years, our investment team has developed an extensive global network of strategic relationships, including individuals and families that control businesses, corporate board members, corporate management, regional brokerage firms, press contacts, etc. We leverage these relationships to help generate and better evaluate investment opportunities. |
| • | Taking a Private Equity Approach to Public Equity Investing. When we are interested in an investment opportunity, we get to know the management team of the company, study the company’s business model, evaluate the competitive and regulatory environment, and test and crosscheck everything the management team tells us against our own experience. |
| • | Always Active, Sometimes Activist. We are always engaged with the companies in which we invest to ensure management teams follow through on their commitments to change. On limited occasions, when we are not satisfied with the efforts of management, we may play an activist role working with other shareholders to facilitate change. |
1
Evermore Global Value Fund
Executing Our Approach . . .
| • | Targeting Complex Investment Opportunities. We love looking at holding companies and conglomerates that are often under-researched and/or misunderstood. |
| • | Investing Across the Capital Structure. We evaluate all parts of a company’s capital structure to determine where the best risk-adjusted return potential exists. At times, we may invest in multiple parts of a company’s capital structure (e.g., investing in both a company’s debt and equity). |
| • | Merger Arbitrage and Distressed Companies. We look to take advantage of announced merger and acquisition deals where an attractive spread exists between the market price and the announced deal price for the target company. We also look for opportunities in distressed companies that have filed or may file for bankruptcy, or are involved in reorganizations or financial restructurings. |
| • | Exploiting Short Selling Opportunities. We will seek to take advantage of short selling opportunities to address currency, security, sector and market risk. |
| • | Tactically Managing Cash Levels. We are not afraid to hold significant cash positions when it makes sense for the portfolios. |
2
Evermore Global Value Fund
A Letter from the CEO

Eric LeGoff
CEO, Evermore Funds Trust
Dear Shareholder,
The Evermore Global Value Fund (the “Fund”) had a difficult year from an investment performance standpoint, as geopolitical, macroeconomic and pandemic events, including the Ukrainian-Russia crisis, slowing European Gross Domestic Product (“GDP”) growth, EBOLA fears, and declining oil prices, adversely impacted a number of our special situations investments. On a positive note, Fund assets again grew substantially last year, increasing by about 52% to $235.5 million, and bringing assets of Evermore Global Advisors, the Fund’s investment adviser, to about $358 million at year-end 2014. This growth is a testament to the hard work of our entire organization.
We approach 2015 with measured optimism, as we see a market environment that offers its own set of catalysts that we believe will help create value across our holdings. For example, low oil prices will help our industrial companies lower their operating expenses; a declining Euro will help our European companies that are major exporters compete more effectively in the global marketplace; and we believe the European Central Bank’s (“ECB’s”) recent announcement of a gargantuan $1.3 trillion quantitative easing program could have the same positive dramatic effects on European companies and their stock prices as it had in the U.S. Beyond the macroeconomic environment in Europe, we see continued growth in merger and acquisition, spin-off and activist activity across the region, which should provide us with many interesting opportunities on which to focus.
In the spring of 2014, Evermore welcomed Matthew Epstein to its investment team as a senior research analyst. Matt previously worked for a large, New Jersey based asset management firm where he gained many years of special situations and private equity investing experience. Matt has quickly become a contributing member of the team.
David Marcus and I continue to be extremely appreciative of the efforts of our employees, Board of Trustees, advisors, and service providers. I would like to thank the following service providers for their support over the past year: U.S. Bancorp Fund Services, LLC (Fund administrator, accountant, transfer agent); U.S. Bank N.A. (Fund custodian); Quasar Distributors LLC (Fund distributor); Drinker Biddle & Reath LLP (Fund counsel); John Canning of Cipperman Compliance Services, LLC (Chief Compliance Officer and compliance services provider); Gary M. Gardner (counsel to the Fund’s independent trustees); Ernst & Young (Fund auditor); Olmec Systems, Inc. (technology support provider); Tiller, LLC (marketing communications provider); JCPR, Inc. (public relations and marketing provider); Eze Castle Software
3
(order management system provider); Advent Software (portfolio management software provider); and Bloomberg (market data provider).
And finally, the entire Evermore team would like to thank you, our shareholders, for the continued support and confidence you have shown us. We wish you all the best for a happy, healthy and prosperous 2015.
Sincerely,

Eric LeGoff
CEO, Evermore Funds Trust
4
Evermore Global Value Fund
A Letter from the Portfolio Manager

David Marcus
Portfolio Manager
“Long ago, Ben Graham taught me that ‘Price is what you pay; value is what you get.’ Whether we’re talking about socks or stocks, I like buying quality merchandise when it is marked down.” – Warren Buffett
Dear Shareholder,
For the year ended December 31, 2014, Class I shares of the Evermore Global Value Fund (the “Fund”) were down 6.58% while the MSCI All Country World Index (“MSCI ACWI”) was up 4.16%, and the HFRX Event Driven Index (“HFRX ED”) was down 4.06%.
Year-end 2014 marked the five year anniversary of the Fund and a period over which international, and especially European, markets were marked by varying levels of crisis and significant volatility. European value and event driven special situations have struggled to gain a strong footing. U.S. markets, conversely, showed reasonably steady gains over the period. The fact that the Fund’s portfolio has been heavily concentrated in European investments over this time has certainly had an adverse impact on the Fund’s investment performance. Here is a review of the Fund’s performance versus our benchmarks:
Average Annual Total Returns as of December 31, 2014
| Since | ||||
| Inception | ||||
| 1 Year | 3 Year | 5 Year | 1/1/10 | |
| Fund (EVGIX) | -6.58% | 11.57% | 3.21% | 3.21% |
| MSCI ACWI | 4.16% | 14.10% | 9.20% | 9.20% |
| HFRX ED | -4.06% | 5.00% | 2.30% | 2.30% |
The performance data quoted represents past performance and is no guarantee of future results. Current performance may be lower or higher than the performance data quoted. Investment return and principal value will fluctuate so that an investor’s shares, when redeemed, may be worth more or less than their original cost. Performance data current to the most recent month end may be obtained by calling 866-EVERMORE or (866-383-7667). The Fund imposes a 2% redemption fee on shares held for 30 days or less. Performance data quoted does not reflect the redemption fee. If reflected, total returns would be reduced. The Fund’s gross expense ratio is 1.59%.
5
2014 was a disappointing follow-up to what was a very good 2013. The year started off fine with a continuation of the same positive situations that we had seen in 2013 – an acceleration in restructurings, refocusing by companies, breakups, spinoffs, management changes, and an increase in merger and acquisition (“M&A”) activity. There was optimism and a cautious sense of recovery. The view was that Europe, having come out of recession in 2013, would see a major pick-up in GDP growth and that, along with other positive developments, would result in meaningful releases of value in select European companies.
So, what happened?
Russia invaded Crimea/Ukraine. Panic set in quickly. Consumer sentiment fell off a cliff. Sanctions were levied and the economic impact of reduced trade with Russia/Ukraine began to show. People questioned whether Russia might not stop with the invasion of Ukraine. The long expected quantitative easing (“QE”) program from the European Central Bank (“ECB”) did not materialize as expected. Ebola fears that started in Africa began to spread around the world. The positive sentiment we had coming into 2014 quickly vaporized and became fearful and negative. Overall, the perception shifted to a perspective that the long talked about recovery in Europe would now be pushed out and it would continue to be a tomorrow story, not a today story.
We fundamentally disagree with this perspective on both the macro and micro level. We believe that 2014 was a period marked by investor stress and uncertainty, but that today there are many European companies which are less expensive than they have been in years with better prospects that investors have not fully focused on. Our recent trips to Europe and conversations with European business operators and owners have corroborated our thoughts.
It is important to note that we have not made a decision to “allocate” a large percent of the Fund’s assets to Europe – we are agnostic to geography. Rather, we make allocations to those investment opportunities that are most compelling from a valuation and catalyst standpoint on a company specific basis. We happen to have a large exposure to European special situations because, in our opinion, that is where the best opportunities exist today.
Some of the special situations we own have been reporting year over year top line growth in excess of 15% in their best segments. These increases are off of already meaningfully reduced baselines of revenues, so they are telling us that they believe (1) they have seen a bottom, and (2) there is surely a long way to go back up.
We are compelled to own select companies that are restructuring and making the right strategic moves in a time of low growth and cyclical downturns. These companies have been streamlining operations to focus on the businesses that have the ability to generate the strongest cash flows, making the necessary cuts to improve operational inefficiencies, and selling non-essential/losing businesses. What is left behind are more pure play companies that sell at sizable discounts to cash flow and/or book value.
6
So, while widespread consistent top-line growth is unsteady and has generally fallen the last five years, these smartly run businesses have remained profitable on their bottom lines due to the cuts they have, and are continuing, to make. When incremental top line growth begins to come back more broadly, we expect our companies will show increased cash flows coming through that exceed investors’ current expectations. This potential upside in profitability and earnings power will be a much deserved positive outcome of their savvy and focused cost cutting efforts.
Considering the macro environment, we ask ourselves, what could stimulate top line growth and a return of investor and consumer confidence? We believe the answer lies in a mix of a weakening Euro, sharply falling oil and energy prices, near zero interest rates, and the recently announced €1.1 trillion ($1.33 trillion) ECB quantitative easing (QE) program.
Armed with a long-term perspective, these are just a few reasons to suggest that now is an excellent time to be sifting through the muck of European uncertainty. We remain highly confident in the quality of our portfolio holdings, the value in their underlying assets, and believe that going into the New Year our portfolio is positioned with the potential to deliver real value creation.
Portfolio Construction and Activity
The Fund ended the year with 32 equity (issuer) positions, the top 10 of which represented 46.5% of the Fund’s total net assets. Below please find year-end market cap, geographic region, and strategy breakdowns of the Fund’s portfolio as of December 31, 2014.1
 |  |

_______________
1 Market cap, geographic region and strategy breakdown are show as a percentage of invested capital in equity positions only.
7
Portfolio Review
Spin-off activity was again on the rise in 2014, growing globally from 37 in 2013 to 60 in 20142. We continue to focus on spin-offs, which often are extremely attractive situations, as they are generally not well understood parts of larger companies that can come to the market extremely mispriced.
The Fund participated in a number of spin-offs in 2013, including ING U.S. (now VOYA Financial), which was spun-off from ING Groep NV (also a Fund holding since 2013). In June 2014, ING Groep spun-off another one of its business segments – NN Group NV – via an initial public offering. NN Group is the largest insurance provider in the Netherlands. We participated in the IPO, which was priced at what we believed was an extremely low valuation – under 0.6 times book value. In a very short time, book value has grown to about €45 ($54.45) per share. The company expects to pay between 40 and 50 percent of operating cash flow to shareholders. The underlying insurance businesses are strong. The biggest risk to the stock continues to be litigation from legacy annuity products. We believe the stock is cheap even after factoring in a significant settlement.
The Fund also invested in an interesting arbitrage situation during the year. Alliant Techsystems Inc., primarily a U.S. based defense company, is also the parent of an outdoor and leisure business called Vista Outdoor (“Vista”). The long position the Fund has in Alliant is part of an arbitrage trade to create a Vista spinoff very cheaply, as Alliant and another U.S. based defense business, Orbital Sciences Corp., are scheduled to merge in 2015 and simultaneously spinoff Vista. We have no interest in the defense businesses, but believe Vista is extremely compelling. Today, we can “create” the new Vista by buying Alliant and shorting Orbital and get to “own” it now before it trades on a stand-alone basis. At the time of purchase, Vista was being valued at barely 6 times EBITDA and 9 times earnings. My experience is that investors will generally start focusing on these types of spin-offs once they are on their own and we would expect to see Vista valued closer to where its peers trade, which is about 50% higher. We believe this is one of those unique situations where the opportunity is not in the new merged company, but is actually in the lesser known and misunderstood division that is getting spun-off as a new standalone public company.
The Fund also invested in several interesting restructuring special situations, including Fomento de Construcionnes y Contratas SA (“FCC”) (one of the leading detractors to Fund performance for the year) and Green Brick Partners, Inc. (“Green Brick”) (the leading contributor to Fund performance for the year).
We initiated our position in FCC, a Spain based construction and concession conglomerate, in early 2014. The company is in the midst of a transformative financial and operational restructuring. An acquisition spree in the mid-2000s left the company in an over-leveraged, under-earning state by the end of the decade. In addition to its core businesses of water services, waste collection, and construction, FCC accumulated a portfolio of non-core businesses including cement production, real estate ownership and development, and furniture rental, to name a few. In 2013,
_______________
2 Spinoff Research, January 2015 issue.
8
the controlling shareholder, Esther Koplowitz, brought in Juan Béjar as CEO to sell assets, pay down debt, and refocus the company. We have met Mr. Béjar on several occasions and believe he is one of the best CEOs in Europe with the skills to successfully restructure both financially and operationally. In 2014, Mr. Béjar began selling non-core assets, and consummated a €1 billion ($1.21 billion) rights issue, €765 million ($925.7 million) of which was used to pay down €900 million ($1.09 billion) of debt. As part of the financial restructuring, Carlos Slim, the Mexican billionaire, became a 25.6% owner of the company and Esther Koplowitz went from being a majority investor to a minority investor – a very positive result.
Using a sum of the parts analysis where we look at comparable business transactions and other publicly traded companies’ valuations, we estimate that FCC is worth around €24.00 ($29.04) per share versus €11.75 ($14.22) per share as of year-end. Today, FCC is trading at less than 5 times the depressed cash flows of their best businesses, water and waste treatment, where peers typically trade between 8 and 11 times cash flow. Green Brick is a very interesting situation. The predecessor company was called BioFuels Energy, which was a defunct alternative energy business. David Einhorn from Greenlight Capital took control and recapitalized the business into a large home builder in Atlanta and parts of Texas. We were able to buy this company in the third quarter pre-conversion after documents were filed with the SEC, but still little understood by the market. At the time we initiated our position in the stock, we were creating the new business at less than 7 times earnings with excellent management, and main shareholders that include Greenlight and Dan Loeb’s Third Point, which collectively own 67%. We took advantage of the inherent mispricing by the market of the warrants that were issued to shareholders to create our position extremely cheap.
The Fund’s largest detractor to performance for the year was Sevan Drilling AS. Sevan, a deep water drilling company, suffered a fate similar to most oil exploration companies and sold off meaningfully. Severe downward pressure on the price of oil, along with problems on one of their rigs during the year, caused the stock to decline over 78% in the year. At year end, the stock was trading at less than 2 times earnings and less than 25% of replacement value for its assets. The company has restructured its credit facilities and is running at a higher level of efficiency than at any time in the history of the company. As a result, the Fund continues to hold this position. Unfortunately, due to the volatility of the commodity price, today, investors have little interest in Sevan or other oil related businesses.
Another of the Fund’s top detractors to performance in 2014 was Genworth Financial Inc., the U.S. based multiline insurance company. We decided to exit this position in the fourth quarter at a loss after owning the position for several years. The original thesis centered on the reorganization of their Mortgage Insurance business. Our view was that the stock was trading at a substantial discount to book value and that they would be able to ring fence the mortgage insurance problem, which they were in fact able to do. The stock performed well until late in 2014 when it emerged that the Long Term Care business was having significant issues and might require the company to do a capital raise. This was not part of our original thesis and, as a result, we determined that it was time to move on in spite of the significant discount to book value.
9
Closing Thoughts
In this environment, there are a lot of cheap stocks to be had outside the United States, but you cannot own them all and expect to generate an outsized return. I firmly believe that the key to creating value is found in identifying those certain catalysts that are likely to accrete shareholder value in the years to come. Understanding the nature, potential impact and time frame of such catalysts is the road map to successful special situations investing.
We spend a great deal of time trying to understand management’s appraisal of their business and proposed path. Ultimately, we believe that management is the most important catalyst to value creation and we strive to place our investment capital alongside some of the best operators the world, and especially Europe, have to offer.
In 2014, we made several trips to Europe. Based on these visits, in my opinion, the news headlines have not accurately reflected the underlying improvements in businesses across a variety of sectors that have been years in the making. Beyond improving business fundamentals, we enter 2015 with some significant tailwinds behind European companies – low oil prices, low interest rates, low valuations, increasing M&A and spin-off activity, and a huge ECB mandated quantitative easing program. In our view, these developments represent an inflection point for the prospects of many European companies.
We are nomadic and roam to where we believe the best investment opportunities exist. When we believe they have played out, we move on. We continue to believe that out of crisis comes opportunity. In our opinion, the situation that has evolved out of the crisis in Europe has set the stage for a multiyear opportunity for special situations in the region. The key is to be extremely selective.
And, while many investors are nervous about the U.S. markets, we continue to find selective cases where there are compelling breakup, spinoff, and activist situations in which to invest.
As such, I believe that the special situations in which we have invested, and the opportunities we continue to find, have the potential to provide our Fund shareholders with attractive long term investment returns.
Thank you once again for your ongoing partnership, confidence and support.
Sincerely,

David E. Marcus
Portfolio Manager
10
Management’s Discussion of Fund Performance
For the year ended December 31, 2014, Class I shares of the Evermore Global Value Fund (the “Fund”) were down 6.58% while the MSCI All Country World Index (“MSCI ACWI”) was up 4.16%, and the HFRX Event Driven Index (“HFRX ED”) was down 4.06%.
2014 was a disappointing follow-up to what was a very good 2013. The year started off fine with a continuation of the same positive situations that we had seen in 2013 – an acceleration in restructurings, refocusing by companies, breakups, spinoffs, management changes, and an increase in M&A activity. There was optimism and a cautious sense of recovery. The view was that Europe, having come out of recession in 2013, would see a major pick-up in GDP growth and that, along with other positive developments, would result in meaningful releases of value in select European companies. However, we believe a series of events had a major negative impact on our performance, especially in the second and third quarters of the year.
Russia invaded Crimea/Ukraine. Panic set in quickly. Consumer sentiment fell off a cliff. Sanctions were levied and the economic impact of reduced trade with Russia/Ukraine began to show. People questioned whether Russia might not stop with the invasion of Ukraine. The long expected quantitative easing (“QE”) program from the European Central Bank (“ECB”) did not materialize as expected. Ebola fears that started in Africa began to spread around the world. The positive sentiment we had coming into 2014 quickly vaporized and became fearful and negative, and investor perception shifted to a perspective that the long talked about recovery in Europe would now be pushed out and it would continue to be a tomorrow story, not a today story.
Three of the top five contributors to Fund performance were U.S. positions; two were European positions. Four of the top five detractors to Fund performance were European positions; one was a U.S. position. The largest contributors and detractors to the Fund performance for the year were:
For the Year Ended 12/31/14
| Top 5 Contributors to Performance | Top 5 Detractors to Performance |
| Green Brick Partners, Inc. | Sevan Drilling ASA |
| Compagnie d’Enterprises CFE SA | Genworth Financial Inc. |
| Voya Financial, Inc. | Fomento de Construcionnes y Contratas SA |
| Gramercy Property Trust Inc. | Sky Deutschland AG |
| Ei Towers S.p.A. | Bolloré SA |
A short discussion on several of the contributors and detractors listed above can be found in the Portfolio Manager’s letter to shareholders located at the beginning of this annual report.
11
As of December 31, 2014, the Fund’s ten largest issuer positions were as follows:
Evermore Global Value Fund
Top 10 Positions
| Issuer Position | % of Net Assets |
| Ambac Financial Group, Inc. | 6.6% |
| Vivendi SA | 6.2% |
Alliant Techsystems, Inc.3 | 6.0% |
| NN Group NV | 5.0% |
| Green Brick Partners, Inc. | 5.0% |
| Sky Deutschland AG | 4.8% |
| Fomento de Construcionnes y Contratas SA | 4.5% |
| ING Groep NV | 4.4% |
| Voya Financial, Inc. | 3.9% |
| American International Group, Inc. | 3.7% |
At year-end 2014, the Fund’s cash position stood at 0.6%.
_______________
3 Alliant Techsystems plans to merge with Orbital Sciences (a short position in the Fund as of 12/31/14) and simultaneously will spin-off Vista Outdoor, a leisure equipment and products company, in the first quarter of 2015.
12
Opinions expressed are subject to change at any time, are not guaranteed and should not be considered investment advice.
Past performance does not guarantee future results. Investment performance reflects fee waivers in effect. In the absence of such waivers, total return would be reduced.
Mutual fund investing involves risk. Principal loss is possible. Investments in foreign securities involve greater volatility and political, economic and currency risks and differences in accounting methods. These risks are greater for emerging markets. Investing in smaller companies involves additional risks such as limited liquidity and greater volatility than larger companies. The Fund may make short sales of securities, which involves the risk that losses may exceed the original amount invested. Investments in debt securities typically decrease in value when interest rates rise. This risk is usually greater for longer-term debt securities. Investment in lower-rated, non-rated and distressed securities presents a greater risk of loss to principal and interest than higher-rated securities. Investments in special situations may involve greater risks when compared to other investments if expected developments do not occur. Additional special risks relevant to our Fund involve derivatives and hedging. Please refer to the prospectus for further details.
Please refer to the Schedules of Investments for complete holdings information. Fund holdings and sector allocations are subject to change at any time and are not recommendations to buy or sell any security.
The MSCI All-Country World Index is an unmanaged index comprised of 48 country indices, including 23 developed and 25 emerging market country indices, and is calculated with dividends reinvested after deduction of holding tax. The index is a trademark of Morgan Stanley Capital International and is not available for direct investment.
Hedge Fund Research, Inc. (HFR) utilizes a UCITSIII compliant methodology to construct the HFRX Hedge Fund Indices. The methodology is based on defined and predetermined rules and objective criteria to select and rebalance components to maximize representation of the Hedge Fund Universe. The HFRX Event Driven Index is being used under license from Hedge Fund Research, Inc. which does not approve or endorse the Evermore Global Value Fund.
It is not possible to invest directly in an index.
Cash flow measures the cash generating capability of a company by adding non-cash charges (e.g. depreciation) and interest expense to pretax income. “EBIT” is the acronym for earnings before taxes and interest. “EBITDA” is the acronym for earnings before interest, taxes, depreciation and amortization. “Book Value” is calculated by subtracting a company’s liabilities from its assets. “Price to Book Value” is a ratio used to compare a stock’s market value to its book value. It is calculated by dividing the current closing price of the stock by the latest quarter’s book value per share.
Must be preceded or accompanied by a prospectus.
The Evermore Global Value Fund is distributed by Quasar Distributors, LLC. Quasar Distributors, LLC is affiliated with U.S. Bancorp Fund Services, LLC and U.S. Bank N.A.
13
Evermore Global Value Fund
| SECTOR ALLOCATION* as a Percentage of Net Assets at December 31, 2014 (Unaudited) |
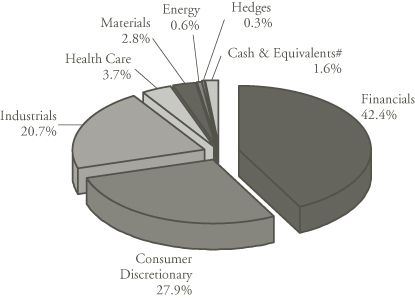
*Does not include security sold short.
#Cash equivalents and other assets less liabilities.
14
Evermore Global Value Fund
| EXPENSE EXAMPLE for the Six Months Ended December 31, 2014 (Unaudited) |
As a shareholder of the Evermore Global Value Fund (the “Fund”), you incur two types of costs: (1) transaction costs, including sales charges or loads; and (2) ongoing costs, including investment advisory fees, distribution fees, and other Fund expenses. This example is intended to help you understand your ongoing costs (in dollars) of investing in the Fund and to compare these costs with the ongoing costs of investing in other mutual funds. The example is based on an investment of $1,000 invested at the beginning of the period and held for the entire period (7/1/14 – 12/31/14).
Actual Expenses
The first line of the table below provides information about actual account values based on actual returns and actual expenses. You will be assessed fees for outgoing wire transfers, returned checks and stop payment orders at prevailing rates charged by U.S. Bancorp Fund Services, LLC, the Fund’s transfer agent. If you request a redemption be made by wire transfer, currently a $15.00 fee is charged by the Fund’s transfer agent. You will be charged a redemption fee equal to 2% of the net amount of the redemption if you redeem shares less than 30 calendar days after you purchase them. An Individual Retirement Account (“IRA”) will be charged a $15.00 annual maintenance fee. To the extent the Fund invests in shares of other investment companies as part of its investment strategy, you will indirectly bear your proportionate share of any fees and expenses charged by the underlying funds in which the Fund invests in addition to the expenses of the Fund. Actual expenses of the underlying funds may vary. These expenses are not included in the example below. The example below includes, but is not limited to, investment advisory fees, shareholder servicing fees, fund accounting fees, custody fees and transfer agent fees. However, the example below does not include portfolio trading commissions and related expenses, and other extraordinary expenses as determined under generally accepted accounting principles. You may use the information in this line, together with the amount you invested, to estimate the expenses that you paid over the period. Simply divide your account value by $1,000 (for example, an $8,600 account value divided by $1,000 = 8.6), then multiply the result by the number in the first line under the heading entitled “Expenses Paid During the Period” to estimate the expenses you paid on your account during this period.
Hypothetical Example for Comparison Purposes
The second line of the table below provides information about hypothetical account values and hypothetical expenses based on the Fund’s actual expense ratios and an assumed rate of return of 5% per year before expenses, which is not the Fund’s actual return. The hypothetical account value and expenses may not be used to estimate the actual ending account balance or expenses you paid for the period. You may use this information to compare the ongoing costs of investing in the Fund and other funds. To do so, compare this 5% hypothetical example with the 5% hypothetical examples
15
Evermore Global Value Fund
| EXPENSE EXAMPLE for the Six Months Ended December 31, 2014 (Unaudited), Continued |
that appear in the shareholder reports of the other funds. Please note that the expenses shown in the table are meant to highlight your ongoing costs only and do not reflect any transactional costs, such as sales charges (loads), redemption fees or exchange fees. Therefore, the second line of the table is useful in comparing ongoing costs only and will not help you determine the relative total costs of owning different funds. In addition, if these transactional costs were included, your costs would have been higher.
| Beginning | Ending | Expenses Paid | |
| Account Value | Account Value | During the Period | |
| 7/1/14 | 12/31/14 | 7/1/14 – 12/31/14* | |
| Class A Actual | $1,000 | $ 930 | $7.78 |
| Class A Hypothetical (5% annual | |||
| return before expenses) | $1,000 | $1,017 | $8.13 |
| Class I Actual | $1,000 | $ 931 | $6.57 |
| Class I Hypothetical (5% annual | |||
| return before expenses) | $1,000 | $1,018 | $6.87 |
| * | Expenses are equal to the Fund’s expense ratios for the most recent six-month period, including interest expense and dividend expense on securities sold short, of 1.61% for Class A shares and 1.36% forClass I shares multiplied by the average account value over the period multiplied by 184/365 (to reflect the one-half year period). |
16
Evermore Global Value Fund
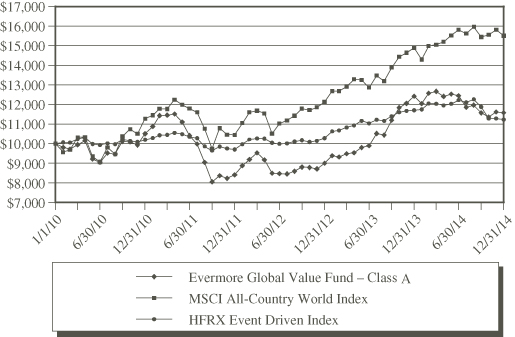
Value of $10,000 vs. MSCI All-Country World Index &
HFRX Event Driven Index (Unaudited)
| Total Annualized | Since | Value of | |||
| Returns Year Ended | Inception | $10,000 | |||
| December 31, 2014 | 1 Year | 3 Year | 5 Year | (1/1/2010) | (12/31/14) |
| Class A | (6.83)% | 11.25% | 2.97% | 2.97% | $11,573 |
| Class A | |||||
| (with sales charge*) | (11.46)% | 9.35% | 1.91% | 1.91% | $10,444 |
| Class I | (6.58)% | 11.57% | 3.21% | 3.21% | $11,713 |
| MSCI All-Country | |||||
| World Index | 4.16% | 14.10% | 9.17% | 9.17% | $15,506 |
| HFRX Event | |||||
| Driven Index | (4.06)% | 5.00% | 2.30% | 2.30% | $11,226 |
| * | The maximum sales charge (load) imposed on a purchase is 5.00%. |
This chart illustrates the performance of a hypothetical $10,000 investment made on January 1, 2010, and is not intended to imply any future performance. The returns shown do not reflect the deduction of taxes that a shareholder would pay on fund distributions or the redemption of fund shares. The returns reflect fee waivers/recoupments in effect. In the absence of such waivers/recoupments, total return would be reduced. The chart assumes reinvestment of capital gains and dividends for a fund and dividends for an index.
17
Evermore Global Value Fund
| SCHEDULE OF INVESTMENTS at December 31, 2014 |
| Market | |||||||
| Shares | Value# | ||||||
| COMMON STOCKS – 92.8% | |||||||
| Aerospace & Defense – 6.0% | |||||||
| 121,006 | Alliant | ||||||
| Techsystems, Inc. | |||||||
| (United States) | $ | 14,066,948 | |||||
| Asset Management & | |||||||
| Custody Banks – 5.3% | |||||||
| 13,524,484 | SC Fondul | ||||||
| Proprietatea SA | |||||||
| (Romania) | 3,259,972 | ||||||
| 213,600 | Voya Financial, Inc. | ||||||
| (United States) | 9,052,368 | ||||||
| 12,312,340 | |||||||
| Cable & Satellite – 4.8% | |||||||
| 1,386,427 | Sky Deutschland | ||||||
AG (Germany)*1 | 11,199,750 | ||||||
| Casinos & Gaming – 5.2% | |||||||
| 800,898 | OPAP SA (Greece) | 8,582,685 | |||||
| 231,900 | Universal | ||||||
| Entertainment | |||||||
| Corp. (Japan) | 3,466,147 | ||||||
| 12,048,832 | |||||||
| Construction & Engineering – 10.9% | |||||||
| 76,814 | Compagnie | ||||||
| d’Enterprises | |||||||
| (Belgium) | 7,870,579 | ||||||
| 738,886 | Fomento de | ||||||
| Contrucciones | |||||||
| (Spain)* | 10,433,708 | ||||||
| 3,276,920 | Maire Tecnimont | ||||||
| SpA (Italy)* | 7,064,520 | ||||||
| 25,368,807 | |||||||
| Diversified Financial Services – 4.4% | |||||||
| 784,700 | ING Groep NV | ||||||
(Netherlands)*1 | 10,138,086 | ||||||
| General Merchandise Stores – 2.6% | |||||||
| 278,157 | Retail Holdings | ||||||
NV (Hong Kong)2 | 6,119,454 | ||||||
| Health Care Providers | |||||||
| & Services – 3.7% | |||||||
| 497,327 | Lifco AB (Sweden)* | 8,580,598 | |||||
| Home Building – 5.0% | |||||||
| 1,415,353 | Green Brick | ||||||
| Partners, Inc. | |||||||
| (United States)* | 11,605,895 | ||||||
| Industrial Conglomerates – 3.7% | |||||||
| 7,800 | Bollore Protection | ||||||
| SA (France)* | 35,522 | ||||||
| 1,044,300 | Bollore SA | ||||||
(France)1 | 4,755,852 | ||||||
| 27,711,000 | K1 Ventures Ltd. | ||||||
| (Singapore) | 3,894,623 | ||||||
| 8,685,997 | |||||||
| Insurance – 13.5% | |||||||
| 527,731 | Ambac Financial | ||||||
| Group, Inc. | |||||||
(United States)*1 | 12,929,409 | ||||||
| 394,100 | NN Group NV | ||||||
(Netherlands)*1 | 11,765,291 | ||||||
| 706,440 | UNIQA Insurance | ||||||
| Group AG | |||||||
| (Austria) | 6,629,964 | ||||||
| 31,324,664 | |||||||
| Media – 10.3% | |||||||
| 376,190 | Havas SA (France) | 3,071,844 | |||||
| 7,128,484 | Promotora de | ||||||
| Informaciones SA | |||||||
| (Spain)* | 2,211,891 | ||||||
| 3,683,197 | Promotora de | ||||||
| Informaciones SA – | |||||||
| Class A – | |||||||
| (Spain) ADR* | 4,309,340 | ||||||
| 581,666 | Vivendi SA | ||||||
| (France) | 14,478,012 | ||||||
| 24,071,087 | |||||||
| Metals & Mining – 2.8% | |||||||
| 257,400 | ThyssenKrupp | ||||||
| AG (Germany) | 6,556,983 | ||||||
The accompanying notes are an integral part of these financial statements.
18
Evermore Global Value Fund
| SCHEDULE OF INVESTMENTS at December 31, 2014, Continued |
| Market | |||||||
| Shares | Value# | ||||||
| Multi-line Insurance – 3.7% | |||||||
| 155,300 | American | ||||||
| International | |||||||
| Group, Inc. | |||||||
| (United States) | $ | 8,698,353 | |||||
| Oil & Gas Drilling – 0.6% | |||||||
| 10,392,243 | Sevan Drilling AS | ||||||
| (Norway)* | 1,490,245 | ||||||
| Other Diversified Financial | |||||||
| Services – 5.3% | |||||||
| 45,183 | Ackermans & | ||||||
| van Haaren NV | |||||||
| (Belgium) | 5,571,346 | ||||||
| 465,900 | American | ||||||
| Capital Ltd. | |||||||
(United States)*1 | 6,806,799 | ||||||
| 12,378,145 | |||||||
| Real Estate Management | |||||||
| & Development – 5.0% | |||||||
| 2,109,035 | Deutsche Office | ||||||
| AG (Germany)* | 7,451,742 | ||||||
| 1,520,000 | Selvaag Bolig AS | ||||||
| (Norway) | 4,099,289 | ||||||
| 11,551,031 | |||||||
| TOTAL COMMON STOCKS | |||||||
| (Cost $211,055,534) | 216,197,215 | ||||||
| PARTNERSHIPS & TRUSTS – 4.2% | |||||||
| Real Estate Investment Trusts – 4.2% | |||||||
| 1,045,172 | Gramercy Property | ||||||
| Trust, Inc. | |||||||
| (United States) | 7,211,687 | ||||||
| 199,000 | Saltangen Property | ||||||
(Sweden)*2 | 2,552,738 | ||||||
| TOTAL PARTNERSHIPS | |||||||
| & TRUSTS | |||||||
| (Cost $7,449,401) | 9,764,425 | ||||||
| WARRANTS – 1.1% | |||||||
| Insurance – 1.1% | |||||||
| 174,371 | Ambac Financial | ||||||
| Group, Inc., | |||||||
| Expiration: | |||||||
| April, 2023, | |||||||
| Exercise Price: | |||||||
| $16.67 | |||||||
| (United States)* | 2,484,787 | ||||||
| TOTAL WARRANTS | |||||||
| (Cost $2,729,833) | 2,484,787 | ||||||
| Contracts | |||||||
| CALL OPTIONS PURCHASED – 0.2% | |||||||
| Hedges – 0.1% | |||||||
| 3,000 | CurrencyShare | ||||||
| Swiss Franc, | |||||||
| Expiration: | |||||||
| March, 2015, | |||||||
| Strike Price: | |||||||
| 107 CHF | |||||||
(Switzerland)3 | 22,500 | ||||||
| 900 | iShares 20+ Year | ||||||
| Treasury Bond | |||||||
| Fund, Expiration: | |||||||
| March, 2015, | |||||||
| Strike Price: | |||||||
| $124 | |||||||
(United States)3 | 339,750 | ||||||
| 362,250 | |||||||
| Multi-line Insurance – 0.1% | |||||||
| 4,450 | Genworth | ||||||
| Financial, Inc., | |||||||
| Expiration: | |||||||
| January, 2016, | |||||||
| Strike Price: | |||||||
| $15 | |||||||
(United States)3 | 122,375 | ||||||
| TOTAL CALL OPTIONS | |||||||
| PURCHASED | |||||||
| (Cost $1,158,773) | 484,625 | ||||||
The accompanying notes are an integral part of these financial statements.
19
Evermore Global Value Fund
| SCHEDULE OF INVESTMENTS at December 31, 2014, Continued |
| Market | |||||||
| Contracts | Value# | ||||||
| PUT OPTIONS PURCHASED – 0.1% | |||||||
| Hedges – 0.1% | |||||||
| 440 | DAX 03/20/15 | ||||||
| P8600, | |||||||
| Expiration: | |||||||
| March, 2015, | |||||||
| Strike Price: | |||||||
| 8600 EUR | |||||||
(Germany)4 | $ | 230,007 | |||||
| TOTAL PUT OPTIONS | |||||||
| PURCHASED | |||||||
| (Cost $788,041) | 230,007 | ||||||
| SHORT-TERM INVESTMENT – 0.6% | |||||||
| Money Market Fund – 0.6% | |||||||
| 1,439,556 | Invesco Liquid | ||||||
| Assets Portfolio – | |||||||
| Institutional | |||||||
Class, 0.07%5 | $ | 1,439,556 | |||||
| TOTAL SHORT-TERM | |||||||
| INVESTMENT | |||||||
| (Cost $1,439,556) | 1,439,556 | ||||||
| TOTAL INVESTMENTS | |||||||
| IN SECURITIES – 99.0% | |||||||
| (Cost $224,621,138) | 230,600,615 | ||||||
| Other Assets in Excess | |||||||
| of Liabilities – 1.0% | 2,443,740 | ||||||
| TOTAL NET | |||||||
| ASSETS – 100.0% | $ | 233,044,355 | |||||
| # | See Significant Accounting Policies of accompanying Notes to Financial Statements regarding valuation of securities. |
| * | Non-income producing security. |
| ADR | American Depositary Receipt |
| CHF | Swiss Franc |
| EUR | Euro |
| 1 | All or a portion of this security was segregated as collateral for forward foreign currency contract. |
| 2 | Affiliated company as defined by the Investment Company Act of 1940. |
| 3 | 100 shares per contract. |
| 4 | 5 shares per contract. |
| 5 | Seven-day yield as of December 31, 2014. |
The Global Industry Classification Standard (GICS®) was developed by and/or is the exclusive property of MSCI, Inc. and Standard & Poor Financial Services LLC (“S&P”). GICS® is a service mark of MSCI, Inc. and S&P and has been licensed for use by the Fund’s Administrator, U.S. Bancorp Fund Services, LLC.
| SCHEDULE OF SECURITY SOLD BUT NOT YET PURCHASED at December 31, 2014 |
| Shares | Value | ||||||
| SECURITY SOLD BUT NOT | |||||||
| YET PURCHASED – 3.1% | |||||||
| Aerospace & Defense – 3.1% | |||||||
| 269,499 | Orbital Sciences Corp. | ||||||
| (United States)* | $ | 7,246,828 | |||||
| TOTAL SECURITY SOLD | |||||||
| BUT NOT YET PURCHASED | |||||||
| (Proceeds $6,854,372) | $ | 7,246,828 | |||||
| * | Non-income producing security. |
The accompanying notes are an integral part of these financial statements.
20
Evermore Global Value Fund
| COUNTRY ALLOCATION at December 31, 2014 |
| Country | Long Exposure | Short Exposure^ | Net Exposure | ||||||||||
| United States | 33.0 | % | 3.3 | % | 29.7 | % | |||||||
| Germany | 11.5 | % | — | 11.5 | % | ||||||||
| France | 10.1 | % | — | 10.1 | % | ||||||||
| Netherlands | 9.9 | % | — | 9.9 | % | ||||||||
| Spain | 7.6 | % | — | 7.6 | % | ||||||||
| Belgium | 6.1 | % | — | 6.1 | % | ||||||||
| Sweden | 5.0 | % | — | 5.0 | % | ||||||||
| Greece | 3.9 | % | — | 3.9 | % | ||||||||
| Italy | 3.2 | % | — | 3.2 | % | ||||||||
| Austria | 3.0 | % | — | 3.0 | % | ||||||||
| Hong Kong | 2.8 | % | — | 2.8 | % | ||||||||
| Norway | 2.5 | % | — | 2.5 | % | ||||||||
| Singapore | 1.7 | % | — | 1.7 | % | ||||||||
| Japan | 1.5 | % | — | 1.5 | % | ||||||||
| Romania | 1.5 | % | — | 1.5 | % | ||||||||
| Switzerland# | 0.0 | % | — | 0.0 | % | ||||||||
| Total | 103.3 | % | 3.3 | % | 100.0 | % | |||||||
| ^ | Securities sold but not yet purchased. |
| # | Less than 0.1%. |
| FORWARD FOREIGN CURRENCY CONTRACTS at December 31, 2014 |
As of December 31, 2014, the Fund had the following forward currency contracts outstanding with Morgan Stanley:
| Amount | Amount | ||||||||||||||||||
| of | of | Net | |||||||||||||||||
| Currency | Currency | Settle- | Currency | Currency | Unrealized | ||||||||||||||
| to be | to be | ment | to be | to be | Fair | Appreciation | |||||||||||||
| Received | Received | Date | Delivered | Delivered | Value | (Depreciation) | |||||||||||||
| EUR | 7,000,000 | 3/11/15 | USD | 8,712,900 | $ | 8,475,807 | $ | (237,093 | ) | ||||||||||
| USD | 131,879,516 | 3/11/15 | EUR | 105,667,600 | 127,945,464 | 3,934,052 | |||||||||||||
| USD | 3,772,571 | 3/11/15 | JPY | 431,200,000 | 3,602,170 | 170,401 | |||||||||||||
| NOK | 11,600,000 | 3/11/15 | USD | 1,632,178 | 1,553,315 | (78,863 | ) | ||||||||||||
| USD | 7,289,405 | 3/11/15 | NOK | 50,004,000 | 6,695,857 | 593,548 | |||||||||||||
| RON | 1,500,000 | 3/11/15 | USD | 416,782 | 404,234 | (12,548 | ) | ||||||||||||
| USD | 3,861,840 | 3/11/15 | RON | 13,730,000 | 3,700,094 | 161,746 | |||||||||||||
| USD | 11,148,315 | 3/11/15 | SEK | 83,809,600 | 10,753,651 | 394,664 | |||||||||||||
| SGD | 635,000 | 3/11/15 | USD | 489,625 | 478,781 | (10,844 | ) | ||||||||||||
| USD | 4,393,880 | 3/11/15 | SGD | 5,678,400 | 4,281,438 | 112,442 | |||||||||||||
| Net Value of Outstanding Forward Currency Contracts | $ | 167,890,811 | $ | 5,027,505 | |||||||||||||||
| EUR | Euro |
| JPY | Japanese Yen |
| NOK | Norwegian Krone |
| RON | Romanian New Leu |
| SGD | Singapore Dollar |
| SEK | Sweedish Krona |
| USD | U.S. Dollars |
The accompanying notes are an integral part of these financial statements.
21
Evermore Global Value Fund
| STATEMENT OF ASSETS AND LIABILITIES at December 31, 2014 |
| ASSETS | ||||
| Investments in unaffiliated securities, at value^ (Note 2) | $ | 221,928,423 | ||
| Investments in affiliated securities, at value * | 8,672,192 | |||
| Total investments, at value | 230,600,615 | |||
| Unrealized gain on forward foreign currency contracts | 5,366,853 | |||
| Receivables: | ||||
| Investment securities sold | 30,928 | |||
| Fund shares sold | 180,891 | |||
| Dividends and interest, net | 124,563 | |||
| Due from broker, net | 7,496,979 | |||
| Prepaid expenses | 67,883 | |||
| Total assets | 243,868,712 | |||
| LIABILITIES | ||||
| Unrealized loss on forward foreign currency contracts | 339,348 | |||
| Securities sold but not yet purchased, at market value# | 7,246,828 | |||
| Payables: | ||||
| Investment securities purchased | 386,624 | |||
| Foreign currency payable | 1,985 | |||
| Fund shares redeemed | 2,536,951 | |||
| Investment advisory fees, net | 156,279 | |||
| Administration fees | 20,751 | |||
| Custody fees | 19,244 | |||
| Distribution fees | 7,098 | |||
| Fund accounting fees | 10,434 | |||
| Transfer agent fees | 12,793 | |||
| Other accrued expenses | 86,022 | |||
| Total liabilities | 10,824,357 | |||
| NET ASSETS | $ | 233,044,355 | ||
| COMPONENTS OF NET ASSETS | ||||
| Paid-in capital | $ | 236,333,588 | ||
| Accumulated net investment income | 2,113,119 | |||
| Accumulated net realized loss on investments, foreign | ||||
| currency transactions & forward foreign currency contracts | (16,008,004 | ) | ||
| Net unrealized appreciation on investments, foreign | ||||
| currency translations & forward foreign currency contracts | 10,605,652 | |||
| Net assets | $ | 233,044,355 | ||
| ^ Cost of unaffiliated investments | $ | 217,741,980 | ||
| * Cost of affiliated investments | $ | 6,879,158 | ||
| # Proceeds received | $ | 6,854,372 | ||
The accompanying notes are an integral part of these financial statements.
22
Evermore Global Value Fund
| STATEMENT OF ASSETS AND LIABILITIES at December 31, 2014, Continued |
| Class A: | ||||
| Net assets | $ | 33,076,601 | ||
| Shares issued and outstanding (unlimited number | ||||
| of shares authorized without par value) | 3,145,539 | |||
| Net asset value, and redemption price per share | $ | 10.52 | ||
| Maximum offering price per share* | $ | 11.07 | ||
| Class I: | ||||
| Net assets | $ | 199,967,754 | ||
| Shares issued and outstanding (unlimited number | ||||
| of shares authorized without par value) | 18,926,058 | |||
| Net asset value, offering price, and redemption price per share | $ | 10.57 | ||
| * | The maximum offering price per share is calculated as the net asset value per share as of December 31, 2014 divided by (1-front-end sales charge (5%)): $10.52/95.00%. In addition, Class A share investments of $1 million or more, which are purchased at Net Asset Value, are subject to a 0.75% contingent deferred sales charge (“CDSC”) if redeemed within 12 months. |
The accompanying notes are an integral part of these financial statements.
23
(This Page Intentionally Left Blank.)
24
Evermore Global Value Fund
| STATEMENT OF OPERATIONS for the Year Ended December 31, 2014 |
| INVESTMENT INCOME* | ||||
| Income | ||||
| Dividends (net of $169,320 foreign withholding tax) | $ | 2,313,330 | ||
| Interest | 60,186 | |||
| Other income | 699 | |||
| Total investment income | 2,374,215 | |||
| EXPENSES (Note 3) | ||||
| Investment advisory fees | 2,299,230 | |||
| Administration fees | 124,182 | |||
| Transfer agent fees | 119,747 | |||
| Custody fees | 156,205 | |||
| Legal fees | 108,121 | |||
| Distribution fees – Class A | 84,987 | |||
| Registration fees | 81,252 | |||
| Fund accounting fees | 67,550 | |||
| Audit fees | 41,393 | |||
| Chief Compliance Officer fees | 47,953 | |||
| Reports to shareholders | 23,711 | |||
| Trustee fees | 32,022 | |||
| Insurance expense | 28,100 | |||
| Miscellaneous expenses | 4,822 | |||
| Interest expense to broker | 12 | |||
| Total expenses | 3,219,287 | |||
| Plus expenses recouped | 32,229 | |||
| Net expenses | 3,251,516 | |||
| Net investment loss | (877,301 | ) | ||
| REALIZED AND UNREALIZED GAIN (LOSS) ON | ||||
| INVESTMENTS, FOREIGN CURRENCY TRANSACTIONS, | ||||
| FORWARD FOREIGN CURRENCY CONTRACTS | ||||
| & SECURITIES SOLD BUT NOT YET PURCHASED | ||||
| Net realized gain on investments, foreign currency | ||||
| transactions & forward foreign currency contracts* | 4,851,515 | |||
| Net realized loss on securities sold but not yet purchased | (207,022 | ) | ||
| Change in net unrealized depreciation on investments, foreign | ||||
| currency translations & forward foreign currency contracts | (20,246,546 | ) | ||
| Net realized and unrealized loss on investments, foreign | ||||
| currency transactions, forward foreign currency contracts & securities | ||||
| sold but not yet purchased | (15,602,053 | ) | ||
| Net decrease in net assets resulting from operations | $ | (16,479,354 | ) | |
| * No affiliated transactions recorded. | ||||
The accompanying notes are an integral part of these financial statements.
25
Evermore Global Value Fund
| STATEMENTS OF CHANGES IN NET ASSETS |
| Year Ended | Year Ended | |||||||
| December 31, | December 31, | |||||||
| 2014 | 2013 | |||||||
| INCREASE (DECREASE) IN NET ASSETS FROM: | ||||||||
| OPERATIONS | ||||||||
| Net investment income (loss) | $ | (877,301 | ) | $ | 491,277 | |||
| Net realized gain on investments, foreign currency | ||||||||
| transactions, forward foreign currency contracts & | ||||||||
| securities sold but not yet purchased | 4,644,493 | (1,234,992 | ) | |||||
| Change in net unrealized depreciation on investments, foreign | ||||||||
| currency translations & forward foreign currency contracts | (20,246,546 | ) | 34,910,034 | |||||
| Net decrease in net assets resulting from operations | (16,479,354 | ) | 34,166,319 | |||||
| DISTRIBUTIONS TO SHAREHOLDERS | ||||||||
| From net investment income: | ||||||||
| Class A | (1,590,274 | ) | — | |||||
| Class I | (10,411,345 | ) | — | |||||
| Total distributions from net investment income | (12,001,619 | ) | — | |||||
| Total distributions to shareholders | (12,001,619 | ) | — | |||||
| CAPITAL SHARE TRANSACTIONS (Note 3) | ||||||||
| Net increase in net assets derived from net change in | ||||||||
| outstanding shares – Class A (a) | 8,809,495 | 7,678,409 | ||||||
| Net decrease in net assets derived from net change in | ||||||||
| outstanding shares – Class C (a) | — | (229,111 | ) | |||||
| Net increase in net assets derived from net change in | ||||||||
| outstanding shares – Class I (a) | 97,100,731 | 33,641,063 | ||||||
| Total increase in net assets | ||||||||
| from capital share transactions | 105,910,226 | 41,090,361 | ||||||
| Total increase in net assets | 77,429,253 | 75,256,680 | ||||||
| NET ASSETS | ||||||||
| Beginning of year | 155,615,102 | 80,358,422 | ||||||
| End of year | $ | 233,044,355 | $ | 155,615,102 | ||||
| Undistributed net investment income | $ | 2,113,119 | $ | 579,392 | ||||
The accompanying notes are an integral part of these financial statements.
26
Evermore Global Value Fund
| STATEMENTS OF CHANGES IN NET ASSETS, Continued |
| (a) | Summary of capital share transactions is as follows: |
| Year Ended | Year Ended | |||||||||||||||
| December 31, 2014 | December 31, 2013 | |||||||||||||||
| Class A | Shares | Value | Shares | Value | ||||||||||||
| Shares sold | 1,764,178 | $ | 20,264,915 | 1,187,490 | $ | 11,536,000 | ||||||||||
| Shares issued in reinvestment | ||||||||||||||||
| of distributions | 147,537 | 1,518,160 | — | — | ||||||||||||
Shares redeemed1 | (1,151,424 | ) | (12,973,580 | ) | (396,657 | ) | (4,078,308 | ) | ||||||||
| Transfer in from Class C* | — | — | 24,606 | 220,717 | ||||||||||||
| Net increase | 760,291 | $ | 8,809,495 | 815,439 | $ | 7,678,409 | ||||||||||
| Year Ended | Year Ended | |||||||||||||||
| December 31, 2014 | December 31, 2013 | |||||||||||||||
| Class C | Shares | Value | Shares | Value | ||||||||||||
| Shares sold | — | $ | — | 3,396 | $ | 30,000 | ||||||||||
| Shares issued in reinvestment | ||||||||||||||||
| of distributions | — | — | — | — | ||||||||||||
| Shares redeemed | — | — | (4,251 | ) | (38,394 | ) | ||||||||||
| Transfer out to Class A* | — | — | (24,912 | ) | (220,717 | ) | ||||||||||
| Net increase | — | $ | — | (25,767 | ) | $ | (229,111 | ) | ||||||||
| Year Ended | Year Ended | |||||||||||||||
| December 31, 2014 | December 31, 2013 | |||||||||||||||
| Class I | Shares | Value | Shares | Value | ||||||||||||
| Shares sold | 11,451,084 | $ | 133,511,275 | 6,109,680 | $ | 63,872,436 | ||||||||||
| Shares issued in reinvestment | ||||||||||||||||
| of distributions | 985,879 | 10,193,991 | — | — | ||||||||||||
Shares redeemed2 | (4,212,987 | ) | (46,604,535 | ) | (3,147,139 | ) | (30,231,373 | ) | ||||||||
| Net increase | 8,223,976 | $ | 97,100,731 | 2,962,541 | $ | 33,641,063 | ||||||||||
| 1 | Net of redemption fees of $143 and $72, respectively. |
| 2 | Net of redemption fees of $2,150 and $830, respectively. |
| * | Effective April 2, 2013, the Evermore Global Value Fund converted the Class C shares into theClass A shares. |
The accompanying notes are an integral part of these financial statements.
27
Evermore Global Value Fund
| FINANCIAL HIGHLIGHTS For a capital share outstanding throughout the year |
CLASS A
| Year Ended December 31, | ||||||||||||||||||||
| 2014 | 2013 | 2012 | 2011 | 2010 | * | |||||||||||||||
| Net asset value, | ||||||||||||||||||||
| beginning of year | $ | 11.85 | $ | 8.59 | $ | 8.31 | $ | 10.50 | $ | 10.00 | ||||||||||
| INCOME FROM INVESTMENT OPERATIONS | ||||||||||||||||||||
| Net investment income (loss)** | (0.07 | ) | 0.03 | 0.31 | 0.14 | 0.02 | ||||||||||||||
| Net realized and unrealized | �� | |||||||||||||||||||
| gain (loss) on investments | (0.73 | ) | 3.23 | 0.29 | (2.25 | ) | 0.48 | |||||||||||||
| Total from | ||||||||||||||||||||
| investment operations | (0.80 | ) | 3.26 | 0.60 | (2.11 | ) | 0.50 | |||||||||||||
| LESS DISTRIBUTIONS | ||||||||||||||||||||
| From net investment income | (0.53 | ) | — | (0.28 | ) | (0.08 | ) | — | ||||||||||||
| Return of capital | — | — | (0.04 | ) | — | — | ||||||||||||||
| Total distributions | (0.53 | ) | — | (0.32 | ) | (0.08 | ) | — | ||||||||||||
| Paid-in capital from | ||||||||||||||||||||
| redemption fees (Note 2) | 0.00 | 1 | 0.00 | 1 | 0.00 | 1 | 0.00 | 1 | 0.00 | 1 | ||||||||||
| Net asset value, end of year | $ | 10.52 | $ | 11.85 | $ | 8.59 | $ | 8.31 | $ | 10.50 | ||||||||||
| Total return without sales load | (6.83 | )% | 37.95 | % | 7.24 | % | (20.04 | )% | 5.00 | % | ||||||||||
| Total return with sales load | (11.46 | )% | 31.08 | % | 1.85 | % | (24.02 | )% | (0.28 | )% | ||||||||||
| SUPPLEMENTAL DATA | ||||||||||||||||||||
| Net assets, | ||||||||||||||||||||
| end of year (thousands) | $ | 33,077 | $ | 28,258 | $ | 13,491 | $ | 5,331 | $ | 3,651 | ||||||||||
| Portfolio turnover rate | 42 | % | 54 | % | 45 | % | 94 | % | 77 | % | ||||||||||
The accompanying notes are an integral part of these financial statements.
28
Evermore Global Value Fund
| FINANCIAL HIGHLIGHTS For a capital share outstanding throughout the year, Continued |
CLASS A
| Year Ended December 31, | ||||||||||||||||||||
2014 | 2013 | 2012 | 2011 | 2010* | ||||||||||||||||
| RATIO OF EXPENSES TO AVERAGE NET ASSETS | ||||||||||||||||||||
Before expenses absorbed2,6 | 1.60 | % | 1.81 | % | 2.13 | % | 2.24 | % | 3.60 | % | ||||||||||
After expenses absorbed3,6 | — | 1.62 | % | 1.61 | % | 1.70 | % | 1.62 | % | |||||||||||
After expenses recouped3,6 | 1.61 | % | — | — | — | — | ||||||||||||||
| RATIO OF NET INVESTMENT INCOME (LOSS) TO AVERAGE NET ASSETS | ||||||||||||||||||||
Before expenses absorbed4,6 | (0.59 | )% | 0.09 | % | 3.07 | %7 | 0.94 | % | (1.59 | )% | ||||||||||
After expenses absorbed5,6 | — | 0.28 | % | 3.59 | %7 | 1.48 | % | 0.39 | % | |||||||||||
After expenses recouped5,6 | (0.60 | )% | — | — | — | — | ||||||||||||||
| * | Fund commenced operations on January 1, 2010. |
| ** | Calculated using the average shares outstanding method. |
| 1 | Amount less than $0.01. |
| 2 | The ratio of expenses to average net assets before expenses absorbed includes interest expense. The ratio excluding interest expense was 1.59% for the year ended December 31, 2014; and 1.79%, 2.12%, 2.14% and 3.58% for the years ended December 31, 2013, 2012, 2011 and 2010, respectively. |
| 3 | The ratio of expenses to average net assets after expenses absorbed/recouped includes interest expense. The ratio excluding interest expense was 1.60% for the year ended December 31, 2014; and 1.60%, 1.60%, 1.60% and 1.60% for the years ended December 31, 2013, 2012, 2011 and 2010, respectively. |
| 4 | The ratio of net investment income (loss) to average net assets before expenses absorbed includes interest expense. The ratio excluding interest expense was (0.57)% for the year ended December 31, 2014; and 0.11%, 3.08%, 1.04% and (1.57)% for the years ending December 31, 2013, 2012, 2011 and 2010, respectively. |
| 5 | The ratio of net investment income to average net assets after expenses absorbed/recouped includes interest expense. The ratio excluding interest expense was (0.58)% for the year ended December 31, 2014; and 0.30%, 3.60%, 1.58% and 0.41% for the years ending December 31, 2013, 2012, 2011 and 2010, respectively. |
| 6 | Does not include expenses of the investment companies in which the Fund invests. |
| 7 | Certain prior period ratios have been corrected. |
The accompanying notes are an integral part of these financial statements.
29
Evermore Global Value Fund
| FINANCIAL HIGHLIGHTS For a capital share outstanding throughout the year |
CLASS I
| Year Ended December 31, | ||||||||||||||||||||
| 2014 | 2013 | 2012 | 2011 | 2010* | ||||||||||||||||
| Net asset value, | ||||||||||||||||||||
| beginning of year | $ | 11.90 | $ | 8.61 | $ | 8.32 | $ | 10.52 | $ | 10.00 | ||||||||||
| INCOME FROM INVESTMENT OPERATIONS | ||||||||||||||||||||
| Net investment income (loss)** | (0.04 | ) | 0.05 | 0.34 | 0.17 | 0.03 | ||||||||||||||
| Net realized and unrealized | ||||||||||||||||||||
| gain (loss) on investments | (0.69 | ) | 3.24 | 0.28 | (2.26 | ) | 0.49 | |||||||||||||
| Total from | ||||||||||||||||||||
| investment operations | (0.73 | ) | 3.29 | 0.62 | (2.09 | ) | 0.52 | |||||||||||||
| LESS DISTRIBUTIONS | ||||||||||||||||||||
| From net investment income | (0.60 | ) | — | (0.29 | ) | (0.11 | ) | — | ||||||||||||
| Return of capital | — | — | (0.04 | ) | — | — | ||||||||||||||
| Total distributions | (0.60 | ) | — | (0.33 | ) | (0.11 | ) | — | ||||||||||||
| Paid-in capital from | ||||||||||||||||||||
| redemption fees (Note 2) | 0.00 | 1 | 0.00 | 1 | 0.00 | 1 | — | — | ||||||||||||
| Net asset value, end of year | $ | 10.57 | $ | 11.90 | $ | 8.61 | $ | 8.32 | $ | 10.52 | ||||||||||
| Total return | (6.58 | )% | 38.21 | % | 7.55 | % | (19.82 | )% | 5.20 | % | ||||||||||
| SUPPLEMENTAL DATA | ||||||||||||||||||||
| Net assets, | ||||||||||||||||||||
| end of year (thousands) | $ | 199,968 | $ | 127,357 | $ | 66,648 | $ | 27,595 | $ | 32,058 | ||||||||||
| Portfolio turnover rate | 42 | % | 54 | % | 45 | % | 94 | % | 77 | % | ||||||||||
The accompanying notes are an integral part of these financial statements.
30
Evermore Global Value Fund
| FINANCIAL HIGHLIGHTS For a capital share outstanding throughout the year, Continued |
CLASS I
| Year Ended December 31, | ||||||||||||||||||||
| 2014 | 2013 | 2012 | 2011 | 2010* | ||||||||||||||||
| RATIO OF EXPENSES TO AVERAGE NET ASSETS | ||||||||||||||||||||
Before expenses absorbed2,6 | 1.35 | % | 1.56 | % | 1.88 | % | 2.01 | % | 3.23 | % | ||||||||||
After expenses absorbed3,6 | — | 1.37 | % | 1.36 | % | 1.46 | % | 1.37 | % | |||||||||||
After expenses recouped3,6 | 1.36 | % | — | — | — | — | ||||||||||||||
| RATIO OF NET INVESTMENT INCOME (LOSS) TO AVERAGE NET ASSETS | ||||||||||||||||||||
Before expenses absorbed4,6 | (0.33 | )% | 0.34 | % | 3.32 | %7 | 1.14 | % | (1.30 | )% | ||||||||||
After expenses absorbed5,6 | — | 0.53 | % | 3.84 | %7 | 1.69 | % | 0.56 | % | |||||||||||
After expenses recouped5,6 | (0.34 | )% | — | — | — | — | ||||||||||||||
| * | Fund commenced operations on January 1, 2010. |
| ** | Calculated using the average shares outstanding method. |
| 1 | Amount less than $0.01. |
| 2 | The ratio of expenses to average net assets before expenses absorbed includes interest expense. The ratio excluding interest expense was 1.34% for the year ended December 31, 2014; and 1.54%, 1.87%, 1.90% and 3.21% for the years ended December 31, 2013, 2012, 2011 and 2010, respectively. |
| 3 | The ratio of expenses to average net assets after expenses absorbed/recouped includes interest expense. The ratio excluding interest expense was 1.35% for the year ended December 31, 2014; and 1.35%, 1.35%, 1.35% and 1.35% for the years ended December 31, 2013, 2012, 2011 and 2010, respectively. |
| 4 | The ratio of net investment income (loss) to average net assets before expenses absorbed includes interest expense. The ratio excluding interest expense was (0.32)% for the year ended December 31, 2014; and 0.36%, 3.33%, 1.25% and (1.28)% for the years ending December 31, 2013, 2012, 2011 and 2010, respectively. |
| 5 | The ratio of net investment income to average net assets after expenses absorbed/recouped includes interest expense. The ratio excluding interest expense was (0.33)% for the year ended December 31, 2014; and 0.55%, 3.85%, 1.80% and 0.58% for the years ending December 31, 2013, 2012, 2011 and 2010, respectively. |
| 6 | Does not include expenses of the investment companies in which the Fund invests. |
| 7 | Certain prior period ratios have been corrected. |
The accompanying notes are an integral part of these financial statements.
31
Evermore Global Value Fund
| NOTES TO FINANCIAL STATEMENTS December 31, 2014 |
| NOTE 1 – ORGANIZATION |
The Evermore Global Value Fund (the “Fund”) is a series of shares of Evermore Fund Trust (the “Trust”), which is registered under the Investment Company Act of 1940, as amended (the “1940 Act”) as an open-end management investment company. The Fund is an investment company and accordingly follows the investment company accounting and reporting guidance of the Financial Accounting Standards Board (FASB) Accounting Standard Codification Topic 946 “Financial Services – Investment Companies.” The Fund commenced operations on January 1, 2010.
The investment objective of the Fund is to seek capital appreciation by investing in securities from markets around the world, including U.S. markets.
The Fund offers Class A and Class I shares. Class A shares are sold with a front-end sales charge. Each class of shares has equal rights as to earnings and assets except that each class bears different distribution expenses. Each class of shares has exclusive voting rights with respect to matters that affect just that class. Income, expenses (other than expenses attributable to a specific class), and realized and unrealized gains or losses on investments are allocated to each class of shares based on its relative net assets. Class A shares are sold with a front-end sales charge of 5.00%. Purchases greater than $1 million into the Fund are offered at net asset value and subject to a 0.75% contingent deferred sales charge (“CDSC”) if redeemed within 12 months. Class I shares have no sales charge and are offered primarily for direct investment by investors such as pension and profit sharing plans, employee benefit trusts, certain financial intermediaries, endowments, foundations and corporations. For Class I shares, the offering and redemption price per share for the Fund is equal to the Fund’s net asset value per share. The Fund charges a 2.00% redemption fee on shares (both Class A and I) held less than 30 days.
| NOTE 2 – SIGNIFICANT ACCOUNTING POLICIES |
The following is a summary of significant accounting policies consistently followed by the Fund. These policies are in conformity with accounting principles generally accepted in the United States of America.
| A. | Investment Valuation and Fair Value Measurement. All domestic equity securities that are traded on a national securities exchange, except those listed on the NASDAQ Global Market® (“NASDAQ”) are valued at the last reported sale price on the exchange on which the security is principally traded. Securities traded on NASDAQ will be valued at the NASDAQ Official Closing Price. If, on a particular day, an exchange-traded or NASDAQ security does not trade, then the mean between the most recent quoted bid and |
32
Evermore Global Value Fund
| NOTES TO FINANCIAL STATEMENTS December 31, 2014, Continued |
asked prices will be used. All equity securities that are not traded on a listed exchange are valued at the last sale price in the over-the-counter market. If a non-exchange traded security does not trade on a particular day, then the mean between the last quoted closing bid and asked price will be used.
Debt securities exceeding 60 days to maturity are valued by using the mean between the closing bid and asked prices provided by an independent pricing service. If the closing bid and ask prices are not readily available, the pricing service provides a price determined utilizing independent quotations from bond dealers and bond market activity or by a matrix pricing method, which is a formula driven valuation technique. The formula driven techniques generally consider such factors as yields or prices of bonds of comparable quality, type of issue, coupon, ratings, and general market conditions. Securities for which prices are not available from an independent pricing service, but where an active market exists, are valued using market quotations obtained from one or more dealers that make markets in the securities. Debt securities having a maturity of less than 60 days are valued at amortized cost with any discount or premium being accreted or amortized on a straight-line basis until maturity.
The Fund invests substantially in securities traded on foreign exchanges (see “Foreign Currency Translation” below). Investments that are primarily traded on foreign exchanges are generally valued in their local currencies as of the close of their primary exchange or market, or if there were no transactions on such day, at the mean between the bid and asked prices. The local prices are converted to U.S. dollars using the applicable currency exchange rates as of the close of the New York Stock Exchange. Exchange rates are provided daily by recognized independent pricing agents. Foreign currency forward contracts are valued at the current day’s interpolated foreign exchange rate, as calculated using the current day’s exchange rate, and the relevant forward rates provided by an independent pricing service.
There may be less publicly available information about a foreign company than about a U.S. company. Foreign issuers may not be subject to accounting, auditing and financial reporting standards and requirements comparable to, or as uniform as, those of U.S. issuers. The number of securities traded, and the frequency of such trading, in non-U.S. securities markets, while growing in volume, is for the most part, substantially less in U.S. markets. As a result, securities of many foreign issuers may be less liquid and their prices more volatile than securities of comparable U.S. issues. Transaction costs, the costs associated with buying and selling securities, in non-U.S. securities markets may be higher than in the U.S. securities markets. There is generally less
33
Evermore Global Value Fund
| NOTES TO FINANCIAL STATEMENTS December 31, 2014, Continued |
government supervision and regulation of exchanges, brokers and issuers than there is in the U.S. The Fund’s foreign investments may include both voting and non-voting securities, sovereign debt and participations in foreign government deals. The Fund may have greater difficulty taking appropriate legal action with respect to foreign issuers in U.S. courts.
For foreign securities traded on foreign exchanges, the Trust has selected Interactive Data’s Fair Value Information Services (“FVIS”) to provide pricing data with respect to foreign security holdings held by the Fund. The use of this third-party pricing service is designed to capture events occurring after a foreign exchange closes that may affect the value of certain holdings of the Fund’s securities traded on those foreign exchanges. The Fund utilizes a confidence level when determining the use of the FVIS prices. The confidence level is a measure of the historical relationship that each foreign exchange traded security has to movements in various indices and the price of the security’s corresponding American Depositary Receipt, if one exists. FVIS provides the confidence level for each security for which it provides a price. If the FVIS provided price falls within the confidence interval the Fund will value the particular security at that price. If the FVIS provided price does not fall within the confidence level the particular security will be valued at the preceding closing price on its respective foreign exchange, or if there were no transactions on such day, at the mean between the bid and asked prices.
Securities for which quotations are not readily available are valued at their respective fair values as determined in good faith by the Board of Trustees. When a security is “fair valued,” consideration is given to the facts and circumstances relevant to the particular situation, including a review of various factors set forth in the pricing procedures adopted by the Fund’s Board of Trustees. Fair value pricing is an inherently subjective process, and no single standard exists for determining fair value. Different funds could reasonably arrive at different values for the same security. The use of fair value pricing by a fund may cause the net asset value of its shares to differ from the net asset value that would be calculated without regard to such considerations.
As described above, the Fund utilizes various methods to measure the fair value of its investments on a recurring basis. U.S. GAAP establishes a hierarchy that prioritizes inputs to valuation methods. The three levels of inputs are:
| Level 1 – | Unadjusted quoted prices in active markets for identical assets or liabilities that the Fund has the ability to access. These types of assets generally included in this category are equities listed in active markets. | |
| Level 2 – | Observable inputs other than quoted prices included in Level 1 that are observable for the asset or liability, either directly or indirectly. |
34
Evermore Global Value Fund
| NOTES TO FINANCIAL STATEMENTS December 31, 2014, Continued |
| These inputs may include quoted prices for the identical instrument on an inactive market, prices for similar instruments, interest rates, prepayment speeds, credit risk, yield curves, default rates and similar data. The types of assets generally included in this category are bonds and financial instruments classified as derivatives. | ||
| Level 3 – | Significant unobservable inputs that are supported by limited or no market activity. Level 3 may include financial instruments whose values are determined using indicative market quotes or required significant management judgment or estimation. These unobservable valuation inputs may include estimates for current yields, maturity/duration, prepayment speed, and indicative market quotes for comparable investments along with other assumptions relating to credit quality, collateral value, complexity of the investment structure, general market conditions and liquidity. This category may include investments where trading has been halted or there are certain restrictions on trading. While these investments are priced using unobservable inputs, the valuation of these investments reflects the best available data and management believes the prices are a reasonable representation of exit price. |
The availability of observable inputs can vary from security to security and is affected by a wide variety of factors, including, for example, the type of security, whether the security is new and not yet established in the marketplace, the liquidity of markets, and other characteristics particular to the security. To the extent that valuation is based on models or inputs that are less observable or unobservable in the market, the determination of fair value requires more judgment. Accordingly, the degree of judgment exercised in determining fair value is greatest for instruments categorized in Level 3.
The inputs used to measure fair value may fall into different levels of the fair value hierarchy. In such cases, for disclosure purposes, the level in the fair value hierarchy within which the fair value measurement falls in its entirety, is determined based on the lowest level input that is significant to the fair value measurement in its entirety.
35
Evermore Global Value Fund
| NOTES TO FINANCIAL STATEMENTS December 31, 2014, Continued |
The following is a summary of the inputs used to value the Fund’s net assets as of December 31, 2014^:
| Level 1 | Level 2 | Level 3 | Total | |||||||||||||
| Common Stocks | $ | 86,268,453 | $ | 129,928,762 | $ | — | $ | 216,197,215 | ||||||||
| Partnerships & Trusts | 7,211,687 | 2,552,738 | — | 9,764,425 | ||||||||||||
| Warrants | 2,484,787 | — | — | 2,484,787 | ||||||||||||
| Call Options Purchased | — | 484,625 | — | 484,625 | ||||||||||||
| Put Options Purchased | — | 230,007 | — | 230,007 | ||||||||||||
| Short-Term Investments | 1,439,556 | — | — | 1,439,556 | ||||||||||||
| Total Investments | ||||||||||||||||
| in Securities | $ | 97,404,483 | $ | 133,196,132 | $ | — | $ | 230,600,615 | ||||||||
| Other Financial | ||||||||||||||||
| Instruments# | ||||||||||||||||
| Unrealized appreciation | $ | — | $ | 5,366,853 | $ | — | $ | 5,366,853 | ||||||||
| Unrealized depreciation | — | (339,348 | ) | — | (339,348 | ) | ||||||||||
| Total Investments in Other | ||||||||||||||||
| Financial Instruments | $ | — | $ | 5,027,505 | $ | — | $ | 5,027,505 | ||||||||
| Securities Sold But | ||||||||||||||||
| Not Yet Purchased | $ | 7,246,828 | $ | — | $ | — | $ | 7,246,828 | ||||||||
| ^ | See Schedule of Investments for industry breakout. |
| # | Other Financial Instruments are derivative instruments (forward currency contracts), which are value at the unrealized appreciation (depreciation) on the investments. |
Transfers between levels are determined as of the end of the reporting period. There were no Level 3 securities held by the Fund during the year ended December 31, 2014, and therefore there were no transfers into or out of Level 3. It is the Fund’s policy to recognize transfers at market value as of the beginning of the period. Below are the transfers between Levels 1 and 2 during the reporting period from January 1, 2014 to December 31, 2014.
| Transfers into Level 1 | $ | — | ||
| Transfers out of Level 1 | (63,002,461 | ) | ||
| Net transfers in and/or out of Level 1 | $ | (63,002,461 | ) | |
| Transfers into Level 2 | $ | 63,002,461 | ||
| Transfers out of Level 2 | — | |||
| Net transfers in and/or out of Level 2 | $ | 63,002,461 |
At the close of business December 31, 2014, certain of the Fund’s foreign securities that are traded on foreign exchanges were “fair valued” using prices provided by Interactive Data’s Fair Value Information Services (“FVIS”) in accordance with the Fund’s policies and procedures for fair valuing securities
36
Evermore Global Value Fund
| NOTES TO FINANCIAL STATEMENTS December 31, 2014, Continued |
and assets (see note 2 to the financial statements). As a result, these securities were transferred from Level 1 to Level 2.
| B. | Financial Derivative Instruments. The Fund has adopted enhanced disclosure regarding derivatives and hedging activity intended to improve financial reporting of derivative instruments by enabling investors to understand how and why an entity uses derivatives, how derivatives are accounted for, and how derivative instruments affect an entity’s results of operations and financial position. |
The Fund may employ hedging strategies. Hedging is a technique designed to reduce a potential loss to a fund as a result of certain economic or market risks, including risks related to fluctuations in interest rates, currency exchange rates between U.S. and foreign securities or between different foreign currencies, and broad or specific market movements. When pursuing these hedging strategies, the Fund will primarily engage in forward foreign currency exchange contracts. However, the Fund may also engage in the following currency transactions: currency futures contracts, currency swaps, options on currencies, or options on currency futures. In addition, the Fund may engage in other types of transactions, such as the purchase and sale of exchange-listed and over-the-counter (“OTC”) put and call options on securities, equity and fixed-income indices and other financial instruments; and the purchase and sale of financial and other futures contracts and options on futures contracts.
Statement of Assets and Liabilities
Fair values of Derivative Instruments as of December 31, 2014:
| Asset Derivatives | Liability Derivatives | ||||||||||||
| Balance | Balance | ||||||||||||
| Sheet | Sheet | ||||||||||||
| Derivative Instruments | Location | Fair Value | Location | Fair Value | |||||||||
| Forward Foreign | Unrealized | $ | 5,366,853 | Unrealized | $ | 339,348 | |||||||
| Currency Contracts | gain on | loss on | |||||||||||
| forward | forward | ||||||||||||
| foreign | foreign | ||||||||||||
| currency | currency | ||||||||||||
| contracts | contracts | ||||||||||||
| Call Options Purchased | Investments | 484,625 | — | — | |||||||||
| in securities, | |||||||||||||
| at value | |||||||||||||
| Put Options Purchased | Investments | 230,007 | — | — | |||||||||
| in securities, | |||||||||||||
| at value | |||||||||||||
| Total | $ | 6,081,485 | $ | 339,348 | |||||||||
37
Evermore Global Value Fund
| NOTES TO FINANCIAL STATEMENTS December 31, 2014, Continued |
Statement of Operations
The effect of Derivative Instruments on the Statement of Operations for the year ended December 31, 2014:
| Location of | Change in | |||||||||
| Unrealized | Unrealized | |||||||||
| Location | Realized | Appreciation | Appreciation | |||||||
| of Gain | Gain | (Depreciation) | (Depreciation) | |||||||
| (Loss) on | (Loss) on | on | on | |||||||
| Derivatives | Derivatives | Derivatives | Derivatives | |||||||
| Derivative | Recognized | Recognized | Recognized | Recognized | ||||||
| Instruments | in Income | in Income | in Income | in Income | ||||||
| Forward | Net realized gain | $ | 13,438,705 | Change in net | $ | 6,058,600 | ||||
| Foreign | on foreign currency | unrealized | ||||||||
| Currency | transactions & | depreciation on | ||||||||
| Contracts | forward foreign | foreign currency | ||||||||
| currency | translations & | |||||||||
| contracts | forward foreign | |||||||||
| currency contracts | ||||||||||
| Call Options | Net realized loss | (764,079 | ) | Change in net | (544,855 | ) | ||||
| Purchased | on investments | unrealized | ||||||||
| and options | appreciation on | |||||||||
| investments | ||||||||||
| Put Options | Net realized loss | (439,019 | ) | Change in net | (472,058 | ) | ||||
| Purchased | on investments | unrealized | ||||||||
| and options | appreciation on | |||||||||
| investments | ||||||||||
| Total | $ | 12,235,607 | $ | 5,041,687 | ||||||
| C. | Offsetting Assets and Liabilities. The Fund is subject to an arrangement with its sole counter party (Morgan Stanley) which governs the terms of certain transactions between the Fund and Morgan Stanley. The arrangement allows the Fund to close out and net its total exposure in the event of a default with respect to all the transactions governed within the arrangement upon settlement of multiple transactions between the two parties. The following is a summary of offsetting transactions in the Fund as of December 31, 2014. |
| Gross Amounts* | Financial | |||||||||||||||
| Presented in | Instruments | |||||||||||||||
| the Statement | with | Collateral | Net Amount | |||||||||||||
| of Assets & | Allowable | Received/ | (not less | |||||||||||||
| Description | Liabilities | Netting | Pledged | than zero) | ||||||||||||
| Assets: | ||||||||||||||||
| Forward Contracts | $ | 5,366,853 | $ | 339,348 | $ | — | $ | — | ||||||||
| Liabilities: | ||||||||||||||||
| Forward Contracts | $ | 339,348 | $ | 5,366,853 | $ | 16,587,000 | $ | — | ||||||||
| * | Gross amounts presented as no amounts are netted within the Statement of Assets and Liabilities. |
Certain derivatives held by the Fund are not subject to an agreement permitting netting and are excluded from the table above.
38
Evermore Global Value Fund
| NOTES TO FINANCIAL STATEMENTS December 31, 2014, Continued |
| D. | Option Writing. When a Fund writes an option, an amount equal to the premium received by the Fund is recorded as a liability and is subsequently adjusted to the current fair value of the option written. Premiums received from writing options that expire unexercised are treated by the Fund on the expiration date as realized gains from investments. The difference between the premium and the amount paid on effecting a closing purchase transaction, including brokerage commissions, is also treated as a realized gain, or, if the premium is less than the amount paid for the closing purchase transaction, as a realized loss. If a call option is exercised, the premium is added to the proceeds from the sale of the underlying security or currency in determining whether the Fund has realized a gain or loss. If a put option is exercised, the premium reduces the cost basis of the securities purchased by the Fund. The Fund as writer of an option bears the market risk of an unfavorable change in the price of the security underlying the written option. |
| E. | Foreign Currency Translation. Investment securities and other assets and liabilities denominated in foreign currencies are translated into U.S. dollar amounts at the date of valuation. Purchases and sales of investment securities and income and expense items denominated in foreign currencies are translated into U.S. dollar amounts on the respective dates of such transactions. |
The Fund does not isolate that portion of the results of operations resulting from changes in foreign exchange rates on investments from the fluctuations arising from changes in market prices of securities held. Such fluctuations are included with the net realized and unrealized gain or loss from investments.
The Fund reports net realized foreign exchange gains or losses that arise from sales of foreign currencies, currency gains or losses realized between the trade and settlement dates on securities transactions, and the difference between the amounts of dividends, interest, and foreign withholding taxes recorded on the Fund’s books and the U.S. dollar equivalent of the amounts actually received or paid. Net unrealized foreign exchange gains and losses arise from changes in the fair values of assets and liabilities, other than investments in securities at fiscal period end, resulting from changes in exchange rates.
| F. | Federal Income Taxes. The Fund has elected to be taxed as a “regulated investment company” and intends to distribute substantially all taxable income to its shareholders and otherwise comply with the provisions of Subchapter M of the Internal Revenue Code applicable to regulated investment companies. Therefore, no provision for federal income taxes or excise taxes has been made. |
39
Evermore Global Value Fund
| NOTES TO FINANCIAL STATEMENTS December 31, 2014, Continued |
In order to avoid imposition of the excise tax applicable to regulated investment companies, the Fund intends to declare each year as dividends in each calendar year at least 98.0% of its net investment income (earned during the calendar year) and 98.2% of its net realized capital gains (earned during the twelve months ended October 31) plus undistributed amounts, if any, from prior years.
Net capital losses incurred after October 31 and within the taxable year are deemed to arise on the first business day of each Fund’s next taxable year. As of December 31, 2014, there were no post-October losses.
At December 31, 2014, the Fund had capital loss carryforwards available for federal income tax purposes of $10,935,587, of which $9,370,428 are short-term unlimited losses and $1,565,159 are long-term unlimited losses.
A regulated investment company may elect to treat any portion of its qualified late-year loss as arising on the first day of the next taxable year. Qualified late-year losses are certain capital and ordinary losses which occur during the portion of the Fund’s taxable year subsequent to October 31. For the taxable year ended December 31, 2014, there were no qualified late-year losses.
The Fund recognizes the tax benefits of uncertain tax positions only where the position is “more likely than not” to be sustained assuming examination by tax authorities. Management has analyzed the Fund’s tax positions, and has concluded that no liability for unrecognized tax benefits should be recorded related to uncertain tax positions taken on returns filed for the open tax year (2011-2013), or expected to be taken in the Fund’s 2014 tax returns. The Fund identifies their major tax jurisdictions as U.S. Federal, New Jersey State and Massachusetts State; however the Fund is not aware of any tax positions for which it is reasonably possible that the total amounts of unrecognized tax benefits will change materially in the next twelve months.
| G. | Forward Foreign Currency Contracts. The Fund may enter into forward foreign currency contracts as hedges against either specific transactions or fund positions. The aggregate principal amount of the contracts are not recorded because the Fund intends to settle the contracts prior to delivery. All commitments are marked-to-market daily at the applicable foreign exchange rate, and any resulting unrealized gains or losses are recorded currently. The Fund realizes gains or losses at the time the forward contracts are settled. For the period ended October 31, 2014, all gains or losses arising from forward foreign currency contracts were recognized as ordinary income or loss for federal income tax purposes. For the period from November 1, 2014 through December 31, 2014, the Fund elected to treat gains or losses arising from forward foreign currency contracts as capital gains or losses. This election was applied on a contract by contract |
40
Evermore Global Value Fund
| NOTES TO FINANCIAL STATEMENTS December 31, 2014, Continued |
basis. As a result of such elections, unrealized gains and losses on outstanding positions in forward foreign currency contracts held as of December 31, 2014 were recognized as realized gains or losses for federal income tax purposes.
The use of forward foreign currency contracts does not eliminate fluctuations in the underlying prices of the securities, but it does establish a rate of exchange that can be achieved in the future. Although forward foreign currency contracts limit the risk of loss due to a decline in the value of the hedged currency, they also limit a potential gain that might result should the value of the currency increase. These contracts involve market risk in excess of the amount reflected in the Fund’s Statement of Assets and Liabilities. The face or contract amount in U.S. dollars (“USD”) reflects the total exposure the Fund has in that particular currency contract. In addition, there could be exposure to risks (limited to the amount of unrealized gains) if the counterparties to the contracts are unable to meet the terms of their contracts. The average notional value of forward currency contracts outstanding during the year ended December 31, 2014 was $147,198,549. The average notional amount is calculated by the dollar value of open forward contracts at the end of the previous fiscal year and at each quarter end in the current fiscal year. The notional amount is calculated based on the currency being sold converted to USD at each of the time periods noted above.
The Fund helps manage counterparty credit risk by entering into agreements only with counterparties the Fund’s investment Adviser believes have the financial resources to honor their obligations and by having the Adviser monitor the financial stability of counterparties. Collateral pledges are monitored and subsequently adjusted if and when the valuations fluctuate, either up or down by at least the predetermined threshold amount.
| H. | Securities Sold But Not Yet Purchased. The Fund may make short sales of securities, including “short sales against the box.” In a short transaction, a fund sells a security it does not own in anticipation that the market price of that security will decline. The Fund expects to make short sales (i) as a form of hedging to offset potential declines in long positions in similar securities, (ii) in order to maintain portfolio flexibility and (iii) for profit. |
When the Fund makes a short sale, its broker-dealer borrows the security to be sold short and the broker-dealer retains the proceeds of the short sale while the short position is open. The Fund must keep the proceeds account marked to market and must post additional collateral for its obligation to deliver securities to replace the securities that were borrowed and sold short. The Fund may have to pay a fee to borrow particular securities and is often obligated to pay over any payments, including dividends, received on such borrowed securities.
41
Evermore Global Value Fund
| NOTES TO FINANCIAL STATEMENTS December 31, 2014, Continued |
A Fund’s obligation to replace borrowed securities will be secured by collateral deposited with the broker-dealer or the Fund’s custodian bank, U.S. Bank N.A., usually cash, U.S. government securities or other high grade liquid securities similar to those borrowed. The Fund will also be required to segregate similar collateral to the extent, if any (excluding any proceeds of the short sales), necessary so that the value of both collateral deposits in the aggregate is at all times equal to at least 100% of the current market value of the security sold short.
Short sales carry risks of loss if the price of the security sold short increases after the sale. In this situation, when a Fund replaces the borrowed security by buying the security in the securities market, the Fund may pay more for the security than it has received from the purchaser in the short sale. A Fund may, however, profit from a change in the value of the security sold short, if the price decreases.
| I. | Security Transactions and Investment Income. Investment securities transactions are accounted for on the trade date. Gains and losses realized on sales of securities are determined on a high cost basis. Discounts/premiums on debt securities purchased are accreted/ amortized over the life of the respective securities using the effective interest method. Dividend income is recorded on the ex-dividend date. Interest income is recorded on an accrual basis. Other non-cash dividends are recognized as investment income at the fair value of the property received. Withholding taxes on foreign dividends have been provided for in accordance with the Trust’s understanding of the applicable country’s tax rules and rates. |
| J. | Distributions to Shareholders. Distributions to shareholders from net investment income and net recognized gains on securities for the Fund normally, which are determined in accordance with income tax regulations, are declared and paid on an annual basis. Distributions are recorded on the ex-dividend date. |
| K. | Use of Estimates. The preparation of financial statements in conformity with accounting principles generally accepted in the United States of America requires management to make estimates and assumptions that affect the reported amounts of assets and liabilities at the date of the financial statements and the reported amount of revenue and expenses during the reporting period. Actual results could differ from those estimates. |
| L. | Share Valuation. The net asset value (“NAV”) per share of the Fund is calculated by dividing the sum of the value of the securities held by the Fund, plus cash or other assets, minus all liabilities (including estimated accrued expenses) by the total number of shares outstanding for the Fund, rounded to the nearest cent. The Fund’s shares will not be priced on the days on which the NYSE is closed for trading. As discussed in Note 1 above, certain shares are |
42
Evermore Global Value Fund
| NOTES TO FINANCIAL STATEMENTS December 31, 2014, Continued |
subject to a redemption fee if sold before a specified holding period. Any redemption fees are deducted from the redemption proceeds otherwise payable to the shareholder. The Fund retains the fee charged as paid-in-capital and such fees become part of the Fund’ daily NAV calculation.
| M. | Guarantees and Indemnifications. In the normal course of business, the Fund enters into contracts with service providers that contain general indemnification clauses. The Fund’s maximum exposure under these arrangements is unknown as this would involve future claims that may be made against the Fund that have not yet occurred. However, based on experience, the Fund expects the risk of loss to be remote. |
| N. | Reclassification of Capital Accounts. U.S. GAAP requires that certain components of net assets relating to permanent differences be reclassified between financial and tax reporting. These reclassifications have no effect on net assets or net assets per value per share. For the year ended December 31, 2014, the Fund increased accumulated net investment income by $14,412,647 and decreased accumulated net realized loss by $14,412,647. The permanent differences primarily relate to foreign currency re-classes and sales of Passive Foreign Investment Companies. The Fund may also designate earnings and profits distributed to shareholders on the redemption of shares as dividends for purposes of the dividends paid deduction. |
| O. | Subsequent Events. In preparing these financial statements, the Fund has evaluated events and transactions for potential recognition or disclosure through the date the financial statements were available to be issued. The Fund has determined that there were no subsequent events that would be required to be disclosed in the Fund’s financial statements. |
| NOTE 3 – INVESTMENT ADVISORY FEES, SERVICING FEES, AND OTHER FEES AND EXPENSES |
The Adviser provides the Fund with investment management services under an Investment Advisory Agreement (the “Agreement”). Under the Agreement, the Adviser furnishes all investment advice, office space, certain administrative services, and provides most of the personnel needed by the Fund. As compensation for its services, the Adviser is entitled to a monthly fee at the annual rate of 0.99% based upon the average daily net assets of the Fund. As compensation for its services, for the year ended December 31, 2014, the Fund incurred $2,299,230 in advisory fees.
The Adviser has agreed to contractually waive fees and reimburse other fund expenses for the Fund through May 1, 2015, so that total annual fund operating
43
Evermore Global Value Fund
| NOTES TO FINANCIAL STATEMENTS December 31, 2014, Continued |
expenses, exclusive of taxes, interest on borrowings, acquired fund fees and expenses, dividends on securities sold short, brokerage commissions and other expenditures, which are capitalized in accordance with generally accepted accounting principles, and other extraordinary course of the Fund’s business, do not exceed:
| Share Class | ||
| Fund | A | I |
| Global Value Fund | 1.60% | 1.35% |
For the year ended December 31, 2014 the Adviser recouped $32,229 in fees waived in the previous year for the Fund.
The Adviser is permitted to seek reimbursement from the Fund, subject to limitations for fees waived and/or Fund expenses it pays not more than one year after payment. As of December 31, 2014, the Adviser has recouped all eligible amounts waived in the previous year.
The Fund must pay its current ordinary operating expenses before the Adviser is entitled to any reimbursement. Any such reimbursement is also contingent upon Board of Trustees review and approval prior to the time the reimbursement is initiated.
The agreement to contractually reimburse Fund expenses is reevaluated on an annual basis and expires May 1, 2015. The agreement may only be terminated by the Board of Trustees.
U.S. Bancorp Fund Services, LLC (“USBFS”), an indirect wholly-owned subsidiary of U.S. Bancorp, serves as the Fund’ administrator (the “Administrator”) and, in that capacity, performs various administrative and accounting services for the Fund. USBFS also serves as the Fund’s fund accountant, transfer agent, dividend disbursing agent and registrar. The Administrator prepares various federal and state regulatory filings, reports and returns for the Fund; prepares reports and materials to be supplied to the trustees; monitors the activities of the Fund’s custodian, transfer agent and accountants; coordinates the preparation and payment of Fund expenses and reviews the Fund’s expense accruals.
Quasar Distributors, LLC (the “Distributor”) is the Fund’s distributor. U.S. Bank N.A. (the “Custodian”) serves as the custodian to the Fund. Both the Distributor and Custodian are affiliates of the Administrator.
The Fund has adopted a Distribution Plan (the “Plan”) in accordance with Rule 12b-1 under the 1940 Act with respect to Class A shares. The Plan provides that the Fund may pay a fee to the Distributor at an annual rate of up to 0.25% of the average daily net assets of Class A shares. No distribution or shareholder servicing
44
Evermore Global Value Fund
| NOTES TO FINANCIAL STATEMENTS December 31, 2014, Continued |
fees are paid by Class I shares. These fees may be used by the Distributor to provide compensation for sales support distribution activities, or shareholder servicing activities.
| NOTE 4 – PURCHASES AND SALES OF SECURITIES |
For the year ended December 31, 2014, the cost of purchases and the proceeds from the sale of securities, excluding short-term investments, were $208,210,519 and $88,354,845, respectively.
There were no purchases or sales of long-term U.S. Government securities for the year ended December 31, 2014.
| NOTE 5 – DISTRIBUTIONS TO SHAREHOLDERS |
The tax character of distributions paid during the year ended December 31, 2014 and for the year ended December 31, 2013 for the Fund were as follows:
| December 31, 2014 | December 31, 2013 | |
| Distributions paid from: | ||
| Ordinary income | $12,001,619 | $ — |
As of December 31, 2014, the components of distributable earnings on a tax basis were as follows:
| Cost of investments | $ | 229,701,043 | ||
| Gross tax unrealized appreciation | 28,502,899 | |||
| Gross tax unrealized depreciation | (27,603,327 | ) | ||
| Net tax unrealized appreciation | 899,572 | |||
| Undistributed ordinary income | 2,120,607 | |||
| Undistributed long-term capital gain | — | |||
| Total distributable earnings | 2,120,607 | |||
| Post-October Loss | — | |||
| Capital loss carryforwards | (10,935,587 | ) | ||
| Net unrealized appreciation on foreign currency | 5,018,631 | |||
| Net unrealized depreciation on | ||||
| security sold but not yet purchased | (392,456 | ) | ||
| Total accumulated losses | $ | (3,289,233 | ) |
45
Evermore Global Value Fund
| NOTES TO FINANCIAL STATEMENTS December 31, 2014, Continued |
| NOTE 6 – INVESTMENTS IN AFFILIATES |
Affiliated companies, as defined in Section 2 (a) (3) of the 1940 Act, are companies 5% or more of whose outstanding voting shares are held by the Fund and the Advisor. For the period ended December 31, 2014, the Fund had the following transactions with affiliated companies:
As of December 31, 2014, the market value of all securities of affiliated companies held in the Evermore Global Value Fund amounted to $8,672,192 representing 3.7% of net assets.
| Share | Share | |||||||||||||||||||||||||||||||
| Balance | Balance | Realized | Value | Acqui- | ||||||||||||||||||||||||||||
| Dec. 31, | Dec. 31, | Gain | Dividend | Dec. 31, | sition | |||||||||||||||||||||||||||
| Issuer | 2013 | Purchases | Sales | 2014 | (Loss) | Income | 2014 | Cost | ||||||||||||||||||||||||
| Retail | ||||||||||||||||||||||||||||||||
| Holdings | ||||||||||||||||||||||||||||||||
| NV | 278,157 | — | — | 278,157 | $ | — | $ | — | $ | 6,119,454 | $ | 4,210,363 | ||||||||||||||||||||
| Saltangen | ||||||||||||||||||||||||||||||||
| Property | — | 199,000 | — | 199,000 | $ | — | $ | — | $ | 2,552,738 | $ | 2,668,795 | ||||||||||||||||||||
| Total | $ | 8,672,192 | $ | 6,879,158 | ||||||||||||||||||||||||||||
46
Evermore Global Value Fund
| REPORT OF INDEPENDENT REGISTERED PUBLIC ACCOUNTING FIRM |
To the Board of Trustees and Shareholders
of Evermore Funds Trust:
We have audited the accompanying statement of assets and liabilities, including the schedule of investments, of Evermore Global Value Fund (the sole portfolio constituting the Evermore Funds Trust (the Fund)) as of December 31, 2014, and the related statement of operations for the year then ended, the statements of changes in net assets for each of the two years in the period then ended, and the financial highlights for each of the five years in the period then ended. These financial statements and financial highlights are the responsibility of the Fund’s management. Our responsibility is to express an opinion on these financial statements and financial highlights based on our audits.
We conducted our audits in accordance with the standards of the Public Company Accounting Oversight Board (United States). Those standards require that we plan and perform the audit to obtain reasonable assurance about whether the financial statements and financial highlights are free of material misstatement. We were not engaged to perform an audit of the Fund’s internal control over financial reporting. Our audits included consideration of internal control over financial reporting as a basis for designing audit procedures that are appropriate in the circumstances, but not for the purpose of expressing an opinion on the effectiveness of the Fund’s internal control over financial reporting. Accordingly, we express no such opinion. An audit also includes examining, on a test basis, evidence supporting the amounts and disclosures in the financial statements and financial highlights, assessing the accounting principles used and significant estimates made by management, and evaluating the overall financial statement presentation. Our procedures included confirmation of securities owned as of December 31, 2014, by correspondence with the custodian and brokers or by other appropriate auditing procedures where replies from brokers were not received. We believe that our audits provide a reasonable basis for our opinion.
In our opinion, the financial statements and financial highlights referred to above present fairly, in all material respects, the financial position of the Evermore Global Value Fund at December 31, 2014, the results of its operations for the year then ended, the changes in its net assets for each of the two years in the period then ended, and the financial highlights for each of the five years in the period then ended, in conformity with U.S. generally accepted accounting principles.
 |
New York, New York
February 23, 2015
47
Evermore Global Value Fund
APPROVAL OF INVESTMENT ADVISORY AGREEMENT (Unaudited) |
At a Board meeting held on October 30, 2014, the Fund’s Board of Trustees, including a majority of the Trustees who are not “interested persons” of the Trust, approved the continuance for an additional annual period of the Investment Advisory Agreement with Evermore Global Advisors, LLC (the “Adviser”). The Independent Trustees considered whether the Investment Advisory Agreement would be in the best interest of the Fund and its shareholders and the overall fairness of the Investment Advisory Agreement. Among other things, the Trustees reviewed information concerning: (1) the nature, extent and quality of the services provided by the Adviser (2) the Fund’s investment performance; (3) the cost of the services provided and the profits realized by the Adviser from its relationship with the Fund; (4) the extent to which economies of scale, if any, for the benefit of Fund shareholders; and (5) ancillary benefits and other factors. In their deliberations, the Trustees did not rank the importance of any particular piece of information or factor considered, and it is presumed that each Trustee attributed different weights to the various factors. The following summary details the materials and factors that the Board considered, and the conclusions they reached, in approving the Investment Advisory Agreement.
Nature, Extent and Quality of Services Provided to the Fund.
The Board considered information it believed necessary to assess the ongoing nature and quality of services to be provided to the Fund by the Adviser. The Board also reviewed and considered the qualifications of the portfolio manager, and other key personnel of the Adviser who provide the investment advisory services to the Fund. The Board determined that the portfolio manager and key personnel are well qualified by education and/or training and experience to perform the services in an efficient and professional manner. The Board also took into account the Adviser’s compliance policies and procedures, noting certain compliance issues with respect to the Fund that have been corrected. The Board noted that the Adviser provided non-advisory, administrative services to the Fund under the Investment Advisory Agreement, including among other things providing office facilities, equipment and personnel to coordinate the preparation of annual and semi-annual reports to shareholders, assisting in preparing Fund tax returns, and compliance monitoring.
Investment Performance of the Funds.
The Trustees considered the investment experience of the Adviser. The Trustees considered the performance of the Fund since its inception on January 1, 2010 compared to its benchmark index, as well as historical performance of other accounts managed by the Adviser using investment strategies substantially similar to that of the Fund. The Board also reviewed a report prepared by Morningstar, comparing the Fund’s performance to similar funds in the Morningstar peer group.
48
Evermore Global Value Fund
| APPROVAL OF INVESTMENT ADVISORY AGREEMENT (Unaudited), Continued |
The Board noted that the Fund’s performance during the year-to-date through September 30, 2014 underperformed its benchmark index, and that its one year and longer-term performance was lower as well. The Trustees also reviewed information concerning the Fund’s performance versus the Morningstar peer group. The Board noted that the Fund underperformed the performance of its Morningstar peer group median for the year-to-date period ended September 30, 2014 and one year period ended September 30, 2014.
Costs of Services Provided and Profits Realized by the Adviser.
In connection with the Trustees’ consideration of the level of the advisory fees, the Trustees considered a number of factors. The Board’s analysis of the Fund’s advisory fees and expenses included a discussion and review of data concerning the Fund’s current advisory fee and total expense ratios compared to a peer group determined by Morningstar, as well as advisory fees charged by the Adviser to other accounts it manages using investment strategies substantially similar to those of the Fund. The Board noted the Adviser’s agreement to limit the total expenses of the Fund through May 1, 2015. The Board noted that the Fund’s gross advisory fee and net total expense ratio is higher than the median advisory fee and median net total expense ratio of its Morningstar peer group. The Board noted that the Fund’s gross advisory fee and net total expense ratio was within the range of fees for funds in the Morningstar peer group.
Economies of Scale and Fee Levels Reflecting those Economies.
The Trustees considered the extent to which economies of scale were expected to be realized relative to fee levels after the Fund’s assets grow substantially, and whether the advisory fee levels will reflect these economies of scale for the benefit of shareholders. The Board determined that assets of the Fund had not grown sufficiently to consider potential for breakpoints in the contractual advisory fee to be paid to the Adviser, but that, given the relatively high fees, when Fund assets rise significantly, consideration of breakpoints would be appropriate.
Other Benefits.
In addition to the above factors, the Trustees noted that the Adviser receives no other material benefits from its management of the Fund. The Board noted that the Adviser may seek reimbursement from the Fund of fees waived or reimbursed, subject to limitations.
49
Evermore Global Value Fund
TRUSTEES AND EXECUTIVE OFFICERS (Unaudited) |
The Board is responsible for the overall management of the Trust, including general supervision and review of the investment activities of the Fund. The Board, in turn, elects the officers of the Trust, who are responsible for administering the day-to-day operations of the Trust and its separate series. The current Trustees and officers of the Trust, their years of birth and positions with the Trust, term of office with the Trust and length of time served, their principal occupations for the past five years and other directorships held are set forth in the following table. Additional information regarding the Trustees is included in the Fund’s SAI and is available without charge, upon request, by calling 866-EVERMORE or (866) 383-7667.
| Number of | |||||
| Portfolios | |||||
| Term of | Principal | in Fund | |||
| Position | Office and | Occupation | Complex | Other | |
| Name, Age | with the | Length of | During | Overseen | Directorships |
| and Address | Trust | Time Served | Past Five Years | by Trustees | Held |
| Independent Trustees of the Trust | |||||
| Eugene W. Bebout III | Trustee | Indefinite | Chief Financial and | 1 | Director & |
| (born 1959) | Term; Since | Chief Operating | Treasurer, | ||
| 33 Hawthorne Place | 2009. | Officer Herbert L. | Summit | ||
| Summit, NJ 07901 | Jamison & Co. LLC | Lacrosse Club, | |||
| an Insurance Agent | Audit | ||||
| and Broker | Committee | ||||
| Chair, Summit | |||||
| Area YMCA. | |||||
| Nathan Gantcher | Chairman | Indefinite | Managing Member, | 1 | Director, Mack- |
| (born 1940) | and | Term; Since | EXOP Capital LLC, | Cali Realty | |
| 767 Third Avenue | Trustee | 2011. | an investment firm | Corporation; | |
| New York, NY 10017 | (2005 – present) | Trustee, Anti- | |||
| Defamation | |||||
| League | |||||
| Foundation; | |||||
| Former Director, | |||||
| Centerline | |||||
| Holding | |||||
| Company; | |||||
| Former Director, | |||||
| NDS Group plc; | |||||
| Former Director, | |||||
| Liberty | |||||
| Acquisition | |||||
| Holdings Corp.; | |||||
| Former Director | |||||
| Liquidnet | |||||
| Holdings, Inc. | |||||
50
Evermore Global Value Fund
| TRUSTEES AND EXECUTIVE OFFICERS (Unaudited), Continued |
| Number of | |||||
| Portfolios | |||||
| Term of | Principal | in Fund | |||
| Position | Office and | Occupation | Complex | Other | |
| Name, Age | with the | Length of | During | Overseen | Directorships |
| and Address | Trust | Time Served | Past Five Years | by Trustees | Held |
| Interested Trustee | |||||
| Eric LeGoff | Trustee | Indefinite | President, Evermore | 1 | Director, |
| (born 1961) | Term; Since | Global Advisors, | FXCM, Inc. | ||
| Evermore Global | 2009. | LLC, President, | Former Director, | ||
| Advisors, LLC | Hawthorne Associates, | Liquidnet | |||
| 89 Summit Ave | LLC, Chief Operating | Holdings, Inc. | |||
| 3rd Floor | Officer, Liquidnet | ||||
| Summit, NJ 07901 | Holdings, Inc. | ||||
| Officers of the Trust | |||||
| Eric LeGoff | Chief | Indefinite | President, Evermore | 1 | Director, |
| (born 1961) | Executive | Term; Since | Global Advisors, | FXCM, Inc. | |
| Evermore Global | Officer | 2009. | LLC | Former Director, | |
| Advisors, LLC | Liquidnet | ||||
| 89 Summit Ave | Holdings, Inc. | ||||
| 3rd Floor | |||||
| Summit, NJ 07901 | |||||
| David Marcus | President | Indefinite | Chief Executive | Not | Director, |
| (born 1965) | Term; Since | Officer and | Applicable. | Modern | |
| Evermore Global | 2009. | Portfolio Manager, | Holdings, Inc. | ||
| Advisors, LLC | Evermore Global | ||||
| 89 Summit Ave | Advisors, LLC | ||||
| 3rd Floor | |||||
| Summit, NJ 07901 | |||||
| Salvatore DiFranco | Chief | Indefinite | Chief Financial | Not | Not |
| (born 1942) | Financial | Term; Since | Officer, Evermore | Applicable. | Applicable. |
| Evermore Global | Officer | 2009. | Global Advisors, | ||
| Advisors, LLC | Treasurer | Indefinite | LLC | ||
| 89 Summit Ave | Term; Since | ||||
| 3rd Floor | 2009. | ||||
| Summit, NJ 07901 | |||||
| Magali Simo | Secretary | Indefinite | Vice President – | Not | Not |
| (born 1961) | Term; Since | Investor Services, | Applicable. | Applicable. | |
| Evermore Global | 2009. | Evermore Global | |||
| Advisors, LLC | Advisors, LLC | ||||
| 89 Summit Ave | |||||
| 3rd Floor | |||||
| Summit, NJ 07901 | |||||
51
Evermore Global Value Fund
| TRUSTEES AND EXECUTIVE OFFICERS (Unaudited), Continued |
| Number of | |||||
| Portfolios | |||||
| Term of | Principal | in Fund | |||
| Position | Office and | Occupation | Complex | Other | |
| Name, Age | with the | Length of | During | Overseen | Directorships |
| and Address | Trust | Time Served | Past Five Years | by Trustees | Held |
| John Canning | Chief | Indefinite | Managing Director, | None | None |
| (born 1970) | Compliance | Term; Since | Cipperman | ||
| 89 Summit Ave | Officer | 2014. | Compliance | ||
| 3rd Floor | Services, LLC and | ||||
| Summit, NJ 07901 | Anti-Money | Indefinite | Senior Counsel, | ||
| Laundering | Term; Since | Cipperman & | |||
| Officer | 2014. | Company, LLC | |||
| (since 2011); | |||||
| formerly, Director | |||||
| of Mutual Fund | |||||
| Administration | |||||
| of Nationwide | |||||
| Fund Group | |||||
| (2008 – 2011). |
52
Evermore Global Value Fund
| FEDERAL TAX INFORMATION (Unaudited) |
For the fiscal year ended December 31, 2014, certain dividends paid by the Fund may be subject to a maximum tax rate of 23.8%, as provided for by the American Taxpayer Relief Act of 2012. The percentage of dividends declared from ordinary income designated as qualified dividend income was 12.90%.
For corporate shareholders, the percent of ordinary income distributions qualifying for the corporate dividends received deduction for the fiscal year ended December 31, 2014 was 2.20%.
Pursuant to Section 853 of the Internal Revenue Code the Fund designated the following amounts as foreign taxes paid for the year ended December 31, 2014. Foreign taxes paid for purposes of Section 853 may be less than actual foreign taxes paid for financial statement purposes.
| Foreign Dividend Income | $ | 2,399,081 | ||
| Foreign Taxes Paid | 169,320 | |||
| Foreign Taxes Paid per share | 0.007671 | |||
| Foreign Tax Credit/Deduction | 162,292 | |||
| Foreign Tax Credit/Deduction per share | 0.007353 | |||
| Fund shares Outstanding as of December 31, 2014 | 22,071,597 |
| INFORMATION ABOUT PROXY VOTING (Unaudited) |
A description of the policies and procedures that the Fund used to determine how to vote proxies relating to portfolio securities is available without charge, upon request, by calling 866-EVERMORE (866) 383-7667.
Information regarding how the Fund voted proxies relating to portfolio securities during the most recent period ending June 30 is available without charge, upon request, by calling 866-EVERMORE (866) 383-7667. Furthermore, you can obtain the Form N-PX on the SEC’s website at www.sec.gov.
| INFORMATION ABOUT THE PORTFOLIO HOLDINGS (Unaudited) |
The Fund files its complete schedule of portfolio holdings for its first and third quarters with the SEC on Form N-Q. The Fund’s Form N-Q is available without charge, upon request, by calling 866-EVERMORE (866) 383-7667. Furthermore, you can obtain the Form N-Q on the SEC’s website at www.sec.gov.
53
Evermore Global Value Fund
| INFORMATION ABOUT HOUSEHOLDING (Unaudited) |
In an effort to decrease costs, the Fund intends to reduce the number of duplicate prospectuses and Annual and Semi-Annual Reports you receive by sending only one copy of each to those addresses shared by two or more accounts and to shareholders the Transfer Agent reasonably believes are from the same family or household. Once implemented, if you would like to discontinue householding for your accounts, please call toll-free at 866-EVERMORE (866) 383-7667 to request individual copies of these documents. Once the Transfer Agent receives notice to stop householding, the Transfer Agent will begin sending individual copies thirty days after receiving your request. This policy does not apply to account statements.
54
Evermore Funds Trust
PRIVACY NOTICE (Unaudited) |
| FACTS | WHAT DOES EVERMORE FUNDS TRUST DO WITH YOUR PERSONAL INFORMATION? |
| WHY? | Financial companies choose how they share your personal information. Federal law gives consumers the right to limit some but not all sharing. Federal law also requires us to tell you how we collect, share, and protect your personal information. Please read this notice carefully to understand what we do. |
| WHAT? | The types of personal information we collect and share depend on the product or service you have with us. This information can include: |
| • Social Security number | |
| • account balances | |
| • account transactions | |
| • transaction history | |
| • wire transfer instructions | |
| • checking account information | |
When you are no longer our customer, we continue to share your information as described in this notice. | |
| HOW? | All financial companies need to share customers’ personal information to run their everyday business. In the section below, we list the reasons financial companies can share their customers’ personal information; the reasons Evermore Funds Trust chooses to share; and whether you can limit this sharing. |
| Does Evermore | Can you limit | |
| Reasons we can share your personal information. | Funds Trust share? | this sharing? |
| For our everyday business purposes— | Yes | No |
| Such as to process your transactions, maintain | ||
| your account(s), respond to court orders and | ||
| legal investigations, or report to credit bureaus | ||
| For our marketing purposes— | No | We don’t share |
| to offer our products and services to you | ||
| For joint marketing with other financial companies | No | We don’t share |
| For our affiliates’ everyday business purposes— | Yes | No |
| information about your transactions and experiences | ||
| For our affiliates’ everyday business purposes— | No | We don’t share |
| information about your creditworthiness | ||
| For affiliates to market to you | No | We don’t share |
| For non-affiliates to market to you | No | We don’t share |
| Questions? | Call 866-EVERMORE (866-383-7667) or go to www.evermoreglobal.com |
55
Evermore Funds Trust
| PRIVACY NOTICE (Unaudited), Continued |
| What we do | |
| How does Evermore | To protect your personal information from unauthorized access and |
| Funds Trust | use, we use security measures that comply with federal law. These |
| protect my personal | measures include computer safeguards and secured files and |
| information? | buildings. |
| How does Evermore | We collect your personal information, for example, when you |
| Funds Trust collect | • open an account |
| my personal | • provide account information |
| information? | • give us your contact information |
| • make a wire transfer | |
| • tell us where to send the money | |
| We also collect your information from others, such as credit bureaus, affiliates, or other companies. | |
| Why can’t I limit | Federal law gives you the right to limit only |
| all sharing? | • sharing for affiliates’ everyday business purposes – information about your creditworthiness |
| • affiliates from using your information to market to you | |
| • sharing for non-affiliates to market to you | |
| State laws and individual companies may give you additional rights to limit sharing. | |
| Definitions | |
| Affiliates | Companies related by common ownership or control. They can be financial and nonfinancial companies. |
• Our affiliates include companies such as Evermore Global Advisors, LLC. | |
| Non-affiliates | Companies not related by common ownership or control. They can be financial and nonfinancial companies. |
• Evermore Funds Trust doesn’t share with non-affiliates so they can market to you. | |
| Joint marketing | A formal agreement between nonaffiliated financial companies that together market financial products or services to you. |
| • Evermore Funds Trust doesn’t jointly market. | |
56
(This Page Intentionally Left Blank.)
Investment Adviser
EVERMORE GLOBAL ADVISORS, LLC
89 Summit Avenue
Summit, NJ 07901
Distributor
QUASAR DISTRIBUTORS, LLC
615 East Michigan Street
Milwaukee, WI 53202
Custodian
U.S. BANK N.A.
Custody Operations
1555 N. RiverCenter Drive, Suite 302
Milwaukee, WI 53212
Transfer Agent, Fund Accountant and Fund Administrator
U.S. BANCORP FUND SERVICES, LLC
615 East Michigan Street
Milwaukee, WI 53202
Independent Registered Public Accounting Firm
ERNST & YOUNG LLP
5 Times Square
New York, NY 10036
Legal Counsel
DRINKER BIDDLE & REATH LLP
1 Logan Square, Suite 2000
Philadelphia, PA 19103
| Ticker | Cusip | |
| Evermore Global Value Fund | ||
| Class A | EVGBX | 300397106 |
| Class I | EVGIX | 300397122 |
Evermore Global Advisors, LLC
89 Summit Avenue, Summit, NJ 07901
www.evermoreglobal.com
Item 2. Code of Ethics.
The registrant has adopted a code of ethics that applies to the registrant’s principal executive officer and principal financial officer. The registrant has not made any amendments to its code of ethics during the period covered by this report. The registrant has not granted any waivers from any provisions of the code of ethics during the period covered by this report.
A copy of the registrant’s Code of Ethics is filed herewith.
Item 3. Audit Committee Financial Expert.
The registrant’s Board of Trustees has determined that there is at least one audit committee financial expert serving on its audit committee. Eugene Bebout is the “audit committee financial expert” and is considered to be “independent” as each term is defined in Item 3 of Form N-CSR.
Item 4. Principal Accountant Fees and Services.
The registrant has engaged its principal accountant to perform audit services, audit-related services, tax services and other services during the past fiscal years. “Audit services” refer to performing an audit of the registrant's annual financial statements or services that are normally provided by the accountant in connection with statutory and regulatory filings or engagements for those fiscal years. “Audit-related services” refer to the assurance and related services by the principal accountant that are reasonably related to the performance of the audit. “Tax services” refer to professional services rendered by the principal accountant for tax compliance, tax advice, and tax planning. There were no “Other services” provided by the principal accountant. The following table details the aggregate fees billed or expected to be billed for the last fiscal year for audit fees, audit-related fees and tax.
| FYE 12/31/2014 | FYE 12/31/2013 | |
| Audit Fees | $35,500 | $33,800 |
| Audit-Related Fees | N/A | N/A |
| Tax Fees | $8,800 | $8,400 |
| All Other Fees | N/A | N/A |
The audit committee has adopted pre-approval policies and procedures that require the audit committee to pre-approve all audit and non-audit services of the registrant, including services provided to any entity affiliated with the registrant.
The percentage of fees billed by Ernst & Young LLP applicable to non-audit services pursuant to waiver of pre-approval requirement were as follows:
| FYE 12/31/2014 | FYE 12/31/2013 | |
| Audit-Related Fees | 0% | 0% |
| Tax Fees | 0% | 0% |
| All Other Fees | 0% | 0% |
All of the principal accountant’s hours spent on auditing the registrant’s financial statements were attributed to work performed by full-time permanent employees of the principal accountant. (If more than 50 percent of the accountant’s hours were spent to audit the registrant's financial statements for the most recent fiscal year, state how many hours were attributed to work performed by persons other than the principal accountant's full-time, permanent employees.)
The following table indicates the non-audit fees billed or expected to be billed by the registrant’s accountant for services to the registrant and to the registrant’s investment adviser (and any other controlling entity, etc.—not sub-adviser) for the last year. The audit committee of the Board of Trustees has considered whether the provision of non-audit services that were rendered to the registrant's investment adviser is compatible with maintaining the principal accountant's independence and has concluded that the provision of such non-audit services by the accountant has not compromised the accountant’s independence.
| Non-Audit Related Fees | FYE 12/31/2014 | FYE 12/31/2013 |
| Registrant | N/A | N/A |
| Registrant’s Investment Adviser | N/A | N/A |
Item 5. Audit Committee of Listed Registrants.
Not applicable to registrants who are not listed issuers (as defined in Rule 10A-3 under the Securities Exchange Act of 1934).
Item 6. Investments.
Schedule of Investments is included as part of the report to shareholders filed under Item 1 of this Form.
Item 7. Disclosure of Proxy Voting Policies and Procedures for Closed-End Management Investment Companies.
Not applicable to open-end investment companies.
Item 8. Portfolio Managers of Closed-End Management Investment Companies.
Not applicable to open-end investment companies.
Item 9. Purchases of Equity Securities by Closed-End Management Investment Company and Affiliated Purchasers.
Not applicable to open-end investment companies.
Item 10. Submission of Matters to a Vote of Security Holders.
There have been no material changes to the procedures by which shareholders may recommend nominees to the registrant’s Board of Trustees.
Item 11. Controls and Procedures.
| (a) | The Registrant’s Chief Executive Officer and Chief Financial Officer have reviewed the Registrant's disclosure controls and procedures (as defined in Rule 30a-3(c) under the Investment Company Act of 1940 (the “Act”)) as of a date within 90 days of the filing of this report, as required by Rule 30a-3(b) under the Act and Rules 13a-15(b) or 15d-15(b) under the Securities Exchange Act of 1934. Based on their review, such officers have concluded that the disclosure controls and procedures are effective in ensuring that information required to be disclosed in this report is appropriately recorded, processed, summarized and reported and made known to them by others within the Registrant and by the Registrant’s service provider. |
| (b) | There were no changes in the Registrant's internal control over financial reporting (as defined in Rule 30a-3(d) under the Act) that occurred during the fouth fiscal quarter of the period covered by this report that has materially affected, or is reasonably likely to materially affect, the Registrant's internal control over financial reporting. |
Item 12. Exhibits.
| (a) | (1) Any code of ethics or amendment thereto, that is the subject of the disclosure required by Item 2, to the extent that the registrant intends to satisfy Item 2 requirements through filing an exhibit. Filed herewith. |
(2) A separate certification for each principal executive and principal financial officer pursuant to Section 302 of the Sarbanes-Oxley Act of 2002. Filed herewith.
(3) Any written solicitation to purchase securities under Rule 23c-1 under the Act sent or given during the period covered by the report by or on behalf of the registrant to 10 or more persons. Not applicable to open-end investment companies.
| (b) | Certifications pursuant to Section 906 of the Sarbanes-Oxley Act of 2002. Furnished herewith. |
SIGNATURES
Pursuant to the requirements of the Securities Exchange Act of 1934 and the Investment Company Act of 1940, the registrant has duly caused this report to be signed on its behalf by the undersigned, thereunto duly authorized.
(Registrant) Evermore Funds Trust
By (Signature and Title)* /s/Eric LeGoff
Eric LeGoff, Chief Executive Officer
Date 2/23/15
Pursuant to the requirements of the Securities Exchange Act of 1934 and the Investment Company Act of 1940, this report has been signed below by the following persons on behalf of the registrant and in the capacities and on the dates indicated.
By (Signature and Title)* /s/Eric LeGoff
Eric LeGoff, Chief Executive Officer
Date 2/23/15
By (Signature and Title)* /s/Salvatore DiFranco
Salvatore DiFranco, Chief Financial Officer
Date 2/23/15
* Print the name and title of each signing officer under his or her signature.