UNITED STATES
SECURITIES AND EXCHANGE COMMISSION
Washington, D.C. 20549
FORM N-CSR
CERTIFIED SHAREHOLDER REPORT OF REGISTERED
MANAGEMENT INVESTMENT COMPANIES
Investment Company Act file number (811-22335)
Evermore Funds Trust
(Exact name of registrant as specified in charter)
89 Summit Avenue
Summit, New Jersey 07901
(Address of principal executive offices) (Zip code)
Eric LeGoff
89 Summit Ave, 3rd Floor
Summit, New Jersey 07901
(Name and address of agent for service)
(866) 383-7667
Registrant’s telephone number, including area code
Date of fiscal year end: December 31
Date of reporting period: December 31, 2011
Item 1. Reports to Stockholders.

Elements of Our Active Value Investment Approach
At Evermore Global Advisors, LLC, we employ an active value approach to investing. We seek to leverage our deep operating and investing experience and extensive global relationships to identify and invest in great companies around the world that have compelling valuations and are undergoing strategic changes which we believe will unlock value.
|
|
Seeking to Generate Value . . . | |
|
|
• | Catalyst-Driven Investing. We do more than pick cheap stocks and hope for their prices to rise. We invest in companies where a series of catalysts exist to unlock value. The catalysts we look for reflect strategic changes in the company’s management, operations or financial structure that are already underway. They are not broadly recognized, but we believe they are likely to have a significant impact on a stock’s performance over time. |
|
|
Supporting Our Active Value Orientation . . . | |
|
|
• | Original Fact-Based Research. We conduct our own, original fact-based research to validate management’s stated objectives and identify catalysts to unlock value. We also perform detailed business segment analysis on each company we research. |
|
|
• | Business Operating Experience. Our senior team has hands-on business operating experience; including starting and managing businesses, sitting on company boards, and assisting management of multi-national corporations restructure their businesses. We rely on this experience to better evaluate investment opportunities. |
|
|
• | A Global Network of Strategic Relationships. Over the past 20 years, members of our investment team have developed an extensive global network of strategic relationships, including individuals and families that control businesses, corporate board members, corporate management, regional brokerage firms, press contacts, etc. We leverage these relationships to help generate and better evaluate investment opportunities. |
|
|
• | Taking a Private Equity Approach to Public Equity Investing. When we are interested in an investment opportunity, we get to know the management team of the company, study the company’s business model, evaluate the competitive and regulatory environment, and test and crosscheck what the management team tells us against our own experience. |
|
|
• | Always Active, Sometimes Activist. We are always engaged with the companies in which we invest to ensure management teams follow through on their commitments to change. On limited occasions, when we are not satisfied with |
|
|
| 1 |
|
|
| the efforts of management, we may play an activist role working with other shareholders to facilitate change. |
|
|
Executing Our Approach . . . | |
|
|
• | Targeting Complex Investment Opportunities. We love looking at holding companies and conglomerates that are often under-researched and/or misunderstood. |
|
|
• | Investing Across the Capital Structure. We evaluate all parts of a company’s capital structure to determine where the best risk-adjusted return potential exists. At times, we may invest in multiple parts of a company’s capital structure (e.g., investing in both a company’s debt and equity). |
|
|
• | Investing in Merger Arbitrage and Distressed Situations. We look to take advantage of announced merger and acquisition deals where an attractive spread exists between the market price and the announced deal price for the target company. We also look for opportunities in distressed companies that have filed or may file for bankruptcy, or are involved in reorganizations or financial restructurings. |
|
|
• | Exploiting Short Selling Opportunities. We will seek to take advantage of short selling opportunities to address currency, security, sector and market risk. |
|
|
• | Tactically Managing Cash Levels. We are not afraid to hold significant cash positions when it makes sense for the portfolios. |
|
|
2 |
|
A Letter from the CEO
Dear Shareholder:

Last year proved to be quite challenging for global and European investors, as the tragic events in Japan, Middle East unrest, the European Debt Crisis, and the U.S. debt ceiling debate coupled with an S&P downgrade collectively caused unprecedented volatility in global markets in the second and third quarters. The Evermore Funds were adversely impacted by these events from a short-term investment performance standpoint, especially as a result of our high concentration of European (and Euro Crisis Zone) special situation investments. Throughout this turbulent period, our investment team continued to maintain its conviction in our portfolio holdings and took advantage of depressed valuations to add to existing positions and start new ones. The fourth quarter brought some semblance of normalcy back to the global markets, as European leaders began focusing more seriously to come up with solutions for the European debt crisis. During the quarter, we saw a series of catalysts begin to unfold across our portfolio, which validated our continued conviction in our holdings, and brought positive investment performance results.
Market events in 2011 led us to the difficult decision to close the Evermore European Value Fund and focus our mutual fund efforts on the flagship Evermore Global Value Fund. The European Value Fund liquidated as of January 31, 2012. As such, the discussion in David Marcus’ Portfolio Manager Letter will focus on the Evermore Global Value Fund, which in 2011 also happened to own every position that was held in the Evermore European Value Fund.
Despite the market turmoil in 2011, as I look back at our second year in business, I see an organization with a stronger team and great partners. We are very pleased to have Nathan Gantcher join us as Chairman of our Fund Board of Trustees. Mr. Gantcher has tremendous Board and corporate governance experience having served as vice chairman of CIBC Oppenheimer and as a member of many public and private company boards. On the investment team front, we brought in a new research analyst, Thomas O, who has both private equity and deep value investing experience primarily in the U.S. and Asia. On the sales and distribution front, Adam Ermanis joined us as Institutional Sales Director. Adam has spent 10 years in a variety of senior sales roles at two large deep value, special situations focused asset management firms.
We continue to be extremely appreciative of the efforts of our employees, Board of Trustees and advisors. As I stated in last year’s letter, having the right partners is also key to the success of our business. I would like to thank the following service
|
|
| 3 |
providers for their support over the past year: U.S. Bank Fund Services, LLC (Fund administrator, accountant, transfer agent), U.S. Bank N.A. (Fund custodian), Quasar Distributors LLC (Fund distributor), Drinker Biddle & Reath LLP (Fund counsel), Cipperman & Company (counsel to the Fund’s independent Trustees), Ernst & Young LLP (Fund auditor), Alaric Compliance Services, LLC, Tiller, LLC (marketing communications), JCPR, Inc. (public relations and marketing), Eze Castle Software (order management system provider), Advent Software (portfolio management software provider), and all of our executing brokers.
Eric LeGoff
CEO, Evermore Funds Trust
|
|
4 |
|
A Letter from the Portfolio Manager

|
A pessimist sees the difficulty in every opportunity; an optimist sees the opportunity in every difficulty. |
-Winston Churchill |
Dear Shareholder:
Fund performance in 2011 was disappointing. The Evermore Global Value Fund’s Institutional Shares ended down 19.82% for the one year period ended December 31, 2011. The year started off well for the Fund with significant gains across the portfolio during the first quarter. However, panic across the world, and especially in Europe, during the second and third quarters significantly impacted our largest holdings. This was the case even though there was little company specific news on our names. Unfortunately, fear and panic was not contained to Europe alone—there was much concern and uncertainty concerning U.S. economic growth, the slowing of the Chinese economy, the crisis in the Mid-East, etc. We continue to stay laser focused and sift through all the news, the noise, and the stress to find those opportunities that are below the radar, misunderstood, mispriced and offer the potential for substantial rewards relative to the risk inherent in these investments.
Last year was a year where real value was actually created in a variety of the Funds’ holdings. Because of the market turmoil, this value was not reflected in those holdings respective stock prices. Sevan Drilling’s first deepwater rig started production and the construction of their second rig progressed according to plan. Retail Holdings continued its ongoing liquidation with a significant cash distribution. Old Mutual plc and Orkla both accelerated their transformations and are refocusing on core operations. Our largest holding, Grupo Prisa spent the bulk of the year rightsizing operations and working to restructure its levered balance sheet. This is just a sampling of what was taking place within our portfolio. We firmly believe these transformative moves are value accretive to the intrinsic value of these securities, yet regardless of catalysts at work, most of them were down significantly in the second and third quarters. Investors were in sheer panic mode and it seemed that any news in our names was perceived as bad news.
However, after two quarters that were marked by fear and panic in the global markets, the fourth quarter began to show some signs of relief. Investors started taking their heads out of the sand and catalysts began to be recognized by the market.
We continue to own many of the securities in the portfolio that we originally bought during 2010, our first year in business. As I have said in the past, we are long term investors and our investments often take time to come to fruition. While we are not happy having to report being down as much as we were during the year, we are very
|
|
| 5 |
happy that we took advantage of the carnage and panic to average down our cost in certain existing positions and initiate new positions where the indiscriminate selling created compelling buying opportunities. Can a 50 cent dollar go to 40 or even 30 cents on the dollar? Of course it can, and in 2011 it did in many cases. But, our strategy focuses on buying cheap stocks with catalysts and, in the long run, we are true believers that these catalysts should cause these securities to trade closer to their intrinsic values.
European leaders inched closer to getting their acts together to address the European debt crisis, and although things remain far from resolved, the market has gotten somewhat more comfortable that Europe is on a path towards an acceptable resolution.
In our Q3 update, we discussed how cheap the European markets had gotten. Below we have updated data points for 4 European markets through 12/31/11 to show that Europe remains extremely cheap in a historical context. We remind you that we do not buy markets, we buy companies. However, when entire markets sell off and trade at depressed levels we find more of our type of mispriced securities.
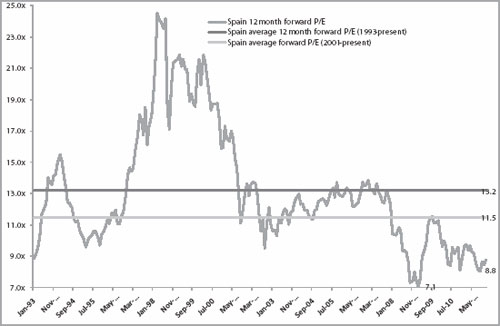
Spain
|
|
6 |
|
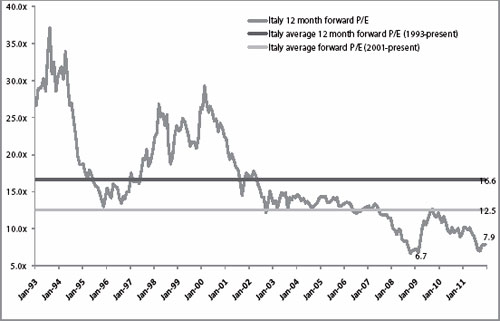
Italy
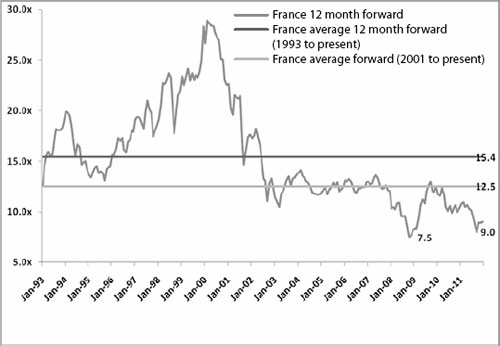
France
|
|
| 7 |
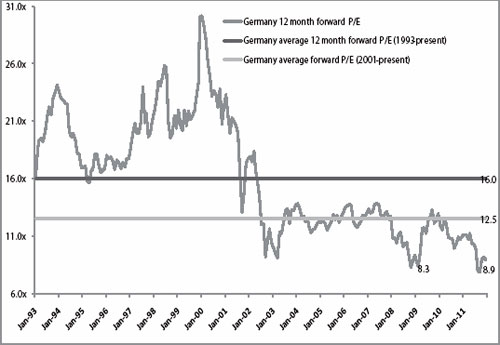
Germany
Source: MSCI, IBES, Datastream, Morgan Stanley Research
Let’s now review several of our key positions where catalysts were at work during 2011:
Grupo Prisa (Bloomberg Symbols: PRIS/B and J0003 SM). Prisa is a Spanish media conglomerate with pay TV, newspaper, radio stations, and education businesses in Spanish speaking countries around the world. We continue to own Prisa B Preferred shares, which trade on the NYSE, and Prisa warrants, which trade on the Madrid Stock Exchange. The Prisa B shares are scheduled to pay an annual dividend of between $0.90 and $1.00 for the next three years. At its year-end share price, that represented almost a 20% annual yield. In June of 2014, these shares mandatorily convert to an ordinary share. The Prisa warrants give us the option to buy Prisa ordinary shares at 2 Euros per share until June of 2014.
The equity is trading between 4 and 5 times depressed cash flows, mostly because of the company’s exposure to Spain, its focus on media businesses, and its debt load. At the end of 2011, the company pushed out the maturity of most of its bank debt from 2012 to 2014/2015. This provides an important first step to lowering the debt load via noncore asset sales and organic cash flows, and replacing bank debt with public debt.
The Polanco family, which owns 20% of the company, and two other investors/ board members collectively, recently injected €150 million of equity in the company at €2 per share, which is 150% higher than the current stock price. Practically, this action helped close the refinancing, but it also signaled long term confidence in the business from Prisa’s most vested, informed, long term investors. Finally, a professional CFO (who is the CEO in waiting) was hired in 2011 and he is focusing on
|
|
8 |
|
aggressively managing the existing businesses and optimizing their portfolio of assets. In 2011, the company laid off 18% of its workforce, which were the first layoffs in the company’s history.
Sevan Drilling ASA (Bloomberg Symbol: SEVDR NO). Sevan Drilling is a Nor-we gian oil drilling company. This special situation was created because of a botched IPO of Sevan Drilling by its former parent company, Sevan Marine. At its current trading level, the market is implying a value for the company’s existing rig fleet, which is brand new and includes two additional rigs that are being built, at $500 million per rig. As a point of reference, in 2011, Transocean (RIG) bought very similar assets from Aker Drilling at close to $700 million per rig. New building rig prices are in the mid $600 million per rig range.
In December 2011, Seadrill (Bloomberg Symbol: SDRL), a company controlled by John Fredrikson, the richest man in Norway who controls a vast empire of oil & gas transport and drilling businesses, bought a 28% stake in Sevan Drilling. New board members and a management team heavily incentivized by a robust options package have been put in place, making the sale of the company to Seadrill or another bidder in the next eighteen months likely.
EI Towers S.p.A. (Bloomberg Symbol: EIT IM). EI Towers is an Italian company that owns and operates broadcast and telecommunications towers in Italy. Our original position, Digital Multimedia Technologies (Bloomberg Symbol: DMT IM), merged in December with the tower infrastructure business of MediaSet, forming the largest tower infrastructure company in Italy. The merger ratio was determined by pricing the DMT equity at €28 per share. Assuming minimal synergies from the merger (which could end up being substantial), the current price of EI Towers values the combined company at a very attractive valuation. Additional catalysts that we believe should unlock value in the coming years include stripping out overlapping costs from the legacy companies and the entrance of new competitors to the Italian television market, which should meaningfully increase the size of the customer base.
Orkla ASA (Bloomberg Symbol: ORK NO). Orkla is a Norwegian conglomerate with consumer goods, energy, aluminum and financial businesses. Based on our conservative sum of the parts valuation, Orkla trades at a 35% discount to its intrinsic value. The company is undertaking an initiative to divest noncore assets and focus their business as a branded consumer company. Currently, they are the incumbent market leader for consumer goods in the Nordic region and other select markets including Russia, Austria, and India. In November, the company announced the sale of its Bakers business to another Norwegian company. Orkla has been paying shareholders special dividends as assets are sold. In addition, investors have been paid to wait for this transformation to take place in the form of a 5% annual dividend that has been funded from ongoing operations.
ModusLink Global Solutions (Bloomberg Symbol: MLNK). ModusLink is an undermanaged, overcapitalized logistics company that is the subject of an activist
|
|
| 9 |
campaign that is aimed at replacing management and pursuing strategic alternatives for the company. The company currently has a market cap of $250 million, about $120 million in excess cash, over $2 billion of net operating loss carry forwards, and trades at an EV/EBITDA multiple of about 6 times. We believe that this company will likely be sold, or broken up in parts, within 18 months. There are a group of activists vying for control of this company so the status quo remaining is very unlikely. Last year, the company was approached with a bid in the $9 range (stock currently trades at about $5.65). While we don’t think we will see a bid in that range, we think a transaction between $7 and $8 per share could be possible.
Frontline 4.5% 2014 Convertible Bond. Our position in the 2014 Frontline convertible bond provides a 9% current yield and a 30% yield to maturity while being covered by a fairly robust, liquid asset base. In late 2011, Frontline restructured itself by selling certain vessels and new building commitments and reworking leases on existing tankers. The result was a substantially lower fixed cost base for the convertible bond holders. In our estimation, there is ample asset coverage in terms of tanker values, even in weaker than current markets, to help hedge our investment. The most likely catalyst that will cause this bond to trade to par is the accretion toward maturity. Beyond that, we hold a free option that the operating environment for tankers improves, in which case the bond should trade higher before 2014. In the meantime, we will collect our yield and grind up to par.
SeaCo Ltd. (Bloomberg Symbol: SEAOF). SeaCo owned a large container fleet. In December 2011, the company announced that it closed the sale of its container leasing business to China’s HNA Group Company Ltd. and Hong Kong’s Bravia Capital for approximately $528 million. That equated to approximately $0.64 per share. SeaCo announced that it would pay out $0.65 per share in early 2012 and additional amounts in eighteen months as the company completes it liquidation. We decided to exit the position in December when the stock traded above the first payout level. There may be further opportunities to participate in the final wind down of SeaCo over the next eighteen months.
|
|
|
| And it comes from saying no to 1,000 things to make sure we don’t get on the wrong track or try to do too much. We’re always thinking about new markets we could enter, but it’s only by saying no that you can concentrate on the things that are really important. |
|
| -Steve Jobs |
|
A Look Ahead
We do not take the crisis in Europe lightly – it is real and the outcome is yet to be determined. That said, we strongly believe that some of the best opportunities globally can be found in Europe and here in the U.S. This is why European and U.S. securities represent the largest regional concentrations in our portfolio. We live a nomadic lifestyle as investors. Our investment style allows us to go anywhere, but we
|
|
10 |
|
don’t have to. We move to where we see value and opportunity and when that plays out we move to new areas.
We believe it is important to say “NO” often. As Steve Jobs said in the quote above, we believe it is important to be focused. This comes not by looking at everything in the global stock universe. Rather, it comes by looking for the attributes that must be present for an investment to be considered for the Fund. “NO” is the first thought. Investments must prove that “YES” is the right answer. Something that is just “OK” is never good enough. We must be convinced that real value and the ability to unlock it are inherent in the opportunity. Period. No excuses. No falling in love with positions.
As we head into 2012, we remain excited about our portfolio, but also very mindful of the Eurozone crisis and its potential impact on global markets. So, how do we prepare ourselves for troubled times yet seek to prosper if things are not so bad? By continuing to strictly adhere to our investment approach, which includes:
|
|
– | Buying stocks and other securities with what we feel is a significant “margin of safety” |
|
|
– | Focusing on special situations where there are catalysts present, so we are not relying on the broader market moves for value creation |
|
|
– | Maintaining reasonable cash levels to try to take advantage of opportunistic situations where positions we own (or are evaluating) sell off for reasons that we believe are short term or market driven but, do not cut the intrinsic value of the underlying investment |
|
|
– | Maintaining currency, market and/or security hedges |
Our commitment to you is that we will continue to be true to our approach through good and bad times. We believe this approach should translate to superior long-term investment returns for our shareholders. We once again thank you for your continued confidence and support.
Sincerely,

David Marcus
Portfolio Manager
|
|
| 11 |
Management’s Discussion of Fund Performance
As was discussed in the CEO and Portfolio Manager letters to shareholders, 2011 was a difficult year for the Evermore Global Value Fund and Evermore European Value Fund (the “Evermore Funds” or “Funds”). The year started strong for both Funds, but as crisis after crisis arose across the globe in the second and third quarters, many of the Fund’s portfolio holdings got battered. The fourth quarter brought a significant reduction in market volatility as European leaders got more serious about providing long term solutions to the European debt crisis. The Funds’ investment performance also moved in a positive direction in the fourth quarter, as a number of catalysts began to unfold across the portfolios.
Disappointing investment performance in 2011 can be largely attributed to the fact that both of the Funds had a high level of concentration in European securities, and especially in Spain and Italy, which were at the heart of the Eurozone crisis. We continue to maintain a high level of conviction in these European holdings, as well as our holdings in other regions.
Evermore Global Value Fund
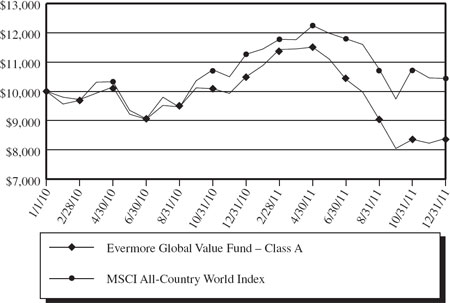
For the year ended December 31, 2011, the Evermore Global Value Fund’s Class I shares were down 19.82%. The MSCI All-Country World Index was down 7.35% during the same period. The biggest detractors to performance in 2011 were Prisa Warrants, Prisa Class B Convertible Preferred ADR, Sino Forest, Balda AG, and Eniro AB. The biggest contributors to performance for the year were: SeaCo Ltd., Retail Holdings NV, Prisa Class A ADR, Charter Communications Inc., and Swedish Match AB.
As a result of the volatility in the markets in the second and third quarters of 2011, we added to our market and security hedges by shorting and buying put options on a number of European banks and industrial companies in the third quarter, which contributed to performance during this extremely volatile period.
As of December 31, 2011, our largest five positions were Prisa Class B Convertible Preferred ADR, Justice Holdings Ltd., American International Group 5/22/2038, 8.625% Bond, ModusLink Global Solutions Inc., and EI Towers S.p.A. The Fund’s cash position stood at 9.2%, which included other assets in excess of liabilities.
Evermore European Value Fund
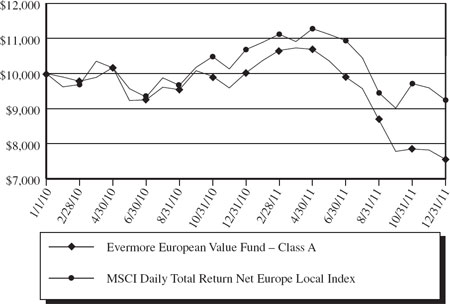
The Evermore Funds’ Board of Trustees approved a plan of liquidation for the Evermore European Value Fund on December 16, 2011. As a result, the Fund began an orderly disposition of its holdings during the following week and the Fund was left with just a few positions as of year-end. For the year ended December 31, 2011, the Evermore European Value Fund’s Class I shares were down 24.45%. The MSCI Daily Total Return Net Europe Local Index was down 11.06% during the same period.
|
|
12 |
|
The biggest detractors to performance in 2011 were Prisa Class B Convertible Preferred ADR, Eniro AB, Balda AG, RHJ International, and Prisa Warrants. The biggest contributors to performance for the year were: Prisa Class A ADR, Siemens AG, Swedish Match AB, Sevan Drilling ASA, and Schibsted ASA.
As a result of the volatility in the markets in the second and third quarters of 2011, we added to our market and security hedges by shorting and buying put options on a number of European banks and industrial companies in the third quarter, which contributed to performance during this extremely volatile period.
Opinions expressed are subject to change at any time, are not guaranteed and should not be considered investment advice.
Past performance does not guarantee future results. Investment performance reflects fee waivers in effect. In the absence of such waivers, total return would be reduced.
Mutual fund investing involves risk. Principal loss is possible. The Funds invest in foreign securities which involve greater volatility and political, economic and currency risks and differences in accounting methods. Investing in smaller companies involves additional risks such as limited liquidity and greater volatility. The Funds may make short sales of securities, which involves the risk that losses may exceed the original amount invested. Investments in debt securities typically decrease in value when interest rates rise. This risk is usually grater for longer-term debt securities. Investment in lower-rated, non-rated and distressed securities presents a greater risk of loss to principal and interest than higher-rated securities. Additional special risks relevant to our Funds involve derivatives and hedging. Please refer to the prospectus for further details.
The Evermore European Value Fund concentrates its investments in a single region, which may subject it to greater risk and volatility than a broadly diversified fund.
Please refer to the Schedules of Investments for complete holdings information. Fund holdings and sector allocations are subject to change at any time and are not recommendations to buy or sell any security.
The MSCI All-Country World Index is an unmanaged index comprised of 48 country indices, including 23 developed and 25 emerging market country indices, and is calculated with dividends reinvested after deduction of holding tax. The index is a trademark of Morgan Stanley Capital International and is not available for direct investment. The MSCI Daily Total Return Net Europe Local Index is a free float adjusted market capitalization weighted index comprised of 16 European developed market indices and reinvests dividends after deduction of withholding tax on the days securities are quoted ex-dividend. The index is a trademark of Morgan Stanley Capital International and is not available for direct investment.
|
|
| 13 |
Cash flow measures the cash generating capability of a company by adding non-cash charges (e.g. depreciation) and interest expense to pretax income. Free cash flow is revenue less operating expenses including interest expense and maintenance capital spending. It is the discretionary cash that a company has after all expenses and is available for purposes such as dividend payments, investing back into the business or share repurchases.
Forward P/E is a measure of price-to earnings ratio (P/E) using forecasted earnings for the P/E calculation. While the earnings used are just an estimate and are not as reliable as current earnings data, there is still benefit in estimated P/E analysis. The forecasted earnings used in the formula can either be for the next 12 months or for the next full-year fiscal period.
EV/EBITDA (Enterprise Value/EBITDA) is a valuation multiple used in finance and investment to measure the value of a company. This important multiple is often used in conjunction with, or as an alternative to, the P/E ratio (Price/Earnings ratio) to determine the fair market value of a company.
Must be preceded or accompanied by a prospectus.
The Evermore Funds are distributed by Quasar Distributors, LLC.
|
|
14 |
|
|
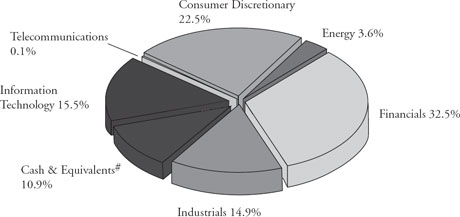
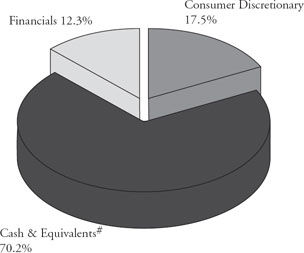
SECTOR ALLOCATION* at December 31, 2011 (Unaudited) |
Evermore Global Value Fund
(Allocations based on total net assets)
Evermore European Value Fund
(Allocations based on total net assets)
|
|
* | Includes long common stocks and options. |
# | Cash equivalents and other assets less liabilities. |
|
|
| 15 |
Evermore Funds
|
EXPENSE EXAMPLE for the Six Months Ended December 31, 2011 (Unaudited) |
As a shareholder of the Evermore European Value Fund or the Evermore Global Value Fund (each a “Fund” and collectively the “Funds”), you incur two types of costs: (1) transaction costs, including sales charges or loads; and (2) ongoing costs, including investment advisory fees, distribution fees, and other Fund expenses. This example is intended to help you understand your ongoing costs (in dollars) of investing in the Funds and to compare these costs with the ongoing costs of investing in other mutual funds. The example is based on an investment of $1,000 invested at the beginning of the period and held for the entire period (7/1/11 - 12/31/11).
Actual Expenses
The first line of the table on the next page provides information about actual account values based on actual returns and actual expenses. You will be assessed fees for outgoing wire transfers, returned checks and stop payment orders at prevailing rates charged by U.S. Bancorp Fund Services, LLC, the Funds’ transfer agent. If you request a redemption be made by wire transfer, currently a $15.00 fee is charged by the Funds’ transfer agent. You will be charged a redemption fee equal to 2% of the net amount of the redemption if you redeem shares less than 30 calendar days after you purchase them. An Individual Retirement Account (“IRA”) will be charged a $15.00 annual maintenance fee. To the extent the Funds invest in shares of other investment companies as part of its investment strategy, you will indirectly bear your proportionate share of any fees and expenses charged by the underlying funds in which the Funds invest in addition to the expenses of the Funds. Actual expenses of the underlying funds may vary. These expenses are not included in the example below. The example below includes, but is not limited to, investment advisory fees, shareholder servicing fees, fund accounting fees, custody fees and transfer agent fees. However, the example below does not include portfolio trading commissions and related expenses, and other extraordinary expenses as determined under generally accepted accounting principles. You may use the information in this line, together with the amount you invested, to estimate the expenses that you paid over the period. Simply divide your account value by $1,000 (for example, an $8,600 account value divided by $1,000 = 8.6), then multiply the result by the number in the first line under the heading entitled “Expenses Paid During the Period” to estimate the expenses you paid on your account during this period.
Hypothetical Example for Comparison Purposes
The second line of the table below provides information about hypothetical account values and hypothetical expenses based on the Funds’ actual expense ratios and an assumed rate of return of 5% per year before expenses, which are not the Funds’ actual returns. The hypothetical account values and expenses may not be used to estimate the actual ending account balance or expenses you paid for the period. You may use this information to compare the ongoing costs of investing in each Fund and other funds. To do so, compare this 5% hypothetical example with the 5% hypothetical examples that appear in the shareholder reports of the other funds. Please note that the expenses shown in the table are meant to highlight your ongoing costs only and do not reflect any transactional costs, such as sales charges (loads), redemption fees or exchange fees. Therefore, the second line of the table is useful in comparing ongoing costs only and will not help you determine the relative total costs of owning different funds. In addition, if these transactional costs were included, your costs would have been higher.
|
|
16 |
|
Evermore Funds
|
EXPENSE EXAMPLE for the Six Months Ended December 31, 2011 (Unaudited), continued |
Evermore Global Value Fund
|
|
|
|
|
|
|
|
|
|
|
|
|
|
|
| Beginning |
| Ending |
| Expenses Paid |
| ||||||
|
|
|
|
| |||||||||
Class A Actual^ |
| $ | 1,000 |
|
| $ | 808 |
|
| $ | 8.20 |
|
|
Class A Hypothetical (5% annual return before expenses)+ |
| $ | 1,000 |
|
| $ | 1,016 |
|
| $ | 9.15 |
|
|
Class C Actual^ |
| $ | 1,000 |
|
| $ | 804 |
|
| $ | 11.59 |
|
|
Class C Hypothetical (5% annual return before expenses)+ |
| $ | 1,000 |
|
| $ | 1,012 |
|
| $ | 12.93 |
|
|
Class I Actual^ |
| $ | 1,000 |
|
| $ | 807 |
|
| $ | 7.06 |
|
|
Class I Hypothetical (5% annual return before expenses)+ |
| $ | 1,000 |
|
| $ | 1,017 |
|
| $ | 7.88 |
|
|
|
|
^ | Excluding interest expense and dividend expense on securities sold short, your actual cost of investments in the Fund would be $7.29 for Class A shares, $10.68 for Class C shares and $6.15 for Class I shares. |
+ | Excluding interest expense and dividend expense on securities sold short, your hypothetical cost of investment in a fund would be $8.13 for Class A shares, $11.93 for Class C shares and $6.87 for Class I shares. |
* | Expenses are equal to the Fund’s expense ratios for the most recent six-month period, including interest expense and dividend expense on securities sold short, of 1.80% for Class A shares, 2.55% for Class C shares and 1.55% for Class I shares multiplied by the average account value over the period multiplied by 184/365 (to reflect the one-half year period). If interest expense and dividends on securities sold short was excluded, the annualized ratio would have been 1.60% for Class A shares, 2.35% for Class C shares and 1.35% for Class I shares. Expense ratios reflect fee waivers currently in effect. |
Evermore European Value Fund
|
|
|
|
|
|
|
|
|
|
|
|
|
|
|
| Beginning |
| Ending |
| Expenses Paid |
| ||||||
|
|
|
|
| |||||||||
Class A Actual^ |
| $ | 1,000 |
|
| $ | 764 |
|
| $ | 7.96 |
|
|
Class A Hypothetical (5% annual return before expenses)+ |
| $ | 1,000 |
|
| $ | 1,016 |
|
| $ | 9.10 |
|
|
Class I Actual^ |
| $ | 1,000 |
|
| $ | 764 |
|
| $ | 6.85 |
|
|
Class I Hypothetical (5% annual return before expenses)+ |
| $ | 1,000 |
|
| $ | 1,017 |
|
| $ | 7.83 |
|
|
|
|
^ | Excluding interest expense and dividend expense on securities sold short, your actual cost of investments in the Fund would be $7.11 for Class A shares and $6.00 for Class I shares. |
+ | Excluding interest expense and dividend expense on securities sold short, your hypothetical cost of investment in the Fund would be $8.13 for Class A shares and $6.87 for Class I shares. |
* | Expenses are equal to the Fund’s expense ratios for the most recent six-month period, including interest expense and dividend expense on securities sold short, of 1.79% for Class A shares and 1.54% for Class I shares multiplied by the average account value over the period multiplied by 184/365 (to reflect the one-half year period). If interest expense and dividends on securities sold short was excluded, the annualized ratio would have been 1.60% for Class A shares and 1.35% for Class I shares. Expense ratios reflect fee waivers currently in effect. |
|
|
| 17 |
Evermore Global Value Fund
Value of $10,000 vs. MSCI All-Country World Index
|
|
|
|
|
|
|
|
|
| |
Total Returns |
|
| One Year |
| Since Inception |
| Value of |
| ||
|
|
|
|
| ||||||
Class A |
| (20.04)% |
| (8.37)% |
| $8,396 |
|
| ||
Class A (with sales charge) |
| (24.02)% |
| (10.71)% |
| $7,973 |
|
| ||
Clsss C |
| (20.56)% |
| (9.11)% |
| $8,262 |
|
| ||
Class C (with sales charge) |
| (21.35)% |
| (9.11)%* |
| $8,262 |
|
| ||
Class I |
| (19.82)% |
| (8.16)% |
| $8,435 |
|
| ||
MSCI All-Country World Index |
| (7.35)% |
| 2.17% |
| $10,439 |
|
| ||
|
|
* | Sales charges for Class C are not applicable if shares not sold within one year. |
The above graph and table illustrates the performance of a hypothetical $10,000 investment made on January 1, 2010, and is not intended to imply any future performance. The returns shown do not reflect the deduction of taxes that a shareholder would pay on fund distributions or the redemption of fund shares. The returns reflect fee waivers in effect. In the absence of such waivers, total return would be reduced. The chart assumes reinvestment of capital gains and dividends for a fund and dividends for an index.
Performance data quoted represents past performance and does not guarantee future results. The investment return and principal value of an investment will fluctuate so that an investor’s shares, when redeemed, may be worth more or less than their original cost. Current performance of the Fund may be lower or higher than the performance quoted. Performance data current to the most recent month end may be obtained by calling 866-EVERMORE or (866) 383-7667.
The Fund imposes a 2.00% redemption fee on shares redeemed within 30 days. Performance does not reflect the redemption fee. If reflected, total returns would be reduced.
|
|
18 |
|
Evermore European Value Fund
Value of $10,000 vs. MSCI Daily Total Return Net Europe Local Index
|
|
|
|
|
|
|
|
|
| |
Total Returns |
|
| One Year |
| Since Inception |
| Value of |
| ||
|
|
|
|
| ||||||
Class A |
| (24.65)% |
| (13.11)% |
| $7,550 |
|
| ||
Class A (with sales charge) |
| (28.44)% |
| (15.31)% |
| $7,170 |
|
| ||
Class I |
| (24.63)% |
| (12.88)% |
| $7,590 |
|
| ||
MSCI Daily Total Return Net Europe Local Index |
| (11.06)% |
| (3.88)% |
| $9,239 |
|
| ||
The above graph and table illustrates the performance of a hypothetical $10,000 investment made on January 1, 2010, and is not intended to imply any future performance. The returns shown do not reflect the deduction of taxes that a shareholder would pay on fund distributions or the redemption of fund shares. The returns reflect fee waivers in effect. In the absence of such waivers, total return would be reduced. The chart assumes reinvestment of capital gains and dividends for a fund and dividends for an index.
Performance data quoted represents past performance and does not guarantee future results. The investment return and principal value of an investment will fluctuate so that an investor’s shares, when redeemed, may be worth more or less than their original cost. Current performance of the Fund may be lower or higher than the performance quoted. Performance data current to the most recent month end may be obtained by calling 866-EVERMORE or (866) 383-7667.
The Fund imposes a 2.00% redemption fee on shares redeemed within 30 days. Performance does not reflect the redemption fee. If reflected, total returns would be reduced.
|
|
| 19 |
|
Evermore Global Value Fund |
|
SCHEDULE OF INVESTMENTS at December 31, 2011 |
|
|
|
|
|
|
|
|
Shares |
|
|
| Value |
| ||
|
|
|
|
|
| ||
COMMON STOCKS – 61.6% |
|
|
| ||||
|
|
|
|
|
| ||
Aerospace & Defense – 0.2% |
|
|
|
| |||
| 8,600 |
| Exelis, Inc. |
|
|
|
|
|
|
| (United States) |
| $ | 77,830 |
|
|
|
|
|
|
| ||
Communications Equipment – 8.4% |
|
|
|
| |||
| 105,547 |
| Balda AG (Germany)* |
|
| 592,001 |
|
| 39,500 |
| Cisco Systems, Inc. |
|
|
|
|
|
|
| (United States) |
|
| 714,160 |
|
| 60,352 |
| Ei Towers SPA |
|
|
|
|
|
|
| (Italy)*1 |
|
| 1,466,199 |
|
|
|
|
|
|
| ||
|
|
|
|
|
| 2,772,360 |
|
|
|
|
|
|
| ||
Diversified Telecommunication |
|
|
|
| |||
| 43,800 |
| Sistema JSFC – ADR |
|
|
|
|
|
|
| (Russia)* |
|
| 736,278 |
|
|
|
|
|
|
| ||
Energy Equipment & Services – 3.6% |
|
|
|
| |||
| 1,391,419 |
| Sevan Drilling AS |
|
|
|
|
|
|
| (Norway)* |
|
| 1,178,908 |
|
|
|
|
|
|
| ||
Exploration & Production – 3.0% |
|
|
|
| |||
| 588,200 |
| Pulse Seismic, Inc. |
|
|
|
|
|
|
| (Canada)* |
|
| 1,010,405 |
|
|
|
|
|
|
| ||
Household Durables – 3.9% |
|
|
|
| |||
| 78,455 |
| Retail Holdings NV |
|
|
|
|
|
|
| (Netherlands)* |
|
| 1,278,817 |
|
|
|
|
|
|
| ||
Industrial Conglomerates – 9.8% |
|
|
|
| |||
| 35,800 |
| EXOR SPA (Italy) |
|
| 717,733 |
|
| 133,500 |
| Justice Holdings Ltd. |
|
|
|
|
|
|
| (United Kingdom)*1 |
|
| 1,782,985 |
|
| 99,520 |
| Orkla ASA (Norway) |
|
| 741,082 |
|
|
|
|
|
|
| ||
|
|
|
|
|
| 3,241,800 |
|
|
|
|
|
|
| ||
Insurance – 5.6% |
|
|
|
| |||
| 143,000 |
| Genworth Financial, |
|
|
|
|
|
|
| Inc. (United States)* |
|
| 936,650 |
|
| 428,202 |
| Old Mutual PLC |
|
|
|
|
|
|
| (United Kingdom) |
|
| 900,644 |
|
|
|
|
|
|
| ||
|
|
|
|
|
| 1,837,294 |
|
|
|
|
|
|
| ||
Internet Software & Services – 4.9% |
|
|
|
| |||
| 299,252 |
| ModusLink Global |
|
|
|
|
|
|
| Solutions, Inc. |
|
|
|
|
|
|
| (United States) |
|
| 1,615,961 |
|
|
|
|
|
|
| ||
|
|
|
|
|
|
|
|
Shares |
|
|
| Value |
| ||
|
|
|
|
|
| ||
Machinery – 3.1% |
|
|
|
|
| ||
| 86,320 |
| Fiat Industrial SPA |
|
|
|
|
|
|
| (Italy)*1 |
| $ | 735,395 |
|
| 4,300 |
| ITT Corp. |
|
|
|
|
|
|
| (United States) |
|
| 83,119 |
|
| 8,600 |
| Xylem, Inc. |
|
|
|
|
|
|
| (United States) |
|
| 220,934 |
|
|
|
|
|
|
| ||
|
|
|
|
|
| 1,039,448 |
|
|
|
|
|
|
| ||
Media – 12.0% |
|
|
|
|
| ||
| 468,213 |
| Constantin Medien |
|
|
|
|
|
|
| AG (Germany)* |
|
| 775,051 |
|
| 297,328 |
| Eniro AB (Sweden)* |
|
| 492,679 |
|
| 41,136 |
| Promotora de |
|
|
|
|
|
|
| Informaciones SA |
|
|
|
|
|
|
| (Spain)* |
|
| 46,126 |
|
| 549,904 |
| Promotora de |
|
|
|
|
|
|
| Informaciones SA – |
|
|
|
|
|
|
| Class B – ADR |
|
|
|
|
|
|
| (Spain)* |
|
| 2,661,536 |
|
|
|
|
|
|
| ||
|
|
|
|
|
| 3,975,392 |
|
|
|
|
|
|
| ||
Movies & Entertainment – 1.1% |
|
|
|
| |||
| 81,303 |
| Highlight |
|
|
|
|
|
|
| Communications AG |
|
|
|
|
|
|
| (Switzerland)* |
|
| 362,060 |
|
|
|
|
|
|
| ||
Shipping & Logistics – 3.4% |
|
|
|
| |||
| 5,757 |
| Bollore SA (France) |
|
| 1,128,521 |
|
|
|
|
|
|
| ||
Textiles, Apparel & Luxury |
|
|
|
| |||
Goods – 0.4% |
|
|
|
| |||
| 200 |
| J.G. Boswell Co. |
|
|
|
|
|
|
| (United States)* |
|
| 139,000 |
|
|
|
|
|
|
| ||
TOTAL COMMON STOCKS |
|
|
|
| |||
(Cost $25,445,007) |
|
| 20,394,074 |
| |||
|
|
|
|
|
| ||
|
|
|
|
| |||
PARTNERSHIPS & TRUSTS – 7.9% |
|
|
|
| |||
|
|
|
|
| |||
Real Estate Investment Trusts – 7.9% |
|
|
|
| |||
| 32,000 |
| American Capital |
|
|
|
|
|
|
| Agency Corp. |
|
|
|
|
|
|
| (United States)1 |
|
| 898,560 |
|
| 61,843 |
| General Growth |
|
|
|
|
|
|
| Properties, Inc. |
|
|
|
|
|
|
| (United States)1 |
|
| 928,883 |
|
The accompanying notes are an integral part of these financial statements.
|
|
20 |
|
|
Evermore Global Value Fund |
|
SCHEDULE OF INVESTMENTS at December 31, 2011 Continued |
|
|
|
|
|
|
|
|
Shares |
|
|
| Value |
| ||
| |||||||
| 151,600 |
| iStar Financial, Inc. – |
|
|
|
|
|
|
| REIT (United |
|
|
|
|
|
|
| States)*1 |
| $ | 801,964 |
|
|
|
|
|
|
| ||
|
|
|
|
|
| 2,629,407 |
|
|
|
|
|
|
| ||
TOTAL PARTNERSHIPS & TRUSTS |
|
|
|
| |||
(Cost $2,414,414) |
|
| 2,629,407 |
| |||
|
|
|
|
|
| ||
|
|
|
|
|
| ||
WARRANTS – 6.0% |
|
|
|
| |||
|
|
|
|
|
|
|
|
Consumer Finance – 1.2% |
|
|
|
| |||
| 27,783 |
| Capital One Financial |
|
|
|
|
|
|
| Corp., Expiration: |
|
|
|
|
|
|
| November, 2018, |
|
|
|
|
|
|
| Exercise Price: $42.13 |
|
|
|
|
|
|
| (United States)* |
| 405,632 |
| |
|
|
|
|
|
| ||
Diversified Financial Services – 1.4% |
|
|
|
| |||
| 101,240 |
| Bank of America Corp., |
|
|
|
|
|
|
| Expiration: January, 2019, |
|
|
|
|
|
|
| Exercise Price: $13.30 |
|
|
|
|
|
|
| (United States)* |
|
| 204,505 |
|
| 31,620 |
| JPMorgan Chase & |
|
|
|
|
|
|
| Co., Expiration: |
|
|
|
|
|
|
| October, 2018, |
|
|
|
|
|
|
| Excercise Price: $42.42 |
|
|
|
|
|
|
| (United States)* |
|
| 268,769 |
|
|
|
|
|
|
| ||
|
|
|
|
|
| 473,274 |
|
|
|
|
|
|
| ||
Insurance – 0.6% |
|
|
|
| |||
| 19,800 |
| Hartford Financial |
|
|
|
|
|
|
| Services Group, Inc., |
|
|
|
|
|
|
| Expiration: June, 2019, |
|
|
|
|
|
|
| Excercise Price: $9.70 |
|
|
|
|
|
|
| (United States)* |
|
| 180,972 |
|
|
|
|
|
|
| ||
Media – 2.8% |
|
|
|
| |||
| 8,059,777 |
| Promotora de |
|
|
|
|
|
|
| Informaciones |
|
|
|
|
|
|
| SA – Class A, |
|
|
|
|
|
|
| Expiration: June, 2014, |
|
|
|
|
|
|
| Excercise Price: $2.00 |
|
|
|
|
|
|
| (Spain)* |
|
| 938,821 |
|
|
|
|
|
|
| ||
TOTAL WARRANTS |
|
|
|
| |||
(Cost $6,107,602) |
|
| 1,998,699 |
| |||
|
|
| |||||
|
|
|
|
|
|
|
|
Principal |
|
|
| Value |
| ||
|
|
|
|
| |||
CORPORATE BONDS – 9.6% |
|
|
|
| |||
|
|
|
|
| |||
Commercial Banking – 1.7% |
|
|
|
| |||
$ | 500,000 |
| Hapag-Lloyd AG, |
|
|
|
|
|
|
| 9.000%, 10/15/2015 |
|
|
|
|
|
|
| (United Kingdom) |
| $ | 566,233 |
|
|
|
|
|
|
| ||
Insurance – 5.0% |
|
|
|
| |||
| 1,300,000 |
| American International |
|
|
|
|
|
|
| Group, Inc., |
|
|
|
|
|
|
| 8.625%, 5/22/2038 |
|
|
|
|
|
|
| (United States)2 |
|
| 1,635,296 |
|
|
|
|
|
|
| ||
Real Estate Investment |
|
|
|
| |||
Trusts – 2.9% |
|
|
|
| |||
| 1,110,000 |
| iStar Financial, Inc., |
|
|
|
|
|
|
| 5.950%, 10/15/2013 |
|
|
|
|
|
|
| (United States) |
|
| 962,925 |
|
|
|
| |||||
TOTAL CORPORATE BONDS |
|
|
|
| |||
(Cost $3,253,049) |
|
| 3,164,454 |
| |||
|
|
| |||||
|
|
|
|
| |||
CONVERTIBLE BOND – 2.8% |
|
|
|
| |||
|
|
|
|
| |||
Shipping & Logistics – 2.8% |
|
|
|
| |||
| 2,000,000 |
| Frontline Ltd., |
|
|
|
|
|
|
| 4.500%, 4/14/2015 |
|
|
|
|
|
|
| (United States) |
|
| 930,000 |
|
|
|
|
|
|
| ||
TOTAL CONVERTIBLE BOND |
|
|
|
| |||
(Cost $1,145,554) |
|
| 930,000 |
| |||
|
|
|
|
|
| ||
|
|
|
|
| |||
MUNICIPAL BONDS – 2.2% |
|
|
|
| |||
|
|
|
|
| |||
Tobacco – 2.2% |
|
|
|
| |||
| 10,840 |
| Northern Tobacco |
|
|
|
|
|
|
| Securitization Co., |
|
|
|
|
|
|
| 5.670%, 6/1/2046 |
|
|
|
|
|
|
| (United States) |
|
| 303,195 |
|
| 22,895 |
| Tobacco Settlement |
|
|
|
|
|
|
| Financing Corp., |
|
|
|
|
|
|
| 6.125%, 6/1/2047 |
|
|
|
|
|
|
| (United States) |
|
| 432,486 |
|
|
|
|
|
|
| ||
|
|
|
|
|
| 735,681 |
|
|
|
|
|
|
| ||
TOTAL MUNICIPAL BONDS |
|
|
|
| |||
(Cost $1,134,360) |
|
| 735,681 |
| |||
|
|
| |||||
The accompanying notes are an integral part of these financial statements.
|
|
| 21 |
|
Evermore Global Value Fund |
|
SCHEDULE OF INVESTMENTS at December 31, 2011 Continued |
|
|
|
|
|
|
|
|
Contracts |
| Value |
| ||||
|
|
|
|
| |||
PUT OPTIONS PURCHASED – 0.7% |
|
|
|
| |||
|
|
|
|
| |||
Auto Manufacturers – 0.1% |
|
|
|
| |||
| 610 |
| Daimler AG-Registered |
|
|
|
|
|
|
| Shares, Expiration: |
|
|
|
|
|
|
| March, 2012, |
|
|
|
|
|
|
| Strike Price: $24.00 |
|
|
|
|
|
|
| (Germany) |
| $ | 20,527 |
|
|
|
|
|
|
| ||
Capital Markets – 0.1% |
|
|
|
| |||
| 454 |
| Deutsche Bank AG, |
|
|
|
|
|
|
| Expiration: April, 2012, |
|
|
|
|
|
|
| Strike Price: $22.50 |
|
|
|
|
|
|
| (Germany) |
|
| 41,995 |
|
|
|
|
|
|
| ||
Commerical Banks – 0.3% |
|
|
|
| |||
| 1,716 |
| Banco Bilbao Vizcaya |
|
|
|
|
|
|
| Argentaria, Expiration: |
|
|
|
|
|
|
| March, 2012, |
|
|
|
|
|
|
| Strike Price: $5.25 |
|
|
|
|
|
|
| (Spain) |
|
| 35,535 |
|
| 1,837 |
| Banoco Santander SA, |
|
|
|
|
|
|
| Expiration: March, |
|
|
|
|
|
|
| 2012, Strike Price: |
|
|
|
|
|
|
| $5.25 (Spain) |
|
| 76,080 |
|
|
|
|
|
|
| ||
|
|
|
|
|
| 111,615 |
|
|
|
|
|
|
| ||
Diversified Telecommunication |
|
|
|
| |||
Services – 0.1% |
|
|
|
| |||
| 1,507 |
| Telefonica SA, |
|
|
|
|
|
|
| Expiration: March, |
|
|
|
|
|
|
| 2012, Strike Price: |
|
|
|
|
|
|
| $12.00 (Spain) |
|
| 37,058 |
|
|
|
|
|
|
| ||
Energy Equipment & Services – 0.1% |
|
|
|
| |||
| 423 |
| Alstom, Expiration: |
|
|
|
|
|
|
| March, 2012, |
|
|
|
|
|
|
| Strike Price: $18.00 |
|
|
|
|
|
|
| (France) |
|
| 22,994 |
|
|
|
|
|
|
| ||
Real Estate Investment Trusts – 0.0% |
|
|
|
| |||
| 843 |
| American Capital |
|
|
|
|
|
|
| Agency Corp., |
|
|
|
|
|
|
| Expiration: March, |
|
|
|
|
|
|
| 2012, Strike Price: |
|
|
|
|
|
|
| $18.00 (United States) |
|
| 4,215 |
|
|
|
|
|
|
|
|
|
|
|
|
|
| |||
Contracts |
| Value |
| ||||
| |||||||
| 315 |
| American Capital |
|
|
|
|
|
|
| Agency Corp., |
|
|
|
|
|
|
| Expiration: |
|
|
|
|
|
|
| March, 2012, |
|
|
|
|
|
|
| Strike Price: $20.00 |
|
|
|
|
|
|
| (United States) |
| $ | 1,575 |
|
|
|
|
|
|
| ||
|
|
|
|
|
| 5,790 |
|
|
|
|
|
|
| ||
Trading Companies & |
|
|
|
| |||
Distributors – 0.0% |
|
|
|
| |||
| 166 |
| TAL International |
|
|
|
|
|
|
| Group, Inc., |
|
|
|
|
|
|
| Expiration: |
|
|
|
|
|
|
| January, 2012, |
|
|
|
|
|
|
| Strike Price: $20.00 |
|
|
|
|
|
|
| (United States) |
|
| 415 |
|
|
|
|
|
|
| ||
TOTAL PURCHASED OPTIONS |
|
|
|
| |||
(Cost $963,472) |
|
| 240,394 |
| |||
|
|
|
|
|
| ||
|
|
|
|
| |||
TOTAL INVESTMENTS IN |
|
|
|
| |||
SECURITIES – 90.8% |
|
|
|
| |||
(Cost $40,463,458) |
|
|
| 30,092,709 |
| ||
Other Assets in Excess |
|
|
|
| |||
of Liabilities – 9.2% |
|
| 3,058,880 |
| |||
|
|
|
|
|
| ||
|
|
|
|
|
| ||
TOTAL NET |
|
|
|
| |||
ASSETS – 100.0% |
| $ | 33,151,589 |
| |||
|
|
| |||||
|
|
|
ADR |
| American Depository Receipt |
* |
| Non-income producing security. |
1 |
| All or a portion of this security was segregated as collateral for forward currency contracts. |
2 |
| Investment is exempt from registration under Rule 144A of the Securities Act of 1933, as amended. These investments may only be resold in transactions exempt from registration, which are normally those transactions with qualified institutional buyers. |
The accompanying notes are an integral part of these financial statements.
|
|
22 |
|
|
Evermore Global Value Fund |
|
SCHEDULE OF SECURITIES SOLD SHORT at December 31, 2011 |
|
|
|
|
|
|
|
|
Shares |
|
|
| Value |
| ||
| |||||||
SECURITIES SOLD SHORT – 2.5% |
|
|
|
| |||
|
|
|
|
| |||
Capital Markets – 0.8% |
|
|
|
| |||
| 7,100 |
| Deutsche Bank AG |
| $ | 268,806 |
|
|
|
|
|
|
| ||
Commercial Banks – 1.6% |
|
|
|
| |||
| 50,300 |
| Barclays PLC |
|
| 137,755 |
|
| 17,790 |
| Barclays PLC – ADR |
|
| 195,512 |
|
| 165,109 |
| Lloyds Banking |
|
| 66,320 |
|
| 22,096 |
| Royal Bank of |
|
| 140,752 |
|
|
|
|
|
|
| ||
|
|
|
|
|
| 540,339 |
|
|
|
|
|
|
| ||
Media – 0.1% |
|
|
|
| |||
| 41,135 |
| Promotora de |
|
| 46,125 |
|
|
|
|
|
|
| ||
TOTAL SECURITIES SOLD SHORT |
|
|
|
| |||
(Proceeds $731,303) |
| $ | 855,270 |
| |||
|
|
|
| ||||
|
|
|
ADR |
| American Depository Receipt |
* |
| Non-income producing security. |
| ||
The Global Industry Classification Standard (GICS®) was developed by and/or is the exclusive property of MSCI, Inc. and Standard & Poor Financial Services LLC (“S&P”). GICS® is a service mark of MSCI, Inc. and S&P and has been licensed for use by the Fund’s Administrator, U.S. Bancorp Fund Services, LLC. | ||
|
|
|
|
|
|
|
Country |
| Percent of |
| Net of | ||
United States |
|
| 35.2 | % |
| – |
Spain# |
|
| 11.5 | % |
| 11.7% |
Italy |
|
| 8.8 | % |
| – |
United Kingdom# |
|
| 6.4 | % |
| 8.0% |
Norway |
|
| 6.3 | % |
| – |
Netherlands |
|
| 3.8 | % |
| – |
Germany# |
|
| 3.5 | % |
| 4.3% |
France |
|
| 3.4 | % |
| – |
Canada |
|
| 3.0 | % |
| – |
Russia |
|
| 2.2 | % |
| – |
Sweden |
|
| 1.5 | % |
| – |
Switzerland |
|
| 1.1 | % |
| – |
Cash & |
|
| 13.3 | % |
| – |
|
|
|
|
|
| |
Total |
|
| 100.0 | % |
|
|
|
|
|
|
|
| |
|
|
^ | Includes money market fund and other assets in excess of liabilities. |
# | Includes securities sold short. |
The accompanying notes are an integral part of these financial statements.
|
|
| 23 |
|
Evermore European Value Fund |
|
SCHEDULE OF INVESTMENTS at December 31, 2011 |
|
|
|
|
|
|
|
|
Shares |
|
|
| Value |
| ||
|
|
|
|
|
| ||
COMMON STOCKS – 25.9% |
|
|
|
| |||
|
|
|
|
|
|
|
|
Industrial Conglomerates – 12.3% |
|
|
|
| |||
| 15,850 |
| Justice Holdings Ltd. |
| $ | 211,688 |
|
|
|
|
|
|
| ||
Media – 13.6% |
|
|
|
|
| ||
| 58,200 |
| Constantin Medien |
|
| 96,341 |
|
|
|
|
|
|
|
|
|
| 7,236 |
| Promotora de |
|
| 8,114 |
|
|
|
|
|
|
|
|
|
| 26,736 |
| Promotora de |
|
| 129,402 |
|
|
|
|
|
|
| ||
|
|
|
|
|
| 233,857 |
|
|
|
|
|
|
| ||
TOTAL COMMON STOCKS |
|
|
|
| |||
(Cost $647,175) |
|
| 445,545 |
| |||
|
|
|
|
|
| ||
|
|
|
|
|
| ||
WARRANT – 3.9% |
|
|
|
| |||
|
|
|
|
|
| ||
Media – 3.9% |
|
|
|
| |||
| 570,387 |
| Promotora de |
|
| 66,436 |
|
|
|
|
|
|
| ||
TOTAL WARRANT |
|
|
|
| |||
(Cost $163,271) |
|
| 66,436 |
| |||
|
|
|
| ||||
|
|
|
|
|
|
|
|
Contracts |
|
|
|
|
|
| |
(100 shares per contract) |
|
|
|
| |||
PUT OPTION PURCHASED – 0.0% |
|
|
|
| |||
|
|
|
|
|
|
|
|
Trading Companies & Distributors – 0.0% |
|
|
|
| |||
| 27 |
| TAL International |
|
| 67 |
|
|
|
|
|
|
| ||
TOTAL PURCHASED OPTION |
|
|
|
| |||
(Cost $1,512) |
|
| 67 |
| |||
|
|
|
|
|
| ||
|
|
|
|
|
|
|
|
Shares |
|
|
| Value |
| ||
|
|
|
|
|
| ||
SHORT-TERM INVESTMENT – 55.5% |
|
|
|
| |||
|
|
|
|
|
| ||
Money Market Fund – 55.5% |
|
|
|
| |||
| 957,308 |
| Invesco Liquid Assets |
| $ | 957,308 |
|
|
|
|
|
|
| ||
TOTAL SHORT-TERM INVESTMENT |
|
|
|
| |||
(Cost $957,308) |
|
| 957,308 |
| |||
|
|
|
|
|
| ||
TOTAL INVESTMENTS IN SECURITIES – 85.3% |
|
|
|
| |||
(Cost $1,769,266) |
|
| 1,469,356 |
| |||
Other Assets in Excess |
|
| 251,886 |
| |||
|
|
|
|
|
| ||
TOTAL NET |
| $ | 1,721,242 |
| |||
|
|
|
| ||||
|
|
|
ADR |
| American Depository Receipt |
* |
| Non-income producing security. |
1 |
| All or a portion of this security was segregated as collateral for forward currency contracts. |
2 |
| 7-day yield as of December 31, 2011. |
The accompanying notes are an integral part of these financial statements.
|
|
24 |
|
|
Evermore European Value Fund |
|
SCHEDULE OF SECURITIES SOLD SHORT at December 31, 2011 |
|
|
|
|
|
|
|
|
Shares |
|
|
| Value |
| ||
|
|
|
|
|
| ||
SECURITIES SOLD SHORT – 0.5% |
|
|
|
| |||
|
|
|
|
|
|
|
|
Media – 0.5% |
|
|
|
|
| ||
| 7,234 |
| Promotora de |
| $ | 8,112 |
|
|
|
|
|
|
| ||
TOTAL SECURITIES SOLD SHORT |
|
|
|
| |||
(Proceeds $7,866) |
| $ | 8,112 |
| |||
|
|
| |||||
|
|
* | Non-income producing security. |
|
|
The Global Industry Classification Standard (GICS®) was developed by and/or is the exclusive property of MSCI, Inc. and Standard & Poor Financial Services LLC (“S&P”). GICS® is a service mark of MSCI, Inc. and S&P and has been licensed for use by the Fund’s Administrator, U.S. Bancorp Fund Services, LLC. | |
|
|
|
|
|
|
|
Country |
| Percent of |
| Net of | ||
United Kingdom |
|
| 12.3 | % |
| – |
Spain# |
|
| 11.4 | % |
| 11.9% |
Germany |
|
| 5.6 | % |
| – |
United States |
|
| – |
|
| – |
Cash & |
|
| 70.7 | % |
| – |
|
|
|
|
|
| |
Total |
|
| 100.0 | % |
|
|
|
|
|
|
|
| |
|
|
^ | Includes money market fund and other assets in excess of liabilities. |
# | Includes securities sold short. |
The accompanying notes are an integral part of these financial statements.
|
|
| 25 |
(This Page Intentionally Left Blank.)
|
|
26 |
|
Evermore Funds
|
|
|
|
|
|
|
|
STATEMENTS OF ASSETS AND LIABILITIES at December 31, 2011 | |||||||
|
| Evermore |
| Evermore |
| ||
ASSETS |
|
|
|
|
|
|
|
Investments in securities, at value^ (Note 2) |
| $ | 30,092,709 |
| $ | 1,469,356 |
|
Unrealized gain on forward currency contracts |
|
| 414,747 |
|
| 106,014 |
|
Foreign Cash (cost of $12,324 and |
|
| 12,272 |
|
| 23,651 |
|
Receivables: |
|
| �� |
|
|
|
|
Investment securities sold |
|
| 4,234,236 |
|
| 132,640 |
|
Fund shares sold |
|
| 3,600 |
|
| — |
|
Dividends and interest, net |
|
| 120,882 |
|
| 1,197 |
|
Due from adviser, net |
|
| — |
|
| 72,171 |
|
Due from broker, net |
|
| — |
|
| 7,836 |
|
Prepaid expenses |
|
| 39,550 |
|
| — |
|
|
|
|
| ||||
Total assets |
|
| 34,917,996 |
|
| 1,812,865 |
|
|
|
|
| ||||
LIABILITIES |
|
|
|
|
|
|
|
Unrealized loss on forward currency contracts |
|
| 5,870 |
|
| 19,146 |
|
Securities sold short, at value (proceeds $731,303 and |
|
| 855,270 |
|
| 8,112 |
|
Due to broker, net |
|
| 129,570 |
|
| — |
|
Due to custodian |
|
| 506,507 |
|
| — |
|
Payables: |
|
|
|
|
|
|
|
Currency payable |
|
| 7,936 |
|
| 577 |
|
Fund shares redeemed |
|
| 198,885 |
|
| — |
|
Investment advisory fees, net |
|
| 7,657 |
|
| — |
|
Administration fees |
|
| 7,894 |
|
| 11,539 |
|
Custody fees |
|
| 7,268 |
|
| 6,731 |
|
Distribution fees |
|
| 9,266 |
|
| 408 |
|
Fund accounting fees |
|
| 6,312 |
|
| 9,724 |
|
Transfer agent fees |
|
| 9,983 |
|
| 9,663 |
|
Other accrued expenses |
|
| 13,989 |
|
| 25,723 |
|
|
|
|
| ||||
Total liabilities |
|
| 1,766,407 |
|
| 91,623 |
|
|
|
|
| ||||
NET ASSETS |
| $ | 33,151,589 |
| $ | 1,721,242 |
|
|
|
|
| ||||
COMPONENTS OF NET ASSETS |
|
|
|
|
|
|
|
Paid-in capital |
| $ | 43,801,037 |
| $ | 3,611,919 |
|
Undistributed net investment income (loss) |
|
| 229,557 |
|
| (86,868 | ) |
Accumulated net realized loss on investments, foreign |
|
| (788,774 | ) |
| (1,590,349 | ) |
Net unrealized depreciation on investments |
|
| (10,370,749 | ) |
| (299,910 | ) |
Net unrealized appreciation on foreign currency |
|
| 404,485 |
|
| 86,696 |
|
Net unrealized depreciation on securities sold short |
|
| (123,967 | ) |
| (246 | ) |
|
|
|
| ||||
Net assets |
| $ | 33,151,589 |
| $ | 1,721,242 |
|
|
|
|
| ||||
^Cost of Investments |
| $ | 40,463,458 |
| $ | 1,769,266 |
|
|
|
|
| ||||
# Financial statements are presented on a liquidation basis. (Note 1)
The accompanying notes are an integral part of these financial statements.
|
|
| 27 |
Evermore Funds
|
|
|
|
|
|
|
|
STATEMENTS OF ASSETS AND LIABILITIES at December 31, 2011 | |||||||
|
| Evermore |
| Evermore |
| ||
Class A: |
|
|
|
|
|
|
|
Net assets |
| $ | 5,330,870 |
| $ | 174,260 |
|
Shares issued and outstanding (unlimited number |
|
| 641,137 |
|
| 23,075 |
|
Net asset value, and redemption price per share |
| $ | 8.31 |
| $ | 7.55 |
|
|
|
|
| ||||
Maximum offering price per share* |
|
|
|
|
|
|
|
($8.31/95.00%) |
| $ | 8.75 |
|
|
|
|
|
|
|
|
|
| ||
($7.55/95.00%) |
|
|
|
| $ | 7.95 |
|
|
|
|
|
|
| ||
|
|
|
|
|
|
|
|
Class C: |
|
|
|
|
|
|
|
Net assets |
| $ | 225,861 |
|
|
|
|
Shares issued and outstanding (unlimited number |
|
| 27,548 |
|
|
|
|
Net asset value, offering price, and |
| $ | 8.20 |
|
|
|
|
|
|
|
|
|
| ||
|
|
|
|
|
|
|
|
Class I: |
|
|
|
|
|
|
|
Net assets |
| $ | 27,594,858 |
| $ | 1,546,982 |
|
Shares issued and outstanding (unlimited number |
|
| 3,315,405 |
|
| 203,803 |
|
Net asset value, offering price, and |
| $ | 8.32 |
| $ | 7.59 |
|
|
|
|
| ||||
|
|
# | Financial statements are presented on a liquidation basis. (Note 1) |
|
|
* | Class A share investments of $1 million or more, which are purchased at Net Asset Value, are subject to a 0.75% contingent deferred sales charge (“CDSC”) if redeemed within 12 months. |
|
|
** | A 1.00% CDSC applies to the lesser of the amount invested or the redemption value of Class C shares redeemed within 12 months after purchase. |
The accompanying notes are an integral part of these financial statements.
|
|
28 |
|
Evermore Funds
|
|
|
|
|
|
|
|
STATEMENTS OF OPERATIONS for the Year Ended December 31, 2011 | |||||||
|
| Evermore |
| Evermore |
| ||
INVESTMENT INCOME |
|
|
|
|
|
|
|
Income |
|
|
|
|
|
|
|
Dividends (net of $62,556 and $19,023 foreign |
| $ | 556,409 |
| $ | 110,383 |
|
Interest |
|
| 878,114 |
|
| 64,133 |
|
Other income |
|
| 6,149 |
|
| 2,396 |
|
|
|
|
| ||||
Total investment income |
|
| 1,440,672 |
|
| 176,912 |
|
|
|
|
| ||||
EXPENSES (Note 3) |
|
|
|
|
|
|
|
Investment advisory fees |
|
| 454,694 |
|
| 81,526 |
|
Custody fees |
|
| 67,611 |
|
| 37,684 |
|
Transfer agent fees |
|
| 67,836 |
|
| 42,757 |
|
Registration fees |
|
| 52,275 |
|
| 69,574 |
|
Administration fees |
|
| 47,230 |
|
| 49,610 |
|
Fund accounting fees |
|
| 37,484 |
|
| 39,438 |
|
Chief Compliance Officer fees |
|
| 40,591 |
|
| 43,551 |
|
Audit fees |
|
| 37,549 |
|
| 37,761 |
|
Legal fees |
|
| 46,967 |
|
| 46,183 |
|
Dividend expense on short securities |
|
| 21,730 |
|
| 2,587 |
|
Trustee fees |
|
| 13,731 |
|
| 13,250 |
|
Distribution fees – Class A |
|
| 19,887 |
|
| 1,233 |
|
Insurance expense |
|
| 11,741 |
|
| 13,476 |
|
Miscellaneous expenses |
|
| 5,820 |
|
| 8,475 |
|
Interest expense to broker |
|
| 3,285 |
|
| 770 |
|
Reports to shareholders |
|
| 13,698 |
|
| 8,805 |
|
Distribution fees – Class C |
|
| 110 |
|
| 110 |
|
|
|
|
| ||||
Total expenses |
|
| 942,239 |
|
| 496,790 |
|
Less expenses waived |
|
| — |
|
| (294,076 | ) |
Less fees waived |
|
| (252,167 | ) |
| (81,526 | ) |
|
|
|
| ||||
Net expenses |
|
| 690,072 |
|
| 121,188 |
|
|
|
|
| ||||
Net investment income |
|
| 750,600 |
|
| 55,724 |
|
|
|
|
| ||||
REALIZED AND UNREALIZED GAIN (LOSS) ON INVESTMENTS, OPTIONS, |
|
|
|
|
|
|
|
Net realized loss on investments, options, foreign |
|
| (850,536 | ) |
| (1,680,010 | ) |
Net realized gain on securities sold short |
|
| 579,349 |
|
| 89,007 |
|
Change in net unrealized depreciation on investments |
|
| (13,200,537 | ) |
| (803,897 | ) |
Change in unrealized appreciation on foreign currency |
|
| 456,649 |
|
| 115,580 |
|
Change in net unrealized depreciation on |
|
| (123,967 | ) |
| (246 | ) |
|
|
|
| ||||
Net realized and unrealized loss on investments, |
|
| (13,139,042 | ) |
| (2,279,566 | ) |
|
|
|
| ||||
Net decrease in net assets |
| $ | (12,388,442 | ) | $ | (2,223,842 | ) |
|
|
|
| ||||
|
# Financial statements are presented on a liquidation basis. (Note 1) |
|
The accompanying notes are an integral part of these financial statements. |
|
|
| 29 |
(This Page Intentionally Left Blank.)
|
|
30 |
|
|
Evermore Global Value Fund |
|
STATEMENT OF CHANGES IN NET ASSETS |
|
|
|
|
|
|
|
|
|
|
|
|
|
| Year Ended |
| Year Ended |
| ||||||
| |||||||||||
INCREASE (DECREASE) IN NET ASSETS FROM: |
|
|
|
|
|
|
|
|
|
|
|
|
|
|
|
|
|
|
|
|
|
|
|
OPERATIONS |
|
|
|
|
|
|
|
|
|
|
|
Net investment income |
|
| $ | 750,600 |
|
|
| $ | 99,325 |
|
|
Net realized loss on investments, options, foreign |
|
|
| (850,536 | ) |
|
|
| (1,067,585 | ) |
|
Net realized gain on securities sold short |
|
|
| 579,349 |
|
|
|
| — |
|
|
Change in unrealized appreciation (depreciation) |
|
|
| (13,200,537 | ) |
|
|
| 2,829,788 |
|
|
Change in unrealized appreciation (depreciation) |
|
|
| 456,649 |
|
|
|
| (52,164 | ) |
|
Change in net unrealized depreciation on securities |
|
|
| (123,967 | ) |
|
|
| — |
|
|
|
|
|
|
|
|
|
| ||||
Net increase (decrease) in net assets resulting |
|
|
| (12,388,442 | ) |
|
|
| 1,809,364 |
|
|
|
|
|
|
|
|
|
| ||||
|
|
|
|
|
|
|
|
|
|
|
|
DISTRIBUTIONS TO SHAREHOLDERS |
|
|
|
|
|
|
|
|
|
|
|
From net investment income: |
|
|
|
|
|
|
|
|
|
|
|
Class A |
|
|
| (54,735 | ) |
|
|
| — |
|
|
Class C |
|
|
| (1,655 | ) |
|
|
| — |
|
|
Class I |
|
|
| (419,754 | ) |
|
|
| — |
|
|
|
|
|
|
|
|
|
| ||||
Total distributions to shareholders |
|
|
| (476,144 | ) |
|
|
| — |
|
|
|
|
|
|
|
|
|
| ||||
|
|
|
|
|
|
|
|
|
|
|
|
CAPITAL SHARE TRANSACTIONS (Note 3) |
|
|
|
|
|
|
|
|
|
|
|
|
|
|
|
|
|
|
|
|
|
|
|
Net increase in net assets derived from net change in |
|
|
| 3,911,769 |
|
|
|
| 3,540,677 |
|
|
Net increase in net assets derived from net change in |
|
|
| 252,330 |
|
|
|
| 25,540 |
|
|
Net increase in net assets derived from net change in |
|
|
| 6,113,301 |
|
|
|
| 30,363,194 |
|
|
|
|
|
|
|
|
|
| ||||
Total increase in net assets from capital |
|
|
| 10,277,400 |
|
|
|
| 33,929,411 |
|
|
|
|
|
|
|
|
|
| ||||
Total increase (decrease) in net assets |
|
|
| (2,587,186 | ) |
|
|
| 35,738,775 |
|
|
|
|
|
|
|
|
|
| ||||
|
|
|
|
|
|
|
|
|
|
|
|
NET ASSETS |
|
|
|
|
|
|
|
|
|
|
|
Beginning of year |
|
|
| 35,738,775 |
|
|
|
| — |
|
|
|
|
|
|
|
|
|
| ||||
End of year |
|
| $ | 33,151,589 |
|
|
| $ | 35,738,775 |
|
|
|
|
|
|
|
|
|
| ||||
Undistributed net investment income |
|
| $ | 229,557 |
|
|
| $ | 47,447 |
|
|
|
|
|
|
|
|
|
| ||||
|
|
The accompanying notes are an integral part of these financial statements. | |
|
|
| 31 |
|
Evermore Global Value Fund |
|
STATEMENT OF CHANGES IN NET ASSETS, Continued |
(a) Summary of capital share transactions is as follows:
|
|
|
|
|
|
|
|
|
|
|
|
|
|
|
| Year Ended |
| Year Ended |
| ||||||||
|
|
|
| ||||||||||
Class A |
| Shares |
| Value |
| Shares |
| Value |
| ||||
|
|
|
|
|
| ||||||||
Shares sold |
|
| 911,481 |
| $ | 9,748,005 |
|
| 444,299 |
| $ | 4,443,211 |
|
Shares issued in reinvestment |
|
| 6,558 |
| $ | 53,577 |
|
|
|
|
|
|
|
Shares redeemed (b) |
|
| (624,623 | ) |
| (5,889,813 | ) |
| (96,577 | ) |
| (902,534 | ) |
|
|
|
|
|
| ||||||||
Net increase |
|
| 293,416 |
| $ | 3,911,769 |
|
| 347,722 |
| $ | 3,540,677 |
|
|
|
|
|
|
| ||||||||
(b) Net of redemption fees of $2,398 and $1,250, respectively.
|
|
|
|
|
|
|
|
|
|
|
|
|
|
|
| Year Ended |
| Year Ended |
| ||||||||
|
|
|
| ||||||||||
Class C |
| Shares |
| Value |
| Shares |
| Value |
| ||||
|
|
|
|
|
| ||||||||
Shares sold |
|
| 24,466 |
| $ | 250,675 |
|
| 23,054 |
| $ | 228,667 |
|
Shares issued in reinvestment |
|
| 205 |
| $ | 1,655 |
|
|
|
|
|
|
|
Shares redeemed |
|
| — |
|
| — |
|
| (20,177 | ) |
| (203,127 | ) |
|
|
|
|
|
| ||||||||
Net increase |
|
| 24,671 |
| $ | 252,330 |
|
| 2,877 |
| $ | 25,540 |
|
|
|
|
|
|
| ||||||||
|
|
|
|
|
|
|
|
|
|
|
|
|
|
|
| Year Ended |
| Year Ended |
| ||||||||
|
|
|
| ||||||||||
Class I |
| Shares |
| Value |
| Shares |
| Value |
| ||||
|
|
|
|
|
| ||||||||
Shares sold |
|
| 3,002,136 |
| $ | 31,597,853 |
|
| 3,314,806 |
| $ | 33,082,689 |
|
Shares issued in reinvestment |
|
| 50,980 |
| $ | 417,020 |
|
|
|
|
|
|
|
Shares redeemed (c) |
|
| (2,784,596 | ) |
| (25,901,572 | ) |
| (267,921 | ) |
| (2,719,495 | ) |
|
|
|
|
|
| ||||||||
Net increase |
|
| 268,520 |
| $ | 6,113,301 |
|
| 3,046,885 |
| $ | 30,363,194 |
|
|
|
|
|
|
| ||||||||
|
|
(c) | Net of redemption fees of $2,398 and $0, respectively. |
* | Fund commenced operations on January 1, 2010. |
|
|
The accompanying notes are an integral part of these financial statements. | |
|
|
32 |
|
Evermore European Value Fund |
|
STATEMENT OF CHANGES IN NET ASSETS |
|
|
|
|
|
|
|
|
|
| Year Ended |
| Year Ended |
| ||
INCREASE (DECREASE) IN NET ASSETS FROM: |
|
|
|
|
|
|
|
| |||||||
OPERATIONS |
|
|
|
|
|
|
|
Net investment income |
| $ | 55,724 |
| $ | 7,569 |
|
Net realized loss on investments, options, foreign |
|
| (1,680,010 | ) |
| (237,236 | ) |
Net realized gain on securities sold short |
|
| 89,007 |
|
| — |
|
Change in unrealized appreciation (depreciation) |
|
| (803,897 | ) |
| 503,987 |
|
Change in unrealized appreciation (depreciation) |
|
| 115,580 |
|
| (28,884 | ) |
Change in net unrealized depreciation on securities |
|
| (246 | ) |
| — |
|
|
|
|
| ||||
Net increase (decrease) in net assets resulting |
|
| (2,223,842 | ) |
| 245,436 |
|
|
|
|
| ||||
|
|
|
|
|
|
|
|
CAPITAL SHARE TRANSACTIONS (Note 3) |
|
|
|
|
|
|
|
Net increase (decrease) in net assets derived from |
|
| (578,210 | ) |
| 847,017 |
|
Net increase (decrease) in net assets derived from |
|
| (13,917 | ) |
| 16,667 |
|
Net increase (decrease) in net assets derived from |
|
| (3,438,167 | ) |
| 6,866,258 |
|
|
|
|
| ||||
Total increase (decrease) in net assets from |
|
| (4,030,294 | ) |
| 7,729,942 |
|
|
|
|
| ||||
Total increase (decrease) in net assets |
|
| (6,254,136 | ) |
| 7,975,378 |
|
|
|
|
| ||||
|
|
|
|
|
|
|
|
NET ASSETS |
|
|
|
|
|
|
|
Beginning of year |
|
| 7,975,378 |
|
| — |
|
|
|
|
| ||||
End of year |
| $ | 1,721,242 |
| $ | 7,975,378 |
|
|
|
|
| ||||
Undistributed net investment income (loss) |
| $ | (86,868 | ) | $ | 27,033 |
|
|
|
|
| ||||
| |||||||
# Financial statements are presented on a liquidation basis. (Note 1) |
|
|
|
|
|
|
|
|
|
The accompanying notes are an integral part of these financial statements. | |
|
|
| 33 |
|
Evermore European Value Fund |
|
STATEMENT OF CHANGES IN NET ASSETS, Continued |
(a) Summary of capital share transactions is as follows:
|
|
|
|
|
|
|
|
|
|
|
|
|
|
|
| Year Ended |
| Year Ended |
| ||||||||
|
|
|
| ||||||||||
Class A |
| Shares |
| Value |
| Shares |
| Value |
| ||||
|
|
|
|
|
| ||||||||
Shares sold |
|
| 34,192 |
| $ | 291,999 |
|
| 160,213 |
| $ | 1,574,634 |
|
Shares redeemed (b) |
|
| (96,596 | ) |
| (870,209 | ) |
| (74,734 | ) |
| (727,617 | ) |
|
|
|
|
|
| ||||||||
Net increase (decrease) |
|
| (62,404 | ) | $ | (578,210 | ) |
| 85,479 |
| $ | 847,017 |
|
|
|
|
|
|
| ||||||||
(b) Net of redemption fees of $399 and $194, respectively.
|
|
|
|
|
|
|
|
|
|
|
|
|
|
|
| Year Ended |
| Year Ended |
| ||||||||
|
|
|
| ||||||||||
Class C |
| Shares |
| Value |
| Shares |
| Value |
| ||||
|
|
|
|
|
| ||||||||
Shares sold |
|
| — |
| $ | — |
|
| 1,667 |
| $ | 16,667 |
|
Shares redeemed |
|
| (1,667 | ) |
| (13,917 | ) |
| — |
|
| — |
|
|
|
|
|
|
| ||||||||
Net increase (decrease) |
|
| (1,667 | ) | $ | (13,917 | ) |
| 1,667 |
| $ | 16,667 |
|
|
|
|
|
|
| ||||||||
|
|
|
|
|
|
|
|
|
|
|
|
|
|
|
| Year Ended |
| Year Ended |
| ||||||||
|
|
|
| ||||||||||
Class I |
| Shares |
| Value |
| Shares |
| Value |
| ||||
|
|
|
|
|
| ||||||||
Shares sold |
|
| 356,341 |
| $ | 3,533,815 |
|
| 720,711 |
| $ | 7,014,504 |
|
Shares redeemed (c) |
|
| (858,126 | ) |
| (6,971,982 | ) |
| (15,123 | ) |
| (148,246 | ) |
|
|
|
|
|
| ||||||||
Net increase (decrease) |
|
| (501,785 | ) | $ | (3,438,167 | ) |
| 705,588 |
| $ | 6,866,258 |
|
|
|
|
|
|
| ||||||||
|
|
(c) | Net of redemption fees of $8 and $2,139, respectively. |
* | Fund commenced operations on January 1, 2010. |
# | Financial statements are presented on a liquidation basis. |
|
|
The accompanying notes are an integral part of these financial statements. | |
|
|
34 |
|
Evermore Global Value Fund
|
FINANCIAL HIGHLIGHTS For a capital share outstanding throughout the year |
CLASS A
|
|
|
|
|
|
|
|
|
|
|
|
|
| Year Ended |
| Year Ended |
| ||||||
Net asset value, beginning of year |
|
| $ | 10.50 |
|
|
| $ | 10.00 |
|
|
|
|
|
|
|
|
|
| ||||
INCOME FROM INVESTMENT OPERATIONS |
|
|
|
|
|
|
|
|
|
|
|
Net investment income^ |
|
|
| 0.14 |
|
|
|
| 0.02 |
|
|
Net realized and unrealized gain (loss) on investments |
|
|
| (2.25 | ) |
|
|
| 0.48 |
|
|
|
|
|
|
|
|
|
| ||||
Total from investment operations |
|
|
| (2.11 | ) |
|
|
| 0.50 |
|
|
|
|
|
|
|
|
|
| ||||
LESS DISTRIBUTIONS |
|
|
|
|
|
|
|
|
|
|
|
From net investment income |
|
|
| (0.08 | ) |
|
|
| — |
|
|
|
|
|
|
|
|
|
| ||||
Total distributions |
|
|
| (0.08 | ) |
|
|
| — |
|
|
|
|
|
|
|
|
|
| ||||
Paid-in capital from redemption fees (Note 2) |
|
|
| 0.00 | 1 |
|
|
| 0.00 | 1 |
|
|
|
|
|
|
|
|
| ||||
Net asset value, end of year |
|
| $ | 8.31 |
|
|
| $ | 10.50 |
|
|
|
|
|
|
|
|
|
| ||||
|
|
|
|
|
|
|
|
|
|
|
|
Total return without sales load |
|
|
| (20.04 | )% |
|
|
| 5.00 | % |
|
Total return with sales load |
|
|
| (24.02 | )% |
|
|
| (0.28 | )% |
|
|
|
|
|
|
|
|
|
|
|
|
|
RATIOS/SUPPLEMENTAL DATA |
|
|
|
|
|
|
|
|
|
|
|
Net assets, end of year (thousands) |
|
| $ | 5,331 |
|
|
| $ | 3,651 |
|
|
|
|
|
|
|
|
|
|
|
|
|
|
RATIO OF EXPENSES TO AVERAGE NET ASSETS |
|
|
|
|
|
|
|
|
|
|
|
Before expenses absorbed2,6 |
|
|
| 2.24 | % |
|
|
| 3.60 | % |
|
After expenses absorbed3,6 |
|
|
| 1.70 | % |
|
|
| 1.62 | % |
|
|
|
|
|
|
|
|
|
|
|
|
|
RATIO OF NET INVESTMENT INCOME (LOSS) TO AVERAGE NET ASSETS | |||||||||||
Before expenses absorbed4,6 |
|
|
| 0.94 | % |
|
|
| (1.59 | )% |
|
After expenses absorbed5,6 |
|
|
| 1.48 | % |
|
|
| 0.39 | % |
|
Portfolio turnover rate |
|
|
| 94 | % |
|
|
| 77 | % |
|
|
|
* | Fund commenced operations on January 1, 2010. |
^ | Calculated using the average shares outstanding method. |
1 | Amount less than $0.01. |
2 | The ratio of expenses to average net assets before expenses absorbed includes interest expense and dividends on securities sold short. The ratio excluding interest expense and dividends on securities sold short was 2.14% and 3.58% for the years ended December 31, 2011 and 2010, respectively. |
3 | The ratio of expenses to average net assets after expenses absorbed includes interest expense and dividends on securities sold short. The ratio excluding interest expense and dividends on securities sold short was 1.60% and 1.60% for the years ended December 31, 2011 and 2010, respectively. |
4 | The ratio of net investment income (loss) to average net assets before expenses absorbed includes interest expense and dividends on securities sold short. The ratio excluding interest expense and dividends on securities sold short were 1.04% and (1.57)% for the years ended December 31, 2011 and 2010, respectively. |
5 | The ratio of net investment income (loss) to average net assets after expenses absorbed includes interest expense and dividends on securities sold short. The ratio excluding interest expense and dividends on securities sold short were 1.58% and 0.41% for the years ended December 31, 2011 and 2010, respectively. |
6 | Does not include expenses of the investment companies in which the Fund invests. |
The accompanying notes are an integral part of these financial statements.
|
|
| 35 |
Evermore Global Value Fund
|
FINANCIAL HIGHLIGHTS For a capital share outstanding throughout the year, Continued |
CLASS C
|
|
|
|
|
|
|
|
|
|
|
|
|
| Year Ended |
| Year Ended |
| ||||||
Net asset value, beginning of year |
|
| $ | 10.40 |
|
|
| $ | 10.00 |
|
|
|
|
|
|
|
|
|
| ||||
|
|
|
|
|
|
|
|
|
|
|
|
INCOME FROM INVESTMENT OPERATIONS |
|
|
|
|
|
|
|
|
|
|
|
Net investment income (loss)^ |
|
|
| 0.12 |
|
|
|
| (0.21 | ) |
|
Net realized and unrealized gain (loss) on investments |
|
|
| (2.26 | ) |
|
|
| 0.61 |
|
|
|
|
|
|
|
|
|
| ||||
Total from investment operations |
|
|
| (2.14 | ) |
|
|
| 0.40 |
|
|
|
|
|
|
|
|
|
| ||||
|
|
|
|
|
|
|
|
|
|
|
|
LESS DISTRIBUTIONS |
|
|
|
|
|
|
|
|
|
|
|
From net investment income |
|
|
| (0.06 | ) |
|
|
| — |
|
|
|
|
|
|
|
|
|
| ||||
Total distributions |
|
|
| (0.06 | ) |
|
|
| — |
|
|
|
|
|
|
|
|
|
| ||||
Net asset value, end of year |
|
| $ | 8.20 |
|
|
| $ | 10.40 |
|
|
|
|
|
|
|
|
|
| ||||
Total return without sales load |
|
|
| (20.56 | )% |
|
|
| 4.00 | % |
|
Total return with sales load |
|
|
| (21.35 | ) % |
|
|
| 3.00 | % |
|
|
|
|
|
|
|
|
|
|
|
|
|
RATIOS/SUPPLEMENTAL DATA |
|
|
|
|
|
|
|
|
|
|
|
Net assets, end of year (thousands) |
|
| $ | 226 |
|
|
| $ | 30 |
|
|
|
|
|
|
|
|
|
|
|
|
|
|
RATIO OF EXPENSES TO AVERAGE NET ASSETS |
|
|
|
|
|
|
|
|
|
|
|
Before expenses absorbed1,5 |
|
|
| 3.09 | % |
|
|
| 5.86 | % |
|
After expenses absorbed2,5 |
|
|
| 2.51 | % |
|
|
| 2.37 | % |
|
|
|
|
|
|
|
|
|
|
|
|
|
RATIO OF NET INVESTMENT INCOME (LOSS) TO AVERAGE NET ASSETS | |||||||||||
Before expenses absorbed3,5 |
|
|
| 0.70 | % |
|
|
| (4.02 | )% |
|
After expenses absorbed4,5 |
|
|
| 1.28 | % |
|
|
| (0.53 | )% |
|
Portfolio turnover rate |
|
|
| 94 | % |
|
|
| 77 | % |
|
|
|
* | Fund commenced operations on January 1, 2010. |
^ | Calculated using the average shares outstanding method. |
1 | The ratio of expenses to average net assets before expenses absorbed includes interest expense and dividends on securities sold short. The ratio excluding interest expense and dividends on securities sold short was 2.93% and 5.84% for the years ended December 31, 2011 and 2010, respectively. |
2 | The ratio of expenses to average net assets after expenses absorbed includes interest expense and dividends on securities sold short. The ratio excluding interest expense and dividends on securities sold short was 2.35% and 2.35% for the years ended December 31, 2011 and 2010, respectively. |
3 | The ratio of net investment income (loss) to average net assets before expenses absorbed includes interest expense and dividends on securities sold short. The ratio excluding interest expense and dividends on securities sold short were 0.86% and (4.00)% for the years ended December 31, 2011 and 2010, respectively. |
4 | The ratio of net investment income (loss) to average net assets after expenses absorbed includes interest expense and dividends on securities sold short. The ratio excluding interest expense and dividends on securities sold short were 1.44% and (0.51)% for the years ended December 31, 2011 and 2010, respectively. |
5 | Does not include expenses of the investment companies in which the Fund invests. |
The accompanying notes are an integral part of these financial statements.
|
|
36 |
|
Evermore Global Value Fund
|
FINANCIAL HIGHLIGHTS For a capital share outstanding throughout the year, Continued |
CLASS I
|
|
|
|
|
|
|
|
|
|
|
|
|
| Year Ended |
| Year Ended |
| ||||||
Net asset value, beginning of year |
|
| $ | 10.52 |
|
|
| $ | 10.00 |
|
|
|
|
|
|
|
|
|
| ||||
|
|
|
|
|
|
|
|
|
|
|
|
INCOME FROM INVESTMENT OPERATIONS |
|
|
|
|
|
|
|
|
|
|
|
Net investment income^ |
|
|
| 0.17 |
|
|
|
| 0.03 |
|
|
Net realized and unrealized gain (loss) on investments |
|
|
| (2.26 | ) |
|
|
| 0.49 |
|
|
|
|
|
|
|
|
|
| ||||
Total from investment operations |
|
|
| (2.09 | ) |
|
|
| 0.52 |
|
|
|
|
|
|
|
|
|
| ||||
|
|
|
|
|
|
|
|
|
|
|
|
LESS DISTRIBUTIONS |
|
|
|
|
|
|
|
|
|
|
|
From net investment income |
|
|
| (0.11 | ) |
|
|
| — |
|
|
|
|
|
|
|
|
|
| ||||
Total distributions |
|
|
| (0.11 | ) |
|
|
| — |
|
|
|
|
|
|
|
|
|
| ||||
Net asset value, end of year |
|
| $ | 8.32 |
|
|
| $ | 10.52 |
|
|
|
|
|
|
|
|
|
| ||||
Total return |
|
|
| (19.82 | )% |
|
|
| 5.20 | % |
|
|
|
|
|
|
|
|
|
|
|
|
|
RATIOS/SUPPLEMENTAL DATA |
|
|
|
|
|
|
|
|
|
|
|
Net assets, end of year (thousands) |
|
| $ | 27,595 |
|
|
| $ | 32,058 |
|
|
|
|
|
|
|
|
|
|
|
|
|
|
RATIO OF EXPENSES TO AVERAGE NET ASSETS |
|
|
|
|
|
|
|
|
|
|
|
Before expenses absorbed1,5 |
|
|
| 2.01 | % |
|
|
| 3.23 | % |
|
After expenses absorbed2,5 |
|
|
| 1.46 | % |
|
|
| 1.37 | % |
|
|
|
|
|
|
|
|
|
|
|
|
|
RATIO OF NET INVESTMENT INCOME (LOSS) TO AVERAGE NET ASSETS | |||||||||||
Before expenses absorbed3,5 |
|
|
| 1.14 | % |
|
|
| (1.30 | )% |
|
After expenses absorbed4,5 |
|
|
| 1.69 | % |
|
|
| 0.56 | % |
|
Portfolio turnover rate |
|
|
| 94 | % |
|
|
| 77 | % |
|
|
|
* | Fund commenced operations on January 1, 2010. |
^ | Calculated using the average shares outstanding method. |
1 | The ratio of expenses to average net assets before expenses absorbed includes interest expense and dividends on securities sold short. The ratio excluding interest expense and dividends on securities sold short was 1.90% and 3.21% for the years ended December 31, 2011 and 2010, respectively. |
2 | The ratio of expenses to average net assets after expenses absorbed includes interest expense and dividends on securities sold short. The ratio excluding interest expense and dividends on securities sold short was 1.35% and 1.35% for the years ended December 31, 2011 and 2010, respectively. |
3 | The ratio of net investment income (loss) to average net assets before expenses absorbed includes interest expense and dividends on securities sold short. The ratio excluding interest expense and dividends on securities sold short were 1.25% and (1.28)% for the years ended December 31, 2011 and 2010, respectively. |
4 | The ratio of net investment income (loss) to average net assets after expenses absorbed includes interest expense and dividends on securities sold short. The ratio excluding interest expense and dividends on securities sold short were 1.80% and 0.58% for the years ended December 31, 2011 and 2010, respectively. |
5 | Does not include expenses of the investment companies in which the Fund invests. |
The accompanying notes are an integral part of these financial statements.
|
|
| 37 |
Evermore European Value Fund
|
FINANCIAL HIGHLIGHTS For a capital share outstanding throughout the year |
CLASS A
|
|
|
|
|
|
|
|
|
|
|
|
|
| Year Ended |
| Year Ended |
| ||||||
Net asset value, beginning of year |
|
| $ | 10.02 |
|
|
| $ | 10.00 |
|
|
|
|
|
|
|
|
|
| ||||
|
|
|
|
|
|
|
|
|
|
|
|
INCOME FROM INVESTMENT OPERATIONS |
|
|
|
|
|
|
|
|
|
|
|
Net investment income^ |
|
|
| 0.03 |
|
|
|
| 0.02 |
|
|
Net realized and unrealized gain (loss) on investments |
|
|
| (2.50 | ) |
|
|
| — |
|
|
|
|
|
|
|
|
|
| ||||
Total from investment operations |
|
|
| (2.47 | ) |
|
|
| 0.02 |
|
|
|
|
|
|
|
|
|
| ||||
Paid-in capital from redemption fees (Note 2) |
|
|
| — |
|
|
|
| 0.001 |
|
|
|
|
|
|
|
|
|
| ||||
Net asset value, end of year |
|
| $ | 7.55 |
|
|
| $ | 10.02 |
|
|
|
|
|
|
|
|
|
| ||||
|
|
|
|
|
|
|
|
|
|
|
|
Total return without sales load |
|
|
| (24.65 | )% |
|
|
| 0.20 | % |
|
Total return with sales load |
|
|
| (28.44 | )% |
|
|
| (4.84 | )% |
|
|
|
|
|
|
|
|
|
|
|
|
|
RATIOS/SUPPLEMENTAL DATA |
|
|
|
|
|
|
|
|
|
|
|
Net assets, end of year (thousands) |
|
| $ | 174 |
|
|
| $ | 857 |
|
|
|
|
|
|
|
|
|
|
|
|
|
|
RATIO OF EXPENSES TO AVERAGE NET ASSETS |
|
|
|
|
|
|
|
|
|
|
|
Before expenses absorbed2,6 |
|
|
| 6.92 | % |
|
|
| 14.21 | % |
|
After expenses absorbed3,6 |
|
|
| 1.73 | % |
|
|
| 1.63 | % |
|
|
|
|
|
|
|
|
|
|
|
|
|
RATIO OF NET INVESTMENT INCOME (LOSS) TO AVERAGE NET ASSETS | |||||||||||
Before expenses absorbed4,6 |
|
|
| (4.89 | )% |
|
|
| (12.26 | )% |
|
After expenses absorbed5,6 |
|
|
| 0.30 | % |
|
|
| 0.32 | % |
|
Portfolio turnover rate |
|
|
| 86 | % |
|
|
| 37 | % |
|
|
|
* | Fund commenced operations on January 1, 2010. |
# | Financial statements are presented on a liquidation basis. |
^ | Calculated using the average shares outstanding method. |
1 | Amount less than $0.01. |
2 | The ratio of expenses to average net assets before expenses absorbed includes interest expense and dividends on securities sold short. The ratio excluding interest expense and dividends on securities sold short was 6.83%+ and 5.84% for the years ended December 31, 2011 and 2010, respectively. |
3 | The ratio of expenses to average net assets after expenses absorbed includes interest expense and dividends on securities sold short. The ratio excluding interest expense and dividends on securities sold short was 1.64%+ and 1.60% for the years ended December 31, 2011 and 2010, respectively. |
4 | The ratio of net investment income (loss) to average net assets before expenses absorbed includes interest expense and dividends on securities sold short. The ratio excluding interest expense and dividends on securities sold short were (4.80)%+ and (12.23)% for the years ended December 31, 2011 and 2010, respectively. |
5 | The ratio of net investment income (loss) to average net assets after expenses absorbed includes interest expense and dividends on securities sold short. The ratio excluding interest expense and dividends on securities sold short were 0.39%+ and 0.35% for the years ended December 31, 2011 and 2010, respectively. |
6 | Does not include expenses of the investment companies in which the Fund invests. |
The accompanying notes are an integral part of these financial statements.
|
|
38 |
|
Evermore European Value Fund
|
FINANCIAL HIGHLIGHTS For a capital share outstanding throughout the year, Continued |
CLASS I
|
|
|
|
|
|
|
|
|
|
|
|
|
| Year Ended |
| Year Ended |
| ||||||
Net asset value, beginning of year |
|
| $ | 10.07 |
|
|
| $ | 10.00 |
|
|
|
|
|
|
|
|
|
| ||||
|
|
|
|
|
|
|
|
|
|
|
|
INCOME FROM INVESTMENT OPERATIONS |
|
|
|
|
|
|
|
|
|
|
|
Net investment income^ |
|
|
| 0.07 |
|
|
|
| 0.01 |
|
|
Net realized and unrealized gain (loss) on investments |
|
|
| (2.55 | ) |
|
|
| 0.06 |
|
|
|
|
|
|
|
|
|
| ||||
Total from investment operations |
|
|
| (2.48 | ) |
|
|
| 0.07 |
|
|
|
|
|
|
|
|
|
| ||||
Paid-in capital from redemption fees (Note 2) |
|
|
| — |
|
|
|
| 0.001 |
|
|
|
|
|
|
|
|
|
| ||||
Net asset value, end of year |
|
| $ | 7.59 |
|
|
| $ | 10.07 |
|
|
|
|
|
|
|
|
|
| ||||
Total return |
|
|
| (24.63 | )% |
|
|
| 0.70 | % |
|
|
|
|
|
|
|
|
|
|
|
|
|
RATIOS/SUPPLEMENTAL DATA |
|
|
|
|
|
|
|
|
|
|
|
Net assets, end of year (thousands) |
|
| $ | 1,547 |
|
|
| $ | 7,102 |
|
|
|
|
|
|
|
|
|
|
|
|
|
|
RATIO OF EXPENSES TO AVERAGE NET ASSETS |
|
|
|
|
|
|
|
|
|
|
|
Before expenses absorbed2,6 |
|
|
| 6.05 | % |
|
|
| 11.40 | % |
|
After expenses absorbed3,6 |
|
|
| 1.47 | % |
|
|
| 1.38 | % |
|
|
|
|
|
|
|
|
|
|
|
|
|
RATIO OF NET INVESTMENT INCOME (LOSS) TO AVERAGE NET ASSETS |
|
|
|
|
|
|
|
|
|
|
|
Before expenses absorbed4,6 |
|
|
| (3.88 | )% |
|
|
| (9.82 | )% |
|
After expenses absorbed5,6 |
|
|
| 0.70 | % |
|
|
| 0.20 | % |
|
Portfolio turnover rate |
|
|
| 86 | % |
|
|
| 37 | % |
|
|
|
* | Fund commenced operations on January 1, 2010. |
# | Financial statements are presented on a liquidation basis. |
^ | Calculated using the average shares outstanding method. |
1 | Amount less than $0.01. |
2 | The ratio of expenses to average net assets before expenses absorbed includes interest expense and dividends on securities sold short. The ratio excluding interest expense and dividends on securities sold short was 5.95%+ and 11.73% for the years ended December 31, 2011 and 2010, respectively. |
3 | The ratio of expenses to average net assets after expenses absorbed includes interest expense and dividends on securities sold short. The ratio excluding interest expense and dividends on securities sold short was 1.37%+ and 1.35% for the years ended December 31, 2011 and 2010, respectively. |
4 | The ratio of net investment income (loss) to average net assets before expenses absorbed includes interest expense and dividends on securities sold short. The ratio excluding interest expense and dividends on securities sold short were (3.78)%+ and (9.79)% for the years ended December 31, 2011 and 2010, respectively. |
5 | The ratio of net investment income (loss) to average net assets after expenses absorbed includes interest expense and dividends on securities sold short. The ratio excluding interest expense and dividends on securities sold short were 0.80%+ and 0.23% for the years ended December 31, 2011 and 2010, respectively. |
6 | Does not include expenses of the investment companies in which the Fund invests. |
The accompanying notes are an integral part of these financial statements.
|
|
| 39 |
|
Evermore Funds |
|
NOTES TO FINANCIAL STATEMENTS December 31, 2011 |
|
NOTE 1 – ORGANIZATION |
The Evermore Global Value Fund and the Evermore European Value Fund (each a “Fund” and collectively, the “Funds”) are a series of shares of Evermore Funds Trust (the “Trust”), which is registered under the Investment Company Act of 1940, as amended (the “1940 Act”) as an open-end management investment company. The Funds commenced operations on January 1, 2010.
The Funds offer Class A and Class I shares. In addition, the Evermore Global Value Fund offers Class C shares. Class A shares are sold with a front-end sales charge. Class C shares are sold with a back-end sales charge for shares redeemed within 12 months after purchase. Class I shares have no sales charge and are offered primarily for direct investment by investors such as pension and profit sharing plans, employee benefit trusts, certain financial intermediaries, endowments, foundations and corporations. Each class of shares has equal rights as to earnings and assets except that each class bears different distribution expenses. Each class of shares has exclusive voting rights with respect to matters that affect just that class. Income, expenses (other than expenses attributable to a specific class), and realized and unrealized gains or losses on investments are allocated to each class of shares based on its relative net assets. Class A shares are sold with a front-end sales charge of 5.00%. Purchases greater than $1 million into the Funds are offered at net asset value and subject to a 0.75% contingent deferred sales charge (“CDSC”) if redeemed within 12 months. For Class C shares, a 1.00% CDSC applies to the lesser of the amount invested or the redemption value of Class C shares redeemed within 12 months after purchase. For Class I shares, the offering and redemption price per share for each Fund is equal to each Fund’s net asset value per share. The Funds charge a 200% redemption fee on shares held less than 30 days.
The investment objective of the Evermore Global Value Fund is to seek capital appreciation by investing in securities from markets around the world, including U.S. markets. The investment objective of the Evermore European Value Fund is to seek capital appreciation by investing in securities from European markets.
Pursuant to the Supplement dated December 19, 2011 to the Prospectus and Statement of Additional Information (“SAI”) dated April 30, 2011, the Board of Trustees approved the liquidation of the Evermore European Value Fund effective January 31, 2012. As of December 31, 2011 the financial statements of the Fund have been presented on a liquidation basis, which includes adjustments to present the net realizable value of the Fund assets and liabilities through the liquidation of the Fund.
|
|
40 |
|
|
Evermore Funds |
|
NOTES TO FINANCIAL STATEMENTS December 31, 2011, Continued |
|
NOTE 2 – SIGNIFICANT ACCOUNTING POLICIES |
The following is a summary of significant accounting policies consistently followed by the Fund. These policies are in conformity with accounting principles generally accepted in the United States of America (“U.S. GAAP”).
|
|
A. | Security Valuation. All equity securities that are traded on a national securities exchange, except those listed on the NASDAQ Global Market® (“NASDAQ”) are valued at the last reported sale price on the exchange on which the security is principally traded. Securities traded on NASDAQ will be valued at the NASDAQ Official Closing Price. If, on a particular day, an exchange-traded or NASDAQ security does not trade, then the mean between the most recent quoted bid and asked prices will be used. All equity securities that are not traded on a listed exchange are valued at the last sale price in the over-the-counter market. If a non-exchange traded security does not trade on a particular day, then the mean between the last quoted closing bid and asked price will be used. |
|
|
| Debt securities exceeding 60 days to maturity are valued by an independent pricing service. The pricing service may employ methodologies that utilize actual market transactions, broker-dealer supplied valuations, or other formula-driven valuation techniques. These techniques generally consider such factors as yields or prices of bonds of comparable quality, type of issue, coupon, maturity, ratings, and general market conditions. Securities for which prices are not available from an independent pricing service, but where an active market exists, are valued using market quotations obtained from one or more dealers that make markets in the securities or from a widely used quotation system. Debt securities that have maturities of less than 60 days, at the time of purchase, are valued at cost, which when combined with accrued interest, approximates market value. |
|
|
| Short-term securities that have maturities of less than 60 days, at the time of purchase, are valued at cost, which when combined with accrued interest, approximates market value. |
|
|
| The Funds invest substantially in securities traded on foreign exchanges (see “Foreign Currency Translation” below). Investments that are primarily traded on foreign exchanges are generally valued at the preceding closing values of such securities on their respective exchanges, or if there were no transactions on such day, at the mean between the bid and asked prices. The prices for foreign securities are reported in local currency and converted to U.S. dollars using currency exchange rates. Exchange rates are provided daily by recognized independent pricing agents. Foreign currency forward contracts are valued at the current day’s interpolated foreign exchange rate, as calculated using the |
|
|
| 41 |
|
Evermore Funds |
|
NOTES TO FINANCIAL STATEMENTS December 31, 2011, Continued |
|
|
| current day’s exchange rate, and the relevant forward rates provided by an independent pricing service. |
|
|
| There may be less publicly available information about a foreign company than about a U.S. company. Foreign issuers may not be subject to accounting, auditing and financial reporting standards and requirements comparable to, or as uniform as, those of U.S. issuers. The number of securities traded, and the frequency of such trading, in non-U.S. securities markets, while growing in volume, is for the most part, substantially less in U.S. markets. As a result, securities of many foreign issuers are less liquid and their prices more volatile than securities of comparable U.S. issuer. Transaction costs, the costs associated with buying and selling securities on non-U.S. securities markets may be higher than in the U.S. There is generally less government supervision and regulation of exchanges, brokers and issuers than there is in the U.S. Each Fund’s foreign investments may include both voting and non-voting securities, sovereign debt and participations in foreign government deals. The Funds may have greater difficulty taking appropriate legal action with respect to domestic issuers in U.S. courts. |
|
|
| For foreign securities traded on foreign exchanges the Trust has selected FT Interactive Data (“FTID”) to provide pricing data with respect to foreign security holdings held by the Fund. The use of this third-party pricing service is designed to capture events occurring after a foreign exchange closes that may affect the value of certain holdings of the Fund’s securities traded on those foreign exchanges. The Fund utilizes a confidence interval when determining the use of the FTID provided prices. The confidence interval is a measure of the historical relationship that each foreign exchange traded security has to movements in various indices and the price of the security’s corresponding American Depository Receipt, if one exists. FTID provides the confidence interval for each security for which it provides a price. If the FTID provided price falls within the confidence interval the Fund will value the particular security at that price. If the FTID provided price does not fall within the confidence interval the particular security will be valued at the preceding closing price on its respective foreign exchange, or if there were no transactions on such day, at the mean between the bid and asked prices. |
|
|
| Securities for which quotations are not readily available are valued at their respective fair values as determined in good faith by the Board of Trustees. When a security is “fair valued,” consideration is given to the facts and circumstances relevant to the particular situation, including a review of various factors set forth in the pricing procedures adopted by the Fund’s Board of Trustees. Fair value pricing is an inherently subjective process, and no single standard exists for determining fair value. Different funds could reasonably |
|
|
42 |
|
|
Evermore Funds |
|
NOTES TO FINANCIAL STATEMENTS December 31, 2011, Continued |
|
| |
| arrive at different values for the same security. The use of fair value pricing by a fund may cause the net asset value of its shares to differ significantly from the net asset value that would be calculated without regard to such considerations. As of December 31, 2011, the Funds did not hold fair valued securities other than the securities fair valued by FTID. | |
|
| |
| As described above, the Funds utilize various methods to measure the fair value of most of its investments on a recurring basis. U.S. GAAP establishes a hierarchy that prioritizes inputs to valuation methods. The three levels of inputs are: | |
|
|
|
| Level 1 – | Unadjusted quoted prices in active markets for identical assets or liabilities that the Funds have the ability to access. |
|
|
|
| Level 2 – | Observable inputs other than quoted prices included in Level 1 that are observable for the asset or liability, either directly or indirectly. These inputs may include quoted prices for the identical instrument on an inactive market, prices for similar instruments, interest rates, prepayment speeds, credit risk, yield curves, default rates and similar data. |
|
|
|
| Level 3 – | Unobservable inputs for the asset or liability, to the extent relevant observable inputs are not available; representing the Funds’ own assumptions about the assumptions a market participant would use in valuing the asset or liability, and would be based on the best information available. |
|
|
|
| The availability of observable inputs can vary from security to security and is affected by a wide variety of factors, including, for example, the type of security whether the security is new and not yet established in the marketplace, the liquidity of markets, and other characteristics particular to the security. To the extent that valuation is based on models or inputs that are less observable or unobservable in the market, the determination of fair value requires more judgment. Accordingly, the degree of judgment exercised in determining fair value is greatest for instruments categorized in Level 3. | |
|
| |
| The inputs used to measure fair value may fall into different levels of the fair value hierarchy. In such cases, for disclosure purposes, the level in the fair value hierarchy within which the fair value measurement falls in its entirety, is determined based on the lowest level input that is significant to the fair value measurement in its entirety. | |
|
|
| 43 |
|
Evermore Funds |
|
NOTES TO FINANCIAL STATEMENTS December 31, 2011, Continued |
|
|
| The following is a summary of the inputs used to value the Evermore Global Value Fund’s net assets as of December 31, 2011: |
|
|
|
|
|
|
|
|
|
|
|
|
|
|
|
| Level 1 |
| Level 2 |
| Level 3 |
| Total |
| ||||
|
|
|
|
|
| ||||||||
Common Stocks^ |
| $ | 6,495,316 |
| $ | 13,898,758 |
| $ | — |
| $ | 20,394,074 |
|
Partnerships & Trusts^ |
|
| 2,629,407 |
|
| — |
|
| — |
|
| 2,629,407 |
|
Warrants^ |
|
| 1,998,699 |
|
| — |
|
| — |
|
| 1,998,699 |
|
Corporate Bonds^ |
|
| — |
|
| 3,164,454 |
|
| — |
|
| 3,164,454 |
|
Convertible Bond^ |
|
| — |
|
| 930,000 |
|
| — |
|
| 930,000 |
|
Municipal Bonds^ |
|
| — |
|
| 735,681 |
|
|
|
|
| 735,681 |
|
Put Options Purchased^ |
|
| 5,790 |
|
| 234,604 |
|
| — |
|
| 240,394 |
|
|
|
|
|
|
| ||||||||
Total Investments in Securities |
| $ | 11,129,212 |
| $ | 18,963,497 |
| $ | — |
| $ | 30,092,709 |
|
|
|
|
|
|
| ||||||||
Other Financial Instruments# |
|
|
|
|
|
|
|
|
|
|
|
|
|
Unrealized appreciation |
| $ | — |
| $ | 414,747 |
| $ | — |
| $ | 414,747 |
|
Unrealized depreciation |
|
| — |
|
| (5,870 | ) |
|
|
|
| (5,870 | ) |
|
|
|
|
|
| ||||||||
Total Investments in Other Financial Instruments |
| $ | — |
| $ | 408,877 |
| $ | — |
| $ | 408,877 |
|
|
|
|
|
|
| ||||||||
Securities Sold Short |
| $ | 250,000 |
| $ | 605,070 |
| $ | — |
| $ | 855,270 |
|
|
|
|
|
|
| ||||||||
|
|
|
| ^ | See Schedule of Investments for industry breakout. |
| # | Other Financial Instruments are derivative instruments (forward currency contracts), which represents the unrealized appreciation (depreciation) on such investments. |
|
|
|
|
|
Transfers into Level 1 |
| $ | — |
|
* Transfers out of Level 1 |
|
| 22,847,822 |
|
|
|
| ||
Net transfers in and/or out of Level 1 |
| $ | 22,847,822 |
|
|
|
| ||
|
|
|
|
|
* Transfers into Level 2 |
| $ | 22,847,822 |
|
Transfers out of Level 2 |
|
| — |
|
|
|
| ||
Net transfers in and/or out of Level 2 |
| $ | 22,847,822 |
|
|
|
|
|
|
| Transfers were made out of Level 1 and into Level 2 due to the Fund’s utilization of FTID for foreign security valuation. |
|
|
44 |
|
|
Evermore Funds |
|
NOTES TO FINANCIAL STATEMENTS December 31, 2011, Continued |
|
|
| The following is a summary of the inputs used to value the Evermore European Value Fund’s net assets as of December 31, 2011: |
|
|
|
|
|
|
|
|
|
|
|
|
|
|
|
| Level 1 |
| Level 2 |
| Level 3 |
| Total |
| ||||
|
|
|
|
|
| ||||||||
Common Stocks^ |
| $ | 137,514 |
| $ | 308,031 |
| $ | — |
| $ | 445,545 |
|
Warrant^ |
|
| 66,436 |
|
| — |
|
| — |
|
| 66,436 |
|
Put Option Purchased^ |
|
| — |
|
| 67 |
|
| — |
|
| 67 |
|
Short-Term Investments |
|
| 957,308 |
|
| — |
|
| — |
|
| 957,308 |
|
|
|
|
|
|
| ||||||||
Total Investments in Securities |
| $ | 1,161,258 |
| $ | 308,098 |
| $ | — |
| $ | 1,469,356 |
|
|
|
|
|
|
| ||||||||
Other Financial Instruments# |
|
|
|
|
|
|
|
|
|
|
|
|
|
Unrealized appreciation |
| $ | — |
| $ | 106,014 |
| $ | — |
| $ | 106,014 |
|
Unrealized depreciaiotn |
|
| — |
|
| (19,146 | ) |
| — |
|
| (19,146 | ) |
|
|
|
|
|
| ||||||||
Total Investments in Other Financial Instruments |
| $ | — |
| $ | 86,868 |
| $ | — |
| $ | 86,868 |
|
|
|
|
|
|
| ||||||||
Securities Sold Short |
| $ |
|
| $ | 8,112 |
| $ | — |
| $ | 8,112 |
|
|
|
|
|
|
| ||||||||
|
|
^ | See Schedule of Investments for industry breakout. |
# | Other Financial Instruments are derivative instruments (forward currency contracts), which represents the unrealized appreciation (depreciation) on such investments. |
|
|
|
|
|
Transfers into Level 1 |
| $ | — |
|
* Transfers out of Level 1 |
|
| 6,223,429 |
|
|
|
| ||
Net transfers in and/or out of Level 1 |
| $ | 6,223,429 |
|
|
|
| ||
|
|
|
|
|
* Transfers into Level 2 |
| $ | 6,223,429 |
|
Transfers out of Level 2 |
|
| — |
|
|
|
| ||
Net transfers in and/or out of Level 2 |
| $ | 6,223,429 |
|
|
|
|
|
|
| Transfers were made out of Level 1 and into Level 2 due to the Fund’s utilization of FTID for foreign security valuation. |
|
|
| Level 3 Reconciliation Disclosure |
|
|
| Following is the reconciliation of Level 3 assets for which significant unobservable inputs were used to determine fair value. |
|
|
|
|
|
Evermore Global Value Fund |
|
|
|
|
|
|
|
|
|
Balance as of 12/31/10 |
| $ | 5,185 |
|
Accrued discounts/premiums |
|
| — |
|
Realized gain (loss) |
|
| — |
|
Change in unrealized appreciation (depreciation) |
|
| — |
|
Net purchases |
|
| — |
|
Transfers in and/or out of Level 3 |
|
| — |
|
Options exercised |
|
| (5,185 | ) |
|
|
| ||
Balance as of December 31, 2011 |
| $ | — |
|
|
|
|
|
|
| 45 |
Evermore Funds
|
NOTES TO FINANCIAL STATEMENTS December 31, 2011, Continued |
|
|
|
|
|
Evermore European Value Fund |
|
|
|
|
| ||||
Balance as of 12/31/10 |
| $ | 972 |
|
Accrued discounts/premiums |
|
| — |
|
Realized gain (loss) |
|
| — |
|
Change in unrealized appreciation (depreciation) |
|
| — |
|
Net purchases |
|
| — |
|
Transfers in and/or out of Level 3 |
|
| — |
|
Options exercised |
|
| (972 | ) |
|
|
| ||
Balance as of December 31, 2011 |
| $ | — |
|
|
|
|
* Transfers between Levels are recognized at the end of the reporting period.
|
|
| The Funds have adopted enhanced disclosure regarding derivatives and hedging activity intended to improve financial reporting of derivative instruments by enabling investors to understand how and why an entity uses derivatives, how derivatives are accounted for, and how derivative instruments affect an entity’s results of operations and financial position. |
|
|
| The Funds may employ hedging strategies. Hedging is a technique designed to reduce a potential loss to a fund as a result of certain economic or market risks, including risks related to fluctuations in interest rates, currency exchange rates between U.S. and foreign securities or between different foreign currencies, and broad or specific market movements. When pursuing these hedging strategies, the Funds will primarily engage in forward foreign currency exchange contracts. However, the Funds may also engage in the following currency transactions: currency futures contracts, currency swaps, options on currencies, or options on currency futures. In addition, the Funds may engage in other types of transactions, such as the purchase and sale of exchange-listed and over-the-counter (“OTC”) put and call options on securities, equity and fixed-income indices and other financial instruments; and the purchase and sale of financial and other futures contracts and options on futures contracts. |
|
|
46 |
|
Evermore Funds
|
NOTES TO FINANCIAL STATEMENTS December 31, 2011, Continued |
|
|
| Evermore Global Value Fund |
|
|
| Statement of Assets and Liabilities |
|
|
| Fair values of Derivative Instruments as of December 31, 2011: |
|
|
|
|
|
|
|
|
|
|
|
|
|
|
|
| Asset Derivatives as |
| Liability Derivatives as |
| ||||||||
|
|
|
| ||||||||||
Derivative Instruments |
| Balance |
| Fair Value |
| Balance |
| Fair Value |
| ||||
|
|
|
|
| |||||||||
Forward Currency Contracts |
| Unrealized gain on forward currency contracts |
|
| $414,747 |
|
| Unrealized loss on forward currency contracts |
|
| $5,870 |
|
|
| |||||||||||||
Put Options Purchased |
| Investments in securities, at value |
|
| 240,394 |
|
| None |
|
| — |
|
|
|
|
|
|
|
|
|
|
|
|
|
| ||
Total |
|
|
|
| $655,141 |
|
|
|
|
| $5,870 |
|
|
|
|
|
|
|
|
|
|
|
|
|
| ||
|
|
| Statement of Operations |
|
|
| The effect of Derivative Instruments for the year ended December 31, 2011: |
|
|
|
|
|
|
|
|
|
|
|
|
|
|
Derivative |
| Location |
| Realized |
| Location |
| Change in |
| ||||
|
|
|
|
| |||||||||
Forward Currency Contracts |
| Net realized loss on investments, options, and foreign currency transactions & forward currency contracts |
|
| $(166,225 | ) |
| Change in unrealized appreciation on foreign currency translations & forward contracts |
|
| $456,649 |
|
|
| |||||||||||||
Call Options Purchased |
| Same as above |
|
| (234,623 | ) |
| Change in net |
|
| 126,481 |
|
|
| |||||||||||||
Put Options Purchased |
| Same as above |
|
| 680,743 |
|
| Same as above |
|
| (723,078 | ) |
|
|
|
|
|
|
|
|
|
|
|
|
| ||
Total |
|
|
|
| $ 210,895 |
|
|
|
|
| $139,948 |
|
|
|
|
|
|
|
|
|
|
|
|
|
| ||
|
|
| 47 |
Evermore Funds
|
NOTES TO FINANCIAL STATEMENTS December 31, 2011, Continued |
|
|
| Evermore European Value Fund |
|
|
| Statement of Assets and Liabilities |
|
|
| Fair values of Derivative Instruments as of December 31, 2011: |
|
|
|
|
|
|
|
|
|
|
|
|
|
|
|
| Asset Derivatives as |
| Liability Derivatives as |
| ||||||||
|
|
|
| ||||||||||
Derivative Instruments |
| Balance |
| Fair Value |
| Balance |
| Fair Value |
| ||||
|
|
|
|
| |||||||||
Forward Currency Contracts |
| Unrealized gain on forward currency contracts |
|
| $106,014 |
|
| Unrealized loss on forward currency contracts |
|
| $19,146 |
|
|
| |||||||||||||
Put Options Purchased |
| Investments in securities at value |
|
| 67 |
|
| None |
|
| — |
|
|
|
|
|
|
|
|
|
|
|
|
|
| ||
Total |
|
|
|
| $106,081 |
|
|
|
|
| $19,146 |
|
|
|
|
|
|
|
|
|
|
|
|
|
| ||
|
|
| Statement of Operations |
|
|
| The effect of Derivative Instruments for the year ended December 31, 2011: |
|
|
|
|
|
|
|
|
|
|
|
|
|
|
Derivative |
| Location |
| Realized |
| Location |
| Change in |
| ||||
|
|
|
|
| |||||||||
Forward Currency Contracts |
| Net realized loss on investments, options, and foreign currency transactions & forward currency contracts |
|
| $(148,809 | ) |
| Change in unrealized appreciation on foreign currency translations & forward contracts |
|
| $115,580 |
|
|
| |||||||||||||
Call Options Purchased |
| Same as above |
|
| (49,010 | ) |
| Change in net |
|
| 24,390 |
|
|
| |||||||||||||
Put Options Purchased |
| Same as above |
|
| 3,624 |
|
| Same as above |
|
| (1,445 | ) |
|
|
|
|
|
|
|
|
|
|
|
|
| ||
Total |
|
|
|
| $(194,195 | ) |
|
|
|
| $138,525 |
|
|
|
|
|
|
|
|
|
|
|
|
|
| ||
|
|
48 |
|
Evermore Funds
|
NOTES TO FINANCIAL STATEMENTS December 31, 2011, Continued |
|
|
|
| B. | Option Writing. When a Fund writes an option, an amount equal to the premium received by the Fund is recorded as a liability and is subsequently adjusted to the current fair value of the option written. Premiums received from writing options that expire unexercised are treated by the Fund on the expiration date as realized gains from investments. The difference between the premium and the amount paid on effecting a closing purchase transaction, including brokerage commissions, is also treated as a realized gain, or, if the premium is less than the amount paid for the closing purchase transaction, as a realized loss. If a call option is exercised, the premium is added to the proceeds from the sale of the underlying security or currency in determining whether the Fund has realized a gain or loss. If a put option is exercised, the premium reduces the cost basis of the securities purchased by the Fund. The Fund as writer of an option bears the market risk of an unfavorable change in the price of the security underlying the written option. |
|
|
|
| C. | Foreign Currency Translation. Investment securities and other assets and liabilities denominated in foreign currencies are translated into U.S. dollar amounts at the date of valuation. Purchases and sales of investment securities and income and expense items denominated in foreign currencies are translated into U.S. dollar amounts on the respective dates of such transactions. |
|
|
|
|
| The Funds do not isolate that portion of the results of operations resulting from changes in foreign exchange rates on investments from the fluctuations arising from changes in market prices of securities held. Such fluctuations are included with the net realized and unrealized gain or loss from investments. |
|
|
|
|
| The Funds report net realized foreign exchange gains or losses that arise from sales of foreign currencies, currency gains or losses realized between the trade and settlement dates on securities transactions, and the difference between the amounts of dividends, interest, and foreign withholding taxes recorded on the Fund’s books and the U.S. dollar equivalent of the amounts actually received or paid. Net unrealized foreign exchange gains and losses arise from changes in the fair values of assets and liabilities, other than investments in securities at fiscal period end, resulting from changes in exchange rates. |
|
|
|
| D. | Federal Income Taxes. Each Fund has elected to be taxed as a “regulated investment company” and intends to distribute substantially all taxable income to its shareholders and otherwise comply with the provisions of Subchapter M of the Internal Revenue Code applicable to regulated investment companies. Therefore, no provision for federal income taxes or excise taxes has been made. |
|
|
|
|
| In order to avoid imposition of the excise tax applicable to regulated investment companies, each Fund intends to declare each year as dividends in each calendar |
|
|
| 49 |
Evermore Funds
|
NOTES TO FINANCIAL STATEMENTS December 31, 2011, Continued |
|
|
|
|
| year at least 98% of its net investment income (earned during the calendar year) and 98.2% of its net realized capital gains (earned during the twelve months ended October 31 for the Evermore Global Value Fund and December 31 for the Evermore European Value Fund) plus undistributed amounts, if any, from prior years. |
|
|
|
|
| Net capital losses incurred after October 31 and within the taxable year are deemed to arise on the first business day of Evermore Global Value Fund’s next taxable year. As of December 31, 2011, the Evermore Global Value Fund deferred, on a tax basis, post-October losses of $666,903. |
|
|
|
|
| At December 31, 2010, the Evermore Global Value Fund did not have capital loss carryforwards. The Evermore European Value Fund had capital loss carry forwards available for federal income tax purposes of $1,585,556 of which $56,192 expires on December 31, 2018 and $1,041,649 are short-term unlimited losses and $487,715 are long-term unlimited losses. |
|
|
|
|
| The Funds recognize the tax benefits of uncertain tax positions only where the position is “more likely than not” to be sustained assuming examination by tax authorities. Management has analyzed the Funds’ tax positions, and has concluded that no liability for unrecognized tax benefits should be recorded related to uncertain tax positions taken on returns filed for the open tax year 2010, or expected to be taken in the Funds’ 2011 tax returns. The Funds identify their major tax jurisdictions as U.S. Federal, New Jersey State and Massachusetts State; however the Funds are not aware of any tax positions for which it is reasonably possible that the total amounts of unrecognized tax benefits will change materially in the next twelve months. |
|
|
|
| E. | Forward Foreign Currency Contracts. The Funds may enter into forward foreign currency contracts as hedges against either specific transactions or fund positions. The aggregate principal amount of the contracts are not recorded because the Funds intend to settle the contracts prior to delivery. All commitments are marked-to-market daily at the applicable foreign exchange rate, and any resulting unrealized gains or losses are recorded currently. The Funds realize gains or losses at the time the forward contracts are extinguished. Unrealized gains or losses on outstanding positions in forward foreign currency contracts held at the close of the period are recognized as ordinary income or loss for federal income tax purposes. |
|
|
|
|
| The use of forward foreign currency contracts does not eliminate fluctuations in the underlying prices of the securities, but it does establish a rate of exchange that can be achieved in the future. Although forward foreign currency contracts limit the risk of loss due to a decline in the value of the hedged currency, they |
|
|
50 |
|
Evermore Funds
|
NOTES TO FINANCIAL STATEMENTS December 31, 2011, Continued |
|
|
|
|
| also limit a potential gain that might result should the value of the currency increase. These contracts involve market risk in excess of the amount reflected in the Funds’ Statement of Assets and Liabilities. The face or contract amount in U.S. dollars reflects the total exposure the Fund has in that particular currency contract. In addition, there could be exposure to risks (limited to the amount of unrealized gains) if the counterparties to the contracts are unable to meet the terms of their contracts. The average notional of forward foreign currency contracts outstanding during the year ended December 31, 2011 was $9,712,786 and $1,565,104 for Evermore Global Value Fund and Evermore European Value Fund, respectively. The average notional amount is calculated by the dollar value of open forward contracts at the end of the previous fiscal year and at each quarter end in the current fiscal year. The notional amount is calculated based on the currency being sold converted to USD at each of the time periods noted above. |
|
|
|
|
| The Funds help manage counterparty credit risk by entering into agreements only with counterparties the Advisor believes have the financial resources to honor their obligations and by having the Advisor monitor the financial stability of the counterparties. Collateral pledges are monitored and subsequently adjusted if and when the valuations fluctuate, either up or down by at least the predetermined threshold amount. |
|
|
|
| F. | Short Sales. Each Fund may make short sales of securities, including “short sales against the box.” In a short sale transaction, a fund sells a security it does not own in anticipation that the market price of that security will decline. Each Fund expects to make short sales (i) as a form of hedging to offset potential declines in long positions in similar securities, (ii) in order to maintain portfolio flexibility and (iii) for profit. |
|
|
|
|
| When a Fund makes a short sale, its broker borrows the security to be sold short and the broker-dealer maintains the proceeds of the short sale while the short position is open. The Fund must keep the proceeds account marked to market and must post additional collateral for its obligation to deliver securities to replace the securities that were borrowed and sold short. The Fund may have to pay a fee to borrow particular securities and is often obligated to pay over any payments received on such borrowed securities. |
|
|
|
|
| A Fund’s obligation to replace borrowed securities will be secured by collateral deposited with the broker-dealer or the Fund’s custodian bank, usually cash, U.S. government securities or other high grade liquid securities similar to those borrowed. The Fund will also be required to segregate similar collateral to the extent, if any (excluding any proceeds of the short sales), necessary so that the |
|
|
| 51 |
Evermore Funds
|
NOTES TO FINANCIAL STATEMENTS December 31, 2011, Continued |
|
|
|
|
| value of both collateral deposits in the aggregate is at all times equal to at least 100% of the current market value of the security sold short. |
|
|
|
|
| Short sales carry risks of loss if the price of the security sold short increases after the sale. In this situation, when a Fund replaces the borrowed security by buying the security in the securities markets, the Fund may pay more for the security than it has received from the purchaser in the short sale. A Fund may, however, profit from a change in the value of the security sold short, if the price decreases. |
|
|
|
| G. | Interest Expense To Broker. The Funds may incur expenses associated with Fund investment borrowing and short sale transactions. For the year ended December 31, 2011 the Evermore Global Value Fund and Evermore European Value Fund incurred interest expenses of $3,285 and $770, respectively. |
|
|
|
| H. | Security Transactions and Investment Income. Investment securities transactions are accounted for on the trade date. Gains and losses realized on sales of securities are determined on a high cost basis. Discounts/premiums on debt securities purchased are accreted/ amortized over the life of the respective securities using the effective interest method. Dividend income is recorded on the ex-dividend date. Interest income is recorded on an accrual basis. Other non-cash dividends are recognized as investment income at the fair value of the property received. Withholding taxes on foreign dividends have been provided for in accordance with the Trust’s understanding of the applicable country’s tax rules and rates. |
|
|
|
| I. | Distributions to Shareholders. Distributions to shareholders from net investment income and net realized gains on securities for the Funds normally, which are determined in accordance with income tax regulations, are declared and paid on an annual basis. Distributions are recorded on the ex-dividend date. |
|
|
|
| J. | Use of Estimates. The preparation of financial statements in conformity with accounting principles generally accepted in the United States of America requires management to make estimates and assumptions that affect the reported amounts of assets and liabilities at the date of the financial statements and the reported amount of revenue and expenses during the reporting period. Actual results could differ from those estimates. |
|
|
|
| K. | Share Valuation. The net asset value (“NAV”) per share of each Fund is calculated by dividing the sum of the value of the securities held by each Fund, plus cash or other assets, minus all liabilities (including estimated accrued expenses) by the total number of shares outstanding for the Funds, rounded to the nearest cent. The Funds’ shares will not be priced on the days on which the New York Stock Exchange (“NYSE”) is closed for trading. The Funds charge a 2.00% redemption fee on shares held less than 30 days. This fee is deducted |
|
|
52 |
|
Evermore Funds
|
NOTES TO FINANCIAL STATEMENTS December 31, 2011, Continued |
|
|
|
|
| from the redemption proceeds otherwise payable to the shareholder. The Funds retain the fee charged as paid-in-capital and such fees become part of the Funds’ daily NAV calculation. |
|
|
|
| L. | Guarantees and Indemnifications. In the normal course of business, the Funds enter into contracts with service providers that contain general indemnification clauses. The Funds’ maximum exposure under these arrangements is unknown as this would involve future claims that may be made against the Funds that have not yet occurred. However, based on experience, the Funds expect the risk of loss to be remote. |
|
|
|
| M. | Reclassification of Capital Accounts. U.S. GAAP requires that certain components of net assets relating to permanent differences be reclassified between financial and tax reporting. These reclassifications have no effect on net assets or net asset value per share. For the year ended December 31, 2011, the Evermore Global Value Fund decreased undistributed net investment income by $92,346, decreased accumulated net realized loss by $92,347 and decreased paid-in capital by $1. For the year ended December 31, 2011, the Evermore European Value Fund decreased undistributed net investment income by $169,625, decreased accumulated net realized loss by $140,068 and increased paid-in capital by $29,557. The permanent differences primarily relate to foreign currency reclasses and REIT distributions. The Funds may also designate earnings and profits distributed to shareholders on the redemption of shares as dividends for purposes of the dividends paid deduction. |
|
|
|
| N. | Subsequent Events. In preparing these financial statements, the Funds have evaluated events and transactions for potential recognition or disclosure through the date the financial statements were available to be issued. |
|
|
|
|
| The Evermore European Value Fund liquidated on January 31, 2012. |
|
|
|
| O. | Recent Accounting Pronouncement. In May 2011, the Financial Accounting Standards Board issued Accounting Standards Update (“ASU”) No. 2011-04 “Amendments to Achieve Common Fair Value Measurement and Disclosure Requirements in U.S. GAAP and International Financial Reporting Standards (“IFRS”)”. ASU 2011-04 includes common requirements for measurement of and disclosure about fair value between U.S. GAAP and IFRS. ASU 2011-04 will require reporting entities to disclose the following information for fair value measurements categorized within Level 3 of the fair value hierarchy: quantitative information about the unobservable inputs used in the fair value measurement, the valuation processes used by the reporting entity, and a narrative description of the sensitivity of the fair value measurement to changes in observable inputs and the interrelationships between those unobservable |
|
|
| 53 |
Evermore Funds
|
NOTES TO FINANCIAL STATEMENTS December 31, 2011, Continued |
|
|
|
|
| inputs. In addition, ASU 2011-04 will require reporting to entities to make disclosures about amounts and reasons for all transfers in and out of Level 1 and Level 2 fair value measurements. The new and revised disclosures are effective for interim and annual reporting periods beginning after December 15, 2011. At this time, management is evaluating the implications of ASU 2011-04 and its impact on the financial statements. |
|
|
|
P. | Regulated Investment Company Modernization Act. On December 22, 2010, the Regulated Investment Company Modernization Act of 2010 (the “Modernization Act”) was signed by the President. The Modernization Act modernizes several of the federal income and excise tax provisions related to regulated investment companies (“RICs”). Some highlights of the enacted provisions are as follows: | |
|
| |
| New capital losses may now be carried forward indefinitely, and retain the character of the original loss. Under pre-enactment law, capital losses could be carried forward for eight years, and carried forward as short-term capital, irrespective of the character of the original loss. | |
|
| |
| The Modernization Act contains simplification provisions, which are aimed at preventing disqualification of a RIC for “inadvertent” failures of the asset diversification and/or qualifying income tests. Additionally, the Modernization Act exempts RICs from the preferential dividend rule, and repealed the 60-day designation requirement for certain types of pay-through income and gains. | |
|
| |
| Finally, the Modernization Act contains several provisions aimed at preserving the character of distributions made by a fiscal year RIC during the portion of its taxable year ending after October 31 or December 31, reducing the circumstances under which a RIC might be required to file amended Forms 1099 to restate previously reported distributions. | |
|
| |
| Except for the simplification provisions related to RIC qualification, the Modernization Act is effective for taxable years beginning after December 22, 2010. The provisions related to RIC qualification are effective for taxable years for which the extended due date of the tax return is after December 22, 2010. |
|
NOTE 3 – INVESTMENT ADVISORY FEES, SERVICING FEES, AND OTHER FEES AND EXPENSES |
Evermore Global Advisors, LLC (the “Advisor”) provides the Funds with investment management services under an Investment Advisory Agreement (the “Agreement”) for each Fund. Under the Agreement, the Advisor furnishes all investment advice, office space, certain administrative services, and provides most of the personnel needed by the Fund. As compensation for its services, the Advisor is entitled to a
|
|
54 |
|
Evermore Funds
|
NOTES TO FINANCIAL STATEMENTS December 31, 2011, Continued |
monthly fee at the annual rate of 0.99% based upon the average daily net assets of the Funds. As compensation for its services, for the year ended December 31, 2011, the Evermore Global Value Fund and Evermore European Value Fund incurred $454,694 and $81,526 in advisory fees, respectively.
The Advisor has agreed to contractually waive fees and reimburse other fund expenses for the following Funds through December 31, 2011, so that total annual fund operating expenses, exclusive of taxes, interest on borrowings, acquired fund fees and expenses, dividends on securities sold short, brokerage commissions and other expenditures:
|
|
|
|
| Share Class | ||
Fund | A | C | I |
Global Value Fund | 1.60% | 2.35% | 1.35% |
European Value Fund | 1.60% | n/a | 1.35% |
For the year ended December 31, 2011 the Advisor waived $252,167 and $375,603 in fees and expenses for the Evermore Global Value Fund and the Evermore European Value Fund, respectively.
The Advisor is permitted to seek reimbursement from the Funds, subject to limitations for fees waived and/or Fund expenses it pays not more than one year after payment. At December 31, 2011, the remaining cumulative unreimbursed amount paid and/or waived by the Advisor on behalf of the Fund that may be reimbursed was $252,167 and $375,602 for the Evermore Global Value Fund and the Evermore European Value Fund, respectively. The Advisor may capture all or a portion of the above amount no later than December 31, 2012 for the Evermore Global Value Fund. The Advisor will not capture any of the above amount for the Evermore European Value Fund.
The Fund must pay its current ordinary operating expenses before the Advisor is entitled to any reimbursement. Any such reimbursement is also contingent upon Board of Trustees review and approval prior to the time the reimbursement is initiated.
The agreement to contractually reimburse Fund expenses is reevaluated on an annual basis and expires May 1, 2012. The agreement may only be terminated by the Board of Trustees.
U.S. Bancorp Fund Services, LLC (“USBFS”), an indirect wholly-owned subsidiary of U.S. Bancorp, serves as the Funds’ administrator (the “Administrator”) and, in that capacity, performs various administrative and accounting services for the Funds. USBFS also serves as the Funds’ fund accountant, transfer agent, dividend disbursing agent and registrar. The Administrator prepares various federal and state regulatory filings, reports and
|
|
| 55 |
Evermore Funds
|
NOTES TO FINANCIAL STATEMENTS December 31, 2011, Continued |
returns for the Funds; prepares reports and materials to be supplied to the trustees; monitors the activities of the Funds’ custodian, transfer agent and accountants; coordinates the preparation and payment of Fund expenses and reviews the Funds’ expense accruals. For the year ended December 31, 2011, the Evermore Global Value Fund and the Evermore European Value Fund each incurred administration fees of $47,230 and $49,610, respectively.
Quasar Distributors, LLC (the “Distributor”) is the Funds’ distributor. U.S. Bank, N.A. (the “Custodian”) serves as the custodian to the Funds. Both the Distributor and Custodian are affiliates of the Administrator.
The Funds have adopted a Distribution Plan (the “Plan”) in accordance with Rule 12b-1 under the 1940 Act with respect to Class A and Class C shares. The Plan provides that the Funds may pay a fee to the Distributor at an annual rate of 0.25% of the average daily net assets of Class A shares and 1.00% of the average daily net assets of Class C shares. No distribution or shareholder servicing fees are paid by Class I shares. These fees may be used by the Distributor to provide compensation for sales support distribution activities, or shareholder servicing activities. For the year ended December 31, 2011, the Evermore Global Value Fund and the Evermore European Value Fund paid distribution fees of $19,997 and $1,343, respectively.
|
NOTE 4 – PURCHASES AND SALES OF SECURITIES |
For the year ended December 31, 2011, the cost of purchases and the proceeds from the sale of securities, excluding short-term investments, were $46,814,394 and $37,326,941, respectively for the Evermore Global Value Fund and $5,506,917 and $9,568,626, respectively for the Evermore European Value Fund.
There were no purchases or sales of long-term U.S. Government securities for the year ended December 31, 2011.
|
NOTE 5 – DISTRIBUTIONS TO SHAREHOLDERS |
The tax character of distributions paid during the years ended December 31, 2011 and 2010 for the Evermore Global Value Fund were as follows:
|
|
|
|
|
|
|
|
| 2011 |
|
| 2010 |
|
|
|
|
|
| ||
Distributions paid from: |
|
| ||||
Ordinary income | $476,144 | $— | ||||
The Evermore European Value Fund did not make distributions for the years ended December 31, 2011 and 2010.
|
|
56 |
|
Evermore Funds
|
NOTES TO FINANCIAL STATEMENTS December 31, 2011, Continued |
As of December 31, 2011, the components of distributable earnings on a tax basis were as follows:
|
|
|
|
|
|
|
|
|
|
|
|
|
| Evermore Global |
| Evermore European |
| ||||||
|
|
|
| ||||||||
Cost of investments |
|
| $ | 40,585,329 |
|
|
| $ | 1,774,059 |
|
|
|
|
|
|
|
|
|
| ||||
|
|
|
|
|
|
|
|
|
|
|
|
Gross tax unrealized appreciation on long positions |
|
|
| 2,034,950 |
|
|
|
| 120,805 |
|
|
Gross tax unrealized depreciation on long positions |
|
|
| (12,527,570 | ) |
|
|
| (425,508 | ) |
|
|
|
|
|
|
|
|
| ||||
Net tax unrealized depreciation on long positions |
|
|
| (10,492,620 | ) |
|
|
| (304,703 | ) |
|
|
|
|
|
|
|
|
| ||||
Total net tax unrealized depreciation |
|
| $ | (10,492,620 | ) |
|
| $ | (304,703 | ) |
|
|
|
|
|
|
|
|
| ||||
Undistributed ordinary income |
|
| $ | 638,434 |
|
|
| $ | — |
|
|
Undistributed long-term capital gain |
|
| $ | — |
|
|
| $ | — |
|
|
|
|
|
|
|
|
|
| ||||
Total distributable earnings |
|
| $ | 638,434 |
|
|
| $ | — |
|
|
Post-October loss |
|
|
| (666,903 | ) |
|
|
| — |
|
|
Capital loss carryforward |
|
|
| — |
|
|
|
| (1,585,556 | ) |
|
Net unrealized depreciation on foreign currency |
|
|
| (4,392 | ) |
|
|
| (172 | ) |
|
Net unrealized depreciation on short sales |
|
|
| (123,967 | ) |
|
|
| (246 | ) |
|
|
|
|
|
|
|
|
| ||||
Total accumulated gains/losses |
|
| $ | (10,649,448 | ) |
|
| $ | (1,890,677 | ) |
|
|
|
|
|
|
|
|
| ||||
|
|
| 57 |
Evermore Funds
|
NOTES TO FINANCIAL STATEMENTS December 31, 2011, Continued |
|
NOTE 6 – FORWARD CURRENCY CONTRACTS |
As of December 31, 2011, the Evermore Global Value Fund had the following forward currency contracts outstanding with Morgan Stanley:
|
|
|
|
|
|
|
|
|
|
|
|
|
|
|
|
|
|
|
|
|
|
| Contracts |
| Settlement |
| Contract |
| Fair |
| Net Unrealized |
| |||||||||
|
|
|
|
|
|
| ||||||||||||||
To Sell: |
|
|
|
|
|
|
|
|
|
|
|
|
|
|
|
|
|
|
|
|
|
| 392,000 CHF |
| 3/9/2012 |
|
| $ | 424,243 |
|
|
| $ | 417,941 |
|
|
| $ | 6,302 |
|
|
To Buy: |
|
|
|
|
|
|
|
|
|
|
|
|
|
|
|
|
|
|
|
|
|
| 392,000 CHF |
| 3/9/2012 |
|
|
| (419,386 | ) |
|
|
| (417,941 | ) |
|
|
| (1,445 | ) |
|
|
|
|
|
|
|
|
|
|
|
|
|
|
|
| ||||||
Net Value of CHF Contracts |
|
|
|
|
|
|
| 4,857 |
|
|
|
| — |
|
|
|
| 4,857 |
|
|
|
|
|
|
|
|
|
|
|
|
|
|
|
|
| ||||||
To Sell: |
|
|
|
|
|
|
|
|
|
|
|
|
|
|
|
|
|
|
|
|
|
| 6,403,000 EUR |
| 3/9/2012 |
|
|
| 8,572,208 |
|
|
|
| 8,292,162 |
|
|
|
| 280,046 |
|
|
To Buy: |
|
|
|
|
|
|
|
|
|
|
|
|
|
|
|
|
|
|
|
|
|
| 822,000 EUR |
| 3/9/2012 |
|
|
| (1,067,803 | ) |
|
|
| (1,064,526 | ) |
|
|
| (3,277 | ) |
|
|
|
|
|
|
|
|
|
|
|
|
|
|
|
| ||||||
Net Value of EUR Contracts |
|
|
|
|
|
|
| 7,504,405 |
|
|
|
| 7,227,636 |
|
|
|
| 276,769 |
|
|
|
|
|
|
|
|
|
|
|
|
|
|
|
|
| ||||||
To Sell: |
|
|
|
|
|
|
|
|
|
|
|
|
|
|
|
|
|
|
|
|
|
| 3,020,300 GBP |
| 3/9/2012 |
|
|
| 4,711,668 |
|
|
|
| 4,687,347 |
|
|
|
| 24,321 |
|
|
To Buy: |
|
|
|
|
|
|
|
|
|
|
|
|
|
|
|
|
|
|
|
|
|
| 334,000 GBP |
| 3/9/2012 |
|
|
| (518,786 | ) |
|
|
| (518,350 | ) |
|
|
| (436 | ) |
|
|
|
|
|
|
|
|
|
|
|
|
|
|
|
| ||||||
Net Value of GDP Contracts |
|
|
|
|
|
|
| 4,192,882 |
|
|
|
| 4,168,997 |
|
|
|
| 23,885 |
|
|
|
|
|
|
|
|
|
|
|
|
|
|
|
|
| ||||||
To Sell: |
|
|
|
|
|
|
|
|
|
|
|
|
|
|
|
|
|
|
|
|
|
| 16,930,000 NOK |
| 3/9/2012 |
|
|
| 2,921,217 |
|
|
|
| 2,823,470 |
|
|
|
| 97,747 |
|
|
To Buy: |
|
|
|
|
|
|
|
|
|
|
|
|
|
|
|
|
|
|
|
|
|
| 4,457,000 NOK |
| 3/9/2012 |
|
|
| (744,020 | ) |
|
|
| (743,308 | ) |
|
|
| (712 | ) |
|
|
|
|
|
|
|
|
|
|
|
|
|
|
|
| ||||||
Net Value of NOK Contracts |
|
|
|
|
|
|
| 2,177,197 |
|
|
|
| 2,080,162 |
|
|
|
| 97,035 |
|
|
|
|
|
|
|
|
|
|
|
|
|
|
|
|
| ||||||
To Sell: |
|
|
|
|
|
|
|
|
|
|
|
|
|
|
|
|
|
|
|
|
|
| 3,152,000 SEK |
| 3/9/2012 |
|
|
| 462,614 |
|
|
|
| 456,494 |
|
|
|
| 6,120 |
|
|
To Buy: |
|
|
|
|
|
|
|
|
|
|
|
|
|
|
|
|
|
|
|
|
|
| 179,000 SEK |
| 3/9/2012 |
|
|
| (25,713 | ) |
|
|
| (25,924 | ) |
|
|
| 211 |
|
|
|
|
|
|
|
|
|
|
|
|
|
|
|
|
| ||||||
Net Value of SEK Contracts |
|
|
|
|
|
|
| 436,901 |
|
|
|
| 430,570 |
|
|
|
| 6,331 |
|
|
|
|
|
|
|
|
|
|
|
|
|
|
|
|
| ||||||
Net Value of Outstanding Forward Currency Contracts |
|
|
|
|
|
| $ | 14,316,242 |
|
|
| $ | 13,907,365 |
|
|
| $ | 408,877 |
|
|
|
|
|
|
|
|
|
|
|
|
|
|
|
|
| ||||||
|
|
CHF | Swiss Franc |
EUR | Euro |
GBP | British Pound |
NOK | Norwegian Krone |
SEK | Swedish Krona |
|
|
58 |
|
Evermore Funds
|
NOTES TO FINANCIAL STATEMENTS December 31, 2011, Continued |
As of December 31, 2011, the Evermore European Value Fund had the following forward currency contracts outstanding with Morgan Stanley:
|
|
|
|
|
|
|
|
|
|
|
|
|
|
|
|
|
|
|
|
|
|
| Contracts |
| Settlement |
| Contract |
| Fair |
| Net Unrealized |
| |||||||||
|
|
|
|
|
|
| ||||||||||||||
To Sell: |
|
|
|
|
|
|
|
|
|
|
|
|
|
|
|
|
|
|
|
|
|
| 65,000 CHF |
| 1/3/2012 |
|
| $ | 70,346 |
|
|
| $ | 69,203 |
|
|
| $ | 1,143 |
|
|
To Buy: |
|
|
|
|
|
|
|
|
|
|
|
|
|
|
|
|
|
|
|
|
|
| 65,000 CHF |
| 1/3/2012 |
|
|
| (69,563 | ) |
|
|
| (69,203 | ) |
|
|
| (360 | ) |
|
|
|
|
|
|
|
|
|
|
|
|
|
|
|
| ||||||
Net Value of CHF Contracts |
|
|
|
|
|
|
| 783 |
|
|
|
| — |
|
|
|
| 783 |
|
|
|
|
|
|
|
|
|
|
|
|
|
|
|
|
| ||||||
To Sell: |
|
|
|
|
|
|
|
|
|
|
|
|
|
|
|
|
|
|
|
|
|
| 1,631,300 EUR |
| 1/3/2012 |
|
|
| 2,183,952 |
|
|
|
| 2,111,360 |
|
|
|
| 72,592 |
|
|
To Buy: |
|
|
|
|
|
|
|
|
|
|
|
|
|
|
|
|
|
|
|
|
|
| 1,631,300 EUR |
| 1/3/2012 |
|
|
| (2,126,047 | ) |
|
|
| (2,111,360 | ) |
|
|
| (14,687 | ) |
|
|
|
|
|
|
|
|
|
|
|
|
|
|
|
| ||||||
Net Value of EUR Contracts |
|
|
|
|
|
|
| 57,905 |
|
|
|
| — |
|
|
|
| 57,905 |
|
|
|
|
|
|
|
|
|
|
|
|
|
|
|
|
| ||||||
To Sell: |
|
|
|
|
|
|
|
|
|
|
|
|
|
|
|
|
|
|
|
|
|
| 559,500 GBP |
| 1/3/2012 |
|
|
| 872,867 |
|
|
|
| 868,870 |
|
|
|
| 3,997 |
|
|
To Buy: |
|
|
|
|
|
|
|
|
|
|
|
|
|
|
|
|
|
|
|
|
|
| 559,500 GBP |
| 1/3/2012 |
|
|
| (864,210 | ) |
|
|
| (868,870 | ) |
|
|
| 4,660 |
|
|
|
|
|
|
|
|
|
|
|
|
|
|
|
|
| ||||||
Net Value of GDP Contracts |
|
|
|
|
|
|
| 8,657 |
|
|
|
| — |
|
|
|
| 8,657 |
|
|
|
|
|
|
|
|
|
|
|
|
|
|
|
|
| ||||||
To Sell: |
|
|
|
|
|
|
|
|
|
|
|
|
|
|
|
|
|
|
|
|
|
| 3,974,000 NOK |
| 1/3/2012 |
|
|
| 685,846 |
|
|
|
| 664,388 |
|
|
|
| 21,458 |
|
|
To Buy: |
|
|
|
|
|
|
|
|
|
|
|
|
|
|
|
|
|
|
|
|
|
| 3,974,000 NOK |
| 1/3/2012 |
|
|
| (668,487 | ) |
|
|
| (664,388 | ) |
|
|
| (4,099 | ) |
|
|
|
|
|
|
|
|
|
|
|
|
|
|
|
| ||||||
Net Value of NOK Contracts |
|
|
|
|
|
|
| 17,359 |
|
|
|
| — |
|
|
|
| 17,359 |
|
|
|
|
|
|
|
|
|
|
|
|
|
|
|
|
| ||||||
To Sell: |
|
|
|
|
|
|
|
|
|
|
|
|
|
|
|
|
|
|
|
|
|
| 809,000 SEK |
| 1/3/2012 |
|
|
| 118,991 |
|
|
|
| 117,523 |
|
|
|
| 1,468 |
|
|
To Buy: |
|
|
|
|
|
|
|
|
|
|
|
|
|
|
|
|
|
|
|
|
|
| 809,000 SEK |
| 1/3/2012 |
|
|
| (116,827 | ) |
|
|
| (117,523 | ) |
|
|
| 696 |
|
|
|
|
|
|
|
|
|
|
|
|
|
|
|
|
| ||||||
Net Value of SEK Contracts |
|
|
|
|
|
|
| 2,164 |
|
|
|
| — |
|
|
|
| 2,164 |
|
|
|
|
|
|
|
|
|
|
|
|
|
|
|
|
| ||||||
Net Value of Outstanding Forward Currency Contracts |
|
|
|
|
|
| $ | 86,868 |
|
|
| $ | — |
|
|
| $ | 86,868 |
|
|
|
|
|
|
|
|
|
|
|
|
|
|
|
|
| ||||||
|
|
CHF | Swiss Franc |
EUR | Euro |
GBP | British Pound |
NOK | Norwegian Krone |
SEK | Swedish Krona |
|
|
| 59 |
Evermore Funds
|
REPORT OF INDEPENDENT REGISTERED PUBLIC ACCOUNTING FIRM |
To the Board of Trustees and Shareholders
of Evermore Funds Trust:
We have audited the accompanying statements of assets and liabilities, including the schedules of investments, of the Evermore Funds Trust (comprising, respectively, the Evermore Global Value Fund and Evermore European Value Fund) (the “Funds”) as of December 31, 2011, and the related statements of operations for the year then ended, the statements of changes in net assets for each of the two years in the period then ended, and the financial highlights for each of the periods indicated therein. These financial statements and financial highlights are the responsibility of the Funds’ management. Our responsibility is to express an opinion on these financial statements and financial highlights based on our audits.
We conducted our audits in accordance with the standards of the Public Company Accounting Oversight Board (United States). Those standards require that we plan and perform the audit to obtain reasonable assurance about whether the financial statements and financial highlights are free of material misstatement. We were not engaged to perform an audit of the Funds’ internal control over financial reporting. Our audits included consideration of internal control over financial reporting as a basis for designing audit procedures that are appropriate in the circumstances, but not for the purpose of expressing an opinion on the effectiveness of the Funds’ internal control over financial reporting. Accordingly, we express no such opinion. An audit also includes examining, on a test basis, evidence supporting the amounts and disclosures in the financial statements and financial highlights, assessing the accounting principles used and significant estimates made by management, and evaluating the overall financial statement presentation. Our procedures included confirmation of securities owned as of December 31, 2011 by correspondence with the custodian and brokers.We believe that our audits provide a reasonable basis for our opinion.
As discussed in Note 1 to the financial statements, the Board of Trustees has approved the liquidation of the Evermore European Value Fund effective January 31, 2012. As a result, the basis of accounting for the Evermore European Value Fund’s financial statements has changed from a going concern to the liquidation basis of accounting.
In our opinion, the financial statements and financial highlights of the Evermore Global Value Fund and Evermore European Value Fund (applied on a liquidation basis) present fairly, in all material respects, the financial position of the Funds at December 31, 2011, and the results of their operations for the year then ended, the changes in their net assets for each of the two years in the period then ended, and the financial highlights for each of the periods indicated therein, in conformity with U.S. generally accepted accounting principles, and for Evermore European Value Fund, the basis described in the preceeding paragraph.

February 28, 2012
|
|
60 |
|
|
Approval of Investment Advisory Agreement |
At a Board meeting held on November 22, 2011, the Fund’s Board of Trustees, including a majority of the Trustees who are not “interested persons” of the Trust, approved the continuance for an additional annual period of the Investment Advisory Agreement with the Adviser. The Board of Trustees considered whether the Investment Advisory Agreement would be in the best interests of the Funds and their shareholders and the overall fairness of the Investment Advisory Agreement. Among other things, the Trustees reviewed information concerning: (1) the nature, extent and quality of the services provided by Evermore Global, including changes in the Funds’ co-portfolio manager; (2) each Fund’s investment performance; (3) the cost of the services provided and the profits realized by Evermore Global from its relationship with the Funds; (4) the extent to which economies of scale have been or will be realized as the Funds grow and the extent to which fee levels reflect the economies of scale, if any, for the benefit of Fund shareholders; and (5) ancillary benefits and other factors. In their deliberations, the Trustees did not rank the importance of any particular piece of information or factor considered, and it is presumed that each Trustee attributed different weights to the various factors. The following summary details the materials and factors that the Board considered, and the conclusions they reached, in approving the Investment Advisory Agreement.
Nature, Extent and Quality of Services Provided to the Funds.
The Board considered information it believed necessary to assess the ongoing nature and quality of services to be provided to the Funds by the Adviser. The Board also reviewed and considered the qualifications of the portfolio managers, and other key personnel of Evermore Global who provide the investment advisory services to the Funds. The Board noted that one of the Funds’ co-portfolio managers was terminated by Evermore Global in September 2011. The Board considered that this manager’s responsibilities were assumed by senior members of the Funds’ portfolio management team, and at all times were subject to the ultimate decision making authority of Mr. Marcus, the Funds’ sole portfolio manager. The Board noted that the services to be provided to the Funds are not expected to be adversely affected by this change in management personnel, or by Evermore Global’s prospective management of certain partnerships. The Board considered that the partnerships are expected to invest in the same or nearly the same portfolio securities as the Funds and that Evermore Global adopted policies to identify and manage conflicts of interest. The Board determined that the portfolio managers and key personnel are well qualified by education and/or training and experience to perform the services in an efficient and professional manner. The Board also took into account the Adviser’s compliance policies and procedures, noting certain compliance issues with respect to the Funds that have
|
|
| 61 |
been corrected, or which Evermore Global is currently addressing. The Board noted that Evermore Global provided non-advisory, administrative services to the Funds under the Investment Advisory Agreement, including among other things providing office facilities, equipment and personnel to coordinate the preparation of annual and semi-annual reports to shareholders, assisting in preparing Fund tax returns, and compliance monitoring.
Investment Performance of the Funds.
The Trustees considered the investment experience of Evermore Global. The Trustees considered the performance of the Funds during 2010 and 2011 compared to their benchmark indices, as well as historical performance of other accounts managed by Evermore Global using investment strategies substantially similar to those of the Funds. The Board also reviewed a report prepared by Morningstar, comparing the Funds’ performance to similar funds in the Morningstar peer group. The Board noted that the Funds’ performance during 2010 and the year-to-date period through September 30, 2011 trailed the performance of their respective benchmark indices. The Board also noted that the Funds’ performance during 2010 trailed the performance of comparable accounts managed by Evermore Global. However, for the year-to-date through September 30, 2011 the Funds’ performance exceeded the performance of these comparable accounts. The Trustees also reviewed information concerning the Funds’ performance versus the Morningstar peer group. The Board noted that the Funds’ performance trailed the performance of their respective Morningstar peer group median for the year-to-date period ended September 30, 2011. For the one-year period ended September 30, 2011, the performance of the Evermore European Value Fund exceeded the performance of the Morningstar peer group median, while the performance of the Evermore Global Value Fund trailed the performance of the Morningstar peer group median during this same one-year period. The Board noted that each Fund’s performance for the year-to-date and one year periods ended September 30, 2011 was within the performance range of similar funds in the Morningstar peer group.
Costs of Services Provided and Profits Realized by Evermore Global.
In connection with the Trustees’ consideration of the level of the advisory fees, the Trustees considered a number of factors. The Board’s analysis of the Funds’ advisory fees and estimated expenses included a discussion and review of data concerning the current advisory fee and total expense ratios of the Funds compared to a peer group determined by Morningstar, as well as advisory fees charged by Evermore Global to other accounts it manages using investment strategies substantially similar to those of the Funds. The Board noted Evermore Global’s
|
|
62 |
|
agreement to limit the total expenses of the Funds through April 30, 2012. The Board noted that each Fund’s gross advisory fee is equal to or slightly higher than the median advisory fee of its Morningstar peer group. The Evermore European Value Fund’s net total expense ratio was lower than the Morningstar peer group median net expense ratio. The Evermore Global Value Fund’s net total expense ratio was higher than the Morningstar peer group median net expense ratio. The Board noted that each Fund’s gross advisory fee and net total expense ratio was within the range of similar funds in the Morningstar peer group. Gross advisory fees charged by Evermore Global to other accounts it manages are the same as the Funds’ gross advisory fee. Evermore Global also waives fees for certain of these accounts. Management also said that it did not expect changes in fee structures unless significant market changes occurred. The Board considered that Evermore Global paid Fund expenses in excess of the amounts it was entitled to receive in advisory fees during 2010. During 2011 through September 30, Evermore Global waived all of its advisory fee with respect to the Evermore European Value Fund, and waived a significant portion of its advisory fee with respect to the Evermore Global Value Fund. Evermore Global advised the Board that it is not profitable with respect to the services it provides to the Funds.
Economies of Scale and Fee Levels Reflecting Those Economies.
The Trustees considered the extent to which economies of scale were expected to be realized relative to fee levels as the Funds’ assets grow, and whether the advisory fee levels reflect these economies of scale for the benefit of shareholders. The Board determined that assets of the Funds had not grown sufficiently to consider breakpoints in the contractual advisory fee to be paid to Evermore Global.
Other Benefits. In addition to the above factors, the Trustees noted that Evermore Global receives no other benefits from its management of the Funds. The Board noted that Evermore Global may seek reimbursement from the Funds of fees waived or reimbursed, subject to limitations, through December 31, 2011.
|
|
| 63 |
Evermore Funds
|
TRUSTEES AND EXECUTIVE OFFICERS |
The Board is responsible for the overall management of the Trust, including general supervision and review of the investment activities of the Funds. The Board, in turn, elects the officers of the Trust, who are responsible for administering the day-to-day operations of the Trust and its separate series. The current Trustees and officers of the Trust, their years of birth and positions with the Trust, term of office with the Trust and length of time served, their principal occupations for the past five years and other directorships held are set forth in the following table. Additional information regarding the Trustees is included in the Funds’ SAI and is available without charge, upon request, by calling 866-EVERMORE or (866) 383-7667.
|
|
|
|
|
|
|
|
|
|
|
Name, Age |
| Position |
| Term of |
| Principal |
| Number of |
| Other |
|
|
|
|
| ||||||
| ||||||||||
Independent Trustees of the Trust | ||||||||||
| ||||||||||
Eugene W. Bebout III |
| Trustee |
| Indefinite Term; Since 2009. |
| Chief Financial and Chief Operating Officer Herbert L. Jamison & Co. LLC an Insurance Agent and Broker |
| 2 |
| Director & Treasurer, Summit Lacrosse Club; Audit Committee Chair, Summit Area YMCA |
|
|
64 |
|
Evermore Funds
|
TRUSTEES AND EXECUTIVE OFFICERS Continued |
|
|
|
|
|
|
|
|
|
|
|
Name, Age |
| Position |
| Term of |
| Principal |
| Number of |
| Other |
|
|
|
|
| ||||||
| ||||||||||
|
|
|
|
|
|
|
|
|
|
|
Nathan Gantcher |
| Chairman |
| Indefinite |
| Managing |
| 2 |
| Director, Mack-Cali Realty Corporation; Trustee, Anti- Defamation League Foundation; Former Director, Centerline Holding Company; Former Director, NDS Group plc; Former Director, Liberty Acquisition Holdings Corp.; Former Director, Liquidnet Holdings, Inc. |
Officers of the Trust | ||||||||||
|
|
|
|
|
|
|
|
|
|
|
Eric LeGoff |
| Trustee |
| Indefinite |
| President, Evermore |
| 2 |
| Director, FXCM, Inc.; Director, Summit Educational Foundation |
|
|
| 65 |
Evermore Funds
|
TRUSTEES AND EXECUTIVE OFFICERS Continued |
|
|
|
|
|
|
|
|
|
|
|
Name, Age |
| Position |
| Term of |
| Principal |
| Number of |
| Other |
|
|
|
|
| ||||||
| ||||||||||
|
|
|
|
|
|
|
|
|
|
|
David Marcus |
| President |
| Indefinite |
| Chief Executive Officer and Portfolio Manager Evermore Global Advisors, LLC; Managing Partner and Portfolio Manager, MarCap Investors, L.P. |
| Not |
| Director, |
|
|
|
|
|
|
|
|
|
|
|
Salvatore DiFranco |
| Chief |
| Indefinite |
| Chief Financial Officer, Evermore Global Advisors, LLC; Chief Financial Officer MarCap Investors, L.P. |
| Not |
| Not |
|
|
|
|
|
|
|
|
|
|
|
Magali Simo |
| Secretary |
| Indefinite |
| Vice President - Investor Services, Evermore Global Advisors, LLC; Vice President - Investor Relations, MarCap Investors, L.P. |
| Not |
| Not |
|
|
|
|
|
|
|
|
|
|
|
Guy Talarico |
| Chief |
| Indefinite |
| Chief Executive Officer, Alaric Compliance Services, LLC |
| Not |
| Director, |
|
|
66 |
|
|
|
|
|
| FEDERAL TAX INFORMATION (Unaudited) | ||
|
| ||
| For the fiscal year ended December 31, 2011, certain dividends paid by the Funds may be subject to a maximum tax rate of 15%, as provided for by the Jobs and Growth Tax Relief Reconciliation Act of 2003. The percentage of dividends declared from ordinary income designated as qualified dividend income was as follows: | ||
|
|
|
|
| Global Value | 47.11% |
|
| European Value | 0.00% |
|
|
|
|
|
| For corporate shareholders, the percent of ordinary income distributions qualifying for the corporate dividends received deduction for the fiscal year ended December 31, 2011, was as follows: | ||
|
|
|
|
| Global Value | 10.23% |
|
| European Value | 0.00% |
|
| INFORMATION ABOUT PROXY VOTING (Unaudited) | ||
|
| ||
| A description of the policies and procedures that the Evermore Global Value Fund and the Evermore European Value Fund use to determine how to vote proxies relating to portfolio securities is available without charge, upon request, by calling 866-EVERMORE (866) 383-7667. | ||
|
| ||
| Information regarding how the Evermore Global Value Fund and the Evermore European Value Fund voted proxies relating to portfolio securities during the most recent period ending June 30 is available without charge, upon request, by calling 866-EVERMORE (866) 383-7667. Furthermore, you can obtain the Form N-PX on the SEC’s website at www.sec.gov. | ||
|
| ||
| INFORMATION ABOUT THE PORTFOLIO HOLDINGS (Unaudited) | ||
|
| ||
| The Evermore Global Value Fund and the Evermore European Value Fund file their complete schedule of portfolio holdings for their first and third quarters with the SEC on Form N-Q. Each Fund’s Form N-Q is available without charge, upon request, by calling 866-EVERMORE (866) 383-7667. Furthermore, you can obtain the Form N-Q on the SEC’s website at www.sec.gov. | ||
|
|
| 67 |
|
|
| INFORMATION ABOUT HOUSEHOLDING (Unaudited) |
|
|
| In an effort to decrease costs, the Evermore Global Value Fund and the Evermore European Value Fund intend to reduce the number of duplicate prospectuses and Annual and Semi-Annual Reports you receive by sending only one copy of each to those addresses shared by two or more accounts and to shareholders the Transfer Agent reasonably believes are from the same family or household. Once implemented, if you would like to discontinue householding for your accounts, please call toll-free at 866-EVERMORE (866) 383-7667 to request individual copies of these documents. Once the Transfer Agent receives notice to stop housholding, the Transfer Agent will begin sending individual copies thirty days after receiving your request. This policy does not apply to account statements. |
|
|
68 |
|
(This Page Intentionally Left Blank.)
|
Investment Adviser |
EVERMORE GLOBAL ADVISORS, LLC |
89 Summit Avenue |
Summit, New Jersey 07901 |
|
Distributor |
QUASAR DISTRIBUTORS, LLC |
615 East Michigan Street |
Milwaukee, WI 53202 |
|
Custodian |
U.S. BANK, N.A. |
Custody Operations |
1555 N. RiverCenter Drive, Suite 302 |
Milwaukee, WI 53212 |
|
Transfer Agent, Fund Accountant and Fund Administrator |
U.S. BANCORP FUND SERVICES, LLC |
615 East Michigan Street |
Milwaukee, WI 53202 |
|
Independent Registered Public Accounting Firm |
ERNST & YOUNG LLP |
5 Times Square |
New York, NY 10036 |
|
Legal Counsel |
DRINKER, BIDDLE & REATH, LLP |
1 Logan Square, Suite 2000 |
Philadelphia, PA 19103-6996 |
|
|
|
|
|
|
|
|
| Ticker |
|
| Cusip |
|
|
|
|
|
| ||
Evermore Global Value Fund |
|
| ||||
Class A | EVGBX | 300397106 | ||||
Class C | EVGCX | 300397114 | ||||
Class I | EVGIX | 300397122 | ||||
|
|
| ||||
Evermore European Value Fund |
|
| ||||
Class A | EVEAX | 300397130 | ||||
Class I | EVEIX | 300397155 | ||||
|
|
Evermore Global Advisors LLC |
Item 2. Code of Ethics.
The registrant has adopted a code of ethics that applies to the registrant’s principal executive officer and principal financial officer. The registrant has not made any amendments to its code of ethics during the period covered by this report. The registrant has not granted any waivers from any provisions of the code of ethics during the period covered by this report.
A copy of the registrant’s Code of Ethics is filed herewith.
Item 3. Audit Committee Financial Expert.
The registrant’s board of [trustees/directors] has determined that there is at least one audit committee financial expert serving on its audit committee. Eugene Bebout is the “audit committee financial expert” and is considered to be “independent” as each term is defined in Item 3 of Form N-CSR.
Item 4. Principal Accountant Fees and Services.
The registrant has engaged its principal accountant to perform audit services, audit-related services, tax services and other services during the past fiscal years. “Audit services” refer to performing an audit of the registrant’s annual financial statements or services that are normally provided by the accountant in connection with statutory and regulatory filings or engagements for those fiscal years. “Audit-related services” refer to the assurance and related services by the principal accountant that are reasonably related to the performance of the audit. “Tax services” refer to professional services rendered by the principal accountant for tax compliance, tax advice, and tax planning. There were no “Other services” provided by the principal accountant. The following table details the aggregate fees billed or expected to be billed for the last fiscal year for audit fees, audit-related fees and tax.
|
|
|
|
|
|
| FYE 12/31/2011 |
| FYE 12/31/2010 |
Audit Fees |
| $54,000 |
| $54,000 |
Audit-Related Fees |
| N/A |
| N/A |
Tax Fees |
| $16,000 |
| $16,000 |
All Other Fees |
| N/A |
| N/A |
The audit committee has adopted pre-approval policies and procedures that require the audit committee to pre-approve all audit and non-audit services of the registrant, including services provided to any entity affiliated with the registrant.
The percentage of fees billed by Ernst & Young LLP applicable to non-audit services pursuant to waiver of pre-approval requirement were as follows:
|
|
|
|
|
|
|
| FYE 12/31/2011 |
| FYE 12/31/2010 |
|
Audit-Related Fees |
| 0% |
| 0% |
|
Tax Fees |
| 0% |
| 0% |
|
All Other Fees |
| 0% |
| 0% |
|
|
|
|
|
|
|
All of the principal accountant’s hours spent on auditing the registrant’s financial statements were attributed to work performed by full-time permanent employees of the principal accountant. (If more than 50 percent of the accountant’s hours were spent to audit the registrant’s financial statements for the most recent fiscal year, state how many hours were attributed to work performed by persons other than the principal accountant’s full-time, permanent employees.) The following table indicates the non-audit fees billed or expected to be billed by the registrant’s accountant for services to the registrant and to the registrant’s investment adviser (and any other controlling entity, etc.—not sub-adviser) for the last year. The audit committee of the board of trustees/directors has considered whether the provision of non-audit services that were rendered to the registrant’s investment adviser is compatible with maintaining the principal accountant’s independence and has concluded that the provision of such non-audit services by the accountant has not compromised the accountant’s independence.
|
|
|
|
|
|
Non-Audit Related Fees |
| FYE 12/31/2011 |
| FYE 12/31/2010 |
|
Registrant |
| N/A |
| N/A |
|
Registrant’s Investment Adviser |
| N/A |
| N/A |
|
Item 5. Audit Committee of Listed Registrants.
Not applicable to registrants who are not listed issuers (as defined in Rule 10A-3 under the Securities Exchange Act of 1934).
Item 6. Investments.
Schedule of Investments is included as part of the report to shareholders filed under Item 1 of this Form. Information regarding divested securities is not applicable.
Item 7. Disclosure of Proxy Voting Policies and Procedures for Closed-End Management Investment Companies.
Not applicable to open-end investment companies.
Item 8. Portfolio Managers of Closed-End Management Investment Companies.
Not applicable to open-end investment companies.
Item 9. Purchases of Equity Securities by Closed-End Management Investment Company and Affiliated Purchasers.
Not applicable to open-end investment companies.
Item 10. Submission of Matters to a Vote of Security Holders.
There have been no material changes to the procedures by which shareholders may recommend nominees to the registrant’s board of trustees.
Item 11. Controls and Procedures.
|
|
(a) | The Registrant’s Chief Executive Officer and Chief Financial Officer have reviewed the Registrant’s disclosure controls and procedures (as defined in Rule 30a-3(c) under the Investment Company Act of 1940 (the “Act”)) as of a date within 90 days of the filing of this report, as required by Rule 30a-3(b) under the Act and Rules 13a-15(b) or 15d-15(b) under the Securities Exchange Act of 1934. Based on their review, such officers have concluded that the disclosure controls and procedures are effective in ensuring that information required to be disclosed in this report is appropriately recorded, processed, summarized and reported and made known to them by others within the Registrant and by the Registrant’s service provider. |
|
|
(b) | There were no changes in the Registrant’s internal control over financial reporting (as defined in Rule 30a-3(d) under the Act) that occurred during the second fiscal quarter of the period covered by this report that has materially affected, or is reasonably likely to materially affect, the Registrant’s internal control over financial reporting. |
|
|
Item 12. Exhibits. | |
|
|
(a) | (1) Any code of ethics or amendment thereto, that is subject of the disclosure required by Item 2, to the extent that the registrant intends to satisfy Item 2 requirements through filing an exhibit. Filed herewith. |
|
|
| (2) Certifications pursuant to Section 302 of the Sarbanes-Oxley Act of 2002. Filed herewith. |
|
|
| (3) Any written solicitation to purchase securities under Rule 23c-1 under the Act sent or given during the period covered by the report by or on behalf of the registrant to 10 or more persons. Not applicable to open-end investment companies. |
|
|
(b) | Certification pursuant to Section 906 of the Sarbanes-Oxley Act of 2002. Furnished herewith. |
SIGNATURES
Pursuant to the requirements of the Securities Exchange Act of 1934 and the Investment Company Act of 1940, the registrant has duly caused this report to be signed on its behalf by the undersigned, thereunto duly authorized.
|
|
| |
| (Registrant) Evermore Funds Trust | ||
|
| ||
| By (Signature and Title)* | /s/ Eric LeGoff |
|
|
| Eric LeGoff, Chief Executive Officer | |
|
| ||
| Date | 3/2/2012 |
|
|
| ||
Pursuant to the requirements of the Securities Exchange Act of 1934 and the Investment Company Act of 1940, this report has been signed below by the following persons on behalf of the registrant and in the capacities and on the dates indicated. | |||
| By (Signature and Title)* | /s/ Eric LeGoff |
|
|
| Eric LeGoff, Chief Executive Officer | |
|
| ||
| Date | 3/2/2012 |
|
|
| ||
| By (Signature and Title)* | /s/ Salvatore DiFranco |
|
|
| Salvatore DiFranco, Chief Financial Officer | |
|
| ||
| Date | 3/2/2012 |
|
|
| ||
* Print the name and title of each signing officer under his or her signature.