UNITED STATES
SECURITIES AND EXCHANGE COMMISSION
Washington, D.C. 20549
FORM N-CSR
CERTIFIED SHAREHOLDER REPORT OF REGISTERED
MANAGEMENT INVESTMENT COMPANIES
Investment Company Act file number 811-22338
Legg Mason Global Asset Management Trust
(Exact name of registrant as specified in charter)
55 Water Street, New York, NY 10041
(Address of principal executive offices) (Zip code)
Robert I. Frenkel, Esq.
Legg Mason & Co., LLC
100 First Stamford Place
Stamford, CT 06902
(Name and address of agent for service)
Registrant’s telephone number, including area code:
Funds Investor Services 1-800-822-5544
or
Institutional Shareholder Services 1-888-425-6432
Date of fiscal year end: September 30
Date of reporting period: September 30, 2010
| ITEM 1. | REPORT TO STOCKHOLDERS. |
The Annual Report to Stockholders is filed herewith.
September 30, 2010

Annual Repor t
Legg Mason
Manager Select
Large
Cap
Growth
Fund
INVESTMENT PRODUCTS: NOT FDIC INSURED • NO BANK GUARANTEE • MAY LOSE VALUE
| | |
| II | | Legg Mason Manager Select Large Cap Growth Fund |
Fund objective
The Fund seeks long-term growth of capital.
Letter to our shareholders
Dear Shareholder,
We are pleased to provide the annual report of Legg Mason Manager Select Large Cap Growth Fund for the period from the Fund’s inception on December 1, 2009 through September 30, 2010 (the “reporting period”). Please read on for a detailed look at prevailing economic and market conditions during the Fund’s reporting period and to learn how those conditions have affected Fund performance.
We look forward to helping you meet your financial goals.
Sincerely,
| | |
 | |  |
Mark R. Fetting Chairman | | David Odenath President |
October 29, 2010
| | | | |
| Legg Mason Manager Select Large Cap Growth Fund | | | III | |
Investment commentary
Economic review
While the U.S. economy continued to expand during the period from the Fund’s inception on December 1, 2009 through September 30, 2010 (the “reporting period”), overall growth moderated as the period progressed and unemployment remained elevated. The Federal Reserve Board (“Fed”)i expressed concerns regarding the direction of the economy and indicated that it was prepared to take additional actions if necessary to spur growth. This, in turn, caused investor sentiment to improve and had significant implications for the financial markets.
In September 2010, the National Bureau of Economic Research (“NBER”), the organization charged with determining when recessions start and end, announced that the downturn that began in December 2007 had concluded in June 2009. However, the NBER said, “In determining that a trough occurred in June 2009, the committee did not conclude that economic conditions since that month have been favorable or that the economy has returned to operating at normal capacity.” The NBER’s point is well-taken given continued areas of weakness in the U.S. economy.
Although the U.S. Department of Commerce continued to report positive U.S. gross domestic product (“GDP”)ii growth, the expansion has moderated since peaking at 5.0% in the fourth quarter of 2009. A slower drawdown in business inventories and renewed consumer spending were contributing factors spurring the economy’s solid growth at the end of 2009. However, the economy has grown at a more modest pace thus far in 2010. According to the Commerce Department, GDP growth was 3.7% and 1.7% during the first and second quarters of 2010, respectively. Its first estimate for third quarter GDP growth was 2.0%.
Turning to the job market, after experiencing sharp job losses in 2009, the U.S. Department of Labor reported that over one million new positions were added during the first five months of 2010. Included in that number, however, were 700,000 temporary government jobs tied to the 2010 Census. From June through September, more than 525,000 of these temporary positions were eliminated. This more than offset private sector growth and resulted in a net loss of 175,000, 66,000, 57,000 and 95,000 jobs in June, July, August and September, respectively. The unemployment rate ended the period at an elevated 9.6%.
There was mixed news in the housing market during the period. According to the National Association of Realtors, existing home sales increased 7.0%
and 8.0% in March and April, respectively, after sales had fallen for the period from December 2009 through February 2010. The rebound was largely attributed to people rushing to take advantage of the government’s $8,000 tax credit for first-time home buyers that expired at the end of April. However, with the end of the tax credit, existing home sales then declined from May through July. After a steep 27.0% decline in sales in July, sales then rose 7.3% and 10.0% in August and September, respectively. In addition, the inventory of unsold homes was a 10.7 month supply in September at the current sales level, versus a 12.0 month supply in August. Looking at home prices, the S&P/Case-Shiller Home Price Indexiii indicated that, after four straight increases, month-to-month U.S. home prices fell 0.2% in August.
One overall bright spot for the economy has been the manufacturing sector. Based on the Institute for Supply Management’s PMIiv, the manufacturing sector has grown fourteen consecutive months since it began expanding in August 2009. After reaching a six-year peak of 60.4 in April 2010, PMI data indicated somewhat more modest growth from May through July (a reading below 50 indicates a contraction, whereas a reading above 50 indicates an expansion). However, the manufacturing sector then expanded at a faster pace in August, as its 56.3 reading during the month was better than July’s 55.5. While PMI dipped back to 54.4 in September, thirteen of the eighteen industries tracked by the Institute for Supply Management grew during the month, whereas only eleven industries expanded in August.
Financial market overview
During most of the first half of the reporting period, the financial markets were largely characterized by healthy investor risk appetite and solid results by stocks and lower-quality bonds. However, the market experienced a sharp sell-off in late April and in May, during which risk aversion returned and investors flocked to the relative safety of U.S. Treasury securities. Demand for riskier assets had resumed by July, before another “flight to quality” occurred in August. This proved to be a temporary situation, however, as risk appetite returned in September.
Due to signs that economic growth was slowing toward the end of the reporting period, the Fed took further actions to spur the economy. At its August 10th meeting, the Fed announced that it would begin to use the proceeds from expiring agency debt and agency mortgage-backed securities to purchase longer-dated Treasury securities. This led
| | |
| IV | | Legg Mason Manager Select Large Cap Growth Fund |
Investment commentary (cont’d)
to speculation that the Fed may again move to purchase large amounts of agency and Treasury securities in an attempt to avoid a double-dip recession and ward off deflation.
In addition, the Fed remained cautious throughout the reporting period given pockets of weakness in the economy. At its meeting in September 2010, the Fed said that “the pace of recovery in output and employment has slowed in recent months. . . . The Committee will maintain the target range for the federal funds ratev at 0 to 1/4 percent and continues to anticipate that economic conditions, including low rates of resource utilization, subdued inflation trends, and stable inflation expectations, are likely to warrant exceptionally low levels of the federal funds rate for an extended period.”
Equity market review
Stock prices, as measured by the S&P 500 Indexvi (the “Index”), moved higher during four of the first five months covered by this report. The market’s ascent was the result of a number of factors, including optimism regarding the economy, better-than-expected corporate profits and increased investor risk appetite. However, robust investor appetite was replaced with heightened risk aversion in May and June. This was due to the escalating sovereign debt crisis in Europe, uncertainties regarding new financial reforms in the U.S. and some worse-than-expected economic data.
After reaching a nineteen-month high on April 23, 2010, the market, as measured by the Index, fell into “correction territory” in May and plunged more than
10%. This marked the first correction since November 2007. Despite continued disappointing economic data, strong second quarter corporate profits helped the market rally in July. The market then declined again in August, triggered by fears that the economy might slip back into recession. With the Fed indicating the possibility of another round of quantitative easing, stock prices then moved sharply higher in September. All told, the Index returned 5.90% over the reporting period.
Looking at the U.S. stock market more closely, small-cap stocks generated the best returns during the reporting period, with the Russell 2000 Indexvii gaining 17.90%. In contrast, the Russell Midcap Indexviii and the large-cap Russell 1000 Indexix rose 17.29% and 6.96%, respectively. From an investment style perspective, growth and value stocks, as measured by the Russell 3000 Growthx and Russell 3000 Valuexi Indices, returned 8.44% and 7.10%, respectively.
As always, thank you for your confidence in our stewardship of your assets.
Sincerely,

R. Jay Gerken, CFA
Vice President
October 29, 2010
All investments are subject to risk including the possible loss of principal. Past performance is no guarantee of future results. All index performance reflects no deduction for fees, expenses or taxes. Please note that an investor cannot invest directly in an index.
| i | The Federal Reserve Board (“Fed”) is responsible for the formulation of policies designed to promote economic growth, full employment, stable prices and a sustainable pattern of international trade and payments. |
| ii | Gross domestic product (“GDP”) is the market value of all final goods and services produced within a country in a given period of time. |
| iii | The S&P/Case-Shiller Home Price Index measures the residential housing market, tracking changes in the value of the residential real estate market in twenty metropolitan regions across the United States. |
| iv | The Institute for Supply Management’s PMI is based on a survey of purchasing executives who buy the raw materials for manufacturing at more than 350 companies. It offers an early reading on the health of the manufacturing sector. |
| v | The federal funds rate is the rate charged by one depository institution on an overnight sale of immediately available funds (balances at the Federal Reserve) to another depository institution; the rate may vary from depository institution to depository institution and from day to day. |
| vi | The S&P 500 Index is an unmanaged index of 500 stocks and is generally representative of the performance of larger companies in the U.S. |
| vii | The Russell 2000 Index measures the performance of the 2,000 smallest companies in the Russell 3000 Index, which represents approximately 8% of the total market capitalization of the Russell 3000 Index. The Russell 3000 Index measures the performance of the 3,000 largest U.S. companies based on total market capitalization, which represents approximately 98% of the U.S. equity market. |
| viii | The Russell Midcap Index measures the performance of the 800 smallest companies in the Russell 1000 Index, which represents approximately 25% of the total market capitalization of the Russell 1000 Index. |
| ix | The Russell 1000 Index measures the performance of the 1,000 largest companies in the Russell 3000 Index, which represents approximately 92% of the total market capitalization of the Russell 3000 Index. |
| x | The Russell 3000 Growth Index measures the performance of those Russell 3000 Index companies with higher price-to-book ratios and higher forecasted growth values. (A price-to-book ratio is the price of a stock compared to the difference between a company’s assets and liabilities.) |
| xi | The Russell 3000 Value Index measures the performance of those Russell 3000 Index companies with lower price-to-book ratios and lower forecasted growth values. |
| | | | |
| Legg Mason Manager Select Large Cap Growth Fund 2010 Annual Report | | | 1 | |
Fund overview
Q. What is the Fund’s investment strategy?
A. The Fund’s investment objective is long-term growth of capital. Under normal market conditions, the Fund invests at least 80% of its assets in equity securities of large-capitalization companies (or other financial instruments that derive their value from the equity securities of such companies). The Fund generally follows a growth discipline in selecting securities. The Fund may invest up to 20% of its net assets in small- and mid-capitalization companies. The Fund may also invest up to 20% of its net assets in securities of foreign companies. The Fund may engage in short sales of securities and other instruments. Short sales may be used to hedge or substantially offset long positions held by the Fund, but also may be unrelated to any long positions held by the Fund. The Fund may also invest in derivatives, such as futures and options, to attempt to enhance its return, or to hedge its investments, among other things.
The Fund utilizes a “multi-manager” approach whereby the Fund’s assets are normally allocated among multiple investment strategies (each managed by a different subadviser and/or investment team) and the Legg Mason Global Asset Allocation “completion portfolio” (managed by the Fund’s adviser, Legg Mason Global Asset Allocation, LLC or “LMGAA”). Each subadviser acts independently from the other subadvisers and uses its own methodology for selecting investments. LMGAA serves as the “manager of managers” for the Fund and has responsibility for monitoring and coordinating the overall management of the Fund. LMGAA also manages a portion of the Fund’s assets in a “completion portfolio” that attempts to reduce overall Fund tracking error versus the Fund’s comparative index, the Russell 1000 Growth Indexi (the “Index”).
Q. What were the overall market conditions during the Fund’s reporting period?
A. The Fund’s reporting period saw significant stock market volatility. From the start of the period on December 1, 2009 through mid-April of 2010, the Index rose by more than 10%, as investors welcomed signs that the severe economic downturn of 2008 and 2009 was ending. In late April of 2010, new fears arose about the creditworthiness of various European governments, sparked by the downgrading of Greece’s sovereign debt to junk status by Standard & Poor’s. Investors began to shy away from riskier assets, like equities, worldwide, and the Index fell by almost 15% between mid-April and early July. Between early July and the end of the period, the Index rallied again, rising by more than 13% from that July low, thanks to a combination of good earnings figures and a stated willingness by the U.S. Federal Reserve Board (“Fed”)ii to engage in further monetary policy easing as necessary to support the economy. For the period as a whole, the Index returned 6.18%.
Performance review
For the period from the Fund’s inception on December 1, 2009 through September 30, 2010, Class I shares of Legg Mason Manager Select Large Cap Growth Fund returned 7.50%. The Fund’s unmanaged benchmark, the Russell 1000 Growth Index, returned 6.18% over the same time frame. The Lipper Large-Cap Growth Funds Category Average1 returned 6.21% for the period from December 1, 2009 through September 30, 2010.
| 1 | Lipper, Inc., a wholly-owned subsidiary of Reuters, provides independent insight on global collective investments. Returns are based on the period from December 1, 2009 through September 30, 2010, including the reinvestment of all distributions, including returns of capital, if any, calculated among the 864 funds in the Fund’s Lipper category. |
| | |
| 2 | | Legg Mason Manager Select Large Cap Growth Fund 2010 Annual Report |
Fund overview (cont’d)
| | | | | | | | |
| Performance Snapshot as of September 30, 2010 (unaudited) | |
| | | 6 months | | | Since
Fund
Inception* | |
| Legg Mason Manager Select Large Cap Growth Fund: | | | | | | | | |
Class I | | | -1.53 | % | | | 7.50 | % |
| Russell 1000 Growth Index | | | -0.27 | % | | | 6.18 | % |
| Lipper Large-Cap Growth Funds Category Average1 | | | -1.18 | % | | | 6.21 | % |
The performance shown represents past performance. Past performance is no guarantee of future results and current performance may be higher or lower than the performance shown above. Principal value and investment returns will fluctuate and investors’ shares, when redeemed, may be worth more or less than their original cost. To obtain performance data current to the most recent month-end, please call Institutional Shareholder Services at 1-888-425-6432.
Fund returns assume the reinvestment of all distributions, including returns of capital, if any, at net asset value and the deduction of all Fund expenses. Returns have not been adjusted to include the deduction of taxes that a shareholder would pay on Fund distributions. Performance figures for periods shorter than one year represent cumulative figures and are not annualized.
Performance figures reflect compensating balance arrangements, expense reimbursements and/or fee waivers, without which the performance would have been lower.
* The Fund’s inception date is December 1, 2009.
|
| Total Annual Operating Expenses (unaudited) |
As of the Fund’s most current prospectus dated December 1, 2009, the gross total operating expense ratio for Class I shares was 4.93%.
Actual expenses may be higher. For example, expenses may be higher than those shown if average net assets decrease. Net assets are more likely to decrease and Fund expense ratios are more likely to increase when markets are volatile.
As a result of an expense limitation agreement, the ratio of expenses, other than interest, brokerage, dividend expense on short sales, taxes and extraordinary expenses, to average net assets will not exceed 0.90% for Class I shares. This expense limitation agreement cannot be terminated prior to December 31, 2011 without the Board of Trustees’ consent.
The manager is permitted to recapture amounts forgone or reimbursed to the class within three years after the year in which the manager earned the fee or incurred the expense if the class’ total annual operating expenses have fallen to a level below the expense limitation in effect at the time the fees were earned or the expense incurred.
Q. What were the leading contributors to performance?
A. Stocks that made the biggest positive contribution to the Fund’s relative performance (versus the Index) over the reporting period were Akamai Technologies Inc., Genzyme Corp. and Chipotle Mexican Grill Inc. (Class A). The Fund also benefited from its underweight positions relative to the benchmark in Microsoft Corp. and Exxon Mobil Corp.; both stocks are large components within the benchmark and both underperformed the benchmark. The Fund’s overweight to the Consumer Discretionary sector and its underweight to the Information Technology sector also contributed positively to relative performance.
Q. What were the leading detractors from performance?
A. Stocks that had the biggest negative impact on the Fund’s relative performance (versus its benchmark) for the reporting period were Anadarko Petroleum Corp., Blackrock Inc., Amgen Inc. and Charles Schwab Corp. In addition, our underweight in Apple Inc. detracted from relative performance. Apple Inc. is one of the largest components of the benchmark and outperformed the benchmark over the reporting period. The Fund’s overweight in the Health Care sector and its underweight in the Industrials sector also detracted from relative performance.
Q. Were there any significant changes to the Fund during the reporting period?
A. The Fund reduced its weighting in the Health Care sector, and increased its weightings in the Consumer Discretionary, Energy and Industrials sectors.
| 1 | Lipper, Inc., a wholly-owned subsidiary of Reuters, provides independent insight on global collective investments. Returns are based on the period ended September 30, 2010, including the reinvestment of all distributions, including returns of capital, if any, calculated among the 865 funds for the six-month period and among the 864 funds for the period from December 1, 2009 through September 30, 2010 in the Fund’s Lipper category. |
| | | | |
| Legg Mason Manager Select Large Cap Growth Fund 2010 Annual Report | | | 3 | |
Thank you for your investment in Legg Mason Manager Select Large Cap Growth Fund. As always, we appreciate that you have chosen us to manage your assets and we remain focused on achieving the Fund’s investment goals.
Sincerely,

Steven Bleiberg
Portfolio Manager
Legg Mason Global Asset Allocation, LLC

Y. Wayne Lin
Portfolio Manager
Legg Mason Global Asset Allocation, LLC

Andrew D. Purdy
Portfolio Manager
Legg Mason Global Asset Allocation, LLC
October 19, 2010
RISKS: Equity securities are subject to price fluctuation. International investments are subject to special risks including currency fluctuations and social, economic and political uncertainties, which could increase volatility. These risks are magnified in emerging markets. Small- and mid-cap stocks involve greater risks and volatility than large-cap stocks. The Fund utilizes a “multi-manager” approach whereby the Fund’s assets are normally allocated among multiple investment strategies (each managed by a different subadviser and/or investment team). While Legg Mason Global Asset Allocation, LLC, the Fund’s adviser, monitors each subadviser and monitors the overall management of the Fund, each subadviser makes investment decisions independently from the others. It is possible that the subadvisers’ investment styles will not always be complementary, which could adversely affect the performance of the Fund. The Fund may suffer significant losses if assets that the Fund sells short appreciate rather than depreciate in value. While the possible loss on a security that is purchased is limited to the price paid for a security, there is no limit on the amount of loss on a security that is sold short. Derivatives, such as options and futures, can be illiquid, may disproportionately increase losses, and have a potentially large impact on Fund performance. Please see the Fund’s prospectus for more information on these and other risks.
Portfolio holdings and breakdowns are as of September 30, 2010 and are subject to change and may not be representative of the portfolio managers’ current or future investments. The Fund’s top ten holdings (as a percentage of net assets) as of this date were: Apple Inc. (3.1%), Amgen Inc. (2.8%), Genzyme Corp. (2.6%), Anadarko Petroleum Corp. (2.5%), Biogen Idec Inc. (2.3%), UnitedHealth Group Inc. (2.2%), Google Inc., Class A Shares (2.2%), Celgene Corp. (1.8%), Weatherford International Ltd. (1.8%) and Amazon.com Inc. (1.7%). Please refer to pages 7 through 11 for a list and percentage breakdown of the Fund’s holdings.
The mention of sector breakdowns is for informational purposes only and should not be construed as a recommendation to purchase or sell any securities. The information provided regarding such sectors is not a sufficient basis upon which to make an investment decision. Investors seeking financial advice regarding the appropriateness of investing in any securities or investment strategies discussed should consult their financial professional. The Fund’s top five sector holdings (as a percentage of net assets) as of September 30, 2010 were: Information Technology (26.7%), Health Care (18.9%), Consumer Discretionary (15.7%), Energy (11.0%) and Industrials (8.3%). The Fund’s portfolio composition is subject to change at any time.
All investments are subject to risk including the possible loss of principal. Past performance is no guarantee of future results. All index performance reflects no deduction for fees, expenses or taxes. Please note that an investor cannot invest directly in an index.
The information provided is not intended to be a forecast of future events, a guarantee of future results or investment advice. Views expressed may differ from those of the firm as a whole.
| i | The Russell 1000 Growth Index measures the performance of those Russell 1000 Index companies with higher price-to-book ratios and higher forecasted growth values. (A price-to-book ratio is the price of a stock compared to the difference between a company’s assets and liabilities.) The Russell 1000 Index measures the performance of the 1,000 largest companies in the Russell 3000 Index, which represents approximately 92% of the total market capitalization of the Russell 3000 Index. The Russell 3000 |
| | Index measures the performance of the 3,000 largest U.S. companies based on total market capitalization, which represents approximately 98% of the U.S. equity market. |
| ii | The Federal Reserve Board (“Fed”) is responsible for the formulation of policies designed to promote economic growth, full employment, stable prices and a sustainable pattern of international trade and payments. |
| | |
| 4 | | Legg Mason Manager Select Large Cap Growth Fund 2010 Annual Report |
Fund at a glance† (unaudited)
Investment breakdown (%) as a percent of total investments
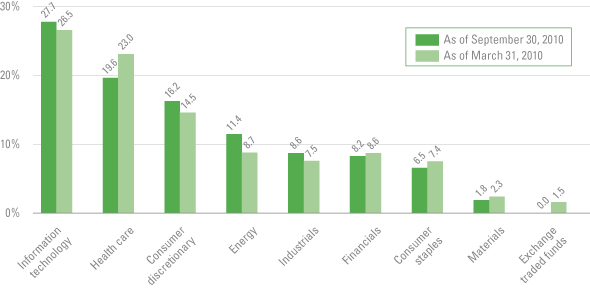
| † | The bar graph above represents the composition of the Fund’s investments as of September 30, 2010 and March 31, 2010. The Fund is actively managed. As a result, the composition of the Fund’s investments is subject to change at any time. |
| | | | |
| Legg Mason Manager Select Large Cap Growth Fund 2010 Annual Report | | | 5 | |
Fund expenses (unaudited)
Example
As a shareholder of the Fund, you may incur two types of costs: (1) transaction costs and (2) ongoing costs, including management fees and other Fund expenses. This example is intended to help you understand your ongoing costs (in dollars) of investing in the Fund and to compare these costs with the ongoing costs of investing in other mutual funds.
This example is based on an investment of $1,000 invested on April 1, 2010 and held for the six months ended September 30, 2010.
Actual expenses
The table below titled “Based on Actual Total Return” provides information about actual account values and actual expenses. You may use the information provided in this table, together with the amount you invested, to estimate the expenses that you paid over the period. To estimate the expenses you paid on your account, divide your ending account value by $1,000 (for example, an $8,600 ending account value divided by $1,000 = 8.6), then multiply the result by the number under the heading entitled “Expenses Paid During the Period”.
Hypothetical example for comparison purposes
The table below titled “Based on Hypothetical Total Return” provides information about hypothetical account values and hypothetical expenses based on the actual expense ratio and an assumed rate of return of 5.00% per year before expenses, which is not the Fund’s actual return. The hypothetical account values and expenses may not be used to estimate the actual ending account balance or expenses you paid for the period. You may use the information provided in this table to compare the ongoing costs of investing in the Fund and other funds. To do so, compare the 5.00% hypothetical example relating to the Fund with the 5.00% hypothetical examples that appear in the shareholder reports of the other funds.
Please note that the expenses shown in the table below are meant to highlight your ongoing costs only and do not reflect any transactional costs. Therefore, the table is useful in comparing ongoing costs only, and will not help you determine the relative total costs of owning different funds. In addition, if these transaction costs were included, your costs would have been higher.
| | | | | | | | | | | | | | | | | | | | | | | | | | | | | | | | | | | | | | | | |
| Based on actual total return1 | | | | | Based on hypothetical total return1 | |
Actual Total
Return2 | | | Beginning
Account
Value | | | Ending
Account
Value | | | Annualized
Expense
Ratio | | | Expenses
Paid During
the Period3 | | | | | Hypothetical
Annualized
Total Return | | | Beginning
Account
Value | | | Ending
Account
Value | | | Annualized
Expense
Ratio | | | Expenses
Paid During
the Period3 | |
| | -1.53 | % | | $ | 1,000.00 | | | $ | 984.70 | | | | 0.90 | % | | $ | 4.48 | | | | | | 5.00 | % | | $ | 1,000.00 | | | $ | 1,020.56 | | | | 0.90 | % | | $ | 4.56 | |
| 1 | For the six months ended September 30, 2010. |
| 2 | Assumes the reinvestment of all distributions, including returns of capital, if any, at net asset value. Total return is not annualized, as it may not be representative of the total return for the year. Performance figures may reflect compensating balance arrangements, fee waivers and/or expense reimbursements. In the absence of compensating balance arrangements, fee waivers and/or expense reimbursements, the total return would have been lower. Past performance is no guarantee of future results. |
| 3 | Expenses (net of compensating balance arrangements, fee waivers and/or expense reimbursements) are equal to the Fund’s annualized expense ratio, multiplied by the average account value over the period, multiplied by the number of days in the most recent fiscal half-year (183), then divided by 365. |
| | |
| 6 | | Legg Mason Manager Select Large Cap Growth Fund 2010 Annual Report |
Fund performance (unaudited)
| | | | |
| Average annual total return1,2 | | | |
| | | Class I | |
| Inception* through 9/30/10 | | | 7.50 | % |
| | | | |
| Cumulative total return1,2 | | | |
| | �� | Class I | |
| Inception date of 12/1/09 through 9/30/10 | | | 7.50 | % |
Historical performance
Value of $1,000,000 invested in
Class I Shares of Legg Mason Manager Select Large Cap Growth Fund vs. Russell 1000 Growth Index† — December 1, 2009* - September 2010
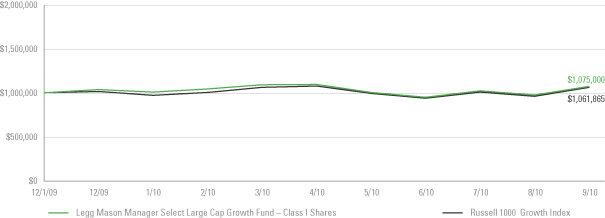
All figures represent past performance and are not a guarantee of future results. Investment return and principal value of an investment will fluctuate so that an investor’s shares, when redeemed, may be worth more or less than their original cost. The returns shown do not reflect the deduction of taxes that a shareholder would pay on Fund distributions or the redemption of Fund shares. Performance figures may reflect compensating balance arrangements, fee waivers and/or expense reimbursements. In the absence of compensating balance arrangements, fee waivers and/or expense reimbursements, the total return would have been lower.
| 2 | Assumes the reinvestment of all distributions, including returns of capital, if any, at net asset value. |
| * | Inception date for Class I shares is December 1, 2009. |
| † | Hypothetical illustration of $1,000,000 invested in Class I shares of Legg Mason Manager Select Large Cap Growth Fund on December 1, 2009 (inception date), assuming the reinvestment of all distributions, including returns of capital, if any, at net asset value through September 30, 2010. The Russell 1000 Growth Index measures the performance of those Russell 1000 Index companies with higher price-to-book ratios and higher forecasted growth values. The Index is unmanaged and is not subject to the same management and trading expenses as a mutual fund. Please note that an investor cannot invest directly in an index. |
| | | | |
| Legg Mason Manager Select Large Cap Growth Fund 2010 Annual Report | | | 7 | |
Schedule of investments
September 30, 2010
Legg Mason Manager Select Large Cap Growth Fund
| | | | | | | | | | | | | | | | |
| Security | | | | | | | | Shares | | | Value | |
| Common Stocks — 96.6% | | | | | | | | | | | | | | | | |
| Consumer Discretionary — 15.7% | | | | | | | | | | | | | | | | |
Auto Components — 1.0% | | | | | | | | | | | | | | | | |
Johnson Controls Inc. | | | | | | | | | | | 500 | | | $ | 15,250 | |
Hotels, Restaurants & Leisure — 2.1% | | | | | | | | | | | | | | | | |
Carnival Corp. | | | | | | | | | | | 101 | | | | 3,859 | |
Chipotle Mexican Grill Inc., Class A | | | | | | | | | | | 51 | | | | 8,772 | * |
McDonald’s Corp. | | | | | | | | | | | 200 | | | | 14,902 | |
Wendy’s/Arby’s Group Inc., Class A Shares | | | | | | | | | | | 586 | | | | 2,655 | |
WMS Industries Inc. | | | | | | | | | | | 89 | | | | 3,388 | * |
Total Hotels, Restaurants & Leisure | | | | | | | | | | | | | | | 33,576 | |
Internet & Catalog Retail — 2.3% | | | | | | | | | | | | | | | | |
Amazon.com Inc. | | | | | | | | | | | 175 | | | | 27,485 | * |
Liberty Media Holding Corp., Interactive Group, Series A Shares | | | | | | | | | | | 400 | | | | 5,484 | * |
Priceline.com Inc. | | | | | | | | | | | 11 | | | | 3,832 | * |
Total Internet & Catalog Retail | | | | | | | | | | | | | | | 36,801 | |
Media — 7.6% | | | | | | | | | | | | | | | | |
Cablevision Systems Corp., New York Group, Class A Shares | | | | | | | | | | | 800 | | | | 20,952 | |
Comcast Corp., Class A Shares | | | | | | | | | | | 200 | | | | 3,616 | |
Comcast Corp., Special Class A Shares | | | | | | | | | | | 1,300 | | | | 22,113 | |
DIRECTV, Class A Shares | | | | | | | | | | | 300 | | | | 12,489 | * |
Discovery Communications Inc., Class A Shares | | | | | | | | | | | 100 | | | | 4,355 | * |
Discovery Communications Inc., Class C Shares | | | | | | | | | | | 100 | | | | 3,819 | * |
Interpublic Group of Cos. Inc. | | | | | | | | | | | 596 | | | | 5,978 | * |
Liberty Global Inc., Series A Shares | | | | | | | | | | | 100 | | | | 3,081 | * |
Liberty Global Inc., Series C Shares | | | | | | | | | | | 100 | | | | 3,056 | * |
Liberty Media Holding Corp., Capital Group, Series A Shares | | | | | | | | | | | 100 | | | | 5,206 | * |
Madison Square Garden Inc., Class A Shares | | | | | | | | | | | 200 | | | | 4,216 | * |
Omnicom Group Inc. | | | | | | | | | | | 250 | | | | 9,870 | |
Sirius Satellite Radio Inc. | | | | | | | | | | | 1,851 | | | | 2,221 | * |
Viacom Inc., Class B Shares | | | | | | | | | | | 100 | | | | 3,619 | |
Walt Disney Co. | | | | | | | | | | | 492 | | | | 16,290 | |
World Wrestling Entertainment Inc., Class A Shares | | | | | | | | | | | 100 | | | | 1,391 | |
Total Media | | | | | | | | | | | | | | | 122,272 | |
Multiline Retail — 0.4% | | | | | | | | | | | | | | | | |
Sears Holdings Corp. | | | | | | | | | | | 36 | | | | 2,597 | * |
Target Corp. | | | | | | | | | | | 81 | | | | 4,329 | |
Total Multiline Retail | | | | | | | | | | | | | | | 6,926 | |
Specialty Retail — 2.3% | | | | | | | | | | | | | | | | |
American Eagle Outfitters Inc. | | | | | | | | | | | 261 | | | | 3,905 | |
Bed Bath & Beyond Inc. | | | | | | | | | | | 152 | | | | 6,598 | * |
Chico’s FAS Inc. | | | | | | | | | | | 519 | | | | 5,460 | |
Home Depot Inc. | | | | | | | | | | | 488 | | | | 15,460 | |
J. Crew Group Inc. | | | | | | | | | | | 87 | | | | 2,925 | * |
Urban Outfitters Inc. | | | | | | | | | | | 102 | | | | 3,207 | * |
Total Specialty Retail | | | | | | | | | | | | | | | 37,555 | |
Total Consumer Discretionary | | | | | | | | | | | | | | | 252,380 | |
See Notes to Financial Statements.
| | |
| 8 | | Legg Mason Manager Select Large Cap Growth Fund 2010 Annual Report |
Schedule of investments (cont’d)
September 30, 2010
Legg Mason Manager Select Large Cap Growth Fund
| | | | | | | | | | | | | | | | |
| Security | | | | | | | | Shares | | | Value | |
| Consumer Staples — 6.3% | | | | | | | | | | | | | | | | |
Beverages — 2.9% | | | | | | | | | | | | | | | | |
Coca-Cola Co. | | | | | | | | | | | 382 | | | $ | 22,355 | |
PepsiCo Inc. | | | | | | | | | | | 378 | | | | 25,114 | |
Total Beverages | | | | | | | | | | | | | | | 47,469 | |
Food & Staples Retailing — 2.0% | | | | | | | | | | | | | | | | |
Costco Wholesale Corp. | | | | | | | | | | | 250 | | | | 16,122 | |
CVS Caremark Corp. | | | | | | | | | | | 514 | | | | 16,176 | |
Total Food & Staples Retailing | | | | | | | | | | | | | | | 32,298 | |
Household Products — 1.3% | | | | | | | | | | | | | | | | |
Procter & Gamble Co. | | | | | | | | | | | 343 | | | | 20,570 | |
Tobacco — 0.1% | | | | | | | | | | | | | | | | |
Philip Morris International Inc. | | | | | | | | | | | 29 | | | | 1,624 | |
Total Consumer Staples | | | | | | | | | | | | | | | 101,961 | |
| Energy — 11.0% | | | | | | | | | | | | | | | | |
Energy Equipment & Services — 5.6% | | | | | | | | | | | | | | | | |
Core Laboratories NV | | | | | | | | | | | 200 | | | | 17,608 | |
National-Oilwell Varco Inc. | | | | | | | | | | | 200 | | | | 8,894 | |
Schlumberger Ltd. | | | | | | | | | | | 420 | | | | 25,876 | |
Tetra Technology Inc. | | | | | | | | | | | 400 | | | | 8,388 | * |
Weatherford International Ltd. | | | | | | | | | | | 1,700 | | | | 29,070 | * |
Total Energy Equipment & Services | | | | | | | | | | | | | | | 89,836 | |
Oil, Gas & Consumable Fuels — 5.4% | | | | | | | | | | | | | | | | |
Anadarko Petroleum Corp. | | | | | | | | | | | 700 | | | | 39,935 | |
Apache Corp. | | | | | | | | | | | 80 | | | | 7,821 | |
Devon Energy Corp. | | | | | | | | | | | 300 | | | | 19,422 | |
Exxon Mobil Corp. | | | | | | | | | | | 300 | | | | 18,537 | |
Southwestern Energy Co. | | | | | | | | | | | 56 | | | | 1,873 | * |
Total Oil, Gas & Consumable Fuels | | | | | | | | | | | | | | | 87,588 | |
Total Energy | | | | | | | | | | | | | | | 177,424 | |
| Financials — 8.0% | | | | | | | | | | | | | | | | |
Capital Markets — 3.7% | | | | | | | | | | | | | | | | |
BlackRock Inc. | | | | | | | | | | | 148 | | | | 25,197 | |
Charles Schwab Corp. | | | | | | | | | | | 767 | | | | 10,661 | |
Cohen & Steers Inc. | | | | | | | | | | | 100 | | | | 2,170 | |
Northern Trust Corp. | | | | | | | | | | | 200 | | | | 9,648 | |
State Street Corp. | | | | | | | | | | | 300 | | | | 11,298 | |
Total Capital Markets | | | | | | | | | | | | | | | 58,974 | |
Commercial Banks — 0.1% | | | | | | | | | | | | | | | | |
BB&T Corp. | | | | | | | | | | | 72 | | | | 1,734 | |
Diversified Financial Services — 1.9% | | | | | | | | | | | | | | | | |
JPMorgan Chase & Co. | | | | | | | | | | | 200 | | | | 7,614 | |
MSCI Inc., Class A Shares | | | | | | | | | | | 300 | | | | 9,963 | * |
Nasdaq OMX Group Inc. | | | | | | | | | | | 678 | | | | 13,174 | * |
Total Diversified Financial Services | | | | | | | | | | | | | | | 30,751 | |
Insurance — 0.5% | | | | | | | | | | | | | | | | |
Berkshire Hathaway Inc., Class B Shares | | | | | | | | | | | 100 | | | | 8,268 | * |
See Notes to Financial Statements.
| | | | |
| Legg Mason Manager Select Large Cap Growth Fund 2010 Annual Report | | | 9 | |
Legg Mason Manager Select Large Cap Growth Fund
| | | | | | | | | | | | | | | | |
| Security | | | | | | | | Shares | | | Value | |
Real Estate Investment Trusts (REITs) — 0.4% | | | | | | | | | | | | | | | | |
Essex Property Trust Inc. | | | | | | | | | | | 58 | | | $ | 6,348 | |
Real Estate Management & Development — 0.6% | | | | | | | | | | | | | | | | |
CB Richard Ellis Group Inc., Class A Shares | | | | | | | | | | | 559 | | | | 10,218 | * |
Thrifts & Mortgage Finance — 0.8% | | | | | | | | | | | | | | | | |
Astoria Financial Corp. | | | | | | | | | | | 400 | | | | 5,452 | |
New York Community Bancorp Inc. | | | | | | | | | | | 400 | | | | 6,500 | |
Total Thrifts & Mortgage Finance | | | | | | | | | | | | | | | 11,952 | |
Total Financials | | | | | | | | | | | | | | | 128,245 | |
| Health Care — 18.9% | | | | | | | | | | | | | | | | |
Biotechnology — 10.6% | | | | | | | | | | | | | | | | |
Amgen Inc. | | | | | | | | | | | 816 | | | | 44,970 | * |
Biogen Idec Inc. | | | | | | | | | | | 662 | | | | 37,151 | * |
Celgene Corp. | | | | | | | | | | | 509 | | | | 29,324 | * |
Genzyme Corp. | | | | | | | | | | | 600 | | | | 42,474 | * |
Vertex Pharmaceuticals Inc. | | | | | | | | | | | 504 | | | | 17,423 | * |
Total Biotechnology | | | | | | | | | | | | | | | 171,342 | |
Health Care Equipment & Supplies — 1.5% | | | | | | | | | | | | | | | | |
Covidien PLC | | | | | | | | | | | 300 | | | | 12,057 | |
Stryker Corp. | | | | | | | | | | | 100 | | | | 5,005 | |
Thermo Fisher Scientific Inc. | | | | | | | | | | | 160 | | | | 7,661 | * |
Total Health Care Equipment & Supplies | | | | | | | | | | | | | | | 24,723 | |
Health Care Providers & Services — 3.0% | | | | | | | | | | | | | | | | |
Medco Health Solutions Inc. | | | | | | | | | | | 250 | | | | 13,015 | * |
UnitedHealth Group Inc. | | | | | | | | | | | 1,000 | | | | 35,110 | |
Total Health Care Providers & Services | | | | | | | | | | | | | | | 48,125 | |
Pharmaceuticals — 3.8% | | | | | | | | | | | | | | | | |
Forest Laboratories Inc. | | | | | | | | | | | 700 | | | | 21,651 | * |
Johnson & Johnson | | | | | | | | | | | 389 | | | | 24,102 | |
Teva Pharmaceutical Industries Ltd., ADR | | | | | | | | | | | 200 | | | | 10,550 | |
Valeant Pharmaceuticals International Inc. | | | | | | | | | | | 178 | | | | 4,461 | |
Total Pharmaceuticals | | | | | | | | | | | | | | | 60,764 | |
Total Health Care | | | | | | | | | | | | | | | 304,954 | |
| Industrials — 8.3% | | | | | | | | | | | | | | | | |
Aerospace & Defense — 1.1% | | | | | | | | | | | | | | | | |
L-3 Communications Holdings Inc. | | | | | | | | | | | 250 | | | | 18,067 | |
Construction & Engineering — 0.8% | | | | | | | | | | | | | | | | |
Fluor Corp. | | | | | | | | | | | 100 | | | | 4,953 | |
Jacobs Engineering Group Inc. | | | | | | | | | | | 200 | | | | 7,740 | * |
Total Construction & Engineering | | | | | | | | | | | | | | | 12,693 | |
Electrical Equipment — 0.9% | | | | | | | | | | | | | | | | |
ABB Ltd., ADR | | | | | | | | | | | 700 | | | | 14,784 | * |
Industrial Conglomerates — 2.4% | | | | | | | | | | | | | | | | |
3M Co. | | | | | | | | | | | 100 | | | | 8,671 | |
General Electric Co. | | | | | | | | | | | 704 | | | | 11,440 | |
Tyco International Ltd. | | | | | | | | | | | 300 | | | | 11,019 | |
United Technologies Corp. | | | | | | | | | | | 100 | | | | 7,123 | |
Total Industrial Conglomerates | | | | | | | | | | | | | | | 38,253 | |
See Notes to Financial Statements.
| | |
| 10 | | Legg Mason Manager Select Large Cap Growth Fund 2010 Annual Report |
Schedule of investments (cont’d)
September 30, 2010
Legg Mason Manager Select Large Cap Growth Fund
| | | | | | | | | | | | | | | | |
| Security | | | | | | | | Shares | | | Value | |
Machinery — 1.7% | | | | | | | | | | | | | | | | |
Cummins Inc. | | | | | | | | | | | 103 | | | $ | 9,330 | |
Donaldson Co. Inc. | | | | | | | | | | | 200 | | | | 9,426 | |
Pall Corp. | | | | | | | | | | | 200 | | | | 8,328 | |
Total Machinery | | | | | | | | | | | | | | | 27,084 | |
Professional Services — 0.8% | | | | | | | | | | | | | | | | |
Verisk Analytics Inc., Class A Shares | | | | | | | | | | | 500 | | | | 14,005 | * |
Road & Rail — 0.3% | | | | | | | | | | | | | | | | |
Hertz Global Holdings Inc. | | | | | | | | | | | 464 | | | | 4,914 | * |
Trading Companies & Distributors — 0.3% | | | | | | | | | | | | | | | | |
Fastenal Co. | | | | | | | | | | | 84 | | | | 4,468 | |
Total Industrials | | | | | | | | | | | | | | | 134,268 | |
| Information Technology — 26.7% | | | | | | | | | | | | | | | | |
Communications Equipment — 3.0% | | | | | | | | | | | | | | | | |
Cisco Systems Inc. | | | | | | | | | | | 1,166 | | | | 25,535 | * |
F5 Networks Inc. | | | | | | | | | | | 30 | | | | 3,114 | * |
Juniper Networks Inc. | | | | | | | | | | | 530 | | | | 16,086 | * |
Nokia OYJ, ADR | | | | | | | | | | | 300 | | | | 3,009 | |
Total Communications Equipment | | | | | | | | | | | | | | | 47,744 | |
Computers & Peripherals — 4.8% | | | | | | | | | | | | | | | | |
Apple Inc. | | | | | | | | | | | 175 | | | | 49,656 | * |
EMC Corp. | | | | | | | | | | | 400 | | | | 8,124 | * |
SanDisk Corp. | | | | | | | | | | | 400 | | | | 14,660 | * |
Seagate Technology | | | | | | | | | | | 500 | | | | 5,890 | * |
Total Computers & Peripherals | | | | | | | | | | | | | | | 78,330 | |
Electronic Equipment, Instruments & Components — 0.5% | | | | | | | | | | | | | | | | |
Tyco Electronics Ltd. | | | | | | | | | | | 300 | | | | 8,766 | |
Internet Software & Services — 4.7% | | | | | | | | | | | | | | | | |
Akamai Technologies Inc. | | | | | | | | | | | 483 | | | | 24,237 | * |
eBay Inc. | | | | | | | | | | | 604 | | | | 14,738 | * |
Google Inc., Class A Shares | | | | | | | | | | | 66 | | | | 34,702 | * |
WebMD Health Corp. | | | | | | | | | | | 50 | | | | 2,493 | * |
Total Internet Software & Services | | | | | | | | | | | | | | | 76,170 | |
IT Services — 4.2% | | | | | | | | | | | | | | | | |
Accenture PLC, Class A Shares | | | | | | | | | | | 300 | | | | 12,747 | |
Automatic Data Processing Inc. | | | | | | | | | | | 250 | | | | 10,508 | |
International Business Machines Corp. | | | | | | | | | | | 85 | | | | 11,402 | |
Teradata Corp. | | | | | | | | | | | 200 | | | | 7,712 | * |
Visa Inc., Class A Shares | | | | | | | | | | | 340 | | | | 25,248 | |
Total IT Services | | | | | | | | | | | | | | | 67,617 | |
Semiconductors & Semiconductor Equipment — 4.8% | | | | | | | | | | | | | | | | |
Broadcom Corp., Class A Shares | | | | | | | | | | | 400 | | | | 14,156 | |
Cree Inc. | | | | | | | | | | | 100 | | | | 5,429 | * |
First Solar Inc. | | | | | | | | | | | 111 | | | | 16,356 | * |
Intel Corp. | | | | | | | | | | | 1,087 | | | | 20,903 | |
NVIDIA Corp. | | | | | | | | | | | 898 | | | | 10,488 | * |
Standard Microsystems Corp. | | | | | | | | | | | 100 | | | | 2,281 | * |
Texas Instruments Inc. | | | | | | | | | | | 270 | | | | 7,328 | |
Total Semiconductors & Semiconductor Equipment | | | | | | | | | | | | | | | 76,941 | |
See Notes to Financial Statements.
| | | | |
| Legg Mason Manager Select Large Cap Growth Fund 2010 Annual Report | | | 11 | |
Legg Mason Manager Select Large Cap Growth Fund
| | | | | | | | | | | | | | | | |
| Security | | | | | | | | Shares | | | Value | |
Software — 4.7% | | | | | | | | | | | | | | | | |
Advent Software Inc. | | | | | | | | | | | 100 | | | $ | 5,219 | * |
Autodesk Inc. | | | | | | | | | | | 100 | | | | 3,197 | * |
CommVault Systems Inc. | | | | | | | | | | | 200 | | | | 5,206 | * |
Electronic Arts Inc. | | | | | | | | | | | 577 | | | | 9,480 | * |
Microsoft Corp. | | | | | | | | | | | 944 | | | | 23,119 | |
Oracle Corp. | | | | | | | | | | | 400 | | | | 10,740 | |
Red Hat Inc. | | | | | | | | | | | 208 | | | | 8,528 | * |
Rovi Corp. | | | | | | | | | | | 200 | | | | 10,082 | * |
Total Software | | | | | | | | | | | | | | | 75,571 | |
Total Information Technology | | | | | | | | | | | | | | | 431,139 | |
| Materials — 1.7% | | | | | | | | | | | | | | | | |
Chemicals — 1.2% | | | | | | | | | | | | | | | | |
Ecolab Inc. | | | | | | | | | | | 250 | | | | 12,685 | |
Monsanto Co. | | | | | | | | | | | 140 | | | | 6,710 | |
Total Chemicals | | | | | | | | | | | | | | | 19,395 | |
Metals & Mining — 0.5% | | | | | | | | | | | | | | | | |
Freeport-McMoRan Copper & Gold Inc., Class B Shares | | | | | | | | | | | 100 | | | | 8,539 | |
Total Materials | | | | | | | | | | | | | | | 27,934 | |
Total Investments — 96.6% (Cost — $1,447,996#) | | | | | | | | | | | | | | | 1,558,305 | |
Other Assets in Excess of Liabilities — 3.4% | | | | | | | | | | | | | | | 54,655 | |
Total Net Assets — 100.0% | | | | | | | | | | | | | | $ | 1,612,960 | |
| * | Non-income producing security. |
| # | Aggregate cost for federal income tax purposes is $1,449,914. |
| | |
Abbreviation used in this schedule: |
| ADR | | — American Depositary Receipt |
See Notes to Financial Statements.
| | |
| 12 | | Legg Mason Manager Select Large Cap Growth Fund 2010 Annual Report |
Statement of assets and liabilities
September 30, 2010
| | | | |
| |
| Assets: | | | | |
Investments, at value (Cost — $1,447,996) | | $ | 1,558,305 | |
Cash | | | 70,423 | |
Receivable from investment manager | | | 63,201 | |
Prepaid expenses | | | 3,240 | |
Dividends receivable | | | 951 | |
Total Assets | | | 1,696,120 | |
| |
| Liabilities: | | | | |
Organizational cost payable | | | 36,025 | |
Trustees’ fees payable | | | 2,644 | |
Accrued expenses | | | 44,491 | |
Total Liabilities | | | 83,160 | |
| Total Net Assets | | $ | 1,612,960 | |
| |
| Net Assets: | | | | |
Par value (Note 5) | | $ | 1 | |
Paid-in capital in excess of par value | | | 1,495,972 | |
Undistributed net investment income | | | 6,114 | |
Accumulated net realized gain on investments | | | 555 | |
Net unrealized appreciation on investments and foreign currencies | | | 110,318 | |
| Total Net Assets | | $ | 1,612,960 | |
| |
| Shares Outstanding | | | 125,000 | |
| |
| Net Asset Value | | | $12.90 | |
See Notes to Financial Statements.
| | | | |
| Legg Mason Manager Select Large Cap Growth Fund 2010 Annual Report | | | 13 | |
Statement of operations
For the Period Ended September 30, 2010†
| | | | |
| |
| Investment Income: | | | | |
Dividends | | $ | 13,903 | |
Interest | | | 1 | |
Less: Foreign taxes withheld | | | (156) | |
Total Investment Income | | | 13,748 | |
| |
| Expenses: | | | | |
Organizational fees | | | 82,138 | |
Custody fees | | | 55,893 | |
Trustees’ fees | | | 37,265 | |
Audit and tax | | | 34,033 | |
Shareholder reports | | | 14,091 | |
Legal fees | | | 10,276 | |
Investment management fee (Note 2) | | | 9,713 | |
Registration fees | | | 2,281 | |
Transfer agent fees | | | 995 | |
Miscellaneous expenses | | | 2,976 | |
Total Expenses | | | 249,661 | |
Less: Fee waivers and/or expense reimbursements (Note 2) | | | (237,722) | |
Compensating balance arrangements (Note 1) | | | (284) | |
Net Expenses | | | 11,655 | |
| Net Investment Income | | | 2,093 | |
| |
| Realized and Unrealized Gain (Loss) on Investments and Foreign Currency Transactions (Notes 1 and 3): | | | | |
Net Realized Gain (Loss) From: | | | | |
Investment transactions | | | 555 | |
Foreign currency transactions | | | (6) | |
Net Realized Gain | | | 549 | |
Change in Net Unrealized Appreciation (Depreciation) From: | | | | |
Investments | | | 110,309 | |
Foreign currencies | | | 9 | |
Change in Net Unrealized Appreciation (Depreciation) | | | 110,318 | |
| Net Gain on Investments and Foreign Currency Transactions | | | 110,867 | |
| Increase in Net Assets From Operations | | $ | 112,960 | |
| † | For the period December 1, 2009 (inception date) to September 30, 2010. |
See Notes to Financial Statements.
| | |
| 14 | | Legg Mason Manager Select Large Cap Growth Fund 2010 Annual Report |
Statement of changes in net assets
| | | | |
| For the Period Ended September 30, | | 2010† | |
| |
| Operations: | | | | |
Net investment income | | $ | 2,093 | |
Net realized gain | | | 549 | |
Change in net unrealized appreciation (depreciation) | | | 110,318 | |
Increase in Net Assets From Operations | | | 112,960 | |
| |
| Fund Share Transactions (Note 5): | | | | |
Net proceeds from sale of shares | | | 1,500,000 | |
Increase in Net Assets From Fund Share Transactions | | | 1,500,000 | |
Increase in Net Assets | | | 1,612,960 | |
| |
| Net Assets: | | | | |
Beginning of period | | | — | |
End of period* | | $ | 1,612,960 | |
* Includes undistributed net investment income of: | | | $6,114 | |
| † | For the period December 1, 2009 (inception date) to September 30, 2010. |
See Notes to Financial Statements.
| | | | |
| Legg Mason Manager Select Large Cap Growth Fund 2010 Annual Report | | | 15 | |
Financial highlights
| | | | |
| For a share of beneficial interest outstanding throughout the period ended September 30: | |
Class I Shares* | | 20101 | |
| |
| Net asset value, beginning of period | | | $12.00 | |
| |
| Income from operations: | | | | |
Net investment income | | | 0.02 | |
Net realized and unrealized gain | | | 0.88 | |
Total income from operations | | | 0.90 | |
| |
| Net asset value, end of period | | | $12.90 | |
Total return2 | | | 7.50 | % |
| |
| Net assets, end of period (000s) | | | $1,613 | |
| |
| Ratios to average net assets: | | | | |
Gross expenses3 | | | 19.28 | % |
Net expenses3,4,5,6 | | | 0.90 | |
Net investment income3 | | | 0.16 | |
| |
| Portfolio turnover rate | | | 37 | % |
| 1 | For the period December 1, 2009 (inception date) to September 30, 2010. |
| 2 | Performance figures may reflect compensating balance arrangements, fee waivers and/or expense reimbursements. In the absence of compensating balance arrangements, fee waivers and/or expense reimbursements, the total return would have been lower. Past performance is no guarantee of future results. Total returns for periods of less than one year are not annualized. |
| 4 | As a result of an expense limitation agreement, the ratio of expenses, other than brokerage, interest, dividend expense on short sales, taxes and extraordinary expenses, to average net assets of Class I shares will not exceed 0.90% until December 31, 2011. |
| 5 | Reflects fee waivers and/or expense reimbursements. |
| 6 | The impact of compensating balance arrangements was 0.02%. |
| * | Per share amounts have been calculated using the average shares method. |
See Notes to Financial Statements.
| | |
| 16 | | Legg Mason Manager Select Large Cap Growth Fund 2010 Annual Report |
Notes to financial statements
1. Organization and significant accounting policies
Legg Mason Manager Select Large Cap Growth Fund (the “Fund”) is a separate diversified investment series of Legg Mason Global Asset Management Trust (the “Trust”). The Trust, a Maryland statutory trust, is registered under the Investment Company Act of 1940, as amended (the “1940 Act”), as an open-end management investment company.
The following are significant accounting policies consistently followed by the Fund and are in conformity with U.S. generally accepted accounting principles (“GAAP”). Estimates and assumptions are required to be made regarding assets, liabilities and changes in net assets resulting from operations when financial statements are prepared. Changes in the economic environment, financial markets and any other parameters used in determining these estimates could cause actual results to differ. Subsequent events have been evaluated through the date the financial statements were issued.
(a) Investment valuation. Equity securities for which market quotations are available are valued at the last reported sales price or official closing price on the primary market or exchange on which they trade. When prices are not readily available, or are determined not to reflect fair value, such as when the value of a security has been significantly affected by events after the close of the exchange or market on which the security is principally traded, but before the Fund calculates its net asset value, the Fund values these securities at fair value as determined in accordance with procedures approved by the Fund’s Board of Trustees. Fair valuing of securities may be also determined with the assistance of a pricing service using calculations based on indices of domestic securities and the appropriate indicators, such as prices of relevant American depositary receipts (ADRs) and futures contracts. Short-term obligations with maturities of 60 days or less are valued at amortized cost, which approximates fair value.
The Fund has adopted Financial Accounting Standards Board Codification Topic 820 (“ASC Topic 820”). ASC Topic 820 establishes a single definition of fair value, creates a three-tier hierarchy as a framework for measuring fair value based on inputs used to value the Fund’s investments, and requires additional disclosure about fair value. The hierarchy of inputs is summarized below.
| Ÿ | | Level 1 — quoted prices in active markets for identical investments |
| Ÿ | | Level 2 — other significant observable inputs (including quoted prices for similar investments, interest rates, prepayment speeds, credit risk, etc.) |
| Ÿ | | Level 3 — significant unobservable inputs (including the Fund’s own assumptions in determining the fair value of investments) |
The inputs or methodology used for valuing securities are not necessarily an indication of the risk associated with investing in those securities.
The Fund uses valuation techniques to measure fair value that are consistent with the market approach and/or income approach, depending on the type of security and the particular circumstance. The market approach uses prices and other relevant information generated by market transactions involving identical or comparable securities. The income approach uses valuation techniques to discount estimated future cash flows to present value.
The following is a summary of the inputs used in valuing the Fund’s assets at fair value:
| | | | | | | | | | | | | | | | |
| Description | | Quoted Prices
(Level 1) | | | Other Significant
Observable Inputs
(Level 2) | | | Significant
Unobservable
Inputs (Level 3) | | | Total | |
| Common stocks† | | $ | 1,558,305 | | | | — | | | | — | | | $ | 1,558,305 | |
| † | See Schedule of Investments for additional detailed categorizations. |
(b) Repurchase agreements. The Fund may enter into repurchase agreements with institutions that its investment adviser has determined are creditworthy. Each repurchase agreement is recorded at cost. Under the terms of a typical repurchase agreement, the Fund acquires a debt security subject to an obligation of the seller to repurchase, and of the Fund to resell, the security at an agreed-upon price and time, thereby determining the yield during the Fund’s holding period. When entering into repurchase agreements, it is the
| | | | |
| Legg Mason Manager Select Large Cap Growth Fund 2010 Annual Report | | | 17 | |
Fund’s policy that its custodian or a third party custodian, acting on the Fund’s behalf, take possession of the underlying collateral securities, the market value of which, at all times, at least equals the principal amount of the repurchase transaction, including accrued interest. To the extent that any repurchase transaction maturity exceeds one business day, the value of the collateral is marked to market and measured against the value of the agreement in an effort to ensure the adequacy of the collateral. If the counterparty defaults, the Fund generally has the right to use the collateral to satisfy the terms of the repurchase transaction. However, if the market value of the collateral declines during the period in which the Fund seeks to assert its rights or if bankruptcy proceedings are commenced with respect to the seller of the security, realization of the collateral by the Fund may be delayed or limited.
(c) Foreign currency translation. Investment securities and other assets and liabilities denominated in foreign currencies are translated into U.S. dollar amounts based upon prevailing exchange rates on the date of valuation. Purchases and sales of investment securities and income and expense items denominated in foreign currencies are translated into U.S. dollar amounts based upon prevailing exchange rates on the respective dates of such transactions.
The Fund does not isolate that portion of the results of operations resulting from fluctuations in foreign exchange rates on investments from the fluctuations arising from changes in market prices of securities held. Such fluctuations are included with the net realized and unrealized gain or loss on investments.
Net realized foreign exchange gains or losses arise from sales of foreign currencies, including gains and losses on forward foreign currency contracts, currency gains or losses realized between the trade and settlement dates on securities transactions, and the difference between the amounts of dividends, interest, and foreign withholding taxes recorded on the Fund’s books and the U.S. dollar equivalent of the amounts actually received or paid. Net unrealized foreign exchange gains and losses arise from changes in the values of assets and liabilities, other than investments in securities, on the date of valuation, resulting from changes in exchange rates.
Foreign security and currency transactions may involve certain considerations and risks not typically associated with those of U.S. dollar denominated transactions as a result of, among other factors, the possibility of lower levels of governmental supervision and regulation of foreign securities markets and the possibility of political or economic instability.
(d) Foreign investment risks. The Fund’s investments in foreign securities may involve risks not present in domestic investments. Since securities may be denominated in foreign currencies, may require settlement in foreign currencies or pay interest or dividends in foreign currencies, changes in the relationship of these foreign currencies to the U.S. dollar can significantly affect the value of the investments and earnings of the Fund. Foreign investments may also subject the Fund to foreign government exchange restrictions, expropriation, taxation or other political, social or economic developments, all of which affect the market and/or credit risk of the investments.
(e) Security transactions and investment income. Security transactions are accounted for on a trade date basis. Interest income, adjusted for amortization of premium and accretion of discount, is recorded on the accrual basis. Dividend income is recorded on the ex-dividend date. Foreign dividend income is recorded on the ex-dividend date or as soon as practicable after the Fund determines the existence of a dividend declaration after exercising reasonable due diligence. The cost of investments sold is determined by use of the specific identification method. To the extent any issuer defaults or a credit event occurs that impacts the issuer, the Fund may halt any additional interest income accruals and consider the realizability of interest accrued up to the date of default or credit event.
(f) Distributions to shareholders. Distributions from net investment income and distributions of net realized gains, if any, are declared at least annually. Distributions to shareholders of the Fund are recorded on the ex-dividend date and are determined in accordance with income tax regulations, which may differ from GAAP.
(g) REIT Distributions. The character of distributions received from Real Estate Investment Trusts (‘‘REITs’’) held by the Fund is generally comprised of net investment income, capital gains, and return of capital. It is the policy of the Fund to estimate the character of distributions received from underlying REITs based on
| | |
| 18 | | Legg Mason Manager Select Large Cap Growth Fund 2010 Annual Report |
Notes to financial statements (cont’d)
historical data provided by the REITs. After each calendar year end, REITs report the actual tax character of these distributions. Differences between the estimated and actual amounts reported by the REITs are reflected in the Fund’s records in the year in which they are reported by the REITs by, adjusting related investment cost basis, capital gains and income, as necessary.
(h) Compensating balance arrangements. The Fund has an arrangement with its custodian bank whereby a portion of the custodian’s fees is paid indirectly by credits earned on the Fund’s cash on deposit with the bank. The amount is shown as a reduction of expenses in the Statement of Operations.
(i) Federal and other taxes. It is the Fund’s policy to comply with the federal income and excise tax requirements of the Internal Revenue Code of 1986 (the “Code”), as amended, applicable to regulated investment companies. Accordingly, the Fund intends to distribute its taxable income and net realized gains, if any, to shareholders in accordance with timing requirements imposed by the Code. Therefore, no federal or state income tax provision is required in the Fund’s financial statements.
Management has analyzed the Fund’s tax positions taken on income tax returns for all open tax years and has concluded that as of September 30, 2010, no provision for income tax is required in the Fund’s financial statements. The Fund’s federal and state income and federal excise tax returns for tax years for which the applicable statutes of limitations have not expired are subject to examination by Internal Revenue Service and state departments of revenue.
Under the applicable foreign tax laws, a withholding tax may be imposed on interest, dividends and capital gains at various rates.
(j) Reclassification. GAAP requires that certain components of net assets be reclassified to reflect permanent differences between financial and tax reporting. These reclassifications have no effect on net assets or net asset value per share. During the current year, the following reclassifications have been made:
| | | | | | | | | | | | |
| | | Undistributed Net
Investment Income | | | Accumulated Net
Realized Gain | | | Paid-in
Capital | |
| (a) | | $ | 4,027 | | | | — | | | $ | (4,027) | |
| (b) | | | (6) | | | | $6 | | | | — | |
| (a) | Reclassifications are primarily due to a non-deductible excise tax paid by the Fund and non-deductible organization costs for tax purposes. |
| (b) | Reclassifications are primarily due to foreign currency transactions treated as ordinary income for tax purposes. |
2. Management agreement and other transactions with affiliates
Legg Mason Partners Fund Advisor, LLC (“LMPFA”) is the Fund’s investment manager. Legg Mason Global Asset Allocation, LLC (“LMGAA”) is the Fund’s investment adviser. Barrett Associates, Inc. (“Barrett”), ClearBridge Advisors, LLC (“ClearBridge”), Batterymarch Financial Management, Inc. (“Batterymarch”) and Legg Mason Capital Management, Inc. (“LMCM”) are the Fund’s subadvisers. LMPFA, LMGAA, Barrett, ClearBridge, Batterymarch and LMCM are wholly-owned subsidiaries of Legg Mason, Inc. (“Legg Mason”). Batterymarch and LMCM did not manage any portion of the Fund’s assets during the fiscal period.
Under the management agreement, the Fund pays a management fee, calculated daily and paid monthly, in accordance with the following breakpoint schedule:
| | | | |
| Average Daily Net Assets | | Annual Rate | |
| First $1 billion | | | 0.750 | % |
| Next $1 billion | | | 0.725 | |
| Next $3 billion | | | 0.700 | |
| Next $5 billion | | | 0.675 | |
| Over $10 billion | | | 0.650 | |
LMPFA provides administrative and certain oversight services to the Fund. LMPFA delegates to LMGAA and the subadvisers the day-to-day portfolio management of the Fund. LMGAA is responsible for allocation management as well as managing a portion of the Fund’s assets.
LMPFA pays the investment adviser and the subadvisers 70% of the net management fee it receives from the Fund. LMGAA receives a portion of the net management fee for allocation management. LMGAA and
| | | | |
| Legg Mason Manager Select Large Cap Growth Fund 2010 Annual Report | | | 19 | |
the subadvisers are then paid the remaining net management fee based on the percentage of total assets each manages.
As a result of an expense limitation agreement between the Fund and LMPFA, the ratio of expenses other than brokerage, interest, dividend expense on short sales, taxes and extraordinary expenses, to average net assets of Class I shares will not exceed 0.90% until December 31, 2011. This expense limitation agreement cannot be terminated prior to December 31, 2011 without the Board of Trustees’ consent.
During the period ended September 30, 2010, fees waived and/or expenses reimbursed amounted to $237,722.
The manager is permitted to recapture amounts previously forgone or reimbursed to a class within three years after the year in which the manager earned the fee or incurred the expense if the class’ total annual operating expenses have fallen to a level below the expense limitation (“expense cap”) in effect at the time the fees were earned or the expenses incurred. In no case will the manager recapture any amount that would result, on any particular business day of the Fund, in the class’ total annual operating expenses exceeding the expense cap or any other lower limit then in effect.
Pursuant to this agreement, at September 30, 2010, the Fund had remaining fee waivers and expense reimbursements subject to recapture by LMPFA and date of expiration as follows:
| | | | |
| | | Class I | |
| Expires September 30, 2013 | | $ | 237,722 | |
| Fee waivers/expense reimbursements subject to recapture | | $ | 237,722 | |
For the period ended September 30, 2010, LMPFA did not recapture any fees.
Legg Mason Investor Services, LLC, a wholly-owned broker-dealer subsidiary of Legg Mason, serves as the Fund’s sole and exclusive distributor.
Under a Deferred Compensation Plan (the “Plan”), Trustees may elect to defer receipt of all or a specified portion of their compensation. A participating trustee may select one or more funds managed by affiliates of Legg Mason in which his or her deferred trustee’s fees will be deemed to be invested. Deferred amounts remain in the fund until distributed in accordance with the Plan.
All officers and two Trustees of the Trust are employees of Legg Mason or its affiliates and do not receive compensation from the Trust.
As of September 30, 2010, Legg Mason and its affiliates owned 100% of the Fund.
3. Investments
During the period ended September 30, 2010, the aggregate cost of purchases and proceeds from sales of investments (excluding short-term investments) were as follows:
| | | | |
| Purchases | | $ | 2,010,316 | |
| Sales | | | 561,148 | |
At September 30, 2010, the aggregate gross unrealized appreciation and depreciation of investments for federal income tax purposes were as follows:
| | | | |
| Gross unrealized appreciation | | $ | 160,180 | |
| Gross unrealized depreciation | | | (51,789) | |
| Net unrealized appreciation | | $ | 108,391 | |
4. Derivative instruments and hedging activities
Financial Accounting Standards Board Codification Topic 815 requires enhanced disclosure about an entity’s derivative and hedging activities.
During the period ended September 30, 2010, the Fund did not invest in any derivative instruments
| | |
| 20 | | Legg Mason Manager Select Large Cap Growth Fund 2010 Annual Report |
Notes to financial statements (cont’d)
5. Shares of beneficial interest
At September 30, 2010, the Trust had an unlimited number of shares of beneficial interest authorized with a par value of $0.00001 per share. The Fund has the ability to issue multiple classes of shares. Each class of shares represents an identical interest and has the same rights, except that each class bears certain direct expenses specifically related to the distribution of its shares.
Transactions in Class I shares of the Fund were as follows:
| | | | |
| | | Period Ended
September 30, 2010† | |
| Shares sold | | | 125,000 | |
| Net increase | | | 125,000 | |
| † | For the period December 1, 2009 (inception date) to September 30, 2010. |
6. Income tax information and distributions to shareholders
The Fund did not make any distributions during the period ended September 30, 2010.
As of September 30, 2010, the components of accumulated earnings on a tax basis were as follows:
| | | | |
| Undistributed ordinary income — net | | $ | 10,927 | |
| Other book/tax temporary differences(a) | | | (2,340) | |
| Unrealized appreciation (depreciation)(b) | | | 108,400 | |
| Total accumulated earnings (losses) — net | | $ | 116,987 | |
| (a) | Other book/tax temporary differences are attributable primarily to book/tax differences in the timing of the deductibility of various expenses. |
| (b) | The difference between book-basis and tax-basis unrealized appreciation (depreciation) is attributable primarily to the tax deferral of losses on wash sales. |
| | | | |
| Legg Mason Manager Select Large Cap Growth Fund 2010 Annual Report | | | 21 | |
Report of independent registered public accounting firm
To the Board of Trustees of Legg Mason Global Asset Management Trust and Shareholders of Legg Mason Manager Select Large Cap Growth Fund:
In our opinion, the accompanying statement of assets and liabilities, including the schedule of investments, and the related statements of operations and of changes in net assets and the financial highlights present fairly, in all material respects, the financial position of Legg Mason Manager Select Large Cap Growth Fund (one of the funds comprising Legg Mason Global Asset Management Trust, the “Fund”) at September 30, 2010, the results of its operations, the changes in its net assets, and the financial highlights for the period presented, in conformity with accounting principles generally accepted in the United States of America. These financial statements and financial highlights (hereafter referred to as “financial statements”) are the responsibility of the Fund’s management; our responsibility is to express an opinion on these financial statements based on our audit. We conducted our audit of these financial statements in accordance with the standards of the Public Company Accounting Oversight Board (United States). Those standards require that we plan and perform the audit to obtain reasonable assurance about whether the financial statements are free of material misstatement. An audit includes examining, on a test basis, evidence supporting the amounts and disclosures in the financial statements, assessing the accounting principles used and significant estimates made by management, and evaluating the overall financial statement presentation. We believe that our audit, which included confirmation of securities at September 30, 2010 by correspondence with the custodian, provide a reasonable basis for our opinion.
PricewaterhouseCoopers LLP
Baltimore, Maryland
November 16, 2010
| | |
| 22 | | Legg Mason Manager Select Large Cap Growth Fund |
Additional information (unaudited)
Information about Trustees and Officers
The business and affairs of Legg Mason Manager Select Large Cap Growth Fund (the “Fund”) are conducted by management under the supervision and subject to the direction of its Board of Trustees. The business address of each Trustee is 100 International Drive, Attn: Fund Secretary, Baltimore, Maryland 21202. Information pertaining to the Trustees and Officers of the Fund is set forth below.
The Statement of Additional Information includes additional information about Trustees and is available, without charge, upon request by calling Institutional Shareholder Services at 1-888-425-6432.
| | |
| Independent Trustees1 |
|
| Ruby P. Hearn |
| |
| Year of birth | | 1940 |
| Position with Trust | | Trustee |
| Term of office and length of time served2 | | Since 2009 |
| Principal occupation(s) during past five years | | Senior Vice President Emerita of The Robert Wood Johnson Foundation (non-profit) since 2001; Trustee of the New York Academy of Medicine since 2004; Director of the Institute for Healthcare Improvement since 2002; Member of the Institute of Medicine since 1982; formerly: Senior Vice President of The Robert Wood Johnson Foundation (1996 to 2001); Fellow of The Yale Corporation (1992 to 1998). |
| Number of funds in fund complex overseen by Trustee | | 16 |
| Other directorships held by Trustee during past five years | | None |
|
| Arnold L. Lehman |
| |
| Year of birth | | 1944 |
| Position with Trust | | Lead Independent Trustee |
| Term of office and length of time served2 | | Since 2009 |
| Principal occupation(s) during past five years | | Director of the Brooklyn Museum since 1997; Trustee of American Federation of Arts since 1998. Formerly: Director of The Baltimore Museum of Art (1979 to 1997). |
| Number of funds in fund complex overseen by Trustee | | 16 |
| Other directorships held by Trustee during past five years | | None |
|
| Robin J.W. Masters |
| |
| Year of birth | | 1955 |
| Position with Trust | | Trustee |
| Term of office and length of time served2 | | Since 2009 |
| Principal occupation(s) during past five years | | Retired; formerly: Chief Investment Officer of ACE Limited (insurance) (1986 to 2000). |
| Number of funds in fund complex overseen by Trustee | | 16 |
| Other directorships held by Trustee during past five years | | Director of Cheyne Capital International Limited (investment advisory firm). Director/Trustee of Legg Mason Institutional Funds plc, WA Fixed Income Funds plc and Western Asset Debt Securities Fund plc. |
|
| Jill E. McGovern |
| |
| Year of birth | | 1944 |
| Position with Trust | | Trustee |
| Term of office and length of time served2 | | Since 2009 |
| Principal occupation(s) during past five years | | Senior Consultant, American Institute for Contemporary German Studies (AICGS) since 2007; formerly: Chief Executive Officer of The Marrow Foundation (non-profit) (1993 to 2007); Executive Director of the Baltimore International Festival (1991 to 1993); Senior Assistant to the President of The Johns Hopkins University (1986 to 1990). |
| Number of funds in fund complex overseen by Trustee | | 16 |
| Other directorships held by Trustee during past five years | | Director of International Biomedical Research Alliance; Director of Lois Roth Endowment |
| | | | |
| Legg Mason Manager Select Large Cap Growth Fund | | | 23 | |
| | |
| Independent Trustees1 cont’d |
|
| Arthur S. Mehlman |
| |
| Year of birth | | 1942 |
| Position with Trust | | Trustee |
| Term of office and length of time served2 | | Since 2009 |
| Principal occupation(s) during past five years | | Retired. Director, The University of Maryland Foundation since 1992; Director, The League for People with Disabilities since 2003; formerly: Partner, KPMG LLP (international accounting firm) (1972 to 2002). |
| Number of funds in fund complex overseen by Trustee | | Director/Trustee of all Legg Mason Funds consisting of 16 portfolios; Director/Trustee of the Royce Family of Funds consisting of 30 portfolios. |
| Other directorships held by Trustee during past five years | | Director of Municipal Mortgage & Equity, LLC. |
|
| G. Peter O’Brien |
| |
| Year of birth | | 1945 |
| Position with Trust | | Trustee |
| Term of office and length of time served2 | | Since 2009 |
| Principal occupation(s) during past five years | | Retired. Trustee Emeritus of Colgate University; Board Member, Hill House, Inc. (residential home care); Board Member, Bridges School (pre- school); formerly: Managing Director, Equity Capital Markets Group of Merrill Lynch & Co. (1971-1999). |
| Number of funds in fund complex overseen by Trustee | | Director/Trustee of all Legg Mason funds consisting of 16 portfolios; Director/Trustee of the Royce Family of Funds consisting of 30 portfolios. |
| Other directorships held by Trustee during past five years | | Director of Technology Investment Capital Corp. |
|
| S. Ford Rowan |
| |
| Year of birth | | 1943 |
| Position with Trust | | Trustee |
| Term of office and length of time served2 | | Since 2009 |
| Principal occupation(s) during past five years | | Chairman, National Center for Critical Incident Analysis, National Defense University Foundation, since 2004; Trustee, St. John’s College, since 2006; formerly: Consultant, Rowan & Blewitt Inc. (management consulting) (1984 to 2007); Lecturer in Journalism, Northwestern University (1980 to 1993); Lecturer in Organizational Sciences, George Washington University (2000 to 2008); Director, Sante Fe Institute (1999 to 2008). |
| Number of funds in fund complex overseen by Trustee | | 16 |
| Other directorships held by Trustee during past five years | | None |
|
| Robert M. Tarola |
| |
| Year of birth | | 1950 |
| Position with Trust | | Trustee |
| Term of office and length of time served2 | | Since 2009 |
| Principal occupation(s) during past five years | | President of Right Advisory LLC (corporate finance and governance consulting) since 2008; Member, Investor Advisory Group of the Public Company Accounting Oversight Board since 2009; Executive Vice President and Chief Financial Officer of The Howard University since 2010 (higher education and health care); formerly: Senior Vice President and Chief Financial Officer of W.R. Grace & Co. (specialty chemicals) (1999 to 2008) and MedStar Health, Inc. (healthcare) (1996 to 1999); Partner, Price Waterhouse, LLP (accounting and auditing) (1984 to 1996). |
| Number of funds in fund complex overseen by Trustee | | 16 |
| Other directorships held by Trustee during past five years | | Director of TeleTech Holdings, Inc. (business process outsourcing); Director of American Kidney Fund (renal disease assistance) |
| | |
| 24 | | Legg Mason Manager Select Large Cap Growth Fund |
Additional information (unaudited) (cont’d)
Information about Trustees and Officers
| | |
| Interested Trustees3 |
|
| Mark R. Fetting |
| |
| Year of birth | | 1954 |
| Position with Trust | | Chairman and Trustee |
| Term of office and length of time served2 | | Since 2009 |
| Principal occupation(s) during past five years | | President, CEO, Chairman and Director of Legg Mason, Inc. and Chairman of Legg Mason Funds since 2008; formerly: President of all Legg Mason Funds (2001 to 2008). Senior Executive Vice President of Legg Mason, Inc., Director and/or officer of various Legg Mason, Inc. affiliates (2000 to 2008). Division President and Senior Officer of Prudential Financial Group, Inc. and related companies, including fund boards and consulting services to subsidiary companies (1991 to 2000) |
| Number of funds in fund complex overseen by Trustee | | Chairman and Director/Trustee of all Legg Mason Funds consisting of 16 portfolios; Director/Trustee of the Royce Family of Funds consisting of 30 portfolios. |
| Other directorships held by Trustee during past five years | | None |
|
| David R. Odenath |
| |
| Year of birth | | 1957 |
| Position with Trust | | President and Trustee |
| Term of office and length of time served2 | | Since 2009 |
| Principal occupation(s) during past five years | | Senior Executive Vice President of Legg Mason, Inc. and President of Legg Mason Funds since 2008; formerly: President of Prudential Annuities (2002 to 2008); Executive Vice President (2003 to 2008) of American Skandia Investment Services, Inc; Chief Executive Officer and Director (2003 to 2008) of American Skandia Life Assurance Corporation, American Skandia Information Services and Technology Corporation and Skandia U.S. Inc.; President, Chief Executive Officer and Director (2003 to 2008) of American Skandia Marketing, Inc.; President, Chief Executive Officer, Chief Operating Officer and Officer-In-Charge (1999 to 2003) of Prudential Investments; Senior Vice President (1999 to 2008) of Prudential Financial, Inc.; Senior Vice President (1993 to 1999) of PaineWebber Group, Inc. (investment banking). |
| Number of funds in fund complex overseen by Trustees | | 16 |
| Other directorships held by Trustee during past five years | | None |
| Executive Officers |
| |
R. Jay Gerken, CFA Legg Mason 620 Eighth Avenue, New York, NY 10018 | | |
| |
| Year of birth | | 1951 |
| Position(s) with Trust | | Vice President |
| Term of office and length of time served2 | | Since 2009 |
| Principal occupation(s) during past five years | | Managing Director of Legg Mason & Co., LLC (“Legg Mason & Co.”) (since 2005); Officer and Trustee/Director of 149 funds associated with Legg Mason Partners Fund Advisor, LLC (“LMPFA”) or its affiliates (since 2006) and Legg Mason & Co. predecessors (prior to 2006); President and Chief Executive Officer (“CEO”) of LMPFA (since 2006); President and CEO of Smith Barney Fund Management LLC (“SBFM”) and Citi Fund Management, Inc. (“CFM”) (formerly registered investment advisers) (since 2002); formerly, Chairman, President and CEO, Travelers Investment Adviser Inc. (prior to 2005) |
| | | | |
| Legg Mason Manager Select Large Cap Growth Fund | | | 25 | |
| | |
| Executive Officers cont’d |
| |
Kaprel Ozsolak Legg Mason 55 Water Street, New York, NY 10041 | | |
| |
| Year of birth | | 1965 |
| Position(s) with Trust | | Chief Financial Officer |
| Term of office and length of time served2 | | Since 2009 |
| Principal occupation(s) during past five years | | Director of Legg Mason & Co. (since 2005); Chief Financial Officer of certain mutual funds associated with Legg Mason & Co. or its affiliates (since 2007) and Legg Mason & Co. predecessors (prior to 2007); formerly, Treasurer of certain mutual funds associated with Legg Mason & Co. or its affiliates (prior to 2010) and Legg Mason & Co. predecessors (prior to 2005); formerly, Controller of certain mutual funds associated with Legg Mason & Co. predecessors (prior to 2004) |
| |
Robert I. Frenkel
Legg Mason
100 First Stamford Place, Stamford, CT 06902 | | |
| |
| Year of birth | | 1954 |
| Position(s) with Trust | | Secretary and Chief Legal Officer |
| Term of office and length of time served2 | | Since 2009 |
| Principal occupation(s) during past five years | | Vice President and Deputy General Counsel of Legg Mason (since 2006); Managing Director and General Counsel of Global Mutual Funds for Legg Mason & Co. (since 2006) and Legg Mason & Co. predecessors (since 1994); Secretary and Chief Legal Officer of certain mutual funds associated with Legg Mason & Co. or its affiliates (since 2006) and Legg Mason & Co. predecessors (prior to 2006) |
| |
Ted P. Becker
Legg Mason
620 Eighth Avenue, New York, NY 10018 | | |
| |
| Year of birth | | 1951 |
| Position(s) with Trust | | Vice President and Chief Compliance Officer |
| Term of office and length of time served2 | | Since 2009 |
| Principal occupation(s) during past five years | | Director of Global Compliance at Legg Mason (since 2006); Chief Compliance Officer of LMPFA (since 2006); Managing Director of Compliance of Legg Mason & Co. (since 2005); Chief Compliance Officer of certain mutual funds associated with Legg Mason & Co. or its affiliates (since 2006) and Legg Mason & Co. predecessors (prior to 2006) |
| |
Christopher Berarducci Legg Mason 55 Water Street, New York, NY 10041 | | |
| |
| Year of birth | | 1974 |
| Position(s) with Trust | | Treasurer |
| Term of office and length of time served2 | | Since 2010 |
| Principal occupation(s) during past five years | | Assistant Vice President of Legg Mason & Co. (since 2007); Treasurer of certain mutual funds associated with LMPFA (since 2010); Assistant Controller of certain mutual funds associated with LMPFA (prior to 2010); Manager of Fund Administration at UBS Global Asset Management (prior to 2007); Assistant Vice President and Manager of Fund Administration at JP Morgan Chase & Co. (prior to 2005) |
| 1 | Trustees who are not “interested persons” of the Fund within the meaning of Section 2(a)(19) of the 1940 Act. Each of the Independent Trustees serves on the standing committees of the Board of Trustees, which include the Audit Committee (chair: Arthur Mehlman), the Nominating Committee (co-chairs: Peter O’Brien and Jill McGovern), and the Independent Trustees Committee (chair: Arnold Lehman). |
| 2 | Officers of the Trust are elected to serve until their successors are elected and qualified. Trustees of the Trust serve a term of indefinite length until their retirement, in accordance with the Board’s retirement policy, resignation or removal, and stand for re-election by shareholders only as and when required by the 1940 Act. |
| 3 | Mr. Fetting and Mr. Odenath are considered to be interested persons, as defined in the 1940 Act, of the Trust on the basis of their current employment with the Fund’s investment adviser or its affiliated entities (including the Trust’s principal underwriter) and Legg Mason, Inc., the parent holding company of these entities as well as their ownership of Legg Mason, Inc. stock. |
Legg Mason Manager Select
Large Cap Growth Fund
Trustees
Mark R. Fetting
Chairman
David R. Odenath
President
Ruby P. Hearn
Arnold L. Lehman
Robin J.W. Masters
Jill E. McGovern
Arthur S. Mehlman
G. Peter O’Brien
S. Ford Rowan
Robert M. Tarola
Manager
Legg Mason Partners Fund Advisor, LLC
Adviser
Legg Mason Global Asset Allocation, LLC
Subadvisers
Barrett Associates, Inc.
Batterymarch Financial Management, Inc.
ClearBridge Advisors, LLC
Legg Mason Capital Management, Inc.
Distributor
Legg Mason Investor Services, LLC
Custodian
State Street Bank and Trust Company
Transfer agent
Boston Financial Data Services, Inc.
2000 Crown Colony Drive
Quincy, MA 02169
Independent registered public accounting firm
PricewaterhouseCoopers LLP
Baltimore, MD
Privacy policy
We are committed to keeping nonpublic personal information about you secure and confidential. This notice is intended to help you understand how we fulfill this commitment. From time to time, we may collect a variety of personal information about you, including:
| Ÿ | | Information we receive from you on applications and forms, via the telephone, and through our websites; |
| Ÿ | | Information about your transactions with us, our affiliates, or others (such as your purchases, sales, or account balances); and |
| Ÿ | | Information we receive from consumer reporting agencies. |
We do not disclose nonpublic personal information about our customers or former customers, except to our affiliates (such as broker-dealers or investment advisers within the Legg Mason family of companies) or as is otherwise permitted by applicable law or regulation. For example, we may share this information with others in order to process your transactions or service an account. We may also provide this information to companies that perform marketing services on our behalf, such as printing and mailing, or to other financial institutions with whom we have joint marketing agreements. When we enter into such agreements, we will require these companies to protect the confidentiality of this information and to use it only to perform the services for which we hired them.
With respect to our internal security procedures, we maintain physical, electronic, and procedural safeguards to protect your nonpublic personal information, and we restrict access to this information.
If you decide at some point either to close your account(s) or become an inactive customer, we will continue to adhere to our privacy policies and practices with respect to your nonpublic personal information.
NOT PART OF THE ANNUAL REPORT
Legg Mason Manager Select Large Cap Growth Fund
The Fund is a separate investment series of Legg Mason Global Asset Management Trust, a Maryland
statutory trust.
Legg Mason Manager Select Large Cap Growth Fund
Legg Mason Funds
55 Water Street
New York, NY 10041
The Fund files its complete schedule of portfolio holdings with the Securities and Exchange Commission (“SEC”) for the first and third quarters of each fiscal year on Form N-Q. The Fund’s Forms N-Q are available on the SEC’s website at www.sec.gov. The Fund’s Forms N-Q may be reviewed and copied at the SEC’s Public Reference Room in Washington, D.C., and information on the operation of the Public Reference Room may be obtained by calling 1-800-SEC-0330. To obtain information on Form N-Q from the Fund, shareholders can call Institutional Shareholder Services at 1-888-425-6432.
Information on how the Fund voted proxies relating to portfolio securities during the prior 12-month period ended June 30th of each year and a description of the policies and procedures that the Fund uses to determine how to vote proxies related to portfolio transactions are available (1) without charge, upon request, by calling Institutional Shareholder Services at 1-888-425-6432, (2) on the Fund’s website at www.leggmason.com/individualinvestors and (3) on the SEC’s website at www.sec.gov.
This report is submitted for the general information of the shareholders of Legg Mason Manager Select Large Cap Growth Fund. This report is not authorized for distribution to prospective investors in the Fund unless preceded or accompanied by a current prospectus.
Investors should consider the Fund’s investment objectives, risks, charges and expenses carefully before investing. The prospectus contains this and other important information about the Fund. Please read the prospectus carefully before investing.
www.leggmason.com/individualinvestors
© 2010 Legg Mason Investor Services, LLC
Member FINRA, SIPC
LMFX012988 11/10 SR10-1232
The registrant has adopted a code of ethics that applies to the registrant’s principal executive officer, principal financial officer, principal accounting officer or controller.
| ITEM 3. | AUDIT COMMITTEE FINANCIAL EXPERT. |
The Board of Trustees of the registrant has determined that Arthur S. Mehlman the Chairman of the Board’s Audit Committee and Robert M. Tarola, possess the technical attributes identified in Instruction 2(b) of Item 3 to Form N-CSR to qualify as “audit committee financial experts,” and have designated Mr. Mehlman and Mr. Tarola as the Audit Committee’s financial experts. Mr. Mehlman and Mr. Tarola are “independent” Trustees pursuant to paragraph (a) (2) of Item 3 to Form N-CSR.
| ITEM 4. | PRINCIPAL ACCOUNTANT FEES AND SERVICES. |
a) Audit Fees. The aggregate fees billed in the last two fiscal years ending September 30, 2009 and September 30, 2010 (the “Reporting Periods”) for professional services rendered by the Registrant’s principal accountant (the “Auditor”) for the audit of the Registrant’s annual financial statements, or services that are normally provided by the Auditor in connection with the statutory and regulatory filings or engagements for the Reporting Periods, were $0 in 2009 and $6,667 in 2010.
b) Audit-Related Fees. The aggregate fees billed in the Reporting Period for assurance and related services by the Auditor that are reasonably related to the performance of the Registrant’s financial statements were $0 in 2009 and $0 in 2010. These services consisted of procedures performed in connection with the Re-domiciliation of the various reviews of Prospectus supplements, and consent issuances related to the N-1A filings for the Legg Mason Global Asset Management Trust.
In addition, there were no Audit-Related Fees billed in the Reporting Period for assurance and related services by the Auditor to the Registrant’s investment adviser (not including any sub-adviser whose role is primarily portfolio management and is subcontracted with or overseen by another investment adviser), and any entity controlling, controlled by or under common control with the investment adviser that provides ongoing services to the Legg Mason Global Asset Management Trust (“service affiliates”), that were reasonably related to the performance of the annual audit of the service affiliates. Accordingly, there were no such fees that required pre-approval by the Audit Committee for the Reporting Periods.
(c) Tax Fees. The aggregate fees billed in the Reporting Periods for professional services rendered by the Auditor for tax compliance, tax advice and tax planning (“Tax Services”) were $0 in 2009 and $0 in 2010. These services consisted of (i) review or preparation of U.S. federal, state, local and excise tax returns; (ii) U.S. federal, state and local tax planning, advice and assistance regarding statutory, regulatory or administrative developments, and (iii) tax advice regarding tax qualification matters and/or treatment of various financial instruments held or proposed to be acquired or held.
There were no fees billed for tax services by the Auditors to service affiliates during the Reporting Periods that required pre-approval by the Audit Committee.
d) All Other Fees. There were no other fees billed in the Reporting Periods for products and services provided by the Auditor, other than the services reported in paragraphs (a) through (c) of this Item for the Legg Mason Global Asset Management Trust.
All Other Fees. There were no other non-audit services rendered by the Auditor to Legg Mason Partners Fund Advisors, LLC (“LMPFA”), and any entity controlling, controlled by or under common control with LMPFA that provided ongoing services to Legg Mason Global Asset Management Trust requiring pre-approval by the Audit Committee in the Reporting Period.
(e) Audit Committee’s pre–approval policies and procedures described in paragraph (c)
(7) of Rule 2-01 of Regulation S-X.
(1) The Charter for the Audit Committee (the “Committee”) of the Board of each registered investment company (the “Fund”) advised by LMPFA or one of their affiliates (each, an “Adviser”) requires that the Committee shall approve (a) all audit and permissible non-audit services to be provided to the Fund and (b) all permissible non-audit services to be provided by the Fund’s independent auditors to the Adviser and any Covered Service Providers if the engagement relates directly to the operations and financial reporting of the Fund. The Committee may implement policies and procedures by which such services are approved other than by the full Committee.
The Committee shall not approve non-audit services that the Committee believes may impair the independence of the auditors. As of the date of the approval of this Audit Committee Charter, permissible non-audit services include any professional services (including tax services), that are not prohibited services as described below, provided to the Fund by the independent auditors, other than those provided to the Fund in connection with an audit or a review of the financial statements of the Fund. Permissible non-audit services may not include: (i) bookkeeping or other services related to the accounting records or financial statements of the Fund; (ii) financial information systems design and implementation; (iii) appraisal or valuation services, fairness opinions or contribution-in-kind reports; (iv) actuarial services; (v) internal audit outsourcing services; (vi) management functions or human resources; (vii) broker or dealer, investment adviser or investment banking services; (viii) legal services and expert services unrelated to the audit; and (ix) any other service the Public Company Accounting Oversight Board determines, by regulation, is impermissible.
Pre-approval by the Committee of any permissible non-audit services is not required so long as: (i) the aggregate amount of all such permissible non-audit services provided to the Fund, the Adviser and any service providers controlling, controlled by or under common control with the Adviser that provide ongoing services to the Fund (“Covered Service Providers”) constitutes not more than 5% of the total amount of revenues paid to the independent auditors during the fiscal year in which the permissible non-audit services are provided to (a) the Fund, (b) the Adviser and (c) any entity controlling, controlled by or under common control with the Adviser that provides ongoing services to the Fund during the fiscal year in which the services are provided that would have to be approved by the Committee; (ii) the permissible non-audit services were not recognized by the Fund at the time of the engagement to be non-audit services; and (iii) such services are promptly brought to the attention of the Committee and approved by the Committee (or its delegate(s)) prior to the completion of the audit.
(2) For the Legg Mason Global Asset Management Trust, the percentage of fees that were approved by the audit committee, with respect to: Audit-Related Fees were 100% and 100% for 2009 and 2010; Tax Fees were 100% and 100% for 2009 and 2010; and Other Fees were 100% and 100% for 2009 and 2010.
(f) N/A
(g) Non-audit fees billed by the Auditor for services rendered to Legg Mason Global Asset Management Trust, LMPFA and any entity controlling, controlled by, or under common control with LMPFA that provides ongoing services to Legg Mason Global Asset Management Trust during the reporting period were $0 in 2010.
(h) Yes. Legg Mason Global Asset Management Trust’s Audit Committee has considered whether the provision of non-audit services that were rendered to Service Affiliates, which were not pre-approved (not requiring pre-approval), is compatible with maintaining the Accountant’s independence. All services provided by the Auditor to the Legg Mason Global Asset Management Trust or to Service Affiliates, which were required to be pre-approved, were pre-approved as required.
| ITEM 5. | AUDIT COMMITTEE OF LISTED REGISTRANTS. |
| | a) | The independent board members are acting as the registrant’s audit committee as specified in Section 3(a)(58)(B) of the Exchange Act. The Audit Committee consists of the following Board members: |
Ruby P. Hearn
Arnold L. Lehman
Robin J.W. Masters
Jill E. McGovern
Arthur S. Mehlman
G. Peter O’Brien
S. Ford Rowan
Robert M. Tarola
| ITEM 6. | SCHEDULE OF INVESTMENTS. |
Included herein under Item 1.
| ITEM 7. | DISCLOSURE OF PROXY VOTING POLICIES AND PROCEDURES FOR CLOSED-END MANAGEMENT INVESTMENT COMPANIES. |
Not applicable.
| ITEM 8. | PORTFOLIO MANAGERS OF CLOSED-END MANAGEMENT INVESTMENT COMPANIES. |
Not applicable.
| ITEM 9. | PURCHASES OF EQUITY SECURITIES BY CLOSED-END MANAGEMENT INVESTMENT COMPANY AND AFFILIATED PURCHASERS. |
Not applicable.
| ITEM 10. | SUBMISSION OF MATTERS TO A VOTE OF SECURITY HOLDERS. |
Not applicable.
| ITEM 11. | CONTROLS AND PROCEDURES. |
| | (a) | The registrant’s principal executive officer and principal financial officer have concluded that the registrant’s disclosure controls and procedures (as defined in Rule 30a- 3(c) under the Investment Company Act of 1940, as amended (the “1940 Act”)) are effective as of a date within 90 days of the filing date of this report that includes the disclosure required by this paragraph, based on their evaluation of the disclosure controls and procedures required by Rule 30a-3(b) under the 1940 Act and 15d-15(b) under the Securities Exchange Act of 1934. |
| | (b) | There were no changes in the registrant’s internal control over financial reporting (as defined in Rule 30a-3(d) under the 1940 Act) that occurred during the registrant’s last fiscal half-year (the registrant’s second fiscal half-year in the case of an annual report) that have materially affected, or are likely to materially affect the registrant’s internal control over financial reporting. |
(a) (1) Code of Ethics attached hereto.
Exhibit 99.CODE ETH
(a) (2) Certifications pursuant to section 302 of the Sarbanes-Oxley Act of 2002 attached hereto.
Exhibit 99.CERT
(b) Certifications pursuant to Section 906 of the Sarbanes-Oxley Act of 2002 attached hereto.
Exhibit 99.906CERT
SIGNATURES
Pursuant to the requirements of the Securities Exchange Act of 1934 and the Investment Company Act of 1940, the registrant has duly caused this Report to be signed on its behalf by the undersigned, there unto duly authorized.
| | |
| Legg Mason Global Asset Management Trust |
| |
| By: | | /S/ DAVID R. ODENATH |
| | (David R. Odenath) |
| | President and Trustee of |
| | Legg Mason Global Asset Management Trust |
Date: November 22, 2010
Pursuant to the requirements of the Securities Exchange Act of 1934 and the Investment Company Act of 1940, this report has been signed below by the following persons on behalf of the registrant and in the capacities and on the dates indicated.
| | |
| By: | | /S/ DAVID R. ODENATH |
| | (David R. Odenath) |
| | President and Trustee of |
| | Legg Mason Global Asset Management Trust |
Date: November 22, 2010
| | |
| By: | | /S/ KAPREL OZSOLAK |
| | (Kaprel Ozsolak) |
| | Chief Financial Officer of |
| | Legg Mason Global Asset Management Trust |
Date: November 22, 2010