UNITED STATES
SECURITIES AND EXCHANGE COMMISSION
Washington, D.C. 20549
FORM N-CSR
CERTIFIED SHAREHOLDER REPORT OF REGISTERED
MANAGEMENT INVESTMENT COMPANIES
Investment Company Act file number 811-22338
|
| Legg Mason Global Asset Management Trust |
(Exact name of registrant as specified in charter)
|
| 55 Water Street, New York, NY 10041 |
(Address of principal executive offices) (Zip code)
|
Robert I. Frenkel, Esq. Legg Mason & Co., LLC 100 First Stamford Place Stamford, CT 06902 |
(Name and address of agent for service)
Registrant’s telephone number, including area code: 1-877-721-1926
Date of fiscal year end: November 30
Date of reporting period: November 30, 2010
| ITEM 1. | REPORT TO STOCKHOLDERS. |
The Annual Report to Stockholders is filed herewith.
November 30, 2010

Annual
Repor t
Legg Mason
Strategic Real
Return Fund
INVESTMENT PRODUCTS: NOT FDIC INSURED • NO BANK GUARANTEE • MAY LOSE VALUE
| | |
| II | | Legg Mason Strategic Real Return Fund |
Fund objective
The Fund seeks to provide an attractive long-term real return.
Dear Shareholder,
We are pleased to provide the annual report of Legg Mason Strategic Real Return Fund for the reporting period from the Fund’s inception on February 26, 2010 through November 30, 2010 (the “reporting period”). Please read on for a detailed look at prevailing economic and market conditions during the Fund’s reporting period and to learn how those conditions have affected Fund performance.
As always, we remain committed to providing you with excellent service and a full spectrum of investment choices. We also remain committed to supplementing the support you receive from your financial advisor. One way we accomplish this is through our website, www.leggmason.com/individualinvestors. Here you can gain immediate access to market and investment information, including:
| Ÿ | | Fund prices and performance, |
| Ÿ | | Market insights and commentaries from our portfolio managers, and |
| Ÿ | | A host of educational resources. |
We look forward to helping you meet your financial goals.
Sincerely,

Mark R. Fetting
Chairman
December 31, 2010
| | | | |
| Legg Mason Strategic Real Return Fund | | | III | |
Investment commentary
Economic review
While the U.S. economy continued to expand during the period from the Fund’s inception on February 26, 2010 through November 30, 2010 (the “reporting period”), economic data was mixed and unemployment remained elevated. The Federal Reserve Board (“Fed”)i expressed concerns regarding the direction of the economy and took additional actions in an attempt to spur growth. This initially caused investor sentiment to improve, but the financial markets declined toward the end of the reporting period given a re-escalation of the European sovereign debt crisis.
In September 2010, the National Bureau of Economic Research (“NBER”), the organization charged with determining when recessions start and end, announced that the recession that began in December 2007 had concluded in June 2009. However, the NBER said, “In determining that a trough occurred in June 2009, the committee did not conclude that economic conditions since that month have been favorable or that the economy has returned to operating at normal capacity.” The NBER’s point is well-taken given continued areas of weakness in the U.S. economy.
Although the U.S. Department of Commerce continued to report positive U.S. gross domestic product (“GDP”)ii growth, the expansion has moderated since peaking at 5.0% in the fourth quarter of 2009. A slower drawdown in business inventories and renewed consumer spending were contributing factors spurring the economy’s solid growth at the end of 2009. However, the economy has grown at a more modest pace thus far in 2010. According to the Commerce Department, GDP growth was 3.7% and 1.7% during the first and second quarters of 2010, respectively. GDP growth then edged somewhat higher to 2.6% in the third quarter.
Turning to the job market, after experiencing sharp job losses in 2009, the U.S.
Department of Labor reported that over one million new positions were added during the first five months of 2010. Included in that number, however, were 700,000 temporary government jobs tied to the 2010 Census. From June through September, more than 525,000 of these temporary positions were eliminated. This more than offset private sector growth and resulted in a total net loss of 300,000 jobs from June through September. The employment picture then brightened some-what in October, as 172,000 new jobs were created. Payrolls then increased a disappointing 39,000 in November and the unemployment rate inched up to end the period at 9.8%. The unemployment rate has now exceeded 9.0% since May 2009.
There was mixed news in the housing market during the period. According to the National Association of Realtors (“NAR”), existing-home sales increased 7.0% and 8.0% in March and April, respectively, after sales had fallen for the period from December 2009 through February 2010. The rebound was largely attributed to people rushing to take advantage of the government’s $8,000 tax credit for first-time home buyers that expired at the end of April. However, with the end of the tax credit, existing-home sales then declined from May through July. After a sharp 27.0% decline in sales in July, sales then rose 7.3% and 10.0% in August and September, respectively. Sales then dipped 2.2% in October and rose 5.6% in November. Looking at home prices, the NAR reported that the median existing-home price for all housing types was $170,600 in November 2010, which was 0.4% higher than in November 2009. Prices appeared to stabilize somewhat as the number of existing homes on the market declined in November. The inventory of unsold homes was a 9.5 month supply in November at the current sales level, versus a 10.5 month supply in October.
| | |
| IV | | Legg Mason Strategic Real Return Fund |
Investment commentary (cont’d)
One overall bright spot for the economy has been the manufacturing sector. Based on the Institute for Supply Management’s PMIiii, the manufacturing sector has grown sixteen consecutive months since it began expanding in August 2009. After reaching a six-year peak of 60.4 in April 2010, PMI data indicated somewhat more modest growth from May through July (a reading below 50 indicates a contraction, whereas a reading above 50 indicates an expansion). The manufacturing sector then expanded at a faster pace in August, before moderating somewhat in September. Manufacturing then grew in October at its fastest pace since May with a reading of 56.9 for the month, before dipping to 56.6 in November.
Financial market overview
Early in the reporting period, the financial markets were largely characterized by healthy investor risk appetite and solid results by stocks and lower-quality bonds. The market then experienced a sharp sell-off in late April and in May, during which risk aversion returned and investors flocked to the relative safety of U.S. Treasury securities. Demand for riskier assets had resumed by July, followed by another “flight to quality” in August. Risk appetite then returned in September and October before the financial markets again weakened beginning in mid-November.
Due to signs that economic growth was slowing toward the end of the reporting period, the Fed took further actions to spur the economy. At its August 10th meeting, the Fed announced an ongoing program that calls for using the proceeds from expiring agency debt and agency mortgage-backed securities to purchase longer-dated Treasury securities.
In addition, the Fed remained cautious throughout the reporting period given pockets of weakness in the economy. At its meeting in September 2010, the Fed said, “The Committee will continue to monitor
the economic outlook and financial developments and is prepared to provide additional accommodation if needed to support the economic recovery. . . .” This led to speculation that the Fed may again move to purchase large amounts of agency and Treasury securities in an attempt to avoid a double-dip recession and ward off deflation.
The Fed then took additional action in early November. Citing that “the pace of recovery in output and employment continues to be slow,” the Fed announced another round of quantitative easing to help stimulate the economy, entailing the purchase of $600 billion of long-term U.S. Treasury securities by the end of the second quarter of 2011. This, coupled with the Fed’s previously announced program to use the proceeds of expiring securities to purchase Treasuries, means it could buy a total of $850 billion to $900 billion of Treasury securities by the end of June 2011.
Equity market review
Stock prices, as measured by the S&P 500 Indexiv (the “Index”), moved higher during the first full two months covered by this report. The market’s ascent was the result of a number of factors, including optimism regarding the economy, better-than-expected corporate profits and increased investor risk appetite. However, robust investor appetite was replaced with heightened risk aversion in May and June. This was due to the escalating sovereign debt crisis in Europe, uncertainties regarding new financial reforms in the U.S. and some worse-than-expected economic data.
After reaching a nineteen-month high on April 23, 2010, the market, as measured by the Index, fell into “correction territory” in May and plunged more than 10%. This marked the first correction since November 2007. Despite continued disappointing economic data, strong second quarter corporate profits helped the market to rally in July. The market then declined again in
| | | | |
| Legg Mason Strategic Real Return Fund | | | V | |
August, triggered by fears that the economy might slip back into recession. With the Fed indicating the possibility of another round of quantitative easing, stock prices then moved sharply higher in September and October. After a strong start in November, the market weak-ened later in the month as financial troubles in Ireland resulted in a re-emergence of the European sovereign debt crisis. All told, the Index returned 8.52% during the reporting period.
Fixed-income market review
Continuing the trend that began in the second quarter of 2009, nearly every spread sector (non-Treasury) outperformed equal-durationv Treasuries during most of the first two full months of the reporting period. Over that time, investor confidence was high given encouraging economic data, continued low interest rates, benign inflation and rebounding corporate profits. Robust investor appetite was then replaced with heightened risk aversion toward the end of April and during the month of May. This was due to the escalating sovereign debt crisis in Europe, uncertainties regarding new financial reforms in the U.S. and some worse-than-expected economic data. Most spread sectors then produced positive absolute returns in June and July, as investor demand for these securities again increased. There was another bout of risk aversion in August, given fears that the economy may slip back into a recession. However, given expectations for additional quantitative easing, most spread sectors rallied in September and October. The spread sectors then ended the reporting period on a weak note due to the fallout from the European sovereign debt crisis.
Both short- and long-term Treasury yields fluctuated but, overall, moved lower during the reporting period. When the period began, two- and ten-year Treasury yields were 0.81% and 3.61%, respectively. On April 5, 2010, two- and ten-year Treasury yields peaked at 1.18% and 4.01%, respectively. Subsequent to hitting their highs for the period, yields
largely declined during much of the remainder of the reporting period. When the period ended on November 30, 2010, two-year Treasury yields were 0.45%, versus a low of 0.33% earlier in the month. Ten-year Treasury yields ended the period at 2.81%, which was higher than their trough of 2.41% that occurred in October. Longer-term yields moved higher toward the end of the period as fears of future inflation increased in light of the Fed’s additional policy accommodation. During the reporting period, the Barclays Capital U.S. Aggregate Indexvi returned 5.69%.
Inflation generally remained well-contained over the reporting period. During the twelve months ended November 30, 2010, the seasonally adjusted rate of inflation, as measured by the Consumer Price Index for All Urban Consumers (“CPI-U”)vii, was 1.1%. The CPI-U less food and energy was 0.8% over the same time frame. Despite tepid inflation, the price of gold, which is often a signal of rising prices, reached an all-time high of $1,421 an ounce in November 2010. Inflation-protected securities generated solid results during the reporting period, with the Barclays Capital U.S. TIPS Indexviii returning 7.51%. In contrast, the high-yield bond market, as measured by the Barclays Capital U.S. High Yield — 2% Issuer Cap Indexix, returned 11.29% and emerging market debt, as measured by the JPMorgan Emerging Markets Bond Index Global (“EMBI Global”)x, returned 10.44% over the reporting period.
As always, thank you for your confidence in our stewardship of your assets.
Sincerely,

R. Jay Gerken, CFA
Vice President
December 31, 2010
| | |
| VI | | Legg Mason Strategic Real Return Fund |
Investment commentary (cont’d)
All investments are subject to risk including the possible loss of principal. Past performance is no guarantee of future results. All index performance reflects no deduction for fees, expenses or taxes. Please note that an investor cannot invest directly in an index.
| i | The Federal Reserve Board (“Fed”) is responsible for the formulation of policies designed to promote economic growth, full employment, stable prices and a sustainable pattern of international trade and payments. |
| ii | Gross domestic product (“GDP”) is the market value of all final goods and services produced within a country in a given period of time. |
| iii | The Institute for Supply Management’s PMI is based on a survey of purchasing executives who buy the raw materials for manufacturing at more than 350 companies. It offers an early reading on the health of the manufacturing sector. |
| iv | The S&P 500 Index is an unmanaged index of 500 stocks and is generally representative of the performance of larger companies in the U.S. |
| v | Duration is the measure of the price sensitivity of a fixed-income security to an interest rate change of 100 basis points. Calculation is based on the weighted average of the present values for all cash flows. |
| vi | The Barclays Capital U.S. Aggregate Index is a broad-based bond index comprised of government, corporate, mortgage- and asset-backed issues, rated investment grade or higher, and having at least one year to maturity. |
| vii | The Consumer Price Index for All Urban Consumers (“CPI-U”) is a measure of the average change in prices over time of goods and services purchased by households, which covers approximately 87% of the total population and includes, in addition to wage earners and clerical worker households, groups such as professional, managerial and technical workers, the self-employed, short-term workers, the unemployed and retirees and others not in the labor force. |
| viii | The Barclays Capital U.S. TIPS Index represents an unmanaged market index made up of U.S. Treasury Inflation-Linked Index securities. |
| ix | The Barclays Capital U.S. High Yield — 2% Issuer Cap Index is an index of the 2% Issuer Cap component of the Barclays Capital U.S. Corporate High Yield Index, which covers the U.S. dollar-denominated, non-investment grade, fixed-rate, taxable corporate bond market. |
| x | The JPMorgan Emerging Markets Bond Index Global (“EMBI Global”) tracks total returns for U.S. dollar-denominated debt instruments issued by emerging market sovereign and quasi-sovereign entities: Brady bonds, loans, Eurobonds and local market instruments. |
| | | | |
| Legg Mason Strategic Real Return Fund 2010 Annual Report | | | 1 | |
Fund overview
Q. What is the Fund’s investment strategy?
A. The Fund seeks attractive long-term real return. The Fund defines real return as total return reduced by the impact of inflation. In seeking to meet its investment goal, the Fund expects to allocate its assets among five investment “sleeves” that Legg Mason Global Asset Allocation, LLC (“LMGAA”), the Fund’s adviser, believes generally complement each other, with the following target allocations of the Fund’s net assets:
| Ÿ | | Inflation-Linked Debt Securities (40%) |
| Ÿ | | Equity Securities (20%) |
| Ÿ | | Commodity-Linked Securities (20%) |
| Ÿ | | Real Estate Investment Trusts (“REITs”)i (10%) |
| Ÿ | | Tactical Strategy (10%) |
LMGAA uses tactical asset allocation to dynamically shift the portfolio among these five sleeves, depending on the fundamental drivers of inflation at the time. Asset allocation decisions are primarily based on LMGAA’s evaluations of future U.S. price trends as measured by the Consumer Price Index (“CPI”)ii and the relative attractiveness of the asset classes in which the Fund invests. Ibbotson Associates, a research-driven thought leader in capital-markets expectations, contributes macroeconomic research that helps LMGAA assess the fundamental drivers of inflation.
The Fund utilizes a “multi-manager” approach, whereby the adviser and each subadviser provide day-to-day management for one or more of the investment sleeves. The adviser and each subadviser use different investment strategies in managing the sleeves, act independently from the others in their management of the relevant investment sleeve, and use their own methodology for selecting investments. Currently, Western Asset Management Company, Western Asset Management Company Limited in London and Western Asset Management Company Ltd. in Japan manage the Inflation-Linked
Debt Securities Sleeve, Batterymarch Financial Management, Inc. manages the Equity Securities Sleeve and LMGAA manages the Commodity-Linked Securities Sleeve, the REITs Sleeve and the Tactical Strategy Sleeve. LMGAA may also allocate a portion of the Fund’s assets to ClearBridge Advisors, LLC, either in place of, or in addition to, the subadvisers named previously.
The Fund uses commodity derivatives (swaps and S&P GSCI®iii futures) to gain exposure to commodities. These derivatives are fully collateralized with cash.
Q. What were the overall market conditions during the Fund’s reporting period?
A. U.S. inflation remained at low levels over the period from February 26, 2010 through November 30, 2010 (the “reporting period”). As of November 30, 2010, CPI had risen just 1.1% over the previous twelve months. Core inflation, excluding the effects of food and energy prices, was 0.8% over that same period. The combination of strong productivity growth and low capacity utilization in the economy continues to keep inflation pressures in check. The longer-term threat of inflation from high and rising levels of government debt remains.
The REIT market was by far the best-performing asset class among the components of the Fund’s Composite Indexiv (the “Composite”), with the FTSE NAREIT All REITs Indexv rising 21.71% over the nine months ended November 30th. Global equities followed, with the MSCI All Country World Index (“MSCI ACWI”)vi returning 8.34% as fears of a double-dip recession eased. Closely behind equities was the Barclays Capital U.S. TIPS Indexvii, which rose 7.51%. The S&P GSCI® returned just 2.50% since the Fund’s inception on February 26th, although recent performance has been strong. As measured by the Citigroup 1-Month U.S. Treasury Bill Indexviii, one-month Treasury bills, which are also a
| | |
| 2 | | Legg Mason Strategic Real Return Fund 2010 Annual Report |
Fund overview (cont’d)
component in the Composite, were up just 0.11%, reflecting the near-zero level of short-term interest rates. The Composite is hedged 50% into a basket of foreign currencies, represented by the U.S. Dollar Index (“USDX”)ix. The USDX rose 1.04% over the nine months ended November 30th as the U.S. dollar strengthened, on average, relative to the foreign currencies in this Index.
Q. How did we respond to these changing market conditions?
A. At the Fund’s inception, inflation was low and accelerating at a moderate pace, leading us to a preference for riskier assets. We felt that both REITs and U.S. Treasury Inflation- Protected Securities (“TIPS”)x looked a little rich, and we favored equities and commodities. Consequently, relative to the Composite, we were underweight TIPS as our models showed the real yield was low by historical and fair value standards, and the risk of rising real rates made TIPS look rich. We held an overweight position to commodities as our models showed commodity valuations looked in line given the commodity sell-off in the first few months of 2010, combined with our feeling that any dollar depreciation would be supportive of commodity prices. Within REITs, REIT yields relative to corporate bond yields were at the low end of their historic range and it appeared to us that real estate was recovering, but not yet robustly; therefore, we held a small underweight to REITs. All other positions were Composite weight. In the Tactical Strategy Sleeve, we were short the S&P 500 Indexxi and long the Barclays Capital U.S. Aggregate Indexxii as we believed the relative value of bonds was more attractive than equities.
In late May, we updated our portfolio to reduce risk and to reflect our current relative valuations. Inflation remained low with modest acceleration. We felt that the sovereign debt crisis in Europe could pose
a drag on U.S. inflation and that REITs remained relatively expensive. We reduced our overweight to commodities as we felt that commodities were pricing in slower economic growth. In addition, the increase in the value of the U.S. dollar hurt commodity prices. We reduced our TIPS position, thus increasing our underweight. Within equities, we increased our allocation from neutral to overweight as recent improvements in earnings growth, in conjunction with declines in equity prices, resulted in attractive relative valuations for equities. REITs continued to look rich to us, and we increased our underweight to the sleeve.
In August, we shifted our tactical allocations again, moving to a neutral position on commodities and adding to the overweight in equities as inflation remained stable and at low levels. Although commodity fundamentals were positive, growth forecast for the S&P GSCI® showed declines and leading indicators pointed to weaker economic growth ahead. Consequently, we reduced our commodities exposure from an overweight position to a Composite neutral position. Within equities, earnings growth continued to improve while equity prices declined, resulting in increasingly attractive relative valuations, so we added to our overweight position. All other positioning remained the same.
The Fund utilized various derivative instruments over the reporting period. Commodity swaps and futures were used to gain exposure to commodities, U.S. Treasury and Eurodollar futures were employed to manage interest rate risk and forward foreign currency contracts were used to gain exposure to foreign currencies. The use of these derivatives contributed to performance. Also, within the Tactical Strategy Sleeve, we went short the EURO STOXX 50 Indexxiii using futures. This strategy detracted from performance.
| | | | |
| Legg Mason Strategic Real Return Fund 2010 Annual Report | | | 3 | |
Performance review
For the period from the Fund’s inception on February 26, 2010 through November 30, 2010, Class A shares of Legg Mason Strategic Real Return Fund, excluding sales charges, returned 6.08%. The Fund’s unmanaged benchmark, the Barclays Capital U.S. TIPS Index, returned 7.51% over the same time frame. The Lipper Flexible Portfolio Funds Category Average1 returned 7.36% for the same period.
| | | | | | | | |
| Performance Snapshot as of November 30, 2010 | |
(excluding sales charges)
(unaudited) | | 6 months | | | Since fund
inception* | |
| Legg Mason Strategic Real Return Fund: | | | | | |
Class A | | | 11.08 | % | | | 6.08 | % |
Class C | | | 10.66 | % | | | 5.50 | % |
Class I | | | 11.16 | % | | | 6.25 | % |
| Barclays Capital U.S. TIPS Index | | | 4.89 | % | | | 7.51 | % |
| Composite Index | | | 11.52 | % | | | 7.84 | % |
| Lipper Flexible Portfolio Funds Category Average1 | | | 7.79 | % | | | 7.36 | % |
The performance shown represents past performance. Past performance is no guarantee of future results and current performance may be higher or lower than the performance shown above. Principal value and investment returns will fluctuate and investors’ shares, when redeemed, may be worth more or less than their original cost. To obtain performance data current to the most recent month-end, please visit our website at www.leggmason.com/individualinvestors.
All share class returns assume the reinvestment of all distributions, including returns of capital, if any, at net asset value and the deduction of all Fund expenses. Returns have not been adjusted to include sales charges that may apply or the deduction of taxes that a shareholder would pay on
Fund distributions. If sales charges were reflected, the performance quoted would be lower. Performance figures for periods shorter than one year represent cumulative figures and are not annualized.
Performance figures reflect expense reimbursements and/or fee waivers, without which the performance would have been lower.
* The Fund’s inception date is February 26, 2010.
Total Annual Operating Expenses† (unaudited)
As of the Fund’s most current prospectus dated February 26, 2010, the gross total operating expense ratios for Class A, Class C and Class I shares were 1.72%, 2.47% and 1.42%, respectively.
Actual expenses may be higher. For example, expenses may be higher than those shown if average net assets decrease. Net assets are more likely to decrease and Fund expense ratios are more likely to increase when markets are volatile.
As a result of an expense limitation arrangement, the ratio of expenses, other than brokerage, interest, taxes, and extraordinary expenses, to average net assets will not exceed 1.35% for Class A shares, 2.10% for Class C shares and 1.10% for Class I shares. This expense limitation arrangement takes into account the expenses of the underlying funds and brokerage commissions paid on purchases and sales of shares of exchange-traded funds (“ETFs”). This expense limitation arrangement cannot be terminated prior to December 31, 2012 without the Board of Trustees’ consent.
The manager is permitted to recapture amounts forgone or reimbursed to a class within three years after the year in which the manager earned the fee or incurred the expense if the class’ total annual operating expenses have fallen to a level below the expense limitation in effect at the time the fees were earned or the expense incurred.
| 1 | Lipper, Inc., a wholly-owned subsidiary of Reuters, provides independent insight on global collective investments. Returns are based on the period ended November 30, 2010, including the reinvestment of all distributions, including returns of capital, if any, calculated among the 176 funds for the six-month period and among the 163 funds for the period from February 26, 2010 through November 30, 2010 in the Fund’s Lipper category, and excluding sales charges. |
| † | Includes expenses of the underlying funds in which the Fund invests. |
| | |
| 4 | | Legg Mason Strategic Real Return Fund 2010 Annual Report |
Fund overview (cont’d)
Q. What were the leading contributors to performance?
A. Our overweight in equities and underweight in TIPS had a positive impact on relative performance over the reporting period. The Tactical Strategy Sleeve also had a positive impact on relative performance.
Within the Equity Securities Sleeve, the stocks that had the largest positive impact on the sleeve’s relative performance (measured versus the MSCI ACWI) were Industrial and Commercial Bank of China Ltd. (Class H shares), Bayerische Motoren Werke AG and Lanxess AG.
Q. What were the leading detractors from performance?
A. Our underweight in REITs had a negative impact on relative performance for the reporting period.
Within the Equity Securities Sleeve, the stocks that had the largest negative impact on the sleeve’s relative performance (measured versus the MSCI ACWI) were Sanofi-Aventis, Fomento de Construcciones y Contratas SA and Manulife Financial Corp.
Within the Tactical Strategy Sleeve, our position in the Rydex Series Funds detracted from performance.
Q. Were there any significant changes to the Fund during the reporting period?
A. Over the past nine months, we reduced our overweight to commodities while moving to an overweight position in equities. We have been underweight both TIPS and REITs since inception. Inflation is currently stable and remains at low levels.
Thank you for your investment in Legg Mason Strategic Real Return Fund. As always, we appreciate that you have chosen us to manage your assets and we remain focused on achieving the Fund’s investment goals.
Sincerely,

Steven Bleiberg
Portfolio Manager
Legg Mason Global Asset Allocation, LLC

Y. Wayne Lin
Portfolio Manager
Legg Mason Global Asset Allocation, LLC

Andrew D. Purdy
Portfolio Manager
Legg Mason Global Asset Allocation, LLC
December 21, 2010
RISKS: The Fund is subject to interest rate, credit, income, prepayment and inflation risks. As interest rates rise, bond prices fall, reducing the value of a fixed-income investment. Periods of deflation may adversely affect the Fund, and changes in inflation will cause the Fund’s income to fluctuate. Equity securities are subject to price fluctuation and possible loss of principal. The Fund is not diversified, which means that it is permitted to invest a higher percentage of its assets in any one issuer than a diversified fund. This may magnify the Fund’s losses from events affecting a particular issuer. In addition to the Fund’s operating expenses, you will indirectly bear the operating expenses of the underlying funds including ETFs. Each
| | | | |
| Legg Mason Strategic Real Return Fund 2010 Annual Report | | | 5 | |
underlying fund may engage in active and frequent trading, resulting in higher portfolio turnover and transaction costs. Derivatives, such as options and futures, which can be illiquid, may disproportionately increase losses and have a potentially large impact on Fund performance. International investments are subject to special risks including currency fluctuations and social, economic and political uncertainties, which could increase volatility. These risks are magnified in emerging markets. The Fund may use leverage which may increase volatility and possibility of loss. The Fund may invest in REITs, which are closely linked to the performance of the real estate markets. REITs are subject to illiquidity, credit and interest rate risks, as well as risks associated with small- and mid-cap investments. The model used to manage the Fund’s assets provides no assurance that the recommended allocation will either maximize returns or minimize risks. There is no assurance that a recommended allocation will prove the ideal allocation in all circumstances. The Fund may engage
in short selling, which is a speculative strategy that involves special risks. Unlike the possible loss on a security that is purchased, there is no limit on the amount of loss on an appreciating security that is sold short. Additional risks may include those risks associated with investing in commodities, ETFs, exchange-traded notes (“ETNs”) and master limited partnerships (“MLPs”). Please see the Fund’s prospectus for a more complete discussion of these and other risks, and the Fund’s principal investment strategies.
Portfolio holdings and breakdowns are as of November 30, 2010 and are subject to change and may not be representative of the portfolio managers’ current or future investments. Please refer to pages 11 through 20 for a list and percentage breakdown of the Fund’s holdings.
All investments are subject to risk including the possible loss of principal. Past performance is no guarantee of future results. All index performance reflects no deduction for fees, expenses or taxes. Please note that an investor cannot invest directly in an index.
The information provided is not intended to be a forecast of future events, a guarantee of future results or investment advice. Views expressed may differ from those of the firm as a whole.
| i | Real estate investment trusts (“REITs”) invest in real estate or loans secured by real estate and issue shares in such investments, which can be illiquid. |
| ii | The Consumer Price Index (“CPI”) measures the average change in U.S. consumer prices over time in a fixed market basket of goods and services determined by the U.S. Bureau of Labor Statistics. |
| iii | The S&P GSCI® is a composite index of commodity sector returns representing an unleveraged, long-only investment in commodity futures that is broadly diversified across the spectrum of commodities. The returns are calculated on a fully collateralized basis with full reinvestment. |
| iv | The Composite Index reflects the blended rate of return of the following underlying indices: 40% Barclays Capital U.S. TIPS Index, 20% MSCI All Country World Index, 20% S&P GSCI®, 10% FTSE NAREIT All REITs Index and 10% Citigroup 1-Month U.S. Treasury Bill Index. This Composite Index is hedged to 50% exposure to the U.S. dollar, as defined by the U.S. Dollar Index (“USDX”). The Composite Index’s unhedged currency exposure is predominantly U.S. dollar-based. The Fund’s target hedged currency exposure is 50% U.S. dollar, 50% non-U.S. dollar. The Fund may deviate, either up or down, from its target currency |
| | allocation due to market conditions. To better align the components of the Composite Index with the Fund’s target currency exposure, a 50% U.S. dollar hedge is applied to the Composite Index by subtracting the returns of the USDX from 50% of the blended rate of return of the Composite Index. |
| v | The FTSE NAREIT All REITs Index consists of all tax-qualified real estate investment trusts (“REITs”) listed on the New York Stock Exchange, American Stock Exchange or NASDAQ National Market List. |
| vi | The MSCI All Country World Index (“MSCI ACWI”) is a free float-adjusted market capitalization weighted index that is designed to measure the equity market performance of developed and emerging markets. |
| vii | The Barclays Capital U.S. TIPS Index represents an unmanaged market index made up of U.S. Treasury Inflation-Linked Index securities. |
| viii | The Citigroup 1-Month U.S. Treasury Bill Index is a market value-weighted index of public obligations of the U.S. Treasury with maturities of one month. |
| ix | The U.S. Dollar Index (“USDX”) is a measure of the value of the U.S. dollar relative to a majority of its most significant trading partners. |
| | |
| 6 | | Legg Mason Strategic Real Return Fund 2010 Annual Report |
Fund overview (cont’d)
| x | U.S. Treasury Inflation-Protected Securities (“TIPS”) are inflation-indexed securities issued by the U.S. Treasury in five-year, ten-year and twenty-year maturities. The principal is adjusted to the Consumer Price Index, the commonly used measure of inflation. The coupon rate is constant, but generates a different amount of interest when multiplied by the inflation-adjusted principal. |
| xi | The S&P 500 Index is an unmanaged index of 500 stocks and is generally representative of the performance of larger companies in the U.S. |
| xii | The Barclays Capital U.S. Aggregate Index is a broad-based bond index comprised of government, corporate, mortgage- and asset-backed issues, rated investment grade or higher, and having at least one year to maturity. |
| xiii | The EURO STOXX 50 Index is Europe’s leading blue-chip index for the Eurozone and provides a blue-chip representation of supersector leaders in the Eurozone. The Index currently covers fifty stocks from twelve Eurozone countries: Austria, Belgium, Finland, France, Germany, Greece, Ireland, Italy, Luxembourg, the Netherlands, Portugal and Spain. |
| | | | |
| Legg Mason Strategic Real Return Fund 2010 Annual Report | | | 7 | |
Fund at a glance† (unaudited)
Investment breakdown (%) as a percent of total investments
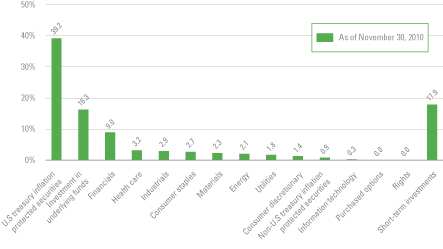
| † | The bar graph above represents the composition of the Fund’s investments as of November 30, 2010 and does not include derivatives, such as written options, futures contracts, forward foreign currency contracts and swap contracts. The Fund is actively managed. As a result, the composition of the Fund’s investments is subject to change at any time. |
| | |
| 8 | | Legg Mason Strategic Real Return Fund 2010 Annual Report |
Fund expenses (unaudited)
Example
As a shareholder of the Fund, you may incur two types of costs: (1) transaction costs, including front-end and back-end sales charges (loads) on purchase payments and (2) ongoing costs, including management fees; distribution and/or service (12b-1) fees; and other Fund expenses. This example is intended to help you understand your ongoing costs (in dollars) of investing in the Fund and to compare these costs with the ongoing costs of investing in other mutual funds.
This example is based on an investment of $1,000 invested on June 1, 2010 and held for the six months ended November 30, 2010.
Actual expenses
The table below titled “Based on Actual Total Return” provides information about actual account values and actual expenses. You may use the information provided in this table, together with the amount you invested, to estimate the expenses that you paid over the period. To estimate the expenses you paid on your account, divide your ending account value by $1,000 (for example, an $8,600 ending account value divided by $1,000 = 8.6), then multiply the result by the number under the heading entitled “Expenses Paid During the Period”.
Hypothetical example for comparison purposes
The table below titled “Based on Hypothetical Total Return” provides information about hypothetical account values and hypothetical expenses based on the actual expense ratio and an assumed rate of return of 5.00% per year before expenses, which is not the Fund’s actual return. The hypothetical account values and expenses may not be used to estimate the actual ending account balance or expenses you paid for the period. You may use the information provided in this table to compare the ongoing costs of investing in the Fund and other funds. To do so, compare the 5.00% hypothetical example relating to the Fund with the 5.00% hypothetical examples that appear in the shareholder reports of the other funds.
Please note that the expenses shown in the table below are meant to highlight your ongoing costs only and do not reflect any transactional costs, such as front-end or back-end sales charges (loads). Therefore, the table is useful in comparing ongoing costs only, and will not help you determine the relative total costs of owning different funds. In addition, if these transaction costs were included, your costs would have been higher.
| | | | | | | | | | | | | | | | | | | | | | | | | | | | | | | | | | | | | | | | | | | | | | |
| Based on actual total return1 | | | | | | Based on hypothetical total return1 | |
| | | Actual Total
Return
Without
Sales
Charges2 | | | Beginning
Account
Value | | | Ending
Account
Value | | | Annualized
Expense
Ratio3 | | | Expenses
Paid
During
the
Period4 | | | | | | | | Hypothetical
Annualized
Total Return | | | Beginning
Account
Value | | | Ending
Account
Value | | | Annualized
Expense
Ratio3 | | | Expenses
Paid
During
the
Period4 | |
| Class A | | | 11.08 | % | | $ | 1,000.00 | | | $ | 1,110.80 | | | | 1.26 | % | | $ | 6.67 | | | | | | | Class A | | | 5.00 | % | | $ | 1,000.00 | | | $ | 1,018.75 | | | | 1.26 | % | | $ | 6.38 | |
| Class C | | | 10.66 | | | | 1,000.00 | | | | 1,106.60 | | | | 2.01 | | | | 10.61 | | | | | | | Class C | | | 5.00 | | | | 1,000.00 | | | | 1,014.99 | | | | 2.01 | | | | 10.15 | |
| Class I | | | 11.16 | | | | 1,000.00 | | | | 1,111.60 | | | | 1.01 | | | | 5.35 | | | | | | | Class I | | | 5.00 | | | | 1,000.00 | | | | 1,020.00 | | | | 1.01 | | | | 5.11 | |
| 1 | For the six months ended November 30, 2010. |
| 2 | Assumes the reinvestment of all distributions, including returns of capital, if any, at net asset value and does not reflect the deduction of the applicable sales charge with respect to Class A shares or the applicable contingent deferred sales charges (“CDSC”) with respect to Class C shares. Total return is not annualized, as it may not be representative of the total return for the year. Performance figures may reflect compensating balance arrangements, fee waivers and/or expense reimbursements. In the absence of compensating balance arrangements, fee waivers/and or expense reimbursements, the total return would have been lower. Past performance is no guarantee of future results. |
| 3 | Does not include expenses of the underlying funds in which the fund invests. |
| 4 | Expenses (net of compensating balance arrangements, fee waivers and/or expense reimbursements) are equal to each class’ respective annualized expense ratio multiplied by the average account value over the period, multiplied by the number of days in the most recent fiscal half-year (183), then divided by 365. |
| | | | |
| Legg Mason Strategic Real Return Fund 2010 Annual Report | | | 9 | |
Fund performance (unaudited)
| | | | | | | | | | | | |
| Average annual total returns† | | | | | | | | | |
| Without sales charges1 | | Class A | | | Class C | | | Class I | |
| Inception* through 11/30/10 | | | 6.08 | % | | | 5.50 | % | | | 6.25 | % |
| | | |
| With sales charges2 | | Class A | | | Class C | | | Class I | |
| Inception* through 11/30/10 | | | 0.00 | % | | | 4.50 | % | | | 6.25 | % |
| | | | | | | | | | | | |
| Cumulative total returns† | | | | | | | | | |
| Without sales charges1 | | | | | | | | | |
| Class A (Inception date of 2/26/10 through 11/30/10) | | | | | | | | | | | 6.08 | % |
| Class C (Inception date of 2/26/10 through 11/30/10) | | | | | | | | | | | 5.50 | |
| Class I (Inception date of 2/26/10 through 11/30/10) | | | | | | | | | | | 6.25 | |
All figures represent past performance and are not a guarantee of future results. Investment return and principal value of an investment will fluctuate so that an investor’s shares, when redeemed, may be worth more or less than their original cost. The returns shown do not reflect the deduction of taxes that a shareholder would pay on Fund distributions or the redemption of Fund shares. Performance figures may reflect compensating balance arrangements, fee waivers and/or expense reimbursements. In the absence of compensating balance arrangements, fee waivers and/or expense reimbursements, the total return would have been lower.
| 1 | Assumes the reinvestment of all distributions, including returns of capital, if any, at net asset value and does not reflect the deduction of the applicable sales charge with respect to Class A shares or the applicable contingent deferred sales charges (“CDSC”) with respect to Class C shares. |
| 2 | Assumes the reinvestment of all distributions, including returns of capital, if any, at net asset value. In addition, Class A shares reflect the deduction of the maximum initial sales charge of 5.75%. Class C shares reflect the deduction of a 1.00% CDSC, which applies if shares are redeemed within one year from purchase payment. |
| * | Inception date for Class A, C and I shares is February 26, 2010. |
| | |
| 10 | | Legg Mason Strategic Real Return Fund 2010 Annual Report |
Fund performance (unaudited) (cont’d)
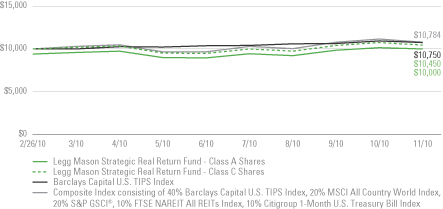
Historical performance
Value of $10,000 invested in
Class A and C Shares of Legg Mason Strategic Real Return Fund vs. Barclays Capital U.S. TIPS Index and the Composite Index consisting of 40% Barclays Capital U.S. TIPS Index, 20% MSCI All Country World Index, 20% S&P GSCI®, 10% FTSE NAREIT All REITs Index, 10% Citigroup 1-Month U.S. Treasury Bill Index‡ — February 26, 2010 - November 2010
Value of $1,000,000 invested in
Class I Shares of Legg Mason Strategic Real Return Fund vs. Barclays Capital U.S. TIPS Index and the Composite Index consisting of 40% Barclays Capital U.S. TIPS Index, 20% MSCI All Country World Index, 20% S&P GSCI®, 10% FTSE NAREIT All REITs Index, 10% Citigroup 1-Month U.S. Treasury Bill Index‡ — February 26, 2010 - November 2010
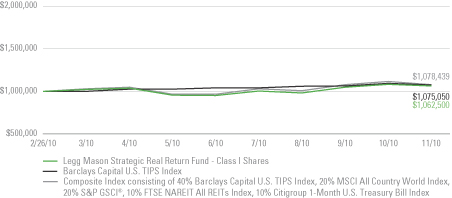
All figures represent past performance and are not a guarantee of future results. Investment return and principal value of an investment will fluctuate so that an investor’s shares, when redeemed, may be worth more or less than their original cost. The returns shown do not reflect the deduction of taxes that a shareholder would pay on Fund distributions or the redemption of Fund shares. Performance figures may reflect compensating balance arrangements, fee waivers and/or expense reimbursements. In the absence of compensating balance arrangements, fee waivers and/or expense reimbursements, the total return would have been lower.
| ‡ | Hypothetical illustration of $10,000 invested in Class A and C shares and $1,000,000 invested in Class I shares of Legg Mason Strategic Real Return Fund on February 26, 2010, assuming the deduction of the maximum initial sales charge of 5.75% at the time of investment for Class A shares and the reinvestment of all distributions, including returns of capital, if any, at net asset value through November 30, 2010. There is a CDSC charge of 1.00% on Class C shares, which applies if redemption occurs within one year from purchase payment. The hypothetical illustration also assumes a $10,000 or $1,000,000 investment, as applicable, in the Barclays Capital U.S. TIPS Index and the Composite Index. The Barclays Capital U.S. TIPS Index represents an unmanaged market index made up of U.S. Treasury Inflation-Linked Index securities. The Composite Index reflects the blended rate of return of the following underlying indices: 40% Barclays Capital U.S. TIPS Index, 20% MSCI All Country World Index, 20% S&P GSCI® Index, 10% FTSE NAREIT All REITs Index and 10% Citigroup 1-Month U.S. Treasury Bill Index. Please note that an investor cannot invest directly in an index. |
| | | | |
| Legg Mason Strategic Real Return Fund 2010 Annual Report | | | 11 | |
Consolidated schedule of investments
November 30, 2010
Legg Mason Strategic Real Return Fund
| | | | | | | | | | | | | | | | |
| Security | | | | | | | | Shares | | | Value | |
| Common Stocks — 23.1% | | | | | | | | | | | | | | | | |
| Consumer Discretionary — 1.3% | | | | | | | | | | | | | | | | |
Automobiles — 1.2% | | | | | | | | | | | | | | | | |
Bayerische Motoren Werke AG | | | | | | | | | | | 428 | | | $ | 32,190 | (a) |
Ford Motor Co. | | | | | | | | | | | 1,818 | | | | 28,979 | * |
Fuji Heavy Industries Ltd. | | | | | | | | | | | 5,000 | | | | 37,045 | (a) |
Honda Motor Co., Ltd. | | | | | | | | | | | 400 | | | | 14,480 | (a) |
Hyundai Motor Co. | | | | | | | | | | | 200 | | | | 29,662 | (a) |
Kia Motors Corp. | | | | | | | | | | | 820 | | | | 34,563 | (a) |
Toyota Motor Corp. | | | | | | | | | | | 1,200 | | | | 46,515 | (a) |
Total Automobiles | | | | | | | | | | | | | | | 223,434 | |
Household Durables — 0.1% | | | | | | | | | | | | | | | | |
SEB SA | | | | | | | | | | | 300 | | | | 27,689 | (a) |
Total Consumer Discretionary | | | | | | | | | | | | | | | 251,123 | |
| Consumer Staples — 2.5% | | | | | | | | | | | | | | | | |
Beverages — 0.7% | | | | | | | | | | | | | | | | |
Anheuser-Busch InBev NV | | | | | | | | | | | 500 | | | | 27,387 | (a) |
Coca-Cola Enterprises Inc. | | | | | | | | | | | 1,060 | | | | 25,599 | |
Dr. Pepper Snapple Group Inc. | | | | | | | | | | | 700 | | | | 25,641 | |
Heineken Holding NV | | | | | | | | | | | 590 | | | | 23,735 | (a) |
PepsiCo Inc. | | | | | | | | | | | 512 | | | | 33,091 | |
Total Beverages | | | | | | | | | | | | | | | 135,453 | |
Food Products — 1.0% | | | | | | | | | | | | | | | | |
Archer-Daniels-Midland Co. | | | | | | | | | | | 420 | | | | 12,176 | |
ConAgra Foods Inc. | | | | | | | | | | | 681 | | | | 14,628 | |
Hershey Co. | | | | | | | | | | | 540 | | | | 25,272 | |
Marine Harvest ASA | | | | | | | | | | | 16,600 | | | | 15,427 | (a) |
Nestle SA, Registered Shares | | | | | | | | | | | 608 | | | | 33,033 | (a) |
Nutreco Holding NV | | | | | | | | | | | 400 | | | | 28,080 | (a) |
Sara Lee Corp. | | | | | | | | | | | 1,209 | | | | 18,135 | |
Tingyi (Cayman Islands) Holding Corp. | | | | | | | | | | | 8,000 | | | | 19,720 | (a) |
Tyson Foods Inc., Class A Shares | | | | | | | | | | | 1,440 | | | | 22,795 | |
Total Food Products | | | | | | | | | | | | | | | 189,266 | |
Personal Products — 0.1% | | | | | | | | | | | | | | | | |
Herbalife Ltd. | | | | | | | | | | | 390 | | | | 26,766 | |
Tobacco — 0.7% | | | | | | | | | | | | | | | | |
British American Tobacco PLC | | | | | | | | | | | 400 | | | | 14,496 | (a) |
Imperial Tobacco Group PLC | | | | | | | | | | | 700 | | | | 20,531 | (a) |
Lorillard Inc. | | | | | | | | | | | 226 | | | | 17,985 | |
See Notes to Consolidated Financial Statements.
| | |
| 12 | | Legg Mason Strategic Real Return Fund 2010 Annual Report |
Consolidated schedule of investments (cont’d)
November 30, 2010
Legg Mason Strategic Real Return Fund
| | | | | | | | | | | | | | | | |
| Security | | | | | | | | Shares | | | Value | |
Tobacco — continued | | | | | | | | | | | | | | | | |
Philip Morris International Inc. | | | | | | | | | | | 960 | | | $ | 54,614 | |
Reynolds American Inc. | | | | | | | | | | | 800 | | | | 24,752 | |
Total Tobacco | | | | | | | | | | | | | | | 132,378 | |
Total Consumer Staples | | | | | | | | | | | | | | | 483,863 | |
| Energy — 2.0% | | | | | | | | | | | | | | | | |
Energy Equipment & Services — 0.4% | | | | | | | | | | | | | | | | |
John Wood Group PLC | | | | | | | | | | | 3,500 | | | | 25,388 | (a) |
Nabors Industries Ltd. | | | | | | | | | | | 1,120 | | | | 24,741 | * |
Patterson-UTI Energy Inc. | | | | | | | | | | | 1,160 | | | | 22,898 | |
Total Energy Equipment & Services | | | | | | | | | | | | | | | 73,027 | |
Oil, Gas & Consumable Fuels — 1.6% | | | | | | | | | | | | | | | | |
BP PLC | | | | | | | | | | | 3,350 | | | | 22,272 | (a) |
Chevron Corp. | | | | | | | | | | | 452 | | | | 36,599 | |
China Petroleum & Chemical Corp., Class H Shares | | | | | | | | | | | 20,000 | | | | 18,537 | (a) |
Eni SpA | | | | | | | | | | | 900 | | | | 18,096 | (a) |
Exxon Mobil Corp. | | | | | | | | | | | 527 | | | | 36,658 | |
Marathon Oil Corp. | | | | | | | | | | | 554 | | | | 18,543 | |
Pacific Rubiales Energy Corp. | | | | | | | | | | | 800 | | | | 24,938 | * |
Polski Koncern Naftowy Orlen SA | | | | | | | | | | | 900 | | | | 12,545 | *(a) |
Repsol YPF, SA | | | | | | | | | | | 917 | | | | 22,161 | (a) |
Royal Dutch Shell PLC, Class A Shares | | | | | | | | | | | 735 | | | | 22,130 | |
Sunoco Inc. | | | | | | | | | | | 480 | | | | 19,267 | |
Total SA | | | | | | | | | | | 700 | | | | 33,877 | (a) |
Valero Energy Corp. | | | | | | | | | | | 1,150 | | | | 22,402 | |
Total Oil, Gas & Consumable Fuels | | | | | | | | | | | | | | | 308,025 | |
Total Energy | | | | | | | | | | | | | | | 381,052 | |
| Financials — 7.5% | | | | | | | | | | | | | | | | |
Commercial Banks — 4.2% | | | | | | | | | | | | | | | | |
Agricultural Bank of China, Class H Shares | | | | | | | | | | | 36,000 | | | | 18,743 | *(a) |
Australia & New Zealand Banking Group Ltd. | | | | | | | | | | | 1,977 | | | | 42,840 | (a) |
Banco do Brasil SA | | | | | | | | | | | 1,500 | | | | 28,782 | |
Banco Santander SA | | | | | | | | | | | 2,971 | | | | 28,162 | (a) |
Bangkok Bank Public Co., Ltd., NVDR | | | | | | | | | | | 5,800 | | | | 27,622 | (a) |
Bank of Montreal | | | | | | | | | | | 400 | | | | 23,457 | |
Bank of Nova Scotia | | | | | | | | | | | 700 | | | | 36,290 | |
Bendigo and Adelaide Bank Ltd. | | | | | | | | | | | 2,700 | | | | 25,527 | (a) |
BNP Paribas SA | | | | | | | | | | | 430 | | | | 25,418 | (a) |
Canadian Imperial Bank of Commerce | | | | | | | | | | | 300 | | | | 23,102 | |
See Notes to Consolidated Financial Statements.
| | | | |
| Legg Mason Strategic Real Return Fund 2010 Annual Report | | | 13 | |
Legg Mason Strategic Real Return Fund
| | | | | | | | | | | | | | | | |
| Security | | | | | | | | Shares | | | Value | |
Commercial Banks — continued | | | | | | | | | | | | | | | | |
Chiba Bank Ltd. | | | | | | | | | | | 4,000 | | | $ | 23,278 | (a) |
CIT Group Inc. | | | | | | | | | | | 600 | | | | 23,676 | * |
Commonwealth Bank of Australia | | | | | | | | | | | 1,058 | | | | 48,850 | (a) |
Grupo Financiero Banorte SAB de CV, Series O Shares | | | | | | | | | | | 2,900 | | | | 12,574 | |
Gunma Bank Ltd. | | | | | | | | | | | 4,000 | | | | 19,980 | (a) |
Hana Financial Group Inc. | | | | | | | | | | | 900 | | | | 29,454 | (a) |
HSBC Holdings PLC | | | | | | | | | | | 1,100 | | | | 11,082 | (a) |
Huntington Bancshares Inc. | | | | | | | | | | | 3,216 | | | | 18,765 | |
Industrial & Commercial Bank of China Ltd., Class H shares | | | | | | | | | | | 17,000 | | | | 13,192 | (a) |
M&T Bank Corp. | | | | | | | | | | | 290 | | | | 22,318 | |
Mizuho Financial Group Inc. | | | | | | | | | | | 11,900 | | | | 18,753 | (a) |
National Bank of Canada | | | | | | | | | | | 500 | | | | 33,043 | |
PT Bank Mandiri | | | | | | | | | | | 30,500 | | | | 21,603 | (a) |
Royal Bank of Canada | | | | | | | | | | | 400 | | | | 21,411 | |
Standard Bank Group Ltd. | | | | | | | | | | | 1,500 | | | | 21,569 | (a) |
Standard Chartered PLC | | | | | | | | | | | 911 | | | | 24,510 | (a) |
Sumitomo Mitsui Financial Group Inc. | | | | | | | | | | | 1,700 | | | | 52,187 | (a) |
Toronto-Dominion Bank | | | | | | | | | | | 500 | | | | 36,379 | |
U.S. Bancorp | | | | | | | | | | | 1,110 | | | | 26,396 | |
Wells Fargo & Co. | | | | | | | | | | | 1,660 | | | | 45,169 | |
Total Commercial Banks | | | | | | | | | | | | | | | 804,132 | |
Consumer Finance — 0.1% | | | | | | | | | | | | | | | | |
American Express Co. | | | | | | | | | | | 560 | | | | 24,203 | |
Diversified Financial Services — 0.3% | | | | | | | | | | | | | | | | |
FirstRand Ltd. | | | | | | | | | | | 4,700 | | | | 13,300 | (a) |
JPMorgan Chase & Co. | | | | | | | | | | | 803 | | | | 30,016 | |
London Stock Exchange Group PLC | | | | | | | | | | | 1,700 | | | | 20,045 | (a) |
Total Diversified Financial Services | | | | | | | | | | | | | | | 63,361 | |
Insurance — 2.0% | | | | | | | | | | | | | | | | |
AFLAC Inc. | | | | | | | | | | | 381 | | | | 19,621 | |
Allstate Corp. | | | | | | | | | | | 565 | | | | 16,447 | |
American Financial Group Inc. | | | | | | | | | | | 587 | | | | 18,062 | |
Amlin PLC | | | | | | | | | | | 2,500 | | | | 14,613 | (a) |
Assurant Inc. | | | | | | | | | | | 506 | | | | 17,847 | |
Aviva PLC | | | | | | | | | | | 3,078 | | | | 16,957 | (a) |
Axis Capital Holdings Ltd. | | | | | | | | | | | 720 | | | | 25,445 | |
Hartford Financial Services Group Inc. | | | | | | | | | | | 750 | | | | 16,695 | |
Industrial Alliance Insurance and Financial Services Inc. | | | | | | | | | | | 900 | | | | 30,378 | |
See Notes to Consolidated Financial Statements.
| | |
| 14 | | Legg Mason Strategic Real Return Fund 2010 Annual Report |
Consolidated schedule of investments (cont’d)
November 30, 2010
Legg Mason Strategic Real Return Fund
| | | | | | | | | | | | | | | | |
| Security | | | | | | | | Shares | | | Value | |
Insurance — continued | | | | | | | | | | | | | | | | |
Legal & General Group PLC | | | | | | | | | | | 16,300 | | | $ | 23,216 | (a) |
Manulife Financial Corp. | | | | | | | | | | | 1,300 | | | | 18,084 | |
Muenchener Rueckversicherungs-Gesellschaft AG (MunichRe),
Registered Shares | | | | | | | | | | | 100 | | | | 13,888 | (a) |
PICC Property & Casualty Co., Ltd. | | | | | | | | | | | 18,000 | | | | 26,832 | *(a) |
Prudential Financial Inc. | | | | | | | | | | | 380 | | | | 19,258 | |
Sun Life Financial Inc. | | | | | | | | | | | 700 | | | | 18,889 | |
T&D Holdings Inc. | | | | | | | | | | | 1,250 | | | | 28,397 | (a) |
Torchmark Corp. | | | | | | | | | | | 335 | | | | 19,252 | |
Transatlantic Holdings Inc. | | | | | | | | | | | 306 | | | | 15,484 | |
Travelers Cos. Inc. | | | | | | | | | | | 600 | | | | 32,394 | |
Total Insurance | | | | | | | | | | | | | | | 391,759 | |
Office — 0.1% | | | | | | | | | | | | | | | | |
Highwoods Properties Inc. | | | | | | | | | | | 350 | | | | 10,679 | |
Real Estate Investment Trusts (REITs) — 0.4% | | | | | | | | | | | | | | | | |
Dexus Property Group | | | | | | | | | | | 30,700 | | | | 22,912 | (a) |
Duke Realty Corp. | | | | | | | | | | | 2,260 | | | | 25,154 | |
Stockland | | | | | | | | | | | 6,400 | | | | 22,429 | (a) |
Total Real Estate Investment Trusts (REITs) | | | | | | | | | | | | | | | 70,495 | |
Real Estate Management & Development — 0.4% | | | | | | | | | | | | | | | | |
China Overseas Land & Investment Ltd. | | | | | | | | | | | 8,000 | | | | 15,337 | (a) |
Jones Lang LaSalle Inc. | | | | | | | | | | | 241 | | | | 19,237 | |
Shimao Property Holdings Ltd. | | | | | | | | | | | 14,000 | | | | 21,088 | (a) |
Wheelock & Co. Ltd. | | | | | | | | | | | 5,000 | | | | 17,814 | (a) |
Total Real Estate Management & Development | | | | | | | | | | | | | | | 73,476 | |
Total Financials | | | | | | | | | | | | | | | 1,438,105 | |
| Health Care — 3.0% | | | | | | | | | | | | | | | | |
Health Care Providers & Services — 0.7% | | | | | | | | | | | | | | | | |
AmerisourceBergen Corp. | | | | | | | | | | | 760 | | | | 23,446 | |
Community Health Systems Inc. | | | | | | | | | | | 460 | | | | 14,656 | * |
Coventry Health Care Inc. | | | | | | | | | | | 680 | | | | 17,217 | * |
Humana Inc. | | | | | | | | | | | 344 | | | | 19,278 | * |
Medco Health Solutions Inc. | | | | | | | | | | | 240 | | | | 14,717 | * |
UnitedHealth Group Inc. | | | | | | | | | | | 1,110 | | | | 40,537 | |
WellPoint Inc. | | | | | | | | | | | 319 | | | | 17,781 | * |
Total Health Care Providers & Services | | | | | | | | | | | | | | | 147,632 | |
Pharmaceuticals — 2.3% | | | | | | | | | | | | | | | | |
Abbott Laboratories | | | | | | | | | | | 626 | | | | 29,115 | |
AstraZeneca PLC | | | | | | | | | | | 960 | | | | 44,712 | (a) |
See Notes to Consolidated Financial Statements.
| | | | |
| Legg Mason Strategic Real Return Fund 2010 Annual Report | | | 15 | |
Legg Mason Strategic Real Return Fund
| | | | | | | | | | | | | | | | |
| Security | | | | | | | | Shares | | | Value | |
Pharmaceuticals — continued | | | | | | | | | | | | | | | | |
Bristol-Myers Squibb Co. | | | | | | | | | | | 1,050 | | | $ | 26,502 | |
Eli Lilly & Co. | | | | | | | | | | | 890 | | | | 29,957 | |
Endo Pharmaceuticals Holdings Inc. | | | | | | | | | | | 681 | | | | 24,523 | * |
Forest Laboratories Inc. | | | | | | | | | | | 553 | | | | 17,635 | * |
GlaxoSmithKline PLC | | | | | | | | | | | 1,143 | | | | 21,645 | (a) |
H. Lundbeck A/S | | | | | | | | | �� | | 856 | | | | 14,842 | (a) |
Merck & Co. Inc. | | | | | | | | | | | 1,056 | | | | 36,400 | |
Merck KGaA | | | | | | | | | | | 300 | | | | 23,415 | (a) |
Novartis AG, Registered Shares | | | | | | | | | | | 544 | | | | 28,950 | (a) |
Pfizer Inc. | | | | | | | | | | | 1,078 | | | | 17,561 | |
Sanofi-Aventis | | | | | | | | | | | 757 | | | | 45,739 | (a) |
Teva Pharmaceutical Industries Ltd., ADR | | | | | | | | | | | 800 | | | | 40,032 | |
Valeant Pharmaceuticals International Inc. | | | | | | | | | | | 742 | | | | 19,196 | |
Warner Chilcott PLC, Class A Shares | | | | | | | | | | | 1,084 | | | | 20,607 | |
Total Pharmaceuticals | | | | | | | | | | | | | | | 440,831 | |
Total Health Care | | | | | | | | | | | | | | | 588,463 | |
| Industrials — 2.7% | | | | | | | | | | | | | | | | |
Aerospace & Defense — 0.6% | | | | | | | | | | | | | | | | |
Empresa Brasileira de Aeronautica SA, ADR | | | | | | | | | | | 940 | | | | 27,373 | |
General Dynamics Corp. | | | | | | | | | | | 260 | | | | 17,183 | |
Lockheed Martin Corp. | | | | | | | | | | | 340 | | | | 23,134 | |
Northrop Grumman Corp. | | | | | | | | | | | 480 | | | | 29,606 | |
Safran SA | | | | | | | | | | | 700 | | | | 21,919 | (a) |
Total Aerospace & Defense | | | | | | | | | | | | | | | 119,215 | |
Air Freight & Logistics — 0.1% | | | | | | | | | | | | | | | | |
Ryder System Inc. | | | | | | | | | | | 500 | | | | 21,555 | |
Construction & Engineering — 0.1% | | | | | | | | | | | | | | | | |
Fomento de Construcciones y Contratas SA | | | | | | | | | | | 456 | | | | 10,366 | (a) |
Electrical Equipment — 0.3% | | | | | | | | | | | | | | | | |
Legrand SA | | | | | | | | | | | 700 | | | | 26,747 | (a) |
Nexans SA | | | | | | | | | | | 300 | | | | 19,950 | (a) |
Sumitomo Electric Industries Ltd. | | | | | | | | | | | 1,200 | | | | 15,702 | (a) |
Total Electrical Equipment | | | | | | | | | | | | | | | 62,399 | |
Industrial Conglomerates — 0.5% | | | | | | | | | | | | | | | | |
DCC PLC | | | | | | | | | | | 871 | | | | 22,773 | (a) |
General Electric Co. | | | | | | | | | | | 913 | | | | 14,453 | |
SembCorp Industries Ltd. | | | | | | | | | | | 7,000 | | | | 25,571 | (a) |
Siemens AG, Registered Shares | | | | | | | | | | | 322 | | | | 35,224 | (a) |
Total Industrial Conglomerates | | | | | | | | | | | | | | | 98,021 | |
See Notes to Consolidated Financial Statements.
| | |
| 16 | | Legg Mason Strategic Real Return Fund 2010 Annual Report |
Consolidated schedule of investments (cont’d)
November 30, 2010
Legg Mason Strategic Real Return Fund
| | | | | | | | | | | | | | | | |
| Security | | | | | | | | Shares | | | Value | |
Machinery — 0.7% | | | | | | | | | | | | | | | | |
Caterpillar Inc. | | | | | | | | | | | 180 | | | $ | 15,228 | |
ITT Industries Inc. | | | | | | | | | | | 450 | | | | 20,700 | |
JTEKT Corp. | | | | | | | | | | | 1,400 | | | | 15,509 | (a) |
Metso Corp. | | | | | | | | | | | 500 | | | | 25,732 | (a) |
NSK Ltd. | | | | | | | | | | | 3,000 | | | | 25,311 | (a) |
Volvo AB, Class B Shares | | | | | | | | | | | 1,800 | | | | 26,112 | *(a) |
Total Machinery | | | | | | | | | | | | | | | 128,592 | |
Road & Rail — 0.3% | | | | | | | | | | | | | | | | |
Central Japan Railway Co. | | | | | | | | | | | 4 | | | | 30,833 | (a) |
CSX Corp. | | | | | | | | | | | 210 | | | | 12,770 | |
FirstGroup PLC | | | | | | | | | | | 3,600 | | | | 20,250 | (a) |
Total Road & Rail | | | | | | | | | | | | | | | 63,853 | |
Trading Companies & Distributors — 0.1% | | | | | | | | | | | | | | | | |
Mitsui & Co., Ltd. | | | | | | | | | | | 1,100 | | | | 17,181 | (a) |
Total Industrials | | | | | | | | | | | | | | | 521,182 | |
| Information Technology — 0.3% | | | | | | | | | | | | | | | | |
Electronic Equipment, Instruments & Components — 0.3% | | | | | | | | | | | | | | | | |
Arrow Electronics Inc. | | | | | | | | | | | 531 | | | | 16,466 | * |
Hitachi Ltd. | | | | | | | | | | | 4,000 | | | | 18,928 | (a) |
Tech Data Corp. | | | | | | | | | | | 344 | | | | 15,160 | * |
Total Information Technology | | | | | | | | | | | | | | | 50,554 | |
| Materials — 2.1% | | | | | | | | | | | | | | | | |
Chemicals — 1.2% | | | | | | | | | | | | | | | | |
BASF SE | | | | | | | | | | | 511 | | | | 38,199 | (a) |
Celanese Corp., Series A Shares | | | | | | | | | | | 500 | | | | 18,500 | |
E.I. du Pont de Nemours & Co. | | | | | | | | | | | 650 | | | | 30,544 | |
Eastman Chemical Co. | | | | | | | | | | | 262 | | | | 20,386 | |
JSR Corp. | | | | | | | | | | | 1,400 | | | | 23,774 | (a) |
Lanxess AG | | | | | | | | | | | 430 | | | | 30,341 | (a) |
LG Chem Ltd. | | | | | | | | | | | 80 | | | | 26,729 | (a) |
Lubrizol Corp. | | | | | | | | | | | 250 | | | | 26,140 | |
Yara International ASA | | | | | | | | | | | 400 | | | | 19,022 | (a) |
Total Chemicals | | | | | | | | | | | | | | | 233,635 | |
Metals & Mining — 0.9% | | | | | | | | | | | | | | | | |
BHP Billiton Ltd. | | | | | | | | | | | 400 | | | | 16,443 | (a) |
Cherepovets MK Severstal, GDR, Registered Shares | | | | | | | | | | | 1,308 | | | | 18,482 | |
Mining & Metallurgical Co. Norilsk Nickel, ADR | | | | | | | | | | | 1,700 | | | | 33,949 | |
Rio Tinto Ltd. | | | | | | | | | | | 200 | | | | 15,702 | (a) |
See Notes to Consolidated Financial Statements.
| | | | |
| Legg Mason Strategic Real Return Fund 2010 Annual Report | | | 17 | |
Legg Mason Strategic Real Return Fund
| | | | | | | | | | | | | | | | |
| Security | | | | | | | | Shares | | | Value | |
Metals & Mining — continued | | | | | | | | | | | | | | | | |
Rio Tinto PLC | | | | | | | | | | | 376 | | | $ | 23,824 | (a) |
Teck Cominco Ltd., Class B Shares | | | | | | | | | | | 400 | | | | 19,876 | |
Vale SA, ADR | | | | | | | | | | | 1,600 | | | | 50,688 | |
Total Metals & Mining | | | | | | | | | | | | | | | 178,964 | |
Total Materials | | | | | | | | | | | | | | | 412,599 | |
| Utilities — 1.7% | | | | | | | | | | | | | | | | |
Electric Utilities — 1.1% | | | | | | | | | | | | | | | | |
DPL Inc. | | | | | | | | | | | 960 | | | | 24,317 | |
Entergy Corp. | | | | | | | | | | | 226 | | | | 16,100 | |
Exelon Corp. | | | | | | | | | | | 850 | | | | 33,464 | |
FirstEnergy Corp. | | | | | | | | | | | 432 | | | | 15,168 | |
HongKong Electric Holdings Ltd. | | | | | | | | | | | 4,500 | | | | 28,844 | (a) |
Kansai Electric Power Co. Inc. | | | | | | | | | | | 1,100 | | | | 26,446 | (a) |
Kyushu Electric Power Co. Inc. | | | | | | | | | | | 1,000 | | | | 22,178 | (a) |
Tokyo Electric Power Co. Inc. | | | | | | | | | | | 1,600 | | | | 37,261 | (a) |
Total Electric Utilities | | | | | | | | | | | | | | | 203,778 | |
Gas Utilities — 0.1% | | | | | | | | | | | | | | | | |
Gas Natural SDG SA | | | | | | | | | | | 885 | | | | 11,951 | (a) |
Snam Rete Gas SpA | | | | | | | | | | | 3,490 | | | | 16,576 | (a) |
Total Gas Utilities | | | | | | | | | | | | | | | 28,527 | |
Independent Power Producers & Energy Traders — 0.2% | | | | | | | | | | | | | | | | |
AES Corp. | | | | | | | | | | | 1,383 | | | | 14,950 | * |
Drax Group PLC | | | | | | | | | | | 3,500 | | | | 19,264 | (a) |
Total Independent Power Producers & Energy Traders | | | | | | | | | | | | | | | 34,214 | |
Multi-Utilities — 0.2% | | | | | | | | | | | | | | | | |
Integrys Energy Group Inc. | | | | | | | | | | | 336 | | | | 16,363 | |
PG&E Corp. | | | | | | | | | | | 379 | | | | 17,787 | |
Total Multi-Utilities | | | | | | | | | | | | | | | 34,150 | |
Water Utilities — 0.1% | | | | | | | | | | | | | | | | |
Severn Trent PLC | | | | | | | | | | | 1,000 | | | | 22,481 | (a) |
Total Utilities | | | | | | | | | | | | | | | 323,150 | |
Total Common Stocks (Cost — $4,247,381) | | | | | | | | | | | | | | | 4,450,091 | |
| Investment In Underlying Funds — 15.3% | | | | | | | | | | | | | | | | |
iShares Trust — iShares Barclays TIPS Bond Fund | | | | | | | | | | | 1,070 | | | | 117,144 | |
iShares Trust — iShares MSCI EAFE Index Fund | | | | | | | | | | | 4,100 | | | | 222,425 | |
iShares Trust — iShares MSCI Japan Index Fund | | | | | | | | | | | 38,826 | | | | 398,743 | |
Rydex Series Funds — Managed Futures Strategy Fund, H-Class Shares | | | | | | | | | | | 20,783 | | | | 510,641 | * |
See Notes to Consolidated Financial Statements.
| | |
| 18 | | Legg Mason Strategic Real Return Fund 2010 Annual Report |
Consolidated schedule of investments (cont’d)
November 30, 2010
Legg Mason Strategic Real Return Fund
| | | | | | | | | | | | | | | | |
| Security | | | | | | | | Shares | | | Value | |
| Investment In Underlying Funds — continued | | | | | | | | | | | | | | | | |
Vanguard Specialized Funds — Vanguard REIT Index Fund, ETF Shares | | | | | | | | | | | 27,405 | | | $ | 1,467,264 | |
Vanguard Total Stock Market ETF | | | | | | | | | | | 3,818 | | | | 233,012 | |
Total Investment In Underlying Funds (Cost—2,726,299) | | | | | | | | | | | | | | | 2,949,229 | |
| Preferred Stocks — 0.6% | | | | | | | | | | | | | | | | |
| Financials — 0.6% | | | | | | | | | | | | | | | | |
Commercial Banks — 0.6% | | | | | | | | | | | | | | | | |
Banco Bradesco SA | | | | | | | | | | | 2,200 | | | | 43,073 | |
Itau Unibanco Holding SA | | | | | | | | | | | 1,800 | | | | 41,205 | |
Itausa — Investimentos Itau SA | | | | | | | | | | | 3,000 | | | | 22,676 | |
Total Preferred Stocks (Cost — $97,893) | | | | | | | | | | | | | | | 106,954 | |
| | | Rate | | | Maturity
Date | | | Face
Amount | | | | |
| U.S. Treasury Inflation Protected Securities — 36.6% | | | | | | | | | | | | | | | | |
| U.S. Treasury Bonds, Inflation Indexed | | | 2.375 | % | | | 1/15/25 | | | $ | 834,358 | | | | 959,968 | (b) |
| U.S. Treasury Bonds, Inflation Indexed | | | 2.000 | % | | | 1/15/26 | | | | 264,132 | | | | 290,875 | |
| U.S. Treasury Bonds, Inflation Indexed | | | 3.625 | % | | | 4/15/28 | | | | 540,212 | | | | 723,462 | |
| U.S. Treasury Bonds, Inflation Indexed | | | 2.500 | % | | | 1/15/29 | | | | 10,174 | | | | 12,016 | |
| U.S. Treasury Bonds, Inflation Indexed | | | 3.875 | % | | | 4/15/29 | | | | 132,873 | | | | 185,046 | |
| U.S. Treasury Bonds, Inflation Indexed | | | 2.125 | % | | | 2/15/40 | | | | 434,567 | | | | 482,607 | |
| U.S. Treasury Notes, Inflation Indexed | | | 2.000 | % | | | 4/15/12 | | | | 355,229 | | | | 366,191 | |
| U.S. Treasury Notes, Inflation Indexed | | | 2.000 | % | | | 1/15/14 | | | | 35,465 | | | | 38,100 | |
| U.S. Treasury Notes, Inflation Indexed | | | 2.000 | % | | | 7/15/14 | | | | 591,003 | | | | 640,638 | |
| U.S. Treasury Notes, Inflation Indexed | | | 1.625 | % | | | 1/15/15 | | | | 125,837 | | | | 135,117 | (b) |
| U.S. Treasury Notes, Inflation Indexed | | | 0.500 | % | | | 4/15/15 | | | | 362,862 | | | | 373,578 | |
| U.S. Treasury Notes, Inflation Indexed | | | 1.875 | % | | | 7/15/15 | | | | 819,790 | | | | 895,812 | |
| U.S. Treasury Notes, Inflation Indexed | | | 2.625 | % | | | 7/15/17 | | | | 627,094 | | | | 727,675 | |
| U.S. Treasury Notes, Inflation Indexed | | | 1.625 | % | | | 1/15/18 | | | | 208,534 | | | | 227,709 | |
| U.S. Treasury Notes, Inflation Indexed | | | 1.875 | % | | | 7/15/19 | | | | 368,291 | | | | 409,982 | |
| U.S. Treasury Notes, Inflation Indexed | | | 1.250 | % | | | 7/15/20 | | | | 570,912 | | | | 600,528 | |
| Total U.S. Treasury Inflation Protected Securities (Cost — $6,775,071) | | | | 7,069,304 | |
| Non-U.S. Treasury Inflation Protected Securities — 0.9% | | | | | | | | | | | | | | | | |
Australia — 0.9% | | | | | | | | | | | | | | | | |
Australia Government, Bonds | | | 4.000 | % | | | 8/20/20 | | | | 60,000 | | | | 93,424 | |
Australia Government, Bonds | | | 3.000 | % | | | 9/20/25 | | | | 70,000 | | | | 72,012 | |
Total Non-U.S. Treasury Inflation Protected Securities (Cost — $167,389) | | | | | | | | 165,436 | |
See Notes to Consolidated Financial Statements.
| | | | |
| Legg Mason Strategic Real Return Fund 2010 Annual Report | | | 19 | |
Legg Mason Strategic Real Return Fund
| | | | | | | | | | | | | | | | |
| Security | | Rate | | | Maturity
Date | | | Face
Amount | | | Value | |
| Corporate Bonds & Notes — 0.4% | | | | | | | | | | | | | | | | |
| Consumer Staples — 0.1% | | | | | | | | | | | | | | | | |
Beverages — 0.1% | | | | | | | | | | | | | | | | |
Anheuser-Busch InBev Worldwide Inc., Senior Notes | | | 3.625 | % | | | 4/15/15 | | | $ | 10,000 | | | $ | 10,517 | |
| Financials — 0.3% | | | | | | | | | | | | | | | | |
Capital Markets — 0.1% | | | | | | | | | | | | | | | | |
Goldman Sachs Group Inc., Notes | | | 4.750 | % | | | 7/15/13 | | | | 20,000 | | | | 21,347 | |
Consumer Finance — 0.1% | | | | | | | | | | | | | | | | |
SLM Corp., Medium-Term Notes | | | 8.000 | % | | | 3/25/20 | | | | 15,000 | | | | 15,075 | |
Diversified Financial Services — 0.1% | | | | | | | | | | | | | | | | |
Bank of America Corp., Senior Notes | | | 4.500 | % | | | 4/1/15 | | | | 10,000 | | | | 10,254 | |
Citigroup Inc., Senior Notes | | | 6.000 | % | | | 12/13/13 | | | | 25,000 | | | | 27,344 | |
Total Diversified Financial Services | | | | | | | | | | | | | | | 37,598 | |
Total Financials | | | | | | | | | | | | | | | 74,020 | |
Total Corporate Bonds & Notes (Cost — $80,685) | | | | | | | | 84,537 | |
| | | | | | Expiration
Date | | | Contracts | | | | |
| Purchased Options — 0.0% | | | | | | | | | | | | | | | | |
U.S. Dollar/Euro, Call @ $1.35 | | | | | | | 12/15/10 | | | | 100,000 | | | | 3,856 | (a) |
Total Purchased Options (Cost — $790) | | | | | | | | | | | | 3,856 | |
| | | | | | | | | Shares | | | | |
| Rights — 0.0% | | | | | | | | | | | | | | | | |
Industrial & Commercial Bank of China Ltd. (Cost — $0) | | | | | | | 12/16/10 | | | | 765 | | | | 251 | *(a) |
Total Investments before Short-Term Investments (Cost — $14,095,508) | | | | 14,829,658 | |
| | | | | | Maturity
Date | | | Face
Amount | | | | |
| Short-Term Investments — 16.7% | | | | | | | | | | | | | | | | |
Repurchase Agreements — 16.7% | | | | | | | | | | | | | | | | |
Goldman Sachs & Co. repurchase agreement dated 11/30/10; Proceeds at maturity — $2,468,592; (Fully collateralized by U.S. government agency obligations, 0.875% due 12/12/14; Market value — $2,523,767) | | | 0.210 | % | | | 12/1/10 | | | $ | 2,468,578 | | | | 2,468,578 | |
State Street Bank & Trust Co. repurchase agreement dated 11/30/10; Proceeds due at maturity — $758,000; (Fully collateralized by various U.S. Treasury Notes, 2.125% to 2.500% due 4/30/15 to 5/31/15; Market Value — $778,505) | | | 0.010 | % | | | 12/1/10 | | | | 758,000 | | | | 758,000 | |
Total Short-Term Investments (Cost — $3,226,578) | | | | | | | | | | | | | | | 3,226,578 | |
Total Investments — 93.6% (Cost — $17,322,086#) | | | | | | | | | | | | | | | 18,056,236 | |
Other Assets in Excess of Liabilities — 6.4% | | | | | | | | | | | | | | | 1,243,708 | |
Total Net Assets — 100.0% | | | | | | | | | | | | | | $ | 19,299,944 | |
See Notes to Consolidated Financial Statements.
| | |
| 20 | | Legg Mason Strategic Real Return Fund 2010 Annual Report |
Consolidated schedule of investments (cont’d)
November 30, 2010
Legg Mason Strategic Real Return Fund
| * | Non-income producing security. |
| (a) | Security is valued in good faith at fair value in accordance with procedures approved by the Board of Trustees (See Note 1). |
| (b) | All or a portion of this security is held at the broker as collateral for open futures contracts. |
| # | Aggregate cost for federal income tax purposes is $17,445,338. |
| | |
Abbreviations used in this schedule: |
| ADR | | — American Depositary Receipt |
| GDR | | — Global Depositary Receipt |
See Notes to Consolidated Financial Statements.
| | | | |
| Legg Mason Strategic Real Return Fund 2010 Annual Report | | | 21 | |
Consolidated statement of assets and liabilities
November 30, 2010
| | | | |
| |
| Assets: | | | | |
Investments, at value (Cost — $14,095,508) | | $ | 14,829,658 | |
Repurchase agreement, at value (Cost — $3,226,578) | | | 3,226,578 | |
Foreign currency collateral for open futures contracts, at value (Cost — $5,152) | | | 5,469 | |
Foreign currency, at value (Cost — $3,975) | | | 3,953 | |
Cash | | | 2,057 | |
Deposits with brokers for open futures contracts | | | 1,018,808 | |
Deposits with brokers for swap contracts | | | 250,000 | |
Unrealized appreciation on forward foreign currency contracts | | | 105,210 | |
Receivable from investment manager | | | 55,204 | |
Dividends and interest receivable | | | 54,958 | |
Receivable for Fund shares sold | | | 3,154 | |
Prepaid expenses | | | 13,690 | |
Total Assets | | | 19,568,739 | |
| |
| Liabilities: | | | | |
Unrealized depreciation on swaps | | | 65,032 | |
Payable to broker — variation margin on open futures contracts | | | 57,818 | |
Payable for offering costs | | | 32,120 | |
Unrealized depreciation on forward foreign currency contracts | | | 26,753 | |
Distribution fees payable | | | 4,456 | |
Trustees’ fees payable | | | 219 | |
Payable for securities purchased | | | 2 | |
Accrued expenses | | | 82,395 | |
Total Liabilities | | | 268,795 | |
| Total Net Assets | | $ | 19,299,944 | |
| |
| Net Assets: | | | | |
Par value (Note 6) | | $ | 15 | |
Paid-in capital in excess of par value | | | 18,188,907 | |
Undistributed net investment income | | | 525,002 | |
Accumulated net realized loss on investments, futures contracts, written options, swap contracts and foreign currency transactions | | | (104,479) | |
Net unrealized appreciation on investments, futures contracts, written options, swap contracts and foreign currencies | | | 690,499 | |
| Total Net Assets | | $ | 19,299,944 | |
See Notes to Consolidated Financial Statements.
| | |
| 22 | | Legg Mason Strategic Real Return Fund 2010 Annual Report |
Consolidated statement of assets and liabilities (cont’d)
| | | | |
| |
| Shares Outstanding: | | | | |
Class A | | | 1,372,178 | |
Class C | | | 79,975 | |
Class I | | | 64,541 | |
| |
| Net Asset Value: | | | | |
Class A (and redemption price) | | | $12.73 | |
Class C* | | | $12.66 | |
Class I (and redemption price) | | | $12.75 | |
| Maximum Public Offering Price Per Share: | | | | |
Class A (based on maximum initial sales charge of 5.75%) | | | $13.51 | |
| * | Redemption price per share is NAV of Class C shares reduced by a 1.00% CDSC if shares are redeemed within one year from purchase payment (See Note 2). |
See Notes to Consolidated Financial Statements.
| | | | |
| Legg Mason Strategic Real Return Fund 2010 Annual Report | | | 23 | |
Consolidated statement of operations
For the Period Ended November 30, 2010†
| | | | |
| |
| Investment Income: | | | | |
Dividends | | $ | 139,684 | |
Interest | | | 109,808 | |
Less: Foreign taxes withheld | | | (5,628) | |
Total Investment Income | | | 243,864 | |
| |
| Expenses: | | | | |
Offering costs | | | 208,050 | |
Investment management fee (Note 2) | | | 97,354 | |
Custody fees | | | 63,498 | |
Organization fees | | | 63,164 | |
Audit and tax | | | 55,600 | |
Distribution fees (Notes 2 and 5) | | | 35,496 | |
Trustees’ fees | | | 32,873 | |
Shareholder reports | | | 30,281 | |
Legal fees | | | 26,003 | |
Transfer agent fees (Note 5) | | | 5,213 | |
Registration fees | | | 5,076 | |
Insurance | | | 450 | |
Miscellaneous expenses | | | 4,079 | |
Total Expenses | | | 627,137 | |
Less: Fee waivers and/or expense reimbursements (Notes 2 and 5) | | | (460,694) | |
Net Expenses | | | 166,443 | |
| Net Investment Income | | | 77,421 | |
| |
| Realized and Unrealized Gain (Loss) on Investments, Futures Contracts, Written Options, Swap Contracts and Foreign Currency Transactions (Notes 1, 3 and 4): | | | | |
Net Realized Gain (Loss) From: | | | | |
Investment transactions | | | 48,802 | |
Futures contracts | | | (122,916) | |
Written options | | | 5,021 | |
Swap contracts | | | 85,141 | |
Foreign currency transactions | | | 245,286 | |
Net Realized Gain | | | 261,334 | |
Change in Net Unrealized Appreciation (Depreciation) From: | | | | |
Investments | | | 734,150 | |
Futures contracts | | | (57,277) | |
Swap contracts | | | (65,032) | |
Foreign currencies | | | 78,658 | |
Change in Net Unrealized Appreciation (Depreciation) | | | 690,499 | |
Net Gain on Investments, Futures Contracts, Written Options, Swap Contracts and
Foreign Currency Transactions | | | 951,833 | |
| Increase in Net Assets From Operations | | $ | 1,029,254 | |
| † | For the period February 26, 2010 (inception date) to November 30, 2010. |
See Notes to Consolidated Financial Statements.
| | |
| 24 | | Legg Mason Strategic Real Return Fund 2010 Annual Report |
Consolidated statement of changes in net assets
For the Period Ended November 30, 2010†
| | | | |
| | | 2010† | |
| |
| Operations: | | | | |
Net investment income | | $ | 77,421 | |
Net realized gain | | | 261,334 | |
Change in net unrealized appreciation (depreciation) | | | 690,499 | |
Increase in Net Assets From Operations | | | 1,029,254 | |
| |
| Fund Share Transactions (Note 6): | | | | |
Net proceeds from sale of shares | | | 18,794,552 | |
Cost of shares repurchased | | | (523,862) | |
Increase in Net Assets From Fund Share Transactions | | | 18,270,690 | |
Increase in Net Assets | | | 19,299,944 | |
| |
| Net Assets: | | | | |
Beginning of year | | | — | |
End of year* | | $ | 19,299,944 | |
* Includes undistributed net investment income of: | | | $525,002 | |
| † | For the period February 26, 2010 (inception date) to November 30, 2010. |
See Notes to Consolidated Financial Statements.
| | | | |
| Legg Mason Strategic Real Return Fund 2010 Annual Report | | | 25 | |
Consolidated financial highlights
| | | | |
| For a share of each class of beneficial interest outstanding throughout the period ended November 30: | |
| Class A Shares1 | | 20102 | |
| |
| Net asset value, beginning of period | | | $ 12.00 | |
| |
| Income from operations: | | | | |
Net investment income | | | 0.06 | |
Net realized and unrealized gain | | | 0.67 | |
Total income from operations | | | 0.73 | |
| |
| Net asset value, end of period | | | $12.73 | |
Total return3 | | | 6.08 | % |
| |
| Net assets, end of period (000s) | | | $17,464 | |
| |
| Ratios to average net assets: | | | | |
Gross expenses4,5 | | | 4.81 | % |
Net expenses4,5,6,7 | | | 1.26 | |
Net investment income5 | | | 0.63 | |
| |
| Portfolio turnover rate | | | 42 | % |
| 1 | Per share amounts have been calculated using the average shares method. |
| 2 | For the period February 26, 2010 (inception date) to November 30, 2010 (unaudited). |
| 3 | Performance figures, exclusive of sales charges, may reflect compensating balance arrangements, fee waivers and/or expense reimbursements. In the absence of compensating balance arrangements, fee waivers and/or expense reimbursements, the total return would have been lower. Past performance is no guarantee of future results. Total returns for periods of less than one year are not annualized. |
| 4 | Does not include expenses of the Underlying Funds in which the Fund invests. |
| 6 | As a result of an expense limitation arrangement, the ratio of expenses, other than brokerage, interest, taxes and extraordinary expenses (except for brokerage commissions paid on purchase and sales of ETFs), to average net assets of Class A shares will not exceed 1.35% until December 31, 2012. Acquired fund fees and expenses are subject to the expense limitation arrangement. |
| 7 | Reflects fee waivers and/or expense reimbursements. |
See Notes to Consolidated Financial Statements.
| | |
| 26 | | Legg Mason Strategic Real Return Fund 2010 Annual Report |
Consolidated financial highlights (cont’d)
| | | | |
| For a share of each class of beneficial interest outstanding throughout the period ended November 30: | |
| Class C Shares1 | | 20102 | |
| |
| Net asset value, beginning of period | | | $12.00 | |
| |
| Income (loss) from operations: | | | | |
Net investment loss | | | (0.02) | |
Net realized and unrealized gain | | | 0.68 | |
Total income from operations | | | 0.66 | |
| |
| Net asset value, end of period | | | $12.66 | |
Total return3 | | | 5.50 | % |
| |
| Net assets, end of period (000s) | | | $1,013 | |
| |
| Ratios to average net assets: | | | | |
Gross expenses4,5 | | | 5.44 | % |
Net expenses4,5,6,7 | | | 2.01 | |
Net investment loss5 | | | (0.22) | |
| |
| Portfolio turnover rate | | | 42 | % |
| 1 | Per share amounts have been calculated using the average shares method. |
| 2 | For the period February 26, 2010 (inception date) to November 30, 2010 (unaudited). |
| 3 | Performance figures, exclusive of CDSC, may reflect compensating balance arrangements, fee waivers and/or expense reimbursements. In the absence of compensating balance arrangements, fee waivers and/or expense reimbursements, the total return would have been lower. Past performance is no guarantee of future results. Total returns for periods of less than one year are not annualized. |
| 4 | Does not include expenses of the Underlying Funds in which the Fund invests. |
| 6 | As a result of an expense limitation arrangement, the ratio of expenses, other than brokerage, interest, taxes and extraordinary expenses (except for brokerage commissions paid on purchase and sales of ETFs), to average net assets of Class C shares will not exceed 2.10% until December 31, 2012. Acquired fund fees and expenses are subject to the expense limitation arrangement. |
| 7 | Reflects fee waivers and/or expense reimbursements. |
See Notes to Consolidated Financial Statements.
| | | | |
| Legg Mason Strategic Real Return Fund 2010 Annual Report | | | 27 | |
| | | | |
| For a share of each class of beneficial interest outstanding throughout the period ended November 30: | |
| Class I Shares1 | | 20102 | |
| |
| Net asset value, beginning of period | | | $12.00 | |
| |
| Income from operations: | | | | |
Net investment income | | | 0.05 | |
Net realized and unrealized gain | | | 0.70 | |
Total income from operations | | | 0.75 | |
| |
| Net asset value, end of period | | | $12.75 | |
Total return3 | | | 6.25 | % |
| |
| Net assets, end of period (000s) | | | $823 | |
| |
| Ratios to average net assets: | | | | |
Gross expenses4,5 | | | 4.67 | % |
Net expenses4,5,6,7 | | | 1.01 | |
Net investment income5 | | | 0.50 | |
| |
| Portfolio turnover rate | | | 42 | % |
| 1 | Per share amounts have been calculated using the average shares method. |
| 2 | For the period February 26, 2010 (inception date) to November 30, 2010 (unaudited). |
| 3 | Performance figures may reflect compensating balance arrangements, fee waivers and/or expense reimbursements. In the absence of compensating balance arrangements, fee waivers and/or expense reimbursements, the total return would have been lower. Past performance is no guarantee of future results. Total returns for periods of less than one year are not annualized. |
| 4 | Does not include expenses of the Underlying Funds in which the Fund invests. |
| 6 | As a result of an expense limitation arrangement, the ratio of expenses, other than brokerage, interest, taxes and extraordinary expenses (except for brokerage commissions paid on purchase and sales of ETFs), to average net assets of Class I shares will not exceed 1.10% until December 31, 2012. Acquired fund fees and expenses are subject to the expense limitation arrangement. |
| 7 | Reflects fee waivers and/or expense reimbursements. |
See Notes to Consolidated Financial Statements.
| | |
| 28 | | Legg Mason Strategic Real Return Fund 2010 Annual Report |
Notes to consolidated financial statements
1. Organization and significant accounting policies
Legg Mason Strategic Real Return Fund (the “Fund”), is a separate non-diversified series of Legg Mason Global Asset Management Trust (the “Trust”). The Trust, a Maryland statutory trust, is registered under the Investment Company Act of 1940, as amended (the “1940 Act”), as an open-end management investment company.
The Fund intends to gain exposure to the commodities markets by investing a portion of its assets in a wholly-owned subsidiary, Real Return Fund Ltd., organized under the laws of the Cayman Islands (the “Subsidiary”). Among other investments, the Subsidiary may invest in commodity-linked instruments. These financial statements are consolidated financial statements of the Fund and the Subsidiary.
The following are significant accounting policies consistently followed by the Fund and are in conformity with U.S. generally accepted accounting principles (“GAAP”). Estimates and assumptions are required to be made regarding assets, liabilities and changes in net assets resulting from operations when financial statements are prepared. Changes in the economic environment, financial markets and any other parameters used in determining these estimates could cause actual results to differ. Subsequent events have been evaluated through the date the financial statements were issued.
(a) Investment valuation. Equity securities for which market quotations are available are valued at the last reported sales price or official closing price on the primary market or exchange on which they trade. Debt securities are valued at the last quoted bid price provided by an independent pricing service, which is based on transactions in debt obligations, quotations from bond dealers, market transactions in comparable securities and various other relationships between securities. Investments in the underlying funds, excluding exchange-traded funds, are valued at the closing net asset value per share of each underlying fund on the day of valuation. Futures contracts are valued daily at the settlement price established by the board of trade or exchange on which they are traded. When reliable prices are not readily available, such as when the value of a security has been significantly affected by events after the close of the exchange or market on which the security is principally traded, but before the Fund calculates its net asset value, the Fund values these securities as determined in accordance with procedures approved by the Fund’s Board of Trustees. Short-term obligations with maturities of 60 days or less are valued at amortized cost, which approximates fair value.
The Fund has adopted Financial Accounting Standards Board Codification Topic 820 (“ASC Topic 820”). ASC Topic 820 establishes a single definition of fair value, creates a three-tier hierarchy as a framework for measuring fair value based on inputs used to value the Fund’s investments, and requires additional disclosure about fair value. The hierarchy of inputs is summarized below.
| Ÿ | | Level 1 — quoted prices in active markets for identical investments |
| Ÿ | | Level 2 — other significant observable inputs (including quoted prices for similar investments, interest rates, prepayment speeds, credit risk, etc.) |
| Ÿ | | Level 3 — significant unobservable inputs (including the Fund’s own assumptions in determining the fair value of investments) |
| | | | |
| Legg Mason Strategic Real Return Fund 2010 Annual Report | | | 29 | |
The inputs or methodology used for valuing securities are not necessarily an indication of the risk associated with investing in those securities.
The Fund uses valuation techniques to measure fair value that are consistent with the market approach and/or income approach, depending on the type of security and the particular circumstance. The market approach uses prices and other relevant information generated by market transactions involving identical or comparable securities. The income approach uses valuation techniques to discount estimated future cash flows to present value.
The following is a summary of the inputs used in valuing the Fund’s assets and liabilities carried at fair value:
| | | | | | | | | | | | | | | | |
| ASSETS | |
| Description | | Quoted Prices
(Level 1) | | | Other Significant Observable Inputs (Level 2) | | | Significant Unobservable Inputs (Level 3) | | | Total | |
| Long-term investments†: | | | | | | | | | | | | | | | | |
Common stocks | | $ | 2,266,618 | | | | 2,183,473 | | | | — | | | $ | 4,450,091 | |
Investments in Underlying Funds | | | 2,949,229 | | | | — | | | | — | | | | 2,949,229 | |
Preferred stocks | | | 106,954 | | | | — | | | | — | | | | 106,954 | |
U.S. treasury inflation protected securities | | | — | | | | 7,069,304 | | | | — | | | | 7,069,304 | |
Non-U.S. treasury inflation protected securities | | | — | | | | 165,436 | | | | — | | | | 165,436 | |
Corporate bonds & notes | | | — | | | | 84,537 | | | | — | | | | 84,537 | |
Purchased options | | | — | | | | 3,856 | | | | — | | | | 3,856 | |
Rights | | | — | | | | 251 | | | | — | | | | 251 | |
| Total long-term investments | | $ | 5,322,801 | | | $ | 9,506,857 | | | | — | | | $ | 14,829,658 | |
| Short-term investments† | | | — | | | | 3,226,578 | | | | — | | | | 3,226,578 | |
| Total investments | | $ | 5,322,801 | | | $ | 12,733,435 | | | | — | | | $ | 18,056,236 | |
| Other financial instruments: | | | | | | | | | | | | | | | | |
Futures contracts | | | 20,498 | | | | — | | | | — | | | | 20,498 | |
Forward foreign currency contracts | | | — | | | | 105,210 | | | | — | | | | 105,210 | |
| Total other financial instruments | | $ | 20,498 | | | $ | 105,210 | | | | — | | | $ | 125,708 | |
| Total | | $ | 5,343,299 | | | $ | 12,838,645 | | | | — | | | $ | 18,181,944 | |
|
| LIABILITIES | |
| Description | | Quoted Prices
(Level 1) | | | Other Significant Observable Inputs (Level 2) | | | Significant Unobservable Inputs (Level 3) | | | Total | |
| Other financial instruments: | | | | | | | | | | | | | | | | |
Futures contracts | | $ | 77,775 | | | | — | | | | — | | | $ | 77,775 | |
Forward foreign currency contracts | | | — | | | $ | 26,753 | | | | — | | | | 26,753 | |
Commodity index swaps | | | — | | | | 65,032 | | | | — | | | | 65,032 | |
| Total | | $ | 77,775 | | | $ | 91,785 | | | | — | | | $ | 169,560 | |
| † | See Schedule of Investments for additional detailed categorizations. |
| | |
| 30 | | Legg Mason Strategic Real Return Fund 2010 Annual Report |
Notes to consolidated financial statements (cont’d)
(b) Repurchase agreements. The Fund may enter into repurchase agreements with institutions that its investment adviser has determined are creditworthy. Each repurchase agreement is recorded at cost. Under the terms of a typical repurchase agreement, the Fund acquires a debt security subject to an obligation of the seller to repurchase, and of the Fund to resell, the security at an agreed-upon price and time, thereby determining the yield during the Fund’s holding period. When entering into repurchase agreements, it is the Fund’s policy that its custodian or a third party custodian, acting on the Fund’s behalf, take possession of the underlying collateral securities, the market value of which, at all times, at least equals the principal amount of the repurchase transaction, including accrued interest. To the extent that any repurchase transaction maturity exceeds one business day, the value of the collateral is marked-to-market and measured against the value of the agreement in an effort to ensure the adequacy of the collateral. If the counterparty defaults, the Fund generally has the right to use the collateral to satisfy the terms of the repurchase transaction. However, if the market value of the collateral declines during the period in which the Fund seeks to assert its rights or if bankruptcy proceedings are commenced with respect to the seller of the security, realization of the collateral by the Fund may be delayed or limited.
(c) Futures contracts. The Fund uses futures contracts to gain exposure to, or hedge against, changes in the value of equities, interest rates, commodities or foreign currencies. A futures contract represents a commitment for the future purchase or sale of an asset at a specified price on a specified date.
Upon entering into a futures contract, the Fund is required to deposit cash or cash equivalents with a broker in an amount equal to a certain percentage of the contract amount. This is known as the “initial margin” and subsequent payments (“variation margin”) are made or received by the Fund each day, depending on the daily fluctuation in the value of the contract. For certain futures, including foreign denominated futures, variation margin is not settled daily, but is recorded as a net variation margin payable or receivable. Futures contracts are valued daily at the settlement price established by the board of trade or exchange on which they are traded. The daily changes in contract value are recorded as unrealized gains or losses in the Consolidated Statement of Operations and the Fund recognizes a realized gain or loss when the contract is closed.
Futures contracts involve, to varying degrees, risk of loss in excess of the amounts reflected in the financial statements. In addition, there is the risk that the Fund may not be able to enter into a closing transaction because of an illiquid secondary market.
(d) Forward foreign currency contracts. The Fund enters into forward foreign currency contracts to maintain its target exposure to foreign currencies. A forward foreign currency contract is an agreement between two parties to buy and sell a currency at a set price with delivery and settlement at a future date. The contract is marked-to-market daily and the change in value is recorded by the Fund as an unrealized gain or loss. When a forward foreign currency contract is closed, through either delivery or offset by entering into another forward foreign currency contract,
| | | | |
| Legg Mason Strategic Real Return Fund 2010 Annual Report | | | 31 | |
the Fund recognizes a realized gain or loss equal to the difference between the value of the contract at the time it was opened and the value of the contract at the time it is closed.
Forward foreign currency contracts involve elements of market risk in excess of the amounts reflected on the Consolidated Statement of Assets and Liabilities. The Fund bears the risk of an unfavorable change in the foreign exchange rate underlying the forward foreign currency contract. Risks may also arise upon entering into these contracts from the potential inability of the counterparties to meet the terms of their contracts.
(e) Written options. The Fund writes options to manage duration, interest rate risk and foreign currency risk. When the Fund writes an option, an amount equal to the premium received by the Fund is recorded as a liability, the value of which is marked-to-market daily to reflect the current market value of the option written. If the option expires, the premium received is recorded as a realized gain. When a written call option is exercised, the difference between the premium received plus the option exercise price and the Fund’s basis in the underlying security (in the case of a covered written call option), or the cost to purchase the underlying security (in the case of an uncovered written call option), including brokerage commission, is recognized as a realized gain or loss. When a written put option is exercised, the amount of the premium received is subtracted from the cost of the security purchased by the Fund from the exercise of the written put option to form the Fund’s basis in the underlying security purchased. The writer or buyer of an option traded on an exchange can liquidate the position before the exercise of the option by entering into a closing transaction. The cost of a closing transaction is deducted from the original premium received resulting in a realized gain or loss to the Fund.
The risk in writing a covered call option is that the Fund may forego the opportunity of profit if the market price of the underlying security increases and the option is exercised. The risk in writing a put option is that the Fund may incur a loss if the market price of the underlying security decreases and the option is exercised. The risk in writing an uncovered call option is that the Fund is exposed to the risk of loss if the market price of the underlying security increases. In addition, there is the risk that the Fund may not be able to enter into a closing transaction because of an illiquid secondary market.
(f) Swap agreements. The Fund invests in swaps for the purpose of managing its exposure to commodities markets. The use of swaps involves risks that are different from those associated with other portfolio transactions.
Swap contracts are marked-to-market daily and changes in value are recorded as unrealized appreciation (depreciation). Gains or losses are realized upon termination of the swap agreement. Collateral, in the form of restricted cash or securities, may be required to be held in segregated accounts with the Fund’s custodian in compliance with the terms of the swap contracts. Securities posted as collateral for swap contracts are identified in the Consolidated Schedule of Investments and restricted cash, if any, is identified on the Consolidated Statement of Assets and Liabilities. Risks may exceed amounts recorded in the Consolidated Statement of Assets and
| | |
| 32 | | Legg Mason Strategic Real Return Fund 2010 Annual Report |
Notes to consolidated financial statements (cont’d)
Liabilities. These risks include changes in the returns of the underlying instruments, failure of the counterparties to perform under the contracts’ terms, and the possible lack of liquidity with respect to the swap agreements.
Payments received or made at the beginning of the measurement period are reflected as a premium or deposit, respectively, on the Consolidated Statement of Assets and Liabilities. These upfront payments are amortized over the life of the swap and are recognized as realized gain or loss in the Consolidated Statement of Operations. Net periodic payments received or paid by the Fund as well as liquidation payments received or made at the termination of the swap are recognized as realized gains or losses in the Consolidated Statement of Operations.
Commodity swaps
The Fund may enter into commodity swaps. Commodity swaps are agreements between two parties to exchange cash flows based upon changes to a commodity reference price for a specified notional principal amount. To the extent the commodity reference price exceeds the offsetting interest obligation, the Fund will receive a payment from the counterparty. To the extent it is less, the Fund will make a payment to the counterparty. The risks of commodity swaps include changes in market conditions that will affect the value of the contract or changes in the present value of the future cash flow streams and the possible inability of the counterparty to fulfill its obligations under the agreement. The Fund’s maximum risk of loss from counterparty credit risk is the discounted net value of the cash flows to be received from the counterparty over the contract’s remaining life, to the extent that the amount is positive.
(g) Foreign investment risks. The Fund’s investments in foreign securities may involve risks not present in domestic investments. Since securities may be denominated in foreign currencies, may require settlement in foreign currencies or pay interest or dividends in foreign currencies, changes in the relationship of these foreign currencies to the U.S. dollar can significantly affect the value of the investments and earnings of the Fund. Foreign investments may also subject the Fund to foreign government exchange restrictions, expropriation, taxation or other political, social or economic developments, all of which affect the market and/or credit risk of the investments.
(h) Foreign currency translation. Investment securities and other assets and liabilities denominated in foreign currencies are translated into U.S. dollar amounts based upon prevailing exchange rates on the date of valuation. Purchases and sales of investment securities and income and expense items denominated in foreign currencies are translated into U.S. dollar amounts based upon prevailing exchange rates on the respective dates of such transactions.
The Fund does not isolate that portion of the results of operations resulting from fluctuations in foreign exchange rates on investments from the fluctuations arising from changes in market prices of securities held. Such fluctuations are included with the net realized and unrealized gain or loss on investments.
| | | | |
| Legg Mason Strategic Real Return Fund 2010 Annual Report | | | 33 | |
Net realized foreign exchange gains or losses arise from sales of foreign currencies, including gains and losses on forward foreign currency contracts, currency gains or losses realized between the trade and settlement dates on securities transactions, and the difference between the amounts of dividends, interest, and foreign withholding taxes recorded on the Fund’s books and the U.S. dollar equivalent of the amounts actually received or paid. Net unrealized foreign exchange gains and losses arise from changes in the values of assets and liabilities, other than investments in securities, on the date of valuation, resulting from changes in exchange rates.
Foreign security and currency transactions may involve certain considerations and risks not typically associated with those of U.S. dollar denominated transactions as a result of, among other factors, the possibility of lower levels of governmental supervision and regulation of foreign securities markets and the possibility of political or economic instability.
(i) Inflation-indexed bonds. Inflation-indexed bonds are fixed-income securities whose principal value or interest rate is periodically adjusted according to the rate of inflation. As the index measuring inflation changes, the principal value or interest rate of inflation-indexed bonds will be adjusted accordingly. Inflation adjustments to the principal amount of inflation-indexed bonds are reflected as an increase or decrease to investment income on the Consolidated Statement of Operations. Repayment of the original bond principal upon maturity (as adjusted for inflation) is guaranteed in the case of U.S. Treasury inflation-indexed bonds. For bonds that do not provide a similar guarantee, the adjusted principal value of the bond repaid at maturity may be less than the original principal.
(j) Security transactions and investment income. Security transactions are accounted for on a trade date basis. Interest income, adjusted for amortization of premium and accretion of discount, is recorded on the accrual basis. Dividend income is recorded on the ex-dividend date. Foreign dividend income is recorded on the ex-dividend date or as soon as practicable after the Fund determines the existence of a dividend declaration after exercising reasonable due diligence. The cost of investments sold is determined by use of the specific identification method. To the extent any issuer defaults or a credit event occurs that impacts the issuer, the Fund may halt any additional interest income accruals and consider the realizability of interest accrued up to the date of default or credit event.
(k) Distributions to shareholders. Distributions from net investment income and distributions of net realized gains, if any, are declared at least annually. Distributions to shareholders of the Fund are recorded on the ex-dividend date and are determined in accordance with income tax regulations, which may differ from GAAP.
(l) REIT distributions. The character of distributions received from Real Estate Investment Trusts (“REITs”) held by the Fund is generally comprised of net investment income, capital gains, and return of capital. It is the policy of the Fund to estimate the character of distributions received from underlying REITs based on historical data provided by the REITs. After each calendar year end, REITs report the actual tax character of these distributions. Differences between the estimated and
| | |
| 34 | | Legg Mason Strategic Real Return Fund 2010 Annual Report |
Notes to consolidated financial statements (cont’d)
actual amounts reported by the REITs are reflected in the Fund’s records in the year in which they are reported by the REITs by adjusting related investment cost basis, capital gains and income, as necessary.
(m) Compensating balance arrangements. The Fund has an arrangement with its custodian bank whereby a portion of the custodian’s fees is paid indirectly by credits earned on the Fund’s cash deposit with the bank.
(n) Share class accounting. Investment income, common expenses and realized/unrealized gains (losses) on investments are allocated to the various classes of the Fund on the basis of daily net assets of each class. Fees relating to a specific class are charged directly to that share class.
(o) Federal and other taxes. It is the Fund’s policy to comply with the federal income and excise tax requirements of the Internal Revenue Code of 1986 (the “Code”), as amended, applicable to regulated investment companies. Accordingly, the Fund intends to distribute its taxable income and net realized gains, if any, to shareholders in accordance with timing requirements imposed by the Code. Therefore, no federal or state income tax provision is required in the Fund’s financial statements.
Management has analyzed the Fund’s tax positions taken on income tax returns for all open tax years and has concluded that as of November 30, 2010, no provision for income tax is required in the Fund’s financial statements. The Fund’s federal and state income and federal excise tax returns for tax years for which the applicable statutes of limitations have not expired are subject to examination by Internal Revenue Service and state departments of revenue.
Under the applicable foreign tax laws, a withholding tax may be imposed on interest, dividends and capital gains at various rates.
(p) Reclassification. GAAP requires that certain components of net assets be reclassified to reflect permanent differences between financial and tax reporting. These reclassifications have no effect on net assets or net asset values per share. During the current year, the following reclassifications have been made:
| | | | | | | | | | | | |
| | | Undistributed Net Investment Income | | | Accumulated Net Realized Loss | | | Paid-in
Capital | |
| (a) | | $ | 81,768 | | | | — | | | $ | (81,768) | |
| (b) | | | 365,813 | | | $ | (365,813) | | | | — | |
| (a) | Reclassifications are primarily due to a non-deductible 12b-1 fees and non-deductible organization costs for tax purposes. |
| (b) | Reclassifications are primarily due to foreign currency transactions treated as ordinary income for tax purposes, and differences between book and tax amortization of premium on fixed income securities. |
Additionally, during the current period, Accumulated Realized Gain and Cost of Investments each have been reduced by $9,289 as a result of return of capital distributions paid by REITs. These adjustments have no effect on net assets or asset values per share.
| | | | |
| Legg Mason Strategic Real Return Fund 2010 Annual Report | | | 35 | |
2. Investment management agreement and other transactions with affiliates
Legg Mason Partners Fund Advisor, LLC (“LMPFA”) is the Fund’s investment manager. Legg Mason Global Asset Allocation, LLC (“LMGAA”) is the Fund’s investment adviser. Batterymarch Financial Management, Inc. (“Batterymarch”), ClearBridge Advisors, LLC (“ClearBridge”), Western Asset Management Company (“Western Asset”), Western Asset Management Company Limited (“Western Asset Limited”), and Western Asset Management Company Ltd (“Western Japan”) are the Fund’s subadvisers. LMPFA, LMGAA, Batterymarch, ClearBridge, Western Asset, Western Asset Limited and Western Japan are wholly-owned subsidiaries of Legg Mason, Inc. (“Legg Mason”). ClearBridge did not manage any portion of the Fund’s assets during the reporting period.
Under the management agreement, the Fund pays LMPFA an investment management fee, calculated daily and paid monthly, at an annual rate of 0.75% of the Fund’s average daily net assets.
LMPFA provides administrative and certain oversight services to the Fund. LMPFA delegates to LMGAA the day-to-day portfolio management of the Fund. LMGAA is responsible for monitoring and coordinating the overall management of the Fund, including rebalancing the Fund’s target asset allocations among itself and the subadvisers. LMGAA also provides management for a portion of the Fund’s assets.
LMPFA pays LMGAA for its services to the Fund an advisory fee, calculated daily and paid monthly, at an annual rate of 0.20% of the Fund’s average daily net assets. The Subsidiary has agreed to reimburse the Fund for the fees paid thereby for the services provided by LMGAA to the Subsidiary. LMPFA pays Batterymarch for its services to the Fund a sub-advisory fee, calculated daily and paid monthly, at an annual rate of 0.45% of the average daily net assets managed by Batterymarch. LMPFA pays ClearBridge for its services to the Fund a sub-advisory fee, calculated daily and paid monthly, at an annual rate of 0.35% of the average daily net assets managed by ClearBridge. LMPFA pays Western Asset for its services to the Fund a sub-advisory fee, calculated daily and paid monthly, at an annual rate of 0.25% of the average daily net assets managed by Western Asset. Western Asset pays Western Asset Limited for its services to the Fund a sub-advisory fee, calculated daily and paid monthly, at an annual rate of 0.25% of the average daily net assets managed by Western Asset Limited. Western Asset pays Western Japan for its services to the Fund a sub-advisory fee, calculated daily and paid monthly, at an annual rate of 0.25% of the average daily net assets managed by Western Japan.
The manager has agreed to forgo fees and/or reimburse operating expenses (other than interest, taxes, extraordinary expenses and brokerage commissions (except for brokerage commissions paid on purchases and sales of shares of ETFs)), subject to recapture as described below. As a result, total annual operating expenses will not exceed 1.35%, 2.10% and 1.10% for Class A, Class C and Class I shares, respectively. Acquired fund fees and expenses are subject to the expense limitation agreement, and are calculated based on an average of the net expense ratio (as shown in the most recent prospectus or shareholder report for each acquired fund as of the date
| | |
| 36 | | Legg Mason Strategic Real Return Fund 2010 Annual Report |
Notes to consolidated financial statements (cont’d)
of the fund’s most recent prospectus) of each acquired fund held by the Fund, weighed in proportion to the Fund’s investment allocation among the acquired funds. This arrangement is expected to continue until December 31, 2012, may be terminated prior to that date by agreement of the manager and the Board, and may be terminated at any time after that date by the manager. The arrangement, however, may be modified by the manager to decrease total annual operating expenses at any time.
During the period ended November 30, 2010, LMPFA has forgone and/or reimbursed expenses in the amount of $460,694.
The manager is permitted to recapture amounts previously forgone or reimbursed to a class within three years after the year in which the manager earned the fee or incurred the expense if the class’ total annual operating expenses have fallen to a level below the expense limitation (“expense cap”) in effect at the time the fees were earned or the expense incurred. In no case will the manager recapture any amount that would result, on any particular business day of the Fund, in the class’ total annual operating expenses exceeding the expense cap or any other lower limit then in effect.
Pursuant to these agreements, at November 30, 2010, the Fund had remaining fee waivers and expense reimbursements subject to recapture by LMPFA as follows:
| | | | | | | | | | | | |
| | | Class A | | | Class C | | | Class I | |
| Expires November 2013 | | $ | 430,654 | | | $ | 17,775 | | | $ | 12,265 | |
Total fee waivers/expenses reimbursements
subject to recapture | | $ | 430,654 | | | $ | 17,775 | | | $ | 12,265 | |
For the period ended November 30, 2010, LMPFA did not recapture any fees.
Legg Mason Investor Services, LLC ("LMIS"), a wholly-owned broker-dealer subsidiary of Legg Mason, serves as the Fund’s sole and exclusive distributor.
There is a maximum initial sales charge of 5.75% for Class A shares. There is a contingent deferred sales charge (“CDSC”) of 1.00% on Class C shares, which applies if redemption occurs within one year from purchase payment. In certain cases, Class A shares have a 1.00% CDSC, which applies if redemption occurs within one year from purchase payment. This CDSC only applies to those purchases of Class A shares, which, when combined with current holdings of Class A shares, equal or exceed $1,000,000 in the aggregate. These purchases do not incur an initial sales charge.
For the period ended November 30, 2010, LMIS and its affiliates received sales charges of approximately $3,000 on sales of the Fund’s Class A shares. In addition, there were no CDSCs paid to LMIS and its affiliates for the period ended November 30, 2010.
Under a Deferred Compensation Plan (the “Plan”), Trustees may elect to defer receipt of all or a specified portion of their compensation. A participating Trustee may select one or more funds managed by affiliates of Legg Mason in which his or her deferred trustee’s fees will be deemed to be invested. Deferred amounts remain in the Fund until distributed in accordance with the Plan.
| | | | |
| Legg Mason Strategic Real Return Fund 2010 Annual Report | | | 37 | |
All officers and one Trustee of the Trust are employees of Legg Mason or its affiliates and do not receive compensation from the Trust.
As of November 30, 2010, Legg Mason and its affiliates owned 86% of the Fund.
3. Investments
At November 30, 2010, the aggregate gross unrealized appreciation and depreciation of investments for federal income tax purposes were as follows:
| | | | |
| Gross unrealized appreciation | | $ | 823,377 | |
| Gross unrealized depreciation | | | (212,479) | |
| Net unrealized appreciation | | $ | 610,898 | |
During the period ended November 30, 2010, the aggregate cost of purchases and proceeds from sales of investments (excluding short-term investments) and U.S Government & Agency Obligations were as follows:
| | | | | | | | |
| | | Investments | | | U.S. Government & Agency Obligations | |
| Purchases | | $ | 11,277,030 | | | $ | 8,229,207 | |
| Sales | | | 3,976,684 | | | | 1,494,281 | |
During the period ended November 30, 2010, written option transactions for the Fund were as follows:
| | | | | | | | |
| | | Number of Contracts | | | Premiums | |
| Written options, outstanding February 26, 2010 | | | — | | | | — | |
| Options written | | | 6 | | | $ | 5,184 | |
| Options closed | | | (2) | | | | (962) | |
| Options exercised | | | (2) | | | | (3,056) | |
| Options expired | | | (2) | | | | (1,166) | |
| Written options, outstanding November 30, 2010 | | | — | | | | — | |
At November 30, 2010, the Fund had the following open futures contracts:
| | | | | | | | | | | | | | | | | | | | |
| | | Number of
Contracts | | | Expiration
Date | | | Basis
Value | | | Market
Value | | | Unrealized
Gain (Loss) | |
| Contracts to Buy: | | | | | | | | | | | | | | | | | | | | |
| Goldman Sachs Commodity Index Futures | | | 15 | | | | 12/10 | | | $ | 2,237,775 | | | $ | 2,160,000 | | | $ | (77,775) | |
| U.S. Treasury 30-Year Bonds | | | 2 | | | | 3/11 | | | | 253,444 | | | | 254,563 | | | | 1,119 | |
| | | | | | | | | | | | | | | | | | | | (76,656) | |
| Contracts to Sell: | | | | | | | | | | | | | | | | | | | | |
| 90-Day Eurodollar | | | 1 | | | | 3/11 | | | | 248,897 | | | | 248,563 | | | | 334 | |
| DJ Euro Stoxx 50 Index Futures | | | 10 | | | | 12/10 | | | | 363,418 | | | | 344,373 | | | | 19,045 | |
| | | | | | | | | | | | | | | | | | | | 19,379 | |
| Net unrealized loss on open futures contracts | | | $ | (57,277) | |
| | |
| 38 | | Legg Mason Strategic Real Return Fund 2010 Annual Report |
Notes to consolidated financial statements (cont’d)
At November 30, 2010, the Fund had the following open forward foreign currency contracts:
| | | | | | | | | | | | | | | | | | | | |
| Foreign Currency | | Counterparty | | | Local
Currency | | | Market
Value | | | Settlement
Date | | | Unrealized
Gain (Loss) | |
| Contracts to Buy: | |
| Australian Dollar | | | Morgan Stanley & Co. Inc. | | | | 1,015,284 | | | $ | 971,589 | | | | 12/15/10 | | | $ | 32,900 | |
| Australian Dollar | | | Morgan Stanley & Co. Inc. | | | | 43,000 | | | | 41,149 | | | | 12/15/10 | | | | (774) | |
| Australian Dollar | | | Morgan Stanley & Co. Inc. | | | | 84,000 | | | | 80,385 | | | | 12/15/10 | | | | (425) | |
| Australian Dollar | | | Morgan Stanley & Co. Inc. | | | | 50,000 | | | | 47,848 | | | | 12/15/10 | | | | (144) | |
| Canadian Dollar | | | Morgan Stanley & Co. Inc. | | | | 957,416 | | | | 932,407 | | | | 12/15/10 | | | | 3,442 | |
| Canadian Dollar | | | Morgan Stanley & Co. Inc. | | | | 64,000 | | | | 62,328 | | | | 12/15/10 | | | | (30) | |
| Canadian Dollar | | | Morgan Stanley & Co. Inc. | | | | 123,000 | | | | 119,787 | | | | 12/15/10 | | | | (490) | |
| Canadian Dollar | | | Morgan Stanley & Co. Inc. | | | | 24,000 | | | | 23,373 | | | | 12/15/10 | | | | (164) | |
| Mexican Peso | | | Morgan Stanley & Co. Inc. | | | | 11,849,280 | | | | 948,083 | | | | 12/15/10 | | | | 35,661 | |
| Mexican Peso | | | Morgan Stanley & Co. Inc. | | | | 491,000 | | | | 39,286 | | | | 12/15/10 | | | | (247) | |
| Mexican Peso | | | Morgan Stanley & Co. Inc. | | | | 1,519,000 | | | | 121,538 | | | | 12/15/10 | | | | 1,477 | |
| Mexican Peso | | | Morgan Stanley & Co. Inc. | | | | 499,000 | | | | 39,926 | | | | 12/15/10 | | | | 174 | |
| New Zealand Dollar | | | Morgan Stanley & Co. Inc. | | | | 1,283,516 | | | | 953,381 | | | | 12/15/10 | | | | 20,092 | |
| New Zealand Dollar | | | Morgan Stanley & Co. Inc. | | | | 64,000 | | | | 47,538 | | | | 12/15/10 | | | | (69) | |
| New Zealand Dollar | | | Morgan Stanley & Co. Inc. | | | | 148,000 | | | | 109,933 | | | | 12/15/10 | | | | 536 | |
| New Zealand Dollar | | | Morgan Stanley & Co. Inc. | | | | 40,000 | | | | 29,712 | | | | 12/15/10 | | | | (128) | |
| Norwegian Krone | | | Morgan Stanley & Co. Inc. | | | | 5,683,340 | | | | 914,299 | | | | 12/15/10 | | | | (10,697) | |
| Norwegian Krone | | | Morgan Stanley & Co. Inc. | | | | 308,000 | | | | 49,549 | | | | 12/15/10 | | | | (3,333) | |
| Norwegian Krone | | | Morgan Stanley & Co. Inc. | | | | 527,000 | | | | 84,780 | | | | 12/15/10 | | | | (4,936) | |
| Norwegian Krone | | | Morgan Stanley & Co. Inc. | | | | 566,000 | | | | 91,054 | | | | 12/15/10 | | | | (582) | |
| Swiss Franc | | | Morgan Stanley & Co. Inc. | | | | 932,658 | | | | 929,473 | | | | 12/15/10 | | | | 4,246 | |
| Swiss Franc | | | Morgan Stanley & Co. Inc. | | | | 54,000 | | | | 53,816 | | | | 12/15/10 | | | | (1,575) | |
| Swiss Franc | | | Morgan Stanley & Co. Inc. | | | | 97,000 | | | | 96,669 | | | | 12/15/10 | | | | (3,000) | |
| Swiss Franc | | | Morgan Stanley & Co. Inc. | | | | 60,000 | | | | 59,795 | | | | 12/15/10 | | | | (159) | |
| | | | | 71,775 | |
| Contracts to Sell: | | | | | | | | | | | | | | | | | | | | |
| Australian Dollar | | | Citibank N.A. | | | | 171,964 | | | | 163,320 | | | | 2/14/11 | | | | 6,682 | |
| Net unrealized gain on open forward foreign currency contracts | | | $ | 78,457 | |
At November 30, 2010, the Fund held the following commodity index swap contracts:
| | | | | | | | | | | | | | | | |
| Agreement With: | | Termination
Date | | | The Fund
Agrees to Pay | | The Fund Will Receive | | Contract Notional
Amount | | | Unrealized
Depreciation | |
Morgan Stanley
Capital Group Inc. | | | January 5, 2011 | | | Treasury Bill
Rate plus
Fees | | Commodity
Index Basket Return | | $ | 1,750,000 | | | $ | (65,032) | * |
| * | Swap contract is valued in good faith at fair value in accordance with procedures approved by the Board of Trustees (See Note 1). |
| | | | |
| Legg Mason Strategic Real Return Fund 2010 Annual Report | | | 39 | |
4. Derivative instruments and hedging activities
Financial Accounting Standards Board Codification Topic 815 requires enhanced disclosure about an entity’s derivative and hedging activities.
Below is a table, grouped by derivative type that provides information about the fair value and the location of derivatives within the Consolidated Statement of Assets and Liabilities at November 30, 2010.
| | | | | | | | | | | | | | | | |
| ASSET DERIVATIVES1 | |
| | | Interest Rate
Contracts Risk | | | Foreign
Exchange
Contracts Risk | | | Commodity
Contracts Risk | | | Total | |
| Purchased options2 | | | — | | | $ | 3,856 | | | | — | | | $ | 3,856 | |
| Futures contracts3 | | $ | 20,498 | | | | — | | | | — | | | | 20,498 | |
| Forward foreign currency contracts | | | — | | | | 105,210 | | | | — | | | | 105,210 | |
| Total | | $ | 20,498 | | | $ | 109,066 | | | | — | | | $ | 129,564 | |
| | | | | | | | | | | | | | | | |
| LIABILITY DERIVATIVES1 | |
| | | Interest Rate
Contracts Risk | | | Foreign
Exchange
Contracts Risk | | | Commodity
Contracts Risk | | | Total | |
| Futures contracts3 | | | — | | | | — | | | $ | 77,775 | | | $ | 77,775 | |
| Swap contracts | | | — | | | | — | | | | 65,032 | | | | 65,032 | |
| Forward foreign currency contracts | | | — | | | $ | 26,753 | | | | — | | | | 26,753 | |
| Total | | | — | | | $ | 26,753 | | | $ | 142,807 | | | $ | 169,560 | |
| 1 | Generally, the balance sheet location for asset derivatives is receivables/net unrealized appreciation (depreciation) and for liability derivatives is payables/net unrealized appreciation (depreciation). |
| 2 | Market value of purchased options is reported in Investments at value in the Consolidated Statement of Assets and Liabilities. |
| 3 | Includes cumulative appreciation (depreciation) of futures contracts as reported in the footnotes. Only variation margin is reported within the receivables and/or payables of the Consolidated Statement of Assets and Liabilities. |
The following tables provide information about the effect of derivatives and hedging activities on the Fund's Consolidated Statement of Operations for the period ended November 30, 2010. The first table provides additional detail about the amounts and sources of gains (losses) realized on derivatives during the period. The second table provides additional information about the changes in unrealized appreciation (depreciation) resulting from the Fund's derivatives and hedging activities during the period.
| | | | | | | | | | | | | | | | |
| AMOUNT OF REALIZED GAIN (LOSS) ON DERIVATIVES RECOGNIZED | |
| | | Interest Rate
Contracts Risk | | | Foreign
Exchange
Contracts Risk | | | Commodity
Contracts Risk | | | Total | |
| Purchased options | | $ | (2,537) | | | $ | (4,116) | | | | — | | | $ | (6,653) | |
| Written options | | | 5,021 | | | | — | | | | — | | | | 5,021 | |
| Futures contracts | | | 4,390 | | | | (252,589) | | | $ | 125,283 | | | | (122,916) | |
| Swap contracts | | | — | | | | — | | | | 85,141 | | | | 85,141 | |
| Forward foreign currency contracts | | | — | | | | (3) | | | | — | | | | (3) | |
| Total | | $ | 6,874 | | | $ | (256,708) | | | $ | 210,424 | | | $ | (39,410) | |
| | |
| 40 | | Legg Mason Strategic Real Return Fund 2010 Annual Report |
Notes to consolidated financial statements (cont’d)
| | | | | | | | | | | | | | | | |
| CHANGE IN UNREALIZED APPRECIATION (DEPRECIATION) ON DERIVATIVES RECOGNIZED | |
| | | Interest Rate
Contracts Risk | | | Foreign
Exchange
Contracts Risk | | | Commodity
Contracts Risk | | | Total | |
| Purchased options | | | — | | | $ | 3,066 | | | | — | | | $ | 3,066 | |
| Futures contracts | | $ | 20,498 | | | | — | | | $ | (77,775) | | | | (57,277) | |
| Swap contracts | | | — | | | | — | | | | (65,032) | | | | (65,032) | |
| Forward foreign currency contracts | | | — | | | | 78,457 | | | | — | | | | 78,457 | |
| Total | | $ | 20,498 | | | $ | 81,523 | | | $ | (142,807) | | | $ | (40,786) | |
During the period ended November 30, 2010, the volume of derivative activity for the Fund was as follows:
| | | | |
| | | Average Market
Value | |
| Purchased options | | $ | 1,071 | |
| Written options | | | 616 | |
| Forward foreign currency contracts (to buy) | | | 4,711,997 | |
| Forward foreign currency contracts (to sell) | | | 184,084 | |
| Futures contracts (to buy) | | | 2,545,978 | |
| Futures contracts (to sell) | | | 1,565,378 | |
| | | Average Notional
Balance | |
| Commodity index swap contracts | | | $1,388,889 | |
The Fund’s contracts with derivative counterparties contain several credit related contingent features that if triggered would allow its derivatives counterparties to close out and demand payment or additional collateral to cover their exposure from the Fund. Credit related contingent features are established between the Fund and its derivatives counterparties to reduce the risk that the Fund will not fulfill its payment obligations to its counterparties. These triggering features include, but are not limited to, a percentage decrease in the Fund’s net assets and/or a percentage decrease in the Fund’s Net Asset Value or NAV. The contingent features are established within the Fund’s International Swap and Derivatives Association, Inc. master agreements which govern positions in swaps, over-the-counter options, and forward currency exchange contracts for each individual counterparty.
As of November 30, 2010, the total value of swap positions with credit related contingent features in a net liability position was $65,032. If a contingent feature would have been triggered as of November 30, 2010, the Fund would have been required to pay this amount in cash to its counterparties. The Fund posted collateral for its swap transactions in the amount of $250,000.
5. Class specific expenses, waivers and/or reimbursements
The Fund has adopted a Rule 12b-1 distribution plan and under that plan the Fund pays a service fee with respect to its Class A and C shares calculated at the annual rate of 0.25% of the average daily net assets of each respective class. The Fund also pays a distribution fee with respect to its Class C shares calculated at the annual rate of 0.75% of the average daily net assets of Class C shares. Distribution and service fees are accrued daily and paid monthly.
| | | | |
| Legg Mason Strategic Real Return Fund 2010 Annual Report | | | 41 | |
For the period ended November 30, 2010, class specific expenses were as follows:
| | | | | | | | |
| | | Distribution/Service
Fees† | | | Transfer Agent
Fees† | |
| Class A | | $ | 30,319 | | | $ | 2,199 | |
| Class C | | | 5,177 | | | | 1,507 | |
| Class I | | | — | | | | 1,507 | |
| Total | | $ | 35,496 | | | $ | 5,213 | |
| † | For the period February 26, 2010 (inception date) to November 30, 2010 |
For the period ended November 30, 2010, fees forgone and/or reimbursed by class were as follows:
| | | | |
| | �� | Waivers/
Reimbursements† | |
| Class A | | $ | 430,654 | |
| Class C | | | 17,775 | |
| Class I | | | 12,265 | |
| Total | | $ | 460,694 | |
| † | For the period February 26, 2010 (inception date) to November 30, 2010 |
6. Shares of beneficial interest
At November 30, 2010, the Trust had an unlimited number of shares of beneficial interest authorized with a par value of $0.00001 per share. The Fund has the ability to issue multiple classes of shares. Each class of shares represents an identical interest and has the same rights, except that each class bears certain direct expenses, including those specifically related to the distribution of its shares.
Transactions in shares of each class were as follows:
| | | | | | | | |
| | | Period Ended
November 30, 2010† | |
| | | Shares | | | Amount | |
| Class A | |
| Shares sold | | | 1,410,640 | | | $ | 16,992,737 | |
| Shares repurchased | | | (38,462) | | | | (470,822) | |
| Net Increase | | | 1,372,178 | | | $ | 16,521,915 | |
| | |
| Class C | | | | | | | | |
| Shares sold | | | 79,975 | | | $ | 981,162 | |
| Net Increase | | | 79,975 | | | $ | 981,162 | |
| | |
| Class I | | | | | | | | |
| Shares sold | | | 68,887 | | | $ | 820,653 | |
| Shares repurchased | | | (4,346) | | | | (53,040) | |
| Net Increase | | | 64,541 | | | $ | 767,613 | |
| † | For the period February 26, 2010 (inception date) to November 30, 2010 |
| | |
| 42 | | Legg Mason Strategic Real Return Fund 2010 Annual Report |
Notes to consolidated financial statements (cont’d)
7. Income tax information and distributions to shareholders
Subsequent to the fiscal year end, the Fund has made the following distributions:
| | | | | | | | | | | | |
Record Date Payable Date | | Class A | | | Class C | | | Class I | |
| 12/28/2010 | | | | | | | | | | | | |
| 12/29/2010 | | $ | 0.513666 | | | $ | 0.414891 | | | $ | 0.546841 | |
The Fund did not make any distributions during the fiscal period ended November 30, 2010.
As of November 30, 2010, the components of accumulated earnings on a tax basis were as follows:
| | | | |
| Undistributed ordinary income — net | | $ | 616,872 | |
| Capital loss carryforward* | | | (192,214) | |
| Other book/tax temporary differences(a) | | | (111,467) | |
| Unrealized appreciation (depreciation)(b) | | | 797,831 | |
| Total accumulated earnings (losses) — net | | $ | 1,111,022 | |
| * | As of November 30, 2010, the Fund had the following net capital loss carryforward remaining: |
| | | | |
| Year of Expiration | | Amount | |
| 11/30/2018 | | $ | (192,214 | ) |
This amount will be available to offset any future taxable capital gains.
| (a) | Other book/tax temporary differences are attributable primarily to the tax deferral of losses on straddles, the realization for tax purposes of unrealized gains on certain futures and foreign currency contracts, book/tax differences in the treatment of certain investments and book/tax differences in the timing of the deductibility of various expenses. |
| (b) | The difference between book-basis and tax-basis unrealized appreciation (depreciation) is attributable primarily to the tax deferral of losses on wash sales, the realization for tax purposes of unrealized gains on investments in passive foreign investment companies, the difference between book and tax amortization methods for premiums on fixed income securities and the difference between the book and tax cost basis of investments in real estate investment trusts. |
| | | | |
| Legg Mason Strategic Real Return Fund 2010 Annual Report | | | 43 | |
Report of independent registered public accounting firm
To the Board of Trustees of Legg Mason Global Asset Management Trust and Shareholders of Legg Mason Strategic Real Return Fund:
In our opinion, the accompanying consolidated statement of assets and liabilities, including the consolidated schedule of investments, and the related consolidated statements of operations and of changes in net assets and the consolidated financial highlights present fairly, in all material respects, the financial position of Legg Mason Strategic Real Return Fund (one of the funds comprising Legg Mason Global Asset Management Trust, the “Fund”) at November 30, 2010, the results of its operations, the changes in its net assets, and the financial highlights for the period presented, in conformity with accounting principles generally accepted in the United States of America. These consolidated financial statements and financial highlights (hereafter referred to as “financial statements”) are the responsibility of the Fund’s management; our responsibility is to express an opinion on these financial statements based on our audit. We conducted our audit of these financial statements in accordance with the standards of the Public Company Accounting Oversight Board (United States). Those standards require that we plan and perform the audit to obtain reasonable assurance about whether the financial statements are free of material misstatement. An audit includes examining, on a test basis, evidence supporting the amounts and disclosures in the financial statements, assessing the accounting principles used and significant estimates made by management, and evaluating the overall financial statement presentation. We believe that our audit, which included confirmation of securities at November 30, 2010 by correspondence with the custodian and brokers, provides a reasonable basis for our opinion.
PricewaterhouseCoopers LLP
Baltimore, Maryland
January 14, 2011
| | |
| 44 | | Legg Mason Strategic Real Return Fund |
Additional information (unaudited)
Information about Trustees and Officers
The business and affairs of Legg Mason Strategic Real Return Fund (the “Fund”) are conducted by management under the supervision and subject to the direction of its Board of Trustees. The business address of each Trustee is 100 International Drive, Attn: Fund Secretary, Baltimore, Maryland 21202. Information pertaining to the Trustees and Officers of the Fund is set forth below.
The Statement of Additional Information includes additional information about Trustees and is available, without charge, upon request by calling the Fund at 1-877-721-1926.
| | |
| Independent Trustees1 |
| Ruby P. Hearn |
| Year of birth | | 1940 |
| Position with Trust | | Trustee |
| Term of office and length of time served2 | | Since 2009 |
| Principal occupation(s) during past five years | | Senior Vice President Emerita of The Robert Wood Johnson Foundation (non-profit) since 2001; Trustee of the New York Academy of Medicine since 2004; Director of the Institute for Healthcare Improvement since 2002; Member of the Institute of Medicine since 1982; formerly: Senior Vice President of The Robert Wood Johnson Foundation (1996 to 2001); Fellow of The Yale Corporation (1992 to 1998). |
| Number of funds in fund complex overseen by Trustee | | 16 |
| Other directorships held by Trustee during past five years | | None |
| Arnold L. Lehman |
| Year of birth | | 1944 |
| Position with Trust | | Lead Independent Trustee |
| Term of office and length of time served2 | | Since 2009 |
| Principal occupation(s) during past five years | | Director of the Brooklyn Museum since 1997; Trustee of American Federation of Arts since 1998. Formerly: Director of The Baltimore Museum of Art (1979 to 1997). |
| Number of funds in fund complex overseen by Trustee | | 16 |
| Other directorships held by Trustee during past five years | | None |
| Robin J.W. Masters |
| Year of birth | | 1955 |
| Position with Trust | | Trustee |
| Term of office and length of time served2 | | Since 2009 |
| Principal occupation(s) during past five years | | Retired; formerly: Chief Investment Officer of ACE Limited (insurance) (1986 to 2000). |
| Number of funds in fund complex overseen by Trustee | | 16 |
| Other directorships held by Trustee during past five years | | Director of Cheyne Capital International Limited (investment advisory firm). Director/Trustee of Legg Mason Institutional Funds plc, WA Fixed Income Funds plc and Western Asset Debt Securities Fund plc. |
| | | | |
| Legg Mason Strategic Real Return Fund | | | 45 | |
| | |
| Independent Trustees1 cont’d |
| Jill E. McGovern |
| Year of birth | | 1944 |
| Position with Trust | | Trustee |
| Term of office and length of time served2 | | Since 2009 |
| Principal occupation(s) during past five years | | Senior Consultant, American Institute for Contemporary German Studies (AICGS) since 2007; formerly: Chief Executive Officer of The Marrow Foundation (non-profit) (1993 to 2007); Executive Director of the Baltimore International Festival (1991 to 1993); Senior Assistant to the President of The Johns Hopkins University (1986 to 1990). |
| Number of funds in fund complex overseen by Trustee | | 16 |
| Other directorships held by Trustee during past five years | | Director of International Biomedical Research Alliance; Director of Lois Roth Endowment |
| Arthur S. Mehlman |
| Year of birth | | 1942 |
| Position with Trust | | Trustee |
| Term of office and length of time served2 | | Since 2009 |
| Principal occupation(s) during past five years | | Retired. Director, The University of Maryland Foundation since 1992; Director, The League for People with Disabilities since 2003; formerly: Partner, KPMG LLP (international accounting firm) (1972 to 2002). |
| Number of funds in fund complex overseen by Trustee | | Director/Trustee of all Legg Mason Funds consisting of 16 portfolios; Director/Trustee of the Royce Family of Funds consisting of 30 portfolios. |
| Other directorships held by Trustee during past five years | | Director of Municipal Mortgage & Equity, LLC. |
| G. Peter O’Brien |
| Year of birth | | 1945 |
| Position with Trust | | Trustee |
| Term of office and length of time served2 | | Since 2009 |
| Principal occupation(s) during past five years | | Retired. Trustee Emeritus of Colgate University; Board Member, Hill House, Inc. (residential home care); Board Member, Bridges School (pre- school); formerly: Managing Director, Equity Capital Markets Group of Merrill Lynch & Co. (1971-1999). |
| Number of funds in fund complex overseen by Trustee | | Director/Trustee of all Legg Mason funds consisting of 16 portfolios; Director/Trustee of the Royce Family of Funds consisting of 30 portfolios. |
| Other directorships held by Trustee during past five years | | Director of Technology Investment Capital Corp. |
| | |
| 46 | | Legg Mason Strategic Real Return Fund |
Additional information (unaudited) (cont’d)
Information about Trustees and Officers
| | |
| Independent Trustees1 cont’d |
| S. Ford Rowan |
| Year of birth | | 1943 |
| Position with Trust | | Trustee |
| Term of office and length of time served2 | | Since 2009 |
| Principal occupation(s) during past five years | | Chairman, National Center for Critical Incident Analysis, National Defense University Foundation, since 2004; Trustee, St. John’s College, since 2006; formerly: Consultant, Rowan & Blewitt Inc. (management consulting) (1984 to 2007); Lecturer in Journalism, Northwestern University (1980 to 1993); Lecturer in Organizational Sciences, George Washington University (2000 to 2008); Director, Sante Fe Institute (1999 to 2008). |
| Number of funds in fund complex overseen by Trustee | | 16 |
| Other directorships held by Trustee during past five years | | None |
| Robert M. Tarola |
| Year of birth | | 1950 |
| Position with Trust | | Trustee |
| Term of office and length of time served2 | | Since 2009 |
| Principal occupation(s) during past five years | | President of Right Advisory LLC (corporate finance and governance consulting) since 2008; Member, Investor Advisory Group of the Public Company Accounting Oversight Board since 2009; Senior Vice President and Chief Financial Officer of The Howard University since 2010 (higher education and health care); formerly: Senior Vice President and Chief Financial Officer of W.R. Grace & Co. (specialty chemicals) (1999 to 2008) and MedStar Health, Inc. (healthcare) (1996 to 1999); Partner, Price Waterhouse, LLP (accounting and auditing) (1984 to 1996). |
| Number of funds in fund complex overseen by Trustee | | 16 |
| Other directorships held by Trustee during past five years | | Director of TeleTech Holdings, Inc. (business process outsourcing); Director of American Kidney Fund (renal disease assistance) |
| | | | |
| Legg Mason Strategic Real Return Fund | | | 47 | |
| | |
| Interested Trustee3 |
| Mark R. Fetting |
| Year of birth | | 1954 |
| Position with Trust | | Chairman and Trustee |
| Term of office and length of time served2 | | Since 2009 |
| Principal occupation(s) during past five years | | President, CEO, Chairman and Director of Legg Mason, Inc. and Chairman of Legg Mason Funds since 2008; formerly: President of all Legg Mason Funds (2001 to 2008). Senior Executive Vice President of Legg Mason, Inc., Director and/or officer of various Legg Mason, Inc. affiliates (2000 to 2008). Division President and Senior Officer of Prudential Financial Group, Inc. and related companies, including fund boards and consulting services to subsidiary companies (1991 to 2000) |
| Number of funds in fund complex overseen by Trustee | | Chairman and Director/Trustee of all Legg Mason Funds consisting of 16 portfolios; Director/Trustee of the Royce Family of Funds consisting of 30 portfolios. |
| Other directorships held by Trustee during past five years | | None |
| Executive Officers |
R. Jay Gerken, CFA Legg Mason 620 Eighth Avenue, New York NY 10018 | | |
| Year of birth | | 1951 |
| Position(s) with Trust | | Vice President |
| Term of office and length of time served2 | | Since 2009 |
| Principal occupation(s) during past five years | | Managing Director of Legg Mason & Co., LLC (“Legg Mason & Co.”) (since 2005); Officer and Trustee/Director of 149 funds associated with Legg Mason Partners Fund Advisor, LLC (“LMPFA”) or its affiliates (since 2006) and Legg Mason & Co. predecessors (prior to 2006); President and Chief Executive Officer (“CEO”) of LMPFA (since 2006); President and CEO of Smith Barney Fund Management LLC (“SBFM”) and Citi Fund Management, Inc. (“CFM”) (formerly registered investment advisers) (since 2002); formerly, Chairman, President and CEO, Travelers Investment Adviser Inc. (prior to 2005) |
| | |
| 48 | | Legg Mason Strategic Real Return Fund |
Additional information (unaudited) (cont’d)
Information about Trustees and Officers
| | |
| Executive Officers cont’d |
Kaprel Ozsolak Legg Mason 55 Water Street, New York, NY 10041 | | |
| Year of birth | | 1965 |
| Position(s) with Trust | | Chief Financial Officer |
| Term of office and length of time served2 | | Since 2009 |
| Principal occupation(s) during past five years | | Director of Legg Mason & Co. (since 2005); Chief Financial Officer of certain mutual funds associated with Legg Mason & Co. or its affiliates (since 2007) and Legg Mason & Co. predecessors (prior to 2007); formerly, Treasurer of certain mutual funds associated with Legg Mason & Co. or its affiliates (prior to 2010) and Legg Mason & Co. predecessors (prior to 2005); formerly, Controller of certain mutual funds associated with Legg Mason & Co. predecessors (prior to 2004) |
Robert I. Frenkel Legg Mason 100 First Stamford Place, Stamford, CT 06902 | | |
| Year of birth | | 1954 |
| Position(s) with Trust | | Secretary and Chief Legal Officer |
| Term of office and length of time served2 | | Since 2009 |
| Principal occupation(s) during past five years | | Vice President and Deputy General Counsel of Legg Mason (since 2006); Managing Director and General Counsel of Global Mutual Funds for Legg Mason & Co. (since 2006) and Legg Mason & Co. predecessors (since 1994); Secretary and Chief Legal Officer of certain mutual funds associated with Legg Mason & Co. or its affiliates (since 2006) and Legg Mason & Co. predecessors (prior to 2006) |
Ted P. Becker Legg Mason 620 Eighth Avenue, New York, NY 10018 | | |
| Year of birth | | 1951 |
| Position(s) with Trust | | Vice President and Chief Compliance Officer |
| Term of office and length of time served2 | | Since 2009 |
| Principal occupation(s) during past five years | | Director of Global Compliance at Legg Mason (since 2006); Chief Compliance Officer of LMPFA (since 2006); Managing Director of Compliance of Legg Mason & Co. (since 2005); Chief Compliance Officer of certain mutual funds associated with Legg Mason & Co. or its affiliates (since 2006) and Legg Mason & Co. predecessors (prior to 2006) |
| | | | |
| Legg Mason Strategic Real Return Fund | | | 49 | |
| | |
| Executive Officers cont’d |
Christopher Berarducci Legg Mason 55 Water Street, New York, NY 10041 | | |
| Year of birth | | 1974 |
| Position(s) with Trust | | Treasurer |
| Term of office and length of time served2 | | Since 2010 |
| Principal occupation(s) during past five years | | Assistant Vice President of Legg Mason & Co. (since 2007); Treasurer of certain mutual funds associated with LMPFA (since 2010); Assistant Controller of certain mutual funds associated with LMPFA (prior to 2010); Manager of Fund Administration at UBS Global Asset Management (prior to 2007); Assistant Vice President and Manager of Fund Administration at JP Morgan Chase & Co. (prior to 2005) |
| 1 | Trustees who are not “interested persons” of the Fund within the meaning of Section 2(a)(19) of the 1940 Act. Each of the Independent Trustees serves on the standing committees of the Board of Trustees, which include the Audit Committee (chair: Arthur S. Mehlman), the Nominating Committee (co-chairs: G. Peter O’Brien and Jill E. McGovern), and the Independent Trustees Committee (chair: Arnold L. Lehman). |
| 2 | Officers of the Trust are elected to serve until their successors are elected and qualified. Trustees of the Trust serve a term of indefinite length until their retirement, in accordance with the Board’s retirement policy, resignation or removal, and stand for re-election by shareholders only as and when required by the 1940 Act. |
| 3 | Mr. Fetting is considered to be an interested person, as defined in the 1940 Act, of the Trust on the basis of his current employment with the Fund’s investment adviser or its affiliated entities (including the Trust’s principal underwriter) and Legg Mason, Inc., the parent holding company of these entities as well as his ownership of Legg Mason, Inc. stock. |
Legg Mason
Strategic Real Return Fund
Board of trustees
Mark R. Fetting Chairman
Dr. Ruby P. Hearn
Arnold L. Lehman
Robin J.W. Masters
Dr. Jill E. McGovern
Arthur S. Mehlman
G. Peter O’Brien
S. Ford Rowan
Robert M. Tarola
Investment manager
Legg Mason Partners Fund Advisor, LLC
Investment adviser
Legg Mason Global Asset Allocation, LLC
Subadvisers
Batterymarch Financial Management, Inc.
ClearBridge Advisors, LLC
Western Asset Management Company
Western Asset Management Company Limited
Western Asset Management Company Ltd
Custodian
State Street Bank & Trust Company
Transfer agent
Boston Financial Data Services, Inc.
2000 Crown Colony Drive
Quincy, MA 02169
Counsel
K&L Gates LLP
Washington, DC
Independent registered public accounting firm
PricewaterhouseCoopers LLP
Baltimore, MD
Legg Mason Strategic Real Return Fund
The Fund is a separate investment series of Legg Mason Global Asset Management Trust, a Maryland statutory trust.
Legg Mason Strategic Real Return Fund
Legg Mason Funds
55 Water Street
New York, NY 10041
The Fund files its complete schedule of portfolio holdings with the Securities and Exchange Commission (“SEC”) for the first and third quarters of each fiscal year on Form N-Q. The Fund’s Forms N-Q are available on the SEC’s website at www.sec.gov. The Fund’s Forms N-Q may be reviewed and copied at the SEC’s Public Reference Room in Washington, D.C., and information on the operation of the Public Reference Room may be obtained by calling 1-800-SEC-0330. To obtain information on Form N-Q, shareholders can call the Fund at 1-877-721-1926.
Information on how the Fund voted proxies relating to portfolio securities during the prior 12-month period ended June 30th of each year and a description of the policies and procedures that the Fund uses to determine how to vote proxies related to portfolio transactions are available (1) without charge, upon request, by calling the Fund at 1-877-721-1926, (2) on the Fund’s website at www.leggmason.com/individualinvestors and (3) on the SEC’s website at www.sec.gov.
This report is submitted for the general information of the shareholders of Legg Mason Strategic Real Return Fund. This report is not authorized for distribution to prospective investors in the Fund unless preceded or accompanied by a current prospectus.
Investors should consider the Fund’s investment objectives, risks, charges and expenses carefully before investing. The prospectus contains this and other important information about the Fund. Please read the prospectus carefully before investing.
www.leggmason.com/individualinvestors
© 2011 Legg Mason Investor Services, LLC
Member FINRA, SIPC
Privacy policy
We are committed to keeping nonpublic personal information about you secure and confidential. This notice is intended to help you understand how we fulfill this commitment. From time to time, we may collect a variety of personal information about you, including:
| Ÿ | | Information we receive from you on applications and forms, via the telephone, and through our websites; |
| Ÿ | | Information about your transactions with us, our affiliates, or others (such as your purchases, sales, or account balances); and |
| Ÿ | | Information we receive from consumer reporting agencies. |
We do not disclose nonpublic personal information about our customers or former customers, except to our affiliates (such as broker-dealers or investment advisers within the Legg Mason family of companies) or as is otherwise permitted by applicable law or regulation. For example, we may share this information with others in order to process your transactions or service an account. We may also provide this information to companies that perform marketing services on our behalf, such as printing and mailing, or to other financial institutions with whom we have joint marketing agreements. When we enter into such agreements, we will require these companies to protect the confidentiality of this information and to use it only to perform the services for which we hired them.
With respect to our internal security procedures, we maintain physical, electronic, and procedural safeguards to protect your nonpublic personal information, and we restrict access to this information.
If you decide at some point either to close your account(s) or become an inactive customer, we will continue to adhere to our privacy policies and practices with respect to your nonpublic personal information.
|
| NOT PART OF THE ANNUAL REPORT |
www.leggmason.com/individualinvestors
©2011 Legg Mason Investor Services, LLC Member FINRA, SIPC
LMFX013120 1/11 SR10-1280
The registrant has adopted a code of ethics that applies to the registrant’s principal executive officer, principal financial officer, principal accounting officer or controller.
| ITEM 3. | AUDIT COMMITTEE FINANCIAL EXPERT. |
The Board of Trustees of the registrant has determined that Arthur S. Mehlman the Chairman of the Board’s Audit Committee and Robert M. Tarola, possess the technical attributes identified in Instruction 2(b) of Item 3 to Form N-CSR to qualify as “audit committee financial experts,” and have designated Mr. Mehlman and Mr. Tarola as the Audit Committee’s financial experts. Mr. Mehlman and Mr. Tarola are “independent” Trustees pursuant to paragraph (a) (2) of Item 3 to Form N-CSR.
| ITEM 4. | PRINCIPAL ACCOUNTANT FEES AND SERVICES. |
a) Audit Fees. The aggregate fees billed in the fiscal period ending November 30, 2010 (the “Reporting Period”) for professional services rendered by the Registrant’s principal accountant (the “Auditor”) for the audit of the Registrant’s annual financial statements, or services that are normally provided by the Auditor in connection with the statutory and regulatory filings or engagements for the Reporting Period, were $0 in 2010.
b) Audit-Related Fees. The aggregate fees billed in the Reporting Period for assurance and related services by the Auditor that are reasonably related to the performance of the Registrant’s financial statements were $0 in 2010.
In addition, there were no Audit-Related Fees billed in the Reporting Period for assurance and related services by the Auditor to the Registrant’s investment adviser (not including any sub-adviser whose role is primarily portfolio management and is subcontracted with or overseen by another investment adviser), and any entity controlling, controlled by or under common control with the investment adviser that provides ongoing services to the Legg Mason Global Asset Management Trust (“service affiliates”), that were reasonably related to the performance of the annual audit of the service affiliates. Accordingly, there were no such fees that required pre-approval by the Audit Committee for the Reporting Periods.
(c) Tax Fees. The aggregate fees billed in the Reporting Period for professional services rendered by the Auditor for tax compliance, tax advice and tax planning (“Tax Services”) were $0 in 2010. These services consisted of (i) review or preparation of U.S. federal, state, local and excise tax returns; (ii) U.S. federal, state and local tax planning, advice and assistance regarding statutory, regulatory or administrative developments, and (iii) tax advice regarding tax qualification matters and/or treatment of various financial instruments held or proposed to be acquired or held.
There were no fees billed for tax services by the Auditors to service affiliates during the Reporting Periods that required pre-approval by the Audit Committee.
d) All Other Fees. The aggregate other fees billed in the Reporting Periods for products and services provided by the Auditor, were $3,000 in 2010 other than the services reported in paragraphs (a) through (c) of this Item for the Legg Mason Global Asset Management Trust. There were no other non-audit services rendered by the Auditor to Legg Mason Partners Fund Advisors, LLC (“LMPFA”), and any entity controlling, controlled by or under common control with LMPFA that provided ongoing services to Legg Mason Global Asset Management Trust requiring pre-approval by the Audit Committee in the Reporting Period.
(e) Audit Committee’s pre–approval policies and procedures described in paragraph (c)
(7) of Rule 2-01 of Regulation S-X.
(1) The Charter for the Audit Committee (the “Committee”) of the Board of each registered investment company (the “Fund”) advised by LMPFA or one of their affiliates (each, an “Adviser”) requires that the Committee shall approve (a) all audit and permissible non-audit services to be provided to the Fund and (b) all permissible non-audit services to be provided by the Fund’s independent auditors to the Adviser and any Covered Service Providers if the engagement relates directly to the operations and financial reporting of the Fund. The Committee may implement policies and procedures by which such services are approved other than by the full Committee.
The Committee shall not approve non-audit services that the Committee believes may impair the independence of the auditors. As of the date of the approval of this Audit Committee Charter, permissible non-audit services
include any professional services (including tax services), that are not prohibited services as described below, provided to the Fund by the independent auditors, other than those provided to the Fund in connection with an audit or a review of the financial statements of the Fund. Permissible non-audit services may not include: (i) bookkeeping or other services related to the accounting records or financial statements of the Fund; (ii) financial information systems design and implementation; (iii) appraisal or valuation services, fairness opinions or contribution-in-kind reports; (iv) actuarial services; (v) internal audit outsourcing services; (vi) management functions or human resources; (vii) broker or dealer, investment adviser or investment banking services; (viii) legal services and expert services unrelated to the audit; and (ix) any other service the Public Company Accounting Oversight Board determines, by regulation, is impermissible.
Pre-approval by the Committee of any permissible non-audit services is not required so long as: (i) the aggregate amount of all such permissible non-audit services provided to the Fund, the Adviser and any service providers controlling, controlled by or under common control with the Adviser that provide ongoing services to the Fund (“Covered Service Providers”) constitutes not more than 5% of the total amount of revenues paid to the independent auditors during the fiscal year in which the permissible non-audit services are provided to (a) the Fund, (b) the Adviser and (c) any entity controlling, controlled by or under common control with the Adviser that provides ongoing services to the Fund during the fiscal year in which the services are provided that would have to be approved by the Committee; (ii) the permissible non-audit services were not recognized by the Fund at the time of the engagement to be non-audit services; and (iii) such services are promptly brought to the attention of the Committee and approved by the Committee (or its delegate(s)) prior to the completion of the audit.
(2) For the Legg Mason Global Asset Management Trust, the percentage of fees that were approved by the audit committee, with respect to: Audit-Related Fees were 100% for 2010; Tax Fees were 100% for 2010; and Other Fees were 100% for 2010.
(f) N/A
(g) Non-audit fees billed by the Auditor for services rendered to Legg Mason Global Asset Management Trust, LMPFA and any entity controlling, controlled by, or under common control with LMPFA that provides ongoing services to Legg Mason Global Asset Management Trust during the reporting period were $0 in 2010.
(h) Yes. Legg Mason Global Asset Management Trust’s Audit Committee has considered whether the provision of non-audit services that were rendered to Service Affiliates, which were not pre-approved (not requiring pre-approval), is compatible with maintaining the Accountant’s independence. All services provided by the Auditor to the Legg Mason Global Asset Management Trust or to Service Affiliates, which were required to be pre-approved, were pre-approved as required.
| ITEM 5. | AUDIT COMMITTEE OF LISTED REGISTRANTS. |
a) The independent board members are acting as the registrant’s audit committee as specified in Section 3(a)(58)(B) of the Exchange Act. The Audit Committee consists of the following Board members:
Ruby P. Hearn
Arnold L. Lehman
Robin J.W. Masters
Jill E. McGovern
Arthur S. Mehlman
G. Peter O’Brien
S. Ford Rowan
Robert M. Tarola
b) Not applicable
| ITEM 6. | SCHEDULE OF INVESTMENTS. |
Included herein under Item 1.
| ITEM 7. | DISCLOSURE OF PROXY VOTING POLICIES AND PROCEDURES FOR CLOSED-END MANAGEMENT INVESTMENT COMPANIES. |
Not applicable.
| ITEM 8. | PORTFOLIO MANAGERS OF CLOSED-END MANAGEMENT INVESTMENT COMPANIES. |
Not applicable.
| ITEM 9. | PURCHASES OF EQUITY SECURITIES BY CLOSED-END MANAGEMENT INVESTMENT COMPANY AND AFFILIATED PURCHASERS. |
Not applicable.
| ITEM 10. | SUBMISSION OF MATTERS TO A VOTE OF SECURITY HOLDERS. |
Not applicable.
| ITEM 11. | CONTROLS AND PROCEDURES. |
| | (a) | The registrant’s principal executive officer and principal financial officer have concluded that the registrant’s disclosure controls and procedures (as defined in Rule 30a- 3(c) under the Investment Company Act of 1940, as amended (the “1940 Act”)) are effective as of a date within 90 days of the filing date of this report that includes the disclosure required by this paragraph, based on their evaluation of the disclosure controls and procedures required by Rule 30a-3(b) under the 1940 Act and 15d-15(b) under the Securities Exchange Act of 1934. |
| | (b) | There were no changes in the registrant’s internal control over financial reporting (as defined in Rule 30a-3(d) under the 1940 Act) that occurred during the registrant’s last fiscal half-year (the registrant’s second fiscal half-year in the case of an annual report) that have materially affected, or are likely to materially affect the registrant’s internal control over financial reporting. |
(a) (1) Code of Ethics attached hereto.
Exhibit 99.CODE ETH
(a) (2) Certifications pursuant to section 302 of the Sarbanes-Oxley Act of 2002 attached hereto.
Exhibit 99.CERT
(b) Certifications pursuant to Section 906 of the Sarbanes-Oxley Act of 2002 attached hereto.
Exhibit 99.906CERT
SIGNATURES
Pursuant to the requirements of the Securities Exchange Act of 1934 and the Investment Company Act of 1940, the registrant has duly caused this Report to be signed on its behalf by the undersigned, there unto duly authorized.
| | |
| Legg Mason Global Asset Management Trust |
| |
| By: | | /S/ R. JAY GERKEN |
| | R. Jay Gerken |
| | Principal Executive Officer of |
| | Legg Mason Global Asset Management Trust |
| |
| Date: | | January 21, 2011 |
Pursuant to the requirements of the Securities Exchange Act of 1934 and the Investment Company Act of 1940, this report has been signed below by the following persons on behalf of the registrant and in the capacities and on the dates indicated.
| | |
| |
| By: | | /S/ R. JAY GERKEN |
| | R. Jay Gerken |
| | Principal Executive Officer of |
| | Legg Mason Global Asset Management Trust |
| |
| Date: | | January 21, 2011 |
| |
| By: | | /S/ KAPREL OZSOLAK |
| | (Kaprel Ozsolak) |
| | Chief Financial Officer of |
| | Legg Mason Global Asset Management Trust |
| |
| Date: | | January 21, 2011 |