UNITED STATES
SECURITIES AND EXCHANGE COMMISSION
Washington, D.C. 20549
FORM N-CSR
CERTIFIED SHAREHOLDER REPORT OF REGISTERED
MANAGEMENT INVESTMENT COMPANIES
Investment Company Act file number 811-22338
Legg Mason Global Asset Management Trust
(Exact name of registrant as specified in charter)
55 Water Street, New York, NY 10041
(Address of principal executive offices) (Zip code)
Robert I. Frenkel, Esq.
Legg Mason & Co., LLC
100 First Stamford Place
Stamford, CT 06902
(Name and address of agent for service)
Registrant’s telephone number, including area code:
Funds Investor Services 1-800-822-5544
or
Institutional Shareholder Services 1-888-425-6432
Date of fiscal year end: September 30
Date of reporting period: September 30, 2010
| ITEM 1. | REPORT TO STOCKHOLDERS. |
The Annual Report to Stockholders is filed herewith.
September 30, 2010

Annual Repor t
Legg Mason BW
Diversified
Large Cap
Value Fund
INVESTMENT PRODUCTS: NOT FDIC INSURED • NO BANK GUARANTEE • MAY LOSE VALUE
| | |
| II | | Legg Mason BW Diversified Large Cap Value Fund |
Fund objective
The Fund seeks long-term capital appreciation.
| | | | |
| Letter to our shareholders | | | | |
Dear Shareholder,
We are pleased to provide the annual report of Legg Mason BW Diversified Large Cap Value Fund for the reporting period from the Fund’s inception on September 7, 2010 through September 30, 2010.
As always, we remain committed to providing you with excellent service and a full spectrum of investment choices. We also remain committed to supplementing the support you receive from your financial advisor. One way we accomplish this is through our website, www.leggmason.com/individualinvestors. Here you can gain immediate access to market and investment information, including:
| Ÿ | | Fund prices and performance, |
| Ÿ | | Market insights and commentaries from our portfolio managers, and |
| Ÿ | | A host of educational resources. |
We look forward to helping you meet your financial goals.
Sincerely,
| | |
 | |  |
Mark R. Fetting Chairman | | David Odenath President |
October 29, 2010
| | | | |
| Legg Mason BW Diversified Large Cap Value Fund | | | III | |
Fund overview
Q. What is the Fund’s investment strategy?
A. The Fund seeks long-term capital appreciation. Normally, the Fund invests at least 80% of its net assets in equity securities of large-capitalization companies. The Fund invests primarily in equity securities that, in our opinion, are undervalued or out of favor. We invest in securities that meet our value criteria, based on both quantitative and fundamental analysis. The Fund may invest in foreign equity securities, either directly or through depositary receipts.
We firmly believe that combining the discipline and consistency of our quantitative process with the insights derived from our fundamental stock research offers the greatest potential to outperform the large-cap value benchmark. While the Fund is newly launched, we have managed other investment products with substantially similar investment strategies. Our core value philosophy has remained unchanged since the inception of the Diversified Large Cap Value Equity strategy in 1999.
Our Diversified Large Cap Value Equity philosophy is based in part on our fundamental academic research. Our research studies confirm our experience-derived belief that concentrating on U.S. large-capitalization stocks with low valuation ratios produces excellent investment result potential. Our investment philosophy is based on our belief that stocks with the lowest prices relative to current earnings or book value will provide strong returns over longer periods of time. Avoiding stocks with poor recent relative performance helps prevent investing too early in any particular value stock. Focusing on companies that relatively have been able to reduce their equity shares helps identify the stocks with the financial strength to generate strong returns. We employ quantitative techniques to identify each of these attractive characteristics.
Regarding our fundamental research, we have determined that our exclusionary process, which seeks to eliminate poor performers, is an effective means to capitalize on the value-based opportunities. In this process, we use our fundamental research to exclude from our quantitatively select investment universe those stocks that we feel have the least ability to outperform. We periodically update our research to confirm and enhance our process and approach.
Performance review
For the period from the Fund’s inception on September 7, 2010 through September 30, 2010 (the “reporting period”), Class A shares of Legg Mason BW Diversified Large Cap Value Fund, excluding sales charges, returned 4.33%. The Fund’s unmanaged benchmark, the Russell 1000 Value Indexi (the “Index”), returned 3.82% over the same time frame. The Lipper Large-Cap Value Funds Category Average1 returned 4.17% for the period from September 2, 2010 through September 30, 2010.
| | | | |
| Performance Snapshot as of September 30, 2010 | | | |
| (excluding sales charges) (unaudited) | | Since Fund
Inception* | |
| Legg Mason BW Diversified Large Cap Value Fund: | | | | |
Class A | | | 4.33 | % |
Class C | | | 4.33 | % |
Class I | | | 4.42 | % |
Class IS | | | 4.42 | % |
| Russell 1000 Value Index | | | 3.82 | % |
| Lipper Large-Cap Value Funds Category Average1 | | | 4.17 | % |
The performance shown represents past performance. Past performance is no guarantee of future results and current performance may be higher or lower than the performance shown above. Principal value and investment returns will fluctuate and investors’ shares, when redeemed, may be worth more or less than their original cost. To obtain performance data current to the most recent month-end, please visit our website at www.leggmason.com/individualinvestors.
All share class returns assume the reinvestment of all distributions, including returns of capital, if any, at net asset value and the deduction of all Fund expenses. Returns have not been adjusted to include sales charges that may apply or the deduction of taxes that a shareholder would pay on Fund distributions. If sales charges were reflected, the performance quoted would be lower. Performance figures for periods shorter than one year represent cumulative figures and are not annualized. Results for longer periods may differ, in some cases, substantially.
Performance figures reflect compensating balance arrangements, expense reimbursements and/or fee waivers, without which the performance would have been lower.
| * | The Fund’s inception date is September 7, 2010. |
|
| Total Annual Operating Expenses (unaudited) |
As of the Fund’s most current prospectus dated August 20, 2010, the gross total operating expense ratios for Class A, Class C, Class I and Class IS shares were 1.46%, 2.21%, 1.11% and 1.01%, respectively.
Actual expenses may be higher. For example, expenses may be higher than those shown if average net assets decrease. Net assets are more likely to decrease and Fund expense ratios are more likely to increase when markets are volatile.
| 1 | Lipper, Inc., a wholly-owned subsidiary of Reuters, provides independent insight on global collective investments. Returns are based on the period from September 2, 2010 through September 30, 2010, including the reinvestment of all distributions, including returns of capital, if any, calculated among the 486 funds in the Fund’s Lipper category, and excluding sales charges. |
| | |
| IV | | Legg Mason BW Diversified Large Cap Value Fund |
Fund overview (cont’d)
As a result of an expense limitation agreement, the ratio of expenses, other than interest, brokerage, taxes and extraordinary expenses, to average net assets will not exceed 1.30% for Class A shares, 2.05% for Class C shares, 0.95% for Class I shares and 0.85% for Class IS shares. In addition, the total annual operating expenses of Class IS shares will not exceed those of Class I shares. This expense limitation agreement takes into account brokerage commissions paid on purchases and sales of shares of exchange-traded funds. This expense limitation agreement cannot be terminated prior to December 31, 2011 without the Board of Trustees’ consent.
The manager is permitted to recapture amounts forgone or reimbursed to a class within three years after the year in which the manager earned the fee or incurred the expense if the class’ total annual operating expenses have fallen to a level below the expense limitation in effect at the time the fees were earned or the expense incurred.
Q. What were the leading contributors to performance?
A. The Financials sector was the most significant contributor to relative performance for the reporting period as a result of our lack of exposure to certain securities within the Index. Insurance continues to represent nearly half of our overall weight in the Financials sector and was a significant contributor on both an absolute and relative basis. Our overweights to the Consumer Discretionary, Consumer Staples and Industrials Sectors were also contributors to the Fund’s return. In addition, issue selection within these sectors was additive to relative results.
Q. What were the leading detractors from performance?
A. The Fund’s slight underweights to the Energy and Telecommunication Services sectors detracted from relative performance for the period as both sectors outperformed the overall Index. Issue selection within these sectors also had a negative impact on relative performance.
Thank you for your investment in Legg Mason BW Diversified Large Cap Value Fund. As always, we appreciate that you have chosen us to manage your assets and we remain focused on achieving the Fund’s investment goals.
Sincerely,

Henry F. Otto
Portfolio Manager
Brandywine Global Investment
Management, LLC

Steven M. Tonkovich
Portfolio Manager
Brandywine Global Investment
Management, LLC

Joseph J. Kirby
Portfolio Manager
Brandywine Global Investment
Management, LLC
October 19, 2010
RISKS: Equity securities are subject to market fluctuations. Foreign securities are subject to certain risks of overseas investing including currency fluctuations and changes in political and economic conditions, which could result in significant market fluctuations. These risks are magnified in emerging markets. The Fund may use derivatives, such as options and futures, which can be illiquid, may disproportionately increase losses, and have a potentially large impact on Fund performance. Please see the Fund’s prospectus for more information on these and other risks.
Portfolio holdings and breakdowns are as of September 30, 2010 and are subject to change and may not be representative of the portfolio managers’ current or future investments. The Fund’s top ten holdings (as a percentage of net assets) as of this date were: General Electric Co. (4.4%), AT&T Inc. (4.0%), Chevron Corp. (3.9%), JPMorgan Chase & Co. (3.5%), International Business Machines Corp. (2.7%), ConocoPhillips (2.1%), Wells Fargo & Co. (2.1%), Johnson & Johnson (2.0%), Wal-Mart Stores Inc. (2.0%) and Intel Corp. (1.7%). Please refer to pages 4 through 11 for a list and percentage breakdown of the Fund’s holdings.
The mention of sector breakdowns is for informational purposes only and should not be construed as a recommendation to purchase or sell any securities. The information provided regarding such sectors is not a sufficient basis upon which to make an investment decision. Investors seeking financial advice regarding the appropriateness of investing in any securities or investment strategies discussed should consult their financial professional. The Fund’s top five sector holdings (as a percentage of net assets) as of September 30, 2010 were: Financials (19.2%), Health Care (13.5%), Industrials (11.3%), Consumer Discretionary (11.1%) and Consumer Staples (11.0%). The Fund’s portfolio composition is subject to change at any time.
All investments are subject to risk including the possible loss of principal. Past performance is no guarantee of future results. All index performance reflects no deduction for fees, expenses or taxes. Please note that an investor cannot invest directly in an index.
The information provided is not intended to be a forecast of future events, a guarantee of future results or investment advice. Views expressed may differ from those of the firm as a whole.
| 1 | The Russell 1000 Value Index measures the performance of those Russell 1000 Index companies with lower price-to-book ratios and lower forecasted growth values. (A price-to-book ratio is the price of a stock compared to the difference between a company’s assets and liabilities.) The Russell 1000 Index measures the performance of the 1,000 largest |
companies in the Russell 3000 Index, which represents approximately 92% of the total market capitalization of the Russell 3000 Index. The Russell 3000 Index measures the performance of the 3,000 largest U.S. companies based on total market capitalization, which represents approximately 98% of the U.S. equity market.
| | | | |
| Legg Mason BW Diversified Large Cap Value Fund 2010 Annual Report | | | 1 | |
Fund at a glance† (unaudited)
Investment breakdown (%) as a percent of total investments
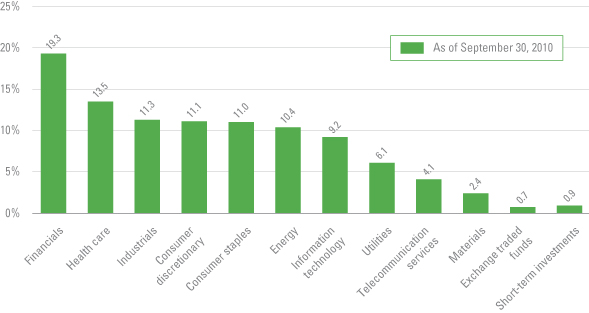
| † | The bar graph above represents the composition of the Fund’s investments as of September 30, 2010. The Fund is actively managed. As a result, the composition of the Fund’s investments is subject to change at any time. |
| | |
| 2 | | Legg Mason BW Diversified Large Cap Value Fund 2010 Annual Report |
Fund expenses (unaudited)
Example
As a shareholder of the Fund, you may incur two types of costs: (1) transaction costs including front-end and back-end sales charges (loads) on purchase payments; and (2) ongoing costs, including management fees; distribution and/or service (12b-1) fees, and other Fund expenses. This example is intended to help you understand your ongoing costs (in dollars) of investing in the Fund and to compare these costs with the ongoing costs of investing in other mutual funds.
This example is based on an investment of $1,000 invested on September 7, 2010 (inception date) and held for the period ended September 30, 2010.
Actual expenses
The table below titled “Based on Actual Total Return” provides information about actual account values and actual expenses. You may use the information provided in this table, together with the amount you invested, to estimate the expenses that you paid over the period. To estimate the expenses you paid on your account, divide your ending account value by $1,000 (for example, an $8,600 ending account value divided by $1,000 = 8.6), then multiply the result by the number under the heading entitled “Expenses Paid During the Period”.
Hypothetical example for
comparison purposes
The table below titled “Based on Hypothetical Total Return” provides information about hypothetical account values and hypothetical expenses based on the actual expense ratio and an assumed rate of return of 5.00% per year before expenses, which is not the Fund’s actual return. The hypothetical account values and expenses may not be used to estimate the actual ending account balance or expenses you paid for the period. You may use the information provided in this table to compare the ongoing costs of investing in the Fund and other funds. To do so, compare the 5.00% hypothetical example relating to the Fund with the 5.00% hypothetical examples that appear in the shareholder reports of the other funds.
Please note that the expenses shown in the table below are meant to highlight your ongoing costs only and do not reflect any transactional costs, such as front-end or back-end sales charges (loads). Therefore, the table is useful in comparing ongoing costs only, and will not help you determine the relative total costs of owning different funds. In addition, if these transaction costs were included, your costs would have been higher.
| | | | | | | | | | | | | | | | | | | | | | | | | | | | | | | | | | | | | | | | | | | | | | |
| Based on actual total return1 | | | | | | Based on hypothetical total return | |
| | | Actual Total
Return2 | | | Beginning
Account
Value | | | Ending
Account
Value | | | Annualized
Expense
Ratio | | | Expenses
Paid
During
the
Period3 | | | | | | | | Hypothetical
Annualized
Total Return | | | Beginning
Account
Value | | | Ending
Account
Value | | | Annualized
Expense
Ratio | | | Expenses
Paid
During the
Period4 | |
| Class A | | | 4.33 | % | | $ | 1,000.00 | | | $ | 1,043.30 | | | | 1.27 | % | | $ | 0.82 | | | | | | | Class A | | | 5.00 | % | | $ | 1,000.00 | | | $ | 1,018.70 | | | | 1.27 | % | | $ | 6.43 | |
| Class C | | | 4.33 | | | | 1,000.00 | | | | 1,043.30 | | | | 2.02 | | | | 1.30 | | | | | | | Class C | | | 5.00 | | | | 1,000.00 | | | | 1,014.94 | | | | 2.02 | | | | 10.20 | |
| Class I | | | 4.42 | | | | 1,000.00 | | | | 1,044.20 | | | | 0.92 | | | | 0.59 | | | | | | | Class I | | | 5.00 | | | | 1,000.00 | | | | 1,020.46 | | | | 0.92 | | | | 4.66 | |
| Class IS | | | 4.42 | | | | 1,000.00 | | | | 1,044.20 | | | | 0.82 | | | | 0.53 | | | | | | | Class IS | | | 5.00 | | | | 1,000.00 | | | | 1,020.96 | | | | 0.82 | | | | 4.15 | |
| 1 | For the period September 7, 2010 (inception date) through September 30, 2010. |
| 2 | Assumes the reinvestment of all distributions, including returns of capital, if any, at net asset value and does not reflect the deduction of the applicable sales charge with respect to Class A shares or the applicable contingent deferred sales charges (“CDSC”) with Class C shares. Total return is not annualized, as it may not be representative of the total return for the year. Performance figures may reflect compensating balance arrangements, fee waivers and/or expense reimbursements. In the absence of compensating balance arrangements, fee waivers and/or expense reimbursements, the total return would have been lower. Past performance is no guarantee of future results. |
| 3 | Expenses (net of compensating balance arrangements, fee waivers and/or expense reimbursements) are equal to each class’s respective annualized expense ratio multiplied by the average account value over the period, multiplied by the number of days in the most recent fiscal period (23), then divided by 365. |
| 4 | Expenses (net of compensating balance arrangements, fee waivers and/or expense reimbursements) are equal to each class’s respective annualized expense ratio multiplied by the average account value over the period, multiplied by the number of days in the most recent fiscal half-year (183), then divided by 365. |
| | | | |
| Legg Mason BW Diversified Large Cap Value Fund 2010 Annual Report | | | 3 | |
Fund performance (unaudited)
| | | | | | | | | | | | | | | | |
| Average annual total returns† | |
| Without sales charges1 | | Class A | | | Class C | | | Class I | | | Class IS | |
Inception* through 9/30/10 | | | 4.33 | % | | | 4.33 | % | | | 4.42 | % | | | 4.42 | % |
| | | | |
| With sales charges2 | | Class A | | | Class C | | | Class I | | | Class IS | |
Inception* through 9/30/10 | | | -1.65 | % | | | 3.33 | % | | | 4.42 | % | | | 4.42 | % |
| | | | | | | | |
| Cumulative total returns† | | | | |
| Without sales charges1 | | | | | | |
| Class A (Inception date of 9/7/10 through 9/30/10) | | | 4.33 | % | | | | |
| Class C (Inception date of 9/7/10 through 9/30/10) | | | 4.33 | | | | | |
| Class I (Inception date of 9/7/10 through 9/30/10) | | | 4.42 | | | | | |
| Class IS (Inception date of 9/7/10 through 9/30/10) | | | 4.42 | | | | | |
All figures represent past performance and are not a guarantee of future results. Investment return and principal value of an investment will fluctuate so that an investor’s shares, when redeemed, may be worth more or less than their original cost. The returns shown do not reflect the deduction of taxes that a shareholder would pay on Fund distributions or the redemption of Fund shares. Performance figures may reflect compensating balance arrangements, fee waivers and/or expense reimbursements. In the absence of compensating balance arrangements, fee waivers and/or expense reimbursements, the total return would have been lower.
| 1 | Assumes the reinvestment of all distributions, including returns of capital, if any, at net asset value and does not reflect the deduction of the applicable sales charge with respect to Class A shares or the applicable CDSC with respect to Class C shares. |
| 2 | Assumes the reinvestment of all distributions, including returns of capital, if any, at net asset value. In addition, Class A shares reflect the deduction of the maximum initial sales charge of 5.75% and Class C shares reflect the deduction of a 1.00% CDSC, which applies if shares are redeemed within one year from purchase payment. |
| * | Inception date for Class A, C, I and IS shares is September 7, 2010. |
| | |
| 4 | | Legg Mason BW Diversified Large Cap Value Fund 2010 Annual Report |
Schedule of investments
September 30, 2010
Legg Mason BW Diversified Large Cap Value Fund
| | | | | | | | | | | | | | | | |
| Security | | | | | | | | Shares | | | Value | |
| Common Stocks — 98.9% | | | | | | | | | | | | | | | | |
| Consumer Discretionary — 11.1% | | | | | | | | | | | | | | | | |
Hotels, Restaurants & Leisure — 1.7% | | | | | | | | | | | | | | | | |
Carnival Corp. | | | | | | | | | | | 32,100 | | | $ | 1,226,541 | |
Darden Restaurants Inc. | | | | | | | | | | | 4,100 | | | | 175,398 | |
Royal Caribbean Cruises Ltd. | | | | | | | | | | | 6,300 | | | | 198,639 | * |
Wyndham Worldwide Corp. | | | | | | | | | | | 14,900 | | | | 409,303 | |
Total Hotels, Restaurants & Leisure | | | | | | | | | | | | | | | 2,009,881 | |
Household Durables — 0.7% | | | | | | | | | | | | | | | | |
D.R. Horton Inc. | | | | | | | | | | | 8,100 | | | | 90,072 | |
Mohawk Industries Inc. | | | | | | | | | | | 2,900 | | | | 154,570 | * |
Newell Rubbermaid Inc. | | | | | | | | | | | 12,100 | | | | 215,501 | |
Toll Brothers Inc. | | | | | | | | | | | 4,700 | | | | 89,394 | * |
Tupperware Brands Corp. | | | | | | | | | | | 1,700 | | | | 77,792 | |
Whirlpool Corp. | | | | | | | | | | | 2,500 | | | | 202,400 | |
Total Household Durables | | | | | | | | | | | | | | | 829,729 | |
Leisure Equipment & Products — 0.4% | | | | | | | | | | | | | | | | |
Hasbro Inc. | | | | | | | | | | | 6,300 | | | | 280,413 | |
Mattel Inc. | | | | | | | | | | | 9,000 | | | | 211,140 | |
Total Leisure Equipment & Products | | | | | | | | | | | | | | | 491,553 | |
Media — 5.1% | | | | | | | | | | | | | | | | |
CBS Corp., Class B Shares | | | | | | | | | | | 49,900 | | | | 791,414 | |
Comcast Corp., Class A Shares | | | | | | | | | | | 80,500 | | | | 1,455,440 | |
DISH Network Corp., Class A Shares | | | | | | | | | | | 13,700 | | | | 262,492 | |
News Corp., Class A Shares | | | | | | | | | | | 63,400 | | | | 828,004 | |
Omnicom Group Inc. | | | | | | | | | | | 13,900 | | | | 548,772 | |
Time Warner Inc. | | | | | | | | | | | 43,700 | | | | 1,339,405 | |
Viacom Inc., Class B Shares | | | | | | | | | | | 27,900 | | | | 1,009,701 | |
Total Media | | | | | | | | | | | | | | | 6,235,228 | |
Multiline Retail — 1.8% | | | | | | | | | | | | | | | | |
Big Lots Inc. | | | | | | | | | | | 2,600 | | | | 86,450 | * |
Kohl’s Corp. | | | | | | | | | | | 7,100 | | | | 374,028 | * |
Macy’s Inc. | | | | | | | | | | | 24,200 | | | | 558,778 | |
Target Corp. | | | | | | | | | | | 22,700 | | | | 1,213,088 | |
Total Multiline Retail | | | | | | | | | | | | | | | 2,232,344 | |
Specialty Retail — 1.2% | | | | | | | | | | | | | | | | |
AutoZone Inc. | | | | | | | | | | | 1,100 | | | | 251,801 | * |
Gap Inc. | | | | | | | | | | | 20,000 | | | | 372,800 | |
RadioShack Corp. | | | | | | | | | | | 3,500 | | | | 74,655 | |
Ross Stores Inc. | | | | | | | | | | | 3,500 | | | | 191,170 | |
Signet Jewelers Ltd. | | | | | | | | | | | 2,000 | | | | 63,480 | * |
TJX Cos. Inc. | | | | | | | | | | | 12,600 | | | | 562,338 | |
Total Specialty Retail | | | | | | | | | | | | | | | 1,516,244 | |
Textiles, Apparel & Luxury Goods — 0.2% | | | | | | | | | | | | | | | | |
V.F. Corp. | | | | | | | | | | | 3,600 | | | | 291,672 | |
Total Consumer Discretionary | | | | | | | | | | | | | | | 13,606,651 | |
See Notes to Financial Statements.
| | | | |
| Legg Mason BW Diversified Large Cap Value Fund 2010 Annual Report | | | 5 | |
Legg Mason BW Diversified Large Cap Value Fund
| | | | | | | | | | | | | | | | |
| Security | | | | | | | | Shares | | | Value | |
| Consumer Staples — 11.0% | | | | | | | | | | | | | | | | |
Beverages — 0.3% | | | | | | | | | | | | | | | | |
Constellation Brands Inc., Class A Shares | | | | | | | | | | | 6,500 | | | $ | 114,985 | * |
Molson Coors Brewing Co., Class B Shares | | | | | | | | | | | 4,300 | | | | 203,046 | |
Total Beverages | | | | | | | | | | | | | | | 318,031 | |
Food & Staples Retailing — 3.3% | | | | | | | | | | | | | | | | |
CVS Caremark Corp. | | | | | | | | | | | 34,100 | | | | 1,073,127 | |
Kroger Co. | | | | | | | | | | | 14,800 | | | | 320,568 | |
Safeway Inc. | | | | | | | | | | | 9,400 | | | | 198,904 | |
Wal-Mart Stores Inc. | | | | | | | | | | | 45,200 | | | | 2,419,104 | |
Total Food & Staples Retailing | | | | | | | | | | | | | | | 4,011,703 | |
Food Products — 2.8% | | | | | | | | | | | | | | | | |
Archer-Daniels-Midland Co. | | | | | | | | | | | 14,800 | | | | 472,416 | |
Campbell Soup Co. | | | | | | | | | | | 12,300 | | | | 439,725 | |
ConAgra Foods Inc. | | | | | | | | | | | 14,000 | | | | 307,160 | |
Corn Products International Inc. | | | | | | | | | | | 2,700 | | | | 101,250 | |
Del Monte Foods Co. | | | | | | | | | | | 12,800 | | | | 167,808 | |
General Mills Inc. | | | | | | | | | | | 16,100 | | | | 588,294 | |
Hormel Foods Corp. | | | | | | | | | | | 3,900 | | | | 173,940 | |
J.M. Smucker Co. | | | | | | | | | | | 3,400 | | | | 205,802 | |
Kellogg Co. | | | | | | | | | | | 7,800 | | | | 393,978 | |
Ralcorp Holdings Inc. | | | | | | | | | | | 1,300 | | | | 76,024 | * |
Sara Lee Corp. | | | | | | | | | | | 25,300 | | | | 339,779 | |
Tyson Foods Inc., Class A Shares | | | | | | | | | | | 13,000 | | | | 208,260 | |
Total Food Products | | | | | | | | | | | | | | | 3,474,436 | |
Household Products — 1.1% | | | | | | | | | | | | | | | | |
Clorox Co. | | | | | | | | | | | 6,200 | | | | 413,912 | |
Energizer Holdings Inc. | | | | | | | | | | | 1,600 | | | | 107,568 | * |
Kimberly-Clark Corp. | | | | | | | | | | | 13,800 | | | | 897,690 | |
Total Household Products | | | | | | | | | | | | | | | 1,419,170 | |
Personal Products — 0.1% | | | | | | | | | | | | | | | | |
Herbalife Ltd. | | | | | | | | | | | 1,700 | | | | 102,595 | |
Tobacco — 3.4% | | | | | | | | | | | | | | | | |
Altria Group Inc. | | | | | | | | | | | 49,200 | | | | 1,181,784 | |
Lorillard Inc. | | | | | | | | | | | 4,800 | | | | 385,488 | |
Philip Morris International Inc. | | | | | | | | | | | 36,900 | | | | 2,067,138 | |
Reynolds American Inc. | | | | | | | | | | | 8,700 | | | | 516,693 | |
Total Tobacco | | | | | | | | | | | | | | | 4,151,103 | |
Total Consumer Staples | | | | | | | | | | | | | | | 13,477,038 | |
| Energy — 10.4% | | | | | | | | | | | | | | | | |
Energy Equipment & Services — 1.0% | | | | | | | | | | | | | | | | |
Dresser-Rand Group Inc. | | | | | | | | | | | 3,400 | | | | 125,426 | * |
Helmerich & Payne Inc. | | | | | | | | | | | 4,600 | | | | 186,116 | |
National-Oilwell Varco Inc. | | | | | | | | | | | 9,700 | | | | 431,359 | |
Rowan Cos. Inc. | | | | | | | | | | | 4,900 | | | | 148,764 | * |
Weatherford International Ltd. | | | | | | | | | | | 17,100 | | | | 292,410 | * |
Total Energy Equipment & Services | | | | | | | | | | | | | | | 1,184,075 | |
See Notes to Financial Statements.
| | |
| 6 | | Legg Mason BW Diversified Large Cap Value Fund 2010 Annual Report |
Schedule of investments (cont’d)
September 30, 2010
Legg Mason BW Diversified Large Cap Value Fund
| | | | | | | | | | | | | | | | |
| Security | | | | | | | | Shares | | | Value | |
Oil, Gas & Consumable Fuels — 9.4% | | | | | | | | | | | | | | | | |
Apache Corp. | | | | | | | | | | | 8,400 | | | $ | 821,184 | |
Chevron Corp. | | | | | | | | | | | 58,200 | | | | 4,717,110 | |
ConocoPhillips | | | | | | | | | | | 45,600 | | | | 2,618,808 | |
Devon Energy Corp. | | | | | | | | | | | 8,400 | | | | 543,816 | |
El Paso Corp. | | | | | | | | | | | 59,100 | | | | 731,658 | |
Hess Corp. | | | | | | | | | | | 7,700 | | | | 455,224 | |
Marathon Oil Corp. | | | | | | | | | | | 16,400 | | | | 542,840 | |
Newfield Exploration Co. | | | | | | | | | | | 2,500 | | | | 143,600 | * |
Southern Union Co. | | | | | | | | | | | 5,300 | | | | 127,518 | |
Sunoco Inc. | | | | | | | | | | | 3,400 | | | | 124,100 | |
Valero Energy Corp. | | | | | | | | | | | 13,100 | | | | 229,381 | |
Williams Cos. Inc. | | | | | | | | | | | 22,600 | | | | 431,886 | |
Total Oil, Gas & Consumable Fuels | | | | | | | | | | | | | | | 11,487,125 | |
Total Energy | | | | | | | | | | | | | | | 12,671,200 | |
| Exchange Traded Funds — 0.7% | | | | | | | | | | | | | | | | |
iShares Trust — iShares Russell 1000 Value Index Fund | | | | | | | | | | | 15,400 | | | | 908,446 | |
| Financials — 19.2% | | | | | | | | | | | | | | | | |
Capital Markets — 1.7% | | | | | | | | | | | | | | | | |
Ameriprise Financial Inc. | | | | | | | | | | | 5,800 | | | | 274,514 | |
Bank of New York Mellon Corp. | | | | | | | | | | | 28,100 | | | | 734,253 | |
Goldman Sachs Group Inc. | | | | | | | | | | | 5,400 | | | | 780,732 | |
Raymond James Financial Inc. | | | | | | | | | | | 5,000 | | | | 126,650 | |
State Street Corp. | | | | | | | | | | | 5,500 | | | | 207,130 | |
Total Capital Markets | | | | | | | | | | | | | | | 2,123,279 | |
Commercial Banks — 3.2% | | | | | | | | | | | | | | | | |
BOK Financial Corp. | | | | | | | | | | | 1,300 | | | | 58,669 | |
City National Corp. | | | | | | | | | | | 1,200 | | | | 63,684 | |
Comerica Inc. | | | | | | | | | | | 12,800 | | | | 475,520 | |
Fifth Third Bancorp | | | | | | | | | | | 37,700 | | | | 453,531 | |
Regions Financial Corp. | | | | | | | | | | | 54,800 | | | | 398,396 | |
Wells Fargo & Co. | | | | | | | | | | | 100,400 | | | | 2,523,052 | |
Total Commercial Banks | | | | | | | | | | | | | | | 3,972,852 | |
Consumer Finance — 0.5% | | | | | | | | | | | | | | | | |
Capital One Financial Corp. | | | | | | | | | | | 10,600 | | | | 419,230 | |
SLM Corp. | | | | | | | | | | | 18,600 | | | | 214,830 | * |
Total Consumer Finance | | | | | | | | | | | | | | | 634,060 | |
Diversified Financial Services — 4.8% | | | | | | | | | | | | | | | | |
Bank of America Corp. | | | | | | | | | | | 79,700 | | | | 1,044,867 | |
JPMorgan Chase & Co. | | | | | | | | | | | 111,000 | | | | 4,225,770 | |
Leucadia National Corp. | | | | | | | | | | | 4,700 | | | | 111,014 | * |
Nasdaq OMX Group Inc. | | | | | | | | | | | 4,700 | | | | 91,321 | * |
NYSE Euronext | | | | | | | | | | | 6,000 | | | | 171,420 | |
Principal Financial Group Inc. | | | | | | | | | | | 7,400 | | | | 191,808 | |
Total Diversified Financial Services | | | | | | | | | | | | | | | 5,836,200 | |
Insurance — 8.8% | | | | | | | | | | | | | | | | |
ACE Ltd. | | | | | | | | | | | 7,800 | | | | 454,350 | |
AFLAC Inc. | | | | | | | | | | | 17,800 | | | | 920,438 | |
See Notes to Financial Statements.
| | | | |
| Legg Mason BW Diversified Large Cap Value Fund 2010 Annual Report | | | 7 | |
Legg Mason BW Diversified Large Cap Value Fund
| | | | | | | | | | | | | | |
| Security | | | | | | | Shares | | | Value | |
Insurance — continued | | | | | | | | | | | | | | |
Alleghany Corp. | | | | | | | | | 24 | | | $ | 7,273 | * |
Allied World Assurance Holdings Ltd. | | | | | | | | | 1,100 | | | | 62,249 | |
Allstate Corp. | | | | | | | | | 30,000 | | | | 946,500 | |
American Financial Group Inc. | | | | | | | | | 6,700 | | | | 204,886 | |
Arch Capital Group Ltd. | | | | | | | | | 3,600 | | | | 301,680 | * |
Assurant Inc. | | | | | | | | | 6,300 | | | | 256,410 | |
Axis Capital Holdings Ltd. | | | | | | | | | 7,700 | | | | 253,638 | |
Chubb Corp. | | | | | | | | | 19,200 | | | | 1,094,208 | |
Cincinnati Financial Corp. | | | | | | | | | 5,900 | | | | 170,215 | |
Everest Re Group Ltd. | | | | | | | | | 1,300 | | | | 112,411 | |
HCC Insurance Holdings Inc. | | | | | | | | | 4,100 | | | | 106,969 | |
Loews Corp. | | | | | | | | | 27,000 | | | | 1,023,300 | |
Markel Corp. | | | | | | | | | 400 | | | | 137,836 | * |
Old Republic International Corp. | | | | | | | | | 8,600 | | | | 119,110 | |
Progressive Corp. | | | | | | | | | 37,200 | | | | 776,364 | |
Prudential Financial Inc. | | | | | | | | | 10,800 | | | | 585,144 | |
Reinsurance Group of America Inc. | | | | | | | | | 2,600 | | | | 125,554 | |
RenaissanceRe Holdings Ltd. | | | | | | | | | 3,500 | | | | 209,860 | |
Torchmark Corp. | | | | | | | | | 4,900 | | | | 260,386 | |
Transatlantic Holdings Inc. | | | | | | | | | 3,900 | | | | 198,198 | |
Travelers Cos. Inc. | | | | | | | | | 23,300 | | | | 1,213,930 | |
Unum Group | | | | | | | | | 29,900 | | | | 662,285 | |
W.R. Berkley Corp. | | | | | | | | | 5,300 | | | | 143,471 | |
White Mountains Insurance Group Ltd. | | | | | | | | | 500 | | | | 154,230 | |
XL Group PLC | | | | | | | | | 10,500 | | | | 227,430 | |
Total Insurance | | | | | | | | | | | | | 10,728,325 | |
Thrifts & Mortgage Finance — 0.2% | | | | | | | | | | | | | | |
Hudson City Bancorp Inc. | | | | | | | | | 18,700 | | | | 229,262 | |
Total Financials | | | | | | | | | | | | | 23,523,978 | |
| Health Care — 13.5% | | | | | | | | | | | | | | |
Biotechnology — 1.4% | | | | | | | | | | | | | | |
Amgen Inc. | | | | | | | | | 22,200 | | | | 1,223,442 | * |
Biogen Idec Inc. | | | | | | | | | 5,600 | | | | 314,272 | * |
Cephalon Inc. | | | | | | | | | 1,700 | | | | 106,148 | * |
Total Biotechnology | | | | | | | | | | | | | 1,643,862 | |
Health Care Equipment & Supplies — 1.0% | | | | | | | | | | | | | | |
Becton, Dickinson & Co. | | | | | | | | | 5,500 | | | | 407,550 | |
St. Jude Medical Inc. | | | | | | | | | 7,600 | | | | 298,984 | * |
Zimmer Holdings Inc. | | | | | | | | | 9,800 | | | | 512,834 | * |
Total Health Care Equipment & Supplies | | | | | | | | | | | | | 1,219,368 | |
Health Care Providers & Services — 4.7% | | | | | | | | | | | | | | |
Aetna Inc. | | | | | | | | | 12,900 | | | | 407,769 | |
AmerisourceBergen Corp. | | | | | | | | | 9,400 | | | | 288,204 | |
Cardinal Health Inc. | | | | | | | | | 8,900 | | | | 294,056 | |
CIGNA Corp. | | | | | | | | | 8,600 | | | | 307,708 | |
Community Health Systems Inc. | | | | | | | | | 2,800 | | | | 86,716 | * |
Coventry Health Care Inc. | | | | | | | | | 4,500 | | | | 96,885 | * |
See Notes to Financial Statements.
| | |
| 8 | | Legg Mason BW Diversified Large Cap Value Fund 2010 Annual Report |
Schedule of investments (cont’d)
September 30, 2010
Legg Mason BW Diversified Large Cap Value Fund
| | | | | | | | | | | | | | | | |
| Security | | | | | | | | Shares | | | Value | |
Health Care Providers & Services — continued | | | | | | | | | | | | | | | | |
DaVita Inc. | | | | | | | | | | | 3,100 | | | $ | 213,993 | * |
Health Net Inc. | | | | | | | | | | | 2,900 | | | | 78,851 | * |
Humana Inc. | | | | | | | | | | | 5,300 | | | | 266,272 | * |
Kinetic Concepts Inc. | | | | | | | | | | | 2,300 | | | | 84,134 | * |
Laboratory Corporation of America Holdings | | | | | | | | | | | 3,400 | | | | 266,662 | * |
McKesson Corp. | | | | | | | | | | | 12,500 | | | | 772,250 | |
Mednax Inc. | | | | | | | | | | | 600 | | | | 31,980 | * |
Omnicare Inc. | | | | | | | | | | | 3,100 | | | | 74,028 | |
Patterson Cos. Inc. | | | | | | | | | | | 2,900 | | | | 83,085 | |
UnitedHealth Group Inc. | | | | | | | | | | | 35,500 | | | | 1,246,405 | |
Universal Health Services Inc., Class B Shares | | | | | | | | | | | 2,900 | | | | 112,694 | |
WellPoint Inc. | | | | | | | | | | | 17,900 | | | | 1,013,856 | * |
Total Health Care Providers & Services | | | | | | | | | | | | | | | 5,725,548 | |
Pharmaceuticals — 6.4% | | | | | | | | | | | | | | | | |
Abbott Laboratories | | | | | | | | | | | 37,400 | | | | 1,953,776 | |
Bristol-Myers Squibb Co. | | | | | | | | | | | 57,500 | | | | 1,558,825 | |
Eli Lilly & Co. | | | | | | | | | | | 26,700 | | | | 975,351 | |
Endo Pharmaceuticals Holdings Inc. | | | | | | | | | | | 5,000 | | | | 166,200 | * |
Forest Laboratories Inc. | | | | | | | | | | | 13,700 | | | | 423,741 | * |
Johnson & Johnson | | | | | | | | | | | 39,500 | | | | 2,447,420 | |
Mylan Inc. | | | | | | | | | | | 13,200 | | | | 248,292 | * |
Warner Chilcott PLC, Class A Shares | | | | | | | | | | | 4,800 | | | | 107,712 | |
Total Pharmaceuticals | | | | | | | | | | | | | | | 7,881,317 | |
Total Health Care | | | | | | | | | | | | | | | 16,470,095 | |
| Industrials — 11.3% | | | | | | | | | | | | | | | | |
Aerospace & Defense — 2.6% | | | | | | | | | | | | | | | | |
General Dynamics Corp. | | | | | | | | | | | 11,200 | | | | 703,472 | |
Honeywell International Inc. | | | | | | | | | | | 14,900 | | | | 654,706 | |
Lockheed Martin Corp. | | | | | | | | | | | 9,200 | | | | 655,776 | |
Northrop Grumman Corp. | | | | | | | | | | | 9,100 | | | | 551,733 | |
Raytheon Co. | | | | | | | | | | | 11,500 | | | | 525,665 | |
Spirit AeroSystems Holdings Inc. | | | | | | | | | | | 4,100 | | | | 81,713 | * |
Total Aerospace & Defense | | | | | | | | | | | | | | | 3,173,065 | |
Airlines — 0.2% | | | | | | | | | | | | | | | | |
Southwest Airlines Co. | | | | | | | | | | | 20,500 | | | | 267,935 | |
Commercial Services & Supplies — 0.1% | | | | | | | | | | | | | | | | |
Avery Dennison Corp. | | | | | | | | | | | 1,500 | | | | 55,680 | |
Pitney Bowes Inc. | | | | | | | | | | | 3,500 | | | | 74,830 | |
Total Commercial Services & Supplies | | | | | | | | | | | | | | | 130,510 | |
Construction & Engineering — 0.1% | | | | | | | | | | | | | | | | |
KBR Inc. | | | | | | | | | | | 3,600 | | | | 88,704 | |
URS Corp. | | | | | | | | | | | 1,300 | | | | 49,374 | * |
Total Construction & Engineering | | | | | | | | | | | | | | | 138,078 | |
Electrical Equipment — 0.2% | | | | | | | | | | | | | | | | |
Cooper Industries PLC | | | | | | | | | | | 3,100 | | | | 151,683 | |
Hubbell Inc., Class B Shares | | | | | | | | | | | 2,100 | | | | 106,575 | |
Total Electrical Equipment | | | | | | | | | | | | | | | 258,258 | |
See Notes to Financial Statements.
| | | | |
| Legg Mason BW Diversified Large Cap Value Fund 2010 Annual Report | | | 9 | |
Legg Mason BW Diversified Large Cap Value Fund
| | | | | | | | | | | | | | | | |
| Security | | | | | | | | Shares | | | Value | |
Industrial Conglomerates — 7.1% | | | | | | | | | | | | | | | | |
3M Co. | | | | | | | | | | | 14,300 | | | $ | 1,239,953 | |
General Electric Co. | | | | | | | | | | | 328,000 | | | | 5,330,000 | |
United Technologies Corp. | | | | | | | | | | | 28,800 | | | | 2,051,424 | |
Total Industrial Conglomerates | | | | | | | | | | | | | | | 8,621,377 | |
Machinery — 0.9% | | | | | | | | | | | | | | | | |
AGCO Corp. | | | | | | | | | | | 2,700 | | | | 105,327 | * |
Flowserve Corp. | | | | | | | | | | | 1,700 | | | | 186,014 | |
ITT Industries Inc. | | | | | | | | | | | 5,300 | | | | 248,199 | |
Joy Global Inc. | | | | | | | | | | | 5,700 | | | | 400,824 | |
SPX Corp. | | | | | | | | | | | 1,900 | | | | 120,232 | |
Total Machinery | | | | | | | | | | | | | | | 1,060,596 | |
Professional Services — 0.1% | | | | | | | | | | | | | | | | |
Equifax Inc. | | | | | | | | | | | 4,100 | | | | 127,920 | |
Total Industrials | | | | | | | | | | | | | | | 13,777,739 | |
| Information Technology — 9.2% | | | | | | | | | | | | | | | | |
Communications Equipment — 0.2% | | | | | | | | | | | | | | | | |
Harris Corp. | | | | | | | | | | | 3,700 | | | | 163,873 | |
Tellabs Inc. | | | | | | | | | | | 12,800 | | | | 95,360 | |
Total Communications Equipment | | | | | | | | | | | | | | | 259,233 | |
Computers & Peripherals — 0.6% | | | | | | | | | | | | | | | | |
Dell Inc. | | | | | | | | | | | 46,300 | | | | 600,048 | * |
Lexmark International Inc., Class A Shares | | | | | | | | | | | 1,400 | | | | 62,468 | * |
Total Computers & Peripherals | | | | | | | | | | | | | | | 662,516 | |
Electronic Equipment, Instruments & Components — 1.1% | | | | | | | | | | | | | | | | |
Arrow Electronics Inc. | | | | | | | | | | | 5,100 | | | | 136,323 | * |
Avnet Inc. | | | | | | | | | | | 6,600 | | | | 178,266 | * |
Corning Inc. | | | | | | | | | | | 47,600 | | | | 870,128 | |
Ingram Micro Inc., Class A Shares | | | | | | | | | | | 6,000 | | | | 101,160 | * |
Molex Inc. | | | | | | | | | | | 2,600 | | | | 54,418 | |
Total Electronic Equipment, Instruments & Components | | | | | | | | | | | | | | | 1,340,295 | |
Internet Software & Services — 0.1% | | | | | | | | | | | | | | | | |
IAC/InterActiveCorp | | | | | | | | | | | 6,100 | | | | 160,247 | * |
IT Services — 3.0% | | | | | | | | | | | | | | | | |
Alliance Data Systems Corp. | | | | | | | | | | | 1,200 | | | | 78,312 | * |
Fiserv Inc. | | | | | | | | | | | 3,500 | | | | 188,370 | * |
International Business Machines Corp. | | | | | | | | | | | 24,300 | | | | 3,259,602 | |
Total System Services Inc. | | | | | | | | | | | 7,600 | | | | 115,824 | |
Total IT Services | | | | | | | | | | | | | | | 3,642,108 | |
Semiconductors & Semiconductor Equipment — 2.4% | | | | | | | | | �� | | | | | | | |
Intel Corp. | | | | | | | | | | | 109,800 | | | | 2,111,454 | |
Lam Research Corp. | | | | | | | | | | | 2,400 | | | | 100,440 | * |
Texas Instruments Inc. | | | | | | | | | | | 27,600 | | | | 749,064 | |
Total Semiconductors & Semiconductor Equipment | | | | | | | | | | | | | | | 2,960,958 | |
Software — 1.8% | | | | | | | | | | | | | | | | |
Broadridge Financial Solutions Inc. | | | | | | | | | | | 6,000 | | | | 137,220 | |
CA Inc. | | | | | | | | | | | 23,300 | | | | 492,096 | |
See Notes to Financial Statements.
| | |
| 10 | | Legg Mason BW Diversified Large Cap Value Fund 2010 Annual Report |
Schedule of investments (cont’d)
September 30, 2010
Legg Mason BW Diversified Large Cap Value Fund
| | | | | | | | | | | | | | | | |
| Security | | | | | | | | Shares | | | Value | |
Software — continued | | | | | | | | | | | | | | | | |
Microsoft Corp. | | | | | | | | | | | 64,900 | | | $ | 1,589,401 | |
Total Software | | | | | | | | | | | | | | | 2,218,717 | |
Total Information Technology | | | | | | | | | | | | | | | 11,244,074 | |
| Materials — 2.4% | | | | | | | | | | | | | | | | |
Chemicals — 1.5% | | | | | | | | | | | | | | | | |
E.I. du Pont de Nemours & Co. | | | | | | | | | | | 17,500 | | | | 780,850 | |
Eastman Chemical Co. | | | | | | | | | | | 1,700 | | | | 125,800 | |
FMC Corp. | | | | | | | | | | | 3,900 | | | | 266,799 | |
Huntsman Corp. | | | | | | | | | | | 5,900 | | | | 68,204 | |
International Flavors & Fragrances Inc. | | | | | | | | | | | 2,300 | | | | 111,596 | |
Lubrizol Corp. | | | | | | | | | | | 1,900 | | | | 201,343 | |
RPM International Inc. | | | | | | | | | | | 5,500 | | | | 109,560 | |
Scotts Miracle-Gro Co., Class A Shares | | | | | | | | | | | 1,200 | | | | 62,076 | |
Valspar Corp. | | | | | | | | | | | 2,900 | | | | 92,365 | |
Total Chemicals | | | | | | | | | | | | | | | 1,818,593 | |
Containers & Packaging — 0.6% | | | | | | | | | | | | | | | | |
Ball Corp. | | | | | | | | | | | 4,300 | | | | 253,055 | |
Crown Holdings Inc. | | | | | | | | | | | 4,400 | | | | 126,104 | * |
Greif Inc., Class A Shares | | | | | | | | | | | 1,300 | | | | 76,492 | |
Sealed Air Corp. | | | | | | | | | | | 6,900 | | | | 155,112 | |
Sonoco Products Co. | | | | | | | | | | | 2,800 | | | | 93,632 | |
Total Containers & Packaging | | | | | | | | | | | | | | | 704,395 | |
Metals & Mining — 0.1% | | | | | | | | | | | | | | | | |
Compass Minerals International Inc. | | | | | | | | | | | 900 | | | | 68,958 | |
Reliance Steel & Aluminum Co. | | | | | | | | | | | 2,200 | | | | 91,366 | |
Total Metals & Mining | | | | | | | | | | | | | | | 160,324 | |
Paper & Forest Products — 0.2% | | | | | | | | | | | | | | | | |
Domtar Corp. | | | | | | | | | | | 1,100 | | | | 71,038 | |
MeadWestvaco Corp. | | | | | | | | | | | 7,400 | | | | 180,412 | |
Total Paper & Forest Products | | | | | | | | | | | | | | | 251,450 | |
Total Materials | | | | | | | | | | | | | | | 2,934,762 | |
| Telecommunication Services — 4.1% | | | | | | | | | | | | | | | | |
Diversified Telecommunication Services — 4.0% | | | | | | | | | | | | | | | | |
AT&T Inc. | | | | | | | | | | | 171,200 | | | | 4,896,320 | |
Wireless Telecommunication Services — 0.1% | | | | | | | | | | | | | | | | |
Telephone & Data Systems Inc. | | | | | | | | | | | 3,000 | | | | 98,400 | |
Total Telecommunication Services | | | | | | | | | | | | | | | 4,994,720 | |
| Utilities — 6.0% | | | | | | | | | | | | | | | | |
Electric Utilities — 2.5% | | | | | | | | | | | | | | | | |
DPL Inc. | | | | | | | | | | | 3,300 | | | | 86,229 | |
Duke Energy Corp. | | | | | | | | | | | 51,800 | | | | 917,378 | |
Edison International | | | | | | | | | | | 13,000 | | | | 447,070 | |
Entergy Corp. | | | | | | | | | | | 5,500 | | | | 420,915 | |
Great Plains Energy Inc. | | | | | | | | | | | 3,100 | | | | 58,590 | |
NextEra Energy Inc. | | | | | | | | | | | 7,000 | | | | 380,730 | |
Northeast Utilities | | | | | | | | | | | 3,000 | | | | 88,710 | |
NV Energy Inc. | | | | | | | | | | | 10,200 | | | | 134,130 | |
See Notes to Financial Statements.
| | | | |
| Legg Mason BW Diversified Large Cap Value Fund 2010 Annual Report | | | 11 | |
Legg Mason BW Diversified Large Cap Value Fund
| | | | | | | | | | | | | | | | |
| Security | | | | | | | | Shares | | | Value | |
Electric Utilities — continued | | | | | | | | | | | | | | | | |
Pepco Holdings Inc. | | | | | | | | | | | 5,300 | | | $ | 98,580 | |
Pinnacle West Capital Corp. | | | | | | | | | | | 3,700 | | | | 152,699 | |
Progress Energy Inc. | | | | | | | | | | | 4,000 | | | | 177,680 | |
Westar Energy Inc. | | | | | | | | | | | 3,500 | | | | 84,805 | |
Total Electric Utilities | | | | | | | | | | | | | | | 3,047,516 | |
Gas Utilities — 0.5% | | | | | | | | | | | | | | | | |
AGL Resources Inc. | | | | | | | | | | | 3,300 | | | | 126,588 | |
Atmos Energy Corp. | | | | | | | | | | | 2,900 | | | | 84,825 | |
Energen Corp. | | | | | | | | | | | 3,000 | | | | 137,160 | |
ONEOK Inc. | | | | | | | | | | | 4,500 | | | | 202,680 | |
UGI Corp. | | | | | | | | | | | 2,500 | | | | 71,525 | |
Total Gas Utilities | | | | | | | | | | | | | | | 622,778 | |
Independent Power Producers & Energy Traders — 0.1% | | | | | | | | | | | | | | | | |
Constellation Energy Group Inc. | | | | | | | | | | | 5,800 | | | | 186,992 | |
Multi-Utilities — 2.8% | | | | | | | | | | | | | | | | |
Alliant Energy Corp. | | | | | | | | | | | 3,000 | | | | 109,050 | |
CMS Energy Corp. | | | | | | | | | | | 10,000 | | | | 180,200 | |
Consolidated Edison Inc. | | | | | | | | | | | 7,200 | | | | 347,184 | |
Dominion Resources Inc. | | | | | | | | | | | 13,600 | | | | 593,776 | |
DTE Energy Co. | | | | | | | | | | | 6,600 | | | | 303,138 | |
Integrys Energy Group Inc. | | | | | | | | | | | 2,200 | | | | 114,532 | |
NiSource Inc. | | | | | | | | | | | 11,900 | | | | 207,060 | |
OGE Energy Corp. | | | | | | | | | | | 3,100 | | | | 123,597 | |
PG&E Corp. | | | | | | | | | | | 6,300 | | | | 286,146 | |
Public Service Enterprise Group Inc. | | | | | | | | | | | 11,700 | | | | 387,036 | |
SCANA Corp. | | | | | | | | | | | 2,900 | | | | 116,928 | |
Sempra Energy | | | | | | | | | | | 4,500 | | | | 242,100 | |
TECO Energy Inc. | | | | | | | | | | | 6,200 | | | | 107,384 | |
Xcel Energy Inc. | | | | | | | | | | | 14,000 | | | | 321,580 | |
Total Multi-Utilities | | | | | | | | | | | | | | | 3,439,711 | |
Water Utilities — 0.1% | | | | | | | | | | | | | | | | |
American Water Works Co. Inc. | | | | | | | | | | | 4,000 | | | | 93,080 | |
Total Utilities | | | | | | | | | | | | | | | 7,390,077 | |
Total Investments before Short-Term Investments (Cost — $116,373,532) | | | | | | | | | | | | | | | 120,998,780 | |
| | | | |
| | | Rate | | | Maturity
Date | | | Face
Amount | | | | |
| Short-Term Investments — 0.9% | | | | | | | | | | | | | | | | |
Repurchase Agreements — 0.9% | | | | | | | | | | | | | | | | |
Bank of America repurchase agreement dated 9/30/10; Proceeds at maturity —$1,088,836; (Fully collateralized by U.S. government acency obligation, 0.176% due 8/26/11; Market value — $1,114,509) (Cost — $1,088,832) | | | 0.130 | % | | | 10/1/10 | | | $ | 1,088,832 | | | | 1,088,832 | |
Total Investments — 99.8% (Cost — $117,462,364#) | | | | | | | | | | | | | | | 122,087,612 | |
Other Assets in Excess of Liabilities — 0.2% | | | | | | | | | | | | | | | 290,200 | |
Total Net Assets — 100.0% | | | | | | | | | | | | | | $ | 122,377,812 | |
| * | Non-income producing security. |
| # | Aggregate cost for federal income tax purposes is $117,468,077. |
See Notes to Financial Statements.
| | |
| 12 | | Legg Mason BW Diversified Large Cap Value Fund 2010 Annual Report |
Statement of assets and liabilities
September 30, 2010
| | | | |
| |
| Assets: | | | | |
Investments, at value (Cost — $117,462,364) | | $ | 122,087,612 | |
Receivable for securities sold | | | 3,888,272 | |
Dividends and interest receivable | | | 171,354 | |
Receivable for Fund shares sold | | | 143,939 | |
Receivable from investment manager | | | 9,600 | |
Total Assets | | | 126,300,777 | |
| |
| Liabilities: | | | | |
Payable for securities purchased | | | 3,707,119 | |
Payable for Fund shares repurchased | | | 144,873 | |
Payable for offering and organization costs | | | 19,568 | |
Trustees’ fees payable | | | 2,480 | |
Distribution fees payable | | | 81 | |
Accrued expenses | | | 48,844 | |
Total Liabilities | | | 3,922,965 | |
| Total Net Assets | | $ | 122,377,812 | |
| |
| Net Assets: | | | | |
Par value (Note 6) | | $ | 98 | |
Paid-in capital in excess of par value | | | 117,347,457 | |
Undistributed net investment income | | | 199,295 | |
Accumulated net realized gain on investments | | | 205,714 | |
Net unrealized appreciation on investments | | | 4,625,248 | |
| Total Net Assets | | $ | 122,377,812 | |
| |
| Shares Outstanding: | | | | |
Class A | | | 8,333 | |
Class C | | | 8,333 | |
Class I | | | 8,333 | |
Class IS | | | 9,743,089 | |
| |
| Net Asset Value: | | | | |
Class A (and redemption price) | | | $12.52 | |
Class C* | | | $12.52 | |
Class I (and redemption price) | | | $12.53 | |
Class IS (and redemption price) | | | $12.53 | |
| Maximum Public Offering Price Per Share: | | | | |
Class A (based on maximum initial sales charge of 5.75%) | | | $13.28 | |
| * | Redemption price per share is NAV of Class C shares reduced by a 1.00% CDSC, if shares are redeemed within one year from purchase payment (See Note 2). |
See Notes to Financial Statements.
| | | | |
| Legg Mason BW Diversified Large Cap Value Fund 2010 Annual Report | | | 13 | |
Statement of operations
For the Period Ended September 30, 2010†
| | | | |
| |
| Investment Income: | | | | |
Dividends | | $ | 240,193 | |
Interest | | | 878 | |
Total Investment Income | | | 241,071 | |
| |
| Expenses: | | | | |
Investment management fee (Note 2) | | | 56,085 | |
Audit and tax | | | 27,019 | |
Shareholder reports | | | 15,000 | |
Organization fees | | | 10,000 | |
Offering costs | | | 9,568 | |
Custody fees | | | 4,968 | |
Trustees’ fees | | | 2,530 | |
Legal fees | | | 1,265 | |
Transfer agent fees (Note 5) | | | 87 | |
Distribution fees (Notes 2 and 5) | | | 81 | |
Miscellaneous expenses | | | 506 | |
Total Expenses | | | 127,109 | |
Less: Fee waivers and/or expense reimbursements (Notes 2 and 5) | | | (65,684) | |
Net Expenses | | | 61,425 | |
| Net Investment Income | | | 179,646 | |
| |
| Realized and Unrealized Gain on Investments (Notes 1 and 3): | | | | |
Net Realized Gain on Investment Transactions | | | 205,714 | |
Change in Net Unrealized Appreciation (Depreciation) from Investments | | | 4,625,248 | |
| Net Gain on Investments | | | 4,830,962 | |
| Increase in Net Assets from Operations | | $ | 5,010,608 | |
| † | For the period September 7, 2010 (inception date) to September 30, 2010. |
See Notes to Financial Statements.
| | |
| 14 | | Legg Mason BW Diversified Large Cap Value Fund 2010 Annual Report |
Statement of changes in net assets
| | | | |
| For the Period Ended September 30, | | 2010† | |
| |
| Operations: | | | | |
Net investment income | | $ | 179,646 | |
Net realized gain | | | 205,714 | |
Change in net unrealized appreciation (depreciation) | | | 4,625,248 | |
Increase in Net Assets From Operations | | | 5,010,608 | |
| |
| Fund Share Transactions (Note 6): | | | | |
Net proceeds from sale of shares | | | 118,106,886 | |
Cost of shares repurchased | | | (739,682) | |
Increase in Net Assets From Fund Share Transactions | | | 117,367,204 | |
Increase in Net Assets | | | 122,377,812 | |
| |
| Net Assets: | | | | |
Beginning of period | | | — | |
End of period* | | $ | 122,377,812 | |
* Includes undistributed net investment income of: | | | $199,295 | |
| † | For the period September 7, 2010 (inception date) to September 30, 2010. |
See Notes to Financial Statements.
| | | | |
| Legg Mason BW Diversified Large Cap Value Fund 2010 Annual Report | | | 15 | |
Financial highlights
| | | | |
| For a share of each class of beneficial interest outstanding throughout the period ended September 30: | |
Class A Shares1 | | 20102 | |
| |
| Net asset value, beginning of period | | | $12.00 | |
| |
| Income from operations: | | | | |
Net investment income | | | 0.02 | |
Net realized and unrealized gain | | | 0.50 | |
Total income from operations | | | 0.52 | |
| |
| Net asset value, end of period | | | $12.52 | |
Total return3 | | | 4.33 | % |
| |
| Net assets, end of period (000s) | | | $104 | |
| |
| Ratios to average net assets: | | | | |
Gross expenses4 | | | 2.19 | % |
Net expenses4,5,6 | | | 1.27 | |
Net investment income4 | | | 1.98 | |
| |
| Portfolio turnover rate | | | 6 | % |
| 1 | Per share amounts have been calculated using the average shares method. |
| 2 | For the period September 7, 2010 (inception date) to September 30, 2010. |
| 3 | Performance figures, exclusive of sales charges, may reflect compensating balance arrangements, fee waivers and/or expense reimbursements. In the absence of compensating balance arrangements, fee waivers and/or expense reimbursements, the total return would have been lower. Past performance is no guarantee of future results. Total returns for periods of less than one year are not annualized. |
| 5 | Reflects fee waivers and/or expense reimbursements. |
| 6 | As a result of an expense limitation agreement, the ratio of expenses, other than brokerage commissions (except for brokerage commissions paid on purchases and sales of shares of ETFs), interest, taxes and extraordinary expenses, to average net assets of Class A shares will not exceed 1.30%, until December 31, 2011. |
See Notes to Financial Statements.
| | |
| 16 | | Legg Mason BW Diversified Large Cap Value Fund 2010 Annual Report |
Financial highlights (cont’d)
| | | | |
| For a share of each class of beneficial interest outstanding throughout the period ended September 30: | |
Class C Shares1 | | 20102 | |
| |
| Net asset value, beginning of period | | | $12.00 | |
| |
| Income from operations: | | | | |
Net investment income | | | 0.01 | |
Net realized and unrealized gain | | | 0.51 | |
Total income from operations | | | 0.52 | |
| |
| Net asset value, end of period | | | $12.52 | |
Total return3 | | | 4.33 | % |
| |
| Net assets, end of period (000s) | | | $104 | |
| |
| Ratios to average net assets: | | | | |
Gross expenses4 | | | 2.94 | % |
Net expenses4,5,6 | | | 2.02 | |
Net investment income4 | | | 1.23 | |
| |
| Portfolio turnover rate | | | 6 | % |
| 1 | Per share amounts have been calculated using the average shares method. |
| 2 | For the period September 7, 2010 (inception date) to September 30, 2010. |
| 3 | Performance figures, exclusive of CDSC, may reflect compensating balance arrangements, fee waivers and/or expense reimbursements. In the absence of compensating balance arrangements, fee waivers and/or expense reimbursements, the total return would have been lower. Past performance is no guarantee of future results. Total returns for periods of less than one year are not annualized. |
| 5 | Reflects fee waivers and/or expense reimbursements. |
| 6 | As a result of an expense limitation agreement, the ratio of expenses, other than brokerage commissions (except for brokerage commissions paid on purchases and sales of shares of ETFs), interest, taxes and extraordinary expenses, to average net assets of Class C shares will not exceed 2.05%, until December 31, 2011. |
See Notes to Financial Statements.
| | | | |
| Legg Mason BW Diversified Large Cap Value Fund 2010 Annual Report | | | 17 | |
| | | | |
| For a share of each class of beneficial interest outstanding throughout the period ended September 30: | |
Class I Shares1 | | 20102 | |
| |
| Net asset value, beginning of period | | | $12.00 | |
| |
| Income from operations: | | | | |
Net investment income | | | 0.02 | |
Net realized and unrealized gain | | | 0.51 | |
Total income from operations | | | 0.53 | |
| |
| Net asset value, end of period | | | $12.53 | |
Total return3 | | | 4.42 | % |
| |
| Net assets, end of period (000s) | | | $105 | |
| |
| Ratios to average net assets: | | | | |
Gross expenses4 | | | 1.94 | % |
Net expenses4,5,6 | | | 0.92 | |
Net investment income4 | | | 2.33 | |
| |
| Portfolio turnover rate | | | 6 | % |
| 1 | Per share amounts have been calculated using the average shares method. |
| 2 | For the period September 7, 2010 (inception date) to September 30, 2010. |
| 3 | Performance figures may reflect compensating balance arrangements, fee waivers and/or expense reimbursements. In the absence of compensating balance arrangements, fee waivers and/or expense reimbursements, the total return would have been lower. Past performance is no guarantee of future results. Total returns for periods of less than one year are not annualized. |
| 5 | Reflects fee waivers and/or expense reimbursements. |
| 6 | As a result of an expense limitation agreement, the ratio of expenses, other than brokerage commissions (except for brokerage commissions paid on purchases and sales of shares of ETFs), interest, taxes and extraordinary expenses, to average net assets of Class I shares will not exceed 0.95%, until December 31, 2011. |
See Notes to Financial Statements.
| | |
| 18 | | Legg Mason BW Diversified Large Cap Value Fund 2010 Annual Report |
Financial highlights (cont’d)
| | | | |
| For a share of each class of beneficial interest outstanding throughout the period ended September 30: | |
Class IS Shares1 | | 20102 | |
| |
| Net asset value, beginning of period | | | $ 12.00 | |
| |
| Income from operations: | | | | |
Net investment income | | | 0.02 | |
Net realized and unrealized gain | | | 0.51 | |
Total income from operations | | | 0.53 | |
| |
| Net asset value, end of period | | | $12.53 | |
Total return3 | | | 4.42 | % |
| |
| Net assets, end of period (000s) | | | $122,063 | |
| |
| Ratios to average net assets: | | | | |
Gross expenses4 | | | 1.70 | % |
Net expenses4,5,6 | | | 0.82 | |
Net investment income4 | | | 2.40 | |
| |
| Portfolio turnover rate | | | 6 | % |
| 1 | Per share amounts have been calculated using the average shares method. |
| 2 | For the period September 7, 2010 (inception date) to September 30, 2010. |
| 3 | Performance figures may reflect compensating balance arrangements, fee waivers and/or expense reimbursements. In the absence of compensating balance arrangements, fee waivers and/or expense reimbursements, the total return would have been lower. Past performance is no guarantee of future results. Total returns for periods of less than one year are not annualized. |
| 5 | Reflects fee waivers and/or expense reimbursements. |
| 6 | As a result of an expense limitation agreement, the ratio of expenses, other than brokerage commissions (except for brokerage commissions paid on purchases and sales of shares of ETFs), interest, taxes and extraordinary expenses, to average net assets of Class IS shares will not exceed 0.85%, until December 31, 2011. In addition, total annual fund operating expenses for Class IS shares will not exceed total annual fund operating expenses for Class I shares. |
See Notes to Financial Statements.
| | | | |
| Legg Mason BW Diversified Large Cap Value Fund 2010 Annual Report | | | 19 | |
Notes to financial statements
1. Organization and significant accounting policies
Legg Mason BW Diversified Large Cap Value Fund (the “Fund”) is a separate diversified series of Legg Mason Global Asset Management Trust (the “Trust”). The Trust, a Maryland statutory trust, is registered under the Investment Company Act of 1940, as amended (the “1940 Act”), as an open-end management investment company.
The following are significant accounting policies consistently followed by the Fund and are in conformity with U.S. generally accepted accounting principles (“GAAP”). Estimates and assumptions are required to be made regarding assets, liabilities and changes in net assets resulting from operations when financial statements are prepared. Changes in the economic environment, financial markets and any other parameters used in determining these estimates could cause actual results to differ. Subsequent events have been evaluated through the date the financial statements were issued.
(a) Investment valuation. Equity securities for which market quotations are available are valued at the last reported sales price or official closing price on the primary market or exchange on which they trade. When prices are not readily available, or are determined not to reflect fair value, such as when the value of a security has been significantly affected by events after the close of the exchange or market on which the security is principally traded, but before the Fund calculates its net asset value, the Fund values these securities at fair value as determined in accordance with procedures approved by the Fund’s Board of Trustees. Short-term obligations with maturities of 60 days or less are valued at amortized cost, which approximates fair value.
The Fund has adopted Financial Accounting Standards Board Codification Topic 820 (“ASC Topic 820”). ASC Topic 820 establishes a single definition of fair value, creates a three-tier hierarchy as a framework for measuring fair value based on inputs used to value the Fund’s investments, and requires additional disclosure about fair value. The hierarchy of inputs is summarized below.
| Ÿ | | Level 1 — quoted prices in active markets for identical investments |
| Ÿ | | Level 2 — other significant observable inputs (including quoted prices for similar investments, interest rates, prepayment speeds, credit risk, etc.) |
| Ÿ | | Level 3 — significant unobservable inputs (including the Fund’s own assumptions in determining the fair value of investments) |
The inputs or methodology used for valuing securities are not necessarily an indication of the risk associated with investing in those securities.
The Fund uses valuation techniques to measure fair value that are consistent with the market approach and/or income approach, depending on the type of the security and the particular circumstance. The market approach uses prices and other relevant information generated by market transactions involving identical or comparable securities. The income approach uses valuation techniques to discount estimated future cash flows to present value.
The following is a summary of the inputs used in valuing the Fund’s assets carried at fair value:
| | | | | | | | | | | | | | | | |
| Description | | Quoted Prices (Level 1) | | | Other Significant
Observable Inputs (Level 2) | | | Significant
Unobservable
Inputs (Level 3) | | | Total | |
| Common stocks† | | $ | 120,998,780 | | | | — | | | | — | | | $ | 120,998,780 | |
| Short-term investments† | | | — | | | $ | 1,088,832 | | | | — | | | | 1,088,832 | |
| Total investments | | $ | 120,998,780 | | | $ | 1,088,832 | | | | — | | | $ | 122,087,612 | |
| † | See Schedule of Investments for additional detailed categorizations. |
(b) Repurchase agreements. The Fund may enter into repurchase agreements with institutions that its investment adviser has determined are creditworthy. Each repurchase agreement is recorded at cost. Under the terms of a typical repurchase agreement, the Fund acquires a debt security subject to an obligation of
| | |
| 20 | | Legg Mason BW Diversified Large Cap Value Fund 2010 Annual Report |
Notes to financial statements (cont’d)
the seller to repurchase, and of the Fund to resell, the security at an agreed-upon price and time, thereby determining the yield during the Fund’s holding period. When entering into repurchase agreements, it is the Fund’s policy that its custodian or a third party custodian, acting on the Fund’s behalf, take possession of the underlying collateral securities, the market value of which, at all times, at least equals the principal amount of the repurchase transaction, including accrued interest. To the extent that any repurchase transaction maturity exceeds one business day, the value of the collateral is marked to market and measured against the value of the agreement in an effort to ensure the adequacy of the collateral. If the counterparty defaults, the Fund generally has the right to use the collateral to satisfy the terms of the repurchase transaction. However, if the market value of the collateral declines during the period in which the Fund seeks to assert its rights or if bankruptcy proceedings are commenced with respect to the seller of the security, realization of the collateral by the Fund may be delayed or limited.
(c) Security transactions and investment income. Security transactions are accounted for on a trade date basis. Interest income, adjusted for amortization of premium and accretion of discount, is recorded on the accrual basis. Dividend income is recorded on the ex-dividend date. The cost of investments sold is determined by use of the specific identification method. To the extent any issuer defaults or a credit event occurs that impacts the issuer, the Fund may halt any additional interest income accruals and consider the realizability of interest accrued up to the date of default or credit event.
(d) Distributions to shareholders. Distributions from net investment income and distributions of net realized gains, if any, are declared at least annually. Distributions to shareholders of the Fund are recorded on the ex-dividend date and are determined in accordance with income tax regulations, which may differ from GAAP.
(e) Share class accounting. Investment income, common expenses and realized/unrealized gains (losses) on investments are allocated to the various classes of the Fund on the basis of daily net assets of each class. Fees relating to a specific class are charged directly to that share class.
(f) Federal and other taxes. It is the Fund’s policy to comply with the federal income and excise tax requirements of the Internal Revenue Code of 1986 (the “Code”), as amended, applicable to regulated investment companies. Accordingly, the Fund intends to distribute its taxable income and net realized gains, if any, to shareholders in accordance with timing requirements imposed by the Code. Therefore, no federal or state income tax provision is required in the Fund’s financial statements.
Management has analyzed the Fund’s tax positions taken and has concluded that as of September 30, 2010, no provision for income tax is required in the Fund’s financial statements. The Fund’s federal and state income and federal excise tax returns for tax years for which the applicable statutes of limitations have not expired are subject to examination by Internal Revenue Service and state departments of revenue.
(g) Reclassification. GAAP requires that certain components of net assets be reclassified to reflect permanent differences between financial and tax reporting. These reclassifications have no effect on net assets or net asset value per share. During the current period, the following reclassifications have been made:
| | | | | | |
| | | Undistributed Net
Investment Income | | Paid-in
Capital | |
| (a) | | $19,649 | | $ | (19,649) | |
| (a) | Reclassifications are primarily due to non-deductible 12b-1 fees and non-deductible organizational costs. |
2. Management agreement and other transactions with affiliates
Legg Mason Partners Fund Advisor, LLC (“LMPFA”) is the Fund’s manager and Brandywine Global Investment Management, LLC (“Brandywine Global”) is the Fund’s investment adviser. LMPFA and Brandywine Global are wholly-owned subsidiaries of Legg Mason, Inc. (“Legg Mason”).
| | | | |
| Legg Mason BW Diversified Large Cap Value Fund 2010 Annual Report | | | 21 | |
Under the management agreement, the Fund pays an investment management fee calculated daily and paid monthly, in accordance with the following breakpoint schedule:
| | | | |
| Average Daily Net Assets | | Annual Rate | |
| First $1 billion | | | 0.750 | % |
| Next $1 billion | | | 0.725 | |
| Next $3 billion | | | 0.700 | |
| Next $5 billion | | | 0.675 | |
| Over $10 billion | | | 0.650 | |
LMPFA provides administrative and certain oversight services to the Fund. LMPFA delegates to the investment adviser the day-to-day portfolio management of the Fund. For its services, LMPFA pays Brandywine Global 90% of the net management fee it receives from the Fund.
As a result of an expense limitation agreement, between the Fund and LMPFA, the ratio of expenses other than brokerage commissions (except for brokerage commissions paid on purchases and sales of shares of ETFs), interest, taxes and extraordinary expenses, to average net assets of the Fund’s Class A, C, I and IS shares will not exceed 1.30%, 2.05%, 0.95% and 0.85%, respectively. In addition, total annual fund operating expenses for Class IS shares will not exceed total annual fund operating expenses for Class I shares. These expense limitations cannot be terminated prior to December 31, 2011 without the Board of Trustees’ consent.
During the period ended September 30, 2010, fees waived and/or expenses reimbursed amounted to $65,684.
The manager is permitted to recapture amounts previously forgone or reimbursed to a class within three year in which the manager earned the fee or incurred the expense if the class’ total annual operating expenses have fallen to a level below the expense limitation (“expense cap”) in effect at the time the fees were earned or the expense incurred. In no case will the manager recapture any amount that would result, on any particular business day of the Fund, in the class’ total annual operating expenses exceeding the expense cap or any other lower limit then in effect.
Pursuant to these agreements, at September 30, 2010, the Fund had remaining fee waivers and expense reimbursements subject to recapture by LMPFA and date of expiration as follows:
| | | | | | | | |
| | | Class A | | Class C | | Class I | | Class IS |
| | | | |
| Expires September 30, 2013 | | $59 | | $11 | | $66 | | $65,500 |
| Fee waivers/expense reimbursements subject to recapture | | $59 | | $11 | | $66 | | $65,500 |
For the period ended September 30, 2010, LMPFA did not recapture any fees.
Legg Mason Investor Services, LLC (“LMIS”), a wholly-owned broker-dealer subsidiary of Legg Mason, serves as the Fund’s sole and exclusive distributor.
There is a maximum initial sales charge of 5.75% for Class A shares. There is a contingent deferred sales charge (“CDSC”) of 1.00% on Class C shares, which applies if redemption occurs within one year from purchase payment. In certain cases, Class A shares have a 1.00% CDSC, which applies if redemption occurs within one year from purchase payment. This CDSC only applies to those purchases of Class A shares, which, when combined with current holdings of Class A shares, equal or exceed $1,000,000 in the aggregate. These purchases do not incur an initial sales charge.
For the period ended September 30, 2010, LMIS and its affiliates did not receive any sales charges on sales of the Fund’s Class A shares. In addition, there were no CDSCs paid to LMIS and its affiliates for the period ended September 30, 2010.
Under a Deferred Compensation Plan (the “Plan”), Trustees may elect to defer receipt of all or a specified portion of their compensation. A participating trustee may select one or more funds managed by affiliates of Legg Mason in which his or her deferred trustee’s fees will be deemed to be invested. Deferred amounts remain in the fund until distributed in accordance with the Plan.
| | |
| 22 | | Legg Mason BW Diversified Large Cap Value Fund 2010 Annual Report |
Notes to financial statements (cont’d)
All officers and two Trustees of the Trust are employees of Legg Mason or its affiliates and do not receive compensation from the Trust.
As of September 30, 2010, Legg Mason and its affiliates owned 100% of the Fund.
3. Investments
During the period ended September 30, 2010, the aggregate cost of purchases and proceeds from sales of investments (excluding short-term investments) were as follows:
| | | | |
| Purchases | | $ | 122,956,377 | |
| Sales | | | 6,788,559 | |
At September 30, 2010, the aggregate gross unrealized appreciation and depreciation of investments for federal income tax purposes were as follows:
| | | | |
| Gross unrealized appreciation | | $ | 4,846,508 | |
| Gross unrealized depreciation | | | (226,973) | |
| Net unrealized appreciation | | $ | 4,619,535 | |
4. Derivative instruments and hedging activities
Financial Accounting Standards Board Codification Topic 815 requires enhanced disclosure about an entity’s derivative and hedging activities.
During the period ended September 30, 2010, the Fund did not invest in any derivative instruments.
5. Class specific expenses, waivers and/or reimbursements
The Fund has adopted a Rule 12b-1 distribution plan and under that plan the Fund pays a service fee with respect to its Class A and C shares calculated at the annual rate of 0.25% of the average daily net assets of each respective class. The Fund also pays a distribution fee with respect to its Class C shares calculated at the annual rate of 0.75% of the average daily net assets of its Class C shares. Service and distribution fees are accrued daily and paid monthly.
For the period ended September 30, 2010, class specific expenses were as follows:
| | | | | | | | |
| | | Distribution
Fees† | | | Transfer Agent
Fees† | |
| Class A | | | $16 | | | | $16 | |
| Class C | | | 65 | | | | 16 | |
| Class I | | | — | | | | 16 | |
| Class IS | | | — | | | | 39 | |
| Total | | | $81 | | | | $87 | |
| † | For the period September 7, 2010 (inception date) to September 30, 2010. |
For the period ended September 30, 2010, waivers and/or reimbursements by class were as follows:
| | | | | | | | |
| | | Distribution Fees Waived† | | | Waivers/
Reimbursements† | |
| Class A | | | — | | | | $59 | |
| Class C | | | $48 | | | | 11 | |
| Class I | | | — | | | | 66 | |
| Class IS | | | — | | | | 65,500 | |
| Total | | | $48 | | | | $65,636 | |
| † | For the period September 7, 2010 (inception date) to September 30, 2010. |
| | | | |
| Legg Mason BW Diversified Large Cap Value Fund 2010 Annual Report | | | 23 | |
6. Shares of beneficial interest
At September 30, 2010, the Trust had an unlimited number of shares of beneficial interest authorized with a par value of $0.00001 per share. The Fund has the ability to issue multiple classes of shares. Each class of shares represents an identical interest and has the same rights, except that each class bears certain direct expenses, including those specifically related to the distribution of its shares.
Transactions in shares of each class were as follows:
| | | | | | | | |
| | | Period Ended
September 30, 2010† | |
| | | Shares | | | Amount | |
| Class A | | | | | | | | |
| Shares sold | | | 8,333 | | | $ | 100,000 | |
| Net increase | | | 8,333 | | | $ | 100,000 | |
| | |
| Class C | | | | | | | | |
| Shares sold | | | 8,333 | | | $ | 100,000 | |
| Net increase | | | 8,333 | | | $ | 100,000 | |
| | |
| Class I | | | | | | | | |
| Shares sold | | | 8,333 | | | $ | 100,000 | |
| Net increase | | | 8,333 | | | $ | 100,000 | |
| | |
| Class IS | | | | | | | | |
| Shares sold | | | 9,802,467 | | | $ | 117,806,886 | |
| Shares repurchased | | | (59,378) | | | | (739,682) | |
| Net increase | | | 9,743,089 | | | $ | 117,067,204 | |
| † | For the period September 7, 2010 (inception date) to September 30, 2010. |
7. Income tax information and distributions to shareholders
During the period ended September 30, 2010, the Fund did not make any distributions.
As of September 30, 2010, the components of accumulated earnings on a tax basis were as follows:
| | | | |
| Undistributed ordinary income—net | | $ | 443,156 | |
| Other book/tax temporary differences(a) | | | (32,434) | |
| Unrealized appreciation (depreciation)(b) | | | 4,619,535 | |
| Total accumulated earnings (losses) — net | | $ | 5,030,257 | |
| (a) | Other book/tax temporary differences are attributable primarily to book/tax differences in the timing of the deductibility of various expenses. |
| (b) | The difference between book-basis and tax-basis unrealized appreciation (depreciation) is attributable primarily to the tax deferral of losses on wash sales. |
| | |
| 24 | | Legg Mason BW Diversified Large Cap Value Fund 2010 Annual Report |
Report of independent registered public accounting firm
To the Board of Trustees of Legg Mason Global Asset Management Trust and Shareholders of Legg Mason BW Diversified Large Cap Value Fund:
In our opinion, the accompanying statement of assets and liabilities, including the schedule of investments, and the related statements of operations and of changes in net assets and the financial highlights present fairly, in all material respects, the financial position of Legg Mason BW Diversified Large Cap Value Fund (one of the funds comprising Legg Mason Global Asset Management Trust, the “Fund”) at September 30, 2010, the results of its operations, the changes in its net assets, and the financial highlights for the period presented, in conformity with accounting principles generally accepted in the United States of America. These financial statements and financial highlights (hereafter referred to as “financial statements”) are the responsibility of the Fund’s management; our responsibility is to express an opinion on these financial statements based on our audit. We conducted our audit of these financial statements in accordance with the standards of the Public Company Accounting Oversight Board (United States). Those standards require that we plan and perform the audit to obtain reasonable assurance about whether the financial statements are free of material misstatement. An audit includes examining, on a test basis, evidence supporting the amounts and disclosures in the financial statements, assessing the accounting principles used and significant estimates made by management, and evaluating the overall financial statement presentation. We believe that our audit, which included confirmation of securities at September 30, 2010 by correspondence with the custodian and brokers, provide a reasonable basis for our opinion.
Pricewaterhouse Coopers LLP
Baltimore, Maryland
November 16, 2010
| | | | |
| Legg Mason BW Diversified Large Cap Value Fund | | | 25 | |
Board approval of management and
subadvisory agreements (unaudited)
At its August 2010 meeting, the Fund’s Board of Trustees (the “Board”) approved the management agreement (the “Management Agreement”) with Legg Mason Partners Fund Advisor, LLC (the “Manager”) and the subadvisory agreement (the “Advisory Agreement”) with Brandywine Global Investment Management, LLC (the “Adviser”). The trustees who are not “interested persons” of the Fund (as defined in the Investment Company Act of 1940, as amended (the “1940 Act”) (the “Independent Trustees”) met, with the assistance of their independent legal counsel, to review and evaluate the materials provided by the Manager and the Adviser to assist the Board, and in particular the Independent Trustees, in considering the Management and Advisory Agreements, respectively. At such meeting the Independent Trustees received presentations from the Manager and the Adviser, as well as a memorandum from legal counsel.
In voting to approve the Agreements, the Board, including the Independent Trustees, considered whether approval of the Agreements would be in the best interests of the Fund and its shareholders. No single factor or item of information reviewed by the Board was identified as the principal factor in determining whether to approve the Management Agreement and the Advisory Agreement. Based upon its evaluation of all material factors, including those described below, the Board concluded that the terms of each Agreement are reasonable and fair and that it was in the best interest of the Fund to approve the Agreements.
The Board received and considered information regarding the nature, extent and quality of services to be provided to the Fund by the Manager and the Adviser under the Management and Advisory Agreements, respectively. The Board also considered the Manager’s supervisory activities over the Adviser. In addition, the Board received and considered other information regarding the administrative and other services to be rendered to the Fund and its shareholders by the Manager and its affiliates. The Board noted information received at regular meetings throughout the year related to the services rendered by the Manager in its management of the affairs of the other funds in the Legg Mason fund complex and the Manager’s role in coordinating the activities of the Adviser and those other funds’ other service providers. The Board’s evaluation of the services to be provided by the Manager and the Adviser took into account the Board’s knowledge and familiarity gained as Board members of funds in the Legg Mason fund complex, including the scope and quality of the investment management and other capabilities of the Manager and the Adviser and the quality of the Manager’s administrative and other services. The Board observed that the scope of services provided by the Manager to the Legg Mason fund complex had expanded over time as a result of regulatory and other developments, including maintaining and monitoring its own expanded compliance programs and the compliance program to be implemented for the Fund.
The Board reviewed the qualifications, backgrounds and responsibilities of the senior personnel serving the funds in the Legg Mason fund complex and the portfolio management team that would be primarily responsible for the day-to-day portfolio management of the Fund. The Board considered the portfolio management strategy of the Fund’s portfolio managers and noted that the Adviser was committed to providing the resources necessary to assist the portfolio managers in managing the Fund. The Board also considered, based on its knowledge of the Manager and the Manager’s affiliates, the financial resources available through the Manager’s parent organization, Legg Mason, Inc.
The Board considered the division of responsibilities between the Manager and the Adviser and the oversight to be provided by the Manager. The Board also considered information that it received and reviewed as a part of its annual evaluation of the Adviser’s brokerage policies and practices, the standards applied in seeking best execution, the policies regarding soft dollars, and the existence of quality controls applicable to brokerage allocation procedures.
The Board received and reviewed composite performance information of the Adviser for managing accounts similar to the Fund relative to a benchmark index for each of the last ten years and for the one-, three-, five- and ten-year periods ended December 31, 2009. The Board noted that the Adviser had outperformed the benchmark in all but two of the last ten years and over each of the periods ended December 31, 2009. In addition, the Board noted the Adviser had exceeded the median performance of its peer group over each of the three-, five- and ten-year periods ended December 31, 2009.
| | |
| 26 | | Legg Mason BW Diversified Large Cap Value Fund |
Board approval of management and
subadvisory agreements (unaudited) (cont’d)
The Board reviewed and considered the contractual management fee (the “Contractual Management Fee”) payable by the Fund to the Manager and the subadvisory fee paid by the Manager to the Adviser in light of the nature, extent and quality of the management and advisory services expected to be provided by the Manager and the Adviser, respectively. The Board noted that the Manager, and not the Fund, pays the fee to the Adviser. The Board also noted that the Manager had agreed it would forgo fees or reimburse expenses to the extent necessary to maintain specified expense levels (exclusive of interest, taxes, brokerage commissions (except for brokerage commissions paid on purchases and sales of shares of ETFs) and extraordinary expenses), until December 31, 2011 unless the Board consents to an earlier termination.
Additionally, the Board received and considered information comparing the Fund’s Contractual Management Fee and the expected total expense ratio (after foregoing fees or reimbursing expenses) with those of a relevant group of funds based upon the Fund’s expected classification by Lipper, Inc., which showed that the Fund’s Contractual Management Fee was competitive to below average and that the expected total expense ratio (after foregoing fees or reimbursing expenses) would be competitive to below average, depending upon the growth of assets achieved by the Fund. The Board considered the expected profitability of the Fund to Legg Mason and determined that the profitability was not excessive in light of the nature, extent and quality of the services to be provided to the Fund.
The Board noted that the breakpoints included as a part of the Contractual Management Fee provide for sharing of economies of scale with shareholders as the Fund’s assets grow. The Board also noted that as the Fund’s assets increase, the Fund and its shareholders should realize other economies of scale as certain expenses, such as fixed fund fees, become a smaller percentage of overall assets.
The Board considered other benefits expected to be received by the Manager and its affiliates, as a result of the Manager’s relationship with the Fund, including the opportunity to offer additional products and services to Fund shareholders.
In light of comparative fee information, as well as the nature, extent and quality of the services expected to be provided, the other benefits expected to be received by the Manager and its affiliates and the Manager’s commitment to the Fund and expected profitability, the Board concluded that the Management Fees were reasonable.
After evaluation of all material factors, the Board concluded that the approval of each Agreement is in the best interest of the Fund.
| | | | |
| Legg Mason BW Diversified Large Cap Value Fund | | | 27 | |
Additional information (unaudited)
Information about Trustees and Officers
The business and affairs of Legg Mason BW Diversified Large Cap Value Fund (the “Fund”) are conducted by management under the supervision and subject to the direction of its Board of Trustees. The business address of each Trustee is 100 International Drive, Attn: Fund Secretary, Baltimore, Maryland 21202. Information pertaining to the Trustees and Officers of the Fund is set forth below.
The Statement of Additional Information includes additional information about Trustees and is available, without charge, upon request by calling Funds Investor Services at 1-800-822-5544 or Institutional Shareholder Services at 1-888-425-6432.
| | |
| Independent Trustees1 |
|
| Ruby P. Hearn |
| |
| Year of birth | | 1940 |
| Position with Trust | | Trustee |
| Term of office and length of time served2 | | Since 2009 |
| Principal occupation(s) during past five years | | Senior Vice President Emerita of The Robert Wood Johnson Foundation (non-profit) since 2001; Trustee of the New York Academy of Medicine since 2004; Director of the Institute for Healthcare Improvement since 2002; Member of the Institute of Medicine since 1982; formerly: Senior Vice President of The Robert Wood Johnson Foundation (1996 to 2001); Fellow of The Yale Corporation (1992 to 1998). |
| Number of funds in fund complex overseen by Trustee | | 16 |
| Other directorships held by Trustee during past five years | | None |
|
| Arnold L. Lehman |
| |
| Year of birth | | 1944 |
| Position with Trust | | Lead Independent Trustee |
| Term of office and length of time served2 | | Since 2009 |
| Principal occupation(s) during past five years | | Director of the Brooklyn Museum since 1997; Trustee of American Federation of Arts since 1998. Formerly: Director of The Baltimore Museum of Art (1979 to 1997). |
| Number of funds in fund complex overseen by Trustee | | 16 |
| Other directorships held by Trustee during past five years | | None |
|
| Robin J.W. Masters |
| |
| Year of birth | | 1955 |
| Position with Trust | | Trustee |
| Term of office and length of time served2 | | Since 2009 |
| Principal occupation(s) during past five years | | Retired; formerly: Chief Investment Officer of ACE Limited (insurance) (1986 to 2000). |
| Number of funds in fund complex overseen by Trustee | | 16 |
| Other directorships held by Trustee during past five years | | Director of Cheyne Capital International Limited (investment advisory firm). Director/Trustee of Legg Mason Institutional Funds plc, WA Fixed Income Funds plc and Western Asset Debt Securities Fund plc. |
|
| Jill E. McGovern |
| |
| Year of birth | | 1944 |
| Position with Trust | | Trustee |
| Term of office and length of time served2 | | Since 2009 |
| Principal occupation(s) during past five years | | Senior Consultant, American Institute for Contemporary German Studies (AICGS) since 2007; formerly: Chief Executive Officer of The Marrow Foundation (non-profit) (1993 to 2007); Executive Director of the Baltimore International Festival (1991 to 1993); Senior Assistant to the President of The Johns Hopkins University (1986 to 1990). |
| Number of funds in fund complex overseen by Trustee | | 16 |
| Other directorships held by Trustee during past five years | | Director of International Biomedical Research Alliance; Director of Lois Roth Endowment |
| | |
| 28 | | Legg Mason BW Diversified Large Cap Value Fund |
Additional information (unaudited) (cont’d)
Information about Trustees and Officers
| | |
| Independent Trustees1 cont’d |
|
| Arthur S. Mehlman |
| |
| Year of birth | | 1942 |
| Position with Trust | | Trustee |
| Term of office and length of time served2 | | Since 2009 |
| Principal occupation(s) during past five years | | Retired. Director, The University of Maryland Foundation since 1992; Director, The League for People with Disabilities since 2003; formerly: Partner, KPMG LLP (international accounting firm) (1972 to 2002). |
| Number of funds in fund complex overseen by Trustee | | Director/Trustee of all Legg Mason Funds consisting of 16 portfolios; Director/Trustee of the Royce Family of Funds consisting of 30 portfolios. |
| Other directorships held by Trustee during past five years | | Director of Municipal Mortgage & Equity, LLC. |
|
| G. Peter O’Brien |
| |
| Year of birth | | 1945 |
| Position with Trust | | Trustee |
| Term of office and length of time served2 | | Since 2009 |
| Principal occupation(s) during past five years | | Retired. Trustee Emeritus of Colgate University; Board Member, Hill House, Inc. (residential home care); Board Member, Bridges School (pre- school); formerly: Managing Director, Equity Capital Markets Group of Merrill Lynch & Co. (1971-1999). |
| Number of funds in fund complex overseen by Trustee | | Director/Trustee of all Legg Mason funds consisting of 16 portfolios; Director/Trustee of the Royce Family of Funds consisting of 30 portfolios. |
| Other directorships held by Trustee during past five years | | Director of Technology Investment Capital Corp. |
|
| S. Ford Rowan |
| |
| Year of birth | | 1943 |
| Position with Trust | | Trustee |
| Term of office and length of time served2 | | Since 2009 |
| Principal occupation(s) during past five years | | Chairman, National Center for Critical Incident Analysis, National Defense University Foundation, since 2004; Trustee, St. John’s College, since 2006; formerly: Consultant, Rowan & Blewitt Inc. (management consulting) (1984 to 2007); Lecturer in Journalism, Northwestern University (1980 to 1993); Lecturer in Organizational Sciences, George Washington University (2000 to 2008); Director, Sante Fe Institute (1999 to 2008). |
| Number of funds in fund complex overseen by Trustee | | 16 |
| Other directorships held by Trustee during past five years | | None |
|
| Robert M. Tarola |
| |
| Year of birth | | 1950 |
| Position with Trust | | Trustee |
| Term of office and length of time served2 | | Since 2009 |
| Principal occupation(s) during past five years | | President of Right Advisory LLC (corporate finance and governance consulting) since 2008; Member, Investor Advisory Group of the Public Company Accounting Oversight Board since 2009; Executive Vice President and Chief Financial Officer of The Howard University since 2010 (higher education and health care); formerly: Senior Vice President and Chief Financial Officer of W.R. Grace & Co. (specialty chemicals) (1999 to 2008) and MedStar Health, Inc. (healthcare) (1996 to 1999); Partner, Price Waterhouse, LLP (accounting and auditing) (1984 to 1996). |
| Number of funds in fund complex overseen by Trustee | | 16 |
| Other directorships held by Trustee during past five years | | Director of TeleTech Holdings, Inc. (business process outsourcing); Director of American Kidney Fund (renal disease assistance) |
| | | | |
| Legg Mason BW Diversified Large Cap Value Fund | | | 29 | |
| | |
| Interested Trustees3 |
|
| Mark R. Fetting |
| |
| Year of birth | | 1954 |
| Position with Trust | | Chairman and Trustee |
| Term of office and length of time served2 | | Since 2009 |
| Principal occupation(s) during past five years | | President, CEO, Chairman and Director of Legg Mason, Inc. and Chairman of Legg Mason Funds since 2008; formerly: President of all Legg Mason Funds (2001 to 2008). Senior Executive Vice President of Legg Mason, Inc., Director and/or officer of various Legg Mason, Inc. affiliates (2000 to 2008). Division President and Senior Officer of Prudential Financial Group, Inc. and related companies, including fund boards and consulting services to subsidiary companies (1991 to 2000) |
| Number of funds in fund complex overseen by Trustee | | Chairman and Director/Trustee of all Legg Mason Funds consisting of 16 portfolios; Director/Trustee of the Royce Family of Funds consisting of 30 portfolios. |
| Other directorships held by Trustee during past five years | | None |
|
| David R. Odenath |
| |
| Year of birth | | 1957 |
| Position with Trust | | President and Trustee |
| Term of office and length of time served2 | | Since 2009 |
| Principal occupation(s) during past five years | | Senior Executive Vice President of Legg Mason, Inc. and President of Legg Mason Funds since 2008; formerly: President of Prudential Annuities (2002 to 2008); Executive Vice President (2003 to 2008) of American Skandia Investment Services, Inc; Chief Executive Officer and Director (2003 to 2008) of American Skandia Life Assurance Corporation, American Skandia Information Services and Technology Corporation and Skandia U.S. Inc.; President, Chief Executive Officer and Director (2003 to 2008) of American Skandia Marketing, Inc.; President, Chief Executive Officer, Chief Operating Officer and Officer-In-Charge (1999 to 2003) of Prudential Investments; Senior Vice President (1999 to 2008) of Prudential Financial, Inc.; Senior Vice President (1993 to 1999) of PaineWebber Group, Inc. (investment banking). |
| Number of funds in fund complex overseen by Trustees | | 16 |
| Other directorships held by Trustee during past five years | | None |
| Executive Officers |
| |
R. Jay Gerken, CFA Legg Mason 620 Eight Avenue, New York NY 10018 | | |
| |
| Year of birth | | 1951 |
| Position(s) with Trust | | Vice President |
| Term of office and length of time served2 | | Since 2009 |
| Principal occupation(s) during past five years | | Managing Director of Legg Mason & Co., LLC (“Legg Mason & Co.”) (since 2005); Officer and Trustee/Director of 149 funds associated with Legg Mason Partners Fund Advisor, LLC (“LMPFA”) or its affiliates (since 2006) and Legg Mason & Co. predecessors (prior to 2006); President and Chief Executive Officer (“CEO”) of LMPFA (since 2006); President and CEO of Smith Barney Fund Management LLC (“SBFM”) and Citi Fund Management, Inc. (“CFM”) (formerly registered investment advisers) (since 2002); formerly, Chairman, President and CEO, Travelers Investment Adviser Inc. (prior to 2005) |
| |
Kaprel Ozsolak Legg Mason 55 Water Street, New York, NY 10041 | | |
| |
| Year of birth | | 1965 |
| Position(s) with Trust | | Chief Financial Officer |
| Term of office and length of time served2 | | Since 2009 |
| Principal occupation(s) during past five years | | Director of Legg Mason & Co. (since 2005); Chief Financial Officer of certain mutual funds associated with Legg Mason & Co. or its affiliates (since 2007) and Legg Mason & Co. predecessors (prior to 2007); formerly, Treasurer of certain mutual funds associated with Legg Mason & Co. or its affiliates (prior to 2010) and Legg Mason & Co. predecessors (prior to 2005); formerly, Controller of certain mutual funds associated with Legg Mason & Co. predecessors (prior to 2004) |
| | |
| 30 | | Legg Mason BW Diversified Large Cap Value Fund |
Additional information (unaudited) (cont’d)
Information about Trustees and Officers
| | |
| Executive Officers cont’d |
| |
Robert I. Frenkel
Legg Mason
100 First Stamford Place, Stamford, CT 06902 | | |
| |
| Year of birth | | 1954 |
| Position(s) with Trust | | Secretary and Chief Legal Officer |
| Term of office and length of time served2 | | Since 2009 |
| Principal occupation(s) during past five years | | Vice President and Deputy General Counsel of Legg Mason (since 2006); Managing Director and General Counsel of Global Mutual Funds for Legg Mason & Co. (since 2006) and Legg Mason & Co. predecessors (since 1994); Secretary and Chief Legal Officer of certain mutual funds associated with Legg Mason & Co. or its affiliates (since 2006) and Legg Mason & Co. predecessors (prior to 2006) |
| |
Ted P. Becker
Legg Mason
620 Eighth Avenue, New York, NY 10018 | | |
| |
| Year of birth | | 1951 |
| Position(s) with Trust | | Vice President and Chief Compliance Officer |
| Term of office and length of time served2 | | Since 2009 |
| Principal occupation(s) during past five years | | Director of Global Compliance at Legg Mason (since 2006); Chief Compliance Officer of LMPFA (since 2006); Managing Director of Compliance of Legg Mason & Co. (since 2005); Chief Compliance Officer of certain mutual funds associated with Legg Mason & Co. or its affiliates (since 2006) and Legg Mason & Co. predecessors (prior to 2006) |
| |
Christopher Berarducci Legg Mason 55 Water Street, New York, NY 10041 | | |
| |
| Year of birth | | 1974 |
| Position(s) with Trust | | Treasurer |
| Term of office and length of time served2 | | Since 2010 |
| Principal occupation(s) during past five years | | Assistant Vice President of Legg Mason & Co. (since 2007); Treasurer of certain mutual funds associated with LMPFA (since 2010); Assistant Controller of certain mutual funds associated with LMPFA (prior to 2010); Manager of Fund Administration at UBS Global Asset Management (prior to 2007); Assistant Vice President and Manager of Fund Administration at JP Morgan Chase & Co. (prior to 2005) |
| 1 | Trustees who are not “interested persons” of the Fund within the meaning of Section 2(a)(19) of the 1940 Act. Each of the Independent Trustees serves on the standing committees of the Board of Trustees, which include the Audit Committee (chair: Arthur Mehlman), the Nominating Committee (co-chairs: Peter O’Brien and Jill McGovern), and the Independent Trustees Committee (chair: Arnold Lehman). |
| 2 | Officers of the Trust are elected to serve until their successors are elected and qualified. Trustees of the Trust serve a term of indefinite length until their retirement, in accordance with the Board’s retirement policy, resignation or removal, and stand for re-election by shareholders only as and when required by the 1940 Act. |
| 3 | Mr. Fetting and Mr. Odenath are considered to be interested persons, as defined in the 1940 Act, of the Trust on the basis of their current employment with the Fund’s investment adviser or its affiliated entities (including the Trust’s principal underwriter) and Legg Mason, Inc., the parent holding company of these entities as well as their ownership of Legg Mason, Inc. stock. |
Legg Mason BW
Diversified Large Cap Value Fund
Trustees
Mark R. Fetting
Chairman
David R. Odenath
President
Ruby P. Hearn
Arnold L. Lehman
Robin J.W. Masters
Jill E. McGovern
Arthur S. Mehlman
G. Peter O’Brien
S. Ford Rowan
Robert M. Tarola
Investment manager
Legg Mason Partners Fund Advisor, LLC
Investment adviser
Brandywine Global Investment Management, LLC
Distributor
Legg Mason Investor Services, LLC
Custodian
State Street Bank and Trust Company
Transfer agent
Boston Financial Data
Services, Inc.
2000 Crown Colony Drive
Quincy, MA 02169
Independent registered public accounting firm
PricewaterhouseCoopers LLP
Baltimore, MD
Legg Mason BW Diversified Large Cap Value Fund
The Fund is a separate investment series of Legg Mason Global Asset Management Trust, a Maryland statutory trust.
Legg Mason BW Diversified Large Cap Value Fund
Legg Mason Funds
55 Water Street
New York, NY 10041
The Fund files its complete schedule of portfolio holdings with the Securities and Exchange Commission (“SEC”) for the first and third quarters of each fiscal year on Form N-Q. The Fund’s Forms N-Q are available on the SEC’s website at www.sec.gov. The Fund’s Forms N-Q may be reviewed and copied at the SEC’s Public Reference Room in Washington, D.C., and information on the operation of the Public Reference Room may be obtained by calling 1-800-SEC-0330. To obtain information on Form N-Q from the Fund, shareholders can call Funds Investor Services at 1-800-822-5544 or Institutional Shareholder Services at 1-888-425-6432.
Information on how the Fund voted proxies relating to portfolio securities during the prior 12-month period ended June 30th of each year and a description of the policies and procedures that the Fund uses to determine how to vote proxies relating to portfolio transactions are available (1) without charge, upon request, by calling Funds Investor Services at 1-800-822-5544 or Institutional Shareholder Services at 1-888-425-6432, (2) on the Fund’s website at www.leggmason.com/individualinvestors and (3) on the SEC’s website at www.sec.gov.
This report is submitted for the general information of the shareholders of Legg Mason BW Diversified Large Cap Value Fund. This report is not authorized for distribution to prospective investors in the Fund unless preceded or accompanied by a current prospectus.
Investors should consider the Fund’s investment objectives, risks, charges and expenses carefully before investing. The prospectus contains this and other important information about the Fund. Please read the prospectus carefully before you invest.
www.leggmason.com/individualinvestors
© 2010 Legg Mason Investor Services, LLC
Member FINRA, SIPC
Privacy policy
We are committed to keeping nonpublic personal information about you secure and confidential. This notice is intended to help you understand how we fulfill this commitment. From time to time, we may collect a variety of personal information about you, including:
| Ÿ | | Information we receive from you on applications and forms, via the telephone, and through our websites; |
| Ÿ | | Information about your transactions with us, our affiliates, or others (such as your purchases, sales, or account balances); and |
| Ÿ | | Information we receive from consumer reporting agencies. |
We do not disclose nonpublic personal information about our customers or former customers, except to our affiliates (such as broker-dealers or investment advisers within the Legg Mason family of companies) or as is otherwise permitted by applicable law or regulation. For example, we may share this information with others in order to process your transactions or service an account. We may also provide this information to companies that perform marketing services on our behalf, such as printing and mailing, or to other financial institutions with whom we have joint marketing agreements. When we enter into such agreements, we will require these companies to protect the confidentiality of this information and to use it only to perform the services for which we hired them.
With respect to our internal security procedures, we maintain physical, electronic, and procedural safeguards to protect your nonpublic personal information, and we restrict access to this information.
If you decide at some point either to close your account(s) or become an inactive customer, we will continue to adhere to our privacy policies and practices with respect to your nonpublic personal information.
|
| NOT PART OF THE ANNUAL REPORT |
At Legg Mason, we’ve assembled a collection of experienced investment management firms and empowered each of them with the tools, the resources and, most importantly, the independence to pursue the strategies they know best.
| Ÿ | | Each was purposefully chosen for their commitment to investment excellence. |
| Ÿ | | Each is focused on specific investment styles and asset classes. |
| Ÿ | | Each exhibits thought leadership in their chosen area of focus. |
Together, we’ve built a powerful portfolio of solutions for financial advisors and their clients. And it has made us a world leader in money management.*
| * | Ranked 11th-largest money manager in the world, according to Pensions & Investments, June 28, 2010, based on 12/31/09 worldwide assets under management. |
www.leggmason.com/individualinvestors
©2010 Legg Mason Investor Services, LLC Member FINRA, SIPC
LMFX012987 11/10 SR10-1235
|
| NOT PART OF THE ANNUAL REPORT |
The registrant has adopted a code of ethics that applies to the registrant’s principal executive officer, principal financial officer, principal accounting officer or controller.
| ITEM 3. | AUDIT COMMITTEE FINANCIAL EXPERT. |
The Board of Trustees of the registrant has determined that Arthur S. Mehlman the Chairman of the Board’s Audit Committee and Robert M. Tarola, possess the technical attributes identified in Instruction 2(b) of Item 3 to Form N-CSR to qualify as “audit committee financial experts,” and have designated Mr. Mehlman and Mr. Tarola as the Audit Committee’s financial experts. Mr. Mehlman and Mr. Tarola are “independent” Trustees pursuant to paragraph (a) (2) of Item 3 to Form N-CSR.
| ITEM 4. | PRINCIPAL ACCOUNTANT FEES AND SERVICES. |
a) Audit Fees. The aggregate fees billed in the last two fiscal years ending September 30, 2009 and September 30, 2010 (the “Reporting Periods”) for professional services rendered by the Registrant’s principal accountant (the “Auditor”) for the audit of the Registrant’s annual financial statements, or services that are normally provided by the Auditor in connection with the statutory and regulatory filings or engagements for the Reporting Periods, were $0 in 2009 and $6,667 in 2010.
b) Audit-Related Fees. The aggregate fees billed in the Reporting Period for assurance and related services by the Auditor that are reasonably related to the performance of the Registrant’s financial statements were $0 in 2009 and $0 in 2010. These services consisted of procedures performed in connection with the Re-domiciliation of the various reviews of Prospectus supplements, and consent issuances related to the N-1A filings for the Legg Mason Global Asset Management Trust.
In addition, there were no Audit-Related Fees billed in the Reporting Period for assurance and related services by the Auditor to the Registrant’s investment adviser (not including any sub-adviser whose role is primarily portfolio management and is subcontracted with or overseen by another investment adviser), and any entity controlling, controlled by or under common control with the investment adviser that provides ongoing services to the Legg Mason Global Asset Management Trust (“service affiliates”), that were reasonably related to the performance of the annual audit of the service affiliates. Accordingly, there were no such fees that required pre-approval by the Audit Committee for the Reporting Periods.
(c) Tax Fees. The aggregate fees billed in the Reporting Periods for professional services rendered by the Auditor for tax compliance, tax advice and tax planning (“Tax Services”) were $0 in 2009 and $0 in 2010. These services consisted of (i) review or preparation of U.S. federal, state, local and excise tax returns; (ii) U.S. federal, state and local tax planning, advice and assistance regarding statutory, regulatory or administrative developments, and (iii) tax advice regarding tax qualification matters and/or treatment of various financial instruments held or proposed to be acquired or held.
There were no fees billed for tax services by the Auditors to service affiliates during the Reporting Periods that required pre-approval by the Audit Committee.
d) All Other Fees. There were no other fees billed in the Reporting Periods for products and services provided by the Auditor, other than the services reported in paragraphs (a) through (c) of this Item for the Legg Mason Global Asset Management Trust.
All Other Fees. There were no other non-audit services rendered by the Auditor to Legg Mason Partners Fund Advisors, LLC (“LMPFA”), and any entity controlling, controlled by or under common control with LMPFA that provided ongoing services to Legg Mason Global Asset Management Trust requiring pre-approval by the Audit Committee in the Reporting Period.
(e) Audit Committee’s pre–approval policies and procedures described in paragraph (c)
(7) of Rule 2-01 of Regulation S-X.
(1) The Charter for the Audit Committee (the “Committee”) of the Board of each registered investment company (the “Fund”) advised by LMPFA or one of their affiliates (each, an “Adviser”) requires that the Committee shall approve (a) all audit and permissible non-audit services to be provided to the Fund and (b) all permissible non-audit services to be provided by the Fund’s independent auditors to the Adviser and any Covered Service Providers if the engagement relates directly to the operations and financial reporting of the Fund. The Committee may implement policies and procedures by which such services are approved other than by the full Committee.
The Committee shall not approve non-audit services that the Committee believes may impair the independence of the auditors. As of the date of the approval of this Audit Committee Charter, permissible non-audit services include any professional services (including tax services), that are not prohibited services as described below, provided to the Fund by the independent auditors, other than those provided to the Fund in connection with an audit or a review of the financial statements of the Fund. Permissible non-audit services may not include: (i) bookkeeping or other services related to the accounting records or financial statements of the Fund; (ii) financial information systems design and implementation; (iii) appraisal or valuation services, fairness opinions or contribution-in-kind reports; (iv) actuarial services; (v) internal audit outsourcing services; (vi) management functions or human resources; (vii) broker or dealer, investment adviser or investment banking services; (viii) legal services and expert services unrelated to the audit; and (ix) any other service the Public Company Accounting Oversight Board determines, by regulation, is impermissible.
Pre-approval by the Committee of any permissible non-audit services is not required so long as: (i) the aggregate amount of all such permissible non-audit services provided to the Fund, the Adviser and any service providers controlling, controlled by or under common control with the Adviser that provide ongoing services to the Fund (“Covered Service Providers”) constitutes not more than 5% of the total amount of revenues paid to the independent auditors during the fiscal year in which the permissible non-audit services are provided to (a) the Fund, (b) the Adviser and (c) any entity controlling, controlled by or under common control with the Adviser that provides ongoing services to the Fund during the fiscal year in which the services are provided that would have to be approved by the Committee; (ii) the permissible non-audit services were not recognized by the Fund at the time of the engagement to be non-audit services; and (iii) such services are promptly brought to the attention of the Committee and approved by the Committee (or its delegate(s)) prior to the completion of the audit.
(2) For the Legg Mason Global Asset Management Trust, the percentage of fees that were approved by the audit committee, with respect to: Audit-Related Fees were 100% and 100% for 2009 and 2010; Tax Fees were 100% and 100% for 2009 and 2010; and Other Fees were 100% and 100% for 2009 and 2010.
(f) N/A
(g) Non-audit fees billed by the Auditor for services rendered to Legg Mason Global Asset Management Trust, LMPFA and any entity controlling, controlled by, or under common control with LMPFA that provides ongoing services to Legg Mason Global Asset Management Trust during the reporting period were $0 in 2010.
(h) Yes. Legg Mason Global Asset Management Trust’s Audit Committee has considered whether the provision of non-audit services that were rendered to Service Affiliates, which were not pre-approved (not requiring pre-approval), is compatible with maintaining the Accountant’s independence. All services provided by the Auditor to the Legg Mason Global Asset Management Trust or to Service Affiliates, which were required to be pre-approved, were pre-approved as required.
| ITEM 5. | AUDIT COMMITTEE OF LISTED REGISTRANTS. |
| | a) | The independent board members are acting as the registrant’s audit committee as specified in Section 3(a)(58)(B) of the Exchange Act .The Audit Committee consists of the following Board members: |
Ruby P. Hearn
Arnold L. Lehman
Robin J.W. Masters
Jill E. McGovern
Arthur S. Mehlman
G. Peter O’Brien
S. Ford Rowan
Robert M. Tarola
| ITEM 6. | SCHEDULE OF INVESTMENTS. |
Included herein under Item 1.
| ITEM 7. | DISCLOSURE OF PROXY VOTING POLICIES AND PROCEDURES FOR CLOSED-END MANAGEMENT INVESTMENT COMPANIES. |
Not applicable.
| ITEM 8. | PORTFOLIO MANAGERS OF CLOSED-END MANAGEMENT INVESTMENT COMPANIES. |
Not applicable.
| ITEM 9. | PURCHASES OF EQUITY SECURITIES BY CLOSED-END MANAGEMENT INVESTMENT COMPANY AND AFFILIATED PURCHASERS. |
Not applicable.
| ITEM 10. | SUBMISSION OF MATTERS TO A VOTE OF SECURITY HOLDERS. |
Not applicable.
| ITEM 11. | CONTROLS AND PROCEDURES. |
| | (a) | The registrant’s principal executive officer and principal financial officer have concluded that the registrant’s disclosure controls and procedures (as defined in Rule 30a- 3(c) under the Investment Company Act of 1940, as amended (the “1940 Act”)) are effective as of a date within 90 days of the filing date of this report that includes the disclosure required by this paragraph, based on their evaluation of the disclosure controls and procedures required by Rule 30a-3(b) under the 1940 Act and 15d-15(b) under the Securities Exchange Act of 1934. |
| | (b) | There were no changes in the registrant’s internal control over financial reporting (as defined in Rule 30a-3(d) under the 1940 Act) that occurred during the registrant’s last fiscal half-year (the registrant’s second fiscal half-year in the case of an annual report) that have materially affected, or are likely to materially affect the registrant’s internal control over financial reporting. |
(a) (1) Code of Ethics attached hereto.
Exhibit 99.CODE ETH
(a) (2) Certifications pursuant to section 302 of the Sarbanes-Oxley Act of 2002 attached hereto.
Exhibit 99.CERT
(b) Certifications pursuant to Section 906 of the Sarbanes-Oxley Act of 2002 attached hereto.
Exhibit 99.906CERT
SIGNATURES
Pursuant to the requirements of the Securities Exchange Act of 1934 and the Investment Company Act of 1940, the registrant has duly caused this Report to be signed on its behalf by the undersigned, there unto duly authorized.
| | |
| Legg Mason Global Asset Management Trust |
| |
By: | | /S/ DAVID R. ODENATH |
| | (David R. Odenath) |
| | President and Trustee of |
| | Legg Mason Global Asset Management Trust |
| |
Date: | | November 22, 2010 |
Pursuant to the requirements of the Securities Exchange Act of 1934 and the Investment Company Act of 1940, this report has been signed below by the following persons on behalf of the registrant and in the capacities and on the dates indicated.
| | |
| |
By: | | /S/ DAVID R. ODENATH |
| | (David R. Odenath) |
| | President and Trustee of |
| | Legg Mason Global Asset Management Trust |
| |
Date: | | November 22, 2010 |
| |
By: | | /S/ KAPREL OZSOLAK |
| | (Kaprel Ozsolak) |
| | Chief Financial Officer of |
| | Legg Mason Global Asset Management Trust |
| |
Date: | | November 22, 2010 |