UNITED STATES
SECURITIES AND EXCHANGE COMMISSION
Washington, D.C. 20549
FORM N-CSR
CERTIFIED SHAREHOLDER REPORT OF REGISTERED
MANAGEMENT INVESTMENT COMPANIES
Investment Company Act file number 811-22338
Legg Mason Global Asset Management Trust
(Exact name of registrant as specified in charter)
55 Water Street, New York, NY 10041
(Address of principal executive offices) (Zip code)
Robert I. Frenkel, Esq.
Legg Mason & Co., LLC
100 First Stamford Place
Stamford, CT 06902
(Name and address of agent for service)
Registrant’s telephone number, including area code: 1-877-721-1926
Date of fiscal year end: October 31
Date of reporting period: October 31, 2012
| ITEM 1. | REPORT TO STOCKHOLDERS. |
The Annual Report to Stockholders is filed herewith.
October 31, 2012

Investment Commentary and
Annual
Repor t
Legg Mason
Capital Management
Global Growth Trust
INVESTMENT PRODUCTS: NOT FDIC INSURED • NO BANK GUARANTEE • MAY LOSE VALUE
| | |
| II | | Legg Mason Capital Management Global Growth Trust |
Fund objective
The Fund seeks long-term growth of capital.
Investment commentary
On July 2, 2012, Legg Mason Capital Management Growth Trust changed its name to Legg Mason Capital Management Global Growth Trust. The Fund’s benchmark was also changed from the S&P 500 Indexi to the MSCI All Country World Index (MSCI ACWI)ii.
The Fund’s name was changed and the investment mandate was broadened to allow the Fund to source growth from all parts of the world. This change allows for additional flexibility to achieve the Fund’s investment objective. While the United States remains a key driver in the global economy, emerging markets and other developed markets offer growth opportunities that cannot be captured solely by a U.S.-only fund. As portfolio manager, I look forward to the challenge and opportunity of leveraging our research process to uncover growth companies across the globe.
During its first few months as a global fund, the Fund initiated twelve positions and eliminated four others. The Fund had 60 holdings at the end of October, with the top ten representing 29% of total assets compared with 9% for the MSCI ACWI. The Fund has a high active share of 83%1. From a valuation perspective, it trades at a premium to the MSCI ACWI in terms of forward price-to-earnings, price-to-sales and price-to-cash flow multiples, with trailing and forecast earnings growth rates 1.4 to 1.9 times that of the MSCI ACWI.
Outlook
If one were to venture out and build a wall of worry, the current global macro environment would provide ample material and tools. Although the European Central Bank (“ECB”) appears to have substantially reduced the likelihood of a tail event in Europe, fiscal retrenchment and deleveraging are apt to weigh on growth in the years to come. China’s gross domestic product (“GDP”)iii growth has slowed to less than 8% this year, and it may very well slow further as the country attempts to shift from investment-led to consumption-led growth. A dispute with China over the Diaoyu Islands has hampered Japanese exporters already struggling under a
| 1 | “Active share” represents the share of portfolio holdings that differ from the benchmark index holdings. Mutual funds with active share below 60% are considered closet indexers. Source: Cremers, Martijn and Petajisto, Antti; “How Active is Your Fund Manager? A New Measure That Predicts Performance” (March 31, 2009). AFA 2007 Chicago Meetings Paper; EFA 2007 Ljubljana Meetings Paper; Yale ICF Working Paper No. 06-14. Available at SSRN: http://ssrn.com/abstract=891719 or http://dx.doi.org/10.2139/ssrn.891719 |
The Investment Commentary is not a part of the Annual Report.
| | | | |
| Legg Mason Capital Management Global Growth Trust | | | III | |
strong yen. South Africa is grappling with labor disputes that have escalated into violence. GDP growth in Brazil has decelerated to less than 1%, potentially indicating a recession next year. U.S. transportation stocks have started to behave badly. In addition, the U.S. is grappling with its “fiscal cliff.” Remarkably, in the face of such worries, the MSCI ACWI was up 6.84% during the third quarter.
The strength occurring in equity markets despite very weak flows into equity funds suggests that much of the bad news had been priced into stocks. Furthermore, there are also some chinks in the wall of worry. U.S. housing starts have shown signs of improvement. From the 608.8K starts in 2011, it would require around 22% compounded average growth just to reach the more normalized 2007 level by 2015. If that occurs, it should provide a nice tailwind to the U.S. economy. Furthermore, home prices are moving broadly higher, with some markets even experiencing tight supply. Another recent event that potentially has favorable long-term consequences is the liberalization of deposit rates in China, which should start to bolster consumer wealth and support the structural shift to consumption-led growth. All of that is not to say that the wall of worry has a weak foundation, but rather that one must be careful not to build it too high.
Looking above and beyond the wall of worry, I believe there are long-term opportunities in both the emerging market and U.S. consumer sectors. The Fund is overweight in Consumer Staples and Discretionary stocks, with the idea that growth in the emerging markets will be increasingly driven by rising consumer spending and incomes. The investment-driven approach of the last cycle was inflationary in many emerging markets, to the benefit of many commodities. In China, there is a clear policy objective to increase the social safety net and support consumption-driven growth, and there are signs that this is happening elsewhere, as well. We see opportunities both in emerging market consumer companies and multinational consumer companies with high exposure to emerging markets. We also believe the U.S. consumer may be underestimated if housing continues to recover.
With such divergent macro trends and the tendency for more frequent growth scares in a low-growth environment, the Fund’s holdings are weighted toward secular growth, rather than cyclical. The Information Technology (“IT”) sector is ripe with secular growth opportunities, owing to broad-based innovation around cloud computing, mobility, social, and big data. We see the adoption of cloud architectures and business models as a multi-year secular shift. Our analysis suggests that the adoption of public cloud infrastructure is less than 1% penetrated, as compared with traditional IT outsourcing which represents a significantly higher percentage of IT spending. With penetration so low, there is ample room for growth in cloud, and we see opportunities where this growth is not fully discounted.
It would be difficult to characterize Big Pharma as a growth sector in recent years, with significant patent expirations and low returns on R&D. However, many of the companies have now coasted over their patent cliffs or are close to it. The smarter among them have changed their approach to managing R&D, concentrating resources, applying process management technology, and even implementing a venture capital type approach to drug discovery. There are some early signs that this new approach is paying off, with improving pipelines and returns. In some cases, the valuation has not caught up with the
The Investment Commentary is not a part of the Annual Report.
| | |
| IV | | Legg Mason Capital Management Global Growth Trust |
Investment commentary (cont’d)
improving growth trajectory, creating opportunities for the Fund.
So while we are cognizant of the wall of worry, we see a bridge to a better environment, with Technology, Health Care, and Emerging Market and U.S. consumers as the supports.

Gibboney Huske,
Portfolio Manager
November 30, 2012
LMCM Global Growth Trust portfolio manager update
Gibboney Huske joined the Fund as a portfolio manager in July and was named sole portfolio manager effective September 30, 2012.
The views expressed in this commentary reflect those solely of the portfolio manager as of the date of this commentary and may differ from those of Legg Mason, Inc. as a whole or the other portfolio managers of its affiliates. Any such views are subject to change at any time based on market or other conditions. These views are not intended to be a forecast of future events, a guarantee of future results or investment advice. The information contained herein has been prepared from sources believed to be reliable, but cannot be guaranteed. Forecasts and predictions are inherently limited and should not be relied upon as an indication of actual or future performance. Investors should not use this information as the sole basis for investment decisions.
| i | The S&P 500 Index is an unmanaged index of 500 stocks and is generally representative of the performance of larger companies in the U.S. |
| ii | The MSCI All Country World Index (MSCI ACWI) is a free float-adjusted market capitalization weighted index that is designed to measure the equity market performance of developed and emerging markets. |
| iii | Gross domestic product ("GDP") is the market value of all final goods and services produced within a country in a given period of time. |
The Investment Commentary is not a part of the Annual Report.
October 31, 2012
Annual
Repor t
Legg Mason
Capital Management
Global Growth Trust
INVESTMENT PRODUCTS: NOT FDIC INSURED • NO BANK GUARANTEE • MAY LOSE VALUE
| | | | |
| Legg Mason Capital Management Global Growth Trust 2012 Annual Report | | | 1 | |
Letter from the chairman

Dear Shareholder,
We are pleased to provide the annual report of Legg Mason Capital Management Global Growth Trust for the twelve-month reporting period ended October 31, 2012. Please read on for a detailed look at prevailing economic and market conditions during the Fund’s reporting period and to learn how those conditions have affected Fund performance.
Special shareholder notice
In May 2012, the Board of Trustees of Legg Mason Global Asset Management Trust (the “Board”) approved changes to the Fund’s investment strategy, name and performance benchmark. Effective July 2, 2012, the 25% limitation on investments in foreign securities for the Fund was eliminated and the name of the Fund changed from Legg Mason Capital Management Growth Trust to Legg Mason Capital Management Global Growth Trust. Additionally, the Fund changed its performance benchmark from the S&P 500i Index to the MSCI All Country World Index (MSCI ACWI)ii, which better reflects the full breadth of the global investment mandate that the Fund intends to pursue. Additionally, effective September 30, 2012, Gibboney Huske, CFA is the Fund’s portfolio manager and has day-to-day responsibility for managing the Fund’s portfolio. Ms. Huske has been a portfolio manager for the Fund since 2012.
At the Board’s regular meeting held in November 2012, Western Asset Management Company (“Western Asset”) was appointed as an additional subadviser of the Fund solely for cash management purposes. For more information regarding these changes, please see the Fund’s prospectus.
As always, we remain committed to providing you with excellent service and a full spectrum of investment choices. We also remain committed to supplementing the support you receive from your financial advisor. One way we accomplish this is through our website, www.leggmason.com/individualinvestors. Here you can gain immediate access to market and investment information, including:
| Ÿ | | Fund prices and performance, |
| Ÿ | | Market insights and commentaries from our portfolio managers, and |
| Ÿ | | A host of educational resources. |
We look forward to helping you meet your financial goals.
Sincerely,

R. Jay Gerken, CFA
Chairman and President
November 30, 2012
| i | The S&P 500 Index is an unmanaged index of 500 stocks and is generally representative of the performance of larger companies in the U.S. Please note that an investor cannot invest directly in an index. |
| ii | The MSCI All Country World Index (MSCI ACWI) is a free float-adjusted market capitalization weighted index that is designed to measure the equity market performance of developed and emerging markets. Please note that an investor cannot invest directly in an index. |
| | |
| 2 | | Legg Mason Capital Management Global Growth Trust 2012 Annual Report |
Fund overview
Q. What is the Fund’s investment strategy?
A. Prior to July 2, 2012, the Fund followed a different investment mandate under the name Legg Mason Capital Management Growth Trust. The Fund’s investment objective, to seek long-term growth of capital, remains unchanged. Effective July 2, 2012, the Fund normally invests primarily in common stocks of U.S. and foreign companies that, in the portfolio manager’s opinion, appear to offer above average growth potential and trade at a significant discount to the portfolio manager’s assessment of their intrinsic value. Any income realized will be incidental to the Fund’s objective. The Fund may invest in companies of any size located throughout the world, including companies located, or with substantial operations in emerging markets. Foreign companies are considered to include those organized, headquartered or with substantial operations outside of the U.S. The Fund’s policy is to remain substantially invested in common stocks or securities convertible into or exchangeable for common stock.
Q. What were the overall market conditions during the Fund’s reporting period?
A. Equities extended 2011’s fourth quarter rally into the first quarter of 2012, reacting to improving domestic economic data, strong corporate earnings and increasingly positive headlines from Europe, which indicated a mitigating debt crisis. The European Union (“EU”), the European Central Bank (“ECB”), and other central banks continued to buy the additional time needed for European banks to deleverage and take losses in an orderly fashion. As a result, volatility plummeted and the median three-month correlations of S&P 500 stocks to the S&P 500 Indexi posted a record collapse, close to the long-term average. Stocks subsequently cooled their torrid pace set during the first quarter as non-farm payrolls missed consensus estimates by wide margins and reports out of China pointed to slowing economic growth out of the world’s second largest economy. Additionally, reports postulating Greece’s exit from the euro currency swirled during the second quarter, but the Greek population ultimately decided to elect the pro-bailout and pro-euro New Democracy party. As conditions deteriorated, heads of state and central banks stood ready to implement policy changes and provide further easing. In the U.S., the Federal Reserve Board (“Fed”)ii added $267 billion to “Operation Twist” and extended the program through the end of 2012 due to slowing consumer spending and employment growth. Spain also announced a $24 billion bailout for troubled lender Bankia, effectively nationalizing Spain’s third largest banking institution. Finally, during the late June EU summit, leaders decided to speed the creation of a singular regulatory body for banks and bolstered support for the European System of Financial Supervisors (“ESFS”) and European Stability Mechanism (“ESM”), EU bailout funds. Equities recovered in the third quarter largely due to additional central bank stimulus and improving economic data. After the Fed’s chairman Ben Bernanke described the unemployment problem in the U.S. as a “grave concern,” the Federal Open Markets Committee (“FOMC”)iii announced a third round of asset purchases, colloquially known as quantitative easing (“QE3”) which aimed to purchase $40 billion of mortgage-backed securities each month with no stated termination date and extend “Operation Twist.” Across the Atlantic, the ECB’s president Mario Draghi bolstered markets after promising “whatever it takes to preserve the euro,” beginning with plans to purchase eurozone government bonds with no purchase limits. Many domestic economic indicators also picked up during the quarter, including a drop in the unemployment rate, rising housing starts and an expansion in manu-
| | | | |
| Legg Mason Capital Management Global Growth Trust 2012 Annual Report | | | 3 | |
facturing output. However, stocks trimmed their year-to-date gains in October as investors shifted attention to the November presidential election.
Q. How did we respond to these changing market conditions?
A. Coming into the reporting period, the market reacted strongly to shaky confidence in the U.S. government and the European banking system, which drove correlations to concerning highs. Since then, correlations have dropped and equities seem to react more to fundamentals, such as earnings, company-specific news or long-term trends like the housing recovery. This provided the opportunity to position the Fund to capture upside at attractive valuations in a shifting environment.
As more fully described below, the Fund broadened its mandate to allow for additional investment in global equities. During its first few months as a global fund, the portfolio initiated twelve positions and eliminated four others. The Fund had 60 holdings at the end of October, with the top ten representing 29% of total assets compared with 9% for the MSCI All Country World Index (MSCI ACWI)iv. From a valuation perspective, as of the end of the period, the Fund traded at a premium to the MSCI ACWI in terms of forward price-to-earnings, price-to-sales and price-to- cash flow multiples.
Performance review
For the twelve months ended October 31, 2012, Class C shares of Legg Mason Capital Management Global Growth Trust, excluding sales charges, returned 8.78%. The Fund’s new unmanaged benchmark, the MSCI ACWI and its former benchmark, the S&P 500 Index, returned 8.55% and 15.21%, respectively, for the same period. The Lipper Multi-Cap Growth Funds Category Average1 returned 9.36% over the same time frame.
| | | | | | | | |
Performance Snapshot as of October 31, 2012
(unaudited) | |
| (excluding sales charges) | | 6 months | | | 12 months | |
Legg Mason Capital Management
Global Growth Trust: | |
Class A | | | -2.44 | % | | | 9.61 | % |
Class C | | | -2.81 | % | | | 8.78 | % |
Class R | | | -2.58 | % | | | 9.36 | % |
Class FI | | | -2.42 | % | | | 9.65 | % |
Class I | | | -2.33 | % | | | 9.88 | % |
| MSCI All Country World Index (MSCI ACWI) | | | 1.38 | % | | | 8.55 | % |
| S&P 500 Index | | | 2.16 | % | | | 15.21 | % |
| Lipper Multi-Cap Growth Funds Category Average1 | | | -2.56 | % | | | 9.36 | % |
The performance shown represents past performance. Past performance is no guarantee of future results and current performance may be higher or lower than the performance shown above. Principal value and investment returns will fluctuate and investors’ shares, when redeemed, may be worth more or less than their original cost. To obtain performance data current to the most recent month-end, please visit our website at www.leggmason.com/individualinvestors.
All share class returns assume the reinvestment of all distributions at net asset value and the deduction of all Fund expenses. Returns have not been adjusted to include sales charges that may apply or the deduction of taxes that a shareholder would pay on Fund distributions. If sales charges were reflected, the performance quoted would be lower. Performance figures for periods shorter than one year represent cumulative figures and are not annualized.
| 1 | Lipper, Inc., a wholly-owned subsidiary of Reuters, provides independent insight on global collective investments. Returns are based on the period ended October 31, 2012, including the reinvestment of all distributions, including returns of capital, if any, calculated among the 561 funds for the six-month period and among the 535 funds for the twelve-month period in the Fund’s Lipper category, and excluding sales charges. |
| | |
| 4 | | Legg Mason Capital Management Global Growth Trust 2012 Annual Report |
Fund overview (cont’d)
Fund performance figures reflect fee waivers and/or expense reimbursements, without which the performance would have been lower.
|
| Total Annual Operating Expenses (unaudited) |
As of the Fund’s current prospectus dated February 29, 2012, the gross total annual operating expense ratios for Class A, Class C, Class R, Class FI and Class I shares were 1.24%, 1.97%, 1.91%, 1.18% and 0.90%, respectively.
Actual expenses may be higher. For example, expenses may be higher than those shown if average net assets decrease. Net assets are more likely to decrease and Fund expense ratios are more likely to increase when markets are volatile.
As a result of expense limitation arrangements, the ratio of expenses, other than interest, brokerage commissions, dividend expense on short sales, taxes, extraordinary expenses and acquired fund fees and expenses, to average net assets is not expected to exceed 1.15% for Class A shares, 1.90% for Class C shares, 1.40% for Class R shares, 1.15% for Class FI shares and 0.90% for Class I shares. These expense limitation arrangements cannot be terminated prior to December 31, 2014 without the Board of Trustees’ consent.
The manager is permitted to recapture amounts waived or reimbursed to a class within three years after the fiscal year in which the manager earned the fee or incurred the expense if the class’ total annual operating expenses have fallen to a level below the expense limitation (“expense cap”) in effect at the time the fees were earned or the expenses incurred. In no case will the manager recapture any amount that would result, on any particular business day of the Fund, in the class’ total annual operating expenses exceeding the expense cap or any other lower limit then in effect.
Q. What were the leading contributors to performance?
A. Apple’s shares appreciated thanks to several strong product launches. The technology giant introduced the iPhone 4s at the end of 2011, the new iPad in March 2012, the iPhone 5 in September 2012 and the iPad Mini in October 2012, while refreshing their iPod and Mac lines. All four new products were record setting at the time of their release. As Apple’s massive cash hoard grew, they initiated a $2.65 dividend and instituted a $10B share repurchase program. Alcoholic beverage producer Diageo was a top contributor for the Fund. The company’s cyclically resilient business and broad international diversification provide strong downside protection to the Fund, while also offering substantial upside through its powerful market position and high incremental margins. Lowe’s added to performance after the home-improvement retailer benefitted from the early stages of the housing recovery, which led to two blowout quarters during 2012.
Prada and L’Occitane were part of broad-based outperformance in luxury goods. Despite a tepid macro environment, these luxury retailers produced consistently solid earnings and same-store sales growth. Prada and L’Occitane are both extremely high return businesses with long-term growth profiles due to their product mix and international placement.
Q. What were the leading detractors from performance?
A. Shares of Groupon and Marvell detracted the most from performance. The volatile post-IPO performance of Groupon continued through the year as the company hit several road bumps during its torrid growth, leading some investors to question the company’s long-term business model. We continue to believe the company’s business model is misunderstood by the market and the company provides significant upside potential for patient, long-term investors. Marvell Technology detracted from performance after several earnings miss and high-turnover at the CFO position. Though the company has become a repeat underperformer, the stock price embeds substantial deterioration, which we find unwarranted considering the company’s long-term growth opportunities and top-notch capital allocation.
| | | | |
| Legg Mason Capital Management Global Growth Trust 2012 Annual Report | | | 5 | |
Acme Packet detracted from performance after the voice-over-IP company forecasted significantly lower revenues from large mobile carriers for 2012. As over-the-top voice, such as Skype or Google Voice, minimized the need for AT&T and Verizon to build out more voice capabilities, Acme announced that it expected 25% less revenue from major voice providers. With mobile carriers de-prioritizing investments in voice, our investment case on Acme was violated and we exited the position.
CONSOL Energy and Nabors had significant exposure to commodity prices, especially natural gas, oil and coal, all of which have been volatile over the past year. Additionally, overproduction and atypically warm weather have boosted inventories and driven natural gas prices down, which in turn have reduced oil and coal consumption.
Q. Were there any significant changes to the Fund during the reporting period?
A. On July 2, 2012, the Fund changed its name from Legg Mason Capital Management Growth Trust to Legg Mason Capital Management Global Growth Trust. The benchmark for the Fund was also changed from the S&P 500 Index to the MSCI ACWI. The Fund’s name was changed and the investment mandate was broadened to allow the Fund to source growth from all parts of the world. This change allows for additional flexibility to achieve the Fund’s investment objective. While the United States remains a key driver in the global economy, emerging markets and other developed markets offer growth opportunities that cannot be captured solely by a U.S.-only fund. Legg Mason Capital Management believes that the Fund can benefit from leveraging the firm’s research process to uncover growth companies across the globe.
Thank you for your investment in Legg Mason Capital Management Global Growth Trust. As always, we appreciate that you have chosen us to manage your assets and we remain focused on achieving the Fund’s investment goals.
Sincerely,
Legg Mason Capital Management, LLC
November 23, 2012
RISKS: Equity securities are subject to price fluctuation and possible loss of principal. The manager’s investment style may become out of favor and/or the manager’s selection process may prove incorrect, which may have a negative impact on the Fund’s performance. Growth stocks as a group can be more volatile than value stocks and may be out of favor and underperform the overall equity market while the market concentrates on value stocks. As a non-diversified fund, it is permitted to invest a higher percentage of its assets in any one issuer than a diversified fund, which may magnify the Fund’s losses from events affecting a particular issuer. The Fund may focus its investments in certain regions or industries, increasing its vulnerability to market volatility. International investments are subject to special risks including currency fluctuations and social, economic and political uncertainties, which could increase volatility. These risks are magnified in emerging markets. Please see the Fund’s prospectus for a more complete discussion of these and other risks, and the Fund’s investment strategies.
Portfolio holdings and breakdowns are as of October 31, 2012 and are subject to change and may not be representative of the portfolio manager’s current or future investments. The Fund’s top ten holdings (as a percentage of net assets) as of October 31, 2012 were: Diageo PLC, ADR (4.2%), Apple Inc. (3.7%), L’Occitane International SA (3.7%), Fomento Economico Mexicano SA de CV, ADR (2.7%), Myriad Genetics Inc. (2.6%), Prada SpA (2.5%), Lowe’s Cos. Inc. (2.4%), Celgene Corp. (2.4%), Sanofi, ADR (2.3%) and Rackspace Hosting Inc. (2.3%). Please refer to pages 13 through 16 for a list and percentage breakdown of the Fund’s holdings.
| | |
| 6 | | Legg Mason Capital Management Global Growth Trust 2012 Annual Report |
Fund overview (cont’d)
The mention of sector breakdowns is for informational purposes only and should not be construed as a recommendation to purchase or sell any securities. The information provided regarding such sectors is not a sufficient basis upon which to make an investment decision. Investors seeking financial advice regarding the appropriateness of investing in any securities or investment strategies discussed should consult their financial professional. The Fund’s top five sector holdings (as a percentage of net assets) as of October 31, 2012 were: Information Technology (31.0%), Consumer Discretionary (20.1%), Health Care (14.7%), Consumer Staples (12.1%) and Energy (6.2%). The Fund’s portfolio composition is subject to change at any time.
All investments are subject to risk including the possible loss of principal. Past performance is no guarantee of future results. All index performance reflects no deduction for fees, expenses or taxes. Please note that an investor cannot invest directly in an index.
The information provided is not intended to be a forecast of future events, a guarantee of future results or investment advice. Views expressed may differ from those of the firm as a whole.
| i | The S&P 500 Index is an unmanaged index of 500 stocks and is generally representative of the performance of larger companies in the U.S. |
| ii | The Federal Reserve Board ("Fed") is responsible for the formulation of policies designed to promote economic growth, full employment, stable prices and a sustainable pattern of international trade and payments. |
| iii | The Federal Open Market Committee ("FOMC") is a policy-making body of the Federal Reserve System responsible for the formulation of a policy designed to promote economic growth, full employment, stable prices and a sustainable pattern of international trade and payments. |
| iv | The MSCI All Country World Index (MSCI ACWI) is a free float-adjusted market capitalization weighted index that is designed to measure the equity market performance of developed and emerging markets. |
| | | | |
| Legg Mason Capital Management Global Growth Trust 2012 Annual Report | | | 7 | |
Fund at a glance† (unaudited)
Investment breakdown (%) as a percent of total investments
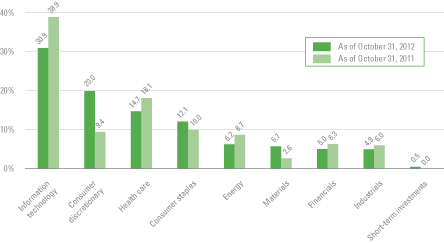
| † | The bar graph above represents the composition of the Fund’s investments as of October 31, 2012 and October 31, 2011. The Fund is actively managed. As a result, the composition of the Fund’s investments is subject to change at any time. |
| | |
| 8 | | Legg Mason Capital Management Global Growth Trust 2012 Annual Report |
Fund expenses (unaudited)
Example
As a shareholder of the Fund, you may incur two types of costs: (1) transaction costs, including front-end and back-end sales charges (loads) on purchase payments; and (2) ongoing costs, including management fees; service and/or distribution (12b-1) fees; and other Fund expenses. This example is intended to help you understand your ongoing costs (in dollars) of investing in the Fund and to compare these costs with the ongoing costs of investing in other mutual funds.
This example is based on an investment of $1,000 invested on May 1, 2012 and held for the six months ended October 31, 2012.
Actual expenses
The table below titled “Based on Actual Total Return” provides information about actual account values and actual expenses. You may use the information provided in this table, together with the amount you invested, to estimate the expenses that you paid over the period. To estimate the expenses you paid on your account, divide your ending account value by $1,000 (for example, an $8,600 ending account value divided by $1,000 = 8.6), then multiply the result by the number under the heading entitled “Expenses Paid During the Period”.
Hypothetical example for comparison purposes
The table below titled “Based on Hypothetical Total Return” provides information about hypothetical account values and hypothetical expenses based on the actual expense ratio and an assumed rate of return of 5.00% per year before expenses, which is not the Fund’s actual return. The hypothetical account values and expenses may not be used to estimate the actual ending account balance or expenses you paid for the period. You may use the information provided in this table to compare the ongoing costs of investing in the Fund and other funds. To do so, compare the 5.00% hypothetical example relating to the Fund with the 5.00% hypothetical examples that appear in the shareholder reports of the other funds.
Please note that the expenses shown in the table below are meant to highlight your ongoing costs only and do not reflect any transactional costs, such as front-end or back-end sales charges (loads). Therefore, the table is useful in comparing ongoing costs only, and will not help you determine the relative total costs of owning different funds. In addition, if these transaction costs were included, your costs would have been higher.
| | | | | | | | | | | | | | | | | | | | | | | | | | | | | | | | | | | | | | | | | | | | |
| Based on actual total return1 | | | | | Based on hypothetical total return1 | |
| | | Actual
Total Return
Without
Sales
Charge2 | | | Beginning
Account
Value | | | Ending
Account
Value | | | Annualized
Expense
Ratio | | | Expenses
Paid
During
the
Period 3 | | | | | | | Hypothetical
Annualized
Total Return | | | Beginning
Account Value | | | Ending
Account
Value | | | Annualized
Expense
Ratio | | | Expenses
Paid
During
the
Period 3 | |
| Class A | | | -2.44 | % | | $ | 1,000.00 | | | $ | 975.60 | | | | 1.15 | % | | $ | 5.71 | | | | | Class A | | | 5.00 | % | | $ | 1,000.00 | | | $ | 1,019.36 | | | | 1.15 | % | | $ | 5.84 | |
| Class C | | | -2.81 | | | | 1,000.00 | | | | 971.90 | | | | 1.90 | | | | 9.42 | | | | | Class C | | | 5.00 | | | | 1,000.00 | | | | 1,015.58 | | | | 1.90 | | | | 9.63 | |
| Class R | | | -2.58 | | | | 1,000.00 | | | | 974.20 | | | | 1.40 | | | | 6.95 | | | | | Class R | | | 5.00 | | | | 1,000.00 | | | | 1,018.10 | | | | 1.40 | | | | 7.10 | |
| Class FI | | | -2.42 | | | | 1,000.00 | | | | 975.80 | | | | 1.15 | | | | 5.71 | | | | | Class FI | | | 5.00 | | | | 1,000.00 | | | | 1,019.36 | | | | 1.15 | | | | 5.84 | |
| Class I | | | -2.33 | | | | 1,000.00 | | | | 976.70 | | | | 0.90 | | | | 4.47 | | | | | Class I | | | 5.00 | | | | 1,000.00 | | | | 1,020.61 | | | | 0.90 | | | | 4.57 | |
| 1 | For the six months ended October 31, 2012. |
| 2 | Assumes the reinvestment of all distributions, including returns of capital, if any, at net asset value and does not reflect the deduction of the applicable sales charge with respect to Class A shares or the applicable contingent deferred sales charge (“CDSC”) with respect to Class C shares. Total return is not annualized, as it may not be representative of the total return for the year. Performance figures may reflect compensating balance arrangements, fee waivers and/or expense reimbursements. In the absence of compensating balance arrangements, fee waivers and/or expense reimbursements, the total return would have been lower. Past performance is no guarantee of future results. |
| 3 | Expenses (net of compensating balance arrangements, fee waivers and/or expense reimbursements) are equal to each class’ respective annualized expense ratio multiplied by the average account value over the period, multiplied by the number of days in the most recent fiscal half-year (184), then divided by 366. |
| | | | |
| Legg Mason Capital Management Global Growth Trust 2012 Annual Report | | | 9 | |
Fund performance (unaudited)
| | | | | | | | | | | | | | | | | | | | |
| Average annual total returns | |
| Without sales charges1 | | Class A | | | Class C | | | Class R | | | Class FI | | | Class I | |
| Twelve Months Ended 10/31/12 | | | 9.61 | % | | | 8.78 | % | | | 9.36 | % | | | 9.65 | % | | | 9.88 | % |
| Five Years Ended 10/31/12 | | | N/A | | | | -9.15 | | | | -8.70 | | | | -8.46 | | | | -8.20 | |
| Ten Years Ended 10/31/12 | | | N/A | | | | 3.54 | | | | N/A | | | | N/A | | | | N/A | |
| Inception* through 10/31/12 | | | 18.09 | | | | 5.69 | | | | -3.81 | | | | -0.76 | | | | -0.63 | |
| | | | | |
| With sales charges2 | | Class A | | | Class C | | | Class R | | | Class FI | | | Class I | |
| Twelve Months Ended 10/31/12 | | | 3.31 | % | | | 7.78 | % | | | 9.36 | % | | | 9.65 | % | | | 9.88 | % |
| Five Years Ended 10/31/12 | | | N/A | | | | -9.15 | | | | -8.70 | | | | -8.46 | | | | -8.20 | |
| Ten Years Ended 10/31/12 | | | N/A | | | | 3.54 | | | | N/A | | | | N/A | | | | N/A | |
| Inception* through 10/31/12 | | | 16.23 | | | | 5.69 | | | | -3.81 | | | | -0.76 | | | | -0.63 | |
| | | | |
| Cumulative total returns | | | |
| Without sales charges1 | | | |
| Class A (Inception date of 2/3/09 through 10/31/12) | | | 86.36 | % |
| Class C (10/31/02 through 10/31/12) | | | 41.59 | |
| Class R (Inception date of 12/28/06 through 10/31/12) | | | -20.32 | |
| Class FI (Inception date of 1/29/04 through 10/31/12) | | | -6.43 | |
| Class I (Inception date of 3/4/04 through 10/31/12) | | | -5.31 | |
All figures represent past performance and are not a guarantee of future results. Investment return and principal value of an investment will fluctuate so that an investor’s shares, when redeemed, may be worth more or less than their original cost. The returns shown do not reflect the deduction of taxes that a shareholder would pay on Fund distributions or the redemption of Fund shares. Performance figures may reflect compensating balance arrangements, fee waivers and/or expense reimbursements. In the absence of compensating balance arrangements, fee waivers and/or expense reimbursements, the total return would have been lower.
| 1 | Assumes the reinvestment of all distributions, including returns of capital, if any, at net asset value and does not reflect the deduction of the applicable sales charge with respect to Class A shares or the applicable contingent deferred sales charges (“CDSC”) with respect to Class C shares. |
| 2 | Assumes the reinvestment of all distributions, including returns of capital, if any, at net asset value. In addition, Class A shares reflect the deduction of the maximum initial sales charge of 5.75%. Class C shares reflect the deduction of a 1.00% CDSC, which applies if shares are redeemed within one year from purchase payment. |
| * | Inception dates for Class A, C, R, FI and I shares are February 3, 2009, April 17, 1995, December 28, 2006, January 29, 2004 and March 4, 2004, respectively. |
| | |
| 10 | | Legg Mason Capital Management Global Growth Trust 2012 Annual Report |
Fund performance (unaudited) (cont’d)
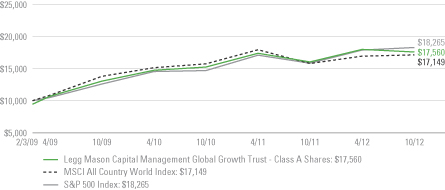
Historical performance
Value of $10,000 invested in
Class A Shares of Legg Mason Capital Management Global Growth Trust vs. MSCI All Country World Index and S&P 500 Index† — February 3, 2009 - October 2012
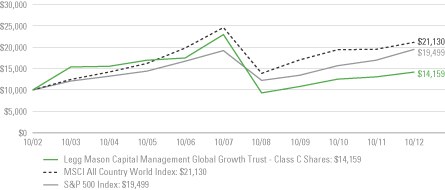
Value of $10,000 invested in
Class C Shares of Legg Mason Capital Management Global Growth Trust vs. MSCI All Country World Index and S&P 500 Index† — October 2002 - October 2012
| | | | |
| Legg Mason Capital Management Global Growth Trust 2012 Annual Report | | | 11 | |
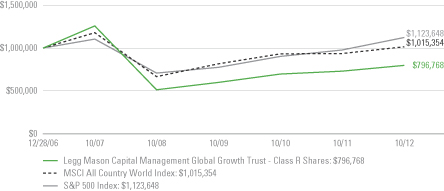
Value of $1,000,000 invested in
Class R Shares of Legg Mason Capital Management Global Growth Trust vs. MSCI All Country World Index and S&P 500 Index† — December 28, 2006 - October 2012
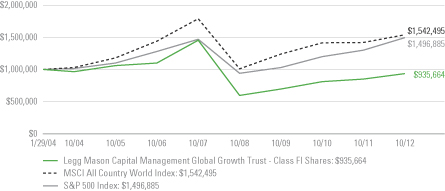
Value of $1,000,000 invested in
Class FI Shares of Legg Mason Capital Management Global Growth Trust vs. MSCI All Country World Index and S&P 500 Index† — January 29, 2004 - October 2012
| | |
| 12 | | Legg Mason Capital Management Global Growth Trust 2012 Annual Report |
Fund performance (unaudited) (cont’d)
Value of $1,000,000 invested in
Class I Shares of Legg Mason Capital Management Global Growth Trust vs. MSCI All Country World Index and S&P 500 Index† — March 4, 2004 - October 2012
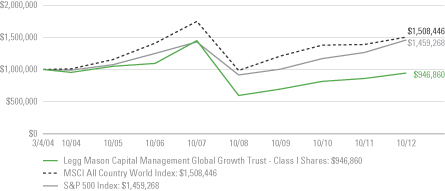
All figures represent past performance and are not a guarantee of future results. Investment return and principal value of an investment will fluctuate so that an investor’s shares, when redeemed, may be worth more or less than their original cost. The returns shown do not reflect the deduction of taxes that a shareholder would pay on Fund distributions or the redemption of Fund shares. Performance figures may reflect compensating balance arrangements, fee waivers and/or expense reimbursements. In the absence of compensating balance arrangements, fee waivers and/or expense reimbursements, the total return would have been lower.
| † | Hypothetical illustration of $10,000 invested in Class A and C shares and $1,000,000 invested in Class R, FI and I shares of Legg Mason Capital Management Global Growth Trust on February 3, 2009 (commencement of operations), October 31, 2002, December 28, 2006 (commencement of operations), January 29, 2004 (commencement of operations) and March 4, 2004 (commencement of operations), respectively, assuming the deduction of the maximum initial sales charge of 5.75% at the time of investment for Class A shares and the reinvestment of all distributions, including returns of capital, if any, at net asset value through October 31, 2012. The hypothetical illustration also assumes a $10,000 or $1,000,000 investment, as applicable, in the MSCI All Country World Index and S&P 500 Index. The MSCI All Country World Index is a free float-adjusted market capitalization weighted index that is designed to measure the equity market performance of developed and emerging markets. The S&P 500 Index is an unmanaged index of 500 stocks and is generally representative of the performance of larger companies in the U.S. The Indices are unmanaged and are not subject to the same management and trading expenses as a mutual fund. Please note that an investor cannot invest directly in an index. |
| | In July 2012, the Fund changed its performance benchmark from the S&P 500 Index to the MSCI All Country World Index (MSCI ACWI), which better reflects the full breadth of the global investment mandate that the Fund intends to pursue. |
| | | | |
| Legg Mason Capital Management Global Growth Trust 2012 Annual Report | | | 13 | |
Schedule of investments
October 31, 2012
Legg Mason Capital Management Global Growth Trust
| | | | | | | | | | | | |
| Security | | | | | | Shares | | | Value | |
| Common Stocks — 99.7% | |
| Consumer Discretionary — 20.1% | |
Auto Components — 1.3% | | | | | | | | | | | | |
Autoliv Inc. | | | | | | | 35,000 | | | $ | 2,016,000 | |
Hotels, Restaurants & Leisure — 3.9% | | | | | | | | | | | | |
Ctrip.com International Ltd., ADR | | | | | | | 110,000 | | | | 2,201,100 | * |
Las Vegas Sands Corp. | | | | | | | 45,000 | | | | 2,089,800 | |
McDonald’s Corp. | | | | | | | 18,000 | | | | 1,562,400 | |
Total Hotels, Restaurants & Leisure | | | | | | | | | | | 5,853,300 | |
Internet & Catalog Retail — 2.6% | | | | | | | | | | | | |
Amazon.com Inc. | | | | | | | 14,000 | | | | 3,259,480 | * |
Groupon Inc. | | | | | | | 180,000 | | | | 741,600 | * |
Total Internet & Catalog Retail | | | | | | | | | | | 4,001,080 | |
Multiline Retail — 1.6% | | | | | | | | | | | | |
Dollar General Corp. | | | | | | | 51,000 | | | | 2,479,620 | * |
Specialty Retail — 6.1% | | | | | | | | | | | | |
L’Occitane International SA | | | | | | | 1,785,000 | | | | 5,562,255 | |
Lowe’s Cos. Inc. | | | | | | | 115,000 | | | | 3,723,700 | |
Total Specialty Retail | | | | | | | | | | | 9,285,955 | |
Textiles, Apparel & Luxury Goods — 4.6% | | | | | | | | | | | | |
NIKE Inc., Class B Shares | | | | | | | 35,000 | | | | 3,198,300 | |
Prada SpA | | | | | | | 460,000 | | | | 3,754,169 | |
Total Textiles, Apparel & Luxury Goods | | | | | | | | | | | 6,952,469 | |
Total Consumer Discretionary | | | | | | | | | | | 30,588,424 | |
| Consumer Staples — 12.1% | |
Beverages — 6.9% | | | | | | | | | | | | |
Diageo PLC, ADR | | | | | | | 56,000 | | | | 6,397,440 | |
Fomento Economico Mexicano SA de CV, ADR | | | | | | | 45,000 | | | | 4,077,450 | |
Total Beverages | | | | | | | | | | | 10,474,890 | |
Food Products — 3.1% | | | | | | | | | | | | |
Amira Nature Foods Ltd. | | | | | | | 167,000 | | | | 1,344,350 | * |
Unilever NV | | | | | | | 95,000 | | | | 3,485,550 | |
Total Food Products | | | | | | | | | | | 4,829,900 | |
Household Products — 2.1% | | | | | | | | | | | | |
Colgate-Palmolive Co. | | | | | | | 30,300 | | | | 3,180,288 | |
Total Consumer Staples | | | | | | | | | | | 18,485,078 | |
| Energy — 6.2% | |
Energy Equipment & Services — 5.3% | | | | | | | | | | | | |
Nabors Industries Ltd. | | | | | | | 171,000 | | | | 2,306,790 | * |
See Notes to Financial Statements.
| | |
| 14 | | Legg Mason Capital Management Global Growth Trust 2012 Annual Report |
Schedule of investments (cont’d)
October 31, 2012
Legg Mason Capital Management Global Growth Trust
| | | | | | | | | | | | |
| Security | | | | | | Shares | | | Value | |
Energy Equipment & Services — continued | | | | | | | | | | | | |
National-Oilwell Varco Inc. | | | | | | | 30,000 | | | $ | 2,211,000 | |
Schlumberger Ltd. | | | | | | | 50,000 | | | | 3,476,500 | |
Total Energy Equipment & Services | | | | | | | | | | | 7,994,290 | |
Oil, Gas & Consumable Fuels — 0.9% | | | | | | | | | | | | |
Occidental Petroleum Corp. | | | | | | | 18,000 | | | | 1,421,280 | |
Total Energy | | | | | | | | | | | 9,415,570 | |
| Financials — 5.0% | |
Capital Markets — 2.9% | | | | | | | | | | | | |
BlackRock Inc. | | | | | | | 11,000 | | | | 2,086,480 | |
Blackstone Group LP | | | | | | | 150,000 | | | | 2,304,000 | |
Total Capital Markets | | | | | | | | | | | 4,390,480 | |
Diversified Financial Services — 2.1% | | | | | | | | | | | | |
JPMorgan Chase & Co. | | | | | | | 77,500 | | | | 3,230,200 | |
Total Financials | | | | | | | | | | | 7,620,680 | |
| Health Care — 14.7% | | | | | |
Biotechnology — 6.1% | | | | | |
Celgene Corp. | | | | | | | 50,000 | | | | 3,666,000 | * |
Myriad Genetics Inc. | | | | | | | 149,400 | | | | 3,909,798 | * |
Vertex Pharmaceuticals Inc. | | | | | | | 35,000 | | | | 1,688,400 | * |
Total Biotechnology | | | | | | | | | | | 9,264,198 | |
Health Care Equipment & Supplies — 1.7% | | | | | |
Medtronic Inc. | | | | | | | 63,000 | | | | 2,619,540 | |
Health Care Technology — 1.0% | | | | | |
athenahealth Inc. | | | | | | | 25,000 | | | | 1,607,250 | * |
Pharmaceuticals — 5.9% | | | | | |
GlaxoSmithKline PLC, ADR | | | | | | | 70,000 | | | | 3,143,000 | |
Johnson & Johnson | | | | | | | 32,400 | | | | 2,294,568 | |
Sanofi, ADR | | | | | | | 80,000 | | | | 3,508,000 | |
Total Pharmaceuticals | | | | | | | | | | | 8,945,568 | |
Total Health Care | | | | | | | | | | | 22,436,556 | |
| Industrials — 4.9% | | | | | |
Airlines — 1.4% | | | | | |
Southwest Airlines Co. | | | | | | | 238,000 | | | | 2,099,160 | |
Industrial Conglomerates — 3.5% | | | | | |
3M Co. | | | | | | | 35,000 | | | | 3,066,000 | |
United Technologies Corp. | | | | | | | 30,000 | | | | 2,344,800 | |
Total Industrial Conglomerates | | | | | | | | | | | 5,410,800 | |
Total Industrials | | | | | | | | | | | 7,509,960 | |
See Notes to Financial Statements.
| | | | |
| Legg Mason Capital Management Global Growth Trust 2012 Annual Report | | | 15 | |
Legg Mason Capital Management Global Growth Trust
| | | | | | | | | | | | |
| Security | | | | | | Shares | | | Value | |
| Information Technology — 31.0% | | | | | |
Communications Equipment — 3.1% | | | | | |
Cisco Systems Inc. | | | | | | | 84,000 | | | $ | 1,439,760 | |
F5 Networks Inc. | | | | | | | 15,000 | | | | 1,237,200 | * |
QUALCOMM Inc. | | | | | | | 35,000 | | | | 2,050,125 | |
Total Communications Equipment | | | | | | | | | | | 4,727,085 | |
Computers & Peripherals — 5.5% | | | | | |
Apple Inc. | | | | | | | 9,400 | | | | 5,593,940 | |
EMC Corp. | | | | | | | 117,000 | | | | 2,857,140 | * |
Total Computers & Peripherals | | | | | | | | | | | 8,451,080 | |
Electronic Equipment, Instruments & Components — 1.9% | | | | | |
Hitachi Ltd. | | | | | | | 540,000 | | | | 2,861,330 | |
Internet Software & Services — 6.8% | | | | | |
eBay Inc. | | | | | | | 57,000 | | | | 2,752,530 | * |
Rackspace Hosting Inc. | | | | | | | 55,000 | | | | 3,502,950 | * |
SINA Corp. | | | | | | | 50,000 | | | | 2,731,500 | * |
Youku.com Inc., ADR | | | | | | | 67,000 | | | | 1,326,600 | * |
Total Internet Software & Services | | | | | | | | | | | 10,313,580 | |
IT Services — 3.5% | | | | | |
Accenture PLC, Class A Shares | | | | | | | 27,000 | | | | 1,820,070 | |
Cognizant Technology Solutions Corp., Class A Shares | | | | | | | 52,500 | | | | 3,499,125 | * |
Total IT Services | | | | | | | | | | | 5,319,195 | |
Semiconductors & Semiconductor Equipment — 1.8% | | | | | |
Marvell Technology Group Ltd. | | | | | | | 140,000 | | | | 1,104,600 | |
Xilinx Inc. | | | | | | | 50,000 | | | | 1,638,000 | |
Total Semiconductors & Semiconductor Equipment | | | | | | | | | | | 2,742,600 | |
Software — 8.4% | | | | | |
Adobe Systems Inc. | | | | | | | 102,000 | | | | 3,468,000 | * |
Autodesk Inc. | | | | | | | 58,500 | | | | 1,862,640 | * |
FleetMatics Group PLC | | | | | | | 73,500 | | | | 1,594,215 | * |
Jive Software Inc. | | | | | | | 131,000 | | | | 1,467,200 | * |
Microsoft Corp. | | | | | | | 54,000 | | | | 1,540,890 | |
Red Hat Inc. | | | | | | | 48,600 | | | | 2,389,662 | * |
ServiceNow Inc. | | | | | | | 11,200 | | | | 343,280 | * |
Workday Inc., Class A Shares | | | | | | | 1,300 | | | | 63,050 | * |
Total Software | | | | | | | | | | | 12,728,937 | |
Total Information Technology | | | | | | | | | | | 47,143,807 | |
See Notes to Financial Statements.
| | |
| 16 | | Legg Mason Capital Management Global Growth Trust 2012 Annual Report |
Schedule of investments
October 31, 2012
Legg Mason Capital Management Global Growth Trust
| | | | | | | | | | | | | | |
| Security | | | | | | | Shares | | | Value | |
| Materials — 5.7% | | | | | |
Chemicals — 3.1% | | | | | |
Monsanto Co. | | | | | | | | | 37,900 | | | $ | 3,262,053 | |
Yingde Gases Group Co. | | | | | | | | | 1,585,000 | | | | 1,509,319 | |
Total Chemicals | | | | | | | | | | | | | 4,771,372 | |
Metals & Mining — 2.6% | | | | | |
Harry Winston Diamond Corp. | | | | | | | | | 165,000 | | | | 2,359,500 | * |
Petra Diamonds Ltd. | | | | | | | | | 950,000 | | | | 1,525,397 | * |
Total Metals & Mining | | | | | | | | | | | | | 3,884,897 | |
Total Materials | | | | | | | | | | | | | 8,656,269 | |
Total Investments before Short-Term Investments (Cost — $128,168,869) | | | | 151,856,344 | |
| | | | |
| | | Rate | | | Maturity
Date | | Face
Amount | | | | |
| Short-Term Investments — 0.6% | | | | | |
Repurchase Agreements — 0.6% | | | | | |
Interest in $175,000,000 joint tri-party repurchase agreement dated 10/31/12 with RBS Securities Inc.; Proceeds at maturity — $860,005; (Fully collateralized by U.S. government agency obligations, 0.000% due
1/18/13; Market value — $877,203)
(Cost — $860,000) | | | 0.230 | % | | 11/1/12 | | $ | 860,000 | | | | 860,000 | |
Total Investments — 100.3% (Cost — $129,028,869#) | | | | 152,716,344 | |
Liabilities in Excess of Other Assets — (0.3)% | | | | (500,641 | ) |
Total Net Assets — 100.0% | | | $ | 152,215,703 | |
| * | Non-income producing security. |
| # | Aggregate cost for federal income tax purposes is $128,954,960. |
| | |
Abbreviation used in this schedule: |
| ADR | | — American Depositary Receipts |
See Notes to Financial Statements.
| | | | |
| Legg Mason Capital Management Global Growth Trust 2012 Annual Report | | | 17 | |
Statement of assets and liabilities
October 31, 2012
| | | | |
| |
| Assets: | | | | |
Investments, at value (Cost — $129,028,869) | | $ | 152,716,344 | |
Dividends and interest receivable | | | 90,515 | |
Receivable for Fund shares sold | | | 46,544 | |
Prepaid expenses | | | 48,884 | |
Total Assets | | | 152,902,287 | |
| |
| Liabilities: | | | | |
Payable for Fund shares repurchased | | | 275,171 | |
Service and/or distribution fees payable | | | 103,663 | |
Investment management fee payable | | | 88,757 | |
Due to custodian | | | 53,846 | |
Accrued expenses | | | 165,147 | |
Total Liabilities | | | 686,584 | |
| Total Net Assets | | $ | 152,215,703 | |
| |
| Net Assets: | | | | |
Par value (Note 6) | | $ | 67 | |
Paid-in capital in excess of par value | | | 501,108,896 | |
Accumulated net investment loss | | | (544,014) | |
Accumulated net realized loss on investments and foreign currency transactions | | | (372,035,867) | |
Net unrealized appreciation on investments and foreign currencies | | | 23,686,621 | |
| Total Net Assets | | $ | 152,215,703 | |
| |
| Shares Outstanding: | | | | |
Class A | | | 413,219 | |
Class C | | | 5,063,882 | |
Class R | | | 60,791 | |
Class FI | | | 449,761 | |
Class I | | | 756,249 | |
| |
| Net Asset Value: | | | | |
Class A (and redemption price) | | | $22.81 | |
Class C* | | | $22.17 | |
Class R (and redemption price) | | | $23.37 | |
Class FI (and redemption price) | | | $23.75 | |
Class I (and redemption price) | | | $24.36 | |
| Maximum Public Offering Price Per Share: | | | | |
Class A (based on maximum initial sales charge of 5.75%) | | | $24.20 | |
| * | Redemption price per share is NAV of Class C shares reduced by a 1.00% CDSC if shares are redeemed within one year from purchase payment (See Note 2). |
See Notes to Financial Statements.
| | |
| 18 | | Legg Mason Capital Management Global Growth Trust 2012 Annual Report |
Statement of operations
For the Year Ended October 31, 2012
| | | | |
| |
| Investment Income: | | | | |
Dividends | | $ | 2,269,453 | |
Interest | | | 531 | |
Less: Foreign taxes withheld | | | (40,896) | |
Total Investment Income | | | 2,229,088 | |
| |
| Expenses: | | | | |
Service and/or distribution fees (Notes 2 and 5) | | | 1,324,849 | |
Investment management fee (Note 2) | | | 1,178,941 | |
Transfer agent fees (Note 5) | | | 220,674 | |
Registration fees | | | 82,548 | |
Legal fees | | | 54,106 | |
Trustees’ fees | | | 45,938 | |
Fund accounting fees | | | 28,925 | |
Shareholder reports | | | 28,723 | |
Audit and tax | | | 26,372 | |
Custody fees | | | 20,592 | |
Insurance | | | 5,712 | |
Fees recaptured by investment manager (Note 2) | | | 831 | |
Miscellaneous expenses | | | 14,694 | |
Total Expenses | | | 3,032,905 | |
Less: Fee waivers and/or expense reimbursements (Notes 2 and 5) | | | (192,275) | |
Net Expenses | | | 2,840,630 | |
| Net Investment Loss | | | (611,542) | |
| |
| Realized and Unrealized Gain (Loss) on Investments and Foreign Currency Transactions (Notes 1 and 3): | | | | |
Net Realized Gain (Loss) From: | | | | |
Investment transactions | | | 13,070,333 | |
Foreign currency transactions | | | (18,277) | |
Net Realized Gain | | | 13,052,056 | |
Change in Net Unrealized Appreciation (Depreciation) From: | | | | |
Investments | | | 2,770,031 | |
Foreign currencies | | | (854) | |
Change in Net Unrealized Appreciation (Depreciation) | | | 2,769,177 | |
| Net Gain on Investments and Foreign Currency Transactions | | | 15,821,233 | |
| Increase in Net Assets from Operations | | $ | 15,209,691 | |
See Notes to Financial Statements.
| | | | |
| Legg Mason Capital Management Global Growth Trust 2012 Annual Report | | | 19 | |
Statements of changes in net assets
| | | | | | | | |
| For the Years Ended October 31, | | 2012 | | | 2011 | |
| | |
| Operations: | | | | | | | | |
Net investment loss | | $ | (611,542) | | | $ | (462,647) | |
Net realized gain | | | 13,052,056 | | | | 39,494,824 | |
Change in net unrealized appreciation (depreciation) | | | 2,769,177 | | | | (27,085,731) | |
Increase in Net Assets From Operations | | | 15,209,691 | | | | 11,946,446 | |
| | |
| Fund Share Transactions (Note 6): | | | | | | | | |
Net proceeds from sale of shares | | | 8,902,221 | | | | 21,007,877 | |
Cost of shares repurchased | | | (56,235,214) | | | | (110,367,063) | |
Decrease in Net Assets From Fund Share Transactions | | | (47,332,993) | | | | (89,359,186) | |
Decrease in Net Assets | | | (32,123,302) | | | | (77,412,740) | |
| | |
| Net Assets: | | | | | | | | |
Beginning of year | | | 184,339,005 | | | | 261,751,745 | |
End of year* | | $ | 152,215,703 | | | $ | 184,339,005 | |
* Includes accumulated net investment loss of: | | | $(544,014) | | | | $(146,773) | |
See Notes to Financial Statements.
| | |
| 20 | | Legg Mason Capital Management Global Growth Trust 2012 Annual Report |
Financial highlights
| | | | | | | | | | | | | | | | |
For a share of each class of beneficial interest outstanding throughout each year ended October 31,
unless otherwise noted: | |
| Class A Shares1 | | 2012 | | | 20112 | | | 20102 | | | 20092,3 | |
| | | | |
| Net asset value, beginning of year | | | $20.80 | | | | $19.81 | | | | $16.97 | | | | $12.24 | |
| | | | |
| Income from operations: | | | | | | | | | | | | | | | | |
Net investment income | | | 0.04 | | | | 0.06 | | | | 0.05 | | | | 0.03 | |
Net realized and unrealized gain | | | 1.97 | | | | 0.93 | | | | 2.79 | | | | 4.70 | |
Total income from operations | | | 2.01 | | | | 0.99 | | | | 2.84 | | | | 4.73 | |
| | | | |
| Net asset value, end of year | | | $22.81 | | | | $20.80 | | | | $19.81 | | | | $16.97 | |
Total return4 | | | 9.61 | % | | | 5.05 | % | | | 16.74 | % | | | 38.64 | % |
| | | | |
| Net assets, end of year (000s) | | | $9,425 | | | | $11,158 | | | | $12,630 | | | | $11,910 | |
| | | | |
| Ratios to average net assets: | | | | | | | | | | | | | | | | |
Gross expenses | | | 1.26 | % | | | 1.24 | % | | | 1.20 | % | | | 1.16 | %5 |
Net expenses6,7,8 | | | 1.15 | | | | 1.15 | | | | 1.15 | | | | 1.13 | 5 |
Net investment income | | | 0.17 | | | | 0.30 | | | | 0.27 | | | | 0.30 | 5 |
| | | | |
| Portfolio turnover rate | | | 51 | % | | | 54 | % | | | 71 | % | | | 36 | % |
| 1 | Per share amounts have been calculated using the average shares method. |
| 2 | Represents a share of capital stock outstanding prior to February 29, 2012. |
| 3 | For the period February 3, 2009 (commencement of operations) to October 31, 2009. |
| 4 | Performance figures, exclusive of sales charges, may reflect compensating balance arrangements, fee waivers and/or expense reimbursements. In the absence of compensating balance arrangements, fee waivers and/or expense reimbursements, the total return would have been lower. Past performance is no guarantee of future results. Total returns for periods of less than one year are not annualized. |
| 6 | As a result of an expense limitation arrangement, the ratio of expenses, other than interest, brokerage commissions, dividend expense on short sales, taxes, extraordinary expenses and acquired fund fees and expenses, to average net assets of Class A shares did not exceed 1.15%. This expense limitation arrangement cannot be terminated prior to December 31, 2014 without the Board of Trustees’ consent. |
| 7 | The impact of compensating balance arrangements, if any, was less than 0.01%. |
| 8 | Reflects fee waivers and/or expense reimbursements. |
See Notes to Financial Statements.
| | | | |
| Legg Mason Capital Management Global Growth Trust 2012 Annual Report | | | 21 | |
| | | | | | | | | | | | | | | | | | | | | | | | |
For a share of each class of beneficial interest outstanding throughout each year ended October 31,
unless otherwise noted: | |
| Class C Shares1,2 | | 2012 | | | 20113 | | | 20103 | | | 20093,4 | | | 20083,5 | | | 20073,5 | |
| | | | | | |
| Net asset value, beginning of year | | | $20.37 | | | | $19.54 | | | | $16.88 | | | | $12.85 | | | | $32.48 | | | | $30.78 | |
| | | | | | |
| Income (loss) from operations: | | | | | | | | | | | | | | | | | | | | | | | | |
Net investment loss | | | (0.12) | | | | (0.09) | | | | (0.09) | | | | (0.05) | | | | (0.16) | | | | (0.30) | |
Net realized and unrealized gain (loss) | | | 1.92 | | | | 0.92 | | | | 2.75 | | | | 4.08 | | | | (19.47) | | | | 4.59 | |
Total income (loss) from operations | | | 1.80 | | | | 0.83 | | | | 2.66 | | | | 4.03 | | | | (19.63) | | | | 4.29 | |
| | | | | | |
| Less distributions from: | | | | | | | | | | | | | | | | | | | | | | | | |
Net realized gains | | | — | | | | — | | | | — | | | | — | | | | — | | | | (2.59) | |
Total distributions | | | — | | | | — | | | | — | | | | — | | | | — | | | | (2.59) | |
| | | | | | |
| Net asset value, end of year | | | $22.17 | | | | $20.37 | | | | $19.54 | | | | $16.88 | | | | $12.85 | | | | $32.48 | |
Total return6 | | | 8.78 | % | | | 4.30 | % | | | 15.76 | % | | | 31.36 | % | | | (60.44) | % | | | 14.00 | % |
| | | | | | |
| Net assets, end of year (000s) | | | $112,266 | | | | $139,175 | | | | $183,178 | | | | $204,588 | | | | $204,523 | | | | $685,972 | |
| | | | | | |
| Ratios to average net assets: | | | | | | | | | | | | | | | | | | | | | | | | |
Gross expenses | | | 2.01 | % | | | 1.97 | % | | | 1.93 | % | | | 1.88 | %7 | | | 1.84 | % | | | 1.84 | % |
Net expenses8,9,10 | | | 1.90 | | | | 1.90 | | | | 1.90 | | | | 1.88 | 7 | | | 1.84 | | | | 1.84 | |
Net investment loss | | | (0.58) | | | | (0.45) | | | | (0.49) | | | | (0.47) | 7 | | | (0.67) | | | | (0.90) | |
| | | | | | |
| Portfolio turnover rate | | | 51 | % | | | 54 | % | | | 71 | % | | | 36 | % | | | 104 | % | | | 62 | % |
| 1 | On February 1, 2009, Primary Class shares were renamed Class C shares. |
| 2 | Per share amounts have been calculated using the average shares method. |
| 3 | Represents a share of capital stock outstanding prior to February 29, 2012. |
| 4 | For the period January 1, 2009 through October 31, 2009. |
| 5 | For the year ended December 31. |
| 6 | Performance figures, exclusive of CDSC, may reflect compensating balance arrangements, fee waivers and/or expense reimbursements. In the absence of compensating balance arrangements, fee waivers and/or expense reimbursements, the total return would have been lower. Past performance is no guarantee of future results. Total returns for periods of less than one year are not annualized. |
| 8 | As a result of an expense limitation arrangement, the ratio of expenses, other than interest, brokerage commissions, dividend expense on short sales, taxes, extraordinary expenses and acquired fund fees and expenses, to average net assets of Class C shares did not exceed 1.90%. This expense limitation arrangement cannot be terminated prior to December 31, 2014 without the Board of Trustees’ consent. |
| 9 | The impact of compensating balance arrangements, if any, was less than 0.01%. |
| 10 | Reflects fee waivers and/or expense reimbursements. |
See Notes to Financial Statements.
| | |
| 22 | | Legg Mason Capital Management Global Growth Trust 2012 Annual Report |
Financial highlights (cont’d)
| | | | | | | | | | | | | | | | | | | | | | | | |
For a share of each class of beneficial interest outstanding throughout each year ended October 31,
unless otherwise noted: | |
| Class R Shares1 | | 2012 | | | 20112 | | | 20102 | | | 20092,3 | | | 20082,4 | | | 20072,4 | |
| | | | | | |
| Net asset value, beginning of year | | | $21.37 | | | | $20.40 | | | | $17.52 | | | | $13.29 | | | | $33.43 | | | | $31.49 | |
| | | | | | |
| Income (loss) from operations: | | | | | | | | | | | | | | | | | | | | | | | | |
Net investment income (loss) | | | (0.02) | | | | 0.01 | | | | 0.01 | | | | 0.00 | 5 | | | (0.03) | | | | (0.15) | |
Net realized and unrealized gain (loss) | | | 2.02 | | | | 0.96 | | | | 2.87 | | | | 4.23 | | | | (20.11) | | | | 4.68 | |
Total income (loss) from operations | | | 2.00 | | | | 0.97 | | | | 2.88 | | | | 4.23 | | | | (20.14) | | | | 4.53 | |
| | | | | | |
| Less distributions from: | | | | | | | | | | | | | | | | | | | | | | | | |
Net realized gains | | | — | | | | — | | | | — | | | | — | | | | — | | | | (2.59) | |
Total distributions | | | — | | | | — | | | | — | | | | — | | | | — | | | | (2.59) | |
| | | | | | |
| Net asset value, end of year | | | $23.37 | | | | $21.37 | | | | $20.40 | | | | $17.52 | | | | $13.29 | | | | $33.43 | |
Total return6 | | | 9.36 | % | | | 4.75 | % | | | 16.44 | % | | | 31.83 | % | | | (60.25) | % | | | 14.45 | % |
| | | | | | |
| Net assets, end of year (000s) | | | $1,421 | | | | $1,324 | | | | $1,071 | | | | $963 | | | | $893 | | | | $512 | |
| | | | | | |
| Ratios to average net assets: | | | | | | | | | | | | | | | | | | | | | | | | |
Gross expenses | | | 1.71 | % | | | 1.91 | % | | | 1.73 | % | | | 1.64 | %7 | | | 1.70 | % | | | 6.56 | % |
Net expenses8,9,10 | | | 1.40 | | | | 1.40 | | | | 1.40 | | | | 1.39 | 7 | | | 1.40 | | | | 1.40 | |
Net investment income (loss) | | | (0.07) | | | | 0.05 | | | | 0.03 | | | | 0.02 | 7 | | | (0.12) | | | | (0.45) | |
| | | | | | |
| Portfolio turnover rate | | | 51 | % | | | 54 | % | | | 71 | % | | | 36 | % | | | 104 | % | | | 62 | % |
| 1 | Per share amounts have been calculated using the average shares method. |
| 2 | Represents a share of capital stock outstanding prior to February 29, 2012. |
| 3 | For the period January 1, 2009 through October 31, 2009. |
| 4 | For the year ended December 31. |
| 5 | Amount represents less than $0.01 per share. |
| 6 | Performance figures may reflect compensating balance arrangements, fee waivers and/or expense reimbursements. In the absence of compensating balance arrangements, fee waivers and/or expense reimbursements, the total return would have been lower. Past performance is no guarantee of future results. Total returns for periods of less than one year are not annualized. |
| 8 | As a result of an expense limitation arrangement, the ratio of expenses, other than interest, brokerage commissions, dividend expense on short sales, taxes, extraordinary expenses and acquired fund fees and expenses, to average net assets of Class R shares did not exceed 1.40%. This expense limitation arrangement cannot be terminated prior to December 31, 2014 without the Board of Trustees’ consent. |
| 9 | The impact of compensating balance arrangements, if any, was less than 0.01%. |
| 10 | Reflects fee waivers and/or expense reimbursements. |
See Notes to Financial Statements.
| | | | |
| Legg Mason Capital Management Global Growth Trust 2012 Annual Report | | | 23 | |
| | | | | | | | | | | | | | | | | | | | | | | | |
For a share of each class of beneficial interest outstanding throughout each year ended October 31,
unless otherwise noted: | |
| Class FI Shares1,2 | | 2012 | | | 20113 | | | 20103 | | | 20093,4 | | | 20083,5 | | | 20073,5 | |
| | | | | | |
| Net asset value, beginning of year | | | $21.66 | | | | $20.62 | | | | $17.67 | | | | $13.37 | | | | $33.54 | | | | $31.48 | |
| | | | | | |
| Income (loss) from operations: | | | | | | | | | | | | | | | | | | | | | | | | |
Net investment income (loss) | | | 0.04 | | | | 0.06 | | | | 0.05 | | | | 0.04 | | | | 0.01 | | | | (0.05) | |
Net realized and unrealized gain (loss) | | | 2.05 | | | | 0.98 | | | | 2.90 | | | | 4.26 | | | | (20.18) | | | | 4.70 | |
Total income (loss) from operations | | | 2.09 | | | | 1.04 | | | | 2.95 | | | | 4.30 | | | | (20.17) | | | | 4.65 | |
| | | | | | |
| Less distributions from: | | | | | | | | | | | | | | | | | | | | | | | | |
Net realized gains | | | — | | | | — | | | | — | | | | — | | | | — | | | | (2.59) | |
Total distributions | | | — | | | | — | | | | — | | | | — | | | | — | | | | (2.59) | |
| | | | | | |
| Net asset value, end of year | | | $23.75 | | | | $21.66 | | | | $20.62 | | | | $17.67 | | | | $13.37 | | | | $33.54 | |
Total return6 | | | 9.65 | % | | | 5.04 | % | | | 16.69 | % | | | 32.16 | % | | | (60.14) | % | | | 14.84 | % |
| | | | | | |
| Net assets, end of year (000s) | | | $10,680 | | | | $13,110 | | | | $36,010 | | | | $41,567 | | | | $106,362 | | | | $339,532 | |
| | | | | | |
| Ratios to average net assets: | | | | | | | | | | | | | | | | | | | | | | | | |
Gross expenses | | | 1.33 | % | | | 1.18 | % | | | 1.24 | % | | | 1.08 | %7 | | | 1.12 | % | | | 1.09 | % |
Net expenses8,9,10 | | | 1.15 | | | | 1.15 | | | | 1.14 | | | | 1.08 | 7 | | | 1.12 | | | | 1.09 | |
Net investment income (loss) | | | 0.17 | | | | 0.29 | | | | 0.27 | | | | 0.34 | 7 | | | 0.05 | | | | (0.15) | |
| | | | | | |
| Portfolio turnover rate | | | 51 | % | | | 54 | % | | | 71 | % | | | 36 | % | | | 104 | % | | | 62 | % |
| 1 | On October 5, 2009, Financial Intermediary Class shares were renamed Class FI shares. |
| 2 | Per share amounts have been calculated using the average shares method. |
| 3 | Represents a share of capital stock outstanding prior to February 29, 2012. |
| 4 | For the period January 1, 2009 through October 31, 2009. |
| 5 | For the year ended December 31. |
| 6 | Performance figures may reflect compensating balance arrangements, fee waivers and/or expense reimbursements. In the absence of compensating balance arrangements, fee waivers and/or expense reimbursements, the total return would have been lower. Past performance is no guarantee of future results. Total returns for periods of less than one year are not annualized. |
| 8 | As a result of an expense limitation arrangement, the ratio of expenses, other than interest, brokerage commissions, dividend expense on short sales, taxes, extraordinary expenses and acquired fund fees and expenses, to average net assets of Class FI shares did not exceed 1.15%. This expense limitation arrangement cannot be terminated prior to December 31, 2014 without the Board of Trustees’ consent. |
| 9 | The impact of compensating balance arrangements, if any, was less than 0.01%. |
| 10 | Reflects fee waivers and/or expense reimbursements. |
See Notes to Financial Statements.
| | |
| 24 | | Legg Mason Capital Management Global Growth Trust 2012 Annual Report |
Financial highlights (cont’d)
| | | | | | | | | | | | | | | | | | | | | | | | |
For a share of each class of beneficial interest outstanding throughout each year ended October 31,
unless otherwise noted: | |
| Class I Shares1,2 | | 2012 | | | 20113 | | | 20103 | | | 20093,4 | | | 20083,5 | | | 20073,5 | |
| | | | | | |
| Net asset value, beginning of year | | | $22.17 | | | | $21.05 | | | | $17.98 | | | | $13.57 | | | | $33.94 | | | | $31.73 | |
| | | | | | |
| Income (loss) from operations: | | | | | | | | | | | | | | | | | | | | | | | | |
Net investment income | | | 0.10 | | | | 0.13 | | | | 0.10 | | | | 0.07 | | | | 0.09 | | | | 0.06 | |
Net realized and unrealized gain (loss) | | | 2.09 | | | | 0.99 | | | | 2.97 | | | | 4.34 | | | | (20.46) | | | | 4.74 | |
Total income (loss) from operations | | | 2.19 | | | | 1.12 | | | | 3.07 | | | | 4.41 | | | | (20.37) | | | | 4.80 | |
| | | | | | |
| Less distributions from: | | | | | | | | | | | | | | | | | | | | | | | | |
Net realized gains | | | — | | | | — | | | | — | | | | — | | | | — | | | | (2.59) | |
Total distributions | | | — | | | | — | | | | — | | | | — | | | | — | | | | (2.59) | |
| | | | | | |
| Net asset value, end of year | | | $24.36 | | | | $22.17 | | | | $21.05 | | | | $17.98 | | | | $13.57 | | | | $33.94 | |
Total return6 | | | 9.88 | % | | | 5.32 | % | | | 17.07 | % | | | 32.50 | % | | | (60.02) | % | | | 15.20 | % |
| | | | | | |
| Net assets, end of year (000s) | | | $18,424 | | | | $19,572 | | | | $28,863 | | | | $38,420 | | | | $41,104 | | | | $228,164 | |
| | | | | | |
| Ratios to average net assets: | | | | | | | | | | | | | | | | | | | | | | | | |
Gross expenses | | | 0.96 | % | | | 0.90 | % | | | 0.85 | % | | | 0.80 | %7 | | | 0.79 | % | | | 0.77 | % |
Net expenses8,9 | | | 0.90 | 10 | | | 0.88 | 10 | | | 0.85 | | | | 0.80 | 7 | | | 0.79 | | | | 0.77 | |
Net investment income | | | 0.43 | | | | 0.58 | | | | 0.53 | | | | 0.61 | 7 | | | 0.36 | | | | 0.17 | |
| | | | | | |
| Portfolio turnover rate | | | 51 | % | | | 54 | % | | | 71 | % | | | 36 | % | | | 104 | % | | | 62 | % |
| 1 | On October 5, 2009, Institutional Class shares were renamed Class I shares. |
| 2 | Per share amounts have been calculated using the average shares method. |
| 3 | Represents a share of capital stock outstanding prior to February 29, 2012. |
| 4 | For the period January 1, 2009 through October 31, 2009. |
| 5 | For the year ended December 31. |
| 6 | Performance figures may reflect compensating balance arrangements, fee waivers and/or expense reimbursements. In the absence of compensating balance arrangements, fee waivers and/or expense reimbursements, the total return would have been lower. Past performance is no guarantee of future results. Total returns for periods of less than one year are not annualized. |
| 8 | As a result of an expense limitation arrangement, the ratio of expenses, other than interest, brokerage commissions, dividend expense on short sales, taxes, extraordinary expenses and acquired fund fees and expenses, to average net assets of Class I shares did not exceed 0.90%. This expense limitation arrangement cannot be terminated prior to December 31, 2014 without the Board of Trustees’ consent. |
| 9 | The impact of compensating balance arrangements, if any, was less than 0.01%. |
| 10 | Reflects fee waivers and/or expense reimbursements. |
See Notes to Financial Statements.
| | | | |
| Legg Mason Capital Management Global Growth Trust 2012 Annual Report | | | 25 | |
Notes to financial statements
1. Organization and significant accounting policies
Legg Mason Capital Management Global Growth Trust (formerly Legg Mason Capital Management Growth Trust) (the “Fund”) is a separate non-diversified investment series of Legg Mason Global Asset Management Trust (the “Trust”). The Trust, a Maryland statutory trust, is registered under the Investment Company Act of 1940, as amended (the “1940 Act”), as an open-end management investment company. On February 29, 2012, the Fund was reorganized as a new series of the Trust. Prior to February 29, 2012, the Fund was organized as a series of Legg Mason Capital Management Growth Trust, Inc., a Maryland corporation.
The following are significant accounting policies consistently followed by the Fund and are in conformity with U.S. generally accepted accounting principles (“GAAP”). Estimates and assumptions are required to be made regarding assets, liabilities and changes in net assets resulting from operations when financial statements are prepared. Changes in the economic environment, financial markets and any other parameters used in determining these estimates could cause actual results to differ. Subsequent events have been evaluated through the date the financial statements were issued.
(a) Investment valuation. Equity securities for which market quotations are available are valued at the last reported sales price or official closing price on the primary market or exchange on which they trade. The valuations for fixed income securities (which may include, but are not limited to, corporate, government, municipal, mortgage-backed, collateralized mortgage obligations and asset-backed securities) and certain derivative instruments are typically the prices supplied by independent third party pricing services, which may use market prices or broker/dealer quotations or a variety of valuation techniques and methodologies. The independent third party pricing services use inputs that are observable such as issuer details, interest rates, yield curves, prepayment speeds, credit risks/spreads, default rates and quoted prices for similar securities. Short-term fixed income securities that will mature in 60 days or less are valued at amortized cost, unless it is determined that using this method would not reflect an investment’s fair value. When the Fund holds securities or other assets that are denominated in a foreign currency, the Fund will normally use the currency exchange rates as of 4:00 p.m. (Eastern Time). If independent third party pricing services are unable to supply prices for a portfolio investment, or if the prices supplied are deemed by the manager to be unreliable, the market price may be determined by the manager using quotations from one or more broker/dealers or at the transaction price if the security has recently been purchased and no value has yet been obtained from a pricing service or pricing broker. When reliable prices are not readily available, such as when the value of a security has been significantly affected by events after the close of the exchange or market on which the security is principally traded, but before the Fund calculates its net asset value, the Fund values these securities as determined in accordance with procedures approved by the Fund’s Board of Trustees.
The Board of Trustees is responsible for the valuation process and has delegated the supervision of the daily valuation process to the Legg Mason North American Fund
| | |
| 26 | | Legg Mason Capital Management Global Growth Trust 2012 Annual Report |
Notes to financial statements (cont’d)
Valuation Committee (the “Valuation Committee”). The Valuation Committee, pursuant to the policies adopted by the Board of Trustees, is responsible for making fair value determinations, evaluating the effectiveness of the Fund’s pricing policies, and reporting to the Board of Trustees. When determining the reliability of third party pricing information for investments owned by the Fund, the Valuation Committee, among other things, conducts due diligence reviews of pricing vendors, monitors the daily change in prices and reviews transactions among market participants.
The Valuation Committee will consider pricing methodologies it deems relevant and appropriate when making fair value determinations. Examples of possible methodologies include, but are not limited to, multiple of earnings; discount from market of a similar freely traded security; discounted cash-flow analysis; book value or a multiple thereof; risk premium/yield analysis; yield to maturity; and/or fundamental investment analysis. The Valuation Committee will also consider factors it deems relevant and appropriate in light of the facts and circumstances. Examples of possible factors include, but are not limited to, the type of security; the issuer’s financial statements; the purchase price of the security; the discount from market value of unrestricted securities of the same class at the time of purchase; analysts’ research and observations from financial institutions; information regarding any transactions or offers with respect to the security; the existence of merger proposals or tender offers affecting the security; the price and extent of public trading in similar securities of the issuer or comparable companies; and the existence of a shelf registration for restricted securities.
For each portfolio security that has been fair valued pursuant to the policies adopted by the Board of Trustees, the fair value price is compared against the last available and next available market quotations. The Valuation Committee reviews the results of such back testing monthly and fair valuation occurrences are reported to the Board of Trustees quarterly.
The Fund uses valuation techniques to measure fair value that are consistent with the market approach and/or income approach, depending on the type of security and the particular circumstance. The market approach uses prices and other relevant information generated by market transactions involving identical or comparable securities. The income approach uses valuation techniques to discount estimated future cash flows to present value.
GAAP establishes a disclosure hierarchy that categorizes the inputs to valuation techniques used to value assets and liabilities at measurement date. These inputs are summarized in the three broad levels listed below:
| Ÿ | | Level 1 — quoted prices in active markets for identical investments |
| Ÿ | | Level 2 — other significant observable inputs (including quoted prices for similar investments, interest rates, prepayment speeds, credit risk, etc.) |
| Ÿ | | Level 3 — significant unobservable inputs (including the Fund’s own assumptions in determining the fair value of investments) |
The inputs or methodologies used to value securities are not necessarily an indication of the risk associated with investing in those securities.
| | | | |
| Legg Mason Capital Management Global Growth Trust 2012 Annual Report | | | 27 | |
The following is a summary of the inputs used in valuing the Fund’s assets carried at fair value:
| | | | | | | | | | | | | | | | |
| ASSETS | |
| Description | | Quoted Prices
(Level 1) | | | Other Significant
Observable Inputs
(Level 2) | | | Significant
Unobservable
Inputs
(Level 3) | | | Total | |
| Common stocks† | | $ | 151,856,344 | | | | — | | | | — | | | $ | 151,856,344 | |
| Short-term investments† | | | — | | | $ | 860,000 | | | | — | | | | 860,000 | |
| Total investments | | $ | 151,856,344 | | | $ | 860,000 | | | | — | | | $ | 152,716,344 | |
| † | See Schedule of Investments for additional detailed categorizations. |
For the year ended October 31, 2012, as a result of the fair value pricing procedures for international equities utilized by the Fund, certain securities have transferred in and out of Level 1 and Level 2 measurements during the period. The Fund’s policy is to recognize transfers between levels as of the end of the reporting period. At October 31, 2012, securities valued at $5,562,255 were transferred from Level 2 to Level 1 within the fair value hierarchy.
(b) Repurchase agreements. The Fund may enter into repurchase agreements with institutions that its investment adviser has determined are creditworthy. Each repurchase agreement is recorded at cost. Under the terms of a typical repurchase agreement, the Fund acquires a debt security subject to an obligation of the seller to repurchase, and of the Fund to resell, the security at an agreed-upon price and time, thereby determining the yield during the Fund’s holding period. When entering into repurchase agreements, it is the Fund’s policy that its custodian or a third party custodian, acting on the Fund’s behalf, take possession of the underlying collateral securities, the market value of which, at all times, at least equals the principal amount of the repurchase transaction, including accrued interest. To the extent that any repurchase transaction maturity exceeds one business day, the value of the collateral is marked-to-market and measured against the value of the agreement in an effort to ensure the adequacy of the collateral. If the counterparty defaults, the Fund generally has the right to use the collateral to satisfy the terms of the repurchase transaction. However, if the market value of the collateral declines during the period in which the Fund seeks to assert its rights or if bankruptcy proceedings are commenced with respect to the seller of the security, realization of the collateral by the Fund may be delayed or limited.
(c) Foreign currency translation. Investment securities and other assets and liabilities denominated in foreign currencies are translated into U.S. dollar amounts based upon prevailing exchange rates on the date of valuation. Purchases and sales of investment securities and income and expense items denominated in foreign currencies are translated into U.S. dollar amounts based upon prevailing exchange rates on the respective dates of such transactions.
The Fund does not isolate that portion of the results of operations resulting from fluctuations in foreign exchange rates on investments from the fluctuations arising from changes in market prices of securities held. Such fluctuations are included with the net realized and unrealized gain or loss on investments.
| | |
| 28 | | Legg Mason Capital Management Global Growth Trust 2012 Annual Report |
Notes to financial statements (cont’d)
Net realized foreign exchange gains or losses arise from sales of foreign currencies, including gains and losses on forward foreign currency contracts, currency gains or losses realized between the trade and settlement dates on securities transactions, and the difference between the amounts of dividends, interest, and foreign withholding taxes recorded on the Fund’s books and the U.S. dollar equivalent of the amounts actually received or paid. Net unrealized foreign exchange gains and losses arise from changes in the values of assets and liabilities, other than investments in securities, on the date of valuation, resulting from changes in exchange rates.
Foreign security and currency transactions may involve certain considerations and risks not typically associated with those of U.S. dollar denominated transactions as a result of, among other factors, the possibility of lower levels of governmental supervision and regulation of foreign securities markets and the possibility of political or economic instability.
(d) Foreign investment risks. The Fund’s investments in foreign securities may involve risks not present in domestic investments. Since securities may be denominated in foreign currencies, may require settlement in foreign currencies or pay interest or dividends in foreign currencies, changes in the relationship of these foreign currencies to the U.S. dollar can significantly affect the value of the investments and earnings of the Fund. Foreign investments may also subject the Fund to foreign government exchange restrictions, expropriation, taxation or other political, social or economic developments, all of which affect the market and/or credit risk of the investments.
(e) Security transactions and investment income. Security transactions are accounted for on a trade date basis. Interest income, adjusted for amortization of premium and accretion of discount, is recorded on the accrual basis. Dividend income is recorded on the ex-dividend date. Foreign dividend income is recorded on the ex-dividend date or as soon as practicable after the Fund determines the existence of a dividend declaration after exercising reasonable due diligence. The cost of investments sold is determined by use of the specific identification method. To the extent any issuer defaults or a credit event occurs that impacts the issuer, the Fund may halt any additional interest income accruals and consider the realizability of interest accrued up to the date of default or credit event.
(f) Distributions to shareholders. Distributions from net investment income and distributions of net realized gains, if any, are declared at least annually. Distributions to shareholders of the Fund are recorded on the ex-dividend date and are determined in accordance with income tax regulations, which may differ from GAAP.
(g) Share class accounting. Investment income, common expenses and realized/unrealized gains (losses) on investments are allocated to the various classes of the Fund on the basis of daily net assets of each class. Fees relating to a specific class are charged directly to that share class.
(h) Compensating balance arrangements. The Fund has an arrangement with its custodian bank whereby a portion of the custodian’s fees is paid indirectly by credits earned on the Fund’s cash on deposit with the bank.
| | | | |
| Legg Mason Capital Management Global Growth Trust 2012 Annual Report | | | 29 | |
(i) Commission recapture. The Fund has entered into an agreement with State Street Bank, its custodian, whereby a portion of commissions paid on investment transactions may be rebated to the Fund. Such payments are included with realized gain (loss) on investment transactions. During the year ended October 31, 2012, the Fund did not receive any commission rebates.
(j) Federal and other taxes. It is the Fund’s policy to comply with the federal income and excise tax requirements of the Internal Revenue Code of 1986 (the “Code”), as amended, applicable to regulated investment companies. Accordingly, the Fund intends to distribute its taxable income and net realized gains, if any, to shareholders in accordance with timing requirements imposed by the Code. Therefore, no federal or state income tax provision is required in the Fund’s financial statements.
Management has analyzed the Fund’s tax positions taken on income tax returns for all open tax years and has concluded that as of October 31, 2012, no provision for income tax is required in the Fund’s financial statements. The Fund’s federal and state income and federal excise tax returns for tax years for which the applicable statutes of limitations have not expired are subject to examination by the Internal Revenue Service and state departments of revenue.
Under the applicable foreign tax laws, a withholding tax may be imposed on interest, dividends and capital gains at various rates.
(k) Reclassification. GAAP requires that certain components of net assets be reclassified to reflect permanent differences between financial and tax reporting. These reclassifications have no effect on net assets or net asset value per share. During the current year, the following reclassifications have been made:
| | | | | | | | | | | | |
| | | Accumulated Net
Investment Loss | | | Accumulated Net
Realized Loss | | | Paid-in
Capital | |
| (a) | | $ | 232,578 | | | | — | | | $ | (232,578) | |
| (b) | | | (18,277) | | | $ | 18,277 | | | | — | |
| (a) | Reclassifications are primarily due to a tax net operating loss. |
| (b) | Reclassifications are primarily due to foreign currency transactions treated as ordinary income for tax purposes. |
2. Investment advisory and management agreement and other transactions with affiliates
The Fund has an investment advisory and management agreement with Legg Mason Capital Management, LLC (“LMCM”). Pursuant to the agreement, LMCM provides the Fund with investment advisory, management and administrative services for which the Fund pays a fee, computed daily and payable monthly, at annual rates based on the Fund’s average daily net assets. The following chart shows the annual advisory fee rates for the Fund:
| | | | |
| Average Daily Net Assets | | Annual Rate | |
| First $1 billion | | | 0.700 | % |
| Next $1 billion | | | 0.680 | |
| Next $3 billion | | | 0.650 | |
| Next $5 billion | | | 0.620 | |
| Over $10 billion | | | 0.590 | |
| | |
| 30 | | Legg Mason Capital Management Global Growth Trust 2012 Annual Report |
Notes to financial statements (cont’d)
Legg Mason Partners Fund Advisor, LLC (“LMPFA”) provides certain administrative and oversight services to the Fund. For LMPFA’s services to the Fund, LMCM (not the Fund) pays LMPFA a fee, calculated daily and payable monthly, at an annual rate of 0.05% of the average daily net assets of the Fund. LMCM and LMPFA are wholly owned subsidiaries and corporate affiliates of Legg Mason, Inc. (“Legg Mason”).
As a result of expense limitation arrangements between the Fund and LMCM, the ratio of expenses, other than interest, brokerage commissions, dividend expense on short sales, taxes, extraordinary expenses and acquired fund fees and expenses, to average net assets of Class A, Class C, Class R, Class FI and Class I shares did not exceed 1.15%, 1.90%, 1.40%, 1.15% and 0.90%, respectively. These expense limitation arrangements cannot be terminated prior to December 31, 2014 without the Board of Trustees’ consent.
During the year ended October 31, 2012, fees waived and/or expenses reimbursed amounted to $192,275.
The investment manager is permitted to recapture amounts waived or reimbursed to a class within three years after the fiscal year in which the investment manager earned the fee or incurred the expense if the class’ total annual operating expenses have fallen to a level below the expense limitation (“expense cap”) in effect at the time the fees were earned or the expenses incurred. In no case will the investment manager recapture any amount that would result, on any particular business day of the Fund, in the class’ total annual operating expenses exceeding the expense cap or any other lower limit then in effect.
Pursuant to these arrangements, at October 31, 2012, the Fund had remaining fee waivers and/or expense reimbursements subject to recapture by LMCM and respective dates of expiration as follows:
| | | | | | | | | | | | | | | | | | | | |
| | | Class A | | | Class C | | | Class R | | | Class FI | | | Class I | |
| Expires October 31, 2013 | | $ | 3,735 | | | $ | 20,014 | | | $ | 1,139 | | | $ | 28,362 | | | | — | |
| Expires October 31, 2014 | | | 11,083 | | | | 118,992 | | | | 6,876 | | | | 8,619 | | | $ | 4,599 | |
| Expires October 31, 2015 | | | 11,228 | | | | 144,024 | | | | 4,306 | | | | 20,408 | | | | 12,309 | |
| Total fee waivers/expense reimbursements subject to recapture | | $ | 26,046 | | | $ | 283,030 | | | $ | 12,321 | | | $ | 57,389 | | | $ | 16,908 | |
During the year ended October 31, 2012, LMCM recaptured $831 for Class R shares.
Legg Mason Investor Services, LLC (“LMIS”), a wholly-owned broker-dealer subsidiary of Legg Mason, serves as the Fund’s sole and exclusive distributor.
There is a maximum initial sales charge of 5.75% for Class A shares. Class C shares have a 1.00% contingent deferred sales charge (“CDSC”), which applies if shares are redeemed within 12 months from purchase payment. In certain cases, Class A shares have a 1.00% CDSC, which applies if redemption occurs within 18 months from purchase payment (or within 12 months for shares purchased prior to August 1, 2012). This CDSC only applies to those purchases of Class A shares, which, when combined with current holdings of other shares of funds sold by LMIS, equal or exceed $1,000,000 in the aggregate. These purchases do not incur an initial sales charge.
| | | | |
| Legg Mason Capital Management Global Growth Trust 2012 Annual Report | | | 31 | |
For the year ended October 31, 2012, LMIS and its affiliates received sales charges of $682 on sales of the Fund’s Class A shares. In addition, for the year ended October 31, 2012, CDSCs paid to LMIS and its affiliates were:
| | | | | | | | |
| | | Class A | | | Class C | |
| CDSCs | | $ | 280 | | | $ | 3,167 | |
Under a Deferred Compensation Plan (the “Plan”), Trustees may elect to defer receipt of all or a specified portion of their compensation. A participating Trustee may select one or more funds managed by affiliates of Legg Mason in which his or her deferred trustee’s fees will be deemed to be invested. Deferred amounts remain in the Fund until distributed in accordance with the Plan.
All officers and one Trustee of the Trust are employees of Legg Mason or its affiliates and do not receive compensation from the Trust.
3. Investments
During the year ended October 31, 2012, the aggregate cost of purchases and proceeds from sales of investments (excluding short-term investments) were as follows:
| | | | |
| Purchases | | $ | 84,490,349 | |
| Sales | | | 130,407,172 | |
At October 31, 2012, the aggregate gross unrealized appreciation and depreciation of investments for federal income tax purposes were as follows:
| | | | |
| Gross unrealized appreciation | | $ | 33,830,724 | |
| Gross unrealized depreciation | | | (10,069,340) | |
| Net unrealized appreciation | | $ | 23,761,384 | |
4. Derivative instruments and hedging activities
Financial Accounting Standards Board Codification Topic 815 requires enhanced disclosure about an entity’s derivative and hedging activities.
During the year ended October 31, 2012, the Fund did not invest in any derivative instruments.
5. Class specific expenses, waivers and/or expense reimbursements
The Fund has adopted Rule 12b-1 distribution plans and under those plans the Fund pays a service fee with respect to its Class A, Class C, Class R, and Class FI shares calculated at the annual rate of 0.25% of the average daily net assets of each respective class. The Fund also pays a distribution fee with respect to its Class C and Class R shares calculated at the annual rate of 0.75% and 0.25% of the average daily net assets of each class, respectively. Service and distribution fees are accrued daily and paid monthly.
The Rule 12b-1 plans for Class R and Class FI shares of the Fund provide for payments of distribution and service fees to LMIS at an annual rate of up to 0.75% and 0.40% of each class’ average daily net assets, respectively, subject to the authority of
| | |
| 32 | | Legg Mason Capital Management Global Growth Trust 2012 Annual Report |
Notes to financial statements (cont’d)
the Board of Trustees to set a lower amount. The Board of Trustees has currently approved payments under the plans of 0.50% and 0.25% of the average daily net assets of Class R and Class FI shares, respectively.
For the year ended October 31, 2012, class specific expenses were as follows:
| | | | | | | | |
| | | Service and/or
Distribution Fees | | | Transfer Agent
Fees | |
| Class A | | $ | 25,132 | | | $ | 12,953 | |
| Class C | | | 1,264,547 | | | | 166,191 | |
| Class R | | | 6,900 | | | | 3,694 | |
| Class FI | | | 28,270 | | | | 22,360 | |
| Class I | | | — | | | | 15,476 | |
| Total | | $ | 1,324,849 | | | $ | 220,674 | |
For the year ended October 31, 2012, waivers and/or expense reimbursements by class were as follows:
| | | | |
| | | Waivers/Expense
Reimbursements | |
| Class A | | $ | 11,228 | |
| Class C | | | 144,024 | |
| Class R | | | 4,306 | |
| Class FI | | | 20,408 | |
| Class I | | | 12,309 | |
| Total | | $ | 192,275 | |
6. Shares of beneficial interest
At October 31, 2012, the Trust had an unlimited number of shares of beneficial interest authorized with a par value of $0.00001 per share. The Fund has the ability to issue multiple classes of shares. Each class of shares represents an identical interest and has the same rights, except that each class bears certain direct expenses, including those specifically related to the distribution of its shares. On February 29, 2012, the Fund was reorganized as a new series of the Trust.
Prior to February 29, 2012, the Fund was a series of a Maryland corporation and had 100,000,000 shares of capital stock authorized with a par value of $0.001 for each of Class A, Class C, Class FI and Class I and 500,000,000 shares of capital stock authorized with a par value of $0.001 for Class R.
Transactions in shares of each class were as follows:
| | | | | | | | | | | | | | | | |
| | | Year Ended
October 31, 2012 | | | Year Ended
October 31, 2011 | |
| | | Shares | | | Amount | | | Shares | | | Amount | |
| Class A | | | | | | | | | | | | | | | | |
| Shares sold | | | 24,213 | | | $ | 534,705 | | | | 106,855 | | | $ | 2,243,349 | |
| Shares repurchased | | | (147,338) | | | | (3,235,531) | | | | (208,164) | | | | (4,459,064) | |
| Net decrease | | | (123,125) | | | $ | (2,700,826) | | | | (101,309) | | | $ | (2,215,715) | |
| | | | |
| Legg Mason Capital Management Global Growth Trust 2012 Annual Report | | | 33 | |
| | | | | | | | | | | | | | | | |
| | | Year Ended
October 31, 2012 | | | Year Ended
October 31, 2011 | |
| | | Shares | | | Amount | | | Shares | | | Amount | |
| Class C | | | | | | | | | | | | | | | | |
| Shares sold | | | 172,040 | | | $ | 3,710,477 | | | | 293,561 | | | $ | 6,022,562 | |
| Shares repurchased | | | (1,939,411) | | | | (41,802,292) | | | | (2,834,918) | | | | (58,675,247) | |
| Net decrease | | | (1,767,371) | | | $ | (38,091,815) | | | | (2,541,357) | | | $ | (52,652,685) | |
| Class R | | | | | | | | | | | | | | | | |
| Shares sold | | | 6,941 | | | $ | 160,056 | | | | 21,439 | | | $ | 470,088 | |
| Shares repurchased | | | (8,120) | | | | (185,506) | | | | (11,966) | | | | (269,647) | |
| Net increase (decrease) | | | (1,179) | | | $ | (25,450) | | | | 9,473 | | | $ | 200,441 | |
| Class FI | | | | | | | | | | | | | | | | |
| Shares sold | | | 58,060 | | | $ | 1,343,248 | | | | 189,241 | | | $ | 4,218,359 | |
| Shares repurchased | | | (213,613) | | | | (4,884,265) | | | | (1,330,169) | | | | (28,107,945) | |
| Net decrease | | | (155,553) | | | $ | (3,541,017) | | | | (1,140,928) | | | $ | (23,889,586) | |
| Class I | | | | | | | | | | | | | | | | |
| Shares sold | | | 133,022 | | | $ | 3,153,735 | | | | 358,813 | | | $ | 8,053,519 | |
| Shares repurchased | | | (259,774) | | | | (6,127,620) | | | | (847,230) | | | | (18,855,160) | |
| Net decrease | | | (126,752) | | | $ | (2,973,885) | | | | (488,417) | | | $ | (10,801,641) | |
7. Income tax information and distributions to shareholders
The Fund did not make any distributions during the fiscal years ended October 31, 2012 and 2011.
As of October 31, 2012, the components of accumulated earnings (losses) on a tax basis were as follows:
| | | | |
| Capital loss carryforward* | | $ | (372,013,176) | |
| Other book/tax temporary differences(a) | | | (640,614) | |
| Unrealized appreciation (depreciation)(b) | | | 23,760,530 | |
| Total accumulated earnings (losses) — net | | $ | (348,893,260) | |
| * | During the taxable year ended October 31, 2012, the Fund utilized $13,025,160 of its capital loss carryforward available from prior years. As of October 31, 2012, the Fund had the following net capital loss carryforwards remaining: |
| | | | |
| Year of Expiration | | Amount | |
| 10/31/2016 | | $ | (201,308,686 | ) |
| 10/31/2017 | | | (170,704,490 | ) |
| | | $ | (372,013,176 | ) |
These amounts will be available to offset any future taxable capital gains.
| (a) | Other book/tax temporary differences are attributable primarily to the deferral of late year ordinary losses for tax purposes and book/tax differences in the timing of the deductibility of various expenses. |
| (b) | The difference between book-basis and tax-basis unrealized appreciation (depreciation) is attributable primarily to the tax deferral of losses on wash sales and book/tax differences in the treatment of distributions from partnerships. |
8. Line of credit
The Fund, along with certain other Legg Mason Funds, participates in a $200 million line of credit (“Credit Agreement”) to be used for temporary or emergency purposes. This 364-day revolving Credit Agreement matures on February 28, 2013.
| | |
| 34 | | Legg Mason Capital Management Global Growth Trust 2012 Annual Report |
Notes to financial statements (cont’d)
Pursuant to the Credit Agreement, each participating fund is liable only for principal and interest payments related to borrowings made by that fund. Borrowings under the Credit Agreement bear interest at a rate equal to the prevailing LIBOR rate plus the LIBOR rate margin. The Fund did not utilize the line of credit during the year ended October 31, 2012.
| | | | |
| Legg Mason Capital Management Global Growth Trust 2012 Annual Report | | | 35 | |
Report of independent registered public accounting firm
To the Board of Trustees of Legg Mason Global Asset Management Trust and Shareholders of Legg Mason Capital Management Global Growth Trust:
In our opinion, the accompanying statement of assets and liabilities, including the schedule of investments, and the related statements of operations and of changes in net assets and the financial highlights present fairly, in all material respects, the financial position of Legg Mason Capital Management Global Growth Trust (one of the funds comprising Legg Mason Global Asset Management Trust, the “Fund”) at October 31, 2012, the results of its operations, the changes in its net assets, and the financial highlights for the periods presented, in conformity with accounting principles generally accepted in the United States of America. These financial statements and financial highlights (hereafter referred to as “financial statements”) are the responsibility of the Fund’s management; our responsibility is to express an opinion on these financial statements based on our audits. We conducted our audits of these financial statements in accordance with the standards of the Public Company Accounting Oversight Board (United States). Those standards require that we plan and perform the audit to obtain reasonable assurance about whether the financial statements are free of material misstatement. An audit includes examining, on a test basis, evidence supporting the amounts and disclosures in the financial statements, assessing the accounting principles used and significant estimates made by management, and evaluating the overall financial statement presentation. We believe that our audits, which included confirmation of securities at October 31, 2012 by correspondence with the custodian and brokers, provide a reasonable basis for our opinion.
PricewaterhouseCoopers LLP
Baltimore, Maryland
December 19, 2012
| | |
| 36 | | Legg Mason Capital Management Global Growth Trust |
Additional information (unaudited)
Information about Trustees and Officers
The business and affairs of Legg Mason Capital Management Global Growth Trust (the “Fund”) are conducted by management under the supervision and subject to the direction of its Board of Trustees. The business address of each Trustee is 100 International Drive, Attn: Fund Secretary, Baltimore, Maryland 21202. Information pertaining to the Trustees and officers of the Fund is set forth below.
The Statement of Additional Information includes additional information about Trustees and is available, without charge, upon request by calling the Fund at 1-877-721-1926.
| | |
| Independent Trustees1 |
| Ruby P. Hearn |
| Year of birth | | 1940 |
| Position(s) with Trust | | Trustee |
| Term of office and length of time served2 | | Since 2004 |
| Principal occupation(s) during past five years | | Senior Vice President Emerita of The Robert Wood Johnson Foundation (non-profit) since 2001; Trustee of the New York Academy of Medicine since 2004; Director of the Institute for Healthcare Improvement since 2002; Member of the Institute of Medicine since 1982; formerly: Senior Vice President of The Robert Wood Johnson Foundation (1996 to 2001); Fellow of The Yale Corporation (1992 to 1998). |
| Number of funds in fund complex overseen by Trustee | | 14 |
| Other directorships held by Trustee during past five years | | None |
| Arnold L. Lehman |
| Year of birth | | 1944 |
| Position(s) with Trust | | Lead Independent Trustee |
| Term of office and length of time served2 | | Since 1998 |
| Principal occupation(s) during past five years | | Director of the Brooklyn Museum since 1997; Trustee of American Federation of Arts since 1998. Formerly: Director of The Baltimore Museum of Art (1979 to 1997). |
| Number of funds in fund complex overseen by Trustee | | 14 |
| Other directorships held by Trustee during past five years | | None |
| Robin J.W. Masters |
| Year of birth | | 1955 |
| Position(s) with Trust | | Trustee |
| Term of office and length of time served2 | | Since 2002 |
| Principal occupation(s) during past five years | | Retired; formerly: Chief Investment Officer of ACE Limited (insurance) (1986 to 2000). |
| Number of funds in fund complex overseen by Trustee | | 14 |
| Other directorships held by Trustee during past five years | | Director of Cheyne Capital International Limited (investment advisory firm). Formerly, Director/Trustee of Legg Mason Institutional Funds plc, WA Fixed Income Funds plc and Western Asset Debt Securities Fund plc. (2007 to 2011) |
| | | | |
| Legg Mason Capital Management Global Growth Trust | | | 37 | |
| | |
| Independent Trustees1 cont’d |
| Jill E. McGovern |
| Year of birth | | 1944 |
| Position(s) with Trust | | Trustee |
| Term of office and length of time served2 | | Since 1998 |
| Principal occupation(s) during past five years | | Senior Consultant, American Institute for Contemporary German Studies (AICGS) since 2007; formerly: Chief Executive Officer of The Marrow Foundation (non-profit) (1993 to 2007); Executive Director of the Baltimore International Festival (1991 to 1993); Senior Assistant to the President of The Johns Hopkins University (1986 to 1990). |
| Number of funds in fund complex overseen by Trustee | | 14 |
| Other directorships held by Trustee during past five years | | Director of International Biomedical Research Alliance; Director of Lois Roth Endowment |
| Arthur S. Mehlman |
| Year of birth | | 1942 |
| Position(s) with Trust | | Trustee |
| Term of office and length of time served2 | | Since 2002 |
| Principal occupation(s) during past five years | | Retired. Director, The University of Maryland Foundation since 1992; Director, The League for People with Disabilities since 2003; formerly: Partner, KPMG LLP (international accounting firm) (1972 to 2002). |
| Number of funds in fund complex overseen by Trustee | | Director/Trustee of all Legg Mason Funds consisting of 14 portfolios; Director/Trustee of the Royce Family of Funds consisting of 35 portfolios. |
| Other directorships held by Trustee during past five years | | Director of Municipal Mortgage & Equity, LLC. |
| G. Peter O’Brien |
| Year of birth | | 1945 |
| Position(s) with Trust | | Trustee |
| Term of office and length of time served2 | | Since 1999 |
| Principal occupation(s) during past five years | | Retired. Trustee Emeritus of Colgate University; Board Member, Hill House, Inc. (residential home care); Board Member, Bridges School (pre- school); formerly: Managing Director, Equity Capital Markets Group of Merrill Lynch & Co. (1971-1999). |
| Number of funds in fund complex overseen by Trustee | | Director/Trustee of all Legg Mason funds consisting of 14 portfolios; Director/Trustee of the Royce Family of Funds consisting of 35 portfolios. |
| Other directorships held by Trustee during past five years | | Director of Technology Investment Capital Corp. |
| | |
| 38 | | Legg Mason Capital Management Global Growth Trust |
Additional information (unaudited) (cont’d)
Information about Trustees and Officers
| | |
| Independent Trustees1 cont’d |
| S. Ford Rowan |
| Year of birth | | 1943 |
| Position(s) with Trust | | Trustee |
| Term of office and length of time served2 | | Since 2002 |
| Principal occupation(s) during past five years | | Chairman, National Center for Critical Incident Analysis, National Defense University Foundation, since 2004; Trustee, St. John’s College, since 2006; formerly: Consultant, Rowan & Blewitt Inc. (management consulting) (1984 to 2007); Lecturer in Journalism, Northwestern University (1980 to 1993); Lecturer in Organizational Sciences, George Washington University (2000 to 2008); Director, Sante Fe Institute (1999 to 2008). |
| Number of funds in fund complex overseen by Trustee | | 14 |
| Other directorships held by Trustee during past five years | | None |
| Robert M. Tarola |
| Year of birth | | 1950 |
| Position(s) with Trust | | Trustee |
| Term of office and length of time served2 | | Since 2004 |
| Principal occupation(s) during past five years | | President of Right Advisory LLC (corporate finance and governance consulting) since 2008; Member, Investor Advisory Group of the Public Company Accounting Oversight Board since 2009; Senior Vice President and Chief Financial Officer of The Howard University since 2010 (higher education and health care); formerly: Senior Vice President and Chief Financial Officer of W.R. Grace & Co. (specialty chemicals) (1999 to 2008) and MedStar Health, Inc. (healthcare) (1996 to 1999); Partner, Price Waterhouse, LLP (accounting and auditing) (1984 to 1996). |
| Number of funds in fund complex overseen by Trustee | | 14 |
| Other directorships held by Trustee during past five years | | Director of TeleTech Holdings, Inc. (business process outsourcing); Director of American Kidney Fund (renal disease assistance) |
| | | | |
| Legg Mason Capital Management Global Growth Trust | | | 39 | |
| | |
| Interested Trustee3 |
R. Jay Gerken Legg Mason 620 Eighth Avenue, New York NY 10018 | | |
| Year of birth | | 1951 |
| Position(s) with Trust | | Chairman, President and Trustee |
| Term of office and length of time served2 | | Since 2009 |
| Principal occupation(s) during past five years | | Managing Director of Legg Mason & Co., LLC (“Legg Mason & Co.”) (since 2005); Officer and Trustee/Director of 157 funds associated with Legg Mason Partners Fund Advisor, LLC (“LMPFA”) or its affiliates (since 2006) and Legg Mason & Co. predecessors (prior to 2006); President and Chief Executive Officer (“CEO”) of LMPFA (since 2006); President and CEO of Smith Barney Fund Management LLC (“SBFM”) (formerly a registered investment advisers) (since 2002) |
| Number of funds in fund complex overseen by Trustee | | 157 |
| Other directorships held by Trustee during past five years | | None |
| | |
| 40 | | Legg Mason Capital Management Global Growth Trust |
Additional information (unaudited) (cont’d)
Information about Trustees and Officers
| | |
| Executive Officers |
Richard F. Sennett Legg Mason 100 International Drive, Baltimore, MD 21202 | | |
| Year of birth | | 1970 |
| Position(s) with Trust | | Principal Financial Officer |
| Term of office and length of time served2 | | Since 2011 |
| Principal occupation(s) during past five years | | Principal Financial Officer of certain mutual funds associated with Legg Mason & Co. or its affiliates (since 2011); Managing Director of Legg Mason & Co. and Senior Manager of the Treasury Policy group for Legg Mason & Co.’s Global Fiduciary Platform (since 2011); formerly, Chief Accountant within the SEC’s Division of Investment Management (2007 to 2011); formerly, Assistant Chief Accountant within the SEC’s Division of Investment Management (2002 to 2007) |
Robert I. Frenkel Legg Mason 100 First Stamford Place, Stamford, CT 06902 | | |
| Year of birth | | 1954 |
| Position(s) with Trust | | Secretary and Chief Legal Officer |
| Term of office and length of time served2 | | Since 2009 |
| Principal occupation(s) during past five years | | Vice President and Deputy General Counsel of Legg Mason (since 2006); Managing Director and General Counsel of Global Mutual Funds for Legg Mason & Co. (since 2006) and Legg Mason & Co. predecessors (since 1994); Secretary and Chief Legal Officer of certain mutual funds associated with Legg Mason & Co. or its affiliates (since 2006) and Legg Mason & Co. predecessors (prior to 2006) |
Ted P. Becker Legg Mason 620 Eighth Avenue, New York, NY 10018 | | |
| Year of birth | | 1951 |
| Position(s) with Trust | | Vice President and Chief Compliance Officer |
| Term of office and length of time served2 | | Since 2007 |
| Principal occupation(s) during past five years | | Director of Global Compliance at Legg Mason (since 2006); Chief Compliance Officer of LMPFA (since 2006); Managing Director of Compliance of Legg Mason & Co. (since 2005); Chief Compliance Officer of certain mutual funds associated with Legg Mason & Co. or its affiliates (since 2006) and Legg Mason & Co. predecessors (prior to 2006) |
| | | | |
| Legg Mason Capital Management Global Growth Trust | | | 41 | |
| | |
| Executive Officers cont’d |
Christopher Berarducci Legg Mason 55 Water Street, New York, NY 10041 | | |
| Year of birth | | 1974 |
| Position(s) with Trust | | Treasurer |
| Term of office and length of time served2 | | Since 2010 |
| Principal occupation(s) during past five years | | Vice President of Legg Mason & Co. (since 2011); Treasurer of certain mutual funds associated with Legg Mason & Co. or its affiliates (since 2010); Assistant Controller of certain mutual funds associated with Legg Mason & Co. or its affiliates (prior to 2010); formerly, Manager of Fund Administration at UBS Global Asset Management (prior to 2007) |
| 1 | Trustees who are not “interested persons” of the Fund within the meaning of Section 2(a)(19) of the 1940 Act. Each of the Independent Trustees serves on the standing committees of the Board of Trustees, which include the Audit Committee (chair: Arthur S. Mehlman), the Nominating Committee (co-chairs: G. Peter O’Brien and Jill E. McGovern), and the Independent Trustees Committee (chair: Arnold L. Lehman). |
| 2 | Officers of the Fund are elected to serve until their successors are elected and qualified Trustees of the Fund serve a term of indefinite length until their retirement, in accordance with the Board’s retirement policy, resignation or removal, and stand for re-election by shareholders only as and when required by the 1940 Act. |
| 3 | Mr. Gerken is considered to be an interested person, as defined in the 1940 Act, of the Fund on the basis of his current employment with the Fund’s investment adviser or its affiliated entities (including the Fund’s principal underwriter) and Legg Mason, Inc., the parent holding company of these entities as well as his ownership of Legg Mason, Inc. stock. |
Legg Mason Capital Management
Global Growth Trust
Trustees
R. Jay Gerken
Chairman
Ruby P. Hearn
Arnold L. Lehman
Robin J.W. Masters
Jill E. McGovern
Arthur S. Mehlman
G. Peter O’Brien
S. Ford Rowan
Robert M. Tarola
Investment manager/adviser
Legg Mason Capital Management, LLC
Distributor
Legg Mason Investor Services, LLC
Custodian
State Street Bank & Trust Company
Transfer agent
Boston Financial Data Services, Inc.
2000 Crown Colony Drive
Quincy, MA 02169
Independent registered public accounting firm
PricewaterhouseCoopers LLP
Baltimore, MD
Legg Mason Capital Management Global Growth Trust
The Fund is a separate investment series of Legg Mason Global Asset Management Trust, a Maryland statutory trust.
Legg Mason Capital Management Global Growth Trust
Legg Mason Funds
55 Water Street
New York, NY 10041
The Fund files its complete schedule of portfolio holdings with the Securities and Exchange Commission (“SEC”) for the first and third quarters of each fiscal year on Form N-Q. The Fund’s Forms N-Q are available on the SEC’s website at www.sec.gov. The Fund’s Forms N-Q may be reviewed and copied at the SEC’s Public Reference Room in Washington, D.C., and information on the operation of the Public Reference Room may be obtained by calling 1-800-SEC-0330. To obtain information on Form N-Q, shareholders can call the Fund at 1-877-721-1926.
Information on how the Fund voted proxies relating to portfolio securities during the prior 12-month period ended June 30th of each year and a description of the policies and procedures that the Fund uses to determine how to vote proxies related to portfolio transactions are available (1) without charge, upon request, by calling the Fund at 1-877-721-1926, (2) on the Fund’s website at www.leggmason.com/individualinvestors and (3) on the SEC’s website at www.sec.gov.
This report is submitted for the general information of the shareholders of Legg Mason Capital Management Global Growth Trust. This report is not authorized for distribution to prospective investors in the Fund unless preceded or accompanied by a current prospectus.
Investors should consider the Fund’s investment objectives, risks, charges and expenses carefully before investing. The prospectus contains this and other important information about the Fund. Please read the prospectus carefully before investing.
www.leggmason.com/individualinvestors
©2012 Legg Mason Investor Services, LLC
Member FINRA, SIPC
Legg Mason Funds Privacy and Security Notice
Your Privacy and the Security of Your Personal Information is Very Important to the Legg Mason Funds
This Privacy and Security Notice (the “Privacy Notice”) addresses the Legg Mason Funds’ privacy and data protection practices with respect to nonpublic personal information the Funds receive. The Legg Mason Funds include any funds sold by the Funds’ distributor, Legg Mason Investor Services, LLC, as well as Legg Mason-sponsored closed-end funds and certain closed-end funds managed or sub-advised by Legg Mason or its affiliates. The provisions of this Privacy Notice apply to your information both while you are a shareholder and after you are no longer invested with the Funds.
The Type of Nonpublic Personal Information the Funds Collect About You
The Funds collect and maintain nonpublic personal information about you in connection with your shareholder account. Such information may include, but is not limited to:
| Ÿ | | Personal information included on applications or other forms; |
| Ÿ | | Account balances, transactions, and mutual fund holdings and positions; |
| Ÿ | | Online account access user IDs, passwords, security challenge question responses; and |
| Ÿ | | Information received from consumer reporting agencies regarding credit history and creditworthiness (such as the amount of an individual’s total debt, payment history, etc.). |
How the Funds Use Nonpublic Personal Information About You
The Funds do not sell or share your nonpublic personal information with third parties or with affiliates for their marketing purposes, or with other financial institutions or affiliates for joint marketing purposes, unless you have authorized the Funds to do so. The Funds do not disclose any nonpublic personal information about you except as may be required to perform transactions or services you have authorized or as permitted or required by law. The Funds may disclose information about you to:
| Ÿ | | Employees, agents, and affiliates on a “need to know” basis to enable the Funds to conduct ordinary business or comply with obligations to government regulators; |
| Ÿ | | Service providers, including the Funds’ affiliates, who assist the Funds as part of the ordinary course of business (such as printing, mailing services, or processing or servicing your account with us) or otherwise perform services on the Funds’ behalf, including companies that may perform marketing services solely for the Funds; |
| Ÿ | | The Funds’ representatives such as legal counsel, accountants and auditors; and |
| Ÿ | | Fiduciaries or representatives acting on your behalf, such as an IRA custodian or trustee of a grantor trust. |
|
| NOT PART OF THE ANNUAL REPORT |
Legg Mason Funds Privacy and Security Notice (cont’d)
Except as otherwise permitted by applicable law, companies acting on the Funds’ behalf are contractually obligated to keep nonpublic personal information the Funds provide to them confidential and to use the information the Funds share only to provide the services the Funds ask them to perform.
The Funds may disclose nonpublic personal information about you when necessary to enforce their rights or protect against fraud, or as permitted or required by applicable law, such as in connection with a law enforcement or regulatory request, subpoena, or similar legal process. In the event of a corporate action or in the event a Fund service provider changes, the Funds may be required to disclose your nonpublic personal information to third parties. While it is the Funds’ practice to obtain protections for disclosed information in these types of transactions, the Funds cannot guarantee their privacy policy will remain unchanged.
Keeping You Informed of the Funds’ Privacy and Security Practices
The Funds will notify you annually of their privacy policy as required by federal law. While the Funds reserve the right to modify this policy at any time they will notify you promptly if this privacy policy changes.
The Funds’ Security Practices
The Funds maintain appropriate physical, electronic and procedural safeguards designed to guard your nonpublic personal information. The Funds’ internal data security policies restrict access to your nonpublic personal information to authorized employees, who may use your nonpublic personal information for Fund business purposes only.
Although the Funds strive to protect your nonpublic personal information, they cannot ensure or warrant the security of any information you provide or transmit to them, and you do so at your own risk. In the event of a breach of the confidentiality or security of your nonpublic personal information, the Funds will attempt to notify you as necessary so you can take appropriate protective steps. If you have consented to the Funds using electronic communications or electronic delivery of statements, they may notify you under such circumstances using the most current email address you have on record with them.
In order for the Funds to provide effective service to you, keeping your account information accurate is very important. If you believe that your account information is incomplete, not accurate or not current, or if you have questions about the Funds’ privacy practices, write the Funds using the contact information on your account statements, email the Funds by clicking on the Contact Us section of the Funds’ website at www.leggmason.com, or contact the Fund at
1-877-721-1926.
Revised April 2011
|
| NOT PART OF THE ANNUAL REPORT |
www.leggmason.com/individualinvestors
©2012 Legg Mason Investor Services, LLC Member FINRA, SIPC
LMF-222/A 12/12 SR12-1807
The registrant has adopted a code of ethics that applies to the registrant’s principal executive officer, principal financial officer, principal accounting officer or controller.
| ITEM 3. | AUDIT COMMITTEE FINANCIAL EXPERT. |
The Board of Trustees of the registrant has determined that Arthur S. Mehlman the Chairman of the Board’s Audit Committee and Robert M. Tarola, possess the technical attributes identified in Instruction 2(b) of Item 3 to Form N-CSR to qualify as “audit committee financial experts,” and have designated Mr. Mehlman and Mr. Tarola as the Audit Committee’s financial experts. Mr. Mehlman and Mr. Tarola are “independent” Trustees pursuant to paragraph (a) (2) of Item 3 to Form N-CSR.
| ITEM 4. | PRINCIPAL ACCOUNTANT FEES AND SERVICES. |
a) Audit Fees. The aggregate fees billed in the last two fiscal years ending October 31, 2011 and October 31, 2012 (the “Reporting Periods”) for professional services rendered by the Registrant’s principal accountant (the “Auditor”) for the audit of the Registrant’s annual financial statements, or services that are normally provided by the Auditor in connection with the statutory and regulatory filings or engagements for the Reporting Periods, were $32,648 in 2011 and $195,925 in 2012.
b) Audit-Related Fees. The aggregate fees billed in the Reporting Period for assurance and related services by the Auditor that are reasonably related to the performance of the Registrant’s financial statements were $5,150 in 2011 and $4,250 in 2012. These services consisted of procedures performed in connection with the Re-domiciliation of the various reviews of Prospectus supplements, and consent issuances related to the N-1A filings for the Legg Mason Global Asset Management Trust.
In addition, there were no Audit-Related Fees billed in the Reporting Period for assurance and related services by the Auditor to the Registrant’s investment adviser (not including any sub-adviser whose role is primarily portfolio management and is subcontracted with or overseen by another investment adviser), and any entity controlling, controlled by or under common control with the investment adviser that provides ongoing services to the Legg Mason Global Asset Management Trust (“service affiliates”), that were reasonably related to the performance of the annual audit of the service affiliates. Accordingly, there were no such fees that required pre-approval by the Audit Committee for the Reporting Periods.
(c) Tax Fees. The aggregate fees billed in the Reporting Periods for professional services rendered by the Auditor for tax compliance, tax advice and tax planning (“Tax Services”) were $5,000 in 2011 and $19,500 in 2012. These services consisted of (i) review or preparation of U.S. federal, state, local and excise tax returns; (ii) U.S. federal, state and local tax planning, advice and assistance regarding statutory, regulatory or administrative developments, and (iii) tax advice regarding tax qualification matters and/or treatment of various financial instruments held or proposed to be acquired or held.
There were no fees billed for tax services by the Auditors to service affiliates during the Reporting Periods that required pre-approval by the Audit Committee.
d) All Other Fees. The aggregate fees for other fees billed in the Reporting Periods for products and services provided by the Auditor were $0 in 2011 and $2,645 in 2012, other than the services reported in paragraphs (a) through (c) of this Item for the Legg Mason Global Asset Management Trust.
All Other Fees. There were no other non-audit services rendered by the Auditor to Legg Mason Partners Fund Advisors, LLC (“LMPFA”), and any entity controlling, controlled by or under common control with LMPFA that provided ongoing services to Legg Mason Global Asset Management Trust requiring pre-approval by the Audit Committee in the Reporting Period.
(e) Audit Committee’s pre–approval policies and procedures described in paragraph (c) (7) of Rule 2-01 of Regulation S-X.
(1) The Charter for the Audit Committee (the “Committee”) of the Board of each registered investment company (the “Fund”) advised by LMPFA or one of their affiliates (each, an “Adviser”) requires that the Committee shall approve (a) all audit and permissible non-audit services to be provided to the Fund and (b) all permissible non-audit services to be provided by the Fund’s independent auditors to the Adviser and any Covered Service Providers if the engagement relates directly to the operations and financial reporting of the Fund. The Committee may implement policies and procedures by which such services are approved other than by the full Committee.
The Committee shall not approve non-audit services that the Committee believes may impair the independence of the auditors. As of the date of the approval of this Audit Committee Charter, permissible non-audit services include any professional services (including tax services), that are not prohibited services as described below, provided to the Fund by the independent auditors, other than those provided to the Fund in connection with an audit or a review of the financial statements of the Fund. Permissible non-audit services may not include: (i) bookkeeping or other services related to the accounting records or financial statements of the Fund; (ii) financial information systems design and implementation; (iii) appraisal or valuation services, fairness opinions or contribution-in-kind reports; (iv) actuarial services; (v) internal audit outsourcing services; (vi) management functions or human resources; (vii) broker or dealer, investment adviser or investment banking services; (viii) legal services and expert services unrelated to the audit; and (ix) any other service the Public Company Accounting Oversight Board determines, by regulation, is impermissible.
Pre-approval by the Committee of any permissible non-audit services is not required so long as: (i) the aggregate amount of all such permissible non-audit services provided to the Fund, the Adviser and any service providers controlling, controlled by or under common control with the Adviser that provide ongoing services to the Fund (“Covered Service Providers”) constitutes not more than 5% of the total amount of revenues paid to the independent auditors during the fiscal year in which the permissible non-audit services are provided to (a) the Fund, (b) the Adviser and (c) any entity controlling, controlled by or under common control with the Adviser that provides ongoing services to the Fund during the fiscal year in which the services are provided that would have to be approved by the Committee; (ii) the permissible non-audit services were not recognized by the Fund at the time of the engagement to be non-audit services; and (iii) such services are promptly brought to the attention of the Committee and approved by the Committee (or its delegate(s)) prior to the completion of the audit.
(2) For the Legg Mason Global Asset Management Trust, the percentage of fees that were approved by the audit committee, with respect to: Audit-Related Fees were 100% and 100% for 2011 and 2012; Tax Fees were 100% and 100% for 2011 and 2012; and Other Fees were 100% and 100% for 2011 and 2012.
(f) N/A
(g) Non-audit fees billed by the Auditor for services rendered to Legg Mason Global Asset Management Trust, LMPFA and any entity controlling, controlled by, or under common control with LMPFA that provides ongoing services to Legg Mason Global Asset Management Trust during the reporting period were $0 in 2012.
(h) Yes. Legg Mason Global Asset Management Trust’s Audit Committee has considered whether the provision of non-audit services that were rendered to Service Affiliates, which were not pre-approved (not requiring pre-approval), is compatible with maintaining the Accountant’s independence. All services provided by the Auditor to the Legg Mason Global Asset Management Trust or to Service Affiliates, which were required to be pre-approved, were pre-approved as required.
| ITEM 5. | AUDIT COMMITTEE OF LISTED REGISTRANTS. |
| | a) | The independent board members are acting as the registrant’s audit committee as specified in Section 3(a)(58)(B) of the Exchange Act .The Audit Committee consists of the following Board members: |
Ruby P. Hearn
Arnold L. Lehman
Robin J.W. Masters
Jill E. McGovern
Arthur S. Mehlman
G. Peter O’Brien
S. Ford Rowan
Robert M. Tarola
| ITEM 6. | SCHEDULE OF INVESTMENTS. |
Included herein under Item 1.
| ITEM 7. | DISCLOSURE OF PROXY VOTING POLICIES AND PROCEDURES FOR CLOSED-END MANAGEMENT INVESTMENT COMPANIES. |
Not applicable.
| ITEM 8. | PORTFOLIO MANAGERS OF CLOSED-END MANAGEMENT INVESTMENT COMPANIES. |
Not applicable.
| ITEM 9. | PURCHASES OF EQUITY SECURITIES BY CLOSED-END MANAGEMENT INVESTMENT COMPANY AND AFFILIATED PURCHASERS. |
Not applicable.
| ITEM 10. | SUBMISSION OF MATTERS TO A VOTE OF SECURITY HOLDERS. |
Not applicable.
| ITEM 11. | CONTROLS AND PROCEDURES. |
| | (a) | The registrant’s principal executive officer and principal financial officer have concluded that the registrant’s disclosure controls and procedures (as defined in Rule 30a- 3(c) under the Investment Company Act of 1940, as amended (the “1940 Act”)) are effective as of a date within 90 days of the filing date of this report that includes the disclosure required by this paragraph, based on their evaluation of the disclosure controls and procedures required by Rule 30a-3(b) under the 1940 Act and 15d-15(b) under the Securities Exchange Act of 1934. |
| | (b) | There were no changes in the registrant’s internal control over financial reporting (as defined in Rule 30a-3(d) under the 1940 Act) that occurred during the second fiscal quarter of the period covered by this report that have materially affected, or are likely to materially affect the registrant’s internal control over financial reporting. |
(a) (1) Code of Ethics attached hereto.
Exhibit 99.CODE ETH
(a) (2) Certifications pursuant to section 302 of the Sarbanes-Oxley Act of 2002 attached hereto.
Exhibit 99.CERT
(b) Certifications pursuant to Section 906 of the Sarbanes-Oxley Act of 2002 attached hereto.
Exhibit 99.906CERT
SIGNATURES
Pursuant to the requirements of the Securities Exchange Act of 1934 and the Investment Company Act of 1940, the registrant has duly caused this Report to be signed on its behalf by the undersigned, there unto duly authorized.
Legg Mason Global Asset Management Trust
| | |
| By: | | /S/ R. JAY GERKEN |
| | R. Jay Gerken |
| | Chairman and President |
| | Legg Mason Global Asset Management Trust |
| |
| Date: | | December 27, 2012 |
Pursuant to the requirements of the Securities Exchange Act of 1934 and the Investment Company Act of 1940, this report has been signed below by the following persons on behalf of the registrant and in the capacities and on the dates indicated.
| | |
| By: | | /S/ R. JAY GERKEN |
| | R. Jay Gerken |
| | Chairman and President |
| | Legg Mason Global Asset Management Trust |
| |
| Date: | | December 27, 2012 |
| |
| By: | | /S/ RICHARD F. SENNETT |
| | (Richard F. Sennett) |
| | Principal Financial Officer of |
| | Legg Mason Global Asset Management Trust |
| |
| Date: | | December 27, 2012 |