UNITED STATES
SECURITIES AND EXCHANGE COMMISSION
Washington, D.C. 20549
FORM N-CSR
CERTIFIED SHAREHOLDER REPORT OF REGISTERED
MANAGEMENT INVESTMENT COMPANIES
Investment Company Act file number 811-22338
Legg Mason Global Asset Management Trust
(Exact name of registrant as specified in charter)
620 Eighth Avenue,
49th Floor, New York, NY 10018
(Address of principal executive offices) (Zip code)
Robert I. Frenkel, Esq.
Legg Mason & Co., LLC
100 First Stamford Place
Stamford, CT 06902
(Name and address of agent for service)
Registrant’s telephone number, including area code: 1-877-721-1926
Date of fiscal year end: December 31
Date of reporting period: December 31, 2012
| ITEM 1. | REPORT TO STOCKHOLDERS. |
The Annual Report to Stockholders is filed herewith.
December 31, 2012

Annual
Repor t
Legg Mason
Batterymarch
International
Equity Trust
INVESTMENT PRODUCTS: NOT FDIC INSURED • NO BANK GUARANTEE • MAY LOSE VALUE
| | |
| II | | Legg Mason Batterymarch International Equity Trust |
Fund objective
The Fund seeks maximum long-term total return.
Letter from the chairman

Dear Shareholder,
We are pleased to provide the annual report of Legg Mason Batterymarch International Equity Trust for the twelve-month reporting period ended December 31, 2012. Please read on for a detailed look at prevailing economic and market conditions during the Fund’s reporting period and to learn how those conditions have affected Fund performance.
Special shareholder notice
At the Board of Trustees of Legg Mason Global Asset Management Trust’s regular meeting held in February 2013, Western Asset Management Company was appointed as a subadviser of the Fund solely for the management of cash and short-term instruments.
As always, we remain committed to providing you with excellent service and a full spectrum of investment choices. We also remain committed to supplementing the support you receive from your financial advisor. One way we accomplish this is through our website, www.leggmason.com/individualinvestors. Here you can gain immediate access to market and investment information, including:
| Ÿ | | Fund prices and performance, |
| Ÿ | | Market insights and commentaries from our portfolio managers, and |
| Ÿ | | A host of educational resources. |
We look forward to helping you meet your financial goals.
Sincerely,

R. Jay Gerken, CFA
Chairman and President
February 8, 2013
| | | | |
| Legg Mason Batterymarch International Equity Trust | | | III | |
Investment commentary
Economic review
The U.S. economy continued to grow over the twelve months ended December 31, 2012, but it did so at an uneven pace. U.S. gross domestic product (“GDP”)i growth, as reported by the U.S. Department of Commerce, was 2.0% in the first quarter of 2012. The economy then slowed in the second quarter, as GDP growth was a tepid 1.3%. Economic growth accelerated to 3.1% in the third quarter, partially due to increased private inventory investment, higher federal government spending and moderating imports. However, this was a temporary uptick, as the Commerce Department’s initial estimate showed that fourth quarter GDP contracted 0.1%. This was the first negative reading since the second quarter of 2009, and was driven by a reversal of the above factors, as private inventory investment and federal government spending weakened.
While there was some improvement in the U.S. job market, unemployment remained elevated throughout the reporting period. When the period began, unemployment, as reported by the U.S. Department of Labor, was 8.3%. Unemployment then generally declined and was 7.8% in September 2012, the lowest rate since January 2009, but still high by historical standards. The unemployment rate then rose to 7.9% in October, before falling to 7.8% in November, where it remained in December. The number of longer-term unemployed continued to be a headwind for the economy, as roughly 39% of the 12.2 million people without a job have been out of work for more than six months.
Meanwhile, the housing market brightened, as sales generally improved and home prices continued to rebound. According to the National Association of Realtors (“NAR”), while existing-home sales dipped 1.0% on a seasonally adjusted basis in December 2012 versus the previous month, they were still 12.8% higher than in December 2011. In addition, the NAR reported that the median existing-home price for all housing types was $180,800 in December 2012, up 11.5% from December 2011. This marked the tenth consecutive month that home prices rose compared to the same period a year earlier. Furthermore, the inventory of homes available for sale fell 8.5% in December, which represents a 4.4 month supply at the current sales pace. This represents the lowest inventory since May 2005.
The manufacturing sector expanded during much of the reporting period, although it experienced several soft patches. Based on the Institute for Supply Management’s PMI (“PMI”)ii, after expanding 34 consecutive months, the PMI fell to 49.7 in June 2012, which represented the first contraction in the manufacturing sector since July 2009 (a reading below 50 indicates a contraction, whereas a reading above 50 indicates an expansion). Manufacturing continued to contract in July and August before ticking up to 51.5 in September and 51.7 in October. The PMI fell back to contraction territory with a reading of 49.5 in November, its lowest level since July 2009. However, manufacturing again expanded in December, with the PMI increasing to 50.7.
Growth generally moderated overseas and, in some cases, fell back into a recession. But in its January 2013 World Economic Outlook Update, after the reporting period ended, the International Monetary Fund (“IMF”) stated that “Global growth is projected to increase during 2013, as the factors underlying soft global activity are expected to subside. However, this upturn is projected to be more gradual than in the October 2012 World Economic Outlook projections.” The IMF projects that global growth will increase from 3.2% in 2012 to 3.5% in 2013. From a regional perspective, the IMF anticipates 2013 growth will be -0.2% in the Eurozone. Growth in emerging market countries is expected to remain
| | |
| IV | | Legg Mason Batterymarch International Equity Trust |
Investment commentary (cont’d)
higher than in their developed country counterparts, and the IMF projects that emerging market growth will increase from 5.1% in 2012 to 5.5% in 2013. In particular, China’s economy is expected to grow 8.2% in 2013, versus 7.8% in 2012. Elsewhere, the IMF projects that growth in India will increase from 4.5% in 2012 to 5.9% in 2013.
The Federal Reserve Board (“Fed”)iii took a number of actions as it sought to meet its dual mandate of fostering maximum employment and price stability. As has been the case since December 2008, the Fed kept the federal funds rateiv at a historically low range between zero and 0.25%. In January 2012, the Fed extended the period it expects to keep rates on hold until at least through late 2014. At its June 2012 meeting, the Fed announced that it would continue its program of purchasing longer-term Treasury securities and selling an equal amount of shorter-term Treasury securities (often referred to as “Operation Twist”) until the end of 2012. In September, the Fed announced a third round of quantitative easing (“QE3”), which involves purchasing $40 billion each month of agency mortgage-backed securities on an open-end basis. In addition, the Fed further extended the duration that it expects to keep the federal funds rate on hold, until at least mid-2015. Finally, at its meeting in December, the Fed announced that it would continue purchasing $40 billion per month of agency mortgage-backed securities, as well as initially purchasing $45 billion a month of longer-term Treasuries. The Fed also said that it would keep the federal funds rate on hold “…as long as the unemployment rate remains above 6.5%, inflation between one and two years ahead is projected to be no more than a half percentage point above the Committee’s 2.0% longer-run goal, and longer-term inflation expectations continue to be well anchored.”
Given the economic challenges in the Eurozone, the European Central Bank (“ECB”)v lowered interest rates from 1.50% to 1.25% in November 2011 and to 1.00% the following month. In July 2012, the ECB cut rates from 1.00% to 0.75%, a record low. In September the ECB introduced its Outright Monetary Transactions program (“OMT”). With the OMT, the ECB can purchase an unlimited amount of bonds that are issued by troubled Eurozone countries, provided the countries formally ask to participate in the program and agree to certain conditions. In other developed countries, the Bank of England kept rates on hold at 0.50% during the reporting period, as did Japan at a range of zero to 0.10%, its lowest level since 2006. In September, the Bank of Japan announced that it would increase its asset-purchase program and extend its duration by six months until the end of 2013. Elsewhere, with growth rates declining, both China and India lowered their cash reserve ratio for banks. China also cut its key interest rate in early June and again in July.
As always, thank you for your confidence in our stewardship of your assets.
Sincerely,
R. Jay Gerken, CFA
Chairman and President
January 31, 2013
All investments are subject to risk including the possible loss of principal. Past performance is no guarantee of future results. Forecasts and predictions are inherently limited and should not be relied upon as an indication of actual or future performance.
| | | | |
| Legg Mason Batterymarch International Equity Trust | | | V | |
| i | Gross domestic product (“GDP”) is the market value of all final goods and services produced within a country in a given period of time. |
| ii | The Institute for Supply Management’s PMI is based on a survey of purchasing executives who buy the raw materials for manufacturing at more than 350 companies. It offers an early reading on the health of the manufacturing sector. |
| iii | The Federal Reserve Board (“Fed”) is responsible for the formulation of policies designed to promote economic growth, full employment, stable prices and a sustainable pattern of international trade and payments. |
| iv | The federal funds rate is the rate charged by one depository institution on an overnight sale of immediately available funds (balances at the Federal Reserve) to another depository institution; the rate may vary from depository institution to depository institution and from day to day. |
| v | The European Central Bank (“ECB”) is responsible for the monetary system of the European Union and the euro currency. |
(This page intentionally left blank.)
| | | | |
| Legg Mason Batterymarch International Equity Trust 2012 Annual Report | | | 1 | |
Fund overview
Q. What is the Fund’s investment strategy?
A. The Fund’s investment objective is maximum long-term total return. We, at Batterymarch Financial Management, Inc. (“Batterymarch”), the Fund’s adviser, currently intend to invest substantially all of the Fund’s assets in non-U.S. equity securities. Our primary focus is value added through stock selection, with a secondary focus on region and sector allocation.
Batterymarch’s stock selection process for the developed market portion of the Fund’s portfolio uses a quantitative bottom-up approach to assess the relative attractiveness of stocks from multiple perspectives based primarily on their underlying fundamentals. Our bottom-up strategy incorporates rigorous stock selection, risk control procedures and cost-efficient trading. Using a proprietary stock selection model, we objectively analyze on a daily basis the relative attractiveness of a broad universe of stocks with a historical record of liquidity across dimensions traditionally followed by fundamental investors. The result is a comprehensive relative ranking of all investable stocks, which we use to dynamically construct and trade the portfolio. Region and sector allocations are based on rankings generated by our proprietary region and sector models. The three largest regions are Europe (excluding the U.K.), the U.K. and Japan.
The Fund may invest up to 35% of its total assets in securities of emerging market issuers. Our investment strategy for the emerging markets portion of the Fund represents a distinctive combination of tested quantitative methodology and traditional fundamental analysis. The emerging markets allocation focuses on higher quality dominant companies that we believe have strong growth prospects and reasonable valuations.
The Fund’s investment portfolio will normally be diversified across a broad range of regions and industry sectors, consistent with the objective of maximum total return while managing risk. We may also seek to enhance portfolio returns through active currency hedging strategies and may invest in derivative instruments to do so.
The Fund is not limited in the amount of its total assets that may be denominated in a single currency or invested in securities of issuers located in a single country. The Fund may invest in debt securities to a limited extent.
Q. What were the overall market conditions during the Fund’s reporting period?
A. During the first quarter of 2012, investors shed some of the battle scars from the turmoil of 2011 and became more optimistic about the state of the economy. Indeed, reasons for optimism abounded: the Greek default appeared orderly; the European Central Bank (“ECB”)i continued its Long Term Refinancing Operations (“LTRO”) program; and several key U.S. economic indicators improved.
None-the-less, by the start of the second quarter many drivers of global growth appeared to slow. Investors became deeply worried about the global economy as a number of European markets slipped into recession. A driving concern for many investors was whether policy makers in Europe and the U.S. would continue to support favorable growth policies. Investors shunned risky assets in favor of safer havens.
Equity markets became modestly positive in early June and markets continued to rise through month-end supported by a series of favorable policy moves around the globe, starting with a Chinese interest rate cut on June 7, 2012, and followed by a European agreement to shore up Spanish banks; Greek election results favoring austerity and continued Eurozone participation; and concluding with the decision
| | |
| 2 | | Legg Mason Batterymarch International Equity Trust 2012 Annual Report |
Fund overview (cont’d)
by European leaders on June 29, 2012, to separate bank and sovereign financing. Equity markets ended the second calendar quarter with euphoria on the last trading day.
The flood of policy moves that started at the end of the second quarter extended into the third quarter as central banks from around the world sought to support flagging economic growth through favorable monetary policies. The quarter began with the ECB’s president Mario Draghi’s speech outlining the Bank’s clear intention of continued support for the Eurozone. By the end of the period, a number of central banks had announced favorable policy moves to combat what seemed to be stagnating global growth. While the rally lost steam after the U.S. was hit by super-storm Sandy and markets declined in the days following the U.S. presidential election, later in November investors embraced risk, and ended the year with a deep value rally.
Of the major regions, continental Europe was the best performing for the year, led by Consumer Discretionary and Financials stocks. Japan lagged the benchmark despite strong returns in Financials stocks there as well, drawn down by Utilities and Materials. Singapore and Hong Kong outperformed, as did the commodity — sensitive Australia, New Zealand & Canada regions.
Q. How did we respond to these changing market conditions?
A. We believe that fundamentals, the very basis of our investment process, will continue to be the primary driver of long-term returns. As a result, we continue to adhere to our investment philosophy while enhancing our process to address sustainable market shifts.
Much of our research over the past several years has been focused on developing tools to help us navigate extreme market environments. As a result of this research, we’ve made several enhancements to our process including the addition of monitoring tools to identify risk in our stock selection models, particularly with regards to factor selection, as well as macro-level tools to identify regimes that are more favorable/unfavorable toward certain factor strategies. These tools allow us to follow our historical bottom-up stock ranking methodology, but also to identify extremes so we can step in to intervene if necessary.
Performance review
For the twelve months ended December 31, 2012, Class C shares of Legg Mason Batterymarch International Equity Trust, excluding sales charges, returned 12.52%. The Fund’s unmanaged benchmark, the MSCI EAFE Indexii, returned 17.32% for the same period. The Lipper International Multi-Cap Core Funds Category Average1 returned 17.37% over the same time frame.
| 1 | Lipper, Inc., a wholly-owned subsidiary of Reuters, provides independent insight on global collective investments. Returns are based on the twelve-month period ended December 31, 2012, including the reinvestment of all distributions, including returns of capital, if any, calculated among the 322 funds in the Fund’s Lipper category, and excluding sales charges. |
| | | | |
| Legg Mason Batterymarch International Equity Trust 2012 Annual Report | | | 3 | |
| | | | | | | | |
Performance Snapshot as of December 31, 2012
(unaudited) | |
| (excluding sales charges) | | 6 months | | | 12 months | |
Legg Mason Batterymarch
International Equity Trust: | |
Class A | | | 11.72 | % | | | 13.23 | % |
Class C | | | 11.33 | % | | | 12.52 | % |
Class FI | | | 11.70 | % | | | 13.26 | % |
Class R | | | 11.60 | % | | | 13.06 | % |
Class I | | | 12.04 | % | | | 13.70 | % |
Class IS | | | 11.92 | % | | | 13.68 | % |
| MSCI EAFE Index | | | 13.95 | % | | | 17.32 | % |
| Lipper International Multi-Cap Core Funds Category Average1 | | | 13.31 | % | | | 17.37 | % |
The performance shown represents past performance. Past performance is no guarantee of future results and current performance may be higher or lower than the performance shown above. Principal value and investment returns will fluctuate and investors’ shares, when redeemed, may be worth more or less than their original cost. To obtain performance data current to the most recent month-end, please visit our website at www.leggmason.com/individualinvestors.
All share class returns assume the reinvestment of all distributions at net asset value and the deduction of all Fund expenses. Returns have not been adjusted to include sales charges that may apply or the deduction of taxes that a shareholder would pay on Fund distributions. If sales charges were reflected, the performance quoted would be lower. Performance figures for periods shorter than one year represent cumulative figures and are not annualized.
Fund performance figures reflect fee waivers and/or expense reimbursements, without which the performance would have been lower.
| | | | |
| Total Annual Operating Expenses (unaudited) |
As of the Fund’s current prospectus dated May 1, 2012, the gross total annual operating expense ratios for Class A, Class C, Class FI, Class R, Class I and Class IS shares were 1.34%, 2.05%, 1.34%, 1.60%, 0.98% and 0.89%, respectively.
Actual expenses may be higher. For example, expenses may be higher than those shown if average net assets decrease. Net assets are more likely to decrease and Fund expense ratios are more likely to increase when markets are volatile.
Q. What were the leading contributors to performance?
A. Stock selection in the Materials and Health Care sectors in continental Europe contributed to relative performance for the period. Stock selection was also strong in Singapore, led by an overweight to Fraser and Neave Ltd. , a Singapore takeover target, which had a return of over 60% for the period held. Investments in two non-benchmark holdings, China Overseas Land & Investment and Spectris Plc., were also leading contributors at the stock level.
Q. What were the leading detractors from performance?
A. Stock selection detracted from relative return most notably in Japan, especially in the Consumer Discretionary sector led by an overweight to NHK Spring Co. Ltd. which had a negative return for the period held. Overweighting Hokkaido Electric Power Co. and underweighting Vivendi were also leading detractors.
A modest exposure to emerging markets, which are not included in the benchmark, also was a major detractor.
Thank you for your investment in Legg Mason Batterymarch International Equity Trust. As always, we appreciate that you have chosen us to manage your assets and we remain focused on achieving the Fund’s investment goals.
Sincerely,
Batterymarch Financial Management, Inc.
January 31, 2013
| 1 | Lipper, Inc., a wholly-owned subsidiary of Reuters, provides independent insight on global collective investments. Returns are based on the period ended December 31, 2012, including the reinvestment of all distributions, including returns of capital, if any, calculated among the 337 funds for the six-month period and among the 322 funds for the twelve-month period in the Fund’s Lipper category, and excluding sales charges. |
| | |
| 4 | | Legg Mason Batterymarch International Equity Trust 2012 Annual Report |
Fund overview (cont’d)
RISKS: International investments are subject to special risks including currency fluctuations, as well as social, economic and political uncertainties, which could increase volatility. These risks are magnified in emerging markets. The securities markets of emerging market countries are substantially smaller, less developed, less liquid and more volatile than securities markets of the U.S. and more developed countries. The Fund may engage in derivative transactions, which involve special risks and costs and may increase losses and have a potentially large impact on Fund performance. Please see the Fund’s prospectus for a more complete discussion of these and other risks, and the Fund’s investment strategies.
Portfolio holdings and breakdowns are as of December 31, 2012 and are subject to change and may not be representative of the portfolio managers’ current or future investments. The Fund’s top ten holdings (as a percentage of net assets) as of December 31, 2012 were: HSBC Holdings PLC (2.4%), Nestle SA, Registered Shares (2.2%), BP PLC (1.5%), Roche Holding AG (1.5%), Royal Dutch Shell PLC, Class A Shares (1.5%), BASF SE (1.4%), Royal Dutch Shell PLC, Class B Shares (1.4%), Vodafone Group PLC (1.3%), Novartis AG, Registered Shares (1.3%) and GlaxoSmithKline PLC (1.2%). Please refer to pages 11 through 20 for a list and percentage breakdown of the Fund’s holdings.
The mention of sector breakdowns is for informational purposes only and should not be construed as a recommendation to purchase or sell any securities. The information provided regarding such sectors is not a sufficient basis upon which to make an investment decision. Investors seeking financial advice regarding the appropriateness of investing in any securities or investment strategies discussed should consult their financial professional. The Fund’s top five sector holdings (as a percentage of net assets) as of December 31, 2012 were: Financials (25.3%), Health Care (11.6%), Industrials (11.5%), Consumer Discretionary (10.9%) and Consumer Staples (10.4%). The Fund’s portfolio composition is subject to change at any time.
All investments are subject to risk including the possible loss of principal. Past performance is no guarantee of future results. All index performance reflects no deduction for fees, expenses or taxes. Please note that an investor cannot invest directly in an index.
The information provided is not intended to be a forecast of future events, a guarantee of future results or investment advice. Views expressed may differ from those of the firm as a whole.
| i | The European Central Bank (“ECB”) is responsible for the monetary system of the European Union and the euro currency. |
| ii | The MSCI EAFE Index is a free float-adjusted market capitalization index designed to measure developed market equity performance, excluding the U.S. and Canada. |
| | | | |
| Legg Mason Batterymarch International Equity Trust 2012 Annual Report | | | 5 | |
Fund at a glance† (unaudited)
Investment breakdown (%) as a percent of total investments
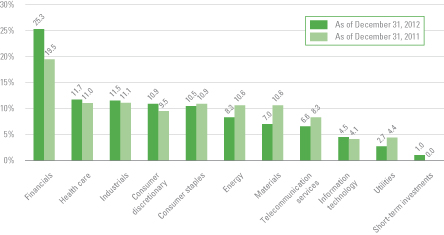
| † | The bar graph above represents the composition of the Fund’s investments as of December 31, 2012 and December 31, 2011 and does not include derivatives such as forward foreign currency contracts. The Fund is actively managed. As a result, the composition of the Fund’s investments is subject to change at any time. |
| | |
| 6 | | Legg Mason Batterymarch International Equity Trust 2012 Annual Report |
Fund expenses (unaudited)
Example
As a shareholder of the Fund, you may incur two types of costs: (1) transaction costs, including front-end and back-end sales charges (loads) on purchase payments; and (2) ongoing costs, including management fees; service and/or distribution (12b-1) fees; and other Fund expenses. This example is intended to help you understand your ongoing costs (in dollars) of investing in the Fund and to compare these costs with the ongoing costs of investing in other mutual funds.
This example is based on an investment of $1,000 invested on July 1, 2012 and held for the six months ended December 31, 2012.
Actual expenses
The table below titled “Based on Actual Total Return” provides information about actual account values and actual expenses. You may use the information provided in this table, together with the amount you invested, to estimate the expenses that you paid over the period. To estimate the expenses you paid on your account, divide your ending account value by $1,000 (for example, an $8,600 ending account value divided by $1,000 = 8.6), then multiply the result by the number under the heading entitled “Expenses Paid During the Period”.
Hypothetical example for comparison purposes
The table below titled “Based on Hypothetical Total Return” provides information about hypothetical account values and hypothetical expenses based on the actual expense ratio and an assumed rate of return of 5.00% per year before expenses, which is not the Fund’s actual return. The hypothetical account values and expenses may not be used to estimate the actual ending account balance or expenses you paid for the period. You may use the information provided in this table to compare the ongoing costs of investing in the Fund and other funds. To do so, compare the 5.00% hypothetical example relating to the Fund with the 5.00% hypothetical examples that appear in the shareholder reports of the other funds.
Please note that the expenses shown in the table below are meant to highlight your ongoing costs only and do not reflect any transactional costs, such as front-end or back-end sales charges (loads). Therefore, the table is useful in comparing ongoing costs only, and will not help you determine the relative total costs of owning different funds. In addition, if these transaction costs were included, your costs would have been higher.
| | | | | | | | | | | | | | | | | | | | | | | | | | | | | | | | | | | | | | | | | | | | |
| Based on actual total return1 | | | | | Based on hypothetical total return1 | |
| | | Actual
Total Return
Without
Sales
Charge2 | | | Beginning
Account
Value | | | Ending
Account
Value | | | Annualized
Expense
Ratio | | | Expenses
Paid
During
the
Period3 | | | | | | | Hypothetical
Annualized
Total Return | | | Beginning
Account
Value | | | Ending
Account
Value | | | Annualized
Expense
Ratio | | | Expenses
Paid
During
the
Period3 | |
| Class A | | | 11.72 | % | | $ | 1,000.00 | | | $ | 1,117.20 | | | | 1.35 | % | | $ | 7.18 | | | | | Class A | | | 5.00 | % | | $ | 1,000.00 | | | $ | 1,018.35 | | | | 1.35 | % | | $ | 6.85 | |
| Class C | | | 11.33 | | | | 1,000.00 | | | | 1,113.30 | | | | 2.05 | | | | 10.89 | | | | | Class C | | | 5.00 | | | | 1,000.00 | | | | 1,014.83 | | | | 2.05 | | | | 10.38 | |
| Class FI | | | 11.70 | | | | 1,000.00 | | | | 1,117.00 | | | | 1.35 | | | | 7.18 | | | | | Class FI | | | 5.00 | | | | 1,000.00 | | | | 1,018.35 | | | | 1.35 | | | | 6.85 | |
| Class R | | | 11.60 | | | | 1,000.00 | | | | 1,116.00 | | | | 1.56 | | | | 8.30 | | | | | Class R | | | 5.00 | | | | 1,000.00 | | | | 1,017.29 | | | | 1.56 | | | | 7.91 | |
| Class I | | | 12.04 | | | | 1,000.00 | | | | 1,120.40 | | | | 0.96 | | | | 5.12 | | | | | Class I | | | 5.00 | | | | 1,000.00 | | | | 1,020.31 | | | | 0.96 | | | | 4.88 | |
| Class IS | | | 11.92 | | | | 1,000.00 | | | | 1,119.20 | | | | 0.94 | | | | 5.01 | | | | | Class IS | | | 5.00 | | | | 1,000.00 | | | | 1,020.41 | | | | 0.94 | | | | 4.77 | |
| 1 | For the six months ended December 31, 2012. |
| 2 | Assumes the reinvestment of all distributions, including returns of capital, if any, at net asset value and does not reflect the deduction of the applicable sales charge with respect to Class A shares or the applicable contingent deferred sales charge (“CDSC”) with respect to Class C shares. Total return is not annualized, as it may not be representative of the total return for the year. Performance figures may reflect compensating balance arrangements, fee waivers and/or expense reimbursements. In the absence of compensating balance arrangements, fee waivers and/or expense reimbursements, the total return would have been lower. Past performance is no guarantee of future results. |
| 3 | Expenses (net of compensating balance arrangements, fee waivers and/or expense reimbursements) are equal to each class’ respective annualized expense ratio multiplied by the average account value over the period, multiplied by the number of days in the most recent fiscal half-year (184), then divided by 366. |
| | | | |
| Legg Mason Batterymarch International Equity Trust 2012 Annual Report | | | 7 | |
Fund performance (unaudited)
| | | | | | | | | | | | | | | | | | | | | | | | |
| Average annual total returns | | | | | | | | | | | | | | | | | | |
| Without sales charges1 | | Class A | | | Class C | | | Class FI | | | Class R | | | Class I | | | Class IS | |
| Twelve Months Ended 12/31/12 | | | 13.23 | % | | | 12.52 | % | | | 13.26 | % | | | 13.06 | % | | | 13.70 | % | | | 13.68 | % |
| Five Years Ended 12/31/12 | | | N/A | | | | -7.34 | | | | -6.68 | | | | -6.98 | | | | -6.34 | | | | N/A | |
| Ten Years Ended 12/31/12 | | | N/A | | | | 6.52 | | | | N/A | | | | N/A | | | | 7.65 | | | | N/A | |
| Inception* through 12/31/12 | | | 9.67 | | | | 3.35 | | | | 6.61 | | | | -4.54 | | | | 2.14 | | | | -3.00 | |
| | | | | | |
| With sales charges2 | | Class A | | | Class C | | | Class FI | | | Class R | | | Class I | | | Class IS | |
| Twelve Months Ended 12/31/12 | | | 6.68 | % | | | 11.52 | % | | | 13.26 | % | | | 13.06 | % | | | 13.70 | % | | | 13.68 | % |
| Five Years Ended 12/31/12 | | | N/A | | | | -7.34 | | | | -6.68 | | | | -6.98 | | | | -6.34 | | | | N/A | |
| Ten Years Ended 12/31/12 | | | N/A | | | | 6.52 | | | | N/A | | | | N/A | | | | 7.65 | | | | N/A | |
| Inception* through 12/31/12 | | | 8.02 | | | | 3.35 | | | | 6.61 | | | | -4.54 | | | | 2.14 | | | | -3.00 | |
| | | | |
| Cumulative total returns | |
| Without sales charges1 | | | |
| Class A (Inception date of 2/3/09 through 12/31/12) | | | 43.44 | % |
| Class C (12/31/02 through 12/31/12) | | | 88.10 | |
| Class FI (Inception date of 5/16/03 through 12/31/12) | | | 85.27 | |
| Class R (Inception date of 12/28/06 through 12/31/12) | | | -24.36 | |
| Class I (12/31/02 through 12/31/12) | | | 109.09 | |
| Class IS (Inception date of 8/4/08 through 12/31/12) | | | -12.57 | |
All figures represent past performance and are not a guarantee of future results. Investment return and principal value of an investment will fluctuate so that an investor’s shares, when redeemed, may be worth more or less than their original cost. The returns shown do not reflect the deduction of taxes that a shareholder would pay on Fund distributions or the redemption of Fund shares. Performance figures may reflect compensating balance arrangements, fee waivers and/or expense reimbursements. In the absence of compensating balance arrangements, fee waivers and/or expense reimbursements, the total return would have been lower.
| 1 | Assumes the reinvestment of all distributions, including returns of capital, if any, at net asset value and does not reflect the deduction of the applicable sales charge with respect to Class A shares or the applicable CDSC with respect to Class C shares. |
| 2 | Assumes the reinvestment of all distributions, including returns of capital, if any, at net asset value. In addition, Class A shares reflect the deduction of the maximum initial sales charge of 5.75%. Class C shares reflect the deduction of a 1.00% CDSC, which applies if shares are redeemed within one year from purchase payment. |
| * | Inception dates for Class A, C, FI, R, I and IS shares are February 3, 2009, February 17, 1995, May 16, 2003, December 28, 2006, May 5, 1998 and August 4, 2008, respectively. |
| | |
| 8 | | Legg Mason Batterymarch International Equity Trust 2012 Annual Report |
Fund performance (unaudited) (cont’d)
Historical performance
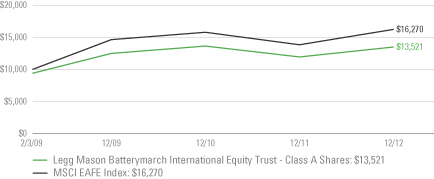
Value of $10,000 invested in
Class A Shares of Legg Mason Batterymarch International Equity Trust vs. MSCI EAFE Index† — February 3, 2009 - December 2012
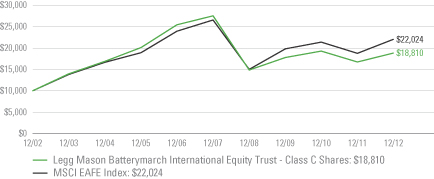
Value of $10,000 invested in
Class C Shares of Legg Mason Batterymarch International Equity Trust vs. MSCI EAFE Index† — December 2002 - December 2012
| | | | |
| Legg Mason Batterymarch International Equity Trust 2012 Annual Report | | | 9 | |
Historical performance
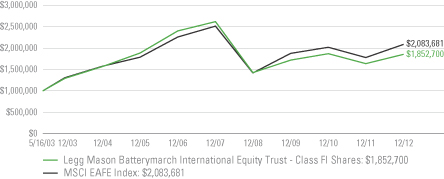
Value of $1,000,000 invested in
Class FI Shares of Legg Mason Batterymarch International Equity Trust vs. MSCI EAFE Index† — May 16, 2003 - December 2012
Value of $1,000,000 invested in
Class R Shares of Legg Mason Batterymarch International Equity Trust vs. MSCI EAFE Index† — December 28, 2006 - December 2012
| | |
| 10 | | Legg Mason Batterymarch International Equity Trust 2012 Annual Report |
Fund performance (unaudited) (cont’d)
Historical performance
Value of $1,000,000 invested in
Class I Shares of Legg Mason Batterymarch International Equity Trust vs. MSCI EAFE Index† — December 2002 - December 2012
Value of $1,000,000 invested in
Class IS Shares of Legg Mason Batterymarch International Equity Trust vs. MSCI Index† — August 4, 2008 - December 2012
All figures represent past performance and are not a guarantee of future results. Investment return and principal value of an investment will fluctuate so that an investor’s shares, when redeemed, may be worth more or less than their original cost. The returns shown do not reflect the deduction of taxes that a shareholder would pay on Fund distributions or the redemption of Fund shares. Performance figures may reflect compensating balance arrangements, fee waivers and/or expense reimbursements. In the absence of compensating balance arrangements, fee waivers and/or expense reimbursements, the total return would have been lower.
| † | Hypothetical illustration of $10,000 invested in Class A and C shares and $1,000,000 invested in Class FI, R, I and IS shares of Legg Mason Batterymarch International Equity Trust on February 3, 2009 (commencement of operations), December 31, 2002, May 16, 2003 (commencement of operations), December 28, 2006 (commencement of operations), December 31, 2002 and August 4, 2008 (commencement of operations), respectively, assuming the deduction of the maximum initial sales charge of 5.75% at the time of investment for Class A shares and the reinvestment of all distributions, including returns of capital, if any, at net asset value through December 31, 2012. The hypothetical illustration also assumes a $10,000 or $1,000,000 investment, as applicable, in the MSCI EAFE Index. The MSCI EAFE Index is a free float-adjusted market capitalization index designed to measure developed market equity performance, excluding the U.S. and Canada. The Index is unmanaged and is not subject to the same management and trading expenses as a mutual fund. Please note that an investor cannot invest directly in an index. |
| | | | |
| Legg Mason Batterymarch International Equity Trust 2012 Annual Report | | | 11 | |
Schedule of investments
December 31, 2012
Legg Mason Batterymarch International Equity Trust
| | | | | | | | | | | | |
| Security | | | | | | Shares | | | Value | |
| Common Stocks — 97.9% | | | | | | | | | | | | |
| Consumer Discretionary — 10.2% | | | | | | | | | | | | |
Auto Components — 1.7% | | | | | | | | | | | | |
Aisin Seiki Co., Ltd. | | | | | | | 22,000 | | | $ | 686,121 | (a) |
Continental AG | | | | | | | 13,611 | | | | 1,574,861 | (a) |
NHK Spring Co., Ltd. | | | | | | | 110,400 | | | | 909,765 | (a) |
Stanley Electric Co., Ltd. | | | | | | | 38,000 | | | | 540,921 | (a) |
Valeo SA | | | | | | | 14,085 | | | | 714,200 | (a) |
Total Auto Components | | | | | | | | | | | 4,425,868 | |
Automobiles — 2.5% | | | | | | | | | | | | |
Daimler AG, Registered Shares | | | | | | | 21,939 | | | | 1,198,851 | (a) |
Hyundai Motor Co. | | | | | | | 6,261 | | | | 1,288,674 | (a) |
Renault SA | | | | | | | 28,098 | | | | 1,550,221 | (a) |
Toyota Motor Corp. | | | | | | | 57,175 | | | | 2,668,733 | (a) |
Total Automobiles | | | | | | | | | | | 6,706,479 | |
Hotels, Restaurants & Leisure — 0.3% | | | | | | | | | | | | |
Paddy Power PLC | | | | | | | 10,956 | | | | 903,047 | (a) |
Household Durables — 1.2% | | | | | | | | | | | | |
Electrolux AB | | | | | | | 50,800 | | | | 1,334,193 | (a) |
Persimmon PLC | | | | | | | 51,248 | | | | 676,792 | (a) |
Sekisui Chemical Co., Ltd. | | | | | | | 119,000 | | | | 1,030,555 | (a) |
Total Household Durables | | | | | | | | | | | 3,041,540 | |
Internet & Catalog Retail — 0.3% | | | | | | | | | | | | |
Dena Co., Ltd. | | | | | | | 24,700 | | | | 812,157 | (a) |
Leisure Equipment & Products — 1.0% | | | | | | | | | | | | |
Namco Bandai Holdings Inc. | | | | | | | 65,700 | | | | 852,066 | (a) |
Nikon Corp. | | | | | | | 38,700 | | | | 1,142,561 | (a) |
Sega Sammy Holdings Inc. | | | | | | | 44,300 | | | | 748,214 | (a) |
Total Leisure Equipment & Products | | | | | | | | | | | 2,742,841 | |
Media — 1.0% | | | | | | | | | | | | |
Axel Springer AG | | | | | | | 12,485 | | | | 532,836 | (a) |
Fuji Media Holdings Inc. | | | | | | | 363 | | | | 548,733 | (a) |
Reed Elsevier NV | | | | | | | 64,177 | | | | 950,845 | (a) |
Wolters Kluwer NV | | | | | | | 28,806 | | | | 595,649 | (a) |
Total Media | | | | | | | | | | | 2,628,063 | |
Multiline Retail — 0.2% | | | | | | | | | | | | |
Canadian Tire Corp., Ltd., Class A Shares | | | | | | | 7,800 | | | | 544,047 | |
Specialty Retail — 0.5% | | | | | | | | | | | | |
Nitori Co., Ltd. | | | | | | | 9,050 | | | | 662,529 | (a) |
See Notes to Financial Statements.
| | |
| 12 | | Legg Mason Batterymarch International Equity Trust 2012 Annual Report |
Schedule of investments (cont’d)
December 31, 2012
Legg Mason Batterymarch International Equity Trust
| | | | | | | | | | | | |
| Security | | | | | | Shares | | | Value | |
Specialty Retail — continued | | | | | | | | | | | | |
SHIMAMURA Co., Ltd. | | | | | | | 6,900 | | | $ | 668,214 | (a) |
Total Specialty Retail | | | | | | | | | | | 1,330,743 | |
Textiles, Apparel & Luxury Goods — 1.5% | | | | | | | | | | | | |
Adidas-Salomon AG | | | | | | | 16,228 | | | | 1,446,210 | (a) |
Christian Dior SA | | | | | | | 4,505 | | | | 778,849 | (a) |
Compagnie Financiere Richemont SA, Class A Shares | | | | | | | 13,729 | | | | 1,097,819 | (a) |
Yue Yuen Industrial Holdings Ltd. | | | | | | | 220,000 | | | | 742,699 | (a) |
Total Textiles, Apparel & Luxury Goods | | | | | | | | | | | 4,065,577 | |
Total Consumer Discretionary | | | | | | | | | | | 27,200,362 | |
| Consumer Staples — 10.4% | | | | | | | | | | | | |
Beverages — 1.6% | | | | | | | | | | | | |
Anheuser-Busch InBev NV | | | | | | | 30,977 | | | | 2,707,037 | (a) |
Diageo PLC | | | | | | | 19,365 | | | | 563,764 | (a) |
Heineken NV | | | | | | | 14,467 | | | | 964,991 | (a) |
Total Beverages | | | | | | | | | | | 4,235,792 | |
Food & Staples Retailing — 2.5% | | | | | | | | | | | | |
Distribuidora Internacional de Alimentacion SA | | | | | | | 178,898 | | | | 1,149,533 | (a) |
FamilyMart Co., Ltd. | | | | | | | 40,000 | | | | 1,646,567 | (a) |
Koninklijke Ahold NV | | | | | | | 147,988 | | | | 1,965,681 | (a) |
Lawson Inc. | | | | | | | 16,200 | | | | 1,101,169 | (a) |
Metro Inc., Class A Shares | | | | | | | 13,900 | | | | 884,977 | |
Total Food & Staples Retailing | | | | | | | | | | | 6,747,927 | |
Food Products — 3.7% | | | | | | | | | | | | |
Nestle SA, Registered Shares | | | | | | | 89,218 | | | | 5,814,704 | (a) |
Suedzucker AG | | | | | | | 41,320 | | | | 1,690,757 | (a) |
Tate & Lyle PLC | | | | | | | 115,250 | | | | 1,429,137 | (a) |
Unilever NV, CVA | | | | | | | 25,427 | | | | 959,456 | (a) |
Total Food Products | | | | | | | | | | | 9,894,054 | |
Personal Products — 0.5% | | | | | | | | | | | | |
Kao Corp. | | | | | | | 55,000 | | | | 1,432,993 | (a) |
Tobacco — 2.1% | | | | | | | | | | | | |
British American Tobacco PLC | | | | | | | 48,763 | | | | 2,470,823 | (a) |
Imperial Tobacco Group PLC | | | | | | | 56,428 | | | | 2,178,958 | (a) |
Japan Tobacco Inc. | | | | | | | 34,600 | | | | 975,432 | (a) |
Total Tobacco | | | | | | | | | | | 5,625,213 | |
Total Consumer Staples | | | | | | | | | | | 27,935,979 | |
| Energy — 8.3% | | | | | | | | | | | | |
Energy Equipment & Services — 1.0% | | | | | | | | | | | | |
Petroleum Geo-Services ASA | | | | | | | 67,525 | | | | 1,168,320 | (a) |
See Notes to Financial Statements.
| | | | |
| Legg Mason Batterymarch International Equity Trust 2012 Annual Report | | | 13 | |
Legg Mason Batterymarch International Equity Trust
| | | | | | | | | | | | |
| Security | | | | | | Shares | | | Value | |
Energy Equipment & Services — continued | | | | | | | | | | | | |
ShawCor Ltd., Class A Shares | | | | | | | 22,600 | | | $ | 885,869 | |
TGS Nopec Geophysical Co. ASA | | | | | | | 20,808 | | | | 681,884 | (a) |
Total Energy Equipment & Services | | | | | | | | | | | 2,736,073 | |
Oil, Gas & Consumable Fuels — 7.3% | | | | | | | | | | | | |
BG Group PLC | | | | | | | 51,829 | | | | 869,082 | (a) |
BP PLC | | | | | | | 595,956 | | | | 4,129,237 | (a) |
Caltex Australia Ltd. | | | | | | | 40,831 | | | | 822,906 | (a) |
Eni SpA | | | | | | | 74,188 | | | | 1,830,184 | (a) |
Inpex Holdings Inc. | | | | | | | 157 | | | | 837,886 | (a) |
Royal Dutch Shell PLC, Class A Shares | | | | | | | 114,068 | | | | 3,921,901 | (a) |
Royal Dutch Shell PLC, Class B Shares | | | | | | | 102,195 | | | | 3,616,921 | (a) |
Statoil ASA | | | | | | | 32,191 | | | | 807,804 | (a) |
Total SA | | | | | | | 49,359 | | | | 2,554,700 | (a) |
Total Oil, Gas & Consumable Fuels | | | | | | | | | | | 19,390,621 | |
Total Energy | | | | | | | | | | | 22,126,694 | |
| Financials — 25.1% | | | | | | | | | | | | |
Capital Markets — 0.3% | | | | | | | | | | | | |
Intermediate Capital Group PLC | | | | | | | 140,939 | | | | 740,397 | (a) |
Commercial Banks — 13.4% | | | | | | | | | | | | |
Aozora Bank Ltd. | | | | | | | 365,000 | | | | 1,121,509 | (a) |
Australia & New Zealand Banking Group Ltd. | | | | | | | 83,984 | | | | 2,198,776 | (a) |
Banca Intesa SpA | | | | | | | 448,957 | | | | 776,697 | (a) |
Banco Bilbao Vizcaya Argentaria SA | | | | | | | 122,906 | | | | 1,128,319 | (a) |
Banco Santander SA | | | | | | | 330,299 | | | | 2,663,229 | (a) |
Banque Cantonale Vaudoise | | | | | | | 2,128 | | | | 1,129,674 | (a) |
Barclays PLC | | | | | | | 577,954 | | | | 2,495,827 | (a) |
BNP Paribas SA | | | | | | | 37,919 | | | | 2,137,386 | (a) |
BOC Hong Kong Holdings Ltd. | | | | | | | 252,000 | | | | 790,595 | (a) |
Commonwealth Bank of Australia | | | | | | | 31,701 | | | | 2,059,214 | (a) |
DNB NOR ASA | | | | | | | 107,200 | | | | 1,366,470 | (a) |
HSBC Holdings PLC | | | | | | | 594,896 | | | | 6,292,113 | (a) |
Mitsubishi UFJ Financial Group Inc. | | | | | | | 130,400 | | | | 701,701 | (a) |
Mizuho Financial Group Inc. | | | | | | | 551,400 | | | | 1,008,865 | (a) |
National Australia Bank Ltd. | | | | | | | 32,087 | | | | 839,164 | (a) |
Nordea Bank AB | | | | | | | 106,700 | | | | 1,021,887 | (a) |
Skandinaviska Enskilda Banken AB | | | | | | | 173,823 | | | | 1,482,290 | (a) |
Societe Generale | | | | | | | 16,481 | | | | 619,920 | *(a) |
Standard Chartered PLC | | | | | | | 107,896 | | | | 2,735,020 | (a) |
Svenska Handelsbanken AB | | | | | | | 25,289 | | | | 906,104 | (a) |
See Notes to Financial Statements.
| | |
| 14 | | Legg Mason Batterymarch International Equity Trust 2012 Annual Report |
Schedule of investments (cont’d)
December 31, 2012
Legg Mason Batterymarch International Equity Trust
| | | | | | | | | | | | |
| Security | | | | | | Shares | | | Value | |
Commercial Banks — continued | | | | | | | | | | | | |
Swedbank AB, Class A Shares | | | | | | | 44,822 | | | $ | 882,025 | (a) |
Westpac Banking Corp. | | | | | | | 51,183 | | | | 1,399,262 | (a) |
Total Commercial Banks | | | | | | | | | | | 35,756,047 | |
Consumer Finance — 0.6% | | | | | | | | | | | | |
ORIX Corp. | | | | | | | 13,940 | | | | 1,572,974 | (a) |
Diversified Financial Services — 1.1% | | | | | | | | | | | | |
First Pacific Co., Ltd. | | | | | | | 748,000 | | | | 828,752 | (a) |
London Stock Exchange Group PLC | | | | | | | 67,900 | | | | 1,186,032 | (a) |
Pohjola Bank PLC | | | | | | | 70,323 | | | | 1,050,136 | (a) |
Total Diversified Financial Services | | | | | | | | | | | 3,064,920 | |
Insurance — 7.4% | | | | | | | | | | | | |
Admiral Group PLC | | | | | | | 58,609 | | | | 1,122,297 | (a) |
Allianz AG, Registered Shares | | | | | | | 18,022 | | | | 2,496,708 | (a) |
Aviva PLC | | | | | | | 160,091 | | | | 966,437 | (a) |
AXA SA | | | | | | | 65,772 | | | | 1,189,681 | (a) |
CNP Assurances | | | | | | | 46,132 | | | | 702,698 | (a) |
Gjensidige Forsikring ASA | | | | | | | 55,411 | | | | 797,444 | (a) |
Hannover Rueckversicherung AG | | | | | | | 14,793 | | | | 1,151,408 | (a) |
Legal & General Group PLC | | | | | | | 421,734 | | | | 1,018,157 | (a) |
Muenchener Rueckversicherungs-Gesellschaft AG (MunichRe), Registered Shares | | | | | | | 11,983 | | | | 2,151,471 | (a) |
PICC Property & Casualty Co., Ltd. | | | | | | | 546,000 | | | | 774,787 | (a) |
SCOR SE | | | | | | | 50,201 | | | | 1,353,639 | (a) |
Sony Financial Holdings Inc. | | | | | | | 59,300 | | | | 1,066,695 | (a) |
Standard Life PLC | | | | | | | 235,745 | | | | 1,259,192 | (a) |
Swiss Re AG | | | | | | | 11,363 | | | | 829,320 | *(a) |
Tokio Marine Holdings Inc. | | | | | | | 30,600 | | | | 853,189 | (a) |
Zurich Insurance Group AG | | | | | | | 7,200 | | | | 1,925,220 | *(a) |
Total Insurance | | | | | | | | | | | 19,658,343 | |
Real Estate Investment Trusts (REITs) — 0.7% | | | | | | | | | | | | |
GPT Group | | | | | | | 191,702 | | | | 740,766 | (a) |
Mirvac Group | | | | | | | 700,006 | | | | 1,090,842 | (a) |
Total Real Estate Investment Trusts (REITs) | | | | | | | | | | | 1,831,608 | |
Real Estate Management & Development — 1.6% | | | | | | | | | | | | |
China Overseas Land & Investment Ltd. | | | | | | | 642,000 | | | | 1,944,725 | (a) |
Tokyu Land Corp. | | | | | | | 145,000 | | | | 1,059,977 | (a) |
Wheelock & Co., Ltd. | | | | | | | 258,000 | | | | 1,309,588 | (a) |
Total Real Estate Management & Development | | | | | | | | | | | 4,314,290 | |
Total Financials | | | | | | | | | | | 66,938,579 | |
See Notes to Financial Statements.
| | | | |
| Legg Mason Batterymarch International Equity Trust 2012 Annual Report | | | 15 | |
Legg Mason Batterymarch International Equity Trust
| | | | | | | | | | | | |
| Security | | | | | | Shares | | | Value | |
| Health Care — 11.6% | | | | | | | | | | | | |
Health Care Equipment & Supplies — 0.4% | | | | | | | | | | | | |
Coloplast A/S, Class B Shares | | | | | | | 23,660 | | | $ | 1,159,586 | (a) |
Health Care Providers & Services — 1.7% | | | | | | | | | | | | |
Alfresa Holdings Corp. | | | | | | | 16,300 | | | | 636,983 | (a) |
Medipal Holdings Corp. | | | | | | | 89,000 | | | | 980,627 | (a) |
Miraca Holdings Inc. | | | | | | | 28,600 | | | | 1,151,567 | (a) |
Ramsay Health Care Ltd. | | | | | | | 39,273 | | | | 1,115,760 | (a) |
Suzuken Co., Ltd. | | | | | | | 23,500 | | | | 662,240 | (a) |
Total Health Care Providers & Services | | | | | | | | | | | 4,547,177 | |
Pharmaceuticals — 9.5% | | | | | | | | | | | | |
AstraZeneca PLC | | | | | | | 63,992 | | | | 3,025,246 | (a) |
Bayer AG, Registered Shares | | | | | | | 33,909 | | | | 3,220,084 | (a) |
GlaxoSmithKline PLC | | | | | | | 148,919 | | | | 3,233,267 | (a) |
Merck KGaA | | | | | | | 10,500 | | | | 1,385,348 | (a) |
Novartis AG, Registered Shares | | | | | | | 54,799 | | | | 3,469,408 | (a) |
Novo Nordisk A/S, Class B Shares | | | | | | | 16,342 | | | | 2,668,973 | (a) |
Roche Holding AG | | | | | | | 19,490 | | | | 3,970,598 | (a) |
Sanofi | | | | | | | 28,383 | | | | 2,691,708 | (a) |
Shionogi & Co., Ltd. | | | | | | | 63,500 | | | | 1,057,766 | (a) |
Teva Pharmaceutical Industries Ltd., ADR | | | | | | | 18,500 | | | | 690,790 | |
Total Pharmaceuticals | | | | | | | | | | | 25,413,188 | |
Total Health Care | | | | | | | | | | | 31,119,951 | |
| Industrials — 11.5% | | | | | | | | | | | | |
Aerospace & Defense — 1.5% | | | | | | | | | | | | |
Cobham PLC | | | | | | | 340,309 | | | | 1,237,624 | (a) |
European Aeronautic Defence & Space Co. | | | | | | | 27,026 | | | | 1,059,239 | (a) |
Qinetiq Group PLC | | | | | | | 338,610 | | | | 994,462 | (a) |
Thales SA | | | | | | | 17,666 | | | | 609,859 | (a) |
Total Aerospace & Defense | | | | | | | | | | | 3,901,184 | |
Air Freight & Logistics — 0.4% | | | | | | | | | | | | |
Deutsche Post AG | | | | | | | 53,400 | | | | 1,170,919 | (a) |
Airlines — 0.9% | | | | | | | | | | | | |
easyJet PLC | | | | | | | 52,920 | | | | 665,301 | (a) |
Japan Airlines Co., Ltd. | | | | | | | 22,600 | | | | 967,326 | *(a) |
WestJet Airlines Ltd. | | | | | | | 43,100 | | | | 855,327 | |
Total Airlines | | | | | | | | | | | 2,487,954 | |
Commercial Services & Supplies — 0.2% | | | | | | | | | | | | |
Societe BIC SA | | | | | | | 5,439 | | | | 649,283 | (a) |
See Notes to Financial Statements.
| | |
| 16 | | Legg Mason Batterymarch International Equity Trust 2012 Annual Report |
Schedule of investments (cont’d)
December 31, 2012
Legg Mason Batterymarch International Equity Trust
| | | | | | | | | | | | |
| Security | | | | | | Shares | | | Value | |
Construction & Engineering — 1.5% | | | | | | | | | | | | |
Daelim Industrial Co. | | | | | | | 9,438 | | | $ | 775,346 | (a) |
Outotec OYJ | | | | | | | 18,855 | | | | 1,078,840 | (a) |
Taisei Corp. | | | | | | | 364,000 | | | | 1,203,329 | (a) |
Vinci SA | | | | | | | 20,215 | | | | 962,080 | (a) |
Total Construction & Engineering | | | | | | | | | | | 4,019,595 | |
Electrical Equipment — 0.3% | | | | | | | | | | | | |
Legrand SA | | | | | | | 248 | | | | 10,467 | (a) |
Prysmian SpA | | | | | | | 36,068 | | | | 729,732 | (a) |
Total Electrical Equipment | | | | | | | | | | | 740,199 | |
Industrial Conglomerates — 1.0% | | | | | | | | | | | | |
DCC PLC | | | | | | | 35,053 | | | | 1,118,621 | (a) |
Siemens AG, Registered Shares | | | | | | | 13,535 | | | | 1,471,114 | (a) |
Total Industrial Conglomerates | | | | | | | | | | | 2,589,735 | |
Machinery — 2.1% | | | | | | | | | | | | |
Andritz AG | | | | | | | 19,763 | | | | 1,269,737 | (a) |
Fiat Industrial SpA | | | | | | | 68,640 | | | | 752,602 | (a) |
Hino Motors Ltd. | | | | | | | 108,000 | | | | 968,468 | (a) |
Metso Corp. | | | | | | | 28,220 | | | | 1,229,342 | (a) |
Scania AB, Class B Shares | | | | | | | 67,600 | | | | 1,405,951 | (a) |
Total Machinery | | | | | | | | | | | 5,626,100 | |
Professional Services — 0.3% | | | | | | | | | | | | |
Adecco SA | | | | | | | 12,500 | | | | 662,571 | *(a) |
Road & Rail — 0.9% | | | | | | | | | | | | |
Central Japan Railway Co. | | | | | | | 14,500 | | | | 1,176,467 | (a) |
East Japan Railway Co. | | | | | | | 20,400 | | | | 1,318,989 | (a) |
Total Road & Rail | | | | | | | | | | | 2,495,456 | |
Trading Companies & Distributors — 2.4% | | | | | | | | | | | | |
Ashtead Group PLC | | | | | | | 150,596 | | | | 1,068,631 | (a) |
Itochu Corp. | | | | | | | 215,100 | | | | 2,270,569 | (a) |
Marubeni Corp. | | | | | | | 237,000 | | | | 1,698,364 | (a) |
Sojitz Corp. | | | | | | | 853,100 | | | | 1,262,018 | (a) |
Total Trading Companies & Distributors | | | | | | | | | | | 6,299,582 | |
Total Industrials | | | | | | | | | | | 30,642,578 | |
| Information Technology — 4.5% | | | | | | | | | | | | |
Computers & Peripherals — 0.6% | | | | | | | | | | | | |
NEC Corp. | | | | | | | 700,000 | | | | 1,473,965 | *(a) |
Electronic Equipment, Instruments & Components — 1.3% | | | | | | | | | | | | |
Hitachi Ltd. | | | | | | | 337,000 | | | | 1,983,288 | (a) |
See Notes to Financial Statements.
| | | | |
| Legg Mason Batterymarch International Equity Trust 2012 Annual Report | | | 17 | |
Legg Mason Batterymarch International Equity Trust
| | | | | | | | | | | | |
| Security | | | | | | Shares | | | Value | |
Electronic Equipment, Instruments & Components — continued | | | | | | | | | | | | |
Spectris PLC | | | | | | | 45,915 | | | $ | 1,537,983 | (a) |
Total Electronic Equipment, Instruments & Components | | | | | | | | | | | 3,521,271 | |
IT Services — 1.1% | | | | | | | | | | | | |
Amadeus IT Holding SA, Class A Shares | | | | | | | 61,699 | | | | 1,548,291 | (a) |
NTT Data Corp. | | | | | | | 453 | | | | 1,416,346 | (a) |
Total IT Services | | | | | | | | | | | 2,964,637 | |
Office Electronics — 0.2% | | | | | | | | | | | | |
Konica Minolta Holdings Inc. | | | | | | | 81,500 | | | | 587,164 | (a) |
Software — 1.3% | | | | | | | | | | | | |
Aveva Group PLC | | | | | | | 16,461 | | | | 585,356 | (a) |
SAP AG | | | | | | | 36,581 | | | | 2,930,377 | (a) |
Total Software | | | | | | | | | | | 3,515,733 | |
Total Information Technology | | | | | | | | | | | 12,062,770 | |
| Materials — 7.0% | | | | | | | | | | | | |
Chemicals — 3.4% | | | | | | | | | | | | |
Arkema | | | | | | | 5,982 | | | | 628,973 | (a) |
Asahi Kasei Corp. | | | | | | | 164,000 | | | | 968,475 | (a) |
BASF SE | | | | | | | 38,750 | | | | 3,642,164 | (a) |
Daicel Corp. | | | | | | | 170,000 | | | | 1,124,837 | (a) |
Johnson Matthey PLC | | | | | | | 21,685 | | | | 832,820 | (a) |
Syngenta AG | | | | | | | 3,217 | | | | 1,297,683 | (a) |
Yara International ASA | | | | | | | 13,010 | | | | 645,768 | (a) |
Total Chemicals | | | | | | | | | | | 9,140,720 | |
Construction Materials — 0.2% | | | | | | | | | | | | |
James Hardie Industries PLC | | | | | | | 55,491 | | | | 536,832 | (a) |
Containers & Packaging — 0.3% | | | | | | | | | | | | |
Amcor Ltd. | | | | | | | 84,768 | | | | 716,787 | (a) |
Metals & Mining — 3.1% | | | | | | | | | | | | |
ArcelorMittal | | | | | | | 32,646 | | | | 565,137 | (a) |
BHP Billiton Ltd. | | | | | | | 60,955 | | | | 2,380,481 | (a) |
BHP Billiton PLC | | | | | | | 55,567 | | | | 1,952,597 | (a) |
Boliden AB | | | | | | | 53,470 | | | | 1,016,310 | (a) |
Rio Tinto PLC | | | | | | | 20,478 | | | | 1,193,303 | (a) |
Voestalpine AG | | | | | | | 30,291 | | | | 1,113,849 | (a) |
Total Metals & Mining | | | | | | | | | | | 8,221,677 | |
Total Materials | | | | | | | | | | | 18,616,016 | |
See Notes to Financial Statements.
| | |
| 18 | | Legg Mason Batterymarch International Equity Trust 2012 Annual Report |
Schedule of investments (cont’d)
December 31, 2012
Legg Mason Batterymarch International Equity Trust
| | | | | | | | | | | | |
| Security | | | | | | Shares | | | Value | |
| Telecommunication Services — 6.6% | | | | | | | | | | | | |
Diversified Telecommunication Services — 3.1% | | | | | | | | | | | | |
Deutsche Telekom AG, Registered Shares | | | | | | | 119,219 | | | $ | 1,354,475 | (a) |
Nippon Telegraph & Telephone Corp. | | | | | | | 31,600 | | | | 1,327,397 | (a) |
TDC A/S | | | | | | | 210,461 | | | | 1,491,476 | (a) |
Telecom Corp. of New Zealand Ltd. | | | | | | | 309,013 | | | | 584,385 | (a) |
Telecom Italia SpA | | | | | | | 909,392 | | | | 822,018 | (a) |
Telefonica SA | | | | | | | 39,457 | | | | 535,776 | (a) |
Telenor ASA | | | | | | | 48,600 | | | | 987,392 | (a) |
Telstra Corp., Ltd. | | | | | | | 263,576 | | | | 1,200,722 | (a) |
Total Diversified Telecommunication Services | | | | | | | | | | | 8,303,641 | |
Wireless Telecommunication Services — 3.5% | | | | | | | | | | | | |
America Movil SAB de CV, Series L Shares, ADR | | | | | | | 45,000 | | | | 1,041,300 | |
KDDI Corp. | | | | | | | 24,700 | | | | 1,744,685 | (a) |
Rogers Communications Inc., Class B Shares | | | | | | | 13,300 | | | | 603,828 | |
Softbank Corp. | | | | | | | 45,100 | | | | 1,650,288 | (a) |
StarHub Ltd. | | | | | | | 250,000 | | | | 780,646 | (a) |
Vodafone Group PLC | | | | | | | 1,418,043 | | | | 3,566,188 | (a) |
Total Wireless Telecommunication Services | | | | | | | | | | | 9,386,935 | |
Total Telecommunication Services | | | | | | | | | | | 17,690,576 | |
| Utilities — 2.7% | | | | | | | | | | | | |
Electric Utilities — 0.7% | | | | | | | | | | | | |
Cheung Kong Infrastructure Holdings Ltd. | | | | | | | 166,000 | | | | 1,019,740 | (a) |
Enel SpA | | | | | | | 229,834 | | | | 956,198 | (a) |
Total Electric Utilities | | | | | | | | | | | 1,975,938 | |
Gas Utilities — 0.5% | | | | | | | | | | | | |
Osaka Gas Co., Ltd. | | | | | | | 355,000 | | | | 1,289,445 | (a) |
Multi-Utilities — 1.5% | | | | | | | | | | | | |
Centrica PLC | | | | | | | 156,680 | | | | 851,147 | (a) |
GDF Suez | | | | | | | 58,635 | | | | 1,208,111 | (a) |
National Grid PLC | | | | | | | 160,239 | | | | 1,835,446 | (a) |
Total Multi-Utilities | | | | | | | | | | | 3,894,704 | |
Total Utilities | | | | | | | | | | | 7,160,087 | |
Total Common Stocks (Cost — $233,630,943) | | | | | | | | | | | 261,493,592 | |
| Preferred Stocks — 0.9% | | | | | | | | | | | | |
| Consumer Discretionary — 0.7% | | | | | | | | | | | | |
Automobiles — 0.4% | | | | | | | | | | | | |
Volkswagen AG | | | | | | | 4,900 | | | | 1,114,779 | (a) |
See Notes to Financial Statements.
| | | | |
| Legg Mason Batterymarch International Equity Trust 2012 Annual Report | | | 19 | |
Legg Mason Batterymarch International Equity Trust
| | | | | | | | | | | | | | |
| Security | | | | | | | Shares | | | Value | |
Media — 0.3% | | | | | | | | | | | | | | |
ProSiebenSat.1 Media AG | | | | | | | | | 26,729 | | | $ | 752,125 | (a) |
Total Consumer Discretionary | | | | | | | | | | | | | 1,866,904 | |
| Financials — 0.2% | | | | | | | | | | | | | | |
Commercial Banks — 0.2% | | | | | | | | | | | | | | |
Itau Unibanco Holding SA | | | | | | | | | 31,700 | | | | 523,616 | (a) |
Total Preferred Stocks (Cost — $2,084,907) | | | | | | | | | | | | | 2,390,520 | |
Total Investments before Short-Term Investments (Cost — $235,715,850) | | | | | | | 263,884,112 | |
| | | | |
| | | Rate | | | Maturity
Date | | Face
Amount | | | | |
| Short-Term Investments — 1.1% | | | | | | | | | | | | | | |
Repurchase Agreements — 1.1% | | | | | | | | | | | | | | |
Interest in $500,000,000 joint tri-party repurchase agreement dated 12/31/12 with RBS Securities Inc.; Proceeds at maturity — $2,757,034; (Fully collateralized by various U.S. government agency obligations, 0.000% to 0.625% due 6/19/13 to 9/30/17; Market value — $2,812,161) (Cost — $2,757,000) | | | 0.220 | % | | 1/2/13 | | $ | 2,757,000 | | | | 2,757,000 | |
Total Investments — 99.9% (Cost — $238,472,850#) | | | | | | | | | | 266,641,112 | |
Other Assets in Excess of Liabilities — 0.1% | | | | | | | | | | | | | 391,945 | |
Total Net Assets — 100.0% | | | | | | | | | | | | $ | 267,033,057 | |
| * | Non-income producing security. |
| (a) | Security is valued in good faith in accordance with procedures approved by the Board of Trustees (See Note 1). |
| # | Aggregate cost for federal income tax purposes is $241,039,205. |
| | |
Abbreviations used in this schedule: |
| ADR | | — American Depositary Receipts |
| CVA | | — Certificaaten van aandelen (Share Certificates) |
See Notes to Financial Statements.
| | |
| 20 | | Legg Mason Batterymarch International Equity Trust 2012 Annual Report |
Schedule of investments (cont’d)
December 31, 2012
Legg Mason Batterymarch International Equity Trust
| | | | |
| Summary of Investments by Country† (unaudited) | | | |
| United Kingdom | | | 21.1 | % |
| Japan | | | 20.1 | |
| Germany | | | 11.0 | |
| Switzerland | | | 7.6 | |
| France | | | 7.3 | |
| Australia | | | 5.5 | |
| Netherlands | | | 3.5 | |
| Sweden | | | 3.0 | |
| Spain | | | 2.6 | |
| Norway | | | 2.4 | |
| Italy | | | 2.2 | |
| Denmark | | | 2.0 | |
| Hong Kong | | | 1.8 | |
| Canada | | | 1.4 | |
| Finland | | | 1.3 | |
| China | | | 1.0 | |
| Belgium | | | 1.0 | |
| Ireland | | | 1.0 | |
| Austria | | | 0.9 | |
| South Korea | | | 0.8 | |
| Mexico | | | 0.4 | |
| Singapore | | | 0.3 | |
| Israel | | | 0.2 | |
| New Zealand | | | 0.2 | |
| Luxembourg | | | 0.2 | |
| Brazil | | | 0.2 | |
| Short-Term Investments | | | 1.0 | |
| | | | 100.0 | % |
| † | As a percentage of total investments. Please note that Fund holdings are as of December 31, 2012 and are subject to change. |
See Notes to Financial Statements.
| | | | |
| Legg Mason Batterymarch International Equity Trust 2012 Annual Report | | | 21 | |
Statement of assets and liabilities
December 31, 2012
| | | | |
| |
| Assets: | | | | |
Investments, at value (Cost — $238,472,850) | | $ | 266,641,112 | |
Foreign currency, at value (Cost — $2,941) | | | 2,946 | |
Cash | | | 275 | |
Receivable for Fund shares sold | | | 642,274 | |
Dividends and interest receivable | | | 546,338 | |
Unrealized appreciation on forward foreign currency contracts | | | 259,798 | |
Prepaid expenses | | | 49,462 | |
Total Assets | | | 268,142,205 | |
| |
| Liabilities: | | | | |
Payable for Fund shares repurchased | | | 662,482 | |
Investment management fee payable | | | 195,301 | |
Service and/or distribution fees payable | | | 65,174 | |
Accrued expenses | | | 186,191 | |
Total Liabilities | | | 1,109,148 | |
| Total Net Assets | | $ | 267,033,057 | |
| |
| Net Assets: | | | | |
Par value (Note 7) | | $ | 216 | |
Paid-in capital in excess of par value | | | 575,272,347 | |
Overdistributed net investment income | | | (366,865) | |
Accumulated net realized loss on investments and foreign currency transactions | | | (336,296,580) | |
Net unrealized appreciation on investments and foreign currencies | | | 28,423,939 | |
| Total Net Assets | | $ | 267,033,057 | |
| |
| Shares Outstanding: | | | | |
Class A | | | 425,242 | |
Class C | | | 5,983,436 | |
Class FI | | | 753,628 | |
Class R | | | 24,839 | |
Class I | | | 1,637,842 | |
Class IS | | | 12,774,453 | |
| |
| Net Asset Value: | | | | |
Class A (and redemption price) | | | $12.09 | |
Class C* | | | $12.12 | |
Class FI (and redemption price) | | | $12.50 | |
Class R (and redemption price) | | | $12.50 | |
Class I (and redemption price) | | | $12.48 | |
Class IS (and redemption price) | | | $12.46 | |
| Maximum Public Offering Price Per Share: | | | | |
Class A (based on maximum initial sales charge of 5.75%) | | | $12.83 | |
| * | Redemption price per share is NAV of Class C shares reduced by a 1.00% CDSC, if shares are redeemed within one year from purchase payment (See Note 2). |
See Notes to Financial Statements.
| | |
| 22 | | Legg Mason Batterymarch International Equity Trust 2012 Annual Report |
Statement of operations
For the Year Ended December 31, 2012
| | | | |
| |
| Investment Income: | | | | |
Dividends | | $ | 9,932,934 | |
Interest | | | 3,271 | |
Less: Foreign taxes withheld | | | (763,656) | |
Total Investment Income | | | 9,172,549 | |
| |
| Expenses: | | | | |
Investment management fee (Note 2) | | | 2,058,998 | |
Service and/or distribution fees (Notes 2 and 5) | | | 817,738 | |
Transfer agent fees (Note 5) | | | 192,453 | |
Custody fees | | | 113,477 | |
Registration fees | | | 92,817 | |
Trustees’ fees | | | 84,321 | |
Legal fees | | | 50,089 | |
Audit and tax | | | 40,553 | |
Fund accounting fees | | | 37,138 | |
Shareholder reports | | | 36,117 | |
Insurance | | | 8,165 | |
Fees recaptured by investment manager (Note 2) | | | 1,375 | |
Miscellaneous expenses | | | 22,755 | |
Total Expenses | | | 3,555,996 | |
Less: Fee waivers and/or expense reimbursements (Notes 2 and 5) | | | (15,883) | |
Net Expenses | | | 3,540,113 | |
| Net Investment Income | | | 5,632,436 | |
| |
Realized and Unrealized Gain (Loss) on Investments and
Foreign Currency Transactions (Notes 1, 3 and 4): | | | | |
Net Realized Loss From: | | | | |
Investment transactions | | | (8,254,892) | |
Foreign currency transactions | | | (55,827) | |
Net Realized Loss | | | (8,310,719) | |
Change in Net Unrealized Appreciation (Depreciation) From: | | | | |
Investments | | | 37,879,982 | |
Foreign currencies | | | 259,149 | |
Change in Net Unrealized Appreciation (Depreciation) | | | 38,139,131 | |
| Net Gain on Investments and Foreign Currency Transactions | | | 29,828,412 | |
| Increase in Net Assets from Operations | | $ | 35,460,848 | |
See Notes to Financial Statements.
| | | | |
| Legg Mason Batterymarch International Equity Trust 2012 Annual Report | | | 23 | |
Statements of changes in net assets
| | | | | | | | |
| For the Years Ended December 31, | | 2012 | | | 2011 | |
| | |
| Operations: | | | | | | | | |
Net investment income | | $ | 5,632,436 | | | $ | 7,094,983 | |
Net realized gain (loss) | | | (8,310,719) | | | | 12,388,212 | |
Change in net unrealized appreciation (depreciation) | | | 38,139,131 | | | | (60,259,167) | |
Increase (Decrease) in Net Assets From Operations | | | 35,460,848 | | | | (40,775,972) | |
| | |
| Distributions to Shareholders From (Notes 1 and 6): | | | | | | | | |
Net investment income | | | (5,966,604) | | | | (7,150,016) | |
Decrease in Net Assets From Distributions to Shareholders | | | (5,966,604) | | | | (7,150,016) | |
| | |
| Fund Share Transactions (Note 7): | | | | | | | | |
Net proceeds from sale of shares | | | 40,770,471 | | | | 43,220,953 | |
Reinvestment of distributions | | | 5,647,572 | | | | 6,830,331 | |
Cost of shares repurchased | | | (99,134,648) | | | | (111,996,193) | |
Decrease in Net Assets From Fund Share Transactions | | | (52,716,605) | | | | (61,944,909) | |
Decrease in Net Assets | | | (23,222,361) | | | | (109,870,897) | |
| | |
| Net Assets: | | | | | | | | |
Beginning of year | | | 290,255,418 | | | | 400,126,315 | |
End of year* | | $ | 267,033,057 | | | $ | 290,255,418 | |
* Includes (overdistributed) undistributed net investment income, respectively, of: | | | $(366,865) | | | | $23,130 | |
See Notes to Financial Statements.
| | |
| 24 | | Legg Mason Batterymarch International Equity Trust 2012 Annual Report |
Financial highlights
| | | | | | | | | | | | | | | | |
For a share of each class of beneficial interest outstanding throughout each year ended December 31,
unless otherwise noted: | |
| Class A Shares1,2 | | 2012 | | | 2011 | | | 2010 | | | 20093 | |
| | | | |
| Net asset value, beginning of year | | | $10.92 | | | | $12.80 | | | | $11.98 | | | | $9.20 | |
| | | | |
| Income (loss) from operations: | | | | | | | | | | | | | | | | |
Net investment income | | | 0.23 | | | | 0.25 | | | | 0.17 | | | | 0.23 | |
Net realized and unrealized gain (loss) | | | 1.21 | | | | (1.86) | | | | 0.90 | | | | 2.80 | |
Total income (loss) from operations | | | 1.44 | | | | (1.61) | | | | 1.07 | | | | 3.03 | |
| | | | |
| Less distributions from: | | | | | | | | | | | | | | | | |
Net investment income | | | (0.27) | | | | (0.27) | | | | (0.25) | | | | (0.25) | |
Total distributions | | | (0.27) | | | | (0.27) | | | | (0.25) | | | | (0.25) | |
| | | | |
| Net asset value, end of year | | | $12.09 | | | | $10.92 | | | | $12.80 | | | | $11.98 | |
Total return4 | | | 13.23 | % | | | (12.54) | % | | | 8.95 | % | | | 32.94 | % |
| | | | |
| Net assets, end of year (000s) | | | $5,142 | | | | $5,753 | | | | $7,583 | | | | $9,322 | |
| | | | |
| Ratios to average net assets: | | | | | | | | | | | | | | | | |
Gross expenses | | | 1.42 | % | | | 1.34 | %5 | | | 1.32 | % | | | 1.19 | %6 |
Net expenses7,8 | | | 1.35 | 9 | | | 1.34 | 5 | | | 1.28 | 9 | | | 1.19 | 6,9 |
Net investment income | | | 1.98 | | | | 2.00 | | | | 1.44 | | | | 2.40 | 6 |
| | | | |
| Portfolio turnover rate | | | 67 | % | | | 58 | % | | | 92 | % | | | 123 | % |
| 1 | Per share amounts have been calculated using the average shares method. |
| 2 | Represents a share of capital stock outstanding prior to April 30, 2012. |
| 3 | For the period February 3, 2009 (commencement of operations) to December 31, 2009. |
| 4 | Performance figures, exclusive of sale charges, may reflect compensating balance arrangements, fee waivers and/or expense reimbursements. In the absence of compensating balance arrangements, fee waivers and/or expense reimbursements, the total return would have been lower. Past performance is no guarantee of future results. Total returns for periods of less than one year are not annualized. |
| 5 | Reflects recapture of fees waived and/or expenses reimbursed from prior fiscal years. |
| 7 | The impact of compensating balance arrangements, if any, was less than 0.01%. |
| 8 | As a result of an expense limitation arrangement, the ratio of expenses, other than interest, brokerage commissions, dividend expenses on short sales, taxes, extraordinary expenses and acquired fund fees and expenses, to average net assets of Class A shares did not exceed 1.35%. This expense limitation arrangement cannot be terminated prior to December 31, 2014 without the Board of Trustees’ consent. |
| 9 | Reflects fee waivers and/or expense reimbursements. |
See Notes to Financial Statements.
| | | | |
| Legg Mason Batterymarch International Equity Trust 2012 Annual Report | | | 25 | |
| | | | | | | | | | | | | | | | | | | | |
| For a share of each class of beneficial interest outstanding throughout each year ended December 31: | |
| Class C Shares1,2,3 | | 2012 | | | 2011 | | | 2010 | | | 2009 | | | 2008 | |
| | | | | |
| Net asset value, beginning of year | | | $10.93 | | | | $12.82 | | | | $12.00 | | | | $10.16 | | | | $19.31 | |
| | | | | |
| Income (loss) from operations: | | | | | | | | | | | | | | | | | | | | |
Net investment income | | | 0.15 | | | | 0.17 | | | | 0.08 | | | | 0.16 | | | | 0.29 | |
Net realized and unrealized gain (loss) | | | 1.22 | | | | (1.87) | | | | 0.90 | | | | 1.84 | | | | (9.16) | |
Total income (loss) from operations | | | 1.37 | | | | (1.70) | | | | 0.98 | | | | 2.00 | | | | (8.87) | |
| | | | | |
| Less distributions from: | | | | | | | | | | | | | | | | | | | | |
Net investment income | | | (0.18) | | | | (0.19) | | | | (0.16) | | | | (0.16) | | | | (0.28) | |
Total distributions | | | (0.18) | | | | (0.19) | | | | (0.16) | | | | (0.16) | | | | (0.28) | |
| | | | | |
| Net asset value, end of year | | | $12.12 | | | | $10.93 | | | | $12.82 | | | | $12.00 | | | | $10.16 | |
Total return4 | | | 12.52 | % | | | (13.22) | % | | | 8.13 | % | | | 19.65 | % | | | (45.95) | % |
| | | | | |
| Net assets, end of year (000s) | | | $72,504 | | | | $84,442 | | | | $136,014 | | | | $163,709 | | | | $192,768 | |
| | | | | |
| Ratios to average net assets: | | | | | | | | | | | | | | | | | | | | |
Gross expenses | | | 2.08 | % | | | 2.05 | %5 | | | 2.03 | % | | | 1.96 | % | | | 1.92 | % |
Net expenses6,7 | | | 2.08 | | | | 2.05 | 5 | | | 2.03 | 8 | | | 1.95 | 8 | | | 1.92 | 8 |
Net investment income | | | 1.28 | | | | 1.35 | | | | 0.66 | | | | 1.54 | | | | 1.86 | |
| | | | | |
| Portfolio turnover rate | | | 67 | % | | | 58 | % | | | 92 | % | | | 123 | % | | | 114 | % |
| 1 | On February 1, 2009, Primary Class shares were renamed Class C shares. |
| 2 | Per share amounts have been calculated using the average shares method. |
| 3 | Represents a share of capital stock outstanding prior to April 30, 2012. |
| 4 | Performance figures, exclusive of CDSC, may reflect compensating balance arrangements, fee waivers and/or expense reimbursements. In the absence of compensating balance arrangements, fee waivers and/or expense reimbursements, the total return would have been lower. Past performance is no guarantee of future results. |
| 5 | Reflects recapture of fees waived and/or expenses reimbursed from prior fiscal years. |
| 6 | As a result of an expense limitation arrangement, the ratio of expenses, other than interest, brokerage commissions, dividend expense on short sales, taxes, extraordinary expenses and acquired fund fees and expenses, to average net assets of Class C shares did not exceed 2.10%. This expense limitation arrangement cannot be terminated prior to December 31, 2014 without the Board of Trustees’ consent. |
| 7 | The impact of compensating balance arrangements, if any, was less than 0.01%. |
| 8 | Reflects fee waivers and/or expense reimbursements. |
See Notes to Financial Statements.
| | |
| 26 | | Legg Mason Batterymarch International Equity Trust 2012 Annual Report |
Financial highlights (cont’d)
| | | | | | | | | | | | | | | | | | | | |
| For a share of each class of beneficial interest outstanding throughout each year ended December 31: | |
| Class FI Shares1,2,3 | | 2012 | | | 2011 | | | 2010 | | | 2009 | | | 2008 | |
| | | | | |
| Net asset value, beginning of year | | | $11.28 | | | | $13.21 | | | | $12.36 | | | | $10.47 | | | | $20.01 | |
| | | | | |
| Income (loss) from operations: | | | | | | | | | | | | | | | | | | | | |
Net investment income | | | 0.24 | | | | 0.27 | | | | 0.19 | | | | 0.25 | | | | 0.40 | |
Net realized and unrealized gain (loss) | | | 1.25 | | | | (1.92) | | | | 0.91 | | | | 1.88 | | | | (9.51) | |
Total income (loss) from operations | | | 1.49 | | | | (1.65) | | | | 1.10 | | | | 2.13 | | | | (9.11) | |
| | | | | |
| Less distributions from: | | | | | | | | | | | | | | | | | | | | |
Net investment income | | | (0.27) | | | | (0.28) | | | | (0.25) | | | | (0.24) | | | | (0.43) | |
Total distributions | | | (0.27) | | | | (0.28) | | | | (0.25) | | | | (0.24) | | | | (0.43) | |
| | | | | |
| Net asset value, end of year | | | $12.50 | | | | $11.28 | | | | $13.21 | | | | $12.36 | | | | $10.47 | |
Total return4 | | | 13.26 | % | | | (12.49) | % | | | 8.92 | % | | | 20.35 | % | | | (45.54) | % |
| | | | | |
| Net assets, end of year (000s) | | | $9,420 | | | | $9,514 | | | | $12,787 | | | | $25,798 | | | | $32,050 | |
| | | | | |
| Ratios to average net assets: | | | | | | | | | | | | | | | | | | | | |
Gross expenses | | | 1.47 | %5 | | | 1.34 | % | | | 1.27 | % | | | 1.28 | % | | | 1.22 | % |
Net expenses6,7 | | | 1.35 | 5,8 | | | 1.31 | 8 | | | 1.27 | | | | 1.28 | | | | 1.22 | |
Net investment income | | | 1.99 | | | | 2.08 | | | | 1.54 | | | | 2.38 | | | | 2.51 | |
| | | | | |
| Portfolio turnover rate | | | 67 | % | | | 58 | % | | | 92 | % | | | 123 | % | | | 114 | % |
| 1 | On October 5, 2009, Financial Intermediary shares were renamed Class FI shares. |
| 2 | Per share amounts have been calculated using the average shares method. |
| 3 | Represents a share of capital stock outstanding prior to April 30, 2012. |
| 4 | Performance figures may reflect compensating balance arrangements, fee waivers and/or expense reimbursements. In the absence of compensating balance arrangements, fee waivers and/or expense reimbursements, the total return would have been lower. Past performance is no guarantee of future results. |
| 5 | Reflects recapture of fees waived and/or expenses reimbursed from prior fiscal years. |
| 6 | The impact of compensating balance arrangements, if any, was less than 0.01%. |
| 7 | As a result of an expense limitation arrangement, the ratio of expenses, other than interest, brokerage commissions, dividend expense on short sales, taxes, extraordinary expenses and acquired fund fees and expenses, to average net assets of Class FI shares did not exceed 1.35%. This expense limitation arrangement cannot be terminated prior to December 31, 2014 without the Board of Trustees’ consent. |
| 8 | Reflects fee waivers and/or expense reimbursements. |
See Notes to Financial Statements.
| | | | |
| Legg Mason Batterymarch International Equity Trust 2012 Annual Report | | | 27 | |
| | | | | | | | | | | | | | | | | | | | |
| For a share of each class of beneficial interest outstanding throughout each year ended December 31: | |
| Class R Shares1,2 | | 2012 | | | 2011 | | | 2010 | | | 2009 | | | 2008 | |
| | | | | |
| Net asset value, beginning of year | | | $11.28 | | | | $13.22 | | | | $12.37 | | | | $10.47 | | | | $19.95 | |
| | | | | |
| Income (loss) from operations: | | | | | | | | | | | | | | | | | | | | |
Net investment income | | | 0.21 | | | | 0.27 | | | | 0.14 | | | | 0.22 | | | | 0.34 | |
Net realized and unrealized gain (loss) | | | 1.26 | | | | (1.97) | | | | 0.92 | | | | 1.88 | | | | (9.47) | |
Total income (loss) from operations | | | 1.47 | | | | (1.70) | | | | 1.06 | | | | 2.10 | | | | (9.13) | |
| | | | | |
| Less distributions from: | | | | | | | | | | | | | | | | | | | | |
Net investment income | | | (0.25) | | | | (0.24) | | | | (0.21) | | | | (0.20) | | | | (0.35) | |
Total distributions | | | (0.25) | | | | (0.24) | | | | (0.21) | | | | (0.20) | | | | (0.35) | |
| | | | | |
| Net asset value, end of year | | | $12.50 | | | | $11.28 | | | | $13.22 | | | | $12.37 | | | | $10.47 | |
Total return3 | | | 13.06 | % | | | (12.81) | % | | | 8.56 | % | | | 20.06 | % | | | (45.80) | % |
| | | | | |
| Net assets, end of year (000s) | | | $311 | | | | $267 | | | | $1,164 | | | | $1,898 | | | | $2,598 | |
| | | | | |
| Ratios to average net assets: | | | | | | | | | | | | | | | | | | | | |
Gross expenses | | | 1.72 | %4 | | | 1.94 | %4 | | | 1.74 | % | | | 1.89 | % | | | 1.71 | % |
Net expenses5,6,7 | | | 1.58 | 4 | | | 1.58 | 4 | | | 1.60 | | | | 1.60 | | | | 1.60 | |
Net investment income | | | 1.73 | | | | 2.02 | | | | 1.13 | | | | 2.08 | | | | 2.17 | |
| | | | | |
| Portfolio turnover rate | | | 67 | % | | | 58 | % | | | 92 | % | | | 123 | % | | | 114 | % |
| 1 | Per share amounts have been calculated using the average shares method. |
| 2 | Represents a share of capital stock outstanding prior to April 30, 2012. |
| 3 | Performance figures may reflect compensating balance arrangements, fee waivers and/or expense reimbursements. In the absence of compensating balance arrangements, fee waivers and/or expense reimbursements, the total return would have been lower. Past performance is no guarantee of future results. |
| 4 | Reflects recapture of fees waived and/or expenses reimbursed from prior fiscal years. |
| 5 | The impact of compensating balance arrangements, if any, was less than 0.01%. |
| 6 | As a result of an expense limitation arrangement, the ratio of expenses, other than interest, brokerage commissions, dividend expense on short sales, taxes, extraordinary expenses and acquired fund fees and expenses, to average net assets of Class R shares did not exceed 1.60%. This expense limitation arrangement cannot be terminated prior to December 31, 2014 without the Board of Trustees’ consent. |
| 7 | Reflects fee waivers and/or expense reimbursements. |
See Notes to Financial Statements.
| | |
| 28 | | Legg Mason Batterymarch International Equity Trust 2012 Annual Report |
Financial highlights (cont’d)
| | | | | | | | | | | | | | | | | | | | |
| For a share of each class of beneficial interest outstanding throughout each year ended December 31: | |
| Class I Shares1,2,3 | | 2012 | | | 2011 | | | 2010 | | | 2009 | | | 2008 | |
| | | | | |
| Net asset value, beginning of year | | | $11.26 | | | | $13.19 | | | | $12.33 | | | | $10.44 | | | | $19.99 | |
| | | | | |
| Income (loss) from operations: | | | | | | | | | | | | | | | | | | | | |
Net investment income | | | 0.30 | | | | 0.30 | | | | 0.21 | | | | 0.28 | | | | 0.53 | |
Net realized and unrealized gain (loss) | | | 1.23 | | | | (1.92) | | | | 0.95 | | | | 1.90 | | | | (9.60) | |
Total income (loss) from operations | | | 1.53 | | | | (1.62) | | | | 1.16 | | | | 2.18 | | | | (9.07) | |
| | | | | |
| Less distributions from: | | | | | | | | | | | | | | | | | | | | |
Net investment income | | | (0.31) | | | | (0.31) | | | | (0.30) | | | | (0.29) | | | | (0.48) | |
Total distributions | | | (0.31) | | | | (0.31) | | | | (0.30) | | | | (0.29) | | | | (0.48) | |
| | | | | |
| Net asset value, end of year | | | $12.48 | | | | $11.26 | | | | $13.19 | | | | $12.33 | | | | $10.44 | |
Total return4 | | | 13.70 | % | | | (12.22) | % | | | 9.36 | % | | | 20.87 | % | | | (45.38) | % |
| | | | | |
| Net assets, end of year (000s) | | | $20,448 | | | | $48,464 | | | | $83,879 | | | | $89,298 | | | | $85,952 | |
| | | | | |
| Ratios to average net assets: | | | | | | | | | | | | | | | | | | | | |
Gross expenses | | | 1.00 | % | | | 0.98 | % | | | 0.96 | % | | | 0.91 | % | | | 0.86 | % |
Net expenses5,6 | | | 1.00 | | | | 0.98 | | | | 0.96 | 7 | | | 0.90 | 7 | | | 0.86 | 7 |
Net investment income | | | 2.55 | | | | 2.30 | | | | 1.74 | | | | 2.58 | | | | 3.06 | |
| | | | | |
| Portfolio turnover rate | | | 67 | % | | | 58 | % | | | 92 | % | | | 123 | % | | | 114 | % |
| 1 | On October 5, 2009, Institutional Class shares were renamed Class I shares. |
| 2 | Per share amounts have been calculated using the average shares method. |
| 3 | Represents a share of capital stock outstanding prior to April 30, 2012. |
| 4 | Performance figures may reflect compensating balance arrangements, fee waivers and/or expense reimbursements. In the absence of compensating balance arrangements, fee waivers and/or expense reimbursements, the total return would have been lower. Past performance is no guarantee of future results. |
| 5 | The impact of compensating balance arrangements, if any, was less than 0.01%. |
| 6 | As a result of an expense limitation arrangement, the ratio of expenses, other than interest, brokerage commissions, dividend expense on short sales, taxes, extraordinary expenses and acquired fund fees and expenses, to average net assets of Class I shares did not exceed 1.10%. This expense limitation arrangement cannot be terminated prior to December 31, 2014 without the Board of Trustees’ consent. |
| 7 | Reflects fee waivers and/or expense reimbursements. |
See Notes to Financial Statements.
| | | | |
| Legg Mason Batterymarch International Equity Trust 2012 Annual Report | | | 29 | |
| | | | | | | | | | | | | | | | | | | | |
For a share of each class of beneficial interest outstanding throughout each year ended December 31,
unless otherwise noted: | |
| Class IS Shares1,2,3 | | 2012 | | | 2011 | | | 2010 | | | 2009 | | | 20084 | |
| | | | | |
| Net asset value, beginning of year | | | $11.25 | | | | $13.18 | | | | $12.33 | | | | $10.44 | | | | $16.48 | |
| | | | | |
| Income (loss) from operations: | | | | | | | | | | | | | | | | | | | | |
Net investment income | | | 0.28 | | | | 0.32 | | | | 0.23 | | | | 0.28 | | | | 0.11 | |
Net realized and unrealized gain (loss) | | | 1.26 | | | | (1.93) | | | | 0.93 | | | | 1.91 | | | | (5.69) | |
Total income (loss) from operations | | | 1.54 | | | | (1.61) | | | | 1.16 | | | | 2.19 | | | | (5.58) | |
| | | | | |
| Less distributions from: | | | | | | | | | | | | | | | | | | | | |
Net investment income | | | (0.33) | | | | (0.32) | | | | (0.31) | | | | (0.30) | | | | (0.46) | |
Total distributions | | | (0.33) | | | | (0.32) | | | | (0.31) | | | | (0.30) | | | | (0.46) | |
| | | | | |
| Net asset value, end of year | | | $12.46 | | | | $11.25 | | | | $13.18 | | | | $12.33 | | | | $10.44 | |
Total return5 | | | 13.68 | % | | | (12.14) | % | | | 9.37 | % | | | 20.92 | % | | | (33.81) | % |
| | | | | |
| Net assets, end of year (000s) | | | $159,208 | | | | $141,815 | | | | $158,699 | | | | $284,206 | | | | $234,531 | |
| | | | | |
| Ratios to average net assets: | | | | | | | | | | | | | | | | | | | | |
Gross expenses | | | 0.93 | % | | | 0.89 | % | | | 0.88 | % | | | 0.86 | % | | | 0.85 | %6 |
Net expenses7,8 | | | 0.93 | 9 | | | 0.89 | | | | 0.88 | | | | 0.86 | | | | 0.85 | 6 |
Net investment income | | | 2.35 | | | | 2.47 | | | | 1.92 | | | | 2.57 | | | | 2.25 | 6 |
| | | | | |
| Portfolio turnover rate | | | 67 | % | | | 58 | % | | | 92 | % | | | 123 | % | | | 114 | % |
| 1 | As of October 5, 2009, Institutional Select Class shares were renamed as Class IS shares. |
| 2 | Per share amounts have been calculated using the average shares method. |
| 3 | Represents a share of capital stock outstanding prior to April 30, 2012. |
| 4 | For the period August 4, 2008 (commencement of operations) to December 31, 2008. |
| 5 | Performance figures may reflect compensating balance arrangements, fee waivers and/or expense reimbursements. In the absence of compensating balance arrangements, fee waivers and/or expense reimbursements, the total return would have been lower. Past performance is no guarantee of future results. Total returns for periods of less than one year are not annualized. |
| 7 | The impact of compensating balance arrangements, if any, was less than 0.01%. |
| 8 | As a result of an expense limitation arrangement, the ratio of expenses, other than interest, brokerage commissions, dividend expense on short sales, taxes, extraordinary expenses and acquired fund fees and expenses, to average net assets of Class IS shares did not exceed the total annual operating expenses of Class I shares. This expense limitation arrangement cannot be terminated prior to December 31, 2014 without the Board of Trustees’ consent. |
| 9 | Reflects fee waivers and/or expense reimbursements. |
See Notes to Financial Statements.
| | |
| 30 | | Legg Mason Batterymarch International Equity Trust 2012 Annual Report |
Notes to financial statements
1. Organization and significant accounting policies
Legg Mason Batterymarch International Equity Trust (the “Fund”) is a separate diversified investment series of Legg Mason Global Asset Management Trust (the “Trust”). The Trust, a Maryland statutory trust, is registered under the Investment Company Act of 1940, as amended (the “1940 Act”), as an open-end management investment company. On April 30, 2012, the Fund was reorganized as a new series of the Trust. Prior to April 30, 2012, the Fund was organized as a series of Legg Mason Global Trust, Inc., a Maryland Corporation.
The following are significant accounting policies consistently followed by the Fund and are in conformity with U.S. generally accepted accounting principles (“GAAP”). Estimates and assumptions are required to be made regarding assets, liabilities and changes in net assets resulting from operations when financial statements are prepared. Changes in the economic environment, financial markets and any other parameters used in determining these estimates could cause actual results to differ. Subsequent events have been evaluated through the date the financial statements were issued.
(a) Investment valuation. Equity securities for which market quotations are available are valued at the last reported sales price or official closing price on the primary market or exchange on which they trade. The valuations for fixed income securities (which may include, but are not limited to, corporate, government, municipal, mortgage-backed, collateralized mortgage obligations and asset-backed securities) and certain derivative instruments are typically the prices supplied by independent third party pricing services, which may use market prices or broker/dealer quotations or a variety of valuation techniques and methodologies. The independent third party pricing services use inputs that are observable such as issuer details, interest rates, yield curves, prepayment speeds, credit risks/spreads, default rates and quoted prices for similar securities. Short-term fixed income securities that will mature in 60 days or less are valued at amortized cost, unless it is determined that using this method would not reflect an investment’s fair value. When the Fund holds securities or other assets that are denominated in a foreign currency, the Fund will normally use the currency exchange rates as of 4:00 p.m. (Eastern Time). If independent third party pricing services are unable to supply prices for a portfolio investment, or if the prices supplied are deemed by the manager to be unreliable, the market price may be determined by the manager using quotations from one or more broker/dealers or at the transaction price if the security has recently been purchased and no value has yet been obtained from a pricing service or pricing broker. When reliable prices are not readily available, such as when the value of a security has been significantly affected by events after the close of the exchange or market on which the security is principally traded, but before the Fund calculates its net asset value, the Fund values these securities as determined in accordance with procedures approved by the Fund’s Board of Trustees.
The Board of Trustees is responsible for the valuation process and has delegated the supervision of the daily valuation process to the Legg Mason North American Fund Valuation Committee (the “Valuation Committee”). The Valuation Committee, pursuant to the policies adopted by the Board of Trustees, is responsible for making fair
| | | | |
| Legg Mason Batterymarch International Equity Trust 2012 Annual Report | | | 31 | |
value determinations, evaluating the effectiveness of the Fund’s pricing policies, and reporting to the Board of Trustees. When determining the reliability of third party pricing information for investments owned by the Fund, the Valuation Committee, among other things, conducts due diligence reviews of pricing vendors, monitors the daily change in prices and reviews transactions among market participants.
The Valuation Committee will consider pricing methodologies it deems relevant and appropriate when making fair value determinations. Examples of possible methodologies include, but are not limited to, multiple of earnings; discount from market of a similar freely traded security; discounted cash-flow analysis; book value or a multiple thereof; risk premium/yield analysis; yield to maturity; and/or fundamental investment analysis. The Valuation Committee will also consider factors it deems relevant and appropriate in light of the facts and circumstances. Examples of possible factors include, but are not limited to, the type of security; the issuer’s financial statements; the purchase price of the security; the discount from market value of unrestricted securities of the same class at the time of purchase; analysts’ research and observations from financial institutions; information regarding any transactions or offers with respect to the security; the existence of merger proposals or tender offers affecting the security; the price and extent of public trading in similar securities of the issuer or comparable companies; and the existence of a shelf registration for restricted securities.
For each portfolio security that has been fair valued pursuant to the policies adopted by the Board of Trustees, the fair value price is compared against the last available and next available market quotations. The Valuation Committee reviews the results of such back testing monthly and fair valuation occurrences are reported to the Board of Trustees quarterly.
The Fund uses valuation techniques to measure fair value that are consistent with the market approach and/or income approach, depending on the type of security and the particular circumstance. The market approach uses prices and other relevant information generated by market transactions involving identical or comparable securities. The income approach uses valuation techniques to discount estimated future cash flows to present value.
GAAP establishes a disclosure hierarchy that categorizes the inputs to valuation techniques used to value assets and liabilities at measurement date. These inputs are summarized in the three broad levels listed below:
| Ÿ | | Level 1 — quoted prices in active markets for identical investments |
| Ÿ | | Level 2 — other significant observable inputs (including quoted prices for similar investments, interest rates, prepayment speeds, credit risk, etc.) |
| Ÿ | | Level 3 — significant unobservable inputs (including the Fund’s own assumptions in determining the fair value of investments) |
The inputs or methodologies used to value securities are not necessarily an indication of the risk associated with investing in those securities.
| | |
| 32 | | Legg Mason Batterymarch International Equity Trust 2012 Annual Report |
Notes to financial statements (cont’d)
The following is a summary of the inputs used in valuing the Fund’s assets carried at fair value:
| | | | | | | | | | | | | | | | |
| ASSETS | |
| Description | | Quoted Prices
(Level 1) | | | Other Significant
Observable Inputs
(Level 2) | | | Significant
Unobservable
Inputs
(Level 3) | | | Total | |
| Long-term investments†: | | | | | | | | | | | | | | | | |
Common stocks: | | | | | | | | | | | | | | | | |
Consumer discretionary | | $ | 544,047 | | | $ | 26,656,315 | | | | — | | | $ | 27,200,362 | |
Consumer staples | | | 884,977 | | | | 27,051,002 | | | | — | | | | 27,935,979 | |
Energy | | | 885,869 | | | | 21,240,825 | | | | — | | | | 22,126,694 | |
Financials | | | — | | | | 66,938,579 | | | | — | | | | 66,938,579 | |
Health care | | | 690,790 | | | | 30,429,161 | | | | — | | | | 31,119,951 | |
Industrials | | | 855,327 | | | | 29,787,251 | | | | — | | | | 30,642,578 | |
Information technology | | | — | | | | 12,062,770 | | | | — | | | | 12,062,770 | |
Materials | | | — | | | | 18,616,016 | | | | — | | | | 18,616,016 | |
Telecommunication services | | | 1,645,128 | | | | 16,045,448 | | | | — | | | | 17,690,576 | |
Utilities | | | — | | | | 7,160,087 | | | | — | | | | 7,160,087 | |
Preferred stocks: | | | | | | | | | | | | | | | | |
Consumer discretionary | | | — | | | | 1,866,904 | | | | — | | | | 1,866,904 | |
Financials | | | — | | | | 523,616 | | | | — | | | | 523,616 | |
| Total long-term investments | | $ | 5,506,138 | | | $ | 258,377,974 | | | | — | | | $ | 263,884,112 | |
| Total short-term investments† | | | — | | | | 2,757,000 | | | | — | | | | 2,757,000 | |
| Total investments | | $ | 5,506,138 | | | $ | 261,134,974 | | | | — | | | $ | 266,641,112 | |
| Other financial instruments: | | | | | | | | | | | | | | | | |
Forward currency contracts | | | — | | | $ | 259,798 | | | | — | | | $ | 259,798 | |
| Total | | $ | 5,506,138 | | | $ | 261,394,772 | | | | — | | | $ | 266,900,910 | |
| † | See Schedule of Investments for additional detailed categorizations. |
For the year ended December 31, 2012, as a result of the fair value pricing procedures for international equities utilized by the Fund, certain securities have transferred in and out of Level 1 and Level 2 measurements during the period. The Fund’s policy is to recognize transfers between levels as of the end of the reporting period. At December 31, 2012, securities valued at $165,228,677 were temporarily transferred from Level 1 to Level 2 within the fair value hierarchy because fair value procedures were applied when the change in value of a domestic equity security index suggested that the closing prices on foreign exchanges may no longer have represented the value of those securities at the time of closing of the NYSE.
(b) Repurchase agreements. The Fund may enter into repurchase agreements with institutions that its investment adviser has determined are creditworthy. Each repurchase agreement is recorded at cost. Under the terms of a typical repurchase agreement, the Fund acquires a debt security subject to an obligation of the seller to repurchase, and of the Fund to resell, the security at an agreed-upon price and time, thereby determining the yield during the Fund’s holding period. When entering into repurchase agreements, it is the Fund’s policy that its custodian or a third
| | | | |
| Legg Mason Batterymarch International Equity Trust 2012 Annual Report | | | 33 | |
party custodian, acting on the Fund’s behalf, take possession of the underlying collateral securities, the market value of which, at all times, at least equals the principal amount of the repurchase transaction, including accrued interest. To the extent that any repurchase transaction maturity exceeds one business day, the value of the collateral is marked-to-market and measured against the value of the agreement in an effort to ensure the adequacy of the collateral. If the counterparty defaults, the Fund generally has the right to use the collateral to satisfy the terms of the repurchase transaction. However, if the market value of the collateral declines during the period in which the Fund seeks to assert its rights or if bankruptcy proceedings are commenced with respect to the seller of the security, realization of the collateral by the Fund may be delayed or limited.
(c) Foreign currency translation. Investment securities and other assets and liabilities denominated in foreign currencies are translated into U.S. dollar amounts based upon prevailing exchange rates on the date of valuation. Purchases and sales of investment securities and income and expense items denominated in foreign currencies are translated into U.S. dollar amounts based upon prevailing exchange rates on the respective dates of such transactions.
The Fund does not isolate that portion of the results of operations resulting from fluctuations in foreign exchange rates on investments from the fluctuations arising from changes in market prices of securities held. Such fluctuations are included with the net realized and unrealized gain or loss on investments.
Net realized foreign exchange gains or losses arise from sales of foreign currencies, including gains and losses on forward foreign currency contracts, currency gains or losses realized between the trade and settlement dates on securities transactions, and the difference between the amounts of dividends, interest, and foreign withholding taxes recorded on the Fund’s books and the U.S. dollar equivalent of the amounts actually received or paid. Net unrealized foreign exchange gains and losses arise from changes in the values of assets and liabilities, other than investments in securities, on the date of valuation, resulting from changes in exchange rates.
Foreign security and currency transactions may involve certain considerations and risks not typically associated with those of U.S. dollar denominated transactions as a result of, among other factors, the possibility of lower levels of governmental supervision and regulation of foreign securities markets and the possibility of political or economic instability.
(d) Forward foreign currency contracts. The Fund enters into a forward foreign currency contract to hedge against foreign currency exchange rate risk on its non-U.S. dollar denominated securities or to facilitate settlement of a foreign currency denominated portfolio transaction. A forward foreign currency contract is an agreement between two parties to buy and sell a currency at a set price with delivery and settlement at a future date. The contract is marked-to-market daily and the change in value is recorded by the Fund as an unrealized gain or loss. When a forward foreign currency contract is closed, through either delivery or offset by entering into another forward foreign currency contract, the Fund recognizes a realized gain or loss equal to the difference between the value of the contract at the time it was opened and the value of the contract at the time it is closed.
| | |
| 34 | | Legg Mason Batterymarch International Equity Trust 2012 Annual Report |
Notes to financial statements (cont’d)
Forward foreign currency contracts involve elements of market risk in excess of the amounts reflected on the Statement of Assets and Liabilities. The Fund bears the risk of an unfavorable change in the foreign exchange rate underlying the forward foreign currency contract. Risks may also arise upon entering into these contracts from the potential inability of the counterparties to meet the terms of their contracts.
(e) Foreign investment risks. The Fund’s investments in foreign securities may involve risks not present in domestic investments. Since securities may be denominated in foreign currencies, may require settlement in foreign currencies or pay interest or dividends in foreign currencies, changes in the relationship of these foreign currencies to the U.S. dollar can significantly affect the value of the investments and earnings of the Fund. Foreign investments may also subject the Fund to foreign government exchange restrictions, expropriation, taxation or other political, social or economic developments, all of which affect the market and/or credit risk of the investments.
(f) Counterparty risk and credit-risk-related contingent features of derivative instruments. The Fund may invest in certain securities or engage in other transactions, where the Fund is exposed to counterparty credit risk in addition to broader market risks. The Fund may invest in securities of issuers, which may also be considered counterparties as trading partners in other transactions. This may increase the risk of loss in the event of default or bankruptcy by the counterparty or if the counterparty otherwise fails to meet its contractual obligations. The Fund’s investment manager attempts to mitigate counterparty risk by (i) periodically assessing the creditworthiness of its trading partners, (ii) monitoring and/or limiting the amount of its net exposure to each individual counterparty based on its assessment and (iii) requiring collateral from the counterparty for certain transactions. Market events and changes in overall economic conditions may impact the assessment of such counterparty risk by the investment manager. In addition, declines in the values of underlying collateral received may expose the Fund to increased risk of loss.
The Fund has entered into master agreements with certain of its derivative counterparties that provide for general obligations, representations, agreements, collateral, events of default or termination and credit related contingent features. The credit related contingent features include, but are not limited to, a percentage decrease in the Fund’s net assets or NAV over a specified period of time. If these credit related contingent features were triggered, the derivatives counterparty could terminate the positions and demand payment or require additional collateral.
As of December 31, 2012, the Fund did not have any open derivative transactions with credit related contingent features in a net liability position.
(g) Security transactions and investment income. Security transactions are accounted for on a trade date basis. Interest income, adjusted for amortization of premium and accretion of discount, is recorded on the accrual basis. Dividend income is recorded on the ex-dividend date. Foreign dividend income is recorded on the ex-dividend date or as soon as practicable after the Fund determines the existence of a dividend declaration after exercising reasonable due diligence. The
| | | | |
| Legg Mason Batterymarch International Equity Trust 2012 Annual Report | | | 35 | |
cost of investments sold is determined by use of the specific identification method. To the extent any issuer defaults or a credit event occurs that impacts the issuer, the Fund may halt any additional interest income accruals and consider the realizability of interest accrued up to the date of default or credit event.
(h) Distributions to shareholders. Distributions from net investment income and distributions of net realized gains, if any, are declared at least annually. Distributions to shareholders of the Fund are recorded on the ex-dividend date and are determined in accordance with income tax regulations, which may differ from GAAP.
(i) Share class accounting. Investment income, common expenses and realized/unrealized gains (losses) on investments are allocated to the various classes of the Fund on the basis of daily net assets of each class. Fees relating to a specific class are charged directly to that share class.
(j) Compensating balance arrangements. The Fund has an arrangement with its custodian bank whereby a portion of the custodian’s fees is paid indirectly by credits earned on the Fund’s cash on deposit with the bank.
(k) Federal and other taxes. It is the Fund’s policy to comply with the federal income and excise tax requirements of the Internal Revenue Code of 1986 (the “Code”), as amended, applicable to regulated investment companies. Accordingly, the Fund intends to distribute its taxable income and net realized gains, if any, to shareholders in accordance with timing requirements imposed by the Code. Therefore, no federal or state income tax provision is required in the Fund’s financial statements.
Management has analyzed the Fund’s tax positions taken on income tax returns for all open tax years and has concluded that as of December 31, 2012, no provision for income tax is required in the Fund’s financial statements. The Fund’s federal and state income and federal excise tax returns for tax years for which the applicable statutes of limitations have not expired are subject to examination by the Internal Revenue Service and state departments of revenue.
Under the applicable foreign tax laws, a withholding tax may be imposed on interest, dividends and capital gains at various rates.
(l) Reclassification. GAAP requires that certain components of net assets be reclassified to reflect permanent differences between financial and tax reporting. These reclassifications have no effect on net assets or net asset values per share. During the current year, the following reclassifications have been made:
| | | | | | | | |
| | | Overdistributed Net
Investment Income | | | Accumulated Net
Realized Loss | |
| (a) | | $ | (55,827) | | | $ | 55,827 | |
| (a) | Reclassifications are primarily due to foreign currency transactions treated as ordinary income for tax purposes. |
| | |
| 36 | | Legg Mason Batterymarch International Equity Trust 2012 Annual Report |
Notes to financial statements (cont’d)
2. Investment advisory and management agreement and other transactions with affiliates
Legg Mason Partners Fund Advisor, LLC (“LMPFA”) is the Fund’s investment manager and Batterymarch Financial Management, Inc. (“Batterymarch”) is the Fund’s investment adviser. Effective February 2013, Western Asset Management Company (“Western Asset”) manages the Fund’s cash and short-term instruments. LMPFA, Batterymarch and Western Asset are wholly-owned subsidiaries of Legg Mason, Inc. (“Legg Mason”).
Under the investment management agreement, the Fund pays an investment management fee, calculated daily and paid monthly, at an annual rate of 0.75% of the Fund’s average daily net assets.
LMPFA provides administrative and certain oversight services to the Fund. LMPFA delegates to the investment advisor the day-to-day portfolio management of the Fund, except for the management of cash and short-term instruments, which effective February 2013 is provided by Western Asset. For its services, LMPFA pays Batterymarch and Western Asset an aggregate fee equal to 66 2/3% of the net management fee it receives from the Fund.
As a result of expense limitation arrangements between the Fund and LMPFA, the ratio of expenses other than interest, brokerage commissions, dividend expense on short sales, taxes, extraordinary expenses and acquired fund fees and expenses, to average net assets of Class A, Class C, Class FI, Class R and Class I shares did not exceed 1.35%, 2.10%, 1.35%, 1.60% and 1.10%, respectively. In addition, total annual fund operating expenses for Class IS shares did not exceed total annual fund operating expenses for Class I shares. These expense limitation arrangements cannot be terminated prior to December 31, 2014 without the Board of Trustees’ consent.
During the year ended December 31, 2012, fees waived and/or expenses reimbursed amounted to $15,883.
The investment manager is permitted to recapture amounts waived or reimbursed to a class within three years after the year in which the investment manager earned the fee or incurred the expense if the class’ total annual operating expenses have fallen to a level below the expense limitation (“expense cap”) in effect at the time the fees were earned or the expenses incurred. In no case will the investment manager recapture any amount that would result, on any particular business day of the Fund, in the class’ total annual operating expenses exceeding the expense cap or any other lower limit then in effect.
Pursuant to these arrangements, at December 31, 2012, the Fund had remaining fee waivers and/or expense reimbursements subject to recapture by LMPFA and respective dates of expiration as follows:
| | | | | | | | | | | | | | | | |
| | | Class A | | | Class FI | | | Class R | | | Class IS | |
| Expires December 31, 2014 | | | — | | | $ | 2,440 | | | $ | 1,811 | | | | — | |
| Expires December 31, 2015 | | $ | 3,893 | | | | 11,444 | | | | 408 | | | $ | 138 | |
| Fee waivers/expense reimbursement subject to recapture | | $ | 3,893 | | | $ | 13,884 | | | $ | 2,219 | | | $ | 138 | |
| | | | |
| Legg Mason Batterymarch International Equity Trust 2012 Annual Report | | | 37 | |
For the year ended December 31, 2012, LMPFA recaptured $967 and $408 for Class FI and R shares, respectively.
Legg Mason Investor Services, LLC (“LMIS”), a wholly-owned broker-dealer subsidiary of Legg Mason, serves as the Fund’s sole and exclusive distributor.
There is a maximum initial sales charge of 5.75% for Class A shares. There is a contingent deferred sales charge (“CDSC”) of 1.00% on Class C shares, which applies if redemption occurs within 12 months from purchase payment. In certain cases, Class A shares have a 1.00% CDSC, which applies if redemption occurs within 18 months from purchase payment (or within 12 months for shares purchased prior to August 1, 2012). This CDSC only applies to those purchases of Class A shares, which, when combined with current holdings of other shares of funds sold by LMIS, equal or exceed $1,000,000 in the aggregate. These purchases do not incur an initial sales charge.
For the year ended December 31, 2012, LMIS and its affiliates received sales charges of $103 on sales of the Fund’s Class A shares. In addition, for the year ended December 31, 2012, CDSCs paid to LMIS and its affiliates were:
| | | | | | | | |
| | | Class A | | | Class C | |
| CDSCs | | $ | 20 | | | $ | 1,882 | |
Under a Deferred Compensation Plan (the “Plan”), Trustees may elect to defer receipt of all or a specified portion of their compensation. A participating Trustee may select one or more funds managed by affiliates of Legg Mason in which his or her deferred trustee’s fees will be deemed to be invested. Deferred amounts remain in the Fund until distributed in accordance with the Plan.
All officers and one Trustee of the Trust are employees of Legg Mason or its affiliates and do not receive compensation from the Trust.
As of December 31, 2012, Legg Mason and its affiliates owned 56% of the Fund.
3. Investments
During the year ended December 31, 2012, the aggregate cost of purchases and proceeds from sales of investments (excluding short-term investments) were as follows:
| | | | |
| Purchases | | $ | 181,071,256 | |
| Sales | | | 236,467,727 | |
At December 31, 2012, the aggregate gross unrealized appreciation and depreciation of investments for federal income tax purposes were as follows:
| | | | |
| Gross unrealized appreciation | | $ | 34,342,570 | |
| Gross unrealized depreciation | | | (8,740,663) | |
| Net unrealized appreciation | | $ | 25,601,907 | |
At December 31, 2012, the Fund had the following open forward foreign currency contracts:
| | | | | | | | | | | | | | | | | | |
| Foreign Currency | | Counterparty | | Local
Currency | | | Market
Value | | | Settlement
Date | | | Unrealized
Gain | |
| Contracts to Sell: | | | | | | | | | | | | | |
| Japanese Yen | | State Street Bank & Trust Co. | | | 437,893,000 | | | $ | 5,054,889 | | | | 1/10/13 | | | $ | 259,798 | |
| | |
| 38 | | Legg Mason Batterymarch International Equity Trust 2012 Annual Report |
Notes to financial statements (cont’d)
4. Derivative instruments and hedging activities
GAAP requires enhanced disclosure about an entity’s derivative and hedging activities.
Below is a table, grouped by derivative type, that provides information about the fair value and the location of derivatives within the Statement of Assets and Liabilities at December 31, 2012.
| | | | |
| ASSET DERIVATIVES1 | |
| | | Foreign Exchange
Contracts Risk | |
| Forward foreign currency contracts | | $ | 259,798 | |
| 1 | Generally, the balance sheet location for asset derivatives is receivables/net unrealized appreciation (depreciation) and for liability derivatives is payables/net unrealized appreciation (depreciation). |
The following tables provide information about the effect of derivatives and hedging activities on the Fund’s Statement of Operations for the year ended December 31, 2012. The first table provides additional detail about the amounts and sources of gains (losses) realized on derivatives during the period. The second table provides additional information about the change in unrealized appreciation (depreciation) resulting from the Fund’s derivatives and hedging activities during the period.
| | | | |
| AMOUNT OF REALIZED GAIN (LOSS) ON DERIVATIVES RECOGNIZED | |
| | | Foreign Exchange
Contracts Risk | |
| Forward foreign currency contracts | | $ | 105,759 | |
|
| CHANGE IN UNREALIZED APPRECIATION (DEPRECIATION) ON DERIVATIVES RECOGNIZED | |
| | | Foreign Exchange
Contracts Risk | |
| Forward foreign currency contracts | | $ | 223,927 | |
During the year ended December 31, 2012, the volume of derivative activity for the Fund was as follows:
| | | | |
| | | Average Market
Value | |
| Forward foreign currency contracts (to buy)† | | $ | 573,789 | |
| Forward foreign currency contracts (to sell) | | | 8,964,132 | |
| † | At December 31, 2012 there were no open positions held in this derivative. |
5. Class specific expenses, waivers and/or expense reimbursements
The Fund has adopted Rule 12b-1 distribution plans and under the plans the Fund pays a service fee with respect to its Class A, Class C, Class FI and Class R shares calculated at the annual rate of 0.25% of the average daily net assets of each class, respectively. The Fund also pays a distribution fee with respect to its Class C and Class R shares calculated at the annual rate of 0.75% and 0.25%, respectively, of the average daily net assets of each class. The Rule 12b-1 plans for Class FI and Class R provide for payments of distribution and service fees to LMIS at an annual rate of up to 0.40% and 0.75% of each class’s average daily net assets, respectively, subject to the authority of the Board of Trustees of the Fund to set a lower amount. The Board
| | | | |
| Legg Mason Batterymarch International Equity Trust 2012 Annual Report | | | 39 | |
of Trustees’ has currently approved payments under the plans of 0.25% and 0.50% of the average daily net assets of Class FI and Class R, respectively. Service and distribution fees are accrued daily and paid monthly.
For the year ended December 31, 2012, class specific expenses were as follows:
| | | | | | | | |
| | | Service and/or
Distribution Fees | | | Transfer Agent
Fees | |
| Class A | | $ | 13,471 | | | $ | 13,212 | |
| Class C | | | 779,064 | | | | 117,140 | |
| Class FI | | | 23,779 | | | | 26,859 | |
| Class R | | | 1,424 | | | | 433 | |
| Class I | | | — | | | | 27,462 | |
| Class IS | | | — | | | | 7,347 | |
| Total | | $ | 817,738 | | | $ | 192,453 | |
For the year ended December 31, 2012, waivers and/or expense reimbursements by class were as follows:
| | | | |
| | | Waivers/Expense
Reimbursements | |
| Class A | | $ | 3,893 | |
| Class C | | | — | |
| Class FI | | | 11,444 | |
| Class R | | | 408 | |
| Class I | | | — | |
| Class IS | | | 138 | |
| Total | | $ | 15,883 | |
6. Distributions to shareholders by class
| | | | | | | | |
| | | Year Ended
December 31, 2012 | | | Year Ended
December 31, 2011 | |
| Net Investment Income: | | | | | | | | |
| Class A | | $ | 114,313 | | | $ | 140,536 | |
| Class C | | | 1,064,389 | | | | 1,485,275 | |
| Class FI | | | 204,142 | | | | 230,002 | |
| Class R | | | 6,060 | | | | 6,920 | |
| Class I | | | 511,861 | | | | 1,313,627 | |
| Class IS | | | 4,065,839 | | | | 3,973,656 | |
| Total | | $ | 5,966,604 | | | $ | 7,150,016 | |
7. Shares of beneficial interest
At December 31, 2012, the Trust had an unlimited number of shares of beneficial interest authorized with a par value of $0.00001 per share. The Fund has the ability to issue multiple classes of shares. Each class of shares represents an identical interest and has the same rights, except that each class bears certain direct expenses, including those specifically related to the distribution of its shares. On April 30, 2012, the Fund was reorganized as a new series of the Trust.
| | |
| 40 | | Legg Mason Batterymarch International Equity Trust 2012 Annual Report |
Notes to financial statements (cont’d)
Prior to April 30, 2012, the Fund was a series of a Maryland corporation and had 125,000,000 shares authorized at $.001 par value for each of the Fund’s Class A, Class C and Class I shares, 100,000,000 shares authorized at $.001 par value for each of the Fund’s Class FI and Class IS shares, and 500,000,000 shares authorized at $.001 par value for Class R shares.
Transactions in shares of each class were as follows:
| | | | | | | | | | | | | | | | |
| | | Year Ended
December 31, 2012 | | | Year Ended
December 31, 2011 | |
| | | Shares | | | Amount | | | Shares | | | Amount | |
| Class A | | | | | | | | | | | | | | | | |
| Shares sold | | | 26,333 | | | $ | 300,174 | | | | 144,125 | | | $ | 1,915,189 | |
| Shares issued on reinvestment | | | 9,260 | | | | 111,507 | | | | 12,779 | | | | 137,671 | |
| Shares repurchased | | | (137,301) | | | | (1,617,202) | | | | (222,426) | | | | (2,606,584) | |
| Net decrease | | | (101,708) | | | $ | (1,205,521) | | | | (65,522) | | | $ | (553,724) | |
| Class C | | | | | | | | | | | | | | | | |
| Shares sold | | | 179,526 | | | $ | 2,064,300 | | | | 295,868 | | | $ | 3,701,794 | |
| Shares issued on reinvestment | | | 86,992 | | | | 1,047,192 | | | | 135,792 | | | | 1,467,157 | |
| Shares repurchased | | | (2,006,083) | | | | (23,074,512) | | | | (3,319,720) | | | | (41,180,825) | |
| Net decrease | | | (1,739,565) | | | $ | (19,963,020) | | | | (2,888,060) | | | $ | (36,011,874) | |
| | | | |
| Class FI | | | | | | | | | | | | | | | | |
| Shares sold | | | 53,152 | | | $ | 632,241 | | | | 91,770 | | | $ | 1,204,771 | |
| Shares issued on reinvestment | | | 15,626 | | | | 194,426 | | | | 19,537 | | | | 217,178 | |
| Shares repurchased | | | (158,755) | | | | (1,886,599) | | | | (235,343) | | | | (3,051,444) | |
| Net decrease | | | (89,977) | | | $ | (1,059,932) | | | | (124,036) | | | $ | (1,629,495) | |
| | | | |
| Class R | | | | | | | | | | | | | | | | |
| Shares sold | | | 10,015 | | | $ | 118,536 | | | | 8,236 | | | $ | 108,578 | |
| Shares issued on reinvestment | | | 487 | | | | 6,060 | | | | 618 | | | | 6,920 | |
| Shares repurchased | | | (9,373) | | | | (112,295) | | | | (73,188) | | | | (990,557) | |
| Net increase (decrease) | | | 1,129 | | | $ | 12,301 | | | | (64,334) | | | $ | (875,059) | |
| | | | |
| Class I | | | | | | | | | | | | | | | | |
| Shares sold | | | 703,215 | | | $ | 8,380,641 | | | | 740,209 | | | $ | 9,797,206 | |
| Shares issued on reinvestment | | | 17,971 | | | | 222,548 | | | | 92,667 | | | | 1,027,749 | |
| Shares repurchased | | | (3,388,452) | | | | (40,749,495) | | | | (2,887,786) | | | | (38,932,552) | |
| Net decrease | | | (2,667,266) | | | $ | (32,146,306) | | | | (2,054,910) | | | $ | (28,107,597) | |
| | | | |
| Class IS | | | | | | | | | | | | | | | | |
| Shares sold | | | 2,499,000 | | | $ | 29,274,579 | | | | 2,205,737 | | | $ | 26,493,415 | |
| Shares issued on reinvestment | | | 327,332 | | | | 4,065,839 | | | | 358,824 | | | | 3,973,656 | |
| Shares repurchased | | | (2,662,925) | | | | (31,694,545) | | | | (1,996,153) | | | | (25,234,231) | |
| Net increase | | | 163,407 | | | $ | 1,645,873 | | | | 568,408 | | | $ | 5,232,840 | |
| | | | |
| Legg Mason Batterymarch International Equity Trust 2012 Annual Report | | | 41 | |
8. Line of credit
The Fund, along with certain other Legg Mason Funds, participates in a $200 million line of credit (“Credit Agreement”) to be used for temporary or emergency purposes. This 364-day revolving Credit Agreement matures on February 28, 2013. Pursuant to the Credit Agreement, each participating fund is liable only for principal and interest payments related to borrowings made by that fund. Borrowings under the Credit Agreement bear interest at a rate equal to the prevailing LIBOR rate plus the LIBOR rate margin. The Fund did not utilize the line of credit during the year ended December 31, 2012. The Fund does not intend to renew the Credit Agreement.
9. Income tax information and distributions to shareholders
The tax character of distributions paid during the fiscal years ended December 31, were as follows:
| | | | | | | | |
| | | 2012 | | | 2011 | |
| Distributions paid from: | | | | | | | | |
| Ordinary Income | | $ | 5,966,604 | | | $ | 7,150,016 | |
As of December 31, 2012, the components of accumulated earnings on a tax basis were as follows:
| | | | |
| Undistributed ordinary income — net | | $ | 606,119 | |
| Capital loss carryforward* | | | (334,338,720) | |
| Other book/tax temporary differences(a) | | | (364,489) | |
| Unrealized appreciation (depreciation)(b) | | | 25,857,584 | |
| Total accumulated earnings (losses) — net | | $ | (308,239,506) | |
| * | As of December 31, 2012, the Fund had the following net capital loss carryforward remaining: |
| | | | |
| Year of Expiration | | Amount | |
| No Expiration | | $ | (11,150,952 | )** |
| 12/31/2016 | | | (132,426,846 | ) |
| 12/31/2017 | | | (187,642,091 | ) |
| 12/31/2018 | | | (3,118,831 | ) |
| | | $ | (334,338,720 | ) |
These amounts will be available to offset any future taxable capital gains.
| ** | Under the Regulated Investment Company Modernization Act of 2010, the Fund is permitted to carry forward these capital losses for an unlimited period. However, these losses will be required to be utilized prior to the fund's other capital losses with the expiration dates listed above. Additionally, these capital losses retain their character as either short-term or long-term capital losses rather than being considered all short-term as under previous law. |
| (a) | Other book/tax temporary differences are attributable primarily to the realization for tax purposes of unrealized gains on certain foreign currency contracts and book/tax differences in the timing of the deductibility of various expenses. |
| (b) | The difference between book-basis and tax-basis unrealized appreciation (depreciation) is attributable primarily to the tax deferral of losses on wash sales and the realization for tax purposes of unrealized gains on investments in passive foreign investment companies . |
| | |
| 42 | | Legg Mason Batterymarch International Equity Trust 2012 Annual Report |
Report of independent registered public accounting firm
To the Board of Trustees of Legg Mason Global Asset Management Trust and to the Shareholders of Legg Mason Batterymarch International Equity Trust:
In our opinion, the accompanying statement of assets and liabilities, including the schedule of investments, and the related statements of operations and of changes in net assets and the financial highlights present fairly, in all material respects, the financial position of Legg Mason Batterymarch International Equity Trust (one of the funds comprising Legg Mason Global Asset Management Trust, the “Fund”) at December 31, 2012, the results of its operations, the changes in its net assets, and the financial highlights for each of the periods presented, in conformity with accounting principles generally accepted in the United States of America. These financial statements and financial highlights (hereafter referred to as “financial statements”) are the responsibility of the Fund’s management; our responsibility is to express an opinion on these financial statements based on our audits. We conducted our audits of these financial statements in accordance with the standards of the Public Company Accounting Oversight Board (United States). Those standards require that we plan and perform the audit to obtain reasonable assurance about whether the financial statements are free of material misstatement. An audit includes examining, on a test basis, evidence supporting the amounts and disclosures in the financial statements, assessing the accounting principles used and significant estimates made by management, and evaluating the overall financial statement presentation. We believe that our audits, which included confirmation of securities at December 31, 2012 by correspondence with the custodian and brokers, provide a reasonable basis for our opinion.
PricewaterhouseCoopers LLP
Baltimore, Maryland
February 19, 2013
| | | | |
| Legg Mason Batterymarch International Equity Trust | | | 43 | |
Board approval of management and investment advisory agreements (unaudited)
At its November 2012 meeting, the Fund’s Board of Trustees (the “Board”) approved the continuation of the management agreement (the “Management Agreement”) with Legg Mason Partners Fund Advisor, LLC (the “Manager”) and the investment advisory agreement (the “Advisory Agreement”) with Batterymarch Financial Management, Inc. (the “Adviser”). The trustees who are not “interested persons” of the Fund (as defined in the Investment Company Act of 1940, as amended (the “1940 Act”)) (the “Independent Trustees”), met on October 11, 2012, with the assistance of their independent legal counsel and their contract review consultant, to review and evaluate the materials provided by the Manager and the Adviser to assist the Board, and in particular the Independent Trustees, in considering renewal of the Management and Advisory Agreements, respectively. At such October meeting the Independent Trustees received a presentation from senior Fund management and reviewed the materials provided, as well as a memorandum from their independent legal counsel and materials from the contract review consultant. The Independent Trustees further discussed renewal of the Management and Advisory Agreements in an executive session held on November 15, 2012.
In voting to approve continuance of the Agreements, the Board, including the Independent Trustees, considered whether continuance of the Agreements would be in the best interests of the Fund and its shareholders. No single factor or item of information reviewed by the Board was identified as the principal factor in determining whether to approve the Management Agreement and the Advisory Agreement. Based upon its evaluation of all material factors, including those described below, the Board concluded that the terms of each Agreement are reasonable and fair and that it was in the best interest of the Fund and its shareholders to approve continuance of the Agreements.
The Board received and considered information regarding the nature, extent and quality of services provided to the Fund by the Manager and the Adviser, under the Management and Advisory Agreements, respectively. The Board also considered the Manager’s supervisory activities over the Adviser. In addition, the Board received and considered other information regarding the administrative and other services rendered to the Fund and its shareholders by the Manager and its affiliates. The Board noted information received at regular meetings throughout the year related to the services rendered by the Manager in its management of the Fund’s affairs and the Manager’s role in coordinating the activities of the Adviser and the Fund’s other service providers. The Board’s evaluation of the services provided by the Manager and the Adviser took into account the Board’s knowledge and familiarity gained as Board members of funds in the Legg Mason fund complex, including the scope and quality of the investment management and other capabilities of the Manager and the Adviser and the quality of the Manager’s administrative and other services. The Board observed that the scope of services provided by the Manager had expanded over time as a result of regulatory and other developments, including maintaining and monitoring its own and the Fund’s compliance programs.
The Board reviewed the qualifications, backgrounds and responsibilities of the senior personnel serving the Fund and the portfolio management team primarily
| | |
| 44 | | Legg Mason Batterymarch International Equity Trust |
Board approval of management and investment advisory agreements (unaudited) (cont’d)
responsible for the day-to-day portfolio management of the Fund. The Board also considered, based on its knowledge of the Manager and the Manager’s affiliates, the financial resources available through the Manager’s parent organization, Legg Mason, Inc.
The Board considered the division of responsibilities between the Manager and the Adviser and the oversight provided by the Manager. The Board also considered the Adviser’s brokerage policies and practices, the standards applied in seeking best execution, the policies regarding soft dollars, and the existence of quality controls applicable to brokerage allocation procedures.
The Board received and reviewed performance information for the Fund and for a group of funds (the “Performance Universe”) selected by Lipper, Inc. (“Lipper”), an independent provider of investment company data. The Board was provided with a description of the methodology Lipper used to determine the similarity of the Fund with the funds included in the Performance Universe. The Lipper data also included a comparison of the Fund’s performance to a benchmark index selected by Lipper. In addition, the Trustees noted that they also had received and discussed at periodic intervals information comparing the Fund’s performance to that of its benchmark index.
The Board noted the Fund’s competitive performance for the one-year period ended June 30, 2012, placing the Fund’s Class IS Shares in the third quintile. The Board also noted the Class IS Shares performance for the three-year period ended June 30, 2012, which ranked in the fourth quintile. The Board also considered information provided through the Fund’s quarterly performance reports regarding the longer-term (five and ten year) performance ranking of the Class C Shares, which ranked in the fifth and third quintiles, respectively. The Board considered the analysis provided by the Adviser of the reasons for the underperformance of its stock selection model during specific periods and the actions taken by the Adviser in response The Board noted that its evaluation of the factors of the nature, extent and quality of services and investment performance led it to conclude that it was in the best interest of the Fund to approve renewal of the Agreement.
The Board reviewed and considered, the contractual management fee (the “Contractual Management Fee”) payable by the Fund to the Manager in light of the nature, extent and quality of the management and advisory services provided by the Manager and the Adviser, respectively. The Board noted that the Manager, and not the Fund, pays the fee to the Adviser. In addition, the Board reviewed and considered the actual management fee rate (after taking into account fees waived and expense reimbursements by the Manager which partially reduced the management fee paid to the Manager) (“Actual Management Fee”).
The Board also reviewed information regarding the fees the Manager and the Adviser charged any of their U.S. clients investing primarily in an asset class similar to that of the Fund including, where applicable, separate accounts. The Manager reviewed with the Board the significant differences in the scope of services provided to the Fund and to such other clients, and that the Manager coordinates and oversees the provision of services to the Fund by other fund service providers,
| | | | |
| Legg Mason Batterymarch International Equity Trust | | | 45 | |
including the Adviser. The Board considered the fee comparisons in light of the scope of services required to manage these different types of accounts.
The Board received an analysis of complex-wide management fees provided by the Manager, which, among other things, set out the range of fees based on asset classes. In addition, the Manager provided and discussed with the Board a comparison with the fees of other registered investment companies managed in the same investment style. Management also discussed with the Board the Fund’s distribution arrangements, including how amounts received by the Fund’s distributors are expended.
Additionally, the Board received and considered information comparing the Fund’s Contractual Management Fee and Actual Management Fee and the Fund’s overall expense ratio with those of a group of funds selected by Lipper as comparable to the Fund and a broader universe of funds also selected by Lipper. With respect to the Fund, the Board noted that Contractual and Actual Management Fees were lower than average (first quintile) and that actual expenses were lower than the Lipper expense group and expense universe averages.
The Board was provided an overview of the process followed in conducting the profitability study and received a report on the profitability of Legg Mason in providing services to the Fund, based on financial information and business data for the 12 months ended March 31, 2012, which corresponds to Legg Mason’s most recently completed fiscal year. The Board considered the profitability study along with the other materials previously provided to the Board and determined that the profitability was not excessive in light of the nature, extent and quality of the services provided to the Fund.
The Board received and considered information regarding whether there have been economies of scale with respect to the management of the Fund as the Fund’s assets grow, whether the Fund has appropriately benefited from any economies of scale, and whether there is potential for realization of any further economies of scale. The Board noted that as a result of market conditions and net redemptions, the Fund complex had suffered a substantial decline in assets over its historic highs. Given the asset size of the Fund and the complex, the Board concluded that although there were no current breakpoints, any economies of scale currently being realized were appropriately being reflected in the Management Fee paid by the Fund.
The Board considered other benefits received by the Manager and its affiliates, as a result of the Manager’s relationship with the Fund, including the opportunity to offer additional products and services to Fund shareholders. The Board also considered the information provided by the Manager regarding intermediary arrangements.
In light of the structure of the fees, the costs of providing investment management and other services to the Fund, the Manager’s ongoing commitment to the Fund and the ancillary benefits received, the Board concluded that the Management Fees were reasonable.
After evaluation of all material factors, the Board concluded that the continuation of each Agreement is in the best interest of the Fund.
| | |
| 46 | | Legg Mason Batterymarch International Equity Trust |
Additional information (unaudited)
Information about Trustees and Officers
The business and affairs of Legg Mason Batterymarch International Equity Trust (the “Fund”) are conducted by management under the supervision and subject to the direction of its Board of Trustees. The business address of each Trustee is 100 International Drive, Attn: Fund Secretary, Baltimore, Maryland 21202. Information pertaining to the Trustees and officers of the Fund is set forth below.
The Statement of Additional Information includes additional information about Trustees and is available, without charge, upon request by calling the Fund at 1-877-721-1926.
| | |
| Independent Trustees1 |
| Ruby P. Hearn |
| Year of birth | | 1940 |
| Position(s) with Trust | | Trustee |
| Term of office and length of time served2 | | Since 2009 |
| Principal occupation(s) during past five years | | Senior Vice President Emerita of The Robert Wood Johnson Foundation (non-profit) since 2001; Member of the Institute of Medicine since 1982; formerly: Trustee of the New York Academy of Medicine (2004 to 2012); Director of the Institute for Healthcare Improvement (2002-2012); Senior Vice President of The Robert Wood Johnson Foundation (1996 to 2001); Fellow of The Yale Corporation (1992 to 1998). |
| Number of funds in fund complex overseen by Trustee | | 14 |
| Other board memberships held by Trustee | | None |
| Arnold L. Lehman |
| Year of birth | | 1944 |
| Position(s) with Trust | | Lead Independent Trustee |
| Term of office and length of time served2 | | Since 2009 |
| Principal occupation(s) during past five years | | Director of the Brooklyn Museum since 1997; Trustee of American Federation of Arts since 1998. Formerly: Director of The Baltimore Museum of Art (1979 to 1997). |
| Number of funds in fund complex overseen by Trustee | | 14 |
| Other board memberships held by Trustee | | None |
| Robin J.W. Masters |
| Year of birth | | 1955 |
| Position(s) with Trust | | Trustee |
| Term of office and length of time served2 | | Since 2009 |
| Principal occupation(s) during past five years | | Retired; formerly: Chief Investment Officer of ACE Limited (insurance) (1986 to 2000). |
| Number of funds in fund complex overseen by Trustee | | 14 |
| Other board memberships held by Trustee | | Director of Cheyne Capital International Limited (investment advisory firm). Formerly, Director/Trustee of Legg Mason Institutional Funds plc, WAFixed Income Funds plc and Western Asset Debt Securities Fund plc. (2007 to 2011) |
| | | | |
| Legg Mason Batterymarch International Equity Trust | | | 47 | |
| | |
| Independent Trustees1 cont’d |
| Jill E. McGovern |
| Year of birth | | 1944 |
| Position(s) with Trust | | Trustee |
| Term of office and length of time served2 | | Since 2009 |
| Principal occupation(s) during past five years | | Senior Consultant, American Institute for Contemporary German Studies (AICGS) since 2007; formerly: Chief Executive Officer of The Marrow Foundation (non-profit) (1993 to 2007); Executive Director of the Baltimore International Festival (1991 to 1993); Senior Assistant to the President of The Johns Hopkins University (1986 to 1990). |
| Number of funds in fund complex overseen by Trustee | | 14 |
| Other board memberships held by Trustee | | Director of International Biomedical Research Alliance; Director of Lois Roth Endowment |
| Arthur S. Mehlman |
| Year of birth | | 1942 |
| Position(s) with Trust | | Trustee |
| Term of office and length of time served2 | | Since 2009 |
| Principal occupation(s) during past five years | | Retired. Director, The University of Maryland Foundation since 1992; Director, The League for People with Disabilities since 2003; formerly: Partner, KPMG LLP (international accounting firm) (1972 to 2002). |
| Number of funds in fund complex overseen by Trustee | | Director/Trustee of all Legg Mason Funds consisting of 14 portfolios; Director/Trustee of the Royce Family of Funds consisting of 35 portfolios. |
| Other board memberships held by Trustee | | Director of Municipal Mortgage & Equity, LLC. |
| G. Peter O’Brien |
| Year of birth | | 1945 |
| Position(s) with Trust | | Trustee |
| Term of office and length of time served2 | | Since 2009 |
| Principal occupation(s) during past five years | | Retired. Trustee Emeritus of Colgate University; Board Member, Hill House, Inc. (residential home care); Board Member, Bridges School (pre-school); formerly: Managing Director, Equity Capital Markets Group of Merrill Lynch & Co. (1971-1999). |
| Number of funds in fund complex overseen by Trustee | | Director/Trustee of all Legg Mason funds consisting of 14 portfolios; Director/Trustee of the Royce Family of Funds consisting of 35 portfolios. |
| Other board memberships held by Trustee | | Director of TICC Capital Corp. |
| | |
| 48 | | Legg Mason Batterymarch International Equity Trust |
Additional information (unaudited) (cont’d)
Information about Trustees and Officers
| | |
| Independent Trustees1 cont’d |
| S. Ford Rowan |
| Year of birth | | 1943 |
| Position(s) with Trust | | Trustee |
| Term of office and length of time served2 | | Since 2009 |
| Principal occupation(s) during past five years | | Chairman, National Center for Critical Incident Analysis, National Defense University Foundation, since 2004; Trustee, St. John’s College, since 2006; formerly: Consultant, Rowan & Blewitt Inc. (management consulting) (1984 to 2007); Lecturer in Journalism, Northwestern University (1980 to 1993); Lecturer in Organizational Sciences, George Washington University (2000 to 2008); Director, Sante Fe Institute (1999 to 2008). |
| Number of funds in fund complex overseen by Trustee | | 14 |
| Other board memberships held by Trustee | | None |
| Robert M. Tarola |
| Year of birth | | 1950 |
| Position(s) with Trust | | Trustee |
| Term of office and length of time served2 | | Since 2009 |
| Principal occupation(s) during past five years | | President of Right Advisory LLC (corporate finance and governance consulting) since 2008; Member, Investor Advisory Group of the Public Company Accounting Oversight Board since 2009; Senior Vice President and Chief Financial Officer of The Howard University since 2010 (higher education and health care); formerly: Senior Vice President and Chief Financial Officer of W.R. Grace & Co. (specialty chemicals) (1999 to 2008) and MedStar Health, Inc. (healthcare) (1996 to 1999); Partner, Price Waterhouse, LLP (accounting and auditing) (1984 to 1996). |
| Number of funds in fund complex overseen by Trustee | | 14 |
| Other board memberships held by Trustee | | Director of TeleTech Holdings, Inc. (business process outsourcing); Director of American Kidney Fund (renal disease assistance) |
| | | | |
| Legg Mason Batterymarch International Equity Trust | | | 49 | |
| | |
| Interested Trustee3 |
R. Jay Gerken Legg Mason 620 Eighth Avenue, New York NY 10018 | | |
| Year of birth | | 1951 |
| Position(s) with Trust | | Chairman, President and Trustee |
| Term of office and length of time served2 | | Since 2011 |
| Principal occupation(s) during past five years | | Managing Director of Legg Mason & Co., LLC (“Legg Mason & Co.”) (since 2005); Officer and Trustee/Director of 161 funds associated with Legg Mason Partners Fund Advisor, LLC (“LMPFA”) or its affiliates (since 2006) and Legg Mason & Co. predecessors (prior to 2006); President and Chief Executive Officer (“CEO”) of LMPFA (since 2006); President and CEO of Smith Barney Fund Management LLC (“SBFM”) (formerly a registered investment adviser) (since 2002) |
| Number of funds in fund complex overseen by Trustee | | 161 |
| Other board memberships held by Trustee | | None |
| Executive Officers |
Richard F. Sennett Legg Mason 100 International Drive, Baltimore, MD 21202 | | |
| Year of birth | | 1970 |
| Position(s) with Trust | | Principal Financial Officer |
| Term of office and length of time served2 | | Since 2011 |
| Principal occupation(s) during past five years | | Principal Financial Officer of certain mutual funds associated with Legg Mason & Co. or its affiliates (since 2011); Managing Director of Legg Mason & Co. and Senior Manager of the Treasury Policy group for Legg Mason & Co.’s Global Fiduciary Platform (since 2011); formerly, Chief Accountant within the SEC’s Division of Investment Management (2007 to 2011); formerly, Assistant Chief Accountant within the SEC’s Division of Investment Management (2002 to 2007) |
Robert I. Frenkel Legg Mason 100 First Stamford Place, Stamford, CT 06902 | | |
| Year of birth | | 1954 |
| Position(s) with Trust | | Secretary and Chief Legal Officer |
| Term of office and length of time served2 | | Since 2009 |
| Principal occupation(s) during past five years | | Vice President and Deputy General Counsel of Legg Mason (since 2006); Managing Director and General Counsel of Global Mutual Funds for Legg Mason & Co. (since 2006) and Legg Mason & Co. predecessors (since 1994); Secretary and Chief Legal Officer of certain mutual funds associated with Legg Mason & Co. or its affiliates (since 2006) and Legg Mason & Co. predecessors (prior to 2006) |
| | |
| 50 | | Legg Mason Batterymarch International Equity Trust |
Additional information (unaudited) (cont’d)
Information about Trustees and Officers
| | |
| Executive Officers cont’d |
Ted P. Becker Legg Mason 620 Eighth Avenue, New York, NY 10018 | | |
| Year of birth | | 1951 |
| Position(s) with Trust | | Vice President and Chief Compliance Officer |
| Term of office and length of time served2 | | Since 2009 |
| Principal occupation(s) during past five years | | Director of Global Compliance at Legg Mason (since 2006); Chief Compliance Officer of LMPFA (since 2006); Managing Director of Compliance of Legg Mason & Co. (since 2005); Chief Compliance Officer of certain mutual funds associated with Legg Mason & Co. or its affiliates (since 2006) and Legg Mason & Co. predecessors (prior to 2006) |
Christopher Berarducci Legg Mason 620 Eighth Avenue, New York, NY 10018 | | |
| Year of birth | | 1974 |
| Position(s) with Trust | | Treasurer |
| Term of office and length of time served2 | | Since 2010 |
| Principal occupation(s) during past five years | | Vice President of Legg Mason & Co. (since 2011); Treasurer of certain mutual funds associated with Legg Mason & Co. or its affiliates (since 2010); Assistant Controller of certain mutual funds associated with Legg Mason & Co. or its affiliates (prior to 2010); formerly, Manager of Fund Administration at UBS Global Asset Management (prior to 2007) |
| 1 | Trustees who are not “interested persons” of the Fund within the meaning of Section 2(a)(19) of the 1940 Act. Each of the Independent Trustees serves on the standing committees of the Board of Trustees, which include the Audit Committee (chair: Arthur S. Mehlman), the Nominating Committee (co-chairs: G. Peter O’Brien and Jill E. McGovern), and the Independent Trustees Committee (chair: Arnold L. Lehman). |
| 2 | Officers of the Fund are elected to serve until their successors are elected and qualified. Trustees of the Fund serve a term of indefinite length until their retirement, in accordance with the Board’s retirement policy, resignation or removal, and stand for re-election by shareholders only as and when required by the 1940 Act. |
| 3 | Mr. Gerken is considered to be an interested person, as defined in the 1940 Act, of the Fund on the basis of his current employment with the Fund’s investment adviser or its affiliated entities (including the Fund’s principal underwriter) and Legg Mason, Inc., the parent holding company of these entities as well as his ownership of Legg Mason, Inc. stock. |
| | | | |
| Legg Mason Batterymarch International Equity Trust | | | 51 | |
Important tax information (unaudited)
The following information is provided with respect to the distributions paid during the taxable year ended December 31, 2012:
| | | | | | | | |
| Record Date: | | | 6/18/2012 | | | | 12/26/2012 | |
| Payable Date: | | | 6/19/2012 | | | | 12/27/2012 | |
| Ordinary Income: | | | | | | | | |
Qualified Dividend Income for Individuals | | | 100.00 | % | | | 100.00 | % |
| Foreign Source Income | | | 98.95 | %* | | | 92.72 | %* |
| Foreign Taxes Paid Per Share | | $ | 0.001080 | | | $ | 0.032619 | |
| * | Expressed as a percentage of the cash distribution grossed-up for foreign taxes. |
The foreign taxes paid represent taxes incurred by the Fund on income received by the Fund from foreign sources. Foreign taxes paid may be included in taxable income with an offsetting deduction from gross income or may be taken as a credit for taxes paid to foreign governments. You should consult your tax adviser regarding the appropriate treatment of foreign taxes paid.
Please retain this information for your records.
Legg Mason Batterymarch
International Equity Trust
Trustees
R. Jay Gerken
Chairman
Ruby P. Hearn
Arnold L. Lehman
Robin J.W. Masters
Jill E. McGovern
Arthur S. Mehlman
G. Peter O’Brien
S. Ford Rowan
Robert M. Tarola
Investment manager
Legg Mason Partners Fund Advisor, LLC
Investment adviser
Batterymarch Financial Management, Inc.
Custodian
State Street Bank & Trust Company
Transfer agent
Boston Financial Data Services, Inc.
2000 Crown Colony Drive
Quincy, MA 02169
Counsel
K&L Gates LLP
Washington, DC
Independent registered public accounting firm
PricewaterhouseCoopers LLP
Baltimore, MD
Legg Mason Batterymarch International Equity Trust
The Fund is a separate investment series of Legg Mason Global Asset Management Trust, a Maryland statutory trust.
Legg Mason Batterymarch International Equity Trust
Legg Mason Funds
620 Eighth Avenue
New York, NY 10018
The Fund files its complete schedule of portfolio holdings with the Securities and Exchange Commission (“SEC”) for the first and third quarters of each fiscal year on Form N-Q. The Fund’s Forms N-Q are available on the SEC’s website at www.sec.gov. The Fund’s Forms N-Q may be reviewed and copied at the SEC’s Public Reference Room in Washington, D.C., and information on the operation of the Public Reference Room may be obtained by calling 1-800-SEC-0330. To obtain information on Form N-Q, shareholders can call the Fund at 1-877-721-1926.
Information on how the Fund voted proxies relating to portfolio securities during the prior 12-month period ended June 30th of each year and a description of the policies and procedures that the Fund uses to determine how to vote proxies related to portfolio transactions are available (1) without charge, upon request, by calling the Fund at 1-877-721-1926, (2) on the Fund’s website at www.leggmason.com/individualinvestors and (3) on the SEC’s website at www.sec.gov.
This report is submitted for the general information of the shareholders of Legg Mason Batterymarch International Equity Trust. This report is not authorized for distribution to prospective investors in the Fund unless preceded or accompanied by a current prospectus.
Investors should consider the Fund’s investment objectives, risks, charges and expenses carefully before investing. The prospectus contains this and other important information about the Fund. Please read the prospectus carefully before investing.
www.leggmason.com/individualinvestors
©2013 Legg Mason Investor Services, LLC
Member FINRA, SIPC
Legg Mason Funds Privacy and Security Notice
Your Privacy and the Security of Your Personal Information is Very Important to the Legg Mason Funds
This Privacy and Security Notice (the “Privacy Notice”) addresses the Legg Mason Funds’ privacy and data protection practices with respect to nonpublic personal information the Funds receive. The Legg Mason Funds include any funds sold by the Funds’ distributor, Legg Mason Investor Services, LLC, as well as Legg Mason-sponsored closed-end funds and certain closed-end funds managed or sub-advised by Legg Mason or its affiliates. The provisions of this Privacy Notice apply to your information both while you are a shareholder and after you are no longer invested with the Funds.
The Type of Nonpublic Personal Information the Funds Collect About You
The Funds collect and maintain nonpublic personal information about you in connection with your shareholder account. Such information may include, but is not limited to:
| Ÿ | | Personal information included on applications or other forms; |
| Ÿ | | Account balances, transactions, and mutual fund holdings and positions; |
| Ÿ | | Online account access user IDs, passwords, security challenge question responses; and |
| Ÿ | | Information received from consumer reporting agencies regarding credit history and creditworthiness (such as the amount of an individual’s total debt, payment history, etc.). |
How the Funds Use Nonpublic Personal Information About You
The Funds do not sell or share your nonpublic personal information with third parties or with affiliates for their marketing purposes, or with other financial institutions or affiliates for joint marketing purposes, unless you have authorized the Funds to do so. The Funds do not disclose any nonpublic personal information about you except as may be required to perform transactions or services you have authorized or as permitted or required by law. The Funds may disclose information about you to:
| Ÿ | | Employees, agents, and affiliates on a “need to know” basis to enable the Funds to conduct ordinary business or comply with obligations to government regulators; |
| Ÿ | | Service providers, including the Funds’ affiliates, who assist the Funds as part of the ordinary course of business (such as printing, mailing services, or processing or servicing your account with us) or otherwise perform services on the Funds’ behalf, including companies that may perform marketing services solely for the Funds; |
| Ÿ | | The Funds’ representatives such as legal counsel, accountants and auditors; and |
| Ÿ | | Fiduciaries or representatives acting on your behalf, such as an IRA custodian or trustee of a grantor trust. |
|
| NOT PART OF THE ANNUAL REPORT |
Legg Mason Funds Privacy and Security Notice (cont’d)
Except as otherwise permitted by applicable law, companies acting on the Funds’ behalf are contractually obligated to keep nonpublic personal information the Funds provide to them confidential and to use the information the Funds share only to provide the services the Funds ask them to perform.
The Funds may disclose nonpublic personal information about you when necessary to enforce their rights or protect against fraud, or as permitted or required by applicable law, such as in connection with a law enforcement or regulatory request, subpoena, or similar legal process. In the event of a corporate action or in the event a Fund service provider changes, the Funds may be required to disclose your nonpublic personal information to third parties. While it is the Funds’ practice to obtain protections for disclosed information in these types of transactions, the Funds cannot guarantee their privacy policy will remain unchanged.
Keeping You Informed of the Funds’ Privacy and Security Practices
The Funds will notify you annually of their privacy policy as required by federal law. While the Funds reserve the right to modify this policy at any time they will notify you promptly if this privacy policy changes.
The Funds’ Security Practices
The Funds maintain appropriate physical, electronic and procedural safeguards designed to guard your nonpublic personal information. The Funds’ internal data security policies restrict access to your nonpublic personal information to authorized employees, who may use your nonpublic personal information for Fund business purposes only.
Although the Funds strive to protect your nonpublic personal information, they cannot ensure or warrant the security of any information you provide or transmit to them, and you do so at your own risk. In the event of a breach of the confidentiality or security of your nonpublic personal information, the Funds will attempt to notify you as necessary so you can take appropriate protective steps. If you have consented to the Funds using electronic communications or electronic delivery of statements, they may notify you under such circumstances using the most current email address you have on record with them.
In order for the Funds to provide effective service to you, keeping your account information accurate is very important. If you believe that your account information is incomplete, not accurate or not current, or if you have questions about the Funds’ privacy practices, write the Funds using the contact information on your account statements, email the Funds by clicking on the Contact Us section of the Funds’ website at www.leggmason.com, or contact the Fund at 1-877-721-1926.
Revised April 2011
|
| NOT PART OF THE ANNUAL REPORT |
www.leggmason.com/individualinvestors
©2013 Legg Mason Investor Services, LLC Member FINRA, SIPC
LMFX013157 2/13 SR13-1861
The registrant has adopted a code of ethics that applies to the registrant’s principal executive officer, principal financial officer, principal accounting officer or controller.
| ITEM 3. | AUDIT COMMITTEE FINANCIAL EXPERT. |
The Board of Trustees of the registrant has determined that Arthur S. Mehlman the Chairman of the Board’s Audit Committee and Robert M. Tarola, possess the technical attributes identified in Instruction 2(b) of Item 3 to Form N-CSR to qualify as “audit committee financial experts,” and have designated Mr. Mehlman and Mr. Tarola as the Audit Committee’s financial experts. Mr. Mehlman and Mr. Tarola are “independent” Trustees pursuant to paragraph (a) (2) of Item 3 to Form N-CSR.
| ITEM 4. | PRINCIPAL ACCOUNTANT FEES AND SERVICES. |
a) Audit Fees. The aggregate fees billed in the last two fiscal years ending December 31, 2011and December 31, 2012 (the “Reporting Periods”) for professional services rendered by the Registrant’s principal accountant (the “Auditor”) for the audit of the Registrant’s annual financial statements, or services that are normally provided by the Auditor in connection with the statutory and regulatory filings or engagements for the Reporting Periods, were $38,748 in December 31, 2011 and $161,900 in December 31, 2012.
b) Audit-Related Fees. The aggregate fees billed in the Reporting Period for assurance and related services by the Auditor that are reasonably related to the performance of the Registrant’s financial statements were $0 in December 31, 2011 and $8,500 in December 31, 2012.
In addition, there were no Audit-Related Fees billed in the Reporting Period for assurance and related services by the Auditor to the Registrant’s investment adviser (not including any sub-adviser whose role is primarily portfolio management and is subcontracted with or overseen by another investment adviser), and any entity controlling, controlled by or under common control with the investment adviser that provides ongoing services to the Legg Mason Global Asset Management Trust (“service affiliates”), that were reasonably related to the performance of the annual audit of the service affiliates. Accordingly, there were no such fees that required pre-approval by the Audit Committee for the Reporting Periods.
(c) Tax Fees. The aggregate fees billed in the Reporting Periods for professional services rendered by the Auditor for tax compliance, tax advice and tax planning (“Tax Services”) were $4,600 in December 31, 2011 and $24,695 in December 31, 2012. These services consisted of (i) review or preparation of U.S. federal, state, local and excise tax returns; (ii) U.S. federal, state and local tax planning, advice and assistance regarding statutory, regulatory or administrative developments, and (iii) tax advice regarding tax qualification matters and/or treatment of various financial instruments held or proposed to be acquired or held.
There were no fees billed for tax services by the Auditors to service affiliates during the Reporting Periods that required pre-approval by the Audit Committee.
d) All Other Fees. The aggregate fees for other fees billed in the Reporting Periods for products and services provided by the Auditor were $0 in December 31, 2011 and $3,306 in December 31, 2012, other than the services reported in paragraphs (a) through (c) of this item for the Legg Mason Global Asset Management Trust.
All Other Fees. There were no other non-audit services rendered by the Auditor to Legg Mason Partners Fund Advisors, LLC (“LMPFA”), and any entity controlling, controlled by or under common control with LMPFA that provided ongoing services to Legg Mason Global Asset Management Trust requiring pre-approval by the Audit Committee in the Reporting Period.
(e) Audit Committee’s pre–approval policies and procedures described in paragraph (c)
(7) of Rule 2-01 of Regulation S-X.
(1) The Charter for the Audit Committee (the “Committee”) of the Board of each registered investment company (the “Fund”) advised by LMPFA or one of their affiliates (each, an “Adviser”) requires that the Committee shall approve (a) all audit and permissible non-audit services to be provided to the Fund and (b) all permissible non-audit services to be provided by the Fund’s independent auditors to the Adviser and any Covered Service Providers if the engagement relates directly to the operations and financial reporting of the Fund. The Committee may implement policies and procedures by which such services are approved other than by the full Committee.
The Committee shall not approve non-audit services that the Committee believes may impair the independence of the auditors. As of the date of the approval of this Audit Committee Charter, permissible non-audit services include any professional services (including tax services), that are not prohibited services as described below, provided to the Fund by the independent auditors, other than those provided to the Fund in connection with an audit or a review of the financial statements of the Fund. Permissible non-audit services may not include: (i) bookkeeping or other services related to the accounting records or financial statements of the Fund; (ii) financial information systems design and implementation; (iii) appraisal or valuation services, fairness opinions or contribution-in-kind reports; (iv) actuarial services; (v) internal audit outsourcing services; (vi) management functions or human resources; (vii) broker or dealer, investment adviser or investment banking services; (viii) legal services and expert services unrelated to the audit; and (ix) any other service the Public Company Accounting Oversight Board determines, by regulation, is impermissible.
Pre-approval by the Committee of any permissible non-audit services is not required so long as: (i) the aggregate amount of all such permissible non-audit services provided to the Fund, the Adviser and any service providers controlling, controlled by or under common control with the Adviser that provide ongoing services to the Fund (“Covered Service Providers”) constitutes not more than 5% of the total amount of revenues paid to the independent auditors during the fiscal year in which the permissible non-audit services are provided to (a) the Fund, (b) the Adviser and (c) any entity controlling, controlled by or under common control with the Adviser that provides ongoing services to the Fund during the fiscal year in which the services are provided that would have to be approved by the Committee; (ii) the permissible non-audit services were not recognized by the Fund at the time of the engagement to be non-audit services; and (iii) such services are promptly brought to the attention of the Committee and approved by the Committee (or its delegate(s)) prior to the completion of the audit.
(2) For the Legg Mason Global Asset Management Trust, the percentage of fees that were approved by the audit committee, with respect to: Audit-Related Fees were 100% and 100% for December 31, 2011 and December 31, 2012; Tax Fees were 100% and 100% for December 31, 2011 and December 31, 2012; and Other Fees were 100% and 100% for December 31, 2011 and December 31, 2012.
(f) N/A
(g) Non-audit fees billed by the Auditor for services rendered to Legg Mason Global Asset Management Trust, LMPFA and any entity controlling, controlled by, or under common control with LMPFA that provides ongoing services to Legg Mason Global Asset Management Trust during the reporting period were $0 in 2012.
(h) Yes. Legg Mason Global Asset Management Trust’s Audit Committee has considered whether the provision of non-audit services that were rendered to Service Affiliates, which were not pre-approved (not requiring pre-approval), is compatible with maintaining the Accountant’s independence. All services provided by the Auditor to the Legg Mason Global Asset Management Trust or to Service Affiliates, which were required to be pre-approved, were pre-approved as required.
| ITEM 5. | AUDIT COMMITTEE OF LISTED REGISTRANTS. |
| | a) | The independent board members are acting as the registrant’s audit committee as specified in Section 3(a)(58)(B) of the Exchange Act .The Audit Committee consists of the following Board members: |
Ruby P. Hearn
Arnold L. Lehman
Robin J.W. Masters
Jill E. McGovern
Arthur S. Mehlman
G. Peter O’Brien
S. Ford Rowan
Robert M. Tarola
| ITEM 6. | SCHEDULE OF INVESTMENTS. |
Included herein under Item 1.
| ITEM 7. | DISCLOSURE OF PROXY VOTING POLICIES AND PROCEDURES FOR CLOSED-END MANAGEMENT INVESTMENT COMPANIES. |
Not applicable.
| ITEM 8. | PORTFOLIO MANAGERS OF CLOSED-END MANAGEMENT INVESTMENT COMPANIES. |
Not applicable.
| ITEM 9. | PURCHASES OF EQUITY SECURITIES BY CLOSED-END MANAGEMENT INVESTMENT COMPANY AND AFFILIATED PURCHASERS. |
Not applicable.
| ITEM 10. | SUBMISSION OF MATTERS TO A VOTE OF SECURITY HOLDERS. |
Not applicable.
| ITEM 11. | CONTROLS AND PROCEDURES. |
| | (a) | The registrant’s principal executive officer and principal financial officer have concluded that the registrant’s disclosure controls and procedures (as defined in Rule 30a- 3(c) under the Investment Company Act of 1940, as amended (the “1940 Act”)) are effective as of a date within 90 days of the filing date of this report that includes the disclosure required by this paragraph, based on their evaluation of the disclosure controls and procedures required by Rule 30a-3(b) under the 1940 Act and 15d-15(b) under the Securities Exchange Act of 1934. |
| | (b) | There were no changes in the registrant’s internal control over financial reporting (as defined in Rule 30a-3(d) under the 1940 Act) that occurred during the second fiscal quarter of the period covered by this report that have materially affected, or are likely to materially affect the registrant’s internal control over financial reporting. |
(a) (1) Code of Ethics attached hereto.
Exhibit 99.CODE ETH
(a) (2) Certifications pursuant to section 302 of the Sarbanes-Oxley Act of 2002 attached hereto.
Exhibit 99.CERT
(b) Certifications pursuant to Section 906 of the Sarbanes-Oxley Act of 2002 attached hereto.
Exhibit 99.906CERT
SIGNATURES
Pursuant to the requirements of the Securities Exchange Act of 1934 and the Investment Company Act of 1940, the registrant has duly caused this Report to be signed on its behalf by the undersigned, there unto duly authorized.
| | |
| Legg Mason Global Asset Management Trust |
| |
| By: | | /s/ R. Jay Gerken |
| | R. Jay Gerken |
| | Chairman and President |
| | Legg Mason Global Asset Management Trust |
| |
| Date: | | February 25, 2013 |
Pursuant to the requirements of the Securities Exchange Act of 1934 and the Investment Company Act of 1940, this report has been signed below by the following persons on behalf of the registrant and in the capacities and on the dates indicated.
| | |
| By: | | /s/ R. Jay Gerken |
| | R. Jay Gerken |
| | Chairman and President |
| | Legg Mason Global Asset Management Trust |
| |
| Date: | | February 25, 2013 |
| | |
| By: | | /s/ Richard F. Sennett |
| | Richard F. Sennett |
| | Principal Financial Officer |
| | Legg Mason Global Asset Management Trust |
| |
| Date: | | February 25, 2013 |