UNITED STATES
SECURITIES AND EXCHANGE COMMISSION
Washington, D.C. 20549
FORM N-CSR
CERTIFIED SHAREHOLDER REPORT OF REGISTERED
MANAGEMENT INVESTMENT COMPANIES
Investment Company Act file number 811-22338
Legg Mason Global Asset Management Trust
(Exact name of registrant as specified in charter)
620 Eighth Avenue, 49th Floor, New York, NY 10018
(Address of principal executive offices) (Zip code)
Robert I. Frenkel, Esq.
Legg Mason & Co., LLC
100 First Stamford Place
Stamford, CT 06902
(Name and address of agent for service)
Registrant’s telephone number, including area code: 1-877-721-1926
Date of fiscal year end: October 31
Date of reporting period: October 31, 2013
| ITEM 1. | REPORT TO STOCKHOLDERS. |
The Annual Report to Stockholders is filed herewith.

| | |
Investment
Commentary and
Annual Report | | October 31, 2013 |
LEGG MASON
CAPITAL MANAGEMENT
SPECIAL INVESTMENT TRUST
|
| PRODUCTS: NOT FDIC INSURED • NO BANK GUARANTEE • MAY LOSE VALUE |
Fund objective
The Fund seeks capital appreciation.
Investment commentary
U.S. stock market indices posted strong returns throughout the year, including the Fund’s benchmark. Regardless of the market’s direction, one key question that we seek to answer is what is being discounted in today’s price and how that compares to our assessment of value. To answer this question we observe existing conditions and make inferences about the future — duration matters. For us duration is the period that a company (or an industry) can sustain returns higher than the cost of capital. One risk, especially in good economic times, is to secularize the cyclical and assume a longer duration is achievable. I often quote a former colleague: “everything is cyclical, everything.”
History is an important source of wisdom as long as there is no assumption that it will be repeated verbatim. One example is the U.S. automotive industry. After dreadful years that saw production nearly halved, contributing to the bankruptcy of two U.S. manufacturers, the industry has emerged strongly. The U.S. auto fleet is the oldest in its history, while an improving economic outlook and rising credit availability has resulted in a sharp rebound in auto production and sales. Our analysis of duration of the U.S. auto industry starts with current conditions, but can’t stop there. While pent-up demand may seem abundant, that assumes that historical replacement norms remain constant. We must consider longer term forces that may alter the nature of the industry over time — there is emerging evidence that driving habits in the U.S. may be changing due to non-economic reasons. According to a study by The University of Michigan Transportation Research Institute the number of registered vehicles per household in the U.S. peaked in 2006 and has continued to decline every year since. In addition, the number of annual miles driven has declined steadily since 2004 with the sharpest decline being in the 16 to 34 year old cohort. Is this an economic phenomena or a generational/secular shift towards less driving? At this point it is unclear, but the fact that these trends started declining prior to the 2008 recession and that the number of 14 to 34 year-olds without a driving license in the U.S. climbed from 21% to 26% in the ten years ended in 2010 should at least make us include in our process the possibility that future auto cycles may be different than past ones.
The Investment Commentary is not a part of the Annual Report.
| | |
| II | | Legg Mason Capital Management Special Investment Trust |
A related example is Autoliv (ALV), a maker of auto safety equipment, which has been a Fund holding for some time. The original investment thesis was based on the embedded expectations at the time that did not incorporate a rebound in global auto production or any improvement in profitability. As the market adjusted for the mispricing, we did too — our investments are made by setting probabilities of how key variables will develop over time. We incorporate key incremental evidence to adjust probabilities (as prescribed by Bayes’ Theorem) and understand the resulting impact in the value of the company. In this case the adoption of new safety standards on a global basis changed our perception of the value of the company relative to our original assumptions.
Cycles and long-term trends of industries and companies will remain an important component of our search for mispriced investments. Key to our process is an understanding that while there are many possible outcomes, only one will be observed. The consequences of those paths help inform whether or not the risk undertaken in each investment (individually as well as collectively) is commensurate with the opportunity. Be assured that our energy is not limited to finding the original investment idea — we must actively monitor important change because “everything is cyclical, everything.”

Albert Grosman
Portfolio Manager
November 18, 2013
LMCM Special Investment Trust Investment Strategy Update
I am very pleased to announce that on December 13, 2013, the Board of Trustees of the Fund approved changing the Fund’s principal investment strategy to permit the Fund to invest the majority of its total assets in the securities of companies that are in the small-cap market capitalization range rather than the mid-cap market capitalization range. The transition of the Fund’s portfolio holdings to align the portfolio with the new strategy will be implemented over time as market conditions warrant, and may take several months. The transition will begin on or about February 1, 2014.
The transition will narrow our focus to the small-cap segment of the market, which has consistently been a sizeable portion of the Fund. What has not changed is our focus on applying our valuation-based investment philosophy in pursuit of excellent long-term investment returns for our shareholders. We believe our shareholders will benefit from this transition, because of greater market inefficiencies in the small-cap segment of the market, the fit that this segment of the market has with our investment process, and the experience that our team has in the small-cap segment of the market.
We expect that small caps will remain a good area for active management, given the combination of what we believe are mispriced assets and the long-term growth opportunities for emerging companies. A Morningstar study showed that over the 20-year period that ended in September 2013, 74% of small-cap funds outperformed their benchmark, compared to 31% of large cap funds. The greater number of mispriced
The Investment Commentary is not a part of the Annual Report.
| | |
| Legg Mason Capital Management Special Investment Trust | | III |
Investment commentary (cont’d)
assets is at least partially a result of the continued decline in research resources dedicated to small caps. The most important driver of our transition, however, is how well we believe our investment process fits with small cap companies. We rigorously analyze the competitiveness and strategic position of businesses to form a robust, probabilistic view of how these assets should be valued, with an emphasis on company filings and discussions with management, competitors, and customers. As such, limited Wall-Street coverage is not a hindrance, since we do our own fundamental analysis, but rather an advantage, as there is not broader dissemination of research on small-cap companies. Finally, we have assembled a team that has a tremendous amount of experience in investing, including small-cap specific focus. Since 1999, a significant amount of my work has focused on small caps, including managing small-cap separate accounts since mid 2009.
We greatly appreciate the support and confidence that our shareholders have shown us over the years and we remain steadfastly focused on finding good investment opportunities to build a portfolio that delivers on its goal of long-term superior risk-adjusted results.
Albert Grosman
Portfolio Manager
December 20, 2013
Any discussion of individual securities is intended to inform shareholders as to the basis (in whole or in part) for previously made decisions by a portfolio manager to buy, sell or hold a security in a portfolio. References to specific securities are not intended, and should not be relied upon, as the basis for anyone to buy, sell or hold any security. Investors seeking financial advice regarding the appropriateness of investing in any securities or investment strategies should consult their financial professional.
Portfolio holdings and breakdowns are as of October 31, 2013 and are subject to change and may not be representative of the portfolio manager’s current or future investments. The Fund’s top ten holdings (as a percentage of net assets) as of this date were: Old Dominion Freight Line Inc. (2.4%), IDEXX Laboratories Inc. (2.2%), Advance Auto Parts Inc. (2.0%), Dr. Pepper Snapple Group Inc. (2.0%), Hartford Financial Services Group Inc. (1.9%), Amdocs Ltd. (1.9%), CONSOL Energy Inc. (1.9%), Aircastle Ltd. (1.9%), Integrated Device Technology (1.9%) and KKR Financial Holdings LLC (1.9%). Please refer to pages 13 through 17 for a list and percentage breakdown of the Fund’s holdings.
The mention of sector breakdowns is for informational purposes only and should not be construed as a recommendation to purchase or sell any securities. The information provided regarding such sectors is not a sufficient basis upon which to make an investment decision. Investors seeking financial advice regarding the appropriateness of investing in any securities or investment strategies discussed should consult their financial professional. Portfolio holdings are subject to change at any time and may not be representative of the portfolio manager’s current or future investments. The Fund’s top five sector holdings (as a percentage of net assets) as of October 31, 2013 were: Financials (20.4%), Industrials (17.5%), Consumer Discretionary (17.0%), Information Technology (14.5%) and Health Care (11.1%). The Fund’s portfolio composition is subject to change at any time.
The Investment Commentary is not a part of the Annual Report.
| | |
| IV | | Legg Mason Capital Management Special Investment Trust |
The views expressed in this commentary reflect those solely of the portfolio manager as of the date of this commentary and may differ from those of Legg Mason, Inc. as a whole or the other portfolio managers of its affiliates. Any such views are subject to change at any time based on market or other conditions. These views are not intended to be a forecast of future events, a guarantee of future results or investment advice. The information contained herein has been prepared from sources believed to be reliable, but cannot be guaranteed. Forecasts and predictions are inherently limited and should not be relied upon as an indication of actual or future performance. Investors should not use this information as the sole basis for investment decisions.
All investments are subject to risk including the possible loss of principal. Past performance is no guarantee of future results. Past performance is no guarantee of future results. All index performance reflects no deduction for fees, expenses or taxes. Please note that an investor cannot invest directly in an index.
The Investment Commentary is not a part of the Annual Report.
| | |
| Legg Mason Capital Management Special Investment Trust | | V |
| | |
| Annual Report | | October 31, 2013 |
LEGG MASON
CAPITAL MANAGEMENT SPECIAL INVESTMENT TRUST
|
| PRODUCTS: NOT FDIC INSURED • NO BANK GUARANTEE • MAY LOSE VALUE |
Letter from the president

Dear Shareholder,
We are pleased to provide the annual report of Legg Mason Capital Management Special Investment Trust for the twelve-month reporting period ended October 31, 2013. Please read on for a detailed look at prevailing economic and market conditions during the Fund’s reporting period and to learn how those conditions have affected Fund performance.
On December 13, 2013, the Board of Trustees approved changes to the Fund’s principal investment strategies. While the Fund may continue to invest in companies of any size, the portfolio managers expect that under normal circumstances, the Fund will invest the majority of its total assets in the securities of companies that are in the small-cap market capitalization range or in special situations, at the time of purchase rather than the mid-cap market capitalization range or in special situations, at the time of purchase. The Fund defines securities of companies in the small-cap market capitalization range, as companies with market capitalizations between $150 million and the upper range of the Russell 2000 Index at the time of purchase. The Fund defines securities of companies in the mid-cap market capitalization range, as companies with market capitalizations similar to companies in the Russell Midcap Index or the S&P MidCap 400 Index. It is anticipated that the transition of the Fund’s portfolio holdings in order to align the portfolio with the new strategy will be implemented over time as market conditions warrant, and may take several months. The transition will begin on or about February 1, 2014.
Also, effective February 1, 2014, the Fund will change its performance benchmark from the S&P MidCap 400 Index to the Russell 2000 Index. The Russell 2000 Index measures the performance of the small-cap segment of the U.S. equity market. The Russell 2000 Index will better reflect the changes in the Fund’s investment universe as described above. For more information regarding these changes, including the potential tax impact to shareholders, please see the current prospectus.
As always, we remain committed to providing you with excellent service and a full spectrum of investment choices. We also remain committed to supplementing the support you receive from your financial advisor. One way we accomplish this is through our website, www.leggmason.com/individualinvestors. Here you can gain immediate access to market and investment information, including:
| Ÿ | | Fund prices and performance, |
| Ÿ | | Market insights and commentaries from our portfolio managers, and |
| Ÿ | | A host of educational resources. |
| | |
| Legg Mason Capital Management Special Investment Trust 2013 Annual Report | | 1 |
Letter from the president (cont’d)
We look forward to helping you meet your financial goals.
Sincerely,

Kenneth D. Fuller
President and Chief Executive Officer
December 20, 2013
| | |
| 2 | | Legg Mason Capital Management Special Investment Trust 2013 Annual Report |
Fund overview
Q. What is the Fund’s investment strategy?
A. The Fund seeks capital appreciation. The Fund invests primarily in equity securities and securities convertible into equity securities. While the Fund may invest in companies of any size, we expect that, under normal circumstances, the Fund will invest the majority of its total assets in the securities of companies that are in the mid-cap market capitalization range or in “special situations,” at the time of purchase. Market capitalization is not a factor when determining whether companies are involved in special situations. We define special situations as companies undergoing unusual or possibly one-time developments that, in our opinion, make them attractive for investment. The Fund will not invest more than 20% of its total assets in securities of companies involved in reorganizations or restructurings in connection with bankruptcy proceedings, at the time of investment. We follow a value discipline in selecting securities and, therefore, seek to purchase securities at large discounts to our assessment of their intrinsic value.
The Fund may also invest in debt securities, including securities involved in special situations, as defined above. The Fund may invest up to 35% of its total assets in debt securities rated below investment grade (i.e. below BBB/Baa) and unrated securities that we judge to be below investment grade.
Q. What were the overall market conditions during the Fund’s reporting period?
A. Major U.S. indices plowed upward throughout the past year setting new highs over and over again, with the NASDAQ Composite Indexi and S&P 500 Indexii returning +34% and +27%, respectively. The Consumer Discretionary, Industrials and Health Care1 sectors paced gains, up more than +35% each since last October. The U.S. Presidential election and debate surrounding the fiscal cliff drove markets during the final months of 2012. Ultimately, President Obama was reelected after beating Republican candidate Mitt Romney. Meanwhile, Congress debated the fiscal cliff up until the final minute to close the year, but eventually passed the American Taxpayer Relief Act of 2012, which added $600 billion of tax revenue over the next 10 years. The start of 2013 echoed the beginning of 2012 as stocks again posted double-digit returns, pushing the S&P 500 Index and Dow Jones Industrials Average (“DJIA”)iii to all-time highs despite concerns of low growth, the European debt crisis and tightening government budgets. Housing starts were above 900K for all three monthly reports during the first quarter, for the first time in nearly five years. In the second quarter, volatility increased, U.S. Treasury yields surged and 30-year mortgage rates soared as the Federal Reserve Board (“Fed”)iv indicated that quantitative easing programs may be wound down, colloquially referred to as “tapering.” Although the Fed’s monetary policy-setting committee left the target
| 1 | Health Care consists of the following industries: Hospitals/Nursing Facilities, Pharmacy Services, Medical Wholesale Drug Distributors, Drug Delivery Systems, Medical Products/Instruments, Medical & Laboratory Testing, Healthcare Cost Containment and Scientific Instruments. |
| | |
| Legg Mason Capital Management Special Investment Trust 2013 Annual Report | | 3 |
Fund overview (cont’d)
short-term interest rate unchanged at 0% to 0.25% and maintained the $85B-a-month bond-buying program, Chairman Ben Bernanke said the central bank may start reducing asset purchases later this year and end them in mid-2014 if the economy continues to improve in line with the Fed’s projection. The S&P 500 Index breached the 1700 threshold in the third quarter as investors focused on U.S. output, the Fed tapering timing, tensions in Syria and the Congressional budget debate. The biggest surprise in terms of economic data was an upward revision in Q2 GDP growth from +1.7% to +2.5%. August saw a sell-off, however, as the U.S. weighed options concerning Syria’s civil unrest. In mid-September, the Fed unexpectedly announced plans to maintain its current accommodative policy while economists had forecasted a $10B reduction in bond purchases. Though stocks rallied on the decision, they subsided as House Republicans and the Democrat-controlled Senate squabbled over the 2014 budget with health care reform in the spotlight. Congress remained stubborn and deadlocked, ultimately resulting in a partial government shutdown beginning in October. Equities eventually recovered after Congress ended the partial government shutdown by approving temporary spending measures and pushing the debt ceiling debate out to early 2014.
Q. How did we respond to these changing conditions?
A. Over the past year we rotated our exposure in several sectors significantly as the market reacted to improving consumer confidence, expectations for rising rates, debate surrounding U.S. health care and a continued rebound in the housing market. Most notably, we increased our position in Consumer Discretionary to our largest relative overweight, whereas we were underweight the sector a year ago. Beyond certain cyclical areas, Health Care1 remains the most attractively valued group in our view, and we continue to find good long-term expectations gaps. We similarly added to our Health Care exposure to switch from an underweight to an overweight position at the end of this fiscal year. To fund these moves, we significantly reduced our overweights in Technology and Financials, and our largest underweight remains in the Materials sector. We also found attractive valuation gaps within smaller companies, as we reduced our weighted average market capitalization from $7B to less than $5B, now roughly in line with the benchmark. From a valuation perspective, the Fund traded at a discount to the S&P MidCap 400 Indexv in terms of forward price-to-earnings and price-to-book multiples.
Performance review
For the twelve months ended October 31, 2013, Class C shares of Legg Mason Capital Management Special Investment Trust, excluding sales charges, returned 33.37%. The Fund’s unmanaged benchmark, the S&P MidCap 400 Index, returned 33.48% for the same period. The Lipper Mid-Cap Core Funds Category Average2 returned 33.03% over the same time frame.
| 1 | Health Care consists of the following industries: Hospital/Nursing Facilities, Pharmacy Services, Medical Wholesale Drug Distributors, Drug Delivery Systems, Medical Products/Instruments, Medical & Laboratory Testing, Healthcare Cost Containment and Scientific Instruments. |
| 2 | Lipper, Inc., a wholly-owned subsidiary of Reuters, provides independent insight on global collective investments. Returns are based on the twelve-month period ended October 31, 2013, including the reinvestment of all distributions, including returns of capital, if any, calculated among the 367 funds in the Fund’s Lipper category, and excluding sales charges. |
| | |
| 4 | | Legg Mason Capital Management Special Investment Trust 2013 Annual Report |
| | | | | | | | |
Performance Snapshot as of October 31, 2013 (unaudited) | |
| (excluding sales charges) | | 6 months | | | 12 months | |
| Legg Mason Capital Management Special Investment Trust: | |
Class A | | | 12.72 | % | | | 34.41 | % |
Class C | | | 12.30 | % | | | 33.37 | % |
Class FI | | | 12.63 | % | | | 34.10 | % |
Class R | | | 12.47 | % | | | 33.81 | % |
Class I | | | 12.84 | % | | | 34.67 | % |
| S&P MidCap 400 Index | | | 11.95 | % | | | 33.48 | % |
| Lipper Mid-Cap Core Funds Category Average1 | | | 13.57 | % | | | 33.03 | % |
The performance shown represents past performance. Past performance is no guarantee of future results and current performance may be higher or lower than the performance shown above. Principal value and investment returns will fluctuate and investors’ shares, when redeemed, may be worth more or less than their original cost. To obtain performance data current to the most recent month-end, please visit our website at www.leggmason.com/individualinvestors.
All share class returns assume the reinvestment of all distributions at net asset value and the deduction of all Fund expenses. Returns have not been adjusted to include sales charges that may apply or the deduction of taxes that a shareholder would pay on Fund distributions. If sales charges were reflected, the performance quoted would be lower. Performance figures for periods shorter than one year represent cumulative figures and are not annualized.
Fund performance figures reflect expense reimbursements, without which the performance would have been lower.
|
| Total Annual Operating Expenses (unaudited) |
As of the Fund’s current prospectus dated March 1, 2013, the gross total annual operating expense ratios for Class A, Class C, Class FI, Class R and Class I shares were 1.11%, 1.88%, 1.19%, 1.60% and 0.82%, respectively.
Actual expenses may be higher. For example, expenses may be higher than those shown if average net assets decrease. Net assets are more likely to decrease and Fund expense ratios are more likely to increase when markets are volatile.
Q. What were the leading contributors to performance?
A. Relative portfolio outperformance was driven by the interaction of our security selection and sector allocation, as well as overall sector allocation effects. In terms of allocation, underweight exposure to the Materials and Utilities2 sectors and an overweight position in the Consumer Staples sector contributed the most to relative performance as the former two sectors underperformed the benchmark while the latter outperformed. Stock selection within the Financials sector also contributed substantially to relative returns. In terms of individual securities, Genworth, FleetCor Technologies, Boston Scientific, TD Ameritrade and Integrated Device Technology were the largest contributors to performance.
Q. What were the leading detractors from performance?
A. Overall security selection had a small negative impact on performance for the period. In particular, selection within
| 1 | Lipper, Inc., a wholly-owned subsidiary of Reuters, provides independent insight on global collective investments. Returns are based on the period ended October 31, 2013, including the reinvestment of all distributions, including returns of capital, if any, calculated among the 377 funds for the six-month period and among the 367 funds for the twelve-month period in the Fund’s Lipper category, and excluding sales charges. |
| 2 | Utilities consists of the following industries: Electric, Natural Gas and Other Utility. |
| | |
| Legg Mason Capital Management Special Investment Trust 2013 Annual Report | | 5 |
Fund overview (cont’d)
Materials, Energy and Industrials had significant negative effects. An overweight in Financials also hurt relative performance as the sector underperformed the broader benchmark. At the security level, Acacia Research, Teradata, Hatteras Financial, BG Medicine and The Active Network detracted the most from returns.
Q. Were there any significant changes to the Fund during the reporting period?
A. We initiated 36 new positions during the year and eliminated 26 positions, ending the period with 78 holdings compared to 68 a year ago; additionally, the top 10 positions accounted for 20% at the end of this year, versus 22% last year. We participated in over 10 IPOs throughout the year, and one of our holdings was acquired, while another was approached with a takeover offer.
The portfolio was most active in the Consumer Discretionary, Health Care1, Information Technology, Financials and Industrials sectors over the past year. Among the largest new positions were IDEXX Laboratories, E*TRADE Financial, Cyberonics, Madison Square Garden and EVERTEC. Among the securities we sold, the most notable were eBay, XL Group, Energizer Holdings, TD Ameritrade and Rackspace Hosting. Additionally, Gardner Denver was acquired by KKR during the period, and we reinvested the proceeds.
Thank you for your investment in Legg Mason Capital Management Special Investment Trust. As always, we appreciate that you have chosen us to manage your assets and we remain focused on achieving the Fund’s investment goals.
Sincerely,
Legg Mason Capital Management LLC
November 18, 2013
RISKS: Equity securities are subject to price fluctuation and possible loss of principal. Small- and mid-cap stocks involve greater risks and volatility than large-cap stocks. The managers’ investment style may become out of favor and/or the managers’ selection process may prove incorrect, which may have a negative impact on the Fund’s performance. The value approach to investing involves the risk that those stocks deemed to be undervalued by the portfolio managers may remain undervalued. The Fund may invest in high-yield bonds, which possess greater price volatility, illiquidity and possibility of default. International investments are subject to special risks including currency fluctuations and social, economic and political uncertainties, which could increase volatility. These risks are magnified in emerging markets. Please see the Fund’s prospectus for a more complete discussion of these and other risks, and the Fund’s investment strategies.
Portfolio holdings and breakdowns are as of October 31, 2013 and are subject to change and may not be representative of the portfolio manager’s current or future investments. The Fund’s top ten holdings (as a percentage of net assets) as of this date were: Old Dominion Freight Line Inc. (2.4%), IDEXX Laboratories Inc. (2.2%), Advance Auto Parts Inc. (2.0%), Dr. Pepper Snapple Group Inc. (2.0%), Hartford Financial Services Group Inc. (1.9%), Amdocs Ltd. (1.9%), CONSOL Energy Inc. (1.9%), Aircastle Ltd. (1.9%), Integrated Device Technology (1.9%) and KKR Financial Holdings LLC (1.9%). Please refer to pages 12 through 16 for a list and percentage breakdown of the Fund’s holdings.
| 1 | Health Care consists of the following industries: Hospitals/Nursing Facilities, Pharmacy Services, Medical Wholesale Drug Distributors, Drug Delivery Systems, Medical Products/Instruments, Medical & Laboratory Testing, Healthcare Cost Containment and Scientific Instruments. |
| | |
| 6 | | Legg Mason Capital Management Special Investment Trust 2013 Annual Report |
The mention of sector breakdowns is for informational purposes only and should not be construed as a recommendation to purchase or sell any securities. The information provided regarding such sectors is not a sufficient basis upon which to make an investment decision. Investors seeking financial advice regarding the appropriateness of investing in any securities or investment strategies discussed should consult their financial professional. The Fund’s top five sector holdings (as a percentage of net assets) as of October 31, 2013 were: Financials (20.4%), Industrials (17.5%), Consumer Discretionary (17.0%), Information Technology (14.5%) and Health Care (11.1%). The Fund’s portfolio composition is subject to change at any time.
All investments are subject to risk including the possible loss of principal. Past performance is no guarantee of future results. All index performance reflects no deduction for fees, expenses or taxes. Please note that an investor cannot invest directly in an index.
The information provided is not intended to be a forecast of future events, a guarantee of future results or investment advice. Views expressed may differ from those of the firm as a whole.
| i | The NASDAQ Composite Index is a market-value weighted index, which measures all securities listed on the NASDAQ stock market. |
| ii | The S&P 500 Index is an unmanaged index of 500 stocks and is generally representative of the performance of larger companies in the U.S. |
| iii | The Dow Jones Industrial Average (“DJIA”) is a widely followed measurement of the stock market. The average is comprised of thirty stocks that represent leading companies in major industries. These stocks, widely held by both individual and institutional investors, are considered to be all blue-chip companies. |
| iv | The Federal Reserve Board (“Fed”) is responsible for the formulation of policies designed to promote economic growth, full employment, stable prices and a sustainable pattern of international trade and payments. |
| v | The S&P MidCap 400 Index is a market value weighted index which consists of 400 domestic stocks chosen for market size, liquidity and industry group representation. |
| | |
| Legg Mason Capital Management Special Investment Trust 2013 Annual Report | | 7 |
Fund at a glance† (unaudited)
Investment breakdown (%) as a percent of total investments
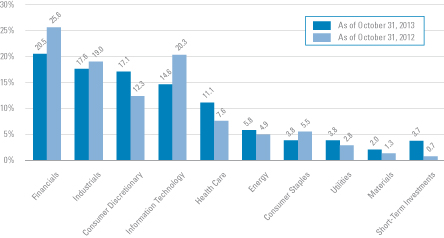
| † | The bar graph above represents the composition of the Fund’s investments as of October 31, 2013 and October 31, 2012. The Fund is actively managed. As a result, the composition of the Fund’s investments is subject to change at any time. |
| | |
| 8 | | Legg Mason Capital Management Special Investment Trust 2013 Annual Report |
Fund expenses (unaudited)
Example
As a shareholder of the Fund, you may incur two types of costs: (1) transaction costs, including front-end and back-end sales charges (loads) on purchase payments; and (2) ongoing costs, including management fees; service and/or distribution (12b-1) fees; and other Fund expenses. This example is intended to help you understand your ongoing costs (in dollars) of investing in the Fund and to compare these costs with the ongoing costs of investing in other mutual funds.
This example is based on an investment of $1,000 invested on May 1, 2013 and held for the six months ended October 31, 2013.
Actual expenses
The table below titled “Based on Actual Total Return” provides information about actual account values and actual expenses. You may use the information provided in this table, together with the amount you invested, to estimate the expenses that you paid over the period. To estimate the expenses you paid on your account, divide your ending account value by $1,000 (for example, an $8,600 ending account value divided by $1,000 = 8.6), then multiply the result by the number under the heading entitled “Expenses Paid During the Period”.
Hypothetical example for comparison purposes
The table below titled “Based on Hypothetical Total Return” provides information about hypothetical account values and hypothetical expenses based on the actual expense ratio and an assumed rate of return of 5.00% per year before expenses, which is not the Fund’s actual return. The hypothetical account values and expenses may not be used to estimate the actual ending account balance or expenses you paid for the period. You may use the information provided in this table to compare the ongoing costs of investing in the Fund and other funds. To do so, compare the 5.00% hypothetical example relating to the Fund with the 5.00% hypothetical examples that appear in the shareholder reports of the other funds.
Please note that the expenses shown in the table below are meant to highlight your ongoing costs only and do not reflect any transactional costs, such as front-end or back-end sales charges (loads). Therefore, the table is useful in comparing ongoing costs only, and will not help you determine the relative total costs of owning different funds. In addition, if these transaction costs were included, your costs would have been higher.
| | | | | | | | | | | | | | | | | | | | | | | | | | | | | | | | | | | | | | | | | | | | |
| Based on actual total return1 | | | | | | | | Based on hypothetical total return1 | |
| | | Actual
Total Return
Without
Sales
Charge2 | | | Beginning
Account
Value | | | Ending
Account
Value | | | Annualized
Expense
Ratio | | | Expenses
Paid
During
the Period3 | | | | | | | Hypothetical
Annualized
Total Return | | | Beginning
Account
Value | | | Ending
Account
Value | | | Annualized
Expense
Ratio | | | Expenses
Paid
During
the
Period3 | |
| Class A | | | 12.72 | % | | $ | 1,000.00 | | | $ | 1,127.20 | | | | 1.04 | % | | $ | 5.58 | | | | | Class A | | | 5.00 | % | | $ | 1,000.00 | | | $ | 1,019.96 | | | | 1.04 | % | | $ | 5.30 | |
| Class C | | | 12.30 | | | | 1,000.00 | | | | 1,123.00 | | | | 1.82 | | | | 9.74 | | | | | Class C | | | 5.00 | | | | 1,000.00 | | | | 1,016.03 | | | | 1.82 | | | | 9.25 | |
| Class FI | | | 12.63 | | | | 1,000.00 | | | | 1,126.30 | | | | 1.25 | | | | 6.70 | | | | | Class FI | | | 5.00 | | | | 1,000.00 | | | | 1,018.90 | | | | 1.25 | | | | 6.36 | |
| Class R | | | 12.47 | | | | 1,000.00 | | | | 1,124.70 | | | | 1.51 | | | | 8.09 | | | | | Class R | | | 5.00 | | | | 1,000.00 | | | | 1,017.59 | | | | 1.51 | | | | 7.68 | |
| Class I | | | 12.84 | | | | 1,000.00 | | | | 1,128.40 | | | | 0.88 | | | | 4.72 | | | | | Class I | | | 5.00 | | | | 1,000.00 | | | | 1,020.77 | | | | 0.88 | | | | 4.48 | |
| | |
| Legg Mason Capital Management Special Investment Trust 2013 Annual Report | | 9 |
Fund expenses (unaudited) (cont’d)
| 1 | For the six months ended October 31, 2013. |
| 2 | Assumes the reinvestment of all distributions, including returns of capital, if any, at net asset value and does not reflect the deduction of the applicable sales charge with respect to Class A shares or the applicable contingent deferred sales charge (“CDSC”) with respect to Class C shares. Total return is not annualized, as it may not be representative of the total return for the year. Performance figures may reflect compensating balance arrangements and/or expense reimbursements. In the absence of compensating balance arrangements and/or expense reimbursements, the total return would have been lower. Past performance is no guarantee of future results. |
| 3 | Expenses (net of compensating balance arrangements and/or expense reimbursements) are equal to each class’ respective annualized expense ratio multiplied by the average account value over the period, multiplied by the number of days in the most recent fiscal half-year (184), then divided by 365. |
| | |
| 10 | | Legg Mason Capital Management Special Investment Trust 2013 Annual Report |
Fund performance (unaudited)
| | | | | | | | | | | | | | | | | | | | |
| Average annual total returns | | | | | | | | | | | | | |
| Without sales charges1 | | Class A | | | Class C | | | Class FI | | | Class R | | | Class I | |
| Twelve Months Ended 10/31/13 | | | 34.41 | % | | | 33.37 | % | | | 34.10 | % | | | 33.81 | % | | | 34.67 | % |
| Five Years Ended 10/31/13 | | | N/A | | | | 18.35 | | | | 19.09 | | | | 18.75 | | | | 19.57 | |
| Ten Years Ended 10/31/13 | | | N/A | | | | 4.75 | | | | N/A | | | | N/A | | | | 5.84 | |
| Inception* through 10/31/13 | | | 23.54 | | | | 10.59 | | | | 5.70 | | | | 2.40 | | | | 11.33 | |
| | | | | |
| With sales charges2 | | Class A | | | Class C | | | Class FI | | | Class R | | | Class I | |
| Twelve Months Ended 10/31/13 | | | 26.68 | % | | | 32.37 | % | | | 34.10 | % | | | 33.81 | % | | | 34.67 | % |
| Five Years Ended 10/31/13 | | | N/A | | | | 18.35 | | | | 19.09 | | | | 18.75 | | | | 19.57 | |
| Ten Years Ended 10/31/13 | | | N/A | | | | 4.75 | | | | N/A | | | | N/A | | | | 5.84 | |
| Inception* through 10/31/13 | | | 22.00 | | | | 10.59 | | | | 5.70 | | | | 2.40 | | | | 11.33 | |
| | | | |
| Cumulative total returns | |
| Without sales charges1 | | | |
| Class A (Inception date of 2/3/09 through 10/31/13) | | | 172.55 | % |
| Class C (10/31/03 through 10/31/13) | | | 59.02 | |
| Class FI (Inception date of 7/30/04 through 10/31/13) | | | 67.06 | |
| Class R (Inception date of 12/28/06 through 10/31/13) | | | 17.66 | |
| Class I (10/31/03 through 10/31/13) | | | 76.47 | |
All figures represent past performance and are not a guarantee of future results. Investment return and principal value of an investment will fluctuate so that an investor’s shares, when redeemed, may be worth more or less than their original cost. The returns shown do not reflect the deduction of taxes that a shareholder would pay on Fund distributions or the redemption of Fund shares. Performance figures may reflect compensating balance arrangements and/or expense reimbursements. In the absence of compensating balance arrangements and/or expense reimbursements, the total return would have been lower.
| 1 | Assumes the reinvestment of all distributions, including returns of capital, if any, at net asset value and does not reflect the deduction of the applicable sales charge with respect to Class A shares or the applicable contingent deferred sales charges (“CDSC”) with respect to Class C shares. |
| 2 | Assumes the reinvestment of all distributions, including returns of capital, if any, at net asset value. In addition, Class A shares reflect the deduction of the maximum initial sales charge of 5.75%. Class C shares reflect the deduction of a 1.00% CDSC, which applies if shares are redeemed within one year from purchase payment. |
| * | Inception dates for Class A, Class C, Class FI, Class R and Class I shares are February 3, 2009, December 30, 1985, July 30, 2004, December 28, 2006 and December 1, 1994, respectively. |
| | |
| Legg Mason Capital Management Special Investment Trust 2013 Annual Report | | 11 |
Fund performance (unaudited) (cont’d)
Historical performance
Value of $10,000 invested in
Class C Shares of Legg Mason Capital Management Special Investment Trust vs. S&P MidCap 400 Index† —
October 2003 - October 2013
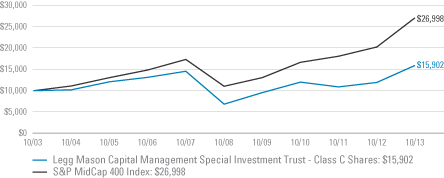
All figures represent past performance and are not a guarantee of future results. Investment return and principal value of an investment will fluctuate so that an investor’s shares, when redeemed, may be worth more or less than their original cost. The returns shown do not reflect the deduction of taxes that a shareholder would pay on Fund distributions or the redemption of Fund shares. Performance figures may reflect expense reimbursements. In the absence of expense reimbursements, the total return would have been lower.
| † | Hypothetical illustration of $10,000 invested in Class C shares of Legg Mason Capital Management Special Investment Trust on October 31, 2003, assuming the reinvestment of all distributions, including returns of capital, if any, at net asset value through October 31, 2013. The hypothetical illustration also assumes a $10,000 investment, in the S&P MidCap 400 Index. The S&P MidCap 400 Index is a market value weighted index which consists of 400 domestic stocks chosen for market size, liquidity and industry group representation. The Index is unmanaged and is not subject to the same management and trading expenses as a mutual fund. Please note that an investor cannot invest directly in an index. The performance of the Fund’s other classes may be greater or less than the Class C Shares’ performance indicated on this chart, depending on whether greater or lesser sales charges and fees were incurred by shareholders investing in these other classes. |
| | |
| 12 | | Legg Mason Capital Management Special Investment Trust 2013 Annual Report |
Schedule of investments
October 31, 2013
Legg Mason Capital Management Special Investment Trust
| | | | | | | | | | | | |
| Security | | | | | | Shares | | | Value | |
| Common Stocks — 95.6% | | | | | | | | | | | | |
| Consumer Discretionary — 17.0% | | | | | | | | | | | | |
Auto Components — 4.0% | | | | | | | | | | | | |
Allison Transmission Holdings Inc. | | | | | | | 250,000 | | | $ | 6,087,500 | |
Autoliv Inc. | | | | | | | 114,880 | | | | 10,250,742 | |
Gentex Corp. | | | | | | | 435,850 | | | | 12,831,424 | |
Total Auto Components | | | | | | | | | | | 29,169,666 | |
Diversified Consumer Services — 1.5% | | | | | | | | | | | | |
Service Corporation International | | | | | | | 580,000 | | | | 10,445,800 | |
Hotels, Restaurants & Leisure — 1.0% | | | | | | | | | | | | |
Bwin.Party Digital Entertainment PLC | | | | | | | 3,612,540 | | | | 7,112,998 | |
Household Durables — 0.9% | | | | | | | | | | | | |
Taylor Morrison Home Corp., Class A Shares | | | | | | | 290,000 | | | | 6,449,600 | * |
Internet & Catalog Retail — 1.6% | | | | | | | | | | | | |
Expedia Inc. | | | | | | | 200,000 | | | | 11,776,000 | |
Media — 3.7% | | | | | | | | | | | | |
Carmike Cinemas Inc. | | | | | | | 224,260 | | | | 5,133,311 | * |
Madison Square Garden Inc., Class A Shares | | | | | | | 179,140 | | | | 10,841,553 | * |
Scripps Networks Interactive, Class A Shares | | | | | | | 136,740 | | | | 11,007,570 | |
Total Media | | | | | | | | | | | 26,982,434 | |
Multiline Retail — 0.9% | | | | | | | | | | | | |
Big Lots Inc. | | | | | | | 180,000 | | | | 6,544,800 | * |
Specialty Retail — 3.4% | | | | | | | | | | | | |
Advance Auto Parts Inc. | | | | | | | 147,970 | | | | 14,675,665 | |
Pier 1 Imports Inc. | | | | | | | 488,400 | | | | 10,197,792 | |
Total Specialty Retail | | | | | | | | | | | 24,873,457 | |
Total Consumer Discretionary | | | | | | | | | | | 123,354,755 | |
| Consumer Staples — 3.8% | | | | | | | | | | | | |
Beverages — 2.0% | | | | | | | | | | | | |
Dr. Pepper Snapple Group Inc. | | | | | | | 300,000 | | | | 14,205,000 | |
Food Products — 1.8% | | | | | | | | | | | | |
TreeHouse Foods Inc. | | | | | | | 180,000 | | | | 13,186,800 | * |
Total Consumer Staples | | | | | | | | | | | 27,391,800 | |
| Energy — 5.8% | | | | | | | | | | | | |
Oil, Gas & Consumable Fuels — 5.8% | | | | | | | | | | | | |
CONSOL Energy Inc. | | | | | | | 374,730 | | | | 13,677,645 | |
Diamondback Energy Inc. | | | | | | | 29,720 | | | | 1,535,038 | * |
Murphy USA Inc. | | | | | | | 163,500 | | | | 6,634,830 | * |
QEP Resources Inc. | | | | | | | 300,000 | | | | 9,918,000 | |
See Notes to Financial Statements.
| | |
| Legg Mason Capital Management Special Investment Trust 2013 Annual Report | | 13 |
Schedule of investments (cont’d)
October 31, 2013
Legg Mason Capital Management Special Investment Trust
| | | | | | | | | | | | |
| Security | | | | | | Shares | | | Value | |
Oil, Gas & Consumable Fuels — continued | | | | | | | | | | | | |
Whiting Petroleum Corp. | | | | | | | 150,000 | | | $ | 10,033,500 | * |
Total Energy | | | | | | | | | | | 41,799,013 | |
| Financials — 20.3% | | | | | | | | | | | | |
Capital Markets — 3.2% | | | | | | | | | | | | |
E*TRADE Financial Corp. | | | | | | | 787,180 | | | | 13,311,214 | * |
Fortress Investment Group LLC, Class A Shares | | | | | | | 1,177,190 | | | | 9,711,817 | |
Total Capital Markets | | | | | | | | | | | 23,023,031 | |
Commercial Banks — 4.8% | | | | | | | | | | | | |
Fifth Third Bancorp | | | | | | | 379,860 | | | | 7,228,736 | |
First Interstate BancSystem Inc., Class A Shares | | | | | | | 537,140 | | | | 13,487,585 | |
First Southern Bancorp Inc., Class B Shares, Series C Cnv Pfd | | | | | | | 263,250 | | | | 1,368,900 | *(b)(c) |
Synovus Financial Corp. | | | | | | | 3,923,050 | | | | 12,749,913 | |
Total Commercial Banks | | | | | | | | | | | 34,835,134 | |
Consumer Finance — 1.1% | | | | | | | | | | | | |
Springleaf Holdings Inc. | | | | | | | 409,330 | | | | 8,321,679 | * |
Diversified Financial Services — 1.9% | | | | | | | | | | | | |
KKR Financial Holdings LLC | | | | | | | 1,370,000 | | | | 13,576,700 | |
Insurance — 6.4% | | | | | | | | | | | | |
Assured Guaranty Ltd. | | | | | | | 558,980 | | | | 11,459,090 | |
Genworth Financial Inc., Class A Shares | | | | | | | 661,740 | | | | 9,615,082 | * |
Hartford Financial Services Group Inc. | | | | | | | 417,190 | | | | 14,059,303 | |
ProAssurance Corp. | | | | | | | 205,370 | | | | 9,307,368 | |
Syncora Holdings Ltd. | | | | | | | 4,139,641 | | | | 1,821,442 | *(a) |
Total Insurance | | | | | | | | | | | 46,262,285 | |
Real Estate Investment Trusts (REITs) — 2.3% | | | | | | | | | | | | |
American Homes 4 Rent, Class A Shares | | | | | | | 540,000 | | | | 8,359,200 | * |
Hatteras Financial Corp. | | | | | | | 475,000 | | | | 8,645,000 | |
Total Real Estate Investment Trusts (REITs) | | | | | | | | | | | 17,004,200 | |
Real Estate Management & Development — 0.6% | | | | | | | | | | | | |
Realogy Holdings Corp. | | | | | | | 109,970 | | | | 4,524,166 | * |
Total Financials | | | | | | | | | | | 147,547,195 | |
| Health Care — 11.0% | | | | | | | | | | | | |
Health Care Equipment & Supplies — 5.5% | | | | | | | | | | | | |
Cyberonics Inc. | | | | | | | 193,690 | | | | 11,187,534 | * |
Endologix Inc. | | | | | | | 377,730 | | | | 6,825,581 | * |
Haemonetics Corp. | | | | | | | 150,000 | | | | 6,084,000 | * |
IDEXX Laboratories Inc. | | | | | | | 146,630 | | | | 15,815,512 | * |
Total Health Care Equipment & Supplies | | | | | | | | | | | 39,912,627 | |
See Notes to Financial Statements.
| | |
| 14 | | Legg Mason Capital Management Special Investment Trust 2013 Annual Report |
Legg Mason Capital Management Special Investment Trust
| | | | | | | | | | | | |
| Security | | | | | | Shares | | | Value | |
Health Care Providers & Services — 5.5% | | | | | | | | | | | | |
Envision Healthcare Holdings Inc. | | | | | | | 199,500 | | | $ | 5,795,475 | * |
IPC The Hospitalist Co. | | | | | | | 200,000 | | | | 10,958,000 | * |
Laboratory Corporation of America Holdings | | | | | | | 90,000 | | | | 9,081,000 | * |
Premier Inc., Class A Shares | | | | | | | 109,520 | | | | 3,374,311 | * |
Surgical Care Affiliates Inc. | | | | | | | 409,050 | | | | 10,737,563 | * |
Total Health Care Providers & Services | | | | | | | | | | | 39,946,349 | |
Total Health Care | | | | | | | | | | | 79,858,976 | |
| Industrials — 17.5% | | | | | | | | | | | | |
Aerospace & Defense — 1.3% | | | | | | | | | | | | |
HEICO Corp. | | | | | | | 175,313 | | | | 9,393,244 | |
Air Freight & Logistics — 1.4% | | | | | | | | | | | | |
Expeditors International of Washington Inc. | | | | | | | 216,840 | | | | 9,820,684 | |
Airlines — 1.4% | | | | | | | | | | | | |
Allegiant Travel Co. | | | | | | | 96,930 | | | | 10,106,891 | |
Building Products — 2.7% | | | | | | | | | | | | |
Masco Corp. | | | | | | | 431,220 | | | | 9,111,678 | |
Owens Corning Inc. | | | | | | | 300,000 | | | | 10,779,000 | * |
Total Building Products | | | | | | | | | | | 19,890,678 | |
Commercial Services & Supplies — 1.3% | | | | | | | | | | | | |
Copart Inc. | | | | | | | 292,630 | | | | 9,431,465 | * |
Electrical Equipment — 1.6% | | | | | | | | | | | | |
Polypore International Inc. | | | | | | | 260,000 | | | | 11,752,000 | * |
Industrial Conglomerates — 0.7% | | | | | | | | | | | | |
McDermott International Inc. | | | | | | | 692,230 | | | | 4,894,066 | * |
Machinery — 1.0% | | | | | | | | | | | | |
Woodward Inc. | | | | | | | 184,500 | | | | 7,396,605 | |
Professional Services — 0.7% | | | | | | | | | | | | |
Acacia Research Corp. | | | | | | | 340,000 | | | | 5,130,600 | |
Road & Rail — 2.4% | | | | | | | | | | | | |
Old Dominion Freight Line Inc. | | | | | | | 375,000 | | | | 17,587,500 | * |
Trading Companies & Distributors — 3.0% | | | | | | | | | | | | |
Aircastle Ltd. | | | | | | | 723,090 | | | | 13,644,708 | |
MRC Global Inc. | | | | | | | 300,000 | | | | 8,385,000 | * |
Total Trading Companies & Distributors | | | | | | | | | | | 22,029,708 | |
Total Industrials | | | | | | | | | | | 127,433,441 | |
| Information Technology — 14.5% | | | | | | | | | | | | |
Communications Equipment — 0.9% | | | | | | | | | | | | |
F5 Networks Inc. | | | | | | | 80,030 | | | | 6,523,245 | * |
See Notes to Financial Statements.
| | |
| Legg Mason Capital Management Special Investment Trust 2013 Annual Report | | 15 |
Schedule of investments (cont’d)
October 31, 2013
Legg Mason Capital Management Special Investment Trust
| | | | | | | | | | | | |
| Security | | | | | | Shares | | | Value | |
Internet Software & Services — 0.4% | | | | | | | | | | | | |
Criteo SA, ADR | | | | | | | 88,057 | | | $ | 3,109,293 | * |
IT Services — 5.4% | | | | | | | | | | | | |
Blackhawk Network Holdings Inc. | | | | | | | 148,380 | | | | 3,391,967 | * |
EVERTEC Inc. | | | | | | | 461,170 | | | | 10,819,048 | |
FleetCor Technologies Inc. | | | | | | | 102,250 | | | | 11,794,538 | * |
NeuStar Inc. | | | | | | | 120,360 | | | | 5,526,931 | * |
Teradata Corp. | | | | | | | 175,000 | | | | 7,712,250 | * |
Total IT Services | | | | | | | | | | | 39,244,734 | |
Semiconductors & Semiconductor Equipment — 1.9% | | | | | | | | | | | | |
Integrated Device Technology Inc. | | | | | | | 1,280,770 | | | | 13,627,393 | * |
Software — 5.9% | | | | | | | | | | | | |
Accelrys Inc. | | | | | | | 552,670 | | | | 5,167,464 | * |
Amdocs Ltd. | | | | | | | 360,000 | | | | 13,842,000 | |
MICROS Systems Inc. | | | | | | | 210,000 | | | | 11,392,500 | * |
Red Hat Inc. | | | | | | | 230,000 | | | | 9,952,100 | * |
ServiceNow Inc. | | | | | | | 50,350 | | | | 2,749,614 | * |
Total Software | | | | | | | | | | | 43,103,678 | |
Total Information Technology | | | | | | | | | | | 105,608,343 | |
| Materials — 2.0% | | | | | | | | | | | | |
Chemicals — 0.9% | | | | | | | | | | | | |
Koppers Holdings Inc. | | | | | | | 149,170 | | | | 6,639,557 | |
Metals & Mining — 1.1% | | | | | | | | | | | | |
Compass Minerals International Inc. | | | | | | | 110,000 | | | | 8,191,700 | |
Total Materials | | | | | | | | | | | 14,831,257 | |
| Utilities — 3.7% | | | | | | | | | | | | |
Electric Utilities — 1.3% | | | | | | | | | | | | |
Portland General Electric Co. | | | | | | | 323,810 | | | | 9,293,347 | |
Independent Power Producers & Energy Traders — 2.4% | | | | | | | | | | | | |
AES Corp. | | | | | | | 378,630 | | | | 5,334,897 | |
Calpine Corp. | | | | | | | 619,810 | | | | 12,501,568 | * |
Total Independent Power Producers & Energy Traders | | | | | | | | | | | 17,836,465 | |
Total Utilities | | | | | | | | | | | 27,129,812 | |
Total Common Stocks (Cost — $555,796,073) | | | | | | | | | | | 694,954,592 | |
| Preferred Stocks — 0.2% | | | | | | | | | | | | |
| Financials — 0.1% | | | | | | | | | | | | |
Commercial Banks — 0.1% | | | | | | | | | | | | |
First Southern Bancorp Inc. | | | | | | | 450 | | | | 908,244 | *(b)(c) |
See Notes to Financial Statements.
| | |
| 16 | | Legg Mason Capital Management Special Investment Trust 2013 Annual Report |
Legg Mason Capital Management Special Investment Trust
| | | | | | | | | | | | | | | | |
| Security | | | | | | | | Shares | | | Value | |
| Health Care — 0.1% | | | | | | | | | | | | | | | | |
Health Care Equipment & Supplies — 0.1% | | | | | | | | | | | | | | | | |
Super Dimension Ltd., Escrow Receipt | | | | | | | | | | | 490,216 | | | $ | 639,050 | *(b)(c)(d) |
Total Preferred Stocks (Cost — $450,000) | | | | | | | | | | | | | | | 1,547,294 | |
Total Investments before Short-term Investments (Cost — $556,246,073) | | | | | | | | 696,501,886 | |
| | | | |
| | | Rate | | | Maturity
Date | | | Face
Amount | | | | |
| Short-Term Investments — 3.7% | | | | | | | | | | | | | | | | |
Repurchase Agreements — 3.7% | | | | | | | | | | | | | | | | |
Interest in $1,150,000,000 joint tri-party repurchase agreement dated 10/31/13 with RBS Securities Inc.; Proceeds at maturity — $26,879,060; (Fully collateralized by various U.S. government obligations, 1.250% to 3.625% due 10/31/18 to 8/15/43; Market value — $27,416,606)
(Cost — $26,879,000) | | | 0.080 | % | | | 11/1/13 | | | $ | 26,879,000 | | | | 26,879,000 | |
Total Investments — 99.5% (Cost — $583,125,073#) | | | | | | | | | | | | | | | 723,380,886 | |
Other Assets in Excess of Liabilities — 0.5% | | | | | | | | | | | | | | | 3,604,973 | |
Total Net Assets — 100.0% | | | | | | | | | | | | | | $ | 726,985,859 | |
| * | Non-income producing security. |
| (a) | In this instance, as defined in the Investment Company Act of 1940, an “Affiliated Company” represents Fund ownership of at least 5% of the outstanding voting securities of an issuer. At October 31, 2013, the total market value of Affiliated Companies was $1,821,442, and the cost was $10,260,723 (See Note 9). |
| (c) | Security is valued in good faith in accordance with procedures approved by the Board of Trustees (See Note 1). |
| (d) | Restricted security (Note 8). |
| # | Aggregate cost for federal income tax purposes is $609,113,333. |
| | |
Abbreviation used in this schedule: |
| ADR | | — American Depositary Receipts |
See Notes to Financial Statements.
| | |
| Legg Mason Capital Management Special Investment Trust 2013 Annual Report | | 17 |
Statement of assets and liabilities
October 31, 2013
| | | | |
| |
| Assets: | | | | |
Investments in unaffiliated securities, at value (Cost — $572,864,350) | | $ | 721,559,444 | |
Investments in affiliated securities, at value (Cost — $10,260,723) | | | 1,821,442 | |
Cash | | | 460 | |
Receivable for securities sold | | | 26,843,595 | |
Dividends and interest receivable | | | 183,097 | |
Receivable for Fund shares sold | | | 134,198 | |
Prepaid expenses | | | 51,009 | |
Other assets | | | 10,303 | |
Total Assets | | | 750,603,548 | |
| |
| Liabilities: | | | | |
Payable for securities purchased | | | 21,710,333 | |
Payable for Fund shares repurchased | | | 645,184 | |
Service and/or distribution fees payable | | | 520,263 | |
Investment management fee payable | | | 411,984 | |
Accrued expenses | | | 329,925 | |
Total Liabilities | | | 23,617,689 | |
| Total Net Assets | | $ | 726,985,859 | |
| |
| Net Assets: | | | | |
Par value (Note 7) | | $ | 183 | |
Paid-in capital in excess of par value | | | 562,692,407 | |
Overdistributed net investment income | | | (1,408,778) | |
Accumulated net realized gain on investments and foreign currency transactions | | | 25,446,234 | |
Net unrealized appreciation on investments | | | 140,255,813 | |
| Total Net Assets | | $ | 726,985,859 | |
| |
| Shares Outstanding: | | | | |
Class A | | | 1,029,106 | |
Class C | | | 15,678,109 | |
Class FI | | | 37,197 | |
Class R | | | 124,185 | |
Class I | | | 1,421,095 | |
| |
| Net Asset Value: | | | | |
Class A (and redemption price) | | | $39.24 | |
Class C* | | | $38.61 | |
Class FI (and redemption price) | | | $50.11 | |
Class R (and redemption price) | | | $49.78 | |
Class I (and redemption price) | | | $51.56 | |
| Maximum Public Offering Price Per Share: | | | | |
Class A (based on maximum initial sales charge of 5.75%) | | | $41.63 | |
| * | Redemption price per share is NAV of Class C shares reduced by a 1.00% CDSC, if shares are redeemed within one year from purchase payment (See Note 2) |
See Notes to Financial Statements.
| | |
| 18 | | Legg Mason Capital Management Special Investment Trust 2013 Annual Report |
Statement of operations
For the Year Ended October 31, 2013
| | | | |
| |
| Investment Income: | | | | |
Dividends from unaffiliated investments | | $ | 10,162,732 | |
Dividends from affiliated investments | | | 382,733 | |
Interest | | | 6,221 | |
Total Investment Income | | | 10,551,686 | |
| |
| Expenses: | | | | |
Service and/or distribution fees (Notes 2 and 5) | | | 5,977,222 | |
Investment management fee (Note 2) | | | 4,897,618 | |
Transfer agent fees (Note 5) | | | 758,043 | |
Legal fees | | | 97,631 | |
Registration fees | | | 92,606 | |
Audit and tax | | | 86,445 | |
Trustees’ fees | | | 82,445 | |
Fund accounting fees | | | 67,733 | |
Shareholder reports | | | 42,630 | |
Insurance | | | 11,295 | |
Custody fees | | | 8,904 | |
Miscellaneous expenses | | | 21,661 | |
Total Expenses | | | 12,144,233 | |
Less: Expense reimbursements (Notes 2 and 5) | | | (168,890) | |
Net Expenses | | | 11,975,343 | |
| Net Investment Loss | | | (1,423,657) | |
| |
Realized and Unrealized Gain (Loss) on Investments and
Foreign Currency Transactions (Notes 1 and 3): | | | | |
Net Realized Gain (Loss) From: | | | | |
Investment transactions in unaffiliated securities | | | 161,316,776 | |
Investment transactions in affiliated securities | | | (11,208,026) | |
Foreign currency transactions | | | 326 | |
Net Realized Gain | | | 150,109,076 | |
Change in Net Unrealized Appreciation (Depreciation) From: | | | | |
Unaffiliated investments | | | 43,443,844 | |
Affiliated investments | | | 9,494,578 | |
Change in Net Unrealized Appreciation (Depreciation) | | | 52,938,422 | |
| Net Gain on Investments and Foreign Currency Transactions | | | 203,047,498 | |
| Increase in Net Assets from Operations | | $ | 201,623,841 | |
See Notes to Financial Statements.
| | |
| Legg Mason Capital Management Special Investment Trust 2013 Annual Report | | 19 |
Statements of changes in net assets
| | | | | | | | |
| For the Years Ended October 31, | | 2013 | | | 2012 | |
| | |
| Operations: | | | | | | | | |
Net investment income (loss) | | $ | (1,423,657) | | | $ | 892,151 | |
Net realized gain | | | 150,109,076 | | | | 29,350,172 | |
Change in net unrealized appreciation (depreciation) | | | 52,938,422 | | | | 40,386,388 | |
Increase in Net Assets From Operations | | | 201,623,841 | | | | 70,628,711 | |
| | |
| Distributions to Shareholders From (Notes 1 and 6): | | | | | | | | |
Net investment income | | | (6,382,179) | | | | (3,087,600) | |
Decrease in Net Assets From Distributions to Shareholders | | | (6,382,179) | | | | (3,087,600) | |
| | |
| Fund Share Transactions (Note 7): | | | | | | | | |
Net proceeds from sale of shares | | | 28,086,667 | | | | 24,284,145 | |
Reinvestment of distributions | | | 5,812,278 | | | | 2,663,269 | |
Cost of shares repurchased | | | (177,772,888) | | | | (244,916,358) | |
Decrease in Net Assets From Fund Share Transactions | | | (143,873,943) | | | | (217,968,944) | |
Increase (Decrease) in Net Assets | | | 51,367,719 | | | | (150,427,833) | |
| | |
| Net Assets: | | | | | | | | |
Beginning of year | | | 675,618,140 | | | | 826,045,973 | |
End of year* | | $ | 726,985,859 | | | $ | 675,618,140 | |
* Includes (overdistributed) undistributed net investment income, respectively, of: | | | $(1,408,778) | | | | $2,442,888 | |
See Notes to Financial Statements.
| | |
| 20 | | Legg Mason Capital Management Special Investment Trust 2013 Annual Report |
Financial highlights
| | | | | | | | | | | | | | | | | | | | | | | | |
For a share of each class of beneficial interest outstanding throughout each year ended October 31,
unless otherwise noted: | |
| Class A Shares1 | | 2013 | | | 2012 | | | 20112 | | | 20102 | | | 20092,3 | | | 20092,4 | |
| | | | | | |
| Net asset value, beginning of year | | | $29.66 | | | | $27.28 | | | | $29.72 | | | | $23.45 | | | | $14.53 | | | | $14.84 | |
| | | | | | |
| Income (loss) from operations: | | | | | | | | | | | | | | | | | | | | | | | | |
Net investment income (loss) | | | 0.15 | | | | 0.22 | | | | 0.04 | | | | (0.07) | | | | 0.04 | | | | 0.01 | |
Net realized and unrealized gain (loss) | | | 9.94 | | | | 2.58 | | | | (2.48) | | | | 6.34 | | | | 8.88 | | | | (0.32) | |
Total income (loss) from operations | | | 10.09 | | | | 2.80 | | | | (2.44) | | | | 6.27 | | | | 8.92 | | | | (0.31) | |
| | | | | | |
| Less distributions from: | | | | | | | | | | | | | | | | | | | | | | | | |
Net investment income | | | (0.51) | | | | (0.42) | | | | — | | | | — | | | | — | | | | — | |
Total distributions | | | (0.51) | | | | (0.42) | | | | — | | | | — | | | | — | | | | — | |
| | | | | | |
| Net asset value, end of year | | | $39.24 | | | | $29.66 | | | | $27.28 | | | | $29.72 | | | | $23.45 | | | | $14.53 | |
Total return5 | | | 34.41 | % | | | 10.30 | % | | | (8.21) | % | | | 26.74 | % | | | 61.39 | % | | | (2.09) | % |
| | | | | | |
| Net assets, end of year (000s) | | | $40,382 | | | | $32,573 | | | | $40,134 | | | | $46,569 | | | | $38,171 | | | | $24,329 | |
| | | | | | |
| Ratios to average net assets: | | | | | | | | | | | | | | | | | | | | | | | | |
Gross expenses | | | 1.09 | % | | | 1.11 | % | | | 1.06 | % | | | 1.07 | % | | | 1.03 | %6 | | | 1.14 | %6 |
Net expenses7,8 | | | 1.06 | | | | 1.09 | | | | 1.05 | | | | 1.05 | | | | 1.03 | 6 | | | 1.13 | 6 |
Net investment income (loss) | | | 0.43 | | | | 0.74 | | | | 0.14 | | | | (0.25) | | | | 0.32 | 6 | | | 0.43 | 6 |
| | | | | | |
| Portfolio turnover rate | | | 39 | % | | | 30 | % | | | 57 | % | | | 46 | % | | | 42 | % | | | 78 | % |
| 1 | Per share amounts have been calculated using the average shares method. |
| 2 | Represents a share of capital stock outstanding prior to February 29, 2012. |
| 3 | For the period April 1, 2009 through October 31, 2009. |
| 4 | For the period February 3, 2009 (inception date) to March 31, 2009. |
| 5 | Performance figures, exclusive of sales charges, may reflect compensating balance arrangements and/or expense reimbursements. In the absence of compensating balance arrangements and/or expense reimbursements, the total return would have been lower. Past performance is no guarantee of future results. Total returns for periods of less than one year are not annualized. |
| 7 | Reflects expense reimbursements. |
| 8 | The impact of compensating balance arrangements, if any, was less than 0.01%. |
See Notes to Financial Statements.
| | |
| Legg Mason Capital Management Special Investment Trust 2013 Annual Report | | 21 |
Financial highlights (cont’d)
| | | | | | | | | | | | | | | | | | | | | | | | |
For a share of each class of beneficial interest outstanding throughout each year ended October 31,
unless otherwise noted: | |
| Class C Shares1,2 | | 2013 | | | 2012 | | | 20113 | | | 20103 | | | 20093,4 | | | 20093,5 | |
| | | | | | |
| Net asset value, beginning of year | | | $29.17 | | | | $26.72 | | | | $29.35 | | | | $23.34 | | | | $14.52 | | | | $25.03 | |
| | | | | | |
| Income (loss) from operations: | | | | | | | | | | | | | | | | | | | | | | | | |
Net investment loss | | | (0.12) | | | | (0.01) | | | | (0.21) | | | | (0.29) | | | | (0.05) | | | | (0.02) | |
Net realized and unrealized gain (loss) | | | 9.82 | | | | 2.53 | | | | (2.42) | | | | 6.30 | | | | 8.87 | | | | (10.49) | |
Total income (loss) from operations | | | 9.70 | | | | 2.52 | | | | (2.63) | | | | 6.01 | | | | 8.82 | | | | (10.51) | |
| | | | | | |
| Less distributions from: | | | | | | | | | | | | | | | | | | | | | | | | |
Net investment income | | | (0.26) | | | | (0.07) | | | | — | | | | — | | | | — | | | | — | |
Total distributions | | | (0.26) | | | | (0.07) | | | | — | | | | — | | | | — | | | | — | |
| | | | | | |
| Net asset value, end of year | | | $38.61 | | | | $29.17 | | | | $26.72 | | | | $29.35 | | | | $23.34 | | | | $14.52 | |
Total return6 | | | 33.37 | % | | | 9.45 | % | | | (8.96) | % | | | 25.75 | % | | | 60.74 | % | | | (41.99) | % |
| | | | | | |
| Net assets, end of year (000s) | | | $605,286 | | | | $559,450 | | | | $678,950 | | | | $955,414 | | | | $904,106 | | | | $611,440 | |
| | | | | | |
| Ratios to average net assets: | | | | | | | | | | | | | | | | | | | | | | | | |
Gross expenses | | | 1.88 | % | | | 1.88 | % | | | 1.86 | % | | | 1.86 | % | | | 1.78 | %7 | | | 1.82 | % |
Net expenses8,9 | | | 1.85 | | | | 1.86 | | | | 1.85 | | | | 1.85 | | | | 1.77 | 7 | | | 1.81 | |
Net investment loss | | | (0.35) | | | | (0.04) | | | | (0.67) | | | | (1.04) | | | | (0.41) | 7 | | | (0.09) | |
| | | | | | |
| Portfolio turnover rate | | | 39 | % | | | 30 | % | | | 57 | % | | | 46 | % | | | 42 | % | | | 78 | % |
| 1 | On February 1, 2009, Primary Class shares were renamed Class C shares. |
| 2 | Per share amounts have been calculated using the average shares method. |
| 3 | Represents a share of capital stock outstanding prior to February 29, 2012. |
| 4 | For the period April 1, 2009 through October 31, 2009. |
| 5 | For the year ended March 31. |
| 6 | Performance figures, exclusive of CDSCs, may reflect compensating balance arrangements and/or expense reimbursements. In the absence of compensating balance arrangements and/or expense reimbursements, the total return would have been lower. Past performance is no guarantee of future results. Total returns for periods of less than one year are not annualized. |
| 8 | Reflects expense reimbursements. |
| 9 | The impact of compensating balance arrangements, if any, was less than 0.01%. |
See Notes to Financial Statements.
| | |
| 22 | | Legg Mason Capital Management Special Investment Trust 2013 Annual Report |
| | | | | | | | | | | | | | | | | | | | | | | | |
For a share of each class of beneficial interest outstanding throughout each year ended October 31,
unless otherwise noted: | |
| Class FI Shares1,2 | | 2013 | | | 2012 | | | 20113 | | | 20103 | | | 20093,4 | | | 20093,5 | |
| | | | | | |
| Net asset value, beginning of year | | | $37.79 | | | | $34.61 | | | | $37.75 | | | | $29.82 | | | | $18.49 | | | | $31.68 | |
| | | | | | |
| Income (loss) from operations: | | | | | | | | | | | | | | | | | | | | | | | | |
Net investment income (loss) | | | 0.25 | | | | 0.24 | | | | 0.00 | 6 | | | (0.11) | | | | 0.03 | | | | 0.14 | |
Net realized and unrealized gain (loss) | | | 12.54 | | | | 3.28 | | | | (3.14) | | | | 8.04 | | | | 11.30 | | | | (13.33) | |
Total income (loss) from operations | | | 12.79 | | | | 3.52 | | | | (3.14) | | | | 7.93 | | | | 11.33 | | | | (13.19) | |
| | | | | | |
| Less distributions from: | | | | | | | | | | | | | | | | | | | | | | | | |
Net investment income | | | (0.47) | | | | (0.34) | | | | — | | | | — | | | | — | | | | — | |
Total distributions | | | (0.47) | | | | (0.34) | | | | — | | | | — | | | | — | | | | — | |
| | | | | | |
| Net asset value, end of year | | | $50.11 | | | | $37.79 | | | | $34.61 | | | | $37.75 | | | | $29.82 | | | | $18.49 | |
Total return7 | | | 34.10 | % | | | 10.23 | % | | | (8.34) | % | | | 26.59 | % | | | 61.28 | % | | | (41.63) | % |
| | | | | | |
| Net assets, end of year (000s) | | | $1,864 | | | | $9,986 | | | | $9,684 | | | | $13,231 | | | | $11,746 | | | | $7,193 | |
| | | | | | |
| Ratios to average net assets: | | | | | | | | | | | | | | | | | | | | | | | | |
Gross expenses | | | 1.25 | % | | | 1.19 | % | | | 1.18 | % | | | 1.14 | % | | | 1.18 | %8 | | | 1.21 | % |
Net expenses9,10 | | | 1.23 | | | | 1.17 | | | | 1.17 | | | | 1.12 | | | | 1.17 | 8 | | | 1.20 | |
Net investment income (loss) | | | 0.61 | | | | 0.66 | | | | 0.01 | | | | (0.32) | | | | 0.18 | 8 | | | 0.49 | |
| | | | | | |
| Portfolio turnover rate | | | 39 | % | | | 30 | % | | | 57 | % | | | 46 | % | | | 42 | % | | | 78 | % |
| 1 | On October 5, 2009, Financial Intermediary Class shares were renamed Class FI shares. |
| 2 | Per share amounts have been calculated using the average shares method. |
| 3 | Represents a share of capital stock outstanding prior to February 29, 2012. |
| 4 | For the period April 1, 2009 through October 31, 2009. |
| 5 | For the year ended March 31. |
| 6 | Amount represents less than $0.01 per share. |
| 7 | Performance figures may reflect compensating balance arrangements and/or expense reimbursements. In the absence of compensating balance arrangements and/or expense reimbursements, the total return would have been lower. Past performance is no guarantee of future results. Total returns for periods of less than one year are not annualized. |
| 9 | Reflects expense reimbursements. |
| 10 | The impact of compensating balance arrangements, if any, was less than 0.01%. |
See Notes to Financial Statements.
| | |
| Legg Mason Capital Management Special Investment Trust 2013 Annual Report | | 23 |
Financial highlights (cont’d)
| | | | | | | | | | | | | | | | | | | | | | | | |
For a share of each class of beneficial interest outstanding throughout each year ended October 31,
unless otherwise noted: | |
| Class R Shares1 | | 2013 | | | 2012 | | | 20112 | | | 20102 | | | 20092,3 | | | 20092,4 | |
| | | | | | |
| Net asset value, beginning of year | | | $37.38 | | | | $34.15 | | | | $37.36 | | | | $29.59 | | | | $18.38 | | | | $31.57 | |
| | | | | | |
| Income (loss) from operations: | | | | | | | | | | | | | | | | | | | | | | | | |
Net investment income (loss) | | | 0.01 | | | | 0.09 | | | | (0.10) | | | | (0.22) | | | | (0.01) | | | | 0.08 | |
Net realized and unrealized gain (loss) | | | 12.61 | | | | 3.24 | | | | (3.11) | | | | 7.99 | | | | 11.22 | | | | (13.27) | |
Total income (loss) from operations | | | 12.62 | | | | 3.33 | | | | (3.21) | | | | 7.77 | | | | 11.21 | | | | (13.19) | |
| | | | | | |
| Less distributions from: | | | | | | | | | | | | | | | | | | | | | | | | |
Net investment income | | | (0.22) | | | | (0.10) | | | | — | | | | — | | | | — | | | | — | |
Total distributions | | | (0.22) | | | | (0.10) | | | | — | | | | — | | | | — | | | | — | |
| | | | | | |
| Net asset value, end of year | | | $49.78 | | | | $37.38 | | | | $34.15 | | | | $37.36 | | | | $29.59 | | | | $18.38 | |
Total return5 | | | 33.81 | % | | | 9.77 | % | | | (8.59) | % | | | 26.26 | % | | | 60.99 | % | | | (41.78) | % |
| | | | | | |
| Net assets, end of year (000s) | | | $6,181 | | | | $7,449 | | | | $9,301 | | | | $13,320 | | | | $14,016 | | | | $9,242 | |
| | | | | | |
| Ratios to average net assets: | | | | | | | | | | | | | | | | | | | | | | | | |
Gross expenses | | | 1.54 | % | | | 1.60 | % | | | 1.44 | % | | | 1.45 | % | | | 1.41 | %6 | | | 1.47 | % |
Net expenses7,8 | | | 1.51 | | | | 1.58 | | | | 1.43 | | | | 1.44 | | | | 1.41 | 6 | | | 1.46 | |
Net investment income (loss) | | | 0.02 | | | | 0.26 | | | | (0.25) | | | | (0.63) | | | | (0.07) | 6 | | | 0.29 | |
| | | | | | |
| Portfolio turnover rate | | | 39 | % | | | 30 | % | | | 57 | % | | | 46 | % | | | 42 | % | | | 78 | % |
| 1 | Per share amounts have been calculated using the average shares method. |
| 2 | Represents a share of capital stock outstanding prior to February 29, 2012. |
| 3 | For the period April 1, 2009 through October 31, 2009. |
| 4 | For the year ended March 31. |
| 5 | Performance figures may reflect compensating balance arrangements and/or expense reimbursements. In the absence of compensating balance arrangements and/or expense reimbursements, the total return would have been lower. Past performance is no guarantee of future results. Total returns for periods of less than one year are not annualized. |
| 7 | Reflects expense reimbursements. |
| 8 | The impact of compensating balance arrangements, if any, was less than 0.01%. |
See Notes to Financial Statements.
| | |
| 24 | | Legg Mason Capital Management Special Investment Trust 2013 Annual Report |
| | | | | | | | | | | | | | | | | | | | | | | | |
For a share of each class of beneficial interest outstanding throughout each year ended October 31,
unless otherwise noted: | |
| Class I Shares1,2 | | 2013 | | | 2012 | | | 20113 | | | 20103 | | | 20093,4 | | | 20093,5 | |
| | | | | | |
| Net asset value, beginning of year | | | $38.84 | | | | $35.57 | | | | $38.67 | | | | $30.47 | | | | $18.84 | | | | $32.13 | |
| | | | | | |
| Income (loss) from operations: | | | | | | | | | | | | | | | | | | | | | | | | |
Net investment income | | | 0.28 | | | | 0.38 | | | | 0.15 | | | | 0.00 | 6 | | | 0.10 | | | | 0.27 | |
Net realized and unrealized gain (loss) | | | 13.04 | | | | 3.39 | | | | (3.25) | | | | 8.24 | | | | 11.53 | | | | (13.56) | |
Total income (loss) from operations | | | 13.32 | | | | 3.77 | | | | (3.10) | | | | 8.24 | | | | 11.63 | | | | (13.29) | |
| | | | | | |
| Less distributions from: | | | | | | | | | | | | | | | | | | | | | | | | |
Net investment income | | | (0.60) | | | | (0.50) | | | | — | | | | (0.04) | | | | — | | | | — | |
Total distributions | | | (0.60) | | | | (0.50) | | | | — | | | | (0.04) | | | | — | | | | — | |
| | | | | | |
| Net asset value, end of year | | | $51.56 | | | | $38.84 | | | | $35.57 | | | | $38.67 | | | | $30.47 | | | | $18.84 | |
Total return7 | | | 34.67 | % | | | 10.65 | % | | | (8.02) | % | | | 27.07 | % | | | 61.73 | % | | | (41.36) | % |
| | | | | | |
| Net assets, end of year (000s) | | | $73,273 | | | | $66,160 | | | | $87,977 | | | | $184,789 | | | | $165,539 | | | | $93,250 | |
| | | | | | |
| Ratios to average net assets: | | | | | | | | | | | | | | | | | | | | | | | | |
Gross expenses | | | 0.91 | % | | | 0.82 | % | | | 0.80 | % | | | 0.81 | % | | | 0.74 | %8 | | | 0.79 | % |
Net expenses9,10 | | | 0.89 | | | | 0.81 | | | | 0.79 | | | | 0.79 | | | | 0.73 | 8 | | | 0.78 | |
Net investment income | | | 0.62 | | | | 1.01 | | | | 0.37 | | | | 0.01 | | | | 0.60 | 8 | | | 0.98 | |
| | | | | | |
| Portfolio turnover rate | | | 39 | % | | | 30 | % | | | 57 | % | | | 46 | % | | | 42 | % | | | 78 | % |
| 1 | On October 5, 2009, Institutional Class shares were renamed Class I shares. |
| 2 | Per share amounts have been calculated using the average shares method. |
| 3 | Represents a share of capital stock outstanding prior to February 29, 2012. |
| 4 | For the period April 1, 2009 through October 31, 2009. |
| 5 | For the year ended March 31. |
| 6 | Amount represents less than $0.01 per share. |
| 7 | Performance figures may reflect compensating balance arrangements and/or expense reimbursements. In the absence of compensating balance arrangements and/or expense reimbursements, the total return would have been lower. Past performance is no guarantee of future results. Total returns for periods of less than one year are not annualized. |
| 9 | Reflects expense reimbursements. |
| 10 | The impact of compensating balance arrangements, if any, was less than 0.01%. |
See Notes to Financial Statements.
| | |
| Legg Mason Capital Management Special Investment Trust 2013 Annual Report | | 25 |
Notes to financial statements
1. Organization and significant accounting policies
Legg Mason Capital Management Special Investment Trust (the “Fund”) is a separate diversified investment series of Legg Mason Global Asset Management Trust (the “Trust”). The Trust, a Maryland statutory trust, is registered under the Investment Company Act of 1940, as amended (the “1940 Act”), as an open-end, management investment company. On February 29, 2012, the Fund was reorganized as a new series of the Trust. Prior to February 29, 2012, the Fund was organized as a series of Legg Mason Capital Management Growth Trust, Inc., a Maryland corporation.
The following are significant accounting policies consistently followed by the Fund and are in conformity with U.S. generally accepted accounting principles (“GAAP”). Estimates and assumptions are required to be made regarding assets, liabilities and changes in net assets resulting from operations when financial statements are prepared. Changes in the economic environment, financial markets and any other parameters used in determining these estimates could cause actual results to differ. Subsequent events have been evaluated through the date the financial statements were issued.
(a) Investment valuation. Equity securities for which market quotations are available are valued at the last reported sales price or official closing price on the primary market or exchange on which they trade. The valuations for fixed income securities (which may include, but are not limited to, corporate, government, municipal, mortgage-backed, collateralized mortgage obligations and asset-backed securities) and certain derivative instruments are typically the prices supplied by independent third party pricing services, which may use market prices or broker/dealer quotations or a variety of valuation techniques and methodologies. The independent third party pricing services use inputs that are observable such as issuer details, interest rates, yield curves, prepayment speeds, credit risks/spreads, default rates and quoted prices for similar securities. Short-term fixed income securities that will mature in 60 days or less are valued at amortized cost, unless it is determined that using this method would not reflect an investment’s fair value. When the Fund holds securities or other assets that are denominated in a foreign currency, the Fund will normally use the currency exchange rates as of 4:00 p.m. (Eastern Time). If independent third party pricing services are unable to supply prices for a portfolio investment, or if the prices supplied are deemed by the manager to be unreliable, the market price may be determined by the manager using quotations from one or more broker/dealers or at the transaction price if the security has recently been purchased and no value has yet been obtained from a pricing service or pricing broker. When reliable prices are not readily available, such as when the value of a security has been significantly affected by events after the close of the exchange or market on which the security is principally traded, but before the Fund calculates its net asset value, the Fund values these securities as determined in accordance with procedures approved by the Fund’s Board of Trustees.
The Board of Trustees is responsible for the valuation process and has delegated the supervision of the daily valuation process to the Legg Mason North American Fund Valuation Committee (the “Valuation Committee”). The Valuation Committee, pursuant to the policies
| | |
| 26 | | Legg Mason Capital Management Special Investment Trust 2013 Annual Report |
adopted by the Board of Trustees, is responsible for making fair value determinations, evaluating the effectiveness of the Fund’s pricing policies, and reporting to the Board of Trustees. When determining the reliability of third party pricing information for investments owned by the Fund, the Valuation Committee, among other things, conducts due diligence reviews of pricing vendors, monitors the daily change in prices and reviews transactions among market participants.
The Valuation Committee will consider pricing methodologies it deems relevant and appropriate when making fair value determinations. Examples of possible methodologies include, but are not limited to, multiple of earnings; discount from market of a similar freely traded security; discounted cash-flow analysis; book value or a multiple thereof; risk premium/yield analysis; yield to maturity; and/or fundamental investment analysis. The Valuation Committee will also consider factors it deems relevant and appropriate in light of the facts and circumstances. Examples of possible factors include, but are not limited to, the type of security; the issuer’s financial statements; the purchase price of the security; the discount from market value of unrestricted securities of the same class at the time of purchase; analysts’ research and observations from financial institutions; information regarding any transactions or offers with respect to the security; the existence of merger proposals or tender offers affecting the security; the price and extent of public trading in similar securities of the issuer or comparable companies; and the existence of a shelf registration for restricted securities.
For each portfolio security that has been fair valued pursuant to the policies adopted by the Board of Trustees, the fair value price is compared against the last available and next available market quotations. The Valuation Committee reviews the results of such back testing monthly and fair valuation occurrences are reported to the Board of Trustees quarterly.
The Fund uses valuation techniques to measure fair value that are consistent with the market approach and/or income approach, depending on the type of security and the particular circumstance. The market approach uses prices and other relevant information generated by market transactions involving identical or comparable securities. The income approach uses valuation techniques to discount estimated future cash flows to present value.
GAAP establishes a disclosure hierarchy that categorizes the inputs to valuation techniques used to value assets and liabilities at measurement date. These inputs are summarized in the three broad levels listed below:
| Ÿ | | Level 1 — quoted prices in active markets for identical investments |
| Ÿ | | Level 2 — other significant observable inputs (including quoted prices for similar investments, interest rates, prepayment speeds, credit risk, etc.) |
| Ÿ | | Level 3 — significant unobservable inputs (including the Fund’s own assumptions in determining the fair value of investments) |
The inputs or methodologies used to value securities are not necessarily an indication of the risk associated with investing in those securities.
| | |
| Legg Mason Capital Management Special Investment Trust 2013 Annual Report | | 27 |
Notes to financial statements (cont’d)
The following is a summary of the inputs used in valuing the Fund’s assets carried at fair value:
| | | | | | | | | | | | | | | | |
| ASSETS | |
| Description | | Quoted Prices
(Level 1) | | | Other Significant
Observable Inputs
(Level 2) | | | Significant
Unobservable
Inputs
(Level 3) | | | Total | |
| Long-term investments†: | | | | | | | | | | | | | | | | |
Common stocks: | | | | | | | | | | | | | | | | |
Financials | | $ | 146,178,295 | | | $ | 1,368,900 | | | | — | | | $ | 147,547,195 | |
Other common stocks | | | 547,407,397 | | | | — | | | | — | | | | 547,407,397 | |
Preferred stocks | | | — | | | | 908,244 | | | $ | 639,050 | | | | 1,547,294 | |
| Total long-term investments | | $ | 693,585,692 | | | $ | 2,277,144 | | | $ | 639,050 | | | $ | 696,501,886 | |
| Short-term investments† | | | — | | | | 26,879,000 | | | | — | | | | 26,879,000 | |
| Total investments | | $ | 693,585,692 | | | $ | 29,156,144 | | | $ | 639,050 | | | $ | 723,380,886 | |
| † | See Schedule of Investments for additional detailed categorizations. |
(b) Repurchase agreements. The Fund may enter into repurchase agreements with institutions that its investment adviser has determined are creditworthy. Each repurchase agreement is recorded at cost. Under the terms of a typical repurchase agreement, the Fund acquires a debt security subject to an obligation of the seller to repurchase, and of the Fund to resell, the security at an agreed-upon price and time, thereby determining the yield during the Fund’s holding period. When entering into repurchase agreements, it is the Fund’s policy that its custodian or a third party custodian, acting on the Fund’s behalf, take possession of the underlying collateral securities, the market value of which, at all times, at least equals the principal amount of the repurchase transaction, including accrued interest. To the extent that any repurchase transaction maturity exceeds one business day, the value of the collateral is marked-to-market and measured against the value of the agreement in an effort to ensure the adequacy of the collateral. If the counterparty defaults, the Fund generally has the right to use the collateral to satisfy the terms of the repurchase transaction. However, if the market value of the collateral declines during the period in which the Fund seeks to assert its rights or if bankruptcy proceedings are commenced with respect to the seller of the security, realization of the collateral by the Fund may be delayed or limited.
(c) Foreign currency translation. Investment securities and other assets and liabilities denominated in foreign currencies are translated into U.S. dollar amounts based upon prevailing exchange rates on the date of valuation. Purchases and sales of investment securities and income and expense items denominated in foreign currencies are translated into U.S. dollar amounts based upon prevailing exchange rates on the respective dates of such transactions.
The Fund does not isolate that portion of the results of operations resulting from fluctuations in foreign exchange rates on investments from the fluctuations arising from changes in market prices of securities held. Such fluctuations are included with the net realized and unrealized gain or loss on investments.
| | |
| 28 | | Legg Mason Capital Management Special Investment Trust 2013 Annual Report |
Net realized foreign exchange gains or losses arise from sales of foreign currencies, including gains and losses on forward foreign currency contracts, currency gains or losses realized between the trade and settlement dates on securities transactions, and the difference between the amounts of dividends, interest, and foreign withholding taxes recorded on the Fund’s books and the U.S. dollar equivalent of the amounts actually received or paid. Net unrealized foreign exchange gains and losses arise from changes in the values of assets and liabilities, other than investments in securities, on the date of valuation, resulting from changes in exchange rates.
Foreign security and currency transactions may involve certain considerations and risks not typically associated with those of U.S. dollar denominated transactions as a result of, among other factors, the possibility of lower levels of governmental supervision and regulation of foreign securities markets and the possibility of political or economic instability.
(d) Foreign investment risks. The Fund’s investments in foreign securities may involve risks not present in domestic investments. Since securities may be denominated in foreign currencies, may require settlement in foreign currencies or pay interest or dividends in foreign currencies, changes in the relationship of these foreign currencies to the U.S. dollar can significantly affect the value of the investments and earnings of the Fund. Foreign investments may also subject the Fund to foreign government exchange restrictions, expropriation, taxation or other political, social or economic developments, all of which affect the market and/or credit risk of the investments.
(e) Security transactions and investment income. Security transactions are accounted for on a trade date basis. Interest income, adjusted for amortization of premium and accretion of discount, is recorded on the accrual basis. Dividend income is recorded on the ex-dividend date. Foreign dividend income is recorded on the ex-dividend date or as soon as practicable after the Fund determines the existence of a dividend declaration after exercising reasonable due diligence. The cost of investments sold is determined by use of the specific identification method. To the extent any issuer defaults or a credit event occurs that impacts the issuer, the Fund may halt any additional interest income accruals and consider the realizability of interest accrued up to the date of default or credit event.
(f) Distributions to shareholders. Distributions from net investment income and distributions of net realized gains, if any, are declared at least annually. Distributions to shareholders of the Fund are recorded on the ex-dividend date and are determined in accordance with income tax regulations, which may differ from GAAP.
(g) REIT distributions. The character of distributions received from Real Estate Investment Trusts (‘‘REITs’’) held by the Fund is generally comprised of net investment income, capital gains, and return of capital. It is the policy of the Fund to estimate the character of distributions received from underlying REITs based on historical data provided by the REITs. After each calendar year end, REITs report the actual tax character of these distributions. Differences between the estimated and actual amounts reported by the REITs are reflected in the Fund’s records in the year in which they are reported by the REITs by adjusting related investment cost basis, capital gains and income, as necessary.
| | |
| Legg Mason Capital Management Special Investment Trust 2013 Annual Report | | 29 |
Notes to financial statements (cont’d)
(h) Share class accounting. Investment income, common expenses and realized/unrealized gains (losses) on investments are allocated to the various classes of the Fund on the basis of daily net assets of each class. Fees relating to a specific class are charged directly to that share class.
(i) Compensating balance arrangements. The Fund has an arrangement with its custodian bank whereby a portion of the custodian’s fees is paid indirectly by credits earned on the Fund’s cash on deposit with the bank.
(j) Commission recapture. The Fund has entered into an agreement with State Street Bank, its custodian, whereby a portion of commissions paid on investment transactions may be rebated to the Fund. Such payments are included with realized gain (loss) on investment transactions. During the year ended October 31, 2013, the Fund did not receive any commission rebates.
(k) Federal and other taxes. It is the Fund’s policy to comply with the federal income and excise tax requirements of the Internal Revenue Code of 1986 (the “Code”), as amended, applicable to regulated investment companies. Accordingly, the Fund intends to distribute its taxable income and net realized gains, if any, to shareholders in accordance with timing requirements imposed by the Code. Therefore, no federal or state income tax provision is required in the Fund’s financial statements.
Management has analyzed the Fund’s tax positions taken on income tax returns for all open tax years and has concluded that as of October 31, 2013, no provision for income tax is required in the Fund’s financial statements. The Fund’s federal and state income and federal excise tax returns for tax years for which the applicable statutes of limitations have not expired are subject to examination by the Internal Revenue Service and state departments of revenue.
Under the applicable foreign tax laws, a withholding tax may be imposed on interest, dividends and capital gains at various rates.
(i) Reclassification. GAAP requires that certain components of net assets be reclassified to reflect permanent differences between financial and tax reporting. These reclassifications have no effect on net assets or net asset values per share. During the current year, the following reclassifications have been made:
| | | | | | | | |
| | | Overdistributed Net
Investment Income | | | Accumulated Net
Realized Gain | |
| (a) | | $ | 3,954,170 | | | $ | (3,954,170) | |
| (a) | Reclassifications are primarily due to foreign currency transactions treated as ordinary income for tax purposes, book/tax differences in the treatment of distributions from real estate investment trusts, book/tax differences in the treatment of passive foreign investment companies and book/tax differences in the treatment of limited partnership investments. |
2. Investment advisory and management agreement and other transactions with affiliates
The Fund has an investment advisory and management agreement with Legg Mason Capital Management, LLC (“LMCM”). Pursuant to the agreement, LMCM provides the Fund with
| | |
| 30 | | Legg Mason Capital Management Special Investment Trust 2013 Annual Report |
investment advisory, management and administrative services for which the Fund pays a fee, computed daily and payable monthly, at annual rates based on the Fund’s average daily net assets. Effective December 1, 2012, Western Asset Management Company (“Western Asset”) manages the Fund’s cash and short-term instruments. The following chart shows the annual advisory fee rates for the Fund:
| | | | |
| Average Daily Net Assets | | Annual Rate | |
| First $1 billion | | | 0.700 | % |
| Next $1 billion | | | 0.680 | |
| Next $3 billion | | | 0.650 | |
| Next $5 billion | | | 0.620 | |
| Over $10 billion | | | 0.590 | |
Legg Mason Partners Fund Advisor, LLC (“LMPFA”) provides certain administrative and oversight services to the Fund. For LMPFA’s services to the Fund, LMCM (not the Fund) pays LMPFA a fee, calculated daily and payable monthly, at an annual rate of 0.05% of the average daily net assets of the Fund. LMCM, LMPFA and Western Asset are wholly owned subsidiaries and corporate affiliates of Legg Mason, Inc. (“Legg Mason”).
The Fund’s agreement with LMCM provides that expense reimbursements be made to the Fund for audit fees and compensation of the Fund’s independent trustees. During the year ended October 31, 2013, the Fund was reimbursed for expenses amounting to $168,890.
Legg Mason Investor Services, LLC (“LMIS”), a wholly-owned broker-dealer subsidiary of Legg Mason, serves as the Fund’s sole and exclusive distributor.
There is a maximum initial sales charge of 5.75% for Class A shares. There is a contingent deferred sales charge (“CDSC”) of 1.00% on Class C shares, which applies if redemption occurs within 12 months from purchase payment. In certain cases, Class A shares have a 1.00% CDSC, which applies if redemption occurs within 18 months from purchase payment. This CDSC only applies to those purchases of Class A shares, which, when combined with current holdings of other shares of funds sold by LMIS, equal or exceed $1,000,000 in the aggregate. These purchases do not incur an initial sales charge.
For the year ended October 31, 2013, LMIS and its affiliates retained sales charges of $2,011 on sales of the Fund’s Class A shares. In addition, for the year ended October 31, 2013, CDSCs paid to LMIS and its affiliates were:
| | | | | | | | |
| | | Class A | | | Class C | |
| CDSCs | | $ | 63 | | | $ | 5,120 | |
Under a Deferred Compensation Plan (the “Plan”), Trustees may elect to defer receipt of all or a specified portion of their compensation. A participating Trustee may select one or more funds managed by affiliates of Legg Mason in which his or her deferred trustee’s fees will be deemed to be invested. Deferred amounts remain in the Fund until distributed in accordance with the Plan.
| | |
| Legg Mason Capital Management Special Investment Trust 2013 Annual Report | | 31 |
Notes to financial statements (cont’d)
All officers and two Trustees of the Trust are employees of Legg Mason or its affiliates and do not receive compensation from the Trust.
3. Investments
During the year ended October 31, 2013, the aggregate cost of purchases and proceeds from sales of investments (excluding short-term investments) were as follows:
| | | | |
| Purchases | | $ | 263,785,380 | |
| Sales | | | 443,270,771 | |
At October 31, 2013, the aggregate gross unrealized appreciation and depreciation of investments for federal income tax purposes were as follows:
| | | | |
| Gross unrealized appreciation | | $ | 173,199,778 | |
| Gross unrealized depreciation | | | (58,932,225) | |
| Net unrealized appreciation | | $ | 114,267,553 | |
4. Derivative instruments and hedging activities
GAAP requires enhanced disclosure about an entity’s derivative and hedging activities.
During the year ended October 31, 2013, the Fund did not invest in any derivative instruments.
5. Class specific expenses and expense reimbursements
The Fund has adopted a Rule 12b-1 distribution plan and under that plan the Fund pays a service fee with respect to its Class A, Class C, Class FI and Class R shares calculated at the annual rate of 0.25% of the average daily net assets of each respective class. The Fund also pays a distribution fee with respect to its Class C and Class R shares calculated at the annual rate of 0.75% and 0.25% of the average daily net assets of each class, respectively. Service and distribution fees are accrued daily and paid monthly.
For the year ended October 31, 2013, class specific expenses were as follows:
| | | | | | | | |
| | | Service and/or
Distribution Fees | | | Transfer Agent
Fees | |
| Class A | | $ | 90,549 | | | $ | 23,412 | |
| Class C | | | 5,843,162 | | | | 613,748 | |
| Class FI | | | 9,914 | | | | 8,798 | |
| Class R | | | 33,597 | | | | 17,781 | |
| Class I | | | — | | | | 94,304 | |
| Total | | $ | 5,977,222 | | | $ | 758,043 | |
For the year ended October 31, 2013, expense reimbursements by class were as follows:
| | | | |
| | | Expense
Reimbursements | |
| Class A | | $ | 8,818 | |
| Class C | | | 141,090 | |
| Class FI | | | 815 | |
| Class R | | | 1,603 | |
| Class I | | | 16,564 | |
| Total | | $ | 168,890 | |
| | |
| 32 | | Legg Mason Capital Management Special Investment Trust 2013 Annual Report |
6. Distributions to shareholders by class
| | | | | | | | |
| | | Year Ended
October 31, 2013 | | | Year Ended
October 31, 2012 | |
| Net Investment Income: | | | | | | | | |
| Class A | | $ | 541,104 | | | $ | 484,925 | |
| Class C | | | 4,705,759 | | | | 1,562,224 | |
| Class FI | | | 117,061 | | | | 92,040 | |
| Class R | | | 35,751 | | | | 20,826 | |
| Class I | | | 982,504 | | | | 927,585 | |
| Total | | $ | 6,382,179 | | | $ | 3,087,600 | |
7. Shares of beneficial interest
At October 31, 2013, the Trust had an unlimited number of shares of beneficial interest authorized with a par value of $0.00001 per share. The Fund has the ability to issue multiple classes of shares. Each class of shares represents an identical interest and has the same rights, except that each class bears certain direct expenses, including those specifically related to the distribution of its shares. On February 29, 2012, the Fund was reorganized as a new series of the Trust.
Prior to February 29, 2012, the Fund was a series of a Maryland corporation and had 100,000,000, 200,000,000, 100,000,000, 500,000,000 and 50,000,000 shares of capital stock authorized with a par value of at $0.001 for Class A, Class C, Class FI, Class R and Class I, respectively.
Transactions in shares of each class were as follows:
| | | | | | | | | | | | | | | | |
| | | Year Ended
October 31, 2013 | | | Year Ended
October 31, 2012 | |
| | | Shares | | | Amount | | | Shares | | | Amount | |
| Class A | | | | | | | | | | | | | | | | |
| Shares sold | | | 190,651 | | | $ | 6,457,739 | | | | 85,055 | | | $ | 2,447,339 | |
| Shares issued on reinvestment | | | 17,343 | | | | 530,964 | | | | 16,233 | | | | 470,277 | |
| Shares repurchased | | | (277,065) | | | | (9,159,692) | | | | (474,434) | | | | (13,588,862) | |
| Net decrease | | | (69,071) | | | $ | (2,170,989) | | | | (373,146) | | | $ | (10,671,246) | |
| Class C | | | | | | | | | | | | | | | | |
| Shares sold | | | 254,384 | | | $ | 8,636,947 | | | | 347,818 | | | $ | 9,795,809 | |
| Shares issued on reinvestment | | | 148,921 | | | | 4,538,050 | | | | 52,757 | | | | 1,507,263 | |
| Shares repurchased | | | (3,902,657) | | | | (129,927,036) | | | | (6,635,017) | | | | (186,216,266) | |
| Net decrease | | | (3,499,352) | | | $ | (116,752,039) | | | | (6,234,442) | | | $ | (174,913,194) | |
| | | | |
| Class FI | | | | | | | | | | | | | | | | |
| Shares sold | | | 8,831 | | | $ | 370,273 | | | | 25,105 | | | $ | 933,309 | |
| Shares issued on reinvestment | | | 3,001 | | | | 117,061 | | | | 2,493 | | | | 92,040 | |
| Shares repurchased | | | (238,857) | | | | (10,069,156) | | | | (43,203) | | | | (1,593,386) | |
| Net decrease | | | (227,025) | | | $ | (9,581,822) | | | | (15,605) | | | $ | (568,037) | |
| | |
| Legg Mason Capital Management Special Investment Trust 2013 Annual Report | | 33 |
Notes to financial statements (cont’d)
| | | | | | | | | | | | | | | | |
| | | Year Ended
October 31, 2013 | | | Year Ended
October 31, 2012 | |
| | | Shares | | | Amount | | | Shares | | | Amount | |
| | | | |
| Class R | | | | | | | | | | | | | | | | |
| Shares sold | | | 57,880 | | | $ | 2,356,889 | | | | 45,908 | | | $ | 1,695,172 | |
| Shares issued on reinvestment | | | 912 | | | | 35,751 | | | | 569 | | | | 20,826 | |
| Shares repurchased | | | (133,874) | | | | (5,659,424) | | | | (119,568) | | | | (4,299,848) | |
| Net decrease | | | (75,082) | | | $ | (3,266,784) | | | | (73,091) | | | $ | (2,583,850) | |
| | | | |
| Class I | | | | | | | | | | | | | | | | |
| Shares sold | | | 226,787 | | | $ | 10,264,819 | | | | 249,669 | | | $ | 9,412,516 | |
| Shares issued on reinvestment | | | 14,721 | | | | 590,452 | | | | 15,119 | | | | 572,863 | |
| Shares repurchased | | | (523,845) | | | | (22,957,580) | | | | (1,034,442) | | | | (39,217,996) | |
| Net decrease | | | (282,337) | | | $ | (12,102,309) | | | | (769,654) | | | $ | (29,232,617) | |
8. Restricted securities
The following Fund investments are restricted as to resale and, in the absence of readily ascertainable market values, are valued in good faith in accordance with procedures approved by the Board of Trustees.
| | | | | | | | | | | | | | | | | | | | | | | | | | | | | | | | |
| Security | | Number of
Shares | | | Acquisition
Date | | | Cost | | | Fair Value
at 10/31/13 | | | Value per
Share | | | Percent of
Net Assets | | | Distributions
Received | | | Open
Commitments | |
| Super Dimension Ltd., Escrow Receipt | | | 490,216 | | | | 05/12 | | | $ | 0 | | | $ | 639,050 | | | $ | 1.30 | | | | 0.09 | % | | | — | | | | — | |
9. Transactions with affiliated companies
An “Affiliated Company”, as defined in the 1940 Act, includes a company in which the Fund owns 5% or more of the company’s outstanding voting securities at any time during the period. The following transactions were effected in shares of such companies for the year ended October 31, 2013:
| | | | | | | | | | | | | | | | | | | | | | | | | | | | | | | | |
| | | Affiliate
Value at
10/31/12 | | | Purchased | | | Sold | | | Dividend
Income | | | Affiliate
Value at
10/31/13 | | | Realized
Gain/(Loss) | |
| | | Cost | | | Shares | | | Cost | | | Shares | | | | |
| BG Medicine Inc., Common Stock | | $ | 3,948,309 | | | | — | | | | — | | | $ | 14,918,743 | | | | 1,716,656 | | | | — | | | | — | * | | $ | (13,071,258) | |
| First Interstate BancSystem Inc., Class A Shares | | | 13,527,000 | | | | — | | | | — | | | | 5,704,159 | | | | 362,860 | | | $ | 382,733 | | | | — | * | | | 1,913,250 | |
| Syncora Holdings Ltd. | | | 3,209,238 | | | | — | | | | — | | | | 79,755 | | | | 28,200 | | | | — | | | $ | 1,821,442 | | | | (50,018) | |
| | | $ | 20,684,547 | | | | — | | | | | | | $ | 20,702,657 | | | | | | | $ | 382,733 | | | $ | 1,812,442 | | | $ | (11,208,026) | |
| * | This security is no longer an affiliated company. |
10. Income tax information and distributions to shareholders
Subsequent to the fiscal year end, the Fund has made the following distributions per share:
| | | | |
Record Date
Payable Date | | Long-Term
Capital Gains | |
| 12/10/2013 | | | | |
| 12/11/2013 | | $ | 2.38709 | |
| | |
| 34 | | Legg Mason Capital Management Special Investment Trust 2013 Annual Report |
The tax character of distributions paid during the fiscal years ended October 31, was as follows:
| | | | | | | | |
| | | 2013 | | | 2012 | |
| Distributions Paid From: | | | | | | | | |
| Ordinary income | | $ | 6,382,179 | | | $ | 3,087,600 | |
As of October 31, 2013, the components of accumulated earnings (losses) on a tax basis were as follows:
| | | | |
| Undistributed ordinary income — net | | $ | 6,010,792 | |
| Undistributed long-term capital gains — net | | | 44,235,220 | |
| Total undistributed earnings | | $ | 50,246,012 | |
| Other book/tax temporary differences(a) | | | (220,296) | |
| Unrealized appreciation (depreciation)(b) | | | 114,267,553 | |
| Total accumulated earnings (losses) — net | | $ | 164,293,269 | |
During the taxabale year ended October 31, 2013, the Fund utilized all of its capital loss carryforward from prior years.
| (a) | Other book/tax temporary differences are attributable primarily to the book/tax differences in the timing of the deductibility of various expenses and book/tax differences in the treatment of distributions from real estate investment trusts. |
| (b) | The difference between book-basis and tax-basis unrealized appreciation (depreciation) is attributable primarily to the tax deferral of losses on wash sales, the difference in the book/tax treatment of limited partnership investments and the realization for tax purposes of unrealized gains on investments in passive foreign investment companies. |
11. Line of credit
The Fund, along with certain other Legg Mason Funds, participated in a $200 million line of credit (“Credit Agreement”) to be used for temporary or emergency purposes. This 364-day revolving Credit Agreement matured on February 28, 2013. Pursuant to the Credit Agreement, each participating fund was liable only for principal and interest payments related to borrowings made by that fund. Borrowings under the Credit Agreement bore interest at a rate equal to the prevailing LIBOR rate plus the LIBOR rate margin. The Fund did not utilize the line of credit during the period ended February 28, 2013. The Fund did not renew the Credit Agreement.
12. Subsequent event
On December 13, 2013, the Board of Trustees approved changes to the Fund’s principal investment strategies. While the Fund may continue to invest in companies of any size, the portfolio managers expect that under normal circumstances, the Fund will invest the majority of its total assets in the securities of companies that are in the small-cap market capitalization range or in special situations, at the time of purchase, rather than the mid-cap market capitalization range or in special situations, at the time of purchase. The Fund defines securities of companies in the small-cap market capitalization range, as companies with market capitalizations between $150 million and the upper range of the Russell 2000 Index at the time of purchase. The Fund defines securities of companies in the mid-cap market capitalization range, as companies with market capitalizations similar to companies in the Russell Midcap Index or the S&P MidCap 400 Index. It is anticipated that the transition of the Fund’s portfolio holdings in order to align the portfolio with the new strategy will be implemented over time as market conditions warrant, and may take several months. The transition will begin on or about February 1, 2014.
| | |
| Legg Mason Capital Management Special Investment Trust 2013 Annual Report | | 35 |
Report of independent registered public accounting firm
To the Board of Trustees of Legg Mason Global Asset Management Trust and Shareholders of Legg Mason Capital Management Special Investment Trust:
In our opinion, the accompanying statement of assets and liabilities, including the schedule of investments, and the related statements of operations and of changes in net assets and the financial highlights present fairly, in all material respects, the financial position of Legg Mason Capital Management Special Investment Trust (one of the funds comprising Legg Mason Global Asset Management Trust, the “Fund”) at October 31, 2013, the results of its operations, the changes in its net assets and the financial highlights for the periods presented, in conformity with accounting principles generally accepted in the United States of America. These financial statements and financial highlights (hereafter referred to as “financial statements”) are the responsibility of the Fund’s management; our responsibility is to express an opinion on these financial statements based on our audits. We conducted our audits of these financial statements in accordance with the standards of the Public Company Accounting Oversight Board (United States). Those standards require that we plan and perform the audit to obtain reasonable assurance about whether the financial statements are free of material misstatement. An audit includes examining, on a test basis, evidence supporting the amounts and disclosures in the financial statements, assessing the accounting principles used and significant estimates made by management, and evaluating the overall financial statement presentation. We believe that our audits, which included confirmation of securities at October 31, 2013 by correspondence with the custodian and brokers, provide a reasonable basis for our opinion.
PricewaterhouseCoopers LLP
Baltimore, Maryland
December 20, 2013
| | |
| 36 | | Legg Mason Capital Management Special Investment Trust 2013 Annual Report |
Additional information (unaudited)
Information about Trustees and Officers
The business and affairs of Legg Mason Capital Management Special Investment (the “Fund”) are conducted by management under the supervision and subject to the direction of its Board of Trustees. The business address of each Trustee is c/o Kenneth D. Fuller, Legg Mason, 100 International Drive, 11th Floor, Baltimore, Maryland 21202. Information pertaining to the Trustees and officers of the Fund is set forth below.
The Statement of Additional Information includes additional information about Trustees and is available, without charge, upon request by calling the Fund at 1-877-721-1926.
| | |
| Independent Trustees1 |
| Ruby P. Hearn |
| Year of birth | | 1940 |
| Position(s) with Trust | | Trustee |
| Term of office and length of time served2 | | Since 2009 |
| Principal occupation(s) during past five years | | Senior Vice President Emerita of The Robert Wood Johnson Foundation (non-profit) since 2001; Member of the Institute of Medicine since 1982; formerly: Trustee of the New York Academy of Medicine (2004 to 2012); Director of the Institute for Healthcare Improvement (2002 to 2012); Senior Vice President of The Robert Wood Johnson Foundation (1996 to 2001); Fellow of The Yale Corporation (1992 to 1998). |
| Number of funds in fund complex overseen by Trustee | | 15 |
| Other board memberships held by Trustee during past five years | | None |
|
| Arnold L. Lehman |
| Year of birth | | 1944 |
| Position(s) with Trust | | Lead Independent Trustee |
| Term of office and length of time served2 | | Since 2009 |
| Principal occupation(s) during past five years | | Director of the Brooklyn Museum since 1997; Trustee of American Federation of Arts since 1998. Formerly: Director of The Baltimore Museum of Art (1979 to 1997). |
| Number of funds in fund complex overseen by Trustee | | 15 |
| Other board memberships held by Trustee during past five years | | None |
|
| Robin J.W. Masters |
| Year of birth | | 1955 |
| Position(s) with Trust | | Trustee |
| Term of office and length of time served2 | | Since 2009 |
| Principal occupation(s) during past five years | | Retired; formerly: Chief Investment Officer of ACE Limited (insurance) (1986 to 2000). |
| Number of funds in fund complex overseen by Trustee | | 15 |
| Other board memberships held by Trustee during past five years | | Director of Cheyne Capital International Limited (investment advisory firm). Formerly, Director/Trustee of Legg Mason Institutional Funds plc, WAFixed Income Funds plc and Western Asset Debt Securities Fund plc. (2007 to 2011) |
| | |
| Legg Mason Capital Management Special Investment Trust | | 37 |
Additional information (unaudited) (cont’d)
Information about Trustees and Officers
| | |
| Independent Trustees1 cont’d |
| Jill E. McGovern |
| Year of birth | | 1944 |
| Position(s) with Trust | | Trustee |
| Term of office and length of time served2 | | Since 2009 |
| Principal occupation(s) during past five years | | Senior Consultant, American Institute for Contemporary German Studies (AICGS) since 2007; formerly: Chief Executive Officer of The Marrow Foundation (non-profit) (1993 to 2007); Executive Director of the Baltimore International Festival (1991 to 1993); Senior Assistant to the President of The Johns Hopkins University (1986 to 1990). |
| Number of funds in fund complex overseen by Trustee | | 15 |
| Other board memberships held by Trustee during past five years | | Director of International Biomedical Research Alliance; Director of Lois Roth Endowment |
|
| Arthur S. Mehlman |
| Year of birth | | 1942 |
| Position(s) with Trust | | Trustee |
| Term of office and length of time served2 | | Since 2009 |
| Principal occupation(s) during past five years | | Retired. Director, The University of Maryland Foundation since 1992; Director, The League for People with Disabilities since 2003; formerly: Director, Municipal Mortgage & Equity LLC (2004 to 2011); Partner, KPMG LLP (international accounting firm) (1972 to 2002). |
| Number of funds in fund complex overseen by Trustee | | Director/Trustee of all Legg Mason Funds consisting of 15 portfolios; Director/Trustee of the Royce Family of Funds consisting of 35 portfolios. |
| Other board memberships held by Trustee during past five years | | Director of Municipal Mortgage & Equity, LLC. (2004 to 2011) |
|
| G. Peter O’Brien |
| Year of birth | | 1945 |
| Position(s) with Trust | | Trustee |
| Term of office and length of time served2 | | Since 2009 |
| Principal occupation(s) during past five years | | Retired. Trustee Emeritus of Colgate University; Board Member, Hill House, Inc. (residential home care); Board Member, Bridges School (pre- school); formerly: Managing Director, Equity Capital Markets Group of Merrill Lynch & Co. (1971-1999). |
| Number of funds in fund complex overseen by Trustee | | Director/Trustee of all Legg Mason funds consisting of 15 portfolios; Director/Trustee of the Royce Family of Funds consisting of 35 portfolios. |
| Other board memberships held by Trustee during past five years | | Director of Ticc Investment Capital Corp. |
| | |
| 38 | | Legg Mason Capital Management Special Investment Trust |
| | |
| Independent Trustees1 cont’d |
| S. Ford Rowan |
| Year of birth | | 1943 |
| Position(s) with Trust | | Trustee |
| Term of office and length of time served2 | | Since 2009 |
| Principal occupation(s) during past five years | | Chairman, National Center for Critical Incident Analysis, National Defense University Foundation, since 2004; Trustee, St. John’s College, since 2006; formerly: Consultant, Rowan & Blewitt Inc. (management consulting) (1984 to 2007); Lecturer in Journalism, Northwestern University (1980 to 1993); Lecturer in Organizational Sciences, George Washington University (2000 to 2008); Director, Santa Fe Institute (1999 to 2008). |
| Number of funds in fund complex overseen by Trustee | | 15 |
| Other board memberships held by Trustee during past five years | | None |
|
| Robert M. Tarola |
| Year of birth | | 1950 |
| Position(s) with Trust | | Trustee |
| Term of office and length of time served2 | | Since 2009 |
| Principal occupation(s) during past five years | | President of Right Advisory LLC (corporate finance and governance consulting) since 2008; Member, Investor Advisory Group of the Public Company Accounting Oversight Board since 2009; formerly Senior Vice President and Chief Financial Officer of The Howard University (2009 to 2013) (higher education and health care); Senior Vice President and Chief Financial Officer of W.R. Grace & Co. (specialty chemicals) (1999 to 2008) and MedStar Health, Inc. (healthcare) (1996 to 1999); Partner, Price Waterhouse, LLP (accounting and auditing) (1984 to 1996). |
| Number of funds in fund complex overseen by Trustee | | 15 |
| Other board memberships held by Trustee during past five years | | Director of TeleTech Holdings, Inc. (business process outsourcing); Director of American Kidney Fund (renal disease assistance) |
| | |
| Interested Trustees3 |
Jennifer W. Murphy | | |
| Year of birth | | 1964 |
| Position(s) with Trust | | Trustee and Chair |
| Term of office and length of time served2 | | Since 2013 |
| Principal occupation(s) during past five years | | Executive Vice President and Chief Administrative Officer of Legg Mason, Inc. (since 2013); formerly: Chief Operations Officer of LMM LLC (1999 to 2013); President and CEO of Legg Mason Capital Management, LLC (“LMCM”) and Manager of LMCM and predecessors (1998 to 2013). |
| Number of funds in fund complex overseen by Trustee | | 15 |
| Other board memberships held by Trustee during past five years | | None |
| | |
| Legg Mason Capital Management Special Investment Trust | | 39 |
Additional information (unaudited) (cont’d)
Information about Trustees and Officers
| | |
| Interested Trustees3 cont’d |
| Kenneth D. Fuller | | |
| Year of birth | | 1958 |
| Position(s) with Trust | | Trustee, President and Chief Executive Officer |
| Term of office1 and length of time served2 | | Since 2013 |
| Principal occupation(s) during past five years | | Managing Director of Legg Mason & Co., LLC (“Legg Mason & Co.”) (since 2013); Officer and/or Trustee/Director of 167 funds associated with Legg Mason Partners Fund Advisor, LLC (“LMPFA”) or its affiliates (since 2013); President and Chief Executive Officer of LM Asset Services, LLC (“LMAS”) and Legg Mason Fund Asset Management, Inc. (“LMFAM”) (formerly registered investment advisers) (since 2013); formerly, Senior Vice President of LMPFA (2012 to 2013); formerly, Director of Legg Mason & Co. (2012 to 2013); formerly, Vice President of Legg Mason & Co. (2009 to 2012); formerly, Vice President — Equity Division of T. Rowe Price Associates (1993 to 2009), as well as Investment Analyst and Portfolio Manager for certain asset allocation accounts (2004 to 2009) |
| Number of funds in fund complex overseen by Trustee | | 155 |
| Other board memberships held by Trustee during past five years | | None |
| | |
| Executive Officers |
| |
Richard F. Sennett Legg Mason 100 International Drive, 7th Floor, Baltimore, MD 21202 | | |
| Year of birth | | 1970 |
| Position(s) with Trust | | Principal Financial Officer |
| Term of office and length of time served2 | | Since 2011 |
| Principal occupation(s) during past five years | | Principal Financial Officer and Treasurer of certain mutual funds associated with Legg Mason & Co. or its affiliates (since 2011 and since 2013); Managing Director of Legg Mason & Co. and Senior Manager of the Treasury Policy group for Legg Mason & Co.’s Global Fiduciary Platform (since 2011); formerly, Chief Accountant within the SEC’s Division of Investment Management (2007 to 2011); formerly, Assistant Chief Accountant within the SEC’s Division of Investment Management (2002 to 2007) |
| |
Robert I. Frenkel Legg Mason 100 First Stamford Place, 6th Floor, Stamford, CT 06902 | | |
| Year of birth | | 1954 |
| Position(s) with Trust | | Secretary and Chief Legal Officer |
| Term of office and length of time served2 | | Since 2009 |
| Principal occupation(s) during past five years | | Vice President and Deputy General Counsel of Legg Mason (since 2006); Managing Director and General Counsel of Global Mutual Funds for Legg Mason & Co. (since 2006) and Legg Mason & Co. predecessors (since 1994); Secretary and Chief Legal Officer of certain mutual funds associated with Legg Mason & Co. or its affiliates (since 2006) and Legg Mason & Co. predecessors (prior to 2006) |
| | |
| 40 | | Legg Mason Capital Management Special Investment Trust |
| | |
| Executive Officers cont’d |
Ted P. Becker Legg Mason 620 Eighth Avenue, 49th Floor, New York, NY 10018 | | |
| Year of birth | | 1951 |
| Position(s) with Trust | | Vice President and Chief Compliance Officer |
| Term of office and length of time served2 | | Since 2009 |
| Principal occupation(s) during past five years | | Director of Global Compliance at Legg Mason (since 2006); Chief Compliance Officer of LMPFA (since 2006); Managing Director of Compliance of Legg Mason & Co. (since 2005); Chief Compliance Officer of certain mutual funds associated with Legg Mason & Co. or its affiliates (since 2006) and Legg Mason & Co. predecessors (prior to 2006) |
| |
Christopher Berarducci Legg Mason 620 Eighth Avenue, 49th Floor, New York, NY 10018 | | |
| Year of birth | | 1974 |
| Position(s) with Trust | | Treasurer |
| Term of office and length of time served2 | | Since 2010 |
| Principal occupation(s) during past five years | | Vice President of Legg Mason & Co. (since 2011); Treasurer of certain mutual funds associated with Legg Mason & Co. or its affiliates (since 2010); formerly, Assistant Controller of certain mutual funds associated with Legg Mason & Co. or its affiliates (prior to 2010); formerly, Manager of Fund Administration at UBS Global Asset Management (prior to 2007) |
| 1 | Trustees who are not “interested persons” of the Fund within the meaning of Section 2(a)(19) of the 1940 Act. Each of the Independent Trustees serves on the standing committees of the Board of Trustees, which include the Audit Committee (chair: Arthur S. Mehlman), the Nominating Committee (co-chairs: G. Peter O’Brien and Jill E. McGovern), and the Independent Trustees Committee (chair: Arnold L. Lehman). |
| 2 | Officers of the Trust are elected to serve until their successors are elected and qualified. Trustees of the Trust serve a term of indefinite length until their retirement, in accordance with the Board’s retirement policy, resignation or removal, and stand for re-election by shareholders only as and when required by the 1940 Act. |
| 3 | Effective June 1, 2013, Ms. Murphy was appointed to the position of Trustee and Chair and Mr. Fuller was appointed to the position of Trustee, President and Chief Executive Officer. Prior to this date, R. Jay Gerken served as Chairman, President and Chief Executive Officer, Mr. Gerken retired May 31, 2013. Ms. Murphy and Mr. Fuller are considered to be interested persons, as defined in the 1940 Act, of the Fund on the basis of their current employment with the Fund’s investment adviser or its affiliated entities (including the Fund’s principal underwriter) and Legg Mason, Inc., the parent holding company of these entities as well as their ownership of Legg Mason, Inc. stock. |
| | |
| Legg Mason Capital Management Special Investment Trust | | 41 |
Important tax information (unaudited)
The following information is provided with respect to the distributions paid during the taxable year ended October 31, 2013:
| | | | | | | | |
| Record date | | | 12/11/2012 | | | | 7/15/2013 | |
| Payable date | | | 12/12/2012 | | | | 7/16/2013 | |
| Ordinary income | | | | | | | | |
Qualified dividend income for individuals | | | 100.00 | % | | | 99.95 | % |
Dividends qualifying for the dividends | | | | | | | | |
received deduction for corporations | | | 100.00 | % | | | 99.60 | % |
Please retain this information for your records.
| | |
| 42 | | Legg Mason Capital Management Special Investment Trust 2013 Annual Report |
Legg Mason Capital Management
Special Investment Trust
Trustees
Kenneth D. Fuller*
President
Ruby P. Hearn
Arnold L. Lehman
Robin J.W. Masters
Jill E. McGovern
Arthur S. Mehlman
Jennifer W. Murphy*
Chair
G. Peter O’Brien
S. Ford Rowan
Robert M. Tarola
Investment manager/adviser
Legg Mason Capital Management, LLC
Distributor
Legg Mason Investor Services, LLC
Custodian
State Street Bank & Trust Company
Transfer agent
Boston Financial Data Services, Inc.
2000 Crown Colony Drive
Quincy, MA 02169
Independent registered public accounting firm
PricewaterhouseCoopers LLP
Baltimore, MD
| * | Effective June 1, 2013, Ms. Murphy became a Trustee and Chair and Mr. Fuller became a Trustee, President and Chief Executive Officer. |
Legg Mason Capital Management Special Investment Trust
The Fund is a separate series of Legg Mason Global Asset Management Trust, a Maryland statutory trust.
Legg Mason Capital Management Special Investment Trust
Legg Mason Funds
620 Eighth Avenue, 49th Floor
New York, NY 10018
The Fund files its complete schedule of portfolio holdings with the Securities and Exchange Commission (“SEC”) for the first and third quarters of each fiscal year on Form N-Q. The Fund’s Forms N-Q are available on the SEC’s website at www.sec.gov. The Fund’s Forms N-Q may be reviewed and copied at the SEC’s Public Reference Room in Washington, D.C., and information on the operation of the Public Reference Room may be obtained by calling 1-800-SEC-0330. To obtain information on Form N-Q, shareholders can call the Fund at 1-877-721-1926.
Information on how the Fund voted proxies relating to portfolio securities during the prior 12-month period ended June 30th of each year and a description of the policies and procedures that the Fund uses to determine how to vote proxies related to portfolio transactions are available (1) without charge, upon request, by calling the Fund at 1-877-721-1926, (2) on the Fund’s website at www.leggmason.com/individualinvestors and (3) on the SEC’s website at www.sec.gov.
This report is submitted for the general information of the shareholders of Legg Mason Capital Management Special Investment Trust. This report is not authorized for distribution to prospective investors in the Fund unless preceded or accompanied by a current prospectus.
Investors should consider the Fund’s investment objectives, risks, charges and expenses carefully before investing. The prospectus contains this and other important information about the Fund. Please read the prospectus carefully before investing.
www.leggmason.com/individualinvestors
©2013 Legg Mason Investor Services, LLC
Member FINRA, SIPC
Legg Mason Funds Privacy and Security Notice
Your Privacy and the Security of Your Personal Information is Very Important to the Legg Mason Funds
This Privacy and Security Notice (the “Privacy Notice”) addresses the Legg Mason Funds’ privacy and data protection practices with respect to nonpublic personal information the Funds receive. The Legg Mason Funds include any funds sold by the Funds’ distributor, Legg Mason Investor Services, LLC, as well as Legg Mason-sponsored closed-end funds and certain closed-end funds managed or sub-advised by Legg Mason or its affiliates. The provisions of this Privacy Notice apply to your information both while you are a shareholder and after you are no longer invested with the Funds.
The Type of Nonpublic Personal Information the Funds Collect About You
The Funds collect and maintain nonpublic personal information about you in connection with your shareholder account. Such information may include, but is not limited to:
| Ÿ | | Personal information included on applications or other forms; |
| Ÿ | | Account balances, transactions, and mutual fund holdings and positions; |
| Ÿ | | Online account access user IDs, passwords, security challenge question responses; and |
| Ÿ | | Information received from consumer reporting agencies regarding credit history and creditworthiness (such as the amount of an individual’s total debt, payment history, etc.). |
How the Funds Use Nonpublic Personal Information About You
The Funds do not sell or share your nonpublic personal information with third parties or with affiliates for their marketing purposes, or with other financial institutions or affiliates for joint marketing purposes, unless you have authorized the Funds to do so. The Funds do not disclose any nonpublic personal information about you except as may be required to perform transactions or services you have authorized or as permitted or required by law. The Funds may disclose information about you to:
| Ÿ | | Employees, agents, and affiliates on a “need to know” basis to enable the Funds to conduct ordinary business or comply with obligations to government regulators; |
| Ÿ | | Service providers, including the Funds’ affiliates, who assist the Funds as part of the ordinary course of business (such as printing, mailing services, or processing or servicing your account with us) or otherwise perform services on the Funds’ behalf, including companies that may perform marketing services solely for the Funds; |
| Ÿ | | The Funds’ representatives such as legal counsel, accountants and auditors; and |
| Ÿ | | Fiduciaries or representatives acting on your behalf, such as an IRA custodian or trustee of a grantor trust. |
|
| NOT PART OF THE ANNUAL REPORT |
Legg Mason Funds Privacy and Security Notice (cont’d)
Except as otherwise permitted by applicable law, companies acting on the Funds’ behalf are contractually obligated to keep nonpublic personal information the Funds provide to them confidential and to use the information the Funds share only to provide the services the Funds ask them to perform.
The Funds may disclose nonpublic personal information about you when necessary to enforce their rights or protect against fraud, or as permitted or required by applicable law, such as in connection with a law enforcement or regulatory request, subpoena, or similar legal process. In the event of a corporate action or in the event a Fund service provider changes, the Funds may be required to disclose your nonpublic personal information to third parties. While it is the Funds’ practice to obtain protections for disclosed information in these types of transactions, the Funds cannot guarantee their privacy policy will remain unchanged.
Keeping You Informed of the Funds’ Privacy and Security Practices
The Funds will notify you annually of their privacy policy as required by federal law. While the Funds reserve the right to modify this policy at any time they will notify you promptly if this privacy policy changes.
The Funds’ Security Practices
The Funds maintain appropriate physical, electronic and procedural safeguards designed to guard your nonpublic personal information. The Funds’ internal data security policies restrict access to your nonpublic personal information to authorized employees, who may use your nonpublic personal information for Fund business purposes only.
Although the Funds strive to protect your nonpublic personal information, they cannot ensure or warrant the security of any information you provide or transmit to them, and you do so at your own risk. In the event of a breach of the confidentiality or security of your nonpublic personal information, the Funds will attempt to notify you as necessary so you can take appropriate protective steps. If you have consented to the Funds using electronic communications or electronic delivery of statements, they may notify you under such circumstances using the most current email address you have on record with them.
In order for the Funds to provide effective service to you, keeping your account information accurate is very important. If you believe that your account information is incomplete, not accurate or not current, or if you have questions about the Funds’ privacy practices, write the Funds using the contact information on your account statements, email the Funds by clicking on the Contact Us section of the Funds’ website at www.leggmason.com, or contact the Fund at 1-877-721-1926.
Revised April 2011
|
| NOT PART OF THE ANNUAL REPORT |
www.leggmason.com/individualinvestors
©2013 Legg Mason Investor Services, LLC Member FINRA, SIPC
LMF-285/A 12/13 SR13-2084
The registrant has adopted a code of ethics that applies to the registrant’s principal executive officer, principal financial officer, principal accounting officer or controller.
| ITEM 3. | AUDIT COMMITTEE FINANCIAL EXPERT. |
The Board of Trustees of the registrant has determined that Arthur S. Mehlman the Chairman of the Board’s Audit Committee and Robert M. Tarola, possess the technical attributes identified in Instruction 2(b) of Item 3 to Form N-CSR to qualify as “audit committee financial experts,” and have designated Mr. Mehlman and Mr. Tarola as the Audit Committee’s financial experts. Mr. Mehlman and Mr. Tarola are “independent” Trustees pursuant to paragraph (a) (2) of Item 3 to Form N-CSR.
| ITEM 4. | PRINCIPAL ACCOUNTANT FEES AND SERVICES. |
a) Audit Fees. The aggregate fees billed in the last two fiscal years ending October 31, 2012 and October 31, 2013 (the “Reporting Periods”) for professional services rendered by the Registrant’s principal accountant (the “Auditor”) for the audit of the Registrant’s annual financial statements, or services that are normally provided by the Auditor in connection with the statutory and regulatory filings or engagements for the Reporting Periods, were $195,925 in 2012 and $72,425 in 2013.
b) Audit-Related Fees. The aggregate fees billed in the Reporting Period for assurance and related services by the Auditor that are reasonably related to the performance of the Registrant’s financial statements were $4,250 in 2012 and $4,250 in 2013. These services consisted of procedures performed in connection with the Re-domiciliation of the various reviews of Prospectus supplements, and consent issuances related to the N-1A filings for the Legg Mason Global Asset Management Trust.
In addition, there were no Audit-Related Fees billed in the Reporting Period for assurance and related services by the Auditor to the Registrant’s investment adviser (not including any sub-adviser whose role is primarily portfolio management and is subcontracted with or overseen by another investment adviser), and any entity controlling, controlled by or under common control with the investment adviser that provides ongoing services to the Legg Mason Global Asset Management Trust (“service affiliates”), that were reasonably related to the performance of the annual audit of the service affiliates. Accordingly, there were no such fees that required pre-approval by the Audit Committee for the Reporting Periods.
(c) Tax Fees. The aggregate fees billed in the Reporting Periods for professional services rendered by the Auditor for tax compliance, tax advice and tax planning (“Tax Services”) were $19,500 in 2012 and $45,890 in 2013. These services consisted of (i) review or preparation of U.S. federal, state, local and excise tax returns; (ii) U.S. federal, state and local tax planning, advice and assistance regarding statutory, regulatory or administrative developments, and (iii) tax advice regarding tax qualification matters and/or treatment of various financial instruments held or proposed to be acquired or held.
There were no fees billed for tax services by the Auditors to service affiliates during the Reporting Periods that required pre-approval by the Audit Committee.
d) All Other Fees. The aggregate fees for other fees billed in the Reporting Periods for products and services provided by the Auditor were $2,645 in 2012 and $4,081 in 2013, other than the services reported in paragraphs (a) through (c) of this Item for the Legg Mason Global Asset Management Trust.
All Other Fees. There were no other non-audit services rendered by the Auditor to Legg Mason Partners Fund Advisors, LLC (“LMPFA”), and any entity controlling, controlled by or under common control with LMPFA that provided ongoing services to Legg Mason Global Asset Management Trust requiring pre-approval by the Audit Committee in the Reporting Period.
(e) Audit Committee’s pre–approval policies and procedures described in paragraph (c) (7) of Rule 2-01 of
Regulation S-X.
(1) The Charter for the Audit Committee (the “Committee”) of the Board of each registered investment company (the “Fund”) advised by LMPFA or one of their affiliates (each, an “Adviser”) requires that the Committee shall approve (a) all audit and permissible non-audit services to be provided to the Fund and (b) all permissible non-audit services to be provided by the Fund’s independent auditors to the Adviser and any Covered Service Providers if the engagement relates directly to the operations and financial reporting of the Fund. The Committee may implement policies and procedures by which such services are approved other than by the full Committee.
The Committee shall not approve non-audit services that the Committee believes may impair the independence of the auditors. As of the date of the approval of this Audit Committee Charter, permissible non-audit services include any professional services (including tax services), that are not prohibited services as described below, provided to the Fund by the independent auditors, other than those provided to the Fund in connection with an audit or a review of the financial statements of the Fund. Permissible non-audit services may not include: (i) bookkeeping or other services related to the accounting records or financial statements of the Fund; (ii) financial information systems design and implementation; (iii) appraisal or valuation services, fairness opinions or contribution-in-kind reports; (iv) actuarial services; (v) internal audit outsourcing services; (vi) management functions or human resources; (vii) broker or dealer, investment adviser or investment banking services; (viii) legal services and expert services unrelated to the audit; and (ix) any other service the Public Company Accounting Oversight Board determines, by regulation, is impermissible.
Pre-approval by the Committee of any permissible non-audit services is not required so long as: (i) the aggregate amount of all such permissible non-audit services provided to the Fund, the Adviser
and any service providers controlling, controlled by or under common control with the Adviser that provide ongoing services to the Fund (“Covered Service Providers”) constitutes not more than 5% of the total amount of revenues paid to the independent auditors during the fiscal year in which the permissible non-audit services are provided to (a) the Fund, (b) the Adviser and (c) any entity controlling, controlled by or under common control with the Adviser that provides ongoing services to the Fund during the fiscal year in which the services are provided that would have to be approved by the Committee; (ii) the permissible non-audit services were not recognized by the Fund at the time of the engagement to be non-audit services; and (iii) such services are promptly brought to the attention of the Committee and approved by the Committee (or its delegate(s)) prior to the completion of the audit.
(2) For the Legg Mason Global Asset Management Trust, the percentage of fees that were approved by the audit committee, with respect to: Audit-Related Fees were 100% and 100% for 2012 and 2013; Tax Fees were 100% and 100% for 2012 and 2013; and Other Fees were 100% and 100% for 2012 and 2013.
(f) N/A
(g) Non-audit fees billed by the Auditor for services rendered to Legg Mason Global Asset Management Trust, LMPFA and any entity controlling, controlled by, or under common control with LMPFA that provides ongoing services to Legg Mason Global Asset Management Trust during the reporting period were $26,900 in 2012 and $240,000 in 2013.
(h) Yes. Legg Mason Global Asset Management Trust’s Audit Committee has considered whether the provision of non-audit services that were rendered to Service Affiliates, which were not pre-approved (not requiring pre-approval), is compatible with maintaining the Accountant’s independence. All services provided by the Auditor to the Legg Mason Global Asset Management Trust or to Service Affiliates, which were required to be pre-approved, were pre-approved as required.
| ITEM 5. | AUDIT COMMITTEE OF LISTED REGISTRANTS. |
| | a) | The independent board members are acting as the registrant’s audit committee as specified in Section 3(a)(58)(B) of the Exchange Act. The Audit Committee consists of the following Board members: |
Ruby P. Hearn
Arnold L. Lehman
Robin J.W. Masters
Jill E. McGovern
Arthur S. Mehlman
G. Peter O’Brien
S. Ford Rowan
Robert M. Tarola
| ITEM 6. | SCHEDULE OF INVESTMENTS. |
Included herein under Item 1.
| ITEM 7. | DISCLOSURE OF PROXY VOTING POLICIES AND PROCEDURES FOR CLOSED-END MANAGEMENT INVESTMENT COMPANIES. |
Not applicable.
| ITEM 8. | PORTFOLIO MANAGERS OF CLOSED-END MANAGEMENT INVESTMENT COMPANIES. |
Not applicable.
| ITEM 9. | PURCHASES OF EQUITY SECURITIES BY CLOSED-END MANAGEMENT INVESTMENT COMPANY AND AFFILIATED PURCHASERS. |
Not applicable.
| ITEM 10. | SUBMISSION OF MATTERS TO A VOTE OF SECURITY HOLDERS. |
Not applicable.
| ITEM 11. | CONTROLS AND PROCEDURES. |
| | (a) | The registrant’s principal executive officer and principal financial officer have concluded that the registrant’s disclosure controls and procedures (as defined in Rule 30a- 3(c) under the Investment Company Act of 1940, as amended (the “1940 Act”)) are effective as of a date within 90 days of the filing date of this report that includes the disclosure required by this paragraph, based on their evaluation of the disclosure controls and procedures required by Rule 30a-3(b) under the 1940 Act and 15d-15(b) under the Securities Exchange Act of 1934. |
| | (b) | There were no changes in the registrant’s internal control over financial reporting (as defined in Rule 30a-3(d) under the 1940 Act) that occurred during the second fiscal quarter of the period covered by this report that have materially affected, or are likely to materially affect the registrant’s internal control over financial reporting. |
(a) (1) Code of Ethics attached hereto.
Exhibit 99.CODE ETH
(a) (2) Certifications pursuant to section 302 of the Sarbanes-Oxley Act of 2002 attached hereto.
Exhibit 99.CERT
(b) Certifications pursuant to Section 906 of the Sarbanes-Oxley Act of 2002 attached hereto.
Exhibit 99.906CERT
SIGNATURES
Pursuant to the requirements of the Securities Exchange Act of 1934 and the Investment Company Act of 1940, the registrant has duly caused this Report to be signed on its behalf by the undersigned, there unto duly authorized.
| | |
| Legg Mason Global Asset Management Trust |
| |
| By: | | /s/ Kenneth D. Fuller |
| | Kenneth D. Fuller |
| | Chief Executive Officer |
| | Legg Mason Global Asset Management Trust |
| |
| Date: | | December 23, 2013 |
Pursuant to the requirements of the Securities Exchange Act of 1934 and the Investment Company Act of 1940, this report has been signed below by the following persons on behalf of the registrant and in the capacities and on the dates indicated.
| | |
| By: | | /s/ Kenneth D. Fuller |
| | Kenneth D. Fuller |
| | Chief Executive Officer |
| | Legg Mason Global Asset Management Trust |
| |
| Date: | | December 23, 2013 |
| |
| By: | | /s/ Richard F. Sennett |
| | Richard F. Sennett |
| | Principal Financial Officer |
| | Legg Mason Global Asset Management Trust |
| |
| Date: | | December 23, 2013 |