UNITED STATES
SECURITIES AND EXCHANGE COMMISSION
Washington, D.C. 20549
FORM N-CSR
CERTIFIED SHAREHOLDER REPORT OF REGISTERED
MANAGEMENT INVESTMENT COMPANIES
Investment Company Act file number 811-22338
Legg Mason Global Asset Management Trust
(Exact name of registrant as specified in charter)
620 Eighth Avenue,
49th Floor, New York, NY 10018
(Address of principal executive offices) (Zip code)
Robert I. Frenkel, Esq.
Legg Mason & Co., LLC
100 First Stamford Place
Stamford, CT 06902
(Name and address of agent for service)
Registrant’s telephone number, including area code: 1-877-721-1926
Date of fiscal year end: December 31
Date of reporting period: December 31, 2013
ITEM 1. REPORT TO STOCKHOLDERS.
The Annual Report to Stockholders is filed herewith.

| | |
| Annual Report | | December 31, 2013 |
LEGG MASON
BATTERYMARCH
U.S. SMALL
CAPITALIZATION
EQUITY PORTFOLIO

|
| INVESTMENT PRODUCTS: NOT FDIC INSURED • NO BANK GUARANTEE • MAY LOSE VALUE |
Fund objective
The Fund seeks long-term capital appreciation.
Letter from the president

Dear Shareholder,
We are pleased to provide the annual report of Legg Mason Batterymarch U.S. Small Capitalization Equity Portfolio for the twelve-month reporting period ended December 31, 2013. Please read on for a detailed look at prevailing economic and market conditions during the Fund’s reporting period and to learn how those conditions have affected Fund performance.
As always, we remain committed to providing you with excellent service and a full spectrum of investment choices. We also remain committed to supplementing the support you receive from your financial advisor. One way we accomplish this is through our website, www.leggmason.com/individualinvestors. Here you can gain immediate access to market and investment information, including:
| Ÿ | | Fund prices and performance, |
| Ÿ | | Market insights and commentaries from our portfolio managers, and |
| Ÿ | | A host of educational resources. |
We look forward to helping you meet your financial goals.
Sincerely,

Kenneth D. Fuller
President and Chief Executive Officer
January 31, 2014
| | |
| II | | Legg Mason Batterymarch U.S. Small Capitalization Equity Portfolio |
Investment commentary
Economic review
The U.S. economy continued to grow over the twelve months ended December 31, 2013 (the “reporting period”). Looking back, U.S. gross domestic product (“GDP”)i growth, as reported by the U.S. Department of Commerce, was 1.1% during the first quarter of 2013. The economic expansion then accelerated, as GDP growth was 2.5% during the second quarter. This was partially due to increases in exports and non-residential fixed investments, along with a smaller decline in federal government spending versus the previous quarter. The economy gained further momentum during the third quarter, with GDP growth of 4.1%, its best reading since the fourth quarter of 2011. Stronger growth was driven, in part, by an increase in private inventory investment, a deceleration in imports and accelerating state and local government spending. The U.S. Department of Commerce’s initial reading for fourth quarter 2013 GDP growth, released after the reporting period ended, was 3.2%. Slower growth was due to several factors, including a deceleration in private inventory investment, declining federal government spending and less residential fixed investments.
The U.S. job market improved during the reporting period, although unemployment remained elevated from a historical perspective. When the period began, unemployment, as reported by the U.S. Department of Labor, was 7.9%. Unemployment fell to 7.7% in February 2013 and generally edged lower over the remainder of the period, falling to 6.7% in December. This represented the lowest level since October 2008. However, falling unemployment during the period was partially due to a decline in the workforce participation rate, which was 62.8% in December, its lowest level since 1978. In addition, the number of longer-term unemployed continues to be high, as roughly 37.7% of the 10.4 million Americans looking for work in December 2013 had been out of work for more than six months.
While sales of existing-homes declined at times throughout the reporting period given rising mortgage rates, they moved higher at the end of the year. According to the National Association of Realtors (“NAR”), existing-home sales rose 1.0% on a seasonally adjusted basis in December 2013 versus the previous month, although they were 0.6% lower than in December 2012. However, existing homes sales in 2013 were 9.1% higher than the previous year and 2013’s sales were the strongest since 2006. In addition, the NAR reported that the median existing-home price for all housing types was $198,100 in December 2013, up 9.9% from December 2012. The inventory of homes available for sale in December 2013 was 11% lower than the previous month at a 4.6 month supply at the current sales pace but 1.6% higher than in December 2012.
The manufacturing sector expanded during the majority of the reporting period, although it experienced a temporary soft patch. Based on the Institute for Supply Management’s Purchasing Managers’ Index (“PMI”)ii, manufacturing expanded during the first four months of the reporting period. It then contracted in May 2013, with a PMI of 49.0 (a reading below 50 indicates a contraction, whereas a reading above 50 indicates an expansion). This represented the PMI’s lowest reading since June 2009. However, the contraction was a short-term setback, as the PMI rose over the next seven months and peaked at 57.3 in November,
| | |
| Legg Mason Batterymarch U.S. Small Capitalization Equity Portfolio | | III |
Investment commentary (cont’d)
the best reading since April 2011. The PMI then moderated somewhat in December 2013, edging back to a still strong 57.0.
The Federal Reserve Board (“Fed”)iii took a number of actions as it sought to meet its dual mandate of fostering maximum employment and price stability. As has been the case since December 2008, the Fed kept the federal funds rateiv at a historically low range between zero and 0.25%. At its meeting in December 2012, the Fed announced that it would continue purchasing $40 billion per month of agency mortgage-backed securities (“MBS”), as well as initially purchasing $45 billion per month of longer-term Treasuries. At its meeting that ended on June 19, 2013, the Fed did not make any material changes to its official policy statement. However, in a press conference following the meeting, Fed Chairman Bernanke said “…the Committee currently anticipates that it would be appropriate to moderate the monthly pace of purchases later this year.” In a surprise to many investors, at its meeting that ended on September 18, 2013, the Fed did not taper its asset purchase program and said that it “…decided to await more evidence that progress will be sustained before adjusting the pace of its purchases.” At its meeting that concluded on December 18, 2013, the Fed announced that it would begin reducing its monthly asset purchases, saying “Beginning in January 2014, the Committee will add to its holdings of agency mortgage-backed securities at a pace of $35 billion per month rather than $40 billion per month, and will add to its holdings of longer-term Treasury securities at a pace of $40 billion per month rather than $45 billion per month.” At the Fed’s meeting that concluded on January 29, 2014, after the reporting period ended, it announced that in February 2014 it would further taper its asset purchases, to a total of $65 billion a month ($30 billion per month of agency mortgage-backed securities and $35 billion per month of longer-term Treasury securities).
As always, thank you for your confidence in our stewardship of your assets.
Sincerely,
Kenneth D. Fuller
President and Chief Executive Officer
January 31, 2014
All investments are subject to risk including the possible loss of principal. Past performance is no guarantee of future results.
| i | Gross domestic product (“GDP”) is the market value of all final goods and services produced within a country in a given period of time. |
| ii | The Institute for Supply Management’s PMI is based on a survey of purchasing executives who buy the raw materials for manufacturing at more than 350 companies. It offers an early reading on the health of the manufacturing sector. |
| iii | The Federal Reserve Board (“Fed”) is responsible for the formulation of policies designed to promote economic growth, full employment, stable prices and a sustainable pattern of international trade and payments. |
| iv | The federal funds rate is the rate charged by one depository institution on an overnight sale of immediately available funds (balances at the Federal Reserve) to another depository institution; the rate may vary from depository institution to depository institution and from day to day. |
| | |
| IV | | Legg Mason Batterymarch U.S. Small Capitalization Equity Portfolio |
Fund overview
Q. What is the Fund’s investment strategy?
A. The Fund’s investment objective is long-term capital appreciation. Under normal market conditions, the Fund will invest at least 80% of net assets, plus any borrowings for investment purposes, in equity securities of companies with relatively small market capitalizations domiciled, or having their principal activities, in the U.S., at the time of investment or other investments with similar economic characteristics. The Fund normally intends to hold a portfolio that is generally comparable to, but not the same as, the Russell 2000 Indexi in terms of economic sector weightings and market capitalization but may depart from this if we believe it to be in the best interests of the Fund. The Fund may also invest in securities of foreign companies in the form of American Depositary Receipts (“ADRs”).
At Batterymarch Financial Management, Inc. (“Batterymarch”), the Fund’s adviser, all portfolios are managed on a collaborative basis using a systematic, rules-based approach. We use a bottom-up, quantitative stock selection process. The cornerstone of this process is a proprietary stock selection model that ranks the stocks in the Fund’s investable universe on a daily basis according to a variety of fundamental measures of relative attractiveness.
Q. What were the overall market conditions during the Fund’s reporting period?
A. 2013 started strong with most global markets posting substantial gains in January as investors focused on consistent, incremental economic improvements and looked past any global growth concerns. Worries about the U.S. fiscal cliff and the sequester passed quickly as the former was resolved to the market’s satisfaction and the latter had little immediate tangible impact. Positive economic news, including improvements in manufacturing and homebuilding, continued to support the slow growth environment. The first quarter ended on a strong note for U.S. markets as events in Cyprus cast renewed doubts about the health of the Eurozone, benefiting U.S. markets and putting them in the position of global safe haven.
U.S. markets continued to be strong during the second quarter of 2013, focused on the U.S. economy’s continued slow, steady growth supported by the low interest rate environment, rising home prices and slowly improving employment. Despite a pullback after the Federal Reserve Board (“Fed”)ii hinted on June 18th that they would begin tapering their monetary stimulus program, the Russell 2000 Index ended the second quarter in positive territory.
In a reversal from the second quarter, the U.S. underperformed all other developed market regions in the third quarter over concerns that the Fed might taper its quantitative easing program and that the U.S. would invade Syria. In August, equities declined on macro concerns as Congress came to a budget impasse. Nevertheless, by September investors seemed to shrug off concerns about the U.S. government shutdown amid modestly positive news, with a number of U.S. companies posting above-estimated earnings and the market was strong through year end.
During the year ended December 31, 2013, small-cap U.S. stocks as measured by the Russell 2000 Index, returned 38.82%, outperforming large-cap U.S. stocks as measured by the Russell 1000 Indexiii, which
| | |
| Legg Mason Batterymarch U.S. Small Capitalization Equity Portfolio 2013 Annual Report | | 1 |
Fund overview (cont’d)
returned 33.11%, led by Consumer Services, Health Care and Software & Services stocks.
Q. How did we respond to these changing market conditions?
A. We believe that fundamentals, the very basis of our investment process, will continue to be the primary driver of long-term returns. As a result, we continue to adhere to our investment philosophy while continuing to enhance our process to address sustainable market shifts. We also believe that integrated risk management is an important element of portfolio construction, and our investment process will continue to reflect these long-held views. We strongly believe, particularly during times of extreme market volatility, in the value of a broadly diversified, rules-based, risk-controlled process.
Much of our research over the past several years has been focused on developing tools to help us navigate extreme market environments. As a result of this research, we’ve made several enhancements to our process including the addition of monitoring tools to identify risk in our stock selection models, particularly with regard to factor selection, as well as macro-level tools to identify regimes that are more favorable/unfavorable for certain factor strategies. These tools allow us to follow our historical bottom-up stock ranking methodology, but also to identify extremes so we can step in to intervene if necessary.
Performance review
For the twelve months ended December 31, 2013, Class I shares of Legg Mason Batterymarch U.S. Small Capitalization Equity Portfolio returned 38.48%. The Fund’s unmanaged benchmark, the Russell 2000 Index, returned 38.82% for the same period. The Lipper Small-Cap Core Funds Category Average1 returned 36.83% over the same time frame.
| | | | | | | | |
Performance Snapshot as of December 31, 2013
(unaudited) | |
| (excluding sales charges) | | 6 months | | | 12 months | |
Legg Mason Batterymarch U.S.
Small Capitalization Equity Portfolio: | |
Class A | | | 21.20 | % | | | 37.82 | % |
Class A2 | | | 21.07 | % | | | 37.69 | % |
Class C | | | 20.70 | % | | | 36.72 | % |
Class FI | | | 21.20 | % | | | 37.87 | % |
Class I | | | 21.47 | % | | | 38.48 | % |
Class IS | | | 21.48 | % | | | 38.46 | % |
| Russell 2000 Index | | | 19.82 | % | | | 38.82 | % |
| Lipper Small-Cap Core Funds Category Average1 | | | 19.00 | % | | | 36.83 | % |
The performance shown represents past performance. Past performance is no guarantee of future results and current performance may be higher or lower than the performance shown above. Principal value and investment returns will fluctuate and investors’ shares, when redeemed, may be worth more or less than their original cost. To obtain performance data current to the most recent month-end, please visit our website at www.leggmason.com/individualinvestors.
All share class returns assume the reinvestment of all distributions, at net asset value
| 1 | Lipper, Inc., a wholly-owned subsidiary of Reuters, provides independent insight on global collective investments. Returns are based on the period ended December 31, 2013, including the reinvestment of all distributions, including returns of capital, if any, calculated among the 735 funds for the six-month period and among the 718 funds for the twelve-month period in the Fund’s Lipper category, and excluding sales charges. |
| | |
| 2 | | Legg Mason Batterymarch U.S. Small Capitalization Equity Portfolio 2013 Annual Report |
and the deduction of all Fund expenses. Returns have not been adjusted to include sales charges that may apply or the deduction of taxes that a shareholder would pay on Fund distributions. If sales charges were reflected, the performance quoted would be lower. Performance figures for periods shorter than one year represent cumulative figures and are not annualized.
Fund performance figures reflect fee waivers and/or expense reimbursements, without which the performance would have been lower.
|
| Total Annual Operating Expenses (unaudited) |
As of the Fund’s current prospectus dated May 1, 2013, the gross total annual operating expense ratios for Class A, Class A2, Class C, Class FI, Class I and Class IS shares were 1.24%, 1.20%, 2.06%, 1.53%, 0.89% and 0.79%, respectively.
Actual expenses may be higher. For example, expenses may be higher than those shown if average net assets decrease. Net assets are more likely to decrease and Fund expense ratios are more likely to increase when markets are volatile.
As a result of expense limitation arrangements, the ratio of expenses, other than interest, brokerage commissions, dividend expense on short sales, taxes, extraordinary expenses and acquired fund fees and expenses, to average net assets is not expected to exceed 1.30% for Class A shares, 1.50% for Class A2 shares, 2.05% for Class C shares, 1.30% for Class FI shares, 1.00% Class I shares and 0.75% for Class IS shares. In addition, total annual fund operating expenses for Class IS shares will not exceed total annual fund operating expenses for Class I shares. These expense limitation arrangements cannot be terminated prior to December 31, 2015 without the Board of Trustees’ consent. The manager currently intends to voluntarily waive fees and/or reimburse operating expenses, other than interest, brokerage commissions, dividend expense on short sales, taxes, extraordinary expenses and acquired fund fees and expenses, so that annual operating expenses are not expected to exceed 1.20% for Class A shares, 1.40% for Class A2 shares, 1.95% for Class C shares, 1.20% for Class FI shares and 0.90% for Class I shares. These arrangements are expected to continue until December 31, 2015 but may be terminated at any time by the manager.
The manager is permitted to recapture amounts waived or reimbursed to a class within three years after the fiscal year in which the manager earned the fee or incurred the expense if the class’ total annual operating expenses have fallen to a level below the expense limitation (“expense cap”) in effect at the time the fees were earned or the expenses incurred. In no case will the manager recapture any amount that would result, on any particular business day of the Fund, in the class’ total annual operating expenses exceeding the expense cap or any other lower limit then in effect.
Q. What were the leading contributors to performance?
A. Stock selection was the primary contributor to relative performance for the period, especially in the Financials — Real Estate, Consumer Staples and Health Care sectors. At the stock level, owning Nu Skin Enterprises Inc., a non-benchmark holding that returned over 280% for the period held as a result of improved earnings forecasts and revenue targets, was the primary contributor to performance, followed by an overweight to American Equity Investment Life Holding Company and FelCor Lodging Trust Inc. American Equity approved a preliminary agreement in a class action lawsuit at the end of October, and FelCor shares jumped
| | |
| Legg Mason Batterymarch U.S. Small Capitalization Equity Portfolio 2013 Annual Report | | 3 |
Fund overview (cont’d)
on the news of the sale of six “non-strategic” hotels allowing it to pay part of its accrued preferred dividends.
An overweight to Health Care and Financials stocks contributed to relative performance, as those sectors outperformed the benchmark overall.
Q. What were the leading detractors from performance?
A. Stock selection in the Materials sector was the primary detractor from relative return for the period, followed by selection in Software & Services and Technology. At the stock level, mining stocks Golden Star Resources Ltd. and Coeur Mining Inc. were impacted by falling gold prices and were the primary detractors at the stock level. An overweight to a financial services firm that focuses on the under-banked consumer, DFC Global Corp. also detracted. All three stock level detractors had double digit negative returns for the period.
Sector allocation decisions overall detracted from relative performance, with an underweight to Retailers and Consumer Services, which outperformed in the benchmark, and an overweight to Materials, which underperformed, hurting performance
Thank you for your investment in Legg Mason Batterymarch U.S. Small Capitalization Equity Portfolio. As always, we appreciate that you have chosen us to manage your assets and we remain focused on achieving the Fund’s investment goals.
Sincerely,
Batterymarch Financial Management, Inc.
January 24, 2014
RISKS: Investments in small-cap companies may involve greater risks and volatility than investments in larger, more established companies. Small-cap companies may have limited product lines, markets or financial resources. The Fund may engage in active and frequent trading, resulting in higher portfolio turnover and transaction costs. The Fund may use derivatives, such as options and futures, which can be illiquid, may disproportionately increase losses, and may have a potentially large impact on Fund performance. Please see the Fund’s prospectus for a more complete discussion of these and other risks, and the Fund’s investment strategies.
Portfolio holdings and breakdowns are as of December 31, 2013 and are subject to change and may not be representative of the portfolio managers’ current or future investments. The Fund’s top ten holdings (as a percentage of net assets) as of December 31, 2013 were: iShares Trust — iShares Russell 2000 Index Fund (3.5%), American Equity Investment Life Holding Co. (0.8%), Cracker Barrel Old Country Store Inc. (0.8%), Manhattan Associates Inc. (0.7%), Hyster-Yale Materials Handling Inc. (0.7%), Esterline Technologies Corp. (0.7%), Generac Holdings Inc. (0.7%), NPS Pharmaceuticals Inc. (0.7%), Questcor Pharmaceuticals Inc. (0.7%) and Aspen Technology Inc. (0.6%). Please refer to pages 11 through 22 for a list and percentage breakdown of the Fund’s holdings.
The mention of sector breakdowns is for informational purposes only and should not be construed as a recommendation to purchase or sell any securities. The information provided regarding such sectors is not a sufficient basis upon which to make an investment decision. Investors seeking financial advice regarding the appropriateness of investing in any securities or investment strategies discussed should consult their financial professional. The Fund’s top five sector holdings (as a percentage of net assets) as of December 31, 2013 were: Financials (21.9%),
| | |
| 4 | | Legg Mason Batterymarch U.S. Small Capitalization Equity Portfolio 2013 Annual Report |
Information Technology (18.2%), Industrials (14.4%), Health Care (13.6%) and Consumer Discretionary (11.1%). The Fund’s portfolio composition is subject to change at any time.
All investments are subject to risk including the possible loss of principal. Past performance is no guarantee of future results. All index performance reflects no deduction for fees, expenses or taxes. Please note that an investor cannot invest directly in an index.
The information provided is not intended to be a forecast of future events, a guarantee of future results or investment advice. Views expressed may differ from those of the firm as a whole.
| i | The Russell 2000 Index measures the performance of the small-cap segment of the U.S. equity universe. The Russell 2000 is a subset of the Russell 3000 Index representing approximately 10% of the total market capitalization of that index. It includes approximately 2,000 of the smallest securities based on a combination of their market cap and current index membership. The Russell 3000 Index measures the performance of the 3,000 largest U.S. companies based on total market capitalization, which represents approximately 98% of the U.S. equity market. |
| ii | The Federal Reserve Board (“Fed”) is responsible for the formulation of policies designed to promote economic growth, full employment, stable prices and a sustainable pattern of international trade and payments. |
| iii | The Russell 1000 Index measures the performance of the large-cap segment of the U.S. equity universe. It is a subset of the Russell 3000 Index and includes approximately 1,000 of the largest securities based on a combination of their market cap and current index membership. The Russell 1000 represents approximately 92% of the U.S. market. |
| | |
| Legg Mason Batterymarch U.S. Small Capitalization Equity Portfolio 2013 Annual Report | | 5 |
Fund at a glance† (unaudited)
Investment breakdown (%) as a percent of total investments
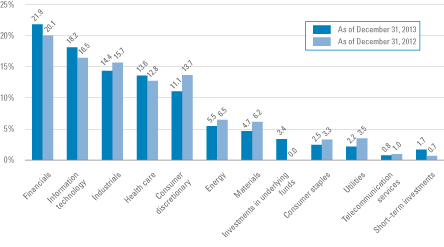
| † | The bar graph above represents the composition of the Fund’s investments as of December 31, 2013 and December 31, 2012. The Fund is actively managed. As a result, the composition of the Fund’s investments is subject to change at any time. |
| | |
| 6 | | Legg Mason Batterymarch U.S. Small Capitalization Equity Portfolio 2013 Annual Report |
Fund expenses (unaudited)
Example
As a shareholder of the Fund, you may incur two types of costs: (1) transaction costs, including front-end and back-end sales charges (loads) on purchase payments; and (2) ongoing costs, including management fees; service and/or distribution (12b-1) fees; and other Fund expenses. This example is intended to help you understand your ongoing costs (in dollars) of investing in the Fund and to compare these costs with the ongoing costs of investing in other mutual funds.
This example is based on an investment of $1,000 invested on July 1, 2013 and held for the six months ended December 31, 2013.
Actual expenses
The table below titled “Based on Actual Total Return” provides information about actual account values and actual expenses. You may use the information provided in this table, together with the amount you invested, to estimate the expenses that you paid over the period. To estimate the expenses you paid on your account, divide your ending account value by $1,000 (for example, an $8,600 ending account value divided by $1,000 = 8.6), then multiply the result by the number under the heading entitled “Expenses Paid During the Period”.
Hypothetical example for comparison purposes
The table below titled “Based on Hypothetical Total Return” provides information about hypothetical account values and hypothetical expenses based on the actual expense ratio and an assumed rate of return of 5.00% per year before expenses, which is not the Fund’s actual return. The hypothetical account values and expenses may not be used to estimate the actual ending account balance or expenses you paid for the period. You may use the information provided in this table to compare the ongoing costs of investing in the Fund and other funds. To do so, compare the 5.00% hypothetical example relating to the Fund with the 5.00% hypothetical examples that appear in the shareholder reports of the other funds.
Please note that the expenses shown in the table below are meant to highlight your ongoing costs only and do not reflect any transactional costs, such as front-end or back-end sales charges (loads). Therefore, the table is useful in comparing ongoing costs only, and will not help you determine the relative total costs of owning different funds. In addition, if these transaction costs were included, your costs would have been higher.
| | | | | | | | | | | | | | | | | | | | | | | | | | | | | | | | | | | | | | | | | | | | |
| Based on actual total return1 | | | | | Based on hypothetical total return1 | |
| | | Actual
Total Return
Without
Sales
Charge2 | | | Beginning
Account
Value | | | Ending
Account
Value | | | Annualized
Expense
Ratio | | | Expenses
Paid
During
the
Period3 | | | | | | | Hypothetical
Annualized
Total Return | | | Beginning
Account
Value | | | Ending
Account
Value | | | Annualized
Expense
Ratio | | | Expenses
Paid
During
the
Period3 | |
Class A | | | 21.20 | % | | $ | 1,000.00 | | | $ | 1,212.00 | | | | 1.20 | % | | $ | 6.69 | | | | | Class A | | | 5.00 | % | | $ | 1,000.00 | | | $ | 1,019.16 | | | | 1.20 | % | | $ | 6.11 | |
Class A2 | | | 21.07 | | | | 1,000.00 | | | | 1,210.70 | | | | 1.40 | | | | 7.80 | | | | | Class A2 | | | 5.00 | | | | 1,000.00 | | | | 1,018.15 | | | | 1.40 | | | | 7.12 | |
Class C | | | 20.70 | | | | 1,000.00 | | | | 1,207.00 | | | | 1.95 | | | | 10.85 | | | | | Class C | | | 5.00 | | | | 1,000.00 | | | | 1,015.38 | | | | 1.95 | | | | 9.91 | |
Class FI | | | 21.20 | | | | 1,000.00 | | | | 1,212.00 | | | | 1.20 | | | | 6.69 | | | | | Class FI | | | 5.00 | | | | 1,000.00 | | | | 1,019.16 | | | | 1.20 | | | | 6.11 | |
Class I | | | 21.47 | | | | 1,000.00 | | | | 1,214.70 | | | �� | 0.75 | | | | 4.19 | | | | | Class I | | | 5.00 | | | | 1,000.00 | | | | 1,021.42 | | | | 0.75 | | | | 3.82 | |
Class IS | | | 21.48 | | | | 1,000.00 | | | | 1,214.80 | | | | 0.75 | | | | 4.19 | | | | | Class IS | | | 5.00 | | | | 1,000.00 | | | | 1,021.42 | | | | 0.75 | | | | 3.82 | |
| | |
| Legg Mason Batterymarch U.S. Small Capitalization Equity Portfolio 2013 Annual Report | | 7 |
Fund expenses (unaudited) (cont’d)
| 1 | For the six months ended December 31, 2013. |
| 2 | Assumes the reinvestment of all distributions, including returns of capital, if any, at net asset value and does not reflect the deduction of the applicable sales charge with respect to Class A and Class A2 shares or the applicable contingent deferred sales charge (“CDSC”) with respect to Class C shares. Total return is not annualized, as it may not be representative of the total return for the year. Performance figures may reflect compensating balance arrangements, fee waivers and/or expense reimbursements. In the absence of compensating balance arrangements, fee waivers and/or expense reimbursements, the total return would have been lower. Past performance is no guarantee of future results. |
| 3 | Expenses (net of compensating balance arrangements, fee waivers and/or expense reimbursements) are equal to each class’ respective annualized expense ratio multiplied by the average account value over the period, multiplied by the number of days in the most recent fiscal half-year (184), then divided by 365. |
| | |
| 8 | | Legg Mason Batterymarch U.S. Small Capitalization Equity Portfolio 2013 Annual Report |
Fund performance (unaudited)
| | | | | | | | | | | | | | | | | | | | | | | | |
| Average annual total returns | | | | | | | | | | | | | | | | | | |
| Without sales charges1 | | Class A | | | Class A2 | | | Class C | | | Class FI | | | Class I | | | Class IS | |
| Twelve Months Ended 12/31/13 | | | 37.82 | % | | | 37.69 | % | | | 36.72 | % | | | 37.87 | % | | | 38.48 | % | | | 38.46 | % |
| Five Years Ended 12/31/13 | | | N/A | | | | N/A | | | | N/A | | | | 20.54 | | | | 21.01 | | | | N/A | |
| Ten Years Ended 12/31/13 | | | N/A | | | | N/A | | | | N/A | | | | 7.48 | | | | 7.93 | | | | N/A | |
| Inception* through 12/31/13 | | | 22.87 | | | | 36.39 | | | | 21.93 | | | | 9.76 | | | | 6.82 | | | | 22.24 | |
| | | | | | |
| With sales charges2 | | Class A | | | Class A2 | | | Class C | | | Class FI | | | Class I | | | Class IS | |
| Twelve Months Ended 12/31/13 | | | 29.86 | % | | | 29.74 | % | | | 35.72 | % | | | 37.87 | % | | | 38.48 | % | | | 38.46 | % |
| Five Years Ended 12/31/13 | | | N/A | | | | N/A | | | | N/A | | | | 20.54 | | | | 21.01 | | | | N/A | |
| Ten Years Ended 12/31/13 | | | N/A | | | | N/A | | | | N/A | | | | 7.48 | | | | 7.93 | | | | N/A | |
| Inception* through 12/31/13 | | | 21.38 | | | | 29.61 | | | | 21.93 | | | | 9.76 | | | | 6.82 | | | | 22.24 | |
| | | | |
| Cumulative total returns | |
| Without sales charges1 | | | |
| Class A (Inception date of 2/5/09 through 12/31/13) | | | 174.54 | % |
| Class A2 (Inception date of 10/31/12 through 12/31/13) | | | 43.77 | |
| Class C (Inception date of 2/5/09 through 12/31/13) | | | 164.46 | |
| Class FI (12/31/03 through 12/31/13) | | | 105.69 | |
| Class I (12/31/03 through 12/31/13) | | | 114.48 | |
| Class IS (Inception date of 3/23/12 through 12/31/13) | | | 42.92 | |
All figures represent past performance and are not a guarantee of future results. Investment return and principal value of an investment will fluctuate so that an investor’s shares, when redeemed, may be worth more or less than their original cost. The returns shown do not reflect the deduction of taxes that a shareholder would pay on Fund distributions or the redemption of Fund shares. Performance figures may reflect compensating balance arrangements, fee waivers and/or expense reimbursements. In the absence of compensating balance arrangements, fee waivers and/or expense reimbursements, the total return would have been lower.
| 1 | Assumes the reinvestment of all distributions, including returns of capital, if any, at net asset value and does not reflect the deduction of the applicable sales charge with respect to Class A shares and Class A2 shares or the applicable contingent deferred sales charge (“CDSC”) with respect to Class C shares. |
| 2 | Assumes the reinvestment of all distributions, including returns of capital, if any, at net asset value. In addition, Class A shares and Class A2 shares reflect the deduction of the maximum initial sales charge of 5.75%. Class C shares reflect the deduction of a 1.00% CDSC, which applies if shares are redeemed within one year from purchase payment. |
| * | Inception dates for Class A, A2, C, FI, I and IS shares are February 5, 2009, October 31, 2012, February 5, 2009, January 9, 2003, March 13, 2000 and March 23, 2012, respectively. |
| | |
| Legg Mason Batterymarch U.S. Small Capitalization Equity Portfolio 2013 Annual Report | | 9 |
Fund performance (unaudited) (cont’d)
Historical performance
Value of $1,000,000 invested in
Class I Shares of Legg Mason Batterymarch U.S. Small Capitalization Equity Portfolio vs. Russell 2000 Index† — December 2003 - December 2013
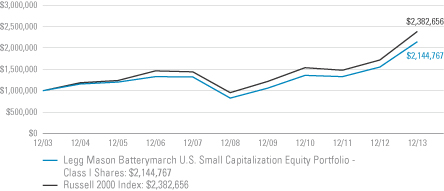
All figures represent past performance and are not a guarantee of future results. Investment return and principal value of an investment will fluctuate so that an investor’s shares, when redeemed, may be worth more or less than their original cost. The returns shown do not reflect the deduction of taxes that a shareholder would pay on Fund distributions or the redemption of Fund shares. Performance figures may reflect compensating balance arrangements, fee waivers and/or expense reimbursements. In the absence of compensating balance arrangements, fee waivers and/or expense reimbursements, the total return would have been lower.
| † | Hypothetical illustration of $1,000,000 invested in Class I shares of Legg Mason Batterymarch U.S. Small Capitalization Equity Portfolio on December 31, 2003, assuming the reinvestment of all distributions, including returns of capital, if any, at net asset value through December 31, 2013. The hypothetical illustration also assumes a $1,000,000 investment in the Russell 2000 Index. The Russell 2000 Index measures the performance of the 2,000 smallest companies in the Russell 3000 Index, which represents approximately 8% of the total market capitalization of the Russell 3000 Index. The Index is unmanaged and is not subject to the same management and trading expenses as a mutual fund. Please note that an investor cannot invest directly in an index. The performance of the Fund’s other classes may be greater or less than Class I share’s performance indicated on this chart, depending on whether greater or lesser sales charges and fees were incurred by shareholders investing in the other classes. |
| | |
| 10 | | Legg Mason Batterymarch U.S. Small Capitalization Equity Portfolio 2013 Annual Report |
Schedule of investments
December 31, 2013
Legg Mason Batterymarch U.S. Small Capitalization Equity Portfolio
| | | | | | | | | | | | |
| Security | | | | | | Shares | | | Value | |
| Common Stocks — 94.8% | | | | | | | | | | | | |
| Consumer Discretionary — 11.1% | | | | | | | | | | | | |
Auto Components — 1.0% | | | | | | | | | | | | |
Dana Holding Corp. | | | | | | | 95,600 | | | $ | 1,875,672 | |
Stoneridge Inc. | | | | | | | 296,645 | | | | 3,782,224 | * |
Tower International Inc. | | | | | | | 104,909 | | | | 2,245,052 | * |
Total Auto Components | | | | | | | | | | | 7,902,948 | |
Automobiles — 0.4% | | | | | | | | | | | | |
Winnebago Industries Inc. | | | | | | | 127,007 | | | | 3,486,342 | * |
Diversified Consumer Services — 0.6% | | | | | | | | | | | | |
Hillenbrand Inc. | | | | | | | 58,812 | | | | 1,730,249 | |
LifeLock Inc. | | | | | | | 169,292 | | | | 2,778,082 | * |
Steiner Leisure Ltd. | | | | | | | 12,565 | | | | 618,072 | * |
Total Diversified Consumer Services | | | | | | | | | | | 5,126,403 | |
Hotels, Restaurants & Leisure — 2.2% | | | | | | | | | | | | |
CEC Entertainment Inc. | | | | | | | 82,947 | | | | 3,672,893 | |
Cracker Barrel Old Country Store Inc. | | | | | | | 56,200 | | | | 6,185,934 | |
Jack in the Box Inc. | | | | | | | 72,300 | | | | 3,616,446 | * |
Marcus Corp. | | | | | | | 55,081 | | | | 740,289 | |
Marriott Vacations Worldwide Corp. | | | | | | | 44,100 | | | | 2,326,716 | * |
Monarch Casino & Resort Inc. | | | | | | | 66,380 | | | | 1,332,910 | * |
Total Hotels, Restaurants & Leisure | | | | | | | | | | | 17,875,188 | |
Household Durables — 0.4% | | | | | | | | | | | | |
NACCO Industries Inc., Class A Shares | | | | | | | 31,231 | | | | 1,942,256 | |
TRI Pointe Homes Inc. | | | | | | | 38,760 | | | | 772,487 | * |
Total Household Durables | | | | | | | | | | | 2,714,743 | |
Internet & Catalog Retail — 0.4% | | | | | | | | | | | | |
FTD Cos. Inc. | | | | | | | 21,488 | | | | 700,079 | * |
Orbitz Worldwide Inc. | | | | | | | 344,900 | | | | 2,476,382 | * |
Total Internet & Catalog Retail | | | | | | | | | | | 3,176,461 | |
Leisure Equipment & Products — 1.2% | | | | | | | | | | | | |
Arctic Cat Inc. | | | | | | | 37,204 | | | | 2,119,884 | |
Brunswick Corp. | | | | | | | 69,000 | | | | 3,178,140 | |
Smith & Wesson Holding Corp. | | | | | | | 323,100 | | | | 4,358,619 | * |
Total Leisure Equipment & Products | | | | | | | | | | | 9,656,643 | |
Media — 1.5% | | | | | | | | | | | | |
Ballantyne Strong Inc. | | | | | | | 16,451 | | | | 76,168 | * |
Cumulus Media Inc., Class A Shares | | | | | | | 502,751 | | | | 3,886,265 | * |
Entravision Communications Corp., Class A Shares | | | | | | | 643,381 | | | | 3,918,191 | |
Live Nation Inc. | | | | | | | 218,500 | | | | 4,317,560 | * |
Total Media | | | | | | | | | | | 12,198,184 | |
See Notes to Financial Statements.
| | |
| Legg Mason Batterymarch U.S. Small Capitalization Equity Portfolio 2013 Annual Report | | 11 |
Schedule of investments (cont’d)
December 31, 2013
Legg Mason Batterymarch U.S. Small Capitalization Equity Portfolio
| | | | | | | | | | | | |
| Security | | | | | | Shares | | | Value | |
Multiline Retail — 0.2% | | | | | | | | | | | | |
Dillard's Inc., Class A Shares | | | | | | | 16,000 | | | $ | 1,555,360 | |
Specialty Retail — 2.6% | | | | | | | | | | | | |
Aaron's Inc. | | | | | | | 15,465 | | | | 454,671 | |
Big 5 Sporting Goods Corp. | | | | | | | 120,006 | | | | 2,378,519 | |
Brown Shoe Co. Inc. | | | | | | | 119,740 | | | | 3,369,484 | |
Buckle Inc. | | | | | | | 42,500 | | | | 2,233,800 | |
Christopher & Banks Corp. | | | | | | | 88,944 | | | | 759,582 | * |
Citi Trends Inc. | | | | | | | 14,977 | | | | 254,609 | * |
Destination Maternity Corp. | | | | | | | 58,990 | | | | 1,762,621 | |
Genesco. Inc. | | | | | | | 38,200 | | | | 2,790,892 | * |
hhgregg Inc. | | | | | | | 78,328 | | | | 1,094,242 | * |
Lumber Liquidators Holdings Inc. | | | | | | | 13,600 | | | | 1,399,304 | * |
Penske Automotive Group Inc. | | | | | | | 90,300 | | | | 4,258,548 | |
Total Specialty Retail | | | | | | | | | | | 20,756,272 | |
Textiles, Apparel & Luxury Goods — 0.6% | | | | | | | | | | | | |
Iconix Brand Group Inc. | | | | | | | 99,400 | | | | 3,946,180 | * |
Unifi Inc. | | | | | | | 35,442 | | | | 965,440 | * |
Total Textiles, Apparel & Luxury Goods | | | | | | | | | | | 4,911,620 | |
Total Consumer Discretionary | | | | | | | | | | | 89,360,164 | |
| Consumer Staples — 2.5% | | | | | | | | | | | | |
Food & Staples Retailing — 0.4% | | | | | | | | | | | | |
Ingles Markets Inc., Class A Shares | | | | | | | 3,051 | | | | 82,682 | |
Rite Aid Corp. | | | | | | | 682,900 | | | | 3,455,474 | * |
Total Food & Staples Retailing | | | | | | | | | | | 3,538,156 | |
Food Products — 0.7% | | | | | | | | | | | | |
John B. Sanfilippo & Son Inc. | | | | | | | 8,510 | | | | 210,027 | |
Pilgrim's Pride Corp. | | | | | | | 139,472 | | | | 2,266,420 | * |
Sanderson Farms Inc. | | | | | | | 46,000 | | | | 3,327,180 | |
Total Food Products | | | | | | | | | | | 5,803,627 | |
Household Products — 0.1% | | | | | | | | | | | | |
WD-40 Co. | | | | | | | 13,378 | | | | 999,069 | |
Personal Products — 1.3% | | | | | | | | | | | | |
Inter Parfums Inc. | | | | | | | 62,811 | | | | 2,249,262 | |
Nu Skin Enterprises Inc., Class A Shares | | | | | | | 36,965 | | | | 5,109,302 | |
USANA Health Sciences Inc. | | | | | | | 37,780 | | | | 2,855,413 | * |
Total Personal Products | | | | | | | | | | | 10,213,977 | |
Total Consumer Staples | | | | | | | | | | | 20,554,829 | |
See Notes to Financial Statements.
| | |
| 12 | | Legg Mason Batterymarch U.S. Small Capitalization Equity Portfolio 2013 Annual Report |
Legg Mason Batterymarch U.S. Small Capitalization Equity Portfolio
| | | | | | | | | | | | |
| Security | | | | | | Shares | | | Value | |
| Energy — 5.5% | | | | | | | | | | | | |
Energy Equipment & Services — 2.0% | | | | | | | | | | | | |
Exterran Holdings Inc. | | | | | | | 146,400 | | | $ | 5,006,880 | * |
GulfMark Offshore Inc., Class A Shares | | | | | | | 43,000 | | | | 2,026,590 | |
Hercules Offshore Inc. | | | | | | | 443,900 | | | | 2,898,667 | * |
Key Energy Services Inc. | | | | | | | 269,615 | | | | 2,129,959 | * |
Pacific Drilling SA | | | | | | | 93,200 | | | | 1,068,072 | * |
Vantage Drilling Co. | | | | | | | 736,916 | | | | 1,355,925 | * |
Willbros Group Inc. | | | | | | | 165,609 | | | | 1,560,037 | * |
Total Energy Equipment & Services | | | | | | | | | | | 16,046,130 | |
Oil, Gas & Consumable Fuels — 3.5% | | | | | | | | | | | | |
Alon USA Energy Inc. | | | | | | | 89,451 | | | | 1,479,519 | |
Carrizo Oil & Gas Inc. | | | | | | | 52,730 | | | | 2,360,722 | * |
Delek US Holdings Inc. | | | | | | | 78,500 | | | | 2,701,185 | |
Energy XXI (Bermuda) Ltd. | | | | | | | 71,900 | | | | 1,945,614 | |
EPL Oil & Gas Inc. | | | | | | | 126,800 | | | | 3,613,800 | * |
Green Plains Renewable Energy Inc. | | | | | | | 16,710 | | | | 324,007 | |
Matador Resources Co. | | | | | | | 177,270 | | | | 3,304,313 | * |
Renewable Energy Group Inc. | | | | | | | 81,300 | | | | 931,698 | * |
SemGroup Corp., Class A Shares | | | | | | | 62,200 | | | | 4,057,306 | |
Stone Energy Corp. | | | | | | | 100,200 | | | | 3,465,918 | * |
Targa Resources Corp. | | | | | | | 13,516 | | | | 1,191,706 | |
VAALCO Energy Inc. | | | | | | | 402,202 | | | | 2,771,172 | * |
Total Oil, Gas & Consumable Fuels | | | | | | | | | | | 28,146,960 | |
Total Energy | | | | | | | | | | | 44,193,090 | |
| Financials — 21.9% | | | | | | | | | | | | |
Capital Markets — 1.4% | | | | | | | | | | | | |
Arlington Asset Investment Corp., Class A Shares | | | | | | | 3,383 | | | | 89,277 | |
FXCM Inc., Class A Shares | | | | | | | 249,597 | | | | 4,452,811 | |
Manning & Napier Inc. | | | | | | | 117,186 | | | | 2,068,333 | (a) |
MCG Capital Corp. | | | | | | | 486,320 | | | | 2,139,808 | |
WisdomTree Investments Inc. | | | | | | | 156,482 | | | | 2,771,296 | * |
Total Capital Markets | | | | | | | | | | | 11,521,525 | |
Commercial Banks — 7.8% | | | | | | | | | | | | |
Community Trust Bancorp Inc. | | | | | | | 21,889 | | | | 988,507 | |
First Interstate BancSystem Inc., Class A Shares | | | | | | | 8,350 | | | | 236,889 | |
First Merchants Corp. | | | | | | | 143,260 | | | | 3,260,598 | |
FirstMerit Corp. | | | | | | | 205,100 | | | | 4,559,373 | |
FNB Corp. | | | | | | | 217,000 | | | | 2,738,540 | |
See Notes to Financial Statements.
| | |
| Legg Mason Batterymarch U.S. Small Capitalization Equity Portfolio 2013 Annual Report | | 13 |
Schedule of investments (cont’d)
December 31, 2013
Legg Mason Batterymarch U.S. Small Capitalization Equity Portfolio
| | | | | | | | | | | | |
| Security | | | | | | Shares | | | Value | |
Commercial Banks — continued | | | | | | | | | | | | |
Hanmi Financial Corp. | | | | | | | 201,730 | | | $ | 4,415,870 | |
Lakeland Financial Corp. | | | | | | | 64,958 | | | | 2,533,362 | |
MB Financial Inc. | | | | | | | 89,960 | | | | 2,886,816 | |
OFG Bancorp | | | | | | | 223,077 | | | | 3,868,155 | |
PrivateBancorp Inc. | | | | | | | 179,600 | | | | 5,195,828 | |
S&T Bancorp Inc. | | | | | | | 20,048 | | | | 507,415 | |
Sandy Spring Bancorp Inc. | | | | | | | 31,600 | | | | 890,804 | |
Susquehanna Bancshares Inc. | | | | | | | 220,840 | | | | 2,835,586 | |
Umpqua Holdings Corp. | | | | | | | 166,407 | | | | 3,185,030 | |
Union First Market Bankshares Corp. | | | | | | | 47,105 | | | | 1,168,675 | |
United Community Banks Inc. | | | | | | | 252,390 | | | | 4,479,922 | * |
Webster Financial Corp. | | | | | | | 136,100 | | | | 4,243,598 | |
Wesbanco Inc. | | | | | | | 57,008 | | | | 1,824,256 | |
Western Alliance Bancorp | | | | | | | 207,967 | | | | 4,962,093 | * |
Wilshire Bancorp Inc. | | | | | | | 454,700 | | | | 4,969,871 | |
Wintrust Financial Corp. | | | | | | | 78,400 | | | | 3,615,808 | |
Total Commercial Banks | | | | | | | | | | | 63,366,996 | |
Consumer Finance — 2.4% | | | | | | | | | | | | |
Credit Acceptance Corp. | | | | | | | 27,293 | | | | 3,547,817 | * |
DFC Global Corp. | | | | | | | 185,736 | | | | 2,126,677 | * |
Encore Capital Group Inc. | | | | | | | 97,900 | | | | 4,920,454 | * |
EZCORP Inc., Class A Shares | | | | | | | 84,223 | | | | 984,567 | * |
Nelnet Inc., Class A Shares | | | | | | | 75,400 | | | | 3,177,356 | |
Portfolio Recovery Associates Inc. | | | | | | | 81,900 | | | | 4,327,596 | * |
Total Consumer Finance | | | | | | | | | | | 19,084,467 | |
Diversified Financial Services — 0.0% | | | | | | | | | | | | |
Gain Capital Holdings Inc. | | | | | | | 28,250 | | | | 212,158 | |
Insurance — 2.6% | | | | | | | | | | | | |
American Equity Investment Life Holding Co. | | | | | | | 241,880 | | | | 6,380,794 | |
AmTrust Financial Services Inc. | | | | | | | 79,600 | | | | 2,602,124 | |
First American Financial Corp. | | | | | | | 172,400 | | | | 4,861,680 | |
HCI Group Inc. | | | | | | | 46,345 | | | | 2,479,457 | |
Maiden Holdings Ltd. | | | | | | | 203,200 | | | | 2,220,976 | |
Platinum Underwriters Holdings Ltd. | | | | | | | 15,610 | | | | 956,581 | |
Tower Group International Ltd. | | | | | | | 78,700 | | | | 266,006 | |
United Fire Group Inc. | | | | | | | 29,107 | | | | 834,207 | |
Total Insurance | | | | | | | | | | | 20,601,825 | |
See Notes to Financial Statements.
| | |
| 14 | | Legg Mason Batterymarch U.S. Small Capitalization Equity Portfolio 2013 Annual Report |
Legg Mason Batterymarch U.S. Small Capitalization Equity Portfolio
| | | | | | | | | | | | |
| Security | | | | | | Shares | | | Value | |
Real Estate Investment Trusts (REITs) — 6.7% | | | | | | | | | | | | |
Ashford Hospitality Prime Inc. | | | | | | | 56,144 | | | $ | 1,021,821 | |
Ashford Hospitality Trust | | | | | | | 280,720 | | | | 2,324,362 | |
Cedar Shopping Centers Inc. | | | | | | | 332,890 | | | | 2,083,891 | |
DiamondRock Hospitality Co. | | | | | | | 311,300 | | | | 3,595,515 | |
DuPont Fabros Technology Inc. | | | | | | | 146,200 | | | | 3,612,602 | |
EPR Properties | | | | | | | 51,500 | | | | 2,531,740 | |
FelCor Lodging Trust Inc. | | | | | | | 595,600 | | | | 4,860,096 | * |
First Industrial Realty Trust Inc. | | | | | | | 232,590 | | | | 4,058,696 | |
Geo Group Inc. | | | | | | | 47,947 | | | | 1,544,852 | |
Getty Realty Corp. | | | | | | | 48,200 | | | | 885,434 | |
Hersha Hospitality Trust | | | | | | | 462,100 | | | | 2,573,897 | |
LaSalle Hotel Properties | | | | | | | 104,200 | | | | 3,215,612 | |
New Residential Investment Corp. | | | | | | | 162,630 | | | | 1,086,368 | |
Pennsylvania Real Estate Investment Trust | | | | | | | 146,400 | | | | 2,778,672 | |
Potlatch Corp. | | | | | | | 102,700 | | | | 4,286,698 | |
Redwood Trust Inc. | | | | | | | 151,470 | | | | 2,933,974 | |
Resource Capital Corp. | | | | | | | 389,000 | | | | 2,306,770 | |
RLJ Lodging Trust | | | | | | | 174,400 | | | | 4,241,408 | |
Saul Centers Inc. | | | | | | | 8,442 | | | | 402,937 | |
Sunstone Hotel Investors Inc. | | | | | | | 292,700 | | | | 3,922,180 | |
Total Real Estate Investment Trusts (REITs) | | | | | | | | | | | 54,267,525 | |
Thrifts & Mortgage Finance — 1.0% | | | | | | | | | | | | |
First Defiance Financial Corp. | | | | | | | 19,087 | | | | 495,689 | |
Home Loan Servicing Solutions Ltd. | | | | | | | 143,500 | | | | 3,296,195 | |
Ocwen Financial Corp. | | | | | | | 73,600 | | | | 4,081,120 | * |
Total Thrifts & Mortgage Finance | | | | | | | | | | | 7,873,004 | |
Total Financials | | | | | | | | | | | 176,927,500 | |
| Health Care — 13.6% | | | | | | | | | | | | |
Biotechnology — 4.1% | | | | | | | | | | | | |
Alkermes PLC | | | | | | | 112,900 | | | | 4,590,514 | * |
AMAG Pharmaceuticals Inc. | | | | | | | 100,400 | | | | 2,436,708 | * |
Dyax Corp. | | | | | | | 136,076 | | | | 1,024,652 | * |
Epizyme Inc. | | | | | | | 71,196 | | | | 1,480,877 | * |
Insys Therapeutics Inc. | | | | | | | 30,000 | | | | 1,161,300 | * |
Isis Pharmaceuticals Inc. | | | | | | | 109,800 | | | | 4,374,432 | * |
Neurocrine Biosciences Inc. | | | | | | | 153,161 | | | | 1,430,524 | * |
NPS Pharmaceuticals Inc. | | | | | | | 177,900 | | | | 5,401,044 | * |
PDL BioPharma Inc. | | | | | | | 441,350 | | | | 3,724,994 | |
See Notes to Financial Statements.
| | |
| Legg Mason Batterymarch U.S. Small Capitalization Equity Portfolio 2013 Annual Report | | 15 |
Schedule of investments (cont’d)
December 31, 2013
Legg Mason Batterymarch U.S. Small Capitalization Equity Portfolio
| | | | | | | | | | | | |
| Security | | | | | | Shares | | | Value | |
Biotechnology — continued | | | | | | | | | | | | |
Peregrine Pharmaceuticals Inc. | | | | | | | 391,300 | | | $ | 543,907 | * |
Repligen Corp. | | | | | | | 249,894 | | | | 3,408,554 | * |
SciClone Pharmaceuticals Inc. | | | | | | | 413,580 | | | | 2,084,443 | * |
Vanda Pharmaceuticals Inc. | | | | | | | 141,900 | | | | 1,760,979 | * |
Total Biotechnology | | | | | | | | | | | 33,422,928 | |
Health Care Equipment & Supplies — 3.0% | | | | | | | | | | | | |
Align Technology Inc. | | | | | | | 19,400 | | | | 1,108,710 | * |
AngioDynamics Inc. | | | | | | | 6,594 | | | | 113,351 | * |
Anika Therapeutics Inc. | | | | | | | 86,249 | | | | 3,291,262 | * |
CONMED Corp. | | | | | | | 13,170 | | | | 559,725 | |
Dexcom Inc. | | | | | | | 114,895 | | | | 4,068,432 | * |
HeartWare International Inc. | | | | | | | 8,346 | | | | 784,190 | * |
Invacare Corp. | | | | | | | 125,176 | | | | 2,905,335 | |
Natus Medical Inc. | | | | | | | 103,861 | | | | 2,336,873 | * |
NuVasive Inc. | | | | | | | 71,353 | | | | 2,306,842 | * |
STERIS Corp. | | | | | | | 81,769 | | | | 3,929,000 | |
West Pharmaceutical Services Inc. | | | | | | | 48,800 | | | | 2,394,128 | |
Total Health Care Equipment & Supplies | | | | | | | | | | | 23,797,848 | |
Health Care Providers & Services — 2.8% | | | | | | | | | | | | |
Addus HomeCare Corp. | | | | | | | 19,466 | | | | 437,012 | * |
Bio-Reference Laboratories Inc. | | | | | | | 132,059 | | | | 3,372,787 | * |
Centene Corp. | | | | | | | 52,832 | | | | 3,114,446 | * |
Ensign Group Inc. | | | | | | | 20,500 | | | | 907,535 | |
Magellan Health Services Inc. | | | | | | | 64,310 | | | | 3,852,812 | * |
Molina Healthcare Inc. | | | | | | | 18,290 | | | | 635,578 | * |
PharMerica Corp. | | | | | | | 158,200 | | | | 3,401,300 | * |
Skilled Healthcare Group Inc., Class A Shares | | | | | | | 98,162 | | | | 472,159 | * |
Team Health Holdings Inc. | | | | | | | 50,900 | | | | 2,318,495 | * |
WellCare Health Plans Inc. | | | | | | | 60,241 | | | | 4,242,171 | * |
Total Health Care Providers & Services | | | | | | | | | | | 22,754,295 | |
Health Care Technology — 0.0% | | | | | | | | | | | | |
Omnicell Inc. | | | | | | | 13,790 | | | | 352,059 | * |
Life Sciences Tools & Services — 0.4% | | | | | | | | | | | | |
Parexel International Corp. | | | | | | | 63,900 | | | | 2,887,002 | * |
Pharmaceuticals — 3.3% | | | | | | | | | | | | |
Endocyte Inc. | | | | | | | 71,080 | | | | 759,845 | * |
Impax Laboratories Inc. | | | | | | | 87,100 | | | | 2,189,694 | * |
Jazz Pharmaceuticals PLC | | | | | | | 37,500 | | | | 4,746,000 | * |
See Notes to Financial Statements.
| | |
| 16 | | Legg Mason Batterymarch U.S. Small Capitalization Equity Portfolio 2013 Annual Report |
Legg Mason Batterymarch U.S. Small Capitalization Equity Portfolio
| | | | | | | | | | | | |
| Security | | | | | | Shares | | | Value | |
Pharmaceuticals — continued | | | | | | | | | | | | |
Medicines Co. | | | | | | | 124,833 | | | $ | 4,821,051 | * |
Nektar Therapeutics | | | | | | | 14,707 | | | | 166,924 | * |
Prestige Brands Holdings Inc. | | | | | | | 105,700 | | | | 3,784,060 | * |
Questcor Pharmaceuticals Inc. | | | | | | | 98,300 | | | | 5,352,435 | |
Sagent Pharmaceuticals Inc. | | | | | | | 29,800 | | | | 756,324 | * |
Santarus Inc. | | | | | | | 122,804 | | | | 3,924,816 | * |
Total Pharmaceuticals | | | | | | | | | | | 26,501,149 | |
Total Health Care | | | | | | | | | | | 109,715,281 | |
| Industrials — 14.4% | | | | | | | | | | | | |
Aerospace & Defense — 2.5% | | | | | | | | | | | | |
AAR Corp. | | | | | | | 174,500 | | | | 4,887,745 | |
American Science & Engineering Inc. | | | | | | | 14,209 | | | | 1,021,769 | |
Curtiss-Wright Corp. | | | | | | | 42,194 | | | | 2,625,733 | |
Ducommun Inc. | | | | | | | 97,162 | | | | 2,896,399 | * |
Esterline Technologies Corp. | | | | | | | 53,400 | | | | 5,444,664 | * |
Moog Inc., Class A Shares | | | | | | | 16,147 | | | | 1,097,027 | * |
Taser International Inc. | | | | | | | 146,930 | | | | 2,333,249 | * |
Total Aerospace & Defense | | | | | | | | | | | 20,306,586 | |
Air Freight & Logistics — 0.2% | | | | | | | | | | | | |
Park-Ohio Holdings Corp. | | | | | | | 26,503 | | | | 1,388,757 | * |
Airlines — 0.4% | | | | | | | | | | | | |
Alaska Air Group Inc. | | | | | | | 35,692 | | | | 2,618,722 | |
Hawaiian Holdings Inc. | | | | | | | 37,407 | | | | 360,229 | * |
Total Airlines | | | | | | | | | | | 2,978,951 | |
Commercial Services & Supplies — 2.8% | | | | | | | | | | | | |
ABM Industries Inc. | | | | | | | 80,159 | | | | 2,291,746 | |
Brink's Co. | | | | | | | 99,600 | | | | 3,400,344 | |
Consolidated Graphics Inc. | | | | | | | 22,700 | | | | 1,530,888 | * |
Deluxe Corp. | | | | | | | 90,300 | | | | 4,712,757 | |
Herman Miller Inc. | | | | | | | 40,300 | | | | 1,189,656 | |
Kimball International Inc., Class B Shares | | | | | | | 169,527 | | | | 2,547,991 | |
Quad Graphics Inc. | | | | | | | 65,477 | | | | 1,782,938 | |
United Stationers Inc. | | | | | | | 110,893 | | | | 5,088,880 | |
Total Commercial Services & Supplies | | | | | | | | | | | 22,545,200 | |
Construction & Engineering — 1.3% | | | | | | | | | | | | |
Comfort Systems USA Inc. | | | | | | | 180,500 | | | | 3,499,895 | |
Granite Construction Inc. | | | | | | | 120,917 | | | | 4,229,677 | |
Pike Corp. | | | | | | | 287,800 | | | | 3,042,046 | * |
Total Construction & Engineering | | | | | | | | | | | 10,771,618 | |
See Notes to Financial Statements.
| | |
| Legg Mason Batterymarch U.S. Small Capitalization Equity Portfolio 2013 Annual Report | | 17 |
Schedule of investments (cont’d)
December 31, 2013
Legg Mason Batterymarch U.S. Small Capitalization Equity Portfolio
| | | | | | | | | | | | |
| Security | | | | | | Shares | | | Value | |
Electrical Equipment — 1.4% | | | | | | | | | | | | |
EnerSys | | | | | | | 39,300 | | | $ | 2,754,537 | |
Generac Holdings Inc. | | | | | | | 95,700 | | | | 5,420,448 | |
General Cable Corp. | | | | | | | 99,900 | | | | 2,938,059 | |
Total Electrical Equipment | | | | | | | | | | | 11,113,044 | |
Machinery — 2.6% | | | | | | | | | | | | |
Albany International Corp., Class A Shares | | | | | | | 67,476 | | | | 2,424,413 | |
CIRCOR International Inc. | | | | | | | 23,889 | | | | 1,929,753 | |
Federal Signal Corp. | | | | | | | 201,847 | | | | 2,957,059 | * |
Hyster-Yale Materials Handling Inc. | | | | | | | 60,128 | | | | 5,601,524 | |
L.B. Foster Co., Class A | | | | | | | 47,230 | | | | 2,233,507 | |
Mueller Industries Inc. | | | | | | | 690 | | | | 43,477 | |
Mueller Water Products Inc., Class A Shares | | | | | | | 478,400 | | | | 4,482,608 | |
Xerium Technologies Inc. | | | | | | | 87,362 | | | | 1,440,599 | * |
Total Machinery | | | | | | | | | | | 21,112,940 | |
Professional Services — 1.1% | | | | | | | | | | | | |
Insperity Inc. | | | | | | | 84,633 | | | | 3,057,790 | |
Kforce Inc. | | | | | | | 119,772 | | | | 2,450,535 | |
Korn/Ferry International | | | | | | | 17,372 | | | | 453,757 | * |
Resources Connection Inc. | | | | | | | 205,320 | | | | 2,942,236 | |
Total Professional Services | | | | | | | | | | | 8,904,318 | |
Road & Rail — 1.4% | | | | | | | | | | | | |
AMERCO | | | | | | | 18,100 | | | | 4,304,904 | * |
Saia Inc. | | | | | | | 81,825 | | | | 2,622,491 | * |
Swift Transportation Co. | | | | | | | 204,800 | | | | 4,548,608 | * |
Total Road & Rail | | | | | | | | | | | 11,476,003 | |
Trading Companies & Distributors — 0.7% | | | | | | | | | | | | |
Aircastle Ltd. | | | | | | | 196,357 | | | | 3,762,200 | |
H&E Equipment Services Inc. | | | | | | | 26,701 | | | | 791,151 | * |
Kaman Corp. | | | | | | | 27,411 | | | | 1,089,039 | |
Total Trading Companies & Distributors | | | | | | | | | | | 5,642,390 | |
Total Industrials | | | | | | | | | | | 116,239,807 | |
| Information Technology — 18.2% | | | | | | | | | | | | |
Communications Equipment — 1.9% | | | | | | | | | | | | |
Aruba Networks Inc. | | | | | | | 81,500 | | | | 1,458,850 | * |
Black Box Corp. | | | | | | | 54,027 | | | | 1,610,005 | |
Brocade Communications Systems Inc. | | | | | | | 323,900 | | | | 2,872,993 | * |
Calix Inc. | | | | | | | 224,292 | | | | 2,162,175 | * |
Ciena Corp. | | | | | | | 81,700 | | | | 1,955,081 | * |
Comtech Telecommunications Corp | | | | | | | 58,633 | | | | 1,848,112 | |
See Notes to Financial Statements.
| | |
| 18 | | Legg Mason Batterymarch U.S. Small Capitalization Equity Portfolio 2013 Annual Report |
Legg Mason Batterymarch U.S. Small Capitalization Equity Portfolio
| | | | | | | | | | | | |
| Security | | | | | | Shares | | | Value | |
Communications Equipment — continued | | | | | | | | | | | | |
Harmonic Inc. | | | | | | | 383,569 | | | $ | 2,830,739 | * |
Ubiquiti Networks Inc. | | | | | | | 10,900 | | | | 500,964 | * |
Total Communications Equipment | | | | | | | | | | | 15,238,919 | |
Computers & Peripherals — 1.0% | | | | | | | | | | | | |
Cray Inc. | | | | | | | 8,009 | | | | 219,927 | * |
Datalink Corp. | | | | | | | 88,470 | | | | 964,323 | * |
Immersion Corp. | | | | | | | 115,187 | | | | 1,195,641 | * |
Silicon Graphics International Corp. | | | | | | | 135,400 | | | | 1,815,714 | * |
Super Micro Computer Inc. | | | | | | | 68,611 | | | | 1,177,365 | * |
Xyratex Ltd. | | | | | | | 198,262 | | | | 2,634,902 | |
Total Computers & Peripherals | | | | | | | | | | | 8,007,872 | |
Electronic Equipment, Instruments & Components — 2.1% | | | | | | | | | | | | |
Benchmark Electronics Inc. | | | | | | | 154,739 | | | | 3,571,376 | * |
Checkpoint Systems Inc. | | | | | | | 107,777 | | | | 1,699,643 | * |
Daktronics Inc. | | | | | | | 55,256 | | | | 866,414 | |
Insight Enterprises Inc. | | | | | | | 128,510 | | | | 2,918,462 | * |
Plexus Corp. | | | | | | | 100,000 | | | | 4,329,000 | * |
Sanmina Corp. | | | | | | | 184,500 | | | | 3,081,150 | * |
Vishay Precision Group Inc. | | | | | | | 8,783 | | | | 130,779 | * |
Total Electronic Equipment, Instruments & Components | | | | | | | | | | | 16,596,824 | |
Internet Software & Services — 1.6% | | | | | | | | | | | | |
Constant Contact Inc. | | | | | | | 40,700 | | | | 1,264,549 | * |
Digital River Inc. | | | | | | | 33,501 | | | | 619,769 | * |
Stamps.com Inc. | | | | | | | 66,292 | | | | 2,790,893 | * |
Support.com Inc. | | | | | | | 75,260 | | | | 285,235 | * |
United Online Inc. | | | | | | | 15,348 | | | | 211,189 | |
ValueClick Inc. | | | | | | | 106,900 | | | | 2,498,253 | * |
VistaPrint NV | | | | | | | 56,579 | | | | 3,216,516 | * |
WebMD Health Corp. | | | | | | | 42,390 | | | | 1,674,405 | * |
Total Internet Software & Services | | | | | | | | | | | 12,560,809 | |
IT Services — 3.1% | | | | | | | | | | | | |
Ciber Inc. | | | | | | | 511,793 | | | | 2,118,823 | * |
Convergys Corp. | | | | | | | 152,850 | | | | 3,217,493 | |
Hackett Group Inc. | | | | | | | 60,700 | | | | 376,947 | |
iGATE Corp. | | | | | | | 95,771 | | | | 3,846,163 | * |
Sapient Corp. | | | | | | | 220,200 | | | | 3,822,672 | * |
Syntel Inc. | | | | | | | 36,514 | | | | 3,320,948 | |
TeleTech Holdings Inc. | | | | | | | 781 | | | | 18,697 | * |
Unisys Corp. | | | | | | | 136,013 | | | | 4,565,957 | * |
See Notes to Financial Statements.
| | |
| Legg Mason Batterymarch U.S. Small Capitalization Equity Portfolio 2013 Annual Report | | 19 |
Schedule of investments (cont’d)
December 31, 2013
Legg Mason Batterymarch U.S. Small Capitalization Equity Portfolio
| | | | | | | | | | | | |
| Security | | | | | | Shares | | | Value | |
IT Services — continued | | | | | | | | | | | | |
Virtusa Corp. | | | | | | | 100,234 | | | $ | 3,817,913 | * |
Total IT Services | | | | | | | | | | | 25,105,613 | |
Semiconductors & Semiconductor Equipment — 4.1% | | | | | | | | | | | | |
Advanced Energy Industries Inc. | | | | | | | 74,000 | | | | 1,691,640 | * |
Cabot Microelectronics Corp. | | | | | | | 35,300 | | | | 1,613,210 | * |
Cirrus Logic Inc. | | | | | | | 109,600 | | | | 2,239,128 | * |
Diodes Inc. | | | | | | | 33,800 | | | | 796,328 | * |
FormFactor Inc. | | | | | | | 293,000 | | | | 1,763,860 | * |
Integrated Silicon Solutions Inc. | | | | | | | 24,990 | | | | 302,129 | * |
International Rectifier Corp. | | | | | | | 121,900 | | | | 3,177,933 | * |
IXYS Corp. | | | | | | | 25,000 | | | | 324,250 | |
Kulicke & Soffa Industries Inc. | | | | | | | 43,547 | | | | 579,175 | * |
Lattice Semiconductor Corp. | | | | | | | 273,700 | | | | 1,508,087 | * |
MKS Instruments Inc. | | | | | | | 73,827 | | | | 2,210,380 | |
OmniVision Technologies Inc. | | | | | | | 186,500 | | | | 3,207,800 | * |
Photronics Inc. | | | | | | | 359,362 | | | | 3,245,039 | * |
PLX Technology, Inc. | | | | | | | 110,605 | | | | 727,781 | * |
RF Micro Devices Inc. | | | | | | | 750,700 | | | | 3,873,612 | * |
Silicon Image Inc. | | | | | | | 573,245 | | | | 3,525,457 | * |
Spansion Inc. | | | | | | | 149,429 | | | | 2,075,569 | * |
Synaptics Inc. | | | | | | | 11,540 | | | | 597,887 | * |
Total Semiconductors & Semiconductor Equipment | | | | | | | | | | | 33,459,265 | |
Software — 4.4% | | | | | | | | | | | | |
Aspen Technology Inc. | | | | | | | 125,100 | | | | 5,229,180 | * |
Comverse Inc. | | | | | | | 70,452 | | | | 2,733,538 | * |
Manhattan Associates Inc. | | | | | | | 49,400 | | | | 5,803,512 | * |
Mentor Graphics Corp. | | | | | | | 151,600 | | | | 3,649,012 | |
NetScout Systems Inc. | | | | | | | 134,965 | | | | 3,993,614 | * |
Pegasystems Inc. | | | | | | | 83,519 | | | | 4,107,464 | |
Progress Software Corp. | | | | | | | 156,573 | | | | 4,044,281 | * |
PTC Inc. | | | | | | | 18,410 | | | | 651,530 | * |
SeaChange International Inc. | | | | | | | 156,575 | | | | 1,903,952 | * |
Tivo, Inc. | | | | | | | 276,026 | | | | 3,621,461 | * |
Total Software | | | | | | | | | | | 35,737,544 | |
Total Information Technology | | | | | | | | | | | 146,706,846 | |
| Materials — 4.7% | | | | | | | | | | | | |
Chemicals — 1.9% | | | | | | | | | | | | |
A. Schulman Inc. | | | | | | | 85,632 | | | | 3,019,384 | |
American Pacific Corp. | | | | | | | 22,941 | | | | 854,782 | * |
See Notes to Financial Statements.
| | |
| 20 | | Legg Mason Batterymarch U.S. Small Capitalization Equity Portfolio 2013 Annual Report |
Legg Mason Batterymarch U.S. Small Capitalization Equity Portfolio
| | | | | | | | | | | | |
| Security | | | | | | Shares | | | Value | |
Chemicals — continued | | | | | | | | | | | | |
Calgon Carbon Corp. | | | | | | | 57,800 | | | $ | 1,188,946 | * |
Ferro Corp. | | | | | | | 1,752 | | | | 22,478 | * |
FutureFuel Corp. | | | | | | | 141,400 | | | | 2,234,120 | |
Landec Corp. | | | | | | | 128,150 | | | | 1,553,178 | * |
Minerals Technologies Inc. | | | | | | | 9,720 | | | | 583,881 | |
OM Group Inc. | | | | | | | 124,500 | | | | 4,533,045 | * |
Tredegar Corp. | | | | | | | 31,830 | | | | 917,022 | |
Total Chemicals | | | | | | | | | | | 14,906,836 | |
Construction Materials — 0.2% | | | | | | | | | | | | |
Headwaters Inc. | | | | | | | 168,357 | | | | 1,648,215 | * |
Containers & Packaging — 0.2% | | | | | | | | | | | | |
AEP Industries Inc. | | | | | | | 11,920 | | | | 629,733 | * |
Myers Industrials Inc. | | | | | | | 54,766 | | | | 1,156,658 | |
Total Containers & Packaging | | | | | | | | | | | 1,786,391 | |
Metals & Mining — 1.2% | | | | | | | | | | | | |
Century Aluminum Co. | | | | | | | 81,350 | | | | 850,921 | * |
Coeur Mining Inc. | | | | | | | 161,000 | | | | 1,746,850 | * |
Handy & Harman Ltd. | | | | | | | 11,000 | | | | 266,310 | * |
Kaiser Aluminum Corp. | | | | | | | 21,800 | | | | 1,531,232 | |
SunCoke Energy Inc. | | | | | | | 100,938 | | | | 2,302,396 | * |
Worthington Industries Inc. | | | | | | | 75,700 | | | | 3,185,456 | |
Total Metals & Mining | | | | | | | | | | | 9,883,165 | |
Paper & Forest Products — 1.2% | | | | | | | | | | | | |
Domtar Corp. | | | | | | | 5,800 | | | | 547,172 | |
Louisiana-Pacific Corp. | | | | | | | 159,900 | | | | 2,959,749 | * |
Neenah Paper Inc. | | | | | | | 26,665 | | | | 1,140,462 | |
P.H. Glatfelter Co. | | | | | | | 2,619 | | | | 72,389 | |
Resolute Forest Products | | | | | | | 160,100 | | | | 2,564,802 | * |
Schweitzer-Mauduit International Inc. | | | | | | | 48,070 | | | | 2,474,163 | |
Total Paper & Forest Products | | | | | | | | | | | 9,758,737 | |
Total Materials | | | | | | | | | | | 37,983,344 | |
| Telecommunication Services — 0.8% | | | | | | | | | | | | |
Diversified Telecommunication Services — 0.5% | | | | | | | | | | | | |
IDT Corp., Class B Shares | | | | | | | 42,289 | | | | 755,705 | |
Straight Path Communications Inc., Class B Shares | | | | | | | 21,144 | | | | 173,169 | * |
Vonage Holdings Corp. | | | | | | | 1,005,620 | | | | 3,348,715 | * |
Total Diversified Telecommunication Services | | | | | | | | | | | 4,277,589 | |
See Notes to Financial Statements.
| | |
| Legg Mason Batterymarch U.S. Small Capitalization Equity Portfolio 2013 Annual Report | | 21 |
Schedule of investments (cont’d)
December 31, 2013
Legg Mason Batterymarch U.S. Small Capitalization Equity Portfolio
| | | | | | | | | | | | | | | | |
| Security | | | | | | | | Shares | | | Value | |
Wireless Telecommunication Services — 0.3% | | | | | | | | | | | | | | | | |
USA Mobility Inc. | | | | | | | | | | | 135,358 | | | $ | 1,932,912 | |
Total Telecommunication Services | | | | | | | | | | | | | | | 6,210,501 | |
| Utilities — 2.2% | | | | | | | | | | | | | | | | |
Electric Utilities — 1.0% | | | | | | | | | | | | | | | | |
IDACORP Inc. | | | | | | | | | | | 37,600 | | | | 1,949,184 | |
Otter Tail Corp. | | | | | | | | | | | 90,000 | | | | 2,634,300 | |
UNS Energy Corp. | | | | | | | | | | | 63,150 | | | | 3,779,527 | |
Total Electric Utilities | | | | | | | | | | | | | | | 8,363,011 | |
Gas Utilities — 0.8% | | | | | | | | | | | | | | | | |
Chesapeake Utilities Corp. | | | | | | | | | | | 43,100 | | | | 2,586,862 | |
Southwest Gas Corp. | | | | | | | | | | | 68,200 | | | | 3,813,062 | |
Total Gas Utilities | | | | | | | | | | | | | | | 6,399,924 | |
Water Utilities — 0.4% | | | | | | | | | | | | | | | | |
American States Water Co. | | | | | | | | | | | 109,600 | | | | 3,148,808 | |
Total Utilities | | | | | | | | | | | | | | | 17,911,743 | |
Total Common Stocks (Cost — $592,389,108) | | | | | | | | | | | | | | | 765,803,105 | |
| Investment In Underlying Funds — 3.4% | | | | | | | | | | | | | | | | |
iShares Trust — iShares Russell 2000 Index Fund
(Cost — $25,227,738) | | | | | | | | | | | 242,172 | | | | 27,924,853 | |
Total Investments before Short-Term Investments (Cost — $617,616,846) | | | | 793,727,958 | |
| | | | |
| | | Rate | | | Maturity
Date | | | Face
Amount | | | | |
| Short-Term Investments — 1.7% | | | | | | | | | | | | | | | | |
Repurchase Agreements — 1.7% | | | | | | | | | | | | | | | | |
Interest in $1,500,000,000 joint tri-party repurchase agreement dated 12/31/13 with RBS Securities Inc.; Proceeds at maturity — $13,462,007;
(Fully collateralized by various U.S. government obligations, 0.125% to 2.625% due 7/15/14 to 1/15/23;
Market value — $13,731,292)
(Cost — $13,462,000) | | | 0.010 | % | | | 1/2/14 | | | $ | 13,462,000 | | | | 13,462,000 | |
Total Investments — 99.9% (Cost — $631,078,846#) | | | | | | | | | | | | | | | 807,189,958 | |
Other Assets in Excess of Liabilities — 0.1% | | | | | | | | | | | | | | | 976,480 | |
Total Net Assets — 100.0% | | | | | | | | | | | | | | $ | 808,166,438 | |
| * | Non-income producing security. |
| (a) | Illiquid security (unaudited). |
| # | Aggregate cost for federal income tax purposes is $632,298,559. |
See Notes to Financial Statements.
| | |
| 22 | | Legg Mason Batterymarch U.S. Small Capitalization Equity Portfolio 2013 Annual Report |
Statement of assets and liabilities
December 31, 2013
| | | | |
| |
| Assets: | | | | |
Investments, at value (Cost — $631,078,846) | | $ | 807,189,958 | |
Cash | | | 911 | |
Receivable for Fund shares sold | | | 991,266 | |
Dividends and interest receivable | | | 661,407 | |
Prepaid expenses | | | 56,984 | |
Total Assets | | | 808,900,526 | |
| |
| Liabilities: | | | | |
Investment management fee payable | | | 461,132 | |
Payable for Fund shares repurchased | | | 142,954 | |
Service and/or distribution fees payable | | | 10,066 | |
Trustees' fees payable | | | 1,344 | |
Accrued expenses | | | 118,592 | |
Total Liabilities | | | 734,088 | |
| Total Net Assets | | $ | 808,166,438 | |
| |
| Net Assets: | | | | |
Par value (Note 7) | | $ | 589 | |
Paid-in capital in excess of par value | | | 615,694,732 | |
Overdistributed net investment income | | | (1,065,725) | |
Accumulated net realized gain on investments | | | 17,425,730 | |
Net unrealized appreciation on investments | | | 176,111,112 | |
| Total Net Assets | | $ | 808,166,438 | |
| |
| Shares Outstanding: | | | | |
Class A | | | 1,296,574 | |
Class A2 | | | 256,135 | |
Class C | | | 461,988 | |
Class FI | | | 194,799 | |
Class I | | | 656,481 | |
Class IS | | | 55,989,562 | |
| |
| Net Asset Value: | | | | |
Class A (and redemption price) | | | $13.80 | |
Class A2 (and redemption price) | | | $13.75 | |
Class C* | | | $13.37 | |
Class FI (and redemption price) | | | $13.42 | |
Class I (and redemption price) | | | $13.90 | |
Class IS (and redemption price) | | | $13.73 | |
| Maximum Public Offering Price Per Share: | | | | |
Class A (based on maximum initial sales charge of 5.75%) | | | $14.64 | |
Class A2 (based on maximum initial sales charge of 5.75%) | | | $14.59 | |
| * | Redemption price per share is NAV of Class C shares reduced by a 1.00% CDSC, if shares are redeemed within one year from purchase payment (See Note 2). |
See Notes to Financial Statements.
| | |
| Legg Mason Batterymarch U.S. Small Capitalization Equity Portfolio 2013 Annual Report | | 23 |
Statement of operations
For the Year Ended December 31, 2013
| | | | |
| |
| Investment Income: | | | | |
Dividends | | $ | 7,860,849 | |
Interest | | | 6,308 | |
Less: Foreign taxes withheld | | | (2,706) | |
Total Investment Income | | | 7,864,451 | |
| |
| Expenses: | | | | |
Investment management fee (Note 2) | | | 4,767,312 | |
Service and/or distribution fees (Notes 2 and 5) | | | 105,713 | |
Registration fees | | | 101,951 | |
Transfer agent fees (Note 5) | | | 97,091 | |
Trustees' fees | | | 77,732 | |
Fund accounting fees | | | 65,996 | |
Legal fees | | | 57,910 | |
Shareholder reports | | | 51,189 | |
Audit and tax | | | 40,494 | |
Insurance | | | 13,088 | |
Custody fees | | | 11,168 | |
Fees recaptured by investment manager (Note 2) | | | 3,875 | |
Miscellaneous expenses | | | 18,228 | |
Total Expenses | | | 5,411,747 | |
Less: Fee waivers and/or expense reimbursements (Notes 2 and 5) | | | (154,345) | |
Net Expenses | | | 5,257,402 | |
| Net Investment Income | | | 2,607,049 | |
| |
| Realized and Unrealized Gain (Loss) on Investments (Notes 1 and 3): | | | | |
Net Realized Gain | | | 84,313,861 | |
Change in Net Unrealized Appreciation (Depreciation) | | | 134,328,234 | |
| Net Gain on Investments | | | 218,642,095 | |
| Increase in Net Assets From Operations | | $ | 221,249,144 | |
See Notes to Financial Statements.
| | |
| 24 | | Legg Mason Batterymarch U.S. Small Capitalization Equity Portfolio 2013 Annual Report |
Statements of changes in net assets
| | | | | | | | |
| For the Years Ended December 31, | | 2013 | | | 2012 | |
| | |
| Operations: | | | | | | | | |
Net investment income | | $ | 2,607,049 | | | $ | 6,887,888 | |
Net realized gain | | | 84,313,861 | | | | 16,962,776 | |
Change in net unrealized appreciation (depreciation) | | | 134,328,234 | | | | 23,191,742 | |
Increase in Net Assets From Operations | | | 221,249,144 | | | | 47,042,406 | |
| | |
| Distributions to Shareholders From (Notes 1 and 6): | | | | | | | | |
Net investment income | | | (5,800,030) | | | | (6,711,906) | |
Net realized gains | | | (62,040,419) | | | | — | |
Decrease in Net Assets From Distributions to Shareholders | | | (67,840,449) | | | | (6,711,906) | |
| | |
| Fund Share Transactions (Note 7): | | | | | | | | |
Net proceeds from sale of shares | | | 163,175,280 | | | | 650,179,298 | |
Reinvestment of distributions | | | 33,174,071 | | | | 3,093,560 | |
Cost of shares repurchased | | | (123,495,449) | | | | (356,573,011) | |
Increase in Net Assets From Fund Share Transactions | | | 72,853,902 | | | | 296,699,847 | |
Increase in Net Assets | | | 226,262,597 | | | | 337,030,347 | |
| | |
| Net Assets: | | | | | | | | |
Beginning of year | | | 581,903,841 | | | | 244,873,494 | |
End of year* | | $ | 808,166,438 | | | $ | 581,903,841 | |
* Includes (overdistributed) undistributed net investment income,
respectively, of: | | | $(1,065,725) | | | | $800,702 | |
See Notes to Financial Statements.
| | |
| Legg Mason Batterymarch U.S. Small Capitalization Equity Portfolio 2013 Annual Report | | 25 |
Financial highlights
| | | | | | | | | | | | | | | | | | | | |
For a share of each class of beneficial interest outstanding throughout each year ended December 31,
unless otherwise noted: | |
| Class A Shares1 | | 2013 | | | 20122 | | | 20112 | | | 20102 | | | 20092,3 | |
| | | | | |
| Net asset value, beginning of year | | | $10.94 | | | | $9.50 | | | | $9.74 | | | | $7.59 | | | | $5.53 | |
| | | | | |
| Income (loss) from operations: | | | | | | | | | | | | | | | | | | | | |
Net investment income (loss) | | | (0.01) | | | | 0.09 | | | | 0.01 | | | | (0.01) | | | | 0.01 | |
Net realized and unrealized gain (loss) | | | 4.08 | | | | 1.41 | | | | (0.24) | | | | 2.12 | | | | 2.05 | |
Proceeds from settlement of a regulatory matter | | | — | | | | — | | | | — | | | | 0.04 | | | | — | |
Total income (loss) from operations | | | 4.07 | | | | 1.50 | | | | (0.23) | | | | 2.15 | | | | 2.06 | |
| | | | | |
| Less distributions from: | | | | | | | | | | | | | | | | | | | | |
Net investment income | | | (0.05) | | | | (0.06) | | | | (0.01) | | | | (0.00) | 4 | | | — | |
Net realized gains | | | (1.16) | | | | — | | | | — | | | | — | | | | — | |
Total distributions | | | (1.21) | | | | (0.06) | | | | (0.01) | | | | (0.00) | 4 | | | — | |
| | | | | |
| Net asset value, end of year | | | $13.80 | | | | $10.94 | | | | $9.50 | | | | $9.74 | | | | $7.59 | |
Total return5 | | | 37.82 | % | | | 15.83 | % | | | (2.40) | % | | | 28.39 | %6 | | | 37.25 | % |
| | | | | |
| Net assets, end of year (000s) | | | $17,896 | | | | $16,889 | | | | $18,142 | | | | $20,994 | | | | $18,657 | |
| | | | | |
| Ratios to average net assets: | | | | | | | | | | | | | | | | | | | | |
Gross expenses | | | 1.23 | %7 | | | 1.24 | % | | | 1.23 | %7 | | | 1.38 | % | | | 1.36 | %8,9 |
Net expenses10 | | | 1.20 | 7,11,12 | | | 1.21 | 11,12 | | | 1.23 | 7,12 | | | 1.33 | 11,12 | | | 1.36 | 8,9 |
Net investment income (loss) | | | (0.07) | | | | 0.82 | | | | 0.03 | | | | (0.14) | | | | 0.23 | 8 |
| | | | | |
| Portfolio turnover rate | | | 85 | % | | | 57 | % | | | 49 | % | | | 41 | % | | | 52 | % |
| 1 | Per share amounts have been calculated using the average shares method. |
| 2 | Represents a share of capital stock outstanding prior to April 30, 2012. |
| 3 | For the period February 5, 2009 (commencement of operations) to December 31, 2009. |
| 4 | Amount represents less than $0.01 per share. |
| 5 | Performance figures, exclusive of sales charges, may reflect compensating balance arrangements, fee waivers and/or expense reimbursements. In the absence of compensating balance arrangements, fee waivers and/or expense reimbursements, the total return would have been lower. Past performance is no guarantee of future results. Total returns for periods of less than one year are not annualized. |
| 6 | The total return reflects a payment received due to the settlement of a regulatory matter. Absent this payment, the total return would have been 27.86%. Class A received $96,776 related to this distribution. |
| 7 | Reflects recapture of fees waived/reimbursed from prior fiscal years. |
| 9 | Included in the expense ratios are certain non-recurring restructuring (and reorganization, if applicable) fees that were incurred by the Fund during the period. Without these fees, the gross and net expense ratios would have been 1.36%. |
| 10 | The impact of compensating balance arrangements, if any, was less than 0.01%. |
| 11 | Reflects fee waivers and/or expense reimbursements. |
| 12 | Effective April 30, 2010, as a result of an expense limitation arrangement, the ratio of expenses to average net assets of Class A shares did not exceed 1.30%. This expense limitation arrangement cannot be terminated prior to December 31, 2015 without the Board of Trustees’ consent. The manager currently intends to voluntarily waive fees and/or reimburse expenses so that total annual operating expenses do not exceed 1.20%. This arrangement is expected to continue until December 31, 2015 but may be terminated at any time by the manager. These expense limitation arrangements do not include interest, brokerage commissions, dividend expense on short sales, taxes, extraordinary expenses and acquired fund fees and expenses. |
See Notes to Financial Statements.
| | |
| 26 | | Legg Mason Batterymarch U.S. Small Capitalization Equity Portfolio 2013 Annual Report |
| | | | | | | | |
For a share of each class of beneficial interest outstanding throughout each year ended December 31,
unless otherwise noted: | |
| Class A2 Shares1 | | 2013 | | | 20122 | |
| | |
| Net asset value, beginning of year | | | $10.93 | | | | $10.58 | |
| | |
| Income from operations: | | | | | | | | |
Net investment income | | | (0.00) | 3 | | | 0.07 | |
Net realized and unrealized gain | | | 4.05 | | | | 0.40 | |
Total income from operations | | | 4.05 | | | | 0.47 | |
| | |
| Less distributions from: | | | | | | | | |
Net investment income | | | (0.07) | | | | (0.12) | |
Net realized gains | | | (1.16) | | | | — | |
Total distributions | | | (1.23) | | | | (0.12) | |
| | |
| Net asset value, end of year | | | $13.75 | | | | $10.93 | |
Total return4 | | | 37.69 | % | | | 4.41 | % |
| | |
| Net assets, end of year (000s) | | | $3,522 | | | | $353 | |
| | |
| Ratios to average net assets: | | | | | | | | |
Gross expenses | | | 1.72 | %5 | | | 1.20 | %6 |
Net expenses7,8,9 | | | 1.35 | 5 | | | 1.05 | 6 |
Net investment income (loss) | | | (0.02) | | | | 3.98 | 6 |
| | |
| Portfolio turnover rate | | | 85 | % | | | 57 | % |
| 1 | Per share amounts have been calculated using the average shares method. |
| 2 | For the period October 31, 2012 (commencement of operations) to December 31, 2012. |
| 3 | Amount represents less than $0.01 per share. |
| 4 | Performance figures, exclusive of sales charges, may reflect compensating balance arrangements, fee waivers and/or expense reimbursements. In the absence of compensating balance arrangements, fee waivers and/or expense reimbursements, the total return would have been lower. Past performance is no guarantee of future results. Total returns for periods of less than one year are not annualized. |
| 5 | Reflects recapture of fees waived/reimbursed from prior fiscal years. |
| 7 | The impact of compensating balance arrangements, if any, was less than 0.01%. |
| 8 | As a result of an expense limitation arrangement, the ratio of expenses to average net assets of Class A2 shares did not exceed 1.50%. This expense limitation arrangement cannot be terminated prior to December 31, 2015 without the Board of Trustees’ consent. The manager currently intends to voluntarily waive fees and/or reimburse expenses so that total annual operating expenses do not exceed 1.40%. This arrangement is expected to continue until December 31, 2015 but may be terminated at any time by the manager. These expense limitation arrangements do not include interest, brokerage commissions, dividend expense on short sales, taxes, extraordinary expenses and acquired fund fees and expenses. |
| 9 | Reflects fee waivers and/or expense reimbursements. |
See Notes to Financial Statements.
| | |
| Legg Mason Batterymarch U.S. Small Capitalization Equity Portfolio 2013 Annual Report | | 27 |
Financial highlights (cont’d)
| | | | | | | | | | | | | | | | | | | | |
For a share of each class of beneficial interest outstanding throughout each year ended December 31,
unless otherwise noted: | |
| Class C Shares1 | | 2013 | | | 20122 | | | 20112 | | | 20102 | | | 20092,3 | |
| | | | | |
| Net asset value, beginning of year | | | $10.69 | | | | $9.30 | | | | $9.61 | | | | $7.54 | | | | $5.53 | |
| | | | | |
| Income (loss) from operations: | | | | | | | | | | | | | | | | | | | | |
Net investment income (loss) | | | (0.10) | | | | 0.01 | | | | (0.07) | | | | (0.07) | | | | (0.03) | |
Net realized and unrealized gain (loss) | | | 3.96 | | | | 1.38 | | | | (0.23) | | | | 2.10 | | | | 2.04 | |
Proceeds from settlement of a regulatory matter | | | — | | | | — | | | | — | | | | 0.04 | | | | — | |
Total income (loss) from operations | | | 3.86 | | | | 1.39 | | | | (0.30) | | | | 2.07 | | | | 2.01 | |
| | | | | |
| Less distributions from: | | | | | | | | | | | | | | | | | | | | |
Net investment income | | | (0.02) | | | | — | | | | (0.01) | | | | — | | | | — | |
Net realized gains | | | (1.16) | | | | — | | | | — | | | | — | | | | — | |
Total distributions | | | (1.18) | | | | — | | | | (0.01) | | | | — | | | | — | |
| | | | | |
| Net asset value, end of year | | | $13.37 | | | | $10.69 | | | | $9.30 | | | | $9.61 | | | | $7.54 | |
Total return4 | | | 36.72 | % | | | 14.95 | % | | | (3.16) | % | | | 27.45 | %5 | | | 36.35 | % |
| | | | | |
| Net assets, end of year (000s) | | | $6,179 | | | | $5,073 | | | | $5,330 | | | | $6,032 | | | | $5,521 | |
| | | | | |
| Ratios to average net assets: | | | | | | | | | | | | | | | | | | | | |
Gross expenses | | | 2.06 | %6 | | | 2.06 | %6 | | | 2.08 | %6 | | | 2.19 | % | | | 2.14 | %7,8 |
Net expenses9 | | | 1.95 | 6.10.11 | | | 1.97 | 6,10,11 | | | 2.05 | 6,10,11 | | | 2.09 | 10,11 | | | 2.14 | 7,8 |
Net investment income (loss) | | | (0.81) | | | | 0.07 | | | | (0.78) | | | | (0.90) | | | | (0.56) | 7 |
| | | | | |
| Portfolio turnover rate | | | 85 | % | | | 57 | % | | | 49 | % | | | 41 | % | | | 52 | % |
| 1 | Per share amounts have been calculated using the average shares method. |
| 2 | Represents a share of capital stock outstanding prior to April 30, 2012. |
| 3 | For the period February 5, 2009 (commencement of operations) to December 31, 2009. |
| 4 | Performance figures, exclusive of CDSC, may reflect compensating balance arrangements, fee waivers and/or expense reimbursements. In the absence of compensating balance arrangements, fee waivers and/or expense reimbursements, the total return would have been lower. Past performance is no guarantee of future results. Total returns for periods of less than one year are not annualized. |
| 5 | The total return reflects a payment received due to the settlement of a regulatory matter. Absent this payment, the total return would have been 26.92%. Class C received $29,199 related to this distribution. |
| 6 | Reflects recapture of fees waived/reimbursed from prior fiscal years. |
| 8 | Included in the expense ratios are certain non-recurring restructuring (and reorganization, if applicable) fees that were incurred by the Fund during the period. Without these fees, the gross and net expense ratios would have been 2.14%. |
| 9 | The impact of compensating balance arrangements, if any, was less than 0.01%. |
| 10 | Reflects fee waivers and/or expense reimbursements. |
| 11 | Effective April 30, 2010, as a result of an expense limitation arrangement, the ratio of expenses to average net assets of Class C shares did not exceed 2.05%. This expense limitation arrangement cannot be terminated prior to December 31, 2015 without the Board of Trustees’ consent. The manager currently intends to voluntarily waive fees and/or reimburse expenses so that total annual operating expenses do not exceed 1.95%. This arrangement is expected to continue until December 31, 2015 but may be terminated at any time by the manager. These expense limitation arrangements do not include interest, brokerage commissions, dividend expense on short sales, taxes, extraordinary expenses and acquired fund fees and expenses. |
See Notes to Financial Statements.
| | |
| 28 | | Legg Mason Batterymarch U.S. Small Capitalization Equity Portfolio 2013 Annual Report |
| | | | | | | | | | | | | | | | | | | | |
| For a share of each class of beneficial interest outstanding throughout each year ended December 31: | |
| Class FI Shares1,2 | | 2013 | | | 20123 | | | 20113 | | | 20103 | | | 20093 | |
| | | | | |
| Net asset value, beginning of year | | | $10.68 | | | | $9.27 | | | | $9.51 | | | | $7.45 | | | | $5.83 | |
| | | | | |
| Income (loss) from operations: | | | | | | | | | | | | | | | | | | | | |
Net investment income (loss) | | | 0.01 | | | | 0.10 | | | | (0.00) | 4 | | | (0.01) | | | | 0.02 | |
Net realized and unrealized gain (loss) | | | 3.96 | | | | 1.36 | | | | (0.23) | | | | 2.09 | | | | 1.60 | |
Total income (loss) from operations | | | 3.97 | | | | 1.46 | | | | (0.23) | | | | 2.08 | | | | 1.62 | |
| | | | | |
| Less distributions from: | | | | | | | | | | | | | | | | | | | | |
Net investment income | | | (0.07) | | | | (0.05) | | | | (0.01) | | | | (0.02) | | | | — | |
Net realized gains | | | (1.16) | | | | — | | | | — | | | | — | | | | — | |
Total distributions | | | (1.23) | | | | (0.05) | | | | (0.01) | | | | (0.02) | | | | — | |
| | | | | |
| Net asset value, end of year | | | $13.42 | | | | $10.68 | | | | $9.27 | | | | $9.51 | | | | $7.45 | |
Total return5 | | | 37.87 | % | | | 15.74 | % | | | (2.46) | % | | | 27.93 | % | | | 27.79 | % |
| | | | | |
| Net assets, end of year (000s) | | | $2,614 | | | | $902 | | | | $746 | | | | $747 | | | | $600 | |
| | | | | |
| Ratios to average net assets: | | | | | | | | | | | | | | | | | | | | |
Gross expenses | | | 1.34 | %6 | | | 1.53 | %6 | | | 1.37 | %6 | | | 1.51 | % | | | 1.42 | %7 |
Net expenses8,9 | | | 1.20 | 6,10 | | | 1.22 | 6,10 | | | 1.30 | 6,10 | | | 1.27 | 10,11 | | | 1.20 | 7,11 |
Net investment income (loss) | | | 0.09 | | | | 0.87 | | | | (0.02) | | | | (0.07) | | | | 0.36 | |
| | | | | |
| Portfolio turnover rate | | | 85 | % | | | 57 | % | | | 49 | % | | | 41 | % | | | 52 | % |
| 1 | On October 5, 2009, Financial Intermediary Class shares were renamed as Class FI shares. |
| 2 | Per share amounts have been calculated using the average shares method. |
| 3 | Represents a share of capital stock outstanding prior to April 30, 2012. |
| 4 | Amount represents less than $0.01 per share. |
| 5 | Performance figures may reflect compensating balance arrangements, fee waivers and/or expense reimbursements. In the absence of compensating balance arrangements, fee waivers and/or expense reimbursements, the total return would have been lower. Past performance is no guarantee of future results. |
| 6 | Reflects recapture of fees waived/reimbursed from prior fiscal years. |
| 7 | Included in the expense ratios are certain non-recurring restructuring (and reorganization, if applicable) fees that were incurred by the Fund during the period. Without these fees, the gross and net expense ratios would have been 1.40% and 1.18%, respectively. |
| 8 | The impact of compensating balance arrangements, if any, was less than 0.01%. |
| 9 | Reflects fee waivers and/or expense reimbursements. |
| 10 | Effective April 30, 2010, as a result of an expense limitation arrangement, the ratio of expenses to average net assets of Class FI shares did not exceed 1.30%. This expense limitation arrangement cannot be terminated prior to December 31, 2015 without the Board of Trustees’ consent. The manager currently intends to voluntarily waive fees and/or reimburse expenses so that total annual operating expenses do not exceed 1.20%. This arrangement is expected to continue until December 31, 2015 but may be terminated at any time by the manager. These expense limitation arrangements do not include interest, brokerage commissions, dividend expense on short sales, taxes, extraordinary expenses and acquired fund fees and expenses. |
| 11 | As a result of a contractual expense limitation, until April 30, 2010, the ratio of expenses, other than interest, brokerage commissions, taxes and extraordinary expenses, to average net assets of Class FI shares did not exceed 1.20%. |
See Notes to Financial Statements.
| | |
| Legg Mason Batterymarch U.S. Small Capitalization Equity Portfolio 2013 Annual Report | | 29 |
Financial highlights (cont’d)
| | | | | | | | | | | | | | | | | | | | |
| For a share of each class of beneficial interest outstanding throughout each year ended December 31: | |
| Class I Shares1,2 | | 2013 | | | 20123 | | | 20113 | | | 20103 | | | 20093 | |
| | | | | |
| Net asset value, beginning of year | | | $11.00 | | | | $9.47 | | | | $9.68 | | | | $7.61 | | | | $5.95 | |
| | | | | |
| Income (loss) from operations: | | | | | | | | | | | | | | | | | | | | |
Net investment income | | | 0.05 | | | | 0.05 | | | | 0.04 | | | | 0.02 | | | | 0.04 | |
Net realized and unrealized gain (loss) | | | 4.11 | | | | 1.51 | | | | (0.24) | | | | 2.12 | | | | 1.63 | |
Total income (loss) from operations | | | 4.16 | | | | 1.56 | | | | (0.20) | | | | 2.14 | | | | 1.67 | |
| | | | | |
| Less distributions from: | | | | | | | | | | | | | | | | | | | | |
Net investment income | | | (0.10) | | | | (0.03) | | | | (0.01) | | | | (0.07) | | | | (0.01) | |
Net realized gains | | | (1.16) | | | | — | | | | — | | | | — | | | | — | |
Total distributions | | | (1.26) | | | | (0.03) | | | | (0.01) | | | | (0.07) | | | | (0.01) | |
| | | | | |
| Net asset value, end of year | | | $13.90 | | | | $11.00 | | | | $9.47 | | | | $9.68 | | | | $7.61 | |
Total return4 | | | 38.48 | % | | | 16.50 | % | | | (2.11) | % | | | 28.19 | % | | | 28.16 | % |
| | | | | |
| Net assets, end of year (000s) | | | $9,126 | | | | $9,438 | | | | $220,655 | | | | $235,997 | | | | $186,801 | |
| | | | | |
| Ratios to average net assets: | | | | | | | | | | | | | | | | | | | | |
Gross expenses | | | 0.78 | %5 | | | 0.89 | % | | | 0.94 | %5 | | | 0.96 | %5 | | | 0.93 | %6 |
Net expenses7 | | | 0.77 | 5,8,9 | | | 0.89 | 8,9 | | | 0.94 | 5,8 | | | 0.96 | 5,8,10 | | | 0.89 | 6,9,10 |
Net investment income | | | 0.37 | | | | 0.47 | | | | 0.33 | | | | 0.25 | | | | 0.65 | |
| | | | | |
| Portfolio turnover rate | | | 85 | % | | | 57 | % | | | 49 | % | | | 41 | % | | | 52 | % |
| 1 | Effective October 5, 2009, Institutional Class shares were renamed as Class I shares. |
| 2 | Per share amounts have been calculated using the average shares method. |
| 3 | Represents a share of capital stock outstanding prior to April 30, 2012. |
| 4 | Performance figures may reflect compensating balance arrangements, fee waivers and/or expense reimbursements. In the absence of compensating balance arrangements, fee waivers and/or expense reimbursements, the total return would have been lower. Past performance is no guarantee of future results. |
| 5 | Reflects recapture of fees waived/reimbursed from prior fiscal years. |
| 6 | Included in the expense ratios are certain non-recurring restructuring (and reorganization, if applicable) fees that were incurred by the Fund during the period. Without these fees, the gross and net expense ratios would have been 0.91% and 0.87%, respectively. |
| 7 | The impact of compensating balance arrangements, if any, was less than 0.01%. |
| 8 | Effective April 30, 2010, as a result of an expense limitation arrangement, the ratio of expenses to average net assets of Class I shares did not exceed 1.00%. This expense limitation arrangement cannot be terminated prior to December 31, 2015 without the Board of Trustees’ consent. The manager currently intends to voluntarily waive fees and/or reimburse expenses so that total annual operating expenses do not exceed 0.90%. This arrangement is expected to continue until December 31, 2015 but may be terminated at any time by the manager. These expense limitation arrangements do not include interest, brokerage commissions, dividend expense on short sales, taxes, extraordinary expenses and acquired fund fees and expenses. |
| 9 | Reflects fee waivers and/or expense reimbursements. |
| 10 | As a result of a contractual expense limitation, until April 30, 2010, the ratio of expenses, other than interest, brokerage commissions, taxes and extraordinary expenses, to average net assets of Class I shares did not exceed 0.95%. |
See Notes to Financial Statements.
| | |
| 30 | | Legg Mason Batterymarch U.S. Small Capitalization Equity Portfolio 2013 Annual Report |
| | | | | | | | |
For a share of each class of beneficial interest outstanding throughout each year ended December 31,
unless otherwise noted: | |
| Class IS Shares1 | | 2013 | | | 20122,3 | |
| | |
| Net asset value, beginning of year | | | $10.88 | | | | $10.67 | |
| | |
| Income from operations: | | | | | | | | |
Net investment income | | | 0.05 | | | | 0.13 | |
Net realized and unrealized gain | | | 4.06 | | | | 0.21 | |
Total income from operations | | | 4.11 | | | | 0.34 | |
| | |
| Less distributions from: | | | | | | | | |
Net investment income | | | (0.10) | | | | (0.13) | |
Net realized gains | | | (1.16) | | | | — | |
Total distributions | | | (1.26) | | | | (0.13) | |
| | |
| Net asset value, end of year | | | $13.73 | | | | $10.88 | |
Total return4 | | | 38.46 | % | | | 3.22 | % |
| | |
| Net assets, end of year (000s) | | | $768,829 | | | | $549,249 | |
| | |
| Ratios to average net assets: | | | | | | | | |
Gross expenses | | | 0.77 | % | | | 0.79 | %5 |
Net expenses6,7,8 | | | 0.75 | | | | 0.74 | 5 |
Net investment income | | | 0.41 | | | | 1.58 | 5 |
| | |
| Portfolio turnover rate | | | 85 | % | | | 57 | % |
| 1 | Per share amounts have been calculated using the average shares method. |
| 2 | Represents a share of capital stock outstanding prior to April 30, 2012. |
| 3 | For the period March 23, 2012 (commencement of operations) to December 31, 2012. |
| 4 | Performance figures may reflect compensating balance arrangements, fee waivers and/or expense reimbursements. In the absence of compensating balance arrangements, fee waivers and/or expense reimbursements, the total return would have been lower. Past performance is no guarantee of future results. Total returns for periods of less than one year are not annualized. |
| 6 | The impact of compensating balance arrangements, if any, was less than 0.01%. |
| 7 | As a result of an expense limitation arrangement, the ratio of expenses to average net assets of Class IS shares did not exceed 0.75%. In addition, total annual fund operating expenses for Class IS shares will not exceed total annual fund operating expenses for Class I shares. This expense limitation arrangement cannot be terminated prior to December 31, 2015 without the Board of Trustees’ consent. This expense limitation arrangement does not include interest, brokerage commissions, dividend expense on short sales, taxes, extraordinary expenses and acquired fund fees and expenses. |
| 8 | Reflects fee waivers and/or expense reimbursements. |
See Notes to Financial Statements.
| | |
| Legg Mason Batterymarch U.S. Small Capitalization Equity Portfolio 2013 Annual Report | | 31 |
Notes to financial statements
1. Organization and significant accounting policies
Legg Mason Batterymarch U.S. Small Capitalization Equity Portfolio (the “Fund”) is a separate diversified investment series of Legg Mason Global Asset Management Trust (the “Trust”). The Trust, a Maryland statutory trust, is registered under the Investment Company Act of 1940, as amended (the “1940 Act”), as an open-end management investment company. On April 30, 2012, the Fund was reorganized as a new series of the Trust. Prior to April 30, 2012, the Fund was organized as a series of Legg Mason Charles Street Trust, Inc., a Maryland corporation.
The following are significant accounting policies consistently followed by the Fund and are in conformity with U.S. generally accepted accounting principles (“GAAP”). Estimates and assumptions are required to be made regarding assets, liabilities and changes in net assets resulting from operations when financial statements are prepared. Changes in the economic environment, financial markets and any other parameters used in determining these estimates could cause actual results to differ. Subsequent events have been evaluated through the date the financial statements were issued.
(a) Investment valuation. Equity securities for which market quotations are available are valued at the last reported sales price or official closing price on the primary market or exchange on which they trade. The valuations for fixed income securities (which may include, but are not limited to, corporate, government, municipal, mortgage-backed, collateralized mortgage obligations and asset-backed securities) and certain derivative instruments are typically the prices supplied by independent third party pricing services, which may use market prices or broker/dealer quotations or a variety of valuation techniques and methodologies. The independent third party pricing services use inputs that are observable such as issuer details, interest rates, yield curves, prepayment speeds, credit risks/spreads, default rates and quoted prices for similar securities. Short-term fixed income securities that will mature in 60 days or less are valued at amortized cost, unless it is determined that using this method would not reflect an investment’s fair value. If independent third party pricing services are unable to supply prices for a portfolio investment, or if the prices supplied are deemed by the manager to be unreliable, the market price may be determined by the manager using quotations from one or more broker/dealers or at the transaction price if the security has recently been purchased and no value has yet been obtained from a pricing service or pricing broker. When reliable prices are not readily available, such as when the value of a security has been significantly affected by events after the close of the exchange or market on which the security is principally traded, but before the Fund calculates its net asset value, the Fund values these securities as determined in accordance with procedures approved by the Fund’s Board of Trustees.
The Board of Trustees is responsible for the valuation process and has delegated the supervision of the daily valuation process to the Legg Mason North American Fund Valuation Committee (the “Valuation Committee”). The Valuation Committee, pursuant to the policies adopted by the Board of Trustees, is responsible for making fair value determinations, evaluating the effectiveness of the Fund’s pricing policies, and reporting to the Board of
| | |
| 32 | | Legg Mason Batterymarch U.S. Small Capitalization Equity Portfolio 2013 Annual Report |
Trustees. When determining the reliability of third party pricing information for investments owned by the Fund, the Valuation Committee, among other things, conducts due diligence reviews of pricing vendors, monitors the daily change in prices and reviews transactions among market participants.
The Valuation Committee will consider pricing methodologies it deems relevant and appropriate when making fair value determinations. Examples of possible methodologies include, but are not limited to, multiple of earnings; discount from market of a similar freely traded security; discounted cash-flow analysis; book value or a multiple thereof; risk premium/yield analysis; yield to maturity; and/or fundamental investment analysis. The Valuation Committee will also consider factors it deems relevant and appropriate in light of the facts and circumstances. Examples of possible factors include, but are not limited to, the type of security; the issuer’s financial statements; the purchase price of the security; the discount from market value of unrestricted securities of the same class at the time of purchase; analysts’ research and observations from financial institutions; information regarding any transactions or offers with respect to the security; the existence of merger proposals or tender offers affecting the security; the price and extent of public trading in similar securities of the issuer or comparable companies; and the existence of a shelf registration for restricted securities.
For each portfolio security that has been fair valued pursuant to the policies adopted by the Board of Trustees, the fair value price is compared against the last available and next available market quotations. The Valuation Committee reviews the results of such back testing monthly and fair valuation occurrences are reported to the Board of Trustees quarterly.
The Fund uses valuation techniques to measure fair value that are consistent with the market approach and/or income approach, depending on the type of security and the particular circumstance. The market approach uses prices and other relevant information generated by market transactions involving identical or comparable securities. The income approach uses valuation techniques to discount estimated future cash flows to present value.
GAAP establishes a disclosure hierarchy that categorizes the inputs to valuation techniques used to value assets and liabilities at measurement date. These inputs are summarized in the three broad levels listed below:
| Ÿ | | Level 1 — quoted prices in active markets for identical investments |
| Ÿ | | Level 2 — other significant observable inputs (including quoted prices for similar investments, interest rates, prepayment speeds, credit risk, etc.) |
| Ÿ | | Level 3 — significant unobservable inputs (including the Fund’s own assumptions in determining the fair value of investments) |
The inputs or methodologies used to value securities are not necessarily an indication of the risk associated with investing in those securities.
| | |
| Legg Mason Batterymarch U.S. Small Capitalization Equity Portfolio 2013 Annual Report | | 33 |
Notes to financial statements (cont’d)
The following is a summary of the inputs used in valuing the Fund’s assets carried at fair value:
| | | | | | | | | | | | | | | | |
| ASSETS | |
| Description | | Quoted Prices
(Level 1) | | | Other Significant
Observable Inputs
(Level 2) | | | Significant
Unobservable
Inputs
(Level 3) | | | Total | |
| Long-term investments†: | | | | | | | | | | | | | | | | |
Common stocks | | $ | 765,803,105 | | | | — | | | | — | | | $ | 765,803,105 | |
Investment in Underlying Funds | | | 27,924,853 | | | | — | | | | — | | | | 27,924,853 | |
| Total long-term investments | | $ | 793,727,958 | | | | — | | | | — | | | $ | 793,727,958 | |
| Short-term investments† | | | — | | | $ | 13,462,000 | | | | — | | | | 13,462,000 | |
| Total investments | | $ | 793,727,958 | | | $ | 13,462,000 | | | | — | | | $ | 807,189,958 | |
| † | See Schedule of Investments for additional detailed categorizations. |
(b) Repurchase agreements. The Fund may enter into repurchase agreements with institutions that its investment adviser has determined are creditworthy. Each repurchase agreement is recorded at cost. Under the terms of a typical repurchase agreement, the Fund acquires a debt security subject to an obligation of the seller to repurchase, and of the Fund to resell, the security at an agreed-upon price and time, thereby determining the yield during the Fund’s holding period. When entering into repurchase agreements, it is the Fund’s policy that its custodian or a third party custodian, acting on the Fund’s behalf, take possession of the underlying collateral securities, the market value of which, at all times, at least equals the principal amount of the repurchase transaction, including accrued interest. To the extent that any repurchase transaction maturity exceeds one business day, the value of the collateral is marked-to-market and measured against the value of the agreement in an effort to ensure the adequacy of the collateral. If the counterparty defaults, the Fund generally has the right to use the collateral to satisfy the terms of the repurchase transaction. However, if the market value of the collateral declines during the period in which the Fund seeks to assert its rights or if bankruptcy proceedings are commenced with respect to the seller of the security, realization of the collateral by the Fund may be delayed or limited.
(c) Security transactions and investment income. Security transactions are accounted for on a trade date basis. Interest income, adjusted for amortization of premium and accretion of discount, is recorded on the accrual basis. Dividend income is recorded on the ex-dividend date. Foreign dividend income is recorded on the ex-dividend date or as soon as practicable after the Fund determines the existence of a dividend declaration after exercising reasonable due diligence. The cost of investments sold is determined by use of the specific identification method. To the extent any issuer defaults or a credit event occurs that impacts the issuer, the Fund may halt any additional interest income accruals and consider the realizability of interest accrued up to the date of default or credit event.
(d) Distributions to shareholders. Distributions from net investment income and distributions of net realized gains, if any, are declared at least annually. Distributions to
| | |
| 34 | | Legg Mason Batterymarch U.S. Small Capitalization Equity Portfolio 2013 Annual Report |
shareholders of the Fund are recorded on the ex-dividend date and are determined in accordance with income tax regulations, which may differ from GAAP.
(e) REIT distributions. The character of distributions received from Real Estate Investment Trusts (‘‘REITs’’) held by the Fund is generally comprised of net investment income, capital gains, and return of capital. It is the policy of the Fund to estimate the character of distributions received from underlying REITs based on historical data provided by the REITs. After each calendar year end, REITs report the actual tax character of these distributions. Differences between the estimated and actual amounts reported by the REITs are reflected in the Fund’s records in the year in which they are reported by the REITs by adjusting related investment cost basis, capital gains and income, as necessary.
(f) Compensating balance arrangements. The Fund has an arrangement with its custodian bank whereby a portion of the custodian’s fees is paid indirectly by credits earned on the Fund’s cash on deposit with the bank.
(g) Share class accounting. Investment income, common expenses and realized/unrealized gains (losses) on investments are allocated to the various classes of the Fund on the basis of daily net assets of each class. Fees relating to a specific class are charged directly to that share class.
(h) Federal and other taxes. It is the Fund’s policy to comply with the federal income and excise tax requirements of the Internal Revenue Code of 1986 (the “Code”), as amended, applicable to regulated investment companies. Accordingly, the Fund intends to distribute its taxable income and net realized gains, if any, to shareholders in accordance with timing requirements imposed by the Code. Therefore, no federal or state income tax provision is required in the Fund’s financial statements.
Management has analyzed the Fund’s tax positions taken on income tax returns for all open tax years and has concluded that as of December 31, 2013, no provision for income tax is required in the Fund’s financial statements. The Fund’s federal and state income and federal excise tax returns for tax years for which the applicable statutes of limitations have not expired are subject to examination by the Internal Revenue Service and state departments of revenue.
Under the applicable foreign tax laws, a withholding tax may be imposed on interest, dividends and capital gains at various rates.
(i) Reclassification. GAAP requires that certain components of net assets be reclassified to reflect permanent differences between financial and tax reporting. These reclassifications have no effect on net assets or net asset values per share. During the current year, the following reclassifications have been made:
| | | | | | | | |
| | | Overdistributed Net
Investment Income | | | Accumulated Net
Realized Gain | |
| (a) | | $ | 1,326,554 | | | $ | (1,326,554) | |
| (a) | Reclassifications are primarily due to book/tax differences in the treatment of distributions from real estate investment trusts, book/tax differences in treatment of distributions and book/tax differences in the treatment of passive foreign investment companies. |
| | |
| Legg Mason Batterymarch U.S. Small Capitalization Equity Portfolio 2013 Annual Report | | 35 |
Notes to financial statements (cont’d)
2. Investment advisory and management agreement and other transactions with affiliates
Legg Mason Partners Fund Advisor, LLC (“LMPFA”) is the Fund’s investment manager and Batterymarch Financial Management, Inc. (“Batterymarch”) is the Fund’s investment adviser. Effective February 2013, Western Asset Management Company (“Western Asset”) manages the Fund’s cash and short term instruments. LMPFA, Batterymarch and Western Asset are wholly-owned subsidiaries of Legg Mason, Inc. (“Legg Mason”).
Under the investment management agreement, the Fund pays an investment management fee, calculated daily and paid monthly, at an annual rate of 0.70% of the Fund’s average daily net assets.
LMPFA provides administrative and certain oversight services to the Fund. LMPFA delegates to the investment adviser the day-to-day portfolio management of the Fund, except for the management of cash and short-term instruments, which, effective February 2013, is provided by Western Asset. To the extent LMPFA receives a management fee after taking into accounts its contractual obligation to limit expenses as discussed below, LMPFA will pay Batterymarch and Western Asset the entire management fee it received from the Fund.
As a result of expense limitation arrangements between the Fund and LMPFA, the ratio of expenses other than interest, brokerage commissions, dividend expense on short sales, taxes, extraordinary expenses and acquired fund fees and expenses, to average net assets of Class A, Class A2, Class C, Class FI, Class I and Class IS shares did not exceed 1.30%, 1.50%, 2.05%, 1.30%, 1.00% and 0.75%, respectively. In addition, total annual fund operating expenses for Class IS shares will not exceed total annual fund operating expenses for Class I shares. These expense limitation arrangements cannot be terminated prior to December 31, 2015 without the Board of Trustees’ consent.
The manager currently intends to voluntarily waive fees and/or reimburse operating expenses (other than interest, brokerage commissions, dividend expense on short sales, taxes, extraordinary expenses and acquired fund fees and expenses) so that total annual operating expenses are not expected to exceed 1.20%, 1.40%, 1.95%, 1.20% and 0.90% for Class A, Class A2, Class C, Class FI and Class I shares, respectively. These arrangements are expected to continue until December 31, 2015 but may be terminated at any time by the manager.
During the year ended December 31, 2013, fees waived and/or expenses reimbursed amounted to $154,345.
The investment manager is permitted to recapture amounts waived or reimbursed to a class within three years after the fiscal year in which the investment manager earned the fee or incurred the expense if the class’ total annual operating expenses have fallen to a level below the expense limitation (“expense cap”) in effect at the time the fees were earned or the expenses incurred. In no case will the investment manager recapture any amount that would result, on any particular business day of the Fund, in the class’ total annual operating expenses exceeding the expense cap or any other lower limit then in effect.
| | |
| 36 | | Legg Mason Batterymarch U.S. Small Capitalization Equity Portfolio 2013 Annual Report |
Pursuant to these arrangements, at December 31, 2013, the Fund had remaining fee waivers and/or expense reimbursements subject to recapture by LMPFA and respective dates of expiration as follows:
| | | | | | | | | | | | | | | | | | | | | | | | |
| | | Class A | | | Class A2 | | | Class C | | | Class FI | | | Class I | | | Class IS | |
| Expires December 31, 2014 | | | — | | | | — | | | $ | 1,840 | | | $ | 570 | | | | — | | | | — | |
| Expires December 31, 2015 | | $ | 3,514 | | | | — | | | | 4,689 | | | | 2,618 | | | | — | | | $ | 191,112 | |
| Expires December 31, 2016 | | | 5,775 | | | $ | 5,659 | | | | 6,183 | | | | 1,826 | | | $ | 1,136 | | | | 133,766 | |
| Total fee waivers/expense reimbursementssubject to recapture | | $ | 9,289 | | | $ | 5,659 | | | $ | 12,712 | | | $ | 5,014 | | | $ | 1,136 | | | $ | 324,878 | |
For the year ended December 31, 2013, LMPFA recaptured $3,632, $47, $56, $5 and $135 for Class A, Class A2, Class C, Class FI and Class I shares, respectively.
Legg Mason Investor Services, LLC (“LMIS”), a wholly-owned broker-dealer subsidiary of Legg Mason, serves as the Fund’s sole and exclusive distributor.
There is a maximum initial sales charge of 5.75% for Class A shares and Class A2 shares. There is a contingent deferred sales charge (“CDSC”) of 1.00% on Class C shares, which applies if redemption occurs within 12 months from purchase payment. In certain cases, Class A and Class A2 shares have a 1.00% CDSC, which applies if redemption occurs within 18 months from purchase payment. This CDSC only applies to those purchases of Class A and Class A2 shares, which, when combined with current holdings of other shares of funds sold by LMIS, equal or exceed $1,000,000 in the aggregate. These purchases do not incur an initial sales charge.
For the year ended December 31, 2013, LMIS and its affiliates retained sales charges of $1,398 on sales of the Fund’s Class A shares. In addition, for the year ended December 31, 2013, CDSCs paid to LMIS and its affiliates were:
| | | | | | | | | | | | |
| | | Class A | | | Class A2 | | | Class C | |
| CDSCs | | $ | 5 | | | $ | 12 | | | $ | 43 | |
Under a Deferred Compensation Plan (the “Plan”), Trustees may elect to defer receipt of all or a specified portion of their compensation. A participating Trustee may select one or more funds managed by affiliates of Legg Mason in which his or her deferred trustee’s fees will be deemed to be invested. Deferred amounts remain in the Fund until distributed in accordance with the Plan.
All officers and two Trustees of the Trust are employees of Legg Mason or its affiliates and do not receive compensation from the Trust.
| | |
| Legg Mason Batterymarch U.S. Small Capitalization Equity Portfolio 2013 Annual Report | | 37 |
Notes to financial statements (cont’d)
3. Investments
During the year ended December 31, 2013, the aggregate cost of purchases and proceeds from sales of investments (excluding short-term investments) were as follows:
| | | | |
| Purchases | | $ | 568,314,513 | |
| Sales | | | 568,195,729 | |
At December 31, 2013, the aggregate gross unrealized appreciation and depreciation of investments for federal income tax purposes were as follows:
| | | | |
| Gross unrealized appreciation | | $ | 190,548,295 | |
| Gross unrealized depreciation | | | (15,656,896) | |
| Net unrealized appreciation | | $ | 174,891,399 | |
4. Derivative instruments and hedging activities
GAAP requires enhanced disclosure about an entity’s derivative and hedging activities.
During the year ended December 31, 2013, the Fund did not invest in any derivative instruments.
5. Class specific expenses, waivers and/or expense reimbursements
The Fund has adopted a Rule 12b-1 distribution plan and under that plan the Fund pays a service fee with respect to its Class A, Class A2, Class C and Class FI shares calculated at the annual rate of 0.25% of the average daily net assets of each respective class. The Fund also pays a distribution fee with respect to its Class C shares calculated at the annual rate of 0.75% of the average daily net assets of the class. Service and distribution fees are accrued daily and paid monthly.
For the year ended December 31, 2013, class specific expenses were as follows:
| | | | | | | | |
| | | Service and/or
Distribution Fees | | | Transfer Agent
Fees | |
| Class A | | $ | 42,783 | | | $ | 33,842 | |
| Class A2 | | | 3,851 | | | | 10,889 | |
| Class C | | | 55,769 | | | | 16,457 | |
| Class FI | | | 3,310 | | | | 4,302 | |
| Class I | | | — | | | | 1,064 | |
| Class IS | | | — | | | | 30,537 | |
| Total | | $ | 105,713 | | | $ | 97,091 | |
| | |
| 38 | | Legg Mason Batterymarch U.S. Small Capitalization Equity Portfolio 2013 Annual Report |
For the year ended December 31, 2013, waivers and/or expense reimbursements by class were as follows:
| | | | |
| | | Waivers/
Expense
Reimbursements | |
| Class A | | $ | 5,775 | |
| Class A2 | | | 5,659 | |
| Class C | | | 6,183 | |
| Class FI | | | 1,826 | |
| Class I | | | 1,136 | |
| Class IS | | | 133,766 | |
| Total | | $ | 154,345 | |
6. Distributions to shareholders by class
| | | | | | | | |
| | | Year Ended
December 31, 2013 | | | Year Ended
December 31, 2012 | |
| Net Investment Income: | | | | | | | | |
| Class A | | $ | 61,754 | | | $ | 97,092 | |
| Class A2 | | | 14,788 | | | | 3,653 | † |
| Class C | | | 6,862 | | | | — | |
| Class FI | | | 12,691 | | | | 4,066 | |
| Class I | | | 63,292 | | | | 27,639 | |
| Class IS | | | 5,640,643 | | | | 6,579,456 | ‡ |
| Total | | $ | 5,800,030 | | | $ | 6,711,906 | |
| | |
| Net Realized Gains: | | | | | | | | |
| Class A | | $ | 1,389,786 | | | | — | |
| Class A2 | | | 260,384 | | | | — | |
| Class C | | | 496,407 | | | | — | |
| Class FI | | | 208,313 | | | | — | |
| Class I | | | 693,289 | | | | — | |
| Class IS | | | 58,992,240 | | | | — | |
| Total | | $ | 62,040,419 | | | | — | |
| † | For the period October 31, 2012 (commencement of operations) to December 31, 2012. |
| ‡ | For the period March 23, 2012 (commencement of operations) to December 31, 2012. |
7. Shares of beneficial interest
At December 31, 2013, the Trust had an unlimited number of shares of beneficial interest authorized with a par value of $0.00001 per share. The Fund has the ability to issue multiple classes of shares. Each class of shares represents an identical interest and has the same rights, except that each class bears certain direct expenses, including those specifically related to the distribution of its shares. On April 30, 2012, the Fund was reorganized as a new series of the Trust.
| | |
| Legg Mason Batterymarch U.S. Small Capitalization Equity Portfolio 2013 Annual Report | | 39 |
Notes to financial statements (cont’d)
Prior to April 30, 2012, the Fund was a series of a Maryland corporation and had 500 million shares authorized at $0.001 par value for each of the Class A, Class C, Class FI, Class I and Class IS shares of the Fund.
Transactions in shares of each class were as follows:
| | | | | | | | | | | | | | | | |
| | | Year Ended
December 31, 2013 | | | Year Ended
December 31, 2012 | |
| | | Shares | | | Amount | | | Shares | | | Amount | |
| Class A | | | | | | | | | | | | | | | | |
| Shares sold | | | 81,544 | | | $ | 1,045,700 | | | | 198,338 | | | $ | 1,953,814 | |
| Shares issued on reinvestment | | | 107,237 | | | | 1,401,430 | | | | 8,780 | | | | 94,818 | |
| Shares repurchased | | | (435,650) | | | | (5,514,616) | | | | (573,173) | | | | (5,908,139) | |
| Net decrease | | | (246,869) | | | $ | (3,067,486) | | | | (366,055) | | | $ | (3,859,507) | |
| | | | |
| Class A2 | | | | | | | | | | | | | | | | |
| Shares sold | | | 215,145 | | | $ | 2,818,457 | | | | 31,998 | † | | $ | 338,385 | † |
| Shares issued on reinvestment | | | 21,073 | | | | 275,172 | | | | 339 | † | | | 3,653 | † |
| Shares repurchased | | | (12,368) | | | | (160,513) | | | | (52) | † | | | (573) | † |
| Net increase | | | 223,850 | | | $ | 2,933,116 | | | | 32,285 | † | | $ | 341,465 | † |
| | | | |
| Class C | | | | | | | | | | | | | | | | |
| Shares sold | | | 17,906 | | | $ | 225,079 | | | | 14,575 | | | $ | 146,552 | |
| Shares issued on reinvestment | | | 39,640 | | | | 500,397 | | | | — | | | | — | |
| Shares repurchased | | | (70,178) | | | | (862,724) | | | | (113,237) | | | | (1,169,817) | |
| Net decrease | | | (12,632) | | | $ | (137,248) | | | | (98,662) | | | $ | (1,023,265) | |
| | | | |
| Class FI | | | | | | | | | | | | | | | | |
| Shares sold | | | 105,381 | | | $ | 1,453,503 | | | | 7,861 | | | $ | 79,184 | |
| Shares issued on reinvestment | | | 17,335 | | | | 221,004 | | | | 386 | | | | 4,066 | |
| Shares repurchased | | | (12,381) | | | | (157,106) | | | | (4,269) | | | | (41,086) | |
| Net increase | | | 110,335 | | | $ | 1,517,401 | | | | 3,978 | | | $ | 42,164 | |
| | | | |
| Class I | | | | | | | | | | | | | | | | |
| Shares sold | | | 129,594 | | | $ | 1,739,953 | | | | 635,668 | | | $ | 6,624,551 | |
| Shares issued on reinvestment | | | 57,152 | | | | 756,580 | | | | 2,545 | | | | 27,639 | |
| Shares repurchased | | | (387,934) | | | | (4,537,379) | | | | (23,075,572) | | | | (242,426,296) | |
| Net decrease | | | (201,188) | | | $ | (2,040,846) | | | | (22,437,359) | | | $ | (235,774,106) | |
| | | | |
| Class IS | | | | | | | | | | | | | | | | |
| Shares sold | | | 12,229,866 | | | $ | 155,892,588 | | | | 60,549,383 | ‡ | | $ | 641,036,812 | ‡ |
| Shares issued on reinvestment | | | 2,295,594 | | | | 30,019,488 | | | | 278,053 | ‡ | | | 2,963,384 | ‡ |
| Shares repurchased | | | (9,004,986) | | | | (112,263,111) | | | | (10,358,348) | ‡ | | | (107,027,100) | ‡ |
| Net increase | | | 5,520,474 | | | $ | 73,648,965 | | | | 50,469,088 | ‡ | | $ | 536,973,096 | ‡ |
| † | For the period October 31, 2012 (commencement of operations) to December 31, 2012. |
| ‡ | For the period March 23, 2012 (commencement of operations) to December 31, 2012. During the period Class I shareholders exchanged $234,958,577 into Class IS. |
| | |
| 40 | | Legg Mason Batterymarch U.S. Small Capitalization Equity Portfolio 2013 Annual Report |
8. Line of credit
The Fund, along with certain other Legg Mason Funds, participated in a $200 million line of credit (“Credit Agreement”) to be used for temporary or emergency purposes. This 364-day revolving Credit Agreement matured on February 28, 2013. Pursuant to the Credit Agreement, each participating fund was liable only for principal and interest payments related to borrowings made by that fund. Borrowings under the Credit Agreement bore interest at a rate equal to the prevailing LIBOR rate plus the LIBOR rate margin. The Fund did not utilize the line of credit during the period ended February 28, 2013. The Fund did not renew the Credit Agreement.
9. Income tax information and distributions to shareholders
The tax character of distributions paid during the fiscal years ended December 31, were as follows:
| | | | | | | | |
| | | 2013 | | | 2012 | |
| Distributions Paid From: | | | | | | | | |
| Ordinary income | | $ | 33,231,823 | | | $ | 6,711,906 | |
| Net long-term capital gains | | | 34,608,626 | | | | — | |
| Total taxable distributions | | $ | 67,840,449 | | | $ | 6,711,906 | |
As of December 31, 2013, the components of accumulated earnings on a tax basis were as follows:
| | | | |
| Undistributed ordinary income — net | | $ | 3,367,830 | |
| Undistributed long-term capital gains — net | | | 17,106,129 | |
| Total undistributed earnings | | $ | 20,473,959 | |
| Capital loss carryforward** | | | (2,936,778) | |
| Other book/tax temporary differences (a) | | | 42,537 | |
| Unrealized appreciation (depreciation) (b) | | | 174,891,399 | |
| Total accumulated earnings (losses) — net | | $ | 192,471,117 | |
| ** | During the taxable year ended December 31, 2013, the Fund utilized $978,926 of its capital loss carryforward available from prior years. As of December 31, 2013, the Fund had the following net capital loss carryforwards remaining: |
| | | | |
| Year of Expiration | | Amount | |
| 12/31/2016 | | $ | (2,936,778 | ) |
This amount will be available to offset any future taxable capital gains.
In addition, the Fund’s capital loss carryforward is subject to an annual limitation of $978,926 due to a prior year reorganization.
| (a) | Other book/tax temporary differences are attributable primarily to the book/tax differences in the treatment of distributions from real estate investment trusts and book/tax differences in the timing of the deductibility of various expenses. |
| (b) | The difference between book-basis and tax-basis unrealized appreciation (depreciation) is attributable primarily to the tax deferral of losses on wash sales and the realization for tax purposes of unrealized gains on investments in passive foreign investment companies. |
10. Recent accounting pronouncement
The Fund has adopted the disclosure provisions of Financial Accounting Standards Board (“FASB”) Accounting Standards Update 2011-11 (“ASU 2011-11”), Balance Sheet (Topic 210) – Disclosures about Offsetting Assets and Liabilities along with the related scope clarification
| | |
| Legg Mason Batterymarch U.S. Small Capitalization Equity Portfolio 2013 Annual Report | | 41 |
Notes to financial statements (cont’d)
provisions of FASB Accounting Standards Update 2013-01 (“ASU 2013-01”) entitled Balance Sheet (Topic 210) – Clarifying the Scope of Disclosures about Offsetting Assets and Liabilities. ASU 2011-11 is intended to enhance disclosures on the offsetting of financial assets and liabilities by requiring entities to disclose both gross and net information about financial instruments and transactions that are either offset in the statement of assets and liabilities or subject to a master netting agreement or similar arrangement. ASU 2013-01 limits the scope of ASU 2011-11’s disclosure requirements on offsetting to financial assets and financial liabilities related to derivatives, repurchase and reverse repurchase agreements, and securities lending and securities borrowing transactions.
| | |
| 42 | | Legg Mason Batterymarch U.S. Small Capitalization Equity Portfolio 2013 Annual Report |
Report of independent registered public accounting firm
To the Board of Trustees of Legg Mason Global Asset Management Trust and to the Shareholders of Legg Mason Batterymarch U.S. Small Capitalization Equity Portfolio:
In our opinion, the accompanying statement of assets and liabilities, including the schedule of investments, and the related statements of operations and of changes in net assets and the financial highlights present fairly, in all material respects, the financial position of Legg Mason Batterymarch U.S. Small Capitalization Equity Portfolio (one of the funds comprising Legg Mason Global Asset Management Trust, the “Fund”) at December 31, 2013, the results of its operations, the changes in its net assets and the financial highlights for each of the periods presented, in conformity with accounting principles generally accepted in the United States of America. These financial statements and financial highlights (hereafter referred to as “financial statements”) are the responsibility of the Fund’s management; our responsibility is to express an opinion on these financial statements based on our audits. We conducted our audits of these financial statements in accordance with the standards of the Public Company Accounting Oversight Board (United States). Those standards require that we plan and perform the audit to obtain reasonable assurance about whether the financial statements are free of material misstatement. An audit includes examining, on a test basis, evidence supporting the amounts and disclosures in the financial statements, assessing the accounting principles used and significant estimates made by management, and evaluating the overall financial statement presentation. We believe that our audits, which included confirmation of securities at December 31, 2013 by correspondence with the custodian and brokers, provide a reasonable basis for our opinion.
PricewaterhouseCoopers LLP
Baltimore, Maryland
February 19, 2014
| | |
| Legg Mason Batterymarch U.S. Small Capitalization Equity Portfolio 2013 Annual Report | | 43 |
Board approval of investment management and advisory agreements (unaudited)
At its November 2013 meeting, the Fund’s Board of Trustees (the “Board”) approved the continuation of the investment management agreement (the “Management Agreement”) with Legg Mason Partners Fund Advisor, LLC (the “Manager”), the investment advisory agreement (the “Advisory Agreement”) with Batterymarch Financial Management, Inc. (the “Adviser”) and the sub-advisory agreement (the “Sub-Advisory Agreement”) pursuant to which Western Asset Management Company (“Western Asset”) provides day-to-day management of the Fund’s cash and short-term investments. (The Management, Advisory and Sub-Advisory Agreements are collectively referred to as the “Agreements.”) The trustees who are not “interested persons” of the Fund (as defined in the Investment Company Act of 1940, as amended (the “1940 Act”)) (the “Independent Trustees”), met on October 10, 2013, with the assistance of their independent legal counsel and their contract review consultant, to review and evaluate the materials provided by the Manager and the Adviser to assist the Board, and in particular the Independent Trustees, in considering renewal of the Management and Advisory Agreements, respectively. At such October meeting the Independent Trustees received a presentation from senior Fund management and reviewed the information provided, as well as a memorandum from their independent legal counsel and materials from the contract review consultant. The Board, including the Independent Trustees, at its November 2013 meeting, reviewed and evaluated the materials provided by Western Asset to assist the Board, and in particular the Independent Trustees, in considering renewal of the Sub-Advisory Agreement. The Independent Trustees further discussed renewal of the Management, Advisory and Sub-Advisory Agreements in an executive session with independent legal counsel on November 8, 2013.
In voting to approve continuance of the Agreements, the Board, including the Independent Trustees, considered whether continuance of the Agreements would be in the best interests of the Fund and its shareholders. No single factor or item of information reviewed by the Board was identified as the principal factor in determining whether to approve the Agreements. Based upon its evaluation of all material factors, including those described below, the Board concluded that the terms of each Agreement are reasonable and fair and that it was in the best interest of the Fund and its shareholders to approve continuance of the Agreements.
The Board received and considered information regarding the nature, extent and quality of services provided to the Fund by the Manager, the Adviser and Western Asset, under the Management, Advisory and Sub-Advisory Agreements, respectively. The Board also considered the Manager’s supervisory activities over the Adviser and Western Asset. In addition, the Board received and considered other information regarding the administrative and other services rendered to the Fund and its shareholders by the Manager and its affiliates. The Board noted information received at regular meetings throughout the year related to the services rendered by the Manager in its management of the Fund’s affairs, the Manager’s role in coordinating the activities of the Adviser, Western Asset and the Fund’s other service providers and the services rendered by the Adviser and Western Asset. The Board’s evaluation of the services provided by the Manager, the Adviser and Western Asset took
| | |
| 44 | | Legg Mason Batterymarch U.S. Small Capitalization Equity Portfolio |
into account the Board’s knowledge and familiarity gained as Board members of funds in the Legg Mason fund complex, including the scope and quality of the investment management and other capabilities of the Manager, the Adviser and Western Asset and the quality of the Manager’s administrative and other services.
The Board reviewed the qualifications, backgrounds and responsibilities of the senior personnel serving the Fund and the portfolio management team primarily responsible for the day-to-day portfolio management of the Fund. The Board also considered, based on its knowledge of the Manager and the Manager’s affiliates, the financial resources available through the Manager’s parent organization, Legg Mason, Inc.
The Board considered the division of responsibilities between the Manager and the Adviser and Western Asset and the oversight provided by the Manager. The Board also considered the Adviser’s brokerage policies and practices, the standards applied in seeking best execution, the policies regarding soft dollars, and the existence of quality controls applicable to brokerage allocation procedures.
The Board received and reviewed performance information for the Fund and for a group of funds (the “Performance Universe”) selected by Lipper, Inc. (“Lipper”), an independent provider of investment company data. The Board was provided with a description of the methodology Lipper used to determine the similarity of the Fund with the funds included in the Performance Universe. The Lipper data also included a comparison of the Fund’s performance to a Lipper benchmark. In addition, the Trustees noted that they also had received and discussed at periodic intervals information comparing the Fund’s performance to that of its benchmark and had met with the Fund’s portfolio managers at in-person meetings throughout the year.
The Board also received and reviewed supplemental performance benchmarking materials prepared by the Independent Trustees’ contract review consultant. Although the peer group and product category measures used by the contract review consultant were not the same as the Performance Universe used by Lipper, the Board noted that the results of the consultant’s measures were consistent with and confirmed the results of the Lipper data. The Board also reviewed other measures of performance and risk provided by the contract review consultant.
The Board considered the Fund’s performance for the one- and three-year periods ended June 30, 2013, placing the Fund’s Class A Shares in the fourth quintile for the one-year period and the second quintile for the three-year period. The Board considered the analysis provided by the Adviser of the reasons for the underperformance of the Fund during the one-year period. The Board noted that its evaluation of the factors of the nature, extent and quality of services and investment performance led it to conclude that it was in the best interest of the Fund to approve renewal of the Advisory Agreement.
The Board reviewed and considered the contractual management fee (the “Contractual Management Fee”) payable by the Fund to the Manager in light of the nature, extent and
| | |
| Legg Mason Batterymarch U.S. Small Capitalization Equity Portfolio | | 45 |
Board approval of investment management and advisory agreements (unaudited) (cont’d)
quality of the management and advisory services provided by the Manager, the Adviser and Western Asset, respectively. The Board noted that the Manager, and not the Fund, pays the fee to the Adviser and Western Asset. In addition, the Board reviewed and considered the actual management fee rate (after taking into account fees waived and expense reimbursements by the Manager which partially reduced the management fee paid to the Manager) (the “Actual Management Fee”).
The Board also reviewed information regarding the fees the Manager, the Adviser and Western Asset charged any of their U.S. clients investing primarily in an asset class similar to that of the Fund including, where applicable, separate accounts. The Manager reviewed with the Board the significant differences in the scope of services provided to the Fund and to such other clients, and that the Manager coordinates and oversees the provision of services to the Fund by other fund service providers, including the Adviser and Western Asset. The Board considered the fee comparisons in light of the scope of services required to manage these different types of accounts.
The Board received an analysis of complex-wide management fees provided by the Manager, which, among other things, set out the range of fees based on asset classes. In addition, the Manager provided and discussed with the Board a comparison with the fees of other registered investment companies managed in the same investment style. Management also discussed with the Board the Fund’s distribution arrangements, including how amounts received by the Fund’s distributors are expended.
Additionally, the Board received and considered information comparing the Fund’s Contractual Management Fee and Actual Management Fee and the Fund’s overall expense ratio with those of a group of funds selected by Lipper as comparable to the Fund and a broader universe of funds also selected by Lipper. The Board also received and reviewed supplemental expense benchmarking materials prepared by the Independent Trustees’ contract review consultant. Although the peer group and product category measures used by the contract review consultant were not the same as the Lipper expense group or expense universe, the Board noted that results of the consultant’s measures were consistent with and confirmed the results of the Lipper data. With respect to the Fund, the Board noted that Contractual and Actual Management Fees for the Class IS Shares were less than median (first quintile) and that actual total expenses for the Class IS Shares were lower than the Lipper expense group and expense universe medians.
The Board was provided an overview of the process followed in conducting the profitability study and received a report on the profitability of Legg Mason in providing services to the Fund, based on financial information and business data for the 12 months ended March 31, 2013, which corresponds to Legg Mason’s most recently completed fiscal year. The Board considered the profitability study along with the other materials previously provided to the Board and determined that the profitability was not excessive in light of the nature, extent and quality of the services provided to the Fund.
| | |
| 46 | | Legg Mason Batterymarch U.S. Small Capitalization Equity Portfolio |
The Board received and considered information regarding whether there have been economies of scale with respect to the management of the Fund as the Fund’s assets grow, whether the Fund has appropriately benefited from any economies of scale, and whether there is potential for realization of any further economies of scale. The Board noted that as a result of market conditions and net redemptions, the Fund complex had suffered a substantial decline in assets over its historic highs. Given the asset size of the Fund and the complex, the Board concluded that although there were no current breakpoints, any economies of scale currently being realized were appropriately being reflected in the Management Fee paid by the Fund.
The Board considered other benefits received by the Manager and its affiliates, as a result of the Manager’s relationship with the Fund, including the opportunity to offer additional products and services to Fund shareholders. The Board also considered the information provided by the Manager regarding intermediary arrangements.
In light of the structure of the fees, the costs of providing investment management and other services to the Fund, the Manager’s ongoing commitment to the Fund and the ancillary benefits received, the Board concluded that the Management Fees were reasonable.
After evaluation of all material factors, the Board concluded that the approval of each Agreement is in the best interest of the Fund.
| | |
| Legg Mason Batterymarch U.S. Small Capitalization Equity Portfolio | | 47 |
Additional information (unaudited)
Information about Trustees and Officers
The business and affairs of Legg Mason Batterymarch U.S. Small Capitalization Equity
Portfolio (the “Fund”) are conducted by management under the supervision and subject to the direction of its Board of Trustees. The business address of each Trustee is c/o Kenneth D. Fuller, Legg Mason, 100 International Drive, 11th Floor, Baltimore, Maryland 21202. Information pertaining to the Trustees and officers of the Fund is set forth below.
The Statement of Additional Information includes additional information about Trustees and is available, without charge, upon request by calling the Fund at 1-877-721-1926.
| | |
| Independent Trustees1 |
| Ruby P. Hearn |
| Year of birth | | 1940 |
| Position(s) with Trust | | Trustee |
| Term of office and length of time served2 | | Since 2009 |
| Principal occupation(s) during past five years | | Senior Vice President Emerita of The Robert Wood Johnson Foundation (non-profit) since 2001; Member of the Institute of Medicine since 1982; formerly: Trustee of the New York Academy of Medicine (2004 to 2012); Director of the Institute for Healthcare Improvement (2002 to 2012); Senior Vice President of The Robert Wood Johnson Foundation (1996 to 2001); Fellow of The Yale Corporation (1992 to 1998). |
| Number of funds in fund complex overseen by Trustee | | 18 |
| Other board memberships held by Trustee during past five years | | None |
|
| Arnold L. Lehman |
| Year of birth | | 1944 |
| Position(s) with Trust | | Lead Independent Trustee |
| Term of office and length of time served2 | | Since 2009 |
| Principal occupation(s) during past five years | | Director of the Brooklyn Museum since 1997; Trustee of American Federation of Arts since 1998. Formerly: Director of The Baltimore Museum of Art (1979 to 1997). |
| Number of funds in fund complex overseen by Trustee | | 18 |
| Other board memberships held by Trustee during past five years | | None |
|
| Robin J.W. Masters |
| Year of birth | | 1955 |
| Position(s) with Trust | | Trustee |
| Term of office and length of time served2 | | Since 2009 |
| Principal occupation(s) during past five years | | Retired; formerly: Chief Investment Officer of ACE Limited (insurance) (1986 to 2000). |
| Number of funds in fund complex overseen by Trustee | | 18 |
| Other board memberships held by Trustee during past five years | | Director of Cheyne Capital International Limited (investment advisory firm). Formerly, Director/Trustee of Legg Mason Institutional Funds plc, WAFixed Income Funds plc and Western Asset Debt Securities Fund plc. (2007 to 2011) |
| | |
| 48 | | Legg Mason Batterymarch U.S. Small Capitalization Equity Portfolio |
| | |
| Independent Trustees1 cont’d |
| Jill E. McGovern |
| Year of birth | | 1944 |
| Position(s) with Trust | | Trustee |
| Term of office and length of time served2 | | Since 2009 |
| Principal occupation(s) during past five years | | Senior Consultant, American Institute for Contemporary German Studies (AICGS) since 2007; formerly: Chief Executive Officer of The Marrow Foundation (non-profit) (1993 to 2007); Executive Director of the Baltimore International Festival (1991 to 1993); Senior Assistant to the President of The Johns Hopkins University (1986 to 1990). |
| Number of funds in fund complex overseen by Trustee | | 18 |
| Other board memberships held by Trustee during past five years | | Director of International Biomedical Research Alliance; Director of Lois Roth Endowment |
|
| Arthur S. Mehlman |
| Year of birth | | 1942 |
| Position(s) with Trust | | Trustee |
| Term of office and length of time served2 | | Since 2009 |
| Principal occupation(s) during past five years | | Retired. Director, The University of Maryland Foundation since 1992; Director, The League for People with Disabilities since 2003; formerly: Director, Municipal Mortgage & Equity LLC (2004 to 2011); Partner, KPMG LLP (international accounting firm) (1972 to 2002). |
| Number of funds in fund complex overseen by Trustee | | Director/Trustee of all Legg Mason Funds consisting of 18 portfolios; Director/Trustee of the Royce Family of Funds consisting of 34 portfolios. |
| Other board memberships held by Trustee during past five years | | Director of Municipal Mortgage & Equity, LLC. (2004 to 2011) |
|
| G. Peter O’Brien |
| Year of birth | | 1945 |
| Position(s) with Trust | | Trustee |
| Term of office and length of time served2 | | Since 2009 |
| Principal occupation(s) during past five years | | Retired. Trustee Emeritus of Colgate University; Board Member, Hill House, Inc. (residential home care); Board Member, Bridges School (pre- school); formerly: Managing Director, Equity Capital Markets Group of Merrill Lynch & Co. (1971-1999). |
| Number of funds in fund complex overseen by Trustee | | Director/Trustee of all Legg Mason funds consisting of 18 portfolios; Director/Trustee of the Royce Family of Funds consisting of 34 portfolios. |
| Other board memberships held by Trustee during past five years | | Director of Ticc Investment Capital Corp. |
| | |
| Legg Mason Batterymarch U.S. Small Capitalization Equity Portfolio | | 49 |
Additional information (unaudited) (cont’d)
Information about Trustees and Officers
| | |
| Independent Trustees1 cont’d |
| S. Ford Rowan |
| Year of birth | | 1943 |
| Position(s) with Trust | | Trustee |
| Term of office and length of time served2 | | Since 2009 |
| Principal occupation(s) during past five years | | Chairman, National Center for Critical Incident Analysis, National Defense University Foundation, since 2004; Consultant to University of Maryland University College, since 2013; Lecturer in Organizational Sciences, George Washington University, since 2000; formerly: Trustee, St. John’s College (2006 to 2012); Consultant, Rowan & Blewitt Inc. (management consulting) (1984 to 2007); Lecturer in Journalism, Northwestern University (1980 to 1993); Director, Santa Fe Institute (1999 to 2008). |
| Number of funds in fund complex overseen by Trustee | | 18 |
| Other board memberships held by Trustee during past five years | | None |
|
| Robert M. Tarola |
| Year of birth | | 1950 |
| Position(s) with Trust | | Trustee |
| Term of office and length of time served2 | | Since 2009 |
| Principal occupation(s) during past five years | | President of Right Advisory LLC (corporate finance and governance consulting) since 2008; Member, Investor Advisory Group of the Public Company Accounting Oversight Board since 2009; formerly Senior Vice President and Chief Financial Officer of The Howard University (2009 to 2013) (higher education and health care); Senior Vice President and Chief Financial Officer of W.R. Grace & Co. (specialty chemicals) (1999 to 2008) and MedStar Health, Inc. (healthcare) (1996 to 1999); Partner, Price Waterhouse, LLP (accounting and auditing) (1984 to 1996). |
| Number of funds in fund complex overseen by Trustee | | 18 |
| Other board memberships held by Trustee during past five years | | Director of TeleTech Holdings, Inc. (business process outsourcing); Director of American Kidney Fund (renal disease assistance) |
| | |
| Interested Trustees3 |
| Jennifer W. Murphy | | |
| Year of birth | | 1964 |
| Position(s) with Trust | | Trustee and Chair |
| Term of office and length of time served2 | | Since 2013 |
| Principal occupation(s) during past five years | | Executive Vice President and Chief Administrative Officer of Legg Mason, Inc. (since 2013); formerly: Chief Operations Officer of LMM LLC (1999 to 2013); President and CEO of Legg Mason Capital Management, LLC (“LMCM”) and Manager of LMCM and predecessors (1998 to 2013). |
| Number of funds in fund complex overseen by Trustee | | 18 |
| Other board memberships held by Trustee during past five years | | None |
| | |
| 50 | | Legg Mason Batterymarch U.S. Small Capitalization Equity Portfolio |
| | |
| Interested Trustees3 cont’d |
| Kenneth D. Fuller | | |
| Year of birth | | 1958 |
| Position(s) with Trust | | Trustee, President and Chief Executive Officer |
| Term of office1 and length of time served2 | | Since 2013 |
| Principal occupation(s) during past five years | | Managing Director of Legg Mason & Co., LLC (“Legg Mason & Co.”) (since 2013); Officer and/or Trustee/Director of 167 funds associated with Legg Mason Partners Fund Advisor, LLC (“LMPFA”) or its affiliates (since 2013); President and Chief Executive Officer of LM Asset Services, LLC (“LMAS”) and Legg Mason Fund Asset Management, Inc. (“LMFAM”) (formerly registered investment advisers) (since 2013); formerly, Senior Vice President of LMPFA (2012 to 2013); formerly, Director of Legg Mason & Co. (2012 to 2013); formerly, Vice President of Legg Mason & Co. (2009 to 2012); formerly, Vice President — Equity Division of T. Rowe Price Associates (1993 to 2009), as well as Investment Analyst and Portfolio Manager for certain asset allocation accounts (2004 to 2009) |
| Number of funds in fund complex overseen by Trustee | | 155 |
Other board memberships held by Trustee during past
five years | | None |
| | |
| Executive Officers |
Richard F. Sennett Legg Mason 100 International Drive, 7th Floor, Baltimore, MD 21202 | | |
| Year of birth | | 1970 |
| Position(s) with Trust | | Principal Financial Officer |
| Term of office and length of time served2 | | Since 2011 |
| Principal occupation(s) during past five years | | Principal Financial Officer and Treasurer of certain mutual funds associated with Legg Mason & Co. or its affiliates (since 2011 and since 2013); Managing Director of Legg Mason & Co. and Senior Manager of the Treasury Policy group for Legg Mason & Co.’s Global Fiduciary Platform (since 2011); formerly, Chief Accountant within the SEC’s Division of Investment Management (2007 to 2011); formerly, Assistant Chief Accountant within the SEC’s Division of Investment Management (2002 to 2007) |
| |
Robert I. Frenkel Legg Mason 100 First Stamford Place, 6th Floor, Stamford, CT 06902 | | |
| Year of birth | | 1954 |
| Position(s) with Trust | | Secretary and Chief Legal Officer |
| Term of office and length of time served2 | | Since 2009 |
| Principal occupation(s) during past five years | | Vice President and Deputy General Counsel of Legg Mason (since 2006); Managing Director and General Counsel of Global Mutual Funds for Legg Mason & Co. (since 2006) and Legg Mason & Co. predecessors (since 1994); Secretary and Chief Legal Officer of certain mutual funds associated with Legg Mason & Co. or its affiliates (since 2006) and Legg Mason & Co. predecessors (prior to 2006) |
| | |
| Legg Mason Batterymarch U.S. Small Capitalization Equity Portfolio | | 51 |
Additional information (unaudited) (cont’d)
Information about Trustees and Officers
| | |
| Executive Officers cont’d |
Ted P. Becker Legg Mason 620 Eighth Avenue, 49th Floor, New York, NY 10018 | | |
| Year of birth | | 1951 |
| Position(s) with Trust | | Vice President and Chief Compliance Officer |
| Term of office and length of time served2 | | Since 2009 |
| Principal occupation(s) during past five years | | Director of Global Compliance at Legg Mason (since 2006); Chief Compliance Officer of LMPFA (since 2006); Managing Director of Compliance of Legg Mason & Co. (since 2005); Chief Compliance Officer of certain mutual funds associated with Legg Mason & Co. or its affiliates (since 2006) and Legg Mason & Co. predecessors (prior to 2006) |
| |
Christopher Berarducci Legg Mason 620 Eighth Avenue, 49th Floor, New York, NY 10018 | | |
| Year of birth | | 1974 |
| Position(s) with Trust | | Treasurer |
| Term of office and length of time served2 | | Since 2010 |
| Principal occupation(s) during past five years | | Vice President of Legg Mason & Co. (since 2011); Treasurer of certain mutual funds associated with Legg Mason & Co. or its affiliates (since 2010); formerly, Assistant Controller of certain mutual funds associated with Legg Mason & Co. or its affiliates (prior to 2010); formerly, Manager of Fund Administration at UBS Global Asset Management (prior to 2007) |
| 1 | Trustees who are not “interested persons” of the Fund within the meaning of Section 2(a)(19) of the 1940 Act. Each of the Independent Trustees serves on the standing committees of the Board of Trustees, which include the Audit Committee (chair: Arthur S. Mehlman), the Nominating Committee (co-chairs: G. Peter O’Brien and Jill E. McGovern), and the Independent Trustees Committee (chair: Arnold L. Lehman). |
| 2 | Officers of the Trust are elected to serve until their successors are elected and qualified. Trustees of the Trust serve a term of indefinite length until their retirement, in accordance with the Board’s retirement policy, resignation or removal, and stand for re-election by shareholders only as and when required by the 1940 Act. |
| 3 | Effective June 1, 2013, Ms. Murphy was appointed to the position of Trustee and Chair and Mr. Fuller was appointed to the position of Trustee, President and Chief Executive Officer. Prior to this date, R. Jay Gerken served as Chairman, President and Chief Executive Officer, Mr. Gerken retired May 31, 2013. Ms. Murphy and Mr. Fuller are considered to be interested persons, as defined in the 1940 Act, of the Fund on the basis of their current employment with the Fund’s investment adviser or its affiliated entities (including the Fund’s principal underwriter) and Legg Mason, Inc., the parent holding company of these entities as well as their ownership of Legg Mason, Inc. stock. |
| | |
| 52 | | Legg Mason Batterymarch U.S. Small Capitalization Equity Portfolio |
Important tax information (unaudited)
The following information is provided with respect to the distributions paid during the taxable year ended December 31, 2013:
| | | | | | | | | | | | |
| Record date: | | | 6/17/2013 | | | | 12/10/2013 | | | | 12/26/2013 | |
| Payable date: | | | 6/18/2013 | | | | 12/11/2013 | | | | 12/27/2013 | |
| Ordinary income: | | | | | | | | | | | | |
Qualified dividend income for individuals | | | 93.10 | % | | | 17.74 | % | | | 17.74 | % |
Dividends qualifying for the dividends | | | | | | | | | | | | |
received deduction for corporations | | | 93.07 | % | | | 17.43 | % | | | 17.43 | % |
| Long-term capital gain dividend | | $ | 0.01393 | | | $ | 0.63175 | | | | — | |
The following distribution represents qualified short-term capital gains eligible for exemption from U.S. withholding tax for nonresident aliens and foreign corporations:
| | | | |
| Record date: | | | 12/10/2013 | |
| Payable date: | | | 12/11/2013 | |
| Short-term capital gains per share | | | 0.51154 | |
Please retain this information for your records.
| | |
| Legg Mason Batterymarch U.S. Small Capitalization Equity Portfolio | | 53 |
Legg Mason Batterymarch
U.S. Small Capitalization Equity Portfolio
Trustees
Kenneth D. Fuller*
President
Ruby P. Hearn
Arnold L. Lehman
Robin J.W. Masters
Jill E. McGovern
Arthur S. Mehlman
Jennifer W. Murphy*
Chair
G. Peter O’Brien
S. Ford Rowan
Robert M. Tarola
Investment manager
Legg Mason Partners Fund Advisor, LLC
Investment adviser
Batterymarch Financial Management, Inc.
Custodian
State Street Bank & Trust Company
Co-transfer agents
Boston Financial Data Services, Inc.
2000 Crown Colony Drive
Quincy, MA 02169
BNY Mellon Asset Servicing
4400 Computer Drive
Westborough, MA 01581
Counsel
K&L Gates LLP
Washington, DC
Independent registered public accounting firm
PricewaterhouseCoopers LLP
Baltimore, MD
| * | Effective June 1, 2013, Ms. Murphy became a Trustee and Chair and Mr. Fuller became a Trustee, President and Chief Executive Officer. |
Legg Mason Batterymarch U.S. Small Capitalization Equity Portfolio
The Fund is a separate investment series of Legg Mason Global Asset Management Trust, a Maryland statutory trust.
Legg Mason Batterymarch U.S. Small Capitalization Equity Portfolio
Legg Mason Funds
620 Eighth Avenue, 49th Floor
New York, NY 10018
The Fund files its complete schedule of portfolio holdings with the Securities and Exchange Commission (“SEC”) for the first and third quarters of each fiscal year on Form N-Q. The Fund’s Forms N-Q are available on the SEC’s website at www.sec.gov. The Fund’s Forms N-Q may be reviewed and copied at the SEC’s Public Reference Room in Washington, D.C., and information on the operation of the Public Reference Room may be obtained by calling 1-800-SEC-0330. To obtain information on Form N-Q, shareholders can call the Fund at 1-877-721-1926.
Information on how the Fund voted proxies relating to portfolio securities during the prior 12-month period ended June 30th of each year and a description of the policies and procedures that the Fund uses to determine how to vote proxies related to portfolio transactions are available (1) without charge, upon request, by calling the Fund at 1-877-721-1926, (2) on the Fund’s website at www.leggmason.com/individualinvestors and (3) on the SEC’s website at www.sec.gov.
This report is submitted for the general information of the shareholders of Legg Mason Batterymarch U.S. Small Capitalization Equity Portfolio. This report is not authorized for distribution to prospective investors in the Fund unless preceded or accompanied by a current prospectus.
Investors should consider the Fund’s investment objectives, risks, charges and expenses carefully before investing. The prospectus contains this and other important information about the Fund. Please read the prospectus carefully before investing.
www.leggmason.com/individualinvestors
©2014 Legg Mason Investor Services, LLC
Member FINRA, SIPC
Legg Mason Funds Privacy and Security Notice
Your Privacy and the Security of Your Personal Information is Very Important to the Legg Mason Funds
This Privacy and Security Notice (the “Privacy Notice”) addresses the Legg Mason Funds’ privacy and data protection practices with respect to nonpublic personal information the Funds receive. The Legg Mason Funds include any funds sold by the Funds’ distributor, Legg Mason Investor Services, LLC, as well as Legg Mason-sponsored closed-end funds and certain closed-end funds managed or sub-advised by Legg Mason or its affiliates. The provisions of this Privacy Notice apply to your information both while you are a shareholder and after you are no longer invested with the Funds.
The Type of Nonpublic Personal Information the Funds Collect About You
The Funds collect and maintain nonpublic personal information about you in connection with your shareholder account. Such information may include, but is not limited to:
| Ÿ | | Personal information included on applications or other forms; |
| Ÿ | | Account balances, transactions, and mutual fund holdings and positions; |
| Ÿ | | Online account access user IDs, passwords, security challenge question responses; and |
| Ÿ | | Information received from consumer reporting agencies regarding credit history and creditworthiness (such as the amount of an individual’s total debt, payment history, etc.). |
How the Funds Use Nonpublic Personal Information About You
The Funds do not sell or share your nonpublic personal information with third parties or with affiliates for their marketing purposes, or with other financial institutions or affiliates for joint marketing purposes, unless you have authorized the Funds to do so. The Funds do not disclose any nonpublic personal information about you except as may be required to perform transactions or services you have authorized or as permitted or required by law. The Funds may disclose information about you to:
| Ÿ | | Employees, agents, and affiliates on a “need to know” basis to enable the Funds to conduct ordinary business or comply with obligations to government regulators; |
| Ÿ | | Service providers, including the Funds’ affiliates, who assist the Funds as part of the ordinary course of business (such as printing, mailing services, or processing or servicing your account with us) or otherwise perform services on the Funds’ behalf, including companies that may perform marketing services solely for the Funds; |
| Ÿ | | The Funds’ representatives such as legal counsel, accountants and auditors; and |
| Ÿ | | Fiduciaries or representatives acting on your behalf, such as an IRA custodian or trustee of a grantor trust. |
|
| NOT PART OF THE ANNUAL REPORT |
Legg Mason Funds Privacy and Security Notice (cont’d)
Except as otherwise permitted by applicable law, companies acting on the Funds’ behalf are contractually obligated to keep nonpublic personal information the Funds provide to them confidential and to use the information the Funds share only to provide the services the Funds ask them to perform.
The Funds may disclose nonpublic personal information about you when necessary to enforce their rights or protect against fraud, or as permitted or required by applicable law, such as in connection with a law enforcement or regulatory request, subpoena, or similar legal process. In the event of a corporate action or in the event a Fund service provider changes, the Funds may be required to disclose your nonpublic personal information to third parties. While it is the Funds’ practice to obtain protections for disclosed information in these types of transactions, the Funds cannot guarantee their privacy policy will remain unchanged.
Keeping You Informed of the Funds’ Privacy and Security Practices
The Funds will notify you annually of their privacy policy as required by federal law. While the Funds reserve the right to modify this policy at any time they will notify you promptly if this privacy policy changes.
The Funds’ Security Practices
The Funds maintain appropriate physical, electronic and procedural safeguards designed to guard your nonpublic personal information. The Funds’ internal data security policies restrict access to your nonpublic personal information to authorized employees, who may use your nonpublic personal information for Fund business purposes only.
Although the Funds strive to protect your nonpublic personal information, they cannot ensure or warrant the security of any information you provide or transmit to them, and you do so at your own risk. In the event of a breach of the confidentiality or security of your nonpublic personal information, the Funds will attempt to notify you as necessary so you can take appropriate protective steps. If you have consented to the Funds using electronic communications or electronic delivery of statements, they may notify you under such circumstances using the most current email address you have on record with them.
In order for the Funds to provide effective service to you, keeping your account information accurate is very important. If you believe that your account information is incomplete, not accurate or not current, or if you have questions about the Funds’ privacy practices, write the Funds using the contact information on your account statements, email the Funds by clicking on the Contact Us section of the Funds’ website at www.leggmason.com, or contact the Fund at 1-877-721-1926.
Revised April 2011
|
| NOT PART OF THE ANNUAL REPORT |
www.leggmason.com/individualinvestors
©2014 Legg Mason Investor Services, LLC Member FINRA, SIPC
LMFX012200 2/14 SR14-2135
The registrant has adopted a code of ethics that applies to the registrant’s principal executive officer, principal financial officer, principal accounting officer or controller.
| ITEM 3. | AUDIT COMMITTEE FINANCIAL EXPERT. |
The Board of Trustees of the registrant has determined that Arthur S. Mehlman the Chairman of the Board’s Audit Committee and Robert M. Tarola, possess the technical attributes identified in Instruction 2(b) of Item 3 to Form N-CSR to qualify as “audit committee financial experts,” and have designated Mr. Mehlman and Mr. Tarola as the Audit Committee’s financial experts. Mr. Mehlman and Mr. Tarola are “independent” Trustees pursuant to paragraph (a) (2) of Item 3 to Form N-CSR.
| ITEM 4. | PRINCIPAL ACCOUNTANT FEES AND SERVICES. |
a) Audit Fees. The aggregate fees billed in the last two fiscal years ending December 31, 2012 and December 31, 2013 (the “Reporting Periods”) for professional services rendered by the Registrant’s principal accountant (the “Auditor”) for the audit of the Registrant’s annual financial statements, or services that are normally provided by the Auditor in connection with the statutory and regulatory filings or engagements for the Reporting Periods, were $161,900 in December 31, 2012 and $240,415 in December 31, 2013.
b) Audit-Related Fees. The aggregate fees billed in the Reporting Period for assurance and related services by the Auditor that are reasonably related to the performance of the Registrant’s financial statements were $8,500 in December 31, 2012 and $8,500 in December 31, 2013. These services consisted of procedures performed in connection with the Re-domiciliation of the various reviews of Prospectus supplements, and consent issuances related to the N-1A filings for Legg Mason Global Asset Management Trust.
In addition, there were no Audit-Related Fees billed in the Reporting Period for assurance and related services by the Auditor to the Registrant’s investment adviser (not including any sub-adviser whose role is primarily portfolio management and is subcontracted with or overseen by another investment adviser), and any entity controlling, controlled by or under common control with the investment adviser that provides ongoing services to the Legg Mason Global Asset Management Trust (“service affiliates”), that were reasonably related to the performance of the annual audit of the service affiliates. Accordingly, there were no such fees that required pre-approval by the Audit Committee for the Reporting Periods.
(c) Tax Fees. The aggregate fees billed in the Reporting Periods for professional services rendered by the Auditor for tax compliance, tax advice and tax planning (“Tax Services”) were $24,695 in December 31, 2012 and $22,680 in December 31, 2013. These services consisted of (i) review or preparation of U.S. federal, state, local and excise tax returns; (ii) U.S. federal, state and local tax planning, advice and assistance regarding statutory, regulatory or administrative developments, and (iii) tax advice regarding tax qualification matters and/or treatment of various financial instruments held or proposed to be acquired or held.
There were no fees billed for tax services by the Auditors to service affiliates during the Reporting Periods that required pre-approval by the Audit Committee.
d) All Other Fees. The aggregate fees for other fees billed in the Reporting Periods for products and services provided by the Auditor were $3,306 in December 31, 2012 and $5,305 in December 31, 2013, other than the services reported in paragraphs (a) through (c) of this item for the Legg Mason Global Asset Management Trust.
All Other Fees. There were no other non-audit services rendered by the Auditor to Legg Mason Partners Fund Advisors, LLC (“LMPFA”), and any entity controlling, controlled by or under common control with LMPFA that provided ongoing services to Legg Mason Global Asset Management Trust requiring pre-approval by the Audit Committee in the Reporting Period.
(e) Audit Committee’s pre–approval policies and procedures described in paragraph (c)
(7) of Rule 2-01 of Regulation S-X.
(1) The Charter for the Audit Committee (the “Committee”) of the Board of each registered investment company (the “Fund”) advised by LMPFA or one of their affiliates (each, an “Adviser”) requires that the Committee shall approve (a) all audit and permissible non-audit services to be provided to the Fund and (b) all permissible non-audit services to be provided by the Fund’s independent auditors to the Adviser and any Covered Service Providers if the engagement relates directly to the operations and financial reporting of the Fund. The Committee may implement policies and procedures by which such services are approved other than by the full Committee.
The Committee shall not approve non-audit services that the Committee believes may impair the independence of the auditors. As of the date of the approval of this Audit Committee Charter, permissible non-audit services include any professional services (including tax services), that are not prohibited services as described below, provided to the Fund by the independent auditors, other than those provided to the Fund in connection with an audit or a review of the financial statements of the Fund. Permissible non-audit services may not include: (i) bookkeeping or other services related to the accounting records or financial statements of the Fund; (ii) financial information systems design and implementation; (iii) appraisal or valuation services, fairness opinions or contribution-in-kind reports; (iv) actuarial services; (v) internal audit outsourcing services; (vi) management functions or human resources; (vii) broker or dealer, investment adviser or investment banking services; (viii) legal services and expert services unrelated to the audit; and (ix) any other service the Public Company Accounting Oversight Board determines, by regulation, is impermissible.
Pre-approval by the Committee of any permissible non-audit services is not required so long as: (i) the aggregate amount of all such permissible non-audit services provided to the Fund, the Adviser and any service providers controlling, controlled by or under common control with the Adviser that provide ongoing services to the Fund (“Covered Service Providers”) constitutes not more than 5% of the total amount of revenues paid to the independent auditors during the fiscal year in which the permissible non-audit services are provided to (a) the Fund, (b) the Adviser and (c) any entity controlling, controlled by or under common control with the Adviser that provides ongoing services to the Fund during the fiscal year in which the services are provided that would have to be approved by the Committee; (ii) the permissible non-audit services were not recognized by the Fund at the time of the engagement to be non-audit services; and (iii) such services are promptly brought to the attention of the Committee and approved by the Committee (or its delegate(s)) prior to the completion of the audit.
(2) For the Legg Mason Global Asset Management Trust, the percentage of fees that were approved by the audit committee, with respect to: Audit-Related Fees were 100% and 100% for December 31, 2012 and December 31, 2013; Tax Fees were 100% and 100% for December 31, 2012 and December 31, 2013; and Other Fees were 100% and 100% for December 31, 2012 and December 31, 2013.
(f) N/A
(g) Non-audit fees billed by the Auditor for services rendered to Legg Mason Global Asset Management Trust, LMPFA and any entity controlling, controlled by, or under common control with LMPFA that provides ongoing services to Legg Mason Global Asset Management Trust during the reporting period were $14,100 in December 31, 2012 and $254,500 in December 31, 2013.
(h) Yes. Legg Mason Global Asset Management Trust’s Audit Committee has considered whether the provision of non-audit services that were rendered to Service Affiliates, which were not pre-approved (not requiring pre-approval), is compatible with maintaining the Accountant’s independence. All services provided by the Auditor to the Legg Mason Global Asset Management Trust or to Service Affiliates, which were required to be pre-approved, were pre-approved as required.
| ITEM 5. | AUDIT COMMITTEE OF LISTED REGISTRANTS. |
| | a) | The independent board members are acting as the registrant’s audit committee as specified in Section 3(a)(58)(B) of the Exchange Act .The Audit Committee consists of the following Board members: |
Ruby P. Hearn
Arnold L. Lehman
Robin J.W. Masters
Jill E. McGovern
Arthur S. Mehlman
G. Peter O’Brien
S. Ford Rowan
Robert M. Tarola
| ITEM 6. | SCHEDULE OF INVESTMENTS. |
Included herein under Item 1.
| ITEM 7. | DISCLOSURE OF PROXY VOTING POLICIES AND PROCEDURES FOR CLOSED-END MANAGEMENT INVESTMENT COMPANIES. |
Not applicable.
| ITEM 8. | PORTFOLIO MANAGERS OF CLOSED-END MANAGEMENT INVESTMENT COMPANIES. |
Not applicable.
| ITEM 9. | PURCHASES OF EQUITY SECURITIES BY CLOSED-END MANAGEMENT INVESTMENT COMPANY AND AFFILIATED PURCHASERS. |
Not applicable.
| ITEM 10. | SUBMISSION OF MATTERS TO A VOTE OF SECURITY HOLDERS. |
Not applicable.
| ITEM 11. | CONTROLS AND PROCEDURES. |
| | (a) | The registrant’s principal executive officer and principal financial officer have concluded that the registrant’s disclosure controls and procedures (as defined in Rule 30a- 3(c) under the Investment Company Act of 1940, as amended (the “1940 Act”)) are effective as of a date within 90 days of the filing date of this report that includes the disclosure required by this paragraph, based on their evaluation of the disclosure controls and procedures required by Rule 30a-3(b) under the 1940 Act and 15d-15(b) under the Securities Exchange Act of 1934. |
| | (b) | There were no changes in the registrant’s internal control over financial reporting (as defined in Rule 30a-3(d) under the 1940 Act) that occurred during the second fiscal quarter of the period covered by this report that have materially affected, or are likely to materially affect the registrant’s internal control over financial reporting. |
(a) (1) Code of Ethics attached hereto.
Exhibit 99.CODE ETH
(a) (2) Certifications pursuant to section 302 of the Sarbanes-Oxley Act of 2002 attached hereto.
Exhibit 99.CERT
(b) Certifications pursuant to Section 906 of the Sarbanes-Oxley Act of 2002 attached hereto.
Exhibit 99.906CERT
SIGNATURES
Pursuant to the requirements of the Securities Exchange Act of 1934 and the Investment Company Act of 1940, the registrant has duly caused this Report to be signed on its behalf by the undersigned, there unto duly authorized.
| | |
| Legg Mason Global Asset Management Trust |
| |
| By: | | /s/ Kenneth D. Fuller |
| | Kenneth D. Fuller |
| | Chief Executive Officer |
Date: February 24, 2014
Pursuant to the requirements of the Securities Exchange Act of 1934 and the Investment Company Act of 1940, this report has been signed below by the following persons on behalf of the registrant and in the capacities and on the dates indicated.
| | |
| By: | | /s/ Kenneth D. Fuller |
| | Kenneth D. Fuller |
| | Chief Executive Officer |
|
| Date: February 24, 2014 |
| |
| By: | | /s/ Richard F. Sennett |
| | Richard F. Sennett |
| | Principal Financial Officer |
Date: February 24, 2014