UNITED STATES
SECURITIES AND EXCHANGE COMMISSION
Washington, D.C. 20549
FORM N-CSR
CERTIFIED SHAREHOLDER REPORT OF REGISTERED
MANAGEMENT INVESTMENT COMPANIES
Investment Company Act file number 811-22338
Legg Mason Global Asset Management Trust
(Exact name of registrant as specified in charter)
620 Eighth Avenue, 49th Floor, New York, NY 10018
(Address of principal executive offices) (Zip code)
Robert I. Frenkel, Esq.
Legg Mason & Co., LLC
100 First Stamford Place
Stamford, CT 06902
(Name and address of agent for service)
Registrant’s telephone number, including area code: 1-877-721-1926
Date of fiscal year end: December 31
Date of reporting period: December 31, 2014
| ITEM 1. | REPORT TO STOCKHOLDERS |
The Annual Report to Stockholders is filed herewith.

| | |
| Annual Report | | December 31, 2014 |
LEGG MASON
BW INTERNATIONAL OPPORTUNITIES BOND FUND
|
| INVESTMENT PRODUCTS: NOT FDIC INSURED • NO BANK GUARANTEE • MAY LOSE VALUE |
Fund objective
The Fund’s objective is to maximize total return consisting of income and capital appreciation.
Letter from the president

Dear Shareholder,
We are pleased to provide the annual report of Legg Mason BW International Opportunities Bond Fund for the twelve-month reporting period ended December 31, 2014. Please read on for a detailed look at prevailing economic and market conditions during the Fund’s reporting period and to learn how those conditions have affected Fund performance.
As always, we remain committed to providing you with excellent service and a full spectrum of investment choices. We also remain committed to supplementing the support you receive from your financial advisor. One way we accomplish this is through our website, www.leggmason.com/individualinvestors. Here you can gain immediate access to market and investment information, including:
| Ÿ | | Fund prices and performance, |
| Ÿ | | Market insights and commentaries from our portfolio managers, and |
| Ÿ | | A host of educational resources. |
We look forward to helping you meet your financial goals.
Sincerely,

Kenneth D. Fuller
President and Chief Executive Officer
January 30, 2015
| | |
| II | | Legg Mason BW International Opportunities Bond Fund |
Investment commentary
Economic review
Despite weakness in early 2014, the U.S. economy expanded at a solid pace during the twelve months ended December 31, 2014 (the “reporting period”). The U.S. Department of Commerce reported that in the first quarter of 2014, U.S. gross domestic product (“GDP”)i contracted 2.1%. This was the first negative GDP report in three years and partially attributed to severe winter weather. Thankfully, this setback was very brief, as second quarter GDP growth was 4.6%. The rebound in GDP growth was driven by several factors, including an acceleration in personal consumption expenditures (“PCE”), increased private inventory investment and exports, as well as an upturn in state and local government spending. The economy then gained further momentum as third quarter GDP growth was 5.0%, its strongest reading since the third quarter of 2003. This was driven by contributions from PCE, exports, nonresidential fixed investment and government spending. After the reporting period ended, the U.S. Department of Commerce’s initial estimate showed that fourth quarter 2014 GDP growth was 2.6%. Moderating growth was due to several factors, including an upturn in imports, a downturn in federal government spending and decelerations in nonresidential fixed investment and in exports.
The U.S. manufacturing sector was another tailwind for the economy. Based on figures for the Institute for Supply Management’s Purchasing Managers’ Index (“PMI”)ii, U.S. manufacturing expanded during all twelve months of the reporting period (a reading below 50 indicates a contraction, whereas a reading above 50 indicates an expansion). After a reading of 56.5 in December 2013, the PMI fell to 51.3 in January 2014, but generally rose over the next several months, reaching a high of 59.0 in August, its best reading since March 2011. While the PMI dipped to 56.6 in September, it rose back to 59.0 in October. Manufacturing activity then moderated over the last two months of the year and the PMI was 55.5 in December. However, for 2014 as a whole the PMI averaged 55.8, the best annual reading since 2010.
The improving U.S. job market was another factor supporting the overall economy during the reporting period. When the period began, unemployment, as reported by the U.S. Department of Labor, was 6.6%. Unemployment generally declined throughout the reporting period and reached a low of 5.6% in December 2014, the lowest level since June 2008.
Growth outside the U.S. was mixed. In its January 2015 World Economic Outlook Update, released after the reporting period ended, the International Monetary Fund (“IMF”) said “Global growth will receive a boost from lower oil prices, which reflect to an important extent higher supply. But this boost is projected to be more than offset by negative factors, including investment weakness as adjustment to diminished expectations about medium-term growth continues in many advanced and emerging market economies.” From a regional perspective, the IMF said 2014 growth was 0.8% in the Eurozone, versus -0.5% in 2013. Japan’s economy expanded 0.1% in 2014, compared to 1.6% in 2013. Elsewhere the IMF said that overall growth in emerging market countries decelerated in 2014, with growth of 4.4% versus 4.7% in 2013.
| | |
| Legg Mason BW International Opportunities Bond Fund | | III |
Investment commentary (cont’d)
The Federal Reserve Board (“Fed”)iii took a number of actions as it sought to meet its dual mandate of fostering maximum employment and price stability. As it has since December 2008, the Fed kept the federal funds rateiv at a historically low range between zero and 0.25%. The Fed also ended its asset purchase program that was announced in December 2012. At that time, the Fed said it would continue purchasing $40 billion per month of agency mortgage-backed securities (“MBS”), as well as $45 billion per month of longer-term Treasuries. Following the meeting that concluded on December 18, 2013, the Fed announced that it would begin reducing its monthly asset purchases, saying “Beginning in January 2014, the Committee will add to its holdings of agency MBS at a pace of $35 billion per month rather than $40 billion per month, and will add to its holdings of longer-term Treasury securities at a pace of $40 billion per month rather than $45 billion per month.” At each of the Fed’s next six meetings (January, March, April, June, July and September 2014), it announced further $10 billion tapering of its asset purchases. At its meeting that ended on October 29, 2014, the Fed announced that its asset purchase program had concluded. During its last meeting of the year that concluded on December 17, 2014, the Fed said that “Based on its current assessment, the Committee judges that it can be patient… to maintain the 0 to 1/4 percent target range for the federal funds rate for a considerable time….” Finally, at its meeting that ended on January 28, 2015, after the reporting period ended, the Fed said “Based on its current assessment, the Committee judges that it can be patient in beginning to normalize the stance of monetary policy.”
Given the economic challenges in the Eurozone, the European Central Bank (“ECB”)v took a number of actions to stimulate growth. In November 2013, before the beginning of the reporting period, the ECB cut rates from 0.50% to a new record low of 0.25%. On June 5, 2014, the ECB made a number of additional moves in an attempt to support the region’s economy and ward off deflation: The ECB reduced rates to a new low of 0.15% and announced it would charge commercial banks 0.10% to keep money at the ECB. This “negative deposit rate” was aimed at encouraging commercial banks to lend some of their incremental cash which, in turn, could help to spur growth. On September 4, 2014, the ECB reduced rates to yet another record low of 0.05% and it began charging commercial banks 0.20% to keep money at the ECB. Furthermore, the ECB started purchasing securitized loans and covered bonds in October 2014.
Finally, on January 22, 2015, after the reporting period ended, the ECB announced that beginning in March 2015 it would start a €60 billion-a-month bond buying program that is expected to run until September 2016. In other developed countries, the Bank of England kept rates on hold at 0.50% during the reporting period, as did Japan at a range of zero to 0.10%, its lowest level since 2006. At the end of October 2014, the Bank of Japan announced that it would increase its asset purchases between 10 trillion yen and 20 trillion yen ($90.7 billion to $181.3 billion) to approximately 80 trillion yen ($725 billion) annually, in an attempt to stimulate growth. Elsewhere, after holding rates steady at 6.0% since July 2012, the People’s Bank of China cut the rate to 5.6% on November 21, 2014 in an effort to stimulate growth.
| | |
| IV | | Legg Mason BW International Opportunities Bond Fund |
As always, thank you for your confidence in our stewardship of your assets.
Sincerely,
Kenneth D. Fuller
President and Chief Executive Officer
January 30, 2015
All investments are subject to risk including the possible loss of principal. Past performance is no guarantee of future results. Forecasts and predictions are inherently limited and should not be relied upon as an indication of actual or future performance.
| i | Gross domestic product (“GDP”) is the market value of all final goods and services produced within a country in a given period of time. |
| ii | The Institute for Supply Management’s PMI is based on a survey of purchasing executives who buy the raw materials for manufacturing at more than 350 companies. It offers an early reading on the health of the U.S. manufacturing sector. |
| iii | The Federal Reserve Board (“Fed”) is responsible for the formulation of policies designed to promote economic growth, full employment, stable prices and a sustainable pattern of international trade and payments. |
| iv | The federal funds rate is the rate charged by one depository institution on an overnight sale of immediately available funds (balances at the Federal Reserve) to another depository institution; the rate may vary from depository institution to depository institution and from day to day. |
| v | The European Central Bank (“ECB”) is responsible for the monetary system of the European Union and the euro currency. |
| | |
| Legg Mason BW International Opportunities Bond Fund | | V |
Fund overview
Q. What is the Fund’s investment strategy?
A. The Fund seeks to maximize total return consisting of income and capital appreciation. Under normal market conditions, the Fund will invest at least 80% of its net assets in fixed-income securities of issuers located in developed market countries. Any country that, at the time of purchase has a sovereign debt rating of A- or better from at least one nationally recognized statistical ratings organization (“NRSRO”) or is included in the Citigroup World Government Bond Ex-U.S. Index (Unhedged)i is considered a developed country. The Fund will invest in both investment grade and below investment grade fixed-income securities, and intends to invest less than 35% of its net assets in below investment grade securities. Investment grade securities are securities rated, at the time of purchase, by a NRSRO within one of the top four categories (without regard to +/- designations), or, if unrated, securities that we judge to be of comparable credit quality. The Fund may invest up to 25% of its net assets in convertible debt securities.
The Fund invests in currency forwards in order to hedge its currency exposure in bond positions or to gain currency exposure. The Fund may engage in a variety of transactions using derivatives such as futures, options, forward foreign currency transactions and swaps (including credit default swaps). These investments may be significant at times. The Fund may invest significantly in derivatives for both hedging and non-hedging purposes, including for purposes of enhancing returns.
The Fund will normally hold a portfolio of fixed-income securities of issuers located in a minimum of six countries. We intend to maintain an average weighted portfolio quality of A- or better, whether composed of rated securities or unrated securities deemed to be of comparable quality. The weighted average effective durationii of the Fund’s portfolio, including derivatives, is expected to range from one to ten years, but for individual markets may be greater or lesser depending on our view of the prospects for lower interest rates and potential capital gains.
We follow a value approach to investing and, therefore, seek to identify relative value in the international bond markets. We define as undervalued, those markets where we believe real interest rates are high and the currency is undervalued with the potential to appreciate. We will concentrate investments in those undervalued markets where we believe cyclical business conditions as well as secular economic and political trends provide the best opportunity for declining interest rates and a return to lower real rates over time. We believe that such economic conditions provide the best potential to achieve capital appreciation.
Q. What were the overall market conditions during the Fund’s reporting period?
A. Flagging growth and wilting inflation expectations collapsed sovereign bond yields throughout 2014. Although falling bond yields provided a meaningful tailwind to absolute performance within the global bond universe, the strength of the U.S. dollar produced a challenging offset to the benefit of falling bond yields. European bond yields fell the most during the year, reflecting policy paralysis from the European Central Bank (“ECB”)iii and a poor external environment driven by the Russian recession and slower Chinese growth. Local currency emerging market (“EM”) and developing
| | |
| Legg Mason BW International Opportunities Bond Fund 2014 Annual Report | | 1 |
Fund overview (cont’d)
country bonds broadly performed well during the year, rallying smartly through the third quarter of 2014 when the confluence of abysmal EM macro data, falling commodity prices, a strong dollar, and rising volatility wiped away nearly all of 2014’s gains. Some emerging markets that were mired in war, like Russia or Ukraine, or facing imminent bankruptcy, like Venezuela, underperformed consistently during the year. From a currency perspective, the most important story in 2014 was the U.S. dollar’s spot-rate outperformance against every major peer. The yen and euro each depreciated more than 12% against the dollar after both currencies’ central banks ramped up quantitative easing to battle disinflationary momentum. Notably, the Indian rupee and Indonesian rupiah outperformed the U.S. dollar on a total return basis — i.e. when also considering interest rate differentials. Both the rupee and rupiah underperformed in 2013, which helped to moderate follow-on losses in 2014. Both currencies also benefited from the advancement of ambitious reform agenda, like the removal of fuel subsidies in Indonesia, and improved central bank credibility, like that earned by the Reserve Bank of India after introducing a 6% target cap on realized inflation.
Q. How did we respond to these changing market conditions?
A. The Fund increased portfolio duration by a half-year during the period by rotating out of overvalued G7iv countries and adding durationv from developing countries where yields did not rally as much and remain at attractive valuations. The Fund cut duration in Europe — specifically in the U.K., Italy, and Poland — where yields fell spectacularly in the second half of 2014 as ECB policy paralysis allowed inflation expectations to drop precipitously. The Fund added to duration in Indonesia, Mexico, and Portugal. In terms of sector positioning, the Fund sold government sovereigns and purchased shorter-term, dollar-denominated corporates and Eurozone asset-backed securities (“ABS”). Additions to both sectors contributed negligible amounts of duration.
From a currency perspective, the Fund continued to avoid yen and euro exposure during the reporting year. The Fund added to commodity-related and developing currencies like the Australian dollar, Brazilian real, Malaysian ringgit, Mexico peso, and Chilean peso during the year on the heels of steep depreciations. The Fund also exited a nearly 5% position in the South Korean won. South Korea’s export-oriented economy began to slow markedly during the year as the cheapening yen helped Japan win a greater share of relevant export markets. In our opinion, we expect weakness in the yen-won exchange rate will ultimately lead to a more decisive, policy-induced fall in the won’s value.
Performance review
For the twelve months ended December 31, 2014, Class IS shares of Legg Mason BW International Opportunities Bond Fund returned 4.53%. The Fund’s unmanaged benchmark, the Citigroup World Government Bond Ex-U.S. Index (Unhedged), returned -2.68% for the same period. The Lipper International Income Funds Category Average1 returned 0.89% over the same time frame.
| 1 | Lipper, Inc., a wholly-owned subsidiary of Reuters, provides independent insight on global collective investments. Returns are based on the twelve-month period ended December 31, 2014, including the reinvestment of all distributions, including returns of capital, if any, calculated among the 136 funds in the Fund’s Lipper category, and excluding sales charges. |
| | |
| 2 | | Legg Mason BW International Opportunities Bond Fund 2014 Annual Report |
| | | | | | | | |
Performance Snapshot as of December 31, 2014
(unaudited) | |
| (excluding sales charges) | | 6 months | | | 12 months | |
| Legg Mason BW International Opportunities Bond Fund: | | | | | | | | |
Class A | | | -4.21 | % | | | 4.30 | % |
Class C | | | -4.52 | % | | | 3.41 | % |
Class C1¨ | | | -4.48 | % | | | 3.70 | % |
Class FI | | | -4.18 | % | | | 4.25 | % |
Class R | | | -4.27 | % | | | 4.02 | % |
Class I | | | -4.13 | % | | | 4.43 | % |
Class IS | | | -4.08 | % | | | 4.53 | % |
| Citigroup World Government Bond Ex-U.S. Index (Unhedged) | | | -8.14 | % | | | -2.68 | % |
Lipper International Income Funds
Category Average1 | | | -3.92 | % | | | 0.89 | % |
The performance shown represents past performance. Past performance is no guarantee of future results and current performance may be higher or lower than the performance shown above. Principal value, investment returns and yields will fluctuate and investors’ shares, when redeemed, may be worth more or less than their original cost. To obtain performance data current to the most recent month-end, please visit our website at www.leggmason.com/individualinvestors.
All share class returns assume the reinvestment of all distributions at net asset value and the deduction of all Fund expenses. Returns have not been adjusted to include sales charges that may apply or the deduction of taxes that a shareholder would pay on Fund distributions. If sales charges were reflected, the performance quoted would be lower. Performance figures for periods shorter than one year represent cumulative figures and are not annualized.
| ¨ | Effective August 1, 2012, Class C shares were reclassified as Class C1 shares. Class C1 (formerly Class C) shares are not available for purchase by new or existing investors (except for certain retirement plan programs authorized by the Fund’s distributor prior to August 1, 2012). Class C1 shares continue to be available for dividend reinvestment and incoming exchanges. |
| 1 | Lipper, Inc., a wholly-owned subsidiary of Reuters, provides independent insight on global collective investments. Returns are based on the period ended December 31, 2014, including the reinvestment of all distributions, including returns of capital, if any, calculated among the 136 funds for the six-month period and among the 136 funds for the twelve-month period in the Fund’s Lipper category, and excluding sales charges. |
Fund performance figures reflect fee waivers and/or expense reimbursements, without which the performance would have been lower.
The 30-Day SEC Yields for the period ended December 31, 2014 for Class A, Class C, Class C1, Class FI, Class R, Class I and Class IS shares 2.32%, 1.66%, 1.76%, 2.42%, 2.02%, 2.68% and 2.78%, respectively. Absent fee waivers and/or expense reimbursements, the 30-Day SEC Yields for Class A, Class FI, Class R, Class I and Class IS shares would have been 2.15%, 2.21%, 1.69%, 2.50% and 2.67%, respectively. The 30-Day SEC Yield is subject to change and is based on the yield to maturity of the Fund’s investments over a 30-day period and not on the dividends paid by the Fund, which may differ.
|
| Total Annual Operating Expenses (unaudited) |
As of the Fund’s current prospectus dated May 1, 2014, the gross total annual operating expense ratios for Class A, Class C, Class C1, Class FI, Class R, Class I and Class IS shares were 1.42%, 2.27%, 2.27%, 1.34%, 1.92%, 1.02% and 1.10%, respectively.
Actual expenses may be higher. For example, expenses may be higher than those shown if average net assets decrease. Net assets are more likely to decrease and Fund expense ratios are more likely to increase when markets are volatile.
As a result of expense limitation arrangements, the ratio of expenses, other than interest, brokerage commissions, dividend expense on short sales, taxes, extraordinary expenses and acquired fund fees and
| | |
| Legg Mason BW International Opportunities Bond Fund 2014 Annual Report | | 3 |
Fund overview (cont’d)
expenses, to average net assets is not expected to exceed 1.00% for Class A shares, 1.75% for Class C shares, 1.45% for Class C1 shares, 1.00% for Class FI shares, 1.25% for Class R shares, 0.75% for Class I shares and 0.65% for Class IS shares. In addition, total annual operating expenses for Class IS shares will not exceed those for Class I shares. These expense limitation arrangements cannot be terminated prior to December 31, 2016 without the Board of Trustees’ consent.
The manager is permitted to recapture amounts waived and/or reimbursed to a class within three years after the fiscal year in which the manager earned the fee or incurred the expense if the class’ total annual operating expenses have fallen to a level below the expense limitation (“expense cap”) in effect at the time the fees were earned or the expenses incurred. In no case will the manager recapture any amount that would result, on any particular business day of the Fund, in the class’ total annual operating expenses exceeding the expense cap or any other lower limit then in effect.
Q. What were the leading contributors to performance?
A. The Fund outperformed its benchmark during the twelve months ended December 31, 2014. Currency decisions and yield curvevi positioning contributed meaningfully to performance. Avoiding the euro and yen represented much of the relative benefit from currency decisions. Both currencies fell on terrible economic data which spurred the ECB and Bank of Japan to promise more aggressive policy easing. Long-maturity exposures in the Australia, Mexico, Hungary, and Poland also contributed to relative performance. Long-term growth and inflation expectations diminished globally during the year, driving long rates to low levels across major bond markets.
The use of derivatives, which consisted solely of currency forward contracts in the Fund, contributed to absolute performance in aggregate. Intended to hedge currency exposure in European peripheral sovereigns, contracts shorting the euro against the U.S. dollar provided the greatest performance benefit among derivatives positions during the period in review. European currencies sank in value during the period, but bonds from the European periphery, which are denominated in euro, produced the best performance of all bond markets in our universe. Forward currency contracts allowed the Fund to benefit from elevated and falling interest rates in euro-denominated bonds without being exposed to undesirable currency risk that was undesirable in the investment team’s opinion. Long exposure to the Chilean peso, achieved through non-deliverable currency forwards, offset a small part of the performance benefit from derivatives transactions overall. Chilean peso valuations sank following policy rate cuts and deterioration in the price of copper, the country’s primary export.
Q. What were the leading detractors from performance?
A. Overweight exposure to the Mexican peso offset some of the relative benefit from currency decisions. Investors worried that a drastic oil price drop would reduce 2015 foreign investment in Mexico, which markets at one time expected to be much larger than normal because the country recently liberalized foreign oil investment after a 75-plus-year constitutional ban. Avoiding long-maturity exposure in select core Eurozone countries also detracted from relative performance. Long yields in the Eurozone sank on disinflationary pressures that gained momentum during the year.
| | |
| 4 | | Legg Mason BW International Opportunities Bond Fund 2014 Annual Report |
Thank you for your investment in Legg Mason BW International Opportunities Bond Fund. As always, we appreciate that you have chosen us to manage your assets and we remain focused on achieving the Fund’s investment goals.
Sincerely,

David F. Hoffman, CFA
Portfolio Manager
Brandywine Global Investment Management, LLC

Stephen S. Smith
Portfolio Manager
Brandywine Global Investment Management, LLC

John P. McIntyre, CFA
Portfolio Manager
Brandywine Global Investment Management, LLC
January 20, 2015
RISKS: The Fund is non-diversified and may be more susceptible to economic, political or regulatory events than a diversified fund. Foreign securities involve special risks such as currency fluctuations and changes in political and economic conditions. These risks are magnified in emerging markets. The Fund’s share price will decline as interest rates rise. Below investment grade debt securities involve greater volatility than higher-rated securities. The Fund may engage in derivative transactions, which involve special risks and costs and may increase losses and may have a potentially large impact on Fund performance. Please see the Fund’s prospectus for a more complete discussion of these and other risks, and the Fund’s investment strategies.
All investments are subject to risk including the possible loss of principal. Past performance is no guarantee of future results. All index performance reflects no deduction for fees, expenses or taxes. Please note that an investor cannot invest directly in an index.
The information provided is not intended to be a forecast of future events, a guarantee of future results or investment advice. Views expressed may differ from those of the firm as a whole.
| i | The Citigroup World Government Bond Ex-U.S. Index (Unhedged) encompasses an all-inclusive universe of institutionally traded bonds, including all fixed-rate bonds with remaining maturities of one year or longer with amounts outstanding of at least the equivalent of $25 million. |
| ii | Effective duration measures the expected sensitivity of market price to changes in interest rates, taking into account the effects of structural complexities. (For example, some bonds can be prepaid by the issuer.) |
| iii | The European Central Bank (“ECB”) is responsible for the monetary system of the European Union and the euro currency. |
| iv | The Group of seven (“G7”) is a group consisting of the finance ministers and central bank governors of seven major advanced economies as reported by the International Monetary Fund: Canada, France, Germany, Italy, Japan, the United Kingdom, and the United States. |
| v | Duration is the measure of the price sensitivity of a fixed-income security to an interest rate change of 100 basis points. Calculation is based on the weighted average of the present values for all cash flows. |
| vi | The yield curve is the graphical depiction of the relationship between the yield on bonds of the same credit quality but different maturities. |
| | |
| Legg Mason BW International Opportunities Bond Fund 2014 Annual Report | | 5 |
Fund at a glance† (unaudited)
Investment breakdown (%) as a percent of total investments
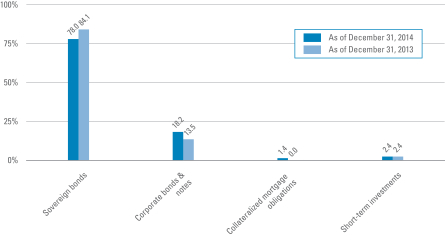
| † | The bar graph above represents the composition of the Fund’s investments as of December 31, 2014 and December 31, 2013 and does not include derivatives, such as forward foreign currency contracts. The Fund is actively managed. As a result, the composition of the Fund’s investments is subject to change at any time. |
| | |
| 6 | | Legg Mason BW International Opportunities Bond Fund 2014 Annual Report |
Fund expenses (unaudited)
Example
As a shareholder of the Fund, you may incur two types of costs: (1) transaction costs including front-end and back-end sales charges (loads) on purchase payments; and (2) ongoing costs, including management fees; service and/or distribution (12b-1) fees; and other Fund expenses. This example is intended to help you understand your ongoing costs (in dollars) of investing in the Fund and to compare these costs with the ongoing costs of investing in other mutual funds.
This example is based on an investment of $1,000 invested on July 1, 2014 and held for the six months ended December 31, 2014.
Actual expenses
The table below titled “Based on Actual Total Return” provides information about actual account values and actual expenses. You may use the information provided in this table, together with the amount you invested, to estimate the expenses that you paid over the period. To estimate the expenses you paid on your account, divide your ending account value by $1,000 (for example, an $8,600 ending account value divided by $1,000 = 8.6), then multiply the result by the number under the heading entitled “Expenses Paid During the Period”.
Hypothetical example for comparison purposes
The table below titled “Based on Hypothetical Total Return” provides information about hypothetical account values and hypothetical expenses based on the actual expense ratio and an assumed rate of return of 5.00% per year before expenses, which is not the Fund’s actual return. The hypothetical account values and expenses may not be used to estimate the actual ending account balance or expenses you paid for the period. You may use the information provided in this table to compare the ongoing costs of investing in the Fund and other funds. To do so, compare the 5.00% hypothetical example relating to the Fund with the 5.00% hypothetical examples that appear in the shareholder reports of the other funds.
Please note that the expenses shown in the table below are meant to highlight your ongoing costs only and do not reflect any transactional costs, such as front-end or back-end sales charges (loads). Therefore, the table is useful in comparing ongoing costs only, and will not help you determine the relative total costs of owning different funds. In addition, if these transaction costs were included, your costs would have been higher.
| | | | | | | | | | | | | | | | | | | | | | | | | | | | | | | | | | | | | | | | | | | | |
| Based on actual total return1 | | | | | Based on hypothetical total return1 | |
| | | Actual
Total Return
Without
Sales
Charge2 | | | Beginning
Account
Value | | | Ending
Account
Value | | | Annualized
Expense
Ratio | | | Expenses
Paid
During
the
Period3 | | | | | | | Hypothetical
Annualized
Total Return | | | Beginning
Account
Value | | | Ending
Account
Value | | | Annualized
Expense
Ratio | | | Expenses
Paid
During
the
Period3 | |
| Class A | | | -4.21 | % | | $ | 1,000.00 | | | $ | 957.90 | | | | 1.00 | % | | $ | 4.93 | | | | | Class A | | | 5.00 | % | | $ | 1,000.00 | | | $ | 1,020.16 | | | | 1.00 | % | | $ | 5.09 | |
| Class C | | | -4.52 | | | | 1,000.00 | | | | 954.80 | | | | 1.75 | | | | 8.62 | | | | | Class C | | | 5.00 | | | | 1,000.00 | | | | 1,016.38 | | | | 1.75 | | | | 8.89 | |
| Class C1 | | | -4.48 | | | | 1,000.00 | | | | 955.20 | | | | 1.45 | | | | 7.15 | | | | | Class C1 | | | 5.00 | | | | 1,000.00 | | | | 1,017.90 | | | | 1.45 | | | | 7.37 | |
| Class FI | | | -4.18 | | | | 1,000.00 | | | | 958.20 | | | | 1.00 | | | | 4.94 | | | | | Class FI | | | 5.00 | | | | 1,000.00 | | | | 1,020.16 | | | | 1.00 | | | | 5.09 | |
| Class R | | | -4.27 | | | | 1,000.00 | | | | 957.30 | | | | 1.25 | | | | 6.17 | | | | | Class R | | | 5.00 | | | | 1,000.00 | | | | 1,018.90 | | | | 1.25 | | | | 6.36 | |
| Class I | | | -4.13 | | | | 1,000.00 | | | | 958.70 | | | | 0.75 | | | | 3.70 | | | | | Class I | | | 5.00 | | | | 1,000.00 | | | | 1,021.42 | | | | 0.75 | | | | 3.82 | |
| Class IS | | | -4.08 | | | | 1,000.00 | | | | 959.20 | | | | 0.65 | | | | 3.21 | | | | | Class IS | | | 5.00 | | | | 1,000.00 | | | | 1,021.93 | | | | 0.65 | | | | 3.31 | |
| | |
| Legg Mason BW International Opportunities Bond Fund 2014 Annual Report | | 7 |
Fund expenses (unaudited) (cont’d)
| 1 | For the six months ended December 31, 2014. |
| 2 | Assumes the reinvestment of all distributions, including returns of capital, if any, at net asset value and does not reflect the deduction of the applicable sales charge with respect to Class A shares or the applicable contingent deferred sales charge (“CDSC”) with respect to Class C and Class C1 shares. Total return is not annualized, as it may not be representative of the total return for the year. Performance figures may reflect compensating balance arrangements, fee waivers and/or expense reimbursements. In the absence of compensating balance arrangements, fee waivers and/or expense reimbursements, the total return would have been lower. Past performance is no guarantee of future results. |
| 3 | Expenses (net of compensating balance arrangements, fee waivers and/or expense reimbursements) are equal to each class’ respective annualized expense ratio multiplied by the average account value over the period, multiplied by the number of days in the most recent fiscal half-year (184), then divided by 365. |
| | |
| 8 | | Legg Mason BW International Opportunities Bond Fund 2014 Annual Report |
Fund performance (unaudited)
| | | | | | | | | | | | | | | | | | | | | | | | | | | | |
| Average annual total returns | |
| Without sales charges1 | | Class A | | | Class C | | | Class C1¨ | | | Class FI | | | Class R | | | Class I | | | Class IS | |
| Twelve Months Ended 12/31/14 | | | 4.30 | % | | | 3.41 | % | | | 3.70 | % | | | 4.25 | % | | | 4.02 | % | | | 4.43 | % | | | 4.53 | % |
| Five Years Ended 12/31/14 | | | N/A | | | | N/A | | | | N/A | | | | N/A | | | | N/A | | | | N/A | | | | 5.32 | |
| Inception* through 12/31/14 | | | 4.34 | | | | 2.53 | | | | 3.82 | | | | 4.40 | | | | 4.06 | | | | 4.59 | | | | 5.38 | |
| | | | | | | |
| With sales charges2 | | Class A | | | Class C | | | Class C1¨ | | | Class FI | | | Class R | | | Class I | | | Class IS | |
| Twelve Months Ended 12/31/14 | | | -0.13 | % | | | 2.42 | % | | | 2.70 | % | | | 4.25 | % | | | 4.02 | % | | | 4.43 | % | | | 4.53 | % |
| Five Years Ended 12/31/14 | | | N/A | | | | N/A | | | | N/A | | | | N/A | | | | N/A | | | | N/A | | | | 5.32 | |
| Inception* through 12/31/14 | | | 2.92 | | | | 2.53 | | | | 3.82 | | | | 4.40 | | | | 4.06 | | | | 4.59 | | | | 5.38 | |
| | | | |
| Cumulative total returns | |
| Without sales charges1 | | | |
| Class A (Inception date of 10/31/11 through 12/31/14) | | | 14.41 | % |
| Class C (Inception date of 8/1/12 through 12/31/14) | | | 6.22 | |
| Class C1¨ (Inception date of 10/31/11 through 12/31/14) | | | 12.61 | |
| Class FI (Inception date of 10/31/11 through 12/31/14) | | | 14.63 | |
| Class R (Inception date of 10/31/11 through 12/31/14) | | | 13.44 | |
| Class I (Inception date of 10/31/11 through 12/31/14) | | | 15.28 | |
| Class IS (Inception date of 12/28/09 through 12/31/14) | | | 30.05 | |
All figures represent past performance and are not a guarantee of future results. Investment return and principal value of an investment will fluctuate so that an investor’s shares, when redeemed, may be worth more or less than their original cost. The returns shown do not reflect the deduction of taxes that a shareholder would pay on Fund distributions or the redemption of Fund shares. Performance figures may reflect compensating balance arrangements, fee waivers and/or expense reimbursements. In the absence of compensating balance arrangements, fee waivers and/or expense reimbursements, the total return would have been lower.
| 1 | Assumes the reinvestment of all distributions, including returns of capital, if any, at net asset value and does not reflect the deduction of the applicable sales charge with respect to Class A shares or the applicable contingent deferred sales charge (“CDSC”) with respect to Class C shares and Class C1¨ shares. |
| 2 | Assumes the reinvestment of all distributions, including returns of capital, if any, at net asset value. In addition, Class A shares reflect the deduction of the maximum initial sales charge of 4.25%. Class C shares and Class C1¨ shares reflect the deduction of a 1.00% CDSC, which applies if shares are redeemed within one year from purchase payment. |
| ¨ | On August 1, 2012, Class C shares were reclassified as Class C1 shares. |
| * | Inception date for Class A, C1¨, FI, R and I shares is October 31, 2011. Inception dates for Class C and IS shares are August 1, 2012 and December 28, 2009, respectively. |
| | |
| Legg Mason BW International Opportunities Bond Fund 2014 Annual Report | | 9 |
Fund performance (unaudited) (cont’d)
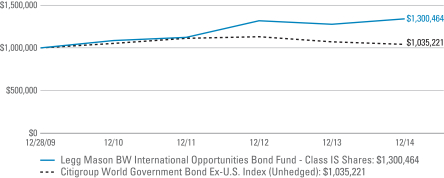
Historical performance
Value of $1,000,000 invested in
Class IS Shares of Legg Mason BW International Opportunities Bond Fund vs. Citigroup World Government Bond Ex-U.S. Index (Unhedged)† — December 28, 2009 - December 31, 2014
All figures represent past performance and are not a guarantee of future results. Investment return and principal value of an investment will fluctuate so that an investor’s shares, when redeemed, may be worth more or less than their original cost. The returns shown do not reflect the deduction of taxes that a shareholder would pay on Fund distributions or the redemption of Fund shares. Performance figures may reflect compensating balance arrangements, fee waivers and/or expense reimbursements. In the absence of compensating balance arrangements, fee waivers and/or expense reimbursements, the total return would have been lower.
| † | Hypothetical illustration of $1,000,000 invested in Class IS shares of Legg Mason BW International Opportunities Bond Fund on December 28, 2009 (inception date), assuming the reinvestment of all distributions, including returns of capital, if any, at net asset value through December 31, 2014. The hypothetical illustration also assumes a $1,000,000 investment in the Citigroup World Government Bond Ex-U.S. Index (Unhedged). The Citigroup World Government Bond Ex-U.S. Index (Unhedged) encompasses an all-inclusive universe of institutionally traded bonds, including all fixed-rate bonds with remaining maturities of one year or longer with amounts outstanding of at least the equivalent of $25 million. The Index is unmanaged and is not subject to the same management and trading expenses of a mutual fund. Please note that an investor cannot invest directly in an index. The performance of the Fund’s other classes may be greater or less than Class IS shares’ performance indicated on this chart, depending on whether greater or lesser charges and fees were incurred by shareholders investing in the other classes. |
| | |
| 10 | | Legg Mason BW International Opportunities Bond Fund 2014 Annual Report |
Schedule of investments
December 31, 2014
Legg Mason BW International Opportunities Bond Fund
| | | | | | | | | | | | | | | | |
| Security | | Rate | | | Maturity
Date | | | Face
Amount† | | | Value | |
| Sovereign Bonds — 76.8% | | | | | | | | | | | | | | | | |
Australia — 7.3% | | | | | | | | | | | | | | | | |
New South Wales Treasury Corp., Senior Notes | | | 5.000 | % | | | 8/20/24 | | | | 8,530,000 | AUD | | $ | 8,096,958 | |
Queensland Treasury Corp., Senior Bonds | | | 6.250 | % | | | 2/21/20 | | | | 8,715,000 | AUD | | | 8,375,753 | (a) |
Queensland Treasury Corp., Senior Notes | | | 6.000 | % | | | 7/21/22 | | | | 4,085,000 | AUD | | | 4,036,566 | (a) |
Total Australia | | | | | | | | | | | | | | | 20,509,277 | |
Brazil — 4.4% | | | | | | | | | | | | | | | | |
Federative Republic of Brazil, Notes | | | 10.000 | % | | | 1/1/21 | | | | 10,315,000 | BRL | | | 3,514,647 | |
Federative Republic of Brazil, Notes | | | 10.000 | % | | | 1/1/23 | | | | 24,470,000 | BRL | | | 8,185,842 | |
Federative Republic of Brazil, Notes | | | 10.000 | % | | | 1/1/25 | | | | 1,535,000 | BRL | | | 505,783 | |
Total Brazil | | | | | | | | | | | | | | | 12,206,272 | |
Hungary — 3.5% | | | | | | | | | | | | | | | | |
Republic of Hungary, Bonds | | | 7.500 | % | | | 11/12/20 | | | | 272,000,000 | HUF | | | 1,273,014 | |
Republic of Hungary, Bonds | | | 7.000 | % | | | 6/24/22 | | | | 390,000,000 | HUF | | | 1,836,029 | |
Republic of Hungary, Bonds | | | 6.000 | % | | | 11/24/23 | | | | 1,480,000,000 | HUF | | | 6,728,115 | |
Total Hungary | | | | | | | | | | | | | | | 9,837,158 | |
Indonesia — 3.7% | | | | | | | | | | | | | | | | |
Republic of Indonesia, Senior Bonds | | | 8.375 | % | | | 3/15/24 | | | | 15,200,000,000 | IDR | | | 1,277,917 | |
Republic of Indonesia, Senior Bonds | | | 9.000 | % | | | 3/15/29 | | | | 83,100,000,000 | IDR | | | 7,212,570 | |
Republic of Indonesia, Senior Bonds | | | 8.750 | % | | | 2/15/44 | | | | 22,600,000,000 | IDR | | | 1,845,567 | |
Total Indonesia | | | | | | | | | | | | | | | 10,336,054 | |
Italy — 8.6% | | | | | | | | | | | | | | | | |
Italy Buoni Poliennali Del Tesoro, Senior Bonds | | | 5.000 | % | | | 8/1/39 | | | | 15,005,000 | EUR | | | 24,128,993 | (a) |
Malaysia — 3.4% | | | | | | | | | | | | | | | | |
Federation of Malaysia, Senior Bonds | | | 4.048 | % | | | 9/30/21 | | | | 4,715,000 | MYR | | | 1,348,853 | |
Federation of Malaysia, Senior Bonds | | | 3.480 | % | | | 3/15/23 | | | | 29,690,000 | MYR | | | 8,110,375 | |
Total Malaysia | | | | | | | | | | | | | | | 9,459,228 | |
Mexico — 14.0% | | | | | | | | | | | | | | | | |
United Mexican States, Bonds | | | 8.500 | % | | | 5/31/29 | | | | 161,000,000 | MXN | | | 13,213,311 | |
United Mexican States, Bonds | | | 8.500 | % | | | 11/18/38 | | | | 124,300,000 | MXN | | | 10,459,499 | |
United Mexican States, Bonds | | | 7.750 | % | | | 11/13/42 | | | | 197,300,000 | MXN | | | 15,433,417 | |
Total Mexico | | | | | | | | | | | | | | | 39,106,227 | |
New Zealand — 3.8% | | | | | | | | | | | | | | | | |
Government of New Zealand, Senior Bonds | | | 5.500 | % | | | 4/15/23 | | | | 11,995,000 | NZD | | | 10,584,543 | (a) |
Norway — 2.4% | | | | | | | | | | | | | | | | |
Kommunalbanken AS, Senior Notes | | | 0.412 | % | | | 2/20/18 | | | | 6,584,000 | | | | 6,595,048 | (b)(c) |
Poland — 2.6% | | | | | | | | | | | | | | | | |
Republic of Poland, Bonds | | | 4.000 | % | | | 10/25/23 | | | | 22,615,000 | PLN | | | 7,198,271 | |
See Notes to Financial Statements.
| | |
| Legg Mason BW International Opportunities Bond Fund 2014 Annual Report | | 11 |
Schedule of investments (cont’d)
December 31, 2014
Legg Mason BW International Opportunities Bond Fund
| | | | | | | | | | | | | | | | |
| Security | | Rate | | | Maturity
Date | | | Face
Amount† | | | Value | |
Portugal — 5.7% | | | | | | | | | | | | | | | | |
Portugal Obrigacoes do Tesouro OT, Senior Bonds | | | 4.950 | % | | | 10/25/23 | | | | 5,700,000 | EUR | | $ | 8,183,299 | (a) |
Portugal Obrigacoes do Tesouro OT, Senior Bonds | | | 4.100 | % | | | 4/15/37 | | | | 6,095,000 | EUR | | | 7,841,519 | (a) |
Total Portugal | | | | | | | | | | | | | | | 16,024,818 | |
South Africa — 3.5% | | | | | | | | | | | | | | | | |
Republic of South Africa, Bonds | | | 6.750 | % | | | 3/31/21 | | | | 37,830,000 | ZAR | | | 3,133,447 | |
Republic of South Africa, Bonds | | | 6.500 | % | | | 2/28/41 | | | | 100,065,000 | ZAR | | | 6,746,056 | |
Total South Africa | | | | | | | | | | | | | | | 9,879,503 | |
South Korea — 4.4% | | | | | | | | | | | | | | | | |
Republic of Korea, Senior Bonds | | | 5.750 | % | | | 9/10/18 | | | | 9,123,500,000 | KRW | | | 9,341,347 | |
Republic of Korea, Senior Bonds | | | 3.375 | % | | | 9/10/23 | | | | 3,209,300,000 | KRW | | | 3,107,656 | |
Total South Korea | | | | | | | | | | | | | | | 12,449,003 | |
United Kingdom — 9.5% | | | | | | | | | | | | | | | | |
United Kingdom Gilt, Bonds | | | 2.750 | % | | | 1/22/15 | | | | 17,010,000 | GBP | | | 26,547,940 | (a) |
Total Sovereign Bonds (Cost — $222,748,144) | | | | 214,862,335 | |
| Collateralized Mortgage Obligations — 1.4% | | | | | | | | | | | | | | | | |
TDA CAM Fondo de Titulizacion de Activos, 2008 A
(Cost — $4,134,174) | | | 0.211 | % | | | 2/26/49 | | | | 3,450,125 | EUR | | | 3,913,268 | (a)(b) |
| Corporate Bonds & Notes — 17.9% | | | | | | | | | | | | | | | | |
| Financials — 17.9% | | | | | | | | | | | | | | | | |
Banks — 12.9% | | | | | | | | | | | | | | | | |
ANZ New Zealand International Ltd., Senior Notes | | | 0.753 | % | | | 4/27/17 | | | | 640,000 | | | | 641,517 | (b)(c) |
Bank Nederlandse Gemeenten NV, Senior Notes | | | 0.512 | % | | | 5/15/18 | | | | 10,400,000 | | | | 10,465,468 | (a)(b) |
Commonwealth Bank of Australia, Senior Notes | | | 0.747 | % | | | 9/20/16 | | | | 2,325,000 | | | | 2,332,677 | (b)(c) |
Export-Import Bank of Korea, Senior Notes | | | 0.823 | % | | | 5/12/17 | | | | 5,730,000 | | | | 5,730,516 | (b)(c) |
Export-Import Bank of Korea, Senior Notes | | | 0.850 | % | | | 8/14/17 | | | | 5,735,000 | | | | 5,737,890 | (b)(c) |
Nederlandse Waterschapsbank NV, Senior Notes | | | 0.463 | % | | | 2/14/18 | | | | 8,795,000 | | | | 8,853,276 | (b)(c) |
Shinhan Bank, Senior Notes | | | 0.883 | % | | | 4/8/17 | | | | 2,195,000 | | | | 2,201,622 | (b)(c) |
Total Banks | | | | | | | | | | | | | | | 35,962,966 | |
Capital Markets — 2.9% | | | | | | | | | | | | | | | | |
Deutsche Bank AG, Senior Notes | | | 0.843 | % | | | 2/13/17 | | | | 4,275,000 | | | | 4,283,357 | (b) |
Macquarie Bank Ltd., Senior Notes | | | 0.864 | % | | | 10/27/17 | | | | 2,290,000 | | | | 2,294,097 | (b)(c) |
Macquarie Group Ltd., Senior Notes | | | 1.233 | % | | | 1/31/17 | | | | 1,520,000 | | | | 1,535,103 | (b)(c) |
Total Capital Markets | | | | | | | | | | | | | | | 8,112,557 | |
Diversified Financial Services — 2.1% | | | | | | | | | | | | | | | | |
Svensk Exportkredit AB, Senior Notes | | | 0.531 | % | | | 1/23/17 | | | | 3,660,000 | | | | 3,675,401 | (b) |
Svensk Exportkredit AB, Senior Notes | | | 0.420 | % | | | 6/12/17 | | | | 1,380,000 | | | | 1,382,546 | (b) |
See Notes to Financial Statements.
| | |
| 12 | | Legg Mason BW International Opportunities Bond Fund 2014 Annual Report |
Legg Mason BW International Opportunities Bond Fund
| | | | | | | | | | | | | | | | |
| Security | | Rate | | | Maturity
Date | | | Face
Amount† | | | Value | |
Diversified Financial Services — continued | | | | | | | | | | | | | | | | |
Svensk Exportkredit AB, Senior Notes | | | 0.607 | % | | | 11/9/17 | | | | 850,000 | | | $ | 858,498 | (a)(b) |
Total Diversified Financial Services | | | | | | | | | | | | | | | 5,916,445 | |
Total Corporate Bonds & Notes (Cost — $49,988,191) | | | | 49,991,968 | |
Total Investments before Short-Term Investments (Cost — $276,870,509) | | | | 268,767,571 | |
| | |
| | | | Shares | | | | |
| Short-Term Investments — 2.4% | | | | | | | | | | | | | | | | |
State Street Institutional Liquid Reserves Fund, Premier Class (Cost — $6,627,959) | | | 0.060 | % | | | | | | | 6,627,959 | | | | 6,627,959 | |
Total Investments — 98.5% (Cost — $283,498,468#) | | | | 275,395,530 | |
Other Assets in Excess of Liabilities — 1.5% | | | | 4,174,944 | |
Total Net Assets — 100.0% | | | $ | 279,570,474 | |
| † | Face amount denominated in U.S. dollars, unless otherwise noted. |
| (a) | Security is exempt from registration under Regulation S of the Securities Act of 1933. Regulation S applies to securities offerings that are made outside of the United States and do not involve direct selling efforts in the United States. This security has been deemed liquid pursuant to guidelines approved by the Board of Trustees, unless otherwise noted. |
| (b) | Variable rate security. Interest rate disclosed is as of the most recent information available. |
| (c) | Security is exempt from registration under Rule 144A of the Securities Act of 1933. This security may be resold in transactions that are exempt from registration, normally to qualified institutional buyers. This security has been deemed liquid pursuant to guidelines approved by the Board of Trustees, unless otherwise noted. |
| # | Aggregate cost for federal income tax purposes is $284,575,417. |
| | |
Abbreviations used in this schedule: |
| AUD | | — Australian Dollar |
| BRL | | — Brazilian Real |
| EUR | | — Euro |
| GBP | | — British Pound |
| HUF | | — Hungarian Forint |
| IDR | | — Indonesian Rupiah |
| KRW | | — South Korean Won |
| MXN | | — Mexican Peso |
| MYR | | — Malaysian Ringgit |
| NZD | | — New Zealand Dollar |
| PLN | | — Polish Zloty |
| ZAR | | — South African Rand |
See Notes to Financial Statements.
| | |
| Legg Mason BW International Opportunities Bond Fund 2014 Annual Report | | 13 |
Schedule of investments (cont’d)
December 31, 2014
Legg Mason BW International Opportunities Bond Fund
| | | | |
| Summary of Investments by Country* (unaudited) | |
| Mexico | | | 14.2 | % |
| Australia | | | 9.7 | |
| United Kingdom | | | 9.6 | |
| South Korea | | | 9.5 | |
| Italy | | | 8.8 | |
| Netherlands | | | 7.0 | |
| Portugal | | | 5.8 | |
| Brazil | | | 4.4 | |
| New Zealand | | | 4.1 | |
| Indonesia | | | 3.8 | |
| South Africa | | | 3.6 | |
| Hungary | | | 3.6 | |
| Malaysia | | | 3.4 | |
| Poland | | | 2.6 | |
| Norway | | | 2.4 | |
| Sweden | | | 2.1 | |
| Germany | | | 1.6 | |
| Spain | | | 1.4 | |
| Short-Term Investments | | | 2.4 | |
| | | | 100.0 | % |
| * | As a percentage of total investments. Please note that the Fund holdings are as of December 31, 2014 and are subject to change. |
See Notes to Financial Statements.
| | |
| 14 | | Legg Mason BW International Opportunities Bond Fund 2014 Annual Report |
Statement of assets and liabilities
December 31, 2014
| | | | |
| |
| Assets: | | | | |
Investments, at value (Cost — $283,498,468) | | $ | 275,395,530 | |
Cash | | | 800 | |
Interest receivable | | | 3,322,523 | |
Unrealized appreciation on forward foreign currency contracts | | | 1,379,179 | |
Receivable for Fund shares sold | | | 562,692 | |
Prepaid expenses | | | 93,385 | |
Total Assets | | | 280,754,109 | |
| |
| Liabilities: | | | | |
Payable for Fund shares repurchased | | | 455,608 | |
Unrealized depreciation on forward foreign currency contracts | | | 437,020 | |
Investment management fee payable | | | 76,260 | |
Service and/or distribution fees payable | | | 19,582 | |
Accrued foreign capital gains tax | | | 9,102 | |
Trustees’ fees payable | | | 4,483 | |
Accrued expenses | | | 181,580 | |
Total Liabilities | | | 1,183,635 | |
| Total Net Assets | | $ | 279,570,474 | |
| |
| Net Assets: | | | | |
Par value (Note 7) | | $ | 244 | |
Paid-in capital in excess of par value | | | 290,861,969 | |
Overdistributed net investment income | | | (1,976,669) | |
Accumulated net realized loss on investments and foreign currency transactions | | | (1,939,560) | |
Net unrealized depreciation on investments and foreign currencies | | | (7,375,510) | * |
| Total Net Assets | | $ | 279,570,474 | |
See Notes to Financial Statements.
| | |
| Legg Mason BW International Opportunities Bond Fund 2014 Annual Report | | 15 |
Statement of assets and liabilities (cont’d)
December 31, 2014
| | | | |
| |
| Shares Outstanding: | | | | |
Class A | | | 735,805 | |
Class C | | | 54,957 | |
Class C1 | | | 954 | |
Class FI | | | 6,933,444 | |
Class R | | | 1,441 | |
Class I | | | 14,449,175 | |
Class IS | | | 2,210,665 | |
| |
| Net Asset Value: | | | | |
Class A (and redemption price) | | | $11.46 | |
Class C** | | | $11.46 | |
Class C1** | | | $11.46 | |
Class FI (and redemption price) | | | $11.47 | |
Class R (and redemption price) | | | $11.46 | |
Class I (and redemption price) | | | $11.46 | |
Class IS (and redemption price) | | | $11.45 | |
| Maximum Public Offering Price Per Share: | | | | |
Class A (based on maximum initial sales charge of 4.25%) | | | $11.97 | |
| * | Net of accrued foreign capital gains tax of $9,102. |
| ** | Redemption price per share is NAV of Class C and Class C1 shares reduced by a 1.00% CDSC, if shares are redeemed within one year from purchase payment (See Note 2). |
See Notes to Financial Statements.
| | |
| 16 | | Legg Mason BW International Opportunities Bond Fund 2014 Annual Report |
Statement of operations
For the Year Ended December 31, 2014
| | | | |
| |
| Investment Income: | | | | |
Interest | | $ | 9,196,657 | |
Less: Foreign taxes withheld | | | (194,458) | |
Total Investment Income | | | 9,002,199 | |
| |
| Expenses: | | | | |
Investment management fee (Note 2) | | | 1,129,777 | |
Transfer agent fees (Note 5) | | | 344,565 | |
Service and/or distribution fees (Notes 2 and 5) | | | 128,779 | |
Custody fees | | | 97,783 | |
Registration fees | | | 89,769 | |
Audit and tax fees | | | 46,083 | |
Fund accounting fees | | | 33,081 | |
Legal fees | | | 32,527 | |
Shareholder reports | | | 25,324 | |
Trustees’ fees | | | 23,611 | |
Fees recaptured by investment manager (Note 2) | | | 10,059 | |
Insurance | | | 2,646 | |
Miscellaneous expenses | | | 5,844 | |
Total Expenses | | | 1,969,848 | |
Less: Fee waivers and/or expense reimbursements (Notes 2 and 5) | | | (174,243) | |
Net Expenses | | | 1,795,605 | |
| Net Investment Income | | | 7,206,594 | |
| |
Realized and Unrealized Gain (Loss) on Investments and
Foreign Currency Transactions (Notes 1, 3 and 4): | | | | |
Net Realized Gain From: | | | | |
Investment transactions | | | 2,364,671 | |
Foreign currency transactions | | | 167,977 | |
Net Realized Gain | | | 2,532,648 | |
Change in Net Unrealized Appreciation (Depreciation) From: | | | | |
Investments | | | (8,686,735) | 1 |
Foreign currencies | | | 804,127 | |
Change in Net Unrealized Appreciation (Depreciation) | | | (7,882,608) | |
| Net Loss on Investments and Foreign Currency Transactions | | | (5,349,960) | |
| Increase in Net Assets from Operations | | $ | 1,856,634 | |
| 1 | Net of change in accrued foreign capital gains tax of $9,102. |
See Notes to Financial Statements.
| | |
| Legg Mason BW International Opportunities Bond Fund 2014 Annual Report | | 17 |
Statements of changes in net assets
| | | | | | | | |
| For the Years Ended December 31, | | 2014 | | | 2013 | |
| | |
| Operations: | | | | | | | | |
Net investment income | | $ | 7,206,594 | | | $ | 2,963,044 | |
Net realized gain (loss) | | | 2,532,648 | | | | (329,104) | |
Change in net unrealized appreciation (depreciation) | | | (7,882,608) | | | | (3,648,620) | |
Increase (Decrease) in Net Assets from Operations | | | 1,856,634 | | | | (1,014,680) | |
| | |
| Distributions to Shareholders From (Notes 1 and 6): | | | | | | | | |
Net investment income | | | (8,280,395) | | | | (1,757,179) | |
Net realized gains | | | (2,983,902) | | | | (3,488,190) | |
Decrease in Net Assets from Distributions to Shareholders | | | (11,264,297) | | | | (5,245,369) | |
| | |
| Fund Share Transactions (Note 7): | | | | | | | | |
Net proceeds from sale of shares | | | 223,288,579 | | | | 121,598,509 | |
Reinvestment of distributions | | | 8,896,194 | | | | 3,975,025 | |
Cost of shares repurchased | | | (76,860,198) | | | | (63,329,619) | |
Increase in Net Assets from Fund Share Transactions | | | 155,324,575 | | | | 62,243,915 | |
Increase in Net Assets | | | 145,916,912 | | | | 55,983,866 | |
| | |
| Net Assets: | | | | | | | | |
Beginning of year | | | 133,653,562 | | | | 77,669,696 | |
End of year* | | $ | 279,570,474 | | | $ | 133,653,562 | |
*Includesoverdistributed net investment income of: | | | $(1,976,669) | | | | $(1,241,398) | |
See Notes to Financial Statements.
| | |
| 18 | | Legg Mason BW International Opportunities Bond Fund 2014 Annual Report |
Financial highlights
| | | | | | | | | | | | | | | | |
For a share of each class of beneficial interest outstanding throughout each year ended December 31,
unless otherwise noted: | |
| Class A Shares1 | | 2014 | | | 2013 | | | 2012 | | | 20112 | |
| | | | |
| Net asset value, beginning of year | | | $11.50 | | | | $12.65 | | | | $11.76 | | | | $12.16 | |
| | | | |
| Income (loss) from operations: | | | | | | | | | | | | | | | | |
Net investment income | | | 0.35 | | | | 0.36 | | | | 0.45 | | | | 0.08 | |
Net realized and unrealized gain (loss) | | | 0.15 | | | | (0.78) | | | | 1.29 | | | | (0.25) | |
Total income (loss) from operations | | | 0.50 | | | | (0.42) | | | | 1.74 | | | | (0.17) | |
| | | | |
| Less distributions from: | | | | | | | | | | | | | | | | |
Net investment income | | | (0.41) | | | | (0.22) | | | | (0.51) | | | | (0.14) | |
Net realized gains | | | (0.13) | | | | (0.51) | | | | (0.34) | | | | (0.09) | |
Total distributions | | | (0.54) | | | | (0.73) | | | | (0.85) | | | | (0.23) | |
| | | | |
| Net asset value, end of year | | | $11.46 | | | | $11.50 | | | | $12.65 | | | | $11.76 | |
Total return3 | | | 4.30 | % | | | (3.43) | % | | | 15.21 | % | | | (1.40) | % |
| | | | |
| Net assets, end of year (000s) | | | $8,431 | | | | $5,504 | | | | $93 | | | | $10 | |
| | | | |
| Ratios to average net assets: | | | | | | | | | | | | | | | | |
Gross expenses | | | 1.17 | % | | | 1.42 | % | | | 1.33 | % | | | 1.35 | %4 |
Net expenses5,6,7 | | | 1.00 | | | | 0.96 | | | | 0.99 | | | | 1.00 | 4 |
Net investment income | | | 2.97 | | | | 3.08 | | | | 3.68 | | | | 3.96 | 4 |
| | | | |
| Portfolio turnover rate | | | 43 | % | | | 81 | % | | | 76 | % | | | 53 | % |
| 1 | Per share amounts have been calculated using the average shares method. |
| 2 | For the period October 31, 2011 (inception date) to December 31, 2011. |
| 3 | Performance figures, exclusive of sales charges, may reflect compensating balance arrangements, fee waivers and/or expense reimbursements. In the absence of compensating balance arrangements, fee waivers and/or expense reimbursements, the total return would have been lower. Past performance is no guarantee of future results. Total returns for periods of less than one year are not annualized. |
| 5 | As a result of an expense limitation arrangement, the ratio of expenses, other than interest, brokerage commissions, dividend expense on short sales, taxes, extraordinary expenses and acquired fund fees and expenses, to average net assets of Class A shares did not exceed 1.00%. This expense limitation arrangement cannot be terminated prior to December 31, 2016 without the Board of Trustees’ consent. |
| 6 | Reflects fee waivers and/or expense reimbursements. |
| 7 | The impact of compensating balance arrangements, if any, was less than 0.01%. |
See Notes to Financial Statements.
| | |
| Legg Mason BW International Opportunities Bond Fund 2014 Annual Report | | 19 |
Financial highlights (cont’d)
| | | | | | | | | | | | |
For a share of each class of beneficial interest outstanding throughout each year ended December 31,
unless otherwise noted: | |
| Class C Shares1 | | 2014 | | | 2013 | | | 20122 | |
| | | |
| Net asset value, beginning of year | | | $11.51 | | | | $12.65 | | | | $12.12 | |
| | | |
| Income (loss) from operations: | | | | | | | | | | | | |
Net investment income | | | 0.27 | | | | 0.27 | | | | 0.15 | |
Net realized and unrealized gain (loss) | | | 0.13 | | | | (0.77) | | | | 0.71 | |
Total income (loss) from operations | | | 0.40 | | | | (0.50) | | | | 0.86 | |
| | | |
| Less distributions from: | | | | | | | | | | | | |
Net investment income | | | (0.32) | | | | (0.13) | | | | (0.18) | |
Net realized gains | | | (0.13) | | | | (0.51) | | | | (0.15) | |
Total distributions | | | (0.45) | | | | (0.64) | | | | (0.33) | |
| | | |
| Net asset value, end of year | | | $11.46 | | | | $11.51 | | | | $12.65 | |
Total return3 | | | 3.41 | % | | | (4.11) | % | | | 7.12 | % |
| | | |
| Net assets, end of year (000s) | | | $630 | | | | $353 | | | | $42 | |
| | | |
| Ratios to average net assets: | | | | | | | | | | | | |
Gross expenses | | | 1.94 | %4 | | | 2.27 | % | | | 2.06 | %5 |
Net expenses6,7,8 | | | 1.75 | 4 | | | 1.74 | | | | 1.74 | 5 |
Net investment income | | | 2.24 | | | | 2.35 | | | | 2.98 | 5 |
| | | |
| Portfolio turnover rate | | | 43 | % | | | 81 | % | | | 76 | % |
| 1 | Per share amounts have been calculated using the average shares method. |
| 2 | For the period August 1, 2012 (inception date) to December 31, 2012. |
| 3 | Performance figures, exclusive of CDSC, may reflect compensating balance arrangements, fee waivers and/or expense reimbursements. In the absence of compensating balance arrangements, fee waivers and/or expense reimbursements, the total return would have been lower. Past performance is no guarantee of future results. Total returns for periods of less than one year are not annualized. |
| 4 | Reflects recapture of expenses waived/reimbursed from prior fiscal years. |
| 6 | As a result of an expense limitation arrangement, the ratio of expenses, other than interest, brokerage commissions, dividend expense on short sales, taxes, extraordinary expenses and acquired fund fees and expenses, to average net assets of Class C shares did not exceed 1.75%. This expense limitation arrangement cannot be terminated prior to December 31, 2016 without the Board of Trustees’ consent. |
| 7 | Reflects fee waivers and/or expense reimbursements. |
| 8 | The impact of compensating balance arrangements, if any, was less than 0.01%. |
See Notes to Financial Statements.
| | |
| 20 | | Legg Mason BW International Opportunities Bond Fund 2014 Annual Report |
| | | | | | | | | | | | | | | | |
For a share of each class of beneficial interest outstanding throughout each year ended December 31,
unless otherwise noted: | |
| Class C1 Shares1,2 | | 2014 | | | 2013 | | | 2012 | | | 20113 | |
| | | | |
| Net asset value, beginning of year | | | $11.50 | | | | $12.65 | | | | $11.76 | | | | $12.16 | |
| | | | |
| Income (loss) from operations: | | | | | | | | | | | | | | | | |
Net investment income | | | 0.31 | | | | 0.33 | | | | 0.39 | | | | 0.07 | |
Net realized and unrealized gain (loss) | | | 0.12 | | | | (0.80) | | | | 1.29 | | | | (0.25) | |
Total income (loss) from operations | | | 0.43 | | | | (0.47) | | | | 1.68 | | | | (0.18) | |
| | | | |
| Less distributions from: | | | | | | | | | | | | | | | | |
Net investment income | | | (0.34) | | | | (0.17) | | | | (0.45) | | | | (0.13) | |
Net realized gains | | | (0.13) | | | | (0.51) | | | | (0.34) | | | | (0.09) | |
Total distributions | | | (0.47) | | | | (0.68) | | | | (0.79) | | | | (0.22) | |
| | | | |
| Net asset value, end of year | | | $11.46 | | | | $11.50 | | | | $12.65 | | | | $11.76 | |
Total return4 | | | 3.70 | % | | | (3.90) | % | | | 14.69 | % | | | (1.47) | % |
| | | | |
| Net assets, end of year (000s) | | | $11 | | | | $22 | | | | $33 | | | | $10 | |
| | | | |
| Ratios to average net assets: | | | | | | | | | | | | | | | | |
Gross expenses | | | 1.65 | %5 | | | 2.27 | % | | | 1.93 | % | | | 1.79 | %6 |
Net expenses7,8,9 | | | 1.45 | 5 | | | 1.45 | | | | 1.45 | | | | 1.45 | 6 |
Net investment income | | | 2.61 | | | | 2.75 | | | | 3.21 | | | | 3.51 | 6 |
| | | | |
| Portfolio turnover rate | | | 43 | % | | | 81 | % | | | 76 | % | | | 53 | % |
| 1 | On August 1, 2012, Class C shares were reclassified as Class C1 shares. |
| 2 | Per share amounts have been calculated using the average shares method. |
| 3 | For the period October 31, 2011 (inception date) to December 31, 2011. |
| 4 | Performance figures, exclusive of CDSC, may reflect compensating balance arrangements, fee waivers and/or expense reimbursements. In the absence of compensating balance arrangements, fee waivers and/or expense reimbursements, the total return would have been lower. Past performance is no guarantee of future results. Total returns for periods of less than one year are not annualized. |
| 5 | Reflects recapture of expenses waived/reimbursed from prior fiscal years. |
| 7 | As a result of an expense limitation arrangement, the ratio of expenses, other than interest, brokerage commissions, dividend expense on short sales, taxes, extraordinary expenses and acquired fund fees and expenses, to average net assets of Class C1 shares did not exceed 1.45%. This expense limitation arrangement cannot be terminated prior to December 31, 2016 without the Board of Trustees’ consent. |
| 8 | Reflects fee waivers and/or expense reimbursements. |
| 9 | The impact of compensating balance arrangements, if any, was less than 0.01%. |
See Notes to Financial Statements.
| | |
| Legg Mason BW International Opportunities Bond Fund 2014 Annual Report | | 21 |
Financial highlights (cont’d)
| | | | | | | | | | | | | | | | |
For a share of each class of beneficial interest outstanding throughout each year ended December 31,
unless otherwise noted: | |
| Class FI Shares1 | | 2014 | | | 2013 | | | 2012 | | | 20112 | |
| | | | |
| Net asset value, beginning of year | | | $11.52 | | | | $12.66 | | | | $11.76 | | | | $12.16 | |
| | | | |
| Income (loss) from operations: | | | | | | | | | | | | | | | | |
Net investment income | | | 0.34 | | | | 0.38 | | | | 0.42 | | | | 0.08 | |
Net realized and unrealized gain (loss) | | | 0.15 | | | | (0.78) | | | | 1.33 | | | | (0.25) | |
Total income (loss) from operations | | | 0.49 | | | | (0.40) | | | | 1.75 | | | | (0.17) | |
| | | | |
| Less distributions from: | | | | | | | | | | | | | | | | |
Net investment income | | | (0.41) | | | | (0.23) | | | | (0.51) | | | | (0.14) | |
Net realized gains | | | (0.13) | | | | (0.51) | | | | (0.34) | | | | (0.09) | |
Total distributions | | | (0.54) | | | | (0.74) | | | | (0.85) | | | | (0.23) | |
| | | | |
| Net asset value, end of year | | | $11.47 | | | | $11.52 | | | | $12.66 | | | | $11.76 | |
Total return3 | | | 4.25 | % | | | (3.27) | % | | | 15.30 | % | | | (1.40) | % |
| | | | |
| Net assets, end of year (000s) | | | $79,514 | | | | $271 | | | | $11 | | | | $2,350 | |
| | | | |
| Ratios to average net assets: | | | | | | | | | | | | | | | | |
Gross expenses | | | 1.12 | %4 | | | 1.35 | %4 | | | 1.31 | % | | | 1.32 | %5 |
Net expenses6,7,8 | | | 1.00 | 4 | | | 0.82 | 4 | | | 0.99 | | | | 1.00 | 5 |
Net investment income | | | 2.89 | | | | 3.24 | | | | 3.49 | | | | 4.07 | 5 |
| | | | |
| Portfolio turnover rate | | | 43 | % | | | 81 | % | | | 76 | % | | | 53 | % |
| 1 | Per share amounts have been calculated using the average shares method. |
| 2 | For the period October 31, 2011 (inception date) to December 31, 2011. |
| 3 | Performance figures may reflect compensating balance arrangements, fee waivers and/or expense reimbursements. In the absence of compensating balance arrangements, fee waivers and/or expense reimbursements, the total return would have been lower. Past performance is no guarantee of future results. Total returns for periods of less than one year are not annualized. |
| 4 | Reflects recapture of expenses waived/reimbursed from prior fiscal years. |
| 6 | As a result of an expense limitation arrangement, the ratio of expenses, other than interest, brokerage commissions, dividend expense on short sales, taxes, extraordinary expenses and acquired fund fees and expenses, to average net assets of Class FI shares did not exceed 1.00%. This expense limitation arrangement cannot be terminated prior to December 31, 2016 without the Board of Trustees’ consent. |
| 7 | Reflects fee waivers and/or expense reimbursements. |
| 8 | The impact of compensating balance arrangements, if any, was less than 0.01%. |
See Notes to Financial Statements.
| | |
| 22 | | Legg Mason BW International Opportunities Bond Fund 2014 Annual Report |
| | | | | | | | | | | | | | | | |
For a share of each class of beneficial interest outstanding throughout each year ended December 31,
unless otherwise noted: | |
| Class R Shares1 | | 2014 | | | 2013 | | | 2012 | | | 20112 | |
| | | | |
| Net asset value, beginning of year | | | $11.50 | | | | $12.65 | | | | $11.76 | | | | $12.16 | |
| | | | |
| Income (loss) from operations: | | | | | | | | | | | | | | | | |
Net investment income | | | 0.33 | | | | 0.35 | | | | 0.41 | | | | 0.07 | |
Net realized and unrealized gain (loss) | | | 0.14 | | | | (0.80) | | | | 1.29 | | | | (0.25) | |
Total income (loss) from operations | | | 0.47 | | | | (0.45) | | | | 1.70 | | | | (0.18) | |
| | | | |
| Less distributions from: | | | | | | | | | | | | | | | | |
Net investment income | | | (0.38) | | | | (0.19) | | | | (0.47) | | | | (0.13) | |
Net realized gains | | | (0.13) | | | | (0.51) | | | | (0.34) | | | | (0.09) | |
Total distributions | | | (0.51) | | | | (0.70) | | | | (0.81) | | | | (0.22) | |
| | | | |
| Net asset value, end of year | | | $11.46 | | | | $11.50 | | | | $12.65 | | | | $11.76 | |
Total return3 | | | 4.02 | % | | | (3.71) | % | | | 14.93 | % | | | (1.45) | % |
| | | | |
| Net assets, end of year (000s) | | | $16 | | | | $11 | | | | $11 | | | | $10 | |
| | | | |
| Ratios to average net assets: | | | | | | | | | | | | | | | | |
Gross expenses | | | 1.43 | % | | | 1.92 | % | | | 1.64 | % | | | 1.58 | %4 |
Net expenses5,6,7 | | | 1.25 | | | | 1.25 | | | | 1.24 | | | | 1.25 | 4 |
Net investment income | | | 2.77 | | | | 2.94 | | | | 3.36 | | | | 3.71 | 4 |
| | | | |
| Portfolio turnover rate | | | 43 | % | | | 81 | % | | | 76 | % | | | 53 | % |
| 1 | Per share amounts have been calculated using the average shares method. |
| 2 | For the period October 31, 2011 (inception date) to December 31, 2011. |
| 3 | Performance figures may reflect compensating balance arrangements, fee waivers and/or expense reimbursements. In the absence of compensating balance arrangements, fee waivers and/or expense reimbursements, the total return would have been lower. Past performance is no guarantee of future results. Total returns for periods of less than one year are not annualized. |
| 5 | As a result of an expense limitation arrangement, the ratio of expenses, other than interest, brokerage commissions, dividend expense on short sales, taxes, extraordinary expenses and acquired fund fees and expenses, to average net assets of Class R shares did not exceed 1.25%. This expense limitation arrangement cannot be terminated prior to December 31, 2016 without the Board of Trustees’ consent. |
| 6 | Reflects fee waivers and/or expense reimbursements. |
| 7 | The impact of compensating balance arrangements, if any, was less than 0.01%. |
See Notes to Financial Statements.
| | |
| Legg Mason BW International Opportunities Bond Fund 2014 Annual Report | | 23 |
Financial highlights (cont’d)
| | | | | | | | | | | | | | | | |
For a share of each class of beneficial interest outstanding throughout each year ended December 31,
unless otherwise noted: | |
| Class I Shares1 | | 2014 | | | 2013 | | | 2012 | | | 20112 | |
| | | | |
| Net asset value, beginning of year | | | $11.51 | | | | $12.65 | | | | $11.76 | | | | $12.16 | |
| | | | |
| Income (loss) from operations: | | | | | | | | | | | | | | | | |
Net investment income | | | 0.39 | | | | 0.39 | | | | 0.49 | | | | 0.08 | |
Net realized and unrealized gain (loss) | | | 0.12 | | | | (0.76) | | | | 1.28 | | | | (0.25) | |
Total income (loss) from operations | | | 0.51 | | | | (0.37) | | | | 1.77 | | | | (0.17) | |
| | | | |
| Less distributions from: | | | | | | | | | | | | | | | | |
Net investment income | | | (0.43) | | | | (0.26) | | | | (0.54) | | | | (0.14) | |
Net realized gains | | | (0.13) | | | | (0.51) | | | | (0.34) | | | | (0.09) | |
Total distributions | | | (0.56) | | | | (0.77) | | | | (0.88) | | | | (0.23) | |
| | | | |
| Net asset value, end of year | | | $11.46 | | | | $11.51 | | | | $12.65 | | | | $11.76 | |
Total return3 | | | 4.43 | % | | | (3.10) | % | | | 15.50 | % | | | (1.36) | % |
| | | | |
| Net assets, end of year (000s) | | | $165,649 | | | | $109,850 | | | | $10,117 | | | | $10 | |
| | | | |
| Ratios to average net assets: | | | | | | | | | | | | | | | | |
Gross expenses | | | 0.82 | %4 | | | 1.03 | %4 | | | 1.11 | % | | | 1.09 | %5 |
Net expenses6,7,8 | | | 0.75 | 4 | | | 0.72 | 4 | | | 0.75 | | | | 0.75 | 5 |
Net investment income | | | 3.26 | | | | 3.34 | | | | 4.01 | | | | 4.22 | 5 |
| | | | |
| Portfolio turnover rate | | | 43 | % | | | 81 | % | | | 76 | % | | | 53 | % |
| 1 | Per share amounts have been calculated using the average shares method. |
| 2 | For the period October 31, 2011 (inception date) to December 31, 2011. |
| 3 | Performance figures may reflect compensating balance arrangements, fee waivers and/or expense reimbursements. In the absence of compensating balance arrangements, fee waivers and/or expense reimbursements, the total return would have been lower. Past performance is no guarantee of future results. Total returns for periods of less than one year are not annualized. |
| 4 | Reflects recapture of expenses waived/reimbursed from prior fiscal years. |
| 6 | As a result of an expense limitation arrangement, the ratio of expenses, other than interest, brokerage commissions, dividend expense on short sales, taxes, extraordinary expenses and acquired fund fees and expenses, to average net assets of Class I shares did not exceed 0.75%. This expense limitation arrangement cannot be terminated prior to December 31, 2016 without the Board of Trustees’ consent. |
| 7 | Reflects fee waivers and/or expense reimbursements. |
| 8 | The impact of compensating balance arrangements, if any, was less than 0.01%. |
See Notes to Financial Statements.
| | |
| 24 | | Legg Mason BW International Opportunities Bond Fund 2014 Annual Report |
| | | | | | | | | | | | | | | | | | | | |
| For a share of each class of beneficial interest outstanding throughout each year ended December 31: | |
| Class IS Shares | | 20141 | | | 20131 | | | 20121 | | | 20111 | | | 2010 | |
| | | | | |
| Net asset value, beginning of year | | | $11.50 | | | | $12.64 | | | | $11.75 | | | | $12.06 | | | | $12.04 | |
| | | | | |
| Income (loss) from operations: | | | | | | | | | | | | | | | | | | | | |
Net investment income | | | 0.40 | | | | 0.43 | | | | 0.48 | | | | 0.50 | | | | 0.41 | |
Net realized and unrealized gain (loss) | | | 0.12 | | | | (0.80) | | | | 1.30 | | | | (0.12) | | | | 0.44 | |
Total income (loss) from operations | | | 0.52 | | | | (0.37) | | | | 1.78 | | | | 0.38 | | | | 0.85 | |
| | | | | |
| Less distributions from: | | | | | | | | | | | | | | | | | | | | |
Net investment income | | | (0.44) | | | | (0.26) | | | | (0.55) | | | | (0.60) | | | | (0.78) | |
Net realized gains | | | (0.13) | | | | (0.51) | | | | (0.34) | | | | (0.09) | | | | (0.05) | |
Total distributions | | | (0.57) | | | | (0.77) | | | | (0.89) | | | | (0.69) | | | | (0.83) | |
| | | | | |
| Net asset value, end of year | | | $11.45 | | | | $11.50 | | | | $12.64 | | | | $11.75 | | | | $12.06 | |
Total return2 | | | 4.53 | % | | | (3.05) | % | | | 15.61 | % | | | 3.19 | % | | | 7.21 | % |
| | | | | |
| Net assets, end of year (000s) | | | $25,319 | | | | $17,643 | | | | $67,363 | | | | $82,823 | | | | $33,396 | |
| | | | | |
| Ratios to average net assets: | | | | | | | | | | | | | | | | | | | | |
Gross expenses | | | 0.69 | %3 | | | 1.10 | % | | | 0.90 | % | | | 0.86 | % | | | 2.04 | % |
Net expenses4,5,6 | | | 0.65 | 3 | | | 0.65 | | | | 0.65 | | | | 0.65 | | | | 0.65 | |
Net investment income | | | 3.36 | | | | 3.59 | | | | 3.93 | | | | 4.16 | | | | 3.40 | |
| | | | | |
| Portfolio turnover rate | | | 43 | % | | | 81 | % | | | 76 | % | | | 53 | % | | | 49 | % |
| 1 | Per share amounts have been calculated using the average shares method. |
| 2 | Performance figures may reflect compensating balance arrangements, fee waivers and/or expense reimbursements. In the absence of compensating balance arrangements, fee waivers and/or expense reimbursements, the total return would have been lower. Past performance is no guarantee of future results. |
| 3 | Reflects recapture of expenses waived/reimbursed from prior fiscal years. |
| 4 | As a result of an expense limitation arrangement, the ratio of expenses, other than interest, brokerage commissions, dividend expense on short sales, taxes, extraordinary expenses and acquired fund fees and expenses, to average net assets of Class IS shares did not exceed 0.65%. In addition, total annual fund operating expenses for Class IS shares will not exceed total annual fund operating expenses for Class I shares. These expense limitation arrangements cannot be terminated prior to December 31, 2016 without the Board of Trustees’ consent. |
| 5 | Reflects fee waivers and/or expense reimbursements. |
| 6 | The impact of compensating balance arrangements, if any, was less than 0.01%. |
See Notes to Financial Statements.
| | |
| Legg Mason BW International Opportunities Bond Fund 2014 Annual Report | | 25 |
Notes to financial statements
1. Organization and significant accounting policies
Legg Mason BW International Opportunities Bond Fund (the “Fund”) is a separate non-diversified investment series of Legg Mason Global Asset Management Trust (the “Trust”). The Trust, a Maryland statutory trust, is registered under the Investment Company Act of 1940, as amended (the “1940 Act”), as an open-end management investment company.
The following are significant accounting policies consistently followed by the Fund and are in conformity with U.S. generally accepted accounting principles (“GAAP”). Estimates and assumptions are required to be made regarding assets, liabilities and changes in net assets resulting from operations when financial statements are prepared. Changes in the economic environment, financial markets and any other parameters used in determining these estimates could cause actual results to differ. Subsequent events have been evaluated through the date the financial statements were issued.
(a) Investment valuation. The valuations for fixed income securities (which may include, but are not limited to, corporate, government, municipal, mortgage-backed, collateralized mortgage obligations and asset-backed securities) and certain derivative instruments are typically the prices supplied by independent third party pricing services, which may use market prices or broker/dealer quotations or a variety of valuation techniques and methodologies. The independent third party pricing services use inputs that are observable such as issuer details, interest rates, yield curves, prepayment speeds, credit risks/spreads, default rates and quoted prices for similar securities. Short-term fixed income securities that will mature in 60 days or less are valued at amortized cost, unless it is determined that using this method would not reflect an investment’s fair value. Investments in open-end funds are valued at the closing net asset value per share of each fund on the day of valuation. Equity securities for which market quotations are available are valued at the last reported sales price or official closing price on the primary market or exchange on which they trade. When the Fund holds securities or other assets that are denominated in a foreign currency, the Fund will normally use the currency exchange rates as of 4:00 p.m. (Eastern Time). If independent third party pricing services are unable to supply prices for a portfolio investment, or if the prices supplied are deemed by the manager to be unreliable, the market price may be determined by the manager using quotations from one or more broker/dealers or at the transaction price if the security has recently been purchased and no value has yet been obtained from a pricing service or pricing broker. When reliable prices are not readily available, such as when the value of a security has been significantly affected by events after the close of the exchange or market on which the security is principally traded, but before the Fund calculates its net asset value, the Fund values these securities as determined in accordance with procedures approved by the Fund’s Board of Trustees.
The Board of Trustees is responsible for the valuation process and has delegated the supervision of the daily valuation process to the Legg Mason North American Fund Valuation Committee (the “Valuation Committee”). The Valuation Committee, pursuant to the policies adopted by the Board of Trustees, is responsible for making fair value determinations, evaluating the effectiveness of the Fund’s pricing policies, and reporting to the Board of
| | |
| 26 | | Legg Mason BW International Opportunities Bond Fund 2014 Annual Report |
Trustees. When determining the reliability of third party pricing information for investments owned by the Fund, the Valuation Committee, among other things, conducts due diligence reviews of pricing vendors, monitors the daily change in prices and reviews transactions among market participants.
The Valuation Committee will consider pricing methodologies it deems relevant and appropriate when making fair value determinations. Examples of possible methodologies include, but are not limited to, multiple of earnings; discount from market of a similar freely traded security; discounted cash-flow analysis; book value or a multiple thereof; risk premium/yield analysis; yield to maturity; and/or fundamental investment analysis. The Valuation Committee will also consider factors it deems relevant and appropriate in light of the facts and circumstances. Examples of possible factors include, but are not limited to, the type of security; the issuer’s financial statements; the purchase price of the security; the discount from market value of unrestricted securities of the same class at the time of purchase; analysts’ research and observations from financial institutions; information regarding any transactions or offers with respect to the security; the existence of merger proposals or tender offers affecting the security; the price and extent of public trading in similar securities of the issuer or comparable companies; and the existence of a shelf registration for restricted securities.
For each portfolio security that has been fair valued pursuant to the policies adopted by the Board of Trustees, the fair value price is compared against the last available and next available market quotations. The Valuation Committee reviews the results of such back testing monthly and fair valuation occurrences are reported to the Board of Trustees quarterly.
The Fund uses valuation techniques to measure fair value that are consistent with the market approach and/or income approach, depending on the type of security and the particular circumstance. The market approach uses prices and other relevant information generated by market transactions involving identical or comparable securities. The income approach uses valuation techniques to discount estimated future cash flows to present value.
GAAP establishes a disclosure hierarchy that categorizes the inputs to valuation techniques used to value assets and liabilities at measurement date. These inputs are summarized in the three broad levels listed below:
| Ÿ | | Level 1 — quoted prices in active markets for identical investments |
| Ÿ | | Level 2 — other significant observable inputs (including quoted prices for similar investments, interest rates, prepayment speeds, credit risk, etc.) |
| Ÿ | | Level 3 — significant unobservable inputs (including the Fund’s own assumptions in determining the fair value of investments) |
The inputs or methodologies used to value securities are not necessarily an indication of the risk associated with investing in those securities.
| | |
| Legg Mason BW International Opportunities Bond Fund 2014 Annual Report | | 27 |
Notes to financial statements (cont’d)
The following is a summary of the inputs used in valuing the Fund’s assets and liabilities carried at fair value:
| | | | | | | | | | | | | | | | |
| ASSETS | |
| Description | | Quoted Prices
(Level 1) | | | Other Significant
Observable Inputs
(Level 2) | | | Significant
Unobservable
Inputs
(Level 3) | | | Total | |
| Long-term investments†: | | | | | | | | | | | | | | | | |
Sovereign bonds | | | — | | | $ | 214,862,335 | | | | — | | | $ | 214,862,335 | |
Collateralized mortgage obligations | | | — | | | | 3,913,268 | | | | — | | | | 3,913,268 | |
Corporate bonds & notes | | | — | | | | 49,991,968 | | | | — | | | | 49,991,968 | |
| Total long-term investments | | | — | | | $ | 268,767,571 | | | | — | | | $ | 268,767,571 | |
| Short-term investments† | | $ | 6,627,959 | | | | — | | | | — | | | | 6,627,959 | |
| Total investments | | $ | 6,627,959 | | | $ | 268,767,571 | | | | — | | | $ | 275,395,530 | |
| Other financial instruments: | | | | | | | | | | | | | | | | |
Forward foreign currency contracts | | | — | | | $ | 1,379,179 | | | | — | | | $ | 1,379,179 | |
| Total | | $ | 6,627,959 | | | $ | 270,146,750 | | | | — | | | $ | 276,774,709 | |
|
| LIABILITIES | |
| Description | | Quoted Prices
(Level 1) | | | Other Significant
Observable Inputs
(Level 2) | | | Significant
Unobservable
Inputs
(Level 3) | | | Total | |
| Other financial instruments: | | | | | | | | | | | | | | | | |
Forward foreign currency contracts | | | — | | | $ | 437,020 | | | | — | | | $ | 437,020 | |
| † | See Schedule of Investments for additional detailed categorizations. |
(b) Repurchase agreements. The Fund may enter into repurchase agreements with institutions that its investment adviser has determined are creditworthy. Each repurchase agreement is recorded at cost. Under the terms of a typical repurchase agreement, the Fund acquires a debt security subject to an obligation of the seller to repurchase, and of the Fund to resell, the security at an agreed-upon price and time, thereby determining the yield during the Fund’s holding period. When entering into repurchase agreements, it is the Fund’s policy that its custodian or a third party custodian, acting on the Fund’s behalf, take possession of the underlying collateral securities, the market value of which, at all times, at least equals the principal amount of the repurchase transaction, including accrued interest. To the extent that any repurchase transaction maturity exceeds one business day, the value of the collateral is marked-to-market and measured against the value of the agreement in an effort to ensure the adequacy of the collateral. If the counterparty defaults, the Fund generally has the right to use the collateral to satisfy the terms of the repurchase transaction. However, if the market value of the collateral declines during the period in which the Fund seeks to assert its rights or if bankruptcy proceedings are commenced with respect to the seller of the security, realization of the collateral by the Fund may be delayed or limited.
(c) Foreign currency translation. Investment securities and other assets and liabilities denominated in foreign currencies are translated into U.S. dollar amounts based upon
| | |
| 28 | | Legg Mason BW International Opportunities Bond Fund 2014 Annual Report |
prevailing exchange rates on the date of valuation. Purchases and sales of investment securities and income and expense items denominated in foreign currencies are translated into U.S. dollar amounts based upon prevailing exchange rates on the respective dates of such transactions.
The Fund does not isolate that portion of the results of operations resulting from fluctuations in foreign exchange rates on investments from the fluctuations arising from changes in market prices of securities held. Such fluctuations are included with the net realized and unrealized gain or loss on investments.
Net realized foreign exchange gains or losses arise from sales of foreign currencies, including gains and losses on forward foreign currency contracts, currency gains or losses realized between the trade and settlement dates on securities transactions, and the difference between the amounts of dividends, interest, and foreign withholding taxes recorded on the Fund’s books and the U.S. dollar equivalent of the amounts actually received or paid. Net unrealized foreign exchange gains and losses arise from changes in the values of assets and liabilities, other than investments in securities, on the date of valuation, resulting from changes in exchange rates.
Foreign security and currency transactions may involve certain considerations and risks not typically associated with those of U.S. dollar denominated transactions as a result of, among other factors, the possibility of lower levels of governmental supervision and regulation of foreign securities markets and the possibility of political or economic instability.
(d) Forward foreign currency contracts. The Fund enters into a forward foreign currency contract to hedge exposure of bond positions or in an attempt to increase the Fund’s return. A forward foreign currency contract is an agreement between two parties to buy and sell a currency at a set price with delivery and settlement at a future date. The contract is marked-to-market daily and the change in value is recorded by the Fund as an unrealized gain or loss. When a forward foreign currency contract is closed, through either delivery or offset by entering into another forward foreign currency contract, the Fund recognizes a realized gain or loss equal to the difference between the value of the contract at the time it was opened and the value of the contract at the time it is closed.
Forward foreign currency contracts involve elements of market risk in excess of the amounts reflected on the Statement of Assets and Liabilities. The Fund bears the risk of an unfavorable change in the foreign exchange rate underlying the forward foreign currency contract. Risks may also arise upon entering into these contracts from the potential inability of the counterparties to meet the terms of their contracts.
(e) Credit and market risk. The Fund invests in high-yield and emerging market instruments that are subject to certain credit and market risks. The yields of high-yield and emerging market debt obligations reflect, among other things, perceived credit and market risks. The Fund’s investments in securities rated below investment grade typically involve risks not associated with higher rated securities including, among others, greater risk related to timely and ultimate payment of interest and principal, greater market price
| | |
| Legg Mason BW International Opportunities Bond Fund 2014 Annual Report | | 29 |
Notes to financial statements (cont’d)
volatility and less liquid secondary market trading. The consequences of political, social, economic or diplomatic changes may have disruptive effects on the market prices of investments held by the Fund. The Fund’s investments in non-U.S. dollar denominated securities may also result in foreign currency losses caused by devaluations and exchange rate fluctuations.
Investments in securities that are collateralized by residential real estate mortgages are subject to certain credit and liquidity risks. When market conditions result in an increase in default rates of the underlying mortgages and the foreclosure values of underlying real estate properties are materially below the outstanding amount of these underlying mortgages, collection of the full amount of accrued interest and principal on these investments may be doubtful. Such market conditions may significantly impair the value and liquidity of these investments and may result in a lack of correlation between their credit ratings and values.
(f) Foreign investment risks. The Fund’s investments in foreign securities may involve risks not present in domestic investments. Since securities may be denominated in foreign currencies, may require settlement in foreign currencies or pay interest or dividends in foreign currencies, changes in the relationship of these foreign currencies to the U.S. dollar can significantly affect the value of the investments and earnings of the Fund. Foreign investments may also subject the Fund to foreign government exchange restrictions, expropriation, taxation or other political, social or economic developments, all of which affect the market and/or credit risk of the investments.
(g) Counterparty risk and credit-risk-related contingent features of derivative instruments. The Fund may invest in certain securities or engage in other transactions, where the Fund is exposed to counterparty credit risk in addition to broader market risks. The Fund may invest in securities of issuers, which may also be considered counterparties as trading partners in other transactions. This may increase the risk of loss in the event of default or bankruptcy by the counterparty or if the counterparty otherwise fails to meet its contractual obligations. The Fund’s investment manager attempts to mitigate counterparty risk by (i) periodically assessing the creditworthiness of its trading partners, (ii) monitoring and/or limiting the amount of its net exposure to each individual counterparty based on its assessment and (iii) requiring collateral from the counterparty for certain transactions. Market events and changes in overall economic conditions may impact the assessment of such counterparty risk by the investment manager. In addition, declines in the values of underlying collateral received may expose the Fund to increased risk of loss.
The Fund has entered into master agreements with certain of its derivative counterparties that provide for general obligations, representations, agreements, collateral, events of default or termination and credit related contingent features. The credit related contingent features include, but are not limited to, a percentage decrease in the Fund’s net assets or NAV over a specified period of time. If these credit related contingent features were triggered, the derivatives counterparty could terminate the positions and demand payment or require additional collateral.
| | |
| 30 | | Legg Mason BW International Opportunities Bond Fund 2014 Annual Report |
Collateral requirements differ by type of derivative. Collateral or margin requirements are set by the broker or exchange clearing house for exchange traded derivatives while collateral terms are contract specific for over-the-counter traded derivatives. Cash collateral that has been pledged to cover obligations of the Fund under derivative contracts, if any, will be reported separately in the Statement of Assets and Liabilities. Securities pledged as collateral, if any, for the same purpose are noted in the Schedule of Investments.
Absent an event of default by the counterparty or a termination of the agreement, the terms of the master agreements do not result in an offset of reported amounts of financial assets and financial liabilities in the Statement of Assets and Liabilities across transactions between the Fund and the applicable counterparty. The enforceability of the right to offset may vary by jurisdiction.
As of December 31, 2014, the Fund held forward foreign currency contracts with credit related contingent features which had a liability position of $437,020. If a contingent feature in the master agreements would have been triggered, the Fund would have been required to pay this amount to its derivatives counterparties.
(h) Security transactions and investment income. Security transactions are accounted for on a trade date basis. Interest income, adjusted for amortization of premium and accretion of discount, is recorded on the accrual basis. Dividend income is recorded on the ex-dividend date. Foreign dividend income is recorded on the ex-dividend date or as soon as practicable after the Fund determines the existence of a dividend declaration after exercising reasonable due diligence. The cost of investments sold is determined by use of the specific identification method. To the extent any issuer defaults or a credit event occurs that impacts the issuer, the Fund may halt any additional interest income accruals and consider the realizability of interest accrued up to the date of default or credit event.
(i) Distributions to shareholders. Distributions from net investment income of the Fund, if any, are declared and paid on a quarterly basis. Prior to April 1, 2014, distributions from net investment income of the Fund, if any, were declared daily and paid on a monthly basis. Distributions of net realized gains, if any, are declared at least annually. Distributions to shareholders of the Fund are recorded on the ex-dividend date and are determined in accordance with income tax regulations, which may differ from GAAP.
(j) Share class accounting. Investment income, common expenses and realized/unrealized gains (losses) on investments are allocated to the various classes of the Fund on the basis of daily net assets of each class. Fees relating to a specific class are charged directly to that share class.
(k) Compensating balance arrangements. The Fund has an arrangement with its custodian bank whereby a portion of the custodian’s fees is paid indirectly by credits earned on the Fund’s cash on deposit with the bank.
(l) Federal and other taxes. It is the Fund’s policy to comply with the federal income and excise tax requirements of the Internal Revenue Code of 1986 (the “Code”), as
| | |
| Legg Mason BW International Opportunities Bond Fund 2014 Annual Report | | 31 |
Notes to financial statements (cont’d)
amended, applicable to regulated investment companies. Accordingly, the Fund intends to distribute its taxable income and net realized gains, if any, to shareholders in accordance with timing requirements imposed by the Code. Therefore, no federal or state income tax provision is required in the Fund’s financial statements.
Management has analyzed the Fund’s tax positions taken on income tax returns for all open tax years and has concluded that as of December 31, 2014, no provision for income tax is required in the Fund’s financial statements. The Fund’s federal and state income and federal excise tax returns for tax years for which the applicable statutes of limitations have not expired are subject to examination by the Internal Revenue Service and state departments of revenue.
Under the applicable foreign tax laws, a withholding tax may be imposed on interest, dividends and capital gains at various rates. Realized gains upon disposition of securities issued in or by certain foreign countries are subject to capital gains tax imposed by those countries. As of December 31, 2014, there were $9,102 of capital gains tax liabilities accrued on unrealized gains.
(m) Reclassification. GAAP requires that certain components of net assets be reclassified to reflect permanent differences between financial and tax reporting. These reclassifications have no effect on net assets or net asset value per share. During the current year, the following reclassifications have been made:
| | | | | | | | |
| | | Overdistributed Net
Investment Income | | | Accumulated Net
Realized Loss | |
| (a) | | $ | 338,530 | | | $ | (338,530) | |
| (a) | Reclassifications are due to foreign currency transactions treated as ordinary income for tax purposes and differences between book and tax amortization of premium on fixed income securities. |
2. Investment management agreement and other transactions with affiliates
Legg Mason Partners Fund Advisor, LLC (“LMPFA”) is the Fund’s investment manager and Brandywine Global Investment Management, LLC (“Brandywine Global”) is the Fund’s subadviser. LMPFA and Brandywine Global are wholly-owned subsidiaries of Legg Mason, Inc. (“Legg Mason”).
LMPFA provides administrative and certain oversight services to the Fund. The Fund pays LMPFA an investment management fee, calculated daily and paid monthly, at an annual rate of 0.50% of the Fund’s average daily net assets. LMPFA has delegated to Brandywine Global the day-to-day portfolio management of the Fund. For its services, LMPFA pays Brandywine Global 70% of the net management fee.
As a result of expense limitation arrangements between the Fund and LMPFA, the ratio of expenses other than interest, brokerage commissions, dividend expense on short sales, taxes, extraordinary expenses and acquired fund fees and expenses, to average net assets of Class A, Class C, Class C1, Class FI, Class R, Class I and Class IS shares did not exceed 1.00%, 1.75%, 1.45%, 1.00%, 1.25%, 0.75% and 0.65%, respectively. In addition, total annual fund operating expenses for Class IS shares of the Fund did not exceed total annual
| | |
| 32 | | Legg Mason BW International Opportunities Bond Fund 2014 Annual Report |
operating expenses for Class I shares. These expense limitation arrangements cannot be terminated prior to December 31, 2016 without the Board of Trustees’ consent.
During the year ended December 31, 2014, fees waived and/or expenses reimbursed amounted to $174,243.
The investment manager is permitted to recapture amounts waived and/or reimbursed to a class within three years after the fiscal year in which the investment manager earned the fee or incurred the expense if the class’ total annual operating expenses have fallen to a level below the expense limitation (“expense cap”) in effect at the time the fees were earned or the expenses incurred. In no case will the investment manager recapture any amount that would result, on any particular business day of the Fund, in the class’ total annual operating expenses exceeding the expense cap or any other lower limit then in effect.
Pursuant to these arrangements, at December 31, 2014, the Fund had remaining fee waivers and/or expense reimbursements subject to recapture by LMPFA and respective dates of expiration as follows:
| | | | | | | | | | | | | | | | | | | | | | | | | | | | |
| | | Class A | | | Class C | | | Class C1 | | | Class FI | | | Class R | | | Class I | | | Class IS | |
| Expires December 31, 2015 | | $ | 229 | | | | — | | | $ | 120 | | | $ | 3,856 | | | $ | 42 | | | $ | 5,489 | | | $ | 188,690 | |
| Expires December 31, 2016 | | | 6,724 | | | $ | 720 | | | | 235 | | | | 583 | | | | 74 | | | | 157,998 | | | | 149,883 | |
| Expires December 31, 2017 | | | 7,355 | | | | 988 | | | | 30 | | | | 52,527 | | | | 21 | | | | 102,439 | | | | 10,883 | |
| Total fee waivers/expense reimbursements subject to recapture | | $ | 14,308 | | | $ | 1,708 | | | $ | 385 | | | $ | 56,966 | | | $ | 137 | | | $ | 265,926 | | | $ | 349,456 | |
For the year ended December 31, 2014, LMPFA recaptured $144, $6, $2,939, $5,404 and $1,566 for Class C, Class C1, Class FI, Class I and Class IS shares, respectively.
Legg Mason Investor Services, LLC (“LMIS”), a wholly-owned broker-dealer subsidiary of Legg Mason, serves as the Fund’s sole and exclusive distributor.
There is a maximum initial sales charge of 4.25% for Class A shares. There is a contingent deferred sales charge (“CDSC”) of 1.00% on Class C shares and Class C1 shares, which applies if redemption occurs within 12 months from purchase payment. In certain cases, Class A shares have a 1.00% CDSC, which applies if redemption occurs within 18 months from purchase payment. This CDSC only applies to those purchases of Class A shares, which, when combined with current holdings of other shares of funds sold by LMIS, equal or exceed $1,000,000 in the aggregate. These purchases do not incur an initial sales charge.
For the year ended December 31, 2014, LMIS and its affiliates retained sales charges of $2,551 on sales of the Fund’s Class A shares. In addition, there were no CDSCs paid to LMIS and its affiliates for the year ended December 31, 2014.
Under a Deferred Compensation Plan (the “Plan”), Trustees may elect to defer receipt of all or a specified portion of their compensation. A participating Trustee may select one or more funds managed by affiliates of Legg Mason in which his or her deferred trustee’s fees will be deemed to be invested. Deferred amounts remain in the Fund until distributed in accordance with the Plan.
| | |
| Legg Mason BW International Opportunities Bond Fund 2014 Annual Report | | 33 |
Notes to financial statements (cont’d)
All officers and two Trustees of the Trust are employees of Legg Mason or its affiliates and do not receive compensation from the Trust.
3. Investments
During the year ended December 31, 2014, the aggregate cost of purchases and proceeds from sales of investments (excluding short-term investments) were as follows:
| | | | |
| Purchases | | $ | 220,671,297 | |
| Sales | | | 91,405,672 | |
At December 31, 2014, the aggregate gross unrealized appreciation and depreciation of investments for federal income tax purposes were as follows:
| | | | |
| Gross unrealized appreciation | | $ | 5,029,688 | |
| Gross unrealized depreciation | | | (14,209,575) | |
| Net unrealized depreciation | | $ | (9,179,887) | |
At December 31, 2014 , the Fund had the following open forward foreign currency contracts:
| | | | | | | | | | | | | | | | | | | | |
Currency
Purchased | | | Currency
Sold | | | Counterparty | | Settlement
Date | | | Unrealized
Appreciation
(Depreciation) | |
| USD | | | 10,344,075 | | | NZD | | | 12,810,000 | | | Citibank, N.A. | | | 1/16/15 | | | $ | 361,453 | |
| CLP | | | 4,502,000,000 | | | USD | | | 7,425,367 | | | HSBC Bank USA, N.A. | | | 1/26/15 | | | | (25,512) | |
| USD | | | 12,016,661 | | | KRW | | | 13,040,000,000 | | | Barclays Bank PLC | | | 2/6/15 | | | | 172,844 | |
| CLP | | | 2,344,000,000 | | | USD | | | 3,884,654 | | | HSBC Bank USA, N.A. | | | 2/9/15 | | | | (37,616) | |
| USD | | | 19,574,712 | | | EUR | | | 15,580,000 | | | Citibank, N.A. | | | 2/10/15 | | | | 715,147 | |
| EUR | | | 3,300,000 | | | USD | | | 4,099,112 | | | HSBC Bank USA, N.A. | | | 2/10/15 | | | | (104,467) | |
| USD | | | 1,365,552 | | | AUD | | | 1,600,000 | | | Morgan Stanley & Co. Inc. | | | 2/12/15 | | | | 62,917 | |
| CLP | | | 1,149,000,000 | | | USD | | | 1,949,440 | | | HSBC Bank USA, N.A. | | | 2/23/15 | | | | (65,833) | |
| CLP | | | 2,348,000,000 | | | USD | | | 3,908,123 | | | HSBC Bank USA, N.A. | | | 3/17/15 | | | | (65,753) | |
| INR | | | 830,000,000 | | | USD | | | 13,089,625 | | | Barclays Bank PLC | | | 3/18/15 | | | | (137,839) | |
| CLP | | | 2,666,000,000 | | | USD | | | 4,286,518 | | | HSBC Bank USA, N.A. | | | 4/13/15 | | | | 66,818 | |
| Total | | | | | | | | | | | | | | | $ | 942,159 | |
| | |
Abbreviations used in this table: |
| AUD | | — Australian Dollar |
| CLP | | — Chilean Peso |
| EUR | | — Euro |
| INR | | — Indian Ruppe |
| KRW | | — South Korean Won |
| NZD | | — New Zealand Dollar |
| USD | | — United States Dollar |
| | |
| 34 | | Legg Mason BW International Opportunities Bond Fund 2014 Annual Report |
4. Derivative instruments and hedging activities
Below is a table, grouped by derivative type, that provides information about the fair value and the location of derivatives within the Statement of Assets and Liabilities at December 31, 2014.
| | | | |
| ASSET DERIVATIVES1 | |
| | | Foreign
Exchange Risk | |
| Forward foreign currency contracts | | $ | 1,379,179 | |
| | | | |
| LIABILITY DERIVATIVES1 | |
| | | Foreign
Exchange Risk | |
| Forward foreign currency contracts | | $ | 437,020 | |
| 1 | Generally, the balance sheet location for asset derivatives is receivables/net unrealized appreciation (depreciation) and for liability derivatives is payables/net unrealized appreciation (depreciation). |
The following tables provide information about the effect of derivatives and hedging activities on the Fund’s Statement of Operations for the year ended December 31, 2014. The first table provides additional detail about the amounts and sources of gains (losses) realized on derivatives during the period. The second table provides additional information about the change in unrealized appreciation (depreciation) resulting from the Fund’s derivatives and hedging activities during the period.
| | | | |
| AMOUNT OF REALIZED GAIN (LOSS) ON DERIVATIVES RECOGNIZED | |
| | | Foreign
Exchange Risk | |
| Forward foreign currency contracts1 | | $ | 362,427 | |
| 1 | Net realized gain (loss) from forward foreign currency contracts is reported in net realized gain (loss) from foreign currency transactions in the Statement of Operations. |
| | | | |
| CHANGE IN UNREALIZED APPRECIATION (DEPRECIATION) ON DERIVATIVES RECOGNIZED | |
| | | Foreign
Exchange Risk | |
| Forward foreign currency contracts1 | | $ | 1,015,317 | |
| 1 | The change in unrealized appreciation (depreciation) from forward foreign currency contracts is reported in the change in net unrealized appreciation (depreciation) from foreign currencies in the Statement of Operations. |
During the year ended December 31, 2014, the volume of derivative activity for the Fund was as follows:
| | | | |
| | | Average Market
Value | |
| Forward foreign currency contracts (to buy) | | $ | 35,167,844 | |
| Forward foreign currency contracts (to sell) | | | 45,617,654 | |
| | |
| Legg Mason BW International Opportunities Bond Fund 2014 Annual Report | | 35 |
Notes to financial statements (cont’d)
The following table presents by financial instrument, the Fund’s derivative assets net of the related collateral received by the Fund at December 31, 2014:
| | | | | | | | | | | | |
| | | Gross Amount of Derivative
Assets in the Statement of
Assets and Liabilities1 | | | Collateral
Received | | | Net
Amount | |
| Forward foreign currency contracts | | $ | 1,379,179 | | | | — | | | $ | 1,379,179 | |
The following table presents by financial instrument, the Fund’s derivative liabilities net of the related collateral pledged by the Fund at December 31, 2014:
| | | | | | | | | | | | |
| | | Gross Amount of Derivative
Liabilities in the Statement of
Assets and Liabilities1 | | | Collateral
Pledged | | | Net
Amount | |
| Forward foreign currency contracts | | $ | 437,020 | | | | — | | | $ | 437,020 | |
| 1 | Absent an event of default or early termination, derivative assets and liabilities are presented gross and not offset in the Statement of Assets and Liabilities. |
5. Class specific expenses, waivers and/or expense reimbursements
The Fund has adopted a Rule 12b-1 shareholder services and distribution plan and under that plan the Fund pays a service fee with respect to its Class A, Class C, Class C1, Class FI and Class R shares calculated at the annual rate of 0.25% of the average daily net assets of each respective class. The Fund also pays a distribution fee with respect to its Class C, Class C1 and Class R shares calculated at the annual rate of 0.75%, 0.45% and 0.25% of the average daily net assets of each class, respectively. Service and distribution fees are accrued daily and paid monthly.
For the year ended December 31, 2014, class specific expenses were as follows:
| | | | | | | | |
| | | Service and/or
Distribution Fees | | | Transfer Agent
Fees | |
| Class A | | $ | 10,925 | | | $ | 10,782 | |
| Class C | | | 5,163 | | | | 1,305 | |
| Class C1 | | | 104 | | | | 37 | |
| Class FI | | | 112,527 | | | | 96,559 | |
| Class R | | | 60 | | | | 32 | |
| Class I | | | — | | | | 228,480 | |
| Class IS | | | — | | | | 7,370 | |
| Total | | $ | 128,779 | | | $ | 344,565 | |
For the year ended December 31, 2014, waivers and/or expense reimbursements by class were as follows:
| | | | |
| | | Waivers/Expense
Reimbursements | |
| Class A | | $ | 7,355 | |
| Class C | | | 988 | |
| Class C1 | | | 30 | |
| Class FI | | | 52,527 | |
| Class R | | | 21 | |
| Class I | | | 102,439 | |
| Class IS | | | 10,883 | |
| Total | | $ | 174,243 | |
| | |
| 36 | | Legg Mason BW International Opportunities Bond Fund 2014 Annual Report |
6. Distributions to shareholders by class
| | | | | | | | |
| | | Year Ended
December 31, 2014 | | | Year Ended
December 31, 2013 | |
| Net Investment Income: | | | | | | | | |
| Class A | | $ | 182,602 | | | $ | 23,552 | |
| Class C | | | 14,062 | | | | 1,428 | |
| Class C1 | | | 401 | | | | 402 | |
| Class FI | | | 1,573,937 | | | | 1,959 | |
| Class R | | | 414 | | | | 173 | |
| Class I | | | 5,516,943 | | | | 981,922 | |
| Class IS | | | 992,036 | | | | 747,743 | |
| Total | | $ | 8,280,395 | | | $ | 1,757,179 | |
| | |
| Net Realized Gains: | | | | | | | | |
| Class A | | $ | 85,654 | | | $ | 54,511 | �� |
| Class C | | | 6,277 | | | | 5,126 | |
| Class C1 | | | 120 | | | | 1,238 | |
| Class FI | | | 796,868 | | | | 3,693 | |
| Class R | | | 161 | | | | 465 | |
| Class I | | | 1,789,573 | | | | 1,668,765 | |
| Class IS | | | 305,249 | | | | 1,754,392 | |
| Total | | $ | 2,983,902 | | | $ | 3,488,190 | |
7. Shares of beneficial interest
At December 31, 2014, the Trust had an unlimited number of shares of beneficial interest authorized with a par value of $0.00001 per share. The Fund has the ability to issue multiple classes of shares. Each class of shares represents an identical interest and has the same rights, except that each class bears certain direct expenses, including those specifically related to the distribution of its shares.
Transactions in shares of each class were as follows:
| | | | | | | | | | | | | | | | |
| | | Year Ended
December 31, 2014 | | | Year Ended
December 31, 2013 | |
| | | Shares | | | Amount | | | Shares | | | Amount | |
| Class A | | | | | | | | | | | | | | | | |
| Shares sold | | | 715,926 | | | $ | 8,584,238 | | | | 519,320 | | | $ | 6,051,570 | |
| Shares issued on reinvestment | | | 21,781 | | | | 253,383 | | | | 5,927 | | | | 68,759 | |
| Shares repurchased | | | (480,568) | | | | (5,559,821) | | | | (53,920) | | | | (626,936) | |
| Net increase | | | 257,139 | | | $ | 3,277,800 | | | | 471,327 | | | $ | 5,493,393 | |
| | | | |
| Class C | | | | | | | | | | | | | | | | |
| Shares sold | | | 36,299 | | | $ | 435,519 | | | | 36,726 | | | $ | 433,570 | |
| Shares issued on reinvestment | | | 1,729 | | | | 20,195 | | | | 555 | | | | 6,554 | |
| Shares repurchased | | | (13,753) | | | | (163,444) | | | | (9,898) | | | | (114,784) | |
| Net increase | | | 24,275 | | | $ | 292,270 | | | | 27,383 | | | $ | 325,340 | |
| | |
| Legg Mason BW International Opportunities Bond Fund 2014 Annual Report | | 37 |
Notes to financial statements (cont’d)
| | | | | | | | | | | | | | | | |
| | | Year Ended
December 31, 2014 | | | Year Ended
December 31, 2013 | |
| | | Shares | | | Amount | | | Shares | | | Amount | |
| Class C1 | | | | | | | | | | | | | | | | |
| Shares issued on reinvestment | | | 45 | | | $ | 521 | | | | 136 | | | $ | 1,640 | |
| Shares repurchased | | | (952) | | | | (11,533) | | | | (895) | | | | (10,223) | |
| Net decrease | | | (907) | | | $ | (11,012) | | | | (759) | | | $ | (8,583) | |
| | | | |
| Class FI | | | | | | | | | | | | | | | | |
| Shares sold | | | 8,437,829 | | | $ | 103,772,032 | | | | 28,357 | | | $ | 334,947 | |
| Shares issued on reinvestment | | | 76,618 | | | | 886,657 | | | | 170 | | | | 1,982 | |
| Shares repurchased | | | (1,604,531) | | | | (19,230,696) | | | | (5,897) | | | | (68,224) | |
| Net increase | | | 6,909,916 | | | $ | 85,427,993 | | | | 22,630 | | | $ | 268,705 | |
| | | | |
| Class R | | | | | | | | | | | | | | | | |
| Shares sold | | | 444 | | | $ | 5,200 | | | | — | | | | — | |
| Shares issued on reinvestment | | | 49 | | | | 575 | | | | 53 | | | $ | 638 | |
| Net increase | | | 493 | | | $ | 5,775 | | | | 53 | | | $ | 638 | |
| | | | |
| Class I | | | | | | | | | | | | | | | | |
| Shares sold | | | 7,185,985 | | | $ | 85,597,124 | | | | 9,573,864 | | | $ | 112,039,239 | |
| Shares issued on reinvestment | | | 585,563 | | | | 6,872,454 | | | | 181,380 | | | | 2,102,098 | |
| Shares repurchased | | | (2,869,075) | | | | (34,116,087) | | | | (1,008,370) | | | | (11,731,396) | |
| Net increase | | | 4,902,473 | | | $ | 58,353,491 | | | | 8,746,874 | | | $ | 102,409,941 | |
| | | | |
| Class IS | | | | | | | | | | | | | | | | |
| Shares sold | | | 2,111,820 | | | $ | 24,894,466 | | | | 234,643 | | | $ | 2,739,183 | |
| Shares issued on reinvestment | | | 73,151 | | | | 862,409 | | | | 146,477 | | | | 1,793,354 | |
| Shares repurchased | | | (1,508,993) | | | | (17,778,617) | | | | (4,175,068) | | | | (50,778,056) | |
| Net increase (decrease) | | | 675,978 | | | $ | 7,978,258 | | | | (3,793,948) | | | $ | (46,245,519) | |
8. Income tax information and distributions to shareholders
The tax character of distributions paid during the fiscal years ended December 31, was as follows:
| | | | | | | | |
| | | 2014 | | | 2013 | |
| Distributions paid from: | | | | | | | | |
| Ordinary income | | $ | 9,024,867 | | | $ | 2,690,658 | |
| Net long-term capital gains | | | 2,239,430 | | | | 2,554,711 | |
| Total distributions paid | | $ | 11,264,297 | | | $ | 5,245,369 | |
| | |
| 38 | | Legg Mason BW International Opportunities Bond Fund 2014 Annual Report |
As of December 31, 2014, the components of accumulated earnings on a tax basis were as follows:
| | | | |
| Undistributed long-term capital gains — net | | $ | 246,455 | |
| Deferred capital losses* | | | (145,037) | |
| Other book/tax temporary differences(a) | | | (2,940,698) | |
| Unrealized appreciation (depreciation)(b) | | | (8,452,459) | |
| Total accumulated earnings (losses) — net | | $ | (11,291,739) | |
| * | These capital losses have been deferred in the current year as either short-term or long-term losses. The losses will be deemed to occur on the first day of the next taxable year in the same character as they were originally deferred and will be available to offset future taxable capital gains. |
| (a) | Other book/tax temporary differences are attributable to the tax deferral of losses on straddles, the realization for tax purposes of unrealized gains (losses) on certain foreign currency contracts, the deferral of certain late year losses for tax purposes and book/tax differences in the timing of the deductibility of various expenses. |
| (b) | The difference between book-basis and tax-basis unrealized appreciation (depreciation) is attributable to the difference between book and tax amortization methods for premiums on fixed income securities. |
| | |
| Legg Mason BW International Opportunities Bond Fund 2014 Annual Report | | 39 |
Report of independent registered public accounting firm
To the Board of Trustees of Legg Mason Global Asset Management Trust and to the Shareholders of Legg Mason BW International Opportunities Bond Fund:
In our opinion, the accompanying statement of assets and liabilities, including the schedule of investments, and the related statements of operations and of changes in net assets and the financial highlights present fairly, in all material respects, the financial position of the Legg Mason BW International Opportunities Bond Fund (one of the funds comprising Legg Mason Global Asset Management Trust, the “Fund”) at December 31, 2014, the results of its operations, the changes in its net assets and the financial highlights for each of the periods presented, in conformity with accounting principles generally accepted in the United States of America. These financial statements and financial highlights (hereafter referred to as “financial statements”) are the responsibility of the Fund’s management. Our responsibility is to express an opinion on these financial statements based on our audits. We conducted our audits of these financial statements in accordance with the standards of the Public Company Accounting Oversight Board (United States). Those standards require that we plan and perform the audit to obtain reasonable assurance about whether the financial statements are free of material misstatement. An audit includes examining, on a test basis, evidence supporting the amounts and disclosures in the financial statements, assessing the accounting principles used and significant estimates made by management, and evaluating the overall financial statement presentation. We believe that our audits, which included confirmation of securities at December 31, 2014 by correspondence with the custodian and brokers, provide a reasonable basis for our opinion.
PricewaterhouseCoopers LLP
Baltimore, Maryland
February 20, 2015
| | |
| 40 | | Legg Mason BW International Opportunities Bond Fund 2014 Annual Report |
Board approval of management and subadvisory agreements (unaudited)
At its November 2014 meeting, the Fund’s Board of Trustees (the “Board”) approved the management agreement (the “Management Agreement”) with Legg Mason Partners Fund Advisor, LLC (the “Manager”) and the subadvisory agreement (the “Subadvisory Agreement”) with Brandywine Global Investment Management, LLC (the “Subadviser”). (The Management Agreement and the Subadvisory Agreement are jointly referred to as the “Agreements.”) The trustees who are not “interested persons” of the Fund (as defined in the Investment Company Act of 1940, as amended) (the “Independent Trustees”), met on October 9, 2014, with the assistance of their independent legal counsel, to review and evaluate the materials provided by the Manager to assist the Board, and in particular the Independent Trustees, in considering renewal of the Agreements. At such October meeting the Independent Trustees received a presentation by senior Fund management and reviewed the information provided, as well as a memorandum from their independent legal counsel. The Independent Trustees further discussed renewal of the Agreements in an executive session with independent legal counsel on November 6, 2014.
In voting to approve continuance of the Agreements, the Board, including the Independent Trustees, considered whether continuance of the Agreements would be in the best interests of the Fund and its shareholders. No single factor or item of information reviewed by the Board was identified as the principal factor in determining whether to approve the Agreements. Based upon its evaluation of all material factors, including those described below, the Board concluded that the terms of each of the Agreements are reasonable and fair and that it was in the best interests of the Fund and its shareholders to approve the Agreements.
The Board received and considered information regarding the nature, extent and quality of services provided to the Fund by the Manager and the Subadviser under the Management Agreement and Subadvisory Agreement, respectively. The Board also considered the Manager’s supervisory activities over the Subadviser. In addition, the Board received and considered other information regarding the administrative and other services rendered to the Fund and its shareholders by the Manager. The Board noted information received at meetings throughout the year related to the services rendered by the Manager in the management of the Fund’s affairs and the Manager’s role in coordinating the activities of the Subadviser and the Fund’s other service providers. The Board’s evaluation of the services provided by the Manager and the Subadviser took into account the Board’s knowledge and familiarity gained as Board members of funds in the Legg Mason fund complex, including the scope and quality of the investment management and other capabilities of the Manager and the Subadviser, and the quality of the Manager’s administrative and other services.
The Board reviewed the qualifications, backgrounds and responsibilities of the senior personnel serving the Fund and the portfolio management team primarily responsible for the day-to-day portfolio management of the Fund. The Board also considered, based on its knowledge of the Manager and the Manager’s affiliates, the financial resources available through the Manager’s parent organization, Legg Mason, Inc.
| | |
| Legg Mason BW International Opportunities Bond Fund | | 41 |
Board approval of management and subadvisory agreements (unaudited) (cont’d)
The Board considered the division of responsibilities between the Manager and the Subadviser and the oversight provided by the Manager. The Board also considered the Subadviser’s brokerage policies and practices, including the standards applied in seeking best execution, policies and practices regarding soft dollars, and the existence of quality controls applicable to brokerage allocation procedures.
The Board received and reviewed performance information for the Fund and for a group of funds (the “Performance Universe”) selected by Lipper, Inc. (“Lipper”), an independent provider of investment company data. The Board was provided with a description of the methodology Lipper used to determine the similarity of the Fund with the funds included in the Performance Universe. The Lipper data also included a comparison of the Fund’s performance to the Fund’s designated benchmark. In addition, the trustees noted that they also had received and discussed at periodic intervals information comparing the Fund’s performance to that of its peer group and benchmark, and had met with the Fund’s portfolio managers at in-person meetings throughout the year.
The Board noted the Fund’s favorable performance for Class IS Shares for the one- and three-year periods ended June 30, 2014, which placed it in the first quintile. The Board noted that its evaluation of the factors of the nature, extent and quality of services and investment performance led it to conclude that it was in the best interests of the Fund to approve renewal of the Agreements.
The Board reviewed and considered the contractual management fee (the “Contractual Management Fee”) payable by the Fund to the Manager in light of the nature, extent and quality of the management and subadvisory services provided by the Manager and the Subadviser, respectively. The Board noted that the Manager, and not the Fund, pays the subadvisory fees to the Subadviser. In addition, the Board reviewed and considered the actual management fee rate (after taking into account fees waived by the Manager which partially reduced the management fee paid to the Manager) (the “Actual Management Fee”).
The Board also reviewed information regarding the fees the Manager and the Subadviser charged any of their U.S. clients investing primarily in an asset class similar to that of the Fund including, where applicable, separate accounts. The Manager reviewed with the Board the significant differences in the scope of services provided to the Fund and to such other clients, and that the Manager coordinates and oversees the provision of services to the Fund by other fund service providers, including the Subadviser. The Board considered the fee comparisons in light of the scope of services required to manage these different types of accounts.
The Board received an analysis of complex-wide management fees provided by the Manager, which, among other things, sets out the range of fees based on asset classes. In addition, the Manager provided and discussed with the Board a comparison with the fees of other registered investment companies managed in the same investment style. Management
| | |
| 42 | | Legg Mason BW International Opportunities Bond Fund |
also discussed with the Board the Fund’s distribution arrangements, including how amounts received by the Fund’s distributors are expended.
Additionally, the Board received and considered information comparing the Fund’s Contractual Management Fee, Actual Management Fee and the Fund’s overall expense ratio with those of a group of funds selected by Lipper as comparable to the Fund and a broader universe of funds also selected by Lipper. With respect to the Fund, the Board noted that Contractual and Actual Management Fees were lower than median (first quintile) and that actual total expenses for the Class IS Shares were lower than the Lipper expense group median (second quintile) and expense universe average.
The Board was provided an overview of the process followed in conducting the profitability study and received a report on the profitability of Legg Mason in providing services to the Fund, based on financial information and business data for the 12 months ended March 31, 2014 and 2013, which corresponds to Legg Mason’s fiscal year end. The Board considered the profitability study along with the other materials previously provided to the Board and determined that the profitability was not excessive in light of the nature, extent and quality of the services provided to the Fund.
The Board received and considered information regarding whether there have been economies of scale with respect to the management of the Fund as the Fund’s assets grow, whether the Fund has appropriately benefited from any economies of scale and whether there is potential for realization of any further economies of scale. Given the asset size of the Fund and the complex, as well as the contractual fee rate, the Board concluded that although there are currently no breakpoints, any economies of scale currently being realized were appropriately being reflected in the Actual Management Fee paid by the Fund.
The Board considered other benefits received by the Manager and its affiliates, including the Subadviser, as a result of the Manager’s relationship with the Fund, including the opportunity to offer additional products and services to Fund shareholders. The Board also considered the information provided by the Manager regarding intermediary arrangements.
In light of the structure of the fees, the costs of providing investment management and other services to the Fund, the Manager’s ongoing commitment to the Fund and the ancillary benefits received, the Board concluded that the Management Fees were reasonable.
After evaluation of all material factors, the Board concluded that the continuation of each Agreement is in the best interests of the Fund.
| | |
| Legg Mason BW International Opportunities Bond Fund | | 43 |
Additional information (unaudited)
Information about Trustees and Officers
The business and affairs of Legg Mason BW International Opportunities Bond Fund (the “Fund”) are conducted by management under the supervision and subject to the direction of its Board of Trustees. The business address of each Trustee is c/o Kenneth D. Fuller, Legg Mason, 100 International Drive, 11th Floor, Baltimore, Maryland 21202. Information pertaining to the Trustees and officers of the Fund is set forth below.
The Statement of Additional Information includes additional information about Trustees and is available, without charge, upon request by calling the Fund at 1-877-721-1926.
| | |
| Independent Trustees† |
| Ruby P. Hearn |
| Year of birth | | 1940 |
| Position(s) with Trust | | Trustee |
| Term of office1 and length of time served2 | | Since 2004 |
| Principal occupation(s) during past five years | | Senior Vice President Emerita of The Robert Wood Johnson Foundation (non-profit) since 2001; Member of the Institute of Medicine since 1982; formerly: Trustee of the New York Academy of Medicine (2004 to 2012); Director of the Institute for Healthcare Improvement (2002 to 2012); Senior Vice President of The Robert Wood Johnson Foundation (1996 to 2001); Fellow of The Yale Corporation (1992 to 1998). |
| Number of funds in fund complex overseen by Trustee | | 18 |
| Other board memberships held by Trustee during past five years | | None |
|
| Arnold L. Lehman |
| Year of birth | | 1944 |
| Position(s) with Trust | | Lead Independent Trustee |
| Term of office1 and length of time served2 | | Since 1982 |
| Principal occupation(s) during past five years | | Director of the Brooklyn Museum since 1997; Trustee of American Federation of Arts since 1998. Formerly: Director of The Baltimore Museum of Art (1979 to 1997). |
| Number of funds in fund complex overseen by Trustee | | 18 |
| Other board memberships held by Trustee during past five years | | None |
|
| Robin J.W. Masters |
| Year of birth | | 1955 |
| Position(s) with Trust | | Trustee |
| Term of office1 and length of time served2 | | Since 2002 |
| Principal occupation(s) during past five years | | Retired; formerly: Chief Investment Officer of ACE Limited (insurance) (1986 to 2000). |
| Number of funds in fund complex overseen by Trustee | | 18 |
| Other board memberships held by Trustee during past five years | | Director of Cheyne Capital International Limited (investment advisory firm). Formerly, Director/Trustee of Legg Mason Institutional Funds plc, WAFixed Income Funds plc and Western Asset Debt Securities Fund plc. (2007 to 2011) |
| | |
| 44 | | Legg Mason BW International Opportunities Bond Fund |
| | |
| Independent Trustees† cont’d |
| Jill E. McGovern |
| Year of birth | | 1944 |
| Position(s) with Trust | | Trustee |
| Term of office1 and length of time served2 | | Since 1989 |
| Principal occupation(s) during past five years | | Senior Consultant, American Institute for Contemporary German Studies (AICGS) since 2007; formerly: Chief Executive Officer of The Marrow Foundation (non-profit) (1993 to 2007); Executive Director of the Baltimore International Festival (1991 to 1993); Senior Assistant to the President of The Johns Hopkins University (1986 to 1990). |
| Number of funds in fund complex overseen by Trustee | | 18 |
| Other board memberships held by Trustee during past five years | | Director of International Biomedical Research Alliance; Director of Lois Roth Endowment |
|
| Arthur S. Mehlman |
| Year of birth | | 1942 |
| Position(s) with Trust | | Trustee |
| Term of office1 and length of time served2 | | Since 2002 |
| Principal occupation(s) during past five years | | Retired. Director, The University of Maryland Foundation since 1992; Director, The League for People with Disabilities since 2003; formerly: Director, Municipal Mortgage & Equity LLC (2004 to 2011); Partner, KPMG LLP (international accounting firm) (1972 to 2002). |
| Number of funds in fund complex overseen by Trustee | | Director/Trustee of all Legg Mason Funds consisting of 18 portfolios; Director/Trustee of the Royce Family of Funds consisting of 33 portfolios. |
| Other board memberships held by Trustee during past five years | | Director of Municipal Mortgage & Equity, LLC. (2004 to 2011) |
|
| G. Peter O’Brien |
| Year of birth | | 1945 |
| Position(s) with Trust | | Trustee |
| Term of office1 and length of time served2 | | Since 1999 |
| Principal occupation(s) during past five years | | Retired. Trustee Emeritus of Colgate University; Board Member, Hill House, Inc. (residential home care); Board Member, Bridges School (pre- school); formerly: Managing Director, Equity Capital Markets Group of Merrill Lynch & Co. (1971-1999). |
| Number of funds in fund complex overseen by Trustee | | Director/Trustee of all Legg Mason funds consisting of 18 portfolios; Director/Trustee of the Royce Family of Funds consisting of 33 portfolios. |
| Other board memberships held by Trustee during past five years | | Director of TICC Capital Corp. |
| | |
| Legg Mason BW International Opportunities Bond Fund | | 45 |
Additional information (unaudited) (cont’d)
Information about Trustees and Officers
| | |
| Independent Trustees† cont’d |
| S. Ford Rowan |
| Year of birth | | 1943 |
| Position(s) with Trust | | Trustee |
| Term of office1 and length of time served2 | | Since 2002 |
| Principal occupation(s) during past five years | | Chairman, National Center for Critical Incident Analysis, National Defense University Foundation, since 2004; Consultant to University of Maryland University College, since 2013; Lecturer in Organizational Sciences, George Washington University, since 2000; formerly: Trustee, St. John’s College (2006 to 2012); Consultant, Rowan & Blewitt Inc. (management consulting) (1984 to 2007); Lecturer in Journalism, Northwestern University (1980 to 1993); Director, Santa Fe Institute (1999 to 2008). |
| Number of funds in fund complex overseen by Trustee | | 18 |
| Other board memberships held by Trustee during past five years | | None |
|
| Robert M. Tarola |
| Year of birth | | 1950 |
| Position(s) with Trust | | Trustee |
| Term of office1 and length of time served2 | | Since 2004 |
| Principal occupation(s) during past five years | | President of Right Advisory LLC (corporate finance and governance consulting) since 2008; Member, Investor Advisory Group of the Public Company Accounting Oversight Board since 2009; formerly Senior Vice President and Chief Financial Officer of The Howard University (2009 to 2013) (higher education and health care); Senior Vice President and Chief Financial Officer of W.R. Grace & Co. (specialty chemicals) (1999 to 2008) and MedStar Health, Inc. (healthcare) (1996 to 1999); Partner, Price Waterhouse, LLP (accounting and auditing) (1984 to 1996). |
| Number of funds in fund complex overseen by Trustee | | 18 |
| Other board memberships held by Trustee during past five years | | Director of American Kidney Fund (renal disease assistance); Director of XBRL International, Inc. (global data standard setting); Director of Vista Outdoor, Inc. (sporting goods); formerly Director of TeleTech Holdings, Inc. (business process outsourcing). |
| | |
| Interested Trustees3 |
| Jennifer W. Murphy | | |
| Year of birth | | 1964 |
| Position(s) with Trust | | Trustee and Chair |
| Term of office1 and length of time served2 | | Since 1999 and since 2013 |
| Principal occupation(s) during past five years | | Executive Vice President and Chief Administrative Officer of Legg Mason, Inc. (since 2013); formerly: Chief Operations Officer of LMM LLC (1999 to 2013); President and CEO of Legg Mason Capital Management, LLC (“LMCM”) and Manager of LMCM and predecessors (1998 to 2013). |
| Number of funds in fund complex overseen by Trustee | | 18 |
| Other board memberships held by Trustee during past five years | | None |
| | |
| 46 | | Legg Mason BW International Opportunities Bond Fund |
| | |
| Interested Trustees3 cont’d |
| Kenneth D. Fuller | | |
| Year of birth | | 1958 |
| Position(s) with Trust | | Trustee, President and Chief Executive Officer |
| Term of office1 and length of time served2 | | Since 2013 |
| Principal occupation(s) during past five years | | Managing Director of Legg Mason & Co., LLC (“Legg Mason & Co.”) (since 2013); Officer and/or Trustee/Director of 157 funds associated with Legg Mason Partners Fund Advisor, LLC (“LMPFA”) or its affiliates (since 2013); President and Chief Executive Officer of LM Asset Services, LLC (“LMAS”) and Legg Mason Fund Asset Management, Inc. (“LMFAM”) (formerly registered investment advisers) (since 2013); formerly, Senior Vice President of LMPFA (2012 to 2013); formerly, Director of Legg Mason & Co. (2012 to 2013); formerly, Vice President of Legg Mason & Co. (2009 to 2012); formerly, Vice President — Equity Division of T. Rowe Price Associates (1993 to 2009), as well as Investment Analyst and Portfolio Manager for certain asset allocation accounts (2004 to 2009) |
| Number of funds in fund complex overseen by Trustee | | 147 |
Other board memberships held by Trustee during past
five years | | None |
| | |
| Executive Officers |
Richard F. Sennett Legg Mason 100 International Drive, 7th Floor, Baltimore, MD 21202 | | |
| Year of birth | | 1970 |
| Position(s) with Trust | | Principal Financial Officer |
| Term of office1 and length of time served2 | | Since 2011 |
| Principal occupation(s) during past five years | | Principal Financial Officer and Treasurer of certain mutual funds associated with Legg Mason & Co. or its affiliates (since 2011 and since 2013); Managing Director of Legg Mason & Co. and Senior Manager of the Treasury Policy group for Legg Mason & Co.’s Global Fiduciary Platform (since 2011); formerly, Chief Accountant within the SEC’s Division of Investment Management (2007 to 2011); formerly, Assistant Chief Accountant within the SEC’s Division of Investment Management (2002 to 2007) |
| |
Robert I. Frenkel Legg Mason 100 First Stamford Place, 6th Floor, Stamford, CT 06902 | | |
| Year of birth | | 1954 |
| Position(s) with Trust | | Secretary and Chief Legal Officer |
| Term of office1 and length of time served2 | | Since 2007 |
| Principal occupation(s) during past five years | | Vice President and Deputy General Counsel of Legg Mason (since 2006); Managing Director and General Counsel of Global Mutual Funds for Legg Mason & Co. (since 2006) and Legg Mason & Co. predecessors (since 1994); Secretary and Chief Legal Officer of certain mutual funds associated with Legg Mason & Co. or its affiliates (since 2006) and Legg Mason & Co. predecessors (prior to 2006) |
| | |
| Legg Mason BW International Opportunities Bond Fund | | 47 |
Additional information (unaudited) (cont’d)
Information about Trustees and Officers
| | |
| Executive Officers cont’d |
Ted P. Becker Legg Mason 620 Eighth Avenue, 49th Floor, New York, NY 10018 | | |
| Year of birth | | 1951 |
| Position(s) with Trust | | Vice President and Chief Compliance Officer |
| Term of office1 and length of time served2 | | Since 2007 |
| Principal occupation(s) during past five years | | Director of Global Compliance at Legg Mason (since 2006); Chief Compliance Officer of LMPFA (since 2006); Managing Director of Compliance of Legg Mason & Co. (since 2005); Chief Compliance Officer of certain mutual funds associated with Legg Mason & Co. or its affiliates (since 2006) and Legg Mason & Co. predecessors (prior to 2006) |
| |
Christopher Berarducci Legg Mason 620 Eighth Avenue, 49th Floor, New York, NY 10018 | | |
| Year of birth | | 1974 |
| Position(s) with Trust | | Treasurer |
| Term of office1 and length of time served2 | | Since 2010 |
| Principal occupation(s) during past five years | | Vice President of Legg Mason & Co. (since 2011); Treasurer of certain mutual funds associated with Legg Mason & Co. or its affiliates (since 2010); formerly, Assistant Controller of certain mutual funds associated with Legg Mason & Co. or its affiliates (prior to 2010); formerly, Manager of Fund Administration at UBS Global Asset Management (prior to 2007) |
Susan Kerr Legg Mason 620 Eighth Avenue, 49th Floor, New York, NY 10018 | | |
| Year of birth | | 1949 |
| Position(s) with Trust | | Chief Anti-Money Laundering Compliance Officer |
| Term of office1 and length of time served2 | | Since 2013 |
| Principal occupation(s) during past five years | | Assistant Vice President of Legg Mason & Co. and Legg Mason Investor Services, LLC (“LMIS”) (since 2010); Chief Anti-Money Laundering Compliance Officer of certain mutual funds associated with Legg Mason & Co. or its affiliates (since 2013) and Anti-Money Laundering Compliance Officer of LMIS (since 2012); Senior Compliance Officer of LMIS (since 2011); formerly, AML Consultant, DTCC (2010); formerly, AML Consultant, Rabobank Netherlands, (2009); formerly, First Vice President, Director of Marketing & Advertising Compliance and Manager of Communications Review Group at Citigroup Inc. (1996 to 2008) |
| | |
| 48 | | Legg Mason BW International Opportunities Bond Fund |
| | |
| Executive Officers cont’d |
Vanessa A. Williams Legg Mason 100 First Stamford Place, 6th Floor, Stamford, CT 06902 | | |
| Year of birth | | 1979 |
| Position(s) with Trust | | Identity Theft Prevention Officer |
| Term of office1 and length of time served2 | | Since 2011 |
| Principal occupation(s) during past five years | | Vice President of Legg Mason & Co. (since 2012); Identity Theft Prevention Officer of certain mutual funds associated with Legg Mason & Co. or its affiliates (since 2011); formerly, Chief Anti-Money Laundering Compliance Officer of certain mutual funds associated with Legg Mason & Co. or its affiliates (2011 to 2013); formerly, Senior Compliance Officer of Legg Mason & Co. (2008 to 2011); formerly, Compliance Analyst of Legg Mason & Co. (2006 to 2008) and Legg Mason & Co. predecessors (prior to 2006) |
| † | Trustees who are not “interested persons” of the Fund within the meaning of Section 2(a)(19) of the 1940 Act. Each of the Independent Trustees serves on the standing committees of the Board of Trustees, which include the Audit Committee (chair: Arthur S. Mehlman), the Nominating Committee (co-chairs: G. Peter O’Brien and Jill E. McGovern), and the Independent Trustees Committee (chair: Arnold L. Lehman). |
| 1 | Each Trustee and officer serves until his or her respective successor has been duly elected and qualified or until his or her earlier death, resignation, retirement or removal. |
| 2 | Indicates the earliest year in which the Trustee became a board member for a fund in the Legg Mason fund complex or the officer took such office. |
| 3 | Ms. Murphy and Mr. Fuller are considered to be interested persons, as defined in the 1940 Act, of the Fund on the basis of their current employment with the Fund’s investment adviser or its affiliated entities (including the Fund’s principal underwriter) and Legg Mason, Inc., the parent holding company of these entities as well as their ownership of Legg Mason, Inc. stock. |
| | |
| Legg Mason BW International Opportunities Bond Fund | | 49 |
Important tax information (unaudited)
The Fund made the following long-term capital gain distributions during the taxable year:
| | | | | | |
Record
Date | | Payable
Date | | | Long-term
Capital Gains
Per Share |
| 6/17/2014 | | | 6/18/2014 | | | $0.014960 |
| 12/09/2014 | | | 12/10/2014 | | | $0.083111 |
The following distributions represent Qualified Short-Term Capital Gains eligible for exemption from U.S. withholding tax for nonresident aliens and foreign corporations:
| | | | | | | | |
Record
Date | | Payable
Date | | | Short-term
Capital Gains
Per Share | |
| 12/09/2014 | | | 12/10/2014 | | | $ | 0.030719 | |
Please retain this information for your records.
| | |
| 50 | | Legg Mason BW International Opportunities Bond Fund |
Legg Mason
BW International Opportunities Bond Fund
Trustees
Kenneth D. Fuller
President
Ruby P. Hearn
Arnold L. Lehman
Robin J.W. Masters
Jill E. McGovern
Arthur S. Mehlman
Jennifer W. Murphy
Chair
G. Peter O’Brien
S. Ford Rowan
Robert M. Tarola
Investment manager
Legg Mason Partners Fund Advisor, LLC
Subadviser
Brandywine Global Investment Management, LLC
Custodian
State Street Bank & Trust Company
Transfer agent
BNY Mellon Investment Servicing (US) Inc.
4400 Computer Drive
Westborough, MA 01581
Counsel
K&L Gates LLP
Washington, DC
Independent registered public accounting firm
PricewaterhouseCoopers LLP
Baltimore, MD
Legg Mason BW International Opportunities Bond Fund
The Fund is a separate investment series of Legg Mason Global Asset Management Trust, a Maryland statutory trust.
Legg Mason BW International Opportunities Bond Fund
Legg Mason Funds
620 Eighth Avenue, 49th Floor
New York, NY 10018
The Fund files its complete schedule of portfolio holdings with the Securities and Exchange Commission (“SEC”) for the first and third quarters of each fiscal year on Form N-Q. The Fund’s Forms N-Q are available on the SEC’s website at www.sec.gov. The Fund’s Forms N-Q may be reviewed and copied at the SEC’s Public Reference Room in Washington, D.C., and information on the operation of the Public Reference Room may be obtained by calling 1-800-SEC-0330. To obtain information on Form N-Q, shareholders can call the Fund at 1-877-721-1926.
Information on how the Fund voted proxies relating to portfolio securities during the prior 12-month period ended June 30th of each year and a description of the policies and procedures that the Fund uses to determine how to vote proxies related to portfolio transactions are available (1) without charge, upon request, by calling the Fund at 1-877-721-1926, (2) on the Fund’s website at www.leggmason.com/individualinvestors and (3) on the SEC’s website at www.sec.gov.
This report is submitted for the general information of the shareholders of Legg Mason BW International Opportunities Bond Fund. This report is not authorized for distribution to prospective investors in the Fund unless preceded or accompanied by a current prospectus.
Investors should consider the Fund’s investment objectives, risks, charges and expenses carefully before investing. The prospectus contains this and other important information about the Fund. Please read the prospectus carefully before investing.
www.leggmason.com/individualinvestors
© 2015 Legg Mason Investor Services, LLC
Member FINRA, SIPC
Legg Mason Funds Privacy and Security Notice
Your Privacy and the Security of Your Personal Information is Very Important to the Legg Mason Funds
This Privacy and Security Notice (the “Privacy Notice”) addresses the Legg Mason Funds’ privacy and data protection practices with respect to nonpublic personal information the Funds receive. The Legg Mason Funds include any funds sold by the Funds’ distributor, Legg Mason Investor Services, LLC, as well as Legg Mason-sponsored closed-end funds and certain closed-end funds managed or sub-advised by Legg Mason or its affiliates. The provisions of this Privacy Notice apply to your information both while you are a shareholder and after you are no longer invested with the Funds.
The Type of Nonpublic Personal Information the Funds Collect About You
The Funds collect and maintain nonpublic personal information about you in connection with your shareholder account. Such information may include, but is not limited to:
| Ÿ | | Personal information included on applications or other forms; |
| Ÿ | | Account balances, transactions, and mutual fund holdings and positions; |
| Ÿ | | Online account access user IDs, passwords, security challenge question responses; and |
| Ÿ | | Information received from consumer reporting agencies regarding credit history and creditworthiness (such as the amount of an individual’s total debt, payment history, etc.). |
How the Funds Use Nonpublic Personal Information About You
The Funds do not sell or share your nonpublic personal information with third parties or with affiliates for their marketing purposes, or with other financial institutions or affiliates for joint marketing purposes, unless you have authorized the Funds to do so. The Funds do not disclose any nonpublic personal information about you except as may be required to perform transactions or services you have authorized or as permitted or required by law. The Funds may disclose information about you to:
| Ÿ | | Employees, agents, and affiliates on a “need to know” basis to enable the Funds to conduct ordinary business or comply with obligations to government regulators; |
| Ÿ | | Service providers, including the Funds’ affiliates, who assist the Funds as part of the ordinary course of business (such as printing, mailing services, or processing or servicing your account with us) or otherwise perform services on the Funds’ behalf, including companies that may perform marketing services solely for the Funds; |
| Ÿ | | The Funds’ representatives such as legal counsel, accountants and auditors; and |
| Ÿ | | Fiduciaries or representatives acting on your behalf, such as an IRA custodian or trustee of a grantor trust. |
|
| NOT PART OF THE ANNUAL REPORT |
Legg Mason Funds Privacy and Security Notice (cont’d)
Except as otherwise permitted by applicable law, companies acting on the Funds’ behalf are contractually obligated to keep nonpublic personal information the Funds provide to them confidential and to use the information the Funds share only to provide the services the Funds ask them to perform.
The Funds may disclose nonpublic personal information about you when necessary to enforce their rights or protect against fraud, or as permitted or required by applicable law, such as in connection with a law enforcement or regulatory request, subpoena, or similar legal process. In the event of a corporate action or in the event a Fund service provider changes, the Funds may be required to disclose your nonpublic personal information to third parties. While it is the Funds’ practice to obtain protections for disclosed information in these types of transactions, the Funds cannot guarantee their privacy policy will remain unchanged.
Keeping You Informed of the Funds’ Privacy and Security Practices
The Funds will notify you annually of their privacy policy as required by federal law. While the Funds reserve the right to modify this policy at any time they will notify you promptly if this privacy policy changes.
The Funds’ Security Practices
The Funds maintain appropriate physical, electronic and procedural safeguards designed to guard your nonpublic personal information. The Funds’ internal data security policies restrict access to your nonpublic personal information to authorized employees, who may use your nonpublic personal information for Fund business purposes only.
Although the Funds strive to protect your nonpublic personal information, they cannot ensure or warrant the security of any information you provide or transmit to them, and you do so at your own risk. In the event of a breach of the confidentiality or security of your nonpublic personal information, the Funds will attempt to notify you as necessary so you can take appropriate protective steps. If you have consented to the Funds using electronic communications or electronic delivery of statements, they may notify you under such circumstances using the most current email address you have on record with them.
In order for the Funds to provide effective service to you, keeping your account information accurate is very important. If you believe that your account information is incomplete, not accurate or not current, or if you have questions about the Funds’ privacy practices, write the Funds using the contact information on your account statements, email the Funds by clicking on the Contact Us section of the Funds’ website at www.leggmason.com, or contact the Fund at 1-877-721-1926.
Revised April 2011
|
| NOT PART OF THE ANNUAL REPORT |
www.leggmason.com/individualinvestors
© 2015 Legg Mason Investor Services, LLC Member FINRA, SIPC
LMFX012200 2/15 SR15-2422
The registrant has adopted a code of ethics that applies to the registrant’s principal executive officer, principal financial officer, principal accounting officer or controller.
| ITEM 3. | AUDIT COMMITTEE FINANCIAL EXPERT. |
The Board of Trustees of the registrant has determined that Arthur S. Mehlman the Chairman of the Board’s Audit Committee and Robert M. Tarola, possess the technical attributes identified in Instruction 2(b) of Item 3 to Form N- to qualify as “audit committee financial experts,” and have designated Mr. Mehlman and Mr. Tarola CSR as the Audit Committee’s financial experts. Mr. Mehlman and Mr. Tarola are “independent” Trustees pursuant to paragraph (a) (2) of Item 3 to Form N-CSR.
| ITEM 4. | PRINCIPAL ACCOUNTANT FEES AND SERVICES. |
a) Audit Fees. The aggregate fees billed in the last two fiscal years ending December 31, 2013 and December 31, 2014 (the “Reporting Periods”) for professional services rendered by the Registrant’s principal accountant (the “Auditor”) for the audit of the Registrant’s annual financial statements, or services that are normally provided by the Auditor in connection with the statutory and regulatory filings or engagements for the Reporting Periods, were $149,891 in December 31, 2013 and $93,388 in December 31, 2014.
b) Audit-Related Fees. The aggregate fees billed in the Reporting Period for assurance and related services by the Auditor that are reasonably related to the performance of the Registrant’s financial statements were $8,500 in December 31, 2013 and $0 in December 31, 2014.
(c) Tax Fees. The aggregate fees billed in the Reporting Periods for professional services rendered by the Auditor for tax compliance, tax advice and tax planning (“Tax Services”) were $13,280 in December 31, 2013 and $17,200 in December 31, 2014. These services consisted of (i) review or preparation of U.S. federal, state, local and excise tax returns; (ii) U.S. federal, state and local tax planning, advice and assistance regarding statutory, regulatory or administrative developments, and (iii) tax advice regarding tax qualification matters and/or treatment of various financial instruments held or proposed to be acquired or held.
There were no fees billed for tax services by the to service affiliates during the Reporting Periods that required pre-approval by the Audit Auditors Committee.
d) All Other Fees. The aggregate fees for other fees billed in the Reporting Periods for products and services provided by the Auditor were $4,432 in December 31, 2013 and $9,672 in December 31, 2014, other than the services reported in paragraphs (a) through (c) of this item for the Legg Mason Global Asset Management Trust.
All Other Fees. There were no other non-audit services rendered by the Auditor to Legg Mason Partners Fund Advisors, LLC (“LMPFA”), and any entity controlling, controlled by or under common control with LMPFA that provided ongoing services to Legg Mason Global Asset Management Trust requiring pre-approval by the Audit Committee in the Reporting Period.
(e) Audit Committee’s pre–approval policies and procedures described in paragraph (c)
(7) of Rule 2-01 of Regulation S-X.
(1) The Charter for the Audit Committee (the “Committee”) of the Board of each registered investment company (the “Fund”) advised by LMPFA or one of their affiliates (each, an “Adviser”) requires that the Committee shall approve (a) all audit and permissible non-audit services to be provided to the Fund and (b) all permissible non-audit services to be provided by the Fund’s independent auditors to the Adviser and any Covered Service Providers if the engagement relates directly to the operations and financial reporting of the Fund. The Committee may implement policies and procedures by which such services are approved other than by the full Committee.
The Committee shall not approve non-audit services that the Committee believes may impair the independence of the auditors. As of the date of the approval of this Audit Committee Charter, permissible non-audit services include any professional services (including tax services), that are not prohibited services as described below, provided to the Fund by the independent auditors, other than those provided to the Fund in connection with an audit or a review of the financial statements of the Fund. Permissible non-audit services may not include: (i) bookkeeping or other services related to the accounting records or financial statements of the Fund; (ii) financial information systems design and implementation; (iii) appraisal or valuation services, fairness opinions or contribution-in-kind reports; (iv) actuarial services; (v) internal audit outsourcing services; (vi) management functions or human resources; (vii) broker or dealer, investment adviser or investment banking services; (viii) legal services and expert services unrelated to the audit; and (ix) any other service the Public Company Accounting Oversight Board determines, by regulation, is impermissible.
Pre-approval by the Committee of any permissible non-audit services is not required so long as: (i) the aggregate amount of all such permissible non-audit services provided to the Fund, the Adviser and any service providers controlling, controlled by or under common control with the Adviser that provide ongoing services to the Fund (“Covered Service Providers”) constitutes not more than 5% of the total amount of revenues paid to the independent auditors during the fiscal year in which the permissible non-audit services are provided to (a) the Fund, (b) the Adviser and (c) any entity controlling, controlled by or under common control with the Adviser that provides ongoing services to the Fund during the fiscal year in which the services are provided that would have to be approved by the Committee; (ii) the permissible non-audit services were not recognized by the Fund at the time of the engagement to be non-audit services; and (iii) such services are promptly brought to the attention of the Committee and approved by the Committee (or its delegate(s)) prior to the completion of the audit.
(2) For the Legg Mason Global Asset Management Trust, the percentage of fees that were approved by the audit committee, with respect to: Audit-Related Fees were 100% and 100% for December 31, 2013 and December 31, 2014; Tax Fees were 100% and 100% for December 31, 2013 and December 31, 2014; and Other Fees were 100% and 100% for December 31, 2013 and December 31, 2014.
(f) N/A
(g) Non-audit fees billed by the Auditor for services rendered to Legg Mason Global Asset Management Trust, LMPFA and any entity controlling, controlled by, or under common control with LMPFA that provides ongoing services to Legg Mason Global Asset Management Trust during the reporting period were $254,400 in December 31, 2013 and $248,092 in December 31, 2014.
(h) Yes. Legg Mason Global Asset Management Trust’s Audit Committee has considered whether the provision of non-audit services that were rendered to Service Affiliates, which were not pre-approved (not requiring pre-approval), is compatible with maintaining the Accountant’s independence. All services provided by the Auditor to the Legg Mason Global Asset Management Trust or to Service Affiliates, which were required to be pre-approved, were pre-approved as required.
| ITEM 5. | AUDIT COMMITTEE OF LISTED REGISTRANTS. |
| | a) | The independent board members are acting as the registrant’s audit committee as specified in Section 3(a)(58)(B) of the Exchange Act .The Audit Committee consists of the following Board members: |
Ruby P. Hearn
Arnold L. Lehman
Robin J.W. Masters
Jill E. McGovern
Arthur S. Mehlman
G. Peter O’Brien
S. Ford Rowan
Robert M. Tarola
| ITEM 6. | SCHEDULE OF INVESTMENTS. |
Included herein under Item 1.
| ITEM 7. | DISCLOSURE OF PROXY VOTING POLICIES AND PROCEDURES FOR CLOSED-END MANAGEMENT INVESTMENT COMPANIES. |
Not applicable.
| ITEM 8. | PORTFOLIO MANAGERS OF CLOSED-END MANAGEMENT INVESTMENT COMPANIES. |
Not applicable.
| ITEM 9. | PURCHASES OF EQUITY SECURITIES BY CLOSED-END MANAGEMENT INVESTMENT COMPANY AND AFFILIATED PURCHASERS. |
Not applicable.
| ITEM 10. | SUBMISSION OF MATTERS TO A VOTE OF SECURITY HOLDERS. |
Not applicable.
| ITEM 11. | CONTROLS AND PROCEDURES. |
| | (a) | The registrant’s principal executive officer and principal financial officer have concluded that the registrant’s disclosure controls and procedures (as defined in Rule 30a- 3(c) under the Investment Company Act of 1940, as amended (the “1940 Act”)) are effective as of a date within 90 days of the filing date of this report that includes the disclosure required by this paragraph, based on their evaluation of the disclosure controls and procedures required by Rule 30a-3(b) under the 1940 Act and 15d-15(b) under the Securities Exchange Act of 1934. |
| | (b) | There were no changes in the registrant’s internal control over financial reporting (as defined in Rule 30a-3(d) under the 1940 Act) that occurred during the second fiscal quarter of the period covered by this report that have materially affected, or are likely to materially affect the registrant’s internal control over financial reporting. |
(a) (1) Code of Ethics attached hereto.
Exhibit 99.CODE ETH
(a) (2) Certifications pursuant to section 302 of the Sarbanes-Oxley Act of 2002 attached hereto.
Exhibit 99.CERT
(b) Certifications pursuant to Section 906 of the Sarbanes-Oxley Act of 2002 attached hereto.
Exhibit 99.906CERT
SIGNATURES
Pursuant to the requirements of the Securities Exchange Act of 1934 and the Investment Company Act of 1940, the registrant has duly caused this Report to be signed on its behalf by the undersigned, there unto duly authorized.
| | |
| Legg Mason Global Asset Management Trust |
| |
| By: | | /s/ Kenneth D. Fuller |
| | Kenneth D. Fuller |
| | Chief Executive Officer |
| |
| Date: | | February 25, 2015 |
Pursuant to the requirements of the Securities Exchange Act of 1934 and the Investment Company Act of 1940, this report has been signed below by the following persons on behalf of the registrant and in the capacities and on the dates indicated.
| | |
| By: | | /s/ Kenneth D. Fuller |
| | Kenneth D. Fuller |
| | Chief Executive Officer |
| |
| Date: | | February 25, 2015 |
| |
| By: | | /s/ Richard F. Sennett |
| | Richard F. Sennett |
| | Principal Financial Officer |
| |
| Date: | | February 25, 2015 |