UNITED STATES
SECURITIES AND EXCHANGE COMMISSION
Washington, D.C. 20549
FORM N-CSR
CERTIFIED SHAREHOLDER REPORT OF REGISTERED
MANAGEMENT INVESTMENT COMPANIES
Investment Company Act file number 811-22338
Legg Mason Global Asset Management Trust
(Exact name of registrant as specified in charter)
620 Eighth Avenue, 49th Floor, New York, NY 10018
(Address of principal executive offices) (Zip code)
Robert I. Frenkel, Esq.
Legg Mason & Co., LLC
100 First Stamford Place
Stamford, CT 06902
(Name and address of agent for service)
Registrant’s telephone number, including area code: 1-877-721-1926
Date of fiscal year end: September 30
Date of reporting period: September 30, 2015
| ITEM 1. | REPORT TO STOCKHOLDERS |
The Annual Report to Stockholders is filed herewith.

| | |
| Annual Report | | September 30, 2015 |
LEGG MASON BW
DYNAMIC
LARGE CAP
VALUE FUND
|
| INVESTMENT PRODUCTS: NOT FDIC INSURED • NO BANK GUARANTEE • MAY LOSE VALUE |
Fund objective
The Fund seeks long-term capital appreciation by quantitatively investing in U.S. equities.
Letter from the president

Dear Shareholder,
We are pleased to provide the annual report of Legg Mason BW Dynamic Large Cap Value Fund for the period since the Fund’s inception on October 31, 2014 through September 30, 2015. Please read on for a detailed look at prevailing economic and market conditions during the Fund’s reporting period and to learn how those conditions have affected Fund performance.
I am pleased to introduce myself as the new President and Chief Executive Officer of the Fund, succeeding Kenneth D. Fuller. I am honored to have been appointed to my new role. During my 27 year career with Legg Mason, I have seen the investment management industry evolve and expand. Throughout these changes, maintaining an unwavering focus on our shareholders and their needs has remained paramount.
As always, we remain committed to providing you with excellent service and a full spectrum of investment choices. We also remain committed to supplementing the support you receive from your financial advisor. One way we accomplish this is through our website, www.leggmason.com/individualinvestors. Here you can gain immediate access to market and investment information, including:
| • | | Fund prices and performance, |
| • | | Market insights and commentaries from our portfolio managers, and |
| • | | A host of educational resources. |
We look forward to helping you meet your financial goals.
Sincerely,

Jane Trust, CFA
President and Chief Executive Officer
October 30, 2015
| | |
| II | | Legg Mason BW Dynamic Large Cap Value Fund |
Investment commentary
Economic review
The pace of U.S. economic activity was mixed during the period since the Fund’s inception on October 31, 2014 through September 30, 2015 (the “reporting period”). Looking back, the U.S. Department of Commerce’s revised figures showed that fourth quarter 2014 U.S. gross domestic product (“GDP”)i growth was 2.1%. First quarter 2015 GDP growth then moderated to 0.6%. This was attributed to a number of factors, including a deceleration in personal consumption expenditures (“PCE”), along with negative contributions from exports, nonresidential fixed investment, and state and local government spending. Economic activity then accelerated, as second quarter GDP growth was 3.9%. The upturn was driven by increasing exports, accelerating PCE, declining imports, expanding state and local government spending, and rising nonresidential fixed investment. The U.S. Department of Commerce’s initial reading for third quarter 2015 GDP growth — released after the reporting period ended — was 1.5%. Decelerating growth was primarily due to a downturn in private inventory investment and decelerations in exports, nonresidential fixed investment, PCE, state and local government spending, and residential fixed investment.
The labor market was a tailwind for the economy during the reporting period. When the period began, unemployment was 5.8%, as reported by the U.S. Department of Labor. By September 2015, unemployment was 5.1%, equaling its lowest level since April 2008.
Turning to the global economy, in its October 2015 World Economic Outlook Update, released after the close of the reporting period, the International Monetary Fund (“IMF”) said “Prospects across the main countries and regions remain uneven. Relative to last year, the recovery in advanced economies is expected to pick up slightly, while activity in emerging market and developing economies is projected to slow for the fifth year in a row, primarily reflecting weaker prospects for some large emerging market economies and oil-exporting countries.” From a regional perspective, the IMF projects that 2015 growth in the Eurozone will be 1.5%, versus 0.9% in 2014. Japan’s economy is expected to expand 0.6% in 2015, compared to a contraction of -0.1% in 2014. Elsewhere, the IMF said that overall growth in emerging market countries will decelerate in 2015, with growth of 4.0% versus 4.6% in 2014.
The Federal Reserve Board (“Fed”)ii took a number of actions as it sought to meet its dual mandate of fostering maximum employment and price stability. As it has since December 2008, the Fed maintained the federal funds rateiii at a historically low range between zero and 0.25% during the reporting period. At its meeting that concluded on July 29, 2015, the Fed said “The Committee currently anticipates that, even after employment and inflation are near mandate-consistent levels, economic conditions may, for some time, warrant keeping the target federal funds rate below levels the Committee views as normal in the longer run.” At its meeting that ended on September 17, 2015, the Fed decided to maintain the target between zero and 0.25%. Finally, at its meeting that concluded on October 28, 2015, after the close of the reporting period, the Fed said, “In determining whether it will be appropriate to raise the target range at its next meeting,
| | |
| Legg Mason BW Dynamic Large Cap Value Fund | | III |
Investment commentary (cont’d)
the Committee will assess progress — both realized and expected — toward its objectives of maximum employment and 2 percent inflation.”
Given the economic challenges in the Eurozone, the European Central Bank (“ECB”)iv took a number of actions to stimulate growth and ward off deflation. The ECB reduced rates in June and September 2014, before the beginning of the reporting period. Then, in January 2015 the ECB announced that, beginning in March 2015, it would start a €60 billion-a-month bond buying program that is expected to run until September 2016. In other developed countries, the Bank of England kept rates on hold at 0.50% during the reporting period, as did Japan at a range of zero to 0.10%, its lowest level since 2006. At the end of October 2014, the Bank of Japan announced that it would increase its asset purchases between 10 trillion yen and 20 trillion yen ($90.7 billion to $181.3 billion) to approximately 80 trillion yen ($725 billion) annually, in an attempt to stimulate growth. Elsewhere, after holding rates steady at 6.0% since July 2012, the People’s Bank of China lowered rates five times from November 23, 2014 to August 25, 2015. On October 23, 2015, after the reporting period ended, China’s central bank again cut rates, pushing them down to 4.35%.
As always, thank you for your confidence in our stewardship of your assets.
Sincerely,
Jane Trust, CFA
President and Chief Executive Officer
October 30, 2015
All investments are subject to risk including the possible loss of principal. Past performance is no guarantee of future results. Forecasts and predictions are inherently limited and should not be relied upon as an indication of actual or future performance.
| i | Gross domestic product (“GDP”) is the market value of all final goods and services produced within a country in a given period of time. |
| ii | The Federal Reserve Board (“Fed”) is responsible for the formulation of U.S. policies designed to promote economic growth, full employment, stable prices and a sustainable pattern of international trade and payments. |
| iii | The federal funds rate is the rate charged by one depository institution on an overnight sale of immediately available funds (balances at the Federal Reserve) to another depository institution; the rate may vary from depository institution to depository institution and from day to day. |
| iv | The European Central Bank (“ECB”) is responsible for the monetary system of the European Union and the euro currency. |
| | |
| IV | | Legg Mason BW Dynamic Large Cap Value Fund |
Fund overview
Q. What is the Fund’s investment strategy?
A. The Fund seeks to provide long-term capital appreciation by quantitatively investing in U.S. equities. The Fund normally invests at least 80% of its net assets in equity securities of large capitalization companies1. The Fund will only invest in U.S. traded companies, which may include companies incorporated outside the U.S. which conduct a significant portion of their activities in the U.S. and are considered U.S. companies in the Russell U.S. indices. The Fund may have significant positions in particular sectors from time to time. In addition, the Fund may engage in active and frequent trading to achieve its investment objective.
We, at Brandywine Global Investment Management, LLC, the Fund’s subadviser, use a proprietary quantitative model to identify investments for the Fund. To identify investments, the model evaluates multiple quantitative characteristics for each potential stock investment and applies specific rules to select the most attractive stocks for investment based on these characteristics.
Our quantitative model seeks to identify stocks that appear to have upside potential and relatively low downside risk to the value benchmarks. The quantitative model analyzes factors regarding a stock’s valuation and quality, as well as market sentiment toward a stock, to select stocks that may have the potential to outperform the benchmark, the Russell 1000 Value Indexi. The Fund seeks to do this by purchasing stocks that our proprietary quantitative model identifies as having low valuations and appropriate quantitative characteristics for the market environment. The quantitative factors are dynamically selected based on prevailing market conditions and include, among other things, earnings quality and profitability, investor sentiment, and management’s utilization of capital. The Fund will typically invest in a stock when it meets the large capitalization threshold, and its price-to-earnings (“P/E”) ratioii or price-to-book (“P/B”) ratioiii indicates an attractive valuation, and the quantitative model ranks it with a high multifactor score. The Fund will typically sell a stock when its multi-factor score reaches a sell target set by the quantitative model, its P/E and P/B exceed the upper thresholds, or its market capitalization falls below the Fund’s large capitalization definition. We will deviate from the quantitative model’s investment decisions only to ensure compliance with portfolio guidelines, due to corporate actions involving a stock (such as a merger or spinoff), or during extraordinary market circumstances. The Fund expects to hold approximately 75-175 stocks under normal market conditions.
Q. What were the overall market conditions during the Fund’s reporting period?
A. During the Fund’s reporting period from October 31, 2014 through September 30, 2015, the broad U.S. stock market was down with a 2.98% drop in the S&P 500 Indexiv. Beneath this modest decline was a
| 1 | Large capitalization companies are those companies within the largest 1000 U.S. public companies as ranked by market capitalization. This range is similar in capitalization to companies in the Russell 1000 Index (the “Index”). The size of the companies in the Index changes with market conditions and the composition of the Index |
| | |
| Legg Mason BW Dynamic Large Cap Value Fund 2015 Annual Report | | 1 |
Fund overview (cont’d)
more volatile market, rising almost 10% through late July 2015, then falling over 12% in the next month before bouncing back a bit to close the period. Impacted by weather and port disruptions the economy (as measured by the U.S. Department of Commerce’s gross domestic productv figures) grew slowly at 0.6% in the first quarter of 2015, but rebounded to 3.9% growth in the second quarter. U.S. housing starts and sales continued their long climb from their lows post financial crisis, though they remain well below the 2005-2006 levels. The September 2015 U.S. unemployment rate at 5.1% is at its lowest level since 2008. U.S. auto sales have continued to climb over this last year, returning to pre-2008 averages. All these positive indicators explain the initial market gains in the recent period.
The sharp decline this summer in U.S. equity markets is best explained by concerns over Federal Reserve Board (“Fed”)vi changes in short term interest rates, the dramatic decline in the Chinese stock market, and heightened world tensions. Investor speculation focused on if and when the Fed would raise the federal funds ratevii above the current 0.25%. Many feared that even the expected small and gradual rate increases would be too damaging for the U.S. economy given the general weakness outside the U.S. At the same time, investors worried that a Fed decision not to raise rates would signal that the Fed saw a significant possibility for a U.S. slowdown. Ultimately, the Fed chose not to raise rates in their September 2015 meeting, pushing rate-hike expectations further in the future. In China, the stock market peaked in June after an explosive rally and then proceeded to drop over 40% in the next three months. This retreat triggered concerns not only about Chinese economic growth, but for other emerging markets as well.
The other key event in this last year was the plunge in oil prices from over $100 per barrel in mid-2014 to as low as $40 in mid-2015. The decline was the result of both increased supply, primarily due to the fracking revolution in the U.S., and weak demand amid sluggish global growth. With substantially lower oil prices, the stocks of oil producers were the worst performers in the U.S. equity market by a wide margin during the reporting period.
Q. How did we respond to these changing market conditions?
A. Our strategy utilizes a dynamic shifting tool which is a timing model that quantitatively evaluates market conditions to shift the Fund between investment models appropriate for broad value and for deep value environments. The dynamic shifting tool triggers changes at relatively infrequent intervals historically ranging from two to seven years. The shifts result from quantitative signals that we believe indicate whether market valuations are compressed and likely to expand or valuations are wide and likely to contract. Our investment models for the different environments are all value based, sharing many of the same factors with differing exposures. By shifting investment models based on the expected market environment, we improve the odds that we capture the appropriate factor exposures to enhance excess return and minimize underperformance against the benchmark.
During the third quarter of 2015, U.S. equity valuation spreads expanded from a very narrow level, triggering a shift in the Fund’s
| | |
| 2 | | Legg Mason BW Dynamic Large Cap Value Fund 2015 Annual Report |
investment strategy from our deep value to our broad value model. We consider this movement in valuation spreads as a sign that higher quality companies and higher valued stocks are still among the lower valuation groups based on P/B or P/E ratios. Historically, this lower valuation group of stocks has outperformed over the next 3 to 5 years after such a switch. The shift to the broad value model slightly lowers our exposure to the value factor while still being invested in a value-oriented portfolio. In addition the portfolio has a higher exposure to momentum and quality factors which tend to perform well in the mid-to-later stages of the business cycle.
Performance review
For the period since inception on October 31, 2014 through September 30, 2015, Class IS shares of Legg Mason BW Dynamic Large Cap Value Fund returned -4.60%. The Fund’s unmanaged benchmarks, the Russell 1000 Value Index and the S&P 500 Index, returned -6.52% and -2.98%, respectively, for the period October 31, 2014 through September 30, 2015. The Lipper Large-Cap Value Funds Category Average1 returned -6.76% for the eleven-month period ended September 30, 2015.
| | | | | | | | |
Performance Snapshot as of September 30, 2015
(unaudited) | |
| (excluding sales charges) | | 6 months | | | Since
Fund
Inception | |
Legg Mason BW Dynamic
Large Cap Value Fund: | | | | | | | | |
Class A | | | -9.52 | % | | | -4.67 | %† |
Class C | | | -9.84 | % | | | -5.38 | %† |
Class R | | | -9.64 | % | | | -5.02 | %† |
Class I | | | -9.34 | % | | | -4.54 | %† |
Class IS | | | -9.35 | % | | | -4.60 | %‡ |
| Russell 1000 Value Index | | | -8.30 | % | | | -6.52 | %* |
| S&P 500 Index | | | -6.18 | % | | | -2.98 | %* |
Lipper Large-Cap Value Funds
Category Average1 | | | -8.77 | % | | | -6.76 | %* |
The performance shown represents past performance. Past performance is no guarantee of future results and current performance may be higher or lower than the performance shown above. Principal value and investment returns will fluctuate and investors’ shares, when redeemed, may be worth more or less than their original cost. To obtain performance data current to the most recent month-end, please visit our website at www.leggmason.com/individualinvestors.
All share class returns assume the reinvestment of all distributions at net asset value and the deduction of all Fund
| 1 | Lipper, Inc., a wholly-owned subsidiary of Reuters, provides independent insight on global collective investments. Returns are based on the period ended September 30, 2015, including the reinvestment of all distributions, including returns of capital, if any, calculated among the 848 funds for the six-month period and among the 128 funds for the eleven-month period in the Fund’s Lipper category, and excluding sales charges. |
| | |
| Legg Mason BW Dynamic Large Cap Value Fund 2015 Annual Report | | 3 |
Fund overview (cont’d)
expenses. Returns have not been adjusted to include sales charges that may apply or the deduction of taxes that a shareholder would pay on Fund distributions. If sales charges were reflected, the performance quoted would be lower. Performance figures for periods shorter than one year represent cumulative figures and are not annualized.
The Fund is the successor to a private fund (the “Predecessor”). On October 31, 2014, the Predecessor transferred its assets to the Fund in exchange for the Fund’s Class IS shares.
Fund performance figures reflect fee waivers and/or expense reimbursements, without which the performance would have been lower.
† The inception date for Class A, Class C, Class R and Class I shares was November 3, 2014.
‡ The inception date for Class IS shares was October 31, 2014.
* For the period October 31, 2014 through September 30, 2015.
| | | | |
| Total Annual Operating Expenses (unaudited) |
As of the Fund’s current prospectus dated October 31, 2014, the gross total annual operating expense ratios for Class A, Class C, Class R, Class I and Class IS shares were 1.37%, 2.12%, 1.62%, 1.02% and 0.92%, respectively.
Actual expenses may be higher. For example, expenses may be higher than those shown if average net assets decrease. Net assets are more likely to decrease and Fund expense ratios are more likely to increase when markets are volatile.
As a result of expense limitation arrangements, the ratio of expenses, other than interest, brokerage commissions, dividend expense on short sales, taxes, extraordinary expenses and acquired fund fees and expenses, to average net assets is not expected to exceed 1.10% for Class A shares, 1.85% for Class C shares, 1.35% for Class R shares, 0.75% for Class I shares and 0.65% for Class IS shares. In addition, the total annual fund operating expenses of Class IS shares will not exceed total annual fund operating expenses of Class I shares. These expense limitation arrangements cannot be terminated prior to December 31, 2016 without the Board of Trustees’ consent.
The manager is permitted to recapture amounts waived and/or reimbursed to a class within three years after the fiscal year in which the manager earned the fee or incurred the expense if the class’ total annual operating expenses have fallen to a level below the expense limitation (“expense cap”) in effect at the time the fees were earned or the expenses incurred. In no case will the manager recapture any amount that would result, on any particular business day of the Fund, in the class’ total annual operating expenses exceeding the expense cap or any other lower limit then in effect.
Q. What were the leading contributors to performance?
A. Energy was the worst performing sector by far in the large cap value market, most notably for exploration & production companies. The Fund’s significant overweight in the refiners while being significantly underweight in other energy industries, was a major contributor to excess return. Unlike other energy companies, lower oil prices were positive for refiners who benefited from lower input costs. The second largest contribution came from the Fund’s overweighting in drug retailers within the Consumer Staples sectors. An overweight position in
| | |
| 4 | | Legg Mason BW Dynamic Large Cap Value Fund 2015 Annual Report |
Aerospace & Defense and Airlines generated the excess return from the Industrials sector, while the overweight in health care providers helped the smaller contribution from the Health Care sector. The Fund’s significant exposure to companies reducing their share count through buybacks was also a major contributor to performance. Companies that outperformed within the reporting period contributed to provide excess return as price momentum was a positive factor during this period.
Q. What were the leading detractors from performance?
A. The largest detractor from performance was our underweight in the Financials sector. Our underweight in Banks and real estate investment trusts (“REITs”)viii and our investment in specific consumer finance names detracted from performance. Both our overweight in Information Technology (“IT”) and our poor stock selection in Communications Equipment and IT services were negatives to performance. Our underweight in Utilities also detracted from returns as interest rates fell in the period ending September 30, 2015. Finally, the Fund’s slightly higher exposure to stocks with higher price volatility negatively impacted performance as did our higher exposure to quality companies based on higher return on equity.
Q. Were there any significant changes to the Fund during the period?
A. In August 2015, our dynamic shifting tool triggered a shift from the strategy’s deep value to the broad value model. From a factor perspective, the shift’s largest impacts were a greater emphasis on companies with higher return on equity ratios to capture higher quality along with increased exposure to stocks with higher price momentum. Both factors tend to outperform in the mid-to-later stages of the business cycle. We also lowered our weight in companies with low P/B ratios thereby lowering exposure to more distressed value stocks.
Within sectors, our largest reduction came in Financials as the banks had lower return on equity ratios and were decreasing their share buyback programs. The second largest reduction came from the Energy sector as in the shift to the broad model; the smaller refiner names had a smaller weight in the Fund. The Fund also had a significant reduction in the Consumer Discretionary sector as some of the Media stocks became more expensive and their weighting fell with the shift in models.
The largest sector weight increase occurred in the Industrials sector as a result of the shift from the deep to the broad value model, where stocks with higher return on equity ratios have a greater weight. As a result, the Fund purchased additional higher quality Industrials, particularly in Aerospace & Defense. The second largest increase came from the Technology sector as the shift to broad value caused the weighting of the mega cap technology names to rise. The stronger emphasis on high price momentum and high return on equity ratios in the broad value model also led to purchases in Pharmaceuticals and Biotechnology names.
Thank you for your investment in Legg Mason BW Dynamic Large Cap Value Fund. As always, we appreciate that you have
| | |
| Legg Mason BW Dynamic Large Cap Value Fund 2015 Annual Report | | 5 |
Fund overview (cont’d)
chosen us to manage your assets and we remain focused on achieving the Fund’s investment goals.
Sincerely,

Henry F. Otto
Portfolio Manager
Brandywine Global Investment
Management, LLC

Steven M. Tonkovich
Portfolio Manager
Brandywine Global Investment
Management, LLC

Michael Fleisher
Portfolio Manager
Brandywine Global Investment
Management, LLC
October 20, 2015
RISKS: Equity securities are subject to price fluctuation. Large-capitalization value stocks may underperform the overall equity market for long periods. The manager’s selection process may prove incorrect, which may have a negative impact on the Fund’s performance. The value of the Fund’s investments held for cash management or defensive investing purposes may be affected by changing interest rates and changes in the underlying investments’ credit ratings. Please see the Fund’s prospectus for a more complete discussion of these and other risks, and the Fund’s investment strategies.
Portfolio holdings and breakdowns are as of September 30, 2015 and are subject to change and may not be representative of the portfolio managers’ current or future investments. The Fund’s top ten holdings (as a percentage of net assets) as of September 30, 2015 were: Apple Inc. (5.0%), JPMorgan Chase & Co. (4.5%), Gilead Sciences Inc. (4.1%), Intel Corp. (4.1%), International Business Machines Corp. (4.0%), Merck & Co. Inc. (4.0%), UnitedHealth Group Inc. (3.1%), QUALCOMM Inc. (2.8%), Boeing Co. (2.6%) and 3M Co. (2.6%). Please refer to pages 14 through 19 for a list and percentage breakdown of the Fund’s holdings.
The mention of sector breakdowns is for informational purposes only and should not be construed as a recommendation to purchase or sell any securities. The information provided regarding such sectors is not a sufficient basis upon which to make an investment decision. Investors seeking financial advice regarding the appropriateness of investing in any securities or investment strategies discussed should consult their financial professional. The Fund’s top five sector holdings (as a percentage of net assets) as of September 30, 2015 were: Industrials (24.1%), Information Technology (18.6%), Financials (15.3%), Health Care (14.2%) and Consumer Discretionary (11.2%). The Fund’s portfolio composition is subject to change at any time.
All investments are subject to risk including the possible loss of principal. Past performance is no guarantee of future results. All index performance reflects no deduction for fees, expenses or taxes. Please note that an investor cannot invest directly in an index.
The information provided is not intended to be a forecast of future events, a guarantee of future results or investment advice. Views expressed may differ from those of the firm as a whole.
| | |
| 6 | | Legg Mason BW Dynamic Large Cap Value Fund 2015 Annual Report |
| i | The Russell 1000 Value Index measures the performance of the large-cap value segment of the U.S. equity universe. It includes those Russell 1000 Index companies with lower price-to-book ratios and lower expected growth values. (A price-to-book ratio is the price of a stock compared to the difference between a company’s assets and liabilities.) The Russell 1000 Index measures the performance of the large-cap segment of the U.S. equity universe. It is a subset of the Russell 3000 Index and includes approximately 1,000 of the largest securities based on a combination of their market cap and current index membership. The Russell 1000 represents approximately 92% of the U.S. market. The Russell 3000 Index measures the performance of the 3,000 largest U.S. companies based on total market capitalization, which represents approximately 98% of the U.S. equity market. |
| ii | The price-to-earnings (“P/E”) ratio is a stock’s price divided by its earnings per share. |
| iii | The price-to-book (“P/B”) ratio is a stock’s price divided by the stock’s per share book value. |
| iv | The S&P 500 Index is an unmanaged index of 500 stocks and is generally representative of the performance of larger companies in the U.S. |
| v | Gross domestic product (“GDP”) is the market value of all final goods and services produced within a country in a given period of time. |
| vi | The Federal Reserve Board (“Fed”) is responsible for the formulation of U.S. policies designed to promote economic growth, full employment, stable prices and a sustainable pattern of international trade and payments. |
| vii | The federal funds rate is the rate charged by one depository institution on an overnight sale of immediately available funds (balances at the Federal Reserve) to another depository institution; the rate may vary from depository institution to depository institution and from day to day. |
| viii | Real estate investment trusts (“REITs”) invest in real estate or loans secured by real estate and issue shares in such investments, which can be illiquid. |
| | |
| Legg Mason BW Dynamic Large Cap Value Fund 2015 Annual Report | | 7 |
Fund at a glance† (unaudited)
Investment breakdown (%) as a percent of total investments
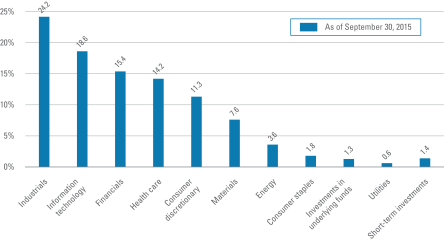
| † | The bar graph above represents the composition of the Fund’s investments as of September 30, 2015. The Fund is actively managed. As a result, the composition of the Fund’s investments is subject to change at any time. |
| | |
| 8 | | Legg Mason BW Dynamic Large Cap Value Fund 2015 Annual Report |
Fund expenses (unaudited)
Example
As a shareholder of the Fund, you may incur two types of costs: (1) transaction costs, including front-end and back-end sales charges (loads) on purchase payments; and (2) ongoing costs, including management fees; service and/or distribution (12b-1) fees, and other Fund expenses. This example is intended to help you understand your ongoing costs (in dollars) of investing in the Fund and to compare these costs with the ongoing costs of investing in other mutual funds.
This example is based on an investment of $1,000 invested on April 1, 2015 and held for the six months ended September 30, 2015.
Actual expenses
The table below titled “Based on Actual Total Return” provides information about actual account values and actual expenses. You may use the information provided in this table, together with the amount you invested, to estimate the expenses that you paid over the period. To estimate the expenses you paid on your account, divide your ending account value by $1,000 (for example, an $8,600 ending account value divided by $1,000 = 8.6), then multiply the result by the number under the heading entitled “Expenses Paid During the Period”.
Hypothetical example for comparison purposes
The table below titled “Based on Hypothetical Total Return” provides information about hypothetical account values and hypothetical expenses based on the actual expense ratio and an assumed rate of return of 5.00% per year before expenses, which is not the Fund’s actual return. The hypothetical account values and expenses may not be used to estimate the actual ending account balance or expenses you paid for the period. You may use the information provided in this table to compare the ongoing costs of investing in the Fund and other funds. To do so, compare the 5.00% hypothetical example relating to the Fund with the 5.00% hypothetical examples that appear in the shareholder reports of the other funds.
Please note that the expenses shown in the table below are meant to highlight your ongoing costs only and do not reflect any transactional costs, such as front-end or back-end sales charges (loads). Therefore, the table is useful in comparing ongoing costs only, and will not help you determine the relative total costs of owning different funds. In addition, if these transaction costs were included, your costs would have been higher.
| | | | | | | | | | | | | | | | | | | | | | | | | | | | | | | | | | | | | | | | | | | | |
| Based on actual total return1 | | | | | Based on hypothetical total return1 | |
| | | Actual
Total Return
Without
Sales
Charge2 | | | Beginning
Account
Value | | | Ending
Account
Value | | | Annualized
Expense
Ratio | | | Expenses
Paid
During
the
Period3 | | | | | | | Hypothetical
Annualized
Total Return | | | Beginning
Account
Value | | | Ending
Account
Value | | | Annualized
Expense
Ratio | | | Expenses
Paid
During
the
Period3 | |
Class A | | | -9.52 | % | | $ | 1,000.00 | | | $ | 904.80 | | | | 1.07 | % | | $ | 5.11 | | | | | Class A | | | 5.00 | % | | $ | 1,000.00 | | | $ | 1,019.70 | | | | 1.07 | % | | $ | 5.42 | |
Class C | | | -9.84 | | | | 1,000.00 | | | | 901.60 | | | | 1.85 | | | | 8.82 | | | | | Class C | | | 5.00 | | | | 1,000.00 | | | | 1,015.79 | | | | 1.85 | | | | 9.35 | |
Class R | | | -9.64 | | | | 1,000.00 | | | | 903.60 | | | | 1.35 | | | | 6.44 | | | | | Class R | | | 5.00 | | | | 1,000.00 | | | | 1,018.30 | | | | 1.35 | | | | 6.83 | |
Class I | | | -9.34 | | | | 1,000.00 | | | | 906.60 | | | | 0.75 | | | | 3.58 | | | | | Class I | | | 5.00 | | | | 1,000.00 | | | | 1,021.31 | | | | 0.75 | | | | 3.80 | |
Class IS | | | -9.35 | | | | 1,000.00 | | | | 906.50 | | | | 0.65 | | | | 3.11 | | | | | Class IS | | | 5.00 | | | | 1,000.00 | | | | 1,021.81 | | | | 0.65 | | | | 3.29 | |
| | |
| Legg Mason BW Dynamic Large Cap Value Fund 2015 Annual Report | | 9 |
Fund expenses (unaudited) (cont’d)
| 1 | For the six months ended September 30, 2015. |
| 2 | Assumes the reinvestment of all distributions, including returns of capital, if any, at net asset value and does not reflect the deduction of the applicable sales charge with respect to Class A shares or the applicable contingent deferred sales charge (“CDSC”) with respect to Class C shares. Total return is not annualized, as it may not be representative of the total return for the year. Performance figures may reflect compensating balance arrangements, fee waivers and/or expense reimbursements. In the absence of compensating balance arrangements, fee waivers and/or expense reimbursements, the total return would have been lower. Past performance is no guarantee of future results. |
| 3 | Expenses (net of compensating balance arrangements, fee waivers and/or expense reimbursements) are equal to each class’ respective annualized expense ratio multiplied by the average account value over the period, multiplied by the number of days in the most recent fiscal half-year (183), then divided by 365. |
| | |
| 10 | | Legg Mason BW Dynamic Large Cap Value Fund 2015 Annual Report |
Fund performance (unaudited)
Legg Mason BW Dynamic Large Cap Value Fund (the “Fund”) is the successor to a private fund (the “Predecessor”). The performance in the accompanying table and line graph for Class IS shares includes performance of the Predecessor. The Predecessor’s inception date was December 27, 2006. On October 31, 2014, the Predecessor transferred its assets to the Fund in exchange for the Fund’s Class IS shares. The investment policies, objectives, guidelines and restrictions of the Fund are in all material respects equivalent to those of the Predecessor. In addition, the Predecessor’s portfolio managers are the current portfolio managers of the Fund. As a mutual fund registered under the Investment Company Act of 1940, the Fund is subject to certain restrictions under the 1940 Act and the Internal Revenue Code to which the Predecessor was not subject. Had the Predecessor been registered under the 1940 Act and been subject to the provisions of the 1940 Act and the Code, its investment performance could have been adversely affected, but these restrictions are not expected to have a material effect on the Fund’s investment program. The performance information reflects the gross expenses of the Predecessor adjusted to reflect the higher fees and expenses of Class IS of the Fund. The performance is shown net of an annual management fee of 0.55% and other expenses of 0.10% which reflects the application of the Class IS expense limitation agreement. If the expense limitation agreement were not applicable, expenses would be higher and performance lower.
The Predecessor did not have distribution policies. The Predecessor was an unregistered private fund, did not qualify as a regulated investment company for federal income tax purposes and did not pay dividends or distributions.
| | | | | | | | | | | | | | | | | | | | |
Average annual total returns | |
| Without sales charges1 | | Class A† | | | Class C† | | | Class R† | | | Class I† | | | Class IS | |
| Twelve Months Ended 9/30/15 | | | N/A | | | | N/A | | | | N/A | | | | N/A | | | | -2.82 | % |
| Five Years Ended 9/30/15 | | | N/A | | | | N/A | | | | N/A | | | | N/A | | | | 15.62 | |
| Inception* through 9/30/15 | | | -4.67 | % | | | -5.38 | % | | | -5.02 | % | | | -4.54 | % | | | 8.57 | |
| | | | | |
| With sales charges2 | | Class A† | | | Class C† | | | Class R† | | | Class I† | | | Class IS | |
| Twelve Months Ended 9/30/15 | | | N/A | | | | N/A | | | | N/A | | | | N/A | | | | -2.82 | % |
| Five Years Ended 9/30/15 | | | N/A | | | | N/A | | | | N/A | | | | N/A | | | | 15.62 | |
| Inception* through 9/30/15 | | | -10.15 | % | | | -6.32 | % | | | -5.02 | % | | | -4.54 | % | | | 8.57 | |
| | | | |
| Cumulative total returns | |
| Without sales charges1 | | | |
| Class A (Inception date of 11/3/14 through 9/30/15) | | | -4.67 | % |
| Class C (Inception date of 11/3/14 through 9/30/15) | | | -5.38 | |
| Class R (Inception date of 11/3/14 through 9/30/15) | | | -5.02 | |
| Class I (Inception date of 11/3/14 through 9/30/15) | | | -4.54 | |
| Class IS (Inception date of 12/27/06 through 9/30/15) | | | 105.60 | |
| | |
| Legg Mason BW Dynamic Large Cap Value Fund 2015 Annual Report | | 11 |
Fund performance (unaudited) (cont’d)
All figures represent past performance and are not a guarantee of future results. Investment return and principal value of an investment will fluctuate so that an investor’s shares, when redeemed, may be worth more or less than their original cost. Results for longer periods will differ, in some cases, substantially. The returns shown do not reflect the deduction of taxes that a shareholder would pay on Fund distributions or the redemption of Fund shares. Performance figures may reflect compensating balance arrangements, fee waivers and/or expense reimbursements. In the absence of compensating balance arrangements, fee waivers and/or expense reimbursements, the total return would have been lower.
| 1 | Assumes the reinvestment of all distributions, including returns of capital, if any, at net asset value and does not reflect the deduction of the applicable sales charge with respect to Class A shares or the applicable contingent deferred sales charge (“CDSC”) with respect to Class C shares. |
| 2 | Assumes the reinvestment of all distributions, including returns of capital, if any, at net asset value. In addition, Class A shares reflect the deduction of the maximum initial sales charge of 5.75%. Class C shares reflect the deduction of a 1.00% CDSC, which applies if shares are redeemed within one year from purchase payment. |
| * | Inception dates for Class A, C, R, I and IS shares are November 3, 2014, November 3, 2014, November 3, 2014, November 3, 2014 and December 27, 2006, respectively. |
| | |
| 12 | | Legg Mason BW Dynamic Large Cap Value Fund 2015 Annual Report |
Fund performance (unaudited) (cont’d)
Historical performance
Value of $1,000,000 invested in
Class IS Shares of Legg Mason BW Dynamic Large Cap Value Fund vs. Russell 1000 Value Index and S&P 500 Index† — December 27, 2006 - September 30, 2015
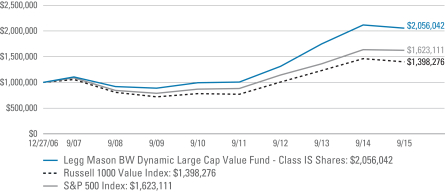
All figures represent past performance and are not a guarantee of future results. Investment return and principal value of an investment will fluctuate so that an investor’s shares, when redeemed, may be worth more or less than their original cost. The returns shown do not reflect the deduction of taxes that a shareholder would pay on Fund distributions or the redemption of Fund shares. Performance figures may reflect compensating balance arrangements, fee waivers and/or expense reimbursements. In the absence of compensating balance arrangements, fee waivers and/or expense reimbursements, the total return would have been lower.
| † | Hypothetical illustration of $1,000,000 invested in Class IS shares of Legg Mason BW Dynamic Large Cap Value Fund at inception on December 27, 2006 (inception date of the Predecessor), assuming the reinvestment of all distributions, including returns of capital, if any, at net asset value through September 30, 2015. The hypothetical illustration also assumes a $1,000,000 investment in the Russell 1000 Index and the S&P 500 Index. The Russell 1000 Index measures the performance of the large-cap segment of the U.S.equity universe. It is a subset of the Russell 3000 Index and includes approximately 1,000 of the largest securities based on a combination of their market cap and current index membership. The Russell 1000 represents approximately 92% of the U.S. market. The S&P 500 Index is an unmanaged index of 500 stocks and is generally representative of the performance of larger companies in the U.S. The Indices are unmanaged and are not subject to the same management and trading expenses as a mutual fund. Please note that an investor cannot invest directly in an index. The performance of the Fund’s other classes may be greater or less than the Class IS shares’ performance indicated on this chart, depending on whether greater or lesser sales charges and fees were incurred by shareholders investing in the other classes. |
| | |
| Legg Mason BW Dynamic Large Cap Value Fund 2015 Annual Report | | 13 |
Schedule of investments
September 30, 2015
Legg Mason BW Dynamic Large Cap Value Fund
| | | | | | | | | | | | |
| Security | | | | | | Shares | | | Value | |
| Common Stocks — 97.0% | | | | | | | | | | | | |
| Consumer Discretionary — 11.2% | | | | | | | | | | | | |
Auto Components — 2.0% | | | | | | | | | | | | |
Delphi Automotive PLC | | | | | | | 1,577 | | | $ | 119,915 | |
Goodyear Tire & Rubber Co. | | | | | | | 1,286 | | | | 37,719 | |
Johnson Controls Inc. | | | | | | | 3,122 | | | | 129,126 | |
Lear Corp. | | | | | | | 417 | | | | 45,361 | |
Total Auto Components | | | | | | | | | | | 332,121 | |
Automobiles — 1.7% | | | | | | | | | | | | |
General Motors Co. | | | | | | | 7,564 | | | | 227,071 | |
Harley-Davidson Inc. | | | | | | | 1,138 | | | | 62,476 | |
Total Automobiles | | | | | | | | | | | 289,547 | |
Hotels, Restaurants & Leisure — 0.8% | | | | | | | | | | | | |
Royal Caribbean Cruises Ltd. | | | | | | | 1,052 | | | | 93,723 | |
Wyndham Worldwide Corp. | | | | | | | 645 | | | | 46,375 | |
Total Hotels, Restaurants & Leisure | | | | | | | | | | | 140,098 | |
Internet & Catalog Retail — 0.0% | | | | | | | | | | | | |
HSN Inc. | | | | | | | 86 | | | | 4,923 | |
Media — 4.4% | | | | | | | | | | | | |
CBS Corp., Class B Shares | | | | | | | 733 | | | | 29,247 | |
Interpublic Group of Cos. Inc. | | | | | | | 2,254 | | | | 43,119 | |
Omnicom Group Inc. | | | | | | | 1,330 | | | | 87,647 | |
Scripps Networks Interactive Inc., Class A Shares | | | | | | | 644 | | | | 31,678 | |
Thomson Reuters Corp. | | | | | | | 4,317 | | | | 173,803 | |
Tribune Media Co. | | | | | | | 456 | | | | 16,234 | |
Twenty-First Century Fox Inc., Class A Shares | | | | | | | 9,833 | | | | 265,294 | |
Viacom Inc., Class B Shares | | | | | | | 2,095 | | | | 90,399 | |
Total Media | | | | | | | | | | | 737,421 | |
Multiline Retail — 1.1% | | | | | | | | | | | | |
Macy’s Inc. | | | | | | | 1,833 | | | | 94,069 | |
Target Corp. | | | | | | | 1,033 | | | | 81,256 | |
Total Multiline Retail | | | | | | | | | | | 175,325 | |
Specialty Retail — 1.2% | | | | | | | | | | | | |
Bed Bath & Beyond Inc. | | | | | | | 928 | | | | 52,914 | * |
Foot Locker Inc. | | | | | | | 666 | | | | 47,932 | |
GameStop Corp., Class A Shares | | | | | | | 589 | | | | 24,273 | |
Gap Inc. | | | | | | | 1,987 | | | | 56,629 | |
GNC Holdings Inc., Class A Shares | | | | | | | 468 | | | | 18,917 | |
Total Specialty Retail | | | | | | | | | | | 200,665 | |
Total Consumer Discretionary | | | | | | | | | | | 1,880,100 | |
See Notes to Financial Statements.
| | |
| 14 | | Legg Mason BW Dynamic Large Cap Value Fund 2015 Annual Report |
Legg Mason BW Dynamic Large Cap Value Fund
| | | | | | | | | | | | |
| Security | | | | | | Shares | | | Value | |
| Consumer Staples — 1.8% | | | | | | | | | | | | |
Beverages — 0.3% | | | | | | | | | | | | |
Coca-Cola Enterprises Inc. | | | | | | | 1,111 | | | $ | 53,717 | |
Food Products — 1.5% | | | | | | | | | | | | |
Archer-Daniels-Midland Co. | | | | | | | 3,385 | | | | 140,308 | |
Bunge Ltd. | | | | | | | 690 | | | | 50,577 | |
Ingredion Inc. | | | | | | | 390 | | | | 34,051 | |
Pilgrim’s Pride Corp. | | | | | | | 1,423 | | | | 29,570 | |
Total Food Products | | | | | | | | | | | 254,506 | |
Total Consumer Staples | | | | | | | | | | | 308,223 | |
| Energy — 3.6% | | | | | | | | | | | | |
Energy Equipment & Services — 0.1% | | | | | | | | | | | | |
Oceaneering International Inc. | | | | | | | 537 | | | | 21,093 | |
Oil, Gas & Consumable Fuels — 3.5% | | | | | | | | | | | | |
Marathon Petroleum Corp. | | | | | | | 2,945 | | | | 136,442 | |
Phillips 66 | | | | | | | 2,584 | | | | 198,555 | |
Tesoro Corp. | | | | | | | 681 | | | | 66,220 | |
Valero Energy Corp. | | | | | | | 2,774 | | | | 166,717 | |
Western Refining Inc. | | | | | | | 156 | | | | 6,883 | |
Total Oil, Gas & Consumable Fuels | | | | | | | | | | | 574,817 | |
Total Energy | | | | | | | | | | | 595,910 | |
| Financials — 15.3% | | | | | | | | | | | | |
Banks — 4.5% | | | | | | | | | | | | |
JPMorgan Chase & Co. | | | | | | | 12,309 | | | | 750,480 | |
Capital Markets — 2.5% | | | | | | | | | | | | |
Ameriprise Financial Inc. | | | | | | | 935 | | | | 102,037 | |
Bank of New York Mellon Corp. | | | | | | | 5,480 | | | | 214,542 | |
Eaton Vance Corp. | | | | | | | 577 | | | | 19,283 | |
T. Rowe Price Group Inc. | | | | | | | 1,250 | | | | 86,875 | |
Total Capital Markets | | | | | | | | | | | 422,737 | |
Consumer Finance — 1.4% | | | | | | | | | | | | |
Credit Acceptance Corp. | | | | | | | 98 | | | | 19,293 | * |
Discover Financial Services | | | | | | | 2,291 | | | | 119,109 | |
Navient Corp. | | | | | | | 2,195 | | | | 24,672 | |
Santander Consumer USA Holdings Inc. | | | | | | | 1,750 | | | | 35,735 | * |
Springleaf Holdings Inc. | | | | | | | 652 | | | | 28,505 | * |
Total Consumer Finance | | | | | | | | | | | 227,314 | |
Diversified Financial Services — 1.5% | | | | | | | | | | | | |
Intercontinental Exchange Inc. | | | | | | | 585 | | | | 137,469 | |
See Notes to Financial Statements.
| | |
| Legg Mason BW Dynamic Large Cap Value Fund 2015 Annual Report | | 15 |
Schedule of investments (cont’d)
September 30, 2015
Legg Mason BW Dynamic Large Cap Value Fund
| | | | | | | | | | | | |
| Security | | | | | | Shares | | | Value | |
Diversified Financial Services — continued | | | | | | | | | | | | |
Principal Financial Group Inc. | | | | | | | 1,435 | | | $ | 67,933 | |
Voya Financial Inc. | | | | | | | 1,340 | | | | 51,952 | |
Total Diversified Financial Services | | | | | | | | | | | 257,354 | |
Insurance — 5.3% | | | | | | | | | | | | |
AFLAC Inc. | | | | | | | 2,256 | | | | 131,141 | |
Allstate Corp. | | | | | | | 2,389 | | | | 139,135 | |
Arch Capital Group Ltd. | | | | | | | 728 | | | | 53,486 | * |
Assurant Inc. | | | | | | | 337 | | | | 26,626 | |
Assured Guaranty Ltd. | | | | | | | 880 | | | | 22,000 | |
Axis Capital Holdings Ltd. | | | | | | | 526 | | | | 28,257 | |
CNO Financial Group Inc. | | | | | | | 1,017 | | | | 19,130 | |
Hartford Financial Services Group Inc. | | | | | | | 2,432 | | | | 111,337 | |
Lincoln National Corp. | | | | | | | 1,321 | | | | 62,695 | |
Reinsurance Group of America Inc. | | | | | | | 351 | | | | 31,797 | |
Torchmark Corp. | | | | | | | 666 | | | | 37,563 | |
Travelers Cos. Inc. | | | | | | | 1,828 | | | | 181,941 | |
Validus Holdings Ltd. | | | | | | | 444 | | | | 20,011 | |
W.R. Berkley Corp. | | | | | | | 598 | | | | 32,513 | |
Total Insurance | | | | | | | | | | | 897,632 | |
Thrifts & Mortgage Finance — 0.1% | | | | | | | | | | | | |
MGIC Investment Corp. | | | | | | | 1,789 | | | | 16,566 | * |
Total Financials | | | | | | | | | | | 2,572,083 | |
| Health Care — 14.2% | | | | | | | | | | | | |
Biotechnology — 4.1% | | | | | | | | | | | | |
Gilead Sciences Inc. | | | | | | | 7,038 | | | | 691,061 | |
Health Care Providers & Services — 6.1% | | | | | | | | | | | | |
Anthem Inc. | | | | | | | 1,436 | | | | 201,040 | |
CIGNA Corp. | | | | | | | 1,228 | | | | 165,805 | |
Humana Inc. | | | | | | | 701 | | | | 125,479 | |
UnitedHealth Group Inc. | | | | | | | 4,548 | | | | 527,613 | |
Total Health Care Providers & Services | | | | | | | | | | | 1,019,937 | |
Pharmaceuticals — 4.0% | | | | | | | | | | | | |
Merck & Co. Inc. | | | | | | | 13,492 | | | | 666,370 | |
Total Health Care | | | | | | | | | | | 2,377,368 | |
| Industrials — 24.1% | | | | | | | | | | | | |
Aerospace & Defense — 10.2% | | | | | | | | | | | | |
Boeing Co. | | | | | | | 3,332 | | | | 436,325 | |
General Dynamics Corp. | | | | | | | 1,586 | | | | 218,789 | |
See Notes to Financial Statements.
| | |
| 16 | | Legg Mason BW Dynamic Large Cap Value Fund 2015 Annual Report |
Legg Mason BW Dynamic Large Cap Value Fund
| | | | | | | | | | | | |
| Security | | | | | | Shares | | | Value | |
Aerospace & Defense — continued | | | | | | | | | | | | |
Huntington Ingalls Industries Inc. | | | | | | | 239 | | | $ | 25,609 | |
Lockheed Martin Corp. | | | | | | | 1,527 | | | | 316,562 | |
Northrop Grumman Corp. | | | | | | | 924 | | | | 153,338 | |
Raytheon Co. | | | | | | | 1,491 | | | | 162,907 | |
Teledyne Technologies Inc. | | | | | | | 164 | | | | 14,809 | * |
United Technologies Corp. | | | | | | | 4,377 | | | | 389,509 | |
Total Aerospace & Defense | | | | | | | | | | | 1,717,848 | |
Airlines — 2.8% | | | | | | | | | | | | |
Alaska Air Group Inc. | | | | | | | 625 | | | | 49,656 | |
American Airlines Group Inc. | | | | | | | 3,296 | | | | 127,984 | |
Delta Air Lines Inc. | | | | | | | 3,800 | | | | 170,506 | |
Southwest Airlines Co. | | | | | | | 3,236 | | | | 123,097 | |
Total Airlines | | | | | | | | | | | 471,243 | |
Commercial Services & Supplies — 0.1% | | | | | | | | | | | | |
Pitney Bowes Inc. | | | | | | | 959 | | | | 19,036 | |
Construction & Engineering — 0.2% | | | | | | | | | | | | |
Fluor Corp. | | | | | | | 710 | | | | 30,069 | |
Electrical Equipment — 1.5% | | | | | | | | | | | | |
Eaton Corp. PLC | | | | | | | 2,233 | | | | 114,553 | |
Emerson Electric Co. | | | | | | | 3,271 | | | | 144,480 | |
Total Electrical Equipment | | | | | | | | | | | 259,033 | |
Industrial Conglomerates — 2.6% | | | | | | | | | | | | |
3M Co. | | | | | | | 3,067 | | | | 434,809 | |
Machinery — 4.1% | | | | | | | | | | | | |
Caterpillar Inc. | | | | | | | 2,968 | | | | 193,989 | |
Deere & Co. | | | | | | | 1,630 | | | | 120,620 | |
Illinois Tool Works Inc. | | | | | | | 1,793 | | | | 147,582 | |
Lincoln Electric Holdings Inc. | | | | | | | 362 | | | | 18,980 | |
Nordson Corp. | | | | | | | 292 | | | | 18,378 | |
Oshkosh Corp. | | | | | | | 83 | | | | 3,015 | |
Parker Hannifin Corp. | | | | | | | 684 | | | | 66,553 | |
Pentair PLC | | | | | | | 865 | | | | 44,150 | |
Stanley Black & Decker Inc. | | | | | | | 757 | | | | 73,414 | |
Total Machinery | | | | | | | | | | | 686,681 | |
Professional Services — 0.2% | | | | | | | | | | | | |
Manpowergroup Inc. | | | | | | | 383 | | | | 31,364 | |
Road & Rail — 2.2% | | | | | | | | | | | | |
Union Pacific Corp. | | | | | | | 4,139 | | | | 365,929 | |
See Notes to Financial Statements.
| | |
| Legg Mason BW Dynamic Large Cap Value Fund 2015 Annual Report | | 17 |
Schedule of investments (cont’d)
September 30, 2015
Legg Mason BW Dynamic Large Cap Value Fund
| | | | | | | | | | | | |
| Security | | | | | | Shares | | | Value | �� |
Trading Companies & Distributors — 0.2% | | | | | | | | | | | | |
United Rentals Inc. | | | | | | | 468 | | | $ | 28,103 | * |
Total Industrials | | | | | | | | | | | 4,044,115 | |
| Information Technology — 18.6% | | | | | | | | | | | | |
Communications Equipment — 2.8% | | | | | | | | | | | | |
QUALCOMM Inc. | | | | | | | 8,624 | | | | 463,368 | |
Electronic Equipment, Instruments & Components — 0.7% | | | | | | | | | | | | |
Corning Inc. | | | | | | | 6,741 | | | | 115,406 | |
IT Services — 0.2% | | | | | | | | | | | | |
DST Systems Inc. | | | | | | | 199 | | | | 20,923 | |
Teradata Corp. | | | | | | | 678 | | | | 19,635 | * |
Total IT Services | | | | | | | | | | | 40,558 | |
Semiconductors & Semiconductor Equipment — 5.9% | | | | | | | | | | | | |
Intel Corp. | | | | | | | 22,704 | | | | 684,298 | |
Texas Instruments Inc. | | | | | | | 4,969 | | | | 246,065 | |
Xilinx Inc. | | | | | | | 1,239 | | | | 52,534 | |
Total Semiconductors & Semiconductor Equipment | | | | | | | | | | | 982,897 | |
Technology Hardware, Storage & Peripherals — 9.0% | | | | | | | | | | | | |
Apple Inc. | | | | | | | 7,529 | | | | 830,448 | |
International Business Machines Corp. | | | | | | | 4,676 | | | | 677,880 | |
Total Technology Hardware, Storage & Peripherals | | | | | | | | | | | 1,508,328 | |
Total Information Technology | | | | | | | | | | | 3,110,557 | |
| Materials — 7.6% | | | | | | | | | | | | |
Chemicals — 6.5% | | | | | | | | | | | | |
CF Industries Holdings Inc. | | | | | | | 1,285 | | | | 57,697 | |
Dow Chemical Co. | | | | | | | 6,358 | | | | 269,579 | |
E.I. du Pont de Nemours & Co. | | | | | | | 4,961 | | | | 239,120 | |
LyondellBasell Industries NV, Class A Shares | | | | | | | 2,552 | | | | 212,735 | |
Monsanto Co. | | | | | | | 2,565 | | | | 218,897 | |
Mosaic Co. | | | | | | | 1,956 | | | | 60,851 | |
Valspar Corp. | | | | | | | 442 | | | | 31,771 | |
Total Chemicals | | | | | | | | | | | 1,090,650 | |
Containers & Packaging — 0.6% | | | | | | | | | | | | |
Bemis Co. Inc. | | | | | | | 536 | | | | 21,210 | |
Crown Holdings Inc. | | | | | | | 765 | | | | 34,999 | * |
Silgan Holdings Inc. | | | | | | | 334 | | | | 17,381 | |
Sonoco Products Co. | | | | | | | 479 | | | | 18,077 | |
Total Containers & Packaging | | | | | | | | | | | 91,667 | |
See Notes to Financial Statements.
| | |
| 18 | | Legg Mason BW Dynamic Large Cap Value Fund 2015 Annual Report |
Legg Mason BW Dynamic Large Cap Value Fund
| | | | | | | | | | | | | | |
| Security | | | | | | | Shares | | | Value | |
Paper & Forest Products — 0.5% | | | | | | | | | | | | | | |
International Paper Co. | | | | | | | | | 2,314 | | | $ | 87,446 | |
Total Materials | | | | | | | | | | | | | 1,269,763 | |
| Utilities — 0.6% | | | | | | | | | | | | | | |
Electric Utilities — 0.2% | | | | | | | | | | | | | | |
PPL Corp. | | | | | | | | | 1,106 | | | | 36,376 | |
Independent Power and Renewable Electricity Producers — 0.4% | | | | | | | | | | | | | | |
AES Corp. | | | | | | | | | 3,753 | | | | 36,742 | |
Calpine Corp. | | | | | | | | | 1,975 | | | | 28,835 | * |
Total Independent Power and Renewable Electricity Producers | | | | | | | | | | | | | 65,577 | |
Total Utilities | | | | | | | | | | | | | 101,953 | |
Total Common Stocks (Cost — $17,435,499) | | | | | | | | | | | | | 16,260,072 | |
| Investment In Underlying Funds — 1.3% | | | | | | | | | | | | | | |
iShares Trust — ishares Russell 1000 Value Index Fund (Cost — $224,655) | | | | | | 2,400 | | | | 223,872 | |
Total Investments before Short-Term Investments (Cost — $17,660,154) | | | | | | | 16,483,944 | |
| | | | |
| | | Rate | | | | | | | | | |
| Short-Term Investments — 1.4% | | | | | | | | | | | | | | |
State Street Institutional Liquid Reserves Fund, Premier Class
(Cost — $227,059) | | | 0.125 | % | | | | $ | 227,059 | | | | 227,059 | |
Total Investments — 99.7% (Cost — $17,887,213#) | | | | | | | | | | 16,711,003 | |
Other Assets in Excess of Liabilities — 0.3% | | | | | | | | | | | | | 50,501 | |
Total Net Assets — 100.0% | | | | | | | | | | | | $ | 16,761,504 | |
| * | Non-income producing security. |
| # | Aggregate cost for federal income tax purposes is $17,981,467. |
See Notes to Financial Statements.
| | |
| Legg Mason BW Dynamic Large Cap Value Fund 2015 Annual Report | | 19 |
Statement of assets and liabilities
September 30, 2015
| | | | |
| |
| Assets: | | | | |
Investments, at value (Cost — $17,887,213) | | $ | 16,711,003 | |
Receivable for Fund shares sold | | | 21,629 | |
Dividends and interest receivable | | | 19,426 | |
Receivable from investment manager | | | 6,485 | |
Prepaid expenses | | | 52,499 | |
Total Assets | | | 16,811,042 | |
| |
| Liabilities: | | | | |
Service and/or distribution fees payable | | | 326 | |
Trustees’ fees payable | | | 239 | |
Accrued expenses | | | 48,973 | |
Total Liabilities | | | 49,538 | |
| Total Net Assets | | $ | 16,761,504 | |
| |
| Net Assets: | | | | |
Par value (Note 7) | | $ | 18 | |
Paid-in capital in excess of par value | | | 17,361,717 | |
Undistributed net investment income | | | 221,907 | |
Accumulated net realized gain on investments | | | 354,072 | |
Net unrealized depreciation on investments | | | (1,176,210) | |
| Total Net Assets | | $ | 16,761,504 | |
| |
| Net Assets: | | | | |
Class A | | | $362,411 | |
Class C | | | $360,761 | |
Class R | | | $9,502 | |
Class I | | | $747,621 | |
Class IS | | | $15,281,209 | |
| |
| Shares Outstanding: | | | | |
Class A | | | 38,152 | |
Class C | | | 38,206 | |
Class R | | | 1,003 | |
Class I | | | 78,640 | |
Class IS | | | 1,607,887 | |
| |
| Net Asset Value: | | | | |
Class A (and redemption price) | | | $9.50 | |
Class C* | | | $9.44 | |
Class R (and redemption price) | | | $9.47 | |
Class I (and redemption price) | | | $9.51 | |
Class IS (and redemption price) | | | $9.50 | |
| Maximum Public Offering Price Per Share: | | | | |
Class A (based on maximum initial sales charge of 5.75%) | | | $10.08 | |
| * | Redemption price per share is NAV of Class C shares reduced by a 1.00% CDSC, if shares are redeemed within one year from purchase payment (See Note 2). |
See Notes to Financial Statements.
| | |
| 20 | | Legg Mason BW Dynamic Large Cap Value Fund 2015 Annual Report |
Statement of operations
For the Period Ended September 30, 2015 †
| | | | |
| |
| Investment Income: | | | | |
Dividends | | $ | 360,684 | |
Interest | | | 189 | |
Less: Foreign taxes withheld | | | (223) | |
Total Investment Income | | | 360,650 | |
| |
| Expenses: | | | | |
Offering costs (Note 1) | | | 151,974 | |
Investment management fee (Note 2) | | | 91,038 | |
Shareholder reports | | | 25,662 | |
Organization expenses (Note 1) | | | 21,849 | |
Legal fees | | | 19,605 | |
Registration fees | | | 19,056 | |
Fund accounting fees | | | 16,823 | |
Audit and tax fees | | | 15,000 | |
Custody fees | | | 3,463 | |
Trustees’ fees | | | 1,462 | |
Service and/or distribution fees (Notes 2 and 5) | | | 1,335 | |
Transfer agent fees (Note 5) | | | 1,108 | |
Insurance | | | 57 | |
Miscellaneous expenses | | | 7,092 | |
Total Expenses | | | 375,524 | |
Less: Fee waivers and/or expense reimbursements (Notes 2 and 5) | | | (266,137) | |
Net Expenses | | | 109,387 | |
| Net Investment Income | | | 251,263 | |
| |
| Realized and Unrealized Gain (Loss) on Investments (Notes 1 and 3): | | | | |
Net Realized Gain from Investment Transactions | | | 354,072 | |
Change in Net Unrealized Appreciation (Depreciation) from Investments | | | (1,176,210) | |
| Net Loss on Investments | | | (822,138) | |
| Decrease in Net Assets from Operations | | $ | (570,875) | |
| † | For the period October 31, 2014 (inception date) to September 30, 2015. |
See Notes to Financial Statements.
| | |
| Legg Mason BW Dynamic Large Cap Value Fund 2015 Annual Report | | 21 |
Statement of changes in net assets
| | | | |
| For the Period Ended September 30, 2015 | | 2015† | |
| |
| Operations: | | | | |
Net investment income | | $ | 251,263 | |
Net realized gain | | | 354,072 | |
Change in net unrealized appreciation (depreciation) | | | (1,176,210) | |
Decrease in Net Assets from Operations | | | (570,875) | |
| |
| Distributions to Shareholders From (Notes 1 and 6): | | | | |
Net investment income | | | (80,000) | |
Decrease in Net Assets from Distributions to Shareholders | | | (80,000) | |
| |
| Fund Share Transactions (Note 7): | | | | |
In-kind capital contribution (Note 8) | | | 18,427,118 | |
Net proceeds from sale of shares | | | 2,111,649 | |
Reinvestment of distributions | | | 80,000 | |
Cost of shares repurchased | | | (3,206,388) | |
Increase in Net Assets from Fund Share Transactions | | | 17,412,379 | |
Increase in Net Assets | | | 16,761,504 | |
| |
| Net Assets: | | | | |
Beginning of period | | | — | |
End of period* | | $ | 16,761,504 | |
*Includes undistributed net investment income of: | | | $221,907 | |
| † | For the period October 31, 2014 (inception date) to September 30, 2015. |
See Notes to Financial Statements.
| | |
| 22 | | Legg Mason BW Dynamic Large Cap Value Fund 2015 Annual Report |
Financial highlights
| | | | |
For a share of each class of beneficial interest outstanding throughout each year ended September 30,
unless otherwise noted: | |
| Class A Shares1 | | 20152 | |
| |
| Net asset value, beginning of period | | | $10.00 | |
| |
| Income (loss) from operations: | | | | |
Net investment income | | | 0.11 | |
Net realized and unrealized loss | | | (0.57) | |
Total loss from operations | | | (0.46) | |
| |
| Less distributions from: | | | | |
Net investment income | | | (0.04) | |
Total distributions | | | (0.04) | |
| |
| Net asset value, end of period | | | $9.50 | |
Total return3 | | | (4.67) | % |
| |
| Net assets, end of period (000s) | | | $362 | |
| |
| Ratios to average net assets: | | | | |
Gross expenses4 | | | 2.58 | % |
Net expenses4,5,6 | | | 1.02 | |
Net investment income4 | | | 1.16 | |
| |
| Portfolio turnover rate7 | | | 110 | % |
| 1 | Per share amounts have been calculated using the average shares method. |
| 2 | For the period November 3, 2014 (inception date) to September 30, 2015. |
| 3 | Performance figures, exclusive of sales charges, may reflect compensating balance arrangements, fee waivers and/or expense reimbursements. In the absence of compensating balance arrangements, fee waivers and/or expense reimbursements, the total return would have been lower. Past performance is no guarantee of future results. Total returns for periods of less than one year are not annualized. |
| 5 | As a result of an expense limitation arrangement, the ratio of expenses, other than interest, brokerage commissions, dividend expense on short sales, taxes, extraordinary expenses and acquired fund fees and expenses, to average net assets of Class A shares did not exceed 1.10%. This expense limitation arrangement cannot be terminated prior to December 31, 2016 without the Board of Trustees’ consent. |
| 6 | Reflects fee waivers and/or expense reimbursements. |
| 7 | Excludes securities received as a result of a contribution in-kind. |
See Notes to Financial Statements.
| | |
| Legg Mason BW Dynamic Large Cap Value Fund 2015 Annual Report | | 23 |
Financial highlights (cont’d)
| | | | |
For a share of each class of beneficial interest outstanding throughout each year ended September 30,
unless otherwise noted: | |
| Class C Shares1 | | 20152 | |
| |
| Net asset value, beginning of period | | | $10.00 | |
| |
| Income (loss) from operations: | | | | |
Net investment income | | | 0.05 | |
Net realized and unrealized loss | | | (0.59) | |
Total loss from operations | | | (0.54) | |
| |
| Less distributions from: | | | | |
Net investment income | | | (0.02) | |
Total distributions | | | (0.02) | |
| |
| Net asset value, end of period | | | $9.44 | |
Total return3 | | | (5.38) | % |
| |
| Net assets, end of period (000s) | | | $361 | |
| |
| Ratios to average net assets: | | | | |
Gross expenses4 | | | 3.14 | % |
Net expenses4,5,6 | | | 1.83 | |
Net investment income4 | | | 0.54 | |
| |
| Portfolio turnover rate7 | | | 110 | % |
| 1 | Per share amounts have been calculated using the average shares method. |
| 2 | For the period November 3, 2014 (inception date) to September 30, 2015. |
| 3 | Performance figures, exclusive of CDSC, may reflect compensating balance arrangements, fee waivers and/or expense reimbursements. In the absence of compensating balance arrangements, fee waivers and/or expense reimbursements, the total return would have been lower. Past performance is no guarantee of future results. Total returns for periods of less than one year are not annualized. |
| 5 | As a result of an expense limitation arrangement, the ratio of expenses, other than interest, brokerage commissions, dividend expense on short sales, taxes, extraordinary expenses and acquired fund fees and expenses, to average net assets of Class C shares did not exceed 1.85%. This expense limitation arrangement cannot be terminated prior to December 31, 2016 without the Board of Trustees’ consent. |
| 6 | Reflects fee waivers and/or expense reimbursements. |
| 7 | Excludes securities received as a result of a contribution in-kind. |
See Notes to Financial Statements.
| | |
| 24 | | Legg Mason BW Dynamic Large Cap Value Fund 2015 Annual Report |
| | | | |
For a share of each class of beneficial interest outstanding throughout each year ended September 30,
unless otherwise noted: | |
| Class R Shares1 | | 20152 | |
| |
| Net asset value, beginning of period | | | $10.00 | |
| |
| Income (loss) from operations: | | | | |
Net investment income | | | 0.09 | |
Net realized and unrealized loss | | | (0.59) | |
Total loss from operations | | | (0.50) | |
| |
| Less distributions from: | | | | |
Net investment income | | | (0.03) | |
Total distributions | | | (0.03) | |
| |
| Net asset value, end of period | | | $9.47 | |
Total return3 | | | (5.02) | % |
| |
| Net assets, end of period (000s) | | | $10 | |
| |
| Ratios to average net assets: | | | | |
Gross expenses4 | | | 2.78 | % |
Net expenses4,5,6 | | | 1.20 | |
Net investment income4 | | | 0.92 | |
| |
| Portfolio turnover rate7 | | | 110 | % |
| 1 | Per share amounts have been calculated using the average shares method. |
| 2 | For the period November 3, 2014 (inception date) to September 30, 2015. |
| 3 | Performance figures may reflect compensating balance arrangements, fee waivers and/or expense reimbursements. In the absence of compensating balance arrangements, fee waivers and/or expense reimbursements, the total return would have been lower. Past performance is no guarantee of future results. Total returns for periods of less than one year are not annualized. |
| 5 | As a result of an expense limitation arrangement, the ratio of expenses, other than interest, brokerage commissions, dividend expense on short sales, taxes, extraordinary expenses and acquired fund fees and expenses, to average net assets of Class R shares did not exceed 1.35%. This expense limitation arrangement cannot be terminated prior to December 31, 2016 without the Board of Trustees’ consent. |
| 6 | Reflects fee waivers and/or expense reimbursements. |
| 7 | Excludes securities received as a result of a contribution in-kind. |
See Notes to Financial Statements.
| | |
| Legg Mason BW Dynamic Large Cap Value Fund 2015 Annual Report | | 25 |
Financial highlights (cont’d)
| | | | |
For a share of each class of beneficial interest outstanding throughout each year ended September 30,
unless otherwise noted: | |
| Class I Shares1 | | 20152 | |
| |
| Net asset value, beginning of period | | | $10.00 | |
| |
| Income (loss) from operations: | | | | |
Net investment income | | | 0.15 | |
Net realized and unrealized loss | | | (0.60) | |
Total loss from operations | | | (0.45) | |
| |
| Less distributions from: | | | | |
Net investment income | | | (0.04) | |
Total distributions | | | (0.04) | |
| |
| Net asset value, end of period | | | $9.51 | |
Total return3 | | | (4.54) | % |
| |
| Net assets, end of period (000s) | | | $748 | |
| |
| Ratios to average net assets: | | | | |
Gross expenses4 | | | 2.02 | % |
Net expenses4,5,6 | | | 0.73 | |
Net investment income4 | | | 1.73 | |
| |
| Portfolio turnover rate7 | | | 110 | % |
| 1 | Per share amounts have been calculated using the average shares method. |
| 2 | For the period November 3, 2014 (inception date) to September 30, 2015. |
| 3 | Performance figures may reflect compensating balance arrangements, fee waivers and/or expense reimbursements. In the absence of compensating balance arrangements, fee waivers and/or expense reimbursements, the total return would have been lower. Past performance is no guarantee of future results. Total returns for periods of less than one year are not annualized. |
| 5 | As a result of an expense limitation arrangement, the ratio of expenses, other than interest, brokerage commissions, dividend expense on short sales, taxes, extraordinary expenses and acquired fund fees and expenses, to average net assets of Class I shares did not exceed 0.75%. This expense limitation arrangement cannot be terminated prior to December 31, 2016 without the Board of Trustees’ consent. |
| 6 | Reflects fee waivers and/or expense reimbursements. |
| 7 | Excludes securities received as a result of a contribution in-kind. |
See Notes to Financial Statements.
| | |
| 26 | | Legg Mason BW Dynamic Large Cap Value Fund 2015 Annual Report |
| | | | |
For a share of each class of beneficial interest outstanding throughout each year ended September 30,
unless otherwise noted: | |
| Class IS Shares1 | | 20152 | |
| |
| Net asset value, beginning of period | | | $10.00 | |
| |
| Income (loss) from operations: | | | | |
Net investment income | | | 0.14 | |
Net realized and unrealized loss | | | (0.60) | |
Total loss from operations | | | (0.46) | |
| |
| Less distributions from: | | | | |
Net investment income | | | (0.04) | |
Total distributions | | | (0.04) | |
| |
| Net asset value, end of period | | | $9.50 | |
Total return3 | | | (4.60) | % |
| |
| Net assets, end of period (000s) | | | $15,281 | |
| |
| Ratios to average net assets: | | | | |
Gross expenses4 | | | 2.26 | % |
Net expenses4,5,6 | | | 0.65 | |
Net investment income4 | | | 1.53 | |
| |
| Portfolio turnover rate7 | | | 110 | % |
| 1 | Per share amounts have been calculated using the average shares method. |
| 2 | For the period October 31, 2014 (inception date) to September 30, 2015. |
| 3 | Performance figures may reflect compensating balance arrangements, fee waivers and/or expense reimbursements. In the absence of compensating balance arrangements, fee waivers and/or expense reimbursements, the total return would have been lower. Past performance is no guarantee of future results. Total returns for periods of less than one year are not annualized. |
| 5 | As a result of an expense limitation arrangement, the ratio of expenses, other than interest, brokerage commissions, dividend expense on short sales, taxes, extraordinary expenses and acquired fund fees and expenses, to average net assets of Class IS shares did not exceed 0.65%. In addition, the total annual fund operating expenses of Class IS shares did not exceed total annual fund operating expenses of Class I shares. These expense limitation arrangements cannot be terminated prior to December 31, 2016 without the Board of Trustees’ consent. |
| 6 | Reflects fee waivers and/or expense reimbursements. |
| 7 | Excludes securities received as a result of a contribution in-kind. |
See Notes to Financial Statements.
| | |
| Legg Mason BW Dynamic Large Cap Value Fund 2015 Annual Report | | 27 |
Notes to financial statements
1. Organization and significant accounting policies
Legg Mason BW Dynamic Large Cap Value Fund (the “Fund”) is a separate diversified investment series of Legg Mason Global Asset Management Trust (the “Trust”). The Trust, a Maryland statutory trust, is registered under the Investment Company Act of 1940, as amended (the “1940 Act”), as an open-end management investment company.
The following are significant accounting policies consistently followed by the Fund and are in conformity with U.S. generally accepted accounting principles (“GAAP”). Estimates and assumptions are required to be made regarding assets, liabilities and changes in net assets resulting from operations when financial statements are prepared. Changes in the economic environment, financial markets and any other parameters used in determining these estimates could cause actual results to differ. Subsequent events have been evaluated through the date the financial statements were issued.
(a) Investment valuation. Equity securities for which market quotations are available are valued at the last reported sales price or official closing price on the primary market or exchange on which they trade. The valuations for fixed income securities (which may include, but are not limited to, corporate, government, municipal, mortgage-backed, collateralized mortgage obligations and asset-backed securities) and certain derivative instruments are typically the prices supplied by independent third party pricing services, which may use market prices or broker/dealer quotations or a variety of valuation techniques and methodologies. The independent third party pricing services use inputs that are observable such as issuer details, interest rates, yield curves, prepayment speeds, credit risks/spreads, default rates and quoted prices for similar securities. Short-term fixed income securities that will mature in 60 days or less are valued at amortized cost, unless it is determined that using this method would not reflect an investment’s fair value. Investments in open-end funds are valued at the closing net asset value per share of each fund on the day of valuation. When the Fund holds securities or other assets that are denominated in a foreign currency, the Fund will normally use the currency exchange rates as of 4:00 p.m. (Eastern Time). If independent third party pricing services are unable to supply prices for a portfolio investment, or if the prices supplied are deemed by the manager to be unreliable, the market price may be determined by the manager using quotations from one or more broker/dealers or at the transaction price if the security has recently been purchased and no value has yet been obtained from a pricing service or pricing broker. When reliable prices are not readily available, such as when the value of a security has been significantly affected by events after the close of the exchange or market on which the security is principally traded, but before the Fund calculates its net asset value, the Fund values these securities as determined in accordance with procedures approved by the Fund’s Board of Trustees.
The Board of Trustees is responsible for the valuation process and has delegated the supervision of the daily valuation process to the Legg Mason North Atlantic Fund Valuation Committee (formerly, Legg Mason North American Fund Valuation Committee) (the “Valuation Committee”). The Valuation Committee, pursuant to the policies adopted by the
| | |
| 28 | | Legg Mason BW Dynamic Large Cap Value Fund 2015 Annual Report |
Board of Trustees, is responsible for making fair value determinations, evaluating the effectiveness of the Fund’s pricing policies, and reporting to the Board of Trustees. When determining the reliability of third party pricing information for investments owned by the Fund, the Valuation Committee, among other things, conducts due diligence reviews of pricing vendors, monitors the daily change in prices and reviews transactions among market participants.
The Valuation Committee will consider pricing methodologies it deems relevant and appropriate when making fair value determinations. Examples of possible methodologies include, but are not limited to, multiple of earnings; discount from market of a similar freely traded security; discounted cash-flow analysis; book value or a multiple thereof; risk premium/yield analysis; yield to maturity; and/or fundamental investment analysis. The Valuation Committee will also consider factors it deems relevant and appropriate in light of the facts and circumstances. Examples of possible factors include, but are not limited to, the type of security; the issuer’s financial statements; the purchase price of the security; the discount from market value of unrestricted securities of the same class at the time of purchase; analysts’ research and observations from financial institutions; information regarding any transactions or offers with respect to the security; the existence of merger proposals or tender offers affecting the security; the price and extent of public trading in similar securities of the issuer or comparable companies; and the existence of a shelf registration for restricted securities.
For each portfolio security that has been fair valued pursuant to the policies adopted by the Board of Trustees, the fair value price is compared against the last available and next available market quotations. The Valuation Committee reviews the results of such back testing monthly and fair valuation occurrences are reported to the Board of Trustees quarterly.
The Fund uses valuation techniques to measure fair value that are consistent with the market approach and/or income approach, depending on the type of security and the particular circumstance. The market approach uses prices and other relevant information generated by market transactions involving identical or comparable securities. The income approach uses valuation techniques to discount estimated future cash flows to present value.
GAAP establishes a disclosure hierarchy that categorizes the inputs to valuation techniques used to value assets and liabilities at measurement date. These inputs are summarized in the three broad levels listed below:
| • | | Level 1 — quoted prices in active markets for identical investments |
| • | | Level 2 — other significant observable inputs (including quoted prices for similar investments, interest rates, prepayment speeds, credit risk, etc.) |
| • | | Level 3 — significant unobservable inputs (including the Fund’s own assumptions in determining the fair value of investments) |
| | |
| Legg Mason BW Dynamic Large Cap Value Fund 2015 Annual Report | | 29 |
Notes to financial statements (cont’d)
The inputs or methodologies used to value securities are not necessarily an indication of the risk associated with investing in those securities.
The following is a summary of the inputs used in valuing the Fund’s assets carried at fair value:
| | | | | | | | | | | | | | | | |
| ASSETS | |
| Description | | Quoted Prices
(Level 1) | | | Other Significant
Observable Inputs
(Level 2) | | | Significant
Unobservable
Inputs
(Level 3) | | | Total | |
| Long-term investments†: | | | | | | | | | | | | | | | | |
Common stocks | | $ | 16,260,072 | | | | — | | | | — | | | $ | 16,260,072 | |
Investment in underlying funds | | | 223,872 | | | | — | | | | — | | | | 223,872 | |
| Total long-term investments | | $ | 16,483,944 | | | | — | | | | — | | | $ | 16,483,944 | |
| Short-term investments† | | | 227,059 | | | | — | | | | — | | | | 227,059 | |
| Total investments | | $ | 16,711,003 | | | | — | | | | — | | | $ | 16,711,003 | |
| † | See Schedule of Investments for additional detailed categorizations. |
(b) Repurchase agreements. The Fund may enter into repurchase agreements with institutions that its subadviser has determined are creditworthy. Each repurchase agreement is recorded at cost. Under the terms of a typical repurchase agreement, the Fund acquires a debt security subject to an obligation of the seller to repurchase, and of the Fund to resell, the security at an agreed-upon price and time, thereby determining the yield during the Fund’s holding period. When entering into repurchase agreements, it is the Fund’s policy that its custodian or a third party custodian, acting on the Fund’s behalf, take possession of the underlying collateral securities, the market value of which, at all times, at least equals the principal amount of the repurchase transaction, including accrued interest. To the extent that any repurchase transaction maturity exceeds one business day, the value of the collateral is marked-to-market and measured against the value of the agreement in an effort to ensure the adequacy of the collateral. If the counterparty defaults, the Fund generally has the right to use the collateral to satisfy the terms of the repurchase transaction. However, if the market value of the collateral declines during the period in which the Fund seeks to assert its rights or if bankruptcy proceedings are commenced with respect to the seller of the security, realization of the collateral by the Fund may be delayed or limited.
(c) Security transactions and investment income. Security transactions are accounted for on a trade date basis. Interest income, adjusted for amortization of premium and accretion of discount, is recorded on the accrual basis. Dividend income is recorded on the ex-dividend date. Foreign dividend income is recorded on the ex-dividend date or as soon as practicable after the Fund determines the existence of a dividend declaration after exercising reasonable due diligence. The cost of investments sold is determined by use of the specific identification method. To the extent any issuer defaults or a credit event occurs that impacts the issuer, the Fund may halt any additional interest income accruals and consider the realizability of interest accrued up to the date of default or credit event.
| | |
| 30 | | Legg Mason BW Dynamic Large Cap Value Fund 2015 Annual Report |
(d) Distributions to shareholders. Distributions from net investment income and distributions of net realized gains, if any, are declared at least annually. Distributions to shareholders of the Fund are recorded on the ex-dividend date and are determined in accordance with income tax regulations, which may differ from GAAP.
(e) Share class accounting. Investment income, common expenses and realized/unrealized gains (losses) on investments are allocated to the various classes of the Fund on the basis of daily net assets of each class. Fees relating to a specific class are charged directly to that share class.
(f) Compensating balance arrangements. The Fund has an arrangement with its custodian bank whereby a portion of the custodian’s fees is paid indirectly by credits earned on the Fund’s cash on deposit with the bank.
(g) Organization costs. Organization costs associated with the establishment of the Fund are charged to expense as they are incurred.
(h) Offering costs. Costs incurred by the Fund in connection with the commencement of the Fund’s operations are being amortized on a straight line basis over twelve months.
(i) Federal and other taxes. It is the Fund’s policy to comply with the federal income and excise tax requirements of the Internal Revenue Code of 1986 (the “Code”), as amended, applicable to regulated investment companies. Accordingly, the Fund intends to distribute its taxable income and net realized gains, if any, to shareholders in accordance with timing requirements imposed by the Code. Therefore, no federal or state income tax provision is required in the Fund’s financial statements.
Management has analyzed the Fund’s tax positions and has concluded that as of September 30, 2015, no provision for income tax is required in the Fund’s financial statements. The Fund’s federal and state income and federal excise tax returns for tax years for which the applicable statutes of limitations have not expired are subject to examination by the Internal Revenue Service and state departments of revenue.
Under the applicable foreign tax laws, a withholding tax may be imposed on interest, dividends and capital gains at various rates.
(j) Reclassification. GAAP requires that certain components of net assets be reclassified to reflect permanent differences between financial and tax reporting. These reclassifications have no effect on net assets or net asset value per share. During the current period, the following reclassifications have been made:
| | | | | | |
| | | Undistributed Net
Investment Income | | Paid-in
Capital | |
| (a) | | $50,644 | | $ | (50,644) | |
| (a) | Reclassifications are due to non-deductible offering and organization costs for tax purposes. |
| | |
| Legg Mason BW Dynamic Large Cap Value Fund 2015 Annual Report | | 31 |
Notes to financial statements (cont’d)
2. Investment management agreement and other transactions with affiliates
Legg Mason Partners Fund Advisor, LLC (“LMPFA”) is the Fund’s investment manager and Brandywine Global Investment Management, LLC (“Brandywine Global”) is the Fund’s subadviser. LMPFA and Brandywine Global are wholly-owned subsidiaries of Legg Mason, Inc. (“Legg Mason”).
Under the investment management agreement, the Fund pays an investment management fee, calculated daily and paid monthly, at an annual rate of 0.55% of the Fund’s average daily net assets.
LMPFA provides administrative and certain oversight services to the Fund. LMPFA delegates to the subadviser the day-to-day portfolio management of the Fund. LMPFA pays Brandywine Global 90% of the net management fee it receives from the Fund.
As a result of expense limitation arrangements between the Fund and LMPFA, the ratio of expenses, other than interest, brokerage commissions, dividend expense on short sales, taxes, extraordinary expenses and acquired fund fees and expenses, to average net assets of Class A, Class C, Class R, Class I and Class IS shares did not exceed 1.10%, 1.85%, 1.35%, 0.75% and 0.65%, respectively. In addition, total annual fund operating expenses for Class IS shares did not exceed total annual fund operating expenses for Class I shares. These expense limitation arrangements cannot be terminated prior to December 31, 2016 without the Board of Trustees’ consent.
During the period ended September 30, 2015, fees waived and/or expenses reimbursed amounted to $266,137.
LMPFA is permitted to recapture amounts waived and/or reimbursed to a class within three years after the fiscal year in which LMPFA earned the fee or incurred the expense if the class’ total annual operating expenses have fallen to a level below the expense limitation (“expense cap”) in effect at the time the fees were earned or the expenses incurred. In no case will LMPFA recapture any amount that would result, on any particular business day of the Fund, in the class’ total annual operating expenses exceeding the expense cap or any other lower limit then in effect.
Pursuant to these arrangements, at September 30, 2015, the Fund had remaining fee waivers and/or expense reimbursements subject to recapture by LMPFA and respective dates of expiration as follows:
| | | | | | | | | | | | | | | | | | | | |
| | | Class A | | | Class C | | | Class R | | | Class I | | | Class IS | |
| Expires September 30, 2018 | | $ | 2,725 | | | $ | 1,116 | | | $ | 148 | | | $ | 1,386 | | | $ | 260,762 | |
| Total fee waivers/expense reimbursements subject to recapture | | $ | 2,725 | | | $ | 1,116 | | | $ | 148 | | | $ | 1,386 | | | $ | 260,762 | |
For the period ended September 30, 2015, LMPFA did not recapture any fees.
Legg Mason Investor Services, LLC (“LMIS”), a wholly-owned broker-dealer subsidiary of Legg Mason, serves as the Fund’s sole and exclusive distributor.
| | |
| 32 | | Legg Mason BW Dynamic Large Cap Value Fund 2015 Annual Report |
There is a maximum initial sales charge of 5.75% for Class A shares. There is a contingent deferred sales charge (“CDSC”) of 1.00% on Class C shares, which applies if redemption occurs within 12 months from purchase payment. In certain cases, Class A shares have a 1.00% CDSC, which applies if redemption occurs within 18 months from purchase payment. This CDSC only applies to those purchases of Class A shares, which, when combined with current holdings of other shares of funds sold by LMIS, equal or exceed $1,000,000 in the aggregate. These purchases do not incur an initial sales charge.
For the period ended September 30, 2015, LMIS and its affiliates retained sales charges of $7 on sales of the Fund’s Class A shares. In addition, there were no CDSCs paid to LMIS and its affiliates for the period ended September 30, 2015.
Under a Deferred Compensation Plan (the “Plan”), Trustees may elect to defer receipt of all or a specified portion of their compensation. A participating Trustee may select one or more funds managed by affiliates of Legg Mason in which his or her deferred trustee’s fees will be deemed to be invested. Deferred amounts remain in the Fund until distributed in accordance with the Plan. In May 2015, the Board of Trustees approved an amendment to the Plan so that effective January 1, 2016, no compensation earned after that date may be deferred under the Plan.
All officers and one Trustee of the Trust are employees of Legg Mason or its affiliates and do not receive compensation from the Trust.
3. Investments
During the period ended September 30, 2015, the aggregate cost of purchases and proceeds from sales of investments (excluding short-term investments) were as follows:
| | | | |
| Purchases | | $ | 19,712,730 | * |
| Sales | | | 20,516,068 | |
| * | Excludes the value of portfolio securities received as a result of a contribution in-kind, totaling $18,109,421. |
At September 30, 2015, the aggregate gross unrealized appreciation and depreciation of investments for federal income tax purposes were as follows:
| | | | |
| Gross unrealized appreciation | | $ | 407,476 | |
| Gross unrealized depreciation | | | (1,677,940) | |
| Net unrealized depreciation | | $ | (1,270,464) | |
4. Derivative instruments and hedging activities
During the period ended September 30, 2015, the Fund did not invest in derivative instruments.
5. Class specific expenses, waivers and/or expense reimbursements
The Fund has adopted a Rule 12b-1 shareholder services and distribution plan and under that plan the Fund pays service and/or distribution fees with respect to its Class A, Class C and Class R shares calculated at the annual rate of 0.25%, 1.00% and 0.50% of the average daily net assets of each class, respectively. Service and/or distribution fees are accrued daily and paid monthly.
| | |
| Legg Mason BW Dynamic Large Cap Value Fund 2015 Annual Report | | 33 |
Notes to financial statements (cont’d)
For the period ended September 30, 2015, class specific expenses were as follows:
| | | | | | | | |
| | | Service and/or
Distribution Fees | | | Transfer Agent
Fees | |
| Class A† | | $ | 438 | | | $ | 338 | |
| Class C† | | | 850 | | | | 60 | |
| Class R† | | | 47 | | | | 18 | |
| Class I† | | | — | | | | 41 | |
| Class IS* | | | — | | | | 651 | |
| Total | | $ | 1,335 | | | $ | 1,108 | |
| † | For the period November 3, 2014 (inception date) to September 30, 2015. |
| * | For the period October 31, 2014 (inception date) to September 30, 2015. |
For the period ended September 30, 2015, waivers and/or expense reimbursements by class were as follows:
| | | | |
| | | Waivers/Expense
Reimbursements | |
| Class A† | | $ | 2,725 | |
| Class C† | | | 1,116 | |
| Class R† | | | 148 | |
| Class I† | | | 1,386 | |
| Class IS* | | | 260,762 | |
| Total | | $ | 266,137 | |
| † | For the period November 3, 2014 (inception date) to September 30, 2015. |
| * | For the period October 31, 2014 (inception date) to September 30, 2015. |
6. Distributions to shareholders by class
| | | | |
| | | Period Ended
September 30, 2015 | |
| Net Investment Income: | | | | |
| Class A† | | $ | 46 | |
| Class C† | | | 25 | |
| Class R† | | | 31 | |
| Class I† | | | 39 | |
| Class IS* | | | 79,859 | |
| Total | | $ | 80,000 | |
| † | For the period November 3, 2014 (inception date) to September 30, 2015. |
| * | For the period October 31, 2014 (inception date) to September 30, 2015. |
7. Shares of beneficial interest
At September 30, 2015, the Trust had an unlimited number of shares of beneficial interest authorized with a par value of $0.00001 per share. The Fund has the ability to issue multiple classes of shares. Each class of shares represents an identical interest and has the same rights, except that each class bears certain direct expenses, including those specifically related to the distribution of its shares.
| | |
| 34 | | Legg Mason BW Dynamic Large Cap Value Fund 2015 Annual Report |
Transactions in shares of each class were as follows:
| | | | | | | | |
| | | Period Ended
September 30, 2015 | |
| | | Shares | | | Amount | |
| Class A† | | | | | | | | |
| Shares sold | | | 44,097 | | | $ | 456,705 | |
| Shares issued on reinvestment | | | 4 | | | | 46 | |
| Shares repurchased | | | (5,949) | | | | (62,414) | |
| Net increase | | | 38,152 | | | $ | 394,337 | |
| | |
| Class C† | | | | | | | | |
| Shares sold | | | 39,206 | | | $ | 402,360 | |
| Shares issued on reinvestment | | | 2 | | | | 25 | |
| Shares repurchased | | | (1,002) | | | | (10,515) | |
| Net increase | | | 38,206 | | | $ | 391,870 | |
| | |
| Class R† | | | | | | | | |
| Shares sold | | | 1,000 | | | $ | 10,000 | |
| Shares issued on reinvestment | | | 3 | | | | 31 | |
| Net increase | | | 1,003 | | | $ | 10,031 | |
| | |
| Class I† | | | | | | | | |
| Shares sold | | | 78,636 | | | $ | 774,832 | |
| Shares issued on reinvestment | | | 4 | | | | 39 | |
| Net increase | | | 78,640 | | | $ | 774,871 | |
| | |
| Class IS* | | | | | | | | |
| In-kind capital contribution | | | 1,842,712 | | | $ | 18,427,118 | |
| Shares sold | | | 45,351 | | | | 467,752 | |
| Shares issued on reinvestment | | | 7,701 | | | | 79,859 | |
| Shares repurchased | | | (287,877) | | | | (3,133,459) | |
| Net increase | | | 1,607,887 | | | $ | 15,841,270 | |
| † | For the period November 3, 2014 (inception date) to September 30, 2015. |
| * | For the period October 31, 2014 (inception date) to September 30, 2015. |
8. In-kind transfer of securities
On October 31, 2014, the Fund’s Class IS shares received a contribution in-kind of investment securities, cash and other receivables in the amount of $18,427,118. The securities contributed in-kind had net unrealized depreciation of $105,852. This contribution was determined to be tax-free under the Internal Revenue Code Section 351 and no gain or loss was realized.
| | |
| Legg Mason BW Dynamic Large Cap Value Fund 2015 Annual Report | | 35 |
Notes to financial statements (cont’d)
9. Income tax information and distributions to shareholders
The tax character of distributions paid during the fiscal period ended September 30 was as follows:
| | | | |
| | | 2015 | |
| Distributions paid from: | | | | |
| Ordinary income | | $ | 80,000 | |
As of September 30, 2015, the components of accumulated earnings (losses) on a tax basis were as follows:
| | | | |
| Undistributed ordinary income — net | | $ | 682,077 | |
| Other book/tax temporary differences(a) | | | (11,844) | |
| Unrealized appreciation (depreciation)(b) | | | (1,270,464) | |
| Total accumulated earnings (losses) — net | | $ | (600,231) | |
| (a) | Other book/tax temporary differences are attributable to book/tax differences in the timing of the deductibility of various expenses. |
| (b) | The difference between book-basis and tax-basis unrealized appreciation (depreciation) is attributable to the tax deferral of losses on wash sales. |
| | |
| 36 | | Legg Mason BW Dynamic Large Cap Value Fund 2015 Annual Report |
Report of independent registered public accounting firm
To the Board of Trustees of Legg Mason Global Asset Management Trust and Shareholders of the Legg Mason BW Dynamic Large Cap Value Fund:
In our opinion, the accompanying statement of assets and liabilities, including the schedule of investments, and the related statements of operations and of changes in net assets and the financial highlights present fairly, in all material respects, the financial position of the Legg Mason BW Dynamic Large Cap Value Fund (one of the funds comprising Legg Mason Global Asset Management Trust, the “Fund”) at September 30, 2015, the results of its operations, the changes in its net assets and the financial highlights for the period presented, in conformity with accounting principles generally accepted in the United States of America. These financial statements and financial highlights (hereafter referred to as “financial statements”) are the responsibility of the Fund’s management. Our responsibility is to express an opinion on these financial statements based on our audit. We conducted our audit of these financial statements in accordance with the standards of the Public Company Accounting Oversight Board (United States). Those standards require that we plan and perform the audit to obtain reasonable assurance about whether the financial statements are free of material misstatement. An audit includes examining, on a test basis, evidence supporting the amounts and disclosures in the financial statements, assessing the accounting principles used and significant estimates made by management, and evaluating the overall financial statement presentation. We believe that our audit, which included confirmation of securities at September 30, 2015 by correspondence with the custodian and brokers, provides a reasonable basis for our opinion.
PricewaterhouseCoopers LLP
Baltimore, Maryland
November 16, 2015
| | |
| Legg Mason BW Dynamic Large Cap Value Fund 2015 Annual Report | | 37 |
Additional information (unaudited)
Information about Trustees and Officers
The business and affairs of Legg Mason BW Dynamic Large Cap Value Fund (the “Fund”) are conducted by management under the supervision and subject to the direction of its Board of Trustees. The business address of each Trustee is c/o Jane Trust, Legg Mason, 100 International Drive, 11th Floor, Baltimore, Maryland 21202. Information pertaining to the Trustees and officers of the Fund is set forth below.
The Statement of Additional Information includes additional information about Trustees and is available, without charge, upon request by calling the Fund at 1-877-721-1926.
| | |
| Independent Trustees† |
| Ruby P. Hearn |
| Year of birth | | 1940 |
| Position(s) with Trust | | Trustee |
| Term of office1 and length of time served2 | | Since 2004 |
| Principal occupation(s) during past five years | | Senior Vice President Emerita of The Robert Wood Johnson Foundation (non-profit) since 2001; Member of the Institute of Medicine since 1982; formerly: Trustee of the New York Academy of Medicine (2004 to 2012); Director of the Institute for Healthcare Improvement (2002 to 2012); Senior Vice President of The Robert Wood Johnson Foundation (1996 to 2001); Fellow of The Yale Corporation (1992 to 1998). |
| Number of funds in fund complex overseen by Trustee | | 19 |
| Other board memberships held by Trustee during past five years | | None |
|
| Arnold L. Lehman |
| Year of birth | | 1944 |
| Position(s) with Trust | | Trustee and Chairman |
| Term of office1 and length of time served2 | | Since 1982 |
| Principal occupation(s) during past five years | | Retired. Trustee of American Federation of Arts since 1998. Formerly: Director of the Brooklyn Museum (1997 to 2015); Director of The Baltimore Museum of Art (1979 to 1997). |
| Number of funds in fund complex overseen by Trustee | | 19 |
| Other board memberships held by Trustee during past five years | | None |
|
| Robin J.W. Masters |
| Year of birth | | 1955 |
| Position(s) with Trust | | Trustee |
| Term of office1 and length of time served2 | | Since 2002 |
| Principal occupation(s) during past five years | | Retired; formerly: Chief Investment Officer of ACE Limited (insurance) (1986 to 2000). |
| Number of funds in fund complex overseen by Trustee | | 19 |
| Other board memberships held by Trustee during past five years | | Director of Cheyne Capital International Limited (investment advisory firm). Formerly, Director/Trustee of Legg Mason Institutional Funds plc, WAFixed Income Funds plc and Western Asset Debt Securities Fund plc. (2007 to 2011) |
| | |
| 38 | | Legg Mason BW Dynamic Large Cap Value Fund |
| | |
| Independent Trustees† cont’d |
| Jill E. McGovern |
| Year of birth | | 1944 |
| Position(s) with Trust | | Trustee |
| Term of office1 and length of time served2 | | Since 1989 |
| Principal occupation(s) during past five years | | Senior Consultant, American Institute for Contemporary German Studies (AICGS) since 2007; formerly: Chief Executive Officer of The Marrow Foundation (non-profit) (1993 to 2007); Executive Director of the Baltimore International Festival (1991 to 1993); Senior Assistant to the President of The Johns Hopkins University (1986 to 1990). |
| Number of funds in fund complex overseen by Trustee | | 19 |
| Other board memberships held by Trustee during past five years | | Director of International Biomedical Research Alliance; Director of Lois Roth Endowment |
|
| Arthur S. Mehlman |
| Year of birth | | 1942 |
| Position(s) with Trust | | Trustee |
| Term of office1 and length of time served2 | | Since 2002 |
| Principal occupation(s) during past five years | | Retired. Director, The University of Maryland Foundation since 1992; Director, The League for People with Disabilities since 2003; formerly: Director, Municipal Mortgage & Equity LLC (2004 to 2011); Partner, KPMG LLP (international accounting firm) (1972 to 2002). |
| Number of funds in fund complex overseen by Trustee | | Director/Trustee of all Legg Mason Funds consisting of 19 portfolios; Director/Trustee of the Royce Family of Funds consisting of 26 portfolios. |
| Other board memberships held by Trustee during past five years | | Director of Municipal Mortgage & Equity, LLC. (2004 to 2011) |
|
| G. Peter O’Brien |
| Year of birth | | 1945 |
| Position(s) with Trust | | Trustee |
| Term of office1 and length of time served2 | | Since 1999 |
| Principal occupation(s) during past five years | | Retired. Trustee Emeritus of Colgate University; Board Member, Hill House, Inc. (residential home care); Board Member, Bridges School (pre- school); formerly: Managing Director, Equity Capital Markets Group of Merrill Lynch & Co. (1971-1999). |
| Number of funds in fund complex overseen by Trustee | | Director/Trustee of all Legg Mason funds consisting of 19 portfolios; Director/Trustee of the Royce Family of Funds consisting of 26 portfolios. |
| Other board memberships held by Trustee during past five years | | Director of TICC Capital Corp. |
| | |
| Legg Mason BW Dynamic Large Cap Value Fund | | 39 |
Additional information (unaudited) (cont’d)
Information about Trustees and Officers
| | |
| Independent Trustees† cont’d |
| S. Ford Rowan |
| Year of birth | | 1943 |
| Position(s) with Trust | | Trustee |
| Term of office1 and length of time served2 | | Since 2002 |
| Principal occupation(s) during past five years | | Chairman, National Center for Critical Incident Analysis, National Defense University Foundation, since 2004; Consultant to University of Maryland University College, since 2013; formerly: Lecturer in Organizational Sciences, George Washington University (2000 to 2014); Trustee, St. John’s College (2006 to 2012); Consultant, Rowan & Blewitt Inc. (management consulting) (1984 to 2007); Lecturer in Journalism, Northwestern University (1980 to 1993); Director, Santa Fe Institute (1999 to 2008). |
| Number of funds in fund complex overseen by Trustee | | 19 |
| Other board memberships held by Trustee during past five years | | None |
|
| Robert M. Tarola |
| Year of birth | | 1950 |
| Position(s) with Trust | | Trustee |
| Term of office1 and length of time served2 | | Since 2004 |
| Principal occupation(s) during past five years | | President of Right Advisory LLC (corporate finance and governance consulting) since 2008; Member, Investor Advisory Group of the Public Company Accounting Oversight Board since 2009; formerly: Senior Vice President and Chief Financial Officer of The Howard University (2009 to 2013) (higher education and health care); Senior Vice President and Chief Financial Officer of W.R. Grace & Co. (specialty chemicals) (1999 to 2008) and MedStar Health, Inc. (healthcare) (1996 to 1999); Partner, Price Waterhouse, LLP (accounting and auditing) (1984 to 1996). |
| Number of funds in fund complex overseen by Trustee | | 19 |
| Other board memberships held by Trustee during past five years | | Director of American Kidney Fund (renal disease assistance); Director of XBRL International, Inc. (global data standard setting); Director of Vista Outdoor, Inc. (sporting goods); formerly: Director of TeleTech Holdings, Inc. (business process outsourcing). |
| | |
| Interested Trustee |
| Jane Trust3 | | |
| Year of birth | | 1962 |
| Position(s) with Trust | | Trustee, President and Chief Executive Officer |
| Term of office1 and length of time served2 | | Since 2015 |
| Principal occupation(s) during past five years | | Managing Director of Legg Mason & Co., LLC (“Legg Mason & Co.”) (since 2015); Officer and/or Trustee/Director of 156 funds associated with LMPFA or its affiliates (since 2015); President and Chief Executive Officer of LMPFA (since 2015); formerly, Senior Vice President of LMPFA (2015); formerly, Director of ClearBridge, LLC (formerly, Legg Mason Capital Management, LLC) (2007 to 2014); formerly, Managing Director of Legg Mason Investment Counsel & Trust Co. (2000 to 20007) |
| Number of funds in fund complex overseen by Trustee | | 147 |
Other board memberships held by Trustee during past
five years | | None |
| | |
| 40 | | Legg Mason BW Dynamic Large Cap Value Fund |
| | |
| Executive Officers |
Richard F. Sennett Legg Mason 100 International Drive, 7th Floor, Baltimore, MD 21202 | | |
| Year of birth | | 1970 |
| Position(s) with Trust | | Principal Financial Officer |
| Term of office1 and length of time served2 | | Since 2011 |
| Principal occupation(s) during past five years | | Principal Financial Officer and Treasurer of certain mutual funds associated with Legg Mason & Co. or its affiliates (since 2011 and since 2013); Managing Director of Legg Mason & Co. and Senior Manager of the Treasury Policy group for Legg Mason & Co.’s Global Fiduciary Platform (since 2011); formerly, Chief Accountant within the SEC’s Division of Investment Management (2007 to 2011); formerly, Assistant Chief Accountant within the SEC’s Division of Investment Management (2002 to 2007) |
| |
Robert I. Frenkel Legg Mason 100 First Stamford Place, 6th Floor, Stamford, CT 06902 | | |
| Year of birth | | 1954 |
| Position(s) with Trust | | Secretary and Chief Legal Officer |
| Term of office1 and length of time served2 | | Since 2007 |
| Principal occupation(s) during past five years | | Vice President and Deputy General Counsel of Legg Mason (since 2006); Managing Director and General Counsel of Global Mutual Funds for Legg Mason & Co. (since 2006) and Legg Mason & Co. predecessors (since 1994); Secretary and Chief Legal Officer of certain mutual funds associated with Legg Mason & Co. or its affiliates (since 2006) and Legg Mason & Co. predecessors (prior to 2006) |
| |
Ted P. Becker Legg Mason 620 Eighth Avenue, 49th Floor, New York, NY 10018 | | |
| Year of birth | | 1951 |
| Position(s) with Trust | | Vice President and Chief Compliance Officer |
| Term of office1 and length of time served2 | | Since 2007 |
| Principal occupation(s) during past five years | | Director of Global Compliance at Legg Mason (since 2006); Chief Compliance Officer of LMPFA (since 2006); Managing Director of Compliance of Legg Mason & Co. (since 2005); Chief Compliance Officer of certain mutual funds associated with Legg Mason & Co. or its affiliates (since 2006) and Legg Mason & Co. predecessors (prior to 2006) |
| | |
| Legg Mason BW Dynamic Large Cap Value Fund | | 41 |
Additional information (unaudited) (cont’d)
Information about Trustees and Officers
| | |
| Executive Officers cont’d |
Christopher Berarducci Legg Mason 620 Eighth Avenue, 49th Floor, New York, NY 10018 | | |
| Year of birth | | 1974 |
| Position(s) with Trust | | Treasurer |
| Term of office1 and length of time served2 | | Since 2010 |
| Principal occupation(s) during past five years | | Director of Legg Mason & Co. (since 2015); Treasurer of certain mutual funds associated with Legg Mason & Co. or its affiliates (since 2010); formerly, Vice President of Legg Mason & Co. (2011 to 2015); formerly, Assistant Controller of certain mutual funds associated with Legg Mason & Co. or its affiliates (prior to 2010) |
| |
Susan Kerr Legg Mason 620 Eighth Avenue, 49th Floor, New York, NY 10018 | | |
| Year of birth | | 1949 |
| Position(s) with Trust | | Chief Anti-Money Laundering Compliance Officer |
| Term of office1 and length of time served2 | | Since 2013 |
| Principal occupation(s) during past five years | | Assistant Vice President of Legg Mason & Co. and Legg Mason Investor Services, LLC (“LMIS”) (since 2010); Chief Anti-Money Laundering Compliance Officer of certain mutual funds associated with Legg Mason & Co. or its affiliates (since 2013) and Anti-Money Laundering Compliance Officer of LMIS (since 2012); Senior Compliance Officer of LMIS (since 2011); formerly, AML Consultant, DTCC (2010); formerly, AML Consultant, Rabobank Netherlands, (2009); formerly, First Vice President, Director of Marketing & Advertising Compliance and Manager of Communications Review Group at Citigroup Inc. (1996 to 2008) |
| |
Vanessa A. Williams Legg Mason 100 First Stamford Place, 6th Floor, Stamford, CT 06902 | | |
| Year of birth | | 1979 |
| Position(s) with Trust | | Identity Theft Prevention Officer |
| Term of office1 and length of time served2 | | Since 2011 |
| Principal occupation(s) during past five years | | Vice President of Legg Mason & Co. (since 2012); Identity Theft Prevention Officer of certain mutual funds associated with Legg Mason & Co. or its affiliates (since 2011); formerly, Chief Anti-Money Laundering Compliance Officer of certain mutual funds associated with Legg Mason & Co. or its affiliates (2011 to 2013); formerly, Senior Compliance Officer of Legg Mason & Co. (2008 to 2011); formerly, Compliance Analyst of Legg Mason & Co. (2006 to 2008) and Legg Mason & Co. predecessors (prior to 2006) |
| | |
| 42 | | Legg Mason BW Dynamic Large Cap Value Fund |
| † | Trustees who are not “interested persons” of the Fund within the meaning of Section 2(a)(19) of the 1940 Act. Each of the Independent Trustees serves on the standing committees of the Board of Trustees, which include the Audit Committee (chair: Arthur S. Mehlman), the Nominating Committee (co-chairs: G. Peter O’Brien and Jill E. McGovern), and the Independent Trustees Committee (chair: Arnold L. Lehman). |
| 1 | Each Trustee and officer serves until his or her respective successor has been duly elected and qualified or until hi s or her earlier death, resignation, retirement or removal. |
| 2 | Indicates the earliest year in which the Trustee became a board member for a fund in the Legg Mason fund complex or the officer took such office. |
| 3 | Effective June 1, 2015, Ms. Trust became a Trustee. In addition, Ms. Trust is an “interested person” of the Fund, as defined in the 1940 Act, because of her position with LMPFA and/or certain of its affiliates. |
| | |
| Legg Mason BW Dynamic Large Cap Value Fund | | 43 |
Important tax information (unaudited)
The following information is provided with respect to the distributions paid during the taxable year ended September 30, 2015:
| | | | |
| Record date: | | | 12/22/2014 | |
| Payable date: | | | 12/23/2014 | |
| Ordinary income: | | | | |
Qualified dividend income for individuals | | | 100.00 | % |
Dividends qualifying for the dividends | | | | |
received deduction for corporations | | | 100.00 | % |
Please retain this information for your records.
| | |
| 44 | | Legg Mason BW Dynamic Large Cap Value Fund |
Legg Mason BW
Dynamic Large Cap Value Fund
Trustees
Ruby P. Hearn
Arnold L. Lehman*
Chairman
Robin J.W. Masters
Jill E. McGovern
Arthur S. Mehlman
G. Peter O’Brien
S. Ford Rowan
Robert M. Tarola
Jane Trust*
| * | Effective June 1, 2015, Mr. Lehman became Chairman and Ms. Trust became a Trustee, President and Chief Executive Officer. |
Investment manager
Legg Mason Partners Fund Advisor, LLC
Subadviser
Brandywine Global Investment Management, LLC
Distributor
Legg Mason Investor Services, LLC
Custodian
State Street Bank and Trust Company
Transfer agent
BNY Mellon Investment
Servicing (US) Inc.
4400 Computer Drive
Westborough, MA 01581
Independent registered public accounting firm
PricewaterhouseCoopers LLP
Baltimore, MD
Legg Mason BW Dynamic Large Cap Value Fund
The Fund is a separate investment series of Legg Mason Global Asset Management Trust, a Maryland statutory trust.
Legg Mason BW Dynamic Large Cap Value Fund
Legg Mason Funds
620 Eighth Avenue, 49th Floor
New York, NY 10018
The Fund files its complete schedule of portfolio holdings with the Securities and Exchange Commission (“SEC”) for the first and third quarters of each fiscal year on Form N-Q. The Fund’s Forms N-Q are available on the SEC’s website at www.sec.gov. The Fund’s Forms N-Q may be reviewed and copied at the SEC’s Public Reference Room in Washington, D.C., and information on the operation of the Public Reference Room may be obtained by calling 1-800-SEC-0330. To obtain information on Form N-Q, shareholders can call the Fund at 1-877-721-1926.
Information on how the Fund voted proxies relating to portfolio securities during the prior 12-month period ended June 30th of each year and a description of the policies and procedures that the Fund uses to determine how to vote proxies relating to portfolio transactions are available (1) without charge, upon request, by calling the Fund at 1-877-721-1926, (2) on the Fund’s website at www.leggmason.com/individualinvestors and (3) on the SEC’s website at www.sec.gov.
This report is submitted for the general information of the shareholders of Legg Mason BW Dynamic Large Cap Value Fund. This report is not authorized for distribution to prospective investors in the Fund unless preceded or accompanied by a current prospectus.
Investors should consider the Fund’s investment objectives, risks, charges and expenses carefully before investing. The prospectus contains this and other important information about the Fund. Please read the prospectus carefully before you invest.
www.leggmason.com/individualinvestors
© 2015 Legg Mason Investor Services, LLC
Member FINRA, SIPC
Legg Mason Funds Privacy and Security Notice
Your Privacy and the Security of Your Personal Information is Very Important to the Legg Mason Funds
This Privacy and Security Notice (the “Privacy Notice”) addresses the Legg Mason Funds’ privacy and data protection practices with respect to nonpublic personal information the Funds receive. The Legg Mason Funds include any funds sold by the Funds’ distributor, Legg Mason Investor Services, LLC, as well as Legg Mason-sponsored closed-end funds and certain closed-end funds managed or sub-advised by Legg Mason or its affiliates. The provisions of this Privacy Notice apply to your information both while you are a shareholder and after you are no longer invested with the Funds.
The Type of Nonpublic Personal Information the Funds Collect About You
The Funds collect and maintain nonpublic personal information about you in connection with your shareholder account. Such information may include, but is not limited to:
| • | | Personal information included on applications or other forms; |
| • | | Account balances, transactions, and mutual fund holdings and positions; |
| • | | Online account access user IDs, passwords, security challenge question responses; and |
| • | | Information received from consumer reporting agencies regarding credit history and creditworthiness (such as the amount of an individual’s total debt, payment history, etc.). |
How the Funds Use Nonpublic Personal Information About You
The Funds do not sell or share your nonpublic personal information with third parties or with affiliates for their marketing purposes, or with other financial institutions or affiliates for joint marketing purposes, unless you have authorized the Funds to do so. The Funds do not disclose any nonpublic personal information about you except as may be required to perform transactions or services you have authorized or as permitted or required by law. The Funds may disclose information about you to:
| • | | Employees, agents, and affiliates on a “need to know” basis to enable the Funds to conduct ordinary business or comply with obligations to government regulators; |
| • | | Service providers, including the Funds’ affiliates, who assist the Funds as part of the ordinary course of business (such as printing, mailing services, or processing or servicing your account with us) or otherwise perform services on the Funds’ behalf, including companies that may perform marketing services solely for the Funds; |
| • | | The Funds’ representatives such as legal counsel, accountants and auditors; and |
| • | | Fiduciaries or representatives acting on your behalf, such as an IRA custodian or trustee of a grantor trust. |
|
| NOT PART OF THE ANNUAL REPORT |
Legg Mason Funds Privacy and Security Notice (cont’d)
Except as otherwise permitted by applicable law, companies acting on the Funds’ behalf are contractually obligated to keep nonpublic personal information the Funds provide to them confidential and to use the information the Funds share only to provide the services the Funds ask them to perform.
The Funds may disclose nonpublic personal information about you when necessary to enforce their rights or protect against fraud, or as permitted or required by applicable law, such as in connection with a law enforcement or regulatory request, subpoena, or similar legal process. In the event of a corporate action or in the event a Fund service provider changes, the Funds may be required to disclose your nonpublic personal information to third parties. While it is the Funds’ practice to obtain protections for disclosed information in these types of transactions, the Funds cannot guarantee their privacy policy will remain unchanged.
Keeping You Informed of the Funds’ Privacy and Security Practices
The Funds will notify you annually of their privacy policy as required by federal law. While the Funds reserve the right to modify this policy at any time they will notify you promptly if this privacy policy changes.
The Funds’ Security Practices
The Funds maintain appropriate physical, electronic and procedural safeguards designed to guard your nonpublic personal information. The Funds’ internal data security policies restrict access to your nonpublic personal information to authorized employees, who may use your nonpublic personal information for Fund business purposes only.
Although the Funds strive to protect your nonpublic personal information, they cannot ensure or warrant the security of any information you provide or transmit to them, and you do so at your own risk. In the event of a breach of the confidentiality or security of your nonpublic personal information, the Funds will attempt to notify you as necessary so you can take appropriate protective steps. If you have consented to the Funds using electronic communications or electronic delivery of statements, they may notify you under such circumstances using the most current email address you have on record with them.
In order for the Funds to provide effective service to you, keeping your account information accurate is very important. If you believe that your account information is incomplete, not accurate or not current, or if you have questions about the Funds’ privacy practices, write the Funds using the contact information on your account statements, email the Funds by clicking on the Contact Us section of the Funds’ website at www.leggmason.com, or contact the Fund at 1-877-721-1926.
|
| NOT PART OF THE ANNUAL REPORT |
www.leggmason.com/individualinvestors
© 2015 Legg Mason Investor Services, LLC Member FINRA, SIPC
BWXX211448 11/15 SR15-2629
The registrant has adopted a code of ethics that applies to the registrant’s principal executive officer, principal financial officer, principal accounting officer or controller.
| ITEM 3. | AUDIT COMMITTEE FINANCIAL EXPERT. |
The Board of Trustees of the registrant has determined that Arthur S. Mehlman the Chairman of the Board’s Audit Committee and Robert M. Tarola, possess the technical attributes identified in Instruction 2(b) of Item 3 to Form N- to qualify as “audit committee financial experts,” and have designated Mr. Mehlman and Mr. Tarola CSR as the Audit Committee’s financial experts. Mr. Mehlman and Mr. Tarola are “independent” Trustees pursuant to paragraph (a) (2) of Item 3 to Form N-CSR.
| ITEM 4. | PRINCIPAL ACCOUNTANT FEES AND SERVICES. |
a) Audit Fees. The aggregate fees billed in the last two fiscal years ending September 30, 2014 and September 30, 2015 (the “Reporting Periods”) for professional services rendered by the Registrant’s principal accountant (the “Auditor”) for the audit of the Registrant’s annual financial statements, or services that are normally provided by the Auditor in connection with the statutory and regulatory filings or engagements for the Reporting Periods, were $187,820 in September 30, 2014 and $205,455 in September 30, 2015.
b) Audit-Related Fees. The aggregate fees billed in the Reporting Period for assurance and related services by the Auditor that are reasonably related to the performance of the Registrant’s financial statements were $0 in September 30, 2014 and $0 in September 30, 2015.
(c) Tax Fees. The aggregate fees billed in the Reporting Periods for professional services rendered by the Auditor for tax compliance, tax advice and tax planning (“Tax Services”) were $75,738 in September 30, 2014 and $25,565 in September 30, 2015. These services consisted of (i) review or preparation of U.S. federal, state, local and excise tax returns; (ii) U.S. federal, state and local tax planning, advice and assistance regarding statutory, regulatory or administrative developments, and (iii) tax advice regarding tax qualification matters and/or treatment of various financial instruments held or proposed to be acquired or held.
There were no fees billed for tax services by the to service affiliates during the Reporting Periods that required pre-approval by the Audit Auditors Committee.
d) All Other Fees. The aggregate fees for other fees billed in the Reporting Periods for products and services provided by the Auditor were $2,928 in September 30, 2014 and $1,762 in September 30, 2015, other than the services reported in paragraphs (a) through (c) of this item for the Legg Mason Global Asset Management Trust.
All Other Fees. There were no other non-audit services rendered by the Auditor to Legg Mason Partners Fund Advisors, LLC (“LMPFA”), and any entity controlling, controlled by or under common control with LMPFA that provided ongoing services to Legg Mason Global Asset Management Trust requiring pre-approval by the Audit Committee in the Reporting Period.
(e) Audit Committee’s pre–approval policies and procedures described in paragraph (c)
(7) of Rule 2-01 of Regulation S-X.
(1) The Charter for the Audit Committee (the “Committee”) of the Board of each registered investment company (the “Fund”) advised by LMPFA or one of their affiliates (each, an “Adviser”) requires that the Committee shall approve (a) all audit and permissible non-audit services to be provided to the Fund and (b) all permissible non-audit services to be provided by the Fund’s independent auditors to the Adviser and any Covered Service Providers if the engagement relates directly to the operations and financial reporting of the Fund. The Committee may implement policies and procedures by which such services are approved other than by the full Committee.
The Committee shall not approve non-audit services that the Committee believes may impair the independence of the auditors. As of the date of the approval of this Audit Committee Charter, permissible non-audit services include any professional services (including tax services), that are not prohibited services as described below, provided to the Fund by the independent auditors, other than those provided to the Fund in connection with an audit or a review of the financial statements of the Fund. Permissible non-audit services may not include: (i) bookkeeping or other services related to the accounting records or financial statements of the Fund; (ii) financial information systems design and implementation; (iii) appraisal or valuation services, fairness opinions or contribution-in-kind reports; (iv) actuarial services; (v) internal audit outsourcing services; (vi) management functions or human resources; (vii) broker or dealer, investment adviser or investment banking services; (viii) legal services and expert services unrelated to the audit; and (ix) any other service the Public Company Accounting Oversight Board determines, by regulation, is impermissible.
Pre-approval by the Committee of any permissible non-audit services is not required so long as: (i) the aggregate amount of all such permissible non-audit services provided to the Fund, the Adviser and any service providers controlling, controlled by or under common control with the Adviser that provide ongoing services to the Fund (“Covered Service Providers”) constitutes not more than 5% of the total amount of revenues paid to the independent auditors during the fiscal year in which the permissible non-audit services are provided to (a) the Fund, (b) the Adviser and (c) any entity controlling, controlled by or under common control with the Adviser that provides ongoing services to the Fund during the fiscal year in which the services are provided that would have to be approved by the Committee; (ii) the permissible non-audit services were not recognized by the Fund at the time of the engagement to be non-audit services; and (iii) such services are promptly brought to the attention of the Committee and approved by the Committee (or its delegate(s)) prior to the completion of the audit.
(2) For the Legg Mason Global Asset Management Trust, the percentage of fees that were approved by the audit committee, with respect to: Audit-Related Fees were 100% and 100% for September 30, 2014 and September 30, 2015; Tax Fees were 100% and 100% for September 30, 2014 and September 30, 2015; and Other Fees were 100% and 100% for September 30, 2014 and September 30, 2015.
(f) N/A
(g) Non-audit fees billed by the Auditor for services rendered to Legg Mason Global Asset Management Trust, LMPFA and any entity controlling, controlled by, or under common control with LMPFA that provides ongoing services to Legg Mason Global Asset Management Trust during the reporting period were $248,092 in September 30, 2014 and $348,474 in September 30, 2015.
(h) Yes. Legg Mason Global Asset Management Trust’s Audit Committee has considered whether the provision of non-audit services that were rendered to Service Affiliates, which were not pre-approved (not requiring pre-approval), is compatible with maintaining the Accountant’s independence. All services provided by the Auditor to the Legg Mason Global Asset Management Trust or to Service Affiliates, which were required to be pre-approved, were pre-approved as required.
| ITEM 5. | AUDIT COMMITTEE OF LISTED REGISTRANTS. |
| | a) | The independent board members are acting as the registrant’s audit committee as specified in Section 3(a)(58)(B) of the Exchange Act .The Audit Committee consists of the following Board members: |
Ruby P. Hearn
Arnold L. Lehman
Robin J.W. Masters
Jill E. McGovern
Arthur S. Mehlman
G. Peter O’Brien
S. Ford Rowan
Robert M. Tarola
| ITEM 6. | SCHEDULE OF INVESTMENTS. |
Included herein under Item 1.
| ITEM 7. | DISCLOSURE OF PROXY VOTING POLICIES AND PROCEDURES FOR CLOSED-END MANAGEMENT INVESTMENT COMPANIES. |
Not applicable.
| ITEM 8. | PORTFOLIO MANAGERS OF CLOSED-END MANAGEMENT INVESTMENT COMPANIES. |
Not applicable.
| ITEM 9. | PURCHASES OF EQUITY SECURITIES BY CLOSED-END MANAGEMENT INVESTMENT COMPANY AND AFFILIATED PURCHASERS. |
Not applicable.
| ITEM 10. | SUBMISSION OF MATTERS TO A VOTE OF SECURITY HOLDERS. |
Not applicable.
| ITEM 11. | CONTROLS AND PROCEDURES. |
| | (a) | The registrant’s principal executive officer and principal financial officer have concluded that the registrant’s disclosure controls and procedures (as defined in Rule 30a- 3(c) under the Investment Company Act of 1940, as amended (the “1940 Act”)) are effective as of a date within 90 days of the filing date of this report that includes the disclosure required by this paragraph, based on their evaluation of the disclosure controls and procedures required by Rule 30a-3(b) under the 1940 Act and 15d-15(b) under the Securities Exchange Act of 1934. |
| | (b) | There were no changes in the registrant’s internal control over financial reporting (as defined in Rule 30a-3(d) under the 1940 Act) that occurred during the second fiscal quarter of the period covered by this report that have materially affected, or are likely to materially affect the registrant’s internal control over financial reporting. |
(a) (1) Code of Ethics attached hereto.
Exhibit 99.CODE ETH
(a) (2) Certifications pursuant to section 302 of the Sarbanes-Oxley Act of 2002 attached hereto.
Exhibit 99.CERT
(b) Certifications pursuant to Section 906 of the Sarbanes-Oxley Act of 2002 attached hereto.
Exhibit 99.906CERT
SIGNATURES
Pursuant to the requirements of the Securities Exchange Act of 1934 and the Investment Company Act of 1940, the registrant has duly caused this Report to be signed on its behalf by the undersigned, there unto duly authorized.
Legg Mason Global Asset Management Trust
| | |
| By: | | /s/ Jane Trust |
| | Jane Trust |
| | Chief Executive Officer |
| |
| Date: | | November 24, 2015 |
Pursuant to the requirements of the Securities Exchange Act of 1934 and the Investment Company Act of 1940, this report has been signed below by the following persons on behalf of the registrant and in the capacities and on the dates indicated.
| | |
| By: | | /s/ Jane Trust |
| | Jane Trust |
| | Chief Executive Officer |
| |
| Date: | | November 24, 2015 |
| |
| By: | | /s/ Richard F. Sennett |
| | Richard F. Sennett |
| | Principal Financial Officer |
| |
| Date: | | November 24, 2015 |