UNITED STATES
SECURITIES AND EXCHANGE COMMISSION
Washington, D.C. 20549
FORM N-CSR
CERTIFIED SHAREHOLDER REPORT OF REGISTERED
MANAGEMENT INVESTMENT COMPANIES
Investment Company Act file number 811-22338
Legg Mason Global Asset Management Trust
(Exact name of registrant as specified in charter)
620 Eighth Avenue, 49th Floor, New York, NY 10018
(Address of principal executive offices) (Zip code)
Robert I. Frenkel, Esq.
Legg Mason & Co., LLC
100 First Stamford Place
Stamford, CT 06902
(Name and address of agent for service)
Registrant’s telephone number, including area code: 1-877-721-1926
Date of fiscal year end: September 30
Date of reporting period: September 30, 2015
| ITEM 1. | REPORT TO STOCKHOLDERS |
The Annual Report to Stockholders is filed herewith.

| | |
| Annual Report | | September 30, 2015 |
MARTIN CURRIE
EMERGING MARKETS FUND

|
| INVESTMENT PRODUCTS: NOT FDIC INSURED • NO BANK GUARANTEE • MAY LOSE VALUE |
Fund objective
The Fund seeks long-term capital appreciation.
Letter from the president

Dear Shareholder,
We are pleased to provide the annual report of Martin Currie Emerging Markets Fund for the period since the Fund’s inception on May 29, 2015 through September 30, 2015. Please read on for a detailed look at prevailing economic and market conditions during the Fund’s reporting period and to learn how those conditions have affected Fund performance.
I am pleased to introduce myself as the new President and Chief Executive Officer of the Fund, succeeding Kenneth D. Fuller. I am honored to have been appointed to my new role. During my 27 year career with Legg Mason, I have seen the investment management industry evolve and expand. Throughout these changes, maintaining an unwavering focus on our shareholders and their needs has remained paramount.
As always, we remain committed to providing you with excellent service and a full spectrum of investment choices. We also remain committed to supplementing the support you receive from your financial advisor. One way we accomplish this is through our website, www.leggmason.com/individualinvestors. Here you can gain immediate access to market and investment information, including:
| • | | Fund prices and performance, |
| • | | Market insights and commentaries from our portfolio managers, and |
| • | | A host of educational resources. |
We look forward to helping you meet your financial goals.
Sincerely,

Jane Trust, CFA
President and Chief Executive Officer
October 30, 2015
| | |
| II | | Martin Currie Emerging Markets Fund |
Investment commentary
This Investment Commentary covers the Fund’s initial reporting period (the Fund’s inception on May 29, 2015 through September 30, 2015).
Economic review
The pace of U.S. economic activity was mixed during the period since the Fund’s inception on May 29, 2015 through September 30, 2015 (the “reporting period”). Looking back, the U.S. Department of Commerce’s reported that first quarter 2015 U.S. gross domestic product (“GDP”)i growth was 0.6%. This modest reading was attributed to a number of factors, including a deceleration in personal consumption expenditures (“PCE”), along with negative contributions from exports, nonresidential fixed investment, and state and local government spending. Economic activity then accelerated, as second quarter GDP growth was 3.9%. The upturn was driven by increasing exports, accelerating PCE, declining imports, expanding state and local government spending, and rising nonresidential fixed investment. The U.S. Department of Commerce’s initial reading for third quarter 2015 GDP growth — released after the reporting period ended — was 1.5%. Decelerating growth was primarily due to a downturn in private inventory investment and decelerations in exports, nonresidential fixed investment, PCE, state and local government spending, and residential fixed investment.
The labor market was a tailwind for the economy during the reporting period. When the period began, unemployment was 5.5%, as reported by the U.S. Department of Labor. By September 2015, unemployment was 5.1%, equaling its lowest level since April 2008.
Turning to the global economy, in its October 2015 World Economic Outlook Update, released after the close of the reporting period, the International Monetary Fund (“IMF”) said “Prospects across the main countries and regions remain uneven. Relative to last year, the recovery in advanced economies is expected to pick up slightly, while activity in emerging market and developing economies is projected to slow for the fifth year in a row, primarily reflecting weaker prospects for some large emerging market economies and oil-exporting countries.” From a regional perspective, the IMF projects that 2015 growth in the Eurozone will be 1.5%, versus 0.9% in 2014. Japan’s economy is expected to expand 0.6% in 2015, compared to a contraction of -0.1% in 2014. Elsewhere, the IMF said that overall growth in emerging market countries will decelerate in 2015, with growth of 4.0% versus 4.6% in 2014.
The Federal Reserve Board (“Fed”)ii took a number of actions as it sought to meet its dual mandate of fostering maximum employment and price stability. As it has since December 2008, the Fed maintained the federal funds rateiii at a historically low range between zero and 0.25% during the reporting period. At its meeting that concluded on July 29, 2015, the Fed said “The Committee currently anticipates that, even after employment and inflation are near mandate-consistent levels, economic conditions may, for some time, warrant keeping the target federal funds rate below levels the Committee views as normal in the longer run.” At its meeting that ended on September 17, 2015, the Fed decided to maintain the target between zero and 0.25%. Finally, at its meeting that concluded on October 28, 2015, after the close of the
| | |
| Martin Currie Emerging Markets Fund | | III |
Investment commentary (cont’d)
reporting period, the Fed said, “In determining whether it will be appropriate to raise the target range at its next meeting, the Committee will assess progress — both realized and expected — toward its objectives of maximum employment and 2 percent inflation.”
Given the economic challenges in the Eurozone, the European Central Bank (“ECB”)iv took a number of actions to stimulate growth and ward off deflation. The ECB reduced rates in June and September 2014, before the beginning of the reporting period. Then, in January 2015 the ECB announced that, beginning in March 2015, it would start a €60 billion-a-month bond buying program that is expected to run until September 2016. In other developed countries, the Bank of England kept rates on hold at 0.50% during the reporting period, as did Japan at a range of zero to 0.10%, its lowest level since 2006. At the end of October 2014, the Bank of Japan announced that it would increase its asset purchases between 10 trillion yen and 20 trillion yen ($90.7 billion to $181.3 billion) to approximately 80 trillion yen ($725 billion) annually, in an attempt to stimulate growth. Elsewhere, after holding rates steady at 6.0% since July 2012, the People’s Bank of China lowered rates five times from November 23, 2014 to August 25, 2015. On October 23, 2015, after the reporting period ended, China’s central bank again cut rates, pushing them down to 4.35%.
As always, thank you for your confidence in our stewardship of your assets.
Sincerely,
Jane Trust, CFA
President and Chief Executive Officer
October 30, 2015
All investments are subject to risk including the possible loss of principal. Past performance is no guarantee of future results. Forecasts and predictions are inherently limited and should not be relied upon as an indication of actual or future performance.
| i | Gross domestic product (“GDP”) is the market value of all final goods and services produced within a country in a given period of time. |
| ii | The Federal Reserve Board (“Fed”) is responsible for the formulation of U.S. policies designed to promote economic growth, full employment, stable prices and a sustainable pattern of international trade and payments. |
| iii | The federal funds rate is the rate charged by one depository institution on an overnight sale of immediately available funds (balances at the Federal Reserve) to another depository institution; the rate may vary from depository institution to depository institution and from day to day. |
| iv | The European Central Bank (“ECB”) is responsible for the monetary system of the European Union and the euro currency. |
| | |
| IV | | Martin Currie Emerging Markets Fund |
Fund overview
Q. What is the Fund’s investment strategy?
A. The Fund seeks long-term capital appreciation. Under normal market conditions, the Fund pursues its objective by investing at least 80% of its net assets plus borrowings for investment purposes, if any, in securities of issuers with substantial economic ties to one or more emerging market countries and other investments with similar economic characteristics. The material factors we consider when determining whether an issuer has substantial economic ties to an emerging market country include whether the issuer is included in the MSCI Emerging Markets Indexi, is organized or headquartered in an emerging market country, or maintains most of its assets in one or more such countries, has a primary listing for its securities on a stock exchange of an emerging market country, or derives a majority of its exposure (e.g. percentage of sales, income or other material factors) from one or more emerging market countries.
Emerging market countries are predominantly found currently in regions including Asia, the Indian subcontinent, South and Central America, the Middle and Near East, Eastern and Central Europe and Africa. The Fund will invest primarily in equity and equity-related securities, which may include common stocks, preferred stock, convertible bonds, other securities convertible into common stock, depositary receipts, real estate investment trusts, securities of other investment companies including exchange traded funds and synthetic foreign equity securitiesii, including international warrants. The Fund will use synthetic foreign equity securities to obtain market exposure where direct access is not otherwise available. The Fund may also enter into index futures contracts as a substitute for buying or selling securities; to obtain market exposure; in an attempt to enhance returns; and to manage cash.
Our overarching investment philosophy is that building stock-focused portfolios, driven by fundamental research, is the best way to exploit market inefficiencies and generate consistent outperformance. Our global emerging markets team builds long-term, high conviction stock-focused portfolios, driven by fundamental research within its risk framework. Within an emerging market country, we select securities that we believe have favorable investment potential. For example, the Fund may purchase stocks of companies with prices that reflect a value lower than that which we place on the company. We may also consider factors we believe will cause the stock price to rise. In general, we will consider, among other factors, an issuer’s valuation, financial strength, competitive position in its industry, projected future earnings, cash flows and dividends when deciding whether to buy or sell investments. The Fund may invest in companies of any size and market capitalization.
The Fund is diversified and may invest in companies domiciled in any country that we believe to be appropriate to the Fund’s investment objective. The Fund may invest a substantial amount of assets (i.e. more than 25%) in issuers located in a single country or a limited number of countries, but will always be invested in or have exposure to no less than three different emerging market countries.
| | |
| Martin Currie Emerging Markets Fund 2015 Annual Report | | 1 |
Fund overview (cont’d)
Q. What were the overall market conditions during the Fund’s reporting period?
A. Global markets were in turmoil during the reporting period ended September 30, 2015, reacting to the slowdown in economic growth in China and the seemingly continuous decline of its onshore A-shareiii market. The People’s Bank of China also surprised the markets by announcing an effective devaluation of the yuan, the first such event since 1994. Since then, economic statistics have continued to cause concern and the markets took the view that policymakers appeared to be ‘behind the curve’, triggering a further drop in capital markets. Investors now appear to accept that Chinese economic growth could be weaker for longer.
Also during the reporting period, Brazil’s foreign currency rating was downgraded from ‘investment grade’ by Standard and Poor’s. The government is under severe pressure as, in addition to the downgrade, the opposition is attempting to impeach President Dilma Rousseff. Meanwhile, in India, although progress on reforms in the latest sitting of parliament was negligible, the country is a major beneficiary of low oil prices and investors appear happy to give Narendra Modi’s government the benefit of the doubt.
In the asset class as a whole, emerging market equity outflows in the year-to-date have amounted to US$39.2 billion. This takes the total to US$87 billion of outflows since the beginning of 2013. This is one component of a well-established and persistent sell-off in ‘risk assets’, which along with the widening in credit spreads, suggests that concerns about China in particular and the broader emerging-market asset class in general are continuing to grow. Currency markets have been a factor in the rout: the Brazilian real came within a whisker of its all-time low and the South African rand and Turkish lira were also badly affected. Negative sentiment is being fed by continuing disappointment in emerging markets news — following a stream of downward revisions, emerging-markets’ gross domestic product (“GDP”)iv growth is now expected to be around 4% this year and next — well below its potential. Explicitly pointing to this weakness, the Federal Reserve Board (‘Fed”)v decided against raising interest rates in September 2015.
Commodities also took a significant hit during the period, with West Texas Intermediate (WTI) crude oil at US$46.50/bbl, now down 14% year to date, and copper at US$236/lb, down 19% year-to-date. Gold has been relatively stable, at US$1,138/oz.
Q. How did we respond to these changing market conditions?
A. The emerging markets asset class is still struggling with overall negative sentiment and record outflows. The main risks remain the absence of external economic stimuli and the corporate sector struggling to generate top-line growth and improve profit margins. Growth forecasts continue to move down, and there is a risk of disappointment in companies’ third-quarter reporting. However, regardless of the short-term volatility of the financial markets, we still find plenty of companies that can benefit from longer-term themes, such as emerging market consumption and service sector growth. With regard to the Fund, our focus remains on identifying individual companies with distinct competitive advantages, resilient balance sheets and well-founded
| | |
| 2 | | Martin Currie Emerging Markets Fund 2015 Annual Report |
growth. We aim to maintain a portfolio of assets that is capable of outperforming its benchmark irrespective of short-term market direction.
Performance review
For the period since inception on May 29, 2015 through September 30, 2015, Class I shares of Martin Currie Emerging Markets Fund returned -19.10%. The Fund’s unmanaged benchmark, the MSCI Emerging Markets Index (Net) (USD)vi, returned -20.03% for the same period.
| | | | |
Performance Snapshot as of September 30, 2015
(unaudited) | |
| | | Since Fund
Inception* | |
| Martin Currie Emerging Markets Fund: | | | | |
Class FI | | | -19.10 | % |
Class I | | | -19.10 | % |
Class IS | | | -19.00 | % |
| MSCI Emerging Markets Index (Net) (USD) | | | -20.03 | % |
The performance shown represents past performance. Past performance is no guarantee of future results and current performance may be higher or lower than the performance shown above. Principal value and investment returns will fluctuate and investors’ shares, when redeemed, may be worth more or less than their original cost. To obtain performance data current to the most recent month-end, please visit our website at www.leggmason.com/individualinvestors.
All share class returns assume the reinvestment of all distributions at net asset value and the deduction of all Fund expenses. Returns have not been adjusted to include the deduction of taxes that a shareholder would pay on Fund distributions. Performance figures for periods shorter than one year represent cumulative figures and are not annualized. Results for longer periods will differ in some cases substantially.
Fund performance figures reflect fee waivers and/or expense reimbursements, without which the performance would have been lower.
* The Fund’s inception date is May 29, 2015.
|
| Total Annual Operating Expenses (unaudited) |
As of the Fund’s current prospectus dated May 29, 2015, the gross total annual operating expense ratios for Class FI, Class I and Class IS shares were 7.09%, 6.74% and 6.64%, respectively.
Actual expenses may be higher. For example, expenses may be higher than those shown if average net assets decrease. Net assets are more likely to decrease and Fund expense ratios are more likely to increase when markets are volatile.
As a result of expense limitation arrangements, the ratio of expenses other than interest, brokerage commissions, dividend expense on short sales, taxes, extraordinary expenses and acquired fund fees and expenses to average net assets, is not expected to exceed 1.50% for Class FI shares, 1.15% for Class I shares and 1.05% for Class IS shares. In addition, total annual fund operating expenses for Class IS shares will not exceed total annual fund operating expenses for Class I shares. These expense limitation arrangements cannot be terminated prior to December 31, 2016 without the Board of Trustees’ consent.
The manager is permitted to recapture amounts waived and/or reimbursed to a class within three years after the fiscal year if the class’ total annual operating expenses have fallen to a level below the expense limitation (“expense cap”) in effect at the time the fees were earned or the expenses incurred. In no case will the manager recapture any amount that would result, on any particular business day of the Fund, in the class’ total annual operating expenses exceeding the expense cap or any other lower limit then in effect.
| | |
| Martin Currie Emerging Markets Fund 2015 Annual Report | | 3 |
Fund overview (cont’d)
Q. What were the leading contributors to performance?
A. Convenience retail is the fastest-growing segment of the retail market in South Korea, and BGF Retail has delivered handsomely in the year to date, ahead of our own and the market’s expectations. The increased tax on tobacco does not appear to have been as damaging as investors had expected. The company’s product mix continues to improve in favour of food and higher margins, while the new store roll-out continues apace, meaning greater potential sales. Cognizant Technology was another positive contributor to performance during the period. The company provides Information Technology (“IT”) consulting and outsourcing services. It focuses on U.S. firms, and the Financial and Health care end markets. The business is highly profitable and continues to deliver rapid growth as the backdrop for IT services remains very supportive. The company is managing the transition from legacy IT systems to newer product areas better than the competition, leading to superior revenue growth compared with the wider industry. Hyundai Mobis also did well over the four months. We believe the company is nearing a turning point in its profitability. New-parts profitability should benefit from a resumption of capacity expansion at Hyundai/Kia and replacement-part profitability should stabilize following a period of negative structural change.
At the sector level, the largest contributions came from our positive stock selection in Materials and Consumer Discretionary. From a country perspective, strong stock selection in Korea (where we had an underweight position) meant this country provided the largest total returns. Elsewhere, our lack of exposure to Greece was beneficial as Greek stocks fell sharply during the reporting period against a volatile policy backdrop.
Q. What were the leading detractors from performance?
A. On the other side, Chinese computer technology company Lenovo performed poorly on the back of concerns regarding the weakness of the PC market, the loss of the company’s market share in Chinese smart phones and worries over the recent acquisitions of Moto and IBM’s server business. The PC market worldwide has had a poor first half of 2015, due to inventory reduction ahead of a new operating system (OS (Windows 10)) and Intel processors (Skylake). However, Lenovo has continued to outgrow the market and gain market share. Elsewhere, Industrial and Commercial Bank of China struggled as a result of the ructions in China during the period. Despite this, it is one of the strongest franchised banks in the country and has solid capital adequacy levels, significant loan-loss reserves and low loan-to-deposit ratios, and is most exposed to fast-growing fee revenues. Cosan was another negative for returns over the period. The company’s main business is fuel distribution (although it is also a producer of bioethanol from sugar cane) and declining volumes triggered the stock’s weakness. After a fairly good June and July, gasoline and diesel prices both fell in August. Investors are not, for the moment, focusing on the improved outlook for ethanol and sugar prices, of which Cosan is a significant beneficiary. The company is set to reach the high end of expectations for sugar production for this year. We believe the combination of better ethanol prices and a recovery in sugar prices will be enough to drive profitability, even if the fuel distribution business continues to suffer.
| | |
| 4 | | Martin Currie Emerging Markets Fund 2015 Annual Report |
At the sector level, we were underweight in Industrials where, despite neutral asset allocation, stock selection was a negative for performance. Likewise, while asset allocation was neutral for Health Care holdings, weak stock selection here was a drag on returns during the period. In terms of countries, Brazil was the biggest detractor in terms of total relative returns, where overall index declines were compounded by poor stock selection. Stock selection in Indonesia and Mexico was also detrimental for returns over the period.
Q. Were there any significant changes to the Fund during the period?
A. Despite the significant macro events, there were no changes to the Fund’s investment outlook during the period. Our investment horizon is 3–5 years and is driven by bottom-up stock picking. As such, we take a long-term view and believe that the companies we have invested in are well placed to weather macro-level change.
Thank you for your investment in Martin Currie Emerging Markets Fund. As always, we appreciate that you have chosen us to manage your assets and we remain focused on achieving the Fund’s investment goals.
Sincerely,

Kim Catechis
Portfolio Manager
Martin Currie Inc.

Andrew Mathewson, CFA
Portfolio Manager
Martin Currie Inc.
October 20, 2015
RISKS: The Fund is newly organized, with a limited history of operations. Equity securities are subject to price fluctuation and possible loss of principal. Small- and mid-cap stocks involve greater risks and volatility than large-cap stocks. The Fund may be significantly overweight to underweight certain companies, industries or market sectors, which may cause the Fund’s performance to be more sensitive to developments affecting those companies, industries or sectors. International investments are subject to special risks including currency fluctuations, as well as social, economic and political uncertainties, which could increase volatility. These risks are magnified in emerging markets. To the extent the Fund focuses its investments in a single country or only a few countries in a particular geographic region, economic, political, regulatory or other conditions affecting such country or region may have a greater impact on fund performance relative to a more geographically diversified fund. Derivatives, such as options and futures, can be illiquid, may disproportionately increase losses and have a potentially large impact on Fund performance. In addition to the Fund’s operating expenses, the Fund will indirectly bear the operating expenses of any underlying funds. Please see the Fund’s prospectus for a more complete discussion of these and other risks, and the Fund’s investment strategies.
Portfolio holdings and breakdowns are as of September 30, 2015 and are subject to change and may not be representative of the portfolio managers’ current or future investments. The Fund’s top ten holdings (as a percentage of net
| | |
| Martin Currie Emerging Markets Fund 2015 Annual Report | | 5 |
Fund overview (cont’d)
assets) as of September 30, 2015 were: Samsung Electronics Co., Ltd. (5.4%), Industrial & Commercial Bank of China Ltd., Class H Shares (5.3%), Taiwan Semiconductor Manufacturing Co., Ltd., ADR (5.1%), Tencent Holdings Ltd. (4.1%), Naspers Ltd., Class N Shares (3.8%), Cognizant Technology Solutions Corp., Class A Shares (2.8%), CTBC Financial Holding Co., Ltd. (2.6%), Credicorp Ltd. (2.5%), Merrill Lynch International & Co. (2.3%) and Hyundai Mobis Co., Ltd. (2.2%). Please refer to pages 12 through 15 for a list and percentage breakdown of the Fund’s holdings.
The mention of sector breakdowns is for informational purposes only and should not be construed as a recommendation to purchase or sell any securities. The information provided regarding such sectors is not a sufficient basis upon which to make an investment decision. Investors seeking financial advice regarding the appropriateness of investing in any securities or investment strategies discussed should consult their financial professional. The Fund’s top five sector holdings (as a percentage of net assets) as of September 30, 2015 were: Information Technology (25.1%), Financials (25.0%), Consumer Discretionary (13.9%), Telecommunication Services (6.9%) and Materials (6.7%).
All investments are subject to risk including the possible loss of principal. Past performance is no guarantee of future results. All index performance reflects no deduction for fees, expenses or taxes. Please note that an investor cannot invest directly in an index.
The information provided is not intended to be a forecast of future events, a guarantee of future results or investment advice. Views expressed may differ from those of the firm as a whole. Forecasts and predictions are inherently limited and should not be relied upon as an indication of actual for future performance.
| i | The MSCI Emerging Markets Index is a free float-adjusted market capitalization index that is designed to measure equity market performance in the global emerging markets. |
| ii | Synthetic foreign equity securities are a type of derivative issued by a bank or other financial institution designed to replicate the economic exposure of buying an equity security directly in a particular foreign market |
| iii | Shares in mainland China-based companies that trade on Chinese stock exchanges and are generally only available for purchase by mainland citizens; foreign investment is only allowed through a tightly-regulated structure known as the Qualified Foreign Institutional Investor (QFII) system. |
| iv | Gross domestic product (“GDP”) is the market value of all final goods and services produced within a country in a given period of time. |
| v | The Federal Reserve Board (“Fed”) is responsible for the formulation of U.S. policies designed to promote economic growth, full employment, stable prices and a sustainable pattern of international trade and payments. |
| vi | The MSCI Emerging Markets Index (Net) (USD) is a free float-adjusted market capitalization index that is designed to measure equity market performance in the global emerging markets. The Index is calculated assuming the minimum possible dividend reinvestment. |
| | |
| 6 | | Martin Currie Emerging Markets Fund 2015 Annual Report |
Fund at a glance† (unaudited)
Investment breakdown (%) as a percent of total investments
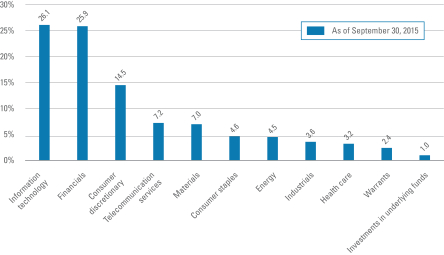
| † | The bar graph above represents the composition of the Fund’s investments as of September 30, 2015. The Fund is actively managed. As a result, the composition of the Fund’s investments is subject to change at any time. |
| | |
| Martin Currie Emerging Markets Fund 2015 Annual Report | | 7 |
Fund expenses (unaudited)
Example
As a shareholder of the Fund, you may incur two types of costs: (1) transaction costs and (2) ongoing costs, including management fees; service and/or distribution (12b-1) fees; and other Fund expenses. This example is intended to help you understand your ongoing costs (in dollars) of investing in the Fund and to compare these costs with the ongoing costs of investing in other mutual funds.
This example is based on an investment of $1,000 invested on April 1, 2015 and held for the six months ended September 30, 2015, unless otherwise noted.
Actual expenses
The table below titled “Based on Actual Total Return” provides information about actual account values and actual expenses. You may use the information provided in this table, together with the amount you invested, to estimate the expenses that you paid over the period. To estimate the expenses you paid on your account, divide your ending account value by $1,000 (for example, an $8,600 ending account value divided by $1,000 = 8.6), then multiply the result by the number under the heading entitled “Expenses Paid During the Period”.
Hypothetical example for comparison purposes
The table below titled “Based on Hypothetical Total Return” provides information about hypothetical account values and hypothetical expenses based on the actual expense ratio and an assumed rate of return of 5.00% per year before expenses, which is not the Fund’s actual return. The hypothetical account values and expenses may not be used to estimate the actual ending account balance or expenses you paid for the period. You may use the information provided in this table to compare the ongoing costs of investing in the Fund and other funds. To do so, compare the 5.00% hypothetical example relating to the Fund with the 5.00% hypothetical examples that appear in the shareholder reports of the other funds.
Please note that the expenses shown in the table below are meant to highlight your ongoing costs only and do not reflect any transactional costs. Therefore, the table is useful in comparing ongoing costs only, and will not help you determine the relative total costs of owning different funds. In addition, if these transaction costs were included, your costs would have been higher.
| | | | | | | | | | | | | | | | | | | | | | | | | | | | | | | | | | | | | | | | | | | | |
| Based on actual total return1 | | | | | Based on hypothetical total return4 | |
| | | Actual
Total Return2 | | | Beginning
Account
Value | | | Ending
Account
Value | | | Annualized
Expense
Ratio | | | Expenses
Paid
During
the
Period3 | | | | | | | Hypothetical
Annualized
Total Return | | | Beginning
Account
Value | | | Ending
Account
Value | | | Annualized
Expense
Ratio | | | Expenses
Paid
During
the
Period5 | |
| Class FI | | | -19.10 | % | | $ | 1,000.00 | | | $ | 809.00 | | | | 1.41 | % | | $ | 4.26 | | | | | Class FI | | | 5.00 | % | | $ | 1,000.00 | | | $ | 1,012.00 | | | | 1.41 | % | | $ | 4.74 | |
| Class I | | | -19.10 | | | | 1,000.00 | | | | 809.00 | | | | 1.15 | | | | 3.48 | | | | | Class I | | | 5.00 | | | | 1,000.00 | | | | 1,012.87 | | | | 1.15 | | | | 3.87 | |
| Class IS | | | -19.00 | | | | 1,000.00 | | | | 810.00 | | | | 1.05 | | | | 3.18 | | | | | Class IS | | | 5.00 | | | | 1,000.00 | | | | 1,013.20 | | | | 1.05 | | | | 3.53 | |
| | |
| 8 | | Martin Currie Emerging Markets Fund 2015 Annual Report |
| 1 | For the period May 29, 2015 (inception date) to September 30, 2015. |
| 2 | Assumes the reinvestment of all distributions, including returns of capital, if any, at net asset value. Total return is not annualized, as it may not be representative of the total return for the year. Performance figures may reflect compensating balance arrangements, fee waivers and/or expense reimbursements. In the absence of compensating balance arrangements, fee waivers and/or expense reimbursements, the total return would have been lower. Past performance is no guarantee of future results. |
| 3 | Expenses (net of compensating balance arrangements, fee waivers and/or expense reimbursements) are equal to each class’ respective annualized expense ratio multiplied by the average account value over the period, multiplied by the number of days in the most recent fiscal period (122), then divided by 365. |
| 4 | For the six months ended September 30, 2015. |
| 5 | Expenses (net of compensating balance arrangements, fee waivers and/or expense reimbursements) are equal to each class’ respective annualized expense ratio multiplied by the average account value over the period, multiplied by the number of days in the most recent fiscal half-year (183), then divided by 365. |
| | |
| Martin Currie Emerging Markets Fund 2015 Annual Report | | 9 |
Fund performance (unaudited)
| | | | | | | | | | | | |
| Average annual total returns1 | |
| | | Class FI† | | | Class I† | | | Class IS† | |
| Inception* through 9/30/15 | | | -19.10 | % | | | -19.10 | % | | | -19.00 | % |
| | | | |
| Cumulative total returns1 | |
| Class FI (Inception date of 5/29/15 through 9/30/15) | | | -19.10 | % |
| Class I (Inception date of 5/29/15 through 9/30/15) | | | -19.10 | |
| Class IS (Inception date of 5/29/15 through 9/30/15) | | | -19.00 | |
All figures represent past performance and are not a guarantee of future results. Investment return and principal value of an investment will fluctuate so that an investor’s shares, when redeemed, may be worth more or less than their original cost. Results for longer periods will differ, in some cases, substantially. The returns shown do not reflect the deduction of taxes that a shareholder would pay on Fund distributions or the redemption of Fund shares. Performance figures may reflect compensating balance arrangements, fee waivers and/or expense reimbursements. In the absence of compensating balance arrangements, fee waivers and/or expense reimbursements, the total return would have been lower.
| 1 | Assumes the reinvestment of all distributions, including returns of capital, if any, at net asset value. |
| * | Inception date for Class FI, I and IS shares is May 29, 2015. |
| | |
| 10 | | Martin Currie Emerging Markets Fund 2015 Annual Report |
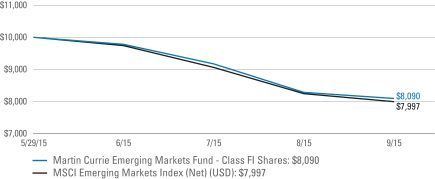
Historical performance
Value of $10,000 invested in
Class FI Shares of Martin Currie Emerging Markets Fund vs. MSCI Emerging Markets Index (Net) (USD)† — May 29, 2015 - September 2015
Value of $1,000,000 invested in
Class I and Class IS Shares of Martin Currie Emerging Markets Fund vs. MSCI Emerging Markets Index (Net) (USD)† — May 29, 2015 - September 2015

All figures represent past performance and are not a guarantee of future results. Investment return and principal value of an investment will fluctuate so that an investor’s shares, when redeemed, may be worth more or less than their original cost. The returns shown do not reflect the deduction of taxes that a shareholder would pay on Fund distributions or the redemption of Fund shares. Performance figures may reflect compensating balance arrangements, fee waivers and/or expense reimbursements. In the absence of compensating balance arrangements, fee waivers and/or expense reimbursements, the total return would have been lower.
| † | Hypothetical illustration of $10,000 invested in Class FI shares and $1,000,000 invested in Class I and Class IS shares of Martin Currie Emerging Markets Fund on May 29, 2015 (inception date), assuming the reinvestment of all distributions, including returns of capital, if any, at net asset value through September 30, 2015. The hypothetical illustration also assumes a $10,000 or $1,000,000 investment, as applicable, in the MSCI Emerging Markets Index (Net) (USD). The MSCI Emerging Markets Index (Net) (USD) is a free float-adjusted market capitalization index that is designed to measure equity market performance in the global emerging markets. The index is calculated assuming the minimum possible dividend reinvestment. The Index is unmanaged and not subject to the same management and trading expenses as a mutual fund. Please note that an investor cannot invest directly in an index. |
| | |
| Martin Currie Emerging Markets Fund 2015 Annual Report | | 11 |
Schedule of investments
September 30, 2015
Martin Currie Emerging Markets Fund
| | | | | | | | | | | | |
| Security | | | | | | Shares | | | Value | |
| Common Stocks — 91.6% | | | | | | | | | | | | |
| Consumer Discretionary — 13.9% | | | | | | | | | | | | |
Auto Components — 3.2% | | | | | | | | | | | | |
Apollo Tyres Ltd. | | | | | | | 9,114 | | | $ | 25,161 | (a) |
Hyundai Mobis Co., Ltd. | | | | | | | 273 | | | | 53,036 | (a) |
Total Auto Components | | | | | | | | | | | 78,197 | |
Automobiles — 4.2% | | | | | | | | | | | | |
Brilliance China Automotive Holdings Ltd. | | | | | | | 44,000 | | | | 52,168 | (a) |
Maruti Suzuki India Ltd. | | | | | | | 694 | | | | 49,504 | (a) |
Total Automobiles | | | | | | | | | | | 101,672 | |
Hotels, Restaurants & Leisure — 1.4% | | | | | | | | | | | | |
Genting Malaysia Berhad | | | | | | | 37,100 | | | | 35,067 | (a) |
Media — 3.8% | | | | | | | | | | | | |
Naspers Ltd., Class N Shares | | | | | | | 743 | | | | 93,227 | (a) |
Multiline Retail — 1.3% | | | | | | | | | | | | |
Woolworths Holdings Ltd. | | | | | | | 4,488 | | | | 31,413 | (a) |
Total Consumer Discretionary | | | | | | | | | | | 339,576 | |
| Consumer Staples — 4.4% | | | | | | | | | | | | |
Beverages — 0.8% | | | | | | | | | | | | |
AMBEV SA | | | | | | | 4,300 | | | | 21,063 | |
Food & Staples Retailing — 1.7% | | | | | | | | | | | | |
BGF Retail Co., Ltd. | | | | | | | 238 | | | | 40,747 | (a) |
Tobacco — 1.9% | | | | | | | | | | | | |
ITC Ltd. | | | | | | | 9,207 | | | | 46,389 | (a) |
Total Consumer Staples | | | | | | | | | | | 108,199 | |
| Energy — 4.3% | | | | | | | | | | | | |
Oil, Gas & Consumable Fuels — 4.3% | | | | | | | | | | | | |
Cairn India Ltd. | | | | | | | 7,492 | | | | 17,693 | (a) |
CNOOC Ltd. | | | | | | | 32,000 | | | | 33,124 | (a) |
Cosan Ltd., Class A Shares | | | | | | | 5,700 | | | | 16,473 | |
Lukoil PJSC, ADR | | | | | | | 1,107 | | | | 37,675 | (a) |
Total Energy | | | | | | | | | | | 104,965 | |
| Financials — 23.7% | | | | | | | | | | | | |
Banks — 18.0% | | | | | | | | | | | | |
Banco Santander Chile, ADR | | | | | | | 2,000 | | | | 36,440 | |
CIMB Group Holdings Berhad | | | | | | | 3,800 | | | | 3,865 | (a) |
Credicorp Ltd. | | | | | | | 581 | | | | 61,795 | |
CTBC Financial Holding Co., Ltd. | | | | | | | 124,315 | | | | 64,125 | (a) |
See Notes to Financial Statements.
| | |
| 12 | | Martin Currie Emerging Markets Fund 2015 Annual Report |
Martin Currie Emerging Markets Fund
| | | | | | | | | | | | |
| Security | | | | | | Shares | | | Value | |
Banks — continued | | | | | | | | | | | | |
Industrial & Commercial Bank of China Ltd., Class H Shares | | | | | | | 222,000 | | | $ | 128,707 | (a) |
OTP Bank PLC | | | | | | | 1,324 | | | | 25,546 | (a) |
PT Bank Rakyat Indonesia (Persero) Tbk | | | | | | | 50,800 | | | | 30,175 | (a) |
State Bank of India, GDR | | | | | | | 1,100 | | | | 39,985 | (b) |
Yes Bank Ltd. | | | | | | | 4,185 | | | | 46,750 | (a) |
Total Banks | | | | | | | | | | | 437,388 | |
Insurance — 3.2% | | | | | | | | | | | | |
AIA Group Ltd. | | | | | | | 6,600 | | | | 34,363 | (a) |
China Taiping Insurance Holdings Co., Ltd. | | | | | | | 14,000 | | | | 43,844 | *(a) |
Total Insurance | | | | | | | | | | | 78,207 | |
Real Estate Investment Trusts (REITs) — 2.5% | | | | | | | | | | | | |
Fibra Uno Administracion SA de CV | | | | | | | 13,500 | | | | 27,879 | |
Macquarie Mexico Real Estate Management SA de CV | | | | | | | 26,200 | | | | 33,120 | * |
Total Real Estate Investment Trusts (REITs) | | | | | | | | | | | 60,999 | |
Total Financials | | | | | | | | | | | 576,594 | |
| Health Care — 3.1% | | | | | | | | | | | | |
Health Care Equipment & Supplies — 1.0% | | | | | | | | | | | | |
St. Shine Optical Co., Ltd. | | | | | | | 2,000 | | | | 24,610 | (a) |
Pharmaceuticals — 2.1% | | | | | | | | | | | | |
Aspen Pharmacare Holdings Ltd. | | | | | | | 2,417 | | | | 51,395 | (a) |
Total Health Care | | | | | | | | | | | 76,005 | |
| Industrials — 3.5% | | | | | | | | | | | | |
Commercial Services & Supplies — 1.2% | | | | | | | | | | | | |
Valid Solucoes e Servicos de Seguranca em Meios de Pagamento e Identificacao SA | | | | | | | 2,571 | | | | 29,676 | |
Electrical Equipment — 0.5% | | | | | | | | | | | | |
Jiangnan Group Ltd. | | | | | | | 58,000 | | | | 12,050 | (a) |
Road & Rail — 1.0% | | | | | | | | | | | | |
Localiza Rent A Car SA | | | | | | | 3,800 | | | | 23,426 | |
Transportation Infrastructure — 0.8% | | | | | | | | | | | | |
Wilson Sons Ltd., BDR | | | | | | | 2,700 | | | | 20,091 | |
Total Industrials | | | | | | | | | | | 85,243 | |
| Information Technology — 25.1% | | | | | | | | | | | | |
Electronic Equipment, Instruments & Components — 1.4% | | | | | | | | | | | | |
Delta Electronics Inc. | | | | | | | 7,000 | | | | 32,998 | (a) |
Internet Software & Services — 5.3% | | | | | | | | | | | | |
Alibaba Group Holding Ltd., Sponsored ADR | | | | | | | 500 | | | | 29,485 | * |
Tencent Holdings Ltd. | | | | | | | 5,900 | | | | 99,383 | (a) |
Total Internet Software & Services | | | | | | | | | | | 128,868 | |
See Notes to Financial Statements.
| | |
| Martin Currie Emerging Markets Fund 2015 Annual Report | | 13 |
Schedule of investments (cont’d)
September 30, 2015
Martin Currie Emerging Markets Fund
| | | | | | | | | | | | |
| Security | | | | | | Shares | | | Value | |
IT Services — 4.0% | | | | | | | | | | | | |
Cognizant Technology Solutions Corp., Class A Shares | | | | | | | 1,100 | | | $ | 68,871 | * |
EPAM Systems Inc. | | | | | | | 400 | | | | 29,808 | * |
Total IT Services | | | | | | | | | | | 98,679 | |
Semiconductors & Semiconductor Equipment — 7.0% | | | | | | | | | | | | |
Media Tek Inc. | | | | | | | 3,000 | | | | 22,388 | (a) |
SK Hynix Inc. | | | | | | | 801 | | | | 22,890 | (a) |
Taiwan Semiconductor Manufacturing Co., Ltd., ADR | | | | | | | 6,000 | | | | 124,500 | |
Total Semiconductors & Semiconductor Equipment | | | | | | | | | | | 169,778 | |
Technology Hardware, Storage & Peripherals — 7.4% | | | | | | | | | | | | |
Lenovo Group Ltd. | | | | | | | 56,000 | | | | 47,550 | (a) |
Samsung Electronics Co., Ltd. | | | | | | | 138 | | | | 132,714 | (a) |
Total Technology Hardware, Storage & Peripherals | | | | | | | | | | | 180,264 | |
Total Information Technology | | | | | | | | | | | 610,587 | |
| Materials — 6.7% | | | | | | | | | | | | |
Chemicals — 5.4% | | | | | | | | | | | | |
Asian Paints Ltd. | | | | | | | 2,167 | | | | 27,840 | (a) |
LG Chem Ltd. | | | | | | | 156 | | | | 37,906 | (a) |
Mexichem SA de CV | | | | | | | 13,600 | | | | 33,427 | |
PTT Global Chemical PCL | | | | | | | 21,400 | | | | 31,692 | (a) |
Total Chemicals | | | | | | | | | | | 130,865 | |
Metals & Mining — 1.3% | | | | | | | | | | | | |
Southern Copper Corp. | | | | | | | 1,200 | | | | 32,064 | |
Total Materials | | | | | | | | | | | 162,929 | |
| Telecommunication Services — 6.9% | | | | | | | | | | | | |
Diversified Telecommunication Services — 4.2% | | | | | | | | | | | | |
China Unicom (Hong Kong) Ltd. | | | | | | | 40,000 | | | | 50,790 | (a) |
Telkom South Africa SOC Ltd. | | | | | | | 10,880 | | | | 52,297 | (a) |
Total Diversified Telecommunication Services | | | | | | | | | | | 103,087 | |
Wireless Telecommunication Services — 2.7% | | | | | | | | | | | | |
PT Tower Bersama Infrastructure Tbk | | | | | | | 54,500 | | | | 24,420 | (a) |
Turkcell Iletisim Hizmetleri AS | | | | | | | 11,445 | | | | 39,938 | (a) |
Total Wireless Telecommunication Services | | | | | | | | | | | 64,358 | |
Total Telecommunication Services | | | | | | | | | | | 167,445 | |
Total Common Stocks (Cost — $2,743,926) | | | | | | | | | | | 2,231,543 | |
| Investment in Underlying Funds — 1.0% | | | | | | | | | | | | |
iShares Trust — iShares MSCI Emerging Markets Index Fund (Cost — $23,758) | | | | | | | 726 | | | | 23,798 | |
| Preferred Stocks — 1.3% | | | | | | | | | | | | |
| Financials — 1.3% | | | | | | | | | | | | |
Banks — 1.3% | | | | | | | | | | | | |
Itau Unibanco Holding SA (Cost — $44,995) | | | | | | | 4,590 | | | | 30,693 | |
See Notes to Financial Statements.
| | |
| 14 | | Martin Currie Emerging Markets Fund 2015 Annual Report |
Martin Currie Emerging Markets Fund
| | | | | | | | | | | | | | |
| Security | | | | Expiration
Date | | | Warrants | | | Value | |
| Warrants — 2.3% | | | | | | | | | | | | | | |
Merrill Lynch International & Co. (Magnit PJSC) (Cost — $63,032) | | | | | 7/12/18 | | | | 320 | | | $ | 56,819 | *(a) |
Total Investments — 96.2% (Cost — $2,875,711#) | | | | | | | | | | | | | 2,342,853 | |
Other Assets in Excess of Liabilities — 3.8% | | | | | | | | | | | | | 92,593 | |
Total Net Assets — 100.0% | | | | | | | | | | | | $ | 2,435,446 | |
| * | Non-income producing security. |
| (a) | Security is valued in good faith in accordance with procedures approved by the Board of Trustees (See Note 1). |
| (b) | Security is exempt from registration under Rule 144A of the Securities Act of 1933. This security may be resold in transactions that are exempt from registration, normally to qualified institutional buyers. This security has been deemed liquid pursuant to guidelines approved by the Board of Trustees, unless otherwise noted. |
| # | Aggregate cost for federal income tax purposes is $2,877,828. |
| | |
Abbreviations used in this schedule: |
| ADR | | — American Depositary Receipts |
| BDR | | — Brazilian Depositary Receipts |
| GDR | | — Global Depositary Receipts |
| PJSC | | — Private Joint Stock Company |
| | | | |
| Summary of Investments by Country** (unaudited) | | | |
| China | | | 21.2 | % |
| South Korea | | | 12.3 | |
| Taiwan | | | 11.5 | |
| India | | | 10.8 | |
| South Africa | | | 9.7 | |
| United States | | | 7.6 | |
| Brazil | | | 6.1 | |
| Mexico | | | 4.0 | |
| Peru | | | 4.0 | |
| Indonesia | | | 2.3 | |
| Turkey | | | 1.7 | |
| Malaysia | | | 1.7 | |
| Russia | | | 1.6 | |
| Chile | | | 1.6 | |
| Hong Kong | | | 1.5 | |
| Thailand | | | 1.3 | |
| Hungary | | | 1.1 | |
| | | | 100.0 | % |
| ** | As a percentage of total investments. Please note that the Fund holdings are as of September 30, 2015 and are subject to change. |
See Notes to Financial Statements.
| | |
| Martin Currie Emerging Markets Fund 2015 Annual Report | | 15 |
Statement of assets and liabilities
September 30, 2015
| | | | |
| |
| Assets: | | | | |
Investments, at value (Cost — $2,875,711) | | $ | 2,342,853 | |
Foreign currency, at value (Cost — $3,950) | | | 3,911 | |
Deferred offering costs | | | 117,006 | |
Receivable for securities sold | | | 75,471 | |
Receivable from investment manager | | | 44,379 | |
Dividends and interest receivable | | | 1,589 | |
Prepaid expenses | | | 7,997 | |
Total Assets | | | 2,593,206 | |
| |
| Liabilities: | | | | |
Payable for offering costs | | | 60,398 | |
Payable for securities purchased | | | 55,196 | |
Due to custodian | | | 2,052 | |
Accrued foreign capital gains tax | | | 60 | |
Trustees’ fees payable | | | 41 | |
Service and/or distribution fees payable | | | 2 | |
Accrued expenses | | | 40,011 | |
Total Liabilities | | | 157,760 | |
| Total Net Assets | | $ | 2,435,446 | |
| |
| Net Assets: | | | | |
Par value (Note 6) | | $ | 3 | |
Paid-in capital in excess of par value | | | 3,002,406 | |
Undistributed net investment income | | | 10,319 | |
Accumulated net realized loss on investments and foreign currency transactions | | | (44,315) | |
Net unrealized depreciation on investments and foreign currencies | | | (532,967) | † |
| Total Net Assets | | $ | 2,435,446 | |
| |
| Net Assets: | | | | |
Class FI | | | $8,087 | |
Class I | | | $14,383 | |
Class IS | | | $2,412,976 | |
| |
| Shares Outstanding: | | | | |
Class FI | | | 1,000 | |
Class I | | | 1,777 | |
Class IS | | | 298,000 | |
| |
| Net Asset Value: | | | | |
Class FI (and redemption price) | | | $8.09 | |
Class I (and redemption price) | | | $8.09 | |
Class IS (and redemption price) | | | $8.10 | |
| † | Net of accrued foreign capital gains tax of $60. |
See Notes to Financial Statements.
| | |
| 16 | | Martin Currie Emerging Markets Fund 2015 Annual Report |
Statement of operations
For the Period Ended September 30, 2015†
| | | | |
| |
| Investment Income: | | | | |
Dividends | | $ | 38,633 | |
Interest | | | 18 | |
Less: Foreign taxes withheld | | | (5,413) | |
Total Investment Income | | | 33,238 | |
| |
| Expenses: | | | | |
Offering costs (Note 1) | | | 58,744 | |
Organization costs (Note 1) | | | 24,544 | |
Audit and tax fees | | | 20,355 | |
Legal fees | | | 14,906 | |
Custody fees | | | 14,334 | |
Shareholder reports | | | 13,701 | |
Investment management fee (Note 2) | | | 7,715 | |
Fund accounting fees | | | 5,450 | |
Registration fees | | | 197 | |
Trustees’ fees | | | 100 | |
Insurance | | | 25 | |
Transfer agent fees (Note 5) | | | 11 | |
Service and/or distribution fees (Notes 2 and 5) | | | 8 | |
Miscellaneous expenses | | | 13,352 | |
Total Expenses | | | 173,442 | |
Less: Fee waivers and/or expense reimbursements (Notes 2 and 5) | | | (163,895) | |
Net Expenses | | | 9,547 | |
| Net Investment Income | | | 23,691 | |
|
| Realized and Unrealized Gain (Loss) on Investments and Foreign Currency Transactions (Notes 1 and 3): | |
Net Realized Gain (Loss) From: | | | | |
Investment transactions | | | (65,362) | |
Foreign currency transactions | | | 3,084 | |
Net Realized Loss | | | (62,278) | |
Change in Net Unrealized Appreciation (Depreciation) From: | | | | |
Investments | | | (532,918) | ‡ |
Foreign currencies | | | (49) | |
Change in Net Unrealized Appreciation (Depreciation) | | | (532,967) | |
| Net Loss on Investments and Foreign Currency Transactions | | | (595,245) | |
| Decrease in Net Assets from Operations | | $ | (571,554) | |
| † | For the period May 29, 2015 (inception date) to September 30, 2015. |
| ‡ | Net of change in accrued foreign capital gains tax of $60. |
See Notes to Financial Statements.
| | |
| Martin Currie Emerging Markets Fund 2015 Annual Report | | 17 |
Statement of changes in net assets
| | | | |
| For the Period Ended September 30, | | 2015† | |
| |
| Operations: | | | | |
Net investment income | | $ | 23,691 | |
Net realized loss | | | (62,278) | |
Change in net unrealized appreciation (depreciation) | | | (532,967) | |
Decrease in Net Assets from Operations | | | (571,554) | |
| |
| Fund Share Transactions (Note 6): | | | | |
Net proceeds from sale of shares | | | 3,007,000 | |
Increase in Net Assets from Fund Share Transactions | | | 3,007,000 | |
Increase in Net Assets | | | 2,435,446 | |
| |
| Net Assets: | | | | |
Beginning of period | | | — | |
End of period* | | $ | 2,435,446 | |
*Includesundistributed net investment income of: | | | $10,319 | |
| † | For the period May 29, 2015 (inception date) to September 30, 2015. |
See Notes to Financial Statements.
| | |
| 18 | | Martin Currie Emerging Markets Fund 2015 Annual Report |
Financial highlights
| | | | |
For a share of each class of beneficial interest outstanding throughout each year ended September 30,
unless otherwise noted: | |
| Class FI Shares1 | | 20152 | |
| |
| Net asset value, beginning of period | | | $10.00 | |
| |
| Income (loss) from operations: | | | | |
Net investment income | | | 0.07 | |
Net realized and unrealized loss | | | (1.98) | |
Total loss from operations | | | (1.91) | |
| |
| Net asset value, end of period | | | $8.09 | |
Total return3 | | | (19.10) | % |
| |
| Net assets, end of period (000s) | | | $8 | |
| |
| Ratios to average net assets: | | | | |
Gross expenses4 | | | 19.47 | % |
Net expenses4,5,6 | | | 1.41 | |
Net investment income4 | | | 2.25 | |
| |
| Portfolio turnover rate | | | 23 | % |
| 1 | Per share amounts have been calculated using the average shares method. |
| 2 | For the period May 29, 2015 (inception date) to September 30, 2015. |
| 3 | Performance figures may reflect compensating balance arrangements, fee waivers and/or expense reimbursements. In the absence of compensating balance arrangements, fee waivers and/or expense reimbursements, the total return would have been lower. Past performance is no guarantee of future results. Total returns for periods of less than one year are not annualized. |
| 5 | As a result of an expense limitation arrangement, the ratio of expenses, other than interest, brokerage commissions, dividend expense on short sales, taxes, extraordinary expenses and acquired fund fees and expenses, to average net assets of Class FI shares did not exceed 1.50%. This expense limitation arrangement cannot be terminated prior to December 31, 2016 without the Board of Trustees’ consent. |
| 6 | Reflects fee waivers and/or expense reimbursements. |
See Notes to Financial Statements.
| | |
| Martin Currie Emerging Markets Fund 2015 Annual Report | | 19 |
Financial highlights (cont’d)
| | | | |
For a share of each class of beneficial interest outstanding throughout each year ended September 30,
unless otherwise noted: | |
| Class I Shares1 | | 20152 | |
| |
| Net asset value, beginning of period | | | $10.00 | |
| |
| Income (loss) from operations: | | | | |
Net investment income | | | 0.06 | |
Net realized and unrealized loss | | | (1.97) | |
Total loss from operations | | | (1.91) | |
| |
| Net asset value, end of period | | | $8.09 | |
Total return3 | | | (19.10) | % |
| |
| Net assets, end of period (000s) | | | $14 | |
| |
| Ratios to average net assets: | | | | |
Gross expenses4 | | | 18.64 | % |
Net expenses4,5,6 | | | 1.15 | |
Net investment income4 | | | 2.07 | |
| |
| Portfolio turnover rate | | | 23 | % |
| 1 | Per share amounts have been calculated using the average shares method. |
| 2 | For the period May 29, 2015 (inception date) to September 30, 2015. |
| 3 | Performance figures may reflect compensating balance arrangements, fee waivers and/or expense reimbursements. In the absence of compensating balance arrangements, fee waivers and/or expense reimbursements, the total return would have been lower. Past performance is no guarantee of future results. Total returns for periods of less than one year are not annualized. |
| 5 | As a result of an expense limitation arrangement, the ratio of expenses, other than interest, brokerage commissions, dividend expense on short sales, taxes, extraordinary expenses and acquired fund fees and expenses, to average net assets of Class I shares did not exceed 1.15%. This expense limitation arrangement cannot be terminated prior to December 31, 2016 without the Board of Trustees’ consent. |
| 6 | Reflects fee waivers and/or expense reimbursements. |
See Notes to Financial Statements.
| | |
| 20 | | Martin Currie Emerging Markets Fund 2015 Annual Report |
| | | | |
For a share of each class of beneficial interest outstanding throughout each year ended September 30,
unless otherwise noted: | |
| Class IS Shares1 | | 20152 | |
| |
| Net asset value, beginning of period | | | $10.00 | |
| |
| Income (loss) from operations: | | | | |
Net investment income | | | 0.08 | |
Net realized and unrealized loss | | | (1.98) | |
Total loss from operations | | | (1.90) | |
| |
| Net asset value, end of period | | | $8.10 | |
Total return3 | | | (19.00) | % |
| |
| Net assets, end of period (000s) | | | $2,413 | |
| |
| Ratios to average net assets: | | | | |
Gross expenses4 | | | 19.11 | % |
Net expenses4,5,6 | | | 1.05 | |
Net investment income4 | | | 2.61 | |
| |
| Portfolio turnover rate | | | 23 | % |
| 1 | Per share amounts have been calculated using the average shares method. |
| 2 | For the period May 29, 2015 (inception date) to September 30, 2015. |
| 3 | Performance figures may reflect compensating balance arrangements, fee waivers and/or expense reimbursements. In the absence of compensating balance arrangements, fee waivers and/or expense reimbursements, the total return would have been lower. Past performance is no guarantee of future results. Total returns for periods of less than one year are not annualized. |
| 5 | As a result of an expense limitation arrangement, the ratio of expenses, other than interest, brokerage commissions, dividend expense on short sales, taxes, extraordinary expenses and acquired fund fees and expenses, to average net assets of Class IS shares did not exceed 1.05%. In addition, total annual fund operating expenses for Class IS shares did not exceed total annual fund operating expenses for Class I shares. These expense limitation arrangements cannot be terminated prior to December 31, 2016 without the Board of Trustees’ consent. |
| 6 | Reflects fee waivers and/or expense reimbursements. |
See Notes to Financial Statements.
| | |
| Martin Currie Emerging Markets Fund 2015 Annual Report | | 21 |
Notes to financial statements
1. Organization and significant accounting policies
Martin Currie Emerging Markets Fund (the “Fund”) is a separate diversified investment series of Legg Mason Global Asset Management Trust (the “Trust”). The Trust, a Maryland statutory trust, is registered under the Investment Company Act of 1940, as amended (the “1940 Act”), as an open-end management investment company.
The following are significant accounting policies consistently followed by the Fund and are in conformity with U.S. generally accepted accounting principles (“GAAP”). Estimates and assumptions are required to be made regarding assets, liabilities and changes in net assets resulting from operations when financial statements are prepared. Changes in the economic environment, financial markets and any other parameters used in determining these estimates could cause actual results to differ. Subsequent events have been evaluated through the date the financial statements were issued.
(a) Investment valuation. Equity securities for which market quotations are available are valued at the last reported sales price or official closing price on the primary market or exchange on which they trade. The valuations for fixed income securities (which may include, but are not limited to, corporate, government, municipal, mortgage-backed, collateralized mortgage obligations and asset-backed securities) and certain derivative instruments are typically the prices supplied by independent third party pricing services, which may use market prices or broker/dealer quotations or a variety of valuation techniques and methodologies. The independent third party pricing services use inputs that are observable such as issuer details, interest rates, yield curves, prepayment speeds, credit risks/spreads, default rates and quoted prices for similar securities. Short-term fixed income securities that will mature in 60 days or less are valued at amortized cost, unless it is determined that using this method would not reflect an investment’s fair value. When the Fund holds securities or other assets that are denominated in a foreign currency, the Fund will normally use the currency exchange rates as of 4:00 p.m. (Eastern Time). If independent third party pricing services are unable to supply prices for a portfolio investment, or if the prices supplied are deemed by the manager to be unreliable, the market price may be determined by the manager using quotations from one or more broker/dealers or at the transaction price if the security has recently been purchased and no value has yet been obtained from a pricing service or pricing broker. When reliable prices are not readily available, such as when the value of a security has been significantly affected by events after the close of the exchange or market on which the security is principally traded, but before the Fund calculates its net asset value, the Fund values these securities as determined in accordance with procedures approved by the Fund’s Board of Trustees.
The Board of Trustees is responsible for the valuation process and has delegated the supervision of the daily valuation process to the Legg Mason North Atlantic Fund Valuation Committee (the “Valuation Committee”). The Valuation Committee, pursuant to the policies adopted by the Board of Trustees, is responsible for making fair value determinations, evaluating the effectiveness of the Fund’s pricing policies, and reporting to the Board of Trustees. When determining the reliability of third party pricing information for investments
| | |
| 22 | | Martin Currie Emerging Markets Fund 2015 Annual Report |
owned by the Fund, the Valuation Committee, among other things, conducts due diligence reviews of pricing vendors, monitors the daily change in prices and reviews transactions among market participants.
The Valuation Committee will consider pricing methodologies it deems relevant and appropriate when making fair value determinations. Examples of possible methodologies include, but are not limited to, multiple of earnings; discount from market of a similar freely traded security; discounted cash-flow analysis; book value or a multiple thereof; risk premium/yield analysis; yield to maturity; and/or fundamental investment analysis. The Valuation Committee will also consider factors it deems relevant and appropriate in light of the facts and circumstances. Examples of possible factors include, but are not limited to, the type of security; the issuer’s financial statements; the purchase price of the security; the discount from market value of unrestricted securities of the same class at the time of purchase; analysts’ research and observations from financial institutions; information regarding any transactions or offers with respect to the security; the existence of merger proposals or tender offers affecting the security; the price and extent of public trading in similar securities of the issuer or comparable companies; and the existence of a shelf registration for restricted securities.
For each portfolio security that has been fair valued pursuant to the policies adopted by the Board of Trustees, the fair value price is compared against the last available and next available market quotations. The Valuation Committee reviews the results of such back testing monthly and fair valuation occurrences are reported to the Board of Trustees quarterly.
The Fund uses valuation techniques to measure fair value that are consistent with the market approach and/or income approach, depending on the type of security and the particular circumstance. The market approach uses prices and other relevant information generated by market transactions involving identical or comparable securities. The income approach uses valuation techniques to discount estimated future cash flows to present value.
GAAP establishes a disclosure hierarchy that categorizes the inputs to valuation techniques used to value assets and liabilities at measurement date. These inputs are summarized in the three broad levels listed below:
| • | | Level 1 — quoted prices in active markets for identical investments |
| • | | Level 2 — other significant observable inputs (including quoted prices for similar investments, interest rates, prepayment speeds, credit risk, etc.) |
| • | | Level 3 — significant unobservable inputs (including the Fund’s own assumptions in determining the fair value of investments) |
The inputs or methodologies used to value securities are not necessarily an indication of the risk associated with investing in those securities.
| | |
| Martin Currie Emerging Markets Fund 2015 Annual Report | | 23 |
Notes to financial statements (cont’d)
The following is a summary of the inputs used in valuing the Fund’s assets carried at fair value:
| | | | | | | | | | | | | | | | |
| ASSETS | |
| Description | | Quoted Prices
(Level 1) | | | Other Significant
Observable Inputs
(Level 2) | | | Significant
Unobservable
Inputs
(Level 3) | | | Total | |
| Long-term investments†: | | | | | | | | | | | | | | | | |
Common stocks: | | | | | | | | | | | | | | | | |
Consumer staples | | $ | 21,063 | | | $ | 87,136 | | | | — | | | $ | 108,199 | |
Energy | | | 16,473 | | | | 88,492 | | | | — | | | | 104,965 | |
Financials | | | 199,219 | | | | 377,375 | | | | — | | | | 576,594 | |
Industrials | | | 73,193 | | | | 12,050 | | | | — | | | | 85,243 | |
Information technology | | | 252,664 | | | | 357,923 | | | | — | | | | 610,587 | |
Materials | | | 65,491 | | | | 97,438 | | | | — | | | | 162,929 | |
Other common stocks | | | — | | | | 583,026 | | | | — | | | | 583,026 | |
Investment in underlying funds | | | 23,798 | | | | — | | | | — | | | | 23,798 | |
Preferred stocks | | | 30,693 | | | | — | | | | — | | | | 30,693 | |
Warrants | | | — | | | | 56,819 | | | | — | | | | 56,819 | |
| Total investments | | $ | 682,594 | | | $ | 1,660,259 | | | | — | | | $ | 2,342,853 | |
| † | See Schedule of Investments for additional detailed categorizations. |
For the period ended September 30, 2015, as a result of the fair value pricing procedures for international equities utilized by the Fund, certain securities have transferred in and out of Level 1 and Level 2 measurements during the period. The Fund’s policy is to recognize transfers between levels as of the end of the reporting period. At September 30, 2015, securities valued at $1,571,748 were classified as Level 2 within the fair value hierarchy because fair value procedures were applied when the change in value of a domestic equity security index suggested that the closing prices on foreign exchanges may no longer have represented the value of those securities at the time of closing of the NYSE.
(b) Repurchase agreements. The Fund may enter into repurchase agreements with institutions that its subadviser has determined are creditworthy. Each repurchase agreement is recorded at cost. Under the terms of a typical repurchase agreement, the Fund acquires a debt security subject to an obligation of the seller to repurchase, and of the Fund to resell, the security at an agreed-upon price and time, thereby determining the yield during the Fund’s holding period. When entering into repurchase agreements, it is the Fund’s policy that its custodian or a third party custodian, acting on the Fund’s behalf, take possession of the underlying collateral securities, the market value of which, at all times, at least equals the principal amount of the repurchase transaction, including accrued interest. To the extent that any repurchase transaction maturity exceeds one business day, the value of the collateral is marked-to-market and measured against the value of the agreement in an effort to ensure the adequacy of the collateral. If the counterparty defaults, the Fund generally has the right to use the collateral to satisfy the terms of the repurchase transaction. However, if the market value of the collateral declines during the period in
| | |
| 24 | | Martin Currie Emerging Markets Fund 2015 Annual Report |
which the Fund seeks to assert its rights or if bankruptcy proceedings are commenced with respect to the seller of the security, realization of the collateral by the Fund may be delayed or limited.
(c) Foreign currency translation. Investment securities and other assets and liabilities denominated in foreign currencies are translated into U.S. dollar amounts based upon prevailing exchange rates on the date of valuation. Purchases and sales of investment securities and income and expense items denominated in foreign currencies are translated into U.S. dollar amounts based upon prevailing exchange rates on the respective dates of such transactions.
The Fund does not isolate that portion of the results of operations resulting from fluctuations in foreign exchange rates on investments from the fluctuations arising from changes in market prices of securities held. Such fluctuations are included with the net realized and unrealized gain or loss on investments.
Net realized foreign exchange gains or losses arise from sales of foreign currencies, including gains and losses on forward foreign currency contracts, currency gains or losses realized between the trade and settlement dates on securities transactions, and the difference between the amounts of dividends, interest, and foreign withholding taxes recorded on the Fund’s books and the U.S. dollar equivalent of the amounts actually received or paid. Net unrealized foreign exchange gains and losses arise from changes in the values of assets and liabilities, other than investments in securities, on the date of valuation, resulting from changes in exchange rates.
Foreign security and currency transactions may involve certain considerations and risks not typically associated with those of U.S. dollar denominated transactions as a result of, among other factors, the possibility of lower levels of governmental supervision and regulation of foreign securities markets and the possibility of political or economic instability.
(d) Foreign investment risks. The Fund’s investments in foreign securities may involve risks not present in domestic investments. Since securities may be denominated in foreign currencies, may require settlement in foreign currencies or pay interest or dividends in foreign currencies, changes in the relationship of these foreign currencies to the U.S. dollar can significantly affect the value of the investments and earnings of the Fund. Foreign investments may also subject the Fund to foreign government exchange restrictions, expropriation, taxation or other political, social or economic developments, all of which affect the market and/or credit risk of the investments.
(e) Security transactions and investment income. Security transactions are accounted for on a trade date basis. Interest income, adjusted for amortization of premium and accretion of discount, is recorded on the accrual basis. Dividend income is recorded on the ex-dividend date. Foreign dividend income is recorded on the ex-dividend date or as soon as practicable after the Fund determines the existence of a dividend declaration after exercising reasonable due diligence. The cost of investments sold is determined by use of
| | |
| Martin Currie Emerging Markets Fund 2015 Annual Report | | 25 |
Notes to financial statements (cont’d)
the specific identification method. To the extent any issuer defaults or a credit event occurs that impacts the issuer, the Fund may halt any additional interest income accruals and consider the realizability of interest accrued up to the date of default or credit event.
(f) Distributions to shareholders. Distributions from net investment income and distributions of net realized gains, if any, are declared at least annually. Distributions to shareholders of the Fund are recorded on the ex-dividend date and are determined in accordance with income tax regulations, which may differ from GAAP.
(g) Share class accounting. Investment income, common expenses and realized/unrealized gains (losses) on investments are allocated to the various classes of the Fund on the basis of daily net assets of each class. Fees relating to a specific class are charged directly to that share class.
(h) Compensating balance arrangements. The Fund has an arrangement with its custodian bank whereby a portion of the custodian’s fees is paid indirectly by credits earned on the Fund’s cash on deposit with the bank.
(i) Organization costs. Organization costs associated with the establishment of the Fund are charged to expense as they are incurred.
(j) Offering costs. Costs incurred by the Fund in connection with the commencement of the Fund’s operations are being amortized on a straight line basis over twelve months.
(k) Federal and other taxes. It is the Fund’s policy to comply with the federal income and excise tax requirements of the Internal Revenue Code of 1986 (the “Code”), as amended, applicable to regulated investment companies. Accordingly, the Fund intends to distribute its taxable income and net realized gains, if any, to shareholders in accordance with timing requirements imposed by the Code. Therefore, no federal or state income tax provision is required in the Fund’s financial statements.
Management has analyzed the Fund’s tax positions and has concluded that as of September 30, 2015, no provision for income tax is required in the Fund’s financial statements. The Fund’s federal and state income and federal excise tax returns for tax years for which the applicable statutes of limitations have not expired are subject to examination by the Internal Revenue Service and state departments of revenue.
Under the applicable foreign tax laws, a withholding tax may be imposed on interest, dividends and capital gains at various rates. Realized gains upon disposition of securities issued in or by certain foreign countries are subject to capital gains tax imposed by those countries. As of September 30, 2015, there were $60 of capital gains tax liabilities accrued on unrealized gains.
| | |
| 26 | | Martin Currie Emerging Markets Fund 2015 Annual Report |
(l) Reclassification. GAAP requires that certain components of net assets be reclassified to reflect permanent differences between financial and tax reporting. These reclassifications have no effect on net assets or net asset value per share. During the current period, the following reclassifications have been made:
| | | | | | | | | | | | |
| | | Undistributed Net
Investment Income | | | Accumulated Net
Realized Loss | | | Paid-in
Capital | |
| (a) | | $ | 4,591 | | | | — | | | $ | (4,591) | |
| (b) | | | (17,963) | | | $ | 17,963 | | | | — | |
| (a) | Reclassifications are due to non-deductible 12B-1 fees, offering and organization costs for tax purposes. |
| (b) | Reclassifications are due to foreign currency transactions treated as ordinary income for tax purposes. |
2. Investment management agreement and other transactions with affiliates
Legg Mason Partners Fund Advisor, LLC (“LMPFA”) is the Fund’s investment manager and Martin Currie Inc. (“Martin Currie”) is the Fund’s subadviser. Western Asset Management Company (“Western Asset”) manages the portion of the Fund’s cash and short-term instruments allocated to it. LMPFA, Martin Currie and Western Asset are wholly-owned subsidiaries of Legg Mason, Inc. (“Legg Mason”).
Under the investment management agreement, the Fund pays an investment management fee, calculated daily and paid monthly, in accordance with the following breakpoint schedule:
| | | | |
| Average Daily Net Assets | | Annual Rate | |
| First $1 billion | | | 0.850 | % |
| Next $1 billion | | | 0.825 | |
| Over $2 billion | | | 0.800 | |
LMPFA provides administrative and certain oversight services to the Fund. LMPFA delegates to the subadviser the day-to-day portfolio management of the Fund, except for the management of the portion of the cash and short-term instruments allocated to Western Asset. For its services, LMPFA pays Martin Currie an aggregate fee equal to 70% of the net management fee it receives from the Fund. For Western Asset’s services to the Fund, LMPFA pays Western Asset 0.02% of the portion of the Fund’s average daily net assets that are allocated to Western Asset by LMPFA.
As a result of expense limitation arrangements between the Fund and LMPFA, the ratio of expenses, other than interest, brokerage commissions, dividend expense on short sales, taxes, extraordinary expenses and acquired fund fees and expenses, to average net assets of Class FI, Class I and Class IS shares did not exceed 1.50%, 1.15% and 1.05%, respectively. In addition, total annual fund operating expenses for Class IS shares did not exceed total annual fund operating expenses for Class I shares. These expense limitation arrangements cannot be terminated prior to December 31, 2016 without the Board of Trustees’ consent.
| | |
| Martin Currie Emerging Markets Fund 2015 Annual Report | | 27 |
Notes to financial statements (cont’d)
During the period ended September 30, 2015, fees waived and/or expenses reimbursed amounted to $163,895.
LMPFA is permitted to recapture amounts waived and/or reimbursed to a class within three years after the fiscal year in which LMPFA earned the fee or incurred the expense if the class’ total annual operating expenses have fallen to a level below the expense limitation (“expense cap”) in effect at the time the fees were earned or the expenses incurred. In no case will LMPFA recapture any amount that would result, on any particular business day of the Fund, in the class’ total annual operating expenses exceeding the expense cap or any other lower limit then in effect.
Pursuant to these arrangements, at September 30, 2015, the Fund had remaining fee waivers and/or expense reimbursements subject to recapture by LMPFA and respective dates of expiration as follows:
| | | | | | | | | | | | |
| | | Class FI | | | Class I | | | Class IS | |
| Expires September 30, 2018 | | $ | 545 | | | $ | 768 | | | $ | 162,582 | |
| Total fee waivers/expense reimbursements subject to recapture | | $ | 545 | | | $ | 768 | | | $ | 162,582 | |
For the period ended September 30, 2015, LMPFA did not recapture any fees.
Legg Mason Investor Services, LLC, a wholly-owned broker-dealer subsidiary of Legg Mason, serves as the Fund’s sole and exclusive distributor.
Under a Deferred Compensation Plan (the “Plan”), Trustees may elect to defer receipt of all or a specified portion of their compensation. A participating Trustee may select one or more funds managed by affiliates of Legg Mason in which his or her deferred trustee’s fees will be deemed to be invested. Deferred amounts remain in the Fund until distributed in accordance with the Plan. In May 2015, the Board of Trustees approved an amendment to the Plan so that effective January 1, 2016, no compensation earned after that date may be deferred under the Plan.
All officers and one Trustee of the Trust are employees of Legg Mason or its affiliates and do not receive compensation from the Trust.
As of September 30, 2015, Legg Mason and its affiliates owned 99.7% of the Fund.
3. Investments
During the period ended September 30, 2015, the aggregate cost of purchases and proceeds from sales of investments (excluding short-term investments) were as follows:
| | | | |
| Purchases | | $ | 3,542,812 | |
| Sales | | | 604,546 | |
| | |
| 28 | | Martin Currie Emerging Markets Fund 2015 Annual Report |
At September 30, 2015, the aggregate gross unrealized appreciation and depreciation of investments for federal income tax purposes were as follows:
| | | | |
| Gross unrealized appreciation | | $ | 17,135 | |
| Gross unrealized depreciation | | | (552,110) | |
| Net unrealized depreciation | | $ | (534,975) | |
4. Derivative instruments and hedging activities
During the period ended September 30, 2015, the Fund did not invest in derivative instruments.
5. Class specific expenses, waivers and/or expense reimbursements
The Fund has adopted a Rule 12b-1 shareholder services and distribution plan and under that plan the Fund pays service and/or distribution fees with respect to its Class FI shares calculated at the annual rate of 0.25% of the average daily net assets. Service and/or distribution fees are accrued daily and paid monthly.
For the period ended September 30, 2015, class specific expenses were as follows:
| | | | | | | | |
| | | Service and/or
Distribution Fees† | | | Transfer Agent
Fees† | |
| Class FI | | $ | 8 | | | $ | 4 | |
| Class I | | | — | | | | 4 | |
| Class IS | | | — | | | | 3 | |
| Total | | $ | 8 | | | $ | 11 | |
| † | For the period May 29, 2015 (inception date) to September 30, 2015. |
For the period ended September 30, 2015, waivers and/or expense reimbursements by class were as follows:
| | | | |
| | | Waivers/Expense
Reimbursements† | |
| Class FI | | $ | 545 | |
| Class I | | | 768 | |
| Class IS | | | 162,582 | |
| Total | | $ | 163,895 | |
| † | For the period May 29, 2015 (inception date) to September 30, 2015. |
6. Shares of beneficial interest
At September 30, 2015, the Trust had an unlimited number of shares of beneficial interest authorized with a par value of $0.00001 per share. The Fund has the ability to issue multiple classes of shares. Each class of shares represents an identical interest and has the same rights, except that each class bears certain direct expenses, including those specifically related to the distribution of its shares.
| | |
| Martin Currie Emerging Markets Fund 2015 Annual Report | | 29 |
Notes to financial statements (cont’d)
Transactions in shares of each class were as follows:
| | | | | | | | |
| | | Period Ended
September 30, 2015† | |
| | | Shares | | | Amount | |
| Class FI | | | | | | | | |
| Shares sold | | | 1,000 | | | $ | 10,000 | |
| Net increase | | | 1,000 | | | $ | 10,000 | |
| | |
| Class I | | | | | | | | |
| Shares sold | | | 1,777 | | | $ | 17,000 | |
| Net increase | | | 1,777 | | | $ | 17,000 | |
| | |
| Class IS | | | | | | | | |
| Shares sold | | | 298,000 | | | $ | 2,980,000 | |
| Net increase | | | 298,000 | | | $ | 2,980,000 | |
| † | For the period May 29, 2015 (inception date) to September 30, 2015. |
7. Income tax information and distributions to shareholders
The Fund did not make any distributions during the period ended September 30, 2015.
As of September 30, 2015, the components of accumulated earnings (losses) on a tax basis were as follows:
| | | | |
| Undistributed ordinary income — net | | $ | 12,388 | |
| Deferred capital losses* | | | (42,424) | |
| Other book/tax temporary differences(a) | | | (1,843) | |
| Unrealized appreciation (depreciation)(b) | | | (535,084) | |
| Total accumulated earnings (losses) — net | | $ | (566,963) | |
| * | These capital losses have been deferred in the current year as either short-term or long-term losses. The losses will be deemed to occur on the first day of the next taxable year in the same character as they were originally deferred and will be available to offset future taxable capital gains. |
| (a) | Other book/tax temporary differences are attributable to the realization for tax purposes of unrealized gains (losses) on certain foreign currency contracts and book/tax differences in the timing of the deductibility of various expenses. |
| (b) | The difference between book-basis and tax-basis unrealized appreciation (depreciation) is attributable to the tax deferral of losses on wash sales and the realization for tax purposes of unrealized gains on investments in passive foreign investment companies. |
| | |
| 30 | | Martin Currie Emerging Markets Fund 2015 Annual Report |
Report of independent registered public accounting firm
To the Board of Trustees of Legg Mason Global Asset Management Trust and Shareholders of the Martin Currie Emerging Markets Fund:
In our opinion, the accompanying statement of assets and liabilities, including the schedule of investments, and the related statements of operations and of changes in net assets and the financial highlights present fairly, in all material respects, the financial position of the Martin Currie Emerging Markets Fund (one of the funds comprising Legg Mason Global Asset Management Trust, the “Fund”) at September 30, 2015, the results of its operations, the changes in its net assets and the financial highlights for the period presented, in conformity with accounting principles generally accepted in the United States of America. These financial statements and financial highlights (hereafter referred to as “financial statements”) are the responsibility of the Fund’s management. Our responsibility is to express an opinion on these financial statements based on our audit. We conducted our audit of these financial statements in accordance with the standards of the Public Company Accounting Oversight Board (United States). Those standards require that we plan and perform the audit to obtain reasonable assurance about whether the financial statements are free of material misstatement. An audit includes examining, on a test basis, evidence supporting the amounts and disclosures in the financial statements, assessing the accounting principles used and significant estimates made by management, and evaluating the overall financial statement presentation. We believe that our audit, which included confirmation of securities at September 30, 2015 by correspondence with the custodian and brokers, provides a reasonable basis for our opinion.
PricewaterhouseCoopers LLP
Baltimore, Maryland
November 16, 2015
| | |
| Martin Currie Emerging Markets Fund 2015 Annual Report | | 31 |
Board approval of management and subadvisory agreements (unaudited)
At its May 2015 meeting, the Fund’s Board of Trustees (the “Board”) approved the investment management agreement (the “Management Agreement”) with Legg Mason Partners Fund Advisor, LLC (the “Manager”), the subadvisory agreement between the Manager and Martin Currie Inc. (“Martin Currie”) and the subadvisory agreement between the Manager and Western Asset Management Company (“Western Asset”) pursuant to which Western Asset provides day-to-day management of that portion of the Fund’s cash and short-term investments allocated to Western Asset under such subadvisory agreement. (Each subadvisory agreement is referred to as a “Subadvisory Agreement.”) Martin Currie and Western Asset are each referred to herein as a “Subadviser.” (The Management and Subadvisory Agreements are collectively referred to as the “Agreements.”) The Trustees who are not “interested persons” of the Fund (as defined in the Investment Company Act of 1940, as amended) (the “Independent Trustees”), met with the assistance of their independent legal counsel, to review and evaluate the materials provided by the Manager and the Subadvisers to assist the Board, and in particular the Independent Trustees, in considering the Management and Subadvisory Agreements, respectively.
In voting to approve the Agreements, the Board, including the Independent Trustees, considered whether approval of the Agreements would be in the best interests of the Fund and its shareholders. No single factor or item of information reviewed by the Board was identified as the principal factor in determining whether to approve the Agreements. Based upon its evaluation of all material factors, including those described below, the Board concluded that the terms of each of the Agreements are reasonable and fair and that it was in the best interest of the Fund and its shareholders to approve the Agreements.
The Board received and considered information regarding the nature, extent and quality of services to be provided to the Fund by the Manager and each Subadviser under the Management and Subadvisory Agreements, respectively. The Board also considered the supervisory activities to be provided by the Manager over the Subadvisers. In addition, the Board received and considered other information regarding the administrative and other services to be rendered to the Fund and its shareholders by the Manager and its affiliates. The Board noted information received at regular meetings throughout the year related to the services rendered by the Manager in its management of other funds in the Legg Mason fund complex, including the Manager’s role in coordinating the activities of the Subadvisers and the Fund’s other service providers and the services rendered by the Manager and Western Asset. The Board’s evaluation of the services to be provided by the Manager and the Subadvisers took into account the Board’s knowledge and familiarity gained as Board members of funds in the Legg Mason fund complex, including the scope and quality of the investment management and other capabilities of the Manager and Western Asset, and the quality of the Manager’s administrative and other services.
The Board reviewed the qualifications, backgrounds and responsibilities of the senior personnel that would be serving the Fund and the portfolio management team that would be primarily responsible for the day-to-day portfolio management of the Fund. The Board
| | |
| 32 | | Martin Currie Emerging Markets Fund |
discussed with representatives of management the portfolio management strategy of the Fund’s portfolio managers. The Board also considered, based on its knowledge of the Manager and the Manager’s affiliates, the financial resources of the Manager’s parent organization, Legg Mason, Inc.
The Board considered the division of responsibilities between the Manager and the Subadvisers and the oversight to be provided by the Manager. The Board also considered brokerage policies and practices, including the policies and practices regarding soft dollars.
The Board received and reviewed historical performance results of a composite of other accounts managed by Martin Currie under the same investment strategy it would use to manage the Fund (the “Composite”). The Board noted that, although the Composite (gross of fees) underperformed the MSCI Emerging Markets (Net) Index for the one- and three-year periods ended March 31, 2015, the Composite outperformed the MSCI Emerging Markets (Net) Index for the five-year period ended March 31, 2015.
The Board reviewed and considered, the proposed contractual management fee (the “Contractual Management Fee”) payable by the Fund to the Manager in light of the nature, extent and quality of the management and subadvisory services to be provided by the Manager and the Subadvisers, respectively. The Board noted that the Manager, and not the Fund, pays the subadvisory fees to the Subadvisers (the subadvisory fees and the Contractual Management Fee are collectively referred to as the “Management Fees”). The Board also noted that the Manager would waive fees and reimburse expenses to the extent necessary to maintain specified expense levels until December 31, 2016 unless the Board consents to an earlier termination.
With respect to profitability, the Board noted the start-up status of the Fund.
Given the expected asset size of the Fund during the term of the Agreements and the breakpoints included in the Contractual Management Fee, the Board concluded that any anticipated economies of scale were appropriately reflected in the Contractual Management Fee.
The Board considered other benefits expected to be received by the Manager and its affiliates, as a result of the Manager’s relationship with the Fund, including the opportunity to offer additional products and services to Fund shareholders.
In light of the structure of the fees, as well as the nature, extent and quality of the services expected to be provided, the Manager’s commitment to the Fund and the ancillary benefits expected to be received, the Board concluded that the Management Fees were reasonable.
After evaluation of all material factors, the Board concluded that the approval of each Agreement is in the best interest of the Fund.
| | |
| Martin Currie Emerging Markets Fund | | 33 |
Additional information (unaudited)
Information about Trustees and Officers
The business and affairs of Martin Currie Emerging Markets Fund (the “Fund”) are conducted by management under the supervision and subject to the direction of its Board of Trustees. The business address of each Trustee is c/o Jane Trust, Legg Mason, 100 International Drive, 11th Floor, Baltimore, Maryland 21202. Information pertaining to the Trustees and officers of the Fund is set forth below.
The Statement of Additional Information includes additional information about Trustees and is available, without charge, upon request by calling the Fund at 1-877-721-1926.
| | |
| Independent Trustees† |
| Ruby P. Hearn |
| Year of birth | | 1940 |
| Position(s) with Trust | | Trustee |
| Term of office1 and length of time served2 | | Since 2004 |
| Principal occupation(s) during past five years | | Senior Vice President Emerita of The Robert Wood Johnson Foundation (non-profit) since 2001; Member of the Institute of Medicine since 1982; formerly, Trustee of the New York Academy of Medicine (2004 to 2012); Director of the Institute for Healthcare Improvement (2002 to 2012); Senior Vice President of The Robert Wood Johnson Foundation (1996 to 2001); Fellow of The Yale Corporation (1992 to 1998). |
| Number of funds in fund complex overseen by Trustee | | 19 |
| Other board memberships held by Trustee during past five years | | None |
|
| Arnold L. Lehman |
| Year of birth | | 1944 |
| Position(s) with Trust | | Trustee and Chairman |
| Term of office1 and length of time served2 | | Since 1982 |
| Principal occupation(s) during past five years | | Retired. Trustee of American Federation of Arts since 1998; formerly, Director of the Brooklyn Museum (1997-2015); Director of The Baltimore Museum of Art (1979 to 1997). |
| Number of funds in fund complex overseen by Trustee | | 19 |
| Other board memberships held by Trustee during past five years | | None |
|
| Robin J.W. Masters |
| Year of birth | | 1955 |
| Position(s) with Trust | | Trustee |
| Term of office1 and length of time served2 | | Since 2002 |
| Principal occupation(s) during past five years | | Retired; formerly: Chief Investment Officer of ACE Limited (insurance) (1986 to 2000). |
| Number of funds in fund complex overseen by Trustee | | 19 |
| Other board memberships held by Trustee during past five years | | Director of Cheyne Capital International Limited (investment advisory firm); formerly, Director/Trustee of Legg Mason Institutional Funds plc, WAFixed Income Funds plc and Western Asset Debt Securities Fund plc. (2007 to 2011) |
| | |
| 34 | | Martin Currie Emerging Markets Fund |
| | |
| Independent Trustees† cont’d |
| Jill E. McGovern |
| Year of birth | | 1944 |
| Position(s) with Trust | | Trustee |
| Term of office1 and length of time served2 | | Since 1989 |
| Principal occupation(s) during past five years | | Senior Consultant, American Institute for Contemporary German Studies (AICGS) since 2007; formerly, Chief Executive Officer of The Marrow Foundation (non-profit) (1993 to 2007); Executive Director of the Baltimore International Festival (1991 to 1993); Senior Assistant to the President of The Johns Hopkins University (1986 to 1990). |
| Number of funds in fund complex overseen by Trustee | | 19 |
| Other board memberships held by Trustee during past five years | | Director of International Biomedical Research Alliance; Director of Lois Roth Endowment |
|
| Arthur S. Mehlman |
| Year of birth | | 1942 |
| Position(s) with Trust | | Trustee |
| Term of office1 and length of time served2 | | Since 2002 |
| Principal occupation(s) during past five years | | Retired. Director, The University of Maryland Foundation since 1992; Director, The League for People with Disabilities since 2003; formerly, Director, Municipal Mortgage & Equity LLC (2004 to 2011); Partner, KPMG LLP (international accounting firm) (1972 to 2002). |
| Number of funds in fund complex overseen by Trustee | | Director/Trustee of all Legg Mason Funds consisting of 19 portfolios; Director/Trustee of the Royce Family of Funds consisting of 26 portfolios. |
| Other board memberships held by Trustee during past five years | | Director of Municipal Mortgage & Equity, LLC. (2004 to 2011) |
|
| G. Peter O’Brien |
| Year of birth | | 1945 |
| Position(s) with Trust | | Trustee |
| Term of office1 and length of time served2 | | Since 1999 |
| Principal occupation(s) during past five years | | Retired. Trustee Emeritus of Colgate University; Board Member, Hill House, Inc. (residential home care); Board Member, Bridges School (pre- school); formerly, Managing Director, Equity Capital Markets Group of Merrill Lynch & Co. (1971 to 1999). |
| Number of funds in fund complex overseen by Trustee | | Director/Trustee of all Legg Mason funds consisting of 19 portfolios; Director/Trustee of the Royce Family of Funds consisting of 26 portfolios. |
| Other board memberships held by Trustee during past five years | | Director of TICC Capital Corp. |
| | |
| Martin Currie Emerging Markets Fund | | 35 |
Additional information (unaudited) (cont’d)
Information about Trustees and Officers
| | |
| Independent Trustees† cont’d |
| S. Ford Rowan |
| Year of birth | | 1943 |
| Position(s) with Trust | | Trustee |
| Term of office1 and length of time served2 | | Since 2002 |
| Principal occupation(s) during past five years | | Chairman, National Center for Critical Incident Analysis, National Defense University Foundation, since 2004; Consultant to University of Maryland University College, since 2013; formerly, Lecturer in Organizational Sciences, George Washington University (2000 to 2014); Trustee, St. John’s College (2006 to 2012); Consultant, Rowan & Blewitt Inc. (management consulting) (1984 to 2007); Lecturer in Journalism, Northwestern University (1980 to 1993); Director, Santa Fe Institute (1999 to 2008). |
| Number of funds in fund complex overseen by Trustee | | 19 |
| Other board memberships held by Trustee during past five years | | None |
|
| Robert M. Tarola |
| Year of birth | | 1950 |
| Position(s) with Trust | | Trustee |
| Term of office1 and length of time served2 | | Since 2004 |
| Principal occupation(s) during past five years | | President of Right Advisory LLC (corporate finance and governance consulting) since 2008; Member, Investor Advisory Group of the Public Company Accounting Oversight Board since 2009; formerly, Senior Vice President and Chief Financial Officer of The Howard University (2009 to 2013) (higher education and health care); Senior Vice President and Chief Financial Officer of W.R. Grace & Co. (specialty chemicals) (1999 to 2008) and MedStar Health, Inc. (healthcare) (1996 to 1999); Partner, Price Waterhouse, LLP (accounting and auditing) (1984 to 1996). |
| Number of funds in fund complex overseen by Trustee | | 19 |
| Other board memberships held by Trustee during past five years | | Director of American Kidney Fund (renal disease assistance); Director of XBRL International, Inc. (global data standard setting); Director of Vista Outdoor, Inc. (sporting goods); formerly, Director of TeleTech Holdings, Inc. (business process outsourcing). |
| | |
| | |
| 36 | | Martin Currie Emerging Markets Fund |
| | |
| Interested Trustee |
| Jane Trust3 | | |
| Year of birth | | 1962 |
| Position(s) with Trust | | Trustee, President and Chief Executive Officer |
| Term of office1 and length of time served2 | | Since 2015 |
| Principal occupation(s) during past five years | | Managing Director of Legg Mason & Co., LLC (“Legg Mason & Co.”) (since 2015); Officer and/or Trustee/Director of 156 funds associated with LMPFA or its affiliates (since 2015); President and Chief Executive Officer of LMPFA (since 2015); formerly, Senior Vice President of LMPFA (2015); formerly, Director of ClearBridge, LLC (formerly, Legg Mason Capital Management, LLC) (2007 to 2014); formerly, Managing Director of Legg Mason Investment Counsel & Trust Co. (2000 to 2007) |
| Number of funds in fund complex overseen by Trustee | | 147 |
Other board memberships held by Trustee during past
five years | | None |
| | |
| Executive Officers |
Richard F. Sennett Legg Mason 100 International Drive, 7th Floor, Baltimore, MD 21202 | | |
| Year of birth | | 1970 |
| Position(s) with Trust | | Principal Financial Officer |
| Term of office1 and length of time served2 | | Since 2011 |
| Principal occupation(s) during past five years | | Principal Financial Officer and Treasurer of certain mutual funds associated with Legg Mason & Co. or its affiliates (since 2011 and since 2013); Managing Director of Legg Mason & Co. and Senior Manager of the Treasury Policy group for Legg Mason & Co.’s Global Fiduciary Platform (since 2011); formerly, Chief Accountant within the SEC’s Division of Investment Management (2007 to 2011); formerly, Assistant Chief Accountant within the SEC’s Division of Investment Management (2002 to 2007) |
| |
Robert I. Frenkel Legg Mason 100 First Stamford Place, 6th Floor, Stamford, CT 06902 | | |
| Year of birth | | 1954 |
| Position(s) with Trust | | Secretary and Chief Legal Officer |
| Term of office1 and length of time served2 | | Since 2007 |
| Principal occupation(s) during past five years | | Vice President and Deputy General Counsel of Legg Mason (since 2006); Managing Director and General Counsel of Global Mutual Funds for Legg Mason & Co. (since 2006) and Legg Mason & Co. predecessors (since 1994); Secretary and Chief Legal Officer of certain mutual funds associated with Legg Mason & Co. or its affiliates (since 2006) and Legg Mason & Co. predecessors (prior to 2006) |
| | |
| Martin Currie Emerging Markets Fund | | 37 |
Additional information (unaudited) (cont’d)
Information about Trustees and Officers
| | |
| Executive Officers cont’d |
Ted P. Becker Legg Mason 620 Eighth Avenue, 49th Floor, New York, NY 10018 | | |
| Year of birth | | 1951 |
| Position(s) with Trust | | Vice President and Chief Compliance Officer |
| Term of office1 and length of time served2 | | Since 2007 |
| Principal occupation(s) during past five years | | Director of Global Compliance at Legg Mason (since 2006); Chief Compliance Officer of LMPFA (since 2006); Managing Director of Compliance of Legg Mason & Co. (since 2005); Chief Compliance Officer of certain mutual funds associated with Legg Mason & Co. or its affiliates (since 2006) and Legg Mason & Co. predecessors (prior to 2006) |
| |
Christopher Berarducci Legg Mason 620 Eighth Avenue, 49th Floor, New York, NY 10018 | | |
| Year of birth | | 1974 |
| Position(s) with Trust | | Treasurer |
| Term of office1 and length of time served2 | | Since 2010 |
| Principal occupation(s) during past five years | | Director of Legg Mason & Co. (since 2015); Treasurer of certain mutual funds associated with Legg Mason & Co. or its affiliates (since 2010); formerly, Vice President of Legg Mason & Co. (2011 to 2015); formerly, Assistant Controller of certain mutual funds associated with Legg Mason & Co. or its affiliates (prior to 2010) |
Susan Kerr Legg Mason 620 Eighth Avenue, 49th Floor, New York, NY 10018 | | |
| Year of birth | | 1949 |
| Position(s) with Trust | | Chief Anti-Money Laundering Compliance Officer |
| Term of office1 and length of time served2 | | Since 2013 |
| Principal occupation(s) during past five years | | Assistant Vice President of Legg Mason & Co. and Legg Mason Investor Services, LLC (“LMIS”) (since 2010); Chief Anti-Money Laundering Compliance Officer of certain mutual funds associated with Legg Mason & Co. or its affiliates (since 2013) and Anti-Money Laundering Compliance Officer of LMIS (since 2012); Senior Compliance Officer of LMIS (since 2011); formerly, AML Consultant, DTCC (2010); formerly, AML Consultant, Rabobank Netherlands, (2009); formerly, First Vice President, Director of Marketing & Advertising Compliance and Manager of Communications Review Group at Citigroup Inc. (1996 to 2008) |
| | |
| 38 | | Martin Currie Emerging Markets Fund |
| | |
| Executive Officers cont’d |
Vanessa A. Williams Legg Mason 100 First Stamford Place, 6th Floor, Stamford, CT 06902 | | |
| Year of birth | | 1979 |
| Position(s) with Trust | | Identity Theft Prevention Officer |
| Term of office1 and length of time served2 | | Since 2011 |
| Principal occupation(s) during past five years | | Vice President of Legg Mason & Co. (since 2012); Identity Theft Prevention Officer of certain mutual funds associated with Legg Mason & Co. or its affiliates (since 2011); formerly, Chief Anti-Money Laundering Compliance Officer of certain mutual funds associated with Legg Mason & Co. or its affiliates (2011 to 2013); formerly, Senior Compliance Officer of Legg Mason & Co. (2008 to 2011); formerly, Compliance Analyst of Legg Mason & Co. (2006 to 2008) and Legg Mason & Co. predecessors (prior to 2006) |
| † | Trustees who are not “interested persons” of the Fund within the meaning of Section 2(a)(19) of the 1940 Act. Each of the Independent Trustees serves on the standing committees of the Board of Trustees, which include the Audit Committee (chair: Arthur S. Mehlman), the Nominating Committee (co-chairs: G. Peter O’Brien and Jill E. McGovern), and the Independent Trustees Committee (chair: Arnold L. Lehman). |
| 1 | Each Trustee and officer serves until his or her respective successor has been duly elected and qualified or until his or her earlier death, resignation, retirement or removal. |
| 2 | Indicates the earliest year in which the Trustee became a board member for a fund in the Legg Mason fund complex or the officer took such office. |
| 3 | Effective June 1, 2015, Ms. Trust became a Trustee. In addition, Ms. Trust is an “interested person” of the Fund, as defined in the 1940 Act, because of her position with LMPFA and/or certain of its affiliates. |
| | |
| Martin Currie Emerging Markets Fund | | 39 |
Martin Currie
Emerging Markets Fund
Trustees
Ruby P. Hearn
Arnold L. Lehman*
Chairman
Robin J.W. Masters
Jill E. McGovern
Arthur S. Mehlman
G. Peter O’Brien
S. Ford Rowan
Robert M. Tarola
Jane Trust*
Investment manager
Legg Mason Partners Fund Advisor, LLC
Subadviser
Martin Currie Inc.
Custodian
State Street Bank & Trust Company
Transfer agent
BNY Mellon Investment Servicing (US) Inc.
4400 Computer Drive
Westborough, MA 01581
Independent registered public accounting firm
PricewaterhouseCoopers LLP
Baltimore, MD
| * | Effective June 1, 2015, Mr. Lehman became Chairman and Ms. Trust became a Trustee, President and Chief Executive Officer. |
Martin Currie Emerging Markets Fund
The Fund is a separate investment series of Legg Mason Global Asset Management Trust, a Maryland statutory trust.
Martin Currie Emerging Markets Fund
Legg Mason Funds
620 Eighth Avenue, 49th Floor
New York, NY 10018
The Fund files its complete schedule of portfolio holdings with the Securities and Exchange Commission (“SEC”) for the first and third quarters of each fiscal year on Form N-Q. The Fund’s Forms N-Q are available on the SEC’s website at www.sec.gov. The Fund’s Forms N-Q may be reviewed and copied at the SEC’s Public Reference Room in Washington, D.C., and information on the operation of the Public Reference Room may be obtained by calling 1-800-SEC-0330. To obtain information on Form N-Q, shareholders can call the Fund at 1-877-721-1926.
Information on how the Fund voted proxies relating to portfolio securities during the prior 12-month period ended June 30th of each year and a description of the policies and procedures that the Fund uses to determine how to vote proxies related to portfolio transactions are available (1) without charge, upon request, by calling the Fund at 1-877-721-1926, (2) on the Fund’s website at www.leggmason.com/individualinvestors and (3) on the SEC’s website at www.sec.gov.
This report is submitted for the general information of the shareholders of Martin Currie Emerging Markets Fund. This report is not authorized for distribution to prospective investors in the Fund unless preceded or accompanied by a current prospectus.
Investors should consider the Fund’s investment objectives, risks, charges and expenses carefully before investing. The prospectus contains this and other important information about the Fund. Please read the prospectus carefully before investing.
www.leggmason.com/individualinvestors
© 2015 Legg Mason Investor Services, LLC
Member FINRA, SIPC
Legg Mason Funds Privacy and Security Notice
Your Privacy and the Security of Your Personal Information is Very Important to the Legg Mason Funds
This Privacy and Security Notice (the “Privacy Notice”) addresses the Legg Mason Funds’ privacy and data protection practices with respect to nonpublic personal information the Funds receive. The Legg Mason Funds include any funds sold by the Funds’ distributor, Legg Mason Investor Services, LLC, as well as Legg Mason-sponsored closed-end funds and certain closed-end funds managed or sub-advised by Legg Mason or its affiliates. The provisions of this Privacy Notice apply to your information both while you are a shareholder and after you are no longer invested with the Funds.
The Type of Nonpublic Personal Information the Funds Collect About You
The Funds collect and maintain nonpublic personal information about you in connection with your shareholder account. Such information may include, but is not limited to:
| • | | Personal information included on applications or other forms; |
| • | | Account balances, transactions, and mutual fund holdings and positions; |
| • | | Online account access user IDs, passwords, security challenge question responses; and |
| • | | Information received from consumer reporting agencies regarding credit history and creditworthiness (such as the amount of an individual’s total debt, payment history, etc.). |
How the Funds Use Nonpublic Personal Information About You
The Funds do not sell or share your nonpublic personal information with third parties or with affiliates for their marketing purposes, or with other financial institutions or affiliates for joint marketing purposes, unless you have authorized the Funds to do so. The Funds do not disclose any nonpublic personal information about you except as may be required to perform transactions or services you have authorized or as permitted or required by law. The Funds may disclose information about you to:
| • | | Employees, agents, and affiliates on a “need to know” basis to enable the Funds to conduct ordinary business or comply with obligations to government regulators; |
| • | | Service providers, including the Funds’ affiliates, who assist the Funds as part of the ordinary course of business (such as printing, mailing services, or processing or servicing your account with us) or otherwise perform services on the Funds’ behalf, including companies that may perform marketing services solely for the Funds; |
| • | | The Funds’ representatives such as legal counsel, accountants and auditors; and |
| • | | Fiduciaries or representatives acting on your behalf, such as an IRA custodian or trustee of a grantor trust. |
|
| NOT PART OF THE ANNUAL REPORT |
Legg Mason Funds Privacy and Security Notice (cont’d)
Except as otherwise permitted by applicable law, companies acting on the Funds’ behalf are contractually obligated to keep nonpublic personal information the Funds provide to them confidential and to use the information the Funds share only to provide the services the Funds ask them to perform.
The Funds may disclose nonpublic personal information about you when necessary to enforce their rights or protect against fraud, or as permitted or required by applicable law, such as in connection with a law enforcement or regulatory request, subpoena, or similar legal process. In the event of a corporate action or in the event a Fund service provider changes, the Funds may be required to disclose your nonpublic personal information to third parties. While it is the Funds’ practice to obtain protections for disclosed information in these types of transactions, the Funds cannot guarantee their privacy policy will remain unchanged.
Keeping You Informed of the Funds’ Privacy and Security Practices
The Funds will notify you annually of their privacy policy as required by federal law. While the Funds reserve the right to modify this policy at any time they will notify you promptly if this privacy policy changes.
The Funds’ Security Practices
The Funds maintain appropriate physical, electronic and procedural safeguards designed to guard your nonpublic personal information. The Funds’ internal data security policies restrict access to your nonpublic personal information to authorized employees, who may use your nonpublic personal information for Fund business purposes only.
Although the Funds strive to protect your nonpublic personal information, they cannot ensure or warrant the security of any information you provide or transmit to them, and you do so at your own risk. In the event of a breach of the confidentiality or security of your nonpublic personal information, the Funds will attempt to notify you as necessary so you can take appropriate protective steps. If you have consented to the Funds using electronic communications or electronic delivery of statements, they may notify you under such circumstances using the most current email address you have on record with them.
In order for the Funds to provide effective service to you, keeping your account information accurate is very important. If you believe that your account information is incomplete, not accurate or not current, or if you have questions about the Funds’ privacy practices, write the Funds using the contact information on your account statements, email the Funds by clicking on the Contact Us section of the Funds’ website at www.leggmason.com, or contact the Fund at 1-877-721-1926.
|
| NOT PART OF THE ANNUAL REPORT |
www.leggmason.com/individualinvestors
© 2015 Legg Mason Investor Services, LLC Member FINRA, SIPC
MCXX211453 11/15 SR15-2633
The registrant has adopted a code of ethics that applies to the registrant’s principal executive officer, principal financial officer, principal accounting officer or controller.
| ITEM 3. | AUDIT COMMITTEE FINANCIAL EXPERT. |
The Board of Trustees of the registrant has determined that Arthur S. Mehlman the Chairman of the Board’s Audit Committee and Robert M. Tarola, possess the technical attributes identified in Instruction 2(b) of Item 3 to Form N- to qualify as “audit committee financial experts,” and have designated Mr. Mehlman and Mr. Tarola CSR as the Audit Committee’s financial experts. Mr. Mehlman and Mr. Tarola are “independent” Trustees pursuant to paragraph (a) (2) of Item 3 to Form N-CSR.
| ITEM 4. | PRINCIPAL ACCOUNTANT FEES AND SERVICES. |
a) Audit Fees. The aggregate fees billed in the last two fiscal years ending September 30, 2014 and September 30, 2015 (the “Reporting Periods”) for professional services rendered by the Registrant’s principal accountant (the “Auditor”) for the audit of the Registrant’s annual financial statements, or services that are normally provided by the Auditor in connection with the statutory and regulatory filings or engagements for the Reporting Periods, were $187,820 in September 30, 2014 and $205,455 in September 30, 2015.
b) Audit-Related Fees. The aggregate fees billed in the Reporting Period for assurance and related services by the Auditor that are reasonably related to the performance of the Registrant’s financial statements were $0 in September 30, 2014 and $0 in September 30, 2015.
(c) Tax Fees. The aggregate fees billed in the Reporting Periods for professional services rendered by the Auditor for tax compliance, tax advice and tax planning (“Tax Services”) were $75,738 in September 30, 2014 and $25,565 in September 30, 2015. These services consisted of (i) review or preparation of U.S. federal, state, local and excise tax returns; (ii) U.S. federal, state and local tax planning, advice and assistance regarding statutory, regulatory or administrative developments, and (iii) tax advice regarding tax qualification matters and/or treatment of various financial instruments held or proposed to be acquired or held.
There were no fees billed for tax services by the to service affiliates during the Reporting Periods that required pre-approval by the Audit Auditors Committee.
d) All Other Fees. The aggregate fees for other fees billed in the Reporting Periods for products and services provided by the Auditor were $2,928 in September 30, 2014 and $1,762 in September 30, 2015, other than the services reported in paragraphs (a) through (c) of this item for the Legg Mason Global Asset Management Trust.
All Other Fees. There were no other non-audit services rendered by the Auditor to Legg Mason Partners Fund Advisors, LLC (“LMPFA”), and any entity controlling, controlled by or under common control with LMPFA that provided ongoing services to Legg Mason Global Asset Management Trust requiring pre-approval by the Audit Committee in the Reporting Period.
(e) Audit Committee’s pre–approval policies and procedures described in paragraph (c)
(7) of Rule 2-01 of Regulation S-X.
(1) The Charter for the Audit Committee (the “Committee”) of the Board of each registered investment company (the “Fund”) advised by LMPFA or one of their affiliates (each, an “Adviser”) requires that the Committee shall approve (a) all audit and permissible non-audit services to be provided to the Fund and (b) all permissible non-audit services to be provided by the Fund’s independent auditors to the Adviser and any Covered Service Providers if the engagement relates directly to the operations and financial reporting of the Fund. The Committee may implement policies and procedures by which such services are approved other than by the full Committee.
The Committee shall not approve non-audit services that the Committee believes may impair the independence of the auditors. As of the date of the approval of this Audit Committee Charter, permissible non-audit services include any professional services (including tax services), that are not prohibited services as described below, provided to the Fund by the independent auditors, other than those provided to the Fund in connection with an audit or a review of the financial statements of the Fund. Permissible non-audit services may not include: (i) bookkeeping or other services related to the accounting records or financial statements of the Fund; (ii) financial information systems design and implementation; (iii) appraisal or valuation services, fairness opinions or contribution-in-kind reports; (iv) actuarial services; (v) internal audit outsourcing services; (vi) management functions or human resources; (vii) broker or dealer, investment adviser or investment banking services; (viii) legal services and expert services unrelated to the audit; and (ix) any other service the Public Company Accounting Oversight Board determines, by regulation, is impermissible.
Pre-approval by the Committee of any permissible non-audit services is not required so long as: (i) the aggregate amount of all such permissible non-audit services provided to the Fund, the Adviser and any service providers controlling, controlled by or under common control with the Adviser that provide ongoing services to the Fund (“Covered Service Providers”) constitutes not more than 5% of the total amount of revenues paid to the independent auditors during the fiscal year in which the permissible non-audit services are provided to (a) the Fund, (b) the Adviser and (c) any entity controlling, controlled by or under common control with the Adviser that provides ongoing services to the Fund during the fiscal year in which the services are provided that would have to be approved by the Committee; (ii) the permissible non-audit services were not recognized by the Fund at the time of the engagement to be non-audit services; and (iii) such services are promptly brought to the attention of the Committee and approved by the Committee (or its delegate(s)) prior to the completion of the audit.
(2) For the Legg Mason Global Asset Management Trust, the percentage of fees that were approved by the audit committee, with respect to: Audit-Related Fees were 100% and 100% for September 30, 2014 and September 30, 2015; Tax Fees were 100% and 100% for September 30, 2014 and September 30, 2015; and Other Fees were 100% and 100% for September 30, 2014 and September 30, 2015.
(f) N/A
(g) Non-audit fees billed by the Auditor for services rendered to Legg Mason Global Asset Management Trust, LMPFA and any entity controlling, controlled by, or under common control with LMPFA that provides ongoing services to Legg Mason Global Asset Management Trust during the reporting period were $248,092 in September 30, 2014 and $348,474 in September 30, 2015.
(h) Yes. Legg Mason Global Asset Management Trust’s Audit Committee has considered whether the provision of non-audit services that were rendered to Service Affiliates, which were not pre-approved (not requiring pre-approval), is compatible with maintaining the Accountant’s independence. All services provided by the Auditor to the Legg Mason Global Asset Management Trust or to Service Affiliates, which were required to be pre-approved, were pre-approved as required.
| ITEM 5. | AUDIT COMMITTEE OF LISTED REGISTRANTS. |
| | a) | The independent board members are acting as the registrant’s audit committee as specified in Section 3(a)(58)(B) of the Exchange Act .The Audit Committee consists of the following Board members: |
Ruby P. Hearn
Arnold L. Lehman
Robin J.W. Masters
Jill E. McGovern
Arthur S. Mehlman
G. Peter O’Brien
S. Ford Rowan
Robert M. Tarola
| ITEM 6. | SCHEDULE OF INVESTMENTS. |
Included herein under Item 1.
| ITEM 7. | DISCLOSURE OF PROXY VOTING POLICIES AND PROCEDURES FOR CLOSED-END MANAGEMENT INVESTMENT COMPANIES. |
Not applicable.
| ITEM 8. | PORTFOLIO MANAGERS OF CLOSED-END MANAGEMENT INVESTMENT COMPANIES. |
Not applicable.
| ITEM 9. | PURCHASES OF EQUITY SECURITIES BY CLOSED-END MANAGEMENT INVESTMENT COMPANY AND AFFILIATED PURCHASERS. |
Not applicable.
| ITEM 10. | SUBMISSION OF MATTERS TO A VOTE OF SECURITY HOLDERS. |
Not applicable.
| ITEM 11. | CONTROLS AND PROCEDURES. |
| | (a) | The registrant’s principal executive officer and principal financial officer have concluded that the registrant’s disclosure controls and procedures (as defined in Rule 30a- 3(c) under the Investment Company Act of 1940, as amended (the “1940 Act”)) are effective as of a date within 90 days of the filing date of this report that includes the disclosure required by this paragraph, based on their evaluation of the disclosure controls and procedures required by Rule 30a-3(b) under the 1940 Act and 15d-15(b) under the Securities Exchange Act of 1934. |
| | (b) | There were no changes in the registrant’s internal control over financial reporting (as defined in Rule 30a-3(d) under the 1940 Act) that occurred during the second fiscal quarter of the period covered by this report that have materially affected, or are likely to materially affect the registrant’s internal control over financial reporting. |
(a) (1) Code of Ethics attached hereto.
Exhibit 99.CODE ETH
(a) (2) Certifications pursuant to section 302 of the Sarbanes-Oxley Act of 2002 attached hereto.
Exhibit 99.CERT
(b) Certifications pursuant to Section 906 of the Sarbanes-Oxley Act of 2002 attached hereto.
Exhibit 99.906CERT
SIGNATURES
Pursuant to the requirements of the Securities Exchange Act of 1934 and the Investment Company Act of 1940, the registrant has duly caused this Report to be signed on its behalf by the undersigned, there unto duly authorized.
Legg Mason Global Asset Management Trust
| | |
| By: | | /s/ Jane Trust |
| | Jane Trust |
| | Chief Executive Officer |
| |
| Date: | | November 24, 2015 |
Pursuant to the requirements of the Securities Exchange Act of 1934 and the Investment Company Act of 1940, this report has been signed below by the following persons on behalf of the registrant and in the capacities and on the dates indicated.
| | |
| By: | | /s/ Jane Trust |
| | Jane Trust |
| | Chief Executive Officer |
| |
| Date: | | November 24, 2015 |
| |
| By: | | /s/ Richard F. Sennett |
| | Richard F. Sennett |
| | Principal Financial Officer |
| |
| Date: | | November 24, 2015 |