UNITED STATES
SECURITIES AND EXCHANGE COMMISSION
Washington, D.C. 20549
FORM N-CSR
CERTIFIED SHAREHOLDER REPORT OF REGISTERED
MANAGEMENT INVESTMENT COMPANIES
Investment Company Act file number 811-22338
Legg Mason Global Asset Management Trust
(Exact name of registrant as specified in charter)
620 Eighth Avenue, 49th Floor, New York, NY 10018
(Address of principal executive offices) (Zip code)
Robert I. Frenkel, Esq.
Legg Mason & Co., LLC
100 First Stamford Place
Stamford, CT 06902
(Name and address of agent for service)
Registrant’s telephone number, including area code: 1-877-721-1926
Date of fiscal year end: December 31
Date of reporting period: December 31, 2017
| ITEM 1. | REPORT TO STOCKHOLDERS |
The Annual Report to Stockholders is filed herewith.

| | |
| Annual Report | | December 31, 2017 |
QS
U.S. SMALL
CAPITALIZATION
EQUITY FUND

|
| INVESTMENT PRODUCTS: NOT FDIC INSURED • NO BANK GUARANTEE • MAY LOSE VALUE |
Fund objective
The Fund seeks long-term capital appreciation.
Letter from the president

Dear Shareholder,
We are pleased to provide the annual report of QS U.S. Small Capitalization Equity Fund for the twelve-month reporting period ended December 31, 2017. Please read on for a detailed look at prevailing economic and market conditions during the Fund’s reporting period and to learn how those conditions have affected Fund performance.
As always, we remain committed to providing you with excellent service and a full spectrum of investment choices. We also remain committed to supplementing the support you receive from your financial advisor. One way we accomplish this is through our website, www.leggmason.com. Here you can gain immediate access to market and investment information, including:
| • | | Fund prices and performance, |
| • | | Market insights and commentaries from our portfolio managers, and |
| • | | A host of educational resources. |
We look forward to helping you meet your financial goals.
Sincerely,

Jane Trust, CFA
President and Chief Executive Officer
January 31, 2018
| | |
| II | | QS U.S. Small Capitalization Equity Fund |
Investment commentary
Economic review
Economic activity in the U.S. was somewhat mixed during the twelve months ended December 31, 2017 (the “reporting period”). Looking back, the U.S. Department of Commerce reported that U.S. gross domestic product (“GDP”)i growth was 1.2% during the first quarter of 2017. Second and third quarter 2017 GDP growth then accelerated to 3.1% and 3.2%, respectively. Finally, the U.S. Department of Commerce’s initial reading for fourth quarter 2017 GDP growth — released after the reporting period ended — was 2.6%. The deceleration in growth reflected a downturn in private investor investment, which was partially offset by accelerations in personal consumption expenditures (“PCE”), exports, nonresidential fixed investment, state and local government spending, federal government spending, and an upturn in residential fixed investment.
Job growth in the U.S. was solid overall and supported the economy during the reporting period. When the reporting period ended on December 31, 2017, the unemployment rate was 4.1%, as reported by the U.S. Department of Labor. This equaled the lowest unemployment rate since December 2000. The percentage of longer-term unemployed declined during the reporting period. In December 2017, 22.9% of Americans looking for a job had been out of work for more than six months, versus 24.4% when the period began.
The Federal Reserve Board (the “Fed”)ii raised interest rates, as represented by the federal funds rate,iii three times during the reporting period. The first occurrence took place on March 15, 2017, as the Fed raised rates to a range between 0.75% and 1.00%. At its meeting that concluded on June 14, 2017, the Fed then raised rates to a range between 1.00% and 1.25%. During its meeting that concluded on September 20, 2017, the Fed kept rates on hold, but reiterated its intention to begin reducing its balance sheet, saying, “In October, the Committee will initiate the balance sheet normalization program….” Finally, at its meeting that ended on December 13, 2017, the Fed raised rates to a range between 1.25% and 1.50%.
As always, thank you for your confidence in our stewardship of your assets.
Sincerely,
Jane Trust, CFA
President and Chief Executive Officer
January 31, 2018
All investments are subject to risk including the possible loss of principal. Past performance is no guarantee of future results.
| i | Gross domestic product (“GDP”) is the market value of all final goods and services produced within a country in a given period of time. |
| ii | The Federal Reserve Board (the “Fed”) is responsible for the formulation of U.S. policies designed to promote economic growth, full employment, stable prices, and a sustainable pattern of international trade and payments. |
| iii | The federal funds rate is the rate charged by one depository institution on an overnight sale of immediately available funds (balances at the Federal Reserve) to another depository institution; the rate may vary from depository institution to depository institution and from day to day. |
| | |
| QS U.S. Small Capitalization Equity Fund | | III |
Fund overview
Q. What is the Fund’s investment strategy?
A. The Fund’s investment objective is long-term capital appreciation. Under normal market conditions, the Fund will invest at least 80% of net assets, plus any borrowings for investment purposes, in equity securities of companies with small market capitalizations domiciled, or having their principal activities, in the U.S., at the time of investment or other investments with similar economic characteristics. The Fund normally intends to hold a portfolio that is generally comparable to, but not the same as, the Russell 2000 Indexi in terms of economic sector weightings and market capitalization but may depart from this if we believe it to be in the best interests of the Fund. The Fund may also invest in securities of foreign companies in the form of American Depositary Receipts (“ADRs”).
At QS Investors, LLC, the Fund’s subadviser, all portfolios are managed on a collaborative basis using a systematic, rules-based approach. We use a bottom-up, quantitative stock selection process. The cornerstone of this process is a proprietary stock selection model that ranks the stocks in the Fund’s investable universe on a daily basis according to a variety of fundamental measures of relative attractiveness.
Q. What were the overall market conditions during the Fund’s reporting period?
A. This was a strong period for U.S. equities, arguably beginning with the run-up after the U.S. presidential election in November 2016. The first quarter of 2017 extended the so-called “Trump rally,” with steady equity gains tapering off after mid-March 2017. Most major economies, including the U.S., saw largely positive economic indicators. These positive trends prompted the Federal Reserve Board (the “Fed”)ii to continue to modestly raise rates, and set expectations for two more hikes to follow in 2017, as well as a gradual tapering of its bond holdings. In this first calendar quarter, the Energy sector was the only decliner, sliding after a run-up in late 2016; oil prices declined over 5% during the first quarter amid reports of large U.S. reserves and suspected cheating on quotas by the Organization of Petroleum Exporting Countries (“OPEC”).
U.S. equities ended the second quarter of 2017 with a gain, despite some softening in growth metrics; Manufacturing slowed slightly, but service sector growth continued to rise. The Fed appeared optimistic as it implemented an interest rate hike, pointed toward one more in 2017, and indicated it may start to pare back its balance sheet against a backdrop of strong employment and low inflation. Stocks saw a wide dispersion in sector returns with the laggard again being the Energy sector; oil prices remained stubbornly low amid higher-than-expected reserves.
U.S. equities ended the third quarter of 2017 in positive territory with a number of indices hitting all-time highs during the period, reacting positively to the possibility of tax cuts. Volatility increased in August 2017, but fell back in September 2017 as strong corporate earnings and positive future estimates continued across most sectors. The active hurricane season was blamed for a weak employment report; it was seen as likely to hit U.S. gross domestic product (“GDP”)iii growth in the short term, but boost auto sales, construction, and other industries over the coming quarters.
| | |
| QS U.S. Small Capitalization Equity Fund 2017 Annual Report | | 1 |
Fund overview (cont’d)
In the final quarter of 2017, U.S. equities continued to hit new highs, with strong corporate profits and an outlook for gains to continue; under the new tax overhaul enacted by Congress, corporate tax rates will be significantly reduced. The Fed raised rates as expected, although a flattening of the yield curveiv despite economic strength may delay additional expected increases in 2018. The housing market, including new home starts, and job growth remained strong, and sentiment has been positive for both business and consumers. Even rising oil prices did not appear to create a headwind.
Sector results within the Russell 2000 Index were virtually all positive for the reporting period, with only the Energy sector posting a negative return. Many sectors had double digit returns, led by the Health Care and Industrials sectors, which tend to hold the more growth-oriented stocks that were favored for much of the year; within the small-capitalization space, growth stocks, as represented by the Russell 2000 Growth Indexv, meaningfully outperformed value stocks, as represented by the Russell 2000 Value Indexvi.
This environment, which was led by an extremely narrow group of growth stocks, tends to disadvantage core portfolios that are broadly diversified. In the first three quarters of 2017, the Fund struggled amid the general drawdown in value which was offset, to some extent, by positive performance of the sentiment dimension of our stock selection model. In the fourth quarter of 2017, investors started to focus more on fundamentals and valuations, and the market exhibited more breadth; both the value and sentiment factors of the stock selection model had positive performance, as expected in a broader based market environment.
Q. How did we respond to these changing market conditions?
A. We believe that fundamentals, the very basis of our investment process, will continue to be the primary driver of long-term returns. We also believe in the value of a broadly diversified, rules-based, risk-controlled process over the long term.
Performance review
For the twelve months ended December 31, 2017, Class I shares of QS U.S. Small Capitalization Equity Fund returned 8.77%. The Fund’s unmanaged benchmark, the Russell 2000 Index, returned 14.65% for the same period. The Lipper Small-Cap Core Funds Category Average1 returned 12.56% over the same time frame.
| 1 | Lipper, Inc., a wholly-owned subsidiary of Reuters, provides independent insight on global collective investments. Returns are based on the twelve-month period ended December 31, 2017, including the reinvestment of all distributions, including returns of capital, if any, calculated among the 1,021 funds in the Fund’s Lipper category, and excluding sales charges, if any. |
| | |
| 2 | | QS U.S. Small Capitalization Equity Fund 2017 Annual Report |
| | | | | | | | |
Performance Snapshot as of December 31, 2017
(unaudited) | |
| (excluding sales charges) | | 6 months | | | 12 months | |
QS U.S. Small Capitalization
Equity Fund: | | | | | | | | |
Class A | | | 7.29 | % | | | 8.46 | % |
Class A2 | | | 7.26 | % | | | 8.29 | % |
Class C | | | 6.92 | % | | | 7.66 | % |
Class FI | | | 7.35 | % | | | 8.49 | % |
Class I | | | 7.54 | % | | | 8.77 | % |
Class IS | | | 7.68 | % | | | 9.02 | % |
| Russell 2000 Index | | | 9.20 | % | | | 14.65 | % |
| Lipper Small-Cap Core Funds Category Average1 | | | 8.78 | % | | | 12.56 | % |
The performance shown represents past performance. Past performance is no guarantee of future results and current performance may be higher or lower than the performance shown above. Principal value and investment returns will fluctuate and investors’ shares, when redeemed, may be worth more or less than their original cost. To obtain performance data current to the most recent month-end, please visit our website at www.leggmason.com/mutualfunds.
All share class returns assume the reinvestment of all distributions at net asset value and the deduction of all Fund expenses. Returns have not been adjusted to include sales charges that may apply or the deduction of taxes that a shareholder would pay on Fund distributions. If sales charges were reflected, the performance quoted would be lower. Performance figures for periods shorter than one year represent cumulative figures and are not annualized.
Fund performance figures reflect fee waivers and/or expense reimbursements, without which the performance would have been lower.
|
| Total Annual Operating Expenses (unaudited) |
As of the Fund’s current prospectus dated May 1, 2017, the gross total annual operating fund expense ratios for Class A, Class A2, Class C, Class FI, Class I and Class IS shares were 1.19%, 1.46%, 1.96%, 1.24%, 0.99% and 0.77%, respectively.
Actual expenses may be higher. For example, expenses may be higher than those shown if average net assets decrease. Net assets are more likely to decrease and Fund expense ratios are more likely to increase when markets are volatile.
As a result of expense limitation arrangements, the ratio of total annual fund operating expenses, other than interest, brokerage commissions, dividend expense on short sales, taxes, extraordinary expenses and acquired fund fees and expenses, to average net assets will not exceed 1.30% for Class A shares, 1.50% for Class A2 shares, 2.05% for Class C shares, 1.30% for Class FI shares, 1.00% for Class I shares and 0.75% for Class IS shares. In addition, the ratio of total annual fund operating expenses for Class IS shares will not exceed the ratio of total annual fund operating expenses for Class I shares. Total annual fund operating expenses after waiving fees and/or reimbursing expenses exceed the expense cap for Class IS shares as the result acquired fund fees and expenses. These expense limitation arrangements cannot be terminated prior to December 31, 2019 without the Board of Trustees’ consent.
The manager currently intends to voluntarily waive fees and/or reimburse operating expenses, other than interest, brokerage commissions, dividend expense on short
| 1 | Lipper, Inc., a wholly-owned subsidiary of Reuters, provides independent insight on global collective investments. Returns are based on the period ended December 31, 2017, including the reinvestment of all distributions, including returns of capital, if any, calculated among the 1,058 funds for the six-month period and among the 1,021 funds for the twelve-month period in the Fund’s Lipper category, and excluding sales charges, if any. |
| | |
| QS U.S. Small Capitalization Equity Fund 2017 Annual Report | | 3 |
Fund overview (cont’d)
sales, taxes, extraordinary expenses and acquired fund fees and expenses, so that annual operating expenses will not exceed 1.20% for Class A shares, 1.40% for Class A2 shares, 1.95% for Class C shares, 1.20% for Class FI shares and 0.90% for Class I shares These arrangements are expected to continue until December 31, 2019, but may be terminated at any time by the manager.
The manager is permitted to recapture amounts waived and/or reimbursed to a class within three years after the fiscal year in which the manager earned the fee or incurred the expense if the class’ total annual operating expenses have fallen to a level below the expense limitation (“expense cap”) in effect at the time the fees were earned or the expenses incurred. In no case will the manager recapture any amount that would result, on any particular business day of the Fund, in the class’ total annual operating expenses exceeding the expense cap or any other lower limit then in effect.
Q. What were the leading contributors to performance?
A. Sector allocation was the leading contributor to relative performance for the reporting period, especially an underweight to the Energy sector, which was the only sector with a negative return for the reporting period. Stock selection in the Consumer Discretionary and Financials sectors was also a major contributor to relative return. At the security level the leading contributor was LendingTree Inc. with a return of over 200%; LendingTree’s revenue jumped over 60% in the first half of 2017 versus the prior year as a result of its core business, as well as fees from its non-mortgage products, such as credit cards and personal loans. KB Home and OraSure Technologies Inc. were also leading contributors to performance with returns for the year of over 100%.
Q. What were the leading detractors from performance?
A. Stock selection overall detracted from relative return for the reporting period, especially in the Information Technology (“IT”), Health Care and Industrials sectors. An underweight to IT was also a major detractor. At the security level, not owning two securities, Nektar Therapeutics and Kite Pharma, Inc., which each returned over 300% in the benchmark, detracted from relative return. Nektar Therapeutics, which depends heavily on payments received from partners, enjoyed a rise in royalty income and is likely to benefit from a collaboration with Eli Lilly & Co. in the near future. Kite Pharma benefited from an acquisition by Gilead Sciences, Inc., making Gilead one of the leaders in the area of developing cell therapy to treat cancer. A position in Dean Foods was also a major detractor from relative return, as the direct-to-store distributor of dairy products lost a large contract with Wall-Mart Stores Inc. and a negative return of over 45% during the reporting period.
Thank you for your investment in QS U.S. Small Capitalization Equity Fund. As always, we appreciate that you have chosen us to manage your assets and we remain focused on achieving the Fund’s investment goals.
Sincerely,
QS Investors, LLC
January 24, 2018
RISKS: Equity securities are subject to market and price fluctuations. Investments in small-cap companies may involve greater risks and volatility than investments in larger, more established companies. Small-cap companies may have limited product lines, operating histories, markets or financial resources. The Fund may use derivatives, such as options and
| | |
| 4 | | QS U.S. Small Capitalization Equity Fund 2017 Annual Report |
futures, which can be illiquid, may disproportionately increase losses, and may have a potentially large impact on Fund performance. Please see the Fund’s prospectus
for a more complete discussion of these and other risks and the Fund’s investment strategies.
Portfolio holdings and breakdowns are as of December 31, 2017 and are subject to change and may not be representative of the portfolio managers’ current or future investments. The Fund’s top ten holdings (as a percentage of net assets) as of December 31, 2017 were: RLJ Lodging Trust (0.8%), KB Home (0.8%), MGIC Investment Corp. (0.8%), Magellan Health Inc. (0.8%), Sanderson Farms Inc. (0.7%), Molina Healthcare Inc. (0.7%), EMCOR Group Inc. (0.7%), Insperity Inc. (0.7%), Essent Group Ltd. (0.7%) and Penn National Gaming Inc. (0.7%). Please refer to pages 11 through 24 for a list and percentage breakdown of the Fund’s holdings.
The mention of sector breakdowns is for informational purposes only and should not be construed as a recommendation to purchase or sell any securities. The information provided regarding such sectors is not a sufficient basis upon which to make an investment decision. Investors seeking financial advice regarding the appropriateness of investing in any securities or investment strategies discussed should consult their financial professional. The Fund’s top five sector holdings (as a percentage of net assets) as of December 31, 2017 were: Information Technology (17.2%), Financials (16.9%), Industrials (14.8%), Consumer Discretionary (14.3%) and Health Care (13.3%). The Fund’s portfolio composition is subject to change at any time.
All investments are subject to risk including the possible loss of principal. Past performance is no guarantee of future results. All index performance reflects no deduction for fees, expenses or taxes. Please note that an investor cannot invest directly in an index.
The information provided is not intended to be a forecast of future events, a guarantee of future results or investment advice. Views expressed may differ from those of the firm as a whole.
| i | The Russell 2000 Index measures the performance of the small-cap segment of the U.S. equity universe. The Russell 2000 is a subset of the Russell 3000 Index representing approximately 10% of the total market capitalization of that index. It includes approximately 2,000 of the smallest securities based on a combination of their market cap and current index membership. The Russell 3000 Index measures the performance of the 3,000 largest U.S. companies based on total market capitalization, which represents approximately 98% of the U.S. equity market. |
| ii | The Federal Reserve Board (the “Fed”) is responsible for the formulation of U.S. policies designed to promote economic growth, full employment, stable prices and a sustainable pattern of international trade and payments. |
| iii | Gross domestic product (“GDP”) is the market value of all final goods and services produced within a country in a given period of time |
| iv | The yield curve is the graphical depiction of the relationship between the yield on bonds of the same credit quality but different maturities. |
| v | The Russell 2000 Growth Index measures the performance of the small-cap growth segment of the U.S. equity universe. It includes those Russell 2000 Index companies with higher price-to-value ratios and higher forecasted growth values. (A price-to-book ratio is the price of a stock compared to the difference between a company’s assets and liabilities.) |
| vi | The Russell 2000 Value Index measures the performance of those Russell 2000 Index companies with lower price-to-book ratios and lower forecasted growth values. |
| | |
| QS U.S. Small Capitalization Equity Fund 2017 Annual Report | | 5 |
Fund at a glance† (unaudited)
Investment breakdown (%) as a percent of total investments
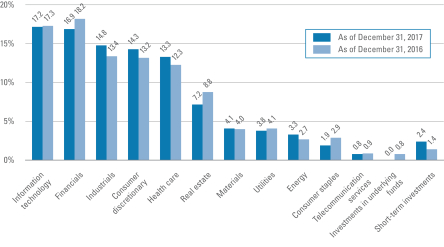
| † | The bar graph above represents the composition of the Fund’s investments as of December 31, 2017 and December 31, 2016. The Fund is actively managed. As a result, the composition of the Fund’s investments is subject to change at any time. |
| | |
| 6 | | QS U.S. Small Capitalization Equity Fund 2017 Annual Report |
Fund expenses (unaudited)
Example
As a shareholder of the Fund, you may incur two types of costs: (1) transaction costs, including front-end and back-end sales charges (loads) on purchase payments; and (2) ongoing costs, including management fees; service and/or distribution (12b-1) fees; and other Fund expenses. This example is intended to help you understand your ongoing costs (in dollars) of investing in the Fund and to compare these costs with the ongoing costs of investing in other mutual funds.
This example is based on an investment of $1,000 invested on July 1, 2017 and held for the six months ended December 31, 2017.
Actual expenses
The table below titled “Based on Actual Total Return” provides information about actual account values and actual expenses. You may use the information provided in this table, together with the amount you invested, to estimate the expenses that you paid over the period. To estimate the expenses you paid on your account, divide your ending account value by $1,000 (for example, an $8,600 ending account value divided by $1,000 = 8.6), then multiply the result by the number under the heading entitled “Expenses Paid During the Period”.
Hypothetical example for comparison purposes
The table below titled “Based on Hypothetical Total Return” provides information about hypothetical account values and hypothetical expenses based on the actual expense ratio and an assumed rate of return of 5.00% per year before expenses, which is not the Fund’s actual return. The hypothetical account values and expenses may not be used to estimate the actual ending account balance or expenses you paid for the period. You may use the information provided in this table to compare the ongoing costs of investing in the Fund and other funds. To do so, compare the 5.00% hypothetical example relating to the Fund with the 5.00% hypothetical examples that appear in the shareholder reports of the other funds.
Please note that the expenses shown in the table below are meant to highlight your ongoing costs only and do not reflect any transactional costs, such as front-end or back-end sales charges (loads). Therefore, the table is useful in comparing ongoing costs only, and will not help you determine the relative total costs of owning different funds. In addition, if these transaction costs were included, your costs would have been higher.
| | | | | | | | | | | | | | | | | | | | | | | | | | | | | | | | | | | | | | | | | | | | | | |
| Based on actual total return1 | | | | | | Based on hypothetical total return1 | |
| | | Actual
Total Return
Without
Sales
Charge2 | | | Beginning
Account
Value | | | Ending
Account
Value | | | Annualized
Expense
Ratio | | | Expenses
Paid
During
the
Period3 | | | | | | | | Hypothetical
Annualized
Total Return | | | Beginning
Account
Value | | | Ending
Account
Value | | | Annualized
Expense
Ratio | | | Expenses
Paid
During
the
Period3 | |
| Class A | | | 7.29 | % | | $ | 1,000.00 | | | $ | 1,072.90 | | | | 1.23 | % | | $ | 6.43 | | | | | | | Class A | | | 5.00 | % | | $ | 1,000.00 | | | $ | 1,019.00 | | | | 1.23 | % | | $ | 6.26 | |
| Class A2 | | | 7.26 | | | | 1,000.00 | | | | 1,072.60 | | | | 1.40 | | | | 7.31 | | | | | | | Class A2 | | | 5.00 | | | | 1,000.00 | | | | 1,018.15 | | | | 1.40 | | | | 7.12 | |
| Class C | | | 6.92 | | | | 1,000.00 | | | | 1,069.20 | | | | 1.95 | | | | 10.17 | | | | | | | Class C | | | 5.00 | | | | 1,000.00 | | | | 1,015.38 | | | | 1.95 | | | | 9.91 | |
| Class FI | | | 7.35 | | | | 1,000.00 | | | | 1,073.50 | | | | 1.20 | | | | 6.27 | | | | | | | Class FI | | | 5.00 | | | | 1,000.00 | | | | 1,019.16 | | | | 1.20 | | | | 6.11 | |
| Class I | | | 7.54 | | | | 1,000.00 | | | | 1,075.40 | | | | 0.90 | | | | 4.71 | | | | | | | Class I | | | 5.00 | | | | 1,000.00 | | | | 1,020.67 | | | | 0.90 | | | | 4.58 | |
| Class IS | | | 7.68 | | | | 1,000.00 | | | | 1,076.80 | | | | 0.75 | | | | 3.93 | | | | | | | Class IS | | | 5.00 | | | | 1,000.00 | | | | 1,021.42 | | | | 0.75 | | | | 3.82 | |
| | |
| QS U.S. Small Capitalization Equity Fund 2017 Annual Report | | 7 |
Fund expenses (unaudited) (cont’d)
| 1 | For the six months ended December 31, 2017. |
| 2 | Assumes the reinvestment of all distributions, including returns of capital, if any, at net asset value and does not reflect the deduction of the applicable sales charge with respect to Class A and Class A2 shares or the applicable contingent deferred sales charge (“CDSC”) with respect to Class C shares. Total return is not annualized, as it may not be representative of the total return for the year. Performance figures may reflect compensating balance arrangements, fee waivers and/or expense reimbursements. In the absence of compensating balance arrangements, fee waivers and/or expense reimbursements, the total return would have been lower. Past performance is no guarantee of future results. |
| 3 | Expenses (net of compensating balance arrangements, fee waivers and/or expense reimbursements) are equal to each class’ respective annualized expense ratio multiplied by the average account value over the period, multiplied by the number of days in the most recent fiscal half-year (184), then divided by 365. |
| | |
| 8 | | QS U.S. Small Capitalization Equity Fund 2017 Annual Report |
Fund performance (unaudited)
| | | | | | | | | | | | | | | | | | | | | | | | |
| Average annual total returns | |
| Without sales charges1 | | Class A | | | Class A2 | | | Class C | | | Class FI | | | Class I | | | Class IS | |
| Twelve Months Ended 12/31/17 | | | 8.46 | % | | | 8.29 | % | | | 7.66 | % | | | 8.49 | % | | | 8.77 | % | | | 9.02 | % |
| Five Years Ended 12/31/17 | | | 13.13 | | | | 12.92 | | | | 12.27 | | | | 13.12 | | | | 13.56 | | | | 13.64 | |
| Ten Years Ended 12/31/17 | | | N/A | | | | N/A | | | | N/A | | | | 7.85 | | | | 8.26 | | | | N/A | |
| Inception* through 12/31/17 | | | 15.80 | | | | 13.42 | | | | 14.93 | | | | — | | | | — | | | | 12.32 | |
| | | | | | |
| With sales charges2 | | Class A | | | Class A2 | | | Class C | | | Class FI | | | Class I | | | Class IS | |
| Twelve Months Ended 12/31/17 | | | 2.22 | % | | | 2.06 | % | | | 6.67 | % | | | 8.49 | % | | | 8.77 | % | | | 9.02 | % |
| Five Years Ended 12/31/17 | | | 11.79 | | | | 11.59 | | | | 12.27 | | | | 13.12 | | | | 13.56 | | | | 13.64 | |
| Ten Years Ended 12/31/17 | | | N/A | | | | N/A | | | | N/A | | | | 7.85 | | | | 8.26 | | | | N/A | |
| Inception* through 12/31/17 | | | 15.02 | | | | 12.12 | | | | 14.93 | | | | — | | | | — | | | | 12.32 | |
| | | | |
| Cumulative total returns | |
| Without sales charges1 | | | |
| Class A (Inception date of 2/5/09 through 12/31/17) | | | 269.08 | % |
| Class A2 (Inception date of 10/31/12 through 12/31/17) | | | 91.72 | |
| Class C (Inception date of 2/5/09 through 12/31/17) | | | 245.10 | |
| Class FI (12/31/07 through 12/31/17) | | | 112.89 | |
| Class I (12/31/07 through 12/31/17) | | | 121.20 | |
| Class IS (Inception date of 3/23/12 through 12/31/17) | | | 95.66 | |
All figures represent past performance and are not a guarantee of future results. Investment return and principal value of an investment will fluctuate so that an investor’s shares, when redeemed, may be worth more or less than their original cost. The returns shown do not reflect the deduction of taxes that a shareholder would pay on Fund distributions or the redemption of Fund shares. Performance figures may reflect compensating balance arrangements, fee waivers and/or expense reimbursements. In the absence of compensating balance arrangements, fee waivers and/or expense reimbursements, the total return would have been lower.
| 1 | Assumes the reinvestment of all distributions, including returns of capital, if any, at net asset value and does not reflect the deduction of the applicable sales charge with respect to Class A shares and Class A2 shares or the applicable contingent deferred sales charge (“CDSC”) with respect to Class C shares. |
| 2 | Assumes the reinvestment of all distributions, including returns of capital, if any, at net asset value. In addition, Class A shares and Class A2 shares reflect the deduction of the maximum initial sales charge of 5.75%. Class C shares reflect the deduction of a 1.00% CDSC, which applies if shares are redeemed within one year from purchase payment. |
| * | Inception dates for Class A, A2, C, FI, I and IS shares are February 5, 2009, October 31, 2012, February 5, 2009, January 9, 2003, March 13, 2000 and March 23, 2012, respectively. |
| | |
| QS U.S. Small Capitalization Equity Fund 2017 Annual Report | | 9 |
Fund performance (unaudited) (cont’d)
Historical performance
Value of $1,000,000 invested in
Class I Shares of QS U.S. Small Capitalization Equity Fund vs. Russell 2000 Index† — December 2007 - December 2017
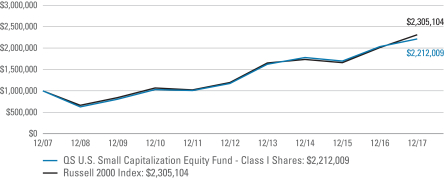
All figures represent past performance and are not a guarantee of future results. Investment return and principal value of an investment will fluctuate so that an investor’s shares, when redeemed, may be worth more or less than their original cost. The returns shown do not reflect the deduction of taxes that a shareholder would pay on Fund distributions or the redemption of Fund shares. Performance figures may reflect compensating balance arrangements, fee waivers and/or expense reimbursements. In the absence of compensating balance arrangements, fee waivers and/or expense reimbursements, the total return would have been lower.
| † | Hypothetical illustration of $1,000,000 invested in Class I shares of QS U.S. Small Capitalization Equity Fund on December 31, 2007, assuming the reinvestment of all distributions, including returns of capital, if any, at net asset value through December 31, 2017. The hypothetical illustration also assumes a $1,000,000 investment in the Russell 2000 Index. The Russell 2000 Index measures the performance of the 2,000 smallest companies in the Russell 3000 Index, which represents approximately 8% of the total market capitalization of the Russell 3000 Index. The index is unmanaged and is not subject to the same management and trading expenses as a mutual fund. Please note that an investor cannot invest directly in an index. The performance of the Fund’s other classes may be greater or less than Class I share’s performance indicated on this chart, depending on whether greater or lesser sales charges and fees were incurred by shareholders investing in the other classes. |
| | |
| 10 | | QS U.S. Small Capitalization Equity Fund 2017 Annual Report |
Schedule of investments
December 31, 2017
QS U.S. Small Capitalization Equity Fund
| | | | | | | | | | | | | | | | |
| Security | | | | | | | | Shares | | | Value | |
| Common Stocks — 97.6% | | | | | | | | | | | | | | | | |
| Consumer Discretionary — 14.3% | | | | | | | | | | | | | | | | |
Auto Components — 2.1% | | | | | | | | | | | | | | | | |
Cooper Tire & Rubber Co. | | | | | | | | | | | 16,939 | | | $ | 598,794 | |
Cooper-Standard Holdings Inc. | | | | | | | | | | | 8,539 | | | | 1,046,027 | * |
Dana Inc. | | | | | | | | | | | 26,595 | | | | 851,306 | |
Stoneridge Inc. | | | | | | | | | | | 26,679 | | | | 609,882 | * |
Tenneco Inc. | | | | | | | | | | | 15,985 | | | | 935,762 | |
Tower International Inc. | | | | | | | | | | | 24,899 | | | | 760,664 | |
Total Auto Components | | | | | | | | | | | | | | | 4,802,435 | |
Diversified Consumer Services — 0.6% | | | | | | | | | | | | | | | | |
Adtalem Global Education Inc. | | | | | | | | | | | 20,119 | | | | 846,004 | * |
Sotheby’s | | | | | | | | | | | 10,197 | | | | 526,165 | * |
Total Diversified Consumer Services | | | | | | | | | | | | | | | 1,372,169 | |
Hotels, Restaurants & Leisure — 5.1% | | | | | | | | | | | | | | | | |
BJ’s Restaurants Inc. | | | | | | | | | | | 17,648 | | | | 642,387 | |
Bloomin’ Brands Inc. | | | | | | | | | | | 40,256 | | | | 859,063 | |
Boyd Gaming Corp. | | | | | | | | | | | 39,824 | | | | 1,395,831 | |
Caesars Entertainment Corp. | | | | | | | | | | | 46,510 | | | | 588,352 | * |
Cheesecake Factory Inc. | | | | | | | | | | | 10,415 | | | | 501,795 | |
Dave & Buster’s Entertainment Inc. | | | | | | | | | | | 15,125 | | | | 834,446 | * |
Denny’s Corp. | | | | | | | | | | | 16,670 | | | | 220,711 | * |
Jack in the Box Inc. | | | | | | | | | | | 11,590 | | | | 1,137,095 | |
Marriott Vacations Worldwide Corp. | | | | | | | | | | | 10,568 | | | | 1,428,899 | |
Penn National Gaming Inc. | | | | | | | | | | | 49,198 | | | | 1,541,373 | * |
Pinnacle Entertainment Inc. | | | | | | | | | | | 10,359 | | | | 339,050 | * |
Ruth’s Hospitality Group Inc. | | | | | | | | | | | 12,650 | | | | 273,873 | |
Scientific Games Corp., Class A Shares | | | | | | | | | | | 25,012 | | | | 1,283,116 | * |
Sonic Corp. | | | | | | | | | | | 20,909 | | | | 574,579 | |
Total Hotels, Restaurants & Leisure | | | | | | | | | | | | | | | 11,620,570 | |
Household Durables — 1.4% | | | | | | | | | | | | | | | | |
Hooker Furniture Corp. | | | | | | | | | | | 4,329 | | | | 183,766 | |
KB Home | | | | | | | | | | | 59,574 | | | | 1,903,389 | |
La-Z-Boy Inc. | | | | | | | | | | | 16,432 | | | | 512,678 | |
M.D.C. Holdings Inc. | | | | | | | | | | | 21,061 | | | | 671,425 | |
Total Household Durables | | | | | | | | | | | | | | | 3,271,258 | |
Leisure Products — 0.5% | | | | | | | | | | | | | | | | |
Johnson Outdoors Inc., Class A Shares | | | | | | | | | | | 3,147 | | | | 195,397 | |
Malibu Boats Inc., Class A Shares | | | | | | | | | | | 9,249 | | | | 274,973 | * |
See Notes to Financial Statements.
| | |
| QS U.S. Small Capitalization Equity Fund 2017 Annual Report | | 11 |
Schedule of investments (cont’d)
December 31, 2017
QS U.S. Small Capitalization Equity Fund
| | | | | | | | | | | | | | | | |
| Security | | | | | | | | Shares | | | Value | |
Leisure Products — continued | | | | | | | | | | | | | | | | |
MCBC Holdings Inc. | | | | | | | | | | | 9,932 | | | $ | 220,689 | * |
Sturm Ruger & Co. Inc. | | | | | | | | | | | 8,203 | | | | 458,138 | |
Total Leisure Products | | | | | | | | | | | | | | | 1,149,197 | |
Media — 0.7% | | | | | | | | | | | | | | | | |
Gray Television Inc. | | | | | | | | | | | 20,793 | | | | 348,283 | * |
Media General Inc., Contingent Value Rights | | | | | | | | | | | 20,404 | | | | 0 | (a)(b)(c) |
Meredith Corp. | | | | | | | | | | | 4,654 | | | | 307,396 | |
Sinclair Broadcast Group Inc., Class A Shares | | | | | | | | | | | 25,554 | | | | 967,219 | |
Total Media | | | | | | | | | | | | | | | 1,622,898 | |
Multiline Retail — 0.5% | | | | | | | | | | | | | | | | |
Big Lots Inc. | | | | | | | | | | | 20,114 | | | | 1,129,401 | |
Specialty Retail — 2.4% | | | | | | | | | | | | | | | | |
Abercrombie & Fitch Co., Class A Shares | | | | | | | | | | | 66,269 | | | | 1,155,069 | |
Ascena Retail Group Inc. | | | | | | | | | | | 69,409 | | | | 163,111 | * |
Barnes & Noble Inc. | | | | | | | | | | | 58,202 | | | | 389,953 | |
Christopher & Banks Corp. | | | | | | | | | | | 29,729 | | | | 37,756 | * |
Express Inc. | | | | | | | | | | | 84,802 | | | | 860,740 | * |
Finish Line Inc., Class A Shares | | | | | | | | | | | 37,453 | | | | 544,192 | |
Francesca’s Holdings Corp. | | | | | | | | | | | 71,248 | | | | 520,823 | * |
Genesco. Inc. | | | | | | | | | | | 24,389 | | | | 792,643 | * |
Hibbett Sports Inc. | | | | | | | | | | | 34,650 | | | | 706,860 | * |
Office Depot Inc. | | | | | | | | | | | 57,534 | | | | 203,670 | |
Total Specialty Retail | | | | | | | | | | | | | | | 5,374,817 | |
Textiles, Apparel & Luxury Goods — 1.0% | | | | | | | | | | | | | | | | |
Deckers Outdoor Corp. | | | | | | | | | | | 7,853 | | | | 630,203 | * |
Oxford Industries Inc. | | | | | | | | | | | 3,468 | | | | 260,759 | |
Perry Ellis International Inc. | | | | | | | | | | | 9,795 | | | | 245,267 | * |
Vera Bradley Inc. | | | | | | | | | | | 11,552 | | | | 140,704 | * |
Wolverine World Wide Inc. | | | | | | | | | | | 27,624 | | | | 880,653 | |
Total Textiles, Apparel & Luxury Goods | | | | | | | | | | | | | | | 2,157,586 | |
Total Consumer Discretionary | | | | | | | | | | | | | | | 32,500,331 | |
| Consumer Staples — 1.9% | | | | | | | | | | | | | | | | |
Food & Staples Retailing — 0.4% | | | | | | | | | | | | | | | | |
Andersons Inc. | | | | | | | | | | | 11,154 | | | | 347,447 | |
Ingles Markets Inc., Class A Shares | | | | | | | | | | | 3,127 | | | | 108,194 | |
SpartanNash Co. | | | | | | | | | | | 10,615 | | | | 283,209 | |
Total Food & Staples Retailing | | | | | | | | | | | | | | | 738,850 | |
See Notes to Financial Statements.
| | |
| 12 | | QS U.S. Small Capitalization Equity Fund 2017 Annual Report |
QS U.S. Small Capitalization Equity Fund
| | | | | | | | | | | | | | | | |
| Security | | | | | | | | Shares | | | Value | |
Food Products — 1.3% | | | | | | | | | | | | | | | | |
Dean Foods Co. | | | | | | | | | | | 57,795 | | | $ | 668,110 | |
Fresh Del Monte Produce Inc. | | | | | | | | | | | 13,466 | | | | 641,924 | |
Sanderson Farms Inc. | | | | | | | | | | | 12,023 | | | | 1,668,552 | |
Total Food Products | | | | | | | | | | | | | | | 2,978,586 | |
Personal Products — 0.2% | | | | | | | | | | | | | | | | |
Medifast Inc. | | | | | | | | | | | 7,277 | | | | 508,007 | |
Total Consumer Staples | | | | | | | | | | | | | | | 4,225,443 | |
| Energy — 3.3% | | | | | | | | | | | | | | | | |
Energy Equipment & Services — 1.1% | | | | | | | | | | | | | | | | |
Archrock Inc. | | | | | | | | | | | 17,914 | | | | 188,097 | |
Exterran Corp. | | | | | | | | | | | 18,078 | | | | 568,372 | * |
Mammoth Energy Services Inc. | | | | | | | | | | | 7,643 | | | | 150,032 | * |
Oil States International Inc. | | | | | | | | | | | 15,633 | | | | 442,414 | * |
Pioneer Energy Services Corp. | | | | | | | | | | | 86,393 | | | | 263,499 | * |
Superior Energy Services Inc. | | | | | | | | | | | 68,873 | | | | 663,247 | * |
Unit Corp. | | | | | | | | | | | 12,069 | | | | 265,518 | * |
Total Energy Equipment & Services | | | | | | | | | | | | | | | 2,541,179 | |
Oil, Gas & Consumable Fuels — 2.2% | | | | | | | | | | | | | | | | |
Abraxas Petroleum Corp. | | | | | | | | | | | 141,501 | | | | 348,093 | * |
Bonanza Creek Energy Inc. | | | | | | | | | | | 14,199 | | | | 391,750 | * |
Cloud Peak Energy Inc. | | | | | | | | | | | 62,447 | | | | 277,889 | * |
Delek U.S. Holdings Inc. | | | | | | | | | | | 40,046 | | | | 1,399,207 | |
Green Plains Inc. | | | | | | | | | | | 7,867 | | | | 132,559 | |
Matador Resources Co. | | | | | | | | | | | 19,624 | | | | 610,895 | * |
Peabody Energy Corp. | | | | | | | | | | | 14,163 | | | | 557,597 | * |
Renewable Energy Group Inc. | | | | | | | | | | | 7,815 | | | | 92,217 | * |
REX American Resources Corp. | | | | | | | | | | | 4,374 | | | | 362,124 | * |
Scorpio Tankers Inc. | | | | | | | | | | | 164,941 | | | | 503,070 | |
Stone Energy Corp. | | | | | | | | | | | 9,746 | | | | 313,431 | * |
Total Oil, Gas & Consumable Fuels | | | | | | | | | | | | | | | 4,988,832 | |
Total Energy | | | | | | | | | | | | | | | 7,530,011 | |
| Financials — 16.9% | | | | | | | | | | | | | | | | |
Banks — 8.4% | | | | | | | | | | | | | | | | |
Banc of California Inc. | | | | | | | | | | | 39,004 | | | | 805,433 | |
Bancorp Inc. | | | | | | | | | | | 28,071 | | | | 277,341 | * |
Berkshire Hills Bancorp Inc. | | | | | | | | | | | 11,701 | | | | 428,257 | |
Brookline Bancorp Inc. | | | | | | | | | | | 29,522 | | | | 463,495 | |
Cathay General Bancorp | | | | | | | | | | | 10,834 | | | | 456,870 | |
See Notes to Financial Statements.
| | |
| QS U.S. Small Capitalization Equity Fund 2017 Annual Report | | 13 |
Schedule of investments (cont’d)
December 31, 2017
QS U.S. Small Capitalization Equity Fund
| | | | | | | | | | | | | | | | |
| Security | | | | | | | | Shares | | | Value | |
Banks — continued | | | | | | | | | | | | | | | | |
Columbia Banking System Inc. | | | | | | | | | | | 24,524 | | | $ | 1,065,323 | |
Community Trust Bancorp Inc. | | | | | | | | | | | 5,122 | | | | 241,246 | |
Customers Bancorp Inc. | | | | | | | | | | | 17,448 | | | | 453,473 | * |
First Bancorp | | | | | | | | | | | 99,920 | | | | 509,592 | * |
First Commonwealth Financial Corp. | | | | | | | | | | | 32,646 | | | | 467,491 | |
First Financial Bancorp | | | | | | | | | | | 12,564 | | | | 331,061 | |
First Interstate BancSystem Inc., Class A Shares | | | | | | | | | | | 14,092 | | | | 564,385 | |
First Merchants Corp. | | | | | | | | | | | 25,598 | | | | 1,076,652 | |
First Midwest Bancorp Inc. | | | | | | | | | | | 35,692 | | | | 856,965 | |
Hancock Holding Co. | | | | | | | | | | | 11,253 | | | | 557,023 | |
Hanmi Financial Corp. | | | | | | | | | | | 36,708 | | | | 1,114,088 | |
Heartland Financial USA Inc. | | | | | | | | | | | 7,467 | | | | 400,604 | |
Hilltop Holdings Inc. | | | | | | | | | | | 28,482 | | | | 721,449 | |
Home BancShares Inc. | | | | | | | | | | | 33,635 | | | | 782,014 | |
IBERIABANK Corp. | | | | | | | | | | | 17,493 | | | | 1,355,707 | |
OFG Bancorp | | | | | | | | | | | 27,642 | | | | 259,835 | |
Opus Bank | | | | | | | | | | | 23,551 | | | | 642,942 | * |
Sandy Spring Bancorp Inc. | | | | | | | | | | | 5,042 | | | | 196,739 | |
Seacoast Banking Corp. | | | | | | | | | | | 13,794 | | | | 347,747 | * |
Triumph Bancorp Inc. | | | | | | | | | | | 3,700 | | | | 116,550 | * |
Union Bankshares Corp. | | | | | | | | | | | 7,015 | | | | 253,732 | |
United Community Banks Inc. | | | | | | | | | | | 43,076 | | | | 1,212,159 | |
Valley National Bancorp | | | | | | | | | | | 34,989 | | | | 392,577 | |
Western Alliance Bancorp | | | | | | | | | | | 23,827 | | | | 1,349,085 | * |
Wintrust Financial Corp. | | | | | | | | | | | 18,394 | | | | 1,515,114 | |
Total Banks | | | | | | | | | | | | | | | 19,214,949 | |
Capital Markets — 1.6% | | | | | | | | | | | | | | | | |
Cowen Inc. | | | | | | | | | | | 21,768 | | | | 297,133 | * |
Evercore Inc., Class A Shares | | | | | | | | | | | 15,079 | | | | 1,357,110 | |
International FCStone Inc. | | | | | | | | | | | 12,227 | | | | 520,015 | * |
Investment Technology Group Inc. | | | | | | | | | | | 4,848 | | | | 93,324 | |
Manning & Napier Inc. | | | | | | | | | | | 26,502 | | | | 95,407 | |
OM Asset Management PLC | | | | | | | | | | | 38,200 | | | | 639,850 | |
Piper Jaffray Cos. | | | | | | | | | | | 7,061 | | | | 609,011 | |
Total Capital Markets | | | | | | | | | | | | | | | 3,611,850 | |
Consumer Finance — 0.3% | | | | | | | | | | | | | | | | |
Consumer Portfolio Services Inc. | | | | | | | | | | | 15,173 | | | | 62,968 | * |
Enova International Inc. | | | | | | | | | | | 28,567 | | | | 434,218 | * |
See Notes to Financial Statements.
| | |
| 14 | | QS U.S. Small Capitalization Equity Fund 2017 Annual Report |
QS U.S. Small Capitalization Equity Fund
| | | | | | | | | | | | | | | | |
| Security | | | | | | | | Shares | | | Value | |
Consumer Finance — continued | | | | | | | | | | | | | | | | |
Nelnet Inc., Class A Shares | | | | | | | | | | | 2,527 | | | $ | 138,429 | |
Total Consumer Finance | | | | | | | | | | | | | | | 635,615 | |
Insurance — 2.1% | | | | | | | | | | | | | | | | |
American Equity Investment Life Holding Co. | | | | | | | | | | | 26,035 | | | | 800,056 | |
CNO Financial Group Inc. | | | | | | | | | | | 26,328 | | | | 650,038 | |
Employers Holdings Inc. | | | | | | | | | | | 6,985 | | | | 310,134 | |
Genworth Financial Inc., Class A Shares | | | | | | | | | | | 68,425 | | | | 212,802 | * |
HCI Group Inc. | | | | | | | | | | | 18,371 | | | | 549,293 | |
Heritage Insurance Holdings Inc. | | | | | | | | | | | 32,027 | | | | 577,126 | |
Infinity Property & Casualty Corp. | | | | | | | | | | | 1,680 | | | | 178,080 | |
Primerica Inc. | | | | | | | | | | | 4,071 | | | | 413,410 | |
United Fire Group Inc. | | | | | | | | | | | 8,362 | | | | 381,140 | |
Universal Insurance Holdings Inc. | | | | | | | | | | | 26,340 | | | | 720,399 | |
Total Insurance | | | | | | | | | | | | | | | 4,792,478 | |
Mortgage Real Estate Investment (REITs) — 0.6% | | | | | | | | | | | | | | | | |
Ladder Capital Corp. | | | | | | | | | | | 35,032 | | | | 477,486 | |
MTGE Investment Corp. | | | | | | | | | | | 17,259 | | | | 319,292 | |
Pennymac Mortgage Investment Trust | | | | | | | | | | | 34,558 | | | | 555,347 | |
Total Mortgage Real Estate Investment (REITs) | | | | | | | | | | | | | | | 1,352,125 | |
Thrifts & Mortgage Finance — 3.9% | | | | | | | | | | | | | | | | |
BofI Holding Inc. | | | | | | | | | | | 48,896 | | | | 1,461,990 | * |
Essent Group Ltd. | | | | | | | | | | | 35,836 | | | | 1,555,999 | * |
LendingTree Inc. | | | | | | | | | | | 4,265 | | | | 1,452,019 | * |
Meridian Bancorp Inc. | | | | | | | | | | | 11,180 | | | | 230,308 | |
Meta Financial Group Inc. | | | | | | | | | | | 5,510 | | | | 510,502 | |
MGIC Investment Corp. | | | | | | | | | | | 132,022 | | | | 1,862,831 | * |
NMI Holdings Inc., Class A Shares | | | | | | | | | | | 27,539 | | | | 468,163 | * |
PennyMac Financial Services Inc., Class A Shares | | | | | | | | | | | 12,383 | | | | 276,760 | * |
Radian Group Inc. | | | | | | | | | | | 52,518 | | | | 1,082,396 | |
Total Thrifts & Mortgage Finance | | | | | | | | | | | | | | | 8,900,968 | |
Total Financials | | | | | | | | | | | | | | | 38,507,985 | |
| Health Care — 13.3% | | | | | | | | | | | | | | | | |
Biotechnology — 4.9% | | | | | | | | | | | | | | | | |
Achillion Pharmaceuticals Inc. | | | | | | | | | | | 89,796 | | | | 258,612 | * |
Acorda Therapeutics Inc. | | | | | | | | | | | 21,148 | | | | 453,625 | * |
AMAG Pharmaceuticals Inc. | | | | | | | | | | | 19,712 | | | | 261,184 | * |
Amicus Therapeutics Inc. | | | | | | | | | | | 27,466 | | | | 395,236 | * |
Aptevo Therapeutics Inc. | | | | | | | | | | | 13,113 | | | | 55,599 | * |
See Notes to Financial Statements.
| | |
| QS U.S. Small Capitalization Equity Fund 2017 Annual Report | | 15 |
Schedule of investments (cont’d)
December 31, 2017
QS U.S. Small Capitalization Equity Fund
| | | | | | | | | | | | | | | | |
| Security | | | | | | | | Shares | | | Value | |
Biotechnology — continued | | | | | | | | | | | | | | | | |
Arena Pharmaceuticals Inc. | | | | | | | | | | | 5,471 | | | $ | 185,850 | * |
Celldex Therapeutics Inc. | | | | | | | | | | | 77,587 | | | | 220,347 | * |
Chimerix Inc. | | | | | | | | | | | 40,401 | | | | 187,057 | * |
Conatus Pharmaceuticals Inc. | | | | | | | | | | | 21,766 | | | | 100,559 | * |
Concert Pharmaceuticals Inc. | | | | | | | | | | | 16,497 | | | | 426,777 | * |
Dyax Corp., Contingent Value Rights | | | | | | | | | | | 52,895 | | | | 0 | (a)(b)(c) |
Eagle Pharmaceuticals Inc. | | | | | | | | | | | 8,195 | | | | 437,777 | * |
Emergent BioSolutions Inc. | | | | | | | | | | | 20,581 | | | | 956,399 | * |
Enanta Pharmaceuticals Inc. | | | | | | | | | | | 13,882 | | | | 814,596 | * |
Epizyme Inc. | | | | | | | | | | | 16,099 | | | | 202,042 | * |
Geron Corp. | | | | | | | | | | | 146,028 | | | | 262,850 | * |
Halozyme Therapeutics Inc. | | | | | | | | | | | 16,732 | | | | 338,990 | * |
Infinity Pharmaceuticals Inc. | | | | | | | | | | | 30,551 | | | | 62,019 | * |
Insmed Inc. | | | | | | | | | | | 13,017 | | | | 405,870 | * |
Insys Therapeutics Inc. | | | | | | | | | | | 31,827 | | | | 306,176 | * |
MiMedx Group Inc. | | | | | | | | | | | 61,192 | | | | 771,631 | * |
Momenta Pharmaceuticals Inc. | | | | | | | | | | | 34,600 | | | | 482,670 | * |
NewLink Genetics Corp. | | | | | | | | | | | 24,740 | | | | 200,641 | * |
Osiris Therapeutics Inc. | | | | | | | | | | | 23,754 | | | | 142,524 | * |
Peregrine Pharmaceuticals Inc. | | | | | | | | | | | 12,641 | | | | 49,047 | * |
PTC Therapeutics Inc. | | | | | | | | | | | 43,442 | | | | 724,613 | * |
Repligen Corp. | | | | | | | | | | | 28,660 | | | | 1,039,785 | * |
Sangamo Therapeutics Inc. | | | | | | | | | | | 25,608 | | | | 419,971 | * |
Trevena Inc. | | | | | | | | | | | 31,141 | | | | 49,826 | * |
Vanda Pharmaceuticals Inc. | | | | | | | | | | | 60,139 | | | | 914,113 | * |
Total Biotechnology | | | | | | | | | | | | | | | 11,126,386 | |
Health Care Equipment & Supplies — 3.5% | | | | | | | | | | | | | | | | |
Analogic Corp. | | | | | | | | | | | 5,220 | | | | 437,175 | |
AngioDynamics Inc. | | | | | | | | | | | 8,021 | | | | 133,389 | * |
Cardiovascular Systems Inc. | | | | | | | | | | | 17,604 | | | | 417,039 | * |
Halyard Health Inc. | | | | | | | | | | | 13,559 | | | | 626,155 | * |
Heska Corp. | | | | | | | | | | | 5,270 | | | | 422,707 | * |
ICU Medical Inc. | | | | | | | | | | | 4,935 | | | | 1,065,960 | * |
Lantheus Holdings Inc. | | | | | | | | | | | 30,054 | | | | 614,604 | * |
Masimo Corp. | | | | | | | | | | | 5,383 | | | | 456,478 | * |
Merit Medical Systems Inc. | | | | | | | | | | | 26,300 | | | | 1,136,160 | * |
Natus Medical Inc. | | | | | | | | | | | 16,774 | | | | 640,767 | * |
NuVasive Inc. | | | | | | | | | | | 7,364 | | | | 430,720 | * |
See Notes to Financial Statements.
| | |
| 16 | | QS U.S. Small Capitalization Equity Fund 2017 Annual Report |
QS U.S. Small Capitalization Equity Fund
| | | | | | | | | | | | | | | | |
| Security | | | | | | | | Shares | | | Value | |
Health Care Equipment & Supplies — continued | | | | | | | | | | | | | | | | |
NxStage Medical Inc. | | | | | | | | | | | 18,791 | | | $ | 455,306 | * |
OraSure Technologies Inc. | | | | | | | | | | | 38,026 | | | | 717,170 | * |
Orthofix International NV | | | | | | | | | | | 7,041 | | | | 385,143 | * |
Total Health Care Equipment & Supplies | | | | | | | | | | | | | | | 7,938,773 | |
Health Care Providers & Services — 1.7% | | | | | | | | | | | | | | | | |
Ensign Group Inc. | | | | | | | | | | | 14,209 | | | | 315,440 | |
LifePoint Health Inc. | | | | | | | | | | | 5,130 | | | | 255,474 | * |
Magellan Health Inc. | | | | | | | | | | | 17,923 | | | | 1,730,466 | * |
Molina Healthcare Inc. | | | | | | | | | | | 21,393 | | | | 1,640,415 | * |
Total Health Care Providers & Services | | | | | | | | | | | | | | | 3,941,795 | |
Health Care Technology — 0.3% | | | | | | | | | | | | | | | | |
Cotiviti Holdings Inc. | | | | | | | | | | | 24,008 | | | | 773,298 | * |
Life Sciences Tools & Services — 1.1% | | | | | | | | | | | | | | | | |
Cambrex Corp. | | | | | | | | | | | 11,329 | | | | 543,792 | * |
INC Research Holdings Inc., Class A Shares | | | | | | | | | | | 16,391 | | | | 714,647 | * |
Luminex Corp. | | | | | | | | | | | 8,014 | | | | 157,876 | |
PRA Health Sciences Inc. | | | | | | | | | | | 11,443 | | | | 1,042,114 | * |
Total Life Sciences Tools & Services | | | | | | | | | | | | | | | 2,458,429 | |
Pharmaceuticals — 1.8% | | | | | | | | | | | | | | | | |
Amphastar Pharmaceuticals Inc. | | | | | | | | | | | 14,818 | | | | 285,098 | * |
Catalent Inc. | | | | | | | | | | | 22,018 | | | | 904,500 | * |
Corcept Therapeutics Inc. | | | | | | | | | | | 34,750 | | | | 627,585 | * |
Horizon Pharma PLC | | | | | | | | | | | 32,782 | | | | 478,617 | * |
Innoviva Inc. | | | | | | | | | | | 27,020 | | | | 383,414 | * |
Intersect ENT Inc. | | | | | | | | | | | 12,302 | | | | 398,585 | * |
Revance Therapeutics Inc. | | | | | | | | | | | 12,567 | | | | 449,270 | * |
Sucampo Pharmaceuticals Inc., Class A Shares | | | | | | | | | | | 20,397 | | | | 366,126 | * |
Supernus Pharmaceuticals Inc. | | | | | | | | | | | 5,246 | | | | 209,053 | * |
Total Pharmaceuticals | | | | | | | | | | | | | | | 4,102,248 | |
Total Health Care | | | | | | | | | | | | | | | 30,340,929 | |
| Industrials — 14.8% | | | | | | | | | | | | | | | | |
Aerospace & Defense — 0.8% | | | | | | | | | | | | | | | | |
AAR Corp. | | | | | | | | | | | 11,675 | | | | 458,711 | |
Curtiss-Wright Corp. | | | | | | | | | | | 8,033 | | | | 978,821 | |
Moog Inc., Class A Shares | | | | | | | | | | | 3,910 | | | | 339,583 | * |
Total Aerospace & Defense | | | | | | | | | | | | | | | 1,777,115 | |
Air Freight & Logistics — 0.0% | | | | | | | | | | | | | | | | |
Forward Air Corp. | | | | | | | | | | | 1,926 | | | | 110,629 | |
See Notes to Financial Statements.
| | |
| QS U.S. Small Capitalization Equity Fund 2017 Annual Report | | 17 |
Schedule of investments (cont’d)
December 31, 2017
QS U.S. Small Capitalization Equity Fund
| | | | | | | | | | | | | | | | |
| Security | | | | | | | | Shares | | | Value | |
Airlines — 0.3% | | | | | | | | | | | | | | | | |
Hawaiian Holdings Inc. | | | | | | | | | | | 19,960 | | | $ | 795,406 | |
Building Products — 1.7% | | | | | | | | | | | | | | | | |
Builders FirstSource Inc. | | | | | | | | | | | 51,643 | | | | 1,125,301 | * |
Continental Building Products Inc. | | | | | | | | | | | 16,233 | | | | 456,959 | * |
NCI Building Systems Inc. | | | | | | | | | | | 23,540 | | | | 454,322 | * |
Patrick Industries Inc. | | | | | | | | | | | 14,680 | | | | 1,019,526 | * |
Universal Forest Products Inc. | | | | | | | | | | | 20,079 | | | | 755,372 | |
Total Building Products | | | | | | | | | | | | | | | 3,811,480 | |
Commercial Services & Supplies — 3.9% | | | | | | | | | | | | | | | | |
ACCO Brands Corp. | | | | | | | | | | | 34,230 | | | | 417,606 | * |
Brink’s Co. | | | | | | | | | | | 16,173 | | | | 1,272,815 | |
Deluxe Corp. | | | | | | | | | | | 12,991 | | | | 998,228 | |
Ennis Inc. | | | | | | | | | | | 13,439 | | | | 278,859 | |
Essendant Inc. | | | | | | | | | | | 26,722 | | | | 247,713 | |
Herman Miller Inc. | | | | | | | | | | | 23,822 | | | | 954,071 | |
Interface Inc. | | | | | | | | | | | 40,583 | | | | 1,020,663 | |
Knoll Inc. | | | | | | | | | | | 31,154 | | | | 717,788 | |
Quad Graphics Inc. | | | | | | | | | | | 21,061 | | | | 475,979 | |
R.R. Donnelley & Sons Co. | | | | | | | | | | | 75,709 | | | | 704,094 | |
Steelcase Inc., Class A Shares | | | | | | | | | | | 66,329 | | | | 1,008,201 | |
Tetra Technology Inc. | | | | | | | | | | | 17,409 | | | | 838,243 | |
Total Commercial Services & Supplies | | | | | | | | | | | | | | | 8,934,260 | |
Construction & Engineering — 2.4% | | | | | | | | | | | | | | | | |
Argan Inc. | | | | | | | | | | | 12,693 | | | | 571,185 | |
Comfort Systems USA Inc. | | | | | | | | | | | 17,357 | | | | 757,633 | |
Dycom Industries Inc. | | | | | | | | | | | 9,135 | | | | 1,017,913 | * |
EMCOR Group Inc. | | | | | | | | | | | 19,781 | | | | 1,617,097 | |
KBR Inc. | | | | | | | | | | | 24,169 | | | | 479,271 | |
MYR Group Inc. | | | | | | | | | | | 9,439 | | | | 337,256 | * |
Orion Group Holdings Inc. | | | | | | | | | | | 8,451 | | | | 66,171 | * |
Primoris Services Corp. | | | | | | | | | | | 19,751 | | | | 537,030 | |
Total Construction & Engineering | | | | | | | | | | | | | | | 5,383,556 | |
Electrical Equipment — 0.3% | | | | | | | | | | | | | | | | |
Generac Holdings Inc. | | | | | | | | | | | 14,343 | | | | 710,265 | * |
Machinery — 1.9% | | | | | | | | | | | | | | | | |
Alamo Group Inc. | | | | | | | | | | | 1,677 | | | | 189,283 | |
Briggs & Stratton Corp. | | | | | | | | | | | 1,117 | | | | 28,338 | |
Federal Signal Corp. | | | | | | | | | | | 30,580 | | | | 614,352 | |
See Notes to Financial Statements.
| | |
| 18 | | QS U.S. Small Capitalization Equity Fund 2017 Annual Report |
QS U.S. Small Capitalization Equity Fund
| | | | | | | | | | | | | | | | |
| Security | | | | | | | | Shares | | | Value | |
Machinery — continued | | | | | | | | | | | | | | | | |
Global Brass & Copper Holdings Inc. | | | | | | | | | | | 16,807 | | | $ | 556,312 | |
Harsco Corp. | | | | | | | | | | | 40,463 | | | | 754,635 | * |
Meritor Inc. | | | | | | | | | | | 8,270 | | | | 194,014 | * |
Mueller Water Products Inc., Class A Shares | | | | | | | | | | | 19,837 | | | | 248,558 | |
SPX Corp. | | | | | | | | | | | 6,820 | | | | 214,080 | * |
Wabash National Corp. | | | | | | | | | | | 65,724 | | | | 1,426,211 | |
Total Machinery | | | | | | | | | | | | | | | 4,225,783 | |
Professional Services — 1.4% | | | | | | | | | | | | | | | | |
Barrett Business Services Inc. | | | | | | | | | | | 5,181 | | | | 334,123 | |
Insperity Inc. | | | | | | | | | | | 27,490 | | | | 1,576,551 | |
Kelly Services Inc., Class A Shares | | | | | | | | | | | 7,310 | | | | 199,344 | |
Navigant Consulting Inc. | | | | | | | | | | | 21,566 | | | | 418,596 | * |
TrueBlue Inc. | | | | | | | | | | | 19,949 | | | | 548,598 | * |
Total Professional Services | | | | | | | | | | | | | | | 3,077,212 | |
Road & Rail — 1.3% | | | | | | | | | | | | | | | | |
Knight-Swift Transportation Holdings Inc. | | | | | | | | | | | 26,180 | | | | 1,144,590 | |
Saia Inc. | | | | | | | | | | | 8,734 | | | | 617,930 | * |
Werner Enterprises Inc. | | | | | | | | | | | 32,060 | | | | 1,239,119 | |
Total Road & Rail | | | | | | | | | | | | | | | 3,001,639 | |
Trading Companies & Distributors — 0.8% | | | | | | | | | | | | | | | | |
Aircastle Ltd. | | | | | | | | | | | 33,679 | | | | 787,752 | |
CAI International Inc. | | | | | | | | | | | 19,539 | | | | 553,344 | * |
Rush Enterprises Inc., Class A Shares | | | | | | | | | | | 9,737 | | | | 494,737 | * |
Total Trading Companies & Distributors | | | | | | | | | | | | | | | 1,835,833 | |
Total Industrials | | | | | | | | | | | | | | | 33,663,178 | |
| Information Technology — 17.2% | | | | | | | | | | | | | | | | |
Communications Equipment — 1.5% | | | | | | | | | | | | | | | | |
ADTRAN Inc. | | | | | | | | | | | 22,084 | | | | 427,326 | |
Aerohive Networks Inc. | | | | | | | | | | | 15,419 | | | | 89,893 | * |
Black Box Corp. | | | | | | | | | | | 7,731 | | | | 27,445 | |
Ciena Corp. | | | | | | | | | | | 24,253 | | | | 507,615 | * |
Finisar Corp. | | | | | | | | | | | 27,449 | | | | 558,587 | * |
NETGEAR Inc. | | | | | | | | | | | 13,038 | | | | 765,983 | * |
Plantronics Inc. | | | | | | | | | | | 10,640 | | | | 536,043 | |
Viavi Solutions Inc. | | | | | | | | | | | 68,477 | | | | 598,489 | * |
Total Communications Equipment | | | | | | | | | | | | | | | 3,511,381 | |
Electronic Equipment, Instruments & Components — 3.4% | | | | | | | | | | | | | | | | |
Belden Inc. | | | | | | | | | | | 7,827 | | | | 604,010 | |
See Notes to Financial Statements.
| | |
| QS U.S. Small Capitalization Equity Fund 2017 Annual Report | | 19 |
Schedule of investments (cont’d)
December 31, 2017
QS U.S. Small Capitalization Equity Fund
| | | | | | | | | | | | | | | | |
| Security | | | | | | | | Shares | | | Value | |
Electronic Equipment, Instruments & Components — continued | | | | | | | | | | | | | | | | |
Benchmark Electronics Inc. | | | | | | | | | | | 41,029 | | | $ | 1,193,944 | * |
Electro Scientific Industries Inc. | | | | | | | | | | | 9,569 | | | | 205,064 | * |
Insight Enterprises Inc. | | | | | | | | | | | 17,430 | | | | 667,395 | * |
Methode Electronics Inc. | | | | | | | | | | | 21,955 | | | | 880,395 | |
Plexus Corp. | | | | | | | | | | | 17,199 | | | | 1,044,323 | * |
Sanmina Corp. | | | | | | | | | | | 35,613 | | | | 1,175,229 | * |
ScanSource Inc. | | | | | | | | | | | 7,438 | | | | 266,280 | * |
Tech Data Corp. | | | | | | | | | | | 14,239 | | | | 1,394,995 | * |
VeriFone Systems Inc. | | | | | | | | | | | 12,579 | | | | 222,774 | * |
Total Electronic Equipment, Instruments & Components | | | | | | | | | | | | | | | 7,654,409 | |
Internet Software & Services — 2.9% | | | | | | | | | | | | | | | | |
Blucora Inc. | | | | | | | | | | | 5,067 | | | | 111,981 | * |
Box Inc., Class A Shares | | | | | | | | | | | 62,243 | | | | 1,314,572 | * |
Carbonite Inc. | | | | | | | | | | | 18,323 | | | | 459,907 | * |
Etsy Inc. | | | | | | | | | | | 40,418 | | | | 826,548 | * |
Hortonworks Inc. | | | | | | | | | | | 61,598 | | | | 1,238,736 | * |
j2 Global Inc. | | | | | | | | | | | 10,365 | | | | 777,686 | |
New Relic Inc. | | | | | | | | | | | 9,918 | | | | 572,963 | * |
NIC Inc. | | | | | | | | | | | 35,577 | | | | 590,578 | |
Okta Inc. | | | | | | | | | | | 12,016 | | | | 307,730 | * |
Yelp Inc. | | | | | | | | | | | 9,477 | | | | 397,655 | * |
Total Internet Software & Services | | | | | | | | | | | | | | | 6,598,356 | |
IT Services — 1.8% | | | | | | | | | | | | | | | | |
CACI International Inc., Class A Shares | | | | | | | | | | | 5,709 | | | | 755,586 | * |
Convergys Corp. | | | | | | | | | | | 30,162 | | | | 708,807 | |
Everi Holdings Inc. | | | | | | | | | | | 64,164 | | | | 483,797 | * |
EVERTEC Inc. | | | | | | | | | | | 18,553 | | | | 253,249 | |
Hackett Group Inc. | | | | | | | | | | | 15,572 | | | | 244,636 | |
Science Applications International Corp. | | | | | | | | | | | 12,206 | | | | 934,613 | |
Travelport Worldwide Ltd. | | | | | | | | | | | 40,319 | | | | 526,969 | |
Unisys Corp. | | | | | | | | | | | 34,598 | | | | 281,974 | * |
Total IT Services | | | | | | | | | | | | | | | 4,189,631 | |
Semiconductors & Semiconductor Equipment — 3.4% | | | | | | | | | | | | | | | | |
Amkor Technology Inc. | | | | | | | | | | | 57,937 | | | | 582,267 | * |
Axcelis Technologies Inc. | | | | | | | | | | | 22,290 | | | | 639,723 | * |
Brooks Automation Inc. | | | | | | | | | | | 11,119 | | | | 265,188 | |
Cirrus Logic Inc. | | | | | | | | | | | 22,619 | | | | 1,173,021 | * |
Cohu Inc. | | | | | | | | | | | 15,960 | | | | 350,322 | |
See Notes to Financial Statements.
| | |
| 20 | | QS U.S. Small Capitalization Equity Fund 2017 Annual Report |
QS U.S. Small Capitalization Equity Fund
| | | | | | | | | | | | | | | | |
| Security | | | | | | | | Shares | | | Value | |
Semiconductors & Semiconductor Equipment — continued | | | | | | | | | | | | | | | | |
Diodes Inc. | | | | | | | | | | | 18,761 | | | $ | 537,878 | * |
FormFactor Inc. | | | | | | | | | | | 25,611 | | | | 400,812 | * |
Integrated Device Technology Inc. | | | | | | | | | | | 7,720 | | | | 229,516 | * |
MaxLinear Inc. | | | | | | | | | | | 34,480 | | | | 910,962 | * |
Power Integrations Inc. | | | | | | | | | | | 4,360 | | | | 320,678 | |
Rudolph Technologies Inc. | | | | | | | | | | | 13,180 | | | | 315,002 | * |
Semtech Corp. | | | | | | | | | | | 24,577 | | | | 840,533 | * |
Silicon Laboratories Inc. | | | | | | | | | | | 10,945 | | | | 966,443 | * |
Xcerra Corp. | | | | | | | | | | | 21,306 | | | | 208,586 | * |
Total Semiconductors & Semiconductor Equipment | | | | | | | | | | | | | | | 7,740,931 | |
Software — 3.9% | | | | | | | | | | | | | | | | |
A10 Networks Inc. | | | | | | | | | | | 25,806 | | | | 199,222 | * |
Barracuda Networks Inc. | | | | | | | | | | | 25,026 | | | | 688,215 | * |
Bottomline Technologies (de) Inc. | | | | | | | | | | | 6,610 | | | | 229,235 | * |
CommVault Systems Inc. | | | | | | | | | | | 7,485 | | | | 392,963 | * |
Fair Isaac Corp. | | | | | | | | | | | 8,335 | | | | 1,276,922 | |
Imperva Inc. | | | | | | | | | | | 15,173 | | | | 602,368 | * |
Manhattan Associates Inc. | | | | | | | | | | | 22,634 | | | | 1,121,288 | * |
MicroStrategy Inc., Class A Shares | | | | | | | | | | | 5,212 | | | | 684,336 | * |
Pegasystems Inc. | | | | | | | | | | | 9,207 | | | | 434,110 | |
Progress Software Corp. | | | | | | | | | | | 28,067 | | | | 1,194,812 | |
Rubicon Project Inc. | | | | | | | | | | | 26,168 | | | | 48,934 | * |
TiVo Corp. | | | | | | | | | | | 32,734 | | | | 510,651 | |
Varonis Systems Inc. | | | | | | | | | | | 4,033 | | | | 195,802 | * |
VASCO Data Security International Inc. | | | | | | | | | | | 23,706 | | | | 329,513 | * |
Verint Systems Inc. | | | | | | | | | | | 23,732 | | | | 993,184 | * |
Total Software | | | | | | | | | | | | | | | 8,901,555 | |
Technology Hardware, Storage & Peripherals — 0.3% | | | | | | | | | | | | | | | | |
Intevac Inc. | | | | | | | | | | | 12,339 | | | | 84,522 | * |
Super Micro Computer Inc. | | | | | | | | | | | 23,051 | | | | 482,342 | * |
Total Technology Hardware, Storage & Peripherals | | | | | | | | | | | | | | | 566,864 | |
Total Information Technology | | | | | | | | | | | | | | | 39,163,127 | |
| Materials — 4.1% | | | | | | | | | | | | | | | | |
Chemicals — 2.4% | | | | | | | | | | | | | | | | |
A. Schulman Inc. | | | | | | | | | | | 19,282 | | | | 718,255 | |
Chemours Co. | | | | | | | | | | | 22,797 | | | | 1,141,218 | |
Innophos Holdings Inc. | | | | | | | | | | | 8,502 | | | | 397,298 | |
Koppers Holdings Inc. | | | | | | | | | | | 12,843 | | | | 653,709 | * |
See Notes to Financial Statements.
| | |
| QS U.S. Small Capitalization Equity Fund 2017 Annual Report | | 21 |
Schedule of investments (cont’d)
December 31, 2017
QS U.S. Small Capitalization Equity Fund
| | | | | | | | | | | | | | | | |
| Security | | | | | | | | Shares | | | Value | |
Chemicals — continued | | | | | | | | | | | | | | | | |
Rayonier Advanced Materials Inc. | | | | | | | | | | | 25,549 | | | $ | 522,477 | |
Trinseo SA | | | | | | | | | | | 15,649 | | | | 1,136,117 | |
Tronox Ltd., Class A Shares | | | | | | | | | | | 44,037 | | | | 903,199 | |
Total Chemicals | | | | | | | | | | | | | | | 5,472,273 | |
Metals & Mining — 0.7% | | | | | | | | | | | | | | | | |
Coeur Mining Inc. | | | | | | | | | | | 56,741 | | | | 425,557 | * |
Commercial Metals Co. | | | | | | | | | | | 25,389 | | | | 541,293 | |
Hecla Mining Co. | | | | | | | | | | | 86,013 | | | | 341,472 | |
TimkenSteel Corp. | | | | | | | | | | | 14,931 | | | | 226,802 | * |
Total Metals & Mining | | | | | | | | | | | | | | | 1,535,124 | |
Paper & Forest Products — 1.0% | | | | | | | | | | | | | | | | |
Boise Cascade Co. | | | | | | | | | | | 22,636 | | | | 903,176 | |
KapStone Paper and Packaging Corp. | | | | | | | | | | | 58,734 | | | | 1,332,675 | |
Total Paper & Forest Products | | | | | | | | | | | | | | | 2,235,851 | |
Total Materials | | | | | | | | | | | | | | | 9,243,248 | |
| Real Estate — 7.2% | | | | | | | | | | | | | | | | |
Equity Real Estate Investment Trusts (REITs) — 6.4% | | | | | | | | | | | | | | | | |
Ashford Hospitality Prime Inc. | | | | | | | | | | | 13,711 | | | | 133,408 | |
Ashford Hospitality Trust Inc. | | | | | | | | | | | 92,459 | | | | 622,249 | |
CBL & Associates Properties Inc. | | | | | | | | | | | 47,347 | | | | 267,984 | |
Chatham Lodging Trust | | | | | | | | | | | 19,471 | | | | 443,160 | |
DiamondRock Hospitality Co. | | | | | | | | | | | 98,311 | | | | 1,109,931 | |
First Industrial Realty Trust Inc. | | | | | | | | | | | 19,074 | | | | 600,259 | |
GEO Group Inc. | | | | | | | | | | | 10,198 | | | | 240,673 | |
Hersha Hospitality Trust | | | | | | | | | | | 37,101 | | | | 645,557 | |
InfraREIT Inc. | | | | | | | | | | | 16,289 | | | | 302,650 | * |
LaSalle Hotel Properties | | | | | | | | | | | 35,921 | | | | 1,008,303 | |
Lexington Realty Trust | | | | | | | | | | | 96,128 | | | | 927,635 | |
Pebblebrook Hotel Trust | | | | | | | | | | | 12,119 | | | | 450,463 | |
Potlatch Corp. | | | | | | | | | | | 25,506 | | | | 1,272,749 | |
Ramco-Gershenson Properties Trust | | | | | | | | | | | 31,461 | | | | 463,421 | |
RLJ Lodging Trust | | | | | | | | | | | 86,686 | | | | 1,904,491 | |
Ryman Hospitality Properties Inc. | | | | | | | | | | | 9,624 | | | | 664,249 | |
Summit Hotel Properties Inc. | | | | | | | | | | | 49,418 | | | | 752,636 | |
Sunstone Hotel Investors Inc. | | | | | | | | | | | 79,219 | | | | 1,309,490 | |
Washington Prime Group Inc. | | | | | | | | | | | 61,572 | | | | 438,393 | |
Xenia Hotels & Resorts Inc. | | | | | | | | | | | 42,536 | | | | 918,352 | |
Total Equity Real Estate Investment Trusts (REITs) | | | | | | | | | | | | | | | 14,476,053 | |
See Notes to Financial Statements.
| | |
| 22 | | QS U.S. Small Capitalization Equity Fund 2017 Annual Report |
QS U.S. Small Capitalization Equity Fund
| | | | | | | | | | | | | | | | |
| Security | | | | | | | | Shares | | | Value | |
Real Estate Management & Development — 0.8% | | | | | | | | | | | | | | | | |
Forestar Group Inc. | | | | | | | | | | | 9,271 | | | $ | 203,962 | * |
HFF Inc., Class A Shares | | | | | | | | | | | 19,401 | | | | 943,665 | |
Marcus & Millichap Inc. | | | | | | | | | | | 14,039 | | | | 457,812 | * |
RE/MAX Holdings Inc., Class A Shares | | | | | | | | | | | 5,050 | | | | 244,925 | |
Total Real Estate Management & Development | | | | | | | | | | | | | | | 1,850,364 | |
Total Real Estate | | | | | | | | | | | | | | | 16,326,417 | |
| Telecommunication Services — 0.8% | | | | | | | | | | | | | | | | |
Diversified Telecommunication Services — 0.5% | | | | | | | | | | | | | | | | |
Cogent Communications Holdings Inc. | | | | | | | | | | | 22,337 | | | | 1,011,866 | |
Frontier Communications Corp. | | | | | | | | | | | 32,485 | | | | 219,599 | |
Total Diversified Telecommunication Services | | | | | | | | | | | | | | | 1,231,465 | |
Wireless Telecommunication Services — 0.3% | | | | | | | | | | | | | | | | |
Boingo Wireless Inc. | | | | | | | | | | | 28,963 | | | | 651,667 | * |
Total Telecommunication Services | | | | | | | | | | | | | | | 1,883,132 | |
| Utilities — 3.8% | | | | | | | | | | | | | | | | |
Electric Utilities — 1.8% | | | | | | | | | | | | | | | | |
ALLETE Inc. | | | | | | | | | | | 13,702 | | | | 1,018,881 | |
El Paso Electric Co. | | | | | | | | | | | 8,659 | | | | 479,275 | |
IDACORP Inc. | | | | | | | | | | | 4,708 | | | | 430,123 | |
PNM Resources Inc. | | | | | | | | | | | 32,986 | | | | 1,334,284 | |
Portland General Electric Co. | | | | | | | | | | | 16,393 | | | | 747,193 | |
Total Electric Utilities | | | | | | | | | | | | | | | 4,009,756 | |
Gas Utilities — 1.3% | | | | | | | | | | | | | | | | |
New Jersey Resources Corp. | | | | | | | | | | | 17,729 | | | | 712,706 | |
Northwest Natural Gas Co. | | | | | | | | | | | 6,302 | | | | 375,914 | |
ONE Gas Inc. | | | | | | | | | | | 12,079 | | | | 884,908 | |
Southwest Gas Holdings Inc. | | | | | | | | | | | 13,677 | | | | 1,100,725 | |
Total Gas Utilities | | | | | | | | | | | | | | | 3,074,253 | |
Independent Power and Renewable Electricity Producers — 0.6% | | | | | | | | | | | | | | | | |
Dynegy Inc. | | | | | | | | | | | 64,774 | | | | 767,572 | * |
NRG Yield Inc., Class C Shares | | | | | | | | | | | 7,983 | | | | 150,879 | |
Pattern Energy Group Inc. | | | | | | | | | | | 20,405 | | | | 438,503 | |
Total Independent Power and Renewable Electricity Producers | | | | | | | | | | | | | | | 1,356,954 | |
Multi-Utilities — 0.1% | | | | | | | | | | | | | | | | |
Unitil Corp. | | | | | | | | | | | 3,041 | | | | 138,730 | |
Total Utilities | | | | | | | | | | | | | | | 8,579,693 | |
Total Investments before Short-Term Investments (Cost — $189,861,628) | | | | | | | | 221,963,494 | |
See Notes to Financial Statements.
| | |
| QS U.S. Small Capitalization Equity Fund 2017 Annual Report | | 23 |
Schedule of investments (cont’d)
December 31, 2017
QS U.S. Small Capitalization Equity Fund
| | | | | | | | | | | | | | | | |
| Security | | Rate | | | | | | Shares | | | Value | |
| Short-Term Investments — 2.4% | | | | | | | | | | | | | | | | |
State Street Institutional U.S. Government Money Market Fund, Premier Class (Cost — $5,374,117) | | | 1.219 | % | | | | | | | 5,374,117 | | | $ | 5,374,117 | |
Total Investments — 100.0% (Cost — $195,235,745) | | | | | | | | | | | | | | | 227,337,611 | |
Other Assets in Excess of Liabilities — 0.0% | | | | | | | | | | | | | | | 73,488 | |
Total Net Assets — 100.0% | | | | | | | | | | | | | | $ | 227,411,099 | |
| * | Non-income producing security. |
| (a) | Value is less than $1. |
| (b) | Security is valued in good faith in accordance with procedures approved by the Board of Trustees (See Note 1). |
| (c) | Security is valued using significant unobservable inputs (See Note 1). |
See Notes to Financial Statements.
| | |
| 24 | | QS U.S. Small Capitalization Equity Fund 2017 Annual Report |
Statement of assets and liabilities
December 31, 2017
| | | | |
|
| Assets: | |
Investments, at value (Cost — $195,235,745) | | $ | 227,337,611 | |
Dividends and interest receivable | | | 320,917 | |
Receivable for Fund shares sold | | | 77,489 | |
Prepaid expenses | | | 34,619 | |
Other assets | | | 132,099 | |
Total Assets | | | 227,902,735 | |
|
| Liabilities: | |
Trustees’ fees payable | | | 136,908 | |
Investment management fee payable | | | 119,433 | |
Payable for Fund shares repurchased | | | 67,466 | |
Service and/or distribution fees payable | | | 16,552 | |
Accrued expenses | | | 151,277 | |
Total Liabilities | | | 491,636 | |
| Total Net Assets | | $ | 227,411,099 | |
|
| Net Assets: | |
Par value (Note 7) | | $ | 168 | |
Paid-in capital in excess of par value | | | 195,896,512 | |
Overdistributed net investment income | | | (294,283) | |
Accumulated net realized loss on investments | | | (293,164) | |
Net unrealized appreciation on investments | | | 32,101,866 | |
| Total Net Assets | | $ | 227,411,099 | |
See Notes to Financial Statements.
| | |
| QS U.S. Small Capitalization Equity Fund 2017 Annual Report | | 25 |
Statement of assets and liabilities (cont’d)
December 31, 2017
| | | | |
|
| Net Assets: | |
Class A | | | $18,601,899 | |
Class A2 | | | $38,534,090 | |
Class C | | | $5,109,811 | |
Class FI | | | $215,804 | |
Class I | | | $22,847,444 | |
Class IS | | | $142,102,051 | |
|
| Shares Outstanding: | |
Class A | | | 1,372,507 | |
Class A2 | | | 2,877,866 | |
Class C | | | 403,551 | |
Class FI | | | 16,654 | |
Class I | | | 1,650,418 | |
Class IS | | | 10,498,724 | |
|
| Net Asset Value: | |
Class A (and redemption price) | | | $13.55 | |
Class A2 (and redemption price) | | | $13.39 | |
Class C* | | | $12.66 | |
Class FI (and redemption price) | | | $12.96 | |
Class I (and redemption price) | | | $13.84 | |
Class IS (and redemption price) | | | $13.54 | |
| Maximum Public Offering Price Per Share: | |
Class A (based on maximum initial sales charge of 5.75%) | | | $14.38 | |
Class A2 (based on maximum initial sales charge of 5.75%) | | | $14.21 | |
| * | Redemption price per share is NAV of Class C shares reduced by a 1.00% CDSC if shares are redeemed within one year from purchase payment (See Note 2). |
See Notes to Financial Statements.
| | |
| 26 | | QS U.S. Small Capitalization Equity Fund 2017 Annual Report |
Statement of operations
For the Year Ended December 31, 2017
| | | | |
|
| Investment Income: | |
Dividends and distributions | | $ | 9,810,671 | |
Return of capital (Note 1 (d)) | | | (981,680) | |
Net Dividends and Distributions | | | 8,828,991 | |
Interest | | | 95,196 | |
Less: Foreign taxes withheld | | | (2,366) | |
Total Investment Income | | | 8,921,821 | |
|
| Expenses: | |
Investment management fee (Note 2) | | | 5,131,325 | |
Transfer agent fees (Note 5) | | | 195,496 | |
Service and/or distribution fees (Notes 2 and 5) | | | 189,556 | |
Trustees’ fees | | | 103,225 | |
Registration fees | | | 102,774 | |
Legal fees | | | 94,024 | |
Fund accounting fees | | | 72,016 | |
Audit and tax fees | | | 40,328 | |
Shareholder reports | | | 33,896 | |
Fees recaptured by investment manager (Note 2) | | | 15,854 | |
Insurance | | | 14,354 | |
Custody fees | | | 7,295 | |
Interest expense | | | 505 | |
Miscellaneous expenses | | | 13,980 | |
Total Expenses | | | 6,014,628 | |
Less: Fee waivers and/or expense reimbursements (Notes 2 and 5) | | | (105,175) | |
Net Expenses | | | 5,909,453 | |
| Net Investment Income | | | 3,012,368 | |
|
| Realized and Unrealized Gain (Loss) on Investments (Notes 1 and 3): | |
Net Realized Gain From: | | | | |
Investment transactions | | | 188,831,062 | |
REIT distributions | | | 503,467 | |
Net Realized Gain | | | 189,334,529 | |
Change in Net Unrealized Appreciation (Depreciation) From Investments | | | (128,530,135) | |
| Net Gain on Investments | | | 60,804,394 | |
| Increase in Net Assets From Operations | | $ | 63,816,762 | |
See Notes to Financial Statements.
| | |
| QS U.S. Small Capitalization Equity Fund 2017 Annual Report | | 27 |
Statements of changes in net assets
| | | | | | | | |
| For the Years Ended December 31, | | 2017 | | | 2016 | |
|
| Operations: | |
Net investment income | | $ | 3,012,368 | | | $ | 5,520,902 | |
Net realized gain | | | 189,334,529 | | | | 58,176,244 | |
Change in net unrealized appreciation (depreciation) | | | (128,530,135) | | | | 109,226,851 | |
Increase in Net Assets From Operations | | | 63,816,762 | | | | 172,923,997 | |
|
| Distributions to Shareholders From (Notes 1 and 6): | |
Net investment income | | | (3,600,026) | | | | (5,500,040) | |
Net realized gains | | | (18,983,701) | | | | (41,500,709) | |
Decrease in Net Assets From Distributions to Shareholders | | | (22,583,727) | | | | (47,000,749) | |
|
| Fund Share Transactions (Note 7): | |
Net proceeds from sale of shares | | | 192,940,860 | | | | 202,459,258 | |
Reinvestment of distributions | | | 22,532,040 | | | | 46,959,555 | |
Cost of shares repurchased | | | (192,051,211) | | | | (593,031,710) | |
Cost of shares redeemed in-kind (Note 8) | | | (729,980,328) | | | | — | |
Decrease in Net Assets From Fund Share Transactions | | | (706,558,639) | | | | (343,612,897) | |
Decrease in Net Assets | | | (665,325,604) | | | | (217,689,649) | |
|
| Net Assets: | |
Beginning of year | | | 892,736,703 | | | | 1,110,426,352 | |
End of year* | | $ | 227,411,099 | | | $ | 892,736,703 | |
*Includes overdistributed net investment income of: | | | $(294,283) | | | | $(1,014,454) | |
See Notes to Financial Statements.
| | |
| 28 | | QS U.S. Small Capitalization Equity Fund 2017 Annual Report |
Financial highlights
| | | | | | | | | | | | | | | | | | | | |
| For a share of each class of beneficial interest outstanding throughout each year ended December 31: | |
| Class A Shares1 | | 2017 | | | 2016 | | | 2015 | | | 2014 | | | 2013 | |
| | | | | |
| Net asset value, beginning of year | | | $13.58 | | | | $11.95 | | | | $13.46 | | | | $13.80 | | | | $10.94 | |
|
| Income (loss) from operations: | |
Net investment income (loss) | | | 0.00 | 2 | | | 0.02 | | | | 0.00 | 2 | | | (0.03) | | | | (0.01) | |
Net realized and unrealized gain (loss) | | | 1.15 | | | | 2.31 | | | | (0.64) | | | | 1.22 | | | | 4.08 | |
Total income (loss) from operations | | | 1.15 | | | | 2.33 | | | | (0.64) | | | | 1.19 | | | | 4.07 | |
|
| Less distributions from: | |
Net investment income | | | (0.19) | | | | (0.04) | | | | — | | | | — | | | | (0.05) | |
Net realized gains | | | (0.99) | | | | (0.66) | | | | (0.87) | | | | (1.53) | | | | (1.16) | |
Total distributions | | | (1.18) | | | | (0.70) | | | | (0.87) | | | | (1.53) | | | | (1.21) | |
| | | | | |
| Net asset value, end of year | | | $13.55 | | | | $13.58 | | | | $11.95 | | | | $13.46 | | | | $13.80 | |
Total return3 | | | 8.46 | % | | | 19.46 | % | | | (4.89) | % | | | 9.09 | % | | | 37.82 | % |
| | | | | |
| Net assets, end of year (000s) | | | $18,602 | | | | $20,690 | | | | $18,127 | | | | $17,244 | | | | $17,896 | |
|
| Ratios to average net assets: | |
Gross expenses | | | 1.19 | % | | | 1.19 | %4 | | | 1.20 | %4 | | | 1.21 | %4 | | | 1.23 | %4 |
Net expenses5 | | | 1.19 | 6 | | | 1.19 | 4 | | | 1.20 | 4,6 | | | 1.20 | 4,6 | | | 1.20 | 4,6 |
Net investment income (loss) | | | 0.03 | | | | 0.18 | | | | 0.01 | | | | (0.21) | | | | (0.07) | |
| | | | | |
| Portfolio turnover rate | | | 41 | %7 | | | 33 | % | | | 34 | % | | | 42 | % | | | 85 | % |
| 1 | Per share amounts have been calculated using the average shares method. |
| 2 | Amount represents less than $0.005 per share. |
| 3 | Performance figures, exclusive of sales charges, may reflect compensating balance arrangements, fee waivers and/or expense reimbursements. In the absence of compensating balance arrangements, fee waivers and/or expense reimbursements, the total return would have been lower. Past performance is no guarantee of future results. |
| 4 | Reflects recapture of expenses waived/reimbursed from prior fiscal years. |
| 5 | As a result of an expense limitation arrangement, the ratio of total annual fund operating expenses to average net assets of Class A shares did not exceed 1.30%. This expense limitation arrangement cannot be terminated prior to December 31, 2019 without the Board of Trustees’ consent. The manager currently intends to voluntarily waive fees and/or reimburse expenses so that total annual fund operating expenses do not exceed 1.20%. This arrangement is expected to continue until December 31, 2019, but may be terminated at any time by the manager. These expense limitation arrangements do not include interest, brokerage commissions, dividend expense on short sales, taxes, extraordinary expenses and acquired fund fees and expenses. |
| 6 | Reflects fee waivers and/or expense reimbursements. |
| 7 | Excludes securities delivered as a result of a redemption in-kind. |
See Notes to Financial Statements.
| | |
| QS U.S. Small Capitalization Equity Fund 2017 Annual Report | | 29 |
Financial highlights (cont’d)
| | | | | | | | | | | | | | | | | | | | |
| For a share of each class of beneficial interest outstanding throughout each year ended December 31: | |
| Class A2 Shares1 | | 2017 | | | 2016 | | | 2015 | | | 2014 | | | 2013 | |
| | | | | |
| Net asset value, beginning of year | | | $13.44 | | | | $11.84 | | | | $13.37 | | | | $13.75 | | | | $10.93 | |
|
| Income (loss) from operations: | |
Net investment income (loss) | | | (0.02) | | | | 0.00 | 2 | | | (0.02) | | | | (0.04) | | | | (0.00) | 2 |
Net realized and unrealized gain (loss) | | | 1.14 | | | | 2.28 | | | | (0.64) | | | | 1.19 | | | | 4.05 | |
Total income (loss) from operations | | | 1.12 | | | | 2.28 | | | | (0.66) | | | | 1.15 | | | | 4.05 | |
|
| Less distributions from: | |
Net investment income | | | (0.18) | | | | (0.02) | | | | — | | | | — | | | | (0.07) | |
Net realized gains | | | (0.99) | | | | (0.66) | | | | (0.87) | | | | (1.53) | | | | (1.16) | |
Total distributions | | | (1.17) | | | | (0.68) | | | | (0.87) | | | | (1.53) | | | | (1.23) | |
| | | | | |
| Net asset value, end of year | | | $13.39 | | | | $13.44 | | | | $11.84 | | | | $13.37 | | | | $13.75 | |
Total return3 | | | 8.29 | % | | | 19.23 | % | | | (5.08) | % | | | 8.82 | % | | | 37.69 | % |
| | | | | |
| Net assets, end of year (000s) | | | $38,534 | | | | $31,598 | | | | $22,061 | | | | $14,399 | | | | $3,522 | |
|
| Ratios to average net assets: | |
Gross expenses | | | 1.42 | %4 | | | 1.45 | % | | | 1.49 | %4 | | | 1.58 | %4 | | | 1.72 | %4 |
Net expenses5,6 | | | 1.40 | 4 | | | 1.40 | | | | 1.40 | 4 | | | 1.40 | 4 | | | 1.35 | 4 |
Net investment loss | | | (0.17) | | | | (0.02) | | | | (0.19) | | | | (0.33) | | | | (0.02) | |
| | | | | |
| Portfolio turnover rate | | | 41 | %7 | | | 33 | % | | | 34 | % | | | 42 | % | | | 85 | % |
| 1 | Per share amounts have been calculated using the average shares method. |
| 2 | Amount represents less than $0.005 per share. |
| 3 | Performance figures, exclusive of sales charges, may reflect compensating balance arrangements, fee waivers and/or expense reimbursements. In the absence of compensating balance arrangements, fee waivers and/or expense reimbursements, the total return would have been lower. Past performance is no guarantee of future results. |
| 4 | Reflects recapture of expenses waived/reimbursed from prior fiscal years. |
| 5 | As a result of an expense limitation arrangement, the ratio of total annual fund operating expenses to average net assets of Class A2 shares did not exceed 1.50%. This expense limitation arrangement cannot be terminated prior to December 31, 2019 without the Board of Trustees’ consent. The manager currently intends to voluntarily waive fees and/or reimburse expenses so that total annual fund operating expenses do not exceed 1.40%. This arrangement is expected to continue until December 31, 2019, but may be terminated at any time by the manager. These expense limitation arrangements do not include interest, brokerage commissions, dividend expense on short sales, taxes, extraordinary expenses and acquired fund fees and expenses. |
| 6 | Reflects fee waivers and/or expense reimbursements. |
| 7 | Excludes securities delivered as a result of a redemption in-kind. |
See Notes to Financial Statements.
| | |
| 30 | | QS U.S. Small Capitalization Equity Fund 2017 Annual Report |
| | | | | | | | | | | | | | | | | | | | |
| For a share of each class of beneficial interest outstanding throughout each year ended December 31: | |
| Class C Shares1 | | 2017 | | | 2016 | | | 2015 | | | 2014 | | | 2013 | |
| | | | | |
| Net asset value, beginning of year | | | $12.76 | | | | $11.31 | | | | $12.88 | | | | $13.37 | | | | $10.69 | |
|
| Income (loss) from operations: | |
Net investment loss | | | (0.09) | | | | (0.07) | | | | (0.10) | | | | (0.13) | | | | (0.10) | |
Net realized and unrealized gain (loss) | | | 1.07 | | | | 2.18 | | | | (0.60) | | | | 1.17 | | | | 3.96 | |
Total income (loss) from operations | | | 0.98 | | | | 2.11 | | | | (0.70) | | | | 1.04 | | | | 3.86 | |
|
| Less distributions from: | |
Net investment income | | | (0.09) | | | | — | | | | — | | | | — | | | | (0.02) | |
Net realized gains | | | (0.99) | | | | (0.66) | | | | (0.87) | | | | (1.53) | | | | (1.16) | |
Total distributions | | | (1.08) | | | | (0.66) | | | | (0.87) | | | | (1.53) | | | | (1.18) | |
| | | | | |
| Net asset value, end of year | | | $12.66 | | | | $12.76 | | | | $11.31 | | | | $12.88 | | | | $13.37 | |
Total return2 | | | 7.66 | % | | | 18.61 | % | | | (5.59) | % | | | 8.24 | % | | | 36.72 | % |
| | | | | |
| Net assets, end of year (000s) | | | $5,110 | | | | $5,646 | | | | $6,012 | | | | $6,367 | | | | $6,179 | |
|
| Ratios to average net assets: | |
Gross expenses | | | 1.96 | %3 | | | 1.96 | %3 | | | 1.96 | %3 | | | 2.09 | % | | | 2.06 | %3 |
Net expenses4,5 | | | 1.95 | 3 | | | 1.95 | 3 | | | 1.95 | 3 | | | 1.95 | | | | 1.95 | 3 |
Net investment loss | | | (0.73) | | | | (0.59) | | | | (0.74) | | | | (0.96) | | | | (0.81) | |
| | | | | |
| Portfolio turnover rate | | | 41 | %6 | | | 33 | % | | | 34 | % | | | 42 | % | | | 85 | % |
| 1 | Per share amounts have been calculated using the average shares method. |
| 2 | Performance figures, exclusive of CDSC, may reflect compensating balance arrangements, fee waivers and/or expense reimbursements. In the absence of compensating balance arrangements, fee waivers and/or expense reimbursements, the total return would have been lower. Past performance is no guarantee of future results. |
| 3 | Reflects recapture of expenses waived/reimbursed from prior fiscal years. |
| 4 | As a result of an expense limitation arrangement, the ratio of total annual fund operating expenses to average net assets of Class C shares did not exceed 2.05%. This expense limitation arrangement cannot be terminated prior to December 31, 2019 without the Board of Trustees’ consent. The manager currently intends to voluntarily waive fees and/or reimburse expenses so that total annual fund operating expenses do not exceed 1.95%. This arrangement is expected to continue until December 31, 2019, but may be terminated at any time by the manager. These expense limitation arrangements do not include interest, brokerage commissions, dividend expense on short sales, taxes, extraordinary expenses and acquired fund fees and expenses. |
| 5 | Reflects fee waivers and/or expense reimbursements. |
| 6 | Excludes securities delivered as a result of a redemption in-kind. |
See Notes to Financial Statements.
| | |
| QS U.S. Small Capitalization Equity Fund 2017 Annual Report | | 31 |
Financial highlights (cont’d)
| | | | | | | | | | | | | | | | | | | | |
| For a share of each class of beneficial interest outstanding throughout each year ended December 31: | |
| Class FI Shares1 | | 2017 | | | 2016 | | | 2015 | | | 2014 | | | 2013 | |
| | | | | |
| Net asset value, beginning of year | | | $13.04 | | | | $11.54 | | | | $13.03 | | | | $13.42 | | | | $10.68 | |
|
| Income (loss) from operations: | |
Net investment income (loss) | | | 0.00 | * | | | 0.02 | | | | (0.03) | | | | (0.03) | | | | 0.01 | |
Net realized and unrealized gain (loss) | | | 1.11 | | | | 2.24 | | | | (0.59) | | | | 1.17 | | | | 3.96 | |
Total income (loss) from operations | | | 1.11 | | | | 2.26 | | | | (0.62) | | | | 1.14 | | | | 3.97 | |
|
| Less distributions from: | |
Net investment income | | | (0.20) | | | | (0.10) | | | | — | | | | — | | | | (0.07) | |
Net realized gains | | | (0.99) | | | | (0.66) | | | | (0.87) | | | | (1.53) | | | | (1.16) | |
Total distributions | | | (1.19) | | | | (0.76) | | | | (0.87) | | | | (1.53) | | | | (1.23) | |
| | | | | |
| Net asset value, end of year | | | $12.96 | | | | $13.04 | | | | $11.54 | | | | $13.03 | | | | $13.42 | |
Total return2 | | | 8.49 | % | | | 19.51 | % | | | (4.91) | % | | | 8.97 | % | | | 37.87 | % |
| | | | | |
| Net assets, end of year (000s) | | | $216 | | | | $167 | | | | $64 | | | | $1,218 | | | | $2,614 | |
|
| Ratios to average net assets: | |
Gross expenses | | | 1.28 | % | | | 1.66 | %3 | | | 1.36 | %3 | | | 1.48 | %3 | | | 1.34 | %3 |
Net expenses4,5 | | | 1.20 | | | | 1.20 | 3 | | | 1.20 | 3 | | | 1.20 | 3 | | | 1.20 | 3 |
Net investment income (loss) | | | 0.04 | | | | 0.20 | | | | (0.21) | | | | (0.24) | | | | 0.09 | |
| | | | | |
| Portfolio turnover rate | | | 41 | %6 | | | 33 | % | | | 34 | % | | | 42 | % | | | 85 | % |
| 1 | Per share amounts have been calculated using the average shares method. |
| 2 | Performance figures may reflect compensating balance arrangements, fee waivers and/or expense reimbursements. In the absence of compensating balance arrangements, fee waivers and/or expense reimbursements, the total return would have been lower. Past performance is no guarantee of future results. |
| 3 | Reflects recapture of expenses waived/reimbursed from prior fiscal years. |
| 4 | As a result of an expense limitation arrangement, the ratio of total annual fund operating expenses to average net assets of Class FI shares did not exceed 1.30%. This expense limitation arrangement cannot be terminated prior to December 31, 2019 without the Board of Trustees’ consent. The manager currently intends to voluntarily waive fees and/or reimburse expenses so that total annual fund operating expenses do not exceed 1.20%. This arrangement is expected to continue until December 31, 2019, but may be terminated at any time by the manager. These expense limitation arrangements do not include interest, brokerage commissions, dividend expense on short sales, taxes, extraordinary expenses and acquired fund fees and expenses. |
| 5 | Reflects fee waivers and/or expense reimbursements. |
| 6 | Excludes securities delivered as a result of a redemption in-kind. |
| * | Amount represents less than $0.005 per share. |
See Notes to Financial Statements.
| | |
| 32 | | QS U.S. Small Capitalization Equity Fund 2017 Annual Report |
| | | | | | | | | | | | | | | | | | | | |
| For a share of each class of beneficial interest outstanding throughout each year ended December 31: | |
| Class I Shares1 | | 2017 | | | 2016 | | | 2015 | | | 2014 | | | 2013 | |
| | | | | |
| Net asset value, beginning of year | | | $13.85 | | | | $12.10 | | | | $13.60 | | | | $13.90 | | | | $11.00 | |
|
| Income (loss) from operations: | |
Net investment income | | | 0.04 | | | | 0.05 | | | | 0.10 | | | | 0.03 | | | | 0.05 | |
Net realized and unrealized gain (loss) | | | 1.18 | | | | 2.36 | | | | (0.69) | | | | 1.23 | | | | 4.11 | |
Total income (loss) from operations | | | 1.22 | | | | 2.41 | | | | (0.59) | | | | 1.26 | | | | 4.16 | |
|
| Less distributions from: | |
Net investment income | | | (0.24) | | | | — | | | | (0.04) | | | | (0.03) | | | | (0.10) | |
Net realized gains | | | (0.99) | | | | (0.66) | | | | (0.87) | | | | (1.53) | | | | (1.16) | |
Total distributions | | | (1.23) | | | | (0.66) | | | | (0.91) | | | | (1.56) | | | | (1.26) | |
| | | | | |
| Net asset value, end of year | | | $13.84 | | | | $13.85 | | | | $12.10 | | | | $13.60 | | | | $13.90 | |
Total return2 | | | 8.77 | % | | | 19.88 | % | | | (4.51) | % | | | 9.53 | % | | | 38.48 | % |
| | | | | |
| Net assets, end of year (000s) | | | $22,847 | | | | $23,387 | | | | $275,797 | | | | $5,559 | | | | $9,126 | |
|
| Ratios to average net assets: | |
Gross expenses | | | 0.92 | %3 | | | 0.98 | % | | | 0.76 | %3 | | | 0.78 | %3 | | | 0.78 | %3 |
Net expenses4 | | | 0.90 | 3,5 | | | 0.90 | 5 | | | 0.76 | 3 | | | 0.77 | 3,5 | | | 0.77 | 3,5 |
Net investment income | | | 0.32 | | | | 0.43 | | | | 0.76 | | | | 0.19 | | | | 0.37 | |
| | | | | |
| Portfolio turnover rate | | | 41 | %6 | | | 33 | % | | | 34 | % | | | 42 | % | | | 85 | % |
| 1 | Per share amounts have been calculated using the average shares method. |
| 2 | Performance figures may reflect compensating balance arrangements, fee waivers and/or expense reimbursements. In the absence of compensating balance arrangements, fee waivers and/or expense reimbursements, the total return would have been lower. Past performance is no guarantee of future results. |
| 3 | Reflects recapture of expenses waived/reimbursed from prior fiscal years. |
| 4 | As a result of an expense limitation arrangement, the ratio of total annual fund operating expenses to average net assets of Class I shares did not exceed 1.00%. This expense limitation arrangement cannot be terminated prior to December 31, 2019 without the Board of Trustees’ consent. The manager currently intends to voluntarily waive fees and/or reimburse expenses so that total annual fund operating expenses do not exceed 0.90%. This arrangement is expected to continue until December 31, 2019, but may be terminated at any time by the manager. These expense limitation arrangements do not include interest, brokerage commissions, dividend expense on short sales, taxes, extraordinary expenses and acquired fund fees and expenses. |
| 5 | Reflects fee waivers and/or expense reimbursements. |
| 6 | Excludes securities delivered as a result of a redemption in-kind. |
See Notes to Financial Statements.
| | |
| QS U.S. Small Capitalization Equity Fund 2017 Annual Report | | 33 |
Financial highlights (cont’d)
| | | | | | | | | | | | | | | | | | | | |
| For a share of each class of beneficial interest outstanding throughout each year ended December 31: | |
| Class IS Shares1 | | 2017 | | | 2016 | | | 2015 | | | 2014 | | | 2013 | |
| | | | | |
| Net asset value, beginning of year | | | $13.56 | | | | $11.92 | | | | $13.41 | | | | $13.73 | | | | $10.88 | |
|
| Income (loss) from operations: | |
Net investment income | | | 0.06 | | | | 0.07 | | | | 0.06 | | | | 0.03 | | | | 0.05 | |
Net realized and unrealized gain (loss) | | | 1.17 | | | | 2.33 | | | | (0.64) | | | | 1.21 | | | | 4.06 | |
Total income (loss) from operations | | | 1.23 | | | | 2.40 | | | | (0.58) | | | | 1.24 | | | | 4.11 | |
|
| Less distributions from: | |
Net investment income | | | (0.26) | | | | (0.10) | | | | (0.04) | | | | (0.03) | | | | (0.10) | |
Net realized gains | | | (0.99) | | | | (0.66) | | | | (0.87) | | | | (1.53) | | | | (1.16) | |
Total distributions | | | (1.25) | | | | (0.76) | | | | (0.91) | | | | (1.56) | | | | (1.26) | |
| | | | | |
| Net asset value, end of year | | | $13.54 | | | | $13.56 | | | | $11.92 | | | | $13.41 | | | | $13.73 | |
Total return2 | | | 9.02 | % | | | 20.04 | % | | | (4.47) | % | | | 9.50 | % | | | 38.46 | % |
| | | | | |
| Net assets, end of year (000s) | | | $142,102 | | | | $811,249 | | | | $788,366 | | | | $742,715 | | | | $768,829 | |
|
| Ratios to average net assets: | |
Gross expenses | | | 0.76 | % | | | 0.76 | %3 | | | 0.75 | %3 | | | 0.76 | % | | | 0.77 | % |
Net expenses4,5 | | | 0.75 | | | | 0.75 | 3 | | | 0.75 | 3 | | | 0.75 | | | | 0.75 | |
Net investment income | | | 0.47 | | | | 0.60 | | | | 0.44 | | | | 0.24 | | | | 0.41 | |
| | | | | |
| Portfolio turnover rate | | | 41 | %6 | | | 33 | % | | | 34 | % | | | 42 | % | | | 85 | % |
| 1 | Per share amounts have been calculated using the average shares method. |
| 2 | Performance figures may reflect compensating balance arrangements, fee waivers and/or expense reimbursements. In the absence of compensating balance arrangements, fee waivers and/or expense reimbursements, the total return would have been lower. Past performance is no guarantee of future results. |
| 3 | Reflects recapture of expenses waived/reimbursed from prior fiscal years. |
| 4 | As a result of an expense limitation arrangement, the ratio of total annual fund operating expenses to average net assets of Class IS shares did not exceed 0.75%. In addition, the ratio of total annual fund operating expenses for Class IS shares did not exceed the ratio of total annual fund operating expenses for Class I shares. These expense limitation arrangements cannot be terminated prior to December 31, 2019 without the Board of Trustees’ consent. These expense limitation arrangements do not include interest, brokerage commissions, dividend expense on short sales, taxes, extraordinary expenses and acquired fund fees and expenses. |
| 5 | Reflects fee waivers and/or expense reimbursements. |
| 6 | Excludes securities delivered as a result of a redemption in-kind. |
See Notes to Financial Statements.
| | |
| 34 | | QS U.S. Small Capitalization Equity Fund 2017 Annual Report |
Notes to financial statements
1. Organization and significant accounting policies
QS U.S. Small Capitalization Equity Fund (the “Fund”) is a separate diversified investment series of Legg Mason Global Asset Management Trust (the “Trust”). The Trust, a Maryland statutory trust, is registered under the Investment Company Act of 1940, as amended (the “1940 Act”), as an open-end management investment company.
The following are significant accounting policies consistently followed by the Fund and are in conformity with U.S. generally accepted accounting principles (“GAAP”). Estimates and assumptions are required to be made regarding assets, liabilities and changes in net assets resulting from operations when financial statements are prepared. Changes in the economic environment, financial markets and any other parameters used in determining these estimates could cause actual results to differ. Subsequent events have been evaluated through the date the financial statements were issued.
(a) Investment valuation. Equity securities for which market quotations are available are valued at the last reported sales price or official closing price on the primary market or exchange on which they trade. The valuations for fixed income securities (which may include, but are not limited to, corporate, government, municipal, mortgage-backed, collateralized mortgage obligations and asset-backed securities) and certain derivative instruments are typically the prices supplied by independent third party pricing services, which may use market prices or broker/dealer quotations or a variety of valuation techniques and methodologies. The independent third party pricing services use inputs that are observable such as issuer details, interest rates, yield curves, prepayment speeds, credit risks/spreads, default rates and quoted prices for similar securities. Prior to December 1, 2017, short-term fixed income securities that would mature in 60 days or less were valued at amortized cost, unless it was determined that using this method would not reflect an investment’s fair value. Investments in open-end funds are valued at the closing net asset value per share of each fund on the day of valuation. When the Fund holds securities or other assets that are denominated in a foreign currency, the Fund will normally use the currency exchange rates as of 4:00 p.m. (Eastern Time). If independent third party pricing services are unable to supply prices for a portfolio investment, or if the prices supplied are deemed by the manager to be unreliable, the market price may be determined by the manager using quotations from one or more broker/dealers or at the transaction price if the security has recently been purchased and no value has yet been obtained from a pricing service or pricing broker. When reliable prices are not readily available, such as when the value of a security has been significantly affected by events after the close of the exchange or market on which the security is principally traded, but before the Fund calculates its net asset value, the Fund values these securities as determined in accordance with procedures approved by the Fund’s Board of Trustees.
The Board of Trustees is responsible for the valuation process and has delegated the supervision of the daily valuation process to the Legg Mason North Atlantic Fund Valuation Committee (the “Valuation Committee”). The Valuation Committee, pursuant to the policies adopted by the Board of Trustees, is responsible for making fair value determinations,
| | |
| QS U.S. Small Capitalization Equity Fund 2017 Annual Report | | 35 |
Notes to financial statements (cont’d)
evaluating the effectiveness of the Fund’s pricing policies, and reporting to the Board of Trustees. When determining the reliability of third party pricing information for investments owned by the Fund, the Valuation Committee, among other things, conducts due diligence reviews of pricing vendors, monitors the daily change in prices and reviews transactions among market participants.
The Valuation Committee will consider pricing methodologies it deems relevant and appropriate when making fair value determinations. Examples of possible methodologies include, but are not limited to, multiple of earnings; discount from market of a similar freely traded security; discounted cash-flow analysis; book value or a multiple thereof; risk premium/yield analysis; yield to maturity; and/or fundamental investment analysis. The Valuation Committee will also consider factors it deems relevant and appropriate in light of the facts and circumstances. Examples of possible factors include, but are not limited to, the type of security; the issuer’s financial statements; the purchase price of the security; the discount from market value of unrestricted securities of the same class at the time of purchase; analysts’ research and observations from financial institutions; information regarding any transactions or offers with respect to the security; the existence of merger proposals or tender offers affecting the security; the price and extent of public trading in similar securities of the issuer or comparable companies; and the existence of a shelf registration for restricted securities.
For each portfolio security that has been fair valued pursuant to the policies adopted by the Board of Trustees, the fair value price is compared against the last available and next available market quotations. The Valuation Committee reviews the results of such back testing monthly and fair valuation occurrences are reported to the Board of Trustees quarterly.
The Fund uses valuation techniques to measure fair value that are consistent with the market approach and/or income approach, depending on the type of security and the particular circumstance. The market approach uses prices and other relevant information generated by market transactions involving identical or comparable securities. The income approach uses valuation techniques to discount estimated future cash flows to present value.
GAAP establishes a disclosure hierarchy that categorizes the inputs to valuation techniques used to value assets and liabilities at measurement date. These inputs are summarized in the three broad levels listed below:
| • | | Level 1 — quoted prices in active markets for identical investments |
| • | | Level 2 — other significant observable inputs (including quoted prices for similar investments, interest rates, prepayment speeds, credit risk, etc.) |
| • | | Level 3 — significant unobservable inputs (including the Fund’s own assumptions in determining the fair value of investments) |
| | |
| 36 | | QS U.S. Small Capitalization Equity Fund 2017 Annual Report |
The inputs or methodologies used to value securities are not necessarily an indication of the risk associated with investing in those securities.
The following is a summary of the inputs used in valuing the Fund’s assets carried at fair value:
| | | | | | | | | | | | | | | | |
| ASSETS | |
| Description | | Quoted Prices
(Level 1) | | | Other Significant
Observable Inputs
(Level 2) | | | Significant
Unobservable
Inputs
(Level 3) | | | Total | |
| Long-term investments†: | |
Common stocks: | |
Consumer discretionary | | $ | 32,500,331 | | | | — | | | $ | 0 | * | | $ | 32,500,331 | |
Health care | | | 30,340,929 | | | | — | | | | 0 | * | | | 30,340,929 | |
Other common stocks | | | 159,122,234 | | | | — | | | | — | | | | 159,122,234 | |
| Total long-term investments | | | 221,963,494 | | | | — | | | | 0 | * | | | 221,963,494 | |
| Short-term investments† | | | 5,374,117 | | | | — | | | | — | | | | 5,374,117 | |
| Total investments | | $ | 227,337,611 | | | | — | | | $ | 0 | * | | $ | 227,337,611 | |
| † | See Schedule of Investments for additional detailed categorizations. |
| * | Amount represents less than $1. |
(b) Security transactions and investment income. Security transactions are accounted for on a trade date basis. Interest income (including interest income from payment-in-kind securities), adjusted for amortization of premium and accretion of discount, is recorded on the accrual basis. Dividend income is recorded on the ex-dividend date for dividends received in cash and/or securities. Foreign dividend income is recorded on the ex-dividend date or as soon as practicable after the Fund determines the existence of a dividend declaration after exercising reasonable due diligence. The cost of investments sold is determined by use of the specific identification method. To the extent any issuer defaults or a credit event occurs that impacts the issuer, the Fund may halt any additional interest income accruals and consider the realizability of interest accrued up to the date of default or credit event.
(c) Distributions to shareholders. Distributions from net investment income and distributions of net realized gains, if any, are declared at least annually. Distributions to shareholders of the Fund are recorded on the ex-dividend date and are determined in accordance with income tax regulations, which may differ from GAAP.
(d) REIT distributions. The character of distributions received from Real Estate Investment Trusts (‘‘REITs’’) held by the Fund is generally comprised of net investment income, capital gains, and return of capital. It is the policy of the Fund to estimate the character of distributions received from underlying REITs based on historical data provided by the REITs. After each calendar year end, REITs report the actual tax character of these distributions. Differences between the estimated and actual amounts reported by the REITs are reflected in the Fund’s records in the year in which they are reported by the REITs by adjusting related investment cost basis, capital gains and income, as necessary.
| | |
| QS U.S. Small Capitalization Equity Fund 2017 Annual Report | | 37 |
Notes to financial statements (cont’d)
(e) Compensating balance arrangements. The Fund has an arrangement with its custodian bank whereby a portion of the custodian’s fees is paid indirectly by credits earned on the Fund’s cash on deposit with the bank.
(f) Share class accounting. Investment income, common expenses and realized/unrealized gains (losses) on investments are allocated to the various classes of the Fund on the basis of daily net assets of each class. Fees relating to a specific class are charged directly to that share class.
(g) Federal and other taxes. It is the Fund’s policy to comply with the federal income and excise tax requirements of the Internal Revenue Code of 1986 (the “Code”), as amended, applicable to regulated investment companies. Accordingly, the Fund intends to distribute its taxable income and net realized gains, if any, to shareholders in accordance with timing requirements imposed by the Code. Therefore, no federal or state income tax provision is required in the Fund’s financial statements.
Management has analyzed the Fund’s tax positions taken on income tax returns for all open tax years and has concluded that as of December 31, 2017, no provision for income tax is required in the Fund’s financial statements. The Fund’s federal and state income and federal excise tax returns for tax years for which the applicable statutes of limitations have not expired are subject to examination by the Internal Revenue Service and state departments of revenue.
Under the applicable foreign tax laws, a withholding tax may be imposed on interest, dividends and capital gains at various rates.
(h) Reclassification. GAAP requires that certain components of net assets be reclassified to reflect permanent differences between financial and tax reporting. These reclassifications have no effect on net assets or net asset value per share. During the current year, the following reclassifications have been made:
| | | | | | | | | | | | |
| | | Overdistributed Net
Investment Income | | | Accumulated Net
Realized Loss | | | Paid-in
Capital | |
| (a) | | | — | | | $ | (173,515,278) | | | $ | 173,515,278 | |
| (b) | | $ | 1,307,829 | | | | (1,307,829) | | | | — | |
| (a) | Reclassifications are due to book/tax differences in the treatment of an in-kind distribution of securities and distributions paid in connection with the redemption of Fund shares. |
| (b) | Reclassifications are due to book/tax differences in the treatment of passive foreign investment companies, book/tax differences in the treatment of distributions from real estate investment trusts and book/tax differences in the treatment of distributions. |
2. Investment management agreement and other transactions with affiliates
Legg Mason Partners Fund Advisor, LLC (“LMPFA”) is the Fund’s investment manager and QS Investors, LLC (“QS Investors”) is the Fund’s subadviser. Western Asset Management Company (“Western Asset”) manages the portion of the Fund’s cash and short-term instruments allocated to it. LMPFA, QS Investors and Western Asset are wholly-owned subsidiaries of Legg Mason, Inc. (“Legg Mason”).
| | |
| 38 | | QS U.S. Small Capitalization Equity Fund 2017 Annual Report |
Under the investment management agreement, the Fund pays an investment management fee, calculated daily and paid monthly, at an annual rate of 0.70% of the Fund’s average daily net assets.
LMPFA provides administrative and certain oversight services to the Fund. LMPFA delegates to the subadviser the day-to-day portfolio management of the Fund, except for the management of the portion of the cash and short-term instruments allocated to Western Asset. To the extent LMPFA receives a management fee after taking into account its contractual obligation to limit expenses as discussed below, LMPFA will pay QS Investors and Western Asset the entire management fee it receives from the Fund.
As a result of expense limitation arrangements between the Fund and LMPFA, the ratio of total annual fund operating expenses, other than interest, brokerage commissions, dividend expense on short sales, taxes, extraordinary expenses and acquired fund fees and expenses, to average net assets of Class A, Class A2, Class C, Class FI, Class I and Class IS shares did not exceed 1.30%, 1.50%, 2.05%, 1.30%, 1.00% and 0.75%, respectively. In addition, the ratio of total annual fund operating expenses for Class IS shares did not exceed the ratio of total annual fund operating expenses for Class I shares. These expense limitation arrangements cannot be terminated prior to December 31, 2019 without the Board of Trustees’ consent.
LMPFA currently intends to voluntarily waive fees and/or reimburse operating expenses, other than interest, brokerage commissions, dividend expense on short sales, taxes, extraordinary expenses and acquired fund fees and expenses so that total annual operating expenses are not expected to exceed 1.20%, 1.40%, 1.95%, 1.20% and 0.90% for Class A, Class A2, Class C, Class FI and Class I shares, respectively. These arrangements are expected to continue until December 31, 2019, but may be terminated at any time by LMPFA.
During the year ended December 31, 2017, fees waived and/or expenses reimbursed amounted to $105,175.
LMPFA is permitted to recapture amounts waived and/or reimbursed to a class within three years after the fiscal year in which LMPFA earned the fee or incurred the expense if the class’ total annual operating expenses have fallen to a level below the expense limitation (“expense cap”) in effect at the time the fees were earned or the expenses incurred. In no case will LMPFA recapture any amount that would result, on any particular business day of the Fund, in the class’ total annual operating expenses exceeding the expense cap or any other lower limit then in effect.
Pursuant to these arrangements, at December 31, 2017, the Fund had remaining fee waivers and/or expense reimbursements subject to recapture by LMPFA and respective dates of expiration as follows:
| | | | | | | | | | | | | | | | | | | | | | | | |
| | | Class A | | | Class A2 | | | Class C | | | Class FI | | | Class I | | | Class IS | |
| Expires December 31, 2018 | | | — | | | $ | 18,031 | | | $ | 822 | | | $ | 4,484 | | | | — | | | $ | 11,703 | |
| Expires December 31, 2019 | | | — | | | | 13,105 | | | | 644 | | | | 656 | | | $ | 172,935 | | | | 92,034 | |
| Expires December 31, 2020 | | | — | | | | 7,072 | | | | 644 | | | | 160 | | | | 4,689 | | | | 92,486 | |
| Total fee waiver/expense reimbursements subject to recapture | | | — | | | $ | 38,208 | | | $ | 2,110 | | | $ | 5,300 | | | $ | 177,624 | | | $ | 196,223 | |
| | |
| QS U.S. Small Capitalization Equity Fund 2017 Annual Report | | 39 |
Notes to financial statements (cont’d)
For the year ended December 31, 2017, LMPFA recaptured $10,549, $436, and $4,869 for Class A2, Class C and Class I shares, respectively.
Legg Mason Investor Services, LLC (‘‘LMIS’’), a wholly-owned broker-dealer subsidiary of Legg Mason, serves as the Fund’s sole and exclusive distributor.
There is a maximum initial sales charge of 5.75% for Class A and Class A2 shares. There is a contingent deferred sales charge (“CDSC”) of 1.00% on Class C shares, which applies if redemption occurs within 12 months from purchase payment. In certain cases, Class A and Class A2 shares have a 1.00% CDSC, which applies if redemption occurs within 18 months from purchase payment. This CDSC only applies to those purchases of Class A and Class A2 shares, which, when combined with current holdings of other shares of funds sold by LMIS, equal or exceed $1,000,000 in the aggregate. These purchases do not incur an initial sales charge.
For the year ended December 31, 2017, LMIS and its affiliates retained sales charges of $562 and $54,614 on sales of the Fund’s Class A and Class A2 shares, respectively. In addition, for the year ended December 31, 2017, CDSCs paid to LMIS and its affiliates were:
| | | | | | | | |
| | | Class A2 | | | Class C | |
| CDSCs | | $ | 108 | | | $ | 341 | |
Under a Deferred Compensation Plan (the “Plan”), Trustees may have elected to defer receipt of all or a specified portion of their compensation. A participating Trustee selected one or more funds managed by affiliates of Legg Mason in which his or her deferred trustee’s fees were deemed to be invested. Deferred amounts remain in the Fund until distributed in accordance with the Plan. In May 2015, the Board of Trustees approved an amendment to the Plan so that effective January 1, 2016, no compensation earned after that date may be deferred under the Plan.
All officers and one Trustee of the Trust are employees of Legg Mason or its affiliates and do not receive compensation from the Trust.
As of December 31, 2017, Legg Mason and its affiliates owned 57% of the Fund.
3. Investments
During the year ended December 31, 2017, the aggregate cost of purchases and proceeds from sales of investments (excluding short-term investments) were as follows:
| | | | |
| Purchases | | $ | 315,755,955 | |
| Sales | | | 299,130,141 | * |
| * | Excludes the value of securities delivered as a result of a redemption in-kind totaling $729,980,328 (see Note 8). |
At December 31, 2017, the aggregate cost of investments and the aggregate gross unrealized appreciation and depreciation of investments for federal income tax purposes were as follows:
| | | | | | | | | | | | | | | | |
| | | Cost | | | Gross
Unrealized
Appreciation | | | Gross
Unrealized
Depreciation | | | Net
Unrealized
Appreciation | |
| Securities | | $ | 195,567,630 | | | $ | 49,801,464 | | | $ | (18,031,483) | | | $ | 31,769,981 | |
| | |
| 40 | | QS U.S. Small Capitalization Equity Fund 2017 Annual Report |
4. Derivative instruments and hedging activities
During the year ended December 31, 2017, the Fund did not invest in derivative instruments.
5. Class specific expenses, waivers and/or expense reimbursements
The Fund has adopted a Rule 12b-1 shareholder services and distribution plan and under that plan the Fund pays service and/or distribution fees with respect to its Class A, Class A2, Class C and Class FI shares calculated at the annual rate of 0.25%, 0.25%, 1.00% and 0.25% of the average daily net assets of each class, respectively. Service and/or distribution fees are accrued daily and paid monthly.
For the year ended December 31, 2017, class specific expenses were as follows:
| | | | | | | | |
| | | Service and/or
Distribution Fees | | | Transfer Agent
Fees | |
| Class A | | $ | 49,140 | † | | $ | 31,612 | |
| Class A2 | | | 86,847 | | | | 124,153 | |
| Class C | | | 53,092 | † | | | 9,267 | |
| Class FI | | | 477 | | | | 477 | |
| Class I | | | — | | | | 27,228 | |
| Class IS | | | — | | | | 2,759 | |
| Total | | $ | 189,556 | | | $ | 195,496 | |
| † | Amounts shown are exclusive of expense reimbursements. For the year ended December 31, 2017, the service and/or distribution fees reimbursed amounted to $110 and $14 for Class A and Class C shares, respectively. |
For the year ended December 31, 2017, waivers and/or expense reimbursements by class were as follows:
| | | | |
| | | Waivers/Expense
Reimbursements | |
| Class A | | $ | 110 | |
| Class A2 | | | 7,072 | |
| Class C | | | 658 | |
| Class FI | | | 160 | |
| Class I | | | 4,689 | |
| Class IS | | | 92,486 | |
| Total | | $ | 105,175 | |
6. Distributions to shareholders by class
| | | | | | | | |
| | | Year Ended
December 31, 2017 | | | Year Ended
December 31, 2016 | |
| Net Investment Income: | |
| Class A | | $ | 249,372 | | | $ | 59,290 | |
| Class A2 | | | 471,544 | | | | 48,640 | |
| Class C | | | 34,743 | | | | — | |
| Class FI | | | 3,070 | | | | 1,173 | |
| Class I | | | 366,741 | | | | — | |
| Class IS | | | 2,474,556 | | | | 5,390,937 | |
| Total | | $ | 3,600,026 | | | $ | 5,500,040 | |
| | |
| QS U.S. Small Capitalization Equity Fund 2017 Annual Report | | 41 |
Notes to financial statements (cont’d)
| | | | | | | | |
| | | Year Ended
December 31, 2017 | | | Year Ended
December 31, 2016 | |
| Net Realized Gains: | |
| Class A | | $ | 1,283,663 | | | $ | 964,009 | |
| Class A2 | | | 2,621,059 | | | | 1,479,870 | |
| Class C | | | 375,895 | | | | 282,662 | |
| Class FI | | | 15,050 | | | | 8,006 | |
| Class I | | | 1,522,549 | | | | 1,088,132 | |
| Class IS | | | 13,165,485 | | | | 37,678,030 | |
| Total | | $ | 18,983,701 | | | $ | 41,500,709 | |
7. Shares of beneficial interest
At December 31, 2017, the Trust had an unlimited number of shares of beneficial interest authorized with a par value of $0.00001 per share. The Fund has the ability to issue multiple classes of shares. Each class of shares represents an identical interest and has the same rights, except that each class bears certain direct expenses, including those specifically related to the distribution of its shares.
Transactions in shares of each class were as follows:
| | | | | | | | | | | | | | | | |
| | | Year Ended
December 31, 2017 | | | Year Ended
December 31, 2016 | |
| | | Shares | | | Amount | | | Shares | | | Amount | |
| Class A | |
| Shares sold | | | 159,819 | | | $ | 2,180,304 | | | | 439,827 | | | $ | 5,147,700 | |
| Shares issued on reinvestment | | | 109,778 | | | | 1,494,562 | | | | 72,399 | | | | 996,207 | |
| Shares repurchased | | | (421,015) | | | | (5,793,597) | | | | (505,795) | | | | (6,181,108) | |
| Net increase (decrease) | | | (151,418) | | | $ | (2,118,731) | | | | 6,431 | | | $ | (37,201) | |
|
| Class A2 | |
| Shares sold | | | 709,165 | | | $ | 9,604,441 | | | | 737,755 | | | $ | 8,843,612 | |
| Shares issued on reinvestment | | | 230,043 | | | | 3,092,603 | | | | 112,225 | | | | 1,528,510 | |
| Shares repurchased | | | (412,562) | | | | (5,639,938) | | | | (362,164) | | | | (4,367,060) | |
| Net increase | | | 526,646 | | | $ | 7,057,106 | | | | 487,816 | | | $ | 6,005,062 | |
|
| Class C | |
| Shares sold | | | 17,122 | | | $ | 217,404 | | | | 23,716 | | | $ | 280,706 | |
| Shares issued on reinvestment | | | 32,222 | | | | 410,059 | | | | 21,783 | | | | 281,658 | |
| Shares repurchased | | | (88,317) | | | | (1,138,729) | | | | (134,447) | | | | (1,556,961) | |
| Net decrease | | | (38,973) | | | $ | (511,266) | | | | (88,948) | | | $ | (994,597) | |
|
| Class FI | |
| Shares sold | | | 3,807 | | | $ | 49,774 | | | | 10,572 | | | $ | 109,544 | |
| Shares issued on reinvestment | | | 1,392 | | | | 18,120 | | | | 695 | | | | 9,179 | |
| Shares repurchased | | | (1,336) | | | | (18,165) | | | | (4,032) | | | | (46,247) | |
| Net increase | | | 3,863 | | | $ | 49,729 | | | | 7,235 | | | $ | 72,476 | |
| | |
| 42 | | QS U.S. Small Capitalization Equity Fund 2017 Annual Report |
| | | | | | | | | | | | | | | | |
| | | Year Ended
December 31, 2017 | | | Year Ended
December 31, 2016 | |
| | | Shares | | | Amount | | | Shares | | | Amount | |
| Class I | |
| Shares sold | | | 254,776 | | | $ | 3,526,905 | | | | 2,989,659 | | | $ | 35,209,611 | |
| Shares issued on reinvestment | | | 134,980 | | | | 1,876,655 | | | | 76,624 | | | | 1,075,034 | |
| Shares repurchased | | | (428,505) | | | | (6,008,314) | | | | (24,165,471) | | | | (310,893,207) | |
| Net decrease | | | (38,749) | | | $ | (604,754) | | | | (21,099,188) | | | $ | (274,608,562) | |
|
| Class IS | |
| Shares sold | | | 13,046,439 | | | $ | 177,362,032 | | | | 12,448,500 | | | $ | 152,868,085 | |
| Shares issued on reinvestment | | | 1,145,965 | | | | 15,640,041 | | | | 3,136,851 | | | | 43,068,967 | |
| Shares repurchased | | | (11,610,646) | | | | (173,452,468) | | | | (21,874,731) | | | | (269,987,127) | |
| Shares redeemed in-kind | | | (51,919,719) | | | | (729,980,328) | | | | — | | | | — | |
| Net decrease | | | (49,337,961) | | | $ | (710,430,723) | | | | (6,289,380) | | | $ | (74,050,075) | |
8. Redemptions-in-kind
The Fund may make payment for Fund shares redeemed wholly or in part by distributing portfolio securities to shareholders. For the year ended December 31, 2017, the Fund had redemptions-in-kind with total proceeds in the amount of $729,980,328. The net realized gains on these redemptions-in-kind amounted to $157,190,286, which was not realized for tax purposes.
9. Income tax information and distributions to shareholders
The tax character of distributions paid during the fiscal years ended December 31, was as follows:
| | | | | | | | |
| | | 2017 | | | 2016 | |
| Distributions paid from: | | | | | | | | |
| Ordinary income | | $ | 10,634,302 | | | $ | 5,500,040 | |
| Net long-term capital gains | | | 11,949,425 | | | | 41,500,709 | |
| Total distributions paid | | $ | 22,583,727 | | | $ | 47,000,749 | |
As of December 31, 2017, the components of accumulated earnings (losses) on a tax basis were as follows:
| | | | |
| Deferred capital losses* | | $ | (290,198) | |
| Other book/tax temporary differences(a) | | | 34,636 | |
| Unrealized appreciation (depreciation)(b) | | | 31,769,981 | |
| Total accumulated earnings (losses) — net | | $ | 31,514,419 | |
| * | These capital losses have been deferred in the current year as either short-term or long-term losses. The losses will be deemed to occur on the first day of the next taxable year in the same character as they were originally deferred and will be available to offset future taxable capital gains. |
| (a) | Other book/tax temporary differences are attributable to book/tax differences in the treatment of distributions from real estate investment trusts, and book/tax differences in the timing of the deductibility of various expenses. |
| (b) | The difference between book-basis and tax-basis unrealized appreciation (depreciation) is attributable to the tax deferral of losses on wash sales and the realization for tax purposes of unrealized gains on investments in passive foreign investment companies. |
| | |
| QS U.S. Small Capitalization Equity Fund 2017 Annual Report | | 43 |
Notes to financial statements (cont’d)
10. Recent accounting pronouncement
In October 2016, the U.S. Securities and Exchange Commission adopted new rules and amended existing rules (together, the “final rules”) intended to modernize the reporting and disclosure of information by registered investment companies. In part, the final rules amend Regulation S-X and require standardized, enhanced disclosure about derivatives in investment company financial statements, as well as other amendments. The compliance date for the amendments to Regulation S-X was August 1, 2017. The Fund has adopted the amendments to Regulation S-X and, upon evaluation, has concluded that the amendments do not materially impact the financial statement amounts; however, as required, additional or enhanced disclosure has been included.
| | |
| 44 | | QS U.S. Small Capitalization Equity Fund 2017 Annual Report |
Report of independent registered public accounting firm
To the Board of Trustees of Legg Mason Global Asset Management Trust and Shareholders of QS U.S. Small Capitalization Equity Fund
Opinion on the financial statements
We have audited the accompanying statement of assets and liabilities, including the schedule of investments, of QS U.S. Small Capitalization Equity Fund (one of the funds constituting Legg Mason Global Asset Management Trust, referred to hereafter as the “Fund”) as of December 31, 2017, the related statement of operations for the year ended December 31, 2017, the statement of changes in net assets for each of the two years in the period ended December 31, 2017, including the related notes, and the financial highlights for each of the five years in the period ended December 31, 2017 (collectively referred to as the “financial statements”). In our opinion, the financial statements present fairly, in all material respects, the financial position of the Fund as of December 31, 2017, the results of its operations for the year then ended, the changes in its net assets for each of the two years in the period ended December 31, 2017 and the financial highlights for each of the five years in the period ended December 31, 2017 in conformity with accounting principles generally accepted in the United States of America.
Basis for opinion
These financial statements are the responsibility of the Fund’s management. Our responsibility is to express an opinion on the Fund’s financial statements based on our audits. We are a public accounting firm registered with the Public Company Accounting Oversight Board (United States) (“PCAOB”) and are required to be independent with respect to the Fund in accordance with the U.S. federal securities laws and the applicable rules and regulations of the Securities and Exchange Commission and the PCAOB.
We conducted our audits of these financial statements in accordance with the standards of the PCAOB. Those standards require that we plan and perform the audit to obtain reasonable assurance about whether the financial statements are free of material misstatement, whether due to error or fraud.
Our audits included performing procedures to assess the risks of material misstatement of the financial statements, whether due to error or fraud, and performing procedures that respond to those risks. Such procedures included examining, on a test basis, evidence regarding the amounts and disclosures in the financial statements. Our audits also included evaluating the accounting principles used and significant estimates made by management, as well as evaluating the overall presentation of the financial statements. Our procedures included confirmation of securities owned as of December 31, 2017 by correspondence with the custodian and brokers. We believe that our audits provide a reasonable basis for our opinion.
/s/PricewaterhouseCoopers LLP
Baltimore, MD
February 16, 2018
We have served as the auditor of one or more investment companies in the Legg Mason investment company group since at least 1973. We have not determined the specific year we began serving as auditor.
| | |
| QS U.S. Small Capitalization Equity Fund 2017 Annual Report | | 45 |
Board approval of management and subadvisory agreements (unaudited)
At its November 2017 meeting, the Fund’s Board of Trustees (the “Board”) approved the continuation of the investment management agreement (the “Management Agreement”) with Legg Mason Partners Fund Advisor, LLC (the “Manager”), the investment advisory agreement (the “Advisory Agreement”) between the Manager and QS Investors, LLC (the “Subadviser”) and the subadvisory agreement (the “Cash Management Agreement”) between the Manager and Western Asset Management Company (“Western Asset”) pursuant to which Western Asset is engaged to provide day-to-day management of the Fund’s cash and short-term investments. (The Management, Advisory and Cash Management Agreements are collectively referred to as the “Agreements.”) The trustees who are not “interested persons” of the Fund (as defined in the Investment Company Act of 1940, as amended) (the “Independent Trustees”), met on October 11, 2017, with the assistance of their independent legal counsel, to review and evaluate the materials provided by the Manager to assist the Board, and in particular the Independent Trustees, in considering continuation of the Agreements. At such October meeting the Independent Trustees received a presentation from senior Fund management and reviewed the information provided, as well as a memorandum from their independent legal counsel. The Independent Trustees further discussed continuation of the Agreements in an executive session with independent legal counsel on November 1, 2017. The Board, including the Independent Trustees, at its November 2017 meeting, reviewed and evaluated the materials, including supplemental materials, provided to assist the Board in considering continuation of the Agreements.
In voting to approve continuation of the Agreements, the Board, including the Independent Trustees, considered whether continuation of the Agreements would be in the best interests of the Fund. No single factor or item of information reviewed by the Board was identified as the principal factor in determining whether to approve the Agreements. The Board considered that although no assets were currently being allocated to Western Asset, the Manager recommended that the Cash Management Agreement with Western Asset be continued to permit allocation of assets to Western Asset at such time as the Manager determined to be appropriate. Based upon its evaluation of all material factors, including those described below, the Board concluded that the terms of each of the Agreements are reasonable and fair and that it was in the best interests of the Fund to approve continuation of the Agreements.
The Board received and considered information regarding the nature, extent and quality of services provided to the Fund by the Manager and the Subadviser and available to be provided by Western Asset, under the Management, Advisory and Cash Management Agreements, respectively. The Board also considered the Manager’s supervisory activities over the Subadviser and Western Asset. In addition, the Board received and considered other information regarding the administrative and other services rendered to the Fund and its shareholders by the Manager and its affiliates. The Board noted information received at regular meetings throughout the year related to the services rendered by the Manager in its management of the Fund’s affairs, the Manager’s role in coordinating the activities of the
| | |
| 46 | | QS U.S. Small Capitalization Equity Fund |
Subadviser, Western Asset and the Fund’s other service providers and the services rendered by the Subadviser. The Board’s evaluation of the services provided by the Manager and the Subadviser took into account the Board’s knowledge and familiarity gained as Board members of funds in the Legg Mason fund complex, including the scope and quality of the investment management and other capabilities of the Manager, the Subadviser and Western Asset, and the quality of the Manager’s administrative and other services.
The Board reviewed the qualifications, backgrounds and responsibilities of the senior personnel serving the Fund and the portfolio management team primarily responsible for the day-to-day portfolio management of the Fund. The Board also considered the financial strength of the Manager’s parent organization, Legg Mason, Inc.
The Board considered the division of responsibilities among the Manager, the Subadviser and Western Asset and the oversight provided by the Manager. The Board also considered the Subadviser’s brokerage policies and practices, the standards applied in seeking best execution and the existence of quality controls applicable to brokerage allocation procedures. The Board noted that the Subadviser does not use soft dollars.
The Board received and reviewed performance information for the Fund and for a group of funds (the “Performance Universe”) selected by Broadridge, an independent provider of investment company data. The Board was provided a description of the methodology Broadridge used to determine the similarity of the Fund with the funds included in the Performance Universe. The Broadridge data also included a comparison of the Fund’s performance to the Fund’s designated benchmark. The Board noted that although useful, the data provided by Broadridge may vary depending on the end dates selected and the selection of a peer group. In addition, the trustees noted that they also had received and discussed at periodic intervals information comparing the Fund’s performance to that of its Performance Universe and benchmark, as well as other performance measures, such as Morningstar rankings, and had met with the Fund’s portfolio manager at in-person meetings during the year.
The Board considered that the Fund’s performance for the one-year period ended June 30, 2017 placed the Class IS Shares in the third quintile, and that the Fund’s performance for the three- and five-year periods ended June 30, 2017 placed the Class IS Shares in the second quintile (the first quintile being the best performers and the fifth quintile being the worst performers.) The Board noted that its evaluation of the factors of the nature, extent and quality of services and investment performance led it to conclude that, with respect to these factors, it was in the best interests of the Fund to approve continuation of the Agreements.
The Board reviewed and considered the contractual management fee (the “Contractual Management Fee”) payable by the Fund to the Manager in light of the nature, extent and quality of the management and advisory services provided by the Manager and the Subadviser, respectively. The Board reviewed the subadvisory fees, noting that the Manager,
| | |
| QS U.S. Small Capitalization Equity Fund | | 47 |
Board approval of management and subadvisory agreements (unaudited) (cont’d)
and not the Fund, pays the fee to the Subadviser and would pay the fee to Western Asset. In addition, the Board reviewed and considered the actual management fee rate (after taking into account fees waived by the Manager which partially reduced the management fee owed to the Manager under the Management Agreement) (the “Actual Management Fee”). The Board also considered that the contractual expense cap had been extended to December 31, 2019. In addition, the Manager had in place additional voluntary expense caps.
The Board also reviewed information regarding the fees the Manager and the Subadviser charged any of their U.S. clients that were included in the same performance composite as the Fund including, where applicable, separate accounts. The Manager reviewed with the Board the significant differences in the scope of services provided to the Fund and to such other clients, and that the Manager coordinates and oversees the provision of services to the Fund by other fund service providers, including the Subadviser and Western Asset. The Board considered the fee comparisons in light of the scope of services required to manage these different types of accounts.
Additionally, the Board received and considered information comparing the Fund’s Contractual Management Fee, Actual Management Fee and the Fund’s overall expense ratio with those of a group of funds selected by Broadridge as comparable to the Fund and with a broader universe of funds also selected by Broadridge. With respect to the Fund, the Board noted that for the Class IS Shares the Contractual and Actual Management Fees were lower than median (first quintile) and that the actual expense ratios were lower than the Broadridge expense group median (first quintile) and average and were lower than the expense universe median. The Board also reviewed the expense ratios for each class of shares of the Fund.
The Board was provided an overview of the process followed in conducting the profitability study and received a report on the profitability of Legg Mason in providing services to the Fund, based on financial information and business data for the 12 months ended March 31, 2017 and 2016, which corresponds to Legg Mason’s fiscal year end. The Board also received certain information showing historical profitability for fiscal years 2013 through 2017. The Board noted that in a prior year it had received a report by an independent consultant regarding its assessment of the methodologies used by Legg Mason for its profitability study and that Legg Mason detailed its changes in methodology from those used in 2016. The Board considered the profitability study along with the other materials previously provided to the Board and determined that the profitability was not excessive in light of the nature, extent and quality of the services provided to the Fund.
The Board received and considered information regarding whether there have been economies of scale with respect to the management of the Fund as the Fund’s assets have grown, whether the Fund has appropriately benefited from any economies of scale and whether there is potential for realization of any further economies of scale. Among other information, the Board reviewed management fee reductions due to waivers during the
| | |
| 48 | | QS U.S. Small Capitalization Equity Fund |
Manager’s 2013 through 2017 fiscal years. Given the asset size of the Fund and the complex, as well as the Contractual Management Fee, the Board concluded that although there were no current breakpoints, any economies of scale currently being realized were appropriately being reflected in the Actual Management Fee paid by the Fund.
The Board considered other benefits received by the Manager and its affiliates as a result of the Manager’s relationship with the Fund, including the opportunity to offer additional products and services to Fund shareholders. The Board also considered the information provided regarding amounts received by the Fund’s distributor and intermediary arrangements.
In light of the structure of the fees, the costs of providing investment management and other services to the Fund, the Manager’s ongoing commitment to the Fund and the ancillary benefits received, the Board concluded that the Management Fees were reasonable.
After evaluation of all material factors, the Board concluded that the continuation of each Agreement is in the best interests of the Fund.
| | |
| QS U.S. Small Capitalization Equity Fund | | 49 |
Additional information (unaudited)
Information about Trustees and Officers
The business and affairs of QS U.S. Small Capitalization Equity Fund (the “Fund”) are conducted by management under the supervision and subject to the direction of its Board of Trustees. The business address of each Trustee is c/o Jane Trust, Legg Mason, 100 International Drive, 11th Floor, Baltimore, Maryland 21202. Information pertaining to the Trustees and officers of the Fund is set forth below.
The Statement of Additional Information includes additional information about Trustees and is available, without charge, upon request by calling the Fund at 1-877-721-1926.
| | |
| Independent Trustees† |
| Ruby P. Hearn |
| Year of birth | | 1940 |
| Position(s) with Trust | | Trustee |
| Term of office1 and length of time served2 | | Since 2004 |
| Principal occupation(s) during past five years | | Senior Vice President Emerita of The Robert Wood Johnson Foundation (non-profit) since 2001; Member of the Institute of Medicine since 1982; formerly, Trustee of the New York Academy of Medicine (2004 to 2012); Director of the Institute for Healthcare Improvement (2002 to 2012); Senior Vice President of The Robert Wood Johnson Foundation (1996 to 2001); Fellow of The Yale Corporation (1992 to 1998) |
| Number of funds in fund complex overseen by Trustee | | 18 |
| Other board memberships held by Trustee during past five years | | None |
|
| Arnold L. Lehman |
| Year of birth | | 1944 |
| Position(s) with Trust | | Trustee and Chairman |
| Term of office1 and length of time served2 | | Since 1982 and since 2015 |
| Principal occupation(s) during past five years | | Senior Advisor, Phillips Auctioneer since 2015; Trustee of American Federation of Arts since 1998; formerly, Fellow, Ford Foundation (2015 to 2016); Director of the Brooklyn Museum (1997 to 2015); Director of The Baltimore Museum of Art (1979 to 1997) |
| Number of funds in fund complex overseen by Trustee | | 18 |
| Other board memberships held by Trustee during past five years | | None |
|
| Robin J.W. Masters |
| Year of birth | | 1955 |
| Position(s) with Trust | | Trustee |
| Term of office1 and length of time served2 | | Since 2002 |
| Principal occupation(s) during past five years | | Retired; formerly, Chief Investment Officer of ACE Limited (insurance) (1986 to 2000) |
| Number of funds in fund complex overseen by Trustee | | 18 |
| Other board memberships held by Trustee during past five years | | Director of Cheyne Capital International Limited (investment advisory firm); formerly, Director/Trustee of Legg Mason Institutional Funds plc, WA Fixed Income Funds plc and Western Asset Debt Securities Fund plc. (2007 to 2011) |
| | |
| 50 | | QS U.S. Small Capitalization Equity Fund |
| | |
| Independent Trustees† cont’d |
| Jill E. McGovern |
| Year of birth | | 1944 |
| Position(s) with Trust | | Trustee |
| Term of office1 and length of time served2 | | Since 1989 |
| Principal occupation(s) during past five years | | Senior Consultant, American Institute for Contemporary German Studies (AICGS) since 2007; formerly, Chief Executive Officer of The Marrow Foundation (non-profit) (1993 to 2007); Executive Director of the Baltimore International Festival (1991 to 1993); Senior Assistant to the President of The Johns Hopkins University (1986 to 1990) |
| Number of funds in fund complex overseen by Trustee | | 18 |
| Other board memberships held by Trustee during past five years | | Director of International Biomedical Research Alliance; Director of Lois Roth Endowment |
|
| Arthur S. Mehlman |
| Year of birth | | 1942 |
| Position(s) with Trust | | Trustee |
| Term of office1 and length of time served2 | | Since 2002 |
| Principal occupation(s) during past five years | | Retired. Director, The University of Maryland Foundation since 1992; Director, The League for People with Disabilities since 2003; formerly, Director, Municipal Mortgage & Equity LLC (2004 to 2011); Partner, KPMG LLP (international accounting firm) (1972 to 2002) |
| Number of funds in fund complex overseen by Trustee | | Director/Trustee of all Legg Mason Funds consisting of 18 portfolios; Director/Trustee of the Royce Family of Funds consisting of 22 portfolios |
| Other board memberships held by Trustee during past five years | | Director of Municipal Mortgage & Equity, LLC. (2004 to 2011) |
|
| G. Peter O’Brien |
| Year of birth | | 1945 |
| Position(s) with Trust | | Trustee |
| Term of office1 and length of time served2 | | Since 1999 |
| Principal occupation(s) during past five years | | Retired. Trustee Emeritus of Colgate University; Board Member, Hill House, Inc. (residential home care); Board Member, Bridges School (pre- school); formerly, Managing Director, Equity Capital Markets Group of Merrill Lynch & Co. (1971 to 1999) |
| Number of funds in fund complex overseen by Trustee | | Director/Trustee of all Legg Mason funds consisting of 18 portfolios; Director/Trustee of the Royce Family of Funds consisting of 22 portfolios |
| Other board memberships held by Trustee during past five years | | Director of TICC Capital Corp. (2003 to 2017) |
| | |
| QS U.S. Small Capitalization Equity Fund | | 51 |
Additional information (unaudited) (cont’d)
Information about Trustees and Officers
| | |
| Independent Trustees† cont’d |
| S. Ford Rowan |
| Year of birth | | 1943 |
| Position(s) with Trust | | Trustee |
| Term of office1 and length of time served2 | | Since 2002 |
| Principal occupation(s) during past five years | | Chairman, National Center for Critical Incident Analysis, since 2004; Consultant to University of Maryland University College, since 2013; formerly, Lecturer in Organizational Sciences, George Washington University (2000 to 2014); Trustee, St. John’s College (2006 to 2012); Consultant, Rowan & Blewitt Inc. (management consulting) (1984 to 2007); Lecturer in Journalism, Northwestern University (1980 to 1993); Director, Santa Fe Institute (1999 to 2008) |
| Number of funds in fund complex overseen by Trustee | | 18 |
| Other board memberships held by Trustee during past five years | | None |
|
| Robert M. Tarola |
| Year of birth | | 1950 |
| Position(s) with Trust | | Trustee |
| Term of office1 and length of time served2 | | Since 2004 |
| Principal occupation(s) during past five years | | President of Rights Advisory LLC (corporate finance and governance consulting) since 2008; Member, Investor Advisory Group of the Public Company Accounting Oversight Board since 2009; formerly, Executive Vice President and Chief Financial Officer, Southcoast Health System, Inc. (healthcare provider network) (2015 to 2017); Senior Vice President and Chief Financial Officer of The Howard University (2009 to 2013) (higher education and health care); Senior Vice President and Chief Financial Officer of W.R. Grace & Co. (specialty chemicals) (1999 to 2008) and MedStar Health, Inc. (healthcare) (1996 to 1999); Partner, Price Waterhouse, LLP (accounting and auditing) (1984 to 1996) |
| Number of funds in fund complex overseen by Trustee | | 18 |
| Other board memberships held by Trustee during past five years | | Director of American Kidney Fund (renal disease assistance); Director of XBRL International, Inc. (global data standard setting); Director of Vista Outdoor, Inc. (consumer outdoor recreation brands); formerly, Director of TeleTech Holdings, Inc. (business processing outsourcing) |
| | |
| | |
| 52 | | QS U.S. Small Capitalization Equity Fund |
| | |
| Interested Trustee |
| Jane Trust3 | | |
| Year of birth | | 1962 |
| Position(s) with Trust | | Trustee, President and Chief Executive Officer |
| Term of office1 and length of time served2 | | Since 2015 |
| Principal occupation(s) during past five years | | Managing Director of Legg Mason & Co., LLC (“Legg Mason & Co.”) (since 2016); Officer and/or Trustee/Director of 148 funds associated with Legg Mason Partners Fund Advisor, LLC (“LMPFA”) or its affiliates (since 2015); President and Chief Executive Officer of LMPFA (since 2015); formerly, Senior Vice President of LMPFA (2015); Director of ClearBridge, LLC (formerly, Legg Mason Capital Management, LLC) (2007 to 2014); Managing Director of Legg Mason Investment Counsel & Trust Co. (2000 to 2007) |
| Number of funds in fund complex overseen by Trustee | | 141 |
Other board memberships held by Trustee during past
five years | | None |
| | |
| Executive Officers |
Richard F. Sennett Legg Mason 100 International Drive, 7th Floor, Baltimore, MD 21202 | | |
| Year of birth | | 1970 |
| Position(s) with Trust | | Principal Financial Officer |
| Term of office1 and length of time served2 | | Since 2011 |
| Principal occupation(s) during past five years | | Principal Financial Officer and Treasurer of certain mutual funds associated with Legg Mason & Co. or its affiliates (since 2011 and since 2013); Managing Director of Legg Mason & Co. and Senior Manager of the Treasury Policy group for Legg Mason & Co.’s Global Fiduciary Platform (since 2011); formerly, Chief Accountant within the SEC’s Division of Investment Management (2007 to 2011); Assistant Chief Accountant within the SEC’s Division of Investment Management (2002 to 2007) |
| |
Robert I. Frenkel Legg Mason 100 First Stamford Place, 6th Floor, Stamford, CT 06902 | | |
| Year of birth | | 1954 |
| Position(s) with Trust | | Secretary and Chief Legal Officer |
| Term of office1 and length of time served2 | | Since 2007 |
| Principal occupation(s) during past five years | | Vice President and Deputy General Counsel of Legg Mason (since 2006); Managing Director and General Counsel of — U.S. Mutual Funds for Legg Mason & Co. (since 2006) and Legg Mason & Co. predecessors (since 1994); Secretary and Chief Legal Officer of certain mutual funds associated with Legg Mason & Co. or its affiliates (since 2006) and Legg Mason & Co. predecessors (prior to 2006) |
| | |
| QS U.S. Small Capitalization Equity Fund | | 53 |
Additional information (unaudited) (cont’d)
Information about Trustees and Officers
| | |
| Executive Officers cont’d |
Ted P. Becker
Legg Mason 620 Eighth Avenue, 49th Floor, New York, NY 10018 | | |
| Year of birth | | 1951 |
| Position(s) with Trust | | Vice President and Chief Compliance Officer |
| Term of office1 and length of time served2 | | Since 2007 |
| Principal occupation(s) during past five years | | Director of Global Compliance at Legg Mason (since 2006); Chief Compliance Officer of LMPFA (since 2006); Managing Director of Compliance of Legg Mason & Co. (since 2005); Chief Compliance Officer of certain mutual funds associated with Legg Mason & Co. or its affiliates (since 2006) and Legg Mason & Co. predecessors (prior to 2006) |
| |
Christopher Berarducci Legg Mason 620 Eighth Avenue, 49th Floor, New York, NY 10018 | | |
| Year of birth | | 1974 |
| Position(s) with Trust | | Treasurer |
| Term of office1 and length of time served2 | | Since 2010 |
| Principal occupation(s) during past five years | | Director of Legg Mason & Co. (since 2015); Treasurer of certain mutual funds associated with Legg Mason & Co. or its affiliates (since 2010); formerly, Vice President of Legg Mason & Co. (2011 to 2015); Assistant Controller of certain mutual funds associated with Legg Mason & Co. or its affiliates (prior to 2010) |
| |
Susan Kerr Legg Mason 620 Eighth Avenue, 49th Floor, New York, NY 10018 | | |
| Year of birth | | 1949 |
| Position(s) with Trust | | Chief Anti-Money Laundering Compliance Officer |
| Term of office1 and length of time served2 | | Since 2013 |
| Principal occupation(s) during past five years | | Assistant Vice President of Legg Mason & Co. and Legg Mason Investor Services, LLC (“LMIS”) (since 2010); Chief Anti-Money Laundering Compliance Officer of certain mutual funds associated with Legg Mason & Co. or its affiliates (since 2013) and Anti-Money Laundering Compliance Officer of LMIS (since 2012); Senior Compliance Officer of LMIS (since 2011); formerly, AML Consultant, DTCC (2010); AML Consultant, Rabobank Netherlands, (2009); First Vice President, Director of Marketing & Advertising Compliance and Manager of Communications Review Group at Citigroup Inc. (1996 to 2008) |
| | |
| 54 | | QS U.S. Small Capitalization Equity Fund |
| | |
| Executive Officers cont’d |
Jenna Bailey Legg Mason 100 First Stamford Place, 5th Floor, Stamford, CT 06902 | | |
| Year of birth | | 1978 |
| Position(s) with Trust | | Identity Theft Prevention Officer |
| Term of office1 and length of time served2 | | Since 2015 |
| Principal occupation(s) during past five years | | Identity Theft Prevention Officer of certain mutual funds associated with Legg Mason & Co. or its affiliates (since 2015); Compliance Officer of Legg Mason & Co. (since 2013); Assistant Vice President of Legg Mason & Co. (since 2011); formerly, Associate Compliance Officer of Legg Mason & Co. (2011 to 2013) |
| |
Jeanne M. Kelly Legg Mason 620 Eighth Avenue, 49th Floor, New York, NY 10018 | | |
| Year of birth | | 1951 |
| Position(s) with Trust | | Senior Vice President |
| Term of office1 and length of time served2 | | Since 2007 |
| Principal occupation(s) during past five years | | Senior Vice President of certain mutual funds associated with Legg Mason & Co. or its affiliates (since 2007); Senior Vice President of LMPFA (since 2006); President and Chief Executive Officer of LMAS and LMFAM (since 2015); Managing Director of Legg Mason & Co. (since 2005) and Legg Mason & Co. predecessors (prior to 2005); formerly, Senior Vice President of LMFAM (2013 to 2015) |
| † | Trustees who are not “interested persons” of the Fund within the meaning of Section 2(a)(19) of the Investment Company Act of 1940, as amended (the “1940 Act”). Each of the Independent Trustees serves on the standing committees of the Board of Trustees, which include the Audit Committee (chair: Arthur S. Mehlman), the Nominating Committee (co-chairs: G. Peter O’Brien and Jill E. McGovern), and the Independent Trustees Committee (chair: Arnold L. Lehman). |
| 1 | Each Trustee and officer serves until his or her respective successor has been duly elected and qualified or until his or her earlier death, resignation, retirement or removal. |
| 2 | Indicates the earliest year in which the Trustee became a board member for a fund in the Legg Mason fund complex or the officer took such office. |
| 3 | Ms. Trust is an “interested person” of the Fund, as defined in the 1940 Act, because of her position with LMPFA and/or certain of its affiliates. |
| | |
| QS U.S. Small Capitalization Equity Fund | | 55 |
Important tax information (unaudited)
The following information is provided with respect to the distributions paid during the taxable year ended December 31, 2017:
| | | | | | | | |
| Record date: | | | 6/12/2017 | | | | 12/19/2017 | |
| Payable date: | | | 6/13/2017 | | | | 12/20/2017 | |
| Ordinary income: | | | | | | | | |
Qualified dividend income for individuals | | | 44.52 | % | | | 100.00 | % |
Dividends qualifying for the dividends | | | | | | | | |
received deduction for corporations | | | 40.92 | % | | | 100.00 | % |
| Long-term capital gain dividend | | | — | | | | $0.752010 | |
The Fund designates additional long-term capital gains in the amount of $17,330,558.
Please retain this information for your records.
| | |
| 56 | | QS U.S. Small Capitalization Equity Fund |
QS
U.S. Small Capitalization Equity Fund
Trustees
Ruby P. Hearn
Arnold L. Lehman
Chairman
Robin J.W. Masters
Jill E. McGovern
Arthur S. Mehlman
G. Peter O’Brien
S. Ford Rowan
Robert M. Tarola
Jane Trust
Investment manager
Legg Mason Partners Fund Advisor, LLC
Subadviser
QS Investors, LLC
Distributor
Legg Mason Investor Services, LLC
Custodian
State Street Bank and Trust Company
Transfer agent
BNY Mellon Investment Servicing (US) Inc.
4400 Computer Drive
Westborough, MA 01581
Independent registered public accounting firm
PricewaterhouseCoopers LLP
Baltimore, MD
QS U.S. Small Capitalization Equity Fund
The Fund is a separate investment series of Legg Mason Global Asset Management Trust, a Maryland statutory trust.
QS U.S. Small Capitalization Equity Fund
Legg Mason Funds
620 Eighth Avenue, 49th Floor
New York, NY 10018
The Fund files its complete schedule of portfolio holdings with the Securities and Exchange Commission (“SEC”) for the first and third quarters of each fiscal year on Form N-Q. The Fund’s Forms N-Q are available on the SEC’s website at www.sec.gov. The Fund’s Forms N-Q may be reviewed and copied at the SEC’s Public Reference Room in Washington, D.C., and information on the operation of the Public Reference Room may be obtained by calling 1-800-SEC-0330. To obtain information on Form N-Q, shareholders can call the Fund at 1-877-721-1926.
Information on how the Fund voted proxies relating to portfolio securities during the prior 12-month period ended June 30th of each year and a description of the policies and procedures that the Fund uses to determine how to vote proxies related to portfolio transactions are available (1) without charge, upon request, by calling the Fund at 1-877-721-1926, (2) at www.leggmason.com/mutualfunds and (3) on the SEC’s website at www.sec.gov.
This report is submitted for the general information of the shareholders of QS U.S. Small Capitalization Equity Fund. This report is not authorized for distribution to prospective investors in the Fund unless preceded or accompanied by a current prospectus.
Investors should consider the Fund’s investment objectives, risks, charges and expenses carefully before investing. The prospectus contains this and other important information about the Fund. Please read the prospectus carefully before investing.
www.leggmason.com
© 2018 Legg Mason Investor Services, LLC
Member FINRA, SIPC
Legg Mason Funds Privacy and Security Notice
Your Privacy and the Security of Your Personal Information is Very Important to the Legg Mason Funds
This Privacy and Security Notice (the “Privacy Notice”) addresses the Legg Mason Funds’ privacy and data protection practices with respect to nonpublic personal information the Funds receive. The Legg Mason Funds include any funds sold by the Funds’ distributor, Legg Mason Investor Services, LLC, as well as Legg Mason-sponsored closed-end funds and certain closed-end funds managed or sub-advised by Legg Mason or its affiliates. The provisions of this Privacy Notice apply to your information both while you are a shareholder and after you are no longer invested with the Funds.
The Type of Nonpublic Personal Information the Funds Collect About You
The Funds collect and maintain nonpublic personal information about you in connection with your shareholder account. Such information may include, but is not limited to:
| • | | Personal information included on applications or other forms; |
| • | | Account balances, transactions, and mutual fund holdings and positions; |
| • | | Online account access user IDs, passwords, security challenge question responses; and |
| • | | Information received from consumer reporting agencies regarding credit history and creditworthiness (such as the amount of an individual’s total debt, payment history, etc.). |
How the Funds Use Nonpublic Personal Information About You
The Funds do not sell or share your nonpublic personal information with third parties or with affiliates for their marketing purposes, or with other financial institutions or affiliates for joint marketing purposes, unless you have authorized the Funds to do so. The Funds do not disclose any nonpublic personal information about you except as may be required to perform transactions or services you have authorized or as permitted or required by law. The Funds may disclose information about you to:
| • | | Employees, agents, and affiliates on a “need to know” basis to enable the Funds to conduct ordinary business or comply with obligations to government regulators; |
| • | | Service providers, including the Funds’ affiliates, who assist the Funds as part of the ordinary course of business (such as printing, mailing services, or processing or servicing your account with us) or otherwise perform services on the Funds’ behalf, including companies that may perform marketing services solely for the Funds; |
| • | | The Funds’ representatives such as legal counsel, accountants and auditors; and |
| • | | Fiduciaries or representatives acting on your behalf, such as an IRA custodian or trustee of a grantor trust. |
|
| NOT PART OF THE ANNUAL REPORT |
Legg Mason Funds Privacy and Security Notice (cont’d)
Except as otherwise permitted by applicable law, companies acting on the Funds’ behalf are contractually obligated to keep nonpublic personal information the Funds provide to them confidential and to use the information the Funds share only to provide the services the Funds ask them to perform.
The Funds may disclose nonpublic personal information about you when necessary to enforce their rights or protect against fraud, or as permitted or required by applicable law, such as in connection with a law enforcement or regulatory request, subpoena, or similar legal process. In the event of a corporate action or in the event a Fund service provider changes, the Funds may be required to disclose your nonpublic personal information to third parties. While it is the Funds’ practice to obtain protections for disclosed information in these types of transactions, the Funds cannot guarantee their privacy policy will remain unchanged.
Keeping You Informed of the Funds’ Privacy and Security Practices
The Funds will notify you annually of their privacy policy as required by federal law. While the Funds reserve the right to modify this policy at any time they will notify you promptly if this privacy policy changes.
The Funds’ Security Practices
The Funds maintain appropriate physical, electronic and procedural safeguards designed to guard your nonpublic personal information. The Funds’ internal data security policies restrict access to your nonpublic personal information to authorized employees, who may use your nonpublic personal information for Fund business purposes only.
Although the Funds strive to protect your nonpublic personal information, they cannot ensure or warrant the security of any information you provide or transmit to them, and you do so at your own risk. In the event of a breach of the confidentiality or security of your nonpublic personal information, the Funds will attempt to notify you as necessary so you can take appropriate protective steps. If you have consented to the Funds using electronic communications or electronic delivery of statements, they may notify you under such circumstances using the most current email address you have on record with them.
In order for the Funds to provide effective service to you, keeping your account information accurate is very important. If you believe that your account information is incomplete, not accurate or not current, or if you have questions about the Funds’ privacy practices, write the Funds using the contact information on your account statements, email the Funds by clicking on the Contact Us section of the Funds’ website at www.leggmason.com, or contact the Fund at 1-877-721-1926.
|
| NOT PART OF THE ANNUAL REPORT |
www.leggmason.com
© 2018 Legg Mason Investor Services, LLC Member FINRA, SIPC
LMFX013159 2/18 SR18-3282
The registrant has adopted a code of ethics that applies to the registrant’s principal executive officer, principal financial officer, principal accounting officer or controller.
| ITEM 3. | AUDIT COMMITTEE FINANCIAL EXPERT. |
The Board of Trustees of the registrant has determined that Arthur S. Mehlman the Chairman of the Board’s Audit Committee and Robert M. Tarola, possess the technical attributes identified in Instruction 2(b) of Item 3 to Form N-CSR to qualify as “audit committee financial experts,” and have designated Mr. Mehlman and Mr. Tarola as the Audit Committee’s financial experts. Mr. Mehlman and Mr. Tarola are “independent” Trustees pursuant to paragraph (a) (2) of Item 3 to Form N-CSR.
| ITEM 4. | PRINCIPAL ACCOUNTANT FEES AND SERVICES. |
a) Audit Fees. The aggregate fees billed in the last two fiscal years ending December 31, 2016 and December 31, 2017 (the “Reporting Periods”) for professional services rendered by the Registrant’s principal accountant (the “Auditor”) for the audit of the Registrant’s annual financial statements, or services that are normally provided by the Auditor in connection with the statutory and regulatory filings or engagements for the Reporting Periods, were $133,424 in December 31, 2016 and $57,354 in December 31, 2017.
b) Audit-Related Fees. The aggregate fees billed in the Reporting Period for assurance and related services by the Auditor that are reasonably related to the performance of the Registrant’s financial statements were $0 in December 31, 2016 and $0 in December 31, 2017.
(c) Tax Fees. The aggregate fees billed in the Reporting Periods for professional services rendered by the Auditor for tax compliance, tax advice and tax planning (“Tax Services”) were $17,540 in December 31, 2016 and $20,817 in December 31, 2017. These services consisted of (i) review or preparation of U.S. federal, state, local and excise tax returns; (ii) U.S. federal, state and local tax planning, advice and assistance regarding statutory, regulatory or administrative developments, and (iii) tax advice regarding tax qualification matters and/or treatment of various financial instruments held or proposed to be acquired or held.
There were no fees billed for tax services by to the service affiliates during the Reporting Periods that required pre-approval by the Audit Auditors Committee.
d) All Other Fees. The aggregate fees for other fees billed in the Reporting Periods for products and services provided by the Auditor were $1,539 in December 31, 2016 and $0 in December 31, 2017, other than the services reported in paragraphs (a) through (c) of this item for the Legg Mason Global Asset Management Trust.
All Other Fees. There were no other non-audit services rendered by the Auditor to Legg Mason Partners Fund Advisors, LLC (“LMPFA”), and any entity controlling, controlled by or under common control with LMPFA that provided ongoing services to Legg Mason Global Asset Management Trust requiring pre-approval by the Audit Committee in the Reporting Period.
(e) Audit Committee’s pre–approval policies and procedures described in paragraph (c)
(7) of Rule 2-01 of Regulation S-X.
(1) The Charter for the Audit Committee (the “Committee”) of the Board of each registered investment company (the “Fund”) advised by LMPFA or one of their affiliates (each, an “Adviser”) requires that the Committee shall approve (a) all audit and permissible non-audit services to be provided to the Fund and (b) all permissible non-audit services to be provided by the Fund’s independent auditors to the Adviser and any Covered Service Providers if the engagement relates directly to the operations and financial reporting of the Fund. The Committee may implement policies and procedures by which such services are approved other than by the full Committee.
The Committee shall not approve non-audit services that the Committee believes may impair the independence of the auditors. As of the date of the approval of this Audit Committee Charter, permissible non-audit services include any professional services (including tax services), that are not prohibited services as described below, provided to the Fund by the independent auditors, other than those provided to the Fund in connection with an audit or a review of the financial statements of the Fund. Permissible non-audit services may not include: (i) bookkeeping or other services related to the accounting records or financial statements of the Fund; (ii) financial information systems design and implementation; (iii) appraisal or valuation services, fairness opinions or contribution-in-kind reports; (iv) actuarial services; (v) internal audit outsourcing services; (vi) management functions or human resources; (vii) broker or dealer, investment adviser or investment banking services; (viii) legal services and expert services unrelated to the audit; and (ix) any other service the Public Company Accounting Oversight Board determines, by regulation, is impermissible.
Pre-approval by the Committee of any permissible non-audit services is not required so long as: (i) the aggregate amount of all such permissible non-audit services provided to the Fund, the Adviser and any service providers controlling, controlled by or under common control with the Adviser that provide ongoing services to the Fund (“Covered Service Providers”) constitutes not more than 5% of the total amount of revenues paid to the independent auditors during the fiscal year in which the permissible non-audit services are provided to (a) the Fund, (b) the Adviser and (c) any entity controlling, controlled by or under common control with the Adviser that provides ongoing services to the Fund during the fiscal year in which the services are provided that would have to be approved by the Committee; (ii) the permissible non-audit services were not recognized by the Fund at the time of the engagement to be non-audit services; and (iii) such services are promptly brought to the attention of the Committee and approved by the Committee (or its delegate(s)) prior to the completion of the audit.
(2) For the Legg Mason Global Asset Management Trust, the percentage of fees that were approved by the audit committee, with respect to: Audit-Related Fees were 100% and 100% for December 31, 2016 and December 31, 2017; Tax Fees were 100% and 100% for December 31, 2016 and December 31, 2017; and Other Fees were 100% and 100% for December 31, 2016 and December 31, 2017.
(f) N/A
(g) Non-audit fees billed by the Auditor for services rendered to Legg Mason Global Asset Management Trust, LMPFA and any entity controlling, controlled by, or under common control with LMPFA that provides ongoing services to Legg Mason Global Asset Management Trust during the reporting period were $188,614 in December 31, 2016 and $160,000 in December 31, 2017.
(h) Yes. Legg Mason Global Asset Management Trust’s Audit Committee has considered whether the provision of non-audit services that were rendered to Service Affiliates, which were not pre-approved (not requiring pre-approval), is compatible with maintaining the Accountant’s independence. All services provided by the Auditor to the Legg Mason Global Asset Management Trust or to Service Affiliates, which were required to be pre-approved, were pre-approved as required.
| ITEM 5. | AUDIT COMMITTEE OF LISTED REGISTRANTS. |
| | a) | The independent board members are acting as the registrant’s audit committee as specified in Section 3(a)(58)(B) of the Exchange Act .The Audit Committee consists of the following Board members: |
Ruby P. Hearn
Arnold L. Lehman
Robin J.W. Masters
Jill E. McGovern
Arthur S. Mehlman
G. Peter O’Brien
S. Ford Rowan
Robert M. Tarola
| ITEM 6. | SCHEDULE OF INVESTMENTS. |
Included herein under Item 1.
| ITEM 7. | DISCLOSURE OF PROXY VOTING POLICIES AND PROCEDURES FOR CLOSED-END MANAGEMENT INVESTMENT COMPANIES. |
Not applicable.
| ITEM 8. | PORTFOLIO MANAGERS OF CLOSED-END MANAGEMENT INVESTMENT COMPANIES. |
Not applicable.
| ITEM 9. | PURCHASES OF EQUITY SECURITIES BY CLOSED-END MANAGEMENT INVESTMENT COMPANY AND AFFILIATED PURCHASERS. |
Not applicable.
| ITEM 10. | SUBMISSION OF MATTERS TO A VOTE OF SECURITY HOLDERS. |
Not applicable.
| ITEM 11. | CONTROLS AND PROCEDURES. |
(a) The registrant’s principal executive officer and principal financial officer have concluded that the registrant’s disclosure controls and procedures (as defined in Rule 30a- 3(c) under the Investment Company Act of 1940, as amended (the “1940 Act”)) are effective as of a date within 90 days of the filing date of this report that includes the disclosure required by this paragraph, based on their evaluation of the disclosure controls and procedures required by Rule 30a-3(b) under the 1940 Act and 15d-15(b) under the Securities Exchange Act of 1934.
| | (b) | There were no changes in the registrant’s internal control over financial reporting (as defined in Rule 30a-3(d) under the 1940 Act) that occurred during the second fiscal quarter of the period covered by this report that have materially affected, or are likely to materially affect the registrant’s internal control over financial reporting. |
(a) (1) Code of Ethics attached hereto.
Exhibit 99.CODE ETH
(a) (2) Certifications pursuant to section 302 of the Sarbanes-Oxley Act of 2002 attached hereto.
Exhibit 99.CERT
(b) Certifications pursuant to Section 906 of the Sarbanes-Oxley Act of 2002 attached hereto.
Exhibit 99.906CERT
SIGNATURES
Pursuant to the requirements of the Securities Exchange Act of 1934 and the Investment Company Act of 1940, the registrant has duly caused this Report to be signed on its behalf by the undersigned, there unto duly authorized.
Legg Mason Global Asset Management Trust
| | |
| |
| By: | | /s/ Jane Trust |
| | Jane Trust |
| | Chief Executive Officer |
Date: February 22, 2018
Pursuant to the requirements of the Securities Exchange Act of 1934 and the Investment Company Act of 1940, this report has been signed below by the following persons on behalf of the registrant and in the capacities and on the dates indicated.
| | |
| |
| By: | | /s/ Jane Trust |
| | Jane Trust |
| | Chief Executive Officer |
Date: February 22, 2018
| | |
| |
| By: | | /s/ Richard F. Sennett |
| | Richard F. Sennett |
| | Principal Financial Officer |
Date: February 22, 2018