UNITED STATES
SECURITIES AND EXCHANGE COMMISSION
Washington, D.C. 20549
FORM N-CSR
CERTIFIED SHAREHOLDER REPORT OF REGISTERED
MANAGEMENT INVESTMENT COMPANIES
Investment Company Act file number 811-22338
Legg Mason Global Asset Management Trust
(Exact name of registrant as specified in charter)
620 Eighth Avenue, 49th Floor, New York, NY 10018
(Address of principal executive offices) (Zip code)
Robert I. Frenkel, Esq.
Legg Mason & Co., LLC
100 First Stamford Place
Stamford, CT 06902
(Name and address of agent for service)
Registrant’s telephone number, including area code: 1-877-721-1926
Date of fiscal year end: September 30
Date of reporting period: September 30, 2018
| ITEM 1. | REPORT TO STOCKHOLDERS |
The Annual Report to Stockholders is filed herewith.

| | |
| Annual Report | | September 30, 2018 |
QS
STRATEGIC REAL RETURN FUND

|
| INVESTMENT PRODUCTS: NOT FDIC INSURED • NO BANK GUARANTEE • MAY LOSE VALUE |
Fund objective
The Fund seeks to provide an attractive long-term real return.
Letter from the president

Dear Shareholder,
We are pleased to provide the annual report of QS Strategic Real Return Fund for the twelve-month reporting period ended September 30, 2018. Please read on for a detailed look at prevailing economic and market conditions during the Fund’s reporting period and to learn how those conditions have affected Fund performance.
As always, we remain committed to providing you with excellent service and a full spectrum of investment choices. We also remain committed to supplementing the support you receive from your financial advisor. One way we accomplish this is through our website, www.leggmason.com. Here you can gain immediate access to market and investment information, including:
| • | | Fund prices and performance, |
| • | | Market insights and commentaries from our portfolio managers, and |
| • | | A host of educational resources. |
We look forward to helping you meet your financial goals.
Sincerely,

Jane Trust, CFA
President and Chief Executive Officer
October 31, 2018
| | |
| II | | QS Strategic Real Return Fund |
Investment commentary
Economic review
Economic activity in the U.S. was mixed during the twelve months ended September 30, 2018 (the “reporting period”). Looking back, the U.S. Department of Commerce reported that fourth quarter 2017 and first quarter 2018 U.S. gross domestic product (“GDP”)i growth was 2.3% and 2.2%, respectively. GDP growth then accelerated to 4.2% during the second quarter of 2018 — the strongest reading since the third quarter of 2014. Finally, the U.S. Department of Commerce’s initial reading for third quarter 2018 GDP growth — released after the reporting period ended — was 3.5%. The deceleration in GDP growth in the third quarter of 2018 reflected a downturn in exports and a deceleration in nonresidential fixed investment. Imports increased in the third quarter after decreasing in the second. These movements were partly offset by an upturn in private inventory investment.
Job growth in the U.S. was solid overall and supported the economy during the reporting period. As reported by the U.S. Department of Labor, when the reporting period ended on September 30, 2018, the unemployment rate was 3.7%, versus 4.1% when the period began. September 2018’s reading was the lowest unemployment rate since 1969. The percentage of longer-term unemployed also declined during the reporting period. In September 2018, 22.9% of Americans looking for a job had been out of work for more than six months, versus 24.8% when the period began.
Turning to the global economy, in its October 2018 World Economic Outlook — released after the reporting period ended — the International Monetary Fund (“IMF”)ii said, “Global growth for 2018–19 is projected to remain steady at its 2017 level, but its pace is less vigorous than projected in April [2018] and it has become less balanced. Downside risks to global growth have risen in the past six months and the potential for upside surprises has receded.” From a regional perspective, the IMF projects 2018 growth in the Eurozone will be 2.0%, versus 2.4% in 2017. Japan’s economy is expected to expand 1.1% in 2018, compared to 1.7% in 2017. Elsewhere, the IMF projects that overall growth in emerging market countries will accelerate to 4.7% in 2018, the same as in 2017.
Looking back, at its meeting that concluded on September 20, 2017, the Federal Reserve Board (the “Fed”)iii kept the federal funds rateiv on hold, but reiterated its intention to begin reducing its balance sheet, saying, “In October, the Committee will initiate the balance sheet normalization program….” At its meeting that ended on December 13, 2017, the Fed raised rates to a range between 1.25% and 1.50%. As expected, the Fed kept rates on hold at its meeting that concluded on January 31, 2018. However, at its meeting that ended on March 21, 2018, the Fed again raised the federal funds rate, moving it to a range between 1.50% and 1.75%. At its meeting that concluded on June 13, 2018, the Fed raised the federal funds rate to a range between 1.75% and 2.00%. Finally, at its meeting that ended on September 26, 2018, the Fed raised the federal funds rate to a range between 2.00% and 2.25%.
Central banks outside the U.S. took different approaches to monetary policy during the reporting period. Looking back, in December 2016, the European Central Bank (“ECB”)v extended its bond buying program until December 2017. From April 2017 through
| | |
| QS Strategic Real Return Fund | | III |
Investment commentary (cont’d)
December 2017, the ECB purchased €60 billion-per-month of bonds. In October 2017, the ECB announced that it would continue to buy bonds through September 2018, but after December 2017 it would pare its purchases to €30 billion-per-month. In June 2018, the ECB announced it would end its bond buying program by the end of the year, but it did not anticipate raising interest rates “at least through the summer of 2019”. In other developed countries, on November 2, 2017, the Bank of Englandvi raised rates from 0.25% to 0.50% — the first increase since July 2007. It then raised rates to 0.75% at its meeting on August 2, 2018. After holding rates steady at 0.10% for more than five years, in January 2016, the Bank of Japanvii announced that it cut the rate on current accounts that commercial banks hold with it to -0.10% and kept rates on hold during the reporting period. Elsewhere, the People’s Bank of Chinaviii kept rates steady at 4.35% during the reporting period.
Inflation remained generally well contained during the reporting period. For the twelve months ended September 30, 2018, the seasonally unadjusted rate of inflation, as measured by the Consumer Price Index for All Urban Consumers (“CPI-U”)ix, was 2.3%. The CPI-U less food and energy was 2.2% over the same period. Inflation-protected securities generated a small gain during the reporting period. For the twelve months ended September 30, 2018, the Bloomberg Barclays U.S. Treasury Inflation-Linked Bond Indexx returned 0.41%.
As always, thank you for your confidence in our stewardship of your assets.
Sincerely,
Jane Trust, CFA
President and Chief Executive Officer
October 31, 2018
All investments are subject to risk including the possible loss of principal. Past performance is no guarantee of future results. All index performance reflects no deduction for fees, expenses or taxes. Please note that an investor cannot invest directly in an index. Forecasts and predictions are inherently limited and should not be relied upon as an indication of actual or future performance.
| | |
| IV | | QS Strategic Real Return Fund |
| i | Gross domestic product (“GDP”) is the market value of all final goods and services produced within a country in a given period of time. |
| ii | The International Monetary Fund (“IMF”) is an organization of 189 countries, working to foster global monetary cooperation, secure financial stability, facilitate international trade, promote high employment and sustainable economic growth, and reduce poverty around the world. |
| iii | The Federal Reserve Board (the “Fed”) is responsible for the formulation of U.S. policies designed to promote economic growth, full employment, stable prices, and a sustainable pattern of international trade and payments. |
| iv | The federal funds rate is the rate charged by one depository institution on an overnight sale of immediately available funds (balances at the Federal Reserve) to another depository institution; the rate may vary from depository institution to depository institution and from day to day. |
| v | The European Central Bank (“ECB”) is responsible for the monetary system of the European Union and the euro currency. |
| vi | The Bank of England (“BoE”), formally the Governor and Company of the BoE, is the central bank of the United Kingdom. The BoE’s purpose is to maintain monetary and financial stability. |
| vii | The Bank of Japan is the central bank of Japan. The bank is responsible for issuing and handling currency and treasury securities, implementing monetary policy, maintaining the stability of the Japanese financial system and the yen currency. |
| viii | The People’s Bank of China is the central bank of the People’s Republic of China with the power to carry out monetary policy and regulate financial institutions in mainland China. |
| ix | The Consumer Price Index for All Urban Consumers (“CPI-U”) is a measure of the average change in prices over time of goods and services purchased by households, which covers approximately 87% of the total population and includes, in addition to wage earners and clerical worker households, groups such as professional, managerial and technical workers, the self-employed, short-term workers, the unemployed and retirees and others not in the labor force. |
| x | The Bloomberg Barclays U.S. Treasury Inflation-Linked Bond Index represents an unmanaged market index made up of U.S. Treasury Inflation-Linked Index securities. |
| | |
| QS Strategic Real Return Fund | | V |
Fund overview
Q. What is the Fund’s investment strategy?
A. Under normal market conditions, the Fund, using a tactical asset allocation program, seeks to provide an attractive long-term real return. The Fund defines real return as total return reduced by the impact of inflation. In seeking to meet its investment objective, the Fund implements a tactical asset allocation program overseen by its adviser and a subadviser, QS Investors, LLC (“QS Investors”). The Fund may allocate its assets among five investment “sleeves” which we believe are generally complementary to each other, with the following target allocations of the Fund’s net assets:
| • | | Inflation-Linked Debt Securities (40%) |
| • | | Global Equity Securities (20%) |
| • | | Commodity-Linked Securities (20%) |
| • | | Exchange-Traded Funds (“ETFs”) that invest in Real Estate Investment Trusts (“REITs”)i (10%) |
| • | | Tactical Strategy (10%) |
Actual allocations may deviate from each target allocation shown above by up to 50% of such target allocation. The composition and asset allocation of the Fund’s investment portfolio will vary over time, based on QS Investors’ overall allocation decisions, and may be changed without shareholder approval. Asset allocation decisions are primarily based on QS Investors’ evaluations of the relative attractiveness of the asset classes in which the Fund invests. The processes take into account several factors, including quantitative analysis, qualitative inputs and risk management guidelines. Holdings in a particular strategy may also vary because of performance differences among the different strategies.
The Fund utilizes a “multi-manager” approach, whereby the adviser and each subadviser provide day-to-day management for one or more of the investment sleeves. The adviser and each subadviser use different investment strategies in managing the sleeves, act independently from the others in their management of the investment sleeve for which they are responsible, and use their own methodology for selecting investments. Currently, Western Asset Management Company, LLC (formerly known as Western Asset Management Company) (“Western Asset”), Western Asset Management Company Limited in London (“WAML”) and Western Asset Management Company Ltd in Japan (“Western Japan”) manage the Inflation-Linked Debt Securities Sleeve and, QS Investors manages the Global Equity Securities Sleeve, the Commodity-Linked Securities Sleeve, the ETF REITs Sleeve and the Tactical Strategy Sleeve. QS Investors may also allocate a portion of the Fund’s assets to ClearBridge Investments, LLC (“ClearBridge”), either in place of, or in addition to, the subadvisers named above. Western Asset also manages the portion of the Fund’s cash and short-term instruments allocated to it. The Fund may use commodity derivatives (swaps and S&P GSCI®ii futures) to gain exposure to commodities. These derivatives are fully collateralized with cash.
Q. What were the overall market conditions during the Fund’s reporting period?
A. The twelve-month reporting period ended September 30, 2018 was a period of strong equity growth across most major regions but generally stagnant fixed income markets, suggesting continued “risk on” sentiment globally. During the reporting period, global
| | |
| QS Strategic Real Return Fund 2018 Annual Report | | 1 |
Fund overview (cont’d)
developed market equities appreciated 9.77%, led by the U.S. which returned 17.91% (as reflected by the MSCI All Country World Indexiii and the S&P 500 Indexiv, respectively). Hurt by the strength of the U.S. dollar during the reporting period, emerging market equities underperformed developed market equities, returning -0.81%, as measured by the MSCI Emerging Markets Indexv. The reporting period also saw sustained inflation growth, as measured by the U.S. Consumer Price Index (“CPI”)vi.
Throughout 2017, including the fourth calendar quarter of 2017, major U.S. equity indices continued to set new, all-time highs. With these new highs, valuations also matched historic levels. The fourth quarter’s strong equity market performance was driven by many advanced economies approaching full employment and inflation rising slowly. In addition to this, a variety of strong economic indicators throughout the quarter, including global manufacturing data, consumer confidence levels and new home starts, provided additional fuel for broad equity market appreciation. In addition to economic data, government action, including President Trump’s tax cuts, also supported equity growth. All of these pro-growth factors contributed to muted results in the fixed income market. Also, in global markets this quarter, commodities had their strongest quarter of performance of 2017, attributed to a sharp rise in crude oil prices during the quarter.
The persistent trend of global equity growth ended in the first quarter of 2018. For most stock indexes, performance in January 2018 remained strong, but trended downward for the remainder of the quarter. Prices also exhibited a high degree of “whipsaw,” which led to a sharp and quick increase in equity volatility. The sell-off across global equity markets was sparked in February 2018 by data released early in that month which showed U.S. inflation had picked up more than consensus estimates. In March 2018, the decline in equities was largely driven by geopolitical factors and resulting uncertainty — specifically tariff rhetoric. Reacting to the sell-off in equities, global fixed income assets appreciated during the quarter. Thus, global fixed income resumed its traditional role as a hedge to the performance of equities — a role that had been recently inconsistent. However, U.S. fixed income continued to display an inconsistent correlation to U.S. equities, and U.S. investment grade bonds ended the first quarter of 2018 down.
The second quarter of 2018 was characterized by a number of geopolitical events, their subsequent headlines, and market reaction, including the U.S. and China trade tariffs and retaliatory measures, U.S ten-year Treasury yield increases, the U.S. pulling out of the Iran nuclear accord and the U.S. Federal Reserve Board (the “Fed”)vii raising its target rate in June 2018. Equity market performance in the second quarter was divided across geographic lines — developed markets performed well, while emerging markets struggled. Positive equity performance in developed markets came in spite of global trade war escalations, which was likely mitigated by generally favorable economic indicators such as strong PMI data and consumer confidence levels. The poor performance in emerging market stocks reflected the long standing negative relationship to U.S. dollar strength, which appreciated 5.0% in the second quarter of 2018. Global fixed income depreciated during the quarter,
| | |
| 2 | | QS Strategic Real Return Fund 2018 Annual Report |
reflecting very weak performance across global ex-U.S. government debt. While commodity performance was flat in the second quarter, crude oil reached prices not seen since the end of 2014 on increased global demand, unplanned supply distributions in Canada and Libya, supply cuts from Saudi Arabia and Russia, and concerns surrounding Iranian sanctions following the U.S.’s decision to pull out of the Iran nuclear accord.
Global equity growth resumed in the third quarter of 2018, driven by U.S. equities. International developed stocks appreciated as well, while emerging market equities continued to struggle, ending the third quarter essentially flat. Though there is a greater degree of dispersion in global equity returns this year versus the last, the asset class’s broad strength this reporting period is a contrast to global fixed income, which has struggled. In the third quarter of 2018, global bonds again depreciated. The U.S. bond markets fared slightly better, where performance was flat during the quarter.
Q. How did we respond to these changing market conditions?
A. Our process focuses mostly on strategic allocation which diversifies among traditional and alternative asset classes and is designed to hedge against short-term and long term-inflation. During the reporting period, no changes were made to the strategic weights. However, three of the underlying sleeves do use active management in order to take advantage of changing investment opportunities. In the Inflation-Linked Debt Securities sleeve the managers added to the Fund’s small allocation to U.S. dollar-denominated emerging market sovereign debt as they saw value after those markets sold-off. In the Global Equity Securities sleeve, the managers adjusted their positions across sectors based on the current inflation regime. Over the past twelve months, they have been slightly overweight in the Financials and Health Care sectors, while maintaining a balanced exposure to valuation and sentiment. Finally, the Tactical Strategy sleeve shifted among global assets to take advantage of changes in global outlook. Tactical views were taken in the global equities, global fixed income and currency markets. Over the reporting period, the Tactical Strategy sleeve managers maintained an overweight to both equities and fixed income. On the currency side they shifted several times between a short and long position in the U.S. dollar versus foreign currencies over the first part of the year, but then spent the second part of the year in favor of a stronger U.S. dollar.
Performance review
For the twelve months ended September 30, 2018, Class A shares of QS Strategic Real Return Fund, excluding sales charges, returned 6.32%. The Fund’s unmanaged benchmark, the Bloomberg Barclays U.S. Treasury Inflation-Linked Bond Indexviii, returned 0.41% and the Composite Indexix, representing the Fund’s underlying investments, returned 6.21% over the same period. The Lipper Flexible Portfolio Funds
| | |
| QS Strategic Real Return Fund 2018 Annual Report | | 3 |
Fund overview (cont’d)
Category Average1 returned 4.68% over the same time frame.
| | | | | | | | |
Performance Snapshot as of September 30, 2018
(unaudited) | |
| (excluding sales charges) | | 6 months | | | 12 months | |
| QS Strategic Real Return Fund: | | | | | | | | |
Class A | | | 2.51 | % | | | 6.32 | % |
Class A2 | | | 2.38 | % | | | 6.13 | % |
Class C | | | 2.16 | % | | | 5.51 | % |
Class I | | | 2.62 | % | | | 6.62 | % |
Class IS | | | 2.66 | % | | | 6.62 | % |
| Bloomberg Barclays U.S. Treasury Inflation-Linked Bond Index | | | -0.05 | % | | | 0.41 | % |
| Composite Index | | | 1.60 | % | | | 6.21 | % |
| Lipper Flexible Portfolio Funds Category Average1 | | | 2.76 | % | | | 4.68 | % |
The performance shown represents past performance. Past performance is no guarantee of future results and current performance may be higher or lower than the performance shown above. Principal value and investment returns will fluctuate and investors’ shares, when redeemed, may be worth more or less than their original cost. To obtain performance data current to the most recent month-end, please visit our website at www.leggmason.com/mutualfunds.
All share class returns assume the reinvestment of all distributions at net asset value and the deduction of all Fund expenses. Returns have not been adjusted to include sales charges that may apply or the deduction of taxes that a shareholder would pay on Fund distributions. If sales charges were reflected, the performance quoted would be lower. Performance figures for periods shorter than one year represent cumulative figures and are not annualized.
Fund performance figures reflect fee waivers and/or expense reimbursements, without which the performance would have been lower.
| | | | |
| Total Annual Operating Expenses (unaudited) |
As of the Fund’s current prospectus dated February 1, 2018, the gross total annual fund operating expense ratios for Class A, Class A2, Class C, Class I and Class IS shares were 1.49%, 1.75%, 2.30%, 1.23% and 1.10%, respectively.
Actual expenses may be higher. For example, expenses may be higher than those shown if average net assets decrease. Net assets are more likely to decrease and Fund expense ratios are more likely to increase when markets are volatile.
As a result of expense limitation arrangements, the ratio of total annual fund operating expenses, other than interest, brokerage commissions (except for brokerage commissions paid on purchases and sales of shares of exchange-traded funds (“ETFs”)), dividend expense on short sales, taxes and extraordinary expenses, to average net assets will not exceed 1.35% for Class A shares, 1.55% for Class A2 shares, 2.10% for Class C shares, 1.10% for Class I shares and 1.00% for Class IS shares. In addition, the ratio of total annual fund operating expenses for Class IS shares will not exceed the ratio of total annual fund operating expenses for Class I shares. Acquired fund fees and expenses are subject to these arrangements. These expense limitation arrangements take into account the expenses of the underlying funds. Total
| 1 | Lipper, Inc., a wholly-owned subsidiary of Reuters, provides independent insight on global collective investments. Returns are based on the period ended September 30, 2018, including the reinvestment of all distributions, including returns of capital, if any, calculated among the 647 funds for the six-month period and among the 615 funds for the twelve-month period in the Fund’s Lipper category, and excluding sales charges, if any. |
| | |
| 4 | | QS Strategic Real Return Fund 2018 Annual Report |
annual fund operating expenses after waiving fees and/or reimbursing expenses exceed the expense cap for each class as a result of interest expense. These expense limitation arrangements cannot be terminated prior to December 31, 2019 without the Board of Trustees’ consent.
The manager is permitted to recapture amounts waived and/or reimbursed to a class within three years after the fiscal year in which the manager earned the fee or incurred the expense if the class’ total annual operating expenses have fallen to a level below the expense limitation (“expense cap”) in effect at the time the fees were earned or the expenses incurred. In no case will the manager recapture any amount that would result, on any particular business day of the Fund, in the class’ total annual operating expenses exceeding the expense cap or any other lower limit then in effect.
Q. What were the leading contributors to performance?
A. The leading contributor to absolute performance was the allocation to the Commodity-Linked Securities sleeve (representing an average of 20.1% of the Fund for the period) followed by the allocation to the Global Equity Securities sleeve (representing approximately 20.5% of the Fund for the period), both managed by QS Investors. Over the twelve months ending September 30, 2018, the Commodity-Linked Securities sleeve contributed 4.1% to absolute performance and the Global Equity Securities sleeve contributed 2.3%, when considering both return and weight in the portfolio. From a relative to the benchmark perspective, the largest contributor to performance was the Tactical Strategy sleeve, which represented an average of 7.0% of the Fund for the period and outperformed its benchmark.
Q. What were the leading detractors from performance?
A. The largest detractor from absolute performance was an allocation to the Inflation-Linked Debt Securities (TIPS) sleeve (representing an average of 39.4% of the Fund for the period). This asset class contributed -0.25% when considering both return and weight in the portfolio. An allocation to the Exchange-Traded Funds (“ETFs”) that invest in Real Estate Investment Trusts (“REITs”) sleeve (an average of 10.1% of the Fund over the period) was also a weak contributor to absolute performance. These asset classes, in addition to the Commodity-Linked Securities sleeve, underperformed their respective benchmarks.
Thank you for your investment in QS Strategic Real Return Fund. As always, we appreciate that you have chosen us to manage your assets and we remain focused on achieving the Fund’s investment goals.
Sincerely,

Adam J. Petryk, CFA
Portfolio Manager
QS Investors, LLC

Thomas Picciochi
Portfolio Manager
QS Investors, LLC

Ellen Tesler
Portfolio Manager
QS Investors, LLC
October 22, 2018
| | |
| QS Strategic Real Return Fund 2018 Annual Report | | 5 |
Fund overview (cont’d)
RISKS: The Fund is subject to interest rate, credit, income, prepayment and inflation risks. As interest rates rise, bond prices fall, reducing the value of a fixed-income investment. Changes in inflation will cause the Fund’s income to fluctuate, sometimes substantially. Periods of deflation may adversely affect the Fund’s net asset value. Equity securities are subject to market and price fluctuations. The Fund is non-diversified, and therefore it is permitted to invest a higher percentage of its assets in any one issuer than a diversified fund, which may magnify the Fund’s losses from events affecting a particular issuer. In addition to the Fund’s operating expenses, you will indirectly bear the operating expenses of any underlying funds, including ETFs. Each underlying fund may engage in active and frequent trading, resulting in higher portfolio turnover and transaction costs. Derivatives, such as options and futures, can be illiquid, may disproportionately increase losses and have a potentially large impact on Fund performance. International investments are subject to special risks including currency fluctuations and social, economic and political uncertainties, which could increase volatility. These risks are magnified in emerging markets. The Fund may use leverage, which may increase volatility and possibility of loss. The Fund may invest in REITs, which are closely linked to the performance of the real estate markets. The Fund is subject to the illiquidity, credit and interest rate risks of REITs, as well as risks associated with small-and mid-cap investments. The model used to manage the Fund’s assets provides no assurance that the recommended allocation will either maximize returns or minimize risks. There is no assurance that a recommended allocation will prove the ideal allocation in all circumstances. The Fund may engage in short selling, which is a speculative strategy that involves special risks. Unlike the possible loss on a security that is purchased, there is no limit on the amount of loss on an appreciating security that is sold short. Additional risks may include those risks associated with investing in commodities, ETFs, exchange-traded notes (ETNs) and master limited partnerships (MLPs). Please see the Fund’s prospectus for a more complete discussion of these and other risks and the Fund’s investment strategies.
Portfolio holdings and breakdowns are as of September 30, 2018 and are subject to change and may not be representative of the portfolio managers’ current or future investments. Please refer to pages 14 through 24 for a list and percentage breakdown of the Fund’s holdings.
All investments are subject to risk including the possible loss of principal. Past performance is no guarantee of future results. All index performance reflects no deduction for fees, expenses or taxes. Please note that an investor cannot invest directly in an index.
The information provided is not intended to be a forecast of future events, a guarantee of future results or investment advice. Views expressed may differ from those of the firm as a whole.
| | |
| 6 | | QS Strategic Real Return Fund 2018 Annual Report |
| i | Real estate investment trusts (“REITs”) invest in real estate or loans secured by real estate and issue shares in such investments, which can be illiquid. |
| ii | The S&P GSCI® is a composite index of commodity sector returns representing an unleveraged, long-only investment in commodity futures that is broadly diversified across the spectrum of commodities. The returns are calculated on a fully collateralized basis with full reinvestment. |
| iii | The MSCI All Country World Index (“MSCI ACWI”) a market capitalization weighted index that is designed to measure the equity market performance of developed and emerging markets. The MSCI ACWI consists of 45 country indices comprising 24 developed and 21 emerging market country indices. |
| iv | The S&P 500 Index is an unmanaged index of 500 stocks and is generally representative of the performance of larger companies in the U.S. |
| v | The MSCI Emerging Markets Index is a free float-adjusted market capitalization index that is designed to measure equity market performance in the global emerging markets. |
| vi | The Consumer Price Index (“CPI”) measures the average change in U.S. consumer prices over time in a fixed market basket of goods and services determined by the U.S. Bureau of Labor Statistics. |
| vii | The Federal Reserve Board (the “Fed”) is responsible for the formulation of U.S. policies designed to promote economic growth, full employment, stable prices and a sustainable pattern of international trade and payments. |
| viii | The Bloomberg Barclays U.S. Treasury Inflation-Linked Bond Index represents an unmanaged market index made up of U.S. Treasury Inflation-Linked Index securities. |
| ix | The Composite Index reflects the blended rate of return of the following underlying indices: 40% Bloomberg Barclays U.S. Treasury Inflation-Linked Bond Index, 20% MSCI All Country World Index, 20% S&P GSCI®, 10% FTSE NAREIT All REITs Index and 10% FTSE 1-Month U.S. Treasury Bill Index (formerly the Citigroup 1-Month U.S. Treasury Bill Index). The Composite Index is hedged to 50% exposure to the U.S. dollar, as defined by the U.S. Dollar Index (USDX). The Composite Index’s unhedged currency exposure is predominantly U.S. dollar-based. The Fund’s target hedged currency exposure is 50% U.S. dollar, 50% non-U.S. dollar. The Fund may deviate, either up or down, from its target currency allocation due to market conditions. |
| x | U.S. Treasury Inflation-Protected Securities (“TIPS”) are inflation-indexed securities issued by the U.S. Treasury in five-year, ten-year and thirty-year maturities. The principal is adjusted to the Consumer Price Index, the commonly used measure of inflation. The coupon rate is constant, but generates a different amount of interest when multiplied by the inflation-adjusted principal. |
| | |
| QS Strategic Real Return Fund 2018 Annual Report | | 7 |
Fund at a glance† (unaudited)
Investment breakdown (%) as a percent of total investments
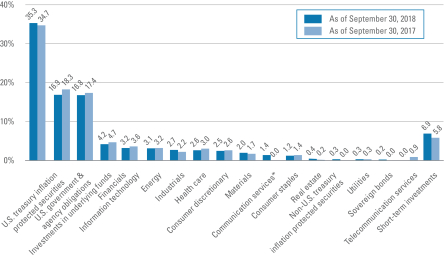
| † | The bar graph above represents the composition of the Fund’s investments as of September 30, 2018 and September 30, 2017 and does not include derivatives, such as futures contracts and forward foreign currency contracts. The Fund is actively managed. As a result, the composition of the Fund’s investments is subject to change at any time. |
| * | As of September 28, 2018, the Telecommunication Services sector was broadened to include some companies previously classified in the Consumer Discretionary and Information Technology sectors and renamed the Communication Services sector. |
| | |
| 8 | | QS Strategic Real Return Fund 2018 Annual Report |
Fund expenses (unaudited)
Example
As a shareholder of the Fund, you may incur two types of costs: (1) transaction costs, including front-end and back-end sales charges (loads) on purchase payments; and (2) ongoing costs, including management fees; service and/or distribution (12b-1) fees; and other Fund expenses. This example is intended to help you understand your ongoing costs (in dollars) of investing in the Fund and to compare these costs with the ongoing costs of investing in other mutual funds.
This example is based on an investment of $1,000 invested on April 1, 2018 and held for the six months ended September 30, 2018.
Actual expenses
The table below titled “Based on Actual Total Return” provides information about actual account values and actual expenses. You may use the information provided in this table, together with the amount you invested, to estimate the expenses that you paid over the period. To estimate the expenses you paid on your account, divide your ending account value by $1,000 (for example, an $8,600 ending account value divided by $1,000 = 8.6), then multiply the result by the number under the heading entitled “Expenses Paid During the Period”.
Hypothetical example for comparison purposes
The table below titled “Based on Hypothetical Total Return” provides information about hypothetical account values and hypothetical expenses based on the actual expense ratio and an assumed rate of return of 5.00% per year before expenses, which is not the Fund’s actual return. The hypothetical account values and expenses may not be used to estimate the actual ending account balance or expenses you paid for the period. You may use the information provided in this table to compare the ongoing costs of investing in the Fund and other funds. To do so, compare the 5.00% hypothetical example relating to the Fund with the 5.00% hypothetical examples that appear in the shareholder reports of the other funds.
Please note that the expenses shown in the table below are meant to highlight your ongoing costs only and do not reflect any transactional costs, such as front-end or back-end sales charges (loads). Therefore, the table is useful in comparing ongoing costs only, and will not help you determine the relative total costs of owning different funds. In addition, if these transaction costs were included, your costs would have been higher.
| | | | | | | | | | | | | | | | | | | | | | | | | | | | | | | | | | | | | | | | | | | | | | |
| Based on actual total return1 | | | | | | Based on hypothetical total return1 | |
| | | Actual
Total Return
Without
Sales
Charge2 | | | Beginning
Account
Value | | | Ending
Account
Value | | | Annualized
Expense
Ratio3 | | | Expenses
Paid
During
the
Period4 | | | | | | | | Hypothetical
Annualized
Total Return | | | Beginning
Account
Value | | | Ending
Account
Value | | | Annualized
Expense
Ratio3 | | | Expenses
Paid
During
the
Period4 | |
| Class A | | | 2.51 | % | | $ | 1,000.00 | | | $ | 1,025.10 | | | | 1.32 | % | | $ | 6.70 | | | | | | | Class A | | | 5.00 | % | | $ | 1,000.00 | | | $ | 1,018.45 | | | | 1.32 | % | | $ | 6.68 | |
| Class A2 | | | 2.38 | | | | 1,000.00 | | | | 1,023.80 | | | | 1.52 | | | | 7.71 | | | | | | | Class A2 | | | 5.00 | | | | 1,000.00 | | | | 1,017.45 | | | | 1.52 | | | | 7.69 | |
| Class C | | | 2.16 | | | | 1,000.00 | | | | 1,021.60 | | | | 2.07 | | | | 10.49 | | | | | | | Class C | | | 5.00 | | | | 1,000.00 | | | | 1,014.69 | | | | 2.07 | | | | 10.45 | |
| Class I | | | 2.62 | | | | 1,000.00 | | | | 1,026.20 | | | | 1.11 | | | | 5.64 | | | | | | | Class I | | | 5.00 | | | | 1,000.00 | | | | 1,019.50 | | | | 1.11 | | | | 5.62 | |
| Class IS | | | 2.66 | | | | 1,000.00 | | | | 1,026.60 | | | | 0.97 | | | | 4.93 | | | | | | | Class IS | | | 5.00 | | | | 1,000.00 | | | | 1,020.21 | | | | 0.97 | | | | 4.91 | |
| | |
| QS Strategic Real Return Fund 2018 Annual Report | | 9 |
Fund expenses (unaudited) (cont’d)
| 1 | For the six months ended September 30, 2018. |
| 2 | Assumes the reinvestment of all distributions, including returns of capital, if any, at net asset value and does not reflect the deduction of the applicable sales charge with respect to Class A and Class A2 shares or the applicable contingent deferred sales charge (“CDSC”) with respect to Class C shares. Total return is not annualized, as it may not be representative of the total return for the year. Performance figures may reflect compensating balance arrangements, fee waivers and/or expense reimbursements. In the absence of compensating balance arrangements, fee waivers and/or expense reimbursements, the total return would have been lower. Past performance is no guarantee of future results. |
| 3 | Does not include fees and expenses of the Underlying Funds in which the Fund invests. |
| 4 | Expenses (net of compensating balance arrangements, fee waivers and/or expense reimbursements) are equal to each class’ respective annualized expense ratio multiplied by the average account value over the period, multiplied by the number of days in the most recent fiscal half-year (183), then divided by 365. |
| | |
| 10 | | QS Strategic Real Return Fund 2018 Annual Report |
Fund performance (unaudited)
| | | | | | | | | | | | | | | | | | | | |
| Average annual total returns | |
| Without sales charges1 | | Class A | | | Class A2 | | | Class C | | | Class I | | | Class IS | |
| Twelve Months Ended 9/30/18 | | | 6.32 | % | | | 6.13 | % | | | 5.51 | % | | | 6.62 | % | | | 6.62 | % |
| Five Years Ended 9/30/18 | | | 0.03 | | | | -0.16 | | | | -0.71 | | | | 0.29 | | | | 0.37 | |
| Inception* through 9/30/18 | | | 2.62 | | | | 0.19 | | | | 1.87 | | | | 2.89 | | | | 1.92 | |
| | | | | |
| With sales charges2 | | Class A | | | Class A2 | | | Class C | | | Class I | | | Class IS | |
| Twelve Months Ended 9/30/18 | | | 0.19 | % | | | 0.01 | % | | | 4.51 | % | | | 6.62 | % | | | 6.62 | % |
| Five Years Ended 9/30/18 | | | -1.15 | | | | -1.33 | | | | -0.71 | | | | 0.29 | | | | 0.37 | |
| Inception* through 9/30/18 | | | 1.92 | | | | -0.80 | | | | 1.87 | | | | 2.89 | | | | 1.92 | |
| | | | |
| Cumulative total returns | |
| Without sales charges1 | | | |
| Class A (Inception date of 2/26/10 through 9/30/18) | | | 24.92 | % |
| Class A2 (Inception date of 10/31/12 through 9/30/18) | | | 1.16 | |
| Class C (Inception date of 2/26/10 through 9/30/18) | | | 17.28 | |
| Class I (Inception date of 2/26/10 through 9/30/18) | | | 27.76 | |
| Class IS (Inception date of 12/15/11 through 9/30/18) | | | 13.78 | |
All figures represent past performance and are not a guarantee of future results. Investment return and principal value of an investment will fluctuate so that an investor’s shares, when redeemed, may be worth more or less than their original cost. The returns shown do not reflect the deduction of taxes that a shareholder would pay on Fund distributions or the redemption of Fund shares. Performance figures may reflect compensating balance arrangements, fee waivers and/or expense reimbursements. In the absence of compensating balance arrangements, fee waivers and/or expense reimbursements, the total return would have been lower.
| 1 | Assumes the reinvestment of all distributions, including returns of capital, if any, at net asset value and does not reflect the deduction of the applicable sales charge with respect to Class A shares and Class A2 shares or the applicable contingent deferred sales charge (“CDSC”) with respect to Class C shares. |
| 2 | Assumes the reinvestment of all distributions, including returns of capital, if any, at net asset value. In addition, Class A shares and Class A2 shares reflect the deduction of the maximum initial sales charge of 5.75%. Class C shares reflect the deduction of a 1.00% CDSC, which applies if shares are redeemed within one year from purchase payment. |
| * | Inception dates for Class A, A2, C, I and IS shares are February 26, 2010, October 31, 2012, February 26, 2010, February 26, 2010 and December 15, 2011, respectively. |
| | |
| QS Strategic Real Return Fund 2018 Annual Report | | 11 |
Fund performance (unaudited) (cont’d)
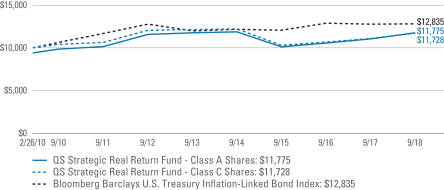
Historical performance
Value of $10,000 invested in
Class A and C Shares of QS Strategic Real Return Fund vs. Bloomberg Barclays U.S. Treasury Inflation-Linked Bond Index‡ — February 26, 2010 - September 2018
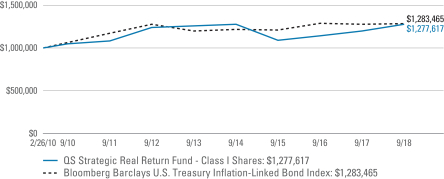
Value of $1,000,000 invested in
Class I Shares of QS Strategic Real Return Fund vs. Bloomberg Barclays U.S. Treasury Inflation-Linked Bond Index‡ — February 26, 2010 - September 2018
| | |
| 12 | | QS Strategic Real Return Fund 2018 Annual Report |
All figures represent past performance and are not a guarantee of future results. Investment return and principal value of an investment will fluctuate so that an investor’s shares, when redeemed, may be worth more or less than their original cost. The returns shown do not reflect the deduction of taxes that a shareholder would pay on Fund distributions or the redemption of Fund shares. Performance figures may reflect compensating balance arrangements, fee waivers and/or expense reimbursements. In the absence of compensating balance arrangements, fee waivers and/or expense reimbursements, the total return would have been lower.
| ‡ | Hypothetical illustration of $10,000 invested in Class A and C shares and $1,000,000 invested in Class I shares of QS Strategic Real Return Fund on February 26, 2010 (inception date), assuming the deduction of the maximum initial sales charge of 5.75% at the time of investment for Class A shares and the reinvestment of all distributions, including returns of capital, if any, at net asset value through September 30, 2018. The hypothetical illustration also assumes a $10,000 or $1,000,000 investment, as applicable, in the Bloomberg Barclays U.S. Treasury Inflation-Linked Bond Index. The Bloomberg Barclays U.S. Treasury Inflation-Linked Bond Index represents an unmanaged market index made up of U.S. Treasury Inflation-Linked Index securities. Please note that an investor cannot invest directly in an index. The performance of the Fund’s other classes may be greater or less than the Class A, C and I shares’ performance indicated on these charts, depending on whether greater or lesser sales charges and fees were incurred by shareholders investing in the other classes. |
| | |
| QS Strategic Real Return Fund 2018 Annual Report | | 13 |
Consolidated schedule of investments
September 30, 2018
QS Strategic Real Return Fund
| | | | | | | | | | | | | | | | |
| Security | | Rate | | | Maturity
Date | | | Face
Amount | | | Value | |
| U.S. Treasury Inflation Protected Securities — 34.5% | | | | | | | | | | | | | | | | |
U.S. Treasury Bonds, Inflation Indexed | | | 0.125 | % | | | 4/15/20 | | | $ | 1,937,016 | | | $ | 1,912,173 | |
U.S. Treasury Bonds, Inflation Indexed | | | 1.250 | % | | | 7/15/20 | | | | 2,311,080 | | | | 2,337,814 | |
U.S. Treasury Bonds, Inflation Indexed | | | 0.125 | % | | | 4/15/22 | | | | 6,217,380 | | | | 6,042,030 | |
U.S. Treasury Bonds, Inflation Indexed | | | 0.375 | % | | | 7/15/23 | | | | 2,501,453 | | | | 2,453,024 | |
U.S. Treasury Bonds, Inflation Indexed | | | 2.000 | % | | | 1/15/26 | | | | 4,456,647 | | | | 4,794,863 | |
U.S. Treasury Bonds, Inflation Indexed | | | 3.625 | % | | | 4/15/28 | | | | 358,361 | | | | 445,219 | |
U.S. Treasury Bonds, Inflation Indexed | | | 2.500 | % | | | 1/15/29 | | | | 5,164,544 | | | | 5,939,831 | |
U.S. Treasury Bonds, Inflation Indexed | | | 3.875 | % | | | 4/15/29 | | | | 4,276,930 | | | | 5,511,950 | |
U.S. Treasury Bonds, Inflation Indexed | | | 2.125 | % | | | 2/15/40 | | | | 349,782 | | | | 423,359 | |
U.S. Treasury Bonds, Inflation Indexed | | | 2.125 | % | | | 2/15/41 | | | | 828,547 | | | | 1,009,792 | |
U.S. Treasury Bonds, Inflation Indexed | | | 1.375 | % | | | 2/15/44 | | | | 4,044,062 | | | | 4,340,284 | |
U.S. Treasury Bonds, Inflation Indexed | | | 0.750 | % | | | 2/15/45 | | | | 1,648,062 | | | | 1,535,004 | |
Total U.S. Treasury Inflation Protected Securities (Cost — $37,122,085) | | | | | | | | 36,745,343 | |
| | | | |
| | | | | | | | | Shares | | | | |
| Common Stocks — 20.5% | | | | | | | | | | | | | | | | |
| Communication Services — 1.4% | | | | | | | | | | | | | | | | |
Diversified Telecommunication Services — 0.6% | | | | | | | | | | | | | | | | |
AT&T Inc. | | | | | | | | | | | 3,849 | | | | 129,249 | |
China Telecom Corp. Ltd., Class H Shares | | | | | | | | | | | 268,000 | | | | 132,947 | (a) |
KT Corp., ADR | | | | | | | | | | | 7,042 | | | | 104,574 | |
LG Uplus Corp. | | | | | | | | | | | 6,096 | | | | 100,540 | (a) |
Nippon Telegraph & Telephone Corp. | | | | | | | | | | | 4,336 | | | | 195,869 | (a) |
Total Diversified Telecommunication Services | | | | | | | | | | | | | | | 663,179 | |
Interactive Media & Services — 0.3% | | | | | | | | | | | | | | | | |
Alphabet Inc., Class A Shares | | | | | | | | | | | 166 | | | | 200,376 | * |
Facebook Inc., Class A Shares | | | | | | | | | | | 668 | | | | 109,589 | * |
Total Interactive Media & Services | | | | | | | | | | | | | | | 310,235 | |
Media — 0.2% | | | | | | | | | | | | | | | | |
CBS Corp., Class B Shares, Non Voting Shares | | | | | | | | | | | 2,673 | | | | 153,564 | |
Wireless Telecommunication Services — 0.3% | | | | | | | | | | | | | | | | |
KDDI Corp. | | | | | | | | | | | 6,500 | | | | 179,597 | (a) |
T-Mobile US Inc. | | | | | | | | | | | 2,400 | | | | 168,432 | * |
Total Wireless Telecommunication Services | | | | | | | | | | | | | | | 348,029 | |
Total Communication Services | | | | | | | | | | | | | | | 1,475,007 | |
| Consumer Discretionary — 2.4% | | | | | | | | | | | | | | | | |
Auto Components — 0.1% | | | | | | | | | | | | | | | | |
Aptiv PLC | | | | | | | | | | | 995 | | | | 83,481 | |
See Notes to Consolidated Financial Statements.
| | |
| 14 | | QS Strategic Real Return Fund 2018 Annual Report |
QS Strategic Real Return Fund
| | | | | | | | | | | | | | | | |
| Security | | | | | | | | Shares | | | Value | |
Automobiles — 0.3% | | | | | | | | | | | | | | | | |
Guangzhou Automobile Group Co., Ltd., Class H | | | | | | | | | | | | | | | | |
Shares | | | | | | | | | | | 122,600 | | | $ | 134,276 | (a) |
Mazda Motor Corp. | | | | | | | | | | | 7,400 | | | | 88,859 | (a) |
Subaru Corp. | | | | | | | | | | | 3,400 | | | | 104,156 | (a) |
Total Automobiles | | | | | | | | | | | | | | | 327,291 | |
Hotels, Restaurants & Leisure — 0.7% | | | | | | | | | | | | | | | | |
Brinker International Inc. | | | | | | | | | | | 2,465 | | | | 115,190 | |
Genting Singapore Ltd. | | | | | | | | | | | 151,800 | | | | 117,501 | (a) |
Jack in the Box Inc. | | | | | | | | | | | 1,293 | | | | 108,392 | |
Las Vegas Sands Corp. | | | | | | | | | | | 1,700 | | | | 100,861 | |
Sands China Ltd. | | | | | | | | | | | 22,800 | | | | 102,079 | (a) |
Wyndham Destination Inc. | | | | | | | | | | | 1,323 | | | | 57,365 | |
Yum! Brands Inc. | | | | | | | | | | | 1,236 | | | | 112,365 | |
Total Hotels, Restaurants & Leisure | | | | | | | | | | | | | | | 713,753 | |
Household Durables — 0.2% | | | | | | | | | | | | | | | | |
Electrolux AB, Class B Shares | | | | | | | | | | | 4,795 | | | | 105,476 | (a) |
Persimmon PLC | | | | | | | | | | | 3,125 | | | | 96,241 | (a) |
Taylor Wimpey PLC | | | | | | | | | | | 34,406 | | | | 76,894 | (a) |
Total Household Durables | | | | | | | | | | | | | | | 278,611 | |
Specialty Retail — 0.9% | | | | | | | | | | | | | | | | |
Home Depot Inc. | | | | | | | | | | | 1,810 | | | | 374,941 | |
Lowe’s Cos. Inc. | | | | | | | | | | | 2,422 | | | | 278,094 | |
Ross Stores Inc. | | | | | | | | | | | 1,937 | | | | 191,957 | |
TJX Cos. Inc. | | | | | | | | | | | 1,585 | | | | 177,552 | |
Total Specialty Retail | | | | | | | | | | | | | | | 1,022,544 | |
Textiles, Apparel & Luxury Goods — 0.2% | | | | | | | | | | | | | | | | |
Burberry Group PLC | | | | | | | | | | | 3,780 | | | | 99,267 | (a) |
Pandora A/S | | | | | | | | | | | 1,198 | | | | 74,889 | (a) |
Total Textiles, Apparel & Luxury Goods | | | | | | | | | | | | | | | 174,156 | |
Total Consumer Discretionary | | | | | | | | | | | | | | | 2,599,836 | |
| Consumer Staples — 1.2% | | | | | | | | | | | | | | | | |
Beverages — 0.2% | | | | | | | | | | | | | | | | |
Kirin Holdings Co., Ltd. | | | | | | | | | | | 7,000 | | | | 179,369 | (a) |
Food & Staples Retailing — 0.3% | | | | | | | | | | | | | | | | |
Tesco PLC | | | | | | | | | | | 41,300 | | | | 129,010 | (a) |
Walmart Inc. | | | | | | | | | | | 1,518 | | | | 142,555 | |
Total Food & Staples Retailing | | | | | | | | | | | | | | | 271,565 | |
See Notes to Consolidated Financial Statements.
| | |
| QS Strategic Real Return Fund 2018 Annual Report | | 15 |
Consolidated schedule of investments (cont’d)
September 30, 2018
QS Strategic Real Return Fund
| | | | | | | | | | | | | | | | |
| Security | | | | | | | | Shares | | | Value | |
Food Products — 0.2% | | | | | | | | | | | | | | | | |
Archer-Daniels-Midland Co. | | | | | | | | | | | 3,220 | | | $ | 161,870 | |
Morinaga & Co. Ltd. | | | | | | | | | | | 2,400 | | | | 89,638 | (a) |
Total Food Products | | | | | | | | | | | | | | | 251,508 | |
Household Products — 0.2% | | | | | | | | | | | | | | | | |
Church & Dwight Co. Inc. | | | | | | | | | | | 2,230 | | | | 132,395 | |
Clorox Co. | | | | | | | | | | | 812 | | | | 122,133 | |
Total Household Products | | | | | | | | | | | | | | | 254,528 | |
Personal Products — 0.2% | | | | | | | | | | | | | | | | |
Estee Lauder Cos. Inc., Class A Shares | | | | | | | | | | | 778 | | | | 113,059 | |
Hengan International Group Co., Ltd. | | | | | | | | | | | 12,000 | | | | 110,099 | (a) |
Total Personal Products | | | | | | | | | | | | | | | 223,158 | |
Tobacco — 0.1% | | | | | | | | | | | | | | | | |
KT&G Corp. | | | | | | | | | | | 746 | | | | 69,942 | (a) |
Total Consumer Staples | | | | | | | | | | | | | | | 1,250,070 | |
| Energy — 1.3% | | | | | | | | | | | | | | | | |
Oil, Gas & Consumable Fuels — 1.3% | | | | | | | | | | | | | | | | |
China Petroleum & Chemical Corp., Class H Shares | | | | | | | | | | | 160,000 | | | | 160,440 | (a) |
Eni SpA | | | | | | | | | | | 5,776 | | | | 108,937 | (a) |
Exxon Mobil Corp. | | | | | | | | | | | 1,548 | | | | 131,611 | |
OMV AG | | | | | | | | | | | 2,919 | | | | 163,860 | (a) |
Petroleo Brasileiro SA, ADR | | | | | | | | | | | 13,904 | | | | 145,436 | |
Polskie Gornictwo Naftowe i Gazownictwo SA, Class I Shares | | | | | | | | | | | 85,701 | | | | 150,022 | *(a) |
Repsol SA | | | | | | | | | | | 6,644 | | | | 132,402 | (a) |
Royal Dutch Shell PLC, Class A Shares | | | | | | | | | | | 3,628 | | | | 124,067 | (a) |
Valero Energy Corp. | | | | | | | | | | | 2,000 | | | | 227,500 | |
Total Energy | | | | | | | | | | | | | | | 1,344,275 | |
| Financials — 4.1% | | | | | | | | | | | | | | | | |
Banks — 1.8% | | | | | | | | | | | | | | | | |
Bank of America Corp. | | | | | | | | | | | 10,209 | | | | 300,757 | |
BNP Paribas SA | | | | | | | | | | | 2,233 | | | | 136,471 | (a) |
Canadian Imperial Bank of Commerce | | | | | | | | | | | 2,100 | | | | 196,774 | |
Citigroup Inc. | | | | | | | | | | | 3,433 | | | | 246,283 | |
Citizens Financial Group Inc. | | | | | | | | | | | 5,376 | | | | 207,352 | |
Danske Bank A/S | | | | | | | | | | | 4,373 | | | | 114,729 | (a) |
Fifth Third Bancorp | | | | | | | | | | | 4,333 | | | | 120,977 | |
JPMorgan Chase & Co. | | | | | | | | | | | 2,182 | | | | 246,217 | |
Lloyds Banking Group PLC | | | | | | | | | | | 204,717 | | | | 157,978 | (a) |
National Bank of Canada | | | | | | | | | | | 4,400 | | | | 219,753 | |
Total Banks | | | | | | | | | | | | | | | 1,947,291 | |
See Notes to Consolidated Financial Statements.
| | |
| 16 | | QS Strategic Real Return Fund 2018 Annual Report |
QS Strategic Real Return Fund
| | | | | | | | | | | | | | | | |
| Security | | | | | | | | Shares | | | Value | |
Capital Markets — 0.4% | | | | | | | | | | | | | | | | |
Ameriprise Financial Inc. | | | | | | | | | | | 894 | | | $ | 132,008 | |
Bank of New York Mellon Corp. | | | | | | | | | | | 2,110 | | | | 107,589 | |
Morgan Stanley | | | | | | | | | | | 3,300 | | | | 153,681 | |
Total Capital Markets | | | | | | | | | | | | | | | 393,278 | |
Consumer Finance — 0.2% | | | | | | | | | | | | | | | | |
Capital One Financial Corp. | | | | | | | | | | | 2,091 | | | | 198,499 | |
Insurance — 1.7% | | | | | | | | | | | | | | | | |
Aegon NV | | | | | | | | | | | 21,112 | | | | 136,949 | (a) |
Allianz SE | | | | | | | | | | | 1,157 | | | | 257,742 | (a) |
Allstate Corp. | | | | | | | | | | | 2,131 | | | | 210,330 | |
AXA SA | | | | | | | | | | | 5,029 | | | | 135,019 | (a) |
Axis Capital Holdings Ltd. | | | | | | | | | | | 1,232 | | | | 71,099 | |
DB Insurance Co., Ltd. | | | | | | | | | | | 1,293 | | | | 84,858 | (a) |
Hannover Rueck SE | | | | | | | | | | | 889 | | | | 125,571 | (a) |
Legal & General Group PLC | | | | | | | | | | | 31,700 | | | | 108,203 | (a) |
Muenchener Rueckversicherungs-Gesellschaft AG In Muenchen | | | | | | | | | | | 500 | | | | 110,741 | (a) |
Prudential Financial Inc. | | | | | | | | | | | 1,232 | | | | 124,826 | |
SCOR SE | | | | | | | | | | | 3,617 | | | | 167,880 | (a) |
Swiss Life Holding AG, Registered Shares | | | | | | | | | | | 358 | | | | 135,553 | (a) |
Swiss Re AG | | | | | | | | | | | 1,657 | | | | 152,812 | (a) |
Total Insurance | | | | | | | | | | | | | | | 1,821,583 | |
Total Financials | | | | | | | | | | | | | | | 4,360,651 | |
| Health Care — 2.6% | | | | | | | | | | | | | | | | |
Biotechnology — 0.5% | | | | | | | | | | | | | | | | |
Amgen Inc. | | | | | | | | | | | 1,163 | | | | 241,078 | |
Biogen Inc. | | | | | | | | | | | 528 | | | | 186,548 | * |
United Therapeutics Corp. | | | | | | | | | | | 808 | | | | 103,327 | * |
Total Biotechnology | | | | | | | | | | | | | | | 530,953 | |
Health Care Equipment & Supplies — 0.7% | | | | | | | | | | | | | | | | |
Baxter International Inc. | | | | | | | | | | | 3,494 | | | | 269,352 | |
Edwards Lifesciences Corp. | | | | | | | | | | | 1,300 | | | | 226,330 | * |
Hoya Corp. | | | | | | | | | | | 2,300 | | | | 136,542 | (a) |
Masimo Corp. | | | | | | | | | | | 1,169 | | | | 145,587 | * |
Total Health Care Equipment & Supplies | | | | | | | | | | | | | | | 777,811 | |
Health Care Providers & Services — 1.1% | | | | | | | | | | | | | | | | |
Aetna Inc. | | | | | | | | | | | 619 | | | | 125,564 | |
Anthem Inc. | | | | | | | | | | | 498 | | | | 136,477 | |
Cigna Corp. | | | | | | | | | | | 637 | | | | 132,655 | |
See Notes to Consolidated Financial Statements.
| | |
| QS Strategic Real Return Fund 2018 Annual Report | | 17 |
Consolidated schedule of investments (cont’d)
September 30, 2018
QS Strategic Real Return Fund
| | | | | | | | | | | | | | | | |
| Security | | | | | | | | Shares | | | Value | |
Health Care Providers & Services — continued | | | | | | | | | | | | | | | | |
CVS Health Corp. | | | | | | | | | | | 1,602 | | | $ | 126,110 | |
Humana Inc. | | | | | | | | | | | 545 | | | | 184,493 | |
McKesson Corp. | | | | | | | | | | | 610 | | | | 80,917 | |
UnitedHealth Group Inc. | | | | | | | | | | | 855 | | | | 227,464 | |
WellCare Health Plans Inc. | | | | | | | | | | | 572 | | | | 183,320 | * |
Total Health Care Providers & Services | | | | | | | | | | | | | | | 1,197,000 | |
Pharmaceuticals — 0.3% | | | | | | | | | | | | | | | | |
Merck & Co. Inc. | | | | | | | | | | | 1,702 | | | | 120,740 | |
Shionogi & Co., Ltd. | | | | | | | | | | | 2,100 | | | | 137,150 | (a) |
Total Pharmaceuticals | | | | | | | | | | | | | | | 257,890 | |
Total Health Care | | | | | | | | | | | | | | | 2,763,654 | |
| Industrials — 2.6% | | | | | | | | | | | | | | | | |
Aerospace & Defense — 0.7% | | | | | | | | | | | | | | | | |
Boeing Co. | | | | | | | | | | | 933 | | | | 346,983 | |
Safran SA | | | | | | | | | | | 1,600 | | | | 223,927 | (a) |
Spirit AeroSystems Holdings Inc., Class A Shares | | | | | | | | | | | 1,505 | | | | 137,963 | |
Total Aerospace & Defense | | | | | | | | | | | | | | | 708,873 | |
Airlines — 0.3% | | | | | | | | | | | | | | | | |
Qantas Airways Ltd. | | | | | | | | | | | 37,336 | | | | 158,531 | (a) |
Southwest Airlines Co. | | | | | | | | | | | 2,641 | | | | 164,931 | |
Total Airlines | | | | | | | | | | | | | | | 323,462 | |
Building Products — 0.1% | | | | | | | | | | | | | | | | |
Owens Corning | | | | | | | | | | | 2,001 | | | | 108,594 | |
Construction & Engineering — 0.2% | | | | | | | | | | | | | | | | |
ACS Actividades de Construccion y Servicios SA | | | | | | | | | | | 2,634 | | | | 111,616 | (a) |
HOCHTIEF AG | | | | | | | | | | | 516 | | | | 85,552 | (a) |
Total Construction & Engineering | | | | | | | | | | | | | | | 197,168 | |
Electrical Equipment — 0.1% | | | | | | | | | | | | | | | | |
Rockwell Automation Inc. | | | | | | | | | | | 589 | | | | 110,449 | |
Industrial Conglomerates — 0.1% | | | | | | | | | | | | | | | | |
LG Corp. | | | | | | | | | | | 1,386 | | | | 90,709 | (a) |
Machinery — 0.5% | | | | | | | | | | | | | | | | |
CNH Industrial NV | | | | | | | | | | | 11,035 | | | | 132,353 | (a) |
Cummins Inc. | | | | | | | | | | | 1,129 | | | | 164,913 | |
Illinois Tool Works Inc. | | | | | | | | | | | 910 | | | | 128,419 | |
Toro Co. | | | | | | | | | | | 2,859 | | | | 171,454 | |
Total Machinery | | | | | | | | | | | | | | | 597,139 | |
Professional Services — 0.1% | | | | | | | | | | | | | | | | |
ManpowerGroup Inc. | | | | | | | | | | | 1,639 | | | | 140,888 | |
See Notes to Consolidated Financial Statements.
| | |
| 18 | | QS Strategic Real Return Fund 2018 Annual Report |
QS Strategic Real Return Fund
| | | | | | | | | | | | | | | | |
| Security | | | | | | | | Shares | | | Value | |
Road & Rail — 0.1% | | | | | | | | | | | | | | | | |
Union Pacific Corp. | | | | | | | | | | | 730 | | | $ | 118,866 | |
Trading Companies & Distributors — 0.3% | | | | | | | | | | | | | | | | |
Marubeni Corp. | | | | | | | | | | | 11,000 | | | | 100,708 | (a) |
Sumitomo Corp. | | | | | | | | | | | 5,200 | | | | 86,701 | (a) |
WW Grainger Inc. | | | | | | | | | | | 300 | | | | 107,223 | |
Total Trading Companies & Distributors | | | | | | | | | | | | | | | 294,632 | |
Transportation Infrastructure — 0.1% | | | | | | | | | | | | | | | | |
Aena SME SA | | | | | | | | | | | 548 | | | | 94,788 | (a)(b) |
Total Industrials | | | | | | | | | | | | | | | 2,785,568 | |
| Information Technology — 3.2% | | | | | | | | | | | | | | | | |
Communications Equipment — 0.3% | | | | | | | | | | | | | | | | |
Cisco Systems Inc. | | | | | | | | | | | 7,437 | | | | 361,810 | |
Electronic Equipment, Instruments & Components — 0.2% | | | | | | | | | | | | | | | | |
Hitachi Ltd. | | | | | | | | | | | 5,200 | | | | 176,704 | (a) |
IT Services — 0.1% | | | | | | | | | | | | | | | | |
Visa Inc., Class A Shares | | | | | | | | | | | 853 | | | | 128,027 | |
Semiconductors & Semiconductor Equipment — 0.6% | | | | | | | | | | | | | | | | |
Applied Materials Inc. | | | | | | | | | | | 4,488 | | | | 173,461 | |
KLA-Tencor Corp. | | | | | | | | | | | 727 | | | | 73,943 | |
NVIDIA Corp. | | | | | | | | | | | 811 | | | | 227,908 | |
Texas Instruments Inc. | | | | | | | | | | | 1,717 | | | | 184,217 | |
Total Semiconductors & Semiconductor Equipment | | | | | | | | | | | | | | | 659,529 | |
Software — 0.6% | | | | | | | | | | | | | | | | |
Microsoft Corp. | | | | | | | | | | | 3,264 | | | | 373,304 | |
VMware Inc., Class A Shares | | | | | | | | | | | 1,320 | | | | 205,999 | * |
Total Software | | | | | | | | | | | | | | | 579,303 | |
Technology Hardware, Storage & Peripherals — 1.4% | | | | | | | | | | | | | | | | |
Apple Inc. | | | | | | | | | | | 3,363 | | | | 759,164 | |
FUJIFILM Holdings Corp. | | | | | | | | | | | 4,000 | | | | 180,107 | (a) |
HP Inc. | | | | | | | | | | | 8,802 | | | | 226,827 | |
Samsung Electronics Co., Ltd. | | | | | | | | | | | 7,200 | | | | 301,552 | (a) |
Total Technology Hardware, Storage & Peripherals | | | | | | | | | | | | | | | 1,467,650 | |
Total Information Technology | | | | | | | | | | | | | | | 3,373,023 | |
| Materials — 1.0% | | | | | | | | | | | | | | | | |
Chemicals — 0.3% | | | | | | | | | | | | | | | | |
Chemours Co. | | | | | | | | | | | 2,245 | | | | 88,543 | |
Covestro AG | | | | | | | | | | | 916 | | | | 74,255 | (a)(b) |
Huntsman Corp. | | | | | | | | | | | 5,489 | | | | 149,465 | |
Total Chemicals | | | | | | | | | | | | | | | 312,263 | |
See Notes to Consolidated Financial Statements.
| | |
| QS Strategic Real Return Fund 2018 Annual Report | | 19 |
Consolidated schedule of investments (cont’d)
September 30, 2018
QS Strategic Real Return Fund
| | | | | | | | | | | | | | | | |
| Security | | | | | | | | Shares | | | Value | |
Metals & Mining — 0.5% | | | | | | | | | | | | | | | | |
Anglo American PLC | | | | | | | | | | | 4,271 | | | $ | 95,668 | (a) |
Boliden AB | | | | | | | | | | | 2,937 | | | | 81,760 | (a) |
Glencore PLC | | | | | | | | | | | 20,620 | | | | 88,887 | (a) |
POSCO | | | | | | | | | | | 349 | | | | 92,682 | (a) |
Rio Tinto PLC | | | | | | | | | | | 2,643 | | | | 133,345 | (a) |
South32 Ltd. | | | | | | | | | | | 42,949 | | | | 121,187 | (a) |
Total Metals & Mining | | | | | | | | | | | | | | | 613,529 | |
Paper & Forest Products — 0.2% | | | | | | | | | | | | | | | | |
UPM-Kymmene OYJ | | | | | | | | | | | 5,000 | | | | 195,903 | (a) |
Total Materials | | | | | | | | | | | | | | | 1,121,695 | |
| Real Estate — 0.4% | | | | | | | | | | | | | | | | |
Real Estate Management & Development — 0.4% | | | | | | | | | | | | | | | | |
China Vanke Co., Ltd., Class H Shares | | | | | | | | | | | 29,400 | | | $ | 96,083 | (a) |
Country Garden Holdings Co., Ltd. | | | | | | | | | | | 111,000 | | | | 138,131 | (a) |
Jones Lang LaSalle Inc. | | | | | | | | | | | 719 | | | | 103,766 | |
Shimao Property Holdings Ltd. | | | | | | | | | | | 36,000 | | | | 89,826 | (a) |
Total Real Estate | | | | | | | | | | | | | | | 427,806 | |
| Utilities — 0.3% | | | | | | | | | | | | | | | | |
Independent Power and Renewable Electricity Producers — 0.2% | | | | | | | | | | | | | |
NRG Energy Inc. | | | | | | | | | | | 5,281 | | | | 197,510 | |
Multi-Utilities — 0.1% | | | | | | | | | | | | | | | | |
AGL Energy Ltd. | | | | | | | | | | | 6,000 | | | | 84,745 | (a) |
Total Utilities | | | | | | | | | | | | | | | 282,255 | |
Total Common Stocks (Cost — $15,547,693) | | | | | | | | | | | | | | | 21,783,840 | |
| | | | |
| | | Rate | | | Maturity
Date | | | Face
Amount | | | | |
| U.S. Government & Agency Obligations — 16.6% | | | | | | | | | | | | | | | | |
U.S. Government Obligations — 16.6% | | | | | | | | | | | | | | | | |
U.S. Treasury Bills | | | 2.149 | % | | | 12/13/18 | | | $ | 7,400,000 | | | | 7,368,170 | (c) |
U.S. Treasury Bills | | | 2.334 | % | | | 3/14/19 | | | | 9,600,000 | | | | 9,500,397 | (c) |
U.S. Treasury Notes | | | 1.500 | % | | | 5/31/20 | | | | 800,000 | | | | 783,328 | |
Total U.S. Government & Agency Obligations (Cost — $17,656,418) | | | | | | | | 17,651,895 | |
| | | | |
| | | | | | | | | Shares | | | | |
| Investments in Underlying Funds — 16.4% | | | | | | | | | | | | | | | | |
Invesco S&P 500 Top 50 ETF | | | | | | | | | | | 6,799 | | | | 1,422,079 | |
iShares Core High Dividend ETF | | | | | | | | | | | 6,842 | | | | 619,475 | |
See Notes to Consolidated Financial Statements.
| | |
| 20 | | QS Strategic Real Return Fund 2018 Annual Report |
QS Strategic Real Return Fund
| | | | | | | | | | | | | | | | |
| Security | | | | | | | | Shares | | | Value | |
| Investments in Underlying Funds — continued | | | | | | | | | | | | | | | | |
iShares Edge MSCI USA Momentum Factor ETF | | | | | | | | | | | 15,937 | | | $ | 1,896,503 | |
iShares Edge MSCI USA Quality Factor ETF | | | | | | | | | | | 30,601 | | | | 2,765,412 | |
Vanguard REIT ETF | | | | | | | | | | | 133,545 | | | | 10,774,411 | |
Total Investments in Underlying Funds (Cost — $12,264,014) | | | | | | | | 17,477,880 | |
| | | | |
| | | Rate | | | Maturity
Date | | | Face
Amount | | | | |
| Corporate Bonds & Notes — 2.6% | | | | | | | | | | | | | | | | |
| Energy — 1.7% | | | | | | | | | | | | | | | | |
Energy Equipment & Services — 0.0% | | | | | | | | | | | | | | | | |
Halliburton Co., Senior Notes | | | 3.800 | % | | | 11/15/25 | | | $ | 50,000 | | | | 49,648 | |
Oil, Gas & Consumable Fuels — 1.7% | | | | | | | | | | | | | | | | |
Anadarko Petroleum Corp., Senior Notes | | | 5.550 | % | | | 3/15/26 | | | | 40,000 | | | | 42,507 | |
Anadarko Petroleum Corp., Senior Notes | | | 6.600 | % | | | 3/15/46 | | | | 190,000 | | | | 224,201 | |
Apache Corp., Senior Notes | | | 2.625 | % | | | 1/15/23 | | | | 29,000 | | | | 27,703 | |
Apache Corp., Senior Notes | | | 5.100 | % | | | 9/1/40 | | | | 30,000 | | | | 29,768 | |
Apache Corp., Senior Notes | | | 4.750 | % | | | 4/15/43 | | | | 230,000 | | | | 218,079 | |
BP Capital Markets PLC, Senior Notes | | | 3.119 | % | | | 5/4/26 | | | | 50,000 | | | | 47,725 | |
BP Capital Markets PLC, Senior Notes | | | 3.588 | % | | | 4/14/27 | | | | 240,000 | | | | 234,929 | |
Devon Energy Corp., Senior Notes | | | 5.850 | % | | | 12/15/25 | | | | 230,000 | | | | 251,021 | |
Exxon Mobil Corp., Senior Notes | | | 3.043 | % | | | 3/1/26 | | | | 50,000 | | | | 48,546 | |
Noble Energy Inc., Senior Notes | | | 3.900 | % | | | 11/15/24 | | | | 50,000 | | | | 49,169 | |
Noble Energy Inc., Senior Notes | | | 5.250 | % | | | 11/15/43 | | | | 230,000 | | | | 227,639 | |
Occidental Petroleum Corp., Senior Notes | | | 3.000 | % | | | 2/15/27 | | | | 100,000 | | | | 95,111 | |
Targa Resources Partners LP/Targa Resources Partners Finance Corp., Senior Notes | | | 5.375 | % | | | 2/1/27 | | | | 100,000 | | | | 100,500 | |
Transcontinental Gas Pipe Line Co., LLC, Senior Notes | | | 7.850 | % | | | 2/1/26 | | | | 160,000 | | | | 195,168 | |
Total Oil, Gas & Consumable Fuels | | | | | | | | | | | | | | | 1,792,066 | |
Total Energy | | | | | | | | | | | | | | | 1,841,714 | |
| Materials — 0.9% | | | | | | | | | | | | | | | | |
Metals & Mining — 0.9% | | | | | | | | | | | | | | | | |
Alcoa Nederland Holding BV, Senior Notes | | | 6.125 | % | | | 5/15/28 | | | | 200,000 | | | | 206,000 | (b) |
Anglo American Capital PLC, Senior Notes | | | 4.000 | % | | | 9/11/27 | | | | 200,000 | | | | 184,611 | (b) |
ArcelorMittal, Senior Notes | | | 6.125 | % | | | 6/1/25 | | | | 40,000 | | | | 43,519 | |
ArcelorMittal, Senior Notes | | | 7.000 | % | | | 10/15/39 | | | | 60,000 | | | | 69,945 | |
Barrick Gold Corp., Senior Notes | | | 5.250 | % | | | 4/1/42 | | | | 50,000 | | | | 52,248 | |
Glencore Funding LLC, Senior Notes | | | 4.000 | % | | | 3/27/27 | | | | 50,000 | | | | 47,014 | (b) |
Glencore Funding LLC, Senior Notes | | | 3.875 | % | | | 10/27/27 | | | | 90,000 | | | | 83,663 | (b) |
Southern Copper Corp., Senior Notes | | | 5.250 | % | | | 11/8/42 | | | | 220,000 | | | | 223,169 | |
See Notes to Consolidated Financial Statements.
| | |
| QS Strategic Real Return Fund 2018 Annual Report | | 21 |
Consolidated schedule of investments (cont’d)
September 30, 2018
QS Strategic Real Return Fund
| | | | | | | | | | | | | | | | |
| Security | | Rate | | | Maturity
Date | | | Face
Amount | | | Value | |
Metals & Mining — continued | | | | | | | | | | | | | | | | |
Teck Resources Ltd., Senior Notes | | | 3.750 | % | | | 2/1/23 | | | $ | 40,000 | | | $ | 39,300 | |
Total Materials | | | | | | | | | | | | | | | 949,469 | |
Total Corporate Bonds & Notes (Cost — $2,834,081) | | | | | | | | | | | | | | | 2,791,183 | |
| Non-U.S. Treasury Inflation Protected Securities — 0.3% | | | | | | | | | | | | | | | | |
Brazil — 0.3% | | | | | | | | | | | | | | | | |
Brazil Notas do Tesouro Nacional Serie B, Notes (Cost — $423,138) | | | 6.000 | % | | | 8/15/30 | | | | 1,462,458 | BRL | | | 367,483 | |
| Sovereign Bonds — 0.2% | | | | | | | | | | | | | | | | |
Indonesia — 0.2% | | | | | | | | | | | | | | | | |
Indonesia Government International Bond, Senior Notes (Cost — $198,354) | | | 4.350 | % | | | 1/11/48 | | | | 200,000 | | | | 183,423 | |
Total Investments before Short-Term Investments (Cost — $86,045,783) | | | | | | | | 97,001,047 | |
| | | | |
| | | | | | | | | Shares | | | | |
| Short-Term Investments — 6.8% | | | | | | | | | | | | | | | | |
Invesco Government & Agency Portfolio, Institutional Class | | | 2.044 | % | | | | | | | 6,307,506 | | | | 6,307,506 | |
Dreyfus Government Cash Management, Institutional Shares | | | 2.013 | % | | | | | | | 601,699 | | | | 601,699 | |
Invesco Treasury Portfolio, Institutional Class | | | 2.042 | % | | | | | | | 291,509 | | | | 291,509 | |
Total Short-Term Investments (Cost — $7,200,714) | | | | | | | | | | | | | | | 7,200,714 | |
Total Investments — 97.9% (Cost — $93,246,497) | | | | | | | | | | | | | | | 104,201,761 | |
Other Assets in Excess of Liabilities — 2.1% | | | | | | | | | | | | | | | 2,280,514 | |
Total Net Assets — 100.0% | | | | | | | | | | | | | | $ | 106,482,275 | |
| * | Non-income producing security. |
| (a) | Security is valued in good faith in accordance with procedures approved by the Board of Trustees (See Note 1). |
| (b) | Security is exempt from registration under Rule 144A of the Securities Act of 1933. This security may be resold in transactions that are exempt from registration, normally to qualified institutional buyers. This security has been deemed liquid pursuant to guidelines approved by the Board of Trustees. |
| (c) | Rate shown represents yield-to-maturity. |
| | |
Abbreviations used in this schedule: |
| ADR | | — American Depositary Receipts |
| BRL | | — Brazilian Real |
| ETF | | — Exchange-Traded Fund |
| REIT | | — Real Estate Investment Trust |
See Notes to Consolidated Financial Statements.
| | |
| 22 | | QS Strategic Real Return Fund 2018 Annual Report |
QS Strategic Real Return Fund
At September 30, 2018, the Fund had the following open futures contracts:
| | | | | | | | | | | | | | | | | | | | |
| | | Number of
Contracts | | | Expiration
Date | | | Notional
Amount | | | Market
Value | | | Unrealized
Appreciation
(Depreciation) | |
| Contracts to Buy: | | | | | | | | | | | | | | | | | | | | |
| Dax Index | | | 3 | | | | 12/18 | | | $ | 1,044,039 | | | $ | 1,065,974 | | | $ | 21,935 | |
| E-Mini S&P 500 Index | | | 5 | | | | 12/18 | | | | 723,701 | | | | 729,750 | | | | 6,049 | |
| Euro-Bund | | | 91 | | | | 12/18 | | | | 16,944,128 | | | | 16,777,044 | | | | (167,084) | |
| FTSE 100 Index | | | 7 | | | | 12/18 | | | | 664,183 | | | | 683,053 | | | | 18,870 | |
| S&P GSCI | | | 181 | | | | 10/18 | | | | 21,317,810 | | | | 22,000,550 | | | | 682,740 | |
| S&P/TSX 60 | | | 14 | | | | 12/18 | | | | 2,061,744 | | | | 2,060,032 | | | | (1,712) | |
| SPI 200 Index | | | 19 | | | | 12/18 | | | | 2,114,413 | | | | 2,126,733 | | | | 12,320 | |
| Topix Index | | | 8 | | | | 12/18 | | | | 1,193,663 | | | | 1,279,704 | | | | 86,041 | |
| United Kingdom Long Gilt Bond | | | 26 | | | | 12/18 | | | | 4,139,507 | | | | 4,098,463 | | | | (41,044) | |
| | | | | | | | | | | | | | | | | | | | 618,115 | |
| Contracts to Sell: | | | | | | | | | | | | | | | | | | | | |
| Canadian 10-Year Bonds | | | 50 | | | | 12/18 | | | | 5,185,859 | | | | 5,133,744 | | | | 52,115 | |
| Euro-Bund | | | 15 | | | | 12/18 | | | | 2,779,873 | | | | 2,765,447 | | | | 14,426 | |
| U.S. Treasury 5-Year Notes | | | 4 | | | | 12/18 | | | | 449,962 | | | | 449,906 | | | | 56 | |
| U.S. Treasury 10-Year Notes | | | 99 | | | | 12/18 | | | | 11,887,693 | | | | 11,759,344 | | | | 128,349 | |
| U.S. Treasury Long-Term Bonds | | | 7 | | | | 12/18 | | | | 1,007,078 | | | | 983,500 | | | | 23,578 | |
| | | | | | | | | | | | | | | | | | | | 218,524 | |
| Net unrealized appreciation on open futures contracts | | | | | | | $ | 836,639 | |
At September 30, 2018, the Fund had the following open forward foreign currency contracts:
| | | | | | | | | | | | | | | | | | | | |
Currency
Purchased | | | Currency
Sold | | | Counterparty | | Settlement
Date | | | Unrealized
Appreciation
(Depreciation) | |
| AUD | | | 360,000 | | | USD | | | 262,006 | | | Citibank N.A. | | | 10/12/18 | | | $ | (1,760) | |
| AUD | | | 2,316,000 | | | USD | | | 1,657,582 | | | Citibank N.A. | | | 10/12/18 | | | | 16,668 | |
| AUD | | | 2,998,000 | | | USD | | | 2,126,245 | | | Citibank N.A. | | | 10/12/18 | | | | 41,027 | |
| CAD | | | 1,451,000 | | | USD | | | 1,112,630 | | | Citibank N.A. | | | 10/12/18 | | | | 11,115 | |
| CHF | | | 329,000 | | | USD | | | 340,800 | | | Citibank N.A. | | | 10/12/18 | | | | (5,139) | |
| CHF | | | 1,135,000 | | | USD | | | 1,167,376 | | | Citibank N.A. | | | 10/12/18 | | | | (9,395) | |
| GBP | | | 1,102,000 | | | USD | | | 1,442,030 | | | Citibank N.A. | | | 10/12/18 | | | | (4,777) | |
| GBP | | | 2,999,000 | | | USD | | | 3,900,770 | | | Citibank N.A. | | | 10/12/18 | | | | 10,594 | |
| JPY | | | 19,600,000 | | | USD | | | 174,289 | | | Citibank N.A. | | | 10/12/18 | | | | (1,605) | |
| JPY | | | 228,700,000 | | | USD | | | 2,054,455 | | | Citibank N.A. | | | 10/12/18 | | | | (39,516) | |
| JPY | | | 491,000,000 | | | USD | | | 4,410,745 | | | Citibank N.A. | | | 10/12/18 | | | | (84,837) | |
| NOK | | | 5,840,000 | | | USD | | | 707,847 | | | Citibank N.A. | | | 10/12/18 | | | | 10,128 | |
| NOK | | | 15,060,000 | | | USD | | | 1,848,182 | | | Citibank N.A. | | | 10/12/18 | | | | 3,310 | |
| NZD | | | 1,886,000 | | | USD | | | 1,234,770 | | | Citibank N.A. | | | 10/12/18 | | | | 15,473 | |
See Notes to Consolidated Financial Statements.
| | |
| QS Strategic Real Return Fund 2018 Annual Report | | 23 |
Consolidated schedule of investments (cont’d)
September 30, 2018
QS Strategic Real Return Fund
| | | | | | | | | | | | | | | | | | | | |
Currency
Purchased | | | Currency
Sold | | | Counterparty | | Settlement
Date | | | Unrealized
Appreciation
(Depreciation) | |
| NZD | | | 3,275,000 | | | USD | | | 2,129,153 | | | Citibank N.A. | | | 10/12/18 | | | $ | 41,869 | |
| SEK | | | 24,230,000 | | | USD | | | 2,760,115 | | | Citibank N.A. | | | 10/12/18 | | | | (30,623) | |
| USD | | | 1,162,392 | | | EUR | | | 998,000 | | | Citibank N.A. | | | 10/12/18 | | | | 2,367 | |
| USD | | | 3,923 | | | GBP | | | 3,000 | | | Citibank N.A. | | | 10/12/18 | | | | 10 | |
| USD | | | 83,950 | | | SEK | | | 760,000 | | | Citibank N.A. | | | 10/12/18 | | | | (1,663) | |
| USD | | | 1,359,120 | | | SEK | | | 12,280,000 | | | Citibank N.A. | | | 10/12/18 | | | | (24,214) | |
| CAD | | | 374,000 | | | USD | | | 284,756 | | | HSBC Bank USA, N.A. | | | 10/12/18 | | | | 4,892 | |
| CAD | | | 6,709,000 | | | USD | | | 5,108,105 | | | HSBC Bank USA, N.A. | | | 10/12/18 | | | | 87,764 | |
| EUR | | | 439,000 | | | USD | | | 516,125 | | | HSBC Bank USA, N.A. | | | 10/12/18 | | | | (5,853) | |
| EUR | | | 16,110,000 | | | USD | | | 18,692,256 | | | HSBC Bank USA, N.A. | | | 10/12/18 | | | | 33,196 | |
| MXN | | | 41,560,000 | | | USD | | | 2,146,420 | | | HSBC Bank USA, N.A. | | | 10/12/18 | | | | 69,116 | |
| NOK | | | 18,070,000 | | | USD | | | 2,164,172 | | | HSBC Bank USA, N.A. | | | 10/12/18 | | | | 57,373 | |
| NOK | | | 22,530,000 | | | USD | | | 2,698,328 | | | HSBC Bank USA, N.A. | | | 10/12/18 | | | | 71,534 | |
| SEK | | | 12,380,000 | | | USD | | | 1,368,617 | | | HSBC Bank USA, N.A. | | | 10/12/18 | | | | 25,981 | |
| USD | | | 3,099,908 | | | AUD | | | 4,370,000 | | | HSBC Bank USA, N.A. | | | 10/12/18 | | | | (59,190) | |
| USD | | | 362,386 | | | CAD | | | 468,000 | | | HSBC Bank USA, N.A. | | | 10/12/18 | | | | (62) | |
| USD | | | 1,044 | | | CHF | | | 1,000 | | | HSBC Bank USA, N.A. | | | 10/12/18 | | | | 23 | |
| USD | | | 4,086,908 | | | CHF | | | 3,972,000 | | | HSBC Bank USA, N.A. | | | 10/12/18 | | | | 34,483 | |
| USD | | | 4,543,874 | | | EUR | | | 3,915,000 | | | HSBC Bank USA, N.A. | | | 10/12/18 | | | | (6,724) | |
| USD | | | 939,383 | | | GBP | | | 722,000 | | | HSBC Bank USA, N.A. | | | 10/12/18 | | | | (2,265) | |
| USD | | | 1,675,397 | | | JPY | | | 187,400,000 | | | HSBC Bank USA, N.A. | | | 10/12/18 | | | | 24,327 | |
| USD | | | 1,335 | | | NZD | | | 2,000 | | | HSBC Bank USA, N.A. | | | 10/12/18 | | | | 10 | |
| USD | | | 1,059,295 | | | NZD | | | 1,629,000 | | | HSBC Bank USA, N.A. | | | 10/12/18 | | | | (20,581) | |
| USD | | | 2,358 | | | EUR | | | 2,000 | | | Goldman Sachs Group Inc. | | | 10/18/18 | | | | 32 | |
| USD | | | 3,537 | | | EUR | | | 3,000 | | | Goldman Sachs Group Inc. | | | 10/18/18 | | | | 49 | |
| USD | | | 6,876 | | | EUR | | | 6,000 | | | Goldman Sachs Group Inc. | | | 10/18/18 | | | | (101) | |
| USD | | | 10,288 | | | EUR | | | 9,000 | | | Goldman Sachs Group Inc. | | | 10/18/18 | | | | (179) | |
| Total | | | | | | $ | 262,857 | |
| | |
Abbreviations used in this table: |
| AUD | | — Australian Dollar |
| CAD | | — Canadian Dollar |
| CHF | | — Swiss Franc |
| EUR | | — Euro |
| GBP | | — British Pound |
| JPY | | — Japanese Yen |
| MXN — Mexican Peso |
| NOK | | — Norwegian Krone |
| NZD | | — New Zealand Dollar |
| SEK | | — Swedish Krona |
| USD | | — United States Dollar |
See Notes to Consolidated Financial Statements.
| | |
| 24 | | QS Strategic Real Return Fund 2018 Annual Report |
Consolidated statement of assets and liabilities
September 30, 2018
| | | | |
| |
| Assets: | | | | |
Investments, at value (Cost — $93,246,497) | | $ | 104,201,761 | |
Foreign currency, at value (Cost — $36,322) | | | 35,715 | |
Deposits with brokers for open futures contracts | | | 1,265,922 | |
Foreign currency collateral for open futures contracts, at value (Cost — $751,137) | | | 749,629 | |
Unrealized appreciation on forward foreign currency contracts | | | 561,341 | |
Interest and dividends receivable | | | 298,461 | |
Receivable from broker — variation margin on open futures contracts | | | 40,899 | |
Prepaid expenses | | | 35,381 | |
Total Assets | | | 107,189,109 | |
| |
| Liabilities: | | | | |
Payable for securities purchased | | | 169,869 | |
Unrealized depreciation on forward foreign currency contracts | | | 298,484 | |
Due to custodian | | | 41,000 | |
Investment management fee payable | | | 36,354 | |
Trustees’ fees payable | | | 2,490 | |
Service and/or distribution fees payable | | | 485 | |
Payable for Fund shares repurchased | | | 30 | |
Accrued expenses | | | 158,122 | |
Total Liabilities | | | 706,834 | |
| Total Net Assets | | $ | 106,482,275 | |
| |
| Net Assets: | | | | |
Par value (Note 7) | | $ | 86 | |
Paid-in capital in excess of par value | | | 88,196,154 | |
Undistributed net investment income | | | 3,602,850 | |
Accumulated net realized gain on investments, futures contracts, forward foreign currency contracts and foreign currency transactions | | | 2,630,999 | |
Net unrealized appreciation on investments, futures contracts, forward foreign currency contracts and foreign currencies | | | 12,052,186 | |
| Total Net Assets | | $ | 106,482,275 | |
See Notes to Consolidated Financial Statements.
| | |
| QS Strategic Real Return Fund 2018 Annual Report | | 25 |
Consolidated statement of assets and liabilities (cont’d)
September 30, 2018
| | | | |
| |
| Net Assets: | | | | |
Class A | | | $324,239 | |
Class A2 | | | $1,329,173 | |
Class C | | | $182,717 | |
Class I | | | $1,853,872 | |
Class IS | | | $102,792,274 | |
| |
| Shares Outstanding: | | | | |
Class A | | | 26,492 | |
Class A2 | | | 110,350 | |
Class C | | | 15,463 | |
Class I | | | 148,099 | |
Class IS | | | 8,314,476 | |
| |
| Net Asset Value: | | | | |
Class A (and redemption price) | | | $12.24 | |
Class A2 (and redemption price) | | | $12.05 | |
Class C* | | | $11.82 | |
Class I (and redemption price) | | | $12.52 | |
Class IS (and redemption price) | | | $12.36 | |
| Maximum Public Offering Price Per Share: | | | | |
Class A (based on maximum initial sales charge of 5.75%) | | | $12.99 | |
Class A2 (based on maximum initial sales charge of 5.75%) | | | $12.79 | |
| * | Redemption price per share is NAV of Class C shares reduced by a 1.00% CDSC if shares are redeemed within one year from purchase payment (Note 2). |
See Notes to Consolidated Financial Statements.
| | |
| 26 | | QS Strategic Real Return Fund 2018 Annual Report |
Consolidated statement of operations
For the Year Ended September 30, 2018
| | | | |
| |
| Investment Income: | | | | |
Dividends | | $ | 1,167,086 | |
Return of capital (Note 1 (i)) | | | (156,756) | |
Net Dividends | | | 1,010,330 | |
Interest | | | 1,730,037 | |
Less: Foreign taxes withheld | | | (42,066) | |
Total Investment Income | | | 2,698,301 | |
| |
| Expenses: | | | | |
Investment management fee (Note 2) | | | 801,288 | |
Registration fees | | | 88,527 | |
Audit and tax fees | | | 71,391 | |
Custody fees | | | 55,837 | |
Legal fees | | | 42,120 | |
Fund accounting fees | | | 33,544 | |
Commodity pool reports | | | 33,000 | |
Shareholder reports | | | 26,155 | |
Trustees’ fees | | | 15,353 | |
Transfer agent fees (Note 5) | | | 6,956 | |
Insurance | | | 6,461 | |
Service and/or distribution fees (Notes 2 and 5) | | | 6,276 | |
Fees recaptured by investment manager (Note 2) | | | 314 | |
Interest expense | | | 269 | |
Miscellaneous expenses | | | 12,014 | |
Total Expenses | | | 1,199,505 | |
Less: Fee waivers and/or expense reimbursements (Notes 2 and 5) | | | (143,345) | |
Net Expenses | | | 1,056,160 | |
| Net Investment Income | | | 1,642,141 | |
| |
Realized and Unrealized Gain (Loss) on Investments, Futures Contracts,
Forward Foreign Currency Contracts and Foreign Currency Transactions (Notes 1, 3 and 4): | | | | |
Net Realized Gain (Loss) From: | | | | |
Investment transactions | | | 3,360,571 | |
Futures contracts | | | 5,166,375 | |
Forward foreign currency contracts | | | (3,082,432) | |
Foreign currency transactions | | | 394,885 | |
REIT distributions | | | 4,934 | |
Net Realized Gain | | | 5,844,333 | |
Change in Net Unrealized Appreciation (Depreciation) From: | | | | |
Investments | | | (1,625,879) | |
Futures contracts | | | 350,889 | |
Forward foreign currency contracts | | | 724,762 | |
Foreign currencies | | | (1,105) | |
Change in Net Unrealized Appreciation (Depreciation) | | | (551,333) | |
| Net Gain on Investments, Futures Contracts, Forward Foreign Currency Contracts and Foreign Currency Transactions | | | 5,293,000 | |
| Increase in Net Assets From Operations | | $ | 6,935,141 | |
See Notes to Consolidated Financial Statements.
| | |
| QS Strategic Real Return Fund 2018 Annual Report | | 27 |
Consolidated statements of changes in net assets
| | | | | | | | |
| For the Years Ended September 30, | | 2018 | | | 2017 | |
| | |
| Operations: | | | | | | | | |
Net investment income | | $ | 1,642,141 | | | $ | 1,047,934 | |
Net realized gain | | | 5,844,333 | | | | 4,549,769 | |
Change in net unrealized appreciation (depreciation) | | | (551,333) | | | | (59,651) | |
Increase in Net Assets From Operations | | | 6,935,141 | | | | 5,538,052 | |
| | |
| Distributions to Shareholders From (Notes 1 and 6): | | | | | | | | |
Net investment income | | | (1,554,012) | | | | — | |
Net realized gains | | | (2,799,946) | | | | (2,489,657) | |
Decrease in Net Assets From Distributions to Shareholders | | | (4,353,958) | | | | (2,489,657) | |
| | |
| Fund Share Transactions (Note 7): | | | | | | | | |
Net proceeds from sale of shares | | | 2,168,546 | | | | 7,412,581 | |
Reinvestment of distributions | | | 4,351,094 | | | | 2,489,457 | |
Cost of shares repurchased | | | (7,914,758) | | | | (29,516,828) | |
Decrease in Net Assets From Fund Share Transactions | | | (1,395,118) | | | | (19,614,790) | |
Increase (Decrease) in Net Assets | | | 1,186,065 | | | | (16,566,395) | |
| | |
| Net Assets: | | | | | | | | |
Beginning of year | | | 105,296,210 | | | | 121,862,605 | |
End of year* | | $ | 106,482,275 | | | $ | 105,296,210 | |
* Includes undistributed net investment income of: | | | $3,602,850 | | | | $1,839,050 | |
See Notes to Consolidated Financial Statements.
| | |
| 28 | | QS Strategic Real Return Fund 2018 Annual Report |
Consolidated financial highlights
| | | | | | | | | | | | | | | | | | | | | | | | |
For a share of each class of beneficial interest outstanding throughout each year ended September 30,
unless otherwise noted: | |
| Class A Shares1 | | 2018 | | | 2017 | | | 2016 | | | 2015 | | | 20142 | | | 20133 | |
| | | | | | |
| Net asset value, beginning of year | | | $11.93 | | | | $11.63 | | | | $11.57 | | | | $13.78 | | | | $14.20 | | | | $14.16 | |
| | | | | | |
| Income (loss) from operations: | | | | | | | | | | | | | | | | | | | | | | | | |
Net investment income (loss) | | | 0.13 | | | | 0.05 | | | | 0.01 | | | | (0.06) | | | | 0.04 | | | | 0.06 | |
Net realized and unrealized gain (loss) | | | 0.60 | | | | 0.49 | | | | 0.48 | | | | (1.96) | | | | (0.06) | | | | 0.26 | |
Total income (loss) from operations | | | 0.73 | | | | 0.54 | | | | 0.49 | | | | (2.02) | | | | (0.02) | | | | 0.32 | |
| | | | | | |
| Less distributions from: | | | | | | | | | | | | | | | | | | | | | | | | |
Net investment income | | | (0.10) | | | | — | | | | — | | | | — | | | | — | | | | (0.22) | |
Net realized gains | | | (0.32) | | | | (0.24) | | | | (0.43) | | | | (0.19) | | | | (0.40) | | | | (0.06) | |
Total distributions | | | (0.42) | | | | (0.24) | | | | (0.43) | | | | (0.19) | | | | (0.40) | | | | (0.28) | |
| | | | | | |
| Net asset value, end of year | | | $12.24 | | | | $11.93 | | | | $11.63 | | | | $11.57 | | | | $13.78 | | | | $14.20 | |
Total return4 | | | 6.32 | % | | | 4.75 | % | | | 4.41 | % | | | (14.82) | % | | | (0.15) | % | | | 2.27 | % |
| | | | | | |
| Net assets, end of year (000s) | | | $324 | | | | $551 | | | | $1,143 | | | | $1,864 | | | | $3,697 | | | | $5,156 | |
| | | | | | |
| Ratios to average net assets: | | | | | | | | | | | | | | | | | | | | | | | | |
Gross expenses5 | | | 1.54 | % | | | 1.49 | %6 | | | 1.47 | %6 | | | 1.49 | %6 | | | 1.58 | %7 | | | 1.52 | % |
Net expenses5,8,9 | | | 1.33 | | | | 1.33 | 6 | | | 1.33 | 6 | | | 1.32 | 6 | | | 1.32 | 7 | | | 1.32 | |
Net investment income (loss) | | | 1.11 | | | | 0.46 | | | | 0.07 | | | | (0.49) | | | | 0.32 | 7 | | | 0.41 | |
| | | | | | |
| Portfolio turnover rate | | | 61 | % | | | 42 | % | | | 41 | % | | | 65 | % | | | 25 | % | | | 55 | % |
| 1 | Per share amounts have been calculated using the average shares method. |
| 2 | For the period December 1, 2013 through September 30, 2014. |
| 3 | For the year ended November 30. |
| 4 | Performance figures, exclusive of sales charges, may reflect compensating balance arrangements, fee waivers and/or expense reimbursements. In the absence of compensating balance arrangements, fee waivers and/or expense reimbursements, the total return would have been lower. Past performance is no guarantee of future results. Total returns for periods of less than one year are not annualized. |
| 5 | Does not include fees and expenses of the Underlying Funds in which the Fund invests. |
| 6 | Reflects recapture of expenses waived/reimbursed from prior fiscal years. |
| 8 | Reflects fee waivers and/or expense reimbursements. |
| 9 | As a result of an expense limitation arrangement, the ratio of total annual fund operating expenses, other than interest, brokerage commissions (except for brokerage commissions paid on purchases and sales of shares of ETFs), dividend expenses on short sales, taxes and extraordinary expenses, to average net assets of Class A shares did not exceed 1.35%. This expense limitation arrangement cannot be terminated prior to December 31, 2019 without the Board of Trustees’ consent. Acquired fund fees and expenses are subject to the expense limitation arrangement. |
See Notes to Consolidated Financial Statements.
| | |
| QS Strategic Real Return Fund 2018 Annual Report | | 29 |
Consolidated financial highlights (cont’d)
| | | | | | | | | | | | | | | | | | | | | | | | |
For a share of each class of beneficial interest outstanding throughout each year ended September 30,
unless otherwise noted: | |
| Class A2 Shares1 | | 2018 | | | 2017 | | | 2016 | | | 2015 | | | 20142 | | | 20133 | |
| | | | | | |
| Net asset value, beginning of year | | | $11.77 | | | | $11.50 | | | | $11.47 | | | | $13.69 | | | | $14.13 | | | | $14.16 | |
| | | | | | |
| Income (loss) from operations: | | | | | | | | | | | | | | | | | | | | | | | | |
Net investment income (loss) | | | 0.12 | | | | 0.04 | | | | (0.00) | 4 | | | (0.06) | | | | 0.02 | | | | 0.03 | |
Net realized and unrealized gain (loss) | | | 0.58 | | | | 0.47 | | | | 0.46 | | | | (1.97) | | | | (0.06) | | | | 0.27 | |
Total income (loss) from operations | | | 0.70 | | | | 0.51 | | | | 0.46 | | | | (2.03) | | | | (0.04) | | | | 0.30 | |
| | | | | | |
| Less distributions from: | | | | | | | | | | | | | | | | | | | | | | | | |
Net investment income | | | (0.10) | | | | — | | | | — | | | | — | | | | — | | | | (0.27) | |
Net realized gains | | | (0.32) | | | | (0.24) | | | | (0.43) | | | | (0.19) | | | | (0.40) | | | | (0.06) | |
Total distributions | | | (0.42) | | | | (0.24) | | | | (0.43) | | | | (0.19) | | | | (0.40) | | | | (0.33) | |
| | | | | | |
| Net asset value, end of year | | | $12.05 | | | | $11.77 | | | | $11.50 | | | | $11.47 | | | | $13.69 | | | | $14.13 | |
Total return5 | | | 6.13 | % | | | 4.54 | % | | | 4.27 | % | | | (15.07) | % | | | (0.30) | % | | | 2.17 | % |
| | | | | | |
| Net assets, end of year (000s) | | | $1,329 | | | | $1,381 | | | | $1,358 | | | | $1,435 | | | | $1,844 | | | | $1,672 | |
| | | | | | |
| Ratios to average net assets: | | | | | | | | | | | | | | | | | | | | | | | | |
Gross expenses6 | | | 1.65 | %7 | | | 1.74 | %7 | | | 1.75 | %7 | | | 1.77 | % | | | 2.08 | %8 | | | 1.83 | %7 |
Net expenses6,9,10 | | | 1.53 | 7 | | | 1.53 | 7 | | | 1.53 | 7 | | | 1.53 | | | | 1.52 | 8 | | | 1.49 | 7 |
Net investment income (loss) | | | 0.99 | | | | 0.36 | | | | (0.01) | | | | (0.50) | | | | 0.17 | 8 | | | 0.24 | |
| | | | | | |
| Portfolio turnover rate | | | 61 | % | | | 42 | % | | | 41 | % | | | 65 | % | | | 25 | % | | | 55 | % |
| 1 | Per share amounts have been calculated using the average shares method. |
| 2 | For the period December 1, 2013 through September 30, 2014. |
| 3 | For the year ended November 30. |
| 4 | Amount represents less than $0.005 per share. |
| 5 | Performance figures, exclusive of sales charges, may reflect compensating balance arrangements, fee waivers and/or expense reimbursements. In the absence of compensating balance arrangements, fee waivers and/or expense reimbursements, the total return would have been lower. Past performance is no guarantee of future results. Total returns for periods of less than one year are not annualized. |
| 6 | Does not include fees and expenses of the Underlying Funds in which the Fund invests. |
| 7 | Reflects recapture of expenses waived/reimbursed from prior fiscal years. |
| 9 | Reflects fee waivers and/or expense reimbursements. |
| 10 | As a result of an expense limitation arrangement, the ratio of total annual fund operating expenses, other than interest, brokerage commissions (except for brokerage commissions paid on purchases and sales of shares of ETFs), dividend expenses on short sales, taxes and extraordinary expenses, to average net assets of Class A2 shares did not exceed 1.55%. This expense limitation arrangement cannot be terminated prior to December 31, 2019 without the Board of Trustees’ consent. Acquired fund fees and expenses are subject to the expense limitation arrangement. |
See Notes to Consolidated Financial Statements.
| | |
| 30 | | QS Strategic Real Return Fund 2018 Annual Report |
| | | | | | | | | | | | | | | | | | | | | | | | |
For a share of each class of beneficial interest outstanding throughout each year ended September 30,
unless otherwise noted: | |
| Class C Shares1 | | 2018 | | | 2017 | | | 2016 | | | 2015 | | | 20142 | | | 20133 | |
| | | | | | |
| Net asset value, beginning of year | | | $11.52 | | | | $11.31 | | | | $11.35 | | | | $13.63 | | | | $14.13 | | | | $14.07 | |
| | | | | | |
| Income (loss) from operations: | | | | | | | | | | | | | | | | | | | | | | | | |
Net investment income (loss) | | | 0.05 | | | | (0.02) | | | | (0.07) | | | | (0.17) | | | | (0.05) | | | | (0.05) | |
Net realized and unrealized gain (loss) | | | 0.57 | | | | 0.47 | | | | 0.46 | | | | (1.92) | | | | (0.05) | | | | 0.26 | |
Total income (loss) from operations | | | 0.62 | | | | 0.45 | | | | 0.39 | | | | (2.09) | | | | (0.10) | | | | 0.21 | |
| | | | | | |
| Less distributions from: | | | | | | | | | | | | | | | | | | | | | | | | |
Net investment income | | | — | | | | — | | | | — | | | | — | | | | — | | | | (0.09) | |
Net realized gains | | | (0.32) | | | | (0.24) | | | | (0.43) | | | | (0.19) | | | | (0.40) | | | | (0.06) | |
Total distributions | | | (0.32) | | | | (0.24) | | | | (0.43) | | | | (0.19) | | | | (0.40) | | | | (0.15) | |
| | | | | | |
| Net asset value, end of year | | | $11.82 | | | | $11.52 | | | | $11.31 | | | | $11.35 | | | | $13.63 | | | | $14.13 | |
Total return4 | | | 5.51 | % | | | 3.98 | % | | | 3.68 | % | | | (15.50) | % | | | (0.74) | % | | | 1.49 | % |
| | | | | | |
| Net assets, end of year (000s) | | | $183 | | | | $196 | | | | $373 | | | | $490 | | | | $1,035 | | | | $1,260 | |
| | | | | | |
| Ratios to average net assets: | | | | | | | | | | | | | | | | | | | | | | | | |
Gross expenses5 | | | 2.34 | % | | | 2.28 | %6 | | | 2.28 | % | | | 2.32 | %6 | | | 2.42 | %7 | | | 2.43 | % |
Net expenses5,8,9 | | | 2.08 | | | | 2.08 | 6 | | | 2.08 | | | | 2.07 | 6 | | | 2.07 | 7 | | | 2.07 | |
Net investment income (loss) | | | 0.44 | | | | (0.18) | | | | (0.62) | | | | (1.33) | | | | (0.42) | 7 | | | (0.33) | |
| | | | | | |
| Portfolio turnover rate | | | 61 | % | | | 42 | % | | | 41 | % | | | 65 | % | | | 25 | % | | | 55 | % |
| 1 | Per share amounts have been calculated using the average shares method. |
| 2 | For the period December 1, 2013 through September 30, 2014. |
| 3 | For the year ended November 30. |
| 4 | Performance figures, exclusive of CDSC, may reflect compensating balance arrangements, fee waivers and/or expense reimbursements. In the absence of compensating balance arrangements, fee waivers and/or expense reimbursements, the total return would have been lower. Past performance is no guarantee of future results. Total returns for periods of less than one year are not annualized. |
| 5 | Does not include fees and expenses of the Underlying Funds in which the Fund invests. |
| 6 | Reflects recapture of expenses waived/reimbursed from prior fiscal years. |
| 8 | Reflects fee waivers and/or expense reimbursements. |
| 9 | As a result of an expense limitation arrangement, the ratio of total annual fund operating expenses, other than interest, brokerage commissions (except for brokerage commissions paid on purchases and sales of shares of ETFs), dividend expense on short sales, taxes and extraordinary expenses, to average net assets of Class C shares did not exceed 2.10%. This expense limitation arrangement cannot be terminated prior to December 31, 2019 without the Board of Trustees’ consent. Acquired fund fees and expenses are subject to the expense limitation arrangement. |
See Notes to Consolidated Financial Statements.
| | |
| QS Strategic Real Return Fund 2018 Annual Report | | 31 |
Consolidated financial highlights (cont’d)
| | | | | | | | | | | | | | | | | | | | | | | | |
For a share of each class of beneficial interest outstanding throughout each year ended September 30,
unless otherwise noted: | |
| Class I Shares1 | | 2018 | | | 2017 | | | 2016 | | | 2015 | | | 20142 | | | 20133 | |
| | | | | | |
| Net asset value, beginning of year | | | $12.22 | | | | $11.87 | | | | $11.77 | | | | $14.02 | | | | $14.42 | | | | $14.19 | |
| | | | | | |
| Income (loss) from operations: | | | | | | | | | | | | | | | | | | | | | | | | |
Net investment income (loss) | | | 0.18 | | | | 0.11 | | | | 0.05 | | | | (0.01) | | | | 0.07 | | | | 0.10 | |
Net realized and unrealized gain (loss) | | | 0.60 | | | | 0.48 | | | | 0.48 | | | | (2.01) | | | | (0.07) | | | | 0.26 | |
Total income (loss) from operations | | | 0.78 | | | | 0.59 | | | | 0.53 | | | | (2.02) | | | | (0.00) | 4 | | | 0.36 | |
| | | | | | |
| Less distributions from: | | | | | | | | | | | | | | | | | | | | | | | | |
Net investment income | | | (0.16) | | | | — | | | | — | | | | (0.04) | | | | — | | | | (0.07) | |
Net realized gains | | | (0.32) | | | | (0.24) | | | | (0.43) | | | | (0.19) | | | | (0.40) | | | | (0.06) | |
Total distributions | | | (0.48) | | | | (0.24) | | | | (0.43) | | | | (0.23) | | | | (0.40) | | | | (0.13) | |
| | | | | | |
| Net asset value, end of year | | | $12.52 | | | | $12.22 | | | | $11.87 | | | | $11.77 | | | | $14.02 | | | | $14.42 | |
Total return5 | | | 6.62 | % | | | 5.08 | % | | | 4.68 | % | | | (14.62) | % | | | (0.01) | % | | | 2.59 | % |
| | | | | | |
| Net assets, end of year (000s) | | | $1,854 | | | | $1,674 | | | | $906 | | | | $808 | | | | $955 | | | | $890 | |
| | | | | | |
| Ratios to average net assets: | | | | | | | | | | | | | | | | | | | | | | | | |
Gross expenses6 | | | 1.18 | % | | | 1.20 | %7 | | | 1.17 | %7 | | | 1.24 | %7 | | | 1.44 | %8 | | | 1.26 | %7 |
Net expenses6,9,10 | | | 1.08 | | | | 1.08 | 7 | | | 1.08 | 7 | | | 1.08 | 7 | | | 1.07 | 8 | | | 1.07 | 7 |
Net investment income (loss) | | | 1.47 | | | | 0.97 | | | | 0.47 | | | | (0.05) | | | | 0.61 | 8 | | | 0.69 | |
| | | | | | |
| Portfolio turnover rate | | | 61 | % | | | 42 | % | | | 41 | % | | | 65 | % | | | 25 | % | | | 55 | % |
| 1 | Per share amounts have been calculated using the average shares method. |
| 2 | For the period December 1, 2013 through September 30, 2014. |
| 3 | For the year ended November 30. |
| 4 | Amount represents less than $0.005 per share. |
| 5 | Performance figures may reflect compensating balance arrangements, fee waivers and/or expense reimbursements. In the absence of compensating balance arrangements, fee waivers and/or expense reimbursements, the total return would have been lower. Past performance is no guarantee of future results. Total returns for periods of less than one year are not annualized. |
| 6 | Does not include fees and expenses of the Underlying Funds in which the Fund invests. |
| 7 | Reflects recapture of expenses waived/reimbursed from prior fiscal years. |
| 9 | Reflects fee waivers and/or expense reimbursements. |
| 10 | As a result of an expense limitation arrangement, the ratio of total annual fund operating expenses, other than interest, brokerage commissions (except for brokerage commissions paid on purchases and sales of shares of ETFs), dividend expenses on short sales, taxes and extraordinary expenses, to average net assets of Class I shares did not exceed 1.10%. This expense limitation arrangement cannot be terminated prior to December 31, 2019 without the Board of Trustees’ consent. Acquired fund fees and expenses are subject to the expense limitation arrangement. |
See Notes to Consolidated Financial Statements.
| | |
| 32 | | QS Strategic Real Return Fund 2018 Annual Report |
| | | | | | | | | | | | | | | | | | | | | | | | |
For a share of each class of beneficial interest outstanding throughout each year ended September 30,
unless otherwise noted: | |
| Class IS Shares1 | | 2018 | | | 2017 | | | 2016 | | | 2015 | | | 20142 | | | 20133 | |
| | | | | | |
| Net asset value, beginning of year | | | $12.08 | | | | $11.73 | | | | $11.62 | | | | $13.85 | | | | $14.22 | | | | $14.19 | |
| | | | | | |
| Income (loss) from operations: | | | | | | | | | | | | | | | | | | | | | | | | |
Net investment income | | | 0.19 | | | | 0.11 | | | | 0.06 | | | | 0.01 | | | | 0.08 | | | | 0.10 | |
Net realized and unrealized gain (loss) | | | 0.58 | | | | 0.48 | | | | 0.48 | | | | (2.00) | | | | (0.05) | | | | 0.26 | |
Total income (loss) from operations | | | 0.77 | | | | 0.59 | | | | 0.54 | | | | (1.99) | | | | 0.03 | | | | 0.36 | |
| | | | | | |
| Less distributions from: | | | | | | | | | | | | | | | | | | | | | | | | |
Net investment income | | | (0.17) | | | | — | | | | — | | | | (0.05) | | | | — | | | | (0.27) | |
Net realized gains | | | (0.32) | | | | (0.24) | | | | (0.43) | | | | (0.19) | | | | (0.40) | | | | (0.06) | |
Total distributions | | | (0.49) | | | | (0.24) | | | | (0.43) | | | | (0.24) | | | | (0.40) | | | | (0.33) | |
| | | | | | |
| Net asset value, end of year | | | $12.36 | | | | $12.08 | | | | $11.73 | | | | $11.62 | | | | $13.85 | | | | $14.22 | |
Total return4 | | | 6.62 | % | | | 5.14 | % | | | 4.83 | % | | | (14.58) | % | | | 0.21 | % | | | 2.60 | % |
| | | | | | |
| Net assets, end of year (millions) | | | $103 | | | | $101 | | | | $118 | | | | $116 | | | | $137 | | | | $134 | |
| | | | | | |
| Ratios to average net assets: | | | | | | | | | | | | | | | | | | | | | | | | |
Gross expenses5 | | | 1.11 | %6 | | | 1.08 | % | | | 1.08 | % | | | 1.04 | % | | | 1.08 | %7 | | | 1.09 | % |
Net expenses5,8,9 | | | 0.98 | 6 | | | 0.98 | | | | 0.98 | | | | 0.98 | | | | 0.97 | 7 | | | 0.97 | |
Net investment income | | | 1.55 | | | | 0.91 | | | | 0.55 | | | | 0.04 | | | | 0.70 | 7 | | | 0.74 | |
| | | | | | |
| Portfolio turnover rate | | | 61 | % | | | 42 | % | | | 41 | % | | | 65 | % | | | 25 | % | | | 55 | % |
| 1 | Per share amounts have been calculated using the average shares method. |
| 2 | For the period December 1, 2013 through September 30, 2014. |
| 3 | For the year ended November 30. |
| 4 | Performance figures may reflect compensating balance arrangements, fee waivers and/or expense reimbursements. In the absence of compensating balance arrangements, fee waivers and/or expense reimbursements, the total return would have been lower. Past performance is no guarantee of future results. Total returns for periods of less than one year are not annualized. |
| 5 | Does not include fees and expenses of the Underlying Funds in which the Fund invests. |
| 6 | Reflects recapture of expenses waived/reimbursed from prior fiscal years. |
| 8 | Reflects fee waivers and/or expense reimbursements. |
| 9 | As a result of an expense limitation arrangement, the ratio of total annual fund operating expenses, other than interest, brokerage commissions (except for brokerage commissions paid on purchases and sales of shares of ETFs), dividend expenses on short sales, taxes and extraordinary expenses, to average net assets of Class IS shares did not exceed 1.00%. In addition, the ratio of total annual fund operating expenses for Class IS shares did not exceed the ratio of total annual fund operating expenses for Class I shares. These expense limitation arrangements cannot be terminated prior to December 31, 2019 without the Board of Trustees’ consent. Acquired fund fees and expenses are subject to the expense limitation arrangement. |
See Notes to Consolidated Financial Statements.
| | |
| QS Strategic Real Return Fund 2018 Annual Report | | 33 |
Notes to consolidated financial statements
1. Organization and significant accounting policies
QS Strategic Real Return Fund (the “Fund”) is a separate non-diversified investment series of Legg Mason Global Asset Management Trust (the “Trust”). The Trust, a Maryland statutory trust, is registered under the Investment Company Act of 1940, as amended (the “1940 Act”), as an open-end management investment company.
The Fund gains exposure to the commodities markets by investing a portion of its assets in a wholly-owned subsidiary, Real Return Fund Ltd. (the “Subsidiary”), organized under the laws of the Cayman Islands. Among other investments, the Subsidiary may invest in commodity-linked instruments. The Fund may invest up to 25% of its total assets in the Subsidiary. These financial statements are the consolidated financial statements of the Fund and the Subsidiary.
The following are significant accounting policies consistently followed by the Fund and are in conformity with U.S. generally accepted accounting principles (“GAAP”). Estimates and assumptions are required to be made regarding assets, liabilities and changes in net assets resulting from operations when financial statements are prepared. Changes in the economic environment, financial markets and any other parameters used in determining these estimates could cause actual results to differ. Subsequent events have been evaluated through the date the consolidated financial statements were issued.
(a) Investment valuation. Equity securities for which market quotations are available are valued at the last reported sales price or official closing price on the primary market or exchange on which they trade. The valuations for fixed income securities (which may include, but are not limited to, corporate, government, municipal, mortgage-backed, collateralized mortgage obligations and asset-backed securities) and certain derivative instruments are typically the prices supplied by independent third party pricing services, which may use market prices or broker/dealer quotations or a variety of valuation techniques and methodologies. The independent third party pricing services use inputs that are observable such as issuer details, interest rates, yield curves, prepayment speeds, credit risks/spreads, default rates and quoted prices for similar securities. Prior to December 1, 2017, short-term fixed income securities that would mature in 60 days or less were valued at amortized cost, unless it was determined that using this method would not reflect an investment’s fair value. Investments in open-end funds are valued at the closing net asset value per share of each fund on the day of valuation. Futures contracts are valued daily at the settlement price established by the board of trade or exchange on which they are traded. When the Fund holds securities or other assets that are denominated in a foreign currency, the Fund will normally use the currency exchange rates as of 4:00 p.m. (Eastern Time). If independent third party pricing services are unable to supply prices for a portfolio investment, or if the prices supplied are deemed by the manager to be unreliable, the market price may be determined by the manager using quotations from one or more broker/dealers or at the transaction price if the security has recently been purchased and no value has yet been obtained from a pricing service or pricing broker. When reliable prices are not readily available, such as when the value of a security has been significantly affected by
| | |
| 34 | | QS Strategic Real Return Fund 2018 Annual Report |
events after the close of the exchange or market on which the security is principally traded, but before the Fund calculates its net asset value, the Fund values these securities as determined in accordance with procedures approved by the Fund’s Board of Trustees.
The Board of Trustees is responsible for the valuation process and has delegated the supervision of the daily valuation process to the Legg Mason North Atlantic Fund Valuation Committee (the “Valuation Committee”). The Valuation Committee, pursuant to the policies adopted by the Board of Trustees, is responsible for making fair value determinations, evaluating the effectiveness of the Fund’s pricing policies, and reporting to the Board of Trustees. When determining the reliability of third party pricing information for investments owned by the Fund, the Valuation Committee, among other things, conducts due diligence reviews of pricing vendors, monitors the daily change in prices and reviews transactions among market participants.
The Valuation Committee will consider pricing methodologies it deems relevant and appropriate when making fair value determinations. Examples of possible methodologies include, but are not limited to, multiple of earnings; discount from market of a similar freely traded security; discounted cash-flow analysis; book value or a multiple thereof; risk premium/yield analysis; yield to maturity; and/or fundamental investment analysis. The Valuation Committee will also consider factors it deems relevant and appropriate in light of the facts and circumstances. Examples of possible factors include, but are not limited to, the type of security; the issuer’s financial statements; the purchase price of the security; the discount from market value of unrestricted securities of the same class at the time of purchase; analysts’ research and observations from financial institutions; information regarding any transactions or offers with respect to the security; the existence of merger proposals or tender offers affecting the security; the price and extent of public trading in similar securities of the issuer or comparable companies; and the existence of a shelf registration for restricted securities.
For each portfolio security that has been fair valued pursuant to the policies adopted by the Board of Trustees, the fair value price is compared against the last available and next available market quotations. The Valuation Committee reviews the results of such back testing monthly and fair valuation occurrences are reported to the Board of Trustees quarterly.
The Fund uses valuation techniques to measure fair value that are consistent with the market approach and/or income approach, depending on the type of security and the particular circumstance. The market approach uses prices and other relevant information generated by market transactions involving identical or comparable securities. The income approach uses valuation techniques to discount estimated future cash flows to present value.
GAAP establishes a disclosure hierarchy that categorizes the inputs to valuation techniques used to value assets and liabilities at measurement date. These inputs are summarized in the three broad levels listed below:
| • | | Level 1 — quoted prices in active markets for identical investments |
| | |
| QS Strategic Real Return Fund 2018 Annual Report | | 35 |
Notes to consolidated financial statements (cont’d)
| • | | Level 2 — other significant observable inputs (including quoted prices for similar investments, interest rates, prepayment speeds, credit risk, etc.) |
| • | | Level 3 — significant unobservable inputs (including the Fund’s own assumptions in determining the fair value of investments) |
The inputs or methodologies used to value securities are not necessarily an indication of the risk associated with investing in those securities.
The following is a summary of the inputs used in valuing the Fund’s assets and liabilities carried at fair value:
| | | | | | | | | | | | | | | | |
| ASSETS | |
| Description | | Quoted Prices
(Level 1) | | | Other Significant
Observable Inputs
(Level 2) | | | Significant
Unobservable
Inputs
(Level 3) | | | Total | |
| Long-term investments†: | | | | | | | | | | | | | | | | |
U.S. treasury inflation protected securities | | | — | | | $ | 36,745,343 | | | | — | | | $ | 36,745,343 | |
Common stocks: | | | | | | | | | | | | | | | | |
Communication services | | $ | 866,054 | | | | 608,953 | | | | — | | | | 1,475,007 | |
Consumer discretionary | | | 1,600,198 | | | | 999,638 | | | | — | | | | 2,599,836 | |
Consumer staples | | | 672,012 | | | | 578,058 | | | | — | | | | 1,250,070 | |
Energy | | | 504,547 | | | | 839,728 | | | | — | | | | 1,344,275 | |
Financials | | | 2,536,145 | | | | 1,824,506 | | | | — | | | | 4,360,651 | |
Health care | | | 2,489,962 | | | | 273,692 | | | | — | | | | 2,763,654 | |
Industrials | | | 1,700,683 | | | | 1,084,885 | | | | — | | | | 2,785,568 | |
Information technology | | | 2,714,660 | | | | 658,363 | | | | — | | | | 3,373,023 | |
Materials | | | 238,008 | | | | 883,687 | | | | — | | | | 1,121,695 | |
Real estate | | | 103,766 | | | | 324,040 | | | | — | | | | 427,806 | |
Utilities | | | 197,510 | | | | 84,745 | | | | — | | | | 282,255 | |
U.S. government & agency obligations | | | — | | | | 17,651,895 | | | | — | | | | 17,651,895 | |
Investments in underlying funds | | | 17,477,880 | | | | — | | | | — | | | | 17,477,880 | |
Corporate bonds & notes | | | — | | | | 2,791,183 | | | | — | | | | 2,791,183 | |
Non-U.S. treasury inflation protected securities | | | — | | | | 367,483 | | | | — | | | | 367,483 | |
Sovereign bonds | | | — | | | | 183,423 | | | | — | | | | 183,423 | |
| Total long-term investments | | | 31,101,425 | | | | 65,899,622 | | | | — | | | | 97,001,047 | |
| Short-term investments† | | | 7,200,714 | | | | — | | | | — | | | | 7,200,714 | |
| Total investments | | $ | 38,302,139 | | | $ | 65,899,622 | | | | — | | | $ | 104,201,761 | |
| Other financial instruments: | | | | | | | | | | | | | | | | |
Futures contracts | | $ | 1,046,479 | | | | — | | | | — | | | $ | 1,046,479 | |
Forward foreign currency contracts | | | — | | | $ | 561,341 | | | | — | | | | 561,341 | |
| Total other financial instruments | | $ | 1,046,479 | | | $ | 561,341 | | | | — | | | $ | 1,607,820 | |
| Total | | $ | 39,348,618 | | | $ | 66,460,963 | | | | — | | | $ | 105,809,581 | |
| | |
| 36 | | QS Strategic Real Return Fund 2018 Annual Report |
| | | | | | | | | | | | | | | | |
| LIABILITIES | |
| Description | | Quoted Prices
(Level 1) | | | Other Significant
Observable Inputs
(Level 2) | | | Significant
Unobservable
Inputs
(Level 3) | | | Total | |
| Other financial instruments: | | | | | | | | | | | | | | | | |
Futures contracts | | $ | 209,840 | | | | — | | | | — | | | $ | 209,840 | |
Forward foreign currency contracts | | | — | | | $ | 298,484 | | | | — | | | | 298,484 | |
| Total | | $ | 209,840 | | | $ | 298,484 | | | | — | | | $ | 508,324 | |
| † | See Consolidated Schedule of Investments for additional detailed categorizations. |
For the year ended September 30, 2018, as a result of the fair value pricing procedures for international equities utilized by the Fund, certain securities have transferred in and out of Level 1 and Level 2 measurements during the period. The Fund’s policy is to recognize transfers between levels as of the end of the reporting period. At September 30, 2018, securities valued at $8,160,295 were classified as Level 2 within the fair value hierarchy because fair value procedures were applied when the change in value of a domestic equity security index suggested that the closing prices on foreign exchanges may no longer have represented the value of those securities at the time of closing of the NYSE.
(b) Futures contracts. The Fund uses futures contracts generally to gain exposure to, or hedge against, changes in interest rates or gain exposure to, or hedge against, changes in certain asset classes, including commodity markets. A futures contract represents a commitment for the future purchase or sale of an asset at a specified price on a specified date.
Upon entering into a futures contract, the Fund is required to deposit cash or cash equivalents with a broker in an amount equal to a certain percentage of the contract amount. This is known as the ‘‘initial margin’’ and subsequent payments (‘‘variation margin’’) are made or received by the Fund each day, depending on the daily fluctuation in the value of the contract. For certain futures, including foreign denominated futures, variation margin is not settled daily, but is recorded as a net variation margin payable or receivable. The daily changes in contract value are recorded as unrealized gains or losses in the Consolidated Statement of Operations and the Fund recognizes a realized gain or loss when the contract is closed.
Futures contracts involve, to varying degrees, risk of loss in excess of the amounts reflected in the financial statements. In addition, there is the risk that the Fund may not be able to enter into a closing transaction because of an illiquid secondary market.
(c) Forward foreign currency contracts. The Fund enters into a forward foreign currency contract to maintain its target exposure to foreign currencies, to hedge against foreign currency exchange rate risk on its non-U.S. dollar denominated securities, to facilitate settlement of a foreign currency denominated portfolio transaction or to attempt to increase the Fund’s return. A forward foreign currency contract is an agreement between two parties to buy and sell a currency at a set price with delivery and settlement at a future date. The
| | |
| QS Strategic Real Return Fund 2018 Annual Report | | 37 |
Notes to consolidated financial statements (cont’d)
contract is marked-to-market daily and the change in value is recorded by the Fund as an unrealized gain or loss. When a forward foreign currency contract is closed, through either delivery or offset by entering into another forward foreign currency contract, the Fund recognizes a realized gain or loss equal to the difference between the value of the contract at the time it was opened and the value of the contract at the time it is closed.
Forward foreign currency contracts involve elements of market risk in excess of the amounts reflected on the Consolidated Statement of Assets and Liabilities. The Fund bears the risk of an unfavorable change in the foreign exchange rate underlying the forward foreign currency contract. Risks may also arise upon entering into these contracts from the potential inability of the counterparties to meet the terms of their contracts.
(d) Inflation-indexed bonds. Inflation-indexed bonds are fixed-income securities whose principal value or interest rate is periodically adjusted according to the rate of inflation. As the index measuring inflation changes, the principal value or interest rate of inflation-indexed bonds will be adjusted accordingly. Inflation adjustments to the principal amount of inflation-indexed bonds are reflected as an increase or decrease to investment income on the Consolidated Statement of Operations. Repayment of the original bond principal upon maturity (as adjusted for inflation) is guaranteed in the case of U.S. Treasury inflation-indexed bonds. For bonds that do not provide a similar guarantee, the adjusted principal value of the bond repaid at maturity may be less than the original principal.
(e) Foreign currency translation. Investment securities and other assets and liabilities denominated in foreign currencies are translated into U.S. dollar amounts based upon prevailing exchange rates on the date of valuation. Purchases and sales of investment securities and income and expense items denominated in foreign currencies are translated into U.S. dollar amounts based upon prevailing exchange rates on the respective dates of such transactions.
The Fund does not isolate that portion of the results of operations resulting from fluctuations in foreign exchange rates on investments from the fluctuations arising from changes in market prices of securities held. Such fluctuations are included with the net realized and unrealized gain or loss on investments.
Net realized foreign exchange gains or losses arise from sales of foreign currencies, including gains and losses on forward foreign currency contracts, currency gains or losses realized between the trade and settlement dates on securities transactions, and the difference between the amounts of dividends, interest, and foreign withholding taxes recorded on the Fund’s books and the U.S. dollar equivalent of the amounts actually received or paid. Net unrealized foreign exchange gains and losses arise from changes in the values of assets and liabilities, other than investments in securities, on the date of valuation, resulting from changes in exchange rates.
Foreign security and currency transactions may involve certain considerations and risks not typically associated with those of U.S. dollar denominated transactions as a result of,
| | |
| 38 | | QS Strategic Real Return Fund 2018 Annual Report |
among other factors, the possibility of lower levels of governmental supervision and regulation of foreign securities markets and the possibility of political or economic instability.
(f) Foreign investment risks. The Fund’s investments in foreign securities may involve risks not present in domestic investments. Since securities may be denominated in foreign currencies, may require settlement in foreign currencies or pay interest or dividends in foreign currencies, changes in the relationship of these foreign currencies to the U.S. dollar can significantly affect the value of the investments and earnings of the Fund. Foreign investments may also subject the Fund to foreign government exchange restrictions, expropriation, taxation or other political, social or economic developments, all of which affect the market and/or credit risk of the investments.
(g) Counterparty risk and credit-risk-related contingent features of derivative instruments. The Fund may invest in certain securities or engage in other transactions, where the Fund is exposed to counterparty credit risk in addition to broader market risks. The Fund may invest in securities of issuers, which may also be considered counterparties as trading partners in other transactions. This may increase the risk of loss in the event of default or bankruptcy by the counterparty or if the counterparty otherwise fails to meet its contractual obligations. The Fund’s subadviser attempts to mitigate counterparty risk by (i) periodically assessing the creditworthiness of its trading partners, (ii) monitoring and/or limiting the amount of its net exposure to each individual counterparty based on its assessment and (iii) requiring collateral from the counterparty for certain transactions. Market events and changes in overall economic conditions may impact the assessment of such counterparty risk by the subadviser. In addition, declines in the values of underlying collateral received may expose the Fund to increased risk of loss.
With exchange traded and centrally cleared derivatives, there is less counterparty risk to the Fund since the exchange or clearinghouse, as counterparty to such instruments, guarantees against a possible default. The clearinghouse stands between the buyer and the seller of the contract; therefore, the credit risk is limited to failure of the clearinghouse. While offset rights may exist under applicable law, the Fund does not have a contractual right of offset against a clearing broker or clearinghouse in the event of a default of the clearing broker or clearinghouse in the event of a default of the clearing broker or clearinghouse.
The Fund has entered into master agreements, such as an International Swaps and Derivatives Association, Inc. Master Agreement (“ISDA Master Agreement”) or similar agreement, with certain of its derivative counterparties that govern over-the-counter derivatives and provide for general obligations, representations, agreements, collateral posting terms, netting provisions in the event of default or termination and credit related contingent features. The credit related contingent features include, but are not limited to, a percentage decrease in the Fund’s net assets or NAV over a specified period of time. If these credit related contingent features were triggered, the derivatives counterparty could terminate the positions and demand payment or require additional collateral.
| | |
| QS Strategic Real Return Fund 2018 Annual Report | | 39 |
Notes to consolidated financial statements (cont’d)
Under an ISDA Master Agreement, the Fund may, under certain circumstances, offset with the counterparty certain derivative financial instruments’ payables and/or receivables with collateral held and/or posted and create one single net payment. However, absent an event of default by the counterparty or a termination of the agreement, the terms of the ISDA Master Agreements do not result in an offset of reported amounts of financial assets and financial liabilities in the Consolidated Statement of Assets and Liabilities across transactions between the Fund and the applicable counterparty. The enforceability of the right to offset may vary by jurisdiction.
Collateral requirements differ by type of derivative. Collateral or margin requirements are set by the broker or exchange clearinghouse for exchange traded derivatives while collateral terms are contract specific for over-the-counter traded derivatives. Cash collateral that has been pledged to cover obligations of the Fund under derivative contracts, if any, will be reported separately in the Consolidated Statement of Assets and Liabilities. Securities pledged as collateral, if any, for the same purpose are noted in the Consolidated Schedule of Investments.
As of September 30, 2018, the Fund held forward foreign currency contracts with credit related contingent features which had a liability position of $298,484. If a contingent feature in the master agreements would have been triggered, the Fund would have been required to pay this amount to its derivatives counterparties.
(h) Security transactions and investment income. Security transactions are accounted for on a trade date basis. Interest income (including interest income from payment-in-kind securities), adjusted for amortization of premium and accretion of discount, is recorded on the accrual basis. Dividend income is recorded on the ex-dividend date for dividends received in cash and/or securities. Foreign dividend income is recorded on the ex-dividend date or as soon as practicable after the Fund determines the existence of a dividend declaration after exercising reasonable due diligence. The cost of investments sold is determined by use of the specific identification method. To the extent any issuer defaults or a credit event occurs that impacts the issuer, the Fund may halt any additional interest income accruals and consider the realizability of interest accrued up to the date of default or credit event.
(i) REIT distributions. The character of distributions received from Real Estate Investment Trusts (‘‘REITs’’) held by the Fund is generally comprised of net investment income, capital gains, and return of capital. It is the policy of the Fund to estimate the character of distributions received from underlying REITs based on historical data provided by the REITs. After each calendar year end, REITs report the actual tax character of these distributions. Differences between the estimated and actual amounts reported by the REITs are reflected in the Fund’s records in the year in which they are reported by the REITs by adjusting related investment cost basis, capital gains and income, as necessary.
(j) Distributions to shareholders. Distributions from net investment income and distributions of net realized gains, if any, are declared at least annually. Distributions to
| | |
| 40 | | QS Strategic Real Return Fund 2018 Annual Report |
shareholders of the Fund are recorded on the ex-dividend date and are determined in accordance with income tax regulations, which may differ from GAAP.
(k) Share class accounting. Investment income, common expenses and realized/ unrealized gains (losses) on investments are allocated to the various classes of the Fund on the basis of daily net assets of each class. Fees relating to a specific class are charged directly to that share class.
(l) Compensating balance arrangements. The Fund has an arrangement with its custodian bank whereby a portion of the custodian’s fees is paid indirectly by credits earned on the Fund’s cash on deposit with the bank.
(m) Federal and other taxes. It is the Fund’s policy to comply with the federal income and excise tax requirements of the Internal Revenue Code of 1986 (the “Code”), as amended, applicable to regulated investment companies. Accordingly, the Fund intends to distribute its taxable income and net realized gains, if any, to shareholders in accordance with timing requirements imposed by the Code. Therefore, no federal or state income tax provision is required in the Fund’s financial statements.
Management has analyzed the Fund’s tax positions taken on income tax returns for all open tax years and has concluded that as of September 30, 2018, no provision for income tax is required in the Fund’s financial statements. The Fund’s federal and state income and federal excise tax returns for tax years for which the applicable statutes of limitations have not expired are subject to examination by the Internal Revenue Service and state departments of revenue.
Under the applicable foreign tax laws, a withholding tax may be imposed on interest, dividends and capital gains at various rates.
(n) Reclassification. GAAP requires that certain components of net assets be reclassified to reflect permanent differences between financial and tax reporting. These reclassifications have no effect on net assets or net asset value per share. During the current year, the following reclassifications have been made:
| | | | | | | | |
| | | Undistributed Net
Investment Income | | | Accumulated Net
Realized Gain | |
| (a) | | $ | 1,675,671 | | | $ | (1,675,671) | |
| (a) | Reclassifications are due to book/tax differences in the treatment of gains realized by the Fund’s wholly owned subsidiary, foreign currency transactions treated as ordinary income for tax purposes, book/tax differences in the treatment of passive foreign investment companies and inflation protected securities. |
2. Investment management agreement and other transactions with affiliates
Legg Mason Partners Fund Advisor, LLC (“LMPFA”) is the Fund’s investment manager. QS Investors, LLC (“QS Investors”), is the Fund’s adviser and a subadviser. ClearBridge Investments, LLC (“ClearBridge”), Western Asset Management Company, LLC (formerly known as
| | |
| QS Strategic Real Return Fund 2018 Annual Report | | 41 |
Notes to consolidated financial statements (cont’d)
Western Asset Management Company) (“Western Asset”), Western Asset Management Company Limited in London (“Western Asset London”) and Western Asset Management Company Ltd (“Western Japan”) are also the Fund’s subadvisers. Western Asset also manages the portion of the Fund’s cash and short-term instruments allocated to it pursuant to a separate subadvisory agreement between LMPFA and Western Asset (“Western Asset Agreement”). LMPFA, QS Investors, ClearBridge, Western Asset, Western Asset London and Western Japan are wholly-owned subsidiaries of Legg Mason, Inc. (“Legg Mason”). ClearBridge did not manage any portion of the Fund’s assets during the reporting period.
Under the investment management agreement, the Fund pays LMPFA an investment management fee, calculated daily and paid monthly, at an annual rate of 0.75% of the Fund’s average daily net assets.
LMPFA provides administrative and certain oversight services to the Fund. LMPFA delegates to QS Investors the day-to-day portfolio management of the Fund, except for the management of the portion of the cash and short term instruments allocated to Western Asset. QS Investors is responsible for monitoring and coordinating the overall management of the Fund, including rebalancing the Fund’s target asset allocations among itself and the subadvisers. QS Investors also provides management for a portion of the Fund’s assets.
LMPFA pays QS Investors for its services to the Fund an advisory fee, calculated daily and paid monthly, at an annual rate of 0.20% of the Fund’s average daily net assets. The Subsidiary has agreed to reimburse the Fund for the fees paid thereby for the services provided by QS Investors to the Subsidiary. LMPFA pays QS Investors for its services to the Fund a subadvisory fee, calculated daily and paid monthly, at an annual rate of 0.45% of the average daily net assets managed by QS Investors. LMPFA pays ClearBridge for its services to the Fund a sub-advisory fee, calculated daily and paid monthly, at an annual rate of 0.35% of the average daily net assets managed by ClearBridge. LMPFA pays Western Asset for its services to the Fund a sub-advisory fee, calculated daily and paid monthly, at an annual rate of 0.25% of the average daily net assets managed by Western Asset. For Western Asset’s cash management services to the Fund pursuant to the Western Asset Agreement, LMPFA, not the Fund, pays Western Asset monthly 0.02% of the portion of the Fund’s average daily net assets that are allocated to them by LMPFA. Western Asset pays Western Asset London for its services to the Fund a sub-advisory fee, calculated daily and paid monthly, at an annual rate of 0.25% of the average daily net assets managed by Western Asset London. Western Asset pays Western Japan for its services to the Fund a subadvisory fee, calculated daily and paid monthly, at an annual rate of 0.25% of the average daily net assets managed by Western Japan.
LMPFA has agreed to waive fees and/or reimburse operating expenses (other than interest, brokerage commissions (except for brokerage commissions paid on purchases and sales of shares of ETFs), dividend expense on short sales, taxes and extraordinary expenses), subject to recapture as described below. As a result, total annual fund operating expenses did not exceed 1.35%, 1.55%, 2.10%, 1.10% and 1.00% for Class A, Class A2, Class C, Class I and Class IS shares, respectively. In addition, the ratio of total annual fund operating expenses
| | |
| 42 | | QS Strategic Real Return Fund 2018 Annual Report |
for Class IS shares did not exceed the ratio of total annual fund operating expenses for Class I shares. Acquired fund fees and expenses are subject to the expense limitation arrangements, and are calculated based on an average of the net expense ratio (as shown in the most recent prospectus or shareholder report for each acquired fund as of the date of the Fund’s most recent prospectus) of each acquired fund held by the Fund, weighted in proportion to the Fund’s investment allocation among the acquired funds. These arrangements are expected to continue until December 31, 2019, may be terminated prior to that date by agreement of LMPFA and the Board of Trustees, and may be terminated at any time after that date by LMPFA. The arrangements, however, may be modified by LMPFA to decrease total annual fund operating expenses at any time.
During the year ended September 30, 2018, fees waived and/or expenses reimbursed amounted to $143,345.
LMPFA is permitted to recapture amounts waived and/or reimbursed to a class within three years after the fiscal year in which LMPFA earned the fee or incurred the expense if the class’ total annual operating expenses have fallen to a level below the expense limitation (“expense cap”) in effect at the time the fees were earned or the expenses incurred. In no case will LMPFA recapture any amount that would result, on any particular business day of the Fund, in the class’ total annual operating expenses exceeding the expense cap or any other lower limit then in effect.
Pursuant to these arrangements, at September 30, 2018, the Fund had remaining fee waivers and/or expense reimbursements subject to recapture by LMPFA and respective dates of expiration as follows:
| | | | | | | | | | | | | | | | | | | | |
| | | Class A | | | Class A2 | | | Class C | | | Class I | | | Class IS | |
| Expires September 30, 2019 | | $ | 1,961 | | | $ | 2,972 | | | $ | 854 | | | $ | 861 | | | $ | 113,331 | |
| Expires September 30, 2020 | | | 1,137 | | | | 2,689 | | | | 540 | | | | 1,492 | | | | 109,061 | |
| Expires September 30, 2021 | | | 899 | | | | 1,691 | | | | 496 | | | | 1,824 | | | | 138,435 | |
| Total fee waivers/expense reimbursements subject to recapture | | $ | 3,997 | | | $ | 7,352 | | | $ | 1,890 | | | $ | 4,177 | | | $ | 360,827 | |
For the year ended September 30, 2018, fee waivers and/or expense reimbursements recaptured by LMPFA, if any, were as follows:
| | | | | | | | |
| | | Class A2 | | | Class IS | |
| LMPFA recaptured | | $ | 253 | | | $ | 61 | |
Legg Mason Investor Services, LLC (“LMIS”), a wholly-owned broker-dealer subsidiary of Legg Mason, serves as the Fund’s sole and exclusive distributor.
There is a maximum initial sales charge of 5.75% for Class A and Class A2 shares. There is a contingent deferred sales charge (“CDSC”) of 1.00% on Class C shares, which applies if redemption occurs within 12 months from purchase payment. In certain cases, Class A and Class A2 shares have a 1.00% CDSC, which applies if redemption occurs within 18 months from purchase payment. This CDSC only applies to those purchases of Class A and Class A2
| | |
| QS Strategic Real Return Fund 2018 Annual Report | | 43 |
Notes to consolidated financial statements (cont’d)
shares, which, when combined with current holdings of other shares of funds sold by LMIS, equal or exceed $1,000,000 in the aggregate. These purchases do not incur an initial sales charge.
For the year ended September 30, 2018, sales charges retained by and CDSCs paid to LMIS and its affiliates, if any, were as follows:
| | | | | | | | | | | | |
| | | Class A | | | Class A2 | | | Class C | |
| Sales charges | | | — | | | $ | 965 | | | | — | |
| CDSCs | | | — | | | | — | | | | — | |
Under a Deferred Compensation Plan (the “Plan”), Trustees may have elected to defer receipt of all or a specified portion of their compensation. A participating Trustee selected one or more funds managed by affiliates of Legg Mason in which his or her deferred trustee’s fees were deemed to be invested. Deferred amounts remain in the Fund until distributed in accordance with the Plan. In May 2015, the Board of Trustees approved an amendment to the Plan so that effective January 1, 2016, no compensation earned after that date may be deferred under the Plan.
All officers and one Trustee of the Trust are employees of Legg Mason or its affiliates and do not receive compensation from the Trust.
As of September 30, 2018, Legg Mason and its affiliates owned 97% of the Fund.
3. Investments
During the year ended September 30, 2018, the aggregate cost of purchases and proceeds from sales of investments (excluding short-term investments) and U.S. Government & Agency Obligations were as follows:
| | | | | | | | |
| | | Investments | | | U.S. Government &
Agency Obligations | |
| Purchases | | $ | 15,851,201 | | | $ | 33,443,115 | |
| Sales | | | 17,585,635 | | | | 30,847,744 | |
At September 30, 2018, the aggregate cost of investments and the aggregate gross unrealized appreciation and depreciation of investments for federal income tax purposes were as follows:
| | | | | | | | | | | | | | | | |
| | | Cost | | | Gross
Unrealized
Appreciation | | | Gross
Unrealized
Depreciation | | | Net
Unrealized
Appreciation | |
| Securities | | $ | 93,306,755 | | | $ | 11,892,041 | | | $ | (997,035) | | | $ | 10,895,006 | |
| Futures contracts | | | — | | | | 1,046,479 | | | | (209,840) | | | | 836,639 | |
| Forward foreign currency contracts | | | — | | | | 561,341 | | | | (298,484) | | | | 262,857 | |
| | |
| 44 | | QS Strategic Real Return Fund 2018 Annual Report |
4. Derivative instruments and hedging activities
Below is a table, grouped by derivative type, that provides information about the fair value and the location of derivatives within the Consolidated Statement of Assets and Liabilities at September 30, 2018.
| | | | | | | | | | | | | | | | | | | | |
| ASSET DERIVATIVES1 | |
| | | Interest
Rate Risk | | | Foreign
Exchange Risk | | | Equity
Risk | | | Commodity
Risk | | | Total | |
| Futures contracts2 | | $ | 218,524 | | | | — | | | $ | 145,215 | | | $ | 682,740 | | | $ | 1,046,479 | |
| Forward foreign currency contracts | | | — | | | $ | 561,341 | | | | — | | | | — | | | | 561,341 | |
| Total | | $ | 218,524 | | | $ | 561,341 | | | $ | 145,215 | | | $ | 682,740 | | | $ | 1,607,820 | |
|
| LIABILITY DERIVATIVES1 | |
| | | | | | Interest
Rate Risk | | | Foreign
Exchange Risk | | | Equity
Risk | | | Total | |
| Futures contracts2 | | | | | | $ | 208,128 | | | | — | | | $ | 1,712 | | | $ | 209,840 | |
| Forward foreign currency contracts | | | | | | | — | | | $ | 298,484 | | | | — | | | | 298,484 | |
| Total | | | | | | $ | 208,128 | | | $ | 298,484 | | | $ | 1,712 | | | $ | 508,324 | |
| 1 | Generally, the balance sheet location for asset derivatives is receivables/net unrealized appreciation (depreciation) and for liability derivatives is payables/net unrealized appreciation (depreciation). |
| 2 | Includes cumulative appreciation (depreciation) of futures contracts as reported in the Consolidated Schedule of Investments. Only variation margin is reported within the receivables and/or payables on the Consolidated Statement of Assets and Liabilities. |
The following tables provide information about the effect of derivatives and hedging activities on the Fund’s Consolidated Statement of Operations for the year ended September 30, 2018. The first table provides additional detail about the amounts and sources of gains
(losses) realized on derivatives during the period. The second table provides additional information about the change in unrealized appreciation (depreciation) resulting from the Fund’s derivatives and hedging activities during the period.
| | | | | | | | | | | | | | | | | | | | |
| AMOUNT OF REALIZED GAIN (LOSS) ON DERIVATIVES RECOGNIZED | |
| | | Interest
Rate Risk | | | Foreign
Exchange Risk | | | Equity
Risk | | | Commodity
Risk | | | Total | |
| Futures contracts | | $ | 729,532 | | | | — | | | $ | 373,177 | | | $ | 4,063,666 | | | $ | 5,166,375 | |
| Forward foreign currency contracts | | | — | | | $ | (3,082,432) | | | | — | | | | — | | | | (3,082,432) | |
| Total | | $ | 729,532 | | | $ | (3,082,432) | | | $ | 373,177 | | | $ | 4,063,666 | | | $ | 2,083,943 | |
| | | | | | | | | | | | | | | | | | | | |
| CHANGE IN UNREALIZED APPRECIATION (DEPRECIATION) ON DERIVATIVES RECOGNIZED | |
| | | Interest
Rate Risk | | | Foreign
Exchange Risk | | | Equity
Risk | | | Commodity
Risk | | | Total | |
| Futures contracts | | $ | 284,519 | | | | — | | | $ | (12,597) | | | $ | 78,967 | | | $ | 350,889 | |
| Forward foreign currency contracts | | | — | | | $ | 724,762 | | | | — | | | | — | | | | 724,762 | |
| Total | | $ | 284,519 | | | $ | 724,762 | | | $ | (12,597) | | | $ | 78,967 | | | $ | 1,075,651 | |
| | |
| QS Strategic Real Return Fund 2018 Annual Report | | 45 |
Notes to consolidated financial statements (cont’d)
During the year ended September 30, 2018, the volume of derivative activity for the Fund was as follows:
| | | | |
| | | Average Market
Value | |
| Futures contracts (to buy) | | $ | 51,649,309 | |
| Futures contracts (to sell) | | | 19,690,729 | |
| Forward foreign currency contracts (to buy) | | | 55,423,888 | |
| Forward foreign currency contracts (to sell) | | | 15,394,279 | |
The following table presents the Fund’s OTC derivative assets and liabilities by counterparty net of amounts available for offset under an ISDA Master Agreement and net of the related collateral pledged (received) by the Fund as of September 30, 2018.
| | | | | | | | | | | | | | | | | | | | |
| Counterparty | | Gross Assets
Subject to Master
Agreements1 | | | Gross Liabilities
Subject to Master
Agreements1 | | | Net Assets (Liabilities)
Subject to Master
Agreements | | | Collateral
Pledged
(Received) | | | Net
Amount2 | |
| Citibank N.A. | | $ | 152,561 | | | $ | (203,529) | | | $ | (50,968) | | | | — | | | $ | (50,968) | |
| Goldman Sachs Group Inc. | | | 81 | | | | (280) | | | | (199) | | | | — | | | | (199) | |
| HSBC Bank USA, N.A. | | | 408,699 | | | | (94,675) | | | | 314,024 | | | | — | | | | 314,024 | |
| Total | | $ | 561,341 | | | $ | (298,484) | | | $ | 262,857 | | | | — | | | $ | 262,857 | |
| 1 | Absent an event of default or early termination, derivative assets and liabilities are presented gross and not offset in the Consolidated Statement of Assets and Liabilities. |
| 2 | Net amount may also include forward foreign currency exchange contracts that are not required to be collateralized. |
5. Class specific expenses, waivers and/or expense reimbursements
The Fund has adopted a Rule 12b-1 shareholder services and distribution plan and under that plan the Fund pays service and/or distribution fees with respect to its Class A, Class A2 and Class C shares calculated at the annual rate of 0.25%, 0.25% and 1.00% of the average daily net assets of each class, respectively. Service and/or distribution fees are accrued daily and paid monthly.
For the year ended September 30, 2018, class specific expenses were as follows:
| | | | | | | | |
| | | Service and/or
Distribution Fees | | | Transfer Agent
Fees | |
| Class A | | $ | 1,065 | | | $ | 778 | |
| Class A2 | | | 3,307 | | | | 3,639 | |
| Class C | | | 1,904 | | | | 434 | |
| Class I | | | — | | | | 1,203 | |
| Class IS | | | — | | | | 902 | |
| Total | | $ | 6,276 | | | $ | 6,956 | |
| | |
| 46 | | QS Strategic Real Return Fund 2018 Annual Report |
For the year ended September 30, 2018, waivers and/or expense reimbursements by class were as follows:
| | | | |
| | | Waivers/Expense
Reimbursements | |
| Class A | | $ | 899 | |
| Class A2 | | | 1,691 | |
| Class C | | | 496 | |
| Class I | | | 1,824 | |
| Class IS | | | 138,435 | |
| Total | | $ | 143,345 | |
6. Distributions to shareholders by class
| | | | | | | | |
| | | Year Ended
September 30, 2018 | | | Year Ended
September 30, 2017 | |
| Net Investment Income: | | | | | | | | |
| Class A | | $ | 4,256 | | | | — | |
| Class A2 | | | 12,086 | | | | — | |
| Class C | | | — | | | | — | |
| Class I | | | 23,572 | | | | — | |
| Class IS | | | 1,514,098 | | | | — | |
| Total | | $ | 1,554,012 | | | | — | |
| | |
| Net Realized Gains: | | | | | | | | |
| Class A | | $ | 12,961 | | | $ | 20,224 | |
| Class A2 | | | 37,027 | | | | 26,012 | |
| Class C | | | 5,435 | | | | 7,665 | |
| Class I | | | 44,467 | | | | 11,118 | |
| Class IS | | | 2,700,056 | | | | 2,424,638 | |
| Total | | $ | 2,799,946 | | | $ | 2,489,657 | |
7. Shares of beneficial interest
At September 30, 2018, the Trust had an unlimited number of shares of beneficial interest authorized with a par value of $0.00001 per share. The Fund has the ability to issue multiple classes of shares. Each class of shares represents an identical interest and has the same rights, except that each class bears certain direct expenses, including those specifically related to the distribution of its shares.
Transactions in shares of each class were as follows:
| | | | | | | | | | | | | | | | |
| | | Year Ended
September 30, 2018 | | | Year Ended
September 30, 2017 | |
| | | Shares | | | Amount | | | Shares | | | Amount | |
| Class A | | | | | | | | | | | | | | | | |
| Shares sold | | | 1,671 | | | $ | 19,999 | | | | 1,415 | | | $ | 16,295 | |
| Shares issued on reinvestment | | | 1,221 | | | | 14,353 | | | | 1,795 | | | | 20,024 | |
| Shares repurchased | | | (22,545) | | | | (272,414) | | | | (55,357) | | | | (623,742) | |
| Net decrease | | | (19,653) | | | $ | (238,062) | | | | (52,147) | | | $ | (587,423) | |
| | |
| QS Strategic Real Return Fund 2018 Annual Report | | 47 |
Notes to consolidated financial statements (cont’d)
| | | | | | | | | | | | | | | | |
| | | Year Ended
September 30, 2018 | | | Year Ended
September 30, 2017 | |
| | | Shares | | | Amount | | | Shares | | | Amount | |
| Class A2 | | | | | | | | | | | | | | | | |
| Shares sold | | | 13,399 | | | $ | 159,781 | | | | 21,612 | | | $ | 244,593 | |
| Shares issued on reinvestment | | | 4,238 | | | | 49,113 | | | | 2,359 | | | | 26,012 | |
| Shares repurchased | | | (24,590) | | | | (292,671) | | | | (24,837) | | | | (277,994) | |
| Net decrease | | | (6,953) | | | $ | (83,777) | | | | (866) | | | $ | (7,389) | |
| | | | |
| Class C | | | | | | | | | | | | | | | | |
| Shares sold | | | 1,232 | | | $ | 14,471 | | | | 184 | | | $ | 2,032 | |
| Shares issued on reinvestment | | | 480 | | | | 5,435 | | | | 707 | | | | 7,665 | |
| Shares repurchased | | | (3,229) | | | | (37,608) | | | | (16,853) | | | | (184,577) | |
| Net decrease | | | (1,517) | | | $ | (17,702) | | | | (15,962) | | | $ | (174,880) | |
| | | | |
| Class I | | | | | | | | | | | | | | | | |
| Shares sold | | | 21,835 | | | $ | 269,296 | | | | 132,770 | | | $ | 1,541,093 | |
| Shares issued on reinvestment | | | 5,653 | | | | 68,039 | | | | 974 | | | | 11,118 | |
| Shares repurchased | | | (16,317) | | | | (200,456) | | | | (73,127) | | | | (843,685) | |
| Net increase | | | 11,171 | | | $ | 136,879 | | | | 60,617 | | | $ | 708,526 | |
| | | | |
| Class IS | | | | | | | | | | | | | | | | |
| Shares sold | | | 139,668 | | | $ | 1,704,999 | | | | 491,604 | | | $ | 5,608,568 | |
| Shares issued on reinvestment | | | 354,693 | | | | 4,214,154 | | | | 215,394 | | | | 2,424,638 | |
| Shares repurchased | | | (583,992) | | | | (7,111,609) | | | | (2,373,455) | | | | (27,586,830) | |
| Net decrease | | | (89,631) | | | $ | (1,192,456) | | | | (1,666,457) | | | $ | (19,553,624) | |
8. Income tax information and distributions to shareholders
The tax character of distributions paid during the fiscal years ended September 30, was as follows:
| | | | | | | | |
| | | 2018 | | | 2017 | |
| Distributions paid from: | | | | | | | | |
| Ordinary income | | $ | 1,553,857 | | | | — | |
| Net long-term capital gains | | | 2,800,101 | | | $ | 2,489,657 | |
| Total distributions paid | | $ | 4,353,958 | | | $ | 2,489,657 | |
As of September 30, 2018, the components of accumulated earnings (losses) on a tax basis were as follows:
| | | | |
| Undistributed ordinary income — net | | $ | 4,803,828 | |
| Undistributed long-term capital gains — net | | | 2,724,714 | |
| Total undistributed earnings | | | 7,528,542 | |
| Other book/tax temporary differences(a) | | | (551,695) | |
| Unrealized appreciation (depreciation)(b) | | | 11,309,188 | |
| Total accumulated earnings (losses) — net | | $ | 18,286,035 | |
| (a) | Other book/tax temporary differences are attributable to the tax deferral of losses on straddles, the realization for tax purposes of unrealized gains (losses) on certain futures and foreign currency contracts and book/tax differences in the timing of the deductibility of various expenses. |
| (b) | The difference between book-basis and tax-basis unrealized appreciation (depreciation) is attributable to the tax deferral of losses on wash sales. |
| | |
| 48 | | QS Strategic Real Return Fund 2018 Annual Report |
Report of independent registered public accounting firm
To the Board of Trustees of Legg Mason Global Asset Management Trust and Shareholders of QS Strategic Real Return Fund
Opinion on the financial statements
We have audited the accompanying consolidated statement of assets and liabilities, including the consolidated schedule of investments, of QS Strategic Real Return Fund and its subsidiary (one of the funds constituting Legg Mason Global Asset Management Trust, referred to hereafter as the “Fund”) as of September 30, 2018, the related consolidated statement of operations for the year ended September 30, 2018, the consolidated statement of changes in net assets for each of the two years in the period ended September 30, 2018, including the related notes, and the consolidated financial highlights for each of the periods indicated therein (collectively referred to as the “financial statements”). In our opinion, the financial statements present fairly, in all material respects, the financial position of the Fund as of September 30, 2018, the results of its operations for the year then ended, the changes in its net assets for each of the two years in the period ended September 30, 2018 and the financial highlights for each of the periods indicated therein in conformity with accounting principles generally accepted in the United States of America.
Basis for opinion
These financial statements are the responsibility of the Fund’s management. Our responsibility is to express an opinion on the Fund’s financial statements based on our audits. We are a public accounting firm registered with the Public Company Accounting Oversight Board (United States) (“PCAOB”) and are required to be independent with respect to the Fund in accordance with the U.S. federal securities laws and the applicable rules and regulations of the Securities and Exchange Commission and the PCAOB.
We conducted our audits of these financial statements in accordance with the standards of the PCAOB. Those standards require that we plan and perform the audit to obtain reasonable assurance about whether the financial statements are free of material misstatement, whether due to error or fraud.
Our audits included performing procedures to assess the risks of material misstatement of the financial statements, whether due to error or fraud, and performing procedures that respond to those risks. Such procedures included examining, on a test basis, evidence regarding the amounts and disclosures in the financial statements. Our audits also included evaluating the accounting principles used and significant estimates made by management, as well as evaluating the overall presentation of the financial statements. Our procedures included confirmation of securities owned as of September 30, 2018 by correspondence with the custodian and brokers; when replies were not received, we performed other auditing procedures. We believe that our audits provide a reasonable basis for our opinion.
/s/PricewaterhouseCoopers LLP
Baltimore, Maryland
November 16, 2018
We have served as the auditor of one or more investment companies in Legg Mason investment company group since 1973. We have not determined the specific year we began serving as auditor.
| | |
| QS Strategic Real Return Fund 2018 Annual Report | | 49 |
Additional information (unaudited)
Information about Trustees and Officers
The business and affairs of QS Strategic Real Return Fund (the “Fund”) are conducted by management under the supervision and subject to the direction of its Board of Trustees. The business address of each Trustee is c/o Jane Trust, Legg Mason, 100 International Drive, 11th Floor, Baltimore, Maryland 21202. Information pertaining to the Trustees and officers of the Fund is set forth below.
The Statement of Additional Information includes additional information about Trustees and is available, without charge, upon request by calling the Fund at 1-877-721-1926.
| | |
| Independent Trustees† |
| Ruby P. Hearn |
| Year of birth | | 1940 |
| Position(s) with Trust | | Trustee |
| Term of office1 and length of time served2 | | Since 2004 |
| Principal occupation(s) during past five years | | Senior Vice President Emerita of The Robert Wood Johnson Foundation (non-profit) since 2001; Member of the Institute of Medicine since 1982; formerly, Trustee of the New York Academy of Medicine (2004 to 2012); Director of the Institute for Healthcare Improvement (2002 to 2012); Senior Vice President of The Robert Wood Johnson Foundation (1996 to 2001); Fellow of The Yale Corporation (1992 to 1998) |
| Number of funds in fund complex overseen by Trustee | | 19 |
| Other board memberships held by Trustee during past five years | | None |
|
| Arnold L. Lehman |
| Year of birth | | 1944 |
| Position(s) with Trust | | Trustee and Chairman |
| Term of office1 and length of time served2 | | Since 1982 and since 2015 |
| Principal occupation(s) during past five years | | Senior Advisor, Phillips Auctioneer since 2015; Trustee of American Federation of Arts since 1998; formerly, Fellow, Ford Foundation (2015 to 2016); Director of the Brooklyn Museum (1997 to 2015); Director of The Baltimore Museum of Art (1979 to 1997) |
| Number of funds in fund complex overseen by Trustee | | 19 |
| Other board memberships held by Trustee during past five years | | None |
|
| Robin J.W. Masters |
| Year of birth | | 1955 |
| Position(s) with Trust | | Trustee |
| Term of office1 and length of time served2 | | Since 2002 |
| Principal occupation(s) during past five years | | Retired; formerly, Chief Investment Officer of ACE Limited (insurance) (1986 to 2000) |
| Number of funds in fund complex overseen by Trustee | | 19 |
| Other board memberships held by Trustee during past five years | | Director of Cheyne Capital International Limited (investment advisory firm); formerly, Director/Trustee of Legg Mason Institutional Funds plc, WA Fixed Income Funds plc and Western Asset Debt Securities Fund plc. (2007 to 2011) |
| | |
| 50 | | QS Strategic Real Return Fund |
| | |
| Independent Trustees† cont’d |
| Jill E. McGovern |
| Year of birth | | 1944 |
| Position(s) with Trust | | Trustee |
| Term of office1 and length of time served2 | | Since 1989 |
| Principal occupation(s) during past five years | | Senior Consultant, American Institute for Contemporary German Studies (AICGS) since 2007; formerly, Chief Executive Officer of The Marrow Foundation (non-profit) (1993 to 2007); Executive Director of the Baltimore International Festival (1991 to 1993); Senior Assistant to the President of The Johns Hopkins University (1986 to 1990) |
| Number of funds in fund complex overseen by Trustee | | 19 |
| Other board memberships held by Trustee during past five years | | Director of International Biomedical Research Alliance; Director of Lois Roth Endowment |
|
| Arthur S. Mehlman |
| Year of birth | | 1942 |
| Position(s) with Trust | | Trustee |
| Term of office1 and length of time served2 | | Since 2002 |
| Principal occupation(s) during past five years | | Retired. Director, The University of Maryland Foundation since 1992; Director, The League for People with Disabilities since 2003; formerly, Director, Municipal Mortgage & Equity LLC (2004 to 2011); Partner, KPMG LLP (international accounting firm) (1972 to 2002) |
| Number of funds in fund complex overseen by Trustee | | Trustee of all Legg Mason Funds consisting of 19 portfolios; Director/Trustee of the Royce Family of Funds consisting of 22 portfolios |
| Other board memberships held by Trustee during past five years | | Director of Municipal Mortgage & Equity, LLC. (2004 to 2011) |
|
| G. Peter O’Brien |
| Year of birth | | 1945 |
| Position(s) with Trust | | Trustee |
| Term of office1 and length of time served2 | | Since 1999 |
| Principal occupation(s) during past five years | | Retired. Trustee Emeritus of Colgate University; Board Member, Hill House, Inc. (residential home care); formerly, Board Member, Bridges School (pre- school) (2006 to 2017); Managing Director, Equity Capital Markets Group of Merrill Lynch & Co. (1971 to 1999) |
| Number of funds in fund complex overseen by Trustee | | Trustee of all Legg Mason funds consisting of 19 portfolios; Director/Trustee of the Royce Family of Funds consisting of 22 portfolios |
| Other board memberships held by Trustee during past five years | | Director of TICC Capital Corp. (2003 to 2017) |
| | |
| QS Strategic Real Return Fund | | 51 |
Additional information (unaudited) (cont’d)
Information about Trustees and Officers
| | |
| Independent Trustees† cont’d |
| S. Ford Rowan |
| Year of birth | | 1943 |
| Position(s) with Trust | | Trustee |
| Term of office1 and length of time served2 | | Since 2002 |
| Principal occupation(s) during past five years | | Chairman, National Center for Critical Incident Analysis, since 2004; Consultant to University of Maryland University College, since 2013; formerly, Lecturer in Organizational Sciences, George Washington University (2000 to 2014); Trustee, St. John’s College (2006 to 2012); Consultant, Rowan & Blewitt Inc. (management consulting) (1984 to 2007); Lecturer in Journalism, Northwestern University (1980 to 1993); Director, Santa Fe Institute (1999 to 2008) |
| Number of funds in fund complex overseen by Trustee | | 19 |
| Other board memberships held by Trustee during past five years | | None |
|
| Robert M. Tarola |
| Year of birth | | 1950 |
| Position(s) with Trust | | Trustee |
| Term of office1 and length of time served2 | | Since 2004 |
| Principal occupation(s) during past five years | | President of Rights Advisory LLC (corporate finance and governance consulting) since 2008; Member, Investor Advisory Group of the Public Company Accounting Oversight Board since 2009; formerly, Executive Vice President and Chief Financial Officer, Southcoast Health System, Inc. (healthcare provider network) (2015 to 2017); Senior Vice President and Chief Financial Officer of The Howard University (2009 to 2013) (higher education and health care); Senior Vice President and Chief Financial Officer of W.R. Grace & Co. (specialty chemicals) (1999 to 2008) and MedStar Health, Inc. (healthcare) (1996 to 1999); Partner, Price Waterhouse, LLP (accounting and auditing) (1984 to 1996) |
| Number of funds in fund complex overseen by Trustee | | 19 |
| Other board memberships held by Trustee during past five years | | Director of American Kidney Fund (renal disease assistance); Director of XBRL International, Inc. (global data standard setting); Director of Vista Outdoor, Inc. (consumer outdoor recreation brands); formerly, Director of TeleTech Holdings, Inc. (business processing outsourcing) |
| | |
| | |
| 52 | | QS Strategic Real Return Fund |
| | |
| Interested Trustee |
| Jane Trust, CFA3 | | |
| Year of birth | | 1962 |
| Position(s) with Trust | | Trustee, President and Chief Executive Officer |
| Term of office1 and length of time served2 | | Since 2015 |
| Principal occupation(s) during past five years | | Senior Managing Director of Legg Mason & Co., LLC (“Legg Mason & Co.”) (since 2018); Managing Director of Legg Mason & Co. (2016 to 2018); Officer and/or Trustee/Director of 147 funds associated with Legg Mason Partners Fund Advisor, LLC (“LMPFA”) or its affiliates (since 2015); President and Chief Executive Officer of LMPFA (since 2015); formerly, Senior Vice President of LMPFA (2015); Director of ClearBridge, LLC (formerly, Legg Mason Capital Management, LLC) (2007 to 2014); Managing Director of Legg Mason Investment Counsel & Trust Co. (2000 to 2007) |
| Number of funds in fund complex overseen by Trustee | | 138 |
Other board memberships held by Trustee during past
five years | | None |
| | |
| Executive Officers |
Richard F. Sennett Legg Mason 100 International Drive, 7th Floor, Baltimore, MD 21202 | | |
| Year of birth | | 1970 |
| Position(s) with Trust | | Principal Financial Officer |
| Term of office1 and length of time served2 | | Since 2011 |
| Principal occupation(s) during past five years | | Principal Financial Officer and Treasurer of certain mutual funds associated with Legg Mason & Co. or its affiliates (since 2011 and since 2013); Managing Director of Legg Mason & Co. and Senior Manager of the Treasury Policy group for Legg Mason & Co.’s Global Fiduciary Platform (since 2011); formerly, Chief Accountant within the SEC’s Division of Investment Management (2007 to 2011); Assistant Chief Accountant within the SEC’s Division of Investment Management (2002 to 2007) |
| |
Robert I. Frenkel Legg Mason 100 First Stamford Place, 6th Floor, Stamford, CT 06902 | | |
| Year of birth | | 1954 |
| Position(s) with Trust | | Secretary and Chief Legal Officer |
| Term of office1 and length of time served2 | | Since 2007 |
| Principal occupation(s) during past five years | | Vice President and Deputy General Counsel of Legg Mason (since 2006); Managing Director and General Counsel of — U.S. Mutual Funds for Legg Mason & Co. (since 2006) and Legg Mason & Co. predecessors (since 1994); Secretary and Chief Legal Officer of certain mutual funds associated with Legg Mason & Co. or its affiliates (since 2006) and Legg Mason & Co. predecessors (prior to 2006) |
| | |
| QS Strategic Real Return Fund | | 53 |
Additional information (unaudited) (cont’d)
Information about Trustees and Officers
| | |
| Executive Officers cont’d |
Thomas C. Mandia Legg Mason 100 First Stamford Place, 6th Floor, Stamford, CT 06902 |
| Year of birth | | 1962 |
| Position(s) with Trust | | Assistant Secretary |
| Term of office1 and length of time served2 | | Since 2007 |
| Principal occupation(s) during past five years | | Managing Director and Deputy General Counsel of Legg Mason & Co. (since 2005) and Legg Mason & Co. predecessors (prior to 2005); Secretary of LMPFA (since 2006); Assistant Secretary of certain mutual funds associated with Legg Mason & Co. or its affiliates (since 2006) and Legg Mason & Co. predecessors (prior to 2006); Secretary of LM Asset Services, LLC (“LMAS”) (since 2002) and Legg Mason Fund Asset Management, Inc. (“LMFAM”) (since 2013) (formerly registered investment advisers) |
| |
Ted P. Becker
Legg Mason 620 Eighth Avenue, 49th Floor, New York, NY 10018 | | |
| Year of birth | | 1951 |
| Position(s) with Trust | | Chief Compliance Officer |
| Term of office1 and length of time served2 | | Since 2007 |
| Principal occupation(s) during past five years | | Director of Global Compliance at Legg Mason (since 2006); Chief Compliance Officer of LMPFA (since 2006); Managing Director of Compliance of Legg Mason & Co. (since 2005); Chief Compliance Officer of certain mutual funds associated with Legg Mason & Co. or its affiliates (since 2006) and Legg Mason & Co. predecessors (prior to 2006) |
| |
Christopher Berarducci Legg Mason 620 Eighth Avenue, 49th Floor, New York, NY 10018 | | |
| Year of birth | | 1974 |
| Position(s) with Trust | | Treasurer |
| Term of office1 and length of time served2 | | Since 2010 |
| Principal occupation(s) during past five years | | Director of Legg Mason & Co. (since 2015); Treasurer of certain mutual funds associated with Legg Mason & Co. or its affiliates (since 2010); formerly, Vice President of Legg Mason & Co. (2011 to 2015); Assistant Controller of certain mutual funds associated with Legg Mason & Co. or its affiliates (prior to 2010) |
| | |
| 54 | | QS Strategic Real Return Fund |
| | |
| Executive Officers cont’d |
Susan Kerr Legg Mason 620 Eighth Avenue, 49th Floor, New York, NY 10018 | | |
| Year of birth | | 1949 |
| Position(s) with Trust | | Chief Anti-Money Laundering Compliance Officer |
| Term of office1 and length of time served2 | | Since 2013 |
| Principal occupation(s) during past five years | | Assistant Vice President of Legg Mason & Co. and Legg Mason Investor Services, LLC (“LMIS”) (since 2010); Chief Anti-Money Laundering Compliance Officer of certain mutual funds associated with Legg Mason & Co. or its affiliates (since 2013) and Anti-Money Laundering Compliance Officer of LMIS (since 2012); Senior Compliance Officer of LMIS (since 2011); formerly, AML Consultant, DTCC (2010); AML Consultant, Rabobank Netherlands, (2009); First Vice President, Director of Marketing & Advertising Compliance and Manager of Communications Review Group at Citigroup Inc. (1996 to 2008) |
| |
Jenna Bailey Legg Mason 100 First Stamford Place, 5th Floor, Stamford, CT 06902 | | |
| Year of birth | | 1978 |
| Position(s) with Trust | | Identity Theft Prevention Officer |
| Term of office1 and length of time served2 | | Since 2015 |
| Principal occupation(s) during past five years | | Identity Theft Prevention Officer of certain mutual funds associated with Legg Mason & Co. or its affiliates (since 2015); Compliance Officer of Legg Mason & Co. (since 2013); Assistant Vice President of Legg Mason & Co. (since 2011); formerly, Associate Compliance Officer of Legg Mason & Co. (2011 to 2013) |
| |
Jeanne M. Kelly Legg Mason 620 Eighth Avenue, 49th Floor, New York, NY 10018 | | |
| Year of birth | | 1951 |
| Position(s) with Trust | | Senior Vice President |
| Term of office1 and length of time served2 | | Since 2007 |
| Principal occupation(s) during past five years | | Senior Vice President of certain mutual funds associated with Legg Mason & Co. or its affiliates (since 2007); Senior Vice President of LMPFA (since 2006); President and Chief Executive Officer of LMAS and LMFAM (since 2015); Managing Director of Legg Mason & Co. (since 2005) and Legg Mason & Co. predecessors (prior to 2005); formerly, Senior Vice President of LMFAM (2013 to 2015) |
| † | Trustees who are not “interested persons” of the Fund within the meaning of Section 2(a)(19) of the Investment Company Act of 1940, as amended (the “1940 Act”). Each of the Independent Trustees serves on the standing committees of the Board of Trustees, which include the Audit Committee (chair: Arthur S. Mehlman), the Nominating Committee (co-chairs: G. Peter O’Brien and Jill E. McGovern), and the Independent Trustees Committee (chair: Arnold L. Lehman). |
| | |
| QS Strategic Real Return Fund | | 55 |
Additional information (unaudited) (cont’d)
Information about Trustees and Officers
| 1 | Each Trustee and officer serves until his or her respective successor has been duly elected and qualified or until his or her earlier death, resignation, retirement or removal. |
| 2 | Indicates the earliest year in which the Trustee became a board member for a fund in the Legg Mason fund complex or the officer took such office. |
| 3 | Ms. Trust is an “interested person” of the Fund, as defined in the 1940 Act, because of her position with LMPFA and/or certain of its affiliates. |
| | |
| 56 | | QS Strategic Real Return Fund |
Important tax information (unaudited)
The following information is provided with respect to the distributions paid during the taxable year ended September 30, 2018:
| | | | | | | | |
| Record date: | | | 12/5/2017 | | | | 12/19/2017 | |
| Payable date: | | | 12/6/2017 | | | | 12/20/2017 | |
| Ordinary income: | | | | | | | | |
Qualified dividend income for individuals | | | — | | | | 44.86 | % |
Dividends qualifying for the dividends | | | | | | | | |
received deduction for corporations | | | — | | | | 25.49 | % |
| Interest from Federal obligations | | | — | | | | 32.65 | %* |
| Long-term capital gain dividend | | $ | 0.320070 | | | | — | |
| * | The law varies in each state as to whether and what percentage of dividend income attributable to Federal obligations is exempt from state income tax. We recommend that you consult with your tax adviser to determine if any portion of the dividends you received is exempt from state income taxes. |
Please retain this information for your records.
| | |
| QS Strategic Real Return Fund | | 57 |
QS
Strategic Real Return Fund
Trustees
Ruby P. Hearn
Arnold L. Lehman
Chairman
Robin J.W. Masters
Jill E. McGovern
Arthur S. Mehlman
G. Peter O’Brien
S. Ford Rowan
Robert M. Tarola
Jane Trust
Investment manager
Legg Mason Partners Fund Advisor, LLC
Investment adviser
QS Investors, LLC
Subadvisers
ClearBridge Investments, LLC
QS Investors, LLC
Western Asset Management Company, LLC*
Western Asset Management Company Limited
Western Asset Management Company Ltd
Distributor
Legg Mason Investor Services, LLC
Custodian
The Bank of New York Mellon (“BNY”)**
Transfer agent
BNY Mellon Investment Servicing (US) Inc.
4400 Computer Drive
Westborough, MA 01581
Independent registered public accounting firm
PricewaterhouseCoopers LLP
Baltimore, MD
| * | Prior to May 2, 2018, known as Western Asset Management Company. |
| ** | Effective April 9, 2018, BNY became custodian. |
QS Strategic Real Return Fund
The Fund is a separate investment series of Legg Mason Global Asset Management Trust, a Maryland statutory trust.
QS Strategic Real Return Fund
Legg Mason Funds
620 Eighth Avenue, 49th Floor
New York, NY 10018
The Fund files its complete schedule of portfolio holdings with the Securities and Exchange Commission (“SEC”) for the first and third quarters of each fiscal year on Form N-Q. The Fund’s Forms N-Q are available on the SEC’s website at www.sec.gov. The Fund’s Forms N-Q may be reviewed and copied at the SEC’s Public Reference Room in Washington, D.C., and information on the operation of the Public Reference Room may be obtained by calling 1-800-SEC-0330. To obtain information on Form N-Q, shareholders can call the Fund at 1-877-721-1926.
Information on how the Fund voted proxies relating to portfolio securities during the prior 12-month period ended June 30th of each year and a description of the policies and procedures that the Fund uses to determine how to vote proxies related to portfolio transactions are available (1) without charge, upon request, by calling the Fund at 1-877-721-1926, (2) at www.leggmason.com/mutualfunds and (3) on the SEC’s website at www.sec.gov.
This report is submitted for the general information of the shareholders of QS Strategic Real Return Fund. This report is not authorized for distribution to prospective investors in the Fund unless preceded or accompanied by a current prospectus.
Investors should consider the Fund’s investment objectives, risks, charges and expenses carefully before investing. The prospectus contains this and other important information about the Fund. Please read the prospectus carefully before investing.
www.leggmason.com
© 2018 Legg Mason Investor Services, LLC
Member FINRA, SIPC
Legg Mason Funds Privacy and Security Notice
Your Privacy and the Security of Your Personal Information is Very Important to the Legg Mason Funds
This Privacy and Security Notice (the “Privacy Notice”) addresses the Legg Mason Funds’ privacy and data protection practices with respect to nonpublic personal information the Funds receive. The Legg Mason Funds include any funds sold by the Funds’ distributor, Legg Mason Investor Services, LLC, as well as Legg Mason-sponsored closed-end funds. The provisions of this Privacy Notice apply to your information both while you are a shareholder and after you are no longer invested with the Funds.
The Type of Nonpublic Personal Information the Funds Collect About You
The Funds collect and maintain nonpublic personal information about you in connection with your shareholder account. Such information may include, but is not limited to:
| • | | Personal information included on applications or other forms; |
| • | | Account balances, transactions, and mutual fund holdings and positions; |
| • | | Bank account information, legal documents, and identify verification documentation; |
| • | | Online account access user IDs, passwords, security challenge question responses; and |
| • | | Information received from consumer reporting agencies regarding credit history and creditworthiness (such as the amount of an individual’s total debt, payment history, etc.). |
How the Funds Use Nonpublic Personal Information About You
The Funds do not sell or share your nonpublic personal information with third parties or with affiliates for their marketing purposes, or with other financial institutions or affiliates for joint marketing purposes, unless you have authorized the Funds to do so. The Funds do not disclose any nonpublic personal information about you except as may be required to perform transactions or services you have authorized or as permitted or required by law. The Funds may disclose information about you to:
| • | | Employees, agents, and affiliates on a “need to know” basis to enable the Funds to conduct ordinary business or to comply with obligations to government regulators; |
| • | | Service providers, including the Funds’ affiliates, who assist the Funds as part of the ordinary course of business (such as printing, mailing services, or processing or servicing your account with us) or otherwise perform services on the Funds’ behalf, including companies that may perform statistical analysis, market research and marketing services solely for the Funds; |
| • | | Permit access to transfer, whether in the United States or countries outside of the United States to such Funds’ employees, agents and affiliates and service providers as required to enable the Funds to conduct ordinary business, or to comply with obligations to government regulators; |
| • | | The Funds’ representatives such as legal counsel, accountants and auditors to enable the Funds to conduct ordinary business, or to comply with obligations to government regulators; |
|
| NOT PART OF THE ANNUAL REPORT |
Legg Mason Funds Privacy and Security Notice (cont’d)
| • | | Fiduciaries or representatives acting on your behalf, such as an IRA custodian or trustee of a grantor trust. |
Except as otherwise permitted by applicable law, companies acting on the Funds’ behalf, including those outside the United States, are contractually obligated to keep nonpublic personal information the Funds provide to them confidential and to use the information the Funds share only to provide the services the Funds ask them to perform.
The Funds may disclose nonpublic personal information about you when necessary to enforce their rights or protect against fraud, or as permitted or required by applicable law, such as in connection with a law enforcement or regulatory request, subpoena, or similar legal process. In the event of a corporate action or in the event a Fund service provider changes, the Funds may be required to disclose your nonpublic personal information to third parties. While it is the Funds’ practice to obtain protections for disclosed information in these types of transactions, the Funds cannot guarantee their privacy policy will remain unchanged.
Keeping You Informed of the Funds’ Privacy and Security Practices
The Funds will notify you annually of their privacy policy as required by federal law. While the Funds reserve the right to modify this policy at any time they will notify you promptly if this privacy policy changes.
The Funds’ Security Practices
The Funds maintain appropriate physical, electronic and procedural safeguards designed to guard your nonpublic personal information. The Funds’ internal data security policies restrict access to your nonpublic personal information to authorized employees, who may use your nonpublic personal information for Fund business purposes only.
Although the Funds strive to protect your nonpublic personal information, they cannot ensure or warrant the security of any information you provide or transmit to them, and you do so at your own risk. In the event of a breach of the confidentiality or security of your nonpublic personal information, the Funds will attempt to notify you as necessary so you can take appropriate protective steps. If you have consented to the Funds using electronic communications or electronic delivery of statements, they may notify you under such circumstances using the most current email address you have on record with them.
In order for the Funds to provide effective service to you, keeping your account information accurate is very important. If you believe that your account information is incomplete, not accurate or not current, if you have questions about the Funds’ privacy practices, or our use of your nonpublic personal information, write the Funds using the contact information on your account statements, email the Funds by clicking on the Contact Us section of the Funds’ website at www.leggmason.com, or contact the Funds at 1-877-721-1926.
Revised April 2018
|
| NOT PART OF THE ANNUAL REPORT |
www.leggmason.com
© 2018 Legg Mason Investor Services, LLC Member FINRA, SIPC
LMFX013120 11/18 SR18-3472
The registrant has adopted a code of ethics that applies to the registrant’s principal executive officer, principal financial officer, principal accounting officer or controller.
| ITEM 3. | AUDIT COMMITTEE FINANCIAL EXPERT. |
The Board of Trustees of the registrant has determined that Arthur S. Mehlman the Chairman of the Board’s Audit Committee and Robert M. Tarola, possess the technical attributes identified in Instruction 2(b) of Item 3 to Form N-CSR to qualify as “audit committee financial experts,” and have designated Mr. Mehlman and Mr. Tarola as the Audit Committee’s financial experts. Mr. Mehlman and Mr. Tarola are “independent” Trustees pursuant to paragraph (a) (2) of Item 3 to Form N-CSR.
| ITEM 4. | PRINCIPAL ACCOUNTANT FEES AND SERVICES. |
a) Audit Fees. The aggregate fees billed in the last two fiscal years ending September 30, 2017 and September 30, 2018 (the “Reporting Periods”) for professional services rendered by the Registrant’s principal accountant (the “Auditor”) for the audit of the Registrant’s annual financial statements, or services that are normally provided by the Auditor in connection with the statutory and regulatory filings or engagements for the Reporting Periods, were $214,935 in September 30, 2017 and $306,746 in September 30, 2018.
b) Audit-Related Fees. The aggregate fees billed in the Reporting Period for assurance and related services by the Auditor that are reasonably related to the performance of the Registrant’s financial statements were $0 in September 30, 2017 and $0 in September 30, 2018.
(c) Tax Fees. The aggregate fees billed in the Reporting Periods for professional services rendered by the Auditor for tax compliance, tax advice and tax planning (“Tax Services”) were $27,852 in September 30, 2017 and $45,424 in September 30, 2018. These services consisted of (i) review or preparation of U.S. federal, state, local and excise tax returns; (ii) U.S. federal, state and local tax planning, advice and assistance regarding statutory, regulatory or administrative developments, and (iii) tax advice regarding tax qualification matters and/or treatment of various financial instruments held or proposed to be acquired or held.
There were no fees billed for tax services by to the service affiliates during the Reporting Periods that required pre-approval by the Audit Auditors Committee.
d) All Other Fees. The aggregate fees for other fees billed in the Reporting Periods for products and services provided by the Auditor were $0 in September 30, 2017 and $0 in September 30, 2018, other than the services reported in paragraphs (a) through (c) of this item for the Legg Mason Global Asset Management Trust.
All Other Fees. There were no other non-audit services rendered by the Auditor to Legg Mason Partners Fund Advisors, LLC (“LMPFA”), and any entity controlling, controlled by or under common control with LMPFA that provided ongoing services to Legg Mason Global Asset Management Trust requiring pre-approval by the Audit Committee in the Reporting Period.
(e) Audit Committee’s pre–approval policies and procedures described in paragraph (c)
(7) of Rule 2-01 of Regulation S-X.
(1) The Charter for the Audit Committee (the “Committee”) of the Board of each registered investment company (the “Fund”) advised by LMPFA or one of their affiliates (each, an “Adviser”) requires that the Committee shall approve (a) all audit and permissible non-audit services to be provided to the Fund and (b) all permissible non-audit services to be provided by the Fund’s independent auditors to the Adviser and any Covered Service Providers if the engagement relates directly to the operations and financial reporting of the Fund. The Committee may implement policies and procedures by which such services are approved other than by the full Committee.
The Committee shall not approve non-audit services that the Committee believes may impair the independence of the auditors. As of the date of the approval of this Audit Committee Charter, permissible non-audit services include any professional services (including tax services), that are not prohibited services as described below, provided to the Fund by the independent auditors, other than those provided to the Fund in connection with an audit or a review of the financial statements of the Fund. Permissible non-audit services may not include: (i) bookkeeping or other services related to the accounting records or financial statements of the Fund; (ii) financial information systems design and implementation; (iii) appraisal or valuation services, fairness opinions or contribution-in-kind reports; (iv) actuarial services; (v) internal audit outsourcing services; (vi) management functions or human resources; (vii) broker or dealer, investment adviser or investment banking services; (viii) legal services and expert services unrelated to the audit; and (ix) any other service the Public Company Accounting Oversight Board determines, by regulation, is impermissible.
Pre-approval by the Committee of any permissible non-audit services is not required so long as: (i) the aggregate amount of all such permissible non-audit services provided to the Fund, the Adviser and any service providers controlling, controlled by or under common control with the Adviser that provide ongoing services to the Fund (“Covered Service Providers”) constitutes not more than 5% of the total amount of revenues paid to the independent auditors during the fiscal year in which the permissible non-audit services are provided to (a) the Fund, (b) the Adviser and (c) any entity controlling, controlled by or under common control with the Adviser that provides ongoing services to the Fund during the fiscal year in which the services are provided that would have to be approved by the Committee; (ii) the permissible non-audit services were not recognized by the Fund at the time of the engagement to be non-audit services; and (iii) such services are promptly brought to the attention of the Committee and approved by the Committee (or its delegate(s)) prior to the completion of the audit.
(2) For the Legg Mason Global Asset Management Trust, the percentage of fees that were approved by the audit committee, with respect to: Audit-Related Fees were 100% and 100% for September 30, 2017 and September 30, 2018; Tax Fees were 100% and 100% for September 30, 2017 and September 30, 2018; and Other Fees were 100% and 100% for September 30, 2017 and September 30, 2018.
(f) N/A
(g) Non-audit fees billed by the Auditor for services rendered to Legg Mason Global Asset Management Trust, LMPFA and any entity controlling, controlled by, or under common control with LMPFA that provides ongoing services to Legg Mason Global Asset Management Trust during the reporting period were $271,895 in September 30, 2017 and $477,227 in September 30, 2018.
(h) Yes. Legg Mason Global Asset Management Trust’s Audit Committee has considered whether the provision of non-audit services that were rendered to Service Affiliates, which were not pre-approved (not requiring pre-approval), is compatible with maintaining the Accountant’s independence. All services provided by the Auditor to the Legg Mason Global Asset Management Trust or to Service Affiliates, which were required to be pre-approved, were pre-approved as required.
| ITEM 5. | AUDIT COMMITTEE OF LISTED REGISTRANTS. |
| | a) | The independent board members are acting as the registrant’s audit committee as specified in Section 3(a)(58)(B) of the Exchange Act. The Audit Committee consists of the following Board members: |
Ruby P. Hearn
Arnold L. Lehman
Robin J.W. Masters
Jill E. McGovern
Arthur S. Mehlman
G. Peter O’Brien
S. Ford Rowan
Robert M. Tarola
| ITEM 6. | SCHEDULE OF INVESTMENTS. |
Included herein under Item 1.
| ITEM 7. | DISCLOSURE OF PROXY VOTING POLICIES AND PROCEDURES FOR CLOSED-END MANAGEMENT INVESTMENT COMPANIES. |
Not applicable.
| ITEM 8. | PORTFOLIO MANAGERS OF CLOSED-END MANAGEMENT INVESTMENT COMPANIES. |
Not applicable.
| ITEM 9. | PURCHASES OF EQUITY SECURITIES BY CLOSED-END MANAGEMENT INVESTMENT COMPANY AND AFFILIATED PURCHASERS. |
Not applicable.
| ITEM 10. | SUBMISSION OF MATTERS TO A VOTE OF SECURITY HOLDERS. |
Not applicable.
| ITEM 11. | CONTROLS AND PROCEDURES. |
| | (a) | The registrant’s principal executive officer and principal financial officer have concluded that the registrant’s disclosure controls and procedures (as defined in Rule 30a- 3(c) under the Investment Company Act of 1940, as amended (the “1940 Act”)) are effective as of a date within 90 days of the filing date of this report that includes the disclosure required by this paragraph, based on their evaluation of the disclosure controls and procedures required by Rule 30a-3(b) under the 1940 Act and 15d-15(b) under the Securities Exchange Act of 1934. |
| | (b) | There were no changes in the registrant’s internal control over financial reporting (as defined in Rule 30a-3(d) under the 1940 Act) that occurred during the second fiscal quarter of the period covered by this report that have materially affected, or are likely to materially affect the registrant’s internal control over financial reporting. |
(a) (1) Code of Ethics attached hereto.
Exhibit 99.CODE ETH
(a) (2) Certifications pursuant to section 302 of the Sarbanes-Oxley Act of 2002 attached hereto.
Exhibit 99.CERT
(b) Certifications pursuant to Section 906 of the Sarbanes-Oxley Act of 2002 attached hereto.
Exhibit 99.906CERT
SIGNATURES
Pursuant to the requirements of the Securities Exchange Act of 1934 and the Investment Company Act of 1940, the registrant has duly caused this Report to be signed on its behalf by the undersigned, there unto duly authorized.
| | |
Legg Mason Global Asset Management Trust |
| |
| By: | | /s/ Jane Trust |
| | Jane Trust |
| | Chief Executive Officer |
Pursuant to the requirements of the Securities Exchange Act of 1934 and the Investment Company Act of 1940, this report has been signed below by the following persons on behalf of the registrant and in the capacities and on the dates indicated.
| | |
| By: | | /s/ Jane Trust |
| | Jane Trust |
| | Chief Executive Officer |
| | |
| |
| By: | | /s/ Richard F. Sennett |
| | Richard F. Sennett |
| | Principal Financial Officer |