UNITED STATES
SECURITIES AND EXCHANGE COMMISSION
Washington, D.C. 20549
FORM N-CSR
CERTIFIED SHAREHOLDER REPORT OF REGISTERED
MANAGEMENT INVESTMENT COMPANIES
Investment Company Act file number 811-22338
Legg Mason Global Asset Management Trust
(Exact name of registrant as specified in charter)
620 Eighth Avenue, 49th Floor, New York, NY 10018
(Address of principal executive offices) (Zip code)
Robert I. Frenkel, Esq.
Legg Mason & Co., LLC
100 First Stamford Place
Stamford, CT 06902
(Name and address of agent for service)
Registrant’s telephone number, including area code: 1-877-721-1926
Date of fiscal year end: September 30
Date of reporting period: September 30, 2018
| ITEM 1. | REPORT TO STOCKHOLDERS |
The Annual Report to Stockholders is filed herewith.

| | |
| Annual Report | | September 30, 2018 |
QS
INTERNATIONAL EQUITY FUND

|
| INVESTMENT PRODUCTS: NOT FDIC INSURED • NO BANK GUARANTEE • MAY LOSE VALUE |
Fund objective
The Fund seeks maximum long-term total return.
Letter from the president

Dear Shareholder,
We are pleased to provide the annual report of QS International Equity Fund for the twelve-month reporting period ended September 30, 2018. Please read on for a detailed look at prevailing economic and market conditions during the Fund’s reporting period and to learn how those conditions have affected Fund performance.
As always, we remain committed to providing you with excellent service and a full spectrum of investment choices. We also remain committed to supplementing the support you receive from your financial advisor. One way we accomplish this is through our website, www.leggmason.com. Here you can gain immediate access to market and investment information, including:
| • | | Fund prices and performance, |
| • | | Market insights and commentaries from our portfolio managers, and |
| • | | A host of educational resources. |
We look forward to helping you meet your financial goals.
Sincerely,

Jane Trust, CFA
President and Chief Executive Officer
October 31, 2018
| | |
| II | | QS International Equity Fund |
Investment commentary
Economic review
Economic activity in the U.S. was mixed during the twelve months ended September 30, 2018 (the “reporting period”). Looking back, the U.S. Department of Commerce reported that fourth quarter 2017 and first quarter 2018 U.S. gross domestic product (“GDP”)i growth was 2.3% and 2.2%, respectively. GDP growth then accelerated to 4.2% during the second quarter of 2018 — the strongest reading since the third quarter of 2014. Finally, the U.S. Department of Commerce’s initial reading for third quarter 2018 GDP growth — released after the reporting period ended —was 3.5%. The deceleration in GDP growth in the third quarter of 2018 reflected a downturn in exports and a deceleration in nonresidential fixed investment. Imports increased in the third quarter after decreasing in the second. These movements were partly offset by an upturn in private inventory investment.
Job growth in the U.S. was solid overall and supported the economy during the reporting period. As reported by the U.S. Department of Labor, when the reporting period ended on September 30, 2018, the unemployment rate was 3.7%, versus 4.1% when the period began. September 2018’s reading was the lowest unemployment rate since 1969. The percentage of longer-term unemployed also declined during the reporting period. In September 2018, 22.9% of Americans looking for a job had been out of work for more than six months, versus 24.8% when the period began.
Turning to the global economy, in its October 2018 World Economic Outlook — released after the reporting period ended — the International Monetary Fund (“IMF”)ii said, “Global growth for 2018-19 is projected to remain steady at its 2017 level, but its pace is less vigorous than projected in April [2018] and it has become less balanced. Downside risks to global growth have risen in the past six months and the potential for upside surprises has receded.” From a regional perspective, the IMF projects 2018 growth in the Eurozone will be 2.0%, versus 2.4% in 2017. Japan’s economy is expected to expand 1.1% in 2018, compared to 1.7% in 2017. Elsewhere, the IMF projects that overall growth in emerging market countries will accelerate to 4.7% in 2018, the same as in 2017.
Looking back, at its meeting that concluded on September 20, 2017, the Federal Reserve Board (the “Fed”)iii kept the federal funds rateiv on hold, but reiterated its intention to begin reducing its balance sheet, saying, “In October, the Committee will initiate the balance sheet normalization program….” At its meeting that ended on December 13, 2017, the Fed raised rates to a range between 1.25% and 1.50%. As expected, the Fed kept rates on hold at its meeting that concluded on January 31, 2018. However, at its meeting that ended on March 21, 2018, the Fed again raised the federal funds rate, moving it to a range between 1.50% and 1.75%. At its meeting that concluded on June 13, 2018, the Fed raised the federal funds rate to a range between 1.75% and 2.00%. Finally, at its meeting that ended on September 26, 2018, the Fed raised the federal funds rate to a range between 2.00% and 2.25%.
Central banks outside the U.S. took different approaches to monetary policy during the reporting period. Looking back, in December 2016, the European Central Bank (“ECB”)v extended its bond buying program until
| | |
| QS International Equity Fund | | III |
Investment commentary (cont’d)
December 2017. From April 2017 through December 2017, the ECB purchased €60 billion-per-month of bonds. In October 2017, the ECB announced that it would continue to buy bonds through September 2018, but after December 2017 it would pare its purchases to €30 billion-per-month. In June 2018, the ECB announced it would end its bond buying program by the end of the year, but it did not anticipate raising interest rates “at least through the summer of 2019”. In other developed countries, on November 2, 2017, the Bank of Englandvi raised rates from 0.25% to 0.50% — the first increase since July 2007. It then raised rates to 0.75% at its meeting on August 2, 2018. After holding rates steady at 0.10% for more than five years, in January 2016, the Bank of Japanvii announced that it cut the rate on current accounts that commercial banks hold with it to -0.10% and kept rates on hold during the reporting period. Elsewhere, the People’s Bank of Chinaviii kept rates steady at 4.35% during the reporting period.
As always, thank you for your confidence in our stewardship of your assets.
Sincerely,
Jane Trust, CFA
President and Chief Executive Officer
October 31, 2018
All investments are subject to risk including the possible loss of principal. Past performance is no guarantee of future results. Forecasts and predictions are inherently limited and should not be relied upon as an indication of actual or future performance.
| i | Gross domestic product (“GDP”) is the market value of all final goods and services produced within a country in a given period of time. |
| ii | The International Monetary Fund (“IMF”) is an organization of 189 countries, working to foster global monetary cooperation, secure financial stability, facilitate international trade, promote high employment and sustainable economic growth, and reduce poverty around the world. |
| iii | The Federal Reserve Board (the “Fed”) is responsible for the formulation of U.S. policies designed to promote economic growth, full employment, stable prices, and a sustainable pattern of international trade and payments. |
| iv | The federal funds rate is the rate charged by one depository institution on an overnight sale of immediately available funds (balances at the Federal Reserve) to another depository institution; the rate may vary from depository institution to depository institution and from day to day. |
| v | The European Central Bank (“ECB”) is responsible for the monetary system of the European Union and the euro currency. |
| vi | The Bank of England (“BoE”), formally the Governor and Company of the BoE, is the central bank of the United Kingdom. The BoE’s purpose is to maintain monetary and financial stability. |
| vii | The Bank of Japan is the central bank of Japan. The bank is responsible for issuing and handling currency and treasury securities, implementing monetary policy, maintaining the stability of the Japanese financial system and the yen currency. |
| viii | The People’s Bank of China is the central bank of the People’s Republic of China with the power to carry out monetary policy and regulate financial institutions in mainland China. |
| | |
| IV | | QS International Equity Fund |
Fund overview
Q. What is the Fund’s investment strategy?
A. The Fund’s investment objective is maximum long-term total return. Under normal circumstances, the Fund intends to invest primarily (at least 65% of its total assets) in equity securities of issuers located outside the United States. Under normal circumstances, the Fund invests at least 80% of its net assets, plus any borrowing for investment purposes, in equity securities.
We, at QS Investors, LLC (“QS Investors”), the Fund’s subadviser, use a quantitative process and seek to add value through stock selection and region, country and sector allocation. Region, country and sector allocations are based on rankings generated by our proprietary models. We periodically review these allocations and may adjust them based on current or anticipated market conditions or in an effort to manage risk consistent with the Fund’s investment objective. The Fund’s portfolio managers use a quantitative process that assesses stocks by relative attractiveness based on a variety of measures including value, cash flow, earnings growth and sentiment. The portfolio managers are part of a team approach to research to improve the quantitative models, and thus the models are expected to evolve over time as changes are incorporated.
The Fund is not limited in the amount of its total assets that may be denominated in a single currency or invested in securities of issuers located in a single country. The Fund may invest up to 35% of its total assets in securities of emerging market issuers. The Fund’s investment portfolio will normally be diversified across a broad range of regions and industry sectors, consistent with managing risk while pursuing its investment objective. We may also seek to enhance portfolio returns through active currency hedging strategies and may invest in derivative instruments to do so.
Q. What were the overall market conditions during the Fund’s reporting period?
A. Global equity returns were positive across most regions and sectors for the twelve-month reporting period ended September 30, 2018, with positive results driven largely by record returns in the U.S. Non-U.S. developed markets, as measured by the MSCI EAFE Indexi, underperformed U.S. equity markets, as measured by the Russell 1000 Indexii, returning, 2.74% and 17.76%, respectively, for the reporting period. In non-U.S. markets, growth slowed over the period; a strong first half tapered off to more mixed results across regions and sectors during the second half of the period.
International equities advanced in the fourth quarter of 2017 in U.S. dollars, and ended the year with double-digit gains. Most major equity markets posted positive returns in each quarter of 2017, in spite of geopolitical tensions in the Middle East and the Korean peninsula, as well as rate hikes in the United States and the United Kingdom. 2017 was the best year for global manufacturing since 2010, with expansion in many large economies, including Japan, Canada, and much of the Eurozone. Central banks in most developed countries kept policy rates steady for 2017. However, during the fourth quarter of 2017, the Bank of England (“BoE”)iii hiked rates by 0.25% for the first time in over ten years.
The persistent trend of global equity growth ended in the first quarter of 2018. Despite a backdrop of solid global economic gains, the
| | |
| QS International Equity Fund 2018 Annual Report | | 1 |
Fund overview (cont’d)
market in early February 2018 dipped into correction territory. The sell-off was believed to be sparked by a report that inflation in the U.S. was rising higher than expected, leading to fear that the Federal Reserve Board (the “Fed”)iv would accelerate their rate tightening schedule. Aside from inflation, global manufacturing indicators weakened slightly off a near three-and-a-half year high in January 2018. Equities remained volatile through the end of the quarter amid talks of new tariffs and trade friction between the U.S. and China.
Many developed markets declined in U.S. dollar terms in the second calendar quarter of 2018, as the U.S. dollar continued to strengthen and global trade tensions increased amid tariff implementation. Similar to 2017, for much of 2018, equity market performance continued to be driven by a narrow segment of stocks. Despite bouts of volatility during the first half of 2018, the rally in momentum/growth stocks continued, as investors seemed to be focused on seeking growth while disregarding valuations. Most markets turned positive in July 2018.
In the final quarter of the reporting period, equity markets outside the U.S. were modestly positive overall, but mixed among major regions. In keeping with the general trend of 2018, developed markets outperformed emerging markets, which declined slightly. Large cap indices outperformed small caps and growth stocks continued to outperform value. While business optimism in the U.S. reached new highs in September 2018, it deteriorated in other regions on weakening economic expansion, higher costs for oil and other commodities, and trade tensions.
Japan’s equity market was the best performing developed market for the period, with positive returns in all sectors, many in double digits. Employment, consumer prices, and business spending statistics continued to improve. While business sentiment declined in the final quarter of the reporting period on the high cost of materials, the economy experienced moderate growth with a rising gross domestic product (“GDP”)v. Defensive sectors outperformed; the market was led by the Health Care, Consumer Staples, Communication Services1 and Utilities sectors. The Real Estate sector and banks industry were the weakest performers during the period. We believe that the accommodative stance on monetary policy will likely continue as inflation, while rising at the end of the period, is still less than the Bank of Japan’svi goal.
The U.K. also had a positive return for the reporting period, despite periods of difficulty around Brexit negotiations, including a decline in the final quarter of the period. Solid gains were posted early in the period, with November 2017 being one of the best months on record for factory output, with a weaker pound benefiting exports. After a weak first quarter of 2018, the U.K. had strong results in April 2018. The business environment included falling inflation and gains in the important services area, though consumer confidence was down. The final quarter of the reporting period saw negative
| 1 | As of September 28, 2018, the Telecommunication Services sector was broadened to include some companies previously classified in the Consumer Discretionary and Information Technology sectors and renamed the Communication Services sector. |
| | |
| 2 | | QS International Equity Fund 2018 Annual Report |
returns across most sectors despite an uptick in manufacturing and the rate of job creation, likely as a result of fears around rising inflation and Brexit. The BoE left interest rates unchanged in September 2018 and noted that there was news about Brexit negotiations going poorly — causing private companies to take cost-cutting measures and hold back on investments.
Continental Europe was the laggard among the major regions throughout much of the reporting period and ended in negative territory. Despite strong economic growth in the fourth quarter of 2017, only about half of the European markets advanced. These widely mixed returns persisted in 2018. In the first calendar quarter of that year, countries like Finland, Italy, and Portugal had positive returns, while others like Switzerland and Ireland, which saw negative returns of more than 4%, declined. Economic and sentiment indicators which remained firmly in growth mode, fell modestly. In the second calendar quarter of 2018, equity and bond markets reacted to new governments in Spain and Italy. In the latter, the new coalition hinted it might want to leave the euro, leading to a short chaotic period, but ultimately walking back the claim. Eurozone banks declined sharply amid uncertainty generated by these claims, as well as the continued anemic interest rate regime.
Continental Europe rose modestly in the final quarter of the reporting period. Markets barely reacted to the European Central Bank’s recent announcement that it would reduce its quantitative easing program by half in October 2018 and expects to end the program by the end of 2018. Exports continued to be strong throughout the reporting period. However, manufacturers in the region continued to experience pricing pressure on steel and oil and a slowing growth trend in many markets, including Germany and Switzerland.
Across the smaller regions, the resource-based Australia, New Zealand & Canada region and Asia Developed ex-Japan posted positive returns for the reporting period.
Q. How did we respond to these changing market conditions?
A. We believe that fundamentals, the very basis of our investment process, will continue to be the primary driver of long-term returns. As a result, we continue to adhere to our investment philosophy while continuing to enhance our process to address sustainable market shifts. We also believe that integrated risk management is an important element of portfolio construction and our investment process will continue to reflect these long-held views. We strongly believe, particularly during times of extreme market volatility, in the value of a broadly diversified, rules-based, risk-controlled process.
Much of our research continues to be focused on developing tools to help us enhance performance regardless of market environment. This includes both individual factor research, as well as factor allocation strategies. As a result of this research, we’ve made several enhancements to our process to identify and mitigate risk in our stock selection models during market extremes, using macro-level tools to identify regimes that are more favorable/unfavorable toward certain factor strategies.
Performance review
For the twelve months ended September 30, 2018, Class C shares of QS International Equity Fund, excluding sales charges, returned -0.72%. The Fund’s unmanaged benchmark, the MSCI EAFE Index, returned 2.74% for the
| | |
| QS International Equity Fund 2018 Annual Report | | 3 |
Fund overview (cont’d)
same period. The Lipper International Multi-Cap Core Funds Category Average1 returned 1.14% over the same time frame.
| | | | | | | | |
Performance Snapshot as of September 30, 2018
(unaudited) | |
| (excluding sales charges) | | 6 months | | | 12 months | |
| QS International Equity Fund: | | | | | | | | |
Class A | | | -1.72 | % | | | 0.10 | % |
Class A2 | | | -1.85 | % | | | -0.10 | % |
Class C | | | -2.14 | % | | | -0.72 | % |
Class FI | | | -1.71 | % | | | 0.08 | % |
Class R | | | -1.84 | % | | | -0.14 | % |
Class I | | | -1.54 | % | | | 0.41 | % |
Class IS | | | -1.48 | % | | | 0.50 | % |
| MSCI EAFE Index | | | 0.10 | % | | | 2.74 | % |
| Lipper International Multi-Cap Core Funds Category Average1 | | | -1.66 | % | | | 1.14 | % |
The performance shown represents past performance. Past performance is no guarantee of future results and current performance may be higher or lower than the performance shown above. Principal value and investment returns will fluctuate and investors’ shares, when redeemed, may be worth more or less than their original cost. To obtain performance data current to the most recent month-end, please visit our website at www.leggmason.com/mutualfunds.
All share class returns assume the reinvestment of all distributions at net asset value and the deduction of all Fund expenses. Returns have not been adjusted to include sales charges that may apply or the deduction of taxes that a shareholder would pay on Fund distributions. If sales charges were reflected, the performance quoted would be lower. Performance figures for periods shorter than one year represent cumulative figures and are not annualized.
Fund performance figures reflect fee waivers and/or expense reimbursements, without which the performance would have been lower.
|
| Total Annual Operating Expenses (unaudited) |
As of the Fund’s current prospectus dated February 1, 2018, the gross total annual fund operating expense ratios for Class A, Class A2, Class C, Class FI, Class R, Class I and Class IS shares were 1.24%, 1.47%, 2.11%, 1.32%, 1.58%, 1.02% and 0.89%, respectively.
Actual expenses may be higher. For example, expenses may be higher than those shown if average net assets decrease. Net assets are more likely to decrease and Fund expense ratios are more likely to increase when markets are volatile.
As a result of expense limitation arrangements, the ratio of total annual fund operating expenses, other than interest, brokerage commissions, dividend expense on short sales, taxes, extraordinary expenses and acquired fund fees and expenses, to average net assets will not exceed 1.30% for Class A shares, 1.50% for Class A2 shares, 2.05% for Class C shares, 1.30% for Class FI shares, 1.55% for Class R shares, 0.95% for Class I shares and 0.85% for Class IS shares. In addition, the ratio of total annual fund operating expenses for Class IS shares will not exceed the ratio of total annual fund operating expenses for Class I shares. These expense limitation arrangements cannot be terminated prior to December 31, 2019 without the Board of Trustees’ consent.
The manager is permitted to recapture amounts waived and/or reimbursed to a class within three years after the fiscal year in which the manager earned the fee or
| 1 | Lipper, Inc., a wholly-owned subsidiary of Reuters, provides independent insight on global collective investments. Returns are based on the period ended September 30, 2018, including the reinvestment of all distributions, including returns of capital, if any, calculated among the 412 funds for the six-month period and among the 401 funds for the twelve-month period in the Fund’s Lipper category, and excluding sales charges, if any. |
| | |
| 4 | | QS International Equity Fund 2018 Annual Report |
incurred the expense if the class’ total annual operating expenses have fallen to a level below the expense limitation (“expense cap”) in effect at the time the fees were earned or the expenses incurred. In no case will the manager recapture any amount that would result, on any particular business day of the Fund, in the class’ total annual operating expenses exceeding the expense cap or any other lower limit then in effect.
Q. What were the leading contributors to performance?
A. Region and sector allocation relative to the benchmark was the leading contributor to performance for the reporting period, most notably the small allocation to emerging markets which are not included in the benchmark; emerging markets return in the portfolio significantly outperformed the benchmark return. An overweight to the Continental European Energy sector and an underweight to the Communication Services sector in that region also contributed to results. Stock selection results in the Continental European banks industry was a strong positive contributor to performance as well.
At the security level, the primary contributor to performance was UPM-Kymmene OYJ, a Finnish forest industry company which returned over 50% for the period. Other leading contributors included ICON PLC and Mitsubishi Corporation. ICON PLC, an Irish global provider of outsourced biotech development services, which is not in the benchmark, returned over 35% in the portfolio, while Mitsubishi Corporation returned 37.8% over the period.
Q. What were the leading detractors from performance?
A. During the reporting period, stock selection was the leading detractor from relative return overall, negatively impacting returns across regions. Japanese stock selection results were particularly challenged, especially in the Industrials sector. U.K. results were also negative, with the most negative results in the banks industry. At the stock level, the primary detractor was an overweight to Bayer AG, which merged with Monsanto in June 2018 and will be impacted by the more than 5,000 product liability lawsuits associated with Monsanto’s weedkillers; Bayer AG had a negative return of over 30% for the reporting period.
An overweight to Japanese construction firm Obayashi Corporation, which has been plagued with rumors of bid-rigging, was also a major detractor, as was an overweight to Vestas Wind Systems A/S whose earnings suffered from a slowdown in wind turbine installations in Europe. Both had double digit negative returns over the reporting period.
Thank you for your investment in QS International Equity Fund. As always, we appreciate that you have chosen us to manage your assets and we remain focused on achieving the Fund’s investment goals.
Sincerely,
QS Investors, LLC
October 22, 2018
RISKS: Equity securities are subject to market and price fluctuations. International investments are subject to special risks including currency fluctuations, as well as social, economic and political uncertainties, which could increase volatility. These risks are magnified in emerging markets. The securities markets of emerging market countries are substantially smaller, less developed, less
| | |
| QS International Equity Fund 2018 Annual Report | | 5 |
Fund overview (cont’d)
liquid and more volatile than securities markets of the U.S. and more developed countries. The Fund may engage in derivative transactions, which involve special risks and costs and may increase losses and have a potentially large impact on Fund performance. Please see the Fund’s prospectus for a more complete discussion of these and other risks and the Fund’s investment strategies.
Portfolio holdings and breakdowns are as of September 30, 2018 and are subject to change and may not be representative of the portfolio managers’ current or future investments. The Fund’s top ten holdings (as a percentage of net assets) as of September 30, 2018 were: Royal Dutch Shell PLC, Class A Shares (2.0%), Roche Holding AG (1.4%), Nestle SA, Registered Shares (1.4%), Novartis AG, Registered Shares (1.4%), Toyota Motor Corp. (1.1%), Rio Tinto PLC (1.1%), HSBC Holdings PLC (1.0%), Allianz SE, Registered Shares (1.0%), Diageo PLC (1.0%) and Novo Nordisk A/S, Class B Shares (1.0%). Please refer to pages 13 through 22 for a list and percentage breakdown of the Fund’s holdings.
The mention of sector breakdowns is for informational purposes only and should not be construed as a recommendation to purchase or sell any securities. The information provided regarding such sectors is not a sufficient basis upon which to make an investment decision. Investors seeking financial advice regarding the appropriateness of investing in any securities or investment strategies discussed should consult their financial professional. The Fund’s top five sector holdings (as a percentage of net assets) as of September 30, 2018 were: Financials (20.5%), Industrials (13.1%), Consumer Discretionary (11.1%), Health Care (9.6%) and Materials (9.0%). The Fund’s portfolio composition is subject to change at any time.
All investments are subject to risk including the possible loss of principal. Past performance is no guarantee of future results. All index performance reflects no deduction for fees, expenses or taxes. Please note that an investor cannot invest directly in an index.
The information provided is not intended to be a forecast of future events, a guarantee of future results or investment advice. Views expressed may differ from those of the firm as a whole.
| | |
| 6 | | QS International Equity Fund 2018 Annual Report |
| i | The MSCI EAFE Index is a free float-adjusted market capitalization index designed to measure developed market equity performance, excluding the U.S. and Canada. |
| ii | The Russell 1000 Index measures the performance of the large-cap segment of the U.S. equity universe. It is a subset of the Russell 3000 Index and includes approximately 1,000 of the largest securities based on a combination of their market cap and current index membership. The Russell 1000 represents approximately 90% of the U.S. market. The Russell 3000 Index measures the performance of the 3,000 largest U.S. companies based on total market capitalization, which represents approximately 98% of the U.S. equity market. |
| iii | The Bank of England (“BoE”), formally the Governor and Company of the BoE, is the central bank of the United Kingdom. The BoE’s purpose is to maintain monetary and financial stability. |
| iv | The Federal Reserve Board (the “Fed”) is responsible for the formulation of U.S. policies designed to promote economic growth, full employment, stable prices and a sustainable pattern of international trade and payments. |
| v | Gross domestic product (“GDP”) is the market value of all final goods and services produced within a country in a given period of time. |
| vi | The Bank of Japan (“BoJ”) is the central bank of Japan. The bank is responsible for issuing and handling currency and treasury securities, implementing monetary policy, maintaining the stability of the Japanese financial system and the yen currency. |
| | |
| QS International Equity Fund 2018 Annual Report | | 7 |
Fund at a glance† (unaudited)
Investment breakdown (%) as a percent of total investments
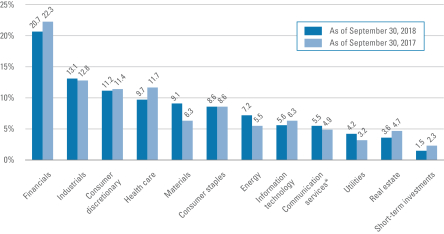
| † | The bar graph above represents the composition of the Fund’s investments as of September 30, 2018 and September 30, 2017. The Fund is actively managed. As a result, the composition of the Fund’s investments is subject to change at any time. |
| * | As of September 28, 2018, the Telecommunication Services sector was broadened to include some companies previously classified in the Consumer Discretionary and Information Technology sectors and renamed the Communication Services sector. |
| | |
| 8 | | QS International Equity Fund 2018 Annual Report |
Fund expenses (unaudited)
Example
As a shareholder of the Fund, you may incur two types of costs: (1) transaction costs, including front-end and back-end sales charges (loads) on purchase payments; and (2) ongoing costs, including management fees; service and/or distribution (12b-1) fees; and other Fund expenses. This example is intended to help you understand your ongoing costs (in dollars) of investing in the Fund and to compare these costs with the ongoing costs of investing in other mutual funds.
This example is based on an investment of $1,000 invested on April 1, 2018 and held for the six months ended September 30, 2018.
Actual expenses
The table below titled “Based on Actual Total Return” provides information about actual account values and actual expenses. You may use the information provided in this table, together with the amount you invested, to estimate the expenses that you paid over the period. To estimate the expenses you paid on your account, divide your ending account value by $1,000 (for example, an $8,600 ending account value divided by $1,000 = 8.6), then multiply the result by the number under the heading entitled “Expenses Paid During the Period”.
Hypothetical example for comparison purposes
The table below titled “Based on Hypothetical Total Return” provides information about hypothetical account values and hypothetical expenses based on the actual expense ratio and an assumed rate of return of 5.00% per year before expenses, which is not the Fund’s actual return. The hypothetical account values and expenses may not be used to estimate the actual ending account balance or expenses you paid for the period. You may use the information provided in this table to compare the ongoing costs of investing in the Fund and other funds. To do so, compare the 5.00% hypothetical example relating to the Fund with the 5.00% hypothetical examples that appear in the shareholder reports of the other funds.
Please note that the expenses shown in the table below are meant to highlight your ongoing costs only and do not reflect any transactional costs, such as front-end or back-end sales charges (loads). Therefore, the table is useful in comparing ongoing costs only, and will not help you determine the relative total costs of owning different funds. In addition, if these transaction costs were included, your costs would have been higher.
| | | | | | | | | | | | | | | | | | | | | | | | | | | | | | | | | | | | | | | | | | | | | | |
| Based on actual total return1 | | | | | | | | | Based on hypothetical total return1 | | | | |
| | | Actual
Total Return
Without
Sales
Charge2 | | | Beginning
Account
Value | | | Ending
Account
Value | | | Annualized
Expense
Ratio | | | Expenses
Paid
During
the
Period3 | | | | | | | | Hypothetical
Annualized
Total Return | | | Beginning
Account
Value | | | Ending
Account
Value | | | Annualized
Expense
Ratio | | | Expenses
Paid
During
the
Period3 | |
| Class A | | | -1.72 | % | | $ | 1,000.00 | | | $ | 982.80 | | | | 1.31 | % | | $ | 6.51 | | | | | | | Class A | | | 5.00 | % | | $ | 1,000.00 | | | $ | 1,018.50 | | | | 1.31 | % | | $ | 6.63 | |
| Class A2 | | | -1.85 | | | | 1,000.00 | | | | 981.50 | | | | 1.55 | | | | 7.70 | | | | | | | Class A2 | | | 5.00 | | | | 1,000.00 | | | | 1,017.30 | | | | 1.55 | | | | 7.84 | |
| Class C | | | -2.14 | | | | 1,000.00 | | | | 978.60 | | | | 2.06 | | | | 10.22 | | | | | | | Class C | | | 5.00 | | | | 1,000.00 | | | | 1,014.74 | | | | 2.06 | | | | 10.40 | |
| Class FI | | | -1.71 | | | | 1,000.00 | | | | 982.90 | | | | 1.34 | | | | 6.66 | | | | | | | Class FI | | | 5.00 | | | | 1,000.00 | | | | 1,018.35 | | | | 1.34 | | | | 6.78 | |
| Class R | | | -1.84 | | | | 1,000.00 | | | | 981.60 | | | | 1.58 | | | | 7.85 | | | | | | | Class R | | | 5.00 | | | | 1,000.00 | | | | 1,017.15 | | | | 1.58 | | | | 7.99 | |
| Class I | | | -1.54 | | | | 1,000.00 | | | | 984.60 | | | | 0.95 | | | | 4.73 | | | | | | | Class I | | | 5.00 | | | | 1,000.00 | | | | 1,020.31 | | | | 0.95 | | | | 4.81 | |
| Class IS | | | -1.48 | | | | 1,000.00 | | | | 985.20 | | | | 0.85 | | | | 4.23 | | | | | | | Class IS | | | 5.00 | | | | 1,000.00 | | | | 1,020.81 | | | | 0.85 | | | | 4.31 | |
| | |
| QS International Equity Fund 2018 Annual Report | | 9 |
Fund expenses (unaudited) (cont’d)
| 1 | For the six months ended September 30, 2018. |
| 2 | Assumes the reinvestment of all distributions, including returns of capital, if any, at net asset value and does not reflect the deduction of the applicable sales charge with respect to Class A and Class A2 shares or the applicable contingent deferred sales charge (“CDSC”) with respect to Class C shares. Total return is not annualized, as it may not be representative of the total return for the year. Performance figures may reflect compensating balance arrangements, fee waivers and/or expense reimbursements. In the absence of compensating balance arrangements, fee waivers and/or expense reimbursements, the total return would have been lower. Past performance is no guarantee of future results. |
| 3 | Expenses (net of compensating balance arrangements, fee waivers and/or expense reimbursements) are equal to each class’ respective annualized expense ratio multiplied by the average account value over the period, multiplied by the number of days in the most recent fiscal half-year (183), then divided by 365. |
| | |
| 10 | | QS International Equity Fund 2018 Annual Report |
Fund performance (unaudited)
| | | | | | | | | | | | | | | | | | | | | | | | | | | | |
| Average annual total returns | | | | | | | | | | | | | | | | | | | | | |
| Without sales charges1 | | Class A | | | Class A2 | | | Class C | | | Class FI | | | Class R | | | Class I | | | Class IS | |
| Twelve Months Ended 9/30/18 | | | 0.10 | % | | | -0.10 | % | | | -0.72 | % | | | 0.08 | % | | | -0.14 | % | | | 0.41 | % | | | 0.50 | % |
| Five Years Ended 9/30/18 | | | 5.15 | | | | N/A | | | | 4.34 | | | | 5.12 | | | | 4.85 | | | | 5.49 | | | | 5.61 | |
| Ten Years Ended 9/30/18 | | | N/A | | | | N/A | | | | 3.44 | | | | 4.20 | | | | 3.92 | | | | 4.57 | | | | 4.66 | |
| Inception* through 9/30/18 | | | 7.94 | | | | 9.39 | | | | — | | | | — | | | | — | | | | — | | | | — | |
| | | | | | | |
| With sales charges2 | | Class A | | | Class A2 | | | Class C | | | Class FI | | | Class R | | | Class I | | | Class IS | |
| Twelve Months Ended 9/30/18 | | | -5.65 | % | | | -5.86 | % | | | -1.69 | % | | | 0.08 | % | | | -0.14 | % | | | 0.41 | % | | | 0.50 | % |
| Five Years Ended 9/30/18 | | | 3.92 | | | | N/A | | | | 4.34 | | | | 5.12 | | | | 4.85 | | | | 5.49 | | | | 5.61 | |
| Ten Years Ended 9/30/18 | | | N/A | | | | N/A | | | | 3.44 | | | | 4.20 | | | | 3.92 | | | | 4.57 | | | | 4.66 | |
| Inception* through 9/30/18 | | | 7.29 | | | | 6.64 | | | | — | | | | — | | | | — | | | | — | | | | — | |
| | | | |
| Cumulative total returns | |
| Without sales charges1 | | | |
| Class A (Inception date of 2/3/09 through 9/30/18) | | | 109.18 | % |
| Class A2 (Inception date of 5/31/16 through 9/30/18) | | | 23.29 | |
| Class C (9/30/08 through 9/30/18) | | | 40.19 | |
| Class FI (9/30/08 through 9/30/18) | | | 50.91 | |
| Class R (9/30/08 through 9/30/18) | | | 46.93 | |
| Class I (9/30/08 through 9/30/18) | | | 56.30 | |
| Class IS (9/30/08 through 9/30/18) | | | 57.62 | |
All figures represent past performance and are not a guarantee of future results. Investment return and principal value of an investment will fluctuate so that an investor’s shares, when redeemed, may be worth more or less than their original cost. The returns shown do not reflect the deduction of taxes that a shareholder would pay on Fund distributions or the redemption of Fund shares. Performance figures may reflect compensating balance arrangements, fee waivers and/or expense reimbursements. In the absence of compensating balance arrangements, fee waivers and/or expense reimbursements, the total return would have been lower.
| 1 | Assumes the reinvestment of all distributions, including returns of capital, if any, at net asset value and does not reflect the deduction of the applicable sales charge with respect to Class A and Class A2 shares or the applicable contingent deferred sales charge (“CDSC”) with respect to Class C shares. |
| 2 | Assumes the reinvestment of all distributions, including returns of capital, if any, at net asset value. In addition, Class A and Class A2 shares reflect the deduction of the maximum initial sales charge of 5.75%. Class C shares reflect the deduction of a 1.00% CDSC, which applies if shares are redeemed within one year from purchase payment. |
| * | Inception dates for Class A, A2, C, FI, R, I and IS shares are February 3, 2009, May 31, 2016, February 17, 1995, May 16, 2003, December 28, 2006, May 5, 1998 and August 4, 2008, respectively. |
| | |
| QS International Equity Fund 2018 Annual Report | | 11 |
Fund performance (unaudited) (cont’d)
Historical performance
Value of $10,000 invested in
Class C Shares of QS International Equity Fund vs. MSCI EAFE Index† — September 2008 - September 2018
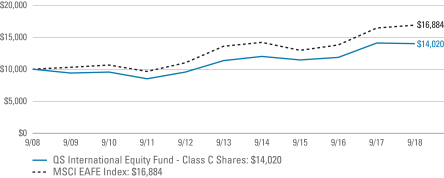
All figures represent past performance and are not a guarantee of future results. Investment return and principal value of an investment will fluctuate so that an investor’s shares, when redeemed, may be worth more or less than their original cost. The returns shown do not reflect the deduction of taxes that a shareholder would pay on Fund distributions or the redemption of Fund shares. Performance figures may reflect compensating balance arrangements, fee waivers and/or expense reimbursements. In the absence of compensating balance arrangements, fee waivers and/or expense reimbursements, the total return would have been lower.
| † | Hypothetical illustration of $10,000 invested in Class C shares of QS International Equity Fund on September 30, 2008, assuming the reinvestment of all distributions, including returns of capital, if any, at net asset value through September 30, 2018. The hypothetical illustration also assumes a $10,000 investment in the MSCI EAFE Index. The MSCI EAFE Index is a free float-adjusted market capitalization index designed to measure developed market equity performance, excluding the U.S. and Canada. The index is unmanaged and is not subject to the same management and trading expenses as a mutual fund. Please note that an investor cannot invest directly in an index. The performance of the Fund’s other classes may be greater or less than the Class C shares’ performance indicated on this chart, depending on whether greater or lesser sales charges and fees were incurred by shareholders investing in the other classes. |
| | |
| 12 | | QS International Equity Fund 2018 Annual Report |
Schedule of investments
September 30, 2018
QS International Equity Fund
| | | | | | | | | | | | | | | | |
| Security | | | | | | | | Shares | | | Value | |
| Common Stocks — 97.7% | | | | | | | | | | | | | | | | |
| Communication Services — 5.5% | | | | | | | | | | | | | | | | |
Diversified Telecommunication Services — 1.8% | | | | | | | | | | | | | | | | |
HKT Trust & HKT Ltd. | | | | | | | | | | | 708,000 | | | $ | 973,344 | (a) |
KT Corp., ADR | | | | | | | | | | | 50,620 | | | | 751,707 | |
Nippon Telegraph & Telephone Corp. | | | | | | | | | | | 47,535 | | | | 2,147,287 | (a) |
Telstra Corp. Ltd. | | | | | | | | | | | 305,101 | | | | 703,556 | (a) |
United Internet AG, Registered Shares | | | | | | | | | | | 16,745 | | | | 792,253 | (a) |
Total Diversified Telecommunication Services | | | | | | | | | | | | | | | 5,368,147 | |
Entertainment — 1.3% | | | | | | | | | | | | | | | | |
Konami Holdings Corp. | | | | | | | | | | | 20,692 | | | | 810,583 | (a) |
Nintendo Co., Ltd. | | | | | | | | | | | 2,600 | | | | 948,980 | (a) |
Square Enix Holdings Co., Ltd. | | | | | | | | | | | 20,943 | | | | 866,368 | (a) |
Vivendi SA | | | | | | | | | | | 42,769 | | | | 1,099,610 | (a) |
Total Entertainment | | | | | | | | | | | | | | | 3,725,541 | |
Media — 0.2% | | | | | | | | | | | | | | | | |
Eutelsat Communications SA | | | | | | | | | | | 25,796 | | | | 609,179 | (a) |
Wireless Telecommunication Services — 2.2% | | | | | | | | | | | | | | | | |
KDDI Corp. | | | | | | | | | | | 65,901 | | | | 1,820,870 | (a) |
NTT DOCOMO Inc. | | | | | | | | | | | 75,459 | | | | 2,029,145 | (a) |
SoftBank Group Corp. | | | | | | | | | | | 10,268 | | | | 1,036,921 | (a) |
Vodafone Group PLC | | | | | | | | | | | 827,594 | | | | 1,774,335 | (a) |
Total Wireless Telecommunication Services | | | | | | | | | | | | | | | 6,661,271 | |
Total Communication Services | | | | | | | | | | | | | | | 16,364,138 | |
| Consumer Discretionary — 11.1% | | | | | | | | | | | | | | | | |
Auto Components — 1.4% | | | | | | | | | | | | | | | | |
Aisin Seiki Co., Ltd. | | | | | | | | | | | 18,032 | | | | 877,896 | (a) |
Magna International Inc. | | | | | | | | | | | 18,115 | | | | 951,576 | |
NGK Spark Plug Co., Ltd. | | | | | | | | | | | 33,300 | | | | 970,356 | (a) |
Stanley Electric Co., Ltd. | | | | | | | | | | | 43,463 | | | | 1,486,044 | (a) |
Total Auto Components | | | | | | | | | | | | | | | 4,285,872 | |
Automobiles — 2.9% | | | | | | | | | | | | | | | | |
Honda Motor Co., Ltd. | | | | | | | | | | | 64,737 | | | | 1,959,895 | (a) |
Mazda Motor Corp. | | | | | | | | | | | 57,631 | | | | 692,029 | (a) |
Nissan Motor Co., Ltd. | | | | | | | | | | | 124,322 | | | | 1,163,806 | (a) |
Peugeot SA | | | | | | | | | | | 49,689 | | | | 1,336,658 | (a) |
Toyota Motor Corp. | | | | | | | | | | | 54,789 | | | | 3,399,207 | (a) |
Total Automobiles | | | | | | | | | | | | | | | 8,551,595 | |
See Notes to Financial Statements.
| | |
| QS International Equity Fund 2018 Annual Report | | 13 |
Schedule of investments (cont’d)
September 30, 2018
QS International Equity Fund
| | | | | | | | | | | | | | | | |
| Security | | | | | | | | Shares | | | Value | |
Hotels, Restaurants & Leisure — 1.8% | | | | | | | | | | | | | | | | |
Aristocrat Leisure Ltd. | | | | | | | | | | | 91,141 | | | $ | 1,863,308 | (a) |
Crown Resorts Ltd. | | | | | | | | | | | 84,204 | | | | 831,179 | (a) |
Genting Singapore Ltd. | | | | | | | | | | | 1,307,545 | | | | 1,012,108 | (a) |
Kindred Group PLC | | | | | | | | | | | 68,209 | | | | 764,087 | (a) |
Melco Resorts & Entertainment Ltd., ADR | | | | | | | | | | | 41,200 | | | | 871,380 | |
Total Hotels, Restaurants & Leisure | | | | | | | | | | | | | | | 5,342,062 | |
Household Durables — 2.3% | | | | | | | | | | | | | | | | |
Haseko Corp. | | | | | | | | | | | 84,682 | | | | 1,094,874 | (a) |
Persimmon PLC | | | | | | | | | | | 42,589 | | | | 1,311,617 | (a) |
Sekisui House Ltd. | | | | | | | | | | | 49,945 | | | | 761,688 | (a) |
Sony Corp. | | | | | | | | | | | 41,042 | | | | 2,517,010 | (a) |
Taylor Wimpey PLC | | | | | | | | | | | 527,464 | | | | 1,178,838 | (a) |
Total Household Durables | | | | | | | | | | | | | | | 6,864,027 | |
Multiline Retail — 0.7% | | | | | | | | | | | | | | | | |
Canadian Tire Corp. Ltd. Class A Shares | | | | | | | | | | | 7,064 | | | | 827,675 | |
Dollarama Inc. | | | | | | | | | | | 44,373 | | | | 1,397,853 | |
Total Multiline Retail | | | | | | | | | | | | | | | 2,225,528 | |
Textiles, Apparel & Luxury Goods — 2.0% | | | | | | | | | | | | | | | | |
Burberry Group PLC | | | | | | | | | | | 41,716 | | | | 1,095,509 | (a) |
Gildan Activewear Inc. | | | | | | | | | | | 24,800 | | | | 754,570 | |
Hugo Boss AG | | | | | | | | | | | 10,233 | | | | 787,950 | (a) |
LVMH Moet Hennessy Louis Vuitton SE | | | | | | | | | | | 2,628 | | | | 927,854 | (a) |
Moncler SpA | | | | | | | | | | | 28,895 | | | | 1,243,326 | (a) |
Swatch Group AG, Bearer Shares | | | | | | | | | | | 2,688 | | | | 1,067,697 | (a) |
Total Textiles, Apparel & Luxury Goods | | | | | | | | | | | | | | | 5,876,906 | |
Total Consumer Discretionary | | | | | | | | | | | | | | | 33,145,990 | |
| Consumer Staples — 8.5% | | | | | | | | | | | | | | | | |
Beverages — 2.0% | | | | | | | | | | | | | | | | |
Anheuser-Busch InBev SA/NV | | | | | | | | | | | 8,411 | | | | 736,123 | (a) |
Asahi Group Holdings Ltd. | | | | | | | | | | | 29,918 | | | | 1,297,004 | (a) |
Coca-Cola HBC AG, Class DI Shares | | | | | | | | | | | 31,587 | | | | 1,074,657 | (a) |
Diageo PLC | | | | | | | | | | | 81,690 | | | | 2,892,999 | (a) |
Total Beverages | | | | | | | | | | | | | | | 6,000,783 | |
Food & Staples Retailing — 2.0% | | | | | | | | | | | | | | | | |
E-MART Inc. | | | | | | | | | | | 5,419 | | | | 1,013,677 | (a) |
Empire Co., Ltd., Class A Shares | | | | | | | | | | | 40,800 | | | | 743,570 | |
J Sainsbury PLC | | | | | | | | | | | 247,429 | | | | 1,036,901 | (a) |
See Notes to Financial Statements.
| | |
| 14 | | QS International Equity Fund 2018 Annual Report |
QS International Equity Fund
| | | | | | | | | | | | | | | | |
| Security | | | | | | | | Shares | | | Value | |
Food & Staples Retailing — continued | | | | | | | | | | | | | | | | |
Seven & i Holdings Co., Ltd. | | | | | | | | | | | 39,200 | | | $ | 1,745,974 | (a) |
Tesco PLC | | | | | | | | | | | 470,735 | | | | 1,470,449 | (a) |
Total Food & Staples Retailing | | | | | | | | | | | | | | | 6,010,571 | |
Food Products — 2.0% | | | | | | | | | | | | | | | | |
Nestle SA, Registered Shares | | | | | | | | | | | 51,196 | | | | 4,264,938 | (a) |
Tate & Lyle PLC | | | | | | | | | | | 102,708 | | | | 913,624 | (a) |
Uni-President Enterprises Corp. | | | | | | | | | | | 350,000 | | | | 913,805 | (a) |
Total Food Products | | | | | | | | | | | | | | | 6,092,367 | |
Household Products — 0.5% | | | | | | | | | | | | | | | | |
Unicharm Corp. | | | | | | | | | | | 40,000 | | | | 1,321,190 | (a) |
Personal Products — 0.6% | | | | | | | | | | | | | | | | |
Unilever NV, CVA | | | | | | | | | | | 33,377 | | | | 1,858,568 | (a) |
Tobacco — 1.4% | | | | | | | | | | | | | | | | |
British American Tobacco PLC | | | | | | | | | | | 27,852 | | | | 1,300,305 | (a) |
Imperial Brands PLC | | | | | | | | | | | 47,970 | | | | 1,668,328 | (a) |
Japan Tobacco Inc. | | | | | | | | | | | 46,300 | | | | 1,208,762 | (a) |
Total Tobacco | | | | | | | | | | | | | | | 4,177,395 | |
Total Consumer Staples | | | | | | | | | | | | | | | 25,460,874 | |
| Energy — 7.2% | | | | | | | | | | | | | | | | |
Energy Equipment & Services — 0.3% | | | | | | | | | | | | | | | | |
WorleyParsons Ltd. | | | | | | | | | | | 55,056 | | | | 810,272 | (a) |
Oil, Gas & Consumable Fuels — 6.9% | | | | | | | | | | | | | | | | |
BP PLC | | | | | | | | | | | 302,843 | | | | 2,323,512 | (a) |
Enagas SA | | | | | | | | | | | 37,913 | | | | 1,023,398 | (a) |
Eni SpA | | | | | | | | | | | 97,277 | | | | 1,834,674 | (a) |
Galp Energia SGPS SA | | | | | | | | | | | 53,537 | | | | 1,061,607 | (a) |
Husky Energy, Inc. | | | | | | | | | | | 47,300 | | | | 830,538 | |
OMV AG | | | | | | | | | | | 22,540 | | | | 1,265,301 | (a) |
Origin Energy Ltd. | | | | | | | | | | | 130,363 | | | | 774,519 | *(a) |
Repsol SA | | | | | | | | | | | 83,466 | | | | 1,663,308 | (a) |
Royal Dutch Shell PLC, Class A Shares | | | | | | | | | | | 170,921 | | | | 5,844,996 | (a) |
Royal Dutch Shell PLC, Class B Shares | | | | | | | | | | | 41,494 | | | | 1,452,106 | (a) |
Santos Ltd. | | | | | | | | | | | 181,321 | | | | 947,874 | (a) |
Total SA | | | | | | | | | | | 23,816 | | | | 1,537,666 | (a) |
Total Oil, Gas & Consumable Fuels | | | | | | | | | | | | | | | 20,559,499 | |
Total Energy | | | | | | | | | | | | | | | 21,369,771 | |
| Financials — 20.5% | | | | | | | | | | | | | | | | |
Banks — 11.5% | | | | | | | | | | | | | | | | |
Australia & New Zealand Banking Group Ltd. | | | | | | | | | | | 103,502 | | | | 2,103,825 | (a) |
Banco Bilbao Vizcaya Argentaria SA | | | | | | | | | | | 258,922 | | | | 1,637,061 | (a) |
See Notes to Financial Statements.
| | |
| QS International Equity Fund 2018 Annual Report | | 15 |
Schedule of investments (cont’d)
September 30, 2018
QS International Equity Fund
| | | | | | | | | | | | | | | | |
| Security | | | | | | | | Shares | | | Value | |
Banks — continued | | | | | | | | | | | | | | | | |
Banco Santander SA | | | | | | | | | | | 150,577 | | | $ | 752,580 | (a) |
Bank Hapoalim BM | | | | | | | | | | | 231,027 | | | | 1,688,578 | (a) |
Bank Leumi Le-Israel BM | | | | | | | | | | | 297,737 | | | | 1,961,043 | (a) |
Bankinter SA | | | | | | | | | | | 73,859 | | | | 680,136 | (a) |
BNP Paribas SA | | | | | | | | | | | 40,212 | | | | 2,457,585 | (a) |
CaixaBank SA | | | | | | | | | | | 297,128 | | | | 1,349,500 | (a) |
Danske Bank A/S | | | | | | | | | | | 38,384 | | | | 1,007,030 | (a) |
Grupo Financiero Banorte SAB de CV, Class O Shares | | | | | | | | | | | 126,400 | | | | 914,397 | |
Hachijuni Bank Ltd. | | | | | | | | | | | 126,316 | | | | 579,348 | (a) |
HSBC Holdings PLC | | | | | | | | | | | 356,327 | | | | 3,110,507 | (a) |
ING Groep NV | | | | | | | | | | | 101,750 | | | | 1,319,139 | (a) |
KBC Group NV | | | | | | | | | | | 11,030 | | | | 820,010 | (a) |
Lloyds Banking Group PLC | | | | | | | | | | | 2,351,216 | | | | 1,814,405 | (a) |
Mediobanca SpA | | | | | | | | | | | 92,659 | | | | 922,793 | (a) |
Mitsubishi UFJ Financial Group Inc. | | | | | | | | | | | 309,654 | | | | 1,927,481 | (a) |
Mizuho Financial Group Inc. | | | | | | | | | | | 877,000 | | | | 1,529,249 | (a) |
Oversea-Chinese Banking Corp., Ltd. | | | | | | | | | | | 157,900 | | | | 1,320,380 | (a) |
Raiffeisen Bank International AG | | | | | | | | | | | 24,764 | | | | 712,102 | (a) |
Resona Holdings Inc. | | | | | | | | | | | 170,000 | | | | 955,000 | (a) |
Royal Bank of Canada | | | | | | | | | | | 9,200 | | | | 737,481 | |
Skandinaviska Enskilda Banken AB, Class A Shares | | | | | | | | | | | 105,879 | | | | 1,181,114 | (a) |
Sumitomo Mitsui Financial Group Inc. | | | | | | | | | | | 51,357 | | | | 2,072,834 | (a) |
Westpac Banking Corp. | | | | | | | | | | | 37,483 | | | | 754,895 | (a) |
Total Banks | | | | | | | | | | | | | | | 34,308,473 | |
Capital Markets — 0.8% | | | | | | | | | | | | | | | | |
Julius Baer Group Ltd. | | | | | | | | | | | 19,460 | | | | 972,608 | (a) |
Natixis SA | | | | | | | | | | | 128,946 | | | | 873,782 | (a) |
UBS Group AG, Registered Shares | | | | | | | | | | | 39,264 | | | | 619,234 | (a) |
Total Capital Markets | | | | | | | | | | | | | | | 2,465,624 | |
Diversified Financial Services — 0.7% | | | | | | | | | | | | | | | | |
AMP Ltd. | | | | | | | | | | | 333,249 | | | | 768,293 | (a) |
ORIX Corp. | | | | | | | | | | | 75,374 | | | | 1,221,909 | (a) |
Total Diversified Financial Services | | | | | | | | | | | | | | | 1,990,202 | |
Insurance — 7.5% | | | | | | | | | | | | | | | | |
Aegon NV | | | | | | | | | | | 168,044 | | | | 1,090,062 | (a) |
Ageas | | | | | | | | | | | 22,556 | | | | 1,212,306 | (a) |
Allianz SE, Registered Shares | | | | | | | | | | | 13,877 | | | | 3,091,345 | (a) |
ASR Nederland NV | | | | | | | | | | | 19,389 | | | | 924,186 | (a) |
Assicurazioni Generali SpA | | | | | | | | | | | 68,102 | | | | 1,174,199 | (a) |
Aviva PLC | | | | | | | | | | | 183,616 | | | | 1,169,815 | (a) |
See Notes to Financial Statements.
| | |
| 16 | | QS International Equity Fund 2018 Annual Report |
QS International Equity Fund
| | | | | | | | | | | | | | | | |
| Security | | | | | | | | Shares | | | Value | |
Insurance — continued | | | | | | | | | | | | | | | | |
AXA SA | | | | | | | | | | | 82,980 | | | $ | 2,227,851 | (a) |
CNP Assurances | | | | | | | | | | | 35,245 | | | | 848,827 | (a) |
Direct Line Insurance Group PLC | | | | | | | | | | | 246,432 | | | | 1,039,327 | (a) |
Legal & General Group PLC | | | | | | | | | | | 345,855 | | | | 1,180,529 | (a) |
MS&AD Insurance Group Holdings Inc. | | | | | | | | | | | 42,217 | | | | 1,405,641 | (a) |
NN Group NV | | | | | | | | | | | 34,376 | | | | 1,531,355 | (a) |
Prudential PLC | | | | | | | | | | | 28,922 | | | | 663,213 | (a) |
Sompo Holdings Inc. | | | | | | | | | | | 46,122 | | | | 1,964,235 | (a) |
Tokio Marine Holdings Inc. | | | | | | | | | | | 25,431 | | | | 1,261,917 | (a) |
Zurich Insurance Group AG | | | | | | | | | | | 5,085 | | | | 1,605,682 | (a) |
Total Insurance | | | | | | | | | | | | | | | 22,390,490 | |
Total Financials | | | | | | | | | | | | | | | 61,154,789 | |
| Health Care — 9.6% | | | | | | | | | | | | | | | | |
Health Care Equipment & Supplies — 0.8% | | | | | | | | | | | | | | | | |
Koninklijke Philips NV | | | | | | | | | | | 33,498 | | | | 1,525,642 | (a) |
Straumann Holding AG, Registered Shares | | | | | | | | | | | 1,196 | | | | 899,000 | (a) |
Total Health Care Equipment & Supplies | | | | | | | | | | | | | | | 2,424,642 | |
Health Care Providers & Services — 0.6% | | | | | | | | | | | | | | | | |
Miraca Holdings Inc. | | | | | | | | | | | 19,946 | | | | 518,739 | (a) |
Suzuken Co., Ltd. | | | | | | | | | | | 25,762 | | | | 1,222,087 | (a) |
Total Health Care Providers & Services | | | | | | | | | | | | | | | 1,740,826 | |
Life Sciences Tools & Services — 0.8% | | | | | | | | | | | | | | | | |
ICON PLC | | | | | | | | | | | 15,227 | | | | 2,341,151 | * |
Pharmaceuticals — 7.4% | | | | | | | | | | | | | | | | |
Astellas Pharma Inc. | | | | | | | | | | | 50,527 | | | | 881,507 | (a) |
AstraZeneca PLC | | | | | | | | | | | 9,890 | | | | 770,494 | (a) |
Bayer AG, Registered Shares | | | | | | | | | | | 9,910 | | | | 880,338 | (a) |
GlaxoSmithKline PLC | | | | | | | | | | | 109,153 | | | | 2,186,871 | (a) |
H. Lundbeck A/S | | | | | | | | | | | 14,608 | | | | 901,139 | (a) |
Novartis AG, Registered Shares | | | | | | | | | | | 47,307 | | | | 4,075,897 | (a) |
Novo Nordisk A/S, Class B Shares | | | | | | | | | | | 61,239 | | | | 2,882,765 | (a) |
Ono Pharmaceutical Co., Ltd. | | | | | | | | | | | 35,300 | | | | 998,578 | (a) |
Orion OYJ, Class B Shares | | | | | | | | | | | 19,544 | | | | 739,877 | (a) |
Roche Holding AG | | | | | | | | | | | 17,853 | | | | 4,320,056 | (a) |
Sanofi | | | | | | | | | | | 21,058 | | | | 1,878,367 | (a) |
Shionogi & Co., Ltd. | | | | | | | | | | | 23,851 | | | | 1,557,694 | (a) |
Total Pharmaceuticals | | | | | | | | | | | | | | | 22,073,583 | |
Total Health Care | | | | | | | | | | | | | | | 28,580,202 | |
See Notes to Financial Statements.
| | |
| QS International Equity Fund 2018 Annual Report | | 17 |
Schedule of investments (cont’d)
September 30, 2018
QS International Equity Fund
| | | | | | | | | | | | | | | | |
| Security | | | | | | | | Shares | | | Value | |
| Industrials — 13.1% | | | | | | | | | | | | | | | | |
Aerospace & Defense — 0.7% | | | | | | | | | | | | | | | | |
Safran SA | | | | | | | | | | | 15,995 | | | $ | 2,238,567 | (a) |
Airlines — 0.3% | | | | | | | | | | | | | | | | |
Qantas Airways Ltd. | | | | | | | | | | | 183,755 | | | | 780,237 | (a) |
Building Products — 0.4% | | | | | | | | | | | | | | | | |
AGC Inc. | | | | | | | | | | | 26,926 | | | | 1,117,655 | (a) |
Construction & Engineering — 3.1% | | | | | | | | | | | | | | | | |
ACS Actividades de Construccion y Servicios SA | | | | | | | | | | | 32,991 | | | | 1,398,000 | (a) |
China Railway Group Ltd., Class H Shares | | | | | | | | | | | 1,175,000 | | | | 1,158,893 | (a) |
Eiffage SA | | | | | | | | | | | 11,931 | | | | 1,331,232 | (a) |
HOCHTIEF AG | | | | | | | | | | | 5,233 | | | | 867,621 | (a) |
Kajima Corp. | | | | | | | | | | | 49,030 | | | | 712,415 | (a) |
Koninklijke Volkerwessels NV | | | | | | | | | | | 31,906 | | | | 670,296 | (a) |
Obayashi Corp. | | | | | | | | | | | 178,672 | | | | 1,692,371 | (a) |
Taisei Corp. | | | | | | | | | | | 28,421 | | | | 1,295,934 | (a) |
Total Construction & Engineering | | | | | | | | | | | | | | | 9,126,762 | |
Industrial Conglomerates — 0.4% | | | | | | | | | | | | | | | | |
Siemens AG, Registered Shares | | | | | | | | | | | 9,239 | | | | 1,182,998 | (a) |
Machinery — 2.6% | | | | | | | | | | | | | | | | |
Atlas Copco AB, Class A Shares | | | | | | | | | | | 30,398 | | | | 875,094 | (a) |
CNH Industrial NV | | | | | | | | | | | 103,726 | | | | 1,244,076 | (a) |
Epiroc AB, Class A Shares | | | | | | | | | | | 30,398 | | | | 339,610 | *(a) |
Georg Fischer AG, Registered Shares | | | | | | | | | | | 1,183 | | | | 1,336,525 | (a) |
Kurita Water Industries Ltd. | | | | | | | | | | | 35,734 | | | | 1,040,311 | (a) |
Sandvik AB | | | | | | | | | | | 56,601 | | | | 1,004,572 | (a) |
Trelleborg AB, Class B Shares | | | | | | | | | | | 31,878 | | | | 649,575 | (a) |
Volvo AB, Class B Shares | | | | | | | | | | | 64,535 | | | | 1,139,719 | (a) |
Total Machinery | | | | | | | | | | | | | | | 7,629,482 | |
Professional Services — 0.8% | | | | | | | | | | | | | | | | |
Adecco Group AG, Registered Shares | | | | | | | | | | | 14,234 | | | | 746,616 | (a) |
Wolters Kluwer NV | | | | | | | | | | | 27,675 | | | | 1,724,652 | (a) |
Total Professional Services | | | | | | | | | | | | | | | 2,471,268 | |
Road & Rail — 0.4% | | | | | | | | | | | | | | | | |
DSV A/S | | | | | | | | | | | 13,323 | | | | 1,210,671 | (a) |
Trading Companies & Distributors — 3.7% | | | | | | | | | | | | | | | | |
Ferguson PLC | | | | | | | | | | | 16,000 | | | | 1,357,284 | (a) |
ITOCHU Corp. | | | | | | | | | | | 82,439 | | | | 1,509,455 | (a) |
Marubeni Corp. | | | | | | | | | | | 169,198 | | | | 1,549,056 | (a) |
Mitsubishi Corp. | | | | | | | | | | | 85,845 | | | | 2,645,686 | (a) |
See Notes to Financial Statements.
| | |
| 18 | | QS International Equity Fund 2018 Annual Report |
QS International Equity Fund
| | | | | | | | | | | | | | | | |
| Security | | | | | | | | Shares | | | Value | |
Trading Companies & Distributors — continued | | | | | | | | | | | | | | | | |
Mitsui & Co., Ltd. | | | | | | | | | | | 84,599 | | | $ | 1,503,371 | (a) |
Sumitomo Corp. | | | | | | | | | | | 84,099 | | | | 1,402,204 | (a) |
Toyota Tsusho Corp. | | | | | | | | | | | 26,800 | | | | 1,011,831 | (a) |
Total Trading Companies & Distributors | | | | | | | | | | | | | | | 10,978,887 | |
Transportation Infrastructure — 0.7% | | | | | | | | | | | | | | | | |
Aena SME SA | | | | | | | | | | | 7,831 | | | | 1,354,530 | (a) |
Flughafen Zurich AG, Registered Shares | | | | | | | | | | | 4,246 | | | | 858,326 | (a) |
Total Transportation Infrastructure | | | | | | | | | | | | | | | 2,212,856 | |
Total Industrials | | | | | | | | | | | | | | | 38,949,383 | |
| Information Technology — 5.5% | | | | | | | | | | | | | | | | |
Communications Equipment — 0.5% | | | | | | | | | | | | | | | | |
Telefonaktiebolaget LM Ericsson, Class B Shares | | | | | | | | | | | 168,611 | | | | 1,492,932 | (a) |
Electronic Equipment, Instruments & Components — 0.7% | | | | | | | | | | | | | | | | |
Hitachi Ltd. | | | | | | | | | | | 41,219 | | | | 1,400,687 | (a) |
Nippon Electric Glass Co., Ltd. | | | | | | | | | | | 19,946 | | | | 627,199 | (a) |
Total Electronic Equipment, Instruments & Components | | | | | | | | | | | | | | | 2,027,886 | |
IT Services — 1.3% | | | | | | | | | | | | | | | | |
Capgemini SE | | | | | | | | | | | 12,230 | | | | 1,539,188 | (a) |
Computershare Ltd. | | | | | | | | | | | 82,527 | | | | 1,185,547 | (a) |
Fujitsu Ltd. | | | | | | | | | | | 16,537 | | | | 1,177,838 | (a) |
Total IT Services | | | | | | | | | | | | | | | 3,902,573 | |
Semiconductors & Semiconductor Equipment — 1.4% | | | | | | | | | | | | | | | | |
ASML Holding NV | | | | | | | | | | | 12,992 | | | | 2,426,023 | (a) |
STMicroelectronics NV | | | | | | | | | | | 45,019 | | | | 818,973 | (a) |
Tokyo Electron Ltd. | | | | | | | | | | | 7,312 | | | | 1,003,646 | (a) |
Total Semiconductors & Semiconductor Equipment | | | | | | | | | | | | | | | 4,248,642 | |
Software — 1.2% | | | | | | | | | | | | | | | | |
Check Point Software Technologies Ltd. | | | | | | | | | | | 12,816 | | | | 1,508,059 | * |
Constellation Software Inc. | | | | | | | | | | | 1,327 | | | | 975,866 | |
SAP SE | | | | | | | | | | | 9,828 | | | | 1,209,545 | (a) |
Total Software | | | | | | | | | | | | | | | 6,319,401 | |
Technology Hardware, Storage & Peripherals — 0.4% | | | | | | | | | | | | | | | | |
Logitech International SA, Registered Shares | | | | | | | | | | | 24,689 | | | | 1,103,315 | (a) |
Total Information Technology | | | | | | | | | | | | | | | 16,468,818 | |
| Materials — 9.0% | | | | | | | | | | | | | | | | |
Chemicals — 3.3% | | | | | | | | | | | | | | | | |
BASF SE | | | | | | | | | | | 25,963 | | | | 2,307,349 | (a) |
China BlueChemical Ltd., Class H Shares | | | | | | | | | | | 2,410,000 | | | | 976,262 | (a) |
Covestro AG | | | | | | | | | | | 26,766 | �� | | | 2,169,772 | (a) |
Daicel Corp. | | | | | | | | | | | 79,946 | | | | 929,005 | (a) |
Methanex Corp. | | | | | | | | | | | 12,328 | | | | 973,145 | |
See Notes to Financial Statements.
| | |
| QS International Equity Fund 2018 Annual Report | | 19 |
Schedule of investments (cont’d)
September 30, 2018
QS International Equity Fund
| | | | | | | | | | | | | | | | |
| Security | | | | | | | | Shares | | | Value | |
Chemicals —continued | | | | | | | | | | | | | | | | |
Nitto Denko Corp. | | | | | | | | | | | 12,600 | | | $ | 944,641 | (a) |
OCI Co., Ltd. | | | | | | | | | | | 6,907 | | | | 684,995 | (a) |
Sika AG | | | | | | | | | | | 6,352 | | | | 923,691 | (a) |
Total Chemicals | | | | | | | | | | | | | | | 9,908,860 | |
Metals & Mining — 4.4% | | | | | | | | | | | | | | | | |
Anglo American PLC | | | | | | | | | | | 110,892 | | | | 2,483,929 | (a) |
ArcelorMittal | | | | | | | | | | | 40,249 | | | | 1,248,018 | (a) |
BHP Billiton Ltd. | | | | | | | | | | | 41,282 | | | | 1,027,617 | (a) |
BHP Billiton PLC | | | | | | | | | | | 46,177 | | | | 1,003,491 | (a) |
BlueScope Steel Ltd. | | | | | | | | | | | 70,256 | | | | 859,752 | (a) |
Fortescue Metals Group Ltd. | | | | | | | | | | | 197,111 | | | | 558,604 | (a) |
Jindal Steel & Power Ltd. | | | | | | | | | | | 590,982 | | | | 1,599,125 | *(a) |
Rio Tinto PLC | | | | | | | | | | | 63,790 | | | | 3,218,340 | (a) |
South32 Ltd. | | | | | | | | | | | 456,600 | | | | 1,288,366 | (a) |
Total Metals & Mining | | | | | | | | | | | | | | | 13,287,242 | |
Paper & Forest Products — 1.3% | | | | | | | | | | | | | | | | |
Oji Holdings Corp. | | | | | | | | | | | 167,867 | | | | 1,218,845 | (a) |
UPM-Kymmene OYJ | | | | | | | | | | | 66,147 | | | | 2,591,673 | (a) |
Total Paper & Forest Products | | | | | | | | | | | | | | | 3,810,518 | |
Total Materials | | | | | | | | | | | | | | | 27,006,620 | |
| Real Estate — 3.5% | | | | | | | | | | | | | | | | |
Equity Real Estate Investment Trusts (REITs) — 1.3% | | | | | | | | | | | | | | | | |
Mirvac Group | | | | | | | | | | | 661,147 | | | | 1,151,659 | (a) |
Scentre Group | | | | | | | | | | | 365,107 | | | | 1,043,460 | (a) |
Stockland | | | | | | | | | | | 311,144 | | | | 931,209 | (a) |
Vicinity Centres | | | | | | | | | | | 396,839 | | | | 751,481 | (a) |
Total Equity Real Estate Investment Trusts (REITs) | | | | | | | | | | | | | | | 3,877,809 | |
Real Estate Management & Development — 2.2% | | | | | | | | | | | | | | | | |
China Overseas Land & Investment Ltd. | | | | | | | | | | | 240,000 | | | | 751,573 | (a) |
CK Asset Holdings Ltd. | | | | | | | | | | | 172,037 | | | | 1,283,791 | (a) |
Kerry Properties Ltd. | | | | | | | | | | | 275,902 | | | | 935,984 | (a) |
Sun Hung Kai Properties Ltd. | | | | | | | | | | | 66,482 | | | | 968,412 | (a) |
Swire Pacific Ltd., Class A Shares | | | | | | | | | | | 80,000 | | | | 876,530 | (a) |
Tokyu Fudosan Holdings Corp. | | | | | | | | | | | 127,900 | | | | 891,499 | (a) |
Wheelock & Co., Ltd. | | | | | | | | | | | 159,558 | | | | 957,200 | (a) |
Total Real Estate Management & Development | | | | | | | | | | | | | | | 6,664,989 | |
Total Real Estate | | | | | | | | | | | | | | | 10,542,798 | |
See Notes to Financial Statements.
| | |
| 20 | | QS International Equity Fund 2018 Annual Report |
QS International Equity Fund
| | | | | | | | | | | | | | | | |
| Security | | | | | | | | Shares | | | Value | |
| Utilities — 4.2% | | | | | | | | | | | | | | | | |
Electric Utilities — 1.6% | | | | | | | | | | | | | | | | |
Chubu Electric Power Co. Inc. | | | | | | | | | | | 70,472 | | | $ | 1,065,976 | (a) |
Enel SpA | | | | | | | | | | | 288,693 | | | | 1,475,216 | (a) |
PGE Polska Grupa Energetyczna SA | | | | | | | | | | | 259,476 | | | | 669,812 | *(a) |
Verbund AG | | | | | | | | | | | 32,540 | | | | 1,601,666 | (a) |
Total Electric Utilities | | | | | | | | | | | | | | | 4,812,670 | |
Gas Utilities — 0.3% | | | | | | | | | | | | | | | | |
Osaka Gas Co., Ltd. | | | | | | | | | | | 47,368 | | | | 923,943 | (a) |
Multi-Utilities — 2.3% | | | | | | | | | | | | | | | | |
AGL Energy Ltd. | | | | | | | | | | | 71,171 | | | | 1,005,233 | (a) |
E.ON SE | | | | | | | | | | | 116,887 | | | | 1,191,548 | (a) |
Engie SA | | | | | | | | | | | 90,627 | | | | 1,331,214 | (a) |
National Grid PLC | | | | | | | | | | | 133,108 | | | | 1,372,528 | (a) |
RWE AG | | | | | | | | | | | 39,538 | | | | 975,285 | (a) |
Veolia Environnement SA | | | | | | | | | | | 44,346 | | | | 884,596 | (a) |
Total Multi-Utilities | | | | | | | | | | | | | | | 6,760,404 | |
Total Utilities | | | | | | | | | | | | | | | 12,497,017 | |
Total Investments before Short-Term Investments (Cost — $261,557,592) | | | | | | | | 291,540,400 | |
| | | | |
| | | | | | Rate | | | | | | | |
| Short-Term Investments — 1.5% | | | | | | | | | | | | | | | | |
Invesco Treasury Portfolio, Institutional Class (Cost — $4,360,473) | | | | | | | 2.042% | | | | 4,360,473 | | | | 4,360,473 | |
Total Investments — 99.2% (Cost — $265,918,065) | | | | | | | | 295,900,873 | |
Other Assets in Excess of Liabilities — 0.8% | | | | | | | | 2,336,798 | |
Total Net Assets — 100.0% | | | | | | | $ | 298,237,671 | |
| * | Non-income producing security. |
| (a) | Security is valued in good faith in accordance with procedures approved by the Board of Trustees (Note 1). |
| | |
Abbreviations used in this schedule: |
| ADR | | — American Depositary Receipts |
| CVA | | — Certificaaten van aandelen (Share Certificates) |
See Notes to Financial Statements.
| | |
| QS International Equity Fund 2018 Annual Report | | 21 |
Schedule of investments (cont’d)
September 30, 2018
QS International Equity Fund
| | | | |
| Summary of Investments by Country** (unaudited) | | | |
| Japan | | | 25.0 | % |
| United Kingdom | | | 11.3 | |
| Switzerland | | | 8.8 | |
| Australia | | | 8.2 | |
| France | | | 7.1 | |
| Netherlands | | | 6.3 | |
| Germany | | | 5.2 | |
| Spain | | | 3.3 | |
| Canada | | | 2.8 | |
| Hong Kong | | | 2.3 | |
| Sweden | | | 2.3 | |
| Italy | | | 2.3 | |
| Denmark | | | 2.0 | |
| Israel | | | 1.8 | |
| Austria | | | 1.2 | |
| Finland | | | 1.1 | |
| China | | | 1.0 | |
| Belgium | | | 0.9 | |
| South Africa | | | 0.8 | |
| South Korea | | | 0.8 | |
| United States | | | 0.8 | |
| Singapore | | | 0.8 | |
| India | | | 0.5 | |
| Luxembourg | | | 0.4 | |
| Portugal | | | 0.4 | |
| Mexico | | | 0.3 | |
| Taiwan | | | 0.3 | |
| Malta | | | 0.3 | |
| Poland | | | 0.2 | |
| Short-Term Investments | | | 1.5 | |
| | | | 100.0 | % |
| ** | As a percentage of total investments. Please note that the Fund holdings are as of September 30, 2018 and are subject to change. |
See Notes to Financial Statements.
| | |
| 22 | | QS International Equity Fund 2018 Annual Report |
Statement of assets and liabilities
September 30, 2018
| | | | |
| |
| Assets: | | | | |
Investments, at value (Cost — $265,918,065) | | $ | 295,900,873 | |
Foreign currency, at value (Cost — $488,805) | | | 484,230 | |
Dividends and interest receivable | | | 1,989,306 | |
Receivable for Fund shares sold | | | 292,551 | |
Other assets | | | 142,687 | |
Prepaid expenses | | | 54,645 | |
Total Assets | | | 298,864,292 | |
| |
| Liabilities: | | | | |
Investment management fee payable | | | 170,637 | |
Payable for Fund shares repurchased | | | 99,180 | |
Service and/or distribution fees payable | | | 32,125 | |
Trustees’ fees payable | | | 150,207 | |
Accrued expenses | | | 174,472 | |
Total Liabilities | | | 626,621 | |
| Total Net Assets | | $ | 298,237,671 | |
| |
| Net Assets: | | | | |
Par value (Note 7) | | $ | 180 | |
Paid-in capital in excess of par value | | | 266,472,492 | |
Undistributed net investment income | | | 5,648,179 | |
Accumulated net realized loss on investments and foreign currency transactions | | | (3,854,690) | |
Net unrealized appreciation on investments and foreign currencies | | | 29,971,510 | |
| Total Net Assets | | $ | 298,237,671 | |
See Notes to Financial Statements.
| | |
| QS International Equity Fund 2018 Annual Report | | 23 |
Statement of assets and liabilities (cont’d)
September 30, 2018
| | | | |
| |
| Net Assets: | | | | |
Class A | | | $11,678,458 | |
Class A2 | | | $1,097,910 | |
Class C | | | $31,695,827 | |
Class FI | | | $6,539,822 | |
Class R | | | $4,971,038 | |
Class I | | | $26,067,780 | |
Class IS | | | $216,186,836 | |
| |
| Shares Outstanding: | | | | |
Class A | | | 728,596 | |
Class A2 | | | 68,862 | |
Class C | | | 1,977,930 | |
Class FI | | | 392,891 | |
Class R | | | 300,041 | |
Class I | | | 1,562,595 | |
Class IS | | | 12,977,060 | |
| |
| Net Asset Value: | | | | |
Class A (and redemption price) | | | $16.03 | |
Class A2 (and redemption price) | | | $15.94 | |
Class C* | | | $16.02 | |
Class FI (and redemption price) | | | $16.65 | |
Class R (and redemption price) | | | $16.57 | |
Class I (and redemption price) | | | $16.68 | |
Class IS (and redemption price) | | | $16.66 | |
| Maximum Public Offering Price Per Share: | | | | |
Class A (based on maximum initial sales charge of 5.75%) | | | $17.01 | |
Class A2 (based on maximum initial sales charge of 5.75%) | | | $16.91 | |
| * | Redemption price per share is NAV of Class C shares reduced by a 1.00% CDSC if shares are redeemed within one year from purchase payment (Note 2). |
See Notes to Financial Statements.
| | |
| 24 | | QS International Equity Fund 2018 Annual Report |
Statement of operations
For the Year Ended September 30, 2018
| | | | |
| |
| Investment Income: | | | | |
Dividends | | $ | 10,906,339 | |
Interest | | | 55,376 | |
Less: Foreign taxes withheld | | | (1,090,598) | |
Total Investment Income | | | 9,871,117 | |
| |
| Expenses: | | | | |
Investment management fee (Note 2) | | | 2,335,894 | |
Service and/or distribution fees (Notes 2 and 5) | | | 436,406 | |
Registration fees | | | 122,874 | |
Transfer agent fees (Note 5) | | | 107,724 | |
Custody fees | | | 104,094 | |
Fund accounting fees | | | 52,250 | |
Fees recaptured by investment manager (Note 2) | | | 51,629 | |
Trustees’ fees | | | 43,801 | |
Legal fees | | | 41,029 | |
Shareholder reports | | | 40,613 | |
Audit and tax fees | | | 40,284 | |
Insurance | | | 5,720 | |
Miscellaneous expenses | | | 16,254 | |
Total Expenses | | | 3,398,572 | |
Less: Fee waivers and/or expense reimbursements (Notes 2 and 5) | | | (165,230) | |
Net Expenses | | | 3,233,342 | |
| Net Investment Income | | | 6,637,775 | |
|
| Realized and Unrealized Gain (Loss) on Investments and Foreign Currency Transactions (Notes 1 and 3): | |
Net Realized Gain (Loss) From: | | | | |
Investment transactions | | | 13,580,097 | |
Foreign currency transactions | | | (92,163) | |
Net Realized Gain | | | 13,487,934 | |
Change in Net Unrealized Appreciation (Depreciation) From: | | | | |
Investments | | | (18,903,071) | ‡ |
Foreign currencies | | | (17,916) | |
Change in Net Unrealized Appreciation (Depreciation) | | | (18,920,987) | |
| Net Loss on Investments and Foreign Currency Transactions | | | (5,433,053) | |
| Increase in Net Assets From Operations | | $ | 1,204,722 | |
| ‡ | Net of change in accrued foreign capital gains tax of $(196,466). |
See Notes to Financial Statements.
| | |
| QS International Equity Fund 2018 Annual Report | | 25 |
Statements of changes in net assets
| | | | | | | | |
| For the Years Ended September 30, | | 2018 | | | 2017 | |
| | |
| Operations: | | | | | | | | |
Net investment income | | $ | 6,637,775 | | | $ | 6,838,732 | |
Net realized gain | | | 13,487,934 | | | | 33,719,129 | |
Change in net unrealized appreciation (depreciation) | | | (18,920,987) | | | | 24,325,372 | |
Increase in Net Assets From Operations | | | 1,204,722 | | | | 64,883,233 | |
| | |
| Distributions to Shareholders From (Notes 1 and 6): | | | | | | | | |
Net investment income | | | (8,000,010) | | | | (8,200,018) | |
Decrease in Net Assets From Distributions to Shareholders | | | (8,000,010) | | | | (8,200,018) | |
| | |
| Fund Share Transactions (Note 7): | | | | | | | | |
Net proceeds from sale of shares | | | 32,589,241 | | | | 50,049,516 | |
Reinvestment of distributions | | | 7,595,956 | | | | 7,875,708 | |
Cost of shares repurchased | | | (38,915,724) | | | | (117,124,636) | |
Cost of shares redeemed in-kind (Note 8) | | | — | | | | (58,360,792) | |
Increase (Decrease) in Net Assets From Fund Share Transactions | | | 1,269,473 | | | | (117,560,204) | |
Decrease in Net Assets | | | (5,525,815) | | | | (60,876,989) | |
| | |
| Net Assets: | | | | | | | | |
Beginning of year | | | 303,763,486 | | | | 364,640,475 | |
End of year* | | $ | 298,237,671 | | | $ | 303,763,486 | |
*Includes undistributed net investment income of: | | | $5,648,179 | | | | $6,446,551 | |
See Notes to Financial Statements.
| | |
| 26 | | QS International Equity Fund 2018 Annual Report |
Financial highlights
| | | | | | | | | | | | | | | | | | | | | | | | |
For a share of each class of beneficial interest outstanding throughout each year ended September 30,
unless otherwise noted: | |
| Class A Shares1 | | 2018 | | | 2017 | | | 2016 | | | 2015 | | | 20142 | | | 20133 | |
| | | | | | |
| Net asset value, beginning of year | | | $16.43 | | | | $13.98 | | | | $13.69 | | | | $14.50 | | | | $14.49 | | | | $12.09 | |
| | | | | | |
| Income (loss) from operations: | | | | | | | | | | | | | | | | | | | | | | | | |
Net investment income | | | 0.31 | | | | 0.26 | | | | 0.24 | | | | 0.27 | | | | 0.27 | | | | 0.22 | |
Net realized and unrealized gain (loss) | | | (0.29) | | | | 2.50 | | | | 0.33 | | | | (0.81) | | | | (0.26) | | | | 2.30 | |
Total income (loss) from operations | | | 0.02 | | | | 2.76 | | | | 0.57 | | | | (0.54) | | | | 0.01 | | | | 2.52 | |
| | | | | | |
| Less distributions from: | | | | | | | | | | | | | | | | | | | | | | | | |
Net investment income | | | (0.42) | | | | (0.31) | | | | (0.28) | | | | (0.27) | | | | — | | | | (0.12) | |
Total distributions | | | (0.42) | | | | (0.31) | | | | (0.28) | | | | (0.27) | | | | — | | | | (0.12) | |
| | | | | | |
| Net asset value, end of year | | | $16.03 | | | | $16.43 | | | | $13.98 | | | | $13.69 | | | | $14.50 | | | | $14.49 | |
Total return4 | | | 0.10 | % | | | 20.16 | % | | | 4.09 | % | | | (3.72) | % | | | 0.07 | % | | | 20.89 | % |
| | | | | | |
| Net assets, end of year (000s) | | | $11,678 | | | | $12,308 | | | | $7,442 | | | | $8,391 | | | | $5,819 | | | | $6,078 | |
| | | | | | |
| Ratios to average net assets: | | | | | | | | | | | | | | | | | | | | | | | | |
Gross expenses | | | 1.34 | %5 | | | 1.24 | % | | | 1.28 | %5 | | | 1.28 | %5 | | | 1.38 | %5,6 | | | 1.37 | %5 |
Net expenses7 | | | 1.29 | 5,8 | | | 1.20 | 8 | | | 1.28 | 5 | | | 1.28 | 5,8 | | | 1.35 | 5,6,8 | | | 1.35 | 5,8 |
Net investment income | | | 1.90 | | | | 1.76 | | | | 1.76 | | | | 1.87 | | | | 2.45 | 6 | | | 1.66 | |
| | | | | | |
| Portfolio turnover rate | | | 27 | % | | | 49 | %9 | | | 71 | % | | | 54 | % | | | 44 | % | | | 55 | % |
| 1 | Per share amounts have been calculated using the average shares method. |
| 2 | For the period January 1, 2014 through September 30, 2014. |
| 3 | For the year ended December 31. |
| 4 | Performance figures, exclusive of sales charges, may reflect compensating balance arrangements, fee waivers and/or expense reimbursements. In the absence of compensating balance arrangements, fee waivers and/or expense reimbursements, the total return would have been lower. Past performance is no guarantee of future results. Total returns for periods of less than one year are not annualized. |
| 5 | Reflects recapture of expenses waived/reimbursed from prior fiscal years. |
| 7 | As a result of an expense limitation arrangement, effective August 3, 2015, the ratio of total annual fund operating expenses, other than interest, brokerage commissions, dividend expense on short sales, taxes, extraordinary expenses and acquired fund fees and expenses, to average net assets of Class A shares did not exceed 1.30%. This expense limitation arrangement cannot be terminated prior to December 31, 2019 without the Board of Trustees’ consent. Prior to August 3, 2015, the ratio of total annual fund operating expenses, other than interest, brokerage commissions, dividend expense on short sales, taxes, extraordinary expenses and acquired fund fees and expenses, to average net assets of Class A shares did not exceed 1.35%. |
| 8 | Reflects fee waivers and/or expense reimbursements. |
| 9 | Excludes securities delivered as a result of a redemption in-kind. |
See Notes to Financial Statements.
| | |
| QS International Equity Fund 2018 Annual Report | | 27 |
Financial highlights (cont’d)
| | | | | | | | | | | | |
For a share of each class of beneficial interest outstanding throughout each year ended September 30,
unless otherwise noted: | |
| Class A2 Shares1 | | 2018 | | | 2017 | | | 20162 | |
| | | |
| Net asset value, beginning of year | | | $16.35 | | | | $13.98 | | | | $13.60 | |
| | | |
| Income (loss) from operations: | | | | | | | | | | | | |
Net investment income | | | 0.33 | | | | 0.28 | | | | 0.09 | |
Net realized and unrealized gain (loss) | | | (0.34) | | | | 2.45 | | | | 0.29 | |
Total income (loss) from operations | | | (0.01) | | | | 2.73 | | | | 0.38 | |
| | | |
| Less distributions from: | | | | | | | | | | | | |
Net investment income | | | (0.40) | | | | (0.36) | | | | — | |
Total distributions | | | (0.40) | | | | (0.36) | | | | — | |
| | | |
| Net asset value, end of year | | | $15.94 | | | | $16.35 | | | | $13.98 | |
Total return3 | | | (0.10) | % | | | 20.06 | % | | | 2.79 | % |
| | | |
| Net assets, end of year (000s) | | | $1,098 | | | | $428 | | | | $123 | |
| | | |
| Ratios to average net assets: | | | | | | | | | | | | |
Gross expenses | | | 1.57 | %4 | | | 1.47 | % | | | 1.13 | %5 |
Net expenses6 | | | 1.50 | 4,7 | | | 1.43 | 7 | | | 1.13 | 5 |
Net investment income | | | 2.02 | | | | 1.88 | | | | 2.06 | 5 |
| | | |
| Portfolio turnover rate | | | 27 | % | | | 49 | %8 | | | 71 | %9 |
| 1 | Per share amounts have been calculated using the average shares method. |
| 2 | For the period May 31, 2016 (inception date) to September 30, 2016. |
| 3 | Performance figures, exclusive of sales charges, may reflect compensating balance arrangements, fee waivers and/or expense reimbursements. In the absence of compensating balance arrangements, fee waivers and/or expense reimbursements, the total return would have been lower. Past performance is no guarantee of future results. Total returns for periods of less than one year are not annualized. |
| 4 | Reflects recapture of expenses waived/reimbursed from prior fiscal years. |
| 6 | As a result of an expense limitation arrangement, the ratio of total annual fund operating expenses, other than interest, brokerage commissions, dividend expense on short sales, taxes, extraordinary expenses and acquired fund fees and expenses, to average net assets of Class A2 shares did not exceed 1.50%. This expense limitation arrangement cannot be terminated prior to December 31, 2019 without the Board of Trustees’ consent. |
| 7 | Reflects fee waivers and/or expense reimbursements. |
| 8 | Excludes securities delivered as a result of a redemption in-kind. |
| 9 | For the year ended September 30, 2016. |
See Notes to Financial Statements.
| | |
| 28 | | QS International Equity Fund 2018 Annual Report |
| | | | | | | | | | | | | | | | | | | | | | | | |
For a share of each class of beneficial interest outstanding throughout each year ended September 30,
unless otherwise noted: | |
| Class C Shares1 | | 2018 | | | 2017 | | | 2016 | | | 2015 | | | 20142 | | | 20133 | |
| | | | | | |
| Net asset value, beginning of year | | | $16.40 | | | | $13.94 | | | | $13.61 | | | | $14.43 | | | | $14.50 | | | | $12.12 | |
| | | | | | |
| Income (loss) from operations: | | | | | | | | | | | | | | | | | | | | | | | | |
Net investment income | | | 0.18 | | | | 0.13 | | | | 0.14 | | | | 0.15 | | | | 0.19 | | | | 0.13 | |
Net realized and unrealized gain (loss) | | | (0.29) | | | | 2.51 | | | | 0.32 | | | | (0.79) | | | | (0.26) | | | | 2.28 | |
Total income (loss) from operations | | | (0.11) | | | | 2.64 | | | | 0.46 | | | | (0.64) | | | | (0.07) | | | | 2.41 | |
| | | | | | |
| Less distributions from: | | | | | | | | | | | | | | | | | | | | | | | | |
Net investment income | | | (0.27) | | | | (0.18) | | | | (0.13) | | | | (0.18) | | | | — | | | | (0.03) | |
Total distributions | | | (0.27) | | | | (0.18) | | | | (0.13) | | | | (0.18) | | | | — | | | | (0.03) | |
| | | | | | |
| Net asset value, end of year | | | $16.02 | | | | $16.40 | | | | $13.94 | | | | $13.61 | | | | $14.43 | | | | $14.50 | |
Total return4 | | | (0.72) | % | | | 19.17 | % | | | 3.36 | % | | | (4.50) | % | | | (0.48) | % | | | 19.94 | % |
| | | | | | |
| Net assets, end of year (000s) | | | $31,696 | | | | $38,169 | | | | $40,766 | | | | $47,999 | | | | $60,174 | | | | $68,862 | |
| | | | | | |
| Ratios to average net assets: | | | | | | | | | | | | | | | | | | | | | | | | |
Gross expenses | | | 2.10 | %5 | | | 2.12 | %5 | | | 2.11 | %5 | | | 2.11 | %5 | | | 2.17 | %6 | | | 2.07 | % |
Net expenses7 | | | 2.05 | 5,8 | | | 2.05 | 5,8 | | | 2.05 | 5,8 | | | 2.09 | 5,8 | | | 2.10 | 6,8 | | | 2.07 | |
Net investment income | | | 1.08 | | | | 0.88 | | | | 1.03 | | | | 1.03 | | | | 1.73 | 6 | | | 0.96 | |
| | | | | | |
| Portfolio turnover rate | | | 27 | % | | | 49 | %9 | | | 71 | % | | | 54 | % | | | 44 | % | | | 55 | % |
| 1 | Per share amounts have been calculated using the average shares method. |
| 2 | For the period January 1, 2014 through September 30, 2014. |
| 3 | For the year ended December 31. |
| 4 | Performance figures, exclusive of CDSC, may reflect compensating balance arrangements, fee waivers and/or expense reimbursements. In the absence of compensating balance arrangements, fee waivers and/or expense reimbursements, the total return would have been lower. Past performance is no guarantee of future results. Total returns for periods of less than one year are not annualized. |
| 5 | Reflects recapture of expenses waived/reimbursed from prior fiscal years. |
| 7 | As a result of an expense limitation arrangement, effective August 3, 2015, the ratio of total annual fund operating expenses, other than interest, brokerage commissions, dividend expense on short sales, taxes, extraordinary expenses and acquired fund fees and expenses, to average net assets of Class C shares did not exceed 2.05%. This expense limitation arrangement cannot be terminated prior to December 31, 2019 without the Board of Trustees’ consent. Prior to August 3, 2015, the ratio of total annual fund operating expenses, other than interest, brokerage commissions, dividend expense on short sales, taxes, extraordinary expenses and acquired fund fees and expenses, to average net assets of Class C shares did not exceed 2.10%. |
| 8 | Reflects fee waivers and/or expense reimbursements. |
| 9 | Excludes securities delivered as a result of a redemption in-kind. |
See Notes to Financial Statements.
| | |
| QS International Equity Fund 2018 Annual Report | | 29 |
Financial highlights (cont’d)
| | | | | | | | | | | | | | | | | | | | | | | | |
For a share of each class of beneficial interest outstanding throughout each year ended September 30,
unless otherwise noted: | |
| Class FI Shares1 | | 2018 | | | 2017 | | | 2016 | | | 2015 | | | 20142 | | | 20133 | |
| | | | | | |
| Net asset value, beginning of year | | | $17.05 | | | | $14.50 | | | | $14.16 | | | | $15.00 | | | | $14.99 | | | | $12.50 | |
| | | | | | |
| Income (loss) from operations: | | | | | | | | | | | | | | | | | | | | | | | | |
Net investment income | | | 0.30 | | | | 0.26 | | | | 0.24 | | | | 0.28 | | | | 0.28 | | | | 0.24 | |
Net realized and unrealized gain (loss) | | | (0.28) | | | | 2.59 | | | | 0.34 | | | | (0.85) | | | | (0.27) | | | | 2.36 | |
Total income (loss) from operations | | | 0.02 | | | | 2.85 | | | | 0.58 | | | | (0.57) | | | | 0.01 | | | | 2.60 | |
| | | | | | |
| Less distributions from: | | | | | | | | | | | | | | | | | | | | | | | | |
Net investment income | | | (0.42) | | | | (0.30) | | | | (0.24) | | | | (0.27) | | | | — | | | | (0.11) | |
Total distributions | | | (0.42) | | | | (0.30) | | | | (0.24) | | | | (0.27) | | | | — | | | | (0.11) | |
| | | | | | |
| Net asset value, end of year | | | $16.65 | | | | $17.05 | | | | $14.50 | | | | $14.16 | | | | $15.00 | | | | $14.99 | |
Total return4 | | | 0.08 | % | | | 20.12 | % | | | 4.06 | % | | | (3.78) | % | | | 0.07 | % | | | 20.86 | % |
| | | | | | |
| Net assets, end of year (000s) | | | $6,540 | | | | $8,469 | | | | $6,542 | | | | $7,804 | | | | $9,225 | | | | $9,551 | |
| | | | | | |
| Ratios to average net assets: | | | | | | | | | | | | | | | | | | | | | | | | |
Gross expenses | | | 1.35 | %5 | | | 1.33 | %5 | | | 1.31 | %5 | | | 1.36 | %5 | | | 1.43 | %6 | | | 1.41 | %5 |
Net expenses7,8 | | | 1.30 | 5 | | | 1.28 | 5 | | | 1.29 | 5 | | | 1.34 | 5 | | | 1.35 | 6 | | | 1.35 | 5 |
Net investment income | | | 1.74 | | | | 1.69 | | | | 1.72 | | | | 1.82 | | | | 2.48 | 6 | | | 1.75 | |
| | | | | | |
| Portfolio turnover rate | | | 27 | % | | | 49 | %9 | | | 71 | % | | | 54 | % | | | 44 | % | | | 55 | % |
| 1 | Per share amounts have been calculated using the average shares method. |
| 2 | For the period January 1, 2014 through September 30, 2014. |
| 3 | For the year ended December 31. |
| 4 | Performance figures may reflect compensating balance arrangements, fee waivers and/or expense reimbursements. In the absence of compensating balance arrangements, fee waivers and/or expense reimbursements, the total return would have been lower. Past performance is no guarantee of future results. Total returns for periods of less than one year are not annualized. |
| 5 | Reflects recapture of expenses waived/reimbursed from prior fiscal years. |
| 7 | Reflects fee waivers and/or expense reimbursements. |
| 8 | As a result of an expense limitation arrangement, effective August 3, 2015, the ratio of total annual fund operating expenses, other than interest, brokerage commissions, dividend expense on short sales, taxes, extraordinary expenses and acquired fund fees and expenses, to average net assets of Class FI shares did not exceed 1.30%. This expense limitation arrangement cannot be terminated prior to December 31, 2019 without the Board of Trustees’ consent. Prior to August 3, 2015, the ratio of total annual fund operating expenses, other than interest, brokerage commissions, dividend expense on short sales, taxes, extraordinary expenses and acquired fund fees and expenses, to average net assets of Class FI shares did not exceed 1.35%. |
| 9 | Excludes securities delivered as a result of a redemption in-kind. |
See Notes to Financial Statements.
| | |
| 30 | | QS International Equity Fund 2018 Annual Report |
| | | | | | | | | | | | | | | | | | | | | | | | |
For a share of each class of beneficial interest outstanding throughout each year ended September 30,
unless otherwise noted: | |
| Class R Shares1 | | 2018 | | | 2017 | | | 2016 | | | 2015 | | | 20142 | | | 20133 | |
| | | | | | |
| Net asset value, beginning of year | | | $17.00 | | | | $14.47 | | | | $14.17 | | | | $14.96 | | | | $14.98 | | | | $12.50 | |
| | | | | | |
| Income (loss) from operations: | | | | | | | | | | | | | | | | | | | | | | | | |
Net investment income | | | 0.31 | | | | 0.28 | | | | 0.22 | | | | 0.28 | | | | 0.30 | | | | 0.20 | |
Net realized and unrealized gain (loss) | | | (0.33) | | | | 2.53 | | | | 0.32 | | | | (0.88) | | | | (0.32) | | | | 2.36 | |
Total income (loss) from operations | | | (0.02) | | | | 2.81 | | | | 0.54 | | | | (0.60) | | | | (0.02) | | | | 2.56 | |
| | | | | | |
| Less distributions from: | | | | | | | | | | | | | | | | | | | | | | | | |
Net investment income | | | (0.41) | | | | (0.28) | | | | (0.24) | | | | (0.19) | | | | — | | | | (0.08) | |
Total distributions | | | (0.41) | | | | (0.28) | | | | (0.24) | | | | (0.19) | | | | — | | | | (0.08) | |
| | | | | | |
| Net asset value, end of year | | | $16.57 | | | | $17.00 | | | | $14.47 | | | | $14.17 | | | | $14.96 | | | | $14.98 | |
Total return4 | | | (0.14) | % | | | 19.79 | % | | | 3.83 | % | | | (4.03) | % | | | (0.13) | % | | | 20.55 | % |
| | | | | | |
| Net assets, end of year (000s) | | | $4,971 | | | | $3,228 | | | | $539 | | | | $475 | | | | $285 | | | | $547 | |
| | | | | | |
| Ratios to average net assets: | | | | | | | | | | | | | | | | | | | | | | | | |
Gross expenses | | | 1.65 | %5 | | | 1.64 | %5 | | | 1.68 | %5 | | | 1.62 | %5 | | | 1.86 | %5,6 | | | 1.82 | % |
Net expenses7,8 | | | 1.55 | 5 | | | 1.54 | 5 | | | 1.55 | 5 | | | 1.59 | 5 | | | 1.60 | 5,6 | | | 1.60 | |
Net investment income | | | 1.80 | | | | 1.76 | | | | 1.58 | | | | 1.84 | | | | 2.62 | 6 | | | 1.49 | |
| | | | | | |
| Portfolio turnover rate | | | 27 | % | | | 49 | %9 | | | 71 | % | | | 54 | % | | | 44 | % | | | 55 | % |
| 1 | Per share amounts have been calculated using the average shares method. |
| 2 | For the period January 1, 2014 through September 30, 2014. |
| 3 | For the year ended December 31. |
| 4 | Performance figures may reflect compensating balance arrangements, fee waivers and/or expense reimbursements. In the absence of compensating balance arrangements, fee waivers and/or expense reimbursements, the total return would have been lower. Past performance is no guarantee of future results. Total returns of less than one year are not annualized. |
| 5 | Reflects recapture of expenses waived/reimbursed from prior fiscal years. |
| 7 | Reflects fee waivers and/or expense reimbursements. |
| 8 | As a result of an expense limitation arrangement, effective August 3, 2015, the ratio of total annual fund operating expenses, other than interest, brokerage commissions, dividend expense on short sales, taxes, extraordinary expenses and acquired fund fees and expenses, to average net assets of Class R shares did not exceed 1.55%. This expense limitation arrangement cannot be terminated prior to December 31, 2019 without the Board of Trustees’ consent. Prior to August 3, 2015, the ratio of total annual fund operating expenses, other than interest, brokerage commissions, dividend expense on short sales, taxes, extraordinary expenses and acquired fund fees and expenses, to average net assets of Class R shares did not exceed 1.60%. |
| 9 | Excludes securities delivered as a result of a redemption in-kind. |
See Notes to Financial Statements.
| | |
| QS International Equity Fund 2018 Annual Report | | 31 |
Financial highlights (cont’d)
| | | | | | | | | | | | | | | | | | | | | | | | |
For a share of each class of beneficial interest outstanding throughout each year ended September 30,
unless otherwise noted: | |
| Class I Shares1 | | 2018 | | | 2017 | | | 2016 | | | 2015 | | | 20142 | | | 20133 | |
| | | | | | |
| Net asset value, beginning of year | | | $17.06 | | | | $14.52 | | | | $14.18 | | | | $15.00 | | | | $14.97 | | | | $12.48 | |
| | | | | | |
| Income (loss) from operations: | | | | | | | | | | | | | | | | | | | | | | | | |
Net investment income | | | 0.39 | | | | 0.31 | | | | 0.31 | | | | 0.34 | | | | 0.32 | | | | 0.28 | |
Net realized and unrealized gain (loss) | | | (0.32) | | | | 2.58 | | | | 0.33 | | | | (0.85) | | | | (0.27) | | | | 2.38 | |
Total income (loss) from operations | | | 0.07 | | | | 2.89 | | | | 0.64 | | | | (0.51) | | | | 0.05 | | | | 2.66 | |
| | | | | | |
| Less distributions from: | | | | | | | | | | | | | | | | | | | | | | | | |
Net investment income | | | (0.45) | | | | (0.35) | | | | (0.30) | | | | (0.31) | | | | (0.02) | | | | (0.17) | |
Total distributions | | | (0.45) | | | | (0.35) | | | | (0.30) | | | | (0.31) | | | | (0.02) | | | | (0.17) | |
| | | | | | |
| Net asset value, end of year | | | $16.68 | | | | $17.06 | | | | $14.52 | | | | $14.18 | | | | $15.00 | | | | $14.97 | |
Total return4 | | | 0.41 | % | | | 20.44 | % | | | 4.54 | % | | | (3.47) | % | | | 0.32 | % | | | 21.25 | % |
| | | | | | |
| Net assets, end of year (000s) | | | $26,068 | | | | $23,554 | | | | $22,455 | | | | $20,100 | | | | $19,812 | | | | $21,575 | |
| | | | | | |
| Ratios to average net assets: | | | | | | | | | | | | | | | | | | | | | | | | |
Gross expenses | | | 1.03 | % | | | 1.02 | % | | | 0.97 | % | | | 0.96 | % | | | 1.03 | %5 | | | 0.98 | % |
Net expenses6 | | | 0.95 | 7 | | | 0.95 | 7 | | | 0.95 | 7 | | | 0.96 | | | | 1.03 | 5 | | | 0.98 | |
Net investment income | | | 2.27 | | | | 2.01 | | | | 2.19 | | | | 2.22 | | | | 2.84 | 5 | | | 2.07 | |
| | | | | | |
| Portfolio turnover rate | | | 27 | % | | | 49 | %8 | | | 71 | % | | | 54 | % | | | 44 | % | | | 55 | % |
| 1 | Per share amounts have been calculated using the average shares method. |
| 2 | For the period January 1, 2014 through September 30, 2014. |
| 3 | For the year ended December 31. |
| 4 | Performance figures may reflect compensating balance arrangements, fee waivers and/or expense reimbursements. In the absence of compensating balance arrangements, fee waivers and/or expense reimbursements, the total return would have been lower. Past performance is no guarantee of future results. Total returns of less than one year are not annualized. |
| 6 | As a result of an expense limitation arrangement, effective August 3, 2015, the ratio of total annual fund operating expenses, other than interest, brokerage commissions, dividend expense on short sales, taxes, extraordinary expenses and acquired fund fees and expenses, to average net assets of Class I shares did not exceed 0.95%. This expense limitation arrangement cannot be terminated prior to December 31, 2019 without the Board of Trustees’ consent. Prior to August 3, 2015, the ratio of total annual fund operating expenses, other than interest, brokerage commissions, dividend expense on short sales, taxes, extraordinary expenses and acquired fund fees and expenses, to average net assets of Class I shares did not exceed 1.10%. |
| 7 | Reflects fee waivers and/or expense reimbursements. |
| 8 | Excludes securities delivered as a result of a redemption in-kind. |
See Notes to Financial Statements.
| | |
| 32 | | QS International Equity Fund 2018 Annual Report |
| | | | | | | | | | | | | | | | | | | | | | | | |
For a share of each class of beneficial interest outstanding throughout each year ended September 30,
unless otherwise noted: | |
| Class IS Shares1 | | 2018 | | | 2017 | | | 2016 | | | 2015 | | | 20142 | | | 20133 | |
| | | | | | |
| Net asset value, beginning of year | | | $17.04 | | | | $14.50 | | | | $14.16 | | | | $14.98 | | | | $14.94 | | | | $12.46 | |
| | | | | | |
| Income (loss) from operations: | | | | | | | | | | | | | | | | | | | | | | | | |
Net investment income | | | 0.40 | | | | 0.32 | | | | 0.31 | | | | 0.34 | | | | 0.33 | | | | 0.27 | |
Net realized and unrealized gain (loss) | | | (0.31) | | | | 2.59 | | | | 0.34 | | | | (0.84) | | | | (0.26) | | | | 2.39 | |
Total income (loss) from operations | | | 0.09 | | | | 2.91 | | | | 0.65 | | | | (0.50) | | | | 0.07 | | | | 2.66 | |
| | | | | | |
| Less distributions from: | | | | | | | | | | | | | | | | | | | | | | | | |
Net investment income | | | (0.47) | | | | (0.37) | | | | (0.31) | | | | (0.32) | | | | (0.03) | | | | (0.18) | |
Total distributions | | | (0.47) | | | | (0.37) | | | | (0.31) | | | | (0.32) | | | | (0.03) | | | | (0.18) | |
| | | | | | |
| Net asset value, end of year | | | $16.66 | | | | $17.04 | | | | $14.50 | | | | $14.16 | | | | $14.98 | | | | $14.94 | |
Total return4 | | | 0.50 | % | | | 20.59 | % | | | 4.63 | % | | | (3.37) | % | | | 0.44 | % | | | 21.41 | % |
| | | | | | |
| Net assets, end of year (millions) | | | $216 | | | | $218 | | | | $287 | | | | $252 | | | | $302 | | | | $247 | |
| | | | | | |
| Ratios to average net assets: | | | | | | | | | | | | | | | | | | | | | | | | |
Gross expenses | | | 0.90 | %5 | | | 0.89 | %5 | | | 0.87 | % | | | 0.86 | % | | | 0.91 | %5,6 | | | 0.89 | %5 |
Net expenses7 | | | 0.85 | 5,8 | | | 0.85 | 5,8 | | | 0.85 | 8 | | | 0.86 | 8 | | | 0.91 | 5,6 | | | 0.88 | 5,8 |
Net investment income | | | 2.32 | | | | 2.10 | | | | 2.23 | | | | 2.24 | | | | 2.89 | 6 | | | 1.99 | |
| | | | | | |
| Portfolio turnover rate | | | 27 | % | | | 49 | %9 | | | 71 | % | | | 54 | % | | | 44 | % | | | 55 | % |
| 1 | Per share amounts have been calculated using the average shares method. |
| 2 | For the period January 1, 2014 through September 30, 2014. |
| 3 | For the year ended December 31. |
| 4 | Performance figures may reflect compensating balance arrangements, fee waivers and/or expense reimbursements. In the absence of compensating balance arrangements, fee waivers and/or expense reimbursements, the total return would have been lower. Past performance is no guarantee of future results. Total returns of less than one year are not annualized. |
| 5 | Reflects recapture of expenses waived/reimbursed from prior fiscal years. |
| 7 | As a result of an expense limitation arrangement, effective August 3, 2015, the ratio of total annual fund operating expenses, other than interest, brokerage commissions, dividend expense on short sales, taxes, extraordinary expenses and acquired fund fees and expenses, to average net assets of Class IS shares did not exceed 0.85%. In addition, the ratio of total annual fund operating expenses for Class IS shares did not exceed the ratio of total annual fund operating expenses for Class I shares. These expense limitation arrangements cannot be terminated prior to December 31, 2019 without the Board of Trustees’ consent. Prior to August 3, 2015, the ratio of total annual fund operating expenses for Class IS shares did not exceed the ratio of total annual fund operating expenses for Class I shares. |
| 8 | Reflects fee waivers and/or expense reimbursements. |
| 9 | Excludes securities delivered as a result of a redemption in-kind. |
See Notes to Financial Statements.
| | |
| QS International Equity Fund 2018 Annual Report | | 33 |
Notes to financial statements
1. Organization and significant accounting policies
QS International Equity Fund (the “Fund”) is a separate diversified investment series of Legg Mason Global Asset Management Trust (the “Trust”). The Trust, a Maryland statutory trust, is registered under the Investment Company Act of 1940, as amended (the “1940 Act”), as an open-end management investment company.
The following are significant accounting policies consistently followed by the Fund and are in conformity with U.S. generally accepted accounting principles (“GAAP”). Estimates and assumptions are required to be made regarding assets, liabilities and changes in net assets resulting from operations when financial statements are prepared. Changes in the economic environment, financial markets and any other parameters used in determining these estimates could cause actual results to differ. Subsequent events have been evaluated through the date the financial statements were issued.
(a) Investment valuation. Equity securities for which market quotations are available are valued at the last reported sales price or official closing price on the primary market or exchange on which they trade. The valuations for fixed income securities (which may include, but are not limited to, corporate, government, municipal, mortgage-backed, collateralized mortgage obligations and asset-backed securities) and certain derivative instruments are typically the prices supplied by independent third party pricing services, which may use market prices or broker/dealer quotations or a variety of valuation techniques and methodologies. The independent third party pricing services use inputs that are observable such as issuer details, interest rates, yield curves, prepayment speeds, credit risks/spreads, default rates and quoted prices for similar securities. Prior to December 1, 2017, short-term fixed income securities that would mature in 60 days or less were valued at amortized cost, unless it was determined that using this method would not reflect an investment’s fair value. Investments in open-end funds are valued at the closing net asset value per share of each fund on the day of valuation. When the Fund holds securities or other assets that are denominated in a foreign currency, the Fund will normally use the currency exchange rates as of 4:00 p.m. (Eastern Time). If independent third party pricing services are unable to supply prices for a portfolio investment, or if the prices supplied are deemed by the manager to be unreliable, the market price may be determined by the manager using quotations from one or more broker/dealers or at the transaction price if the security has recently been purchased and no value has yet been obtained from a pricing service or pricing broker. When reliable prices are not readily available, such as when the value of a security has been significantly affected by events after the close of the exchange or market on which the security is principally traded, but before the Fund calculates its net asset value, the Fund values these securities as determined in accordance with procedures approved by the Fund’s Board of Trustees.
The Board of Trustees is responsible for the valuation process and has delegated the supervision of the daily valuation process to the Legg Mason North Atlantic Fund Valuation Committee (the “Valuation Committee”). The Valuation Committee, pursuant to the policies adopted by the Board of Trustees, is responsible for making fair value determinations,
| | |
| 34 | | QS International Equity Fund 2018 Annual Report |
evaluating the effectiveness of the Fund’s pricing policies, and reporting to the Board of Trustees. When determining the reliability of third party pricing information for investments owned by the Fund, the Valuation Committee, among other things, conducts due diligence reviews of pricing vendors, monitors the daily change in prices and reviews transactions among market participants.
The Valuation Committee will consider pricing methodologies it deems relevant and appropriate when making fair value determinations. Examples of possible methodologies include, but are not limited to, multiple of earnings; discount from market of a similar freely traded security; discounted cash-flow analysis; book value or a multiple thereof; risk premium/yield analysis; yield to maturity; and/or fundamental investment analysis. The Valuation Committee will also consider factors it deems relevant and appropriate in light of the facts and circumstances. Examples of possible factors include, but are not limited to, the type of security; the issuer’s financial statements; the purchase price of the security; the discount from market value of unrestricted securities of the same class at the time of purchase; analysts’ research and observations from financial institutions; information regarding any transactions or offers with respect to the security; the existence of merger proposals or tender offers affecting the security; the price and extent of public trading in similar securities of the issuer or comparable companies; and the existence of a shelf registration for restricted securities.
For each portfolio security that has been fair valued pursuant to the policies adopted by the Board of Trustees, the fair value price is compared against the last available and next available market quotations. The Valuation Committee reviews the results of such back testing monthly and fair valuation occurrences are reported to the Board of Trustees quarterly.
The Fund uses valuation techniques to measure fair value that are consistent with the market approach and/or income approach, depending on the type of security and the particular circumstance. The market approach uses prices and other relevant information generated by market transactions involving identical or comparable securities. The income approach uses valuation techniques to discount estimated future cash flows to present value.
GAAP establishes a disclosure hierarchy that categorizes the inputs to valuation techniques used to value assets and liabilities at measurement date. These inputs are summarized in the three broad levels listed below:
| • | | Level 1 — quoted prices in active markets for identical investments |
| • | | Level 2 — other significant observable inputs (including quoted prices for similar investments, interest rates, prepayment speeds, credit risk, etc.) |
| • | | Level 3 — significant unobservable inputs (including the Fund’s own assumptions in determining the fair value of investments) |
| | |
| QS International Equity Fund 2018 Annual Report | | 35 |
Notes to financial statements (cont’d)
The inputs or methodologies used to value securities are not necessarily an indication of the risk associated with investing in those securities.
The following is a summary of the inputs used in valuing the Fund’s assets carried at fair value:
| | | | | | | | | | | | | | | | |
| ASSETS | |
| Description | | Quoted Prices
(Level 1) | | | Other Significant
Observable Inputs
(Level 2) | | | Significant
Unobservable
Inputs
(Level 3) | | | Total | |
| Long-term investments†: | | | | | | | | | | | | | | | | |
Common stocks: | | | | | | | | | | | | | | | | |
Communication services | | $ | 751,707 | | | $ | 15,612,431 | | | | — | | | $ | 16,364,138 | |
Consumer discretionary | | | 4,803,054 | | | | 28,342,936 | | | | — | | | | 33,145,990 | |
Consumer staples | | | 743,570 | | | | 24,717,304 | | | | — | | | | 25,460,874 | |
Energy | | | 830,538 | | | | 20,539,233 | | | | — | | | | 21,369,771 | |
Financials | | | 1,651,878 | | | | 59,502,911 | | | | — | | | | 61,154,789 | |
Health care | | | 2,341,151 | | | | 26,239,051 | | | | — | | | | 28,580,202 | |
Information technology | | | 2,483,925 | | | | 13,984,893 | | | | — | | | | 16,468,818 | |
Materials | | | 973,145 | | | | 26,033,475 | | | | — | | | | 27,006,620 | |
Other common stocks | | | — | | | | 61,989,198 | | | | — | | | | 61,989,198 | |
| Total long-term investments | | $ | 14,578,968 | | | $ | 276,961,432 | | | | — | | | $ | 291,540,400 | |
| Short-term investments† | | | 4,360,473 | | | | — | | | | — | | | | 4,360,473 | |
| Total investments | | $ | 18,939,441 | | | $ | 276,961,432 | | | | — | | | $ | 295,900,873 | |
| † | See Schedule of Investments for additional detailed categorizations. |
For the year ended September 30, 2018, as a result of the fair value pricing procedures for international equities utilized by the Fund, certain securities have transferred in and out of Level 1 and Level 2 measurements during the period. The Fund’s policy is to recognize transfers between levels as of the end of the reporting period. At September 30, 2018, securities valued at $276,961,432 were classified as Level 2 within the fair value hierarchy because fair value procedures were applied when the change in value of a domestic equity security index suggested that the closing prices on foreign exchanges may no longer have represented the value of those securities at the time of closing of the NYSE.
(b) Foreign currency translation. Investment securities and other assets and liabilities denominated in foreign currencies are translated into U.S. dollar amounts based upon prevailing exchange rates on the date of valuation. Purchases and sales of investment securities and income and expense items denominated in foreign currencies are translated into U.S. dollar amounts based upon prevailing exchange rates on the respective dates of such transactions.
The Fund does not isolate that portion of the results of operations resulting from fluctuations in foreign exchange rates on investments from the fluctuations arising from changes in market prices of securities held. Such fluctuations are included with the net realized and unrealized gain or loss on investments.
| | |
| 36 | | QS International Equity Fund 2018 Annual Report |
Net realized foreign exchange gains or losses arise from sales of foreign currencies, including gains and losses on forward foreign currency contracts, currency gains or losses realized between the trade and settlement dates on securities transactions, and the difference between the amounts of dividends, interest, and foreign withholding taxes recorded on the Fund’s books and the U.S. dollar equivalent of the amounts actually received or paid. Net unrealized foreign exchange gains and losses arise from changes in the values of assets and liabilities, other than investments in securities, on the date of valuation, resulting from changes in exchange rates.
Foreign security and currency transactions may involve certain considerations and risks not typically associated with those of U.S. dollar denominated transactions as a result of, among other factors, the possibility of lower levels of governmental supervision and regulation of foreign securities markets and the possibility of political or economic instability.
(c) Foreign investment risks. The Fund’s investments in foreign securities may involve risks not present in domestic investments. Since securities may be denominated in foreign currencies, may require settlement in foreign currencies or pay interest or dividends in foreign currencies, changes in the relationship of these foreign currencies to the U.S. dollar can significantly affect the value of the investments and earnings of the Fund. Foreign investments may also subject the Fund to foreign government exchange restrictions, expropriation, taxation or other political, social or economic developments, all of which affect the market and/or credit risk of the investments.
(d) Security transactions and investment income. Security transactions are accounted for on a trade date basis. Interest income (including interest income from payment-in-kind securities), adjusted for amortization of premium and accretion of discount, is recorded on the accrual basis. Dividend income is recorded on the ex-dividend date for dividends received in cash and/or securities. Foreign dividend income is recorded on the ex-dividend date or as soon as practicable after the Fund determines the existence of a dividend declaration after exercising reasonable due diligence. The cost of investments sold is determined by use of the specific identification method. To the extent any issuer defaults or a credit event occurs that impacts the issuer, the Fund may halt any additional interest income accruals and consider the realizability of interest accrued up to the date of default or credit event.
(e) Distributions to shareholders. Distributions from net investment income and distributions of net realized gains, if any, are declared at least annually. Distributions to shareholders of the Fund are recorded on the ex-dividend date and are determined in accordance with income tax regulations, which may differ from GAAP.
(f) Share class accounting. Investment income, common expenses and realized/ unrealized gains (losses) on investments are allocated to the various classes of the Fund on the basis of daily net assets of each class. Fees relating to a specific class are charged directly to that share class.
| | |
| QS International Equity Fund 2018 Annual Report | | 37 |
Notes to financial statements (cont’d)
(g) Compensating balance arrangements. The Fund has an arrangement with its custodian bank whereby a portion of the custodian’s fees is paid indirectly by credits earned on the Fund’s cash on deposit with the bank.
(h) Federal and other taxes. It is the Fund’s policy to comply with the federal income and excise tax requirements of the Internal Revenue Code of 1986 (the “Code”), as amended, applicable to regulated investment companies. Accordingly, the Fund intends to distribute its taxable income and net realized gains, if any, to shareholders in accordance with timing requirements imposed by the Code. Therefore, no federal or state income tax provision is required in the Fund’s financial statements.
Management has analyzed the Fund’s tax positions taken on income tax returns for all open tax years and has concluded that as of September 30, 2018, no provision for income tax is required in the Fund’s financial statements. The Fund’s federal and state income and federal excise tax returns for tax years for which the applicable statutes of limitations have not expired are subject to examination by the Internal Revenue Service and state departments of revenue.
Under the applicable foreign tax laws, a withholding tax may be imposed on interest, dividends and capital gains at various rates. Realized gains upon disposition of securities issued in or by certain foreign countries are subject to capital gains tax imposed by those countries.
(i) Reclassification. GAAP requires that certain components of net assets be reclassified to reflect permanent differences between financial and tax reporting. These reclassifications have no effect on net assets or net asset value per share. During the current year, the following reclassifications have been made:
| | | | | | | | | | |
| | | Undistributed Net
Investment Income | | | Accumulated Net
Realized Loss | | | Paid-in
Capital |
| (a) | | | — | | | $ | 174,631,145 | | | $(174,631,145) |
| (b) | | $ | 563,863 | | | | (563,863) | | | — |
| (a) | Reclassifications are due to the expiration of a capital loss carryfoward. |
| (b) | Reclassifications are due to foreign currency transactions treated as ordinary income for tax purposes and book/tax differences in the treatment of passive foreign investment companies. |
2. Investment management agreement and other transactions with affiliates
Legg Mason Partners Fund Advisor, LLC (“LMPFA”) is the Fund’s investment manager and QS Investors, LLC (“QS Investors”) is the Fund’s subadviser. Western Asset Management Company, LLC (formerly Western Asset Management Company) (“Western Asset”) manages the portion of the Fund’s cash and short-term instruments allocated to it. LMPFA, QS Investors and Western Asset are wholly-owned subsidiaries of Legg Mason, Inc. (“Legg Mason”).
| | |
| 38 | | QS International Equity Fund 2018 Annual Report |
Under the investment management agreement, effective December 1, 2017, the Fund pays an investment management fee, calculated daily and paid monthly, in accordance with the following breakpoint schedule:
| | | | |
| Average Daily Net Assets | | Annual Rate | |
| First $1 billion | | | 0.750 | % |
| Next $1 billion | | | 0.700 | |
| Next $3 billion | | | 0.650 | |
| Next $5 billion | | | 0.600 | |
| Over $10 billion | | | 0.550 | |
Prior to December 1, 2017, the Fund paid an investment management fee, calculated daily and paid monthly, at an annual rate of 0.75% of the Fund’s average daily net assets.
LMPFA provides administrative and certain oversight services to the Fund. LMPFA delegates to the subadviser the day-to-day portfolio management of the Fund, except for the management of the portion of the cash and short-term instruments allocated to Western Asset. For its services, LMPFA pays QS Investors monthly an aggregate fee equal to 66 2/3% of the net management fee it receives from the Fund. For Western Asset’s services to the Fund, LMPFA pays Western Asset monthly 0.02% of the portion of the Fund’s average daily net assets that are allocated to Western Asset by LMPFA.
As a result of expense limitation arrangements between the Fund and LMPFA, the ratio of total annual fund operating expenses, other than interest, brokerage commissions, dividend expense on short sales, taxes, extraordinary expenses and acquired fund fees and expenses, to average net assets of Class A, Class A2, Class C, Class FI, Class R, Class I and Class IS shares did not exceed 1.30%, 1.50%, 2.05%, 1.30%, 1.55%, 0.95% and 0.85%, respectively. In addition, the ratio of total annual fund operating expenses for Class IS shares did not exceed the ratio of total annual fund operating expenses for Class I shares. These expense limitation arrangements cannot be terminated prior to December 31, 2019 without the Board of Trustees’ consent.
During the year ended September 30, 2018, fees waived and/or expenses reimbursed amounted to $165,230.
LMPFA is permitted to recapture amounts waived and/or reimbursed to a class within three years after the fiscal year in which LMPFA earned the fee or incurred the expense if the class’ total annual operating expenses have fallen to a level below the expense limitation (“expense cap”) in effect at the time the fees were earned or the expenses incurred. In no case will LMPFA recapture any amount that would result, on any particular business day of the Fund, in the class’ total annual operating expenses exceeding the expense cap or any other lower limit then in effect.
| | |
| QS International Equity Fund 2018 Annual Report | | 39 |
Notes to financial statements (cont’d)
Pursuant to these arrangements, at September 30, 2018, the Fund had remaining fee waivers and/or expense reimbursements subject to recapture by LMPFA and respective dates of expiration as follows:
| | | | | | | | | | | | | | | | | | | | | | | | | | | | |
| | | Class A | | | Class A2 | | | Class C | | | Class FI | | | Class R | | | Class I | | | Class IS | |
| Expires September 30, 2019 | | | — | | | | — | | | | — | | | | — | | | | — | | | $ | 4,947 | | | $ | 70,824 | |
| Expires September 30, 2020 | | | — | | | | — | | | $ | 11,274 | | | $ | 2,470 | | | $ | 1,017 | | | | 14,551 | | | | 97,377 | |
| Expires September 30, 2021 | | $ | 5,881 | | | $ | 490 | | | | 16,178 | | | | 3,833 | | | | 4,516 | | | | 19,902 | | | | 113,587 | |
| Total fee waivers/expense reimbursements subject to recapture | | $ | 5,881 | | | $ | 490 | | | $ | 27,452 | | | $ | 6,303 | | | $ | 5,533 | | | $ | 39,400 | | | $ | 281,788 | |
For the year ended September 30, 2018, fee waivers and/or expense reimbursements recaptured by LMPFA, if any, were as follows:
| | | | | | | | | | | | | | | | | | | | | | | | | | | | |
| | | Class A | | | Class A2 | | | Class C | | | Class FI | | | Class R | | | Class I | | | Class IS | |
| LMPFA recaptured | | $ | 3,344 | | | $ | 109 | | | $ | 44,257 | | | $ | 2,705 | | | $ | 1,159 | | | | — | | | $ | 55 | |
Legg Mason Investor Services, LLC (‘‘LMIS’’), a wholly-owned broker-dealer subsidiary of Legg Mason, serves as the Fund’s sole and exclusive distributor.
There is a maximum initial sales charge of 5.75% for Class A and Class A2 shares. There is a contingent deferred sales charge (“CDSC”) of 1.00% on Class C shares, which applies if redemption occurs within 12 months from purchase payment. In certain cases, Class A and Class A2 shares have a 1.00% CDSC, which applies if redemption occurs within 18 months from purchase payment. This CDSC only applies to those purchases of Class A and Class A2 shares, which, when combined with current holdings of other shares of funds sold by LMIS, equal or exceed $1,000,000 in the aggregate. These purchases do not incur an initial sales charge.
For the year ended September 30, 2018, sales charges retained by and CDSCs paid to LMIS and its affiliates, if any, were as follows:
| | | | | | | | | | | | |
| | | Class A | | | Class A2 | | | Class C | |
| Sales charges | | $ | 810 | | | $ | 4,450 | | | | — | |
| CDSCs | | | — | | | | — | | | $ | 9 | |
Under a Deferred Compensation Plan (the “Plan”), Trustees may have elected to defer receipt of all or a specified portion of their compensation. A participating Trustee selected one or more funds managed by affiliates of Legg Mason in which his or her deferred trustee’s fees were deemed to be invested. Deferred amounts remain in the Fund until distributed in accordance with the Plan. In May 2015, the Board of Trustees approved an amendment to the Plan so that effective January 1, 2016, no compensation earned after that date may be deferred under the Plan.
| | |
| 40 | | QS International Equity Fund 2018 Annual Report |
All officers and one Trustee of the Trust are employees of Legg Mason or its affiliates and do not receive compensation from the Trust.
As of September 30, 2018, Legg Mason and its affiliates owned 72% of the Fund.
3. Investments
During the year ended September 30, 2018, the aggregate cost of purchases and proceeds from sales of investments (excluding short-term investments) were as follows:
| | | | |
| Purchases | | $ | 81,761,984 | |
| Sales | | | 80,983,810 | |
At September 30, 2018, the aggregate cost of investments and the aggregate gross unrealized appreciation and depreciation of investments for federal income tax purposes were as follows:
| | | | | | | | | | | | | | | | |
| | | Cost | | | Gross
Unrealized
Appreciation | | | Gross
Unrealized
Depreciation | | | Net
Unrealized
Appreciation | |
| Securities | | $ | 267,537,158 | | | $ | 44,325,465 | | | $ | (15,961,750) | | | $ | 28,363,715 | |
4. Derivative instruments and hedging activities
During the year ended September 30, 2018, the Fund did not invest in derivative instruments.
5. Class specific expenses, waivers and/or expense reimbursements
The Fund has adopted a Rule 12b-1 shareholder services and distribution plan and under that plan the Fund pays service and/or distribution fees with respect to its Class A, Class A2, Class C, Class FI and Class R shares calculated at the annual rate of 0.25%, 0.25%, 1.00%, 0.25% and 0.50% of the average daily net assets of each class, respectively. Service and/or distribution fees are accrued daily and paid monthly.
For the year ended September 30, 2018, class specific expenses were as follows:
| | | | | | | | |
| | | Service and/or
Distribution Fees | | | Transfer Agent
Fees | |
| Class A | | $ | 29,439 | † | | $ | 18,766 | |
| Class A2 | | | 1,830 | | | | 2,902 | |
| Class C | | | 360,564 | † | | | 27,082 | |
| Class FI | | | 21,300 | † | | | 14,121 | |
| Class R | | | 23,273 | | | | 10,247 | |
| Class I | | | — | | | | 32,811 | |
| Class IS | | | — | | | | 1,795 | |
| Total | | $ | 436,406 | | | $ | 107,724 | |
| † | Amounts shown are exclusive of expense reimbursements. For the year ended September 30, 2018, the service and/or distribution fees reimbursed amounted to $5, $724 and $114 for Class A, Class C and Class F1 shares, respectively. |
| | |
| QS International Equity Fund 2018 Annual Report | | 41 |
Notes to financial statements (cont’d)
For the year ended September 30, 2018, waivers and/or expense reimbursements by class were as follows:
| | | | |
| | | Waivers/Expense
Reimbursements | |
| Class A | | $ | 5,886 | |
| Class A2 | | | 490 | |
| Class C | | | 16,902 | |
| Class FI | | | 3,947 | |
| Class R | | | 4,516 | |
| Class I | | | 19,902 | |
| Class IS | | | 113,587 | |
| Total | | $ | 165,230 | |
6. Distributions to shareholders by class
| | | | | | | | |
| | | Year Ended
September 30, 2018 | | | Year Ended
September 30, 2017 | |
| Net Investment Income: | | | | | | | | |
| Class A | | $ | 277,541 | | | $ | 160,770 | |
| Class A2 | | | 12,237 | | | | 3,755 | |
| Class C | | | 599,277 | | | | 497,333 | |
| Class FI | | | 241,997 | | | | 138,341 | |
| Class R | | | 98,810 | | | | 11,766 | |
| Class I | | | 649,059 | | | | 508,067 | |
| Class IS | | | 6,121,089 | | | | 6,879,986 | |
| Total | | $ | 8,000,010 | | | $ | 8,200,018 | |
7. Shares of beneficial interest
At September 30, 2018, the Trust had an unlimited number of shares of beneficial interest authorized with a par value of $0.00001 per share. The Fund has the ability to issue multiple classes of shares. Each class of shares represents an identical interest and has the same rights, except that each class bears certain direct expenses, including those specifically related to the distribution of its shares.
Transactions in shares of each class were as follows:
| | | | | | | | | | | | | | | | |
| | | Year Ended
September 30, 2018 | | | Year Ended
September 30, 2017 | |
| | | Shares | | | Amount | | | Shares | | | Amount | |
| Class A | | | | | | | | | | | | | �� | | | |
| Shares sold | | | 186,340 | | | $ | 3,066,682 | | | | 375,566 | | | $ | 5,783,815 | |
| Shares issued on reinvestment | | | 15,818 | | | | 254,982 | | | | 11,713 | | | | 159,409 | |
| Shares repurchased | | | (222,677) | | | | (3,679,039) | | | | (170,472) | | | | (2,463,522) | |
| Net increase (decrease) | | | (20,519) | | | $ | (357,375) | | | | 216,807 | | | $ | 3,479,702 | |
| | |
| 42 | | QS International Equity Fund 2018 Annual Report |
| | | | | | | | | | | | | | | | |
| | | Year Ended
September 30, 2018 | | | Year Ended
September 30, 2017 | |
| | | Shares | | | Amount | | | Shares | | | Amount | |
| Class A2 | | | | | | | | | | | | | | | | |
| Shares sold | | | 65,728 | | | $ | 1,075,153 | | | | 34,365 | | | $ | 516,252 | |
| Shares issued on reinvestment | | | 762 | | | | 12,237 | | | | 276 | | | | 3,738 | |
| Shares repurchased | | | (23,809) | | | | (387,490) | | | | (17,251) | | | | (264,199) | |
| Net increase | | | 42,681 | | | $ | 699,900 | | | | 17,390 | | | $ | 255,791 | |
| | | | |
| Class C | | | | | | | | | | | | | | | | |
| Shares sold | | | 32,149 | | | $ | 534,845 | | | | 43,663 | | | $ | 648,529 | |
| Shares issued on reinvestment | | | 36,815 | | | | 596,771 | | | | 35,717 | | | | 488,612 | |
| Shares repurchased | | | (418,616) | | | | (6,852,671) | | | | (676,117) | | | | (9,884,669) | |
| Net decrease | | | (349,652) | | | $ | (5,721,055) | | | | (596,737) | | | $ | (8,747,528) | |
| | | | |
| Class FI | | | | | | | | | | | | | | | | |
| Shares sold | | | 191,823 | | | $ | 3,319,498 | | | | 161,581 | | | $ | 2,648,519 | |
| Shares issued on reinvestment | | | 14,239 | | | | 238,367 | | | | 9,422 | | | | 133,143 | |
| Shares repurchased | | | (309,932) | | | | (5,320,852) | | | | (125,314) | | | | (1,913,276) | |
| Net increase (decrease) | | | (103,870) | | | $ | (1,762,987) | | | | 45,689 | | | $ | 868,386 | |
| | | | |
| Class R | | | | | | | | | | | | | | | | |
| Shares sold | | | 148,361 | | | $ | 2,539,432 | | | | 168,436 | | | $ | 2,655,926 | |
| Shares issued on reinvestment | | | 5,917 | | | | 98,810 | | | | 833 | | | | 11,766 | |
| Shares repurchased | | | (44,078) | | | | (748,570) | | | | (16,692) | | | | (273,397) | |
| Net increase | | | 110,200 | | | $ | 1,889,672 | | | | 152,577 | | | $ | 2,394,295 | |
| | | | |
| Class I | | | | | | | | | | | | | | | | |
| Shares sold | | | 554,751 | | | $ | 9,464,438 | | | | 421,287 | | | $ | 6,569,946 | |
| Shares issued on reinvestment | | | 16,360 | | | | 273,700 | | | | 14,108 | | | | 199,054 | |
| Shares repurchased | | | (389,144) | | | | (6,629,233) | | | | (601,668) | | | | (9,211,477) | |
| Net increase (decrease) | | | 181,967 | | | $ | 3,108,905 | | | | (166,273) | | | $ | (2,442,477) | |
| | | | |
| Class IS | | | | | | | | | | | | | | | | |
| Shares sold | | | 727,536 | | | $ | 12,589,193 | | | | 2,016,160 | | | $ | 31,226,529 | |
| Shares issued on reinvestment | | | 366,752 | | | | 6,121,089 | | | | 488,983 | | | | 6,879,986 | |
| Shares repurchased | | | (890,067) | | | | (15,297,869) | | | | (6,049,743) | | | | (93,114,096) | |
| Shares redeemed in-kind | | | — | | | | — | | | | (3,465,605) | | | | (58,360,792) | |
| Net increase (decrease) | | | 204,221 | | | $ | 3,412,413 | | | | (7,010,205) | | | $ | (113,368,373) | |
8. Redemptions-in-kind
The Fund may make payment for Fund shares redeemed wholly or in part by distributing portfolio securities to shareholders. For the year ended September 30, 2017, the Fund had redemptions-in-kind with total proceeds in the amount of $58,360,792. The net realized gains on these redemptions-in-kind amounted to $12,529,019, which was not realized for tax purposes.
| | |
| QS International Equity Fund 2018 Annual Report | | 43 |
Notes to financial statements (cont’d)
9. Income tax information and distributions to shareholders
The tax character of distributions paid during the fiscal years ended September 30, was as follows:
| | | | | | | | |
| | | 2018 | | | 2017 | |
| Distributions paid from: | | | | | | | | |
| Ordinary Income | | $ | 8,000,010 | | | $ | 8,200,018 | |
As of September 30, 2018, the components of accumulated earnings (losses) on a tax basis were as follows:
| | | | |
| Undistributed ordinary income — net | | $ | 6,592,108 | |
| Capital loss carryforward* | | | (3,118,831) | |
| Other book/tax temporary differences(a) | | | (60,695) | |
| Unrealized appreciation (depreciation)(b) | | | 28,352,417 | |
| Total accumulated earnings (losses) — net | | $ | 31,764,999 | |
| * | During the taxable year ended September 30, 2018, the Fund utilized $ 13,011,046 of its capital loss carryforward available from prior years. As of September 30, 2018, the Fund had the following net capital loss carryforward remaining: |
| | | | |
| Year of Expiration | | Amount | |
| 9/30/2019 | | $ | (3,118,831 | ) |
This amount will be available to offset any future taxable capital gains.
| (a) | Other book/tax temporary differences are attributable to book/tax differences in the timing of the deductibility of various expenses. |
| (b) | The difference between book-basis and tax-basis unrealized appreciation (depreciation) is attributable to the tax deferral of losses on wash sales and the realization for tax purposes of unrealized gains on investments in passive foreign investment companies. |
| | |
| 44 | | QS International Equity Fund 2018 Annual Report |
Report of independent registered public accounting firm
To the Board of Trustees of Legg Mason Global Asset Management Trust and Shareholders of QS International Equity Fund
Opinion on the Financial Statements
We have audited the accompanying statement of assets and liabilities, including the schedule of investments, of QS International Equity Fund (one of the funds constituting Legg Mason Global Asset Management Trust, referred to hereafter as the “Fund”) as of September 30, 2018, the related statement of operations for the year ended September 30, 2018, the statement of changes in net assets for each of the two years in the period ended September 30, 2018, including the related notes, and the financial highlights for each of the periods indicated therein (collectively referred to as the “financial statements”). In our opinion, the financial statements present fairly, in all material respects, the financial position of the Fund as of September 30, 2018, the results of its operations for the year then ended, the changes in its net assets for each of the two years in the period ended September 30, 2018 and the financial highlights for each of the periods indicated therein in conformity with accounting principles generally accepted in the United States of America.
Basis for Opinion
These financial statements are the responsibility of the Fund’s management. Our responsibility is to express an opinion on the Fund’s financial statements based on our audits. We are a public accounting firm registered with the Public Company Accounting Oversight Board (United States) (“PCAOB”) and are required to be independent with respect to the Fund in accordance with the U.S. federal securities laws and the applicable rules and regulations of the Securities and Exchange Commission and the PCAOB.
We conducted our audits of these financial statements in accordance with the standards of the PCAOB. Those standards require that we plan and perform the audit to obtain reasonable assurance about whether the financial statements are free of material misstatement, whether due to error or fraud.
Our audits included performing procedures to assess the risks of material misstatement of the financial statements, whether due to error or fraud, and performing procedures that respond to those risks. Such procedures included examining, on a test basis, evidence regarding the amounts and disclosures in the financial statements. Our audits also included evaluating the accounting principles used and significant estimates made by management, as well as evaluating the overall presentation of the financial statements. Our procedures included confirmation of securities owned as of September 30, 2018 by correspondence with the custodian. We believe that our audits provide a reasonable basis for our opinion.
/s/PricewaterhouseCoopers LLP
Baltimore, Maryland
November 16, 2018
We have served as the auditor of one or more investment companies in Legg Mason investment company group since at least 1973. We have not determined the specific year we began serving as auditor.
| | |
| QS International Equity Fund 2018 Annual Report | | 45 |
Additional information (unaudited)
Information about Trustees and Officers
The business and affairs of QS International Equity Fund (the “Fund”) are conducted by management under the supervision and subject to the direction of its Board of Trustees. The business address of each Trustee is c/o Jane Trust, Legg Mason, 100 International Drive, 11th Floor, Baltimore, Maryland 21202. Information pertaining to the Trustees and officers of the Fund is set forth below.
The Statement of Additional Information includes additional information about Trustees and is available, without charge, upon request by calling the Fund at 1-877-721-1926.
| | |
| Independent Trustees† |
| Ruby P. Hearn |
| Year of birth | | 1940 |
| Position(s) with Trust | | Trustee |
| Term of office1 and length of time served2 | | Since 2004 |
| Principal occupation(s) during past five years | | Senior Vice President Emerita of The Robert Wood Johnson Foundation (non-profit) since 2001; Member of the Institute of Medicine since 1982; formerly, Trustee of the New York Academy of Medicine (2004 to 2012); Director of the Institute for Healthcare Improvement (2002 to 2012); Senior Vice President of The Robert Wood Johnson Foundation (1996 to 2001); Fellow of The Yale Corporation (1992 to 1998) |
| Number of funds in fund complex overseen by Trustee | | 19 |
| Other board memberships held by Trustee during past five years | | None |
|
| Arnold L. Lehman |
| Year of birth | | 1944 |
| Position(s) with Trust | | Trustee and Chairman |
| Term of office1 and length of time served2 | | Since 1982 and since 2015 |
| Principal occupation(s) during past five years | | Senior Advisor, Phillips Auctioneer since 2015; Trustee of American Federation of Arts since 1998; formerly, Fellow, Ford Foundation (2015 to 2016); Director of the Brooklyn Museum (1997 to 2015); Director of The Baltimore Museum of Art (1979 to 1997) |
| Number of funds in fund complex overseen by Trustee | | 19 |
| Other board memberships held by Trustee during past five years | | None |
|
| Robin J.W. Masters |
| Year of birth | | 1955 |
| Position(s) with Trust | | Trustee |
| Term of office1 and length of time served2 | | Since 2002 |
| Principal occupation(s) during past five years | | Retired; formerly, Chief Investment Officer of ACE Limited (insurance) (1986 to 2000) |
| Number of funds in fund complex overseen by Trustee | | 19 |
| Other board memberships held by Trustee during past five years | | Director of Cheyne Capital International Limited (investment advisory firm); formerly, Director/Trustee of Legg Mason Institutional Funds plc, WA Fixed Income Funds plc and Western Asset Debt Securities Fund plc. (2007 to 2011) |
| | |
| 46 | | QS International Equity Fund |
| | |
| Independent Trustees† cont’d |
| Jill E. McGovern |
| Year of birth | | 1944 |
| Position(s) with Trust | | Trustee |
| Term of office1 and length of time served2 | | Since 1989 |
| Principal occupation(s) during past five years | | Senior Consultant, American Institute for Contemporary German Studies (AICGS) since 2007; formerly, Chief Executive Officer of The Marrow Foundation (non-profit) (1993 to 2007); Executive Director of the Baltimore International Festival (1991 to 1993); Senior Assistant to the President of The Johns Hopkins University (1986 to 1990) |
| Number of funds in fund complex overseen by Trustee | | 19 |
| Other board memberships held by Trustee during past five years | | Director of International Biomedical Research Alliance; Director of Lois Roth Endowment |
|
| Arthur S. Mehlman |
| Year of birth | | 1942 |
| Position(s) with Trust | | Trustee |
| Term of office1 and length of time served2 | | Since 2002 |
| Principal occupation(s) during past five years | | Retired. Director, The University of Maryland Foundation since 1992; Director, The League for People with Disabilities since 2003; formerly, Director, Municipal Mortgage & Equity LLC (2004 to 2011); Partner, KPMG LLP (international accounting firm) (1972 to 2002) |
| Number of funds in fund complex overseen by Trustee | | Trustee of all Legg Mason Funds consisting of 19 portfolios; Director/Trustee of the Royce Family of Funds consisting of 22 portfolios |
| Other board memberships held by Trustee during past five years | | Director of Municipal Mortgage & Equity, LLC. (2004 to 2011) |
|
| G. Peter O’Brien |
| Year of birth | | 1945 |
| Position(s) with Trust | | Trustee |
| Term of office1 and length of time served2 | | Since 1999 |
| Principal occupation(s) during past five years | | Retired. Trustee Emeritus of Colgate University; Board Member, Hill House, Inc. (residential home care); formerly, Board Member, Bridges School (pre- school) (2006 to 2017); Managing Director, Equity Capital Markets Group of Merrill Lynch & Co. (1971 to 1999) |
| Number of funds in fund complex overseen by Trustee | | Trustee of all Legg Mason funds consisting of 19 portfolios; Director/Trustee of the Royce Family of Funds consisting of 22 portfolios |
| Other board memberships held by Trustee during past five years | | Director of TICC Capital Corp. (2003 to 2017) |
| | |
| QS International Equity Fund | | 47 |
Additional information (unaudited) (cont’d)
Information about Trustees and Officers
| | |
| Independent Trustees† cont’d |
| S. Ford Rowan |
| Year of birth | | 1943 |
| Position(s) with Trust | | Trustee |
| Term of office1 and length of time served2 | | Since 2002 |
| Principal occupation(s) during past five years | | Chairman, National Center for Critical Incident Analysis, since 2004; Consultant to University of Maryland University College, since 2013; formerly, Lecturer in Organizational Sciences, George Washington University (2000 to 2014); Trustee, St. John’s College (2006 to 2012); Consultant, Rowan & Blewitt Inc. (management consulting) (1984 to 2007); Lecturer in Journalism, Northwestern University (1980 to 1993); Director, Santa Fe Institute (1999 to 2008) |
| Number of funds in fund complex overseen by Trustee | | 19 |
| Other board memberships held by Trustee during past five years | | None |
|
| Robert M. Tarola |
| Year of birth | | 1950 |
| Position(s) with Trust | | Trustee |
| Term of office1 and length of time served2 | | Since 2004 |
| Principal occupation(s) during past five years | | President of Rights Advisory LLC (corporate finance and governance consulting) since 2008; Member, Investor Advisory Group of the Public Company Accounting Oversight Board since 2009; formerly, Executive Vice President and Chief Financial Officer, Southcoast Health System, Inc. (healthcare provider network) (2015 to 2017); Senior Vice President and Chief Financial Officer of The Howard University (2009 to 2013) (higher education and health care); Senior Vice President and Chief Financial Officer of W.R. Grace & Co. (specialty chemicals) (1999 to 2008) and MedStar Health, Inc. (healthcare) (1996 to 1999); Partner, Price Waterhouse, LLP (accounting and auditing) (1984 to 1996) |
| Number of funds in fund complex overseen by Trustee | | 19 |
| Other board memberships held by Trustee during past five years | | Director of American Kidney Fund (renal disease assistance); Director of XBRL International, Inc. (global data standard setting); Director of Vista Outdoor, Inc. (consumer outdoor recreation brands); formerly, Director of TeleTech Holdings, Inc. (business processing outsourcing) |
| | |
| | |
| 48 | | QS International Equity Fund |
| | |
| Interested Trustee |
| Jane Trust, CFA3 | | |
| Year of birth | | 1962 |
| Position(s) with Trust | | Trustee, President and Chief Executive Officer |
| Term of office1 and length of time served2 | | Since 2015 |
| Principal occupation(s) during past five years | | Senior Managing Director of Legg Mason & Co., LLC (“Legg Mason & Co.”) (since 2018); Managing Director of Legg Mason & Co. (2016 to 2018); Officer and/or Trustee/Director of 147 funds associated with Legg Mason Partners Fund Advisor, LLC (“LMPFA”) or its affiliates (since 2015); President and Chief Executive Officer of LMPFA (since 2015); formerly, Senior Vice President of LMPFA (2015); Director of ClearBridge, LLC (formerly, Legg Mason Capital Management, LLC) (2007 to 2014); Managing Director of Legg Mason Investment Counsel & Trust Co. (2000 to 2007) |
| Number of funds in fund complex overseen by Trustee | | 138 |
Other board memberships held by Trustee during past
five years | | None |
| | |
| Executive Officers |
Richard F. Sennett Legg Mason 100 International Drive, 7th Floor, Baltimore, MD 21202 | | |
| Year of birth | | 1970 |
| Position(s) with Trust | | Principal Financial Officer |
| Term of office1 and length of time served2 | | Since 2011 |
| Principal occupation(s) during past five years | | Principal Financial Officer and Treasurer of certain mutual funds associated with Legg Mason & Co. or its affiliates (since 2011 and since 2013); Managing Director of Legg Mason & Co. and Senior Manager of the Treasury Policy group for Legg Mason & Co.’s Global Fiduciary Platform (since 2011); formerly, Chief Accountant within the SEC’s Division of Investment Management (2007 to 2011); Assistant Chief Accountant within the SEC’s Division of Investment Management (2002 to 2007) |
| |
Robert I. Frenkel Legg Mason 100 First Stamford Place, 6th Floor, Stamford, CT 06902 | | |
| Year of birth | | 1954 |
| Position(s) with Trust | | Secretary and Chief Legal Officer |
| Term of office1 and length of time served2 | | Since 2007 |
| Principal occupation(s) during past five years | | Vice President and Deputy General Counsel of Legg Mason (since 2006); Managing Director and General Counsel of — U.S. Mutual Funds for Legg Mason & Co. (since 2006) and Legg Mason & Co. predecessors (since 1994); Secretary and Chief Legal Officer of certain mutual funds associated with Legg Mason & Co. or its affiliates (since 2006) and Legg Mason & Co. predecessors (prior to 2006) |
| | |
| QS International Equity Fund | | 49 |
Additional information (unaudited) (cont’d)
Information about Trustees and Officers
| | |
| Executive Officers cont’d |
Thomas C. Mandia Legg Mason 100 First Stamford Place, 6th Floor, Stamford, CT 06902 | | |
| Year of birth | | 1962 |
| Position(s) with Trust | | Assistant Secretary |
| Term of office1 and length of time served2 | | Since 2007 |
| Principal occupation(s) during past five years | | Managing Director and Deputy General Counsel of Legg Mason & Co. (since 2005) and Legg Mason & Co. predecessors (prior to 2005); Secretary of LMPFA (since 2006); Assistant Secretary of certain mutual funds associated with Legg Mason & Co. or its affiliates (since 2006) and Legg Mason & Co. predecessors (prior to 2006); Secretary of LM Asset Services, LLC (“LMAS”) (since 2002) and Legg Mason Fund Asset Management, Inc. (“LMFAM”) (since 2013) (formerly registered investment advisers) |
| |
Ted P. Becker
Legg Mason 620 Eighth Avenue, 49th Floor, New York, NY 10018 | | |
| Year of birth | | 1951 |
| Position(s) with Trust | | Chief Compliance Officer |
| Term of office1 and length of time served2 | | Since 2007 |
| Principal occupation(s) during past five years | | Director of Global Compliance at Legg Mason (since 2006); Chief Compliance Officer of LMPFA (since 2006); Managing Director of Compliance of Legg Mason & Co. (since 2005); Chief Compliance Officer of certain mutual funds associated with Legg Mason & Co. or its affiliates (since 2006) and Legg Mason & Co. predecessors (prior to 2006) |
| |
Christopher Berarducci Legg Mason 620 Eighth Avenue, 49th Floor, New York, NY 10018 | | |
| Year of birth | | 1974 |
| Position(s) with Trust | | Treasurer |
| Term of office1 and length of time served2 | | Since 2010 |
| Principal occupation(s) during past five years | | Director of Legg Mason & Co. (since 2015); Treasurer of certain mutual funds associated with Legg Mason & Co. or its affiliates (since 2010); formerly, Vice President of Legg Mason & Co. (2011 to 2015); Assistant Controller of certain mutual funds associated with Legg Mason & Co. or its affiliates (prior to 2010) |
| | |
| 50 | | QS International Equity Fund |
| | |
| Executive Officers cont’d |
Susan Kerr Legg Mason 620 Eighth Avenue, 49th Floor, New York, NY 10018 | | |
| Year of birth | | 1949 |
| Position(s) with Trust | | Chief Anti-Money Laundering Compliance Officer |
| Term of office1 and length of time served2 | | Since 2013 |
| Principal occupation(s) during past five years | | Assistant Vice President of Legg Mason & Co. and Legg Mason Investor Services, LLC (“LMIS”) (since 2010); Chief Anti-Money Laundering Compliance Officer of certain mutual funds associated with Legg Mason & Co. or its affiliates (since 2013) and Anti-Money Laundering Compliance Officer of LMIS (since 2012); Senior Compliance Officer of LMIS (since 2011); formerly, AML Consultant, DTCC (2010); AML Consultant, Rabobank Netherlands, (2009); First Vice President, Director of Marketing & Advertising Compliance and Manager of Communications Review Group at Citigroup Inc. (1996 to 2008) |
| |
Jenna Bailey Legg Mason 100 First Stamford Place, 5th Floor, Stamford, CT 06902 | | |
| Year of birth | | 1978 |
| Position(s) with Trust | | Identity Theft Prevention Officer |
| Term of office1 and length of time served2 | | Since 2015 |
| Principal occupation(s) during past five years | | Identity Theft Prevention Officer of certain mutual funds associated with Legg Mason & Co. or its affiliates (since 2015); Compliance Officer of Legg Mason & Co. (since 2013); Assistant Vice President of Legg Mason & Co. (since 2011); formerly, Associate Compliance Officer of Legg Mason & Co. (2011 to 2013) |
| |
Jeanne M. Kelly Legg Mason 620 Eighth Avenue, 49th Floor, New York, NY 10018 | | |
| Year of birth | | 1951 |
| Position(s) with Trust | | Senior Vice President |
| Term of office1 and length of time served2 | | Since 2007 |
| Principal occupation(s) during past five years | | Senior Vice President of certain mutual funds associated with Legg Mason & Co. or its affiliates (since 2007); Senior Vice President of LMPFA (since 2006); President and Chief Executive Officer of LMAS and LMFAM (since 2015); Managing Director of Legg Mason & Co. (since 2005) and Legg Mason & Co. predecessors (prior to 2005); formerly, Senior Vice President of LMFAM (2013 to 2015) |
| † | Trustees who are not “interested persons” of the Fund within the meaning of Section 2(a)(19) of the Investment Company Act of 1940, as amended (the “1940 Act”). Each of the Independent Trustees serves on the standing committees of the Board of Trustees, which include the Audit Committee (chair: Arthur S. Mehlman), the Nominating Committee (co-chairs: G. Peter O’Brien and Jill E. McGovern), and the Independent Trustees Committee (chair: Arnold L. Lehman). |
| | |
| QS International Equity Fund | | 51 |
Additional information (unaudited) (cont’d)
Information about Trustees and Officers
| 1 | Each Trustee and officer serves until his or her respective successor has been duly elected and qualified or until his or her earlier death, resignation, retirement or removal. |
| 2 | Indicates the earliest year in which the Trustee became a board member for a fund in the Legg Mason fund complex or the officer took such office. |
| 3 | Ms. Trust is an “interested person” of the Fund, as defined in the 1940 Act, because of her position with LMPFA and/or certain of its affiliates. |
| | |
| 52 | | QS International Equity Fund |
Important tax information (unaudited)
The following information is provided with respect to the distributions paid during the taxable year ended September 30, 2018:
| | | | |
| Record date: | | | 12/5/2017 | |
| Payable date: | | | 12/6/2017 | |
| Ordinary income: | | | | |
Qualified dividend income for individuals | | | 100.00 | % |
| Foreign source income | | | 88.66 | %* |
| Foreign taxes paid per share | | | $0.040311 | |
| * | Expressed as a percentage of the cash distribution grossed-up for foreign taxes. |
The foreign taxes paid represent taxes incurred by the Fund on income received by the Fund from foreign sources. Foreign taxes paid may be included in taxable income with an offsetting deduction from gross income or may be taken as a credit for taxes paid to foreign governments. You should consult your tax adviser regarding the appropriate treatment of foreign taxes paid.
Please retain this information for your records.
| | |
| QS International Equity Fund | | 53 |
QS
International Equity Fund
Trustees
Ruby P. Hearn
Arnold L. Lehman
Chairman
Robin J.W. Masters
Jill E. McGovern
Arthur S. Mehlman
G. Peter O’Brien
S. Ford Rowan
Robert M. Tarola
Jane Trust
Investment manager
Legg Mason Partners Fund Advisor, LLC
Subadviser
QS Investors, LLC
Distributor
Legg Mason Investor Services, LLC
Custodian
The Bank of New York Mellon (“BNY”)*
| * | Effective April 9, 2018, BNY became custodian. |
Transfer agent
BNY Mellon Investment Servicing (US) Inc.
4400 Computer Drive
Westborough, MA 01581
Independent registered public accounting firm
PricewaterhouseCoopers LLP Baltimore, MD
QS International Equity Fund
The Fund is a separate investment series of Legg Mason Global Asset Management Trust, a Maryland statutory trust.
QS International Equity Fund
Legg Mason Funds
620 Eighth Avenue, 49th Floor
New York, NY 10018
The Fund files its complete schedule of portfolio holdings with the Securities and Exchange Commission (“SEC”) for the first and third quarters of each fiscal year on Form N-Q. The Fund’s Forms N-Q are available on the SEC’s website at www.sec.gov. The Fund’s Forms N-Q may be reviewed and copied at the SEC’s Public Reference Room in Washington, D.C., and information on the operation of the Public Reference Room may be obtained by calling 1-800-SEC-0330. To obtain information on Form N-Q, shareholders can call the Fund at 1-877-721-1926.
Information on how the Fund voted proxies relating to portfolio securities during the prior 12-month period ended June 30th of each year and a description of the policies and procedures that the Fund uses to determine how to vote proxies related to portfolio transactions are available (1) without charge, upon request, by calling the Fund at 1-877-721-1926, (2) at www.leggmason.com/mutualfunds and (3) on the SEC’s website at www.sec.gov.
This report is submitted for the general information of the shareholders of QS International Equity Fund. This report is not authorized for distribution to prospective investors in the Fund unless preceded or accompanied by a current prospectus.
Investors should consider the Fund’s investment objectives, risks, charges and expenses carefully before investing. The prospectus contains this and other important information about the Fund. Please read the prospectus carefully before investing.
www.leggmason.com
© 2018 Legg Mason Investor Services, LLC
Member FINRA, SIPC
Legg Mason Funds Privacy and Security Notice
Your Privacy and the Security of Your Personal Information is Very Important to the Legg Mason Funds
This Privacy and Security Notice (the “Privacy Notice”) addresses the Legg Mason Funds’ privacy and data protection practices with respect to nonpublic personal information the Funds receive. The Legg Mason Funds include any funds sold by the Funds’ distributor, Legg Mason Investor Services, LLC, as well as Legg Mason-sponsored closed-end funds. The provisions of this Privacy Notice apply to your information both while you are a shareholder and after you are no longer invested with the Funds.
The Type of Nonpublic Personal Information the Funds Collect About You
The Funds collect and maintain nonpublic personal information about you in connection with your shareholder account. Such information may include, but is not limited to:
| • | | Personal information included on applications or other forms; |
| • | | Account balances, transactions, and mutual fund holdings and positions; |
| • | | Bank account information, legal documents, and identify verification documentation; |
| • | | Online account access user IDs, passwords, security challenge question responses; and |
| • | | Information received from consumer reporting agencies regarding credit history and cred-itworthiness (such as the amount of an individual’s total debt, payment history, etc.). |
How the Funds Use Nonpublic Personal Information About You
The Funds do not sell or share your nonpublic personal information with third parties or with affiliates for their marketing purposes, or with other financial institutions or affiliates for joint marketing purposes, unless you have authorized the Funds to do so. The Funds do not disclose any nonpublic personal information about you except as may be required to perform transactions or services you have authorized or as permitted or required by law. The Funds may disclose information about you to:
| • | | Employees, agents, and affiliates on a “need to know” basis to enable the Funds to conduct ordinary business or to comply with obligations to government regulators; |
| • | | Service providers, including the Funds’ affiliates, who assist the Funds as part of the ordinary course of business (such as printing, mailing services, or processing or servicing your account with us) or otherwise perform services on the Funds’ behalf, including companies that may perform statistical analysis, market research and marketing services solely for the Funds; |
| • | | Permit access to transfer, whether in the United States or countries outside of the United States to such Funds’ employees, agents and affiliates and service providers as required to enable the Funds to conduct ordinary business, or to comply with obligations to government regulators; |
| • | | The Funds’ representatives such as legal counsel, accountants and auditors to enable the Funds to conduct ordinary business, or to comply with obligations to government regulators; |
|
| NOT PART OF THE ANNUAL REPORT |
Legg Mason Funds Privacy and Security Notice (cont’d)
| • | | Fiduciaries or representatives acting on your behalf, such as an IRA custodian or trustee of a grantor trust. |
Except as otherwise permitted by applicable law, companies acting on the Funds’ behalf, including those outside the United States, are contractually obligated to keep nonpublic personal information the Funds provide to them confidential and to use the information the Funds share only to provide the services the Funds ask them to perform.
The Funds may disclose nonpublic personal information about you when necessary to enforce their rights or protect against fraud, or as permitted or required by applicable law, such as in connection with a law enforcement or regulatory request, subpoena, or similar legal process. In the event of a corporate action or in the event a Fund service provider changes, the Funds may be required to disclose your nonpublic personal information to third parties. While it is the Funds’ practice to obtain protections for disclosed information in these types of transactions, the Funds cannot guarantee their privacy policy will remain unchanged.
Keeping You Informed of the Funds’ Privacy and Security Practices
The Funds will notify you annually of their privacy policy as required by federal law. While the Funds reserve the right to modify this policy at any time they will notify you promptly if this privacy policy changes.
The Funds’ Security Practices
The Funds maintain appropriate physical, electronic and procedural safeguards designed to guard your nonpublic personal information. The Funds’ internal data security policies restrict access to your nonpublic personal information to authorized employees, who may use your nonpublic personal information for Fund business purposes only.
Although the Funds strive to protect your nonpublic personal information, they cannot ensure or warrant the security of any information you provide or transmit to them, and you do so at your own risk. In the event of a breach of the confidentiality or security of your nonpublic personal information, the Funds will attempt to notify you as necessary so you can take appropriate protective steps. If you have consented to the Funds using electronic communications or electronic delivery of statements, they may notify you under such circumstances using the most current email address you have on record with them.
In order for the Funds to provide effective service to you, keeping your account information accurate is very important. If you believe that your account information is incomplete, not accurate or not current, if you have questions about the Funds’ privacy practices, or our use of your nonpublic personal information, write the Funds using the contact information on your account statements, email the Funds by clicking on the Contact Us section of the Funds’ website at www.leggmason.com, or contact the Funds at 1-877-721-1926.
Revised April 2018
|
| NOT PART OF THE ANNUAL REPORT |
www.leggmason.com
© 2018 Legg Mason Investor Services, LLC Member FINRA, SIPC
LMFX013157 11/18 SR18-3465
The registrant has adopted a code of ethics that applies to the registrant’s principal executive officer, principal financial officer, principal accounting officer or controller.
| ITEM 3. | AUDIT COMMITTEE FINANCIAL EXPERT. |
The Board of Trustees of the registrant has determined that Arthur S. Mehlman the Chairman of the Board’s Audit Committee and Robert M. Tarola, possess the technical attributes identified in Instruction 2(b) of Item 3 to Form N-CSR to qualify as “audit committee financial experts,” and have designated Mr. Mehlman and Mr. Tarola as the Audit Committee’s financial experts. Mr. Mehlman and Mr. Tarola are “independent” Trustees pursuant to paragraph (a) (2) of Item 3 to Form N-CSR.
| ITEM 4. | PRINCIPAL ACCOUNTANT FEES AND SERVICES. |
a) Audit Fees. The aggregate fees billed in the last two fiscal years ending September 30, 2017 and September 30, 2018 (the “Reporting Periods”) for professional services rendered by the Registrant’s principal accountant (the “Auditor”) for the audit of the Registrant’s annual financial statements, or services that are normally provided by the Auditor in connection with the statutory and regulatory filings or engagements for the Reporting Periods, were $214,935 in September 30, 2017 and $306,746 in September 30, 2018.
b) Audit-Related Fees. The aggregate fees billed in the Reporting Period for assurance and related services by the Auditor that are reasonably related to the performance of the Registrant’s financial statements were $0 in September 30, 2017 and $0 in September 30, 2018.
(c) Tax Fees. The aggregate fees billed in the Reporting Periods for professional services rendered by the Auditor for tax compliance, tax advice and tax planning (“Tax Services”) were $27,852 in September 30, 2017 and $45,424 in September 30, 2018. These services consisted of (i) review or preparation of U.S. federal, state, local and excise tax returns; (ii) U.S. federal, state and local tax planning, advice and assistance regarding statutory, regulatory or administrative developments, and (iii) tax advice regarding tax qualification matters and/or treatment of various financial instruments held or proposed to be acquired or held.
There were no fees billed for tax services by to the service affiliates during the Reporting Periods that required pre-approval by the Audit Auditors Committee.
d) All Other Fees. The aggregate fees for other fees billed in the Reporting Periods for products and services provided by the Auditor were $0 in September 30, 2017 and $0 in September 30, 2018, other than the services reported in paragraphs (a) through (c) of this item for the Legg Mason Global Asset Management Trust.
All Other Fees. There were no other non-audit services rendered by the Auditor to Legg Mason Partners Fund Advisors, LLC (“LMPFA”), and any entity controlling, controlled by or under common control with LMPFA that provided ongoing services to Legg Mason Global Asset Management Trust requiring pre-approval by the Audit Committee in the Reporting Period.
(e) Audit Committee’s pre–approval policies and procedures described in paragraph (c)
(7) of Rule 2-01 of Regulation S-X.
(1) The Charter for the Audit Committee (the “Committee”) of the Board of each registered investment company (the “Fund”) advised by LMPFA or one of their affiliates (each, an “Adviser”) requires that the Committee shall approve (a) all audit and permissible non-audit services to be provided to the Fund and (b) all permissible non-audit services to be provided by the Fund’s independent auditors to the Adviser and any Covered Service Providers if the engagement relates directly to the operations and financial reporting of the Fund. The Committee may implement policies and procedures by which such services are approved other than by the full Committee.
The Committee shall not approve non-audit services that the Committee believes may impair the independence of the auditors. As of the date of the approval of this Audit Committee Charter, permissible non-audit services include any professional services (including tax services), that are not prohibited services as described below, provided to the Fund by the independent auditors, other than those provided to the Fund in connection with an audit or a review of the financial statements of the Fund. Permissible non-audit services may not include: (i) bookkeeping or other services related to the accounting records or financial statements of the Fund; (ii) financial information systems design and implementation; (iii) appraisal or valuation services, fairness opinions or contribution-in-kind reports; (iv) actuarial services; (v) internal audit outsourcing services; (vi) management functions or human resources; (vii) broker or dealer, investment adviser or investment banking services; (viii) legal services and expert services unrelated to the audit; and (ix) any other service the Public Company Accounting Oversight Board determines, by regulation, is impermissible.
Pre-approval by the Committee of any permissible non-audit services is not required so long as: (i) the aggregate amount of all such permissible non-audit services provided to the Fund, the Adviser and any service providers controlling, controlled by or under common control with the Adviser that provide ongoing services to the Fund (“Covered Service Providers”) constitutes not more than 5% of the total amount of revenues paid to the independent auditors during the fiscal year in which the permissible non-audit services are provided to (a) the Fund, (b) the Adviser and (c) any entity controlling, controlled by or under common control with the Adviser that provides ongoing services to the Fund during the fiscal year in which the services are provided that would have to be approved by the Committee; (ii) the permissible non-audit services were not recognized by the Fund at the time of the engagement to be non-audit services; and (iii) such services are promptly brought to the attention of the Committee and approved by the Committee (or its delegate(s)) prior to the completion of the audit.
(2) For the Legg Mason Global Asset Management Trust, the percentage of fees that were approved by the audit committee, with respect to: Audit-Related Fees were 100% and 100% for September 30, 2017 and September 30, 2018; Tax Fees were 100% and 100% for September 30, 2017 and September 30, 2018; and Other Fees were 100% and 100% for September 30, 2017 and September 30, 2018.
(f) N/A
(g) Non-audit fees billed by the Auditor for services rendered to Legg Mason Global Asset Management Trust, LMPFA and any entity controlling, controlled by, or under common control with LMPFA that provides ongoing services to Legg Mason Global Asset Management Trust during the reporting period were $271,895 in September 30, 2017 and $477,227 in September 30, 2018.
(h) Yes. Legg Mason Global Asset Management Trust’s Audit Committee has considered whether the provision of non-audit services that were rendered to Service Affiliates, which were not pre-approved (not requiring pre-approval), is compatible with maintaining the Accountant’s independence. All services provided by the Auditor to the Legg Mason Global Asset Management Trust or to Service Affiliates, which were required to be pre-approved, were pre-approved as required.
| ITEM 5. | AUDIT COMMITTEE OF LISTED REGISTRANTS. |
| | a) | The independent board members are acting as the registrant’s audit committee as specified in Section 3(a)(58)(B) of the Exchange Act. The Audit Committee consists of the following Board members: |
Ruby P. Hearn
Arnold L. Lehman
Robin J.W. Masters
Jill E. McGovern
Arthur S. Mehlman
G. Peter O’Brien
S. Ford Rowan
Robert M. Tarola
| ITEM 6. | SCHEDULE OF INVESTMENTS. |
Included herein under Item 1.
| ITEM 7. | DISCLOSURE OF PROXY VOTING POLICIES AND PROCEDURES FOR CLOSED-END MANAGEMENT INVESTMENT COMPANIES. |
Not applicable.
| ITEM 8. | PORTFOLIO MANAGERS OF CLOSED-END MANAGEMENT INVESTMENT COMPANIES. |
Not applicable.
| ITEM 9. | PURCHASES OF EQUITY SECURITIES BY CLOSED-END MANAGEMENT INVESTMENT COMPANY AND AFFILIATED PURCHASERS. |
Not applicable.
| ITEM 10. | SUBMISSION OF MATTERS TO A VOTE OF SECURITY HOLDERS. |
Not applicable.
| ITEM 11. | CONTROLS AND PROCEDURES. |
| | (a) | The registrant’s principal executive officer and principal financial officer have concluded that the registrant’s disclosure controls and procedures (as defined in Rule 30a- 3(c) under the Investment Company Act of 1940, as amended (the “1940 Act”)) are effective as of a date within 90 days of the filing date of this report that includes the disclosure required by this paragraph, based on their evaluation of the disclosure controls and procedures required by Rule 30a-3(b) under the 1940 Act and 15d-15(b) under the Securities Exchange Act of 1934. |
| | (b) | There were no changes in the registrant’s internal control over financial reporting (as defined in Rule 30a-3(d) under the 1940 Act) that occurred during the second fiscal quarter of the period covered by this report that have materially affected, or are likely to materially affect the registrant’s internal control over financial reporting. |
(a) (1) Code of Ethics attached hereto.
Exhibit 99.CODE ETH
(a) (2) Certifications pursuant to section 302 of the Sarbanes-Oxley Act of 2002 attached hereto.
Exhibit 99.CERT
(b) Certifications pursuant to Section 906 of the Sarbanes-Oxley Act of 2002 attached hereto.
Exhibit 99.906CERT
SIGNATURES
Pursuant to the requirements of the Securities Exchange Act of 1934 and the Investment Company Act of 1940, the registrant has duly caused this Report to be signed on its behalf by the undersigned, there unto duly authorized.
Legg Mason Global Asset Management Trust
| | |
| By: | | /s/ Jane Trust |
| | Jane Trust |
| | Chief Executive Officer |
Date: November 21, 2018
Pursuant to the requirements of the Securities Exchange Act of 1934 and the Investment Company Act of 1940, this report has been signed below by the following persons on behalf of the registrant and in the capacities and on the dates indicated.
| | |
| By: | | /s/ Jane Trust |
| | Jane Trust |
| | Chief Executive Officer |
|
| Date: November 21, 2018 |
| |
| By: | | /s/ Richard F. Sennett |
| | Richard F. Sennett |
| | Principal Financial Officer |
|
| Date: November 21, 2018 |