UNITED STATES
SECURITIES AND EXCHANGE COMMISSION
Washington, D.C. 20549
FORM N-CSR
CERTIFIED SHAREHOLDER REPORT OF REGISTERED
MANAGEMENT INVESTMENT COMPANIES
Investment Company Act file number 811-22338
Legg Mason Global Asset Management Trust
(Exact name of registrant as specified in charter)
620 Eighth Avenue, 49th Floor, New York, NY 10018
(Address of principal executive offices) (Zip code)
Robert I. Frenkel, Esq.
Legg Mason & Co., LLC
100 First Stamford Place
Stamford, CT 06902
(Name and address of agent for service)
Registrant’s telephone number, including area code: 1-877-721-1926
Date of fiscal year end: September 30
Date of reporting period: September 30, 2018
| ITEM 1. | REPORT TO STOCKHOLDERS |
The Annual Report to Stockholders is filed herewith.

| | |
| Annual Report | | September 30, 2018 |
RARE
GLOBAL INFRASTRUCTURE
VALUE FUND

|
| INVESTMENT PRODUCTS: NOT FDIC INSURED • NO BANK GUARANTEE • MAY LOSE VALUE |
Fund objective
The Fund seeks to provide capital appreciation and income.
Letter from the president

Dear Shareholder,
We are pleased to provide the annual report of RARE Global Infrastructure Value Fund for the twelve-month reporting period ended September 30, 2018. Please read on for a detailed look at prevailing economic and market conditions during the Fund’s reporting period and to learn how those conditions have affected Fund performance.
As always, we remain committed to providing you with excellent service and a full spectrum of investment choices. We also remain committed to supplementing the support you receive from your financial advisor. One way we accomplish this is through our website, www.leggmason.com. Here you can gain immediate access to market and investment information, including:
| • | | Fund prices and performance, |
| • | | Market insights and commentaries from our portfolio managers, and |
| • | | A host of educational resources. |
We look forward to helping you meet your financial goals.
Sincerely,

Jane Trust, CFA
President and Chief Executive Officer
October 31, 2018
| | |
| II | | RARE Global Infrastructure Value Fund |
Investment commentary
Economic review
Economic activity in the U.S. was mixed during the twelve months ended September 30, 2018 (the “reporting period”). Looking back, the U.S. Department of Commerce reported that fourth quarter 2017 and first quarter 2018 U.S. gross domestic product (“GDP”)i growth was 2.3% and 2.2%, respectively. GDP growth then accelerated to 4.2% during the second quarter of 2018 — the strongest reading since the third quarter of 2014. Finally, the U.S. Department of Commerce’s initial reading for third quarter 2018 GDP growth — released after the reporting period ended — was 3.5%. The deceleration in GDP growth in the third quarter of 2018 reflected a downturn in exports and a deceleration in nonresidential fixed investment. Imports increased in the third quarter after decreasing in the second. These movements were partly offset by an upturn in private inventory investment.
Job growth in the U.S. was solid overall and supported the economy during the reporting period. As reported by the U.S. Department of Labor, when the reporting period ended on September 30, 2018, the unemployment rate was 3.7%, versus 4.1% when the period began. September 2018’s reading was the lowest unemployment rate since 1969. The percentage of longer-term unemployed also declined during the reporting period. In September 2018, 22.9% of Americans looking for a job had been out of work for more than six months, versus 24.8% when the period began.
Turning to the global economy, in its October 2018 World Economic Outlook — released after the reporting period ended — the International Monetary Fund (“IMF”)ii said, “Global growth for 2018–19 is projected to remain steady at its 2017 level, but its pace is less vigorous than projected in April [2018] and it has become less balanced. Downside risks to global growth have risen in the past six months and the potential for upside surprises has receded.” From a regional perspective, the IMF projects 2018 growth in the Eurozone will be 2.0%, versus 2.4% in 2017. Japan’s economy is expected to expand 1.1% in 2018, compared to 1.7% in 2017. Elsewhere, the IMF projects that overall growth in emerging market countries will accelerate to 4.7% in 2018, the same as in 2017.
Looking back, at its meeting that concluded on September 20, 2017, the Federal Reserve Board (the “Fed”)iii kept the federal funds rateiv on hold, but reiterated its intention to begin reducing its balance sheet, saying, “In October, the Committee will initiate the balance sheet normalization program….” At its meeting that ended on December 13, 2017, the Fed raised rates to a range between 1.25% and 1.50%. As expected, the Fed kept rates on hold at its meeting that concluded on January 31, 2018. However, at its meeting that ended on March 21, 2018, the Fed again raised the federal funds rate, moving it to a range between 1.50% and 1.75%. At its meeting that concluded on June 13, 2018, the Fed raised the federal funds rate to a range between 1.75% and 2.00%. Finally, at its meeting that ended on September 26, 2018, the Fed raised the federal funds rate to a range between 2.00% and 2.25%.
Central banks outside the U.S. took different approaches to monetary policy during the reporting period. Looking back, in December 2016, the European Central Bank (“ECB”)v extended its bond buying program until
| | |
| RARE Global Infrastructure Value Fund | | III |
Investment commentary (cont’d)
December 2017. From April 2017 through December 2017, the ECB purchased €60 billion-per-month of bonds. In October 2017, the ECB announced that it would continue to buy bonds through September 2018, but after December 2017 it would pare its purchases to €30 billion-per-month. In June 2018, the ECB announced it would end its bond buying program by the end of the year, but it did not anticipate raising interest rates “at least through the summer of 2019”. In other developed countries, on November 2, 2017, the Bank of Englandvi raised rates from 0.25% to 0.50% — the first increase since July 2007. It then raised rates to 0.75% at its meeting on August 2, 2018. After holding rates steady at 0.10% for more than five years, in January 2016, the Bank of Japanvii announced that it cut the rate on current accounts that commercial banks hold with it to -0.10% and kept rates on hold during the reporting period. Elsewhere, the
People’s Bank of Chinaviii kept rates steady at 4.35% during the reporting period.
As always, thank you for your confidence in our stewardship of your assets.
Sincerely,
Jane Trust, CFA
President and Chief Executive Officer
October 31, 2018
All investments are subject to risk including the possible loss of principal. Past performance is no guarantee of future results. Forecasts and predictions are inherently limited and should not be relied upon as an indication of actual or future performance.
| i | Gross domestic product (“GDP”) is the market value of all final goods and services produced within a country in a given period of time. |
| ii | The International Monetary Fund (“IMF”) is an organization of 189 countries, working to foster global monetary cooperation, secure financial stability, facilitate international trade, promote high employment and sustainable economic growth, and reduce poverty around the world. |
| iii | The Federal Reserve Board (the “Fed”) is responsible for the formulation of U.S. policies designed to promote economic growth, full employment, stable prices, and a sustainable pattern of international trade and payments. |
| iv | The federal funds rate is the rate charged by one depository institution on an overnight sale of immediately available funds (balances at the Federal Reserve) to another depository institution; the rate may vary from depository institution to depository institution and from day to day. |
| v | The European Central Bank (“ECB”) is responsible for the monetary system of the European Union and the euro currency. |
| vi | The Bank of England (“BoE”), formally the Governor and Company of the BoE, is the central bank of the United Kingdom. The BoE’s purpose is to maintain monetary and financial stability. |
| vii | The Bank of Japan is the central bank of Japan. The bank is responsible for issuing and handling currency and treasury securities, implementing monetary policy, maintaining the stability of the Japanese financial system and the yen currency. |
| viii | The People’s Bank of China is the central bank of the People’s Republic of China with the power to carry out monetary policy and regulate financial institutions in mainland China. |
| | |
| IV | | RARE Global Infrastructure Value Fund |
Fund overview
Q. What is the Fund’s investment strategy?
A. The Fund seeks to provide capital appreciation and income. Under normal circumstances, the Fund invests at least 80% of its net assets, plus the amount of borrowings for investment purposes, if any, in securities issued by companies that are engaged in the infrastructure business and other investments with similar economic characteristics.
We at RARE Infrastructure (North America) Pty Ltd. (“RARE”), the Fund’s subadviser, consider companies to be engaged in the infrastructure business if at least 50% or more of their assets, income, sales or profits are committed to, derived from or related to, the construction, renovation, ownership, development, financing, management or operation of infrastructure assets or the provision of raw materials necessary for the construction and maintenance of infrastructure assets. Infrastructure assets
include physical structures, networks, developments and projects that communities and economies require to function and grow, including transportation-related infrastructure (airports, roads, railroads, and ports), energy-related infrastructure (gas pipelines, alternative energy and electrical plants), water and sewage infrastructure, communications infrastructure (fiber, copper, wireless and cable networks, broadcast towers and satellites), and social services-related infrastructure (hospitals, healthcare facilities, educational facilities, prisons, sports and entertainment facilities and stadiums) and other resources and services necessary for the construction and maintenance of infrastructure assets. The Fund concentrates its investments in companies that are engaged in the infrastructure business.
The Fund invests primarily in equity and equity-related securities of exchange-traded infrastructure companies, which may include common stocks, preferred stocks, convertible stocks and other securities convertible into equity securities, publicly-traded units of master limited partnerships (MLPs), and securities of other investment companies, exchange traded funds (ETFs) and real estate investment trusts (REITs)i. The Fund may invest in companies of any size and market capitalization, including small and mid-capitalization companies. These issuers may be newer or less-seasoned companies, including companies making initial public offerings (IPOs). The Fund’s portfolio is expected to be highly concentrated, with approximately 30-60 holdings.
The Fund may seek investment opportunities in any foreign country and may invest a significant portion of its assets in foreign securities (up to 80% of its assets). Under normal market conditions the Fund will invest in or have exposure to securities of companies located in at least three foreign countries. The Fund may invest up to 25% of its assets in securities of companies located in countries with developing or emerging markets.
The Fund may engage in forward foreign currency contracts and may use derivatives such as options and futures contracts to hedge investments or to gain exposure to the market for the underlying investments. Derivative instruments are taken into account when determining compliance with the Fund’s 80% policy. It is not anticipated that the Fund will hedge currency exposure to non-U.S. dollar denominated investments, but we reserve the right to do so.
| | |
| RARE Global Infrastructure Value Fund 2018 Annual Report | | 1 |
Fund overview (cont’d)
We use various quantitative and qualitative measures to analyze global equity securities. We apply a proprietary screening methodology to develop an investment universe of securities of companies that are
engaged in the infrastructure business. This process focuses on identifying companies with long term cash flows from regulatory and/or contractual frameworks and where cash flows are believed to be relatively
sustainable. We also focus on companies that we believe are attractively valued relative to other companies in the same industry or market. We may sell a portfolio holding if the anticipated return falls below predetermined required return bands that prompt a review of the portfolio position.
Q. What were the overall market conditions during the Fund’s reporting period?
A. The twelve-month reporting period ended September 30, 2018 was a volatile period for global equity markets dominated by geopolitical events.
Global equities started 2018 on a positive note with optimism around global growth on the back of the 2017 U.S. tax reform bill and better than expected macroeconomic data. However, in February 2018 the market reacted negatively to climbing bond yields. As it relates to listed infrastructure, the rise in bond yields weighed heavily on developed market defensive stocks, namely regulated utilities (gas, water and electric transmission and distribution companies), as for yield-driven investors, the dividend yields of these companies appeared relatively less attractive when compared to bond yields. This created an opportunity for long-term investors.
In March 2018, global equities fell sharply in the second half of the month on fears of a trade war following U.S. President Trump’s decision to impose a tariff on steel and aluminium imports, as well as a tariff on Chinese imports. The trade tension rhetoric continued to dominate the headlines throughout the reporting period. Subsequently in the second quarter of 2018, alongside the broader equity market, global listed infrastructure companies rebounded with North American gas and Western European water industries leading returns.
Within Europe, Italy was the focus after political turmoil in the country spread over to the financial markets in the second quarter of 2018. The markets also reacted to Spanish Prime Minister Mariano Rajoy facing a no-confidence vote towards the end of May 2018.
Turning to emerging markets, 2018 has been a challenging period for emerging markets equities. Growth downside risks from trade tensions persisted. Latin America experienced continued headwinds in the third quarter of 2018 largely due to uncertainty surrounding the outcome of the Brazilian general elections, which was set to take place in October 2018.
Q. How did we respond to these changing market conditions?
A. We believe that it is prudent to retain a core exposure to the more defensive, higher-income utility companies balanced against exposure to the more growth-sensitive infrastructure sectors.
During the reporting period, we increased our conviction in North American pipelines as the valuations have been very attractive.
| | |
| 2 | | RARE Global Infrastructure Value Fund 2018 Annual Report |
Additionally, the U.S. Utilities sector continued to show signs of value and, as such, over the period, we slowly increased the Fund’s exposure to this sector. As a result from a regional perspective, the Fund increased its exposure in North America to 52% during the reporting period.
Performance review
For the twelve months ended September 30, 2018, Class A shares of RARE Global Infrastructure Value Fund, excluding sales charges, returned -4.18%. The Fund’s unmanaged benchmark, the MSCI World Core Infrastructure (Net) (USD)ii, returned 4.49% for the same period. The Lipper Global Infrastructure Funds Category Average1 returned -1.39% over the same time frame.
| | | | | | | | |
Performance Snapshot as of September 30, 2018
(unaudited) | |
| (excluding sales charges) | | 6 months | | | 12 months | |
| RARE Global Infrastructure Value Fund: | | | | | | | | |
Class A | | | 2.13 | % | | | -4.18 | % |
Class I | | | 2.37 | % | | | -3.83 | % |
Class IS | | | 2.30 | % | | | -3.85 | % |
| MSCI World Core Infrastructure (Net) (USD) | | | 4.95 | % | | | 4.49 | % |
Lipper Global Infrastructure Funds
Category Average1 | | | 1.95 | % | | | -1.39 | % |
The performance shown represents past performance. Past performance is no guarantee of future results and current performance may be higher or lower than the performance shown above. Principal value and investment returns will fluctuate and investors’ shares, when redeemed, may be worth more or less than their original cost. To obtain performance data current to the most recent month-end, please visit our website at www.leggmason.com/mutualfunds.
All share class returns assume the reinvestment of all distributions at net asset value and the deduction of all Fund expenses. Returns have not been adjusted to include sales charges that may apply or the deduction of taxes that a shareholder would pay on Fund distributions. If sales charges were reflected, the performance quoted would be lower. Performance figures for periods shorter than one year represent cumulative figures and are not annualized.
Fund performance figures reflect fee waivers and/or expense reimbursements, without which the performance would have been lower.
|
| Total Annual Operating Expenses (unaudited) |
As of the Fund’s current prospectus dated February 1, 2018, as supplemented September 14, 2018, the gross total annual fund operating expense ratios for Class A, Class I and Class IS shares were 1.88%, 1.60% and 1.53%, respectively.
Actual expenses may be higher. For example, expenses may be higher than those shown if average net assets decrease. Net assets are more likely to decrease and Fund expense ratios are more likely to increase when markets are volatile.
As a result of expense limitation arrangements, the ratio of total annual fund operating expenses, other than interest, brokerage commissions, taxes, extraordinary expenses and acquired fund fees and expenses, to average net assets will not exceed 1.35% for Class A shares, 1.00% for Class I shares and 0.90% for Class IS shares.
| 1 | Lipper, Inc., a wholly-owned subsidiary of Reuters, provides independent insight on global collective investments. Returns are based on the period ended September 30, 2018, including the reinvestment of all distributions, including returns of capital, if any, calculated among the 104 funds for the six-month period and among the 96 funds for the twelve-month period in the Fund’s Lipper category, and excluding sales charges, if any. |
| | |
| RARE Global Infrastructure Value Fund 2018 Annual Report | | 3 |
Fund overview (cont’d)
In addition, the ratio of total annual fund operating expenses for Class IS shares will not exceed the ratio of total annual fund operating expenses for Class I shares. These expense limitation arrangements cannot be terminated prior to December 31, 2019 without the Board of Trustees’ consent.
The manager is permitted to recapture amounts waived and/or reimbursed to a class within three years after the fiscal year in which the manager earned the fee or incurred the expense if the class’ total annual operating expenses have fallen to a level below the expense limitation (“expense cap”) in effect at the time the fees were earned or the expenses incurred. In no case will the manager recapture any amount that would result, on any particular business day of the Fund, in the class’ total annual operating expenses exceeding the expense cap or any other lower limit then in effect.
Q. What were the leading contributors to performance?
A. During the reporting period, regional contribution was led by the U.S. & Canada and Asia Pacific Developed. On a sector level, rail and gas contributed to Fund performance. On a stock level, Cheniere Energy (a U.S. gas company), Aeroports de Paris (“ADP”) (a French airport company) and Union Pacific Corporation (“UNP”) (a U.S. rail company) were the top contributors to performance for the period.
Cheniere Energy is an energy infrastructure company that owns and operates U.S. liquefied natural gas (“LNG”) export facilities. Cheniere’s business is predominately contracted under take-or-pay contracts (85%) with investment grade counterparties. In the fourth quarter of 2017, the share price rallied strongly underpinned by the strong performance was positive news regarding the potential expansion of their Corpus Christie facility. This was driven by a positive meeting between the CEO of Cheniere Energy and the Chinese government, the signing of the Engineering Procurement and Construction contract for this expansion and improving LNG prices. Subsequently, in the second quarter of 2018, Cheniere Energy reported an outstanding quarterly result and raised 2018 guidance for their existing eight LNG trains. An LNG train is a LNG plant’s liquefaction and purification facility.
ADP owns and operates three airports in Paris, including Charles de Gaulle (“CDG”), Orly and Le Bourget, as well as minority stakes in several global airports groups, including TAV in Turkey and Schiphol in Holland. The share price of ADP rallied strongly in the first quarter of 2018 post the news that the French government plans to sell their entire 50.6% stake in ADP.
UNP is one of the largest railroad companies in North America. UNP provides an efficient and unique service relative to other transport modes and has historically exhibited pricing power ahead of inflation (subject to light hand economic regulation). The share price of UNP rallied strongly in the third quarter of 2018 after the company announced its operations overhaul plan — Unified Plan 2020.
Q. What were the leading detractors from performance?
A. During the reporting period, Asia Pacific emerging markets and Western Europe were the top regional detractors from performance. On a sector level, electric, ports and toll roads were the top detractors from Fund performance. On a stock level, PG&E Corporation (“PG&E”) (a U.S. electric utility), Atlantia (“ATL”) (an Italian toll road operator) and
| | |
| 4 | | RARE Global Infrastructure Value Fund 2018 Annual Report |
China Merchants Port Holdings (a Chinese port operator) were the top detractors from performance for the period.
PG&E is a regulated utility operating in central and northern California that serves 5.3 million electricity customers and 4.4 million gas customers in 47 of the state’s 58 counties.
The share price of PG&E pulled back sharply at the end of 2017 as the market reacted to the company’s potential connection to the Northern California bushfires.
ATL is an Italian diversified infrastructure company operating both toll road and airport concessions. The collapse of the Polcevera road bridge in Genoa on August 14, 2018 focused the market’s attention on Autostrade per l’Italia (“ASPI”), ATL’s core Italian toll road asset. The press has been reporting on the wide-ranging measures that various politicians within the new coalition government have put forward. These include rescinding the concession without compensation, to the more benign continuation of ASPI’s current concession, but with greater oversight on investment from a more hands-on independent regulator and compensation for families and the Genoa community as well as funds for the bridge reconstruction. We are closely monitoring this event and engaging with key stakeholders to determine the valuation impact for the company.
China Merchant Port Holdings (“CMP”) is China’s largest port operator across China’s five major port regions, including key hub port assets in Pearl River Delta and Yangtze River Delta. The share price of CMP fell substantially during the first quarter of 2018, post the National Development and Reform Commission’s (“NDRC”) decision to cut the benchmark container handling tariff in four ports. While this tariff cut is an unfavorable result for CMP, we believe that there are several long-term catalysts that could benefit the stock.
Q. Were there any significant changes to the Fund during the period?
A. During the reporting period, we have positioned the Fund’s core exposure to growth-oriented utilities balanced against selective exposure to defensive utilities and the more growth-sensitive infrastructure sectors.
Underpinned by valuation, the Fund initiated positions in the following stocks during the reporting period: Beijing Capital International Airport, a Chinese airport operator, CESP, a Brazilian electric company, CFE Transmission, a Brazilian electric company, Ferrovial, a Spanish-based airport operator, GMexico, a Mexican rail operator, SCANA, a US electric company, Terna, an Italian electric company, Transurban, an Australian toll road operator and VINCI, a French toll road operator.
On valuation grounds, we exited: American Tower Corporation, a US communications company, AusNet Services Limited, an Australia electric company, Central Japan Railway Company, a Japanese rail company, CSX Corporation, a US rail company, EDP Renovaveis, a Spanish electric company, Fraport, a German airport operator and Red Electrica Corp, a Spanish electric company.
Thank you for your investment in RARE Global Infrastructure Value Fund. As always, we appreciate that you have chosen us to manage your assets and we remain focused on achieving the Fund’s investment goals.
| | |
| RARE Global Infrastructure Value Fund 2018 Annual Report | | 5 |
Fund overview (cont’d)
Sincerely,

Richard Elmslie
Portfolio Manager
RARE Infrastructure (North America) Pty Ltd.

Nick Langley
Portfolio Manager
RARE Infrastructure (North America) Pty Ltd.

Charles Hamieh
Portfolio Manager
RARE Infrastructure (North America) Pty Ltd.

Shane Hurst
Portfolio Manager
RARE Infrastructure (North America) Pty Ltd.
October 22, 2018
RISKS: Equity securities are subject to market and price fluctuations. Small- and mid-cap stocks involve greater risks and volatility than large-cap stocks. Because the Fund invests significantly in companies that are engaged in the infrastructure business, the Fund is more susceptible to adverse economic, regulatory, political, legal and other changes affecting such companies. International investments are subject to special risks including currency fluctuations and social, economic and political uncertainties, which could increase volatility. These risks are magnified in emerging markets. Because this Fund holds a concentrated portfolio of securities and invests in certain regions or industries, it has increased vulnerability to market volatility. The Fund may invest in real estate investment trusts (REITs), which are closely linked to the performance of the real estate markets. REITs are subject to illiquidity, credit and interest rate risks, as well as risks associated with small- and mid-cap investments. Investments in master limited partnerships (MLPs) include the risks of declines in energy and commodity prices, decreases in energy demand, adverse weather conditions, natural or other disasters, changes in government regulation, changes in tax laws, and other risks of the MLP and energy sector. Derivatives, such as options and futures, can be illiquid, may disproportionately increase losses and have a potentially large impact on Fund performance. The Fund is non-diversified, and therefore it can invest a larger percentage of its assets in a smaller number of issuers than a diversified fund, which may magnify the Fund’s losses from events affecting a particular issuer. Please see the Fund’s prospectus for a more complete discussion of these and other risks and the Fund’s investment strategies.
Portfolio holdings and breakdowns are as of September 30, 2018 and are subject to change and may not be representative of the portfolio managers’ current or future investments. The Fund’s top ten holdings (as a percentage of net assets) as of September 30, 2018 were: Enbridge Inc. (6.4%), Transurban Group (4.5%), United
| | |
| 6 | | RARE Global Infrastructure Value Fund 2018 Annual Report |
Utilities Group PLC (4.5%), Union Pacific Corp. (4.5%), Williams Cos. Inc. (4.2%), Atlantia SpA (4.1%), National Grid PLC (4.1%), Emera Inc. (4.0%), Crown Castle International Corp. (3.9%) and Vinci SA (3.9%). Please refer to pages 14 through 16 for a list and percentage breakdown of the Fund’s holdings.
The mention of sector breakdowns is for informational purposes only and should not be construed as a recommendation to purchase or sell any securities. The information provided regarding such sectors is not a sufficient basis upon which to make an investment decision. Investors seeking financial advice regarding the appropriateness of investing in any securities or investment strategies discussed should consult their financial professional. The Fund’s top five sector holdings (as a percentage of net assets) as of September 30, 2018 were: Utilities (44.4%), Industrials (33.9%), Energy (14.3%), Real Estate (3.9%), Communication Services (1.6%) and Financials (0.9%). The Fund’s portfolio composition is subject to change at any time.
All investments are subject to risk including the possible loss of principal. Past performance is no guarantee of future results. All index performance reflects no deduction for fees, expenses or taxes. Please note that an investor cannot invest directly in an index.
The information provided is not intended to be a forecast of future events, a guarantee of future results or investment advice. Views expressed may differ from those of the firm as a whole.
| i | Real estate investment trusts (“REITs”) invest in real estate or loans secured by real estate and issue shares in such investments, which can be illiquid. |
| ii | The MSCI World Core Infrastructure Index (Net) (USD) captures large and mid-cap securities across the 23 Developed Markets (DM) countries. The Index is designed to represent the performance of listed companies within the developed markets that are engaged in core industrial infrastructure activities. |
| | |
| RARE Global Infrastructure Value Fund 2018 Annual Report | | 7 |
Fund at a glance† (unaudited)
Investment breakdown (%) as a percent of total investments
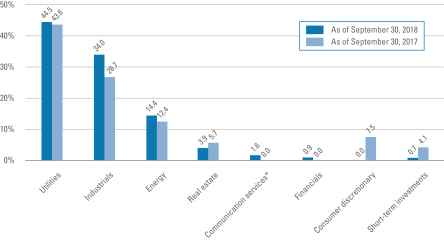
| † | The bar graph above represents the composition of the Fund’s investments as of September, 30, 2018 and September 30, 2017. The Fund is actively managed. As a result, the composition of the Fund’s investments is subject to change at any time. |
| * | As of September 28, 2018, the Telecommunication Services sector was broadened to include some companies previously classified in the Consumer Discretionary and Information Technology sectors and renamed the Communication Services sector. |
| | |
| 8 | | RARE Global Infrastructure Value Fund 2018 Annual Report |
Fund expenses (unaudited)
Example
As a shareholder of the Fund, you may incur two types of costs: (1) transaction costs, including front-end and back-end sales charges (loads) on purchase payments; and (2) ongoing costs, including management fees; service and/or distribution (12b-1) fees; and other Fund expenses. This example is intended to help you understand your ongoing costs (in dollars) of investing in the Fund and to compare these costs with the ongoing costs of investing in other mutual funds.
This example is based on an investment of $1,000 invested on April 1, 2018 and held for the six months ended September 30, 2018.
Actual expenses
The table below titled “Based on Actual Total Return” provides information about actual account values and actual expenses. You may use the information provided in this table, together with the amount you invested, to estimate the expenses that you paid over the period. To estimate the expenses you paid on your account, divide your ending account value by $1,000 (for example, an $8,600 ending account value divided by $1,000 = 8.6), then multiply the result by the number under the heading entitled “Expenses Paid During the Period”.
Hypothetical example for comparison purposes
The table below titled “Based on Hypothetical Total Return” provides information about hypothetical account values and hypothetical expenses based on the actual expense ratio and an assumed rate of return of 5.00% per year before expenses, which is not the Fund’s actual return. The hypothetical account values and expenses may not be used to estimate the actual ending account balance or expenses you paid for the period. You may use the information provided in this table to compare the ongoing costs of investing in the Fund and other funds. To do so, compare the 5.00% hypothetical example relating to the Fund with the 5.00% hypothetical examples that appear in the shareholder reports of the other funds.
Please note that the expenses shown in the table below are meant to highlight your ongoing costs only and do not reflect any transactional costs, such as front-end or back-end sales charges (loads). Therefore, the table is useful in comparing ongoing costs only, and will not help you determine the relative total costs of owning different funds. In addition, if these transaction costs were included, your costs would have been higher.
| | | | | | | | | | | | | | | | | | | | | | | | | | | | | | | | | | | | | | | | | | | | | | |
| Based on actual total return1 | | | | | | Based on hypothetical total return1 | |
| | | Actual
Total Return
Without
Sales
Charge2 | | | Beginning
Account
Value | | | Ending
Account
Value | | | Annualized
Expense
Ratio | | | Expenses
Paid
During
the
Period3 | | | | | | | | Hypothetical
Annualized
Total Return | | | Beginning
Account
Value | | | Ending
Account
Value | | | Annualized
Expense
Ratio | | | Expenses
Paid
During
the
Period3 | |
| Class A | | | 2.13 | % | | $ | 1,000.00 | | | $ | 1,021.30 | | | | 1.47 | % | | $ | 7.45 | | | | | | | Class A | | | 5.00 | % | | $ | 1,000.00 | | | $ | 1,017.70 | | | | 1.47 | % | | $ | 7.44 | |
| Class I | | | 2.37 | | | | 1,000.00 | | | | 1,023.70 | | | | 1.12 | | | | 5.68 | | | | | | | Class I | | | 5.00 | | | | 1,000.00 | | | | 1,019.45 | | | | 1.12 | | | | 5.67 | |
| Class IS | | | 2.30 | | | | 1,000.00 | | | | 1,023.00 | | | | 1.03 | | | | 5.22 | | | | | | | Class IS | | | 5.00 | | | | 1,000.00 | | | | 1,019.90 | | | | 1.03 | | | | 5.22 | |
| | |
| RARE Global Infrastructure Value Fund 2018 Annual Report | | 9 |
Fund expenses (unaudited) (cont’d)
| 1 | For the six months ended September 30, 2018. |
| 2 | Assumes the reinvestment of all distributions, including returns of capital, if any, at net asset value and does not reflect the deduction of the applicable sales charge with respect to Class A shares. Total return is not annualized, as it may not be representative of the total return for the year. Performance figures may reflect compensating balance arrangements, fee waivers and/or expense reimbursements. In the absence of compensating balance arrangements, fee waivers and/or expense reimbursements, the total return would have been lower. Past performance is no guarantee of future results. |
| 3 | Expenses (net of compensating balance arrangements, fee waivers and/or expense reimbursements) are equal to each class’ respective annualized expense ratio multiplied by the average account value over the period, multiplied by the number of days in the most recent fiscal half-year (183), then divided by 365. |
| | |
| 10 | | RARE Global Infrastructure Value Fund 2018 Annual Report |
Fund performance (unaudited)
| | | | | | | | | | | | |
| Average annual total returns | |
| Without sales charges1 | | Class A | | | Class I | | | Class IS | |
| Twelve Months Ended 9/30/18 | | | -4.18 | % | | | -3.83 | % | | | -3.85 | % |
| Inception* through 9/30/18 | | | 5.98 | | | | 6.28 | | | | 6.35 | |
| | | |
| With sales charges2 | | Class A | | | Class I | | | Class IS | |
| Twelve Months Ended 9/30/18 | | | -9.69 | % | | | -3.83 | % | | | -3.85 | % |
| Inception* through 9/30/18 | | | 3.50 | | | | 6.28 | | | | 6.35 | |
| | | | |
| Cumulative total returns | | | |
| Without sales charges1 | | | |
| Class A (Inception date of 3/31/16 through 9/30/18) | | | 15.65 | % |
| Class I (Inception date of 3/31/16 through 9/30/18) | | | 16.45 | |
| Class IS (Inception date of 3/31/16 through 9/30/18) | | | 16.65 | |
All figures represent past performance and are not a guarantee of future results. Investment return and principal value of an investment will fluctuate so that an investor’s shares, when redeemed, may be worth more or less than their original cost. The returns shown do not reflect the deduction of taxes that a shareholder would pay on Fund distributions or the redemption of Fund shares. Performance figures may reflect compensating balance arrangements, fee waivers and/or expense reimbursements. In the absence of compensating balance arrangements, fee waivers and/or expense reimbursements, the total return would have been lower.
| 1 | Assumes the reinvestment of all distributions, including returns of capital, if any, at net asset value and does not reflect the deduction of the applicable sales charge with respect to Class A shares. |
| 2 | Assumes the reinvestment of all distributions, including returns of capital, if any, at net asset value. In addition, Class A shares reflect the deduction of the maximum initial sales charge of 5.75%. |
| * | Inception date for Class A, I and IS shares is March 31, 2016. |
| | |
| RARE Global Infrastructure Value Fund 2018 Annual Report | | 11 |
Fund performance (unaudited) (cont’d)
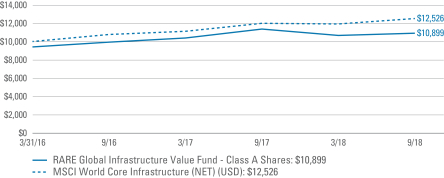
Historical performance
Value of $10,000 invested in
Class A Shares of RARE Global Infrastructure Value Fund vs. MSCI World Core Infrastructure Index (Net) (USD)† — March 31, 2016 - September 2018
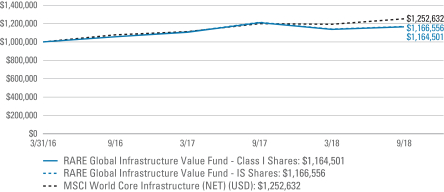
Value of $1,000,000 invested in
Class I and Class IS Shares of RARE Global Infrastructure Value Fund vs. MSCI World Core Infrastructure Index (Net) (USD)† — March 31, 2016 - September 2018
All figures represent past performance and are not a guarantee of future results. Investment return and principal value of an investment will fluctuate so that an investor’s shares, when redeemed, may be worth more or less than their original cost. The returns shown do not reflect the deduction of taxes that a shareholder would pay on Fund distributions or the redemption of Fund shares. Performance figures may reflect compensating balance arrangements, fee waivers and/or expense reimbursements. In the absence of compensating balance arrangements, fee waivers and/or expense reimbursements, the total return would have been lower.
| | |
| 12 | | RARE Global Infrastructure Value Fund 2018 Annual Report |
| † | Hypothetical illustration of $10,000 invested in Class A shares and $1,000,000 invested in Class I and Class IS shares of RARE Global Infrastructure Value Fund on March 31, 2016 (inception date), assuming the deduction of the maximum initial sales charge of 5.75% at the time of investment for Class A shares and the reinvestment of all distributions, including returns of capital, if any, at net asset value through September 30, 2018. The hypothetical illustration also assumes a $10,000 or $1,000,000 investment, as applicable, in the MSCI World Core Infrastructure Index (Net) (USD). The MSCI World Core Infrastructure Index (Net) (USD) captures large and mid-cap securities across the 23 Developed Markets countries. The index is designed to represent the performance of listed companies within the developed markets that are engaged in core industrial infrastructure activities. The index is unmanaged and not subject to the same management and trading expenses as a mutual fund. Please note that an investor cannot invest directly in an index. |
| | |
| RARE Global Infrastructure Value Fund 2018 Annual Report | | 13 |
Schedule of investments
September 30, 2018
RARE Global Infrastructure Value Fund
| | | | | | | | | | | | | | | | |
| Security | | | | | | | | Shares | | | Value | |
| Common Stocks — 99.0% | | | | | | | | | | | | | | | | |
| Communication Services — 1.6% | | | | | | | | | | | | | | | | |
Media — 1.6% | | | | | | | | | | | | | | | | |
Eutelsat Communications SA | | | | | | | | | | | 19,144 | | | $ | 452,090 | (a) |
| Energy — 14.3% | | | | | | | | | | | | | | | | |
Oil, Gas & Consumable Fuels — 14.3% | | | | | | | | | | | | | | | | |
Cheniere Energy Inc. | | | | | | | | | | | 6,148 | | | | 427,225 | * |
Enbridge Inc. | | | | | | | | | | | 56,783 | | | | 1,832,320 | |
Kinder Morgan Inc. | | | | | | | | | | | 35,999 | | | | 638,262 | |
Williams Cos. Inc. | | | | | | | | | | | 43,975 | | | | 1,195,680 | |
Total Energy | | | | | | | | | | | | | | | 4,093,487 | |
| Financials — 0.9% | | | | | | | | | | | | | | | | |
Mortgage Real Estate Investment Trusts (REITs) — 0.9% | | | | | | | | | | | | | | | | |
CFE Capital S de RL de CV | | | | | | | | | | | 276,400 | | | | 264,377 | |
| Industrials — 33.9% | | | | | | | | | | | | | | | | |
Construction & Engineering — 5.8% | | | | | | | | | | | | | | | | |
Ferrovial SA | | | | | | | | | | | 26,727 | | | | 552,660 | (a) |
Vinci SA | | | | | | | | | | | 11,557 | | | | 1,099,422 | (a) |
Total Construction & Engineering | | | | | | | | | | | | | | | 1,652,082 | |
Road & Rail — 11.2% | | | | | | | | | | | | | | | | |
Genesee & Wyoming Inc., Class A Shares | | | | | | | | | | | 8,058 | | | | 733,197 | * |
Getlink | | | | | | | | | | | 47,822 | | | | 610,753 | (a) |
GMexico Transportes SAB de CV | | | | | | | | | | | 357,500 | | | | 601,755 | (b) |
Union Pacific Corp. | | | | | | | | | | | 7,809 | | | | 1,271,540 | |
Total Road & Rail | | | | | | | | | | | | | | | 3,217,245 | |
Transportation Infrastructure — 16.9% | | | | | | | | | | | | | | | | |
Aeroports de Paris | | | | | | | | | | | 2,111 | | | | 475,230 | (a) |
Atlantia SpA | | | | | | | | | | | 57,049 | | | | 1,181,320 | (a) |
Beijing Capital International Airport Co., Ltd., Class H Shares | | | | | | | | | | | 566,000 | | | | 683,799 | (a) |
China Merchants Port Holdings Co., Ltd. | | | | | | | | | | | 364,000 | | | | 696,263 | (a) |
DP World Ltd. | | | | | | | | | | | 6,697 | | | | 127,706 | (a) |
OHL Mexico SAB de CV | | | | | | | | | | | 244,201 | | | | 366,288 | |
Transurban Group | | | | | | | | | | | 159,664 | | | | 1,290,747 | (a) |
Total Transportation Infrastructure | | | | | | | | | | | | | | | 4,821,353 | |
Total Industrials | | | | | | | | | | | | | | | 9,690,680 | |
| Real Estate — 3.9% | | | | | | | | | | | | | | | | |
Equity Real Estate Investment Trusts (REITs) — 3.9% | | | | | | | | | | | | | | | | |
Crown Castle International Corp. | | | | | | | | | | | 10,050 | | | | 1,118,867 | |
See Notes to Financial Statements.
| | |
| 14 | | RARE Global Infrastructure Value Fund 2018 Annual Report |
RARE Global Infrastructure Value Fund
| | | | | | | | | | | | | | | | |
| Security | | | | | | | | Shares | | | Value | |
| Utilities — 44.4% | | | | | | | | | | | | | | | | |
Electric Utilities — 17.7% | | | | | | | | | | | | | | | | |
American Electric Power Co. Inc. | | | | | | | | | | | 12,819 | | | $ | 908,611 | |
Edison International | | | | | | | | | | | 8,966 | | | | 606,819 | |
Emera Inc. | | | | | | | | | | | 36,428 | | | | 1,132,620 | |
NextEra Energy Inc. | | | | | | | | | | | 1,917 | | | | 321,289 | |
PG&E Corp. | | | | | | | | | | | 10,224 | | | | 470,406 | |
Spark Infrastructure Group | | | | | | | | | | | 467,656 | | | | 755,588 | (a) |
Terna Rete Elettrica Nazionale SpA | | | | | | | | | | | 95,710 | | | | 510,111 | (a) |
Transmissora Alianca de Energia Eletrica SA | | | | | | | | | | | 69,400 | | | | 343,688 | |
Total Electric Utilities | | | | | | | | | | | | | | | 5,049,132 | |
Gas Utilities — 4.8% | | | | | | | | | | | | | | | | |
APA Group | | | | | | | | | | | 70,800 | | | | 512,151 | (a) |
Infraestructura Energetica Nova SAB de CV | | | | | | | | | | | 171,007 | | | | 849,826 | |
Total Gas Utilities | | | | | | | | | | | | | | | 1,361,977 | |
Independent Power and Renewable Electricity Producers — 2.3% | | | | | | | | | | | | | | | | |
Clearway Energy, Inc., Class C Shares | | | | | | | | | | | 9,602 | | | | 184,839 | |
Pattern Energy Group Inc., Class A Shares | | | | | | | | | | | 24,258 | | | | 482,006 | |
Total Independent Power and Renewable Electricity Producers | | | | | | | | 666,845 | |
Multi-Utilities — 9.3% | | | | | | | | | | | | | | | | |
Dominion Energy Inc. | | | | | | | | | | | 4,585 | | | | 322,234 | |
National Grid PLC | | | | | | | | | | | 112,556 | | | | 1,160,608 | (a) |
SCANA Corp. | | | | | | | | | | | 19,084 | | | | 742,177 | |
Sempra Energy | | | | | | | | | | | 3,877 | | | | 441,008 | |
Total Multi-Utilities | | | | | | | | | | | | | | | 2,666,027 | |
Water Utilities — 10.3% | | | | | | | | | | | | | | | | |
Pennon Group PLC | | | | | | | | | | | 80,242 | | | | 745,378 | (a) |
Severn Trent PLC | | | | | | | | | | | 37,775 | | | | 909,721 | (a) |
United Utilities Group PLC | | | | | | | | | | | 140,388 | | | | 1,287,328 | (a) |
Total Water Utilities | | | | | | | | | | | | | | | 2,942,427 | |
Total Utilities | | | | | | | | | | | | | | | 12,686,408 | |
Total Investments before Short-Term Investments (Cost — $29,836,672) | | | | | | | | 28,305,909 | |
| | | | |
| | | | | | Rate | | | | | | | |
| Short-Term Investments — 0.8% | | | | | | | | | | | | | | | | |
Invesco Government & Agency Portfolio, Institutional Class (Cost — $215,506) | | | | | | | 2.044% | | | | 215,506 | | | | 215,506 | |
Total Investments — 99.8% (Cost — $30,052,178) | | | | | | | | | | | | | | | 28,521,415 | |
Other Assets in Excess of Liabilities — 0.2% | | | | | | | | | | | | | | | 62,547 | |
Total Net Assets — 100.0% | | | | | | | | | | | | | | $ | 28,583,962 | |
See Notes to Financial Statements.
| | |
| RARE Global Infrastructure Value Fund 2018 Annual Report | | 15 |
Schedule of investments (cont’d)
September 30, 2018
RARE Global Infrastructure Value Fund
| * | Non-income producing security. |
| (a) | Security is valued in good faith in accordance with procedures approved by the Board of Trustees (See Note 1). |
| (b) | Security is exempt from registration under Rule 144A of the Securities Act of 1933. This security may be resold in transactions that are exempt from registration, normally to qualified institutional buyers. This security has been deemed liquid pursuant to guidelines approved by the Board of Trustees. |
| | | | |
| Summary of Investments by Country** (unaudited) | | | |
| United States | | | 34.6 | % |
| United Kingdom | | | 14.4 | |
| Canada | | | 10.4 | |
| France | | | 9.2 | |
| Australia | | | 9.0 | |
| Mexico | | | 7.3 | |
| Italy | | | 5.9 | |
| China | | | 4.8 | |
| Spain | | | 1.9 | |
| Brazil | | | 1.2 | |
| United Arab Emirates | | | 0.5 | |
| Short-Term Investments | | | 0.8 | |
| | | | 100.0 | % |
| ** | As a percentage of total investments. Please note that the Fund holdings are as of September 30, 2018 and are subject to change. |
See Notes to Financial Statements.
| | |
| 16 | | RARE Global Infrastructure Value Fund 2018 Annual Report |
Statement of assets and liabilities
September 30, 2018
| | | | |
| |
| Assets: | | | | |
Investments, at value (Cost — $30,052,178) | | $ | 28,521,415 | |
Foreign currency, at value (Cost — $3,251) | | | 3,267 | |
Receivable for securities sold | | | 362,531 | |
Dividends and interest receivable | | | 52,960 | |
Receivable from investment manager | | | 20,130 | |
Receivable for Fund shares sold | | | 500 | |
Prepaid expenses | | | 23,516 | |
Total Assets | | | 28,984,319 | |
| |
| Liabilities: | | | | |
Payable for securities purchased | | | 303,806 | |
Trustees’ fees payable | | | 652 | |
Service and/or distribution fees payable | | | 40 | |
Accrued expenses | | | 95,859 | |
Total Liabilities | | | 400,357 | |
| Total Net Assets | | $ | 28,583,962 | |
| |
| Net Assets: | | | | |
Par value (Note 7) | | $ | 26 | |
Paid-in capital in excess of par value | | | 30,291,672 | |
Undistributed net investment income | | | 12,542 | |
Accumulated net realized loss on investments and foreign currency transactions | | | (189,548) | |
Net unrealized depreciation on investments and foreign currencies | | | (1,530,730) | |
| Total Net Assets | | $ | 28,583,962 | |
| |
| Net Assets: | | | | |
Class A | | | $194,084 | |
Class I | | | $294,990 | |
Class IS | | | $28,094,888 | |
| |
| Shares Outstanding: | | | | |
Class A | | | 18,022 | |
Class I | | | 27,376 | |
Class IS | | | 2,602,803 | |
| |
| Net Asset Value: | | | | |
Class A (and redemption price) | | | $10.77 | |
Class I (and redemption price) | | | $10.78 | |
Class IS (and redemption price) | | | $10.79 | |
| Maximum Public Offering Price Per Share: | | | | |
Class A (based on maximum initial sales charge of 5.75%) | | | $11.43 | |
See Notes to Financial Statements.
| | |
| RARE Global Infrastructure Value Fund 2018 Annual Report | | 17 |
Statement of operations
For the Year Ended September 30, 2018
| | | | |
| |
| Investment Income: | | | | |
Dividends | | $ | 1,124,737 | |
Income from non-cash dividends | | | 54,742 | |
Interest | | | 8,825 | |
Less: Foreign taxes withheld | | | (82,588) | |
Total Investment Income | | | 1,105,716 | |
| |
| Expenses: | | | | |
Investment management fee (Note 2) | | | 259,847 | |
Registration fees | | | 65,457 | |
Audit and tax fees | | | 40,690 | |
Fund accounting fees | | | 40,627 | |
Custody fees | | | 35,383 | |
Legal fees | | | 28,213 | |
Shareholder reports | | | 14,659 | |
Trustees’ fees | | | 4,148 | |
Transfer agent fees (Note 5) | | | 1,193 | |
Service and/or distribution fees (Notes 2 and 5) | | | 453 | |
Insurance | | | 383 | |
Interest expense | | | 56 | |
Fees recaptured by investment manager (Note 2) | | | 8 | |
Miscellaneous expenses | | | 7,023 | |
Total Expenses | | | 498,140 | |
Less: Fee waivers and/or expense reimbursements (Notes 2 and 5) | | | (196,896) | |
Net Expenses | | | 301,244 | |
| Net Investment Income | | | 804,472 | |
| |
| Realized and Unrealized Gain (Loss) on Investments and Foreign Currency Transactions (Notes 1 and 3): | | | | |
Net Realized Loss From: | | | | |
Investment transactions | | | (144,227) | |
Foreign currency transactions | | | (21,529) | |
Net Realized Loss | | | (165,756) | |
Change in Net Unrealized Appreciation (Depreciation) From: | | | | |
Investments | | | (1,753,498) | |
Foreign currencies | | | 1,352 | |
Change in Net Unrealized Appreciation (Depreciation) | | | (1,752,146) | |
| Net Loss on Investments and Foreign Currency Transactions | | | (1,917,902) | |
| Decrease in Net Assets From Operations | | $ | (1,113,430) | |
See Notes to Financial Statements.
| | |
| 18 | | RARE Global Infrastructure Value Fund 2018 Annual Report |
Statements of changes in net assets
| | | | | | | | |
| For the Years Ended September 30, | | 2018 | | | 2017 | |
| | |
| Operations: | | | | | | | | |
Net investment income | | $ | 804,472 | | | $ | 175,152 | |
Net realized gain (loss) | | | (165,756) | | | | 255,643 | |
Change in net unrealized appreciation (depreciation) | | | (1,752,146) | | | | 27,553 | |
Increase (Decrease) in Net Assets From Operations | | | (1,113,430) | | | | 458,348 | |
| | |
| Distributions to Shareholders From (Notes 1 and 6): | | | | | | | | |
Net investment income | | | (786,306) | | | | (145,006) | |
Net realized gains | | | (331,532) | | | | (50,313) | |
Decrease in Net Assets From Distributions to Shareholders | | | (1,117,838) | | | | (195,319) | |
| | |
| Fund Share Transactions (Note 7): | | | | | | | | |
Net proceeds from sale of shares | | | 2,000,935 | | | | 22,586,701 | |
Reinvestment of distributions | | | 1,117,838 | | | | 195,316 | |
Cost of shares repurchased | | | (744,319) | | | | (5,102) | |
Increase in Net Assets From Fund Share Transactions | | | 2,374,454 | | | | 22,776,915 | |
Increase in Net Assets | | | 143,186 | | | | 23,039,944 | |
| | |
| Net Assets: | | | | | | | | |
Beginning of year | | | 28,440,776 | | | | 5,400,832 | |
End of year* | | $ | 28,583,962 | | | $ | 28,440,776 | |
*Includes undistributed net investment income of: | | | $12,542 | | | | $17,358 | |
See Notes to Financial Statements.
| | |
| RARE Global Infrastructure Value Fund 2018 Annual Report | | 19 |
Financial highlights
| | | | | | | | | | | | |
For a share of each class of beneficial interest outstanding throughout each year ended September 30,
unless otherwise noted: | |
| Class A Shares1 | | 2018 | | | 2017 | | | 20162 | |
| | | |
| Net asset value, beginning of year | | | $11.65 | | | | $10.46 | | | | $10.00 | |
| | | |
| Income (loss) from operations: | | | | | | | | | | | | |
Net investment income | | | 0.28 | | | | 0.20 | | | | 0.08 | |
Net realized and unrealized gain (loss) | | | (0.77) | | | | 1.27 | | | | 0.47 | |
Total income (loss) from operations | | | (0.49) | | | | 1.47 | | | | 0.55 | |
| | | |
| Less distributions from: | | | | | | | | | | | | |
Net investment income | | | (0.26) | | | | (0.18) | | | | (0.09) | |
Net realized gains | | | (0.13) | | | | (0.10) | | | | — | |
Total distributions | | | (0.39) | | | | (0.28) | | | | (0.09) | |
| | | |
| Net asset value, end of year | | | $10.77 | | | | $11.65 | | | | $10.46 | |
Total return3 | | | (4.18) | % | | | 14.38 | % | | | 5.51 | % |
| | | |
| Net assets, end of year (000s) | | | $194 | | | | $167 | | | | $119 | |
| | | |
| Ratios to average net assets: | | | | | | | | | | | | |
Gross expenses | | | 2.11 | % | | | 5.45 | % | | | 8.10 | %4 |
Net expenses5,6 | | | 1.44 | | | | 1.27 | | | | 1.31 | 4 |
Net investment income | | | 2.50 | | | | 1.89 | | | | 1.60 | 4 |
| | | |
| Portfolio turnover rate | | | 58 | % | | | 37 | % | | | 22 | % |
| 1 | Per share amounts have been calculated using the average shares method. |
| 2 | For the period March 31, 2016 (inception date) to September 30, 2016. |
| 3 | Performance figures, exclusive of sales charges, may reflect compensating balance arrangements, fee waivers and/or expense reimbursements. In the absence of compensating balance arrangements, fee waivers and/or expense reimbursements, the total return would have been lower. Past performance is no guarantee of future results. Total returns for periods of less than one year are not annualized. |
| 5 | Reflects fee waivers and/or expense reimbursements. |
| 6 | As a result of an expense limitation arrangement, effective September 14, 2018, the ratio of total annual fund operating expenses, other than interest, brokerage commissions, taxes, extraordinary expenses and acquired fund fees and expenses, to average net assets of Class A shares did not exceed 1.35%. This expense limitation arrangement cannot be terminated prior to December 31, 2019 without the Board of Trustees’ consent. Prior to September 14, 2018, as a result of an expense limitation arrangement, the ratio of total annual fund operating expenses to average net assets of Class A shares did not exceed 1.50%. |
See Notes to Financial Statements.
| | |
| 20 | | RARE Global Infrastructure Value Fund 2018 Annual Report |
| | | | | | | | | | | | |
For a share of each class of beneficial interest outstanding throughout each year ended September 30,
unless otherwise noted: | |
| Class I Shares1 | | 2018 | | | 2017 | | | 20162 | |
| | | |
| Net asset value, beginning of year | | | $11.65 | | | | $10.46 | | | | $10.00 | |
| | | |
| Income (loss) from operations: | | | | | | | | | | | | |
Net investment income | | | 0.30 | | | | 0.23 | | | | 0.10 | |
Net realized and unrealized gain (loss) | | | (0.75) | | | | 1.26 | | | | 0.46 | |
Total income (loss) from operations | | | (0.45) | | | | 1.49 | | �� | | 0.56 | |
| | | |
| Less distributions from: | | | | | | | | | | | | |
Net investment income | | | (0.29) | | | | (0.20) | | | | (0.10) | |
Net realized gains | | | (0.13) | | | | (0.10) | | | | — | |
Total distributions | | | (0.42) | | | | (0.30) | | | | (0.10) | |
| | | |
| Net asset value, end of year | | | $10.78 | | | | $11.65 | | | | $10.46 | |
Total return3 | | | (3.83) | % | | | 14.63 | % | | | 5.63 | % |
| | | |
| Net assets, end of year (000s) | | | $295 | | | | $304 | | | | $210 | |
| | | |
| Ratios to average net assets: | | | | | | | | | | | | |
Gross expenses | | | 1.80 | % | | | 5.25 | % | | | 7.78 | %4 |
Net expenses5,6 | | | 1.12 | | | | 1.06 | | | | 1.05 | 4 |
Net investment income | | | 2.72 | | | | 2.10 | | | | 2.05 | 4 |
| | | |
| Portfolio turnover rate | | | 58 | % | | | 37 | % | | | 22 | % |
| 1 | Per share amounts have been calculated using the average shares method. |
| 2 | For the period March 31, 2016 (inception date) to September 30, 2016. |
| 3 | Performance figures may reflect compensating balance arrangements, fee waivers and/or expense reimbursements. In the absence of compensating balance arrangements, fee waivers and/or expense reimbursements, the total return would have been lower. Past performance is no guarantee of future results. Total returns for periods of less than one year are not annualized. |
| 5 | Reflects fee waivers and/or expense reimbursements. |
| 6 | As a result of an expense limitation arrangement, effective September 14, 2018, the ratio of total annual fund operating expenses, other than interest, brokerage commissions, taxes, extraordinary expenses and acquired fund fees and expenses, to average net assets of Class I shares did not exceed 1.00%. This expense limitation arrangement cannot be terminated prior to December 31, 2019 without the Board of Trustees’ consent. Prior to September 14, 2018, as a result of an expense limitation arrangement, the ratio of total annual fund operating expenses to average net assets of Class I shares did not exceed 1.15%. |
See Notes to Financial Statements.
| | |
| RARE Global Infrastructure Value Fund 2018 Annual Report | | 21 |
Financial highlights (cont’d)
| | | | | | | | | | | | |
For a share of each class of beneficial interest outstanding throughout each year ended September 30,
unless otherwise noted: | |
| Class IS Shares1 | | 2018 | | | 2017 | | | 20162 | |
| | | |
| Net asset value, beginning of year | | | $11.67 | | | | $10.46 | | | | $10.00 | |
| | | |
| Income (loss) from operations: | | | | | | | | | | | | |
Net investment income | | | 0.31 | | | | 0.28 | | | | 0.10 | |
Net realized and unrealized gain (loss) | | | (0.76) | | | | 1.23 | | | | 0.46 | |
Total income (loss) from operations | | | (0.45) | | | | 1.51 | | | | 0.56 | |
| | | |
| Less distributions from: | | | | | | | | | | | | |
Net investment income | | | (0.30) | | | | (0.20) | | | | (0.10) | |
Net realized gains | | | (0.13) | | | | (0.10) | | | | — | |
Total distributions | | | (0.43) | | | | (0.30) | | | | (0.10) | |
| | | |
| Net asset value, end of year | | | $10.79 | | | | $11.67 | | | | $10.46 | |
Total return3 | | | (3.85) | % | | | 14.84 | % | | | 5.64 | % |
| | | |
| Net assets, end of year (000s) | | | $28,095 | | | | $27,969 | | | | $5,072 | |
| | | |
| Ratios to average net assets: | | | | | | | | | | | | |
Gross expenses | | | 1.72 | %4 | | | 4.58 | %4 | | | 7.85 | %5 |
Net expenses6,7 | | | 1.04 | 4 | | | 0.48 | 4 | | | 1.05 | 5 |
Net investment income | | | 2.79 | | | | 2.59 | | | | 1.86 | 5 |
| | | |
| Portfolio turnover rate | | | 58 | % | | | 37 | % | | | 22 | % |
| 1 | Per share amounts have been calculated using the average shares method. |
| 2 | For the period March 31, 2016 (inception date) to September 30, 2016. |
| 3 | Performance figures may reflect compensating balance arrangements, fee waivers and/or expense reimbursements. In the absence of compensating balance arrangements, fee waivers and/or expense reimbursements, the total return would have been lower. Past performance is no guarantee of future results. Total returns for periods of less than one year are not annualized. |
| 4 | Reflects recapture of fees waived and/or expenses reimbursed from prior fiscal years. |
| 6 | Reflects fee waivers and/or expense reimbursements. |
| 7 | As a result of an expense limitation arrangement, effective September 14, 2018, the ratio of total annual fund operating expenses, other than interest, brokerage commissions , taxes, extraordinary expenses and acquired fund fees and expenses, to average net assets of Class IS shares did not exceed 0.90%. In addition, the ratio of total annual fund operating expenses for Class IS shares did not exceed the ratio of total annual fund operating expenses for Class I shares. These expense limitation arrangements cannot be terminated prior to December 31, 2019 without the Board of Trustees’ consent. Prior to September 14, 2018, as a result of expense limitation arrangements, the ratio of total annual fund operating expenses to average net assets of Class IS shares did not exceed 1.05%. In addition, the ratio of total annual fund operating expenses for Class IS shares did not exceed the ratio of total annual fund operating expenses of Class I shares. |
See Notes to Financial Statements.
| | |
| 22 | | RARE Global Infrastructure Value Fund 2018 Annual Report |
Notes to financial statements
1. Organization and significant accounting policies
RARE Global Infrastructure Value Fund (the “Fund”) is a separate non-diversified investment series of Legg Mason Global Asset Management Trust (the “Trust”). The Trust, a Maryland statutory trust, is registered under the Investment Company Act of 1940, as amended (the “1940 Act”), as an open-end management investment company.
The following are significant accounting policies consistently followed by the Fund and are in conformity with U.S. generally accepted accounting principles (“GAAP”). Estimates and assumptions are required to be made regarding assets, liabilities and changes in net assets resulting from operations when financial statements are prepared. Changes in the economic environment, financial markets and any other parameters used in determining these estimates could cause actual results to differ. Subsequent events have been evaluated through the date the financial statements were issued.
(a) Investment valuation. Equity securities for which market quotations are available are valued at the last reported sales price or official closing price on the primary market or exchange on which they trade. The valuations for fixed income securities (which may include, but are not limited to, corporate, government, municipal, mortgage-backed, collateralized mortgage obligations and asset-backed securities) and certain derivative instruments are typically the prices supplied by independent third party pricing services, which may use market prices or broker/dealer quotations or a variety of valuation techniques and methodologies. The independent third party pricing services use inputs that are observable such as issuer details, interest rates, yield curves, prepayment speeds, credit risks/spreads, default rates and quoted prices for similar securities. Prior to December 1, 2017, short-term fixed income securities that would mature in 60 days or less were valued at amortized cost, unless it was determined that using this method would not reflect an investment’s fair value. Investments in open-end funds are valued at the closing net asset value per share of each fund on the day of valuation. When the Fund holds securities or other assets that are denominated in a foreign currency, the Fund will normally use the currency exchange rates as of 4:00 p.m. (Eastern Time). If independent third party pricing services are unable to supply prices for a portfolio investment, or if the prices supplied are deemed by the manager to be unreliable, the market price may be determined by the manager using quotations from one or more broker/dealers or at the transaction price if the security has recently been purchased and no value has yet been obtained from a pricing service or pricing broker. When reliable prices are not readily available, such as when the value of a security has been significantly affected by events after the close of the exchange or market on which the security is principally traded, but before the Fund calculates its net asset value, the Fund values these securities as determined in accordance with procedures approved by the Fund’s Board of Trustees.
The Board of Trustees is responsible for the valuation process and has delegated the supervision of the daily valuation process to the Legg Mason North Atlantic Fund Valuation Committee (the “Valuation Committee”). The Valuation Committee, pursuant to the policies adopted by the Board of Trustees, is responsible for making fair value determinations,
| | |
| RARE Global Infrastructure Value Fund 2018 Annual Report | | 23 |
Notes to financial statements (cont’d)
evaluating the effectiveness of the Fund’s pricing policies, and reporting to the Board of Trustees. When determining the reliability of third party pricing information for investments owned by the Fund, the Valuation Committee, among other things, conducts due diligence reviews of pricing vendors, monitors the daily change in prices and reviews transactions among market participants.
The Valuation Committee will consider pricing methodologies it deems relevant and appropriate when making fair value determinations. Examples of possible methodologies include, but are not limited to, multiple of earnings; discount from market of a similar freely traded security; discounted cash-flow analysis; book value or a multiple thereof; risk premium/yield analysis; yield to maturity; and/or fundamental investment analysis. The Valuation Committee will also consider factors it deems relevant and appropriate in light of the facts and circumstances. Examples of possible factors include, but are not limited to, the type of security; the issuer’s financial statements; the purchase price of the security; the discount from market value of unrestricted securities of the same class at the time of purchase; analysts’ research and observations from financial institutions; information regarding any transactions or offers with respect to the security; the existence of merger proposals or tender offers affecting the security; the price and extent of public trading in similar securities of the issuer or comparable companies; and the existence of a shelf registration for restricted securities.
For each portfolio security that has been fair valued pursuant to the policies adopted by the Board of Trustees, the fair value price is compared against the last available and next available market quotations. The Valuation Committee reviews the results of such back testing monthly and fair valuation occurrences are reported to the Board of Trustees quarterly.
The Fund uses valuation techniques to measure fair value that are consistent with the market approach and/or income approach, depending on the type of security and the particular circumstance. The market approach uses prices and other relevant information generated by market transactions involving identical or comparable securities. The income approach uses valuation techniques to discount estimated future cash flows to present value.
GAAP establishes a disclosure hierarchy that categorizes the inputs to valuation techniques used to value assets and liabilities at measurement date. These inputs are summarized in the three broad levels listed below:
| • | | Level 1 — quoted prices in active markets for identical investments |
| • | | Level 2 — other significant observable inputs (including quoted prices for similar investments, interest rates, prepayment speeds, credit risk, etc.) |
| • | | Level 3 — significant unobservable inputs (including the Fund’s own assumptions in determining the fair value of investments) |
The inputs or methodologies used to value securities are not necessarily an indication of the risk associated with investing in those securities.
| | |
| 24 | | RARE Global Infrastructure Value Fund 2018 Annual Report |
The following is a summary of the inputs used in valuing the Fund’s assets carried at fair value:
| | | | | | | | | | | | | | | | |
| ASSETS | |
| Description | | Quoted Prices
(Level 1) | | | Other Significant
Observable Inputs
(Level 2) | | | Significant
Unobservable
Inputs
(Level 3) | | | Total | |
| Long-term investments†: | | | | | | | | | | | | | | | | |
Common stocks: | | | | | | | | | | | | | | | | |
Communication services | | | — | | | $ | 452,090 | | | | — | | | $ | 452,090 | |
Industrials | | $ | 2,972,780 | | | | 6,717,900 | | | | — | | | | 9,690,680 | |
Utilities | | | 6,805,523 | | | | 5,880,885 | | | | — | | | | 12,686,408 | |
Other common stocks | | | 5,476,731 | | | | — | | | | — | | | | 5,476,731 | |
| Total long-term investments | | | 15,255,034 | | | | 13,050,875 | | | | — | | | | 28,305,909 | |
| Short-term investments† | | | 215,506 | | | | — | | | | — | | | | 215,506 | |
| Total investments | | $ | 15,470,540 | | | $ | 13,050,875 | | | | — | | | $ | 28,521,415 | |
| † | See Schedule of Investments for additional detailed categorizations. |
For the year ended September 30, 2018, as a result of the fair value pricing procedures for international equities utilized by the Fund, certain securities have transferred in and out of Level 1 and Level 2 measurements during the period. The Fund’s policy is to recognize transfers between levels as of the reporting period. At September 30, 2018, securities valued at $13,050,875 were classified as Level 2 within the fair value hierarchy because fair value procedures were applied when the change in value of a domestic equity security index suggested that the closing prices on foreign exchanges may no longer have represented the value of those securities at the time of closing of the NYSE.
(b) Foreign currency translation. Investment securities and other assets and liabilities denominated in foreign currencies are translated into U.S. dollar amounts based upon prevailing exchange rates on the date of valuation. Purchases and sales of investment securities and income and expense items denominated in foreign currencies are translated into U.S. dollar amounts based upon prevailing exchange rates on the respective dates of such transactions.
The Fund does not isolate that portion of the results of operations resulting from fluctuations in foreign exchange rates on investments from the fluctuations arising from changes in market prices of securities held. Such fluctuations are included with the net realized and unrealized gain or loss on investments.
Net realized foreign exchange gains or losses arise from sales of foreign currencies, including gains and losses on forward foreign currency contracts, currency gains or losses realized between the trade and settlement dates on securities transactions, and the difference between the amounts of dividends, interest, and foreign withholding taxes recorded on the Fund’s books and the U.S. dollar equivalent of the amounts actually received or paid. Net unrealized foreign exchange gains and losses arise from changes in the values of assets and liabilities, other than investments in securities, on the date of valuation, resulting from changes in exchange rates.
| | |
| RARE Global Infrastructure Value Fund 2018 Annual Report | | 25 |
Notes to financial statements (cont’d)
Foreign security and currency transactions may involve certain considerations and risks not typically associated with those of U.S. dollar denominated transactions as a result of, among other factors, the possibility of lower levels of governmental supervision and regulation of foreign securities markets and the possibility of political or economic instability.
(c) Foreign investment risks. The Fund’s investments in foreign securities may involve risks not present in domestic investments. Since securities may be denominated in foreign currencies, may require settlement in foreign currencies or pay interest or dividends in foreign currencies, changes in the relationship of these foreign currencies to the U.S. dollar can significantly affect the value of the investments and earnings of the Fund. Foreign investments may also subject the Fund to foreign government exchange restrictions, expropriation, taxation or other political, social or economic developments, all of which affect the market and/or credit risk of the investments.
(d) Concentration risk. The Fund invests significantly in companies that are engaged in the infrastructure business and is therefore more susceptible to adverse economic, regulatory, political, legal and other changes affecting such companies.
(e) Security transactions and investment income. Security transactions are accounted for on a trade date basis. Interest income (including interest income from payment-in-kind securities), adjusted for amortization of premium and accretion of discount, is recorded on the accrual basis. Dividend income is recorded on the ex-dividend date for dividends received in cash and/or securities. Foreign dividend income is recorded on the ex-dividend date or as soon as practicable after the Fund determines the existence of a dividend declaration after exercising reasonable due diligence. The cost of investments sold is determined by use of the specific identification method. To the extent any issuer defaults or a credit event occurs that impacts the issuer, the Fund may halt any additional interest income accruals and consider the realizability of interest accrued up to the date of default or credit event.
(f) REIT distributions. The character of distributions received from Real Estate Investment Trusts (‘‘REITs’’) held by the Fund is generally comprised of net investment income, capital gains, and return of capital. It is the policy of the Fund to estimate the character of distributions received from underlying REITs based on historical data provided by the REITs. After each calendar year end, REITs report the actual tax character of these distributions. Differences between the estimated and actual amounts reported by the REITs are reflected in the Fund’s records in the year in which they are reported by the REITs by adjusting related investment cost basis, capital gains and income, as necessary.
(g) Distributions to shareholders. Distributions from net investment income of the Fund, if any, are declared and paid on a quarterly basis. Distributions of net realized gains, if any, are declared at least annually. Distributions to shareholders of the Fund are recorded on the ex-dividend date and are determined in accordance with income tax regulations, which may differ from GAAP.
| | |
| 26 | | RARE Global Infrastructure Value Fund 2018 Annual Report |
(h) Share class accounting. Investment income, common expenses and realized/ unrealized gains (losses) on investments are allocated to the various classes of the Fund on the basis of daily net assets of each class. Fees relating to a specific class are charged directly to that share class.
(i) Compensating balance arrangements. The Fund has an arrangement with its custodian bank whereby a portion of the custodian’s fees is paid indirectly by credits earned on the Fund’s cash on deposit with the bank.
(j) Federal and other taxes. It is the Fund’s policy to comply with the federal income and excise tax requirements of the Internal Revenue Code of 1986 (the “Code”), as amended, applicable to regulated investment companies. Accordingly, the Fund intends to distribute its taxable income and net realized gains, if any, to shareholders in accordance with timing requirements imposed by the Code. Therefore, no federal or state income tax provision is required in the Fund’s financial statements.
Management has analyzed the Fund’s tax positions taken on income tax returns for all open tax years and has concluded that as of September 30, 2018, no provision for income tax is required in the Fund’s financial statements. The Fund’s federal and state income and federal excise tax returns for tax years for which the applicable statutes of limitations have not expired are subject to examination by the Internal Revenue Service and state departments of revenue.
Under the applicable foreign tax laws, a withholding tax may be imposed on interest, dividends and capital gains at various rates.
(k) Reclassification. GAAP requires that certain components of net assets be reclassified to reflect permanent differences between financial and tax reporting. These reclassifications have no effect on net assets or net asset value per share. During the current year, the following reclassifications have been made:
| | | | | | | | |
| | | Undistributed Net
Investment Income | | | Accumulated Net
Realized Loss | |
| (a) | | $ | (22,982) | | | $ | 22,982 | |
| (a) | Reclassifications are due to foreign currency transactions treated as ordinary income for tax purposes and book/tax differences in the treatment of distributions. |
2. Investment management agreement and other transactions with affiliates
Legg Mason Partners Fund Advisor, LLC (“LMPFA”) is the Fund’s investment manager and RARE Infrastructure (North America) Pty Ltd. (“RARE”) is the Fund’s subadviser. Western Asset Management Company, LLC (formerly Western Asset Management Company) (“Western Asset”) manages the portion of the Fund’s cash and short-term instruments allocated to it. LMPFA and Western Asset are wholly-owned subsidiaries of Legg Mason, Inc. (“Legg Mason”) and RARE is a subsidiary of Legg Mason.
| | |
| RARE Global Infrastructure Value Fund 2018 Annual Report | | 27 |
Notes to financial statements (cont’d)
Under the investment management agreement, the Fund pays an investment management fee, calculated daily and paid monthly, in accordance with the following breakpoint schedule:
| | | | |
| Average Daily Net Assets | | Annual Rate | |
| First $1 billion | | | 0.900 | % |
| Next $1 billion | | | 0.875 | |
| Next $3 billion | | | 0.850 | |
| Next $5 billion | | | 0.825 | |
| Over $10 billion | | | 0.800 | |
LMPFA provides administrative and certain oversight services to the Fund. LMPFA delegates to the subadviser the day-to-day portfolio management of the Fund, except for the management of the portion of the cash and short-term instruments allocated to Western Asset. For their services, LMPFA pays RARE and Western Asset monthly an aggregate fee equal to 70% of the net management fee it receives from the Fund.
Effective September 14, 2018, as a result of expense limitation arrangements between the Fund and LMPFA, the ratio of total annual fund operating expenses, other than interest, brokerage commissions, taxes, extraordinary expenses and acquired fund fees and expenses, to average net assets of Class A, Class I and Class IS shares did not exceed 1.35%, 1.00% and 0.90%, respectively. In addition, the ratio of total annual fund operating expenses for Class IS shares did not exceed the ratio of total annual fund operating expenses for Class I shares. These expense limitation arrangements cannot be terminated prior to December 31, 2019 without the Board of Trustees’ consent.
Prior to September 14, 2018, as a result of expense limitation arrangements between the Fund and LMPFA, the ratio of total annual fund operating expenses other than interest, brokerage commissions, taxes, extraordinary expenses and acquired fund fees and expenses, to average net assets of Class A, Class I and Class IS shares did not exceed 1.50%, 1.15% and 1.05%, respectively. In addition, the ratio of total annual fund operating expenses of Class IS shares did not exceed the ratio of total annual fund operating expenses for Class I shares.
During the year ended September 30, 2018, fees waived and/or expenses reimbursed amounted to $196,896.
LMPFA is permitted to recapture amounts waived and/or reimbursed to a class within the three years after the fiscal year in which LMPFA earned the fee or incurred the expense if the class’ total annual operating expenses have fallen to a level below the expense limitation (“expense cap”) in effect at the time the fees were earned or the expenses incurred. In no case will LMPFA recapture any amount that would result, on any particular business day of the Fund, in the class’ total annual operating expenses exceeding the expense cap or any other lower limit then in effect.
| | |
| 28 | | RARE Global Infrastructure Value Fund 2018 Annual Report |
Pursuant to these arrangements, at September 30, 2018, the Fund had remaining fee waivers and/or expense reimbursements subject to recapture by LMPFA and respective dates of expiration as follows:
| | | | | | | | | | | | |
| | | Class A | | | Class I | | | Class IS | |
| Expires September 30, 2019 | | $ | 3,770 | | | $ | 4,150 | | | $ | 168,304 | |
| Expires September 30, 2020 | | | 5,600 | | | | 10,874 | | | | 264,947 | |
| Expires September 30, 2021 | | | 1,225 | | | | 2,096 | | | | 193,575 | |
| Total fee waivers/expense reimbursements subject to recapture | | $ | 10,595 | | | $ | 17,120 | | | $ | 626,826 | |
For the year ended September 30, 2018, fee waivers and/or expense reimbursements recaptured by LMPFA, if any, were as follows:
| | | | |
| | | Class IS | |
| LMPFA recaptured | | $ | 8 | |
Legg Mason Investor Services, LLC (“LMIS”), a wholly-owned broker-dealer subsidiary of Legg Mason, serves as the Fund’s sole and exclusive distributor.
There is a maximum initial sales charge of 5.75% for Class A shares. In certain cases, Class A shares have a contingent deferred sales charge (“CDSC”) of 1.00%, which applies if redemption occurs within 18 months from purchase payment. This CDSC only applies to those purchases of Class A shares, which, when combined with current holdings of other shares of funds sold by LMIS, equal or exceed $1,000,000 in the aggregate. These purchases do not incur an initial sales charge.
For the year ended September 30, 2018, LMIS and its affiliates did not receive any sales charges on sales of the Fund’s Class A shares. In addition, for the year ended September 30, 2018, there were no CDSCs paid to LMIS and its affiliates.
All officers and one Trustee of the Trust are employees of Legg Mason or its affiliates and do not receive compensation from the Trust.
As of September 30, 2018, Legg Mason and its affiliates owned 99% of the Fund.
3. Investments
During the year ended September 30, 2018, the aggregate cost of purchases and proceeds from sales of investments (excluding short-term investments) were as follows:
| | | | |
| Purchases | | $ | 18,824,588 | |
| Sales | | | 16,243,328 | |
At September 30, 2018, the aggregate cost of investments and the aggregate gross unrealized appreciation and depreciation of investments for federal income tax purposes were as follows:
| | | | | | | | | | | | | | | | |
| | | Cost | | | Gross
Unrealized
Appreciation | | | Gross
Unrealized
Depreciation | | | Net
Unrealized
Depreciation | |
| Securities | | $ | 30,071,661 | | | $ | 1,199,288 | | | $ | (2,749,534) | | | $ | (1,550,246) | |
| | |
| RARE Global Infrastructure Value Fund 2018 Annual Report | | 29 |
Notes to financial statements (cont’d)
4. Derivative instruments and hedging activities
During the year ended September 30, 2018, the Fund did not invest in derivative instruments.
5. Class specific expenses, waivers and/or expense reimbursements
The Fund has adopted a Rule 12b-1 shareholder services and distribution plan and under that plan the Fund pays service and/or distribution fees with respect to its Class A shares calculated at the annual rate of 0.25% of the average daily net assets of the class. Service and/or distribution fees are accrued daily and paid monthly.
For the year ended September 30, 2018, class specific expenses were as follows:
| | | | | | | | |
| | | Service and/or
Distribution Fees | | | Transfer Agent
Fees | |
| Class A | | $ | 453 | | | $ | 230 | |
| Class I | | | — | | | | 268 | |
| Class IS | | | — | | | | 695 | |
| Total | | $ | 453 | | | $ | 1,193 | |
For the year ended September 30, 2018, waivers and/or expense reimbursements by class were as follows:
| | | | |
| | | Waivers/Expense
Reimbursements | |
| Class A | | $ | 1,226 | |
| Class I | | | 2,095 | |
| Class IS | | | 193,575 | |
| Total | | $ | 196,896 | |
6. Distributions to shareholders by class
| | | | | | | | |
| | | Year Ended
September 30, 2018 | | | Year Ended
September 30, 2017 | |
| Net Investment Income: | | | | | | | | |
| Class A | | $ | 4,465 | | | $ | 2,184 | |
| Class I | | | 8,180 | | | | 4,809 | |
| Class IS | | | 773,661 | | | | 138,013 | |
| Total | | $ | 786,306 | | | $ | 145,006 | |
| | |
| Net Realized Gains: | | | | | | | | |
| Class A | | $ | 1,860 | | | $ | 1,107 | |
| Class I | | | 3,541 | | | | 2,118 | |
| Class IS | | | 326,131 | | | | 47,088 | |
| Total | | $ | 331,532 | | | $ | 50,313 | |
7. Shares of beneficial interest
At September 30, 2018, the Trust had an unlimited number of shares of beneficial interest authorized with a par value of $0.00001 per share. The Fund has the ability to issue multiple classes of shares. Each class of shares represents an identical interest and has the same rights, except that each class bears certain direct expenses, including those specifically related to the distribution of its shares.
| | |
| 30 | | RARE Global Infrastructure Value Fund 2018 Annual Report |
Transactions in shares of each class were as follows:
| | | | | | | | | | | | | | | | |
| | | Year Ended
September 30, 2018 | | | Year Ended
September 30, 2017 | |
| | | Shares | | | Amount | | | Shares | | | Amount | |
| Class A | | | | | | | | | | | | | | | | |
| Shares sold | | | 6,664 | | | $ | 72,641 | | | | 3,086 | | | $ | 34,225 | |
| Shares issued on reinvestment | | | 581 | | | | 6,325 | | | | 320 | | | | 3,289 | |
| Shares repurchased | | | (3,596) | | | | (40,635) | | | | (422) | | | | (4,859) | |
| Net increase | | | 3,649 | | | $ | 38,331 | | | | 2,984 | | | $ | 32,655 | |
| | | | |
| Class I | | | | | | | | | | | | | | | | |
| Shares sold | | | 2,307 | | | $ | 25,700 | | | | 5,433 | | | $ | 54,900 | |
| Shares issued on reinvestment | | | 1,075 | | | | 11,721 | | | | 670 | | | | 6,927 | |
| Shares repurchased | | | (2,112) | | | | (23,249) | | | | (22) | | | | (243) | |
| Net increase | | | 1,270 | | | $ | 14,172 | | | | 6,081 | | | $ | 61,584 | |
| | | | |
| Class IS | | | | | | | | | | | | | | | | |
| Shares sold | | | 166,961 | | | $ | 1,902,594 | | | | 1,894,086 | | | $ | 22,497,576 | |
| Shares issued on reinvestment | | | 100,715 | | | | 1,099,792 | | | | 17,554 | | | | 185,100 | |
| Shares repurchased | | | (61,307) | | | | (680,435) | | | | — | | | | — | |
| Net increase | | | 206,369 | | | $ | 2,321,951 | | | | 1,911,640 | | | $ | 22,682,676 | |
8. Income tax information and distributions to shareholders
The tax character of distributions paid during the fiscal years ended September 30, was as follows:
| | | | | | | | |
| | | 2018 | | | 2017 | |
| Distributions paid from: | | | | | | | | |
| Ordinary income | | $ | 884,922 | | | $ | 195,023 | |
| Net long-term capital gains | | | 232,916 | | | | 296 | |
| Total distributions paid | | $ | 1,117,838 | | | $ | 195,319 | |
As of September 30, 2018, the components of accumulated earnings (losses) on a tax basis were as follows:
| | | | |
| Undistributed ordinary income — net | | $ | 59,085 | |
| Deferred capital losses* | | | (170,064) | |
| Other book/tax temporary differences(a) | | | (46,544) | |
| Unrealized appreciation (depreciation)(b) | | | (1,550,213) | |
| Total accumulated earnings (losses) — net | | $ | (1,707,736) | |
| * | These capital losses have been deferred in the current year as either short-term or long-term losses. The losses will be deemed to occur on the first day of the next taxable year in the same character as they were originally deferred and will be available to offset future taxable capital gains. |
| (a) | Other book/tax temporary differences are attributable to book/tax differences in the timing of the deductibility of various expenses. |
| (b) | The difference between book-basis and tax-basis unrealized appreciation (depreciation) is attributable to the tax deferral of losses on wash sales. |
| | |
| RARE Global Infrastructure Value Fund 2018 Annual Report | | 31 |
Notes to financial statements (cont’d)
9. Subsequent events
Effective November 2, 2018, the Fund’s management fee was reduced from a fee schedule that started at 0.90% of the Fund’s average daily net assets and decreased to 0.80% as assets increased, to a flat rate of 0.80% of the Fund’s average daily net assets.
In addition, effective November 2, 2018, the Fund replaced its current broad-based benchmark index, the MSCI World Core Infrastructure Index, with the S&P Global Infrastructure Index (the “S&P Index”). LMPFA and the Fund’s subadviser believe the S&P Index is a more appropriate benchmark for the Fund.
| | |
| 32 | | RARE Global Infrastructure Value Fund 2018 Annual Report |
Report of independent registered public accounting firm
To the Board of Trustees of Legg Mason Global Asset Management Trust and Shareholders of RARE Global Infrastructure Value Fund
Opinion on the financial statements
We have audited the accompanying statement of assets and liabilities, including the schedule of investments, of RARE Global Infrastructure Value Fund (one of the funds constituting Legg Mason Global Asset Management Trust, referred to hereafter as the “Fund”) as of September 30, 2018, the related statement of operations for the year ended September 30, 2018, the statement of changes in net assets for each of the two years in the period ended September 30, 2018, including the related notes, and the financial highlights for each of the periods indicated therein (collectively referred to as the “financial statements”). In our opinion, the financial statements present fairly, in all material respects, the financial position of the Fund as of September 30, 2018, the results of its operations for the year then ended, the changes in its net assets for each of the two years in the period ended September 30, 2018 and the financial highlights for each of the periods indicated therein in conformity with accounting principles generally accepted in the United States of America.
Basis for opinion
These financial statements are the responsibility of the Fund’s management. Our responsibility is to express an opinion on the Fund’s financial statements based on our audits. We are a public accounting firm registered with the Public Company Accounting Oversight Board (United States) (“PCAOB”) and are required to be independent with respect to the Fund in accordance with the U.S. federal securities laws and the applicable rules and regulations of the Securities and Exchange Commission and the PCAOB. We conducted our audits of these financial statements in accordance with the standards of the PCAOB. Those standards require that we plan and perform the audit to obtain reasonable assurance about whether the financial statements are free of material misstatement, whether due to error or fraud.
Our audits included performing procedures to assess the risks of material misstatement of the financial statements, whether due to error or fraud, and performing procedures that respond to those risks. Such procedures included examining, on a test basis, evidence regarding the amounts and disclosures in the financial statements. Our audits also included evaluating the accounting principles used and significant estimates made by management, as well as evaluating the overall presentation of the financial statements. Our procedures included confirmation of securities owned as of September 30, 2018 by correspondence with the custodian and brokers; when replies were not received, we performed other auditing procedures. We believe that our audits provide a reasonable basis for our opinion.
/s/PricewaterhouseCoopers LLP
Baltimore, Maryland
November 16, 2018
We have served as the auditor of one or more investment companies in Legg Mason investment company group since 1973. We have not determined the specific year we began serving as auditor.
| | |
| RARE Global Infrastructure Value Fund 2018 Annual Report | | 33 |
Additional information (unaudited)
Information about Trustees and Officers
The business and affairs of RARE Global Infrastructure Value Fund (the “Fund”) are conducted by management under the supervision and subject to the direction of its Board of Trustees. The business address of each Trustee is c/o Jane Trust, Legg Mason, 100 International Drive, 11th Floor, Baltimore, Maryland 21202. Information pertaining to the Trustees and officers of the Fund is set forth below.
The Statement of Additional Information includes additional information about Trustees and is available, without charge, upon request by calling the Fund at 1-877-721-1926.
| | |
| Independent Trustees† |
| Ruby P. Hearn |
| Year of birth | | 1940 |
| Position(s) with Trust | | Trustee |
| Term of office1 and length of time served2 | | Since 2004 |
| Principal occupation(s) during past five years | | Senior Vice President Emerita of The Robert Wood Johnson Foundation (non-profit) since 2001; Member of the Institute of Medicine since 1982; formerly, Trustee of the New York Academy of Medicine (2004 to 2012); Director of the Institute for Healthcare Improvement (2002 to 2012); Senior Vice President of The Robert Wood Johnson Foundation (1996 to 2001); Fellow of The Yale Corporation (1992 to 1998) |
| Number of funds in fund complex overseen by Trustee | | 19 |
| Other board memberships held by Trustee during past five years | | None |
|
| Arnold L. Lehman |
| Year of birth | | 1944 |
| Position(s) with Trust | | Trustee and Chairman |
| Term of office1 and length of time served2 | | Since 1982 and since 2015 |
| Principal occupation(s) during past five years | | Senior Advisor, Phillips Auctioneer since 2015; Trustee of American Federation of Arts since 1998; formerly, Fellow, Ford Foundation (2015 to 2016); Director of the Brooklyn Museum (1997 to 2015); Director of The Baltimore Museum of Art (1979 to 1997) |
| Number of funds in fund complex overseen by Trustee | | 19 |
| Other board memberships held by Trustee during past five years | | None |
|
| Robin J.W. Masters |
| Year of birth | | 1955 |
| Position(s) with Trust | | Trustee |
| Term of office1 and length of time served2 | | Since 2002 |
| Principal occupation(s) during past five years | | Retired; formerly, Chief Investment Officer of ACE Limited (insurance) (1986 to 2000) |
| Number of funds in fund complex overseen by Trustee | | 19 |
| Other board memberships held by Trustee during past five years | | Director of Cheyne Capital International Limited (investment advisory firm); formerly, Director/Trustee of Legg Mason Institutional Funds plc, WA Fixed Income Funds plc and Western Asset Debt Securities Fund plc. (2007 to 2011) |
| | |
| 34 | | RARE Global Infrastructure Value Fund |
| | |
| Independent Trustees† cont’d |
| Jill E. McGovern |
| Year of birth | | 1944 |
| Position(s) with Trust | | Trustee |
| Term of office1 and length of time served2 | | Since 1989 |
| Principal occupation(s) during past five years | | Senior Consultant, American Institute for Contemporary German Studies (AICGS) since 2007; formerly, Chief Executive Officer of The Marrow Foundation (non-profit) (1993 to 2007); Executive Director of the Baltimore International Festival (1991 to 1993); Senior Assistant to the President of The Johns Hopkins University (1986 to 1990) |
| Number of funds in fund complex overseen by Trustee | | 19 |
| Other board memberships held by Trustee during past five years | | Director of International Biomedical Research Alliance; Director of Lois Roth Endowment |
|
| Arthur S. Mehlman |
| Year of birth | | 1942 |
| Position(s) with Trust | | Trustee |
| Term of office1 and length of time served2 | | Since 2002 |
| Principal occupation(s) during past five years | | Retired. Director, The University of Maryland Foundation since 1992; Director, The League for People with Disabilities since 2003; formerly, Director, Municipal Mortgage & Equity LLC (2004 to 2011); Partner, KPMG LLP (international accounting firm) (1972 to 2002) |
| Number of funds in fund complex overseen by Trustee | | Trustee of all Legg Mason Funds consisting of 19 portfolios; Director/Trustee of the Royce Family of Funds consisting of 22 portfolios |
| Other board memberships held by Trustee during past five years | | Director of Municipal Mortgage & Equity, LLC. (2004 to 2011) |
|
| G. Peter O’Brien |
| Year of birth | | 1945 |
| Position(s) with Trust | | Trustee |
| Term of office1 and length of time served2 | | Since 1999 |
| Principal occupation(s) during past five years | | Retired. Trustee Emeritus of Colgate University; Board Member, Hill House, Inc. (residential home care); formerly, Board Member, Bridges School (pre- school) (2006 to 2017); Managing Director, Equity Capital Markets Group of Merrill Lynch & Co. (1971 to 1999) |
| Number of funds in fund complex overseen by Trustee | | Trustee of all Legg Mason funds consisting of 19 portfolios; Director/Trustee of the Royce Family of Funds consisting of 22 portfolios |
| Other board memberships held by Trustee during past five years | | Director of TICC Capital Corp. (2003 to 2017) |
| | |
| RARE Global Infrastructure Value Fund | | 35 |
Additional information (unaudited) (cont’d)
Information about Trustees and Officers
| | |
| Independent Trustees† cont’d |
| S. Ford Rowan |
| Year of birth | | 1943 |
| Position(s) with Trust | | Trustee |
| Term of office1 and length of time served2 | | Since 2002 |
| Principal occupation(s) during past five years | | Chairman, National Center for Critical Incident Analysis, since 2004; Consultant to University of Maryland University College, since 2013; formerly, Lecturer in Organizational Sciences, George Washington University (2000 to 2014); Trustee, St. John’s College (2006 to 2012); Consultant, Rowan & Blewitt Inc. (management consulting) (1984 to 2007); Lecturer in Journalism, Northwestern University (1980 to 1993); Director, Santa Fe Institute (1999 to 2008) |
| Number of funds in fund complex overseen by Trustee | | 19 |
| Other board memberships held by Trustee during past five years | | None |
|
| Robert M. Tarola |
| Year of birth | | 1950 |
| Position(s) with Trust | | Trustee |
| Term of office1 and length of time served2 | | Since 2004 |
| Principal occupation(s) during past five years | | President of Rights Advisory LLC (corporate finance and governance consulting) since 2008; Member, Investor Advisory Group of the Public Company Accounting Oversight Board since 2009; formerly, Executive Vice President and Chief Financial Officer, Southcoast Health System, Inc. (healthcare provider network) (2015 to 2017); Senior Vice President and Chief Financial Officer of The Howard University (2009 to 2013) (higher education and health care); Senior Vice President and Chief Financial Officer of W.R. Grace & Co. (specialty chemicals) (1999 to 2008) and MedStar Health, Inc. (healthcare) (1996 to 1999); Partner, Price Waterhouse, LLP (accounting and auditing) (1984 to 1996) |
| Number of funds in fund complex overseen by Trustee | | 19 |
| Other board memberships held by Trustee during past five years | | Director of American Kidney Fund (renal disease assistance); Director of XBRL International, Inc. (global data standard setting); Director of Vista Outdoor, Inc. (consumer outdoor recreation brands); formerly, Director of TeleTech Holdings, Inc. (business processing outsourcing) |
| | |
| | |
| 36 | | RARE Global Infrastructure Value Fund |
| | |
| Interested Trustee |
| Jane Trust, CFA3 | | |
| Year of birth | | 1962 |
| Position(s) with Trust | | Trustee, President and Chief Executive Officer |
| Term of office1 and length of time served2 | | Since 2015 |
| Principal occupation(s) during past five years | | Senior Managing Director of Legg Mason & Co., LLC (“Legg Mason & Co.”) (since 2018); Managing Director of Legg Mason & Co. (2016 to 2018); Officer and/or Trustee/Director of 147 funds associated with Legg Mason Partners Fund Advisor, LLC (“LMPFA”) or its affiliates (since 2015); President and Chief Executive Officer of LMPFA (since 2015); formerly, Senior Vice President of LMPFA (2015); Director of ClearBridge, LLC (formerly, Legg Mason Capital Management, LLC) (2007 to 2014); Managing Director of Legg Mason Investment Counsel & Trust Co. (2000 to 2007) |
| Number of funds in fund complex overseen by Trustee | | 138 |
Other board memberships held by Trustee during past
five years | | None |
| | |
| Executive Officers |
Richard F. Sennett Legg Mason 100 International Drive, 7th Floor, Baltimore, MD 21202 | | |
| Year of birth | | 1970 |
| Position(s) with Trust | | Principal Financial Officer |
| Term of office1 and length of time served2 | | Since 2011 |
| Principal occupation(s) during past five years | | Principal Financial Officer and Treasurer of certain mutual funds associated with Legg Mason & Co. or its affiliates (since 2011 and since 2013); Managing Director of Legg Mason & Co. and Senior Manager of the Treasury Policy group for Legg Mason & Co.’s Global Fiduciary Platform (since 2011); formerly, Chief Accountant within the SEC’s Division of Investment Management (2007 to 2011); Assistant Chief Accountant within the SEC’s Division of Investment Management (2002 to 2007) |
| |
Robert I. Frenkel Legg Mason 100 First Stamford Place, 6th Floor, Stamford, CT 06902 | | |
| Year of birth | | 1954 |
| Position(s) with Trust | | Secretary and Chief Legal Officer |
| Term of office1 and length of time served2 | | Since 2007 |
| Principal occupation(s) during past five years | | Vice President and Deputy General Counsel of Legg Mason (since 2006); Managing Director and General Counsel of — U.S. Mutual Funds for Legg Mason & Co. (since 2006) and Legg Mason & Co. predecessors (since 1994); Secretary and Chief Legal Officer of certain mutual funds associated with Legg Mason & Co. or its affiliates (since 2006) and Legg Mason & Co. predecessors (prior to 2006) |
| | |
| RARE Global Infrastructure Value Fund | | 37 |
Additional information (unaudited) (cont’d)
Information about Trustees and Officers
| | |
| Executive Officers cont’d |
Thomas C. Mandia Legg Mason 100 First Stamford Place, 6th Floor, Stamford, CT 06902 |
| Year of birth | | 1962 |
| Position(s) with Trust | | Assistant Secretary |
| Term of office1 and length of time served2 | | Since 2007 |
| Principal occupation(s) during past five years | | Managing Director and Deputy General Counsel of Legg Mason & Co. (since 2005) and Legg Mason & Co. predecessors (prior to 2005); Secretary of LMPFA (since 2006); Assistant Secretary of certain mutual funds associated with Legg Mason & Co. or its affiliates (since 2006) and Legg Mason & Co. predecessors (prior to 2006); Secretary of LM Asset Services, LLC (“LMAS”) (since 2002) and Legg Mason Fund Asset Management, Inc. (“LMFAM”) (since 2013) (formerly registered investment advisers) |
| |
Ted P. Becker
Legg Mason 620 Eighth Avenue, 49th Floor, New York, NY 10018 | | |
| Year of birth | | 1951 |
| Position(s) with Trust | | Chief Compliance Officer |
| Term of office1 and length of time served2 | | Since 2007 |
| Principal occupation(s) during past five years | | Director of Global Compliance at Legg Mason (since 2006); Chief Compliance Officer of LMPFA (since 2006); Managing Director of Compliance of Legg Mason & Co. (since 2005); Chief Compliance Officer of certain mutual funds associated with Legg Mason & Co. or its affiliates (since 2006) and Legg Mason & Co. predecessors (prior to 2006) |
| |
Christopher Berarducci Legg Mason 620 Eighth Avenue, 49th Floor, New York, NY 10018 | | |
| Year of birth | | 1974 |
| Position(s) with Trust | | Treasurer |
| Term of office1 and length of time served2 | | Since 2010 |
| Principal occupation(s) during past five years | | Director of Legg Mason & Co. (since 2015); Treasurer of certain mutual funds associated with Legg Mason & Co. or its affiliates (since 2010); formerly, Vice President of Legg Mason & Co. (2011 to 2015); Assistant Controller of certain mutual funds associated with Legg Mason & Co. or its affiliates (prior to 2010) |
| | |
| 38 | | RARE Global Infrastructure Value Fund |
| | |
| Executive Officers cont’d |
Susan Kerr Legg Mason 620 Eighth Avenue, 49th Floor, New York, NY 10018 | | |
| Year of birth | | 1949 |
| Position(s) with Trust | | Chief Anti-Money Laundering Compliance Officer |
| Term of office1 and length of time served2 | | Since 2013 |
| Principal occupation(s) during past five years | | Assistant Vice President of Legg Mason & Co. and Legg Mason Investor Services, LLC (“LMIS”) (since 2010); Chief Anti-Money Laundering Compliance Officer of certain mutual funds associated with Legg Mason & Co. or its affiliates (since 2013) and Anti-Money Laundering Compliance Officer of LMIS (since 2012); Senior Compliance Officer of LMIS (since 2011); formerly, AML Consultant, DTCC (2010); AML Consultant, Rabobank Netherlands, (2009); First Vice President, Director of Marketing & Advertising Compliance and Manager of Communications Review Group at Citigroup Inc. (1996 to 2008) |
| |
Jenna Bailey Legg Mason 100 First Stamford Place, 5th Floor, Stamford, CT 06902 | | |
| Year of birth | | 1978 |
| Position(s) with Trust | | Identity Theft Prevention Officer |
| Term of office1 and length of time served2 | | Since 2015 |
| Principal occupation(s) during past five years | | Identity Theft Prevention Officer of certain mutual funds associated with Legg Mason & Co. or its affiliates (since 2015); Compliance Officer of Legg Mason & Co. (since 2013); Assistant Vice President of Legg Mason & Co. (since 2011); formerly, Associate Compliance Officer of Legg Mason & Co. (2011 to 2013) |
| |
Jeanne M. Kelly Legg Mason 620 Eighth Avenue, 49th Floor, New York, NY 10018 | | |
| Year of birth | | 1951 |
| Position(s) with Trust | | Senior Vice President |
| Term of office1 and length of time served2 | | Since 2007 |
| Principal occupation(s) during past five years | | Senior Vice President of certain mutual funds associated with Legg Mason & Co. or its affiliates (since 2007); Senior Vice President of LMPFA (since 2006); President and Chief Executive Officer of LMAS and LMFAM (since 2015); Managing Director of Legg Mason & Co. (since 2005) and Legg Mason & Co. predecessors (prior to 2005); formerly, Senior Vice President of LMFAM (2013 to 2015) |
| † | Trustees who are not “interested persons” of the Fund within the meaning of Section 2(a)(19) of the Investment Company Act of 1940, as amended (the “1940 Act”). Each of the Independent Trustees serves on the standing committees of the Board of Trustees, which include the Audit Committee (chair: Arthur S. Mehlman), the Nominating Committee (co-chairs: G. Peter O’Brien and Jill E. McGovern), and the Independent Trustees Committee (chair: Arnold L. Lehman). |
| | |
| RARE Global Infrastructure Value Fund | | 39 |
Additional information (unaudited) (cont’d)
Information about Trustees and Officers
| 1 | Each Trustee and officer serves until his or her respective successor has been duly elected and qualified or until his or her earlier death, resignation, retirement or removal. |
| 2 | Indicates the earliest year in which the Trustee became a board member for a fund in the Legg Mason fund complex or the officer took such office. |
| 3 | Ms. Trust is an “interested person” of the Fund, as defined in the 1940 Act, because of her position with LMPFA and/or certain of its affiliates. |
| | |
| 40 | | RARE Global Infrastructure Value Fund |
Important tax information (unaudited)
The following information is provided with respect to the distributions paid during the taxable year ended September 30, 2018:
| | | | | | | | | | | | | | | | |
| Record date: | | | 12/20/2017 | | | | 3/30/2018 | | | | 6/29/2018 | | | | 9/29/2018 | |
| Payable date: | | | 12/21/2017 | | | | 3/31/2018 | | | | 6/30/2018 | | | | 9/30/2018 | |
| Ordinary income: | | | | | | | | | | | | | | | | |
Qualified dividend income for individuals | | | 90.94 | % | | | 100.00 | % | | | 100.00 | % | | | 100.00 | % |
Dividends qualifying for the dividends | | | | | | | | | | | | | | | | |
received deduction for corporations | | | 16.28 | % | | | 27.05 | % | | | 27.05 | % | | | 27.05 | % |
| Foreign source income* | | | 26.03 | % | | | 93.52 | % | | | 93.52 | % | | | 93.52 | % |
| Foreign taxes paid per share | | | $0.001611 | | | | $0.003247 | | | | $0.011110 | | | | $0.005745 | |
| Long-term capital gain dividend | | | $0.091913 | | | | — | | | | — | | | | — | |
| * | Expressed as a percentage of the cash distribution grossed-up for foreign taxes. |
The foreign taxes paid represent taxes incurred by the Fund on income received by the Fund from foreign sources. Foreign taxes paid may be included in taxable income with an offsetting deduction from gross income or may be taken as a credit for taxes paid to foreign governments. You should consult your tax adviser regarding the appropriate treatment of foreign taxes paid.
Please retain this information for your records.
| | |
| RARE Global Infrastructure Value Fund | | 41 |
RARE
Global Infrastructure Value Fund
Trustees
Ruby P. Hearn
Arnold L. Lehman
Chairman
Robin J.W. Masters
Jill E. McGovern
Arthur S. Mehlman
G. Peter O’Brien
S. Ford Rowan
Robert M. Tarola
Jane Trust
Investment manager
Legg Mason Partners Fund Advisor, LLC
Subadviser
RARE Infrastructure
(North America) Pty Ltd.
Distributor
Legg Mason Investor Services, LLC
Custodian
The Bank of New York Mellon (“BNY”)*
| * | Effective April 9, 2018, BNY became custodian. |
Transfer agent
BNY Mellon Investment Servicing (US) Inc.
4400 Computer Drive
Westborough, MA 01581
Independent registered public accounting firm
PricewaterhouseCoopers LLP
Baltimore, MD
RARE Global Infrastructure Value Fund
The Fund is a separate investment series of Legg Mason Global Asset Management Trust, a Maryland statutory trust.
RARE Global Infrastructure Value Fund
Legg Mason Funds
620 Eighth Avenue, 49th Floor
New York, NY 10018
The Fund files its complete schedule of portfolio holdings with the Securities and Exchange Commission (“SEC”) for the first and third quarters of each fiscal year on Form N-Q. The Fund’s Forms N-Q are available on the SEC’s website at www.sec.gov. The Fund’s Forms N-Q may be reviewed and copied at the SEC’s Public Reference Room in Washington, D.C., and information on the operation of the Public Reference Room may be obtained by calling 1-800-SEC-0330. To obtain information on Form N-Q, shareholders can call the Fund at 1-877-721-1926.
Information on how the Fund voted proxies relating to portfolio securities during the prior 12-month period ended June 30th of each year and a description of the policies and procedures that the Fund uses to determine how to vote proxies related to portfolio transactions are available (1) without charge, upon request, by calling the Fund at 1-877-721-1926, (2) at www.leggmason.com/mutualfunds and (3) on the SEC’s website at www.sec.gov.
This report is submitted for the general information of the shareholders of RARE Global Infrastructure Value Fund. This report is not authorized for distribution to prospective investors in the Fund unless preceded or accompanied by a current prospectus.
Investors should consider the Fund’s investment objectives, risks, charges and expenses carefully before investing. The prospectus contains this and other important information about the Fund. Please read the prospectus carefully before investing.
www.leggmason.com
© 2018 Legg Mason Investor Services, LLC
Member FINRA, SIPC
Legg Mason Funds Privacy and Security Notice
Your Privacy and the Security of Your Personal Information is Very Important to the Legg Mason Funds
This Privacy and Security Notice (the “Privacy Notice”) addresses the Legg Mason Funds’ privacy and data protection practices with respect to nonpublic personal information the Funds receive. The Legg Mason Funds include any funds sold by the Funds’ distributor, Legg Mason Investor Services, LLC, as well as Legg Mason-sponsored closed-end funds. The provisions of this Privacy Notice apply to your information both while you are a shareholder and after you are no longer invested with the Funds.
The Type of Nonpublic Personal Information the Funds Collect About You
The Funds collect and maintain nonpublic personal information about you in connection with your shareholder account. Such information may include, but is not limited to:
| • | | Personal information included on applications or other forms; |
| • | | Account balances, transactions, and mutual fund holdings and positions; |
| • | | Bank account information, legal documents, and identify verification documentation; |
| • | | Online account access user IDs, passwords, security challenge question responses; and |
| • | | Information received from consumer reporting agencies regarding credit history and creditworthiness (such as the amount of an individual’s total debt, payment history, etc.). |
How the Funds Use Nonpublic Personal Information About You
The Funds do not sell or share your nonpublic personal information with third parties or with affiliates for their marketing purposes, or with other financial institutions or affiliates for joint marketing purposes, unless you have authorized the Funds to do so. The Funds do not disclose any nonpublic personal information about you except as may be required to perform transactions or services you have authorized or as permitted or required by law. The Funds may disclose information about you to:
| • | | Employees, agents, and affiliates on a “need to know” basis to enable the Funds to conduct ordinary business or to comply with obligations to government regulators; |
| • | | Service providers, including the Funds’ affiliates, who assist the Funds as part of the ordinary course of business (such as printing, mailing services, or processing or servicing your account with us) or otherwise perform services on the Funds’ behalf, including companies that may perform statistical analysis, market research and marketing services solely for the Funds; |
| • | | Permit access to transfer, whether in the United States or countries outside of the United States to such Funds’ employees, agents and affiliates and service providers as required to enable the Funds to conduct ordinary business, or to comply with obligations to government regulators; |
| • | | The Funds’ representatives such as legal counsel, accountants and auditors to enable the Funds to conduct ordinary business, or to comply with obligations to government regulators; |
|
| NOT PART OF THE ANNUAL REPORT |
Legg Mason Funds Privacy and Security Notice (cont’d)
| • | | Fiduciaries or representatives acting on your behalf, such as an IRA custodian or trustee of a grantor trust. |
Except as otherwise permitted by applicable law, companies acting on the Funds’ behalf, including those outside the United States, are contractually obligated to keep nonpublic personal information the Funds provide to them confidential and to use the information the Funds share only to provide the services the Funds ask them to perform.
The Funds may disclose nonpublic personal information about you when necessary to enforce their rights or protect against fraud, or as permitted or required by applicable law, such as in connection with a law enforcement or regulatory request, subpoena, or similar legal process. In the event of a corporate action or in the event a Fund service provider changes, the Funds may be required to disclose your nonpublic personal information to third parties. While it is the Funds’ practice to obtain protections for disclosed information in these types of transactions, the Funds cannot guarantee their privacy policy will remain unchanged.
Keeping You Informed of the Funds’ Privacy and Security Practices
The Funds will notify you annually of their privacy policy as required by federal law. While the Funds reserve the right to modify this policy at any time they will notify you promptly if this privacy policy changes.
The Funds’ Security Practices
The Funds maintain appropriate physical, electronic and procedural safeguards designed to guard your nonpublic personal information. The Funds’ internal data security policies restrict access to your nonpublic personal information to authorized employees, who may use your nonpublic personal information for Fund business purposes only.
Although the Funds strive to protect your nonpublic personal information, they cannot ensure or warrant the security of any information you provide or transmit to them, and you do so at your own risk. In the event of a breach of the confidentiality or security of your nonpublic personal information, the Funds will attempt to notify you as necessary so you can take appropriate protective steps. If you have consented to the Funds using electronic communications or electronic delivery of statements, they may notify you under such circumstances using the most current email address you have on record with them.
In order for the Funds to provide effective service to you, keeping your account information accurate is very important. If you believe that your account information is incomplete, not accurate or not current, if you have questions about the Funds’ privacy practices, or our use of your nonpublic personal information, write the Funds using the contact information on your account statements, email the Funds by clicking on the Contact Us section of the Funds’ website at www.leggmason.com, or contact the Funds at 1-877-721-1926.
Revised April 2018
|
| NOT PART OF THE ANNUAL REPORT |
www.leggmason.com
© 2018 Legg Mason Investor Services, LLC Member FINRA, SIPC
RARE314422 11/18 SR18-3475
The registrant has adopted a code of ethics that applies to the registrant’s principal executive officer, principal financial officer, principal accounting officer or controller.
| ITEM 3. | AUDIT COMMITTEE FINANCIAL EXPERT. |
The Board of Trustees of the registrant has determined that Arthur S. Mehlman the Chairman of the Board’s Audit Committee and Robert M. Tarola, possess the technical attributes identified in Instruction 2(b) of Item 3 to Form N-CSR to qualify as “audit committee financial experts,” and have designated Mr. Mehlman and Mr. Tarola as the Audit Committee’s financial experts. Mr. Mehlman and Mr. Tarola are “independent” Trustees pursuant to paragraph (a) (2) of Item 3 to Form N-CSR.
| ITEM 4. | PRINCIPAL ACCOUNTANT FEES AND SERVICES. |
a) Audit Fees. The aggregate fees billed in the last two fiscal years ending September 30, 2017 and September 30, 2018 (the “Reporting Periods”) for professional services rendered by the Registrant’s principal accountant (the “Auditor”) for the audit of the Registrant’s annual financial statements, or services that are normally provided by the Auditor in connection with the statutory and regulatory filings or engagements for the Reporting Periods, were $214,935 in September 30, 2017 and $306,746 in September 30, 2018.
b) Audit-Related Fees. The aggregate fees billed in the Reporting Period for assurance and related services by the Auditor that are reasonably related to the performance of the Registrant’s financial statements were $0 in September 30, 2017 and $0 in September 30, 2018.
(c) Tax Fees. The aggregate fees billed in the Reporting Periods for professional services rendered by the Auditor for tax compliance, tax advice and tax planning (“Tax Services”) were $27,852 in September 30, 2017 and $45,424 in September 30, 2018. These services consisted of (i) review or preparation of U.S. federal, state, local and excise tax returns; (ii) U.S. federal, state and local tax planning, advice and assistance regarding statutory, regulatory or administrative developments, and (iii) tax advice regarding tax qualification matters and/or treatment of various financial instruments held or proposed to be acquired or held.
There were no fees billed for tax services by to the service affiliates during the Reporting Periods that required pre-approval by the Audit Auditors Committee.
d) All Other Fees. The aggregate fees for other fees billed in the Reporting Periods for products and services provided by the Auditor were $0 in September 30, 2017 and $0 in September 30, 2018, other than the services reported in paragraphs (a) through (c) of this item for the Legg Mason Global Asset Management Trust.
All Other Fees. There were no other non-audit services rendered by the Auditor to Legg Mason Partners Fund Advisors, LLC (“LMPFA”), and any entity controlling, controlled by or under common control with LMPFA that provided ongoing services to Legg Mason Global Asset Management Trust requiring pre-approval by the Audit Committee in the Reporting Period.
(e) Audit Committee’s pre–approval policies and procedures described in paragraph (c)
(7) of Rule 2-01 of Regulation S-X.
(1) The Charter for the Audit Committee (the “Committee”) of the Board of each registered investment company (the “Fund”) advised by LMPFA or one of their affiliates (each, an “Adviser”) requires that the Committee shall approve (a) all audit and permissible non-audit services to be provided to the Fund and (b) all permissible non-audit services to be provided by the Fund’s independent auditors to the Adviser and any Covered Service Providers if the engagement relates directly to the operations and financial reporting of the Fund. The Committee may implement policies and procedures by which such services are approved other than by the full Committee.
The Committee shall not approve non-audit services that the Committee believes may impair the independence of the auditors. As of the date of the approval of this Audit Committee Charter, permissible non-audit services include any professional services (including tax services), that are not prohibited services as described below, provided to the Fund by the independent auditors, other than those provided to the Fund in connection with an audit or a review of the financial statements of the Fund. Permissible non-audit services may not include: (i) bookkeeping or other services related to the accounting records or financial statements of the Fund; (ii) financial information systems design and implementation; (iii) appraisal or valuation services, fairness opinions or contribution-in-kind reports; (iv) actuarial services; (v) internal audit outsourcing services; (vi) management functions or human resources; (vii) broker or dealer, investment adviser or investment banking services; (viii) legal services and expert services unrelated to the audit; and (ix) any other service the Public Company Accounting Oversight Board determines, by regulation, is impermissible.
Pre-approval by the Committee of any permissible non-audit services is not required so long as: (i) the aggregate amount of all such permissible non-audit services provided to the Fund, the Adviser and any service providers controlling, controlled by or under common control with the Adviser that provide ongoing services to the Fund (“Covered Service Providers”) constitutes not more than 5% of the total amount of revenues paid to the independent auditors during the fiscal year in which the permissible non-audit services are provided to (a) the Fund, (b) the Adviser and (c) any entity controlling, controlled by or under common control with the Adviser that provides ongoing services to the Fund during the fiscal year in which the services are provided that would have to be approved by the Committee; (ii) the permissible non-audit services were not recognized by the Fund at the time of the engagement to be non-audit services; and (iii) such services are promptly brought to the attention of the Committee and approved by the Committee (or its delegate(s)) prior to the completion of the audit.
(2) For the Legg Mason Global Asset Management Trust, the percentage of fees that were approved by the audit committee, with respect to: Audit-Related Fees were 100% and 100% for September 30, 2017 and September 30, 2018; Tax Fees were 100% and 100% for September 30, 2017 and September 30, 2018; and Other Fees were 100% and 100% for September 30, 2017 and September 30, 2018.
(f) N/A
(g) Non-audit fees billed by the Auditor for services rendered to Legg Mason Global Asset Management Trust, LMPFA and any entity controlling, controlled by, or under common control with LMPFA that provides ongoing services to Legg Mason Global Asset Management Trust during the reporting period were $271,895 in September 30, 2017 and $477,227 in September 30, 2018.
(h) Yes. Legg Mason Global Asset Management Trust’s Audit Committee has considered whether the provision of non-audit services that were rendered to Service Affiliates, which were not pre-approved (not requiring pre-approval), is compatible with maintaining the Accountant’s independence. All services provided by the Auditor to the Legg Mason Global Asset Management Trust or to Service Affiliates, which were required to be pre-approved, were pre-approved as required.
| ITEM 5. | AUDIT COMMITTEE OF LISTED REGISTRANTS. |
| | a) | The independent board members are acting as the registrant’s audit committee as specified in Section 3(a)(58)(B) of the Exchange Act. The Audit Committee consists of the following Board members: |
Ruby P. Hearn
Arnold L. Lehman
Robin J.W. Masters
Jill E. McGovern
Arthur S. Mehlman
G. Peter O’Brien
S. Ford Rowan
Robert M. Tarola
| ITEM 6. | SCHEDULE OF INVESTMENTS. |
Included herein under Item 1.
| ITEM 7. | DISCLOSURE OF PROXY VOTING POLICIES AND PROCEDURES FOR CLOSED-END MANAGEMENT INVESTMENT COMPANIES. |
Not applicable.
| ITEM 8. | PORTFOLIO MANAGERS OF CLOSED-END MANAGEMENT INVESTMENT COMPANIES. |
Not applicable.
| ITEM 9. | PURCHASES OF EQUITY SECURITIES BY CLOSED-END MANAGEMENT INVESTMENT COMPANY AND AFFILIATED PURCHASERS. |
Not applicable.
| ITEM 10. | SUBMISSION OF MATTERS TO A VOTE OF SECURITY HOLDERS. |
Not applicable.
| ITEM 11. | CONTROLS AND PROCEDURES. |
| | (a) | The registrant’s principal executive officer and principal financial officer have concluded that the registrant’s disclosure controls and procedures (as defined in Rule 30a- 3(c) under the Investment Company Act of 1940, as amended (the “1940 Act”)) are effective as of a date within 90 days of the filing date of this report that includes the disclosure required by this paragraph, based on their evaluation of the disclosure controls and procedures required by Rule 30a-3(b) under the 1940 Act and 15d-15(b) under the Securities Exchange Act of 1934. |
| | (b) | There were no changes in the registrant’s internal control over financial reporting (as defined in Rule 30a-3(d) under the 1940 Act) that occurred during the second fiscal quarter of the period covered by this report that have materially affected, or are likely to materially affect the registrant’s internal control over financial reporting. |
(a) (1) Code of Ethics attached hereto.
Exhibit 99.CODE ETH
(a) (2) Certifications pursuant to section 302 of the Sarbanes-Oxley Act of 2002 attached hereto.
Exhibit 99.CERT
(b) Certifications pursuant to Section 906 of the Sarbanes-Oxley Act of 2002 attached hereto.
Exhibit 99.906CERT
SIGNATURES
Pursuant to the requirements of the Securities Exchange Act of 1934 and the Investment Company Act of 1940, the registrant has duly caused this Report to be signed on its behalf by the undersigned, there unto duly authorized.
| | |
| Legg Mason Global Asset Management Trust |
| |
| By: | | /s/ Jane Trust |
| | Jane Trust |
| | Chief Executive Officer |
|
| Date: November 21, 2018 |
Pursuant to the requirements of the Securities Exchange Act of 1934 and the Investment Company Act of 1940, this report has been signed below by the following persons on behalf of the registrant and in the capacities and on the dates indicated.
| | |
| By: | | /s/ Jane Trust |
| | Jane Trust |
| | Chief Executive Officer |
|
| Date: November 21, 2018 |
| |
| By: | | /s/ Richard F. Sennett |
| | Richard F. Sennett |
| | Principal Financial Officer |
|
| Date: November 21, 2018 |