UNITED STATES
SECURITIES AND EXCHANGE COMMISSION
Washington, D.C. 20549
FORMN-CSR
CERTIFIED SHAREHOLDER REPORT OF REGISTERED
MANAGEMENT INVESTMENT COMPANIES
Investment Company Act file number811-22338
Legg Mason Global Asset Management Trust
(Exact name of registrant as specified in charter)
620 Eighth Avenue, 49th Floor, New York, NY 10018
(Address of principal executive offices) (Zip code)
Robert I. Frenkel, Esq.
Legg Mason & Co., LLC
100 First Stamford Place
Stamford, CT 06902
(Name and address of agent for service)
Registrant’s telephone number, including area code:1-877-721-1926
Date of fiscal year end: September 30
Date of reporting period: September 30, 2019
| ITEM 1. | REPORT TO STOCKHOLDERS |
TheAnnual Report to Stockholders is filed herewith.

| | |
| Annual Report | | September 30, 2019 |
BrandywineGLOBAL —
DIVERSIFIED US LARGE
CAP VALUE FUND
Beginning in March 2021, as permitted by regulations adopted by the Securities and Exchange Commission, the Fund intends to no longer mail paper copies of the Fund’s shareholder reports like this one, unless you specifically request paper copies of the reports from the Fund or from your Service Agent or financial intermediary (such as a broker-dealer or bank). Instead, the reports will be made available on a website, and you will be notified by mail each time a report is posted and provided with a website link to access the report.
If you already elected to receive shareholder reports electronically(“e-delivery”), you will not be affected by this change and you need not take any action. If you have not already electede-delivery, you may elect to receive shareholder reports and other communications from the Fund electronically by contacting your Service Agent or, if you are a direct shareholder with the Fund, by calling1-877-721-1926.
You may elect to receive all future reports in paper free of charge. If you invest through a Service Agent, you can contact your Service Agent to request that you continue to receive paper copies of your shareholder reports. That election will apply to all Legg Mason Funds held in your account at that Service Agent. If you are a direct shareholder with the Fund, you can call the Fund at1-877-721-1926, or write to the Fund by regular mail at Legg Mason Funds, P.O. Box 9699, Providence, RI 02940-9699 or by express, certified or registered mail to Legg Mason Funds, 4400 Computer Drive, Westborough, MA 01581 to let the Fund know you wish to continue receiving paper copies of your shareholder reports. That election will apply to all Legg Mason Funds held in your account held directly with the fund complex.

|
| INVESTMENT PRODUCTS: NOT FDIC INSURED • NO BANK GUARANTEE • MAY LOSE VALUE |
Fund objective
The Fund seeks long-term capital appreciation.
Letter from the president

Dear Shareholder,
We are pleased to provide the annual report of BrandywineGLOBAL — Diversified US Large Cap Value Fund for the twelve-month reporting period ended September 30, 2019. Please read on for a detailed look at prevailing economic and market conditions during the Fund’s reporting period and to learn how those conditions have affected Fund performance.
As always, we remain committed to providing you with excellent service and a full spectrum of investment choices. We also remain committed to supplementing the support you receive from your financial advisor. One way we accomplish this is through our website, www.leggmason.com. Here you can gain immediate access to market and investment information, including:
| • | | Fund prices and performance, |
| • | | Market insights and commentaries from our portfolio managers, and |
| • | | A host of educational resources. |
We look forward to helping you meet your financial goals.
Sincerely,

Jane Trust, CFA
President and Chief Executive Officer
October 31, 2019
| | |
II | | BrandywineGLOBAL — Diversified US Large Cap Value Fund |
Fund overview
Q. What is the Fund’s investment strategy?
A. The Fund seeks long-term capital appreciation. The Fund normally invests at least 80% of its net assets, plus the amount of borrowings for investment purposes, if any, in issuers domiciled or having their principal activities, in the United States, at the time of investment or other instruments with similar economic characteristics. In addition, the Fund normally invests at least 80% of its net assets in equity securities of large-capitalization companies. Large capitalization companies are those companies with market capitalizations similar to companies in the Russell 1000 Indexi. The Fund invests primarily in equity securities that, in our opinion, are undervalued or out of favor. We invest in securities that meet our value criteria, primarily,price-to-earnings (“P/E”)ii,price-to-book (“P/B”)iii, price momentum and share change and quality, based on both quantitative and fundamental analysis. The Fund expects to hold approximately150-250 stocks under normal market conditions.
We believe that combining the discipline and consistency of our quantitative process with the insights derived from our fundamental stock research offers the greatest potential to outperform thelarge-cap value benchmark. Our core value philosophy has remained unchanged since the inception of the Diversified Large Cap Value Equity strategy in 1999.
Our Diversified Large Cap Value Equity philosophy is based in part on our fundamental academic research. Our research studies confirm our experience-derived belief that concentrating on U.S. large-capitalization stocks with low valuation ratios produces good investment result potential. Our investment philosophy is based on our belief that stocks with the lowest prices relative to current earnings or book value will provide strong returns over longer periods of time. Avoiding stocks with poor recent relative performance helps prevent investing too early in any particular value stock. In our opinion, focusing on companies that relatively have been able to reduce their equity shares helps identify the stocks with the financial strength to generate strong returns. We employ quantitative techniques to identify each of these attractive characteristics.
Regarding our fundamental research, we have determined that our exclusionary process, which seeks to eliminate poor performers, is an effective means to capitalize on the value-based opportunities. In this process, we use our fundamental research to exclude from our quantitatively select investment universe those stocks that we feel have the least ability to outperform. We periodically update our research to confirm and enhance our process and approach.
Q. What were the overall market conditions during the Fund’s reporting period?
A. During the twelve-month reporting period ended September 30, 2019, returns for the broad U.S. stock markets were much more muted than the prior period. The S&P 500 Indexiv was up 4.25% for the reporting period compared to 17.91% for the prior twelve months. Many factors were at play for the lower return environment but the major headwinds for this period were a pronounced slowdown in global growth and rising trade tensions between the U.S. and China. This period was also challenging from the outset as the markets experienced a sharp correction at the end of 2018 as concerns of slower growth,
| | |
| BrandywineGLOBAL — Diversified US Large Cap Value Fund 2019 Annual Report | | 1 |
Fund overview (cont’d)
trade tensions, weaker earnings, and the government shutdown reverberated. Markets were choppy after the end of year correction but rebounded as investors were more optimistic on trade, corporate earnings, and a domestic economy that was slowing but not off track yet. Adding to the volatility of this period is an inversion of the Treasury yield curvev, highlighting a possibility of a future recession. However, during the period the U.S. entered the longest expansion in U.S. history and in the near-term economic data supports a continuation of moderate economic growth buoyed by resilient consumer spending. After reaching 3.1% at the end of the first quarter of this year, U.S. gross domestic product (“GDP”)vi moderated to 2.0% in the second quarter and early projections for the third quarter are likely to remain near this level. Although job growth slowed during this period as well, the labor market remains supportive of consumer spending. Wage growth has been steady, and the unemployment rate was 3.5%, when the reporting period ended, the lowest rate since 1969. Housing data was mixed during the reporting period, but has been improving recently as existing and new home sales have responded to lower mortgage rates.
During the reporting period interest rates plunged as the yield on the10-year Treasury fell from 3.06% to 1.67% and the shorter end of the yield curve inverted. There was a dramatic shift in monetary policy by the Federal Reserve Board (the “Fed”)vii during the period as well. After making a policy error of raising rates into a weak market in December of 2018, the Fed began playing catch up to the falling yield signals from the bond market. Moreover, in response to weaker global growth and fallout from the trade dispute, the Fed shifted from tightening to easing monetary policy by cutting interest rates 25 basis pointsviii at both the July and September 2019 Federal Open Market Committeeix meetings. Like interest rates, oil prices also fell precipitously in the past twelve months by over 25%, despite rising tensions in the Middle East. In addition to the trade dispute with China and rising Middle East tensions, decelerating growth in Europe and the uncertainty of Brexit clouded the outlook for global growth.
Q. How did we respond to these changing market conditions?
A. Our investment strategy is based on the consistent application of our investment philosophy which relies on long term equity factors and market relationships, while avoiding emotional reactions to near term events. We respond to volatile environments by the consistent, disciplined execution of our investment strategy. This process has been tested over more than 40 years of varied conditions and while we recognize it will not excel in every situation, we do believe it will help to minimize large losses relative to the Russell 1000 Value Indexx in the short run and to enhance excess return over longer periods. We are aware of the macro implications of events for specific securities, but do not alter our primary focus on value, quality, and favorable sentiment factors.
| | |
2 | | BrandywineGLOBAL — Diversified US Large Cap Value Fund 2019 Annual Report |
Performance review
For the twelve months ended September 30, 2019, Class A shares of BrandywineGLOBAL — Diversified US Large Cap Value Fund, excluding sales charges, returned-0.36%. The Fund’s unmanaged benchmark, the Russell 1000 Value Index, returned 4.00% for the same period. The LipperLarge-Cap Value Funds Category Averagexi returned 1.92% over the same time frame.
| | | | | | | | |
Performance Snapshot as of September 30, 2019 (unaudited) | |
| (excluding sales charges) | | 6 months | | | 12 months | |
| BrandywineGLOBAL — Diversified US Large Cap Value Fund: | | | | | | | | |
Class A | | | 3.78 | % | | | -0.36 | % |
Class A2 | | | 3.72 | % | | | -0.44 | % |
Class C | | | 3.17 | % | | | -1.29 | % |
Class R | | | 3.63 | % | | | -0.62 | % |
Class I | | | 3.88 | % | | | -0.10 | % |
Class IS | | | 3.93 | % | | | 0.01 | % |
| Russell 1000 Value Index | | | 5.25 | % | | | 4.00 | % |
| LipperLarge-Cap Value Fund Category Average | | | 4.80 | % | | | 1.92 | % |
The performance shown represents past performance. Past performance is no guarantee of future results and current performance may be higher or lower than the performance shown above. Principal value and investment returns will fluctuate and investors’ shares, when redeemed, may be worth more or less than their original cost. To obtain performance data current to the most recentmonth-end, please visit our website at www.leggmason.com/mutualfunds.
All share class returns assume the reinvestment of all distributions at net asset value and the deduction of all Fund expenses. Returns have not been adjusted to include sales charges that may apply or the deduction of taxes that a shareholder would pay on Fund distributions. If sales charges were reflected, the performance quoted would be lower. Performance figures for periods shorter than one year represent cumulative figures and are not annualized.
Fund performance figures reflect fee waivers and/or expense reimbursements, without which the performance would have been lower.
|
| Total Annual Operating Expenses (unaudited) |
As of the Fund’s current prospectus dated February 1, 2019, the gross total annual fund operating expense ratios for Class A, Class A2, Class C, Class R, Class I and Class IS shares were 1.08%, 1.16%, 1.86%, 1.30%, 0.80% and 0.70%, respectively.
Actual expenses may be higher. For example, expenses may be higher than those shown if average net assets decrease. Net assets are more likely to decrease and Fund expense ratios are more likely to increase when markets are volatile.
Q. What were the leading contributors to performance?
A. Despite poor performance in the Energy sector during the reporting period, the Fund benefited from a slight underweight to and strong stock selection in this sector. The price momentum factor aided the strategy by acting as a stop loss indicator for some of the
| | |
| BrandywineGLOBAL — Diversified US Large Cap Value Fund 2019 Annual Report | | 3 |
Fund overview (cont’d)
weaker performing exploration & production (“E&P”) holdings. Additionally, the Fund’s positioning in the refining industry aided performance and was the only bright spot in a sector full of losses. The Industrials sector also performed strongly over the last twelve months and the added benefit to our strategy which was driven from our deselection process of what companies we avoided. The biggest impact was from General Electric which continues to struggle. We have stayed away from the company from both a valuation basis and adverse price momentum.
There was not a pronounced positive impact from any of the factors; however, price momentum did provide a slight benefit since the bottom quartile lagged again. This factor has been consistently positive in our strategy over the last five years.
Q. What were the leading detractors from performance?
A. The landscape has not changed dramatically over the past few years, with the scales still tipped in favor of higher valuation, growth style investing. This has continued to be a strong headwind for our process since we focus on lower valuation companies. Many of the Fund’s holdings that rose in price and were sold on higher valuation earlier in the year, such as Dollar General, Walmart and Proctor and Gamble, continued to rise in value as investors were willing to continue to pay higher multiples for earnings growth and sales growth. This had a negative impact on the Fund, because despite selling these holdings after strong gains, their prices continued to rise and thus the Fund lagged on a relative basis during the reporting period.
The domestic economy has remained strong; however, globally that is not the case. Interest rates have dropped globally, and the Fed transitioned from tightening to then lowering the federal target rate. In this low interest rate environment, the higher yielding Utilities and Real Estate sectors have been used by many as proxies for bonds. Part of the Fund’s underperformance has come from these sectors as these companies have also been steadily bid up in price. The Fund has been underweight from high share issuance or being too expensive from a valuation basis. We have maintained large overweights in the Financials and Information Technology (“IT”) sectors which provided yield to the Fund at much more reasonable valuation levels and helped to lower the overall risk profile of the Fund. We believe owning companies like Prudential Financial, Wells Fargo and IBM which have dividend yields over 4% and are trading below 11x earnings are less risky than owning Welltower and Ventas which are Real Estate Investment Trusts (“REITs”)xii trading well above 50x trailing twelve month earnings with slightly lower yields or even FirstEnergy which is a utility with a P/E in the low 20’s and a much lower dividend yield.
Q. Were there any significant changes to the Fund during the reporting period?
A. We made no significant changes to the Fund’s investment process over the past year, and we remain focused on maintaining a portfolio of lower valuation large cap value stocks with favorable price momentum and quality characteristics. As always, changes in the Fund’s positions and sector weights are the result of ourbottom-up stock selection process, rather than any macro themes. The largest sector changes were in the Industrials and the
| | |
4 | | BrandywineGLOBAL — Diversified US Large Cap Value Fund 2019 Annual Report |
Financials sectors which we increased by slightly more than 4%. There were more new holdings in the Industrials sector as we added in allsub-industries, mostly on lower P/E ratios. It is a sector dominated by companies with low earnings multiples, but which have higher P/B multiples. We see the same dynamic in the IT sector which is why despite reducing the Fund’s absolute weighting in the sector during the year, it remains the second largest overweight after the benchmark further reduced its representation in the sector since the benchmark focuses on P/B. Within the Financials sector, the increase was driven from new holdings in capital markets and insurance companies as well as further adding to existing positions. For tracking error purposes, we restricted the Financials sector from becoming even more overweight otherwise the difference would have been slightly greater. The Fund ended the fiscal year with an 8% overweight in both the IT and Financials sectors. A small reduction in the Utilities sector during the year was mostly driven from companies issuing shares far more aggressively than what our process will accept. Over the last six months, we initially held back from selling completely out of some of the Fund’s utilities holdings, which was also for tracking error purposes. Despite a small absolute reduction in the Fund’s utilities holdings, the relative underweight of the strategy nearly doubled since this sector had been such a strong absolute performer. The Consumer Staples sector was similar to the absolute and relative changes in the Utilities sector. We sold out of some better performing holdings at higher valuations and at a good profit earlier in the year; however, these companies continued to show earnings growth and were bid up throughout the rest of the year to even higher valuation levels. In turn, the small reduction turned into a larger relative underweight by the end of this period. The largest reduction in the Fund’s holdings during the year was within the Health Care sector, mostly from poor performing large pharmaceutical and biotech holdings. We have watched the predicted tracking error steadily rise from a very low level in the Fund over the past 24 months. We have been actively adjusting the Fund to ensure the tracking error did not rise too quickly and have taken steps to keep it tamped down.
Thank you for your investment in BrandywineGLOBAL — Diversified US Large Cap Value Fund. As always, we appreciate that you have chosen us to manage your assets and we remain focused on achieving the Fund’s investment goals.
Sincerely,

Henry F. Otto
Portfolio Manager
Brandywine Global Investment Management, LLC
| | |
| BrandywineGLOBAL — Diversified US Large Cap Value Fund 2019 Annual Report | | 5 |
Fund overview (cont’d)

Steven M. Tonkovich
Portfolio Manager
Brandywine Global Investment Management, LLC

Joseph J. Kirby
Portfolio Manager
Brandywine Global Investment Management, LLC
October 18, 2019
RISKS: Equity securities are subject to market and price fluctuations. Large capitalization companies may fall out of favor with investors based on market and economic conditions. In return for the relative stability and low volatility of large capitalization companies, the Fund’s value may not rise as much as the value of funds that invest in companies with smaller market capitalization. In addition, the value approach to investing involves the risk that stocks may remain undervalued. Value stocks may underperform the overall equity market while the market concentrates on growth stocks. Please see the Fund’s prospectus for a more complete discussion of these and other risks and the Fund’s investment strategies.
Portfolio holdings and breakdowns are as of September 30, 2019 and are subject to change and may not be representative of the portfolio managers’ current or future investments. The Fund’s top ten holdings (as a percentage of net assets) as of September 30, 2019 were: JPMorgan Chase & Co. (4.5%), Apple Inc. (3.7%), Exxon Mobil Corp. (3.6%), Johnson & Johnson (3.5%), Verizon Communications Inc. (3.0%), Bank of America Corp. (2.8%), Intel Corp. (2.7%), Chevron Corp. (2.7%), Wells Fargo & Co. (2.7%) and Comcast Corp. (2.5%). Please refer to pages 14 through 23 for a list and percentage breakdown of the Fund’s holdings.
The mention of sector breakdowns is for informational purposes only and should not be construed as a recommendation to purchase or sell any securities. The information provided regarding such sectors is not a sufficient basis upon which to make an investment decision. Investors seeking financial advice regarding the appropriateness of investing in any securities or investment strategies discussed should consult their financial professional. The Fund’s top five sector holdings (as a percentage of net assets) as of September 30, 2019 were: Financials (31.8%), Information Technology (14.2%), Health Care (13.3%), Industrials (12.8%) and Energy (8.6%). The Fund’s portfolio composition is subject to change at any time.
All investments are subject to risk including the possible loss of principal. Past performance is no guarantee of future results. All index performance reflects no deduction for fees, expenses or taxes. Please note that an investor cannot invest directly in an index.
The information provided is not intended to be a forecast of future events, a guarantee of future results or investment advice. Views expressed may differ from those of the firm as a whole.
| | |
6 | | BrandywineGLOBAL — Diversified US Large Cap Value Fund 2019 Annual Report |
| i | The Russell 1000 Index measures the performance of thelarge-cap segment of the U.S. equity universe. It is a subset of the Russell 3000 Index and includes approximately 1,000 of the largest securities based on a combination of their market cap and current index membership. The Russell 1000 represents approximately 90% of the U.S. market. The Russell 3000 Index measures the performance of the 3,000 largest U.S. companies based on total market capitalization, which represents approximately 98% of the U.S. equity market. |
| ii | Theprice-to-earnings (“P/E”) ratio is a stock’s price divided by its earnings per share. |
| iii | Theprice-to-book (“P/B”) ratio is a stock’s price divided by the stock’s per share book value. |
| iv | The S&P 500 Index is an unmanaged index of 500 stocks and is generally representative of the performance of larger companies in the U.S. |
| v | The yield curve is the graphical depiction of the relationship between the yield on bonds of the same credit quality but different maturities. |
| vi | Gross domestic product (“GDP”) is the market value of all final goods and services produced within a country in a given period of time. |
| vii | The Federal Reserve Board (the “Fed”) is responsible for the formulation of U.S. policies designed to promote economic growth, full employment, stable prices and a sustainable pattern of international trade and payments. |
| viii | A basis point isone-hundredth (1/100 or 0.01) of one percent. |
| ix | The Federal Open Market Committee (“FOMC”) is a policy-making body of the Federal Reserve System responsible for the formulation of a policy designed to promote economic growth, full employment, stable prices and a sustainable pattern of international trade and payments. |
| x | The Russell 1000 Value Index measures the performance of thelarge-cap value segment of the U.S. equity universe. It includes those Russell 1000 Index companies with lowerprice-to-book ratios and lower expected growth values. |
| xi | Lipper, Inc., a wholly-owned subsidiary of Reuters, provides independent insight on global collective investments. Returns are based on the period ended September 30, 2019, including the reinvestment of all distributions, including returns of capital, if any, calculated among the 460 funds for thesix-month period and among the 455 funds for the twelve-month period in the Fund’s Lipper category, and excluding sales charges, if any. |
| xii | Real estate investment trusts (“REITs”) invest in real estate or loans secured by real estate and issue shares in such investments, which can be illiquid. |
| | |
| BrandywineGLOBAL — Diversified US Large Cap Value Fund 2019 Annual Report | | 7 |
Fund at a glance†(unaudited)
Investment breakdown(%) as a percent of total investments

| † | The bar graph above represents the composition of the Fund’s investments as of September 30, 2019 and September 30, 2018. The Fund is actively managed. As a result, the composition of the Fund’s investments is subject to change at any time. |
| | |
8 | | BrandywineGLOBAL — Diversified US Large Cap Value Fund 2019 Annual Report |
Fund expenses(unaudited)
Example
As a shareholder of the Fund, you may incur two types of costs: (1) transaction costs, includingfront-end andback-end sales charges (loads) on purchase payments; and (2) ongoing costs, including management fees; service and/or distribution(12b-1) fees; and other Fund expenses. This example is intended to help you understand your ongoing costs (in dollars) of investing in the Fund and to compare these costs with the ongoing costs of investing in other mutual funds.
This example is based on an investment of $1,000 invested on April 1, 2019 and held for the six months ended September 30, 2019.
Actual expenses
The table below titled “Based on Actual Total Return” provides information about actual account values and actual expenses. You may use the information provided in this table, together with the amount you invested, to estimate the expenses that you paid over the period. To estimate the expenses you paid on your account, divide your ending account value by $1,000 (for example, an $8,600 ending account value divided by $1,000 = 8.6), then multiply the result by the number under the heading entitled “Expenses Paid During the Period”.
Hypothetical example for comparison purposes
The table below titled “Based on Hypothetical Total Return” provides information about hypothetical account values and hypothetical expenses based on the actual expense ratio and an assumed rate of return of 5.00% per year before expenses, which is not the Fund’s actual return. The hypothetical account values and expenses may not be used to estimate the actual ending account balance or expenses you paid for the period. You may use the information provided in this table to compare the ongoing costs of investing in the Fund and other funds. To do so, compare the 5.00% hypothetical example relating to the Fund with the 5.00% hypothetical examples that appear in the shareholder reports of the other funds.
Please note that the expenses shown in the table below are meant to highlight your ongoing costs only and do not reflect any transactional costs, such asfront-end orback-end sales charges (loads). Therefore, the table is useful in comparing ongoing costs only, and will not help you determine the relative total costs of owning different funds. In addition, if these transaction costs were included, your costs would have been higher.
| | | | | | | | | | | | | | | | | | | | | | | | | | | | | | | | | | | | | | | | | | | | | | |
| | | |
| Based on actual total return1 | | | | | | | | | Based on hypothetical total return1 | |
| | | Actual
Total Return
Without
Sales
Charge2 | | | Beginning
Account Value | | | Ending Account Value | | | Annualized
Expense
Ratio | | | Expenses
Paid
During
the
Period3 | | | | | | | | Hypothetical
Annualized
Total Return | | | Beginning
Account Value | | | Ending
Account Value | | | Annualized
Expense
Ratio | | | Expenses
Paid
During
the
Period3 | |
| Class A | | | 3.78 | % | | $ | 1,000.00 | | | $ | 1,037.80 | | | | 1.10 | % | | $ | 5.62 | | | | | | | Class A | | | 5.00 | % | | $ | 1,000.00 | | | $ | 1,019.55 | | | | 1.10 | % | | $ | 5.57 | |
| Class A2 | | | 3.72 | | | | 1,000.00 | | | | 1,037.20 | | | | 1.18 | | | | 6.03 | | | | | | | Class A2 | | | 5.00 | | | | 1,000.00 | | | | 1,019.15 | | | | 1.18 | | | | 5.97 | |
| Class C | | | 3.17 | | | | 1,000.00 | | | | 1,031.70 | | | | 1.84 | | | | 9.37 | | | | | | | Class C | | | 5.00 | | | | 1,000.00 | | | | 1,015.84 | | | | 1.84 | | | | 9.30 | |
| Class R | | | 3.63 | | | | 1,000.00 | | | | 1,036.30 | | | | 1.35 | | | | 6.89 | | | | | | | Class R | | | 5.00 | | | | 1,000.00 | | | | 1,018.30 | | | | 1.35 | | | | 6.83 | |
| Class I | | | 3.88 | | | | 1,000.00 | | | | 1,038.80 | | | | 0.80 | | | | 4.09 | | | | | | | Class I | | | 5.00 | | | | 1,000.00 | | | | 1,021.06 | | | | 0.80 | | | | 4.05 | |
| Class IS | | | 3.93 | | | | 1,000.00 | | | | 1,039.30 | | | | 0.70 | | | | 3.58 | | | | | | | Class IS | | | 5.00 | | | | 1,000.00 | | | | 1,021.56 | | | | 0.70 | | | | 3.55 | |
| | |
| BrandywineGLOBAL — Diversified US Large Cap Value Fund 2019 Annual Report | | 9 |
Fund expenses(unaudited) (cont’d)
| 1 | For the six months ended September 30, 2019. |
| 2 | Assumes the reinvestment of all distributions, including returns of capital, if any, at net asset value and does not reflect the deduction of the applicable sales charge with respect to Class A and Class A2 shares or the applicable contingent deferred sales charge (“CDSC”) with respect to Class C shares. Total return is not annualized, as it may not be representative of the total return for the year. Performance figures may reflect compensating balance arrangements, fee waivers and/or expense reimbursements. In the absence of compensating balance arrangements, fee waivers and/or expense reimbursements, the total return would have been lower. Past performance is no guarantee of future results. |
| 3 | Expenses (net of compensating balance arrangements, fee waivers and/or expense reimbursements) are equal to each class’ respective annualized expense ratio multiplied by the average account value over the period, multiplied by the number of days in the most recent fiscal half-year (183), then divided by 365. |
| | |
10 | | BrandywineGLOBAL — Diversified US Large Cap Value Fund 2019 Annual Report |
Fund performance (unaudited)
| | | | | | | | | | | | | | | | | | | | | | | | |
| Average annual total returns | | | | | | | | | | | | | | | | |
| Without sales charges1 | | Class A | | | Class A2 | | | Class C | | | Class R | | | Class I | | | Class IS | |
| Twelve Months Ended 9/30/19 | | | -0.36 | % | | | -0.44 | % | | | -1.29 | % | | | -0.62 | % | | | -0.10 | % | | | 0.01 | % |
| Five Years Ended 9/30/19 | | | 7.49 | | | | 7.32 | | | | 6.63 | | | | 7.21 | | | | 7.78 | | | | 7.89 | |
| Inception* through 9/30/19 | | | 11.93 | | | | 10.71 | | | | 11.07 | | | | 8.46 | | | | 12.25 | | | | 12.34 | |
| | | | | | |
| With sales charges2 | | Class A | | | Class A2 | | | Class C | | | Class R | | | Class I | | | Class IS | |
| Twelve Months Ended 9/30/19 | | | -6.08 | % | | | -6.18 | % | | | -2.19 | % | | | -0.62 | % | | | -0.10 | % | | | 0.01 | % |
| Five Years Ended 9/30/19 | | | 6.22 | | | | 6.06 | | | | 6.63 | | | | 7.21 | | | | 7.78 | | | | 7.89 | |
| Inception* through 9/30/19 | | | 11.20 | | | | 9.77 | | | | 11.07 | | | | 8.46 | | | | 12.25 | | | | 12.34 | |
| | | | |
| Cumulative total returns | |
| Without sales charges1 | | | |
| Class A (Inception date of 9/7/10 through 9/30/19) | | | 177.75 | % |
| Class A2 (Inception date of 10/31/12 through 9/30/19) | | | 102.05 | |
| Class C (Inception date of 9/7/10 through 9/30/19) | | | 158.90 | |
| Class R (Inception date of 1/31/14 through 9/30/19) | | | 58.37 | |
| Class I (Inception date of 9/7/10 through 9/30/19) | | | 184.97 | |
| Class IS (Inception date of 9/7/10 through 9/30/19) | | | 187.01 | |
All figures represent past performance and are not a guarantee of future results. Investment return and principal value of an investment will fluctuate so that an investor’s shares, when redeemed, may be worth more or less than their original cost. The returns shown do not reflect the deduction of taxes that a shareholder would pay on Fund distributions or the redemption of Fund shares. Performance figures may reflect compensating balance arrangements, fee waivers and/or expense reimbursements. In the absence of compensating balance arrangements, fee waivers and/or expense reimbursements, the total return would have been lower.
| 1 | Assumes the reinvestment of all distributions, including returns of capital, if any, at net asset value and does not reflect the deduction of the applicable sales charge with respect to Class A shares and Class A2 Shares or the applicable contingent deferred sales charge (“CDSC”) with respect to Class C shares. |
| 2 | Assumes the reinvestment of all distributions, including returns of capital, if any, at net asset value. In addition, Class A shares and Class A2 shares reflect the deduction of the maximum initial sales charge of 5.75%. Class C shares reflect the deduction of a 1.00% CDSC, which applies if shares are redeemed within one year from purchase payment. |
| * | Inception dates for Class A, A2, C, R, I and IS shares are September 7, 2010, October 31, 2012, September 7, 2010, January 31, 2014, September 7, 2010 and September 7, 2010, respectively. |
| | |
| BrandywineGLOBAL — Diversified US Large Cap Value Fund 2019 Annual Report | | 11 |
Fund performance(unaudited) (cont’d)
Historical performance
Value of $10,000 invested in
Class A and C Shares of BrandywineGLOBAL — Diversified US Large Cap Value Fund vs. Russell 1000 Value Index† — September 7, 2010 - September 2019

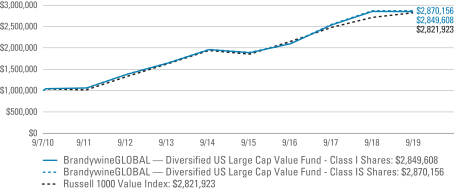
Value of $1,000,000 invested in
Class I and IS Shares of BrandywineGLOBAL — Diversified US Large Cap Value Fund vs. Russell 1000 Value Index† — September 7, 2010 - September 2019
All figures represent past performance and are not a guarantee of future results. Investment return and principal value of an investment will fluctuate so that an investor’s shares, when redeemed, may be worth more or less than their original cost. The returns shown do not reflect the deduction of taxes that a shareholder would pay on Fund distributions or the redemption of Fund shares. Performance figures may reflect compensating balance arrangements, fee waivers and/or expense reimbursements. In the absence of compensating balance arrangements, fee waivers and/or expense reimbursements, the total return would have been lower.
| | |
12 | | BrandywineGLOBAL — Diversified US Large Cap Value Fund 2019 Annual Report |
| † | Hypothetical illustration of $10,000 invested in Class A and C shares and $1,000,000 invested in Class I and IS shares of BrandywineGLOBAL — Diversified US Large Cap Value Fund on September 7, 2010 (inception date), assuming the deduction of the maximum sales charge of 5.75% at the time of investment for Class A shares and the reinvestment of all distributions, including returns of capital, if any, at net asset value through September 30, 2019. The hypothetical illustration also assumes a $10,000 or $1,000,000 investment, as applicable, in the Russell 1000 Value Index. The Russell 1000 Value Index measures the performance of thelarge-cap value segment of the U.S. equity universe. It includes those Russell 1000 Index companies with lowerprice-to-book ratios and lower expected growth values. (Aprice-to-book ratio is the price of a stock compared to the difference between a company’s assets and liabilities). The index is unmanaged and is not subject to the same management and trading expenses as a mutual fund. Please note that an investor cannot invest directly in an index. The performance of the Fund’s other classes may be greater or less than the Class A, C, I and IS shares’ performance indicated on these charts, depending on whether greater or lower sales charges and fees were incurred by shareholders investing in the other classes. |
| | |
| BrandywineGLOBAL — Diversified US Large Cap Value Fund 2019 Annual Report | | 13 |
Schedule of investments
September 30, 2019
BrandywineGLOBAL — Diversified US Large Cap Value Fund
| | | | | | | | | | | | | | | | |
| Security | | | | | | | | Shares | | | Value | |
| Common Stocks — 98.7% | | | | | | | | | | | | | | | | |
| Communication Services — 5.8% | | | | | | | | | | | | | | | | |
Diversified Telecommunication Services — 3.0% | | | | | | | | | | | | | | | | |
Verizon Communications Inc. | | | | | | | | | | | 315,662 | | | $ | 19,053,358 | |
Entertainment — 0.0% | | | | | | | | | | | | | | | | |
Cinemark Holdings | | | | | | | | | | | 4,695 | | | | 181,415 | |
Media — 2.8% | | | | | | | | | | | | | | | | |
Comcast Corp., Class A Shares | | | | | | | | | | | 346,212 | | | | 15,607,237 | |
Interpublic Group of Cos. Inc. | | | | | | | | | | | 26,623 | | | | 573,992 | |
Omnicom Group Inc. | | | | | | | | | | | 16,629 | | | | 1,302,051 | |
Total Media | | | | | | | | | | | | | | | 17,483,280 | |
Total Communication Services | | | | | | | | | | | | | | | 36,718,053 | |
| Consumer Discretionary — 5.1% | | | | | | | | | | | | | | | | |
Auto Components — 0.5% | | | | | | | | | | | | | | | | |
Aptiv PLC | | | | | | | | | | | 18,116 | | | | 1,583,701 | |
BorgWarner Inc. | | | | | | | | | | | 15,736 | | | | 577,196 | |
Gentex Corp. | | | | | | | | | | | 19,452 | | | | 535,611 | |
Lear Corp. | | | | | | | | | | | 4,360 | | | | 514,044 | |
Total Auto Components | | | | | | | | | | | | | | | 3,210,552 | |
Automobiles — 1.1% | | | | | | | | | | | | | | | | |
Ford Motor Co. | | | | | | | | | | | 299,078 | | | | 2,739,555 | |
General Motors Co. | | | | | | | | | | | 98,567 | | | | 3,694,291 | |
Harley-Davidson Inc. | | | | | | | | | | | 11,965 | | | | 430,381 | |
Total Automobiles | | | | | | | | | | | | | | | 6,864,227 | |
Distributors — 0.3% | | | | | | | | | | | | | | | | |
Genuine Parts Co. | | | | | | | | | | | 10,364 | | | | 1,032,151 | |
LKQ Corp. | | | | | | | | | | | 23,500 | | | | 739,075 | * |
Total Distributors | | | | | | | | | | | | | | | 1,771,226 | |
Diversified Consumer Services — 0.0% | | | | | | | | | | | | | | | | |
H&R Block Inc. | | | | | | | | | | | 14,298 | | | | 337,719 | |
Hotels, Restaurants & Leisure — 0.6% | | | | | | | | | | | | | | | | |
Hyatt Hotels Corp., Class A Shares | | | | | | | | | | | 2,546 | | | | 187,564 | |
Las Vegas Sands Corp. | | | | | | | | | | | 16,327 | | | | 943,047 | |
Norwegian Cruise Line Holdings Ltd. | | | | | | | | | | | 16,423 | | | | 850,219 | * |
Royal Caribbean Cruises Ltd. | | | | | | | | | | | 14,860 | | | | 1,609,784 | |
Total Hotels, Restaurants & Leisure | | | | | | | | | | | | | | | 3,590,614 | |
Household Durables — 1.0% | | | | | | | | | | | | | | | | |
DR Horton Inc. | | | | | | | | | | | 25,893 | | | | 1,364,820 | |
Leggett & Platt Inc. | | | | | | | | | | | 8,370 | | | | 342,668 | |
Lennar Corp., Class A Shares | | | | | | | | | | | 21,721 | | | | 1,213,118 | |
Mohawk Industries Inc. | | | | | | | | | | | 5,500 | | | | 682,385 | * |
See Notes to Financial Statements.
| | |
14 | | BrandywineGLOBAL — Diversified US Large Cap Value Fund 2019 Annual Report |
BrandywineGLOBAL — Diversified US Large Cap Value Fund
| | | | | | | | | | | | | | | | |
| Security | | | | | | | | Shares | | | Value | |
Household Durables — continued | | | | | | | | | | | | | | | | |
NVR Inc. | | | | | | | | | | | 255 | | | $ | 947,924 | * |
PulteGroup Inc. | | | | | | | | | | | 20,923 | | | | 764,736 | |
Toll Brothers Inc. | | | | | | | | | | | 10,682 | | | | 438,496 | |
Whirlpool Corp. | | | | | | | | | | | 4,800 | | | | 760,128 | |
Total Household Durables | | | | | | | | | | | | | | | 6,514,275 | |
Leisure Products — 0.1% | | | | | | | | | | | | | | | | |
Polaris Inc. | | | | | | | | | | | 4,632 | | | | 407,662 | |
Multiline Retail — 0.6% | | | | | | | | | | | | | | | | |
Target Corp. | | | | | | | | | | | 37,754 | | | | 4,036,280 | |
Specialty Retail — 0.8% | | | | | | | | | | | | | | | | |
AutoZone Inc. | | | | | | | | | | | 1,917 | | | | 2,079,216 | * |
Best Buy Co. Inc. | | | | | | | | | | | 20,213 | | | | 1,394,495 | |
CarMax Inc. | | | | | | | | | | | 12,596 | | | | 1,108,448 | * |
Williams-Sonoma Inc. | | | | | | | | | | | 6,000 | | | | 407,880 | |
Total Specialty Retail | | | | | | | | | | | | | | | 4,990,039 | |
Textiles, Apparel & Luxury Goods — 0.1% | | | | | | | | | | | | | | | | |
Hanesbrands Inc. | | | | | | | | | | | 20,174 | | | | 309,066 | |
Ralph Lauren Corp. | | | | | | | | | | | 3,599 | | | | 343,596 | |
Total Textiles, Apparel & Luxury Goods | | | | | | | | | | | | | | | 652,662 | |
Total Consumer Discretionary | | | | | | | | | | | | | | | 32,375,256 | |
| Consumer Staples — 2.6% | | | | | | | | | | | | | | | | |
Beverages — 0.1% | | | | | | | | | | | | | | | | |
Molson Coors Brewing Co., Class B Shares | | | | | | | | | | | 10,949 | | | | 629,568 | |
Food & Staples Retailing — 0.0% | | | | | | | | | | | | | | | | |
US Foods Holding Corp. | | | | | | | | | | | 6,372 | | | | 261,889 | * |
Food Products — 1.1% | | | | | | | | | | | | | | | | |
Archer-Daniels-Midland Co. | | | | | | | | | | | 38,905 | | | | 1,597,828 | |
Campbell Soup Co. | | | | | | | | | | | 20,882 | | | | 979,783 | |
JM Smucker Co. | | | | | | | | | | | 7,908 | | | | 870,038 | |
Kellogg Co. | | | | | | | | | | | 26,011 | | | | 1,673,808 | |
Tyson Foods Inc., Class A Shares | | | | | | | | | | | 18,839 | | | | 1,622,792 | |
Total Food Products | | | | | | | | | | | | | | | 6,744,249 | |
Household Products — 0.0% | | | | | | | | | | | | | | | | |
Spectrum Brands Holdings Inc. | | | | | | | | | | | 618 | | | | 32,581 | |
Tobacco — 1.4% | | | | | | | | | | | | | | | | |
Philip Morris International Inc. | | | | | | | | | | | 116,898 | | | | 8,876,065 | |
Total Consumer Staples | | | | | | | | | | | | | | | 16,544,352 | |
| Energy — 8.6% | | | | | | | | | | | | | | | | |
Oil, Gas & Consumable Fuels — 8.6% | | | | | | | | | | | | | | | | |
Chevron Corp. | | | | | | | | | | | 144,885 | | | | 17,183,361 | |
See Notes to Financial Statements.
| | |
| BrandywineGLOBAL — Diversified US Large Cap Value Fund 2019 Annual Report | | 15 |
Schedule of investments (cont’d)
September 30, 2019
BrandywineGLOBAL — Diversified US Large Cap Value Fund
| | | | | | | | |
| Security | | Shares | | | Value | |
Oil, Gas & Consumable Fuels — continued | | | | | | | | |
ConocoPhillips | | | 80,700 | | | | $ 4,598,286 | |
Devon Energy Corp. | | | 28,980 | | | | 697,259 | |
Exxon Mobil Corp. | | | 322,958 | | | | 22,804,064 | |
Hess Corp. | | | 21,807 | | | | 1,318,887 | |
HollyFrontier Corp. | | | 12,600 | | | | 675,864 | |
Noble Energy Inc. | | | 36,500 | | | | 819,790 | |
Phillips 66 | | | 34,246 | | | | 3,506,791 | |
Valero Energy Corp. | | | 31,600 | | | | 2,693,584 | |
Total Energy | | | | | | | 54,297,886 | |
| Financials — 31.8% | | | | | | | | |
Banks — 16.3% | | | | | | | | |
Bank of America Corp. | | | 618,198 | | | | 18,032,836 | |
BB&T Corp. | | | 54,013 | | | | 2,882,674 | |
CIT Group Inc. | | | 8,928 | | | | 404,528 | |
Citigroup Inc. | | | 179,713 | | | | 12,414,574 | |
Citizens Financial Group Inc. | | | 33,898 | | | | 1,198,972 | |
Comerica Inc. | | | 10,192 | | | | 672,570 | |
Commerce Bancshares Inc. | | | 7,703 | | | | 467,187 | |
Cullen/Frost Bankers Inc. | | | 4,371 | | | | 387,052 | |
Huntington Bancshares Inc. | | | 74,454 | | | | 1,062,459 | |
JPMorgan Chase & Co. | | | 241,123 | | | | 28,377,766 | |
KeyCorp | | | 73,688 | | | | 1,314,594 | |
M&T Bank Corp. | | | 10,362 | | | | 1,636,885 | |
PNC Financial Services Group Inc. | | | 32,862 | | | | 4,605,938 | |
Popular Inc. | | | 6,813 | | | | 368,447 | |
Prosperity Bancshares Inc. | | | 4,752 | | | | 335,634 | |
Regions Financial Corp. | | | 78,793 | | | | 1,246,505 | |
Signature Bank | | | 3,896 | | | | 464,481 | |
SunTrust Banks Inc. | | | 32,534 | | | | 2,238,339 | |
SVB Financial Group | | | 2,900 | | | | 605,955 | * |
US Bancorp | | | 114,836 | | | | 6,355,024 | |
Webster Financial Corp. | | | 6,309 | | | | 295,703 | |
Wells Fargo & Co. | | | 339,811 | | | | 17,140,067 | |
Zions Bancorp NA | | | 13,743 | | | | 611,838 | |
Total Banks | | | | | | | 103,120,028 | |
Capital Markets — 5.2% | | | | | | | | |
Ameriprise Financial Inc. | | | 10,976 | | | | 1,614,570 | |
Bank of New York Mellon Corp. | | | 70,360 | | | | 3,180,976 | |
BlackRock Inc. | | | 10,950 | | | | 4,879,758 | |
Charles Schwab Corp. | | | 86,875 | | | | 3,633,981 | |
See Notes to Financial Statements.
| | |
16 | | BrandywineGLOBAL — Diversified US Large Cap Value Fund 2019 Annual Report |
BrandywineGLOBAL — Diversified US Large Cap Value Fund
| | | | | | | | | | | | | | | | |
| Security | | | | | | | | Shares | | | Value | |
Capital Markets — continued | | | | | | | | | | | | | | | | |
E*TRADE Financial Corp. | | | | | | | | | | | 17,963 | | | $ | 784,804 | |
Franklin Resources Inc. | | | | | | | | | | | 35,313 | | | | 1,019,133 | |
Goldman Sachs Group Inc. | | | | | | | | | | | 26,322 | | | | 5,454,708 | |
LPL Financial Holdings Inc. | | | | | | | | | | | 5,857 | | | | 479,688 | |
Morgan Stanley | | | | | | | | | | | 125,631 | | | | 5,360,675 | |
Nasdaq Inc. | | | | | | | | | | | 3,466 | | | | 344,347 | |
Northern Trust Corp. | | | | | | | | | | | 15,213 | | | | 1,419,677 | |
Raymond James Financial Inc. | | | | | | | | | | | 9,839 | | | | 811,324 | |
SEI Investments Co. | | | | | | | | | | | 9,895 | | | | 586,328 | |
T Rowe Price Group Inc. | | | | | | | | | | | 16,629 | | | | 1,899,863 | |
TD Ameritrade Holding Corp. | | | | | | | | | | | 38,473 | | | | 1,796,689 | |
Total Capital Markets | | | | | | | | | | | | | | | 33,266,521 | |
Consumer Finance — 2.5% | | | | | | | | | | | | | | | | |
Ally Financial Inc. | | | | | | | | | | | 30,263 | | | | 1,003,521 | |
American Express Co. | | | | | | | | | | | 60,257 | | | | 7,127,198 | |
Capital One Financial Corp. | | | | | | | | | | | 33,200 | | | | 3,020,536 | |
Credit Acceptance Corp. | | | | | | | | | | | 1,353 | | | | 624,152 | * |
Discover Financial Services | | | | | | | | | | | 26,767 | | | | 2,170,536 | |
Santander Consumer USA Holdings Inc. | | | | | | | | | | | 24,933 | | | | 636,041 | |
Synchrony Financial | | | | | | | | | | | 47,920 | | | | 1,633,593 | |
Total Consumer Finance | | | | | | | | | | | | | | | 16,215,577 | |
Diversified Financial Services — 0.3% | | | | | | | | | | | | | | | | |
AXA Equitable Holdings Inc. | | | | | | | | | | | 34,700 | | | | 768,952 | |
Jefferies Financial Group Inc. | | | | | | | | | | | 24,744 | | | | 455,289 | |
Voya Financial Inc. | | | | | | | | | | | 12,213 | | | | 664,876 | |
Total Diversified Financial Services | | | | | | | | | | | | | | | 1,889,117 | |
Insurance — 7.4% | | | | | | | | | | | | | | | | |
Aflac Inc. | | | | | | | | | | | 54,128 | | | | 2,831,977 | |
Alleghany Corp. | | | | | | | | | | | 1,212 | | | | 966,885 | * |
Allstate Corp. | | | | | | | | | | | 25,656 | | | | 2,788,294 | |
American Financial Group Inc. | | | | | | | | | | | 11,911 | | | | 1,284,601 | |
American International Group Inc. | | | | | | | | | | | 61,479 | | | | 3,424,380 | |
Arch Capital Group Ltd. | | | | | | | | | | | 28,057 | | | | 1,177,833 | * |
Assurant Inc. | | | | | | | | | | | 4,300 | | | | 541,026 | |
Athene Holding Ltd., Class A Shares | | | | | | | | | | | 11,056 | | | | 465,015 | * |
Chubb Ltd. | | | | | | | | | | | 32,172 | | | | 5,193,848 | |
Cincinnati Financial Corp. | | | | | | | | | | | 11,367 | | | | 1,326,188 | |
Everest Re Group Ltd. | | | | | | | | | | | 2,905 | | | | 772,991 | |
Fidelity National Financial Inc. | | | | | | | | | | | 16,197 | | | | 719,309 | |
Globe Life Inc. | | | | | | | | | | | 19,445 | | | | 1,862,053 | |
See Notes to Financial Statements.
| | |
| BrandywineGLOBAL — Diversified US Large Cap Value Fund 2019 Annual Report | | 17 |
Schedule of investments (cont’d)
September 30, 2019
BrandywineGLOBAL — Diversified US Large Cap Value Fund
| | | | | | | | | | | | | | | | |
| Security | | | | | | | | Shares | | | Value | |
Insurance — continued | | | | | | | | | | | | | | | | |
Hanover Insurance Group Inc. | | | | | | | | | | | 2,800 | | | $ | 379,512 | |
Hartford Financial Services Group Inc. | | | | | | | | | | | 24,762 | | | | 1,500,825 | |
Lincoln National Corp. | | | | | | | | | | | 15,115 | | | | 911,737 | |
Loews Corp. | | | | | | | | | | | 22,804 | | | | 1,173,950 | |
Markel Corp. | | | | | | | | | | | 977 | | | | 1,154,716 | * |
MetLife Inc. | | | | | | | | | | | 73,057 | | | | 3,445,368 | |
Old Republic International Corp. | | | | | | | | | | | 17,100 | | | | 403,047 | |
Principal Financial Group Inc. | | | | | | | | | | | 19,684 | | | | 1,124,744 | |
Progressive Corp. | | | | | | | | | | | 33,031 | | | | 2,551,645 | |
Prudential Financial Inc. | | | | | | | | | | | 29,358 | | | | 2,640,752 | |
Reinsurance Group of America Inc. | | | | | | | | | | | 4,641 | | | | 742,003 | |
Travelers Cos. Inc. | | | | | | | | | | | 42,650 | | | | 6,341,629 | |
WR Berkley Corp. | | | | | | | | | | | 12,643 | | | | 913,204 | |
Total Insurance | | | | | | | | | | | | | | | 46,637,532 | |
Thrifts & Mortgage Finance — 0.1% | | | | | | | | | | | | | | | | |
New York Community Bancorp Inc. | | | | | | | | | | | 32,984 | | | | 413,949 | |
Total Financials | | | | | | | | | | | | | | | 201,542,724 | |
| Health Care — 13.3% | | | | | | | | | | | | | | | | |
Biotechnology — 2.3% | | | | | | | | | | | | | | | | |
Amgen Inc. | | | | | | | | | | | 46,581 | | | | 9,013,889 | |
Gilead Sciences Inc. | | | | | | | | | | | 90,846 | | | | 5,757,820 | |
Total Biotechnology | | | | | | | | | | | | | | | 14,771,709 | |
Health Care Providers & Services — 2.8% | | | | | | | | | | | | | | | | |
AmerisourceBergen Corp. | | | | | | | | | | | 15,866 | | | | 1,306,248 | |
Anthem Inc. | | | | | | | | | | | 18,100 | | | | 4,345,810 | |
Cardinal Health Inc. | | | | | | | | | | | 22,347 | | | | 1,054,555 | |
DaVita Inc. | | | | | | | | | | | 11,300 | | | | 644,891 | * |
HCA Healthcare Inc. | | | | | | | | | | | 24,265 | | | | 2,921,991 | |
Henry Schein Inc. | | | | | | | | | | | 10,502 | | | | 666,877 | * |
Humana Inc. | | | | | | | | | | | 9,500 | | | | 2,428,865 | |
Laboratory Corp. of America Holdings | | | | | | | | | | | 7,080 | | | | 1,189,440 | * |
McKesson Corp. | | | | | | | | | | | 14,079 | | | | 1,924,036 | |
Quest Diagnostics Inc. | | | | | | | | | | | 10,268 | | | | 1,098,984 | |
Total Health Care Providers & Services | | | | | | | | | | | | | | | 17,581,697 | |
Life Sciences Tools & Services — 0.1% | | | | | | | | | | | | | | | | |
Bio-Rad Laboratories Inc., Class A Shares | | | | | | | | | | | 1,859 | | | | 618,564 | * |
Pharmaceuticals — 8.1% | | | | | | | | | | | | | | | | |
Bristol-Myers Squibb Co. | | | | | | | | | | | 87,367 | | | | 4,430,381 | |
Jazz Pharmaceuticals PLC | | | | | | | | | | | 4,360 | | | | 558,690 | * |
Johnson & Johnson | | | | | | | | | | | 170,526 | | | | 22,062,654 | |
See Notes to Financial Statements.
| | |
18 | | BrandywineGLOBAL — Diversified US Large Cap Value Fund 2019 Annual Report |
BrandywineGLOBAL — Diversified US Large Cap Value Fund
| | | | | | | | |
| Security | | Shares | | | Value | |
Pharmaceuticals — continued | | | | | | | | |
Merck & Co. Inc. | | | 165,347 | | | | $13,918,911 | |
Perrigo Co. PLC | | | 5,205 | | | | 290,907 | |
Pfizer Inc. | | | 272,796 | | | | 9,801,560 | |
Total Pharmaceuticals | | | | | | | 51,063,103 | |
Total Health Care | | | | | | | 84,035,073 | |
| Industrials — 12.8% | | | | | | | | |
Aerospace & Defense — 3.4% | | | | | | | | |
General Dynamics Corp. | | | 22,069 | | | | 4,032,668 | |
Huntington Ingalls Industries Inc. | | | 3,156 | | | | 668,409 | |
Lockheed Martin Corp. | | | 18,175 | | | | 7,089,340 | |
Northrop Grumman Corp. | | | 11,790 | | | | 4,418,774 | |
Raytheon Co. | | | 17,983 | | | | 3,528,085 | |
Spirit AeroSystems Holdings Inc., Class A Shares | | | 7,908 | | | | 650,354 | |
Textron Inc. | | | 17,536 | | | | 858,563 | |
Total Aerospace & Defense | | | | | | | 21,246,193 | |
Air Freight & Logistics — 1.2% | | | | | | | | |
CH Robinson Worldwide Inc. | | | 10,345 | | | | 877,049 | |
United Parcel Service Inc., Class B Shares | | | 53,303 | | | | 6,386,766 | |
Total Air Freight & Logistics | | | | | | | 7,263,815 | |
Airlines — 1.2% | | | | | | | | |
Alaska Air Group Inc. | | | 9,405 | | | | 610,479 | |
Delta Air Lines Inc. | | | 49,669 | | | | 2,860,934 | |
JetBlue Airways Corp. | | | 20,957 | | | | 351,030 | * |
Southwest Airlines Co. | | | 41,063 | | | | 2,217,813 | |
United Airlines Holdings Inc. | | | 19,642 | | | | 1,736,549 | * |
Total Airlines | | | | | | | 7,776,805 | |
Building Products — 0.7% | | | | | | | | |
AO Smith Corp. | | | 8,000 | | | | 381,680 | |
Fortune Brands Home & Security Inc. | | | 10,664 | | | | 583,321 | |
Johnson Controls International PLC | | | 45,431 | | | | 1,993,966 | |
Masco Corp. | | | 22,095 | | | | 920,920 | |
Owens Corning | | | 8,341 | | | | 527,151 | |
Total Building Products | | | | | | | 4,407,038 | |
Construction & Engineering — 0.1% | | | | | | | | |
AECOM | | | 12,036 | | | | 452,072 | * |
Quanta Services Inc. | | | 10,900 | | | | 412,020 | |
Total Construction & Engineering | | | | | | | 864,092 | |
Electrical Equipment — 1.3% | | | | | | | | |
Acuity Brands Inc. | | | 3,064 | | | | 412,997 | |
Eaton Corp. PLC | | | 32,105 | | | | 2,669,531 | |
See Notes to Financial Statements.
| | |
| BrandywineGLOBAL — Diversified US Large Cap Value Fund 2019 Annual Report | | 19 |
Schedule of investments (cont’d)
September 30, 2019
BrandywineGLOBAL — Diversified US Large Cap Value Fund
| | | | | | | | |
| Security | | Shares | | | Value | |
Electrical Equipment — continued | | | | | | | | |
Emerson Electric Co. | | | 43,448 | | | | $ 2,904,933 | |
Hubbell Inc. | | | 4,121 | | | | 541,499 | |
Rockwell Automation Inc. | | | 8,300 | | | | 1,367,840 | |
Sensata Technologies Holding PLC | | | 12,303 | | | | 615,888 | * |
Total Electrical Equipment | | | | | | | 8,512,688 | |
Machinery — 3.2% | | | | | | | | |
AGCO Corp. | | | 5,830 | | | | 441,331 | |
Allison Transmission Holdings Inc. | | | 9,632 | | | | 453,186 | |
Caterpillar Inc. | | | 39,761 | | | | 5,022,212 | |
Crane Co. | | | 2,838 | | | | 228,828 | |
Cummins Inc. | | | 12,055 | | | | 1,960,987 | |
Deere & Co. | | | 24,020 | | | | 4,051,693 | |
Dover Corp. | | | 10,311 | | | | 1,026,563 | |
Lincoln Electric Holdings Inc. | | | 4,400 | | | | 381,744 | |
Oshkosh Corp. | | | 4,917 | | | | 372,709 | |
PACCAR Inc. | | | 26,413 | | | | 1,849,174 | |
Parker-Hannifin Corp. | | | 9,816 | | | | 1,772,868 | |
Pentair PLC | | | 11,934 | | | | 451,105 | |
Snap-on Inc. | | | 4,221 | | | | 660,755 | |
Stanley Black & Decker Inc. | | | 11,605 | | | | 1,675,878 | |
Total Machinery | | | | | | | 20,349,033 | |
Professional Services — 0.2% | | | | | | | | |
ManpowerGroup Inc. | | | 4,164 | | | | 350,775 | |
Nielsen Holdings PLC | | | 23,150 | | | | 491,938 | |
Robert Half International Inc. | | | 8,343 | | | | 464,371 | |
Total Professional Services | | | | | | | 1,307,084 | |
Road & Rail — 1.1% | | | | | | | | |
AMERCO | | | 1,470 | | | | 573,359 | |
CSX Corp. | | | 60,900 | | | | 4,218,543 | |
J.B. Hunt Transport Services Inc. | | | 6,706 | | | | 742,019 | |
Kansas City Southern | | | 5,835 | | | | 776,113 | |
Knight-Swift Transportation Holdings Inc. | | | 13,049 | | | | 473,679 | |
Total Road & Rail | | | | | | | 6,783,713 | |
Trading Companies & Distributors — 0.4% | | | | | | | | |
HD Supply Holdings Inc. | | | 12,080 | | | | 473,234 | * |
United Rentals Inc. | | | 5,938 | | | | 740,112 | * |
W.W. Grainger Inc. | | | 4,214 | | | | 1,252,190 | |
Total Trading Companies & Distributors | | | | | | | 2,465,536 | |
Total Industrials | | | | | | | 80,975,997 | |
See Notes to Financial Statements.
| | |
20 | | BrandywineGLOBAL — Diversified US Large Cap Value Fund 2019 Annual Report |
BrandywineGLOBAL — Diversified US Large Cap Value Fund
| | | | | | | | | | | | | | | | |
| Security | | | | | | | | Shares | | | Value | |
| Information Technology — 14.2% | | | | | | | | | | | | | | | | |
Communications Equipment — 0.1% | | | | | | | | | | | | | | | | |
Juniper Networks Inc. | | | | | | | | | | | 23,935 | | | $ | 592,391 | |
Electronic Equipment, Instruments & Components — 0.4% | | | | | | | | | | | | | | | | |
Arrow Electronics Inc. | | | | | | | | | | | 6,370 | | | | 475,074 | * |
Corning Inc. | | | | | | | | | | | 80,344 | | | | 2,291,411 | |
Total Electronic Equipment, Instruments & Components | | | | | | | | | | | | | | | 2,766,485 | |
IT Services — 2.2% | | | | | | | | | | | | | | | | |
Cognizant Technology Solutions Corp., Class A Shares | | | | | | | | | | | 39,600 | | | | 2,386,494 | |
International Business Machines Corp. | | | | | | | | | | | 67,592 | | | | 9,829,229 | |
Leidos Holdings Inc. | | | | | | | | | | | 9,995 | | | | 858,371 | |
Western Union Co. | | | | | | | | | | | 32,397 | | | | 750,638 | |
Total IT Services | | | | | | | | | | | | | | | 13,824,732 | |
Semiconductors & Semiconductor Equipment — 5.1% | | | | | | | | | | | | | | | | |
Applied Materials Inc. | | | | | | | | | | | 65,108 | | | | 3,248,889 | |
Broadcom Inc. | | | | | | | | | | | 13,637 | | | | 3,764,767 | |
Intel Corp. | | | | | | | | | | | 338,146 | | | | 17,424,663 | |
Lam Research Corp. | | | | | | | | | | | 9,687 | | | | 2,238,763 | |
Micron Technology Inc. | | | | | | | | | | | 78,000 | | | | 3,342,300 | * |
ON Semiconductor Corp. | | | | | | | | | | | 31,304 | | | | 601,350 | * |
Qorvo Inc. | | | | | | | | | | | 8,989 | | | | 666,444 | * |
Skyworks Solutions Inc. | | | | | | | | | | | 13,144 | | | | 1,041,662 | |
Total Semiconductors & Semiconductor Equipment | | | | | | | | | | | | | | | 32,328,838 | |
Software — 2.4% | | | | | | | | | | | | | | | | |
CDK Global Inc. | | | | | | | | | | | 8,530 | | | | 410,208 | |
Oracle Corp. | | | | | | | | | | | 268,769 | | | | 14,790,358 | |
Total Software | | | | | | | | | | | | | | | 15,200,566 | |
Technology Hardware, Storage & Peripherals — 4.0% | | | | | | | | | | | | | | | | |
Apple Inc. | | | | | | | | | | | 103,976 | | | | 23,287,505 | |
Hewlett Packard Enterprise Co. | | | | | | | | | | | 99,668 | | | | 1,511,964 | |
Xerox Holdings Corp. | | | | | | | | | | | 15,586 | | | | 466,177 | |
Total Technology Hardware, Storage & Peripherals | | | | | | | | | | | | | | | 25,265,646 | |
Total Information Technology | | | | | | | | | | | | | | | 89,978,658 | |
| Materials — 2.0% | | | | | | | | | | | | | | | | |
Chemicals — 1.2% | | | | | | | | | | | | | | | | |
Celanese Corp. | | | | | | | | | | | 9,405 | | | | 1,150,137 | |
Eastman Chemical Co. | | | | | | | | | | | 10,460 | | | | 772,262 | |
FMC Corp. | | | | | | | | | | | 9,984 | | | | 875,397 | |
LyondellBasell Industries NV, Class A Shares | | | | | | | | | | | 31,110 | | | | 2,783,412 | |
PPG Industries Inc. | | | | | | | | | | | 17,413 | | | | 2,063,615 | |
Total Chemicals | | | | | | | | | | | | | | | 7,644,823 | |
See Notes to Financial Statements.
| | |
| BrandywineGLOBAL — Diversified US Large Cap Value Fund 2019 Annual Report | | 21 |
Schedule of investments (cont’d)
September 30, 2019
BrandywineGLOBAL — Diversified US Large Cap Value Fund
| | | | | | | | | | | | | | | | |
| Security | | | | | | | | Shares | | | Value | |
Containers & Packaging — 0.5% | | | | | | | | | | | | | | | | |
Avery Dennison Corp. | | | | | | | | | | | 5,437 | | | $ | 617,480 | |
Berry Global Group Inc. | | | | | | | | | | | 757 | | | | 29,727 | * |
International Paper Co. | | | | | | | | | | | 30,023 | | | | 1,255,562 | |
Packaging Corp. of America | | | | | | | | | | | 6,545 | | | | 694,424 | |
Sealed Air Corp. | | | | | | | | | | | 11,819 | | | | 490,607 | |
Sonoco Products Co. | | | | | | | | | | | 6,352 | | | | 369,750 | |
Total Containers & Packaging | | | | | | | | | | | | | | | 3,457,550 | |
Metals & Mining — 0.3% | | | | | | | | | | | | | | | | |
Nucor Corp. | | | | | | | | | | | 22,025 | | | | 1,121,293 | |
Reliance Steel & Aluminum Co. | | | | | | | | | | | 5,112 | | | | 509,462 | |
Total Metals & Mining | | | | | | | | | | | | | | | 1,630,755 | |
Total Materials | | | | | | | | | | | | | | | 12,733,128 | |
| Real Estate — 0.2% | | | | | | | | | | | | | | | | |
Real Estate Management & Development — 0.2% | | | | | | | | | | | | | | | | |
CBRE Group Inc., Class A Shares | | | | | | | | | | | 25,686 | | | | 1,361,615 | * |
Howard Hughes Corp. | | | | | | | | | | | 892 | | | | 115,603 | * |
Total Real Estate | | | | | | | | | | | | | | | 1,477,218 | |
| Utilities — 2.3% | | | | | | | | | | | | | | | | |
Electric Utilities — 1.1% | | | | | | | | | | | | | | | | |
American Electric Power Co. Inc. | | | | | | | | | | | 32,063 | | | | 3,003,982 | |
Evergy Inc. | | | | | | | | | | | 18,000 | | | | 1,198,080 | |
Eversource Energy | | | | | | | | | | | 20,668 | | | | 1,766,494 | |
OGE Energy Corp. | | | | | | | | | | | 10,871 | | | | 493,326 | |
Pinnacle West Capital Corp. | | | | | | | | | | | 7,280 | | | | 706,670 | |
Total Electric Utilities | | | | | | | | | | | | | | | 7,168,552 | |
Independent Power and Renewable Electricity Producers — 0.3% | | | | | | | | | | | | | | | | |
AES Corp. | | | | | | | | | | | 36,832 | | | | 601,835 | |
Vistra Energy Corp. | | | | | | | | | | | 37,500 | | | | 1,002,375 | |
Total Independent Power and Renewable Electricity Producers | | | | | | | | | | | | | | | 1,604,210 | |
Multi-Utilities — 0.9% | | | | | | | | | | | | | | | | |
DTE Energy Co. | | | | | | | | | | | 11,653 | | | | 1,549,383 | |
Public Service Enterprise Group Inc. | | | | | | | | | | | 35,104 | | | | 2,179,256 | |
WEC Energy Group Inc. | | | | | | | | | | | 21,807 | | | | 2,073,846 | |
Total Multi-Utilities | | | | | | | | | | | | | | | 5,802,485 | |
Total Utilities | | | | | | | | | | | | | | | 14,575,247 | |
Total Common Stocks (Cost — $506,120,620) | | | | | | | | | | | | | | | 625,253,592 | |
| Investments in Underlying Funds — 1.4% | | | | | | | | | | | | | | | | |
iShares Trust, iShares Russell 1000 Value ETF
(Cost — $8,821,628) | | | | | | | | | | | 71,667 | | | | 9,192,009 | |
Total Investments before Short-Term Investments (Cost — $514,942,248) | | | | | | | | | | | | | | | 634,445,601 | |
See Notes to Financial Statements.
| | |
22 | | BrandywineGLOBAL — Diversified US Large Cap Value Fund 2019 Annual Report |
BrandywineGLOBAL — Diversified US Large Cap Value Fund
| | | | | | | | | | | | | | | | |
| Security | | | | | Rate | | | Shares | | | Value | |
| Short-Term Investments — 0.6% | | | | | | | | | | | | | | | | |
JPMorgan U.S. Government Money Market Fund, Institutional Class (Cost — $3,694,995) | | | | | | | 1.943% | | | | 3,694,995 | | | $ | 3,694,995 | |
Total Investments — 100.7% (Cost — $518,637,243) | | | | | | | | | | | | | | | 638,140,596 | |
Liabilities in Excess of Other Assets — (0.7)% | | | | | | | | | | | | | | | (4,415,996 | ) |
Total Net Assets — 100.0% | | | | | | | | | | | | | | $ | 633,724,600 | |
| * | Non-income producing security. |
| | |
Abbreviation used in this schedule: |
|
ETF — Exchange-Traded Fund |
See Notes to Financial Statements.
| | |
| BrandywineGLOBAL — Diversified US Large Cap Value Fund 2019 Annual Report | | 23 |
Statement of assets and liabilities
September 30, 2019
| | | | |
| |
| Assets: | | | | |
Investments, at value (Cost — $518,637,243) | | $ | 638,140,596 | |
Receivable for securities sold | | | 12,216,086 | |
Dividends and interest receivable | | | 601,931 | |
Receivable for Fund shares sold | | | 149,679 | |
Prepaid expenses | | | 56,386 | |
Total Assets | | | 651,164,678 | |
| |
| Liabilities: | | | | |
Payable for securities purchased | | | 14,954,230 | |
Payable for Fund shares repurchased | | | 2,060,292 | |
Investment management fee payable | | | 312,951 | |
Trustees’ fees payable | | | 24,756 | |
Service and/or distribution fees payable | | | 7,542 | |
Accrued expenses | | | 80,307 | |
Total Liabilities | | | 17,440,078 | |
| Total Net Assets | | $ | 633,724,600 | |
| |
| Net Assets: | | | | |
Par value (Note 7) | | $ | 320 | |
Paid-in capital in excess of par value | | | 461,984,335 | |
Total distributable earnings (loss) | | | 171,739,945 | |
| Total Net Assets | | $ | 633,724,600 | |
See Notes to Financial Statements.
| | |
24 | | BrandywineGLOBAL — Diversified US Large Cap Value Fund 2019 Annual Report |
| | | | |
| |
| Net Assets: | | | | |
Class A | | | $2,439,738 | |
Class A2 | | | $33,414,791 | |
Class C | | | $212,863 | |
Class R | | | $107,231 | |
Class I | | | $4,743,346 | |
Class IS | | | $592,806,631 | |
| |
| Shares Outstanding: | | | | |
Class A | | | 123,433 | |
Class A2 | | | 1,711,853 | |
Class C | | | 11,078 | |
Class R | | | 5,444 | |
Class I | | | 239,697 | |
Class IS | | | 29,913,296 | |
| |
| Net Asset Value: | | | | |
Class A (and redemption price) | | | $19.77 | |
Class A2 (and redemption price) | | | $19.52 | |
Class C* | | | $19.21 | |
Class R (and redemption price) | | | $19.70 | |
Class I (and redemption price) | | | $19.79 | |
Class IS (and redemption price) | | | $19.82 | |
| Maximum Public Offering Price Per Share: | | | | |
Class A (based on maximum initial sales charge of 5.75%) | | | $20.98 | |
Class A2 (based on maximum initial sales charge of 5.75%) | | | $20.71 | |
| * | Redemption price per share is NAV of Class C shares reduced by a 1.00% CDSC if shares are redeemed within one year from purchase payment (Note 2). |
See Notes to Financial Statements.
| | |
| BrandywineGLOBAL — Diversified US Large Cap Value Fund 2019 Annual Report | | 25 |
Statement of operations
For the Year Ended September 30, 2019
| | | | |
| |
| Investment Income: | | | | |
Dividends | | $ | 23,846,447 | |
Interest | | | 104,426 | |
Less: Foreign taxes withheld | | | (702) | |
Total Investment Income | | | 23,950,171 | |
| |
| Expenses: | | | | |
Investment management fee (Note 2) | | | 5,602,670 | |
Trustees’ fees | | | 147,407 | |
Service and/or distribution fees (Notes 2 and 5) | | | 101,145 | |
Legal fees | | | 101,019 | |
Registration fees | | | 99,706 | |
Transfer agent fees (Note 5) | | | 89,984 | |
Fund accounting fees | | | 76,004 | |
Audit and tax fees | | | 46,081 | |
Fees recaptured by investment manager (Note 2) | | | 39,639 | |
Shareholder reports | | | 21,811 | |
Insurance | | | 12,476 | |
Custody fees | | | 11,464 | |
Interest expense | | | 5,622 | |
Miscellaneous expenses | | | 8,807 | |
Total Expenses | | | 6,363,835 | |
Less: Fee waivers and/or expense reimbursements (Notes 2 and 5) | | | (135,763) | |
Net Expenses | | | 6,228,072 | |
| Net Investment Income | | | 17,722,099 | |
| |
| Realized and Unrealized Gain (Loss) on Investments (Notes 1 and 3): | | | | |
Net Realized Gain From Investment Transactions | | | 127,854,510 | |
Change in Net Unrealized Appreciation (Depreciation) From Investments | | | (142,886,856) | |
| Net Loss on Investments | | | (15,032,346) | |
| Increase in Net Assets From Operations | | $ | 2,689,753 | |
See Notes to Financial Statements.
| | |
26 | | BrandywineGLOBAL — Diversified US Large Cap Value Fund 2019 Annual Report |
Statements of changes in net assets
| | | | | | | | |
| For the Years Ended September 30, | | 2019 | | | 2018 | |
| | |
| Operations: | | | | | | | | |
Net investment income | | $ | 17,722,099 | | | $ | 14,675,125 | |
Net realized gain | | | 127,854,510 | | | | 65,496,071 | |
Change in net unrealized appreciation (depreciation) | | | (142,886,856) | | | | 30,829,629 | |
Increase in Net Assets From Operations | | | 2,689,753 | | | | 111,000,825 | |
| | |
| Distributions to Shareholders From (Notes 1 and 6): | | | | | | | | |
Total distributable earnings(a) | | | (85,746,084) | | | | (67,447,449) | |
Decrease in Net Assets From Distributions to Shareholders | | | (85,746,084) | | | | (67,447,449) | |
| | |
| Fund Share Transactions (Note 7): | | | | | | | | |
Net proceeds from sale of shares | | | 133,462,145 | | | | 233,756,435 | |
Reinvestment of distributions | | | 85,509,818 | | | | 67,137,051 | |
Cost of shares repurchased | | | (181,623,377) | | | | (193,524,294) | |
Cost of shares redeemedin-kind (Note 8) | | | (309,838,104) | | | | — | |
Increase (Decrease) in Net Assets From Fund Share Transactions | | | (272,489,518) | | | | 107,369,192 | |
Increase (Decrease) in Net Assets | | | (355,545,849) | | | | 150,922,568 | |
| | |
| Net Assets: | | | | | | | | |
Beginning of year | | | 989,270,449 | | | | 838,347,881 | |
End of year(b) | | $ | 633,724,600 | | | $ | 989,270,449 | |
| (a) | Distributions from net investment income and from realized gains are no longer required to be separately disclosed (Note 10). For the year ended September 30, 2018, distributions from net investment income and net realized gains were $15,147,314 and $52,300,135, respectively. |
| (b) | Parenthetical disclosure of undistributed net investment income is no longer required (Note 10). For the year ended September 30, 2018, end of year net assets included undistributed net investment income of $11,293,100. |
See Notes to Financial Statements.
| | |
| BrandywineGLOBAL — Diversified US Large Cap Value Fund 2019 Annual Report | | 27 |
Financial highlights
| | | | | | | | | | | | | | | | | | | | |
| For a share of each class of beneficial interest outstanding throughout each year ended September 30: | |
| Class A Shares1 | | 2019 | | | 2018 | | | 2017 | | | 2016 | | | 2015 | |
| | | | | |
| Net asset value, beginning of year | | | $21.85 | | | | $21.07 | | | | $18.64 | | | | $17.88 | | | | $20.30 | |
| | | | | |
| Income (loss) from operations: | | | | | | | | | | | | | | | | | | | | |
Net investment income | | | 0.32 | | | | 0.26 | | | | 0.27 | | | | 0.27 | | | | 0.24 | |
Net realized and unrealized gain (loss) | | | (0.52) | | | | 2.19 | | | | 3.40 | | | | 1.62 | | | | (0.92) | |
Total income (loss) from operations | | | (0.20) | | | | 2.45 | | | | 3.67 | | | | 1.89 | | | | (0.68) | |
| | | | | |
| Less distributions from: | | | | | | | | | | | | | | | | | | | | |
Net investment income | | | (0.29) | | | | (0.32) | | | | (0.26) | | | | (0.23) | | | | (0.21) | |
Net realized gains | | | (1.59) | | | | (1.35) | | | | (0.98) | | | | (0.90) | | | | (1.53) | |
Total distributions | | | (1.88) | | | | (1.67) | | | | (1.24) | | | | (1.13) | | | | (1.74) | |
| | | | | |
| Net asset value, end of year | | | $19.77 | | | | $21.85 | | | | $21.07 | | | | $18.64 | | | | $17.88 | |
Total return2 | | | (0.36) | % | | | 12.12 | % | | | 20.54 | % | | | 10.85 | % | | | (3.89) | % |
| | | | | |
| Net assets, end of year (000s) | | | $2,440 | | | | $1,972 | | | | $1,096 | | | | $1,194 | | | | $1,290 | |
| | | | | |
| Ratios to average net assets: | | | | | | | | | | | | | | | | | | | | |
Gross expenses3 | | | 1.13 | % | | | 1.13 | % | | | 1.18 | % | | | 1.19 | % | | | 1.22 | % |
Net expenses3,4,5,6 | | | 1.10 | | | | 1.10 | | | | 1.08 | | | | 1.09 | | | | 1.10 | |
Net investment income | | | 1.68 | | | | 1.23 | | | | 1.39 | | | | 1.51 | | | | 1.21 | |
| | | | | |
| Portfolio turnover rate | | | 51 | %7 | | | 46 | % | | | 38 | % | | | 58 | % | | | 67 | %7 |
| 1 | Per share amounts have been calculated using the average shares method. |
| 2 | Performance figures, exclusive of sales charges, may reflect compensating balance arrangements, fee waivers and/or expense reimbursements. In the absence of compensating balance arrangements, fee waivers and/or expense reimbursements, the total return would have been lower. Past performance is no guarantee of future results. |
| 3 | Reflects recapture of fees waived and/or expenses reimbursed from prior fiscal years. |
| 4 | Reflects fee waivers and/or expense reimbursements. |
| 5 | As a result of an expense limitation arrangement, effective August 3, 2015, the ratio of total annual fund operating expenses, other than interest, brokerage commissions, dividend expense on short sales, taxes, extraordinary expenses and acquired fund fees and expenses, to average net assets of Class A shares did not exceed 1.15%. This expense limitation arrangement cannot be terminated prior to December 31, 2020 without the Board of Trustees’ consent. Prior to August 3, 2015, the expense limitation was 1.30%. |
| 6 | As a result of a voluntary expense limitation arrangement, the ratio of total annual fund operating expenses, other than interest, brokerage commissions, dividend expense on short sales, taxes, extraordinary expenses and acquired fund fees and expenses, to average net assets of Class A shares did not exceed 1.10%. This expense limitation arrangement is expected to continue until December 31, 2020, but may be terminated at any time by the manager. |
| 7 | Excludes securities delivered as a result of a redemptionin-kind. |
See Notes to Financial Statements.
| | |
28 | | BrandywineGLOBAL — Diversified US Large Cap Value Fund 2019 Annual Report |
| | | | | | | | | | | | | | | | | | | | |
| For a share of each class of beneficial interest outstanding throughout each year ended September 30: | |
| Class A2 Shares1 | | 2019 | | | 2018 | | | 2017 | | | 2016 | | | 2015 | |
| | | | | |
| Net asset value, beginning of year | | | $21.60 | | | | $20.87 | | | | $18.49 | | | | $17.79 | | | | $20.23 | |
| | | | | |
| Income (loss) from operations: | | | | | | | | | | | | | | | | | | | | |
Net investment income | | | 0.31 | | | | 0.22 | | | | 0.24 | | | | 0.25 | | | | 0.21 | |
Net realized and unrealized gain (loss) | | | (0.52) | | | | 2.17 | | | | 3.38 | | | | 1.60 | | | | (0.93) | |
Total income (loss) from operations | | | (0.21) | | | | 2.39 | | | | 3.62 | | | | 1.85 | | | | (0.72) | |
| | | | | |
| Less distributions from: | | | | | | | | | | | | | | | | | | | | |
Net investment income | | | (0.28) | | | | (0.31) | | | | (0.26) | | | | (0.25) | | | | (0.19) | |
Net realized gains | | | (1.59) | | | | (1.35) | | | | (0.98) | | | | (0.90) | | | | (1.53) | |
Total distributions | | | (1.87) | | | | (1.66) | | | | (1.24) | | | | (1.15) | | | | (1.72) | |
| | | | | |
| Net asset value, end of year | | | $19.52 | | | | $21.60 | | | | $20.87 | | | | $18.49 | | | | $17.79 | |
Total return2 | | | (0.44) | % | | | 11.93 | % | | | 20.38 | % | | | 10.67 | % | | | (4.09) | % |
| | | | | |
| Net assets, end of year (000s) | | | $33,415 | | | | $29,364 | | | | $21,506 | | | | $14,852 | | | | $9,726 | |
| | | | | |
| Ratios to average net assets: | | | | | | | | | | | | | | | | | | | | |
Gross expenses3 | | | 1.19 | % | | | 1.30 | % | | | 1.32 | % | | | 1.33 | % | | | 1.32 | % |
Net expenses3,4,5,6 | | | 1.17 | | | | 1.28 | | | | 1.21 | | | | 1.22 | | | | 1.30 | |
Net investment income | | | 1.62 | | | | 1.03 | | | | 1.24 | | | | 1.39 | | | | 1.09 | |
| | | | | |
| Portfolio turnover rate | | | 51 | %7 | | | 46 | % | | | 38 | % | | | 58 | % | | | 67 | %7 |
| 1 | Per share amounts have been calculated using the average shares method. |
| 2 | Performance figures, exclusive of sales charges, may reflect compensating balance arrangements, fee waivers and/or expense reimbursements. In the absence of compensating balance arrangements, fee waivers and/or expense reimbursements, the total return would have been lower. Past performance is no guarantee of future results. |
| 3 | Reflects recapture of fees waived and/or expenses reimbursed from prior fiscal years. |
| 4 | Reflects fee waivers and/or expense reimbursements. |
| 5 | As a result of an expense limitation arrangement, effective August 3, 2015, the ratio of total annual fund operating expenses, other than interest, brokerage commissions, dividend expense on short sales, taxes, extraordinary expenses and acquired fund fees and expenses, to average net assets of Class A2 shares did not exceed 1.35%. This expense limitation arrangement cannot be terminated prior to December 31, 2020 without the Board of Trustees’ consent. Prior to August 3, 2015, the expense limitation was 1.50%. |
| 6 | As a result of a voluntary expense limitation arrangement, the ratio of total annual fund operating expenses, other than interest, brokerage commissions, dividend expense on short sales, taxes, extraordinary expenses and acquired fund fees and expenses, to average net assets of Class A2 shares did not exceed 1.30%. This expense limitation arrangement is expected to continue until December 31, 2020, but may be terminated at any time by the manager. |
| 7 | Excludes securities delivered as a result of a redemptionin-kind. |
See Notes to Financial Statements.
| | |
| BrandywineGLOBAL — Diversified US Large Cap Value Fund 2019 Annual Report | | 29 |
Financial highlights (cont’d)
| | | | | | | | | | | | | | | | | | | | |
| For a share of each class of beneficial interest outstanding throughout each year ended September 30: | |
| Class C Shares1 | | 2019 | | | 2018 | | | 2017 | | | 2016 | | | 2015 | |
| | | | | |
| Net asset value, beginning of year | | | $21.50 | | | | $20.79 | | | | $18.36 | | | | $17.75 | | | | $20.23 | |
| | | | | |
| Income (loss) from operations: | | | | | | | | | | | | | | | | | | | | |
Net investment income | | | 0.18 | | | | 0.09 | | | | 0.13 | | | | 0.14 | | | | 0.09 | |
Net realized and unrealized gain (loss) | | | (0.56) | | | | 2.17 | | | | 3.36 | | | | 1.59 | | | | (0.92) | |
Total income (loss) from operations | | | (0.38) | | | | 2.26 | | | | 3.49 | | | | 1.73 | | | | (0.83) | |
| | | | | |
| Less distributions from: | | | | | | | | | | | | | | | | | | | | |
Net investment income | | | (0.32) | | | | (0.20) | | | | (0.08) | | | | (0.22) | | | | (0.12) | |
Net realized gains | | | (1.59) | | | | (1.35) | | | | (0.98) | | | | (0.90) | | | | (1.53) | |
Total distributions | | | (1.91) | | | | (1.55) | | | | (1.06) | | | | (1.12) | | | | (1.65) | |
| | | | | |
| Net asset value, end of year | | | $19.21 | | | | $21.50 | | | | $20.79 | | | | $18.36 | | | | $17.75 | |
Total return2 | | | (1.29) | % | | | 11.28 | % | | | 19.70 | % | | | 10.04 | % | | | (4.72) | % |
| | | | | |
| Net assets, end of year (000s) | | | $213 | | | | $288 | | | | $586 | | | | $347 | | | | $179 | |
| | | | | |
| Ratios to average net assets: | | | | | | | | | | | | | | | | | | | | |
Gross expenses3 | | | 1.89 | % | | | 2.04 | % | | | 1.98 | % | | | 1.94 | % | | | 1.99 | % |
Net expenses3,4,5,6 | | | 1.85 | | | | 1.85 | | | | 1.81 | | | | 1.84 | | | | 1.85 | |
Net investment income | | | 0.96 | | | | 0.42 | | | | 0.64 | | | | 0.81 | | | | 0.47 | |
| | | | | |
| Portfolio turnover rate | | | 51 | %7 | | | 46 | % | | | 38 | % | | | 58 | % | | | 67 | %7 |
| 1 | Per share amounts have been calculated using the average shares method. |
| 2 | Performance figures, exclusive of CDSC, may reflect compensating balance arrangements, fee waivers and/or expense reimbursements. In the absence of compensating balance arrangements, fee waivers and/or expense reimbursements, the total return would have been lower. Past performance is no guarantee of future results. |
| 3 | Reflects recapture of fees waived and/or expenses reimbursed from prior fiscal years. |
| 4 | Reflects fee waivers and/or expense reimbursements. |
| 5 | As a result of an expense limitation arrangement, effective August 3, 2015, the ratio of total annual fund operating expenses, other than interest, brokerage commissions, dividend expense on short sales, taxes, extraordinary expenses and acquired fund fees and expenses, to average net assets of Class C shares did not exceed 1.90%. This expense limitation arrangement cannot be terminated prior to December 31, 2020 without the Board of Trustees’ consent. Prior to August 3, 2015, the expense limitation was 2.05%. |
| 6 | As a result of a voluntary expense limitation arrangement, the ratio of total annual fund operating expenses, other than interest, brokerage commissions, dividend expense on short sales, taxes, extraordinary expenses and acquired fund fees and expenses, to average net assets of Class C shares did not exceed 1.85%. This expense limitation arrangement is expected to continue until December 31, 2020, but may be terminated at any time by the manager. |
| 7 | Excludes securities delivered as a result of a redemptionin-kind. |
See Notes to Financial Statements.
| | |
30 | | BrandywineGLOBAL — Diversified US Large Cap Value Fund 2019 Annual Report |
| | | | | | | | | | | | | | | | | | | | |
| For a share of each class of beneficial interest outstanding throughout each year ended September 30: | |
| Class R Shares1 | | 2019 | | | 2018 | | | 2017 | | | 2016 | | | 2015 | |
| | | | | |
| Net asset value, beginning of year | | | $21.80 | | | | $21.01 | | | | $18.60 | | | | $17.86 | | | | $20.27 | |
| | | | | |
| Income (loss) from operations: | | | | | | | | | | | | | | | | | | | | |
Net investment income | | | 0.28 | | | | 0.20 | | | | 0.22 | | | | 0.22 | | | | 0.20 | |
Net realized and unrealized gain (loss) | | | (0.53) | | | | 2.20 | | | | 3.39 | | | | 1.63 | | | | (0.93) | |
Total income (loss) from operations | | | (0.25) | | | | 2.40 | | | | 3.61 | | | | 1.85 | | | | (0.73) | |
| | | | | |
| Less distributions from: | | | | | | | | | | | | | | | | | | | | |
Net investment income | | | (0.26) | | | | (0.26) | | | | (0.22) | | | | (0.21) | | | | (0.15) | |
Net realized gains | | | (1.59) | | | | (1.35) | | | | (0.98) | | | | (0.90) | | | | (1.53) | |
Total distributions | | | (1.85) | | | | (1.61) | | | | (1.20) | | | | (1.11) | | | | (1.68) | |
| | | | | |
| Net asset value, end of year | | | $19.70 | | | | $21.80 | | | | $21.01 | | | | $18.60 | | | | $17.86 | |
Total return2 | | | (0.62) | % | | | 11.89 | % | | | 20.18 | % | | | 10.61 | % | | | (4.16) | % |
| | | | | |
| Net assets, end of year (000s) | | | $107 | | | | $68 | | | | $14 | | | | $12 | | | | $11 | |
| | | | | |
| Ratios to average net assets: | | | | | | | | | | | | | | | | | | | | |
Gross expenses | | | 1.58 | %3 | | | 1.39 | %3 | | | 1.45 | % | | | 1.51 | % | | | 1.45 | %3 |
Net expenses4,5,6 | | | 1.35 | 3 | | | 1.35 | 3 | | | 1.35 | | | | 1.34 | | | | 1.35 | 3 |
Net investment income | | | 1.44 | | | | 0.93 | | | | 1.10 | | | | 1.25 | | | | 1.01 | |
| | | | | |
| Portfolio turnover rate | | | 51 | %7 | | | 46 | % | | | 38 | % | | | 58 | % | | | 67 | %7 |
| 1 | Per share amounts have been calculated using the average shares method. |
| 2 | Performance figures may reflect compensating balance arrangements, fee waivers and/or expense reimbursements. In the absence of compensating balance arrangements, fee waivers and/or expense reimbursements, the total return would have been lower. Past performance is no guarantee of future results. |
| 3 | Reflects recapture of fees waived and/or expenses reimbursed from prior fiscal years. |
| 4 | Reflects fee waivers and/or expense reimbursements. |
| 5 | As a result of an expense limitation arrangement, effective August 3, 2015, the ratio of total annual fund operating expenses, other than interest, brokerage commissions, dividend expense on short sales, taxes, extraordinary expenses and acquired fund fees and expenses, to average net assets of Class R shares did not exceed 1.40%. This expense limitation arrangement cannot be terminated prior to December 31, 2020 without the Board of Trustees’ consent. Prior to August 3, 2015, the expense limitation was 1.55%. |
| 6 | As a result of a voluntary expense limitation arrangement, the ratio of total annual fund operating expenses, other than interest, brokerage commissions, dividend expense on short sales, taxes, extraordinary expenses and acquired fund fees and expenses, to average net assets of Class R shares did not exceed 1.35%. This expense limitation arrangement is expected to continue until December 31, 2020, but may be terminated at any time by the manager. |
| 7 | Excludes securities delivered as a result of a redemptionin-kind. |
See Notes to Financial Statements.
| | |
| BrandywineGLOBAL — Diversified US Large Cap Value Fund 2019 Annual Report | | 31 |
Financial highlights (cont’d)
| | | | | | | | | | | | | | | | | | | | |
| For a share of each class of beneficial interest outstanding throughout each year ended September 30: | |
| Class I Shares1 | | 2019 | | | 2018 | | | 2017 | | | 2016 | | | 2015 | |
| | | | | |
| Net asset value, beginning of year | | | $21.88 | | | | $21.10 | | | | $18.67 | | | | $17.92 | | | | $20.34 | |
| | | | | |
| Income (loss) from operations: | | | | | | | | | | | | | | | | | | | | |
Net investment income | | | 0.37 | | | | 0.34 | | | | 0.33 | | | | 0.33 | | | | 0.29 | |
Net realized and unrealized gain (loss) | | | (0.52) | | | | 2.17 | | | | 3.40 | | | | 1.63 | | | | (0.93) | |
Total income (loss) from operations | | | (0.15) | | | | 2.51 | | | | 3.73 | | | | 1.96 | | | | (0.64) | |
| | | | | |
| Less distributions from: | | | | | | | | | | | | | | | | | | | | |
Net investment income | | | (0.35) | | | | (0.38) | | | | (0.32) | | | | (0.31) | | | | (0.25) | |
Net realized gains | | | (1.59) | | | | (1.35) | | | | (0.98) | | | | (0.90) | | | | (1.53) | |
Total distributions | | | (1.94) | | | | (1.73) | | | | (1.30) | | | | (1.21) | | | | (1.78) | |
| | | | | |
| Net asset value, end of year | | | $19.79 | | | | $21.88 | | | | $21.10 | | | | $18.67 | | | | $17.92 | |
Total return2 | | | (0.10) | % | | | 12.48 | % | | | 20.83 | % | | | 11.24 | % | | | (3.70) | % |
| | | | | |
| Net assets, end of year (000s) | | | $4,743 | | | | $19,444 | | | | $13,028 | | | | $9,625 | | | | $10,914 | |
| | | | | |
| Ratios to average net assets: | | | | | | | | | | | | | | | | | | | | |
Gross expenses | |
| 0.83
| %3
| | | 0.85 | %3 | | | 0.90 | % | | | 0.88 | %3 | | | 0.89 | %3 |
Net expenses4,5 | | | 0.80 | 3 | | | 0.80 | 3 | | | 0.79 | | | | 0.78 | 3 | | | 0.84 | 3,6 |
Net investment income | | | 1.92 | | | | 1.59 | | | | 1.67 | | | | 1.82 | | | | 1.49 | |
| | | | | |
| Portfolio turnover rate | | | 51 | %7 | | | 46 | % | | | 38 | % | | | 58 | % | | | 67 | %7 |
| 1 | Per share amounts have been calculated using the average shares method. |
| 2 | Performance figures may reflect compensating balance arrangements, fee waivers and/or expense reimbursements. In the absence of compensating balance arrangements, fee waivers and/or expense reimbursements, the total return would have been lower. Past performance is no guarantee of future results. |
| 3 | Reflects recapture of fees waived and/or expenses reimbursed from prior fiscal years. |
| 4 | Reflects fee waivers and/or expense reimbursements. |
| 5 | As a result of an expense limitation arrangement, effective August 3, 2015, the ratio of total annual fund operating expenses, other than interest, brokerage commissions, dividend expense on short sales, taxes, extraordinary expenses and acquired fund fees and expenses, to average net assets of Class I shares did not exceed 0.80%. This expense limitation arrangement cannot be terminated prior to December 31, 2020 without the Board of Trustees’ consent. Prior to August 3, 2015, the expense limitation was 0.95%. |
| 6 | As a result of a voluntary expense limitation arrangement, effective July 1, 2012 through August 2, 2015, the ratio of total annual fund operating expenses, other than interest, brokerage commissions, dividend expense on short sales, taxes, extraordinary expenses and acquired fund fees and expenses, to average net assets of Class I shares did not exceed 0.85%. |
| 7 | Excludes securities delivered as a result of a redemptionin-kind. |
See Notes to Financial Statements.
| | |
32 | | BrandywineGLOBAL — Diversified US Large Cap Value Fund 2019 Annual Report |
| | | | | | | | | | | | | | | | | | | | |
| For a share of each class of beneficial interest outstanding throughout each year ended September 30: | |
| Class IS Shares1 | | 2019 | | | 2018 | | | 2017 | | | 2016 | | | 2015 | |
| | | | | |
| Net asset value, beginning of year | | | $21.91 | | | | $21.11 | | | | $18.68 | | | | $17.94 | | | | $20.34 | |
| | | | | |
| Income (loss) from operations: | | | | | | | | | | | | | | | | | | | | |
Net investment income | | | 0.40 | | | | 0.34 | | | | 0.35 | | | | 0.34 | | | | 0.31 | |
Net realized and unrealized gain (loss) | | | (0.53) | | | | 2.20 | | | | 3.40 | | | | 1.62 | | | | (0.93) | |
Total income (loss) from operations | | | (0.13) | | | | 2.54 | | | | 3.75 | | | | 1.96 | | | | (0.62) | |
| | | | | |
| Less distributions from: | | | | | | | | | | | | | | | | | | | | |
Net investment income | | | (0.37) | | | | (0.39) | | | | (0.34) | | | | (0.32) | | | | (0.25) | |
Net realized gains | | | (1.59) | | | | (1.35) | | | | (0.98) | | | | (0.90) | | | | (1.53) | |
Total distributions | | | (1.96) | | | | (1.74) | | | | (1.32) | | | | (1.22) | | | | (1.78) | |
| | | | | |
| Net asset value, end of year | | | $19.82 | | | | $21.91 | | | | $21.11 | | | | $18.68 | | | | $17.94 | |
Total return2 | | | 0.01 | % | | | 12.60 | % | | | 20.97 | % | | | 11.28 | % | | | (3.58) | % |
| | | | | |
| Net assets, end of year (millions) | | | $593 | | | | $938 | | | | $802 | | | | $829 | | | | $730 | |
| | | | | |
| Ratios to average net assets: | | | | | | | | | | | | | | | | | | | | |
Gross expenses | | | 0.72 | %3 | | | 0.72 | %3 | | | 0.80 | % | | | 0.80 | % | | | 0.80 | % |
Net expenses4,5 | | | 0.70 | 3 | | | 0.70 | 3 | | | 0.70 | | | | 0.70 | | | | 0.78 | |
Net investment income | | | 2.08 | | | | 1.61 | | | | 1.76 | | | | 1.90 | | | | 1.57 | |
| | | | | |
| Portfolio turnover rate | | | 51 | %6 | | | 46 | % | | | 38 | % | | | 58 | % | | | 67 | %6 |
| 1 | Per share amounts have been calculated using the average shares method. |
| 2 | Performance figures may reflect compensating balance arrangements, fee waivers and/or expense reimbursements. In the absence of compensating balance arrangements, fee waivers and/or expense reimbursements, the total return would have been lower. Past performance is no guarantee of future results. |
| 3 | Reflects recapture of fees waived and/or expenses reimbursed from prior fiscal years. |
| 4 | Reflects fee waivers and/or expense reimbursements. |
| 5 | As a result of an expense limitation arrangement, effective August 3, 2015, the ratio of total annual fund operating expenses, other than interest, brokerage commissions, taxes, extraordinary expenses and acquired fund fees and expenses, to average net assets of Class IS shares did not exceed 0.70%. In addition, the ratio of total annual fund operating expenses for Class IS shares did not exceed the ratio of total annual fund operating expenses for Class I shares. These expense limitation arrangements cannot be terminated prior to December 31, 2020 without the Board of Trustees’ consent. Prior to August 3, 2015, the expense limitation was 0.85%. In addition, the ratio of total annual fund operating expenses for Class IS shares did not exceed the ratio of total annual fund operating expenses for Class I shares. |
| 6 | Excludes securities delivered as a result of a redemptionin-kind. |
See Notes to Financial Statements.
| | |
| BrandywineGLOBAL — Diversified US Large Cap Value Fund 2019 Annual Report | | 33 |
Notes to financial statements
1. Organization and significant accounting policies
BrandywineGLOBAL — Diversified US Large Cap Value Fund (the “Fund”) is a separate diversified investment series of Legg Mason Global Asset Management Trust (the “Trust”). The Trust, a Maryland statutory trust, is registered under the Investment Company Act of 1940, as amended (the “1940 Act”), as anopen-end management investment company.
The following are significant accounting policies consistently followed by the Fund and are in conformity with U.S. generally accepted accounting principles (“GAAP”). Estimates and assumptions are required to be made regarding assets, liabilities and changes in net assets resulting from operations when financial statements are prepared. Changes in the economic environment, financial markets and any other parameters used in determining these estimates could cause actual results to differ. Subsequent events have been evaluated through the date the financial statements were issued.
(a) Investment valuation.Equity securities for which market quotations are available arevalued at the last reported sales price or official closing price on the primary market or exchange on which they trade. The valuations for fixed income securities (which may include, but are not limited to, corporate, government, municipal, mortgage-backed, collateralized mortgage obligations and asset-backed securities) and certain derivative instruments are typically the prices supplied by independent third party pricing services, which may use market prices or broker/dealer quotations or a variety of valuation techniques and methodologies. The independent third party pricing services use inputs that are observable such as issuer details, interest rates, yield curves, prepayment speeds, credit risks/spreads, default rates and quoted prices for similar securities. Investments inopen-end funds are valued at the closing net asset value per share of each fund on the day of valuation. When the Fund holds securities or other assets that are denominated in a foreign currency, the Fund will normally use the currency exchange rates as of 4:00 p.m. (Eastern Time). If independent third party pricing services are unable to supply prices for a portfolio investment, or if the prices supplied are deemed by the manager to be unreliable, the market price may be determined by the manager using quotations from one or more broker/dealers or at the transaction price if the security has recently been purchased and no value has yet been obtained from a pricing service or pricing broker. When reliable prices are not readily available, such as when the value of a security has been significantly affected by events after the close of the exchange or market on which the security is principally traded, but before the Fund calculates its net asset value, the Fund values these securities as determined in accordance with procedures approved by the Fund’s Board of Trustees.
The Board of Trustees is responsible for the valuation process and has delegated the supervision of the daily valuation process to the Legg Mason North Atlantic Fund Valuation Committee (the “Valuation Committee”). The Valuation Committee, pursuant to the policies adopted by the Board of Trustees, is responsible for making fair value determinations, evaluating the effectiveness of the Fund’s pricing policies, and reporting to the Board of Trustees. When determining the reliability of third party pricing information for investments owned by the Fund, the Valuation Committee, among other things, conducts due diligence reviews of pricing vendors, monitors the daily change in prices and reviews transactions among market participants.
| | |
34 | | BrandywineGLOBAL — Diversified US Large Cap Value Fund 2019 Annual Report |
The Valuation Committee will consider pricing methodologies it deems relevant and appropriate when making fair value determinations. Examples of possible methodologies include, but are not limited to, multiple of earnings; discount from market of a similar freely traded security; discounted cash-flow analysis; book value or a multiple thereof; risk premium/yield analysis; yield to maturity; and/or fundamental investment analysis. The Valuation Committee will also consider factors it deems relevant and appropriate in light of the facts and circumstances. Examples of possible factors include, but are not limited to, the type of security; the issuer’s financial statements; the purchase price of the security; the discount from market value of unrestricted securities of the same class at the time of purchase; analysts’ research and observations from financial institutions; information regarding any transactions or offers with respect to the security; the existence of merger proposals or tender offers affecting the security; the price and extent of public trading in similar securities of the issuer or comparable companies; and the existence of a shelf registration for restricted securities.
For each portfolio security that has been fair valued pursuant to the policies adopted by the Board of Trustees, the fair value price is compared against the last available and next available market quotations. The Valuation Committee reviews the results of such back testing monthly and fair valuation occurrences are reported to the Board of Trustees quarterly.
The Fund uses valuation techniques to measure fair value that are consistent with the market approach and/or income approach, depending on the type of security and the particular circumstance. The market approach uses prices and other relevant information generated by market transactions involving identical or comparable securities. The income approach uses valuation techniques to discount estimated future cash flows to present value.
GAAP establishes a disclosure hierarchy that categorizes the inputs to valuation techniques used to value assets and liabilities at measurement date. These inputs are summarized in the three broad levels listed below:
| • | | Level 1 — quoted prices in active markets for identical investments |
| • | | Level 2 — other significant observable inputs (including quoted prices for similar investments, interest rates, prepayment speeds, credit risk, etc.) |
| • | | Level 3 — significant unobservable inputs (including the Fund’s own assumptions in determining the fair value of investments) |
The inputs or methodologies used to value securities are not necessarily an indication of the risk associated with investing in those securities.
| | |
| BrandywineGLOBAL — Diversified US Large Cap Value Fund 2019 Annual Report | | 35 |
Notes to financial statements (cont’d)
The following is a summary of the inputs used in valuing the Fund’s assets carried at fair value:
| | | | | | | | | | | | | | | | |
| ASSETS | |
| Description | | Quoted Prices
(Level 1) | | | Other Significant
Observable Inputs
(Level 2) | | | Significant
Unobservable
Inputs
(Level 3) | | | Total | |
| Long-Term Investments†: | | | | | | | | | | | | | | | | |
Common Stocks | | $ | 625,253,592 | | | | — | | | | — | | | $ | 625,253,592 | |
Investments in Underlying Funds | | | 9,192,009 | | | | — | | | | — | | | | 9,192,009 | |
| Total Long-Term Investments | | | 634,445,601 | | | | — | | | | — | | | | 634,445,601 | |
| Short-Term Investments† | | | 3,694,995 | | | | — | | | | — | | | | 3,694,995 | |
| Total Investments | | $ | 638,140,596 | | | | — | | | | — | | | $ | 638,140,596 | |
| † | See Schedule of Investments for additional detailed categorizations. |
(b) Foreign investment risks. The Fund’s investments in foreign securities may involverisks not present in domestic investments. Since securities may be denominated in foreign currencies, may require settlement in foreign currencies or pay interest or dividends in foreign currencies, changes in the relationship of these foreign currencies to the U.S. dollar can significantly affect the value of the investments and earnings of the Fund. Foreign investments may also subject the Fund to foreign government exchange restrictions, expropriation, taxation or other political, social or economic developments, all of which affect the market and/or credit risk of the investments.
(c) Security transactions and investment income. Security transactions are accountedfor on a trade date basis. Interest income (including interest income frompayment-in-kind securities), adjusted for amortization of premium and accretion of discount, is recorded on the accrual basis. Dividend income is recorded on theex-dividend date for dividends received in cash and/or securities. Foreign dividend income is recorded on theex-dividend date or as soon as practicable after the Fund determines the existence of a dividend declaration after exercising reasonable due diligence. The cost of investments sold is determined by use of the specific identification method. To the extent any issuer defaults or a credit event occurs that impacts the issuer, the Fund may halt any additional interest income accruals and consider the realizability of interest accrued up to the date of default or credit event.
(d) Distributions to shareholders. Distributions from net investment income and distributions of net realized gains, if any, are declared at least annually. Distributions to shareholders of the Fund are recorded on theex-dividend date and are determined in accordance with income tax regulations, which may differ from GAAP.
(e) Share class accounting. Investment income, common expenses and realized/unrealized gains (losses) on investments are allocated to the various classes of the Fund on the basis of daily net assets of each class. Fees relating to a specific class are charged directly to that share class.
| | |
36 | | BrandywineGLOBAL — Diversified US Large Cap Value Fund 2019 Annual Report |
(f) Compensating balance arrangements. The Fund has an arrangement with its custodian bank whereby a portion of the custodian’s fees is paid indirectly by credits earned on the Fund’s cash on deposit with the bank.
(g) Federal and other taxes. It is the Fund’s policy to comply with the federal income andexcise tax requirements of the Internal Revenue Code of 1986 (the “Code”), as amended, applicable to regulated investment companies. Accordingly, the Fund intends to distribute its taxable income and net realized gains, if any, to shareholders in accordance with timing requirements imposed by the Code. Therefore, no federal or state income tax provision is required in the Fund’s financial statements.
Management has analyzed the Fund’s tax positions taken on income tax returns for all open tax years and has concluded that as of September 30, 2019, no provision for income tax is required in the Fund’s financial statements. The Fund’s federal and state income and federal excise tax returns for tax years for which the applicable statutes of limitations have not expired are subject to examination by the Internal Revenue Service and state departments of revenue.
Under the applicable foreign tax laws, a withholding tax may be imposed on interest, dividends and capital gains at various rates.
(h) Reclassification. GAAP requires that certain components of net assets be reclassifiedto reflect permanent differences between financial and tax reporting. These reclassifications have no effect on net assets or net asset value per share. During the current year, the following reclassifications have been made:
| | | | | | | | |
| | | Total Distributable
Earnings (Loss) | | | Paid-in
Capital | |
| (a) | | $ | (78,180,975) | | | $ | 78,180,975 | |
| (a) | Reclassifications are due to book/tax differences in the treatment ofin-kind distributions of securities. |
2. Investment management agreement and other transactions with affiliates
Legg Mason Partners Fund Advisor, LLC (“LMPFA”) is the Fund’s investment manager and Brandywine Global Investment Management, LLC (“Brandywine Global”) is the Fund’s subadviser. LMPFA and Brandywine Global are wholly-owned subsidiaries of Legg Mason, Inc. (“Legg Mason”).
| | |
| BrandywineGLOBAL — Diversified US Large Cap Value Fund 2019 Annual Report | | 37 |
Notes to financial statements (cont’d)
Under the investment management agreement, the Fund pays an investment management fee, calculated daily and paid monthly, in accordance with the following breakpoint schedule:
| | | | |
| Average Daily Net Assets | | Annual Rate | |
| First $5 billion | | | 0.650 | % |
| Next $5 billion | | | 0.600 | |
| Over $10 billion | | | 0.550 | |
LMPFA provides administrative and certain oversight services to the Fund. LMPFA delegates to the subadviser theday-to-day portfolio management of the Fund. LMPFA pays Brandywine Global monthly 90% of the net management fee it receives from the Fund.
As a result of expense limitation arrangements between the Fund and LMPFA, the ratio of total annual fund operating expenses, other than interest, brokerage commissions, dividend expense on short sales, taxes, extraordinary expenses and acquired fund fees and expenses, to average net assets of Class A, Class A2, Class C, Class R, Class I and Class IS shares did not exceed 1.15%, 1.35%, 1.90%, 1.40%, 0.80% and 0.70%, respectively. In addition, the ratio of total annual fund operating expenses for Class IS shares did not exceed the ratio of total annual fund operating expenses for Class I shares. These expense limitation arrangements cannot be terminated prior to December 31, 2020 without the Board of Trustees’ consent.
As a result of voluntary expense limitation arrangements, the ratio of total annual fund operating expenses, other than interest, brokerage commissions, dividend expense on short sales, taxes, extraordinary expenses and acquired fund fees and expenses, to average net assets of Class A, Class A2, Class C and Class R shares did not exceed 1.10%, 1.30%, 1.85% and 1.35%, respectively. These arrangements are expected to continue until December 31, 2020, but may be terminated at any time by LMPFA.
During the year ended September 30, 2019, fees waived and/or expenses reimbursed amounted to $135,763.
LMPFA is permitted to recapture amounts waived and/or reimbursed to a class within three years after the fiscal year in which LMPFA earned the fee or incurred the expense if the class’ total annual operating expenses have fallen to a level below the expense limitation (“expense cap”) in effect at the time the fees were earned or the expenses incurred. In no case will LMPFA recapture any amount that would result, on any particular business day of the Fund, in the class’ total annual operating expenses exceeding the expense cap or any other lower limit then in effect.
| | |
38 | | BrandywineGLOBAL — Diversified US Large Cap Value Fund 2019 Annual Report |
Pursuant to these arrangements, at September 30, 2019, the Fund had remaining fee waivers and/or expense reimbursements subject to recapture by LMPFA and respective dates of expiration as follows:
| | | | | | | | | | | | | | | | | | | | | | | | |
| | | Class A | | | Class A2 | | | Class C | | | Class R | | | Class I | | | Class IS | |
| Expires September 30, 2020 | | $ | 1,048 | | | | — | | | | — | | | $ | 6 | | | $ | 11,527 | | | $ | 876,512 | |
| Expires September 30, 2021 | | | 540 | | | $ | 4,197 | | | | — | | | | 17 | | | | 9,854 | | | | 192,320 | |
| Expires September 30, 2022 | | | 606 | | | | 4,987 | | | $ | 768 | | | | 194 | | | | 4,225 | | | | 124,983 | |
| Total fee waivers/expense reimbursements subject to recapture | | $ | 2,194 | | | $ | 9,184 | | | $ | 768 | | | $ | 217 | | | $ | 25,606 | | | $ | 1,193,815 | |
For the year ended September 30, 2019, fee waivers and/or expense reimbursements recaptured by LMPFA, if any, were as follows:
| | | | | | | | | | | | | | | | | | | | | | | | |
| | | Class A | | | Class A2 | | | Class C | | | Class R | | | Class I | | | Class IS | |
| LMPFA recaptured | | $ | 246 | | | $ | 1,258 | | | $ | 1,073 | | | $ | 4 | | | $ | 1,558 | | | $ | 35,500 | |
Legg Mason Investor Services, LLC (“LMIS”), a wholly-owned broker-dealer subsidiary of Legg Mason, serves as the Fund’s sole and exclusive distributor.
There is a maximum initial sales charge of 5.75% for Class A and Class A2 shares. There is a contingent deferred sales charge (“CDSC”) of 1.00% on Class C shares, which applies if redemption occurs within 12 months from purchase payment. In certain cases, Class A and Class A2 shares have a 1.00% CDSC, which applies if redemption occurs within 18 months from purchase payment. This CDSC only applies to those purchases of Class A and Class A2 shares, which, when combined with current holdings of other shares of funds sold by LMIS, equal or exceed $1,000,000 in the aggregate. These purchases do not incur an initial sales charge.
For the year ended September 30, 2019, sales charges retained by and CDSCs paid to LMIS and its affiliates, if any, were as follows:
| | | | | | | | | | | | |
| | | Class A | | | Class A2 | | | Class C | |
| Sales charges | | $ | 241 | | | $ | 45,091 | | | | — | |
| CDSCs | | | — | | | | 234 | | | $ | 9 | |
Under a Deferred Compensation Plan (the “Plan”), Trustees may have elected to defer receipt of all or a specified portion of their compensation. A participating Trustee selected one or more funds managed by affiliates of Legg Mason in which his or her deferred trustee’s fees were deemed to be invested. Deferred amounts remain in the Fund until distributed in accordance with the Plan. In May 2015, the Board of Trustees approved an amendment to the Plan so that effective January 1, 2016, no compensation earned after that date may be deferred under the Plan.
All officers and one Trustee of the Trust are employees of Legg Mason or its affiliates and do not receive compensation from the Trust.
| | |
| BrandywineGLOBAL — Diversified US Large Cap Value Fund 2019 Annual Report | | 39 |
Notes to financial statements (cont’d)
As of September 30, 2019, Legg Mason and its affiliates owned 42% of the Fund.
3. Investments
During the year ended September 30, 2019, the aggregate cost of purchases and proceeds from sales of investments (excluding short-term investments) were as follows:
| | | | |
| Purchases | | $ | 434,896,826 | |
| Sales | | | 459,848,949 | * |
| * | Excludes value of securities delivered as a result of redemptionsin-kind totalling $309,838,104 (Note 8). |
At September 30, 2019, the aggregate cost of investments and the aggregate gross unrealized appreciation and depreciation of investments for federal income tax purposes were as follows:
| | | | | | | | | | | | | | | | |
| | | Cost | | | Gross
Unrealized
Appreciation | | | Gross
Unrealized
Depreciation | | | Net
Unrealized
Appreciation | |
| Securities | | $ | 519,890,509 | | | $ | 135,118,557 | | | $ | (16,868,470) | | | $ | 118,250,087 | |
4. Derivative instruments and hedging activities
During the year ended September 30, 2019, the Fund did not invest in derivative instruments.
5. Class specific expenses, waivers and/or expense reimbursements
The Fund has adopted a Rule12b-1 shareholder services and distribution plan and under that plan the Fund pays service and/or distribution fees with respect to its Class A, Class A2, Class C and Class R shares calculated at the annual rate of 0.25%, 0.25%, 1.00% and 0.50% of the average daily net assets of each class, respectively. Service and/or distribution fees are accrued daily and paid monthly.
For the year ended September 30, 2019, class specific expenses were as follows:
| | | | | | | | |
| | | Service and/or
Distribution Fees | | | Transfer Agent
Fees | |
| Class A | | $ | 5,006 | | | $ | 3,084 | |
| Class A2 | | | 76,455 | | | | 67,560 | |
| Class C | | | 19,268 | | | | 2,442 | |
| Class R | | | 416 | | | | 303 | |
| Class I | | | — | | | | 15,124 | |
| Class IS | | | — | | | | 1,471 | |
| Total | | $ | 101,145 | | | $ | 89,984 | |
| | |
40 | | BrandywineGLOBAL — Diversified US Large Cap Value Fund 2019 Annual Report |
For the year ended September 30, 2019, waivers and/or expense reimbursements by class were as follows:
| | | | |
| | | Waivers/Expense
Reimbursements | |
| Class A | | $ | 606 | |
| Class A2 | | | 4,987 | |
| Class C | | | 768 | |
| Class R | | | 194 | |
| Class I | | | 4,225 | |
| Class IS | | | 124,983 | |
| Total | | $ | 135,763 | |
6. Distributions to shareholders by class
| | | | | | | | |
| | | Year Ended
September 30, 2019 | | | Year Ended
September 30, 2018 | |
| Net Investment Income: | | | | | | | | |
| Class A | | $ | 26,696 | | | $ | 16,417 | |
| Class A2 | | | 393,757 | | | | 324,381 | |
| Class C | | | 58,243 | | | | 5,605 | |
| Class R | | | 870 | | | | 176 | |
| Class I | | | 268,312 | | | | 253,373 | |
| Class IS | | | 15,252,159 | | | | 14,547,362 | |
| Total | | $ | 16,000,037 | | | $ | 15,147,314 | |
| | |
| Net Realized Gains: | | | | | | | | |
| Class A | | $ | 146,295 | | | $ | 69,629 | |
| Class A2 | | | 2,277,571 | | | | 1,421,672 | |
| Class C | | | 294,157 | | | | 38,458 | |
| Class R | | | 5,352 | | | | 914 | |
| Class I | | | 1,228,308 | | | | 903,293 | |
| Class IS | | | 65,794,364 | | | | 49,866,169 | |
| Total | | $ | 69,746,047 | | | $ | 52,300,135 | |
7. Shares of beneficial interest
At September 30, 2019, the Trust had an unlimited number of shares of beneficial interest authorized with a par value of $0.00001 per share. The Fund has the ability to issue multiple classes of shares. Each class of shares represents an identical interest and has the same rights, except that each class bears certain direct expenses, including those specifically related to the distribution of its shares.
| | |
| BrandywineGLOBAL — Diversified US Large Cap Value Fund 2019 Annual Report | | 41 |
Notes to financial statements (cont’d)
Transactions in shares of each class were as follows:
| | | | | | | | | | | | | | | | |
| | | Year Ended
September 30, 2019 | | | Year Ended
September 30, 2018 | |
| | | Shares | | | Amount | | | Shares | | | Amount | |
| Class A | | | | | | | | | | | | | | | | |
| Shares sold | | | 55,207 | | | $ | 1,059,625 | | | | 57,907 | | | $ | 1,222,721 | |
| Shares issued on reinvestment | | | 9,226 | | | | 171,517 | | | | 4,141 | | | | 85,017 | |
| Shares repurchased | | | (31,255) | | | | (597,151) | | | | (23,810) | | | | (504,164) | |
| Net increase | | | 33,178 | | | $ | 633,991 | | | | 38,238 | | | $ | 803,574 | |
| | | | |
| Class A2 | | | | | | | | | | | | | | | | |
| Shares sold | | | 467,571 | | | $ | 9,012,430 | | | | 458,659 | | | $ | 9,589,593 | |
| Shares issued on reinvestment | | | 145,418 | | | | 2,671,328 | | | | 85,886 | | | | 1,746,053 | |
| Shares repurchased | | | (260,374) | | | | (4,965,747) | | | | (215,595) | | | | (4,532,869) | |
| Net increase | | | 352,615 | | | $ | 6,718,011 | | | | 328,950 | | | $ | 6,802,777 | |
| | | | |
| Class C | | | | | | | | | | | | | | | | |
| Shares sold | | | 180,943 | | | $ | 3,642,742 | | | | 2,399 | | | $ | 50,203 | |
| Shares issued on reinvestment | | | 19,352 | | | | 352,400 | | | | 2,168 | | | | 44,063 | |
| Shares repurchased | | | (202,629) | | | | (3,865,584) | | | | (19,354) | | | | (411,782) | |
| Net increase (decrease) | | | (2,334) | | | $ | 129,558 | | | | (14,787) | | | $ | (317,516) | |
| | | | |
| Class R | | | | | | | | | | | | | | | | |
| Shares sold | | | 2,005 | | | $ | 38,174 | | | | 2,384 | | | $ | 49,738 | |
| Shares issued on reinvestment | | | 335 | | | | 6,222 | | | | 53 | | | | 1,090 | |
| Shares repurchased | | | (9) | | | | (182) | | | | (2) | | | | (38) | |
| Net increase | | | 2,331 | | | $ | 44,214 | | | | 2,435 | | | $ | 50,790 | |
| | | | |
| Class I | | | | | | | | | | | | | | | | |
| Shares sold | | | 130,920 | | | $ | 2,498,340 | | | | 1,946,466 | | | $ | 40,745,406 | |
| Shares issued on reinvestment | | | 67,950 | | | | 1,261,828 | | | | 41,291 | | | | 847,297 | |
| Shares repurchased | | | (782,829) | | | | (15,447,739) | | | | (1,716,461) | | | | (36,854,138) | |
| Shares redeemedin-kind | | | (65,163) | | | | (1,356,231) | | | | — | | | | — | |
| Net increase (decrease) | | | (649,122) | | | $ | (13,043,802) | | | | 271,296 | | | $ | 4,738,565 | |
| | | | |
| Class IS | | | | | | | | | | | | | | | | |
| Shares sold | | | 6,251,567 | | | $ | 117,210,834 | | | | 8,787,756 | | | $ | 182,098,774 | |
| Shares issued on reinvestment | | | 4,362,030 | | | | 81,046,523 | | | | 3,139,061 | | | | 64,413,531 | |
| Shares repurchased | | | (7,923,680) | | | | (156,746,974) | | | | (7,098,135) | | | | (151,221,303) | |
| Shares redeemedin-kind | | | (15,593,975) | | | | (308,481,873) | | | | — | | | | — | |
| Net increase (decrease) | | | (12,904,058) | | | $ | (266,971,490) | | | | 4,828,682 | | | $ | 95,291,002 | |
8. Redemptionsin-kind
The Fund may make payment for Fund shares redeemed wholly or in part by distributing portfolio securities to shareholders. For the year ended September 30, 2019, the Fund had redemptionsin-kind with total proceeds in the amount of $309,838,104. The net realized gain on these redemptionsin-kind amounted to $79,606,245, which was not realized for tax purposes.
| | |
42 | | BrandywineGLOBAL — Diversified US Large Cap Value Fund 2019 Annual Report |
9. Income tax information and distributions to shareholders
The tax character of distributions paid during the fiscal years ended September 30, was as follows:
| | | | | | | | |
| | | 2019 | | | 2018 | |
| Distributions paid from: | | | | | | | | |
| Ordinary income | | $ | 16,146,797 | | | $ | 17,102,180 | |
| Net long-term capital gains | | | 69,599,287 | | | | 50,345,269 | |
| Total distributions paid | | $ | 85,746,084 | | | $ | 67,447,449 | |
As of September 30, 2019, the components of accumulated earnings (losses) on a tax basis were as follows:
| | | | |
| Undistributed ordinary income — net | | $ | 12,867,878 | |
| Undistributed long-term capital gains — net | | | 40,637,701 | |
| Total undistributed earnings | | $ | 53,505,579 | |
| Other book/tax temporary differences(a) | | | (15,721) | |
| Unrealized appreciation (depreciation)(b) | | | 118,250,087 | |
| Total accumulated earnings (losses) — net | | $ | 171,739,945 | |
| (a) | Other book/tax temporary differences are attributable to book/tax differences in the timing of the deductibility of various expenses. |
| (b) | The difference between book-basis andtax-basis unrealized appreciation (depreciation) is attributable to the tax deferral of losses on wash sales. |
10. Recent accounting pronouncements
The Fund has adopted the disclosure provisions of the Financial Accounting Standards Board Accounting Standards UpdateNo. 2018-13,Fair Value Measurement (Topic 820) —Disclosure Framework— Changes to the Disclosure Requirements for Fair Value Measurement(“ASU2018-13”) which introduces new fair value disclosure requirements as well aseliminates and modifies certain existing fair value disclosure requirements. ASU2018-13 would be effective for fiscal years beginning after December 15, 2019, and interim periods within those fiscal years; however, management has elected to early adopt ASU2018-13. The impact of the Fund’s adoption was limited to changes in the Fund’s financial statement disclosures regarding fair value, primarily those disclosures related to transfers between levels of the fair value hierarchy.
In August 2018, the Securities and Exchange Commission released its Final Rule on Disclosure Update and Simplification (the “Final Rule”) which is intended to simplify an issuer’s disclosure compliance efforts by removing redundant or outdated disclosure requirements without significantly altering the mix of information provided to investors. Effective with the current reporting period, the Fund adopted the Final Rule with the most notable impacts being that the Fund is no longer required to present the components of distributable earnings on the Statement of Assets and Liabilities or the sources of distributions to shareholders and the amount of undistributed net investment income on the Statements of Changes in Net Assets. The tax components of distributable earnings and distributions to shareholders continue to be disclosed within the Notes to Financial Statements.
| | |
| BrandywineGLOBAL — Diversified US Large Cap Value Fund 2019 Annual Report | | 43 |
Report of independent registered public accounting firm
To the Board of Trustees of Legg Mason Global Asset Management Trust and Shareholders of BrandywineGLOBAL — Diversified US Large Cap Value Fund
Opinion on the financial statements
We have audited the accompanying statement of assets and liabilities, including the schedule of investments, of BrandywineGLOBAL — Diversified US Large Cap Value Fund (one of the funds constituting Legg Mason Global Asset Management Trust, referred to hereafter as the “Fund”) as of September 30, 2019, the related statement of operations for the year ended September 30, 2019, the statement of changes in net assets for each of the two years in the period ended September 30, 2019, including the related notes, and the financial highlights for each of the five years in the period ended September 30, 2019 (collectively referred to as the “financial statements”). In our opinion, the financial statements present fairly, in all material respects, the financial position of the Fund as of September 30, 2019, the results of its operations for the year then ended, the changes in its net assets for each of the two years in the period ended September 30, 2019 and the financial highlights for each of the five years in the period ended September 30, 2019 in conformity with accounting principles generally accepted in the United States of America.
Basis for opinion
These financial statements are the responsibility of the Fund’s management. Our responsibility is to express an opinion on the Fund’s financial statements based on our audits. We are a public accounting firm registered with the Public Company Accounting Oversight Board (United States) (PCAOB) and are required to be independent with respect to the Fund in accordance with the U.S. federal securities laws and the applicable rules and regulations of the Securities and Exchange Commission and the PCAOB.
We conducted our audits of these financial statements in accordance with the standards of the PCAOB. Those standards require that we plan and perform the audit to obtain reasonable assurance about whether the financial statements are free of material misstatement, whether due to error or fraud.
Our audits included performing procedures to assess the risks of material misstatement of the financial statements, whether due to error or fraud, and performing procedures that respond to those risks. Such procedures included examining, on a test basis, evidence regarding the amounts and disclosures in the financial statements. Our audits also included evaluating the accounting principles used and significant estimates made by management, as well as evaluating the overall presentation of the financial statements. Our procedures included confirmation of securities owned as of September 30, 2019 by correspondence with the custodian and brokers; when replies were not received from brokers, we performed other auditing procedures. We believe that our audits provide a reasonable basis for our opinion.
/s/PricewaterhouseCoopers LLP
Baltimore, Maryland
November 14, 2019
We have served as the auditor of one or more investment companies in Legg Mason investment company group since at least 1973. We have not been able to determine the specific year we began serving as auditor.
| | |
44 | | BrandywineGLOBAL — Diversified US Large Cap Value Fund 2019 Annual Report |
Additional information(unaudited)
Information about Trustees and Officers
The business and affairs of BrandywineGLOBAL — Diversified US Large Cap Value Fund (the “Fund”) are conducted by management under the supervision and subject to the direction of its Board of Trustees. The business address of each Trustee is c/o Jane Trust, Legg Mason, 100 International Drive, 11th Floor, Baltimore, Maryland 21202. Information pertaining to the Trustees and officers of the Fund is set forth below.
The Statement of Additional Information includes additional information about Trustees and is available, without charge, upon request by calling the Fund at1-877-721-1926.
| | |
| Independent Trustees† | | |
| |
| Ruby P. Hearn | | |
| |
| Year of birth | | 1940 |
| Position(s) with Trust | | Trustee |
| Term of office1 and length of time served2 | | Since 2004 |
| Principal occupation(s) during the past five years | | Senior Vice President Emerita of The Robert Wood Johnson Foundation(non-profit) (since 2001); Member of the Institute of Medicine (since 1982); formerly, Trustee of the New York Academy of Medicine (2004 to 2012); Director of the Institute for Healthcare Improvement (2002 to 2012); Senior Vice President of The Robert Wood Johnson Foundation (1996 to 2001); Fellow of The Yale Corporation (1992 to 1998) |
| Number of funds in fund complex overseen by Trustee | | 20 |
| Other board memberships held by Trustee during the past five years | | None |
| |
| Arnold L. Lehman | | |
| |
| Year of birth | | 1944 |
| Position(s) with Trust | | Trustee and Chairman |
| Term of office1 and length of time served2 | | Since 1982 and since 2015 |
| Principal occupation(s) during the past five years | | Senior Advisor, Phillips (auction house) (since 2015); formerly, Fellow, Ford Foundation (2015 to 2016); Director of the Brooklyn Museum (1997 to 2015) |
| Number of funds in fund complex overseen by Trustee | | 20 |
| Other board memberships held by Trustee during the past five years | | Trustee of American Federation of Arts (since 2002) |
| |
| Robin J.W. Masters | | |
| |
| Year of birth | | 1955 |
| Position(s) with Trust | | Trustee |
| Term of office1 and length of time served2 | | Since 2002 |
| Principal occupation(s) during the past five years | | Retired; formerly, Chief Investment Officer of ACE Limited (insurance) (1986 to 2000) |
| Number of funds in fund complex overseen by Trustee | | 20 |
| Other board memberships held by Trustee during the past five years | | Director of Cheyne Capital International Limited (investment advisory firm) (since 2005); formerly, Director/Trustee of Legg Mason Institutional Funds plc, Western Asset Fixed Income Funds plc and Western Asset Debt Securities Fund plc. (2007 to 2011) |
| | |
| BrandywineGLOBAL — Diversified US Large Cap Value Fund | | 45 |
Additional information(unaudited) (cont’d)
Information about Trustees and Officers
| | |
| Independent Trustees† (cont’d) | | |
| |
| Jill E. McGovern | | |
| |
| Year of birth | | 1944 |
| Position(s) with Trust | | Trustee |
| Term of office1 and length of time served2 | | Since 1989 |
| Principal occupation(s) during the past five years | | Senior Consultant, American Institute for Contemporary German Studies (AICGS) (since 2007); formerly, Chief Executive Officer of The Marrow Foundation(non-profit) (1993 to 2007); Executive Director of the Baltimore International Festival (1991 to 1993); Senior Assistant to the President of The Johns Hopkins University (1986 to 1990) |
| Number of funds in fund complex overseen by Trustee | | 20 |
| Other board memberships held by Trustee during the past five years | | Director of International Biomedical Research Alliance (2002 to 2010); Director of Lois Roth Endowment (2005 to 2012) |
| |
| Arthur S. Mehlman | | |
| |
| Year of birth | | 1942 |
| Position(s) with Trust | | Trustee |
| Term of office1 and length of time served2 | | Since 2002 |
| Principal occupation(s) during the past five years | | Retired. Director, The University of Maryland Foundation (since 1992); formerly, Director, The League for People with Disabilities (2003 to 2017); Director, Municipal Mortgage & Equity LLC (2004 to 2011); Partner, KPMG LLP (international accounting firm) (1972 to 2002) |
| Number of funds in fund complex overseen by Trustee | | Trustee of all Legg Mason Funds consisting of 20 portfolios; Director/Trustee of the Royce Family of Funds consisting of 22 portfolios |
| Other board memberships held by Trustee during the past five years | | Director of Municipal Mortgage & Equity, LLC. (2004 to 2011) |
| |
| G. Peter O’Brien | | |
| |
| Year of birth | | 1945 |
| Position(s) with Trust | | Trustee |
| Term of office1 and length of time served2 | | Since 1999 |
| Principal occupation(s) during the past five years | | Retired. Trustee Emeritus of Colgate University (since 2005); Board Member, Hill House, Inc. (residential home care) (since 1999); formerly, Board Member, Bridges School(pre-school) (2006 to 2017); Managing Director, Equity Capital Markets Group of Merrill Lynch & Co. (1971 to 1999) |
| Number of funds in fund complex overseen by Trustee | | Trustee of all Legg Mason funds consisting of 20 portfolios; Director/Trustee of the Royce Family of Funds consisting of 22 portfolios |
| Other board memberships held by Trustee during the past five years | | Director of TICC Capital Corp. (2003 to 2017) |
| | |
46 | | BrandywineGLOBAL — Diversified US Large Cap Value Fund |
| | |
| Independent Trustees† (cont’d) | | |
| |
| S. Ford Rowan | | |
| |
| Year of birth | | 1943 |
| Position(s) with Trust | | Trustee |
| Term of office1 and length of time served2 | | Since 2002 |
| Principal occupation(s) during the past five years | | Consultant to University of Maryland University College (since 2013); formerly, Chairman, National Center for Critical Incident Analysis (2004 to 2018); Lecturer in Organizational Sciences, George Washington University (2000 to 2014); Trustee, St. John’s College (2006 to 2012); Consultant, Rowan & Blewitt Inc. (management consulting) (1984 to 2007); Lecturer in Journalism, Northwestern University (1980 to 1993); Director, Santa Fe Institute (1999 to 2008) |
| Number of funds in fund complex overseen by Trustee | | 20 |
| Other board memberships held by Trustee during the past five years | | None |
| |
| Robert M. Tarola | | |
| |
| Year of birth | | 1950 |
| Position(s) with Trust | | Trustee |
| Term of office1 and length of time served2 | | Since 2004 |
| Principal occupation(s) during the past five years | | President of Rights Advisory LLC (corporate finance and governance consulting) (since 2008); Member, Investor Advisory Group of the Public Company Accounting Oversight Board (since 2009); formerly, Chief Financial Officer, Little Company of Mary Hospital and Health Care Centers (healthcare provider network) (2018); Executive Vice President and Chief Financial Officer, Southcoast Health System, Inc. (healthcare provider network) (2015 to 2017); Senior Vice President and Chief Financial Officer of The Howard University (higher education and health care) (2009 to 2013); Senior Vice President and Chief Financial Officer of W.R. Grace & Co. (specialty chemicals) (1999 to 2008) and MedStar Health, Inc. (healthcare) (1996 to 1999); Partner, PriceWaterhouse, LLP (accounting and auditing) (1984 to 1996) |
| Number of funds in fund complex overseen by Trustee | | 20 |
| Other board memberships held by Trustee during the past five years | | Director of American Kidney Fund (renal disease assistance) (since 2008); Director and Board Chair of XBRL International, Inc. (global data standard setting) (since 2015); Director of Vista Outdoor, Inc. (consumer recreation products) (since 2015); formerly, Director of TeleTech Holdings, Inc. (business processing outsourcing) (since 2008) |
| | |
| BrandywineGLOBAL — Diversified US Large Cap Value Fund | | 47 |
Additional information(unaudited) (cont’d)
Information about Trustees and Officers
| | |
| Interested Trustee and Officer |
| |
| Jane Trust, CFA3 | | |
| |
| Year of birth | | 1962 |
| Position(s) with Trust | | Trustee, President and Chief Executive Officer |
| Term of office1 and length of time served2 | | Since 2015 |
| Principal occupation(s) during the past five years | | Senior Managing Director of Legg Mason & Co., LLC (“Legg Mason & Co.”) (since 2018); Managing Director of Legg Mason & Co. (2016 to 2018); Officer and/or Trustee/Director of 142 funds associated with Legg Mason Partners Fund Advisor, LLC (“LMPFA”) or its affiliates (since 2015); President and Chief Executive Officer of LMPFA (since 2015); formerly, Senior Vice President of LMPFA (2015); Director of ClearBridge, LLC (formerly, Legg Mason Capital Management, LLC) (2007 to 2014); Managing Director of Legg Mason Investment Counsel & Trust Co. (2000 to 2007) |
| Number of funds in fund complex overseen by Trustee | | 133 |
| Other board memberships held by Trustee during the past five years | | None |
| | |
| Additional Officers |
|
Christopher Berarducci*
Legg Mason 620 Eighth Avenue, 49th Floor, New York, NY 10018 |
| |
| Year of birth | | 1974 |
| Position(s) with Trust | | Treasurer and Principal Financial Officer |
| Term of office1 and length of time served2 | | Since 2010 and 2019 |
| Principal occupation(s) during the past five years | | Treasurer (since 2010) and Principal Financial Officer (since 2019) of certain mutual funds associated with Legg Mason & Co. or its affiliates; Director of Legg Mason & Co. (since 2015); formerly, Vice President of Legg Mason & Co. (2011 to 2015); Assistant Controller of certain mutual funds associated with Legg Mason & Co. or its affiliates (prior to 2010) |
|
Robert I. Frenkel Legg Mason 100 First Stamford Place, 6th Floor, Stamford, CT 06902 |
| |
| Year of birth | | 1954 |
| Position(s) with Trust | | Secretary and Chief Legal Officer |
| Term of office1 and length of time served2 | | Since 2007 |
| Principal occupation(s) during the past five years | | Vice President and Deputy General Counsel of Legg Mason, Inc. (since 2006); Managing Director and General Counsel — U.S. Mutual Funds for Legg Mason & Co. (since 2006) and Legg Mason & Co. predecessors (since 1994); Secretary and Chief Legal Officer of certain mutual funds associated with Legg Mason & Co. or its affiliates (since 2006) and Legg Mason & Co. predecessors (prior to 2006) |
| | |
48 | | BrandywineGLOBAL — Diversified US Large Cap Value Fund |
| | |
| Additional Officers (cont’d) |
|
Thomas C. Mandia
Legg Mason 100 First Stamford Place, 6th Floor, Stamford, CT 06902 |
| |
| Year of birth | | 1962 |
| Position(s) with Trust | | Assistant Secretary |
| Term of office1 and length of time served2 | | Since 2007 |
| Principal occupation(s) during the past five years | | Managing Director and Deputy General Counsel of Legg Mason & Co. (since 2005) and Legg Mason & Co. predecessors (prior to 2005); Secretary of LMPFA (since 2006); Assistant Secretary of certain mutual funds associated with Legg Mason & Co. or its affiliates (since 2006) and Legg Mason & Co. predecessors (prior to 2006); Secretary of LM Asset Services, LLC (“LMAS”) (since 2002) and Legg Mason Fund Asset Management, Inc. (“LMFAM”) (since 2013) (formerly registered investment advisers) |
|
Ted P. Becker Legg Mason 620 Eighth Avenue, 49th Floor, New York, NY 10018 |
| |
| Year of birth | | 1951 |
| |
| Position(s) with Trust | | Chief Compliance Officer |
| Term of office1 and length of time served2 | | Since 2007 |
| Principal occupation(s) during the past five years | | Director of Global Compliance at Legg Mason (since 2006); Chief Compliance Officer of LMPFA (since 2006); Managing Director of Compliance of Legg Mason & Co. (since 2005); Chief Compliance Officer of certain mutual funds associated with Legg Mason & Co. or its affiliates (since 2006) |
|
Susan Kerr Legg Mason 620 Eighth Avenue, 49th Floor, New York, NY 10018 |
| |
| Year of birth | | 1949 |
| Position(s) with Trust | | Chief Anti-Money Laundering Compliance Officer |
| Term of office1 and length of time served2 | | Since 2013 |
| Principal occupation(s) during the past five years | | Assistant Vice President of Legg Mason & Co. and Legg Mason Investor Services, LLC (“LMIS”) (since 2010); Chief Anti-Money Laundering Compliance Officer of certain mutual funds associated with Legg Mason & Co. or its affiliates (since 2013) and Anti-Money Laundering Compliance Officer of LMIS (since 2012); Senior Compliance Officer of LMIS (since 2011); formerly, AML Consultant, DTCC (2010); AML Consultant, Rabobank Netherlands, (2009); First Vice President, Director of Marketing & Advertising Compliance and Manager of Communications Review Group at Citigroup Inc. (1996 to 2008) |
| | |
| BrandywineGLOBAL — Diversified US Large Cap Value Fund | | 49 |
Additional information(unaudited) (cont’d)
Information about Trustees and Officers
| | |
| Additional Officers (cont’d) |
|
Jenna Bailey
Legg Mason 100 First Stamford Place, 5th Floor, Stamford, CT 06902 |
| |
| Year of birth | | 1978 |
| Position(s) with Trust | | Identity Theft Prevention Officer |
| Term of office1 and length of time served2 | | Since 2015 |
| Principal occupation(s) during the past five years | | Identity Theft Prevention Officer of certain mutual funds associated with Legg Mason & Co. or its affiliates (since 2015); Compliance Officer of Legg Mason & Co. (since 2013); Assistant Vice President of Legg Mason & Co. (since 2011); formerly, Associate Compliance Officer of Legg Mason & Co. (2011 to 2013) |
|
Jeanne M. Kelly
Legg Mason 620 Eighth Avenue, 49th Floor, New York, NY 10018 |
| |
| Year of birth | | 1951 |
| Position(s) with Trust | | Senior Vice President |
| Term of office1 and length of time served2 | | Since 2007 |
| Principal occupation(s) during the past five years | | Senior Vice President of certain mutual funds associated with Legg Mason & Co. or its affiliates (since 2007); Senior Vice President of LMPFA (since 2006); President and Chief Executive Officer of LMAS and LMFAM (since 2015); Managing Director of Legg Mason & Co. (since 2005) and Legg Mason & Co. predecessors (prior to 2005); formerly, Senior Vice President of LMFAM (2013 to 2015) |
| † | Trustees who are not “interested persons” of the Fund within the meaning of Section 2(a)(19) of the Investment Company Act of 1940, as amended (the “1940 Act”). Each of the Independent Trustees serves on the standing committees of the Board of Trustees, which include the Audit Committee (chair: Arthur S. Mehlman), the Nominating Committee(co-chairs: G. Peter O’Brien and Jill E. McGovern), and the Independent Trustees Committee (chair: Arnold L. Lehman). |
| * | Effective September 27, 2019, Mr. Berarducci became Treasurer and Principal Financial Officer. |
| 1 | Each Trustee and officer serves until his or her respective successor has been duly elected and qualified or until his or her earlier death, resignation, retirement or removal. |
| 2 | Indicates the earliest year in which the Trustee became a board member for a fund in the Legg Mason fund complex or the officer took such office. |
| 3 | Ms. Trust is an “interested person” of the Fund, as defined in the 1940 Act, because of her position with LMPFA and/or certain of its affiliates. |
| | |
50 | | BrandywineGLOBAL — Diversified US Large Cap Value Fund |
Important tax information(unaudited)
The following information is provided with respect to the distributions paid during the taxable year ended September 30, 2019:
| | | | |
| Record date: | | | 12/4/2018 | |
| Payable date: | | | 12/6/2018 | |
| Ordinary Income: | | | | |
Qualified Dividend Income for Individuals | | | 100.00 | % |
Dividends Qualifying for the Dividends | | | | |
Received Deduction for Corporations | | | 100.00 | % |
| Long-Term Capital Gain Dividend | | | $1.588700 | |
| Qualified Short-Term Capital Gain Dividend* | | | $0.003350 | |
| * | Qualified Short-Term Capital Gains eligible for exemption from U.S. withholding tax for nonresident shareholders and foreign corporations. |
Please retain this information for your records.
| | |
| BrandywineGLOBAL — Diversified US Large Cap Value Fund | | 51 |
BrandywineGLOBAL —
Diversified US Large Cap Value Fund
Trustees
Ruby P. Hearn
Arnold L. Lehman
Chairman
Robin J.W. Masters
Jill E. McGovern
Arthur S. Mehlman
G. Peter O’Brien
S. Ford Rowan
Robert M. Tarola
Jane Trust
Investment manager
Legg Mason Partners Fund Advisor, LLC
Subadviser
Brandywine Global Investment
Management, LLC
Distributor
Legg Mason Investor Services, LLC
Custodian
The Bank of New York Mellon
Transfer agent
BNY Mellon Investment Servicing (US) Inc.
4400 Computer Drive
Westborough, MA 01581
Independent registered public accounting firm
PricewaterhouseCoopers LLP Baltimore, MD
BrandywineGLOBAL — Diversified US Large Cap Value Fund
The Fund is a separate investment series of Legg Mason Global Asset Management Trust, a Maryland statutory trust.
BrandywineGLOBAL — Diversified US Large Cap Value Fund
Legg Mason Funds
620 Eighth Avenue, 49th Floor
New York, NY 10018
The Fund files its complete schedule of portfolio holdings with the Securities and Exchange Commission (“SEC”) for the first and third quarters of each fiscal year as an exhibit to its reports on FormN-PORT. Previously, the Fund filed a complete schedule of portfolio holdings with the SEC for the first and third quarters of each fiscal year on FormN-Q. The Fund’s FormsN-PORT andN-Q are available on the SEC’s website at www.sec.gov. To obtain information on FormsN-PORT andN-Q, shareholders can call the Fund at1-877-721-1926.
Information on how the Fund voted proxies relating to portfolio securities during the prior12-month period ended June 30th of each year and a description of the policies and procedures that the Fund uses to determine how to vote proxies related to portfolio transactions are available (1) without charge, upon request, by calling the Fund at1-877-721-1926, (2) at www.leggmason.com/mutualfunds and (3) on the SEC’s website at www.sec.gov.
This report is submitted for the general information of the shareholders of BrandywineGLOBAL — Diversified US Large Cap Value Fund. This report is not authorized for distribution to prospective investors in the Fund unless preceded or accompanied by a current prospectus.
Investors should consider the Fund’s investment objectives, risks, charges and expenses carefully before investing. The prospectus contains this and other important information about the Fund. Please read the prospectus carefully before investing.
www.leggmason.com
© 2019 Legg Mason Investor Services, LLC
Member FINRA, SIPC
Legg Mason Funds Privacy and Security Notice
Your Privacy and the Security of Your Personal Information is Very Important to the Legg Mason Funds
This Privacy and Security Notice (the “Privacy Notice”) addresses the Legg Mason Funds’ privacy and data protection practices with respect to nonpublic personal information the Funds receive. The Legg Mason Funds include any funds sold by the Funds’ distributor, Legg Mason Investor Services, LLC, as well as Legg Mason-sponsoredclosed-end funds. The provisions of this Privacy Notice apply to your information both while you are a shareholder and after you are no longer invested with the Funds.
The Type of Nonpublic Personal Information the Funds Collect About You
The Funds collect and maintain nonpublic personal information about you in connection with your shareholder account. Such information may include, but is not limited to:
| • | | Personal information included on applications or other forms; |
| • | | Account balances, transactions, and mutual fund holdings and positions; |
| • | | Bank account information, legal documents, and identity verification documentation; |
| • | | Online account access user IDs, passwords, security challenge question responses; and |
| • | | Information received from consumer reporting agencies regarding credit history and creditworthiness (such as the amount of an individual’s total debt, payment history, etc.). |
How the Funds Use Nonpublic Personal Information About You
The Funds do not sell or share your nonpublic personal information with third parties or with affiliates for their marketing purposes, or with other financial institutions or affiliates for joint marketing purposes, unless you have authorized the Funds to do so. The Funds do not disclose any nonpublic personal information about you except as may be required to perform transactions or services you have authorized or as permitted or required by law. The Funds may disclose information about you to:
| • | | Employees, agents, and affiliates on a “need to know” basis to enable the Funds to conduct ordinary business or to comply with obligations to government regulators; |
| • | | Service providers, including the Funds’ affiliates, who assist the Funds as part of the ordinary course of business (such as printing, mailing services, or processing or servicing your account with us) or otherwise perform services on the Funds’ behalf, including companies that may perform statistical analysis, market research and marketing services solely for the Funds; |
| • | | Permit access to transfer, whether in the United States or countries outside of the United States to such Funds’ employees, agents and affiliates and service providers as required to enable the Funds to conduct ordinary business, or to comply with obligations to government regulators; |
| • | | The Funds’ representatives such as legal counsel, accountants and auditors to enable the Funds to conduct ordinary business, or to comply with obligations to government regulators; |
| • | | Fiduciaries or representatives acting on your behalf, such as an IRA custodian or trustee of a grantor trust. |
|
| NOT PART OF THE ANNUAL REPORT |
Legg Mason Funds Privacy and Security Notice (cont’d)
Except as otherwise permitted by applicable law, companies acting on the Funds’ behalf, including those outside the United States, are contractually obligated to keep nonpublic personal information the Funds provide to them confidential and to use the information the Funds share only to provide the services the Funds ask them to perform.
The Funds may disclose nonpublic personal information about you when necessary to enforce their rights or protect against fraud, or as permitted or required by applicable law, such as in connection with a law enforcement or regulatory request, subpoena, or similar legal process. In the event of a corporate action or in the event a Fund service provider changes, the Funds may be required to disclose your nonpublic personal information to third parties. While it is the Funds’ practice to obtain protections for disclosed information in these types of transactions, the Funds cannot guarantee their privacy policy will remain unchanged.
Keeping You Informed of the Funds’ Privacy and Security Practices
The Funds will notify you annually of their privacy policy as required by federal law. While the Funds reserve the right to modify this policy at any time they will notify you promptly if this privacy policy changes.
The Funds’ Security Practices
The Funds maintain appropriate physical, electronic and procedural safeguards designed to guard your nonpublic personal information. The Funds’ internal data security policies restrict access to your nonpublic personal information to authorized employees, who may use your nonpublic personal information for Fund business purposes only.
Although the Funds strive to protect your nonpublic personal information, they cannot ensure or warrant the security of any information you provide or transmit to them, and you do so at your own risk. In the event of a breach of the confidentiality or security of your nonpublic personal information, the Funds will attempt to notify you as necessary so you can take appropriate protective steps. If you have consented to the Funds using electronic communications or electronic delivery of statements, they may notify you under such circumstances using the most current email address you have on record with them.
In order for the Funds to provide effective service to you, keeping your account information accurate is very important. If you believe that your account information is incomplete, not accurate or not current, if you have questions about the Funds’ privacy practices, or our use of your nonpublic personal information, write the Funds using the contact information on your account statements, email the Funds by clicking on the Contact Us section of the Funds’ website at www.leggmason.com, or contact the Funds at1-877-721-1926.
Revised April 2018
|
| NOT PART OF THE ANNUAL REPORT |
www.leggmason.com
© 2019 Legg Mason Investor Services, LLC Member FINRA, SIPC
LMFX012987 11/19 SR19-3732
The registrant has adopted a code of ethics that applies to the registrant’s principal executive officer, principal financial officer, principal accounting officer or controller.
| ITEM 3. | AUDIT COMMITTEE FINANCIAL EXPERT. |
The Board of Trustees of the registrant has determined that Arthur S. Mehlman the Chairman of the Board’s Audit Committee and Robert M. Tarola, possess the technical attributes identified in Instruction 2(b) of Item 3 to FormN-CSR to qualify as “audit committee financial experts,” and have designated Mr. Mehlman and Mr. Tarola as the Audit Committee’s financial experts. Mr. Mehlman and Mr. Tarola are “independent” Trustees pursuant to paragraph (a) (2) of Item 3 to FormN-CSR.
| ITEM 4. | PRINCIPAL ACCOUNTANT FEES AND SERVICES. |
a)Audit Fees. The aggregate fees billed in the last two fiscal years ending September 30, 2018 and September 30, 2019 (the “Reporting Periods”) for professional services rendered by the Registrant’s principal accountant (the “Auditor”) for the audit of the Registrant’s annual financial statements, or services that are normally provided by the Auditor in connection with the statutory and regulatory filings or engagements for the Reporting Periods, were $306,746 in September 30, 2018 and $336,010 in September 30, 2019.
b)Audit-Related Fees. The aggregate fees billed in the Reporting Period for assurance and related services by the Auditor that are reasonably related to the performance of the Registrant’s financial statements were $0 in September 30, 2018 and $3,000 in September 30, 2019.
In addition, there were no Audit-Related Fees billed in the Reporting Period for assurance and related services by the Auditor to the Registrant’s investment adviser (not including anysub-adviser whose role is primarily portfolio management and is subcontracted with or overseen by another investment adviser), and any entity controlling, controlled by or under common control with the investment adviser that provides ongoing services to the Legg Mason Global Asset Management Trust (“service affiliates”), that were reasonably related to the performance of the annual audit of the service affiliates. Accordingly, there were no such fees that requiredpre-approval by the Audit Committee for the Reporting Period.
(c)Tax Fees. The aggregate fees billed in the Reporting Periods for professional services rendered by the Auditor for tax compliance, tax advice and tax planning (“Tax Services”) were $45,424 in September 30, 2018 and $0 in September 30, 2019. These services consisted of (i) review or preparation of U.S. federal, state, local and excise tax returns; (ii) U.S. federal, state and local tax planning, advice and assistance regarding statutory, regulatory or administrative developments, and (iii) tax advice regarding tax qualification matters and/or treatment of various financial instruments held or proposed to be acquired or held.
There were no fees billed for tax services by to the service affiliates during the Reporting Periods that requiredpre-approval by the Audit Auditors Committee.
d)All Other Fees. The aggregate fees for other fees billed in the Reporting Periods for products and services provided by the Auditor were $0 in September 30, 2018 and $0 in September 30, 2019, other than the services reported in paragraphs (a) through (c) of this item for the Legg Mason Global Asset Management Trust.
All Other Fees. There were no othernon-audit services rendered by the Auditor to Legg Mason Partners Fund Advisors, LLC (“LMPFA”), and any entity controlling, controlled by or under common control with LMPFA that provided ongoing services to Legg Mason Global Asset Management Trust requiringpre-approval by the Audit Committee in the Reporting Period.
(e) Audit Committee’s pre–approval policies and procedures described in paragraph (c)
(7) of Rule2-01 of RegulationS-X.
(1) The Charter for the Audit Committee (the “Committee”) of the Board of each registered investment company (the “Fund”) advised by LMPFA or one of their affiliates (each, an “Adviser”) requires that the Committee shall approve (a) all audit and permissiblenon-audit services to be provided to the Fund and (b) all permissiblenon-audit services to be provided by the Fund’s independent auditors to the Adviser and any Covered Service Providers if the engagement relates directly to the operations and financial reporting of the Fund. The Committee may implement policies and procedures by which such services are approved other than by the full Committee.
The Committee shall not approvenon-audit services that the Committee believes may impair the independence of the auditors. As of the date of the approval of this Audit Committee Charter, permissiblenon-audit services include any professional services (including tax services), that are not prohibited services as described below, provided to the Fund by the independent auditors, other than those provided to the Fund in connection with an audit or a review of the financial statements of the Fund. Permissiblenon-audit services may not include: (i) bookkeeping or other services related to the accounting records or financial statements of the Fund; (ii) financial information systems design and implementation; (iii) appraisal or valuation services, fairness opinions orcontribution-in-kind reports; (iv) actuarial services; (v) internal audit outsourcing services; (vi) management functions or human resources; (vii) broker or dealer, investment adviser or investment banking services; (viii) legal services and expert services unrelated to the audit; and (ix) any other service the Public Company Accounting Oversight Board determines, by regulation, is impermissible.
Pre-approval by the Committee of any permissiblenon-audit services is not required so long as: (i) the aggregate amount of all such permissiblenon-audit services provided to the Fund, the Adviser and any service providers controlling, controlled by or under common control with the Adviser that provide ongoing services to the Fund (“Covered Service Providers”) constitutes not more than 5% of the total amount of revenues paid to the independent auditors during the fiscal year in which the permissiblenon-audit services are provided to (a) the Fund, (b) the Adviser and (c) any entity controlling, controlled by or under common control with the Adviser that provides ongoing services to the Fund during the fiscal year in which the services are provided that would have to be approved by the Committee; (ii) the permissiblenon-audit services were not recognized by the Fund at the time of the engagement to benon-audit services; and (iii) such services are promptly brought to the attention of the Committee and approved by the Committee (or its delegate(s)) prior to the completion of the audit.
(2) For the Legg Mason Global Asset Management Trust, the percentage of fees that were approved by the audit committee, with respect to: Audit-Related Fees were 100% and 100% for September 30, 2018 and September 30, 2019; Tax Fees were 100% and 100% for September 30, 2018 and September 30, 2019; and Other Fees were 100% and 100% for September 30, 2018 and September 30, 2019.
(f) N/A
(g)Non-audit fees billed by the Auditor for services rendered to Legg Mason Global Asset Management Trust, LMPFA and any entity controlling, controlled by, or under common control with LMPFA that provides ongoing services to Legg Mason Global Asset Management Trust during the reporting period were $477,227 in September 30, 2018 and $386,151 in September 30, 2019.
(h) Yes. Legg Mason Global Asset Management Trust’s Audit Committee has considered whether the provision ofnon-audit services that were rendered to Service Affiliates, which were notpre-approved (not requiringpre-approval), is compatible with maintaining the Accountant’s independence. All services provided by the Auditor to the Legg Mason Global Asset Management Trust or to Service Affiliates, which were required to bepre-approved, werepre-approved as required.
| ITEM 5. | AUDIT COMMITTEE OF LISTED REGISTRANTS. |
a)The independent board members are acting as the registrant’s audit committee as specified in Section 3(a)(58)(B) of the Exchange Act. The Audit Committee consists of the following Board members:
Ruby P. Hearn
Arnold L. Lehman
Robin J.W. Masters
Jill E. McGovern
Arthur S. Mehlman
G. Peter O’Brien
S. Ford Rowan
Robert M. Tarola
b) Not applicable
| ITEM 6. | SCHEDULE OF INVESTMENTS. |
Included herein under Item 1.
| ITEM 7. | DISCLOSURE OF PROXY VOTING POLICIES AND PROCEDURES FORCLOSED-END MANAGEMENT INVESTMENT COMPANIES. |
Not applicable.
| ITEM 8. | PORTFOLIO MANAGERS OFCLOSED-END MANAGEMENT INVESTMENT COMPANIES. |
Not applicable.
| ITEM 9. | PURCHASES OF EQUITY SECURITIES BYCLOSED-END MANAGEMENT INVESTMENT COMPANY AND AFFILIATED PURCHASERS. |
Not applicable.
| ITEM 10. | SUBMISSION OF MATTERS TO A VOTE OF SECURITY HOLDERS. |
Not applicable.
| ITEM 11. | CONTROLS AND PROCEDURES. |
| | (a) | The registrant’s principal executive officer and principal financial officer have concluded that the registrant’s disclosure controls and procedures (as defined in Rule30a- 3(c) under the Investment Company Act of 1940, as amended (the “1940 Act”)) are effective as of a date within 90 days of the filing date of this report that includes the disclosure required by this paragraph, based on their evaluation of the disclosure controls and procedures required by Rule30a-3(b) under the 1940 Act and15d-15(b) under the Securities Exchange Act of 1934. |
| | (b) | There were no changes in the registrant’s internal control over financial reporting (as defined in Rule30a-3(d) under the 1940 Act) that occurred during the second fiscal quarter of the period covered by this report that have materially affected, or are likely to materially affect the registrant’s internal control over financial reporting. |
| ITEM 12. | DISCLOSURE OF SECURITIES LENDING ACTIVITIES FORCLOSED-END MANAGEMENT INVESTMENT COMPANIES. |
Not applicable.
(a) (1) Code of Ethics attached hereto.
Exhibit 99.CODE ETH
(a) (2) Certifications pursuant to section 302 of the Sarbanes-Oxley Act of 2002 attached hereto.
Exhibit 99.CERT
(b) Certifications pursuant to Section 906 of the Sarbanes-Oxley Act of 2002 attached hereto.
Exhibit 99.906CERT
SIGNATURES
Pursuant to the requirements of the Securities Exchange Act of 1934 and the Investment Company Act of 1940, the registrant has duly caused this Report to be signed on its behalf by the undersigned, there unto duly authorized.
| | |
| Legg Mason Global Asset Management Trust |
| |
| By: | | /s/ Jane Trust |
| | Jane Trust |
| | Chief Executive Officer |
| |
| Date: | | November 21, 2019 |
Pursuant to the requirements of the Securities Exchange Act of 1934 and the Investment Company Act of 1940, this report has been signed below by the following persons on behalf of the registrant and in the capacities and on the dates indicated.
| | |
| By: | | /s/ Jane Trust |
| | Jane Trust |
| | Chief Executive Officer |
| |
| Date: | | November 21, 2019 |
| |
| By: | | /s/ Christopher Berarducci |
| | Christopher Berarducci |
| | Principal Financial Officer |
| |
| Date: | | November 21, 2019 |