UNITED STATES
SECURITIES AND EXCHANGE COMMISSION
Washington, D.C. 20549
FORMN-CSR
CERTIFIED SHAREHOLDER REPORT OF REGISTERED
MANAGEMENT INVESTMENT COMPANIES
Investment Company Act file number811-22338
Legg Mason Global Asset Management Trust
(Exact name of registrant as specified in charter)
620 Eighth Avenue, 49th Floor, New York, NY 10018
(Address of principal executive offices) (Zip code)
Robert I. Frenkel, Esq.
Legg Mason & Co., LLC
100 First Stamford Place
Stamford, CT 06902
(Name and address of agent for service)
Registrant’s telephone number, including area code:1-877-721-1926
Date of fiscal year end: September 30
Date of reporting period: September 30, 2019
| ITEM 1. | REPORT TO STOCKHOLDERS |
TheAnnual Report to Stockholders is filed herewith.

| | |
Annual Report | | September 30, 2019 |
MARTIN CURRIE
EMERGING MARKETS
FUND
Beginning in March 2021, as permitted by regulations adopted by the Securities and Exchange Commission, the Fund intends to no longer mail paper copies of the Fund’s shareholder reports like this one, unless you specifically request paper copies of the reports from the Fund or from your Service Agent or financial intermediary (such as a broker-dealer or bank). Instead, the reports will be made available on a website, and you will be notified by mail each time a report is posted and provided with a website link to access the report.
If you already elected to receive shareholder reports electronically (“e-delivery”), you will not be affected by this change and you need not take any action. If you have not already elected e-delivery, you may elect to receive shareholder reports and other communications from the Fund electronically by contacting your Service Agent or, if you are a direct shareholder with the Fund, by calling 1-877-721-1926.
You may elect to receive all future reports in paper free of charge. If you invest through a Service Agent, you can contact your Service Agent to request that you continue to receive paper copies of your shareholder reports. That election will apply to all Legg Mason Funds held in your account at that Service Agent. If you are a direct shareholder with the Fund, you can call the Fund at 1-877-721-1926, or write to the Fund by regular mail at Legg Mason Funds, P.O. Box 9699, Providence, RI 02940-9699 or by express, certified or registered mail to Legg Mason Funds, 4400 Computer Drive, Westborough, MA 01581 to let the Fund know you wish to continue receiving paper copies of your shareholder reports. That election will apply to all Legg Mason Funds held in your account held directly with the fund complex.

|
| INVESTMENT PRODUCTS: NOT FDIC INSURED • NO BANK GUARANTEE • MAY LOSE VALUE |
Fund objective
The Fund seeks long-term capital appreciation.
Letter from the president

Dear Shareholder,
We are pleased to provide the annual report of Martin Currie Emerging Markets Fund for the twelve-month period ended September 30, 2019. Please read on for a detailed look at prevailing economic and market conditions during the Fund’s reporting period and to learn how those conditions have affected Fund performance.
Special shareholder notice
The Fund is managed by a broad team of portfolio managers. Kim Catechis, Andrew Mathewson, Alastair Reynolds, Divya Mathur, Paul Desoisa, Paul Sloane and Colin Dishington are the Fund’s portfolio managers, and each is responsible for the day-to-day management of the Fund. Mr. Catechis and Mr. Mathewson, CFA have been the Fund’s portfolio managers since inception. Mr. Reynolds has been the Fund’s portfolio manager since 2018. Mr. Mathur, Mr. Desoisa, CFA, Mr. Sloane and Mr. Dishington, CFA, have been the Fund’s portfolio managers since June 2019. These portfolio managers, all of whom are employed by Martin Currie Inc., the Fund’s subadviser, work together to make portfolio management decisions. Effective December 28, 2019, Mr. Catechis will no longer serve as a portfolio manager for the Fund. For more information on the Fund’s portfolio managers, please see the Fund’s prospectus.
As always, we remain committed to providing you with excellent service and a full spectrum of investment choices. We also remain committed to supplementing the support you receive from your financial advisor. One way we accomplish this is through our website, www.leggmason.com. Here you can gain immediate access to market and investment information, including:
| • | | Fund prices and performance, |
| • | | Market insights and commentaries from our portfolio managers, and |
| • | | A host of educational resources. |
| | |
| II | | Martin Currie Emerging Markets Fund |
We look forward to helping you meet your financial goals.
Sincerely,

Jane Trust, CFA
President and Chief Executive Officer
October 31, 2019
| | |
| Martin Currie Emerging Markets Fund | | III |
Fund overview
Q. What is the Fund’s investment strategy?
A. The Fund seeks long-term capital appreciation. Under normal market conditions, the Fund pursues its objective by investing at least 80% of its net assets plus borrowings for investment purposes, if any, in securities of issuers with substantial economic ties to one or more emerging market countries and other investments with similar economic characteristics. The material factors we consider when determining whether an issuer has substantial economic ties to an emerging market country include whether the issuer is included in the MSCI Emerging Markets Indexi, is organized or headquartered in an emerging market country, or maintains most of its assets in one or more such countries, has a primary listing for its securities on a stock exchange of an emerging market country, or derives a majority of its exposure (e.g. percentage of sales, income or other material factors) from one or more emerging market countries. Emerging market countries are predominantly found currently in regions including Asia, the Indian subcontinent, South and Central America, the Middle and Near East, Eastern and Central Europe, and Africa.
The Fund will invest primarily in equity and equity-related securities, which may include common stocks, preferred stock, convertible bonds, other securities convertible into common stock, depositary receipts, real estate investment trusts, securities of other investment companies including exchange traded funds, and synthetic foreign equity securitiesii, including international warrants. The Fund will use synthetic foreign equity securities to obtain market exposure where direct access is not otherwise available. The Fund may also enter into index futures contracts, a form of derivative contract, as a substitute for buying or selling securities, to obtain market exposure, in an attempt to enhance returns, and to manage cash.
Our overarching investment philosophy is that building stock-focused portfolios, driven by fundamental research, can help to exploit market inefficiencies and generate consistent outperformance. Our global emerging markets team aims to build long-term, high conviction stock-focused portfolios, driven by fundamental research within its risk framework.
Within an emerging market country, we select securities that we believe have favorable investment potential. For example, the Fund may purchase stocks of companies with prices that reflect a value lower than that which we place on the company. We may also consider factors we believe will cause the stock price to rise. In general, we will consider, among other factors, an issuer’s valuation, financial strength, competitive position in its industry, projected future earnings, cash flows, and dividends when deciding whether to buy or sell investments. The Fund may invest in companies of any size and market capitalization.
The Fund may invest in companies domiciled in any country that we believe to be appropriate to the Fund’s investment objective. Subject to the Fund’s 80% investment policy, the Fund may invest a substantial amount of assets (i.e. more than 25%) in issuers located in a single country or a limited number of countries, but will always be invested in or have exposure to no less than three different emerging market countries. The Fund may invest in securities denominated in foreign currencies or in U.S. dollars.
| | |
| Martin Currie Emerging Markets Fund 2019 Annual Report | | 1 |
Fund overview (cont’d)
The Fund is classified as “non-diversified”, which means it may invest a larger percentage of its assets in a smaller number of issuers than a diversified fund.
Q. What were the overall market conditions during the Fund’s reporting period?
A. Emerging markets ended the twelve-month reporting period ended September 30, 2019 down in U.S. dollar terms, with the MSCI Emerging Markets Index (Net)iii falling 2.02%. This headline figure though hid periods of more significant falls and recovery.
The final quarter of 2018 was tough for global equities, as trade tensions between the U.S. and China, coupled with fears of a broad global slowdown took hold. Despite some positive relief, following Chinese Premier Xi Jinping and U.S. President Donald Trump meeting in early December 2018, the markets were then overwhelmed by negativity, following the arrest of the CEO at Chinese technology firm Huawei. However, while emerging market equities were not immune to the negative sentiment, they outperformed their developed peers over the quarter, as the U.S. market finally showed some vulnerability.
The start of 2019 was more positive, with a reversal of U.S. interest rate rise expectations and a more promising tone from the U.S. and China on trade. By the end of June 2019, the MSCI Emerging Markets Index had risen 9.9% year to date.
In late May 2019, there was also a flurry of headlines on another trade front, as the U.S. administration announced the imposition of 5% tariffs on Mexican goods unless its neighbor acted to curb migration. Within two weeks, the U.S. declared negotiations a success – meaning no new tariffs. This sequence illustrated the unpredictability of the tariff/trade issue and the difficulty of trying to anticipate news flow around trade tensions.
Trade talks between the U.S. and China have continued to dominate the headlines, acting as a trigger for sentiment. We have also seen the U.S. label China a ‘currency manipulator’, announcing another round of tariffs, with further retaliatory charges promised from the Chinese. Ultimately, the situation remains as it has been for much of the year, with some hope but certainly no clear path to a swift resolution of the issues.
Elsewhere, in India, Narendra Modi was re-elected for a second term, viewed as a market-friendly outcome due to the likelihood of political continuity and reforms. Late in the period, plans were announced to reduce the corporate tax rate for domestic companies to 22%, which implies an effective tax rate of 25% after surcharges versus 30% previously. This stimulus is consistent with the trends of central banks across emerging markets cutting interest rates. We have seen widespread easing of monetary policy in the final quarter of the reporting period. While the U.S. Federal Reserve Board (the “Fed”)iv was the most high-profile example, there were several examples in emerging markets, including rate cuts in Brazil, Mexico, Chile, South Africa, Turkey, Indonesia, and the Philippines.
In Latin America, the Brazilian market has been strong over the course of the year, on hopes that new president Jair Bolsonaro will drive reforms. Meanwhile, Argentina, a recent re-entrant into the MSCI Emerging Market Index, saw its financial markets thrown into
| | |
| 2 | | Martin Currie Emerging Markets Fund 2019 Annual Report |
chaos in August 2019 following the defeat of incumbent President Mauricio Macri in the country’s primary elections. This raised concerns over a potential sovereign default and a return to the populist government.
Q. How did we respond to these changing market conditions?
A. With the trade dispute between the U.S. and China ongoing, the near-term outlook for emerging markets is likely to remain volatile. However, economic activity across most of the emerging-market asset class is still firmly in positive territory, many central banks in the region have cut interest rates, and the valuation of emerging market equities, relative to other asset classes, is becoming more compelling.
The recent shift in global interest-rate policy from tightening towards a resumption of rate cuts should provide a boost to confidence and aid stability. It should also provide support to the intrinsic value of high-growth companies. While our strategy is typically exposed to companies with above-average earnings growth prospects and stronger-than-average balance sheets, an improvement in the overall corporate backdrop would help build confidence that the long-term growth drivers for emerging markets are intact. This is also likely to be a necessary pre-requisite to close the emerging-market valuation gap to the MSCI World Indexv.
We remain excited by the powerful combination of technology adoption, urbanization and services sector growth that is evident in emerging markets. We expect our highly selective, stock-focused approach will continue to prosper through accessing companies with a high return on equity, operating in structurally growing industries.
We continue to have confidence in the growth drivers that we are accessing in key thematic areas, including sustainable energy, smart devices, increased financial services adoption and disruptive technologies.
Performance review
For the twelve-months ended September 30, 2019, Class I shares of Martin Currie Emerging Markets Fund returned 3.85%. The Fund’s unmanaged benchmark, the MSCI Emerging Markets Index (Net), returned -2.02% for the same period. The Lipper Emerging Markets Funds Category Averagevi returned 0.57% over the same time frame.
| | | | | | | | |
Performance Snapshot as of September 30, 2019 (unaudited) | |
| (excluding sales charges) | | 6 months | | | 12 months | |
| Martin Currie Emerging Markets Fund: | | | | | | | | |
Class A | | | -0.08 | % | | | 3.68 | % |
Class C | | | -0.50 | % | | | 2.95 | % |
Class FI | | | -0.17 | % | | | 3.48 | % |
Class I | | | 0.00 | % | | | 3.85 | % |
Class IS | | | 0.00 | % | | | 3.95 | % |
| MSCI Emerging Markets Index (Net) | | | -3.66 | % | | | -2.02 | % |
| Lipper Emerging Markets Funds Category Average | | | -1.72 | % | | | 0.57 | % |
| | |
| Martin Currie Emerging Markets Fund 2019 Annual Report | | 3 |
Fund overview (cont’d)
The performance shown represents past performance. Past performance is no guarantee of future results and current performance may be higher or lower than the performance shown above. Principal value and investment returns will fluctuate and investors’ shares, when redeemed, may be worth more or less than their original cost. To obtain performance data current to the most recent month-end, please visit our website at www.leggmason.com/mutualfunds.
All share class returns assume the reinvestment of all distributions at net asset value and the deduction of all Fund expenses. Returns have not been adjusted to include sales charges that may apply or the deduction of taxes that a shareholder would pay on Fund distributions. If sales charges were reflected, the performance quoted would be lower. Performance figures for periods shorter than one year represent cumulative figures and are not annualized.
Fund performance figures reflect fee waivers and/or expense reimbursements, without which the performance would have been lower.
|
| Total Annual Operating Expenses(unaudited) |
As of the Fund’s current prospectus dated February 1, 2019, the gross total annual fund operating expense ratios for Class A, Class C, Class FI, Class I and Class IS shares were 1.52%, 2.26%, 1.51%, 1.38% and 1.11%, respectively.
Actual expenses may be higher. For example, expenses may be higher than those shown if average net assets decrease. Net assets are more likely to decrease and Fund expense ratios are more likely to increase when markets are volatile.
As a result of expense limitation arrangements, the ratio of total annual fund operating expenses other than interest, brokerage commissions, dividend expense on short sales, taxes, extraordinary expenses and acquired fund fees and expenses to average net assets, will not exceed 1.30% for Class A shares, 2.05% for Class C shares, 1.30% for Class FI shares, 0.95% for Class I shares and 0.85% for Class IS shares. In addition, the ratio of total annual fund operating expenses for Class IS shares will not exceed the ratio of total annual fund operating expenses for Class I shares. Total annual fund operating expenses after waiving fees and/or reimbursing expenses exceed the expense cap for each class as a result of acquired fund fees and expenses. These expense limitation arrangements cannot be terminated prior to December 31, 2020 without the Board of Trustees’ consent.
The manager is permitted to recapture amounts waived and/or reimbursed to a class within three years after the fiscal year in which the manager earned the fee or incurred the expense if the class’ total annual operating expenses have fallen to a level below the expense limitation (“expense cap”) in effect at the time the fees were earned or the expenses incurred. In no case will the manager recapture any amount that would result, on any particular business day of the Fund, in the class’ total annual operating expenses exceeding the expense cap or any other lower limit then in effect.
Q. What were the leading contributors to performance?
A. Cosan, the Brazilian conglomerate producer of bioethanol, sugar and energy was the best performer over the reporting period, appearing among the leading contributors in every quarter over the reporting period. It has benefited from company-specific factors, such as the group’s efforts to simplify its corporate structure, which was welcomed by investors.
| | |
| 4 | | Martin Currie Emerging Markets Fund 2019 Annual Report |
The stock has also been helped by general macro themes, with expectations of domestic economic recovery in Brazil. In the last quarter of the reporting period, Cosan announced the formation of a joint venture with Femsa, a Mexican conglomerate and operator of one of the most successful convenience-store businesses in Latin America, to bring the company’s retail expertise to Cosan’s fuel-distribution outlets.
Titan, the Indian consumer company, also fared well over the reporting period. Early in the period it reported surging jewelry sales, with guidance pointing to sustained sales momentum in the coming quarter. The company continues to take market share in jewelry and is seeing significant progress, particularly in the wedding jewelry space. EPAM, the software provider and consultancy was another strong performer, releasing a strong set of results for the 2018 financial year, seeing revenues and profits growth.
At the sector level, the Information Technology and Financials sectors were most positive for Fund performance during the reporting period. India was the most notable contributor from a regional level.
Q. What were the leading detractors from performance?
A. Mexichem, the plastic pipe and chemicals company, now renamed as Orbia, was the most notable detractor over the reporting period. Its operations span two global chemical industries; fluorine aerosols and PVC production. Both these industries witnessed a period of margin weakness in the final quarter of 2018. It is common in the chemical industry to experience short periods where conditions in feedstock markets fail to pass through to end-product markets. This can lead to temporary swings in profitability for producers.
LG Chem, Ltd., the Korean chemical’s company, was also a poor performer. The company’s second-quarter 2019 results disappointed the market, given the impact of one-off costs due to the early ramp-up of its electric-vehicle (“EV”) battery production in Poland and lower profit expectations for its petrochemicals business. In addition, the market remains concerned about the pace of the overall growth of its EV business. Finally, Genting Malaysia was a negative for results during the reporting period. In November 2018, Malaysia’s finance minister’s budget included plans to increase the gaming tax by significantly more than market expectations. Genting Malaysia also filed a lawsuit against Walt Disney and the Fox Group for abandoning a contract to grant a license to operate the first 20th Century World theme park.
At the sector level, the Health Care and Consumer Staples sectors and not holding the Real Estate sector weighed most on returns. At the country level, the Fund’s holdings in Mexico and Malaysia were the most notable detractors from performance during the reporting period.
Q. Were there any significant changes to the Fund during the period?
A. Over the twelve months reporting period we bought financials ICIC Bank and Kotak Mahindra Bank from India, China’s Ping An Insurance and IRB Brasil. Other purchases were Brazilian dental benefits company OdontoPrev and telecommunications firm Telkom
| | |
| Martin Currie Emerging Markets Fund 2019 Annual Report | | 5 |
Fund overview (cont’d)
Indonesia. We sold Brazilian housebuilder MRV, Indonesian tower provider TBIG, financials CTBC Financial (Taiwan) and Yes Bank (India) and healthcare name Aspen Pharmacare (South Africa). As bottom-up stock pickers with a 3-to-5 year view, our principal focus is on business fundamentals and whether or not the market is pricing these correctly. This has manifested itself in low portfolio turnover. We have a preference for high-quality businesses with sustainable growth prospects at attractive valuations. We believe the long-term outlook for many emerging markets businesses remains bright, with earnings likely to benefit from stronger economic growth, continued productivity improvements and supportive monetary conditions, and the Fund remains positioned to benefit from these trends.
Thank you for your investment in Martin Currie Emerging Markets Fund. As always, we appreciate that you have chosen us to manage your assets and we remain focused on achieving the Fund’s investment goals.
Sincerely,
Martin Currie Inc.
October 18, 2019
RISKS: Equity securities are subject to market and price fluctuations. Small- and mid-cap stocks involve greater risks and volatility than large-cap stocks. The Fund may be significantly overweight or underweight in certain companies, industries or market sectors, which may cause the Fund’s performance to be more sensitive to developments affecting those companies, industries or sectors. International investments are subject to special risks including currency fluctuations, as well as social, economic and political uncertainties, which could increase volatility. These risks are magnified in emerging markets. To the extent the Fund focuses its investments in a single country or only a few countries in a particular geographic region, economic, political, regulatory or other conditions affecting such country or region may have a greater impact on fund performance relative to a more geographically diversified fund. As a non-diversified fund, the Fund is permitted to invest a higher percentage of its assets in any one issuer than a diversified fund, which may magnify the Fund’s losses from events affecting a particular issuer. Derivatives, such as options and futures, can be illiquid, may disproportionately increase losses and have a potentially large impact on Fund performance. In addition to the Fund’s operating expenses, the Fund will indirectly bear the operating expenses of any underlying funds it invests in. Please see the Fund’s prospectus for a more complete discussion of these and other risks and the Fund’s investment strategies.
Portfolio holdings and breakdowns are as of September 30, 2019 and are subject to change and may not be representative of the portfolio managers’ current or future investments. The Fund’s top ten holdings (as a percentage of net assets) as of September 30, 2019 were: Samsung Electronics Co. Ltd. (7.7%), Taiwan Semiconductor Manufacturing Co. Ltd. (7.5%), Tencent Holdings Ltd. (6.3%), Alibaba Group Holding Ltd. (6.2%), Ping An Insurance Group Co. of China Ltd. (3.2%), Industrial and Commercial Bank of China Ltd. (2.9%), OTP Bank Nyrt (2.9%), Titan Co. Ltd. (2.8%), Lukoil PJSC (2.5%) and Credicorp Ltd. (2.5%). Please refer to pages 15 through 18 for a list and percentage breakdown of the Fund’s holdings.
| | |
| 6 | | Martin Currie Emerging Markets Fund 2019 Annual Report |
The mention of sector breakdowns is for informational purposes only and should not be construed as a recommendation to purchase or sell any securities. The information provided regarding such sectors is not a sufficient basis upon which to make an investment decision. Investors seeking financial advice regarding the appropriateness of investing in any securities or investment strategies discussed should consult their financial professional. The Fund’s top five sector holdings (as a percentage of net assets) as of September 30, 2019 were: Financials (26.7%), Information Technology (24.5%), Consumer Discretionary (14.9%), Communication Services (10.6%), and Energy (6.9%). The Fund’s portfolio composition is subject to change at any time.
All investments are subject to risk including the possible loss of principal. Past performance is no guarantee of future results. All index performance reflects no deduction for fees, expenses or taxes. Please note that an investor cannot invest directly in an index.
The information provided is not intended to be a forecast of future events, a guarantee of future results or investment advice. Views expressed may differ from those of the firm as a whole.
| i | The MSCI Emerging Markets Index is a free float-adjusted market capitalization index that is designed to measure equity market performance in the global emerging markets. |
| ii | Synthetic foreign equity securities are a type of derivative issued by a bank or other financial institution designed to replicate the economic exposure of buying an equity security directly in a particular foreign market. |
| iii | The MSCI Emerging Markets Index (Net) is a free float-adjusted market capitalization index that is designed to measure equity market performance in the global emerging markets net of foreign withholding taxes (USD). |
| iv | The Federal Reserve Board (the “Fed”) is responsible for the formulation of U.S. policies designed to promote economic growth, full employment, stable prices and a sustainable pattern of international trade and payments. |
| v | The MSCI World Index is an unmanaged index considered representative of growth stocks of developed countries. |
| vi | Lipper, Inc., a wholly-owned subsidiary of Reuters, provides independent insight on global collective investments. Returns are based on the period ended September 30, 2019, including the reinvestment of all distributions, including returns of capital, if any, calculated among the 825 funds for the six-month period and among the 788 funds for the twelve-month period in the Fund’s Lipper category, and excluding sales charges, if any. |
| | |
| Martin Currie Emerging Markets Fund 2019 Annual Report | | 7 |
Fund at a glance†(unaudited)
Investment breakdown(%) as a percent of total investments
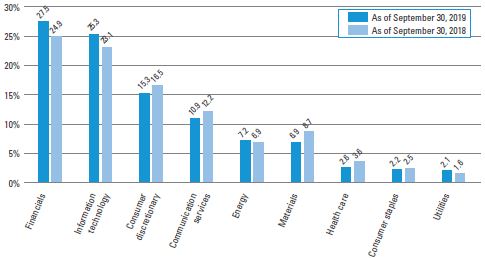
| † | The bar graph above represents the composition of the Fund’s investments as of September 30, 2019 and September 30, 2018. The Fund is actively managed. As a result, the composition of the Fund’s investments is subject to change at any time. |
| | |
| 8 | | Martin Currie Emerging Markets Fund 2019 Annual Report |
Fund expenses(unaudited)
Example
As a shareholder of the Fund, you may incur two types of costs: (1) transaction costs, including front-end and back-end sales charges (loads) on purchase payments; and (2) ongoing costs, including management fees; service and/or distribution (12b-1) fees; and other Fund expenses. This example is intended to help you understand your ongoing costs (in dollars) of investing in the Fund and to compare these costs with the ongoing costs of investing in other mutual funds.
This example is based on an investment of $1,000 invested on April 1, 2019 and held for the six months ended September 30, 2019.
Actual expenses
The table below titled “Based on Actual Total Return” provides information about actual account values and actual expenses. You may use the information provided in this table, together with the amount you invested, to estimate the expenses that you paid over the period. To estimate the expenses you paid on your account, divide your ending account value by $1,000 (for example, an $8,600 ending account value divided by $1,000 = 8.6), then multiply the result by the number under the heading entitled “Expenses Paid During the Period”.
Hypothetical example for comparison purposes
The table below titled “Based on Hypothetical Total Return” provides information about hypothetical account values and hypothetical expenses based on the actual expense ratio and an assumed rate of return of 5.00% per year before expenses, which is not the Fund’s actual return. The hypothetical account values and expenses may not be used to estimate the actual ending account balance or expenses you paid for the period. You may use the information provided in this table to compare the ongoing costs of investing in the Fund and other funds. To do so, compare the 5.00% hypothetical example relating to the Fund with the 5.00% hypothetical examples that appear in the shareholder reports of the other funds.
Please note that the expenses shown in the table below are meant to highlight your ongoing costs only and do not reflect any transactional costs, such as front-end or back-end sales charges (loads). Therefore, the table is useful in comparing ongoing costs only, and will not help you determine the relative total costs of owning different funds. In addition, if these transaction costs were included, your costs would have been higher.
| | | | | | | | | | | | | | | | | | | | | | | | | | | | | | | | | | | | | | | | | | | | | | |
| | | |
| Based on actual total return1 | | | | | | | | | Based on hypothetical total return1 | |
| | | Actual Total Return
Without Sales Charge2 | | | Beginning Account Value | | | Ending Account Value | | | Annualized Expense Ratio | | | Expenses Paid During the Period3 | | | | | | | | Hypothetical Annualized Total Return | | | Beginning Account Value | | | Ending Account Value | | | Annualized
Expense
Ratio | | | Expenses
Paid
During
the
Period3 | |
| Class A | | | -0.08 | % | | $ | 1,000.00 | | | $ | 999.20 | | | | 1.22 | % | | $ | 6.11 | | | | | | | Class A | | | 5.00 | % | | $ | 1,000.00 | | | $ | 1,018.95 | | | | 1.22 | % | | $ | 6.17 | |
| Class C | | | -0.50 | | | | 1,000.00 | | | | 995.00 | | | | 1.96 | | | | 9.80 | | | | | | | Class C | | | 5.00 | | | | 1,000.00 | | | | 1,015.24 | | | | 1.96 | | | | 9.90 | |
| Class FI | | | -0.17 | | | | 1,000.00 | | | | 998.30 | | | | 1.30 | | | | 6.51 | | | | | | | Class FI | | | 5.00 | | | | 1,000.00 | | | | 1,018.55 | | | | 1.30 | | | | 6.58 | |
| Class I | | | 0.00 | | | | 1,000.00 | | | | 1,000.00 | | | | 0.95 | | | | 4.76 | | | | | | | Class I | | | 5.00 | | | | 1,000.00 | | | | 1,020.31 | | | | 0.95 | | | | 4.81 | |
| Class IS | | | 0.00 | | | | 1,000.00 | | | | 1,000.00 | | | | 0.85 | | | | 4.26 | | | | | | | Class IS | | | 5.00 | | | | 1,000.00 | | | | 1,020.81 | | | | 0.85 | | | | 4.31 | |
| | |
| Martin Currie Emerging Markets Fund 2019 Annual Report | | 9 |
Fund expenses(unaudited) (cont’d)
| 1 | For the six months ended September 30, 2019. |
| 2 | Assumes the reinvestment of all distributions, including returns of capital, if any, at net asset value and does not reflect the deduction of the applicable sales charge with respect to Class A shares or the applicable contingent deferred sales charge (“CDSC”) with respect to Class C shares. Total return is not annualized, as it may not be representative of the total return for the year. Performance figures may reflect compensating balance arrangements, fee waivers and/or expense reimbursements. In the absence of compensating balance arrangements, fee waivers and/or expense reimbursements, the total return would have been lower. Past performance is no guarantee of future results. |
| 3 | Expenses (net of compensating balance arrangements, fee waivers and/or expense reimbursements) are equal to each class’ respective annualized expense ratio multiplied by the average account value over the period, multiplied by the number of days in the most recent fiscal half-year (183), then divided by 365. |
| | |
| 10 | | Martin Currie Emerging Markets Fund 2019 Annual Report |
Fund performance(unaudited)
| | | | | | | | | | | | | | | | | | | | |
| Average annual total returns | | | | | | | | | | | | | | | |
| Without sales charges1 | | Class A | | | Class C | | | Class FI | | | Class I | | | Class IS | |
| Twelve Months Ended 9/30/19 | | | 3.68 | % | | | 2.95 | % | | | 3.48 | % | | | 3.85 | % | | | 3.95 | % |
| Inception* through 9/30/19 | | | -2.71 | | | | -3.42 | | | | 4.97 | | | | 5.28 | | | | 5.46 | |
| | | | | |
| With sales charges2 | | Class A | | | Class C | | | Class FI | | | Class I | | | Class IS | |
| Twelve Months Ended 9/30/19 | | | -2.26 | % | | | 1.95 | % | | | 3.48 | % | | | 3.85 | % | | | 3.95 | % |
| Inception* through 9/30/19 | | | -7.39 | | | | -3.42 | | | | 4.97 | | | | 5.28 | | | | 5.46 | |
| | | | |
| Cumulative total returns | | | |
| Without sales charges1 | | | |
| Class A (Inception date of 7/16/18 through 9/30/19) | | | -3.27 | % |
| Class C (Inception date of 7/16/18 through 9/30/19) | | | -4.12 | |
| Class FI (Inception date of 5/29/15 through 9/30/19) | | | 23.43 | |
| Class I (Inception date of 5/29/15 through 9/30/19) | | | 25.04 | |
| Class IS (Inception date of 5/29/15 through 9/30/19) | | | 25.94 | |
All figures represent past performance and are not a guarantee of future results. Investment return and principal value of an investment will fluctuate so that an investor’s shares, when redeemed, may be worth more or less than their original cost. The returns shown do not reflect the deduction of taxes that a shareholder would pay on Fund distributions or the redemption of Fund shares. Performance figures may reflect compensating balance arrangements, fee waivers and/or expense reimbursements. In the absence of compensating balance arrangements, fee waivers and/or expense reimbursements, the total return would have been lower.
| 1 | Assumes the reinvestment of all distributions, including returns of capital, if any, at net asset value and does not reflect the deduction of the applicable sales charge with respect to Class A shares or the applicable contingent deferred sales charge (“CDSC”) with respect to Class C shares. |
| 2 | Assumes the reinvestment of all distributions, including returns of capital, if any, at net asset value. In addition, Class A shares reflect the deduction of the maximum initial sales charge of 5.75% and Class C shares reflect the deduction of a 1.00% CDSC, which applies if shares are redeemed within one year from purchase payment. |
| * | Inception dates for Class A, C, FI, I and IS shares are July 16, 2018, July 16, 2018, May 29, 2015, May 29, 2015 and May 29, 2015, respectively. |
| | |
| Martin Currie Emerging Markets Fund 2019 Annual Report | | 11 |
Fund performance(unaudited) (cont’d)
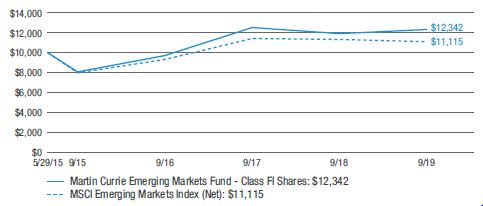
Historical performance
Value of $10,000 invested in
Class FI Shares of Martin Currie Emerging Markets Fund vs. MSCI Emerging Markets Index (Net)† — May 29, 2015 - September 2019
Value of $1,000,000 invested in
Class I and Class IS Shares of Martin Currie Emerging Markets Fund vs. MSCI Emerging Markets Index (Net)† — May 29, 2015 - September 2019
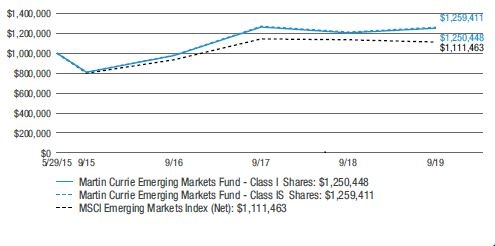
All figures represent past performance and are not a guarantee of future results. Investment return and principal value of an investment will fluctuate so that an investor’s shares, when redeemed, may be worth more or less than their original cost. The returns shown do not reflect the deduction of taxes that a shareholder would pay on Fund distributions or the redemption of Fund shares. Performance figures may reflect compensating balance arrangements, fee waivers and/or expense reimbursements. In the absence of compensating balance arrangements, fee waivers and/or expense reimbursements, the total return would have been lower.
| † | Hypothetical illustration of $10,000 invested in Class FI shares and $1,000,000 invested in Class I and Class IS shares of Martin Currie Emerging Markets Fund on May 29, 2015 (inception date), assuming the reinvestment of |
| | |
| 12 | | Martin Currie Emerging Markets Fund 2019 Annual Report |
all distributions, including returns of capital, if any, at net asset value through September 30, 2019. The hypothetical illustration also assumes a $10,000 or $1,000,000 investment, as applicable, in the MSCI Emerging Markets Index (Net). The MSCI Emerging Markets Index (Net) is a free float adjusted market capitalization index that is designed to measure equity market performance in the global emerging markets. The Index is calculated assuming the minimum possible dividend reinvestment. The index is unmanaged and not subject to the same management and trading expenses as a mutual fund. Please note that an investor cannot invest directly in an index. The performance of the Fund’s other classes may be greater or less than Class FI, I and IS shares’ performance indicated on these charts, depends on whether greater or lesser sales charges and fees were incurred by shareholders investing in the other classes. |
| | |
| Martin Currie Emerging Markets Fund 2019 Annual Report | | 13 |
Schedule of investments
September 30, 2019
Martin Currie Emerging Markets Fund
| | | | | | | | |
| Security | | Shares | | | Value | |
| Common Stocks — 95.1% | | | | | | | | |
| Communication Services — 10.6% | | | | | | | | |
Diversified Telecommunication Services — 1.3% | | | | | | | | |
Telekomunikasi Indonesia Persero Tbk PT | | | 6,818,100 | | | $ | 2,059,613 | (a) |
Interactive Media & Services — 6.4% | | | | | | | | |
Tencent Holdings Ltd. | | | 235,800 | | | | 10,007,280 | (a) |
Internet & Direct Marketing Retail — 2.2% | | | | | | | | |
Naspers Ltd., Class N Shares | | | 23,086 | | | | 3,507,380 | (a) |
Wireless Telecommunication Services — 0.7% | | | | | | | | |
Turkcell Iletisim Hizmetleri AS | | | 464,896 | | | | 1,070,531 | (a) |
Total Communication Services | | | | | | | 16,644,804 | |
| Consumer Discretionary — 14.9% | | | | | | | | |
Auto Components — 1.1% | | | | | | | | |
Minth Group Ltd. | | | 526,000 | | | | 1,784,565 | (a) |
Automobiles — 2.8% | | | | | | | | |
Brilliance China Automotive Holdings Ltd. | | | 1,150,000 | | | | 1,243,602 | (a) |
Maruti Suzuki India Ltd. | | | 32,485 | | | | 3,080,835 | (a) |
Total Automobiles | | | | | | | 4,324,437 | |
Hotels, Restaurants & Leisure — 0.9% | | | | | | | | |
Genting Malaysia Bhd | | | 1,860,200 | | | | 1,349,305 | (a) |
Internet & Direct Marketing Retail — 7.3% | | | | | | | | |
Alibaba Group Holding Ltd., ADR | | | 58,746 | | | | 9,824,094 | * |
Prosus NV | | | 23,086 | | | | 1,694,700 | * |
Total Internet & Direct Marketing Retail | | | | | | | 11,518,794 | |
Textiles, Apparel & Luxury Goods — 2.8% | | | | | | | | |
Titan Co. Ltd. | | | 246,748 | | | | 4,433,706 | (a) |
Total Consumer Discretionary | | | | | | | 23,410,807 | |
| Consumer Staples — 2.1% | | | | | | | | |
Food & Staples Retailing — 0.8% | | | | | | | | |
Robinsons Retail Holdings Inc. | | | 849,265 | | | | 1,289,206 | (a) |
Personal Products — 1.3% | | | | | | | | |
LG Household & Health Care Ltd. | | | 1,899 | | | | 2,078,506 | (a) |
Total Consumer Staples | | | | | | | 3,367,712 | |
| Energy — 6.9% | | | | | | | | |
Oil, Gas & Consumable Fuels — 6.9% | | | | | | | | |
CNOOC Ltd. | | | 2,087,000 | | | | 3,206,451 | (a) |
Cosan Ltd., Class A Shares | | | 250,346 | | | | 3,730,155 | * |
Lukoil PJSC, ADR | | | 48,644 | | | | 4,016,840 | (a) |
Total Energy | | | | | | | 10,953,446 | |
See Notes to Financial Statements.
| | |
| 14 | | Martin Currie Emerging Markets Fund 2019 Annual Report |
Martin Currie Emerging Markets Fund
| | | | | | | | |
| Security | | Shares | | | Value | |
| Financials — 24.9% | | | | | | | | |
Banks — 18.1% | | | | | | | | |
Bank Rakyat Indonesia Persero Tbk PT | | | 10,834,600 | | | $ | 3,146,444 | (a) |
Credicorp Ltd. | | | 18,790 | | | | 3,916,588 | |
Grupo Financiero Banorte SAB de CV, Class O Shares | | | 405,524 | | | | 2,185,646 | |
HDFC Bank Ltd., ADR | | | 55,552 | | | | 3,169,242 | |
ICICI Bank Ltd., ADR | | | 186,880 | | | | 2,276,198 | |
Industrial and Commercial Bank of China Ltd., Class H Shares | | | 6,816,000 | | | | 4,551,284 | (a) |
Kotak Mahindra Bank Ltd. | | | 104,469 | | | | 2,430,058 | (a) |
OTP Bank Nyrt | | | 107,852 | | | | 4,493,595 | (a) |
Sberbank of Russia PJSC, ADR | | | 169,877 | | | | 2,407,180 | (a) |
Total Banks | | | | | | | 28,576,235 | |
Insurance — 6.8% | | | | | | | | |
AIA Group Ltd. | | | 405,800 | | | | 3,807,686 | (a) |
IRB Brasil Resseguros S/A | | | 210,600 | | | | 1,900,238 | |
Ping An Insurance Group Co. of China Ltd., Class H Shares | | | 432,500 | | | | 5,005,196 | (a) |
Total Insurance | | | | | | | 10,713,120 | |
Total Financials | | | | | | | 39,289,355 | |
| Health Care — 2.5% | | | | | | | | |
Health Care Equipment & Supplies — 0.7% | | | | | | | | |
St. Shine Optical Co. Ltd. | | | 80,000 | | | | 1,144,159 | (a) |
Health Care Providers & Services — 0.9% | | | | | | | | |
Odontoprev SA | | | 344,500 | | | | 1,346,510 | |
Pharmaceuticals — 0.9% | | | | | | | | |
Shanghai Fosun Pharmaceutical Group Co. Ltd., Class H Shares | | | 554,000 | | | | 1,497,706 | (a) |
Total Health Care | | | | | | | 3,988,375 | |
Information Technology — 24.5% | | | | | | | | |
Electronic Equipment, Instruments & Components — 4.4% | | | | | | | | |
Delta Electronics Inc. | | | 302,367 | | | | 1,296,056 | (a) |
Largan Precision Co. Ltd. | | | 11,000 | | | | 1,589,898 | (a) |
Samsung SDI Co. Ltd. | | | 8,989 | | | | 1,676,644 | (a) |
Sunny Optical Technology Group Co. Ltd. | | | 155,700 | | | | 2,322,515 | (a) |
Total Electronic Equipment, Instruments & Components | | | | | | | 6,885,113 | |
IT Services — 2.0% | | | | | | | | |
EPAM Systems Inc. | | | 17,178 | | | | 3,131,893 | * |
Semiconductors & Semiconductor Equipment — 10.4% | | | | | | | | |
Globalwafers Co. Ltd. | | | 125,000 | | | | 1,273,349 | (a) |
SK Hynix Inc. | | | 49,016 | | | | 3,370,693 | (a) |
Taiwan Semiconductor Manufacturing Co. Ltd., ADR | | | 253,139 | | | | 11,765,901 | |
Total Semiconductors & Semiconductor Equipment | | | | | | | 16,409,943 | |
See Notes to Financial Statements.
| | |
| Martin Currie Emerging Markets Fund 2019 Annual Report | | 15 |
Schedule of investments (cont’d)
September 30, 2019
Martin Currie Emerging Markets Fund
| | | | | | | | | | | | |
| Security | | | | | Shares | | | Value | |
Technology Hardware, Storage & Peripherals — 7.7% | | | | | | | | | | | | |
Samsung Electronics Co. Ltd. | | | | | | | 298,019 | | | $ | 12,159,155 | (a) |
Total Information Technology | | | | | | | | | | | 38,586,104 | |
| Materials — 6.7% | | | | | | | | | | | | |
Chemicals — 4.3% | | | | | | | | | | | | |
Asian Paints Ltd. | | | | | | | 95,100 | | | | 2,363,688 | (a) |
LG Chem Ltd. | | | | | | | 13,078 | | | | 3,262,267 | (a) |
Orbia Advance Corp. SAB de CV | | | | | | | 605,925 | | | | 1,187,655 | |
Total Chemicals | | | | | | | | | | | 6,813,610 | |
Construction Materials — 1.2% | | | | | | | | | | | | |
UltraTech Cement Ltd. | | | | | | | 31,033 | | | | 1,902,645 | (a) |
Metals & Mining — 1.2% | | | | | | | | | | | | |
Southern Copper Corp. | | | | | | | 53,317 | | | | 1,819,709 | |
Total Materials | | | | | | | | | | | 10,535,964 | |
| Utilities — 2.0% | | | | | | | | | | | | |
Gas Utilities — 2.0% | | | | | | | | | | | | |
China Gas Holdings Ltd. | | | | | | | 821,600 | | | | 3,170,162 | (a) |
Total Common Stocks (Cost — $145,764,478) | | | | | | | | | | | 149,946,729 | |
| | | Rate | | | | | | | |
| Preferred Stocks — 1.8% | | | | | | | | | | | | |
| Financials — 1.8% | | | | | | | | | | | | |
Banks — 1.8% | | | | | | | | | | | | |
Itau Unibanco Holding SA (Cost — $2,862,387) | | | 4.930 | % | | | 330,287 | | | | 2,787,799 | |
Total Investments — 96.9% (Cost — $148,626,865) | | | | | | | | | | | 152,734,528 | |
Other Assets in Excess of Liabilities — 3.1% | | | | | | | | | | | 4,872,649 | |
Total Net Assets — 100.0% | | | | | | | | | | $ | 157,607,177 | |
| * | Non-income producing security. |
| (a) | Security is valued in good faith in accordance with procedures approved by the Board of Trustees (Note 1). |
| | |
Abbreviations used in this schedule: |
| |
| ADR | | — American Depositary Receipts |
| |
| PJSC | | — Private Joint Stock Company |
See Notes to Financial Statements.
| | |
| 16 | | Martin Currie Emerging Markets Fund 2019 Annual Report |
Martin Currie Emerging Markets Fund
| | | | |
| Summary of Investments by Country**(unaudited) | | | |
| China | | | 26.9 | % |
| South Korea | | | 14.8 | |
| India | | | 12.9 | |
| Taiwan | | | 11.2 | |
| Brazil | | | 6.4 | |
| Hong Kong | | | 4.6 | |
| Russia | | | 4.2 | |
| Peru | | | 3.8 | |
| Indonesia | | | 3.4 | |
| Hungary | | | 2.9 | |
| South Africa | | | 2.3 | |
| Mexico | | | 2.2 | |
| United States | | | 2.0 | |
| Malaysia | | | 0.9 | |
| Philippines | | | 0.8 | |
| Turkey | | | 0.7 | |
| | | | 100.0 | % |
| ** | As a percentage of total investments. Please note that the Fund holdings are as of September 30, 2019 and are subject to change. |
See Notes to Financial Statements.
| | |
| Martin Currie Emerging Markets Fund 2019 Annual Report | | 17 |
Statement of assets and liabilities
September 30, 2019
| | | | |
| |
| Assets: | | | | |
Investments, at value (Cost — $148,626,865) | | $ | 152,734,528 | |
Foreign currency, at value (Cost — $35,926) | | | 35,932 | |
Cash | | | 4,628,466 | |
Dividends receivable | | | 288,594 | |
Receivable for Fund shares sold | | | 28,981 | |
Prepaid expenses | | | 36,962 | |
Total Assets | | | 157,753,463 | |
| |
| Liabilities: | | | | |
Investment management fee payable | | | 77,885 | |
Payable for Fund shares repurchased | | | 6,005 | |
Trustees’ fees payable | | | 3,458 | |
Service and/or distribution fees payable | | | 236 | |
Accrued expenses | | | 58,702 | |
Total Liabilities | | | 146,286 | |
| Total Net Assets | | $ | 157,607,177 | |
| |
| Net Assets: | | | | |
Par value (Note 7) | | $ | 130 | |
Paid-in capital in excess of par value | | | 155,083,870 | |
Total distributable earnings (loss) | | | 2,523,177 | |
| Total Net Assets | | $ | 157,607,177 | |
See Notes to Financial Statements.
| | |
| 18 | | Martin Currie Emerging Markets Fund 2019 Annual Report |
| | | | |
| |
| Net Assets: | | | | |
Class A | | | $200,520 | |
Class C | | | $135,943 | |
Class FI | | | $416,416 | |
Class I | | | $14,206,631 | |
Class IS | | | $142,647,667 | |
| |
| Shares Outstanding: | | | | |
Class A | | | 16,683 | |
Class C | | | 11,368 | |
Class FI | | | 34,639 | |
Class I | | | 1,175,038 | |
Class IS | | | 11,765,417 | |
| |
| Net Asset Value: | | | | |
Class A (and redemption price) | | | $12.02 | |
Class C* | | | $11.96 | |
Class FI (and redemption price) | | | $12.02 | |
Class I (and redemption price) | | | $12.09 | |
Class IS (and redemption price) | | | $12.12 | |
| Maximum Public Offering Price Per Share: | | | | |
Class A (based on maximum initial sales charge of 5.75%) | | | $12.75 | |
| * | Redemption price per share is NAV of Class C shares reduced by a 1.00% CDSC if shares are redeemed within one year from purchase payment (Note 2). |
See Notes to Financial Statements.
| | |
| Martin Currie Emerging Markets Fund 2019 Annual Report | | 19 |
Statement of operations
For the Year Ended September 30, 2019
| | | | |
| |
| Investment Income: | | | | |
Dividends | | $ | 5,828,843 | |
Less: Foreign taxes withheld | | | (406,849) | |
Total Investment Income | | | 5,421,994 | |
| |
| Expenses: | | | | |
Investment management fee (Note 2) | | | 1,083,064 | |
Registration fees | | | 117,078 | |
Fund accounting fees | | | 79,295 | |
Audit and tax fees | | | 58,361 | |
Legal fees | | | 34,259 | |
Trustees’ fees | | | 21,855 | |
Transfer agent fees (Note 5) | | | 18,620 | |
Shareholder reports | | | 10,689 | |
Fees recaptured by investment manager (Note 2) | | | 4,322 | |
Insurance | | | 2,412 | |
Service and/or distribution fees (Notes 2 and 5) | | | 2,379 | |
Interest expense | | | 152 | |
Custody fees | | | (22,887) | |
Miscellaneous expenses | | | 5,200 | |
Total Expenses | | | 1,414,799 | |
Less: Fee waivers and/or expense reimbursements (Notes 2 and 5) | | | (175,029) | |
Net Expenses | | | 1,239,770 | |
| Net Investment Income | | | 4,182,224 | |
| |
| Realized and Unrealized Gain (Loss) on Investments and Foreign Currency Transactions (Notes 1 and 3): | | | | |
Net Realized Loss From: | | | | |
Investment transactions | | | (4,128,007) | |
Foreign currency transactions | | | (54,140) | |
Net Realized Loss | | | (4,182,147) | |
Change in Net Unrealized Appreciation (Depreciation) From: | | | | |
Investments | | | 8,194,634 | |
Foreign currencies | | | (229) | |
Change in Net Unrealized Appreciation (Depreciation) | | | 8,194,405 | |
| Net Gain on Investments and Foreign Currency Transactions | | | 4,012,258 | |
| Increase in Net Assets From Operations | | $ | 8,194,482 | |
See Notes to Financial Statements.
| | |
| 20 | | Martin Currie Emerging Markets Fund 2019 Annual Report |
Statements of changes in net assets
| | | | | | | | |
| For the Years Ended September 30, | | 2019 | | | 2018 | |
| | |
| Operations: | | | | | | | | |
Net investment income | | $ | 4,182,224 | | | $ | 1,133,289 | |
Net realized loss | | | (4,182,147) | | | | (1,002,908) | |
Change in net unrealized appreciation (depreciation) | | | 8,194,405 | | | | (4,370,628) | |
Increase (Decrease) in Net Assets From Operations | | | 8,194,482 | | | | (4,240,247) | |
| | |
| Distributions to Shareholders From (Notes 1 and 6): | | | | | | | | |
Total distributable earnings (a) | | | (1,400,007) | | | | (190,009) | |
Decrease in Net Assets From Distributions to Shareholders | | | (1,400,007) | | | | (190,009) | |
| | |
| Fund Share Transactions (Note 7): | | | | | | | | |
Net proceeds from sale of shares | | | 53,879,950 | | | | 24,303,300 | |
Reinvestment of distributions | | | 1,399,550 | | | | 190,009 | |
Cost of shares repurchased | | | (19,757,599) | | | | (9,195,413) | |
Increase in Net Assets From Fund Share Transactions | | | 35,521,901 | | | | 15,297,896 | |
Increase in Net Assets | | | 42,316,376 | | | | 10,867,640 | |
| | |
| Net Assets: | | | | | | | | |
Beginning of year | | | 115,290,801 | | | | 104,423,161 | |
End of year (b) | | $ | 157,607,177 | | | $ | 115,290,801 | |
| (a) | Distributions from net investment income and from realized gains are no longer required to be separately disclosed (Note 9). For the year ended September 30, 2018, distributions from net investment income were $190,009. |
| (b) | Parenthetical disclosure of undistributed net investment income is no longer required (Note 9). For the year ended September 30, 2018, end of year net assets included undistributed net investment income of $1,062,533. |
See Notes to Financial Statements.
| | |
| Martin Currie Emerging Markets Fund 2019 Annual Report | | 21 |
Financial highlights
| | | | | | | | |
For a share of each class of beneficial interest outstanding throughout each year ended September 30,
unless otherwise noted: | |
| Class A Shares1 | | 2019 | | | 20182 | |
| | |
| Net asset value, beginning of year | | | $11.70 | | | | $12.54 | |
| | |
Income (loss) from operations: | | | | | | | | |
Net investment income | | | 0.36 | | | | 0.01 | |
Net realized and unrealized gain (loss) | | | 0.06 | | | | (0.85) | |
Total income (loss) from operations | | | 0.42 | | | | (0.84) | |
| | |
| Less distributions from: | | | | | | | | |
Net investment income | | | (0.10) | | | | — | |
Total distributions | | | (0.10) | | | | — | |
| | |
| Net asset value, end of year | | | $12.02 | | | | $11.70 | |
Total return3 | | | 3.68 | % | | | (6.70) | % |
| | |
| Net assets, end of year (000s) | | | $201 | | | | $47 | |
| | |
| Ratios to average net assets: | | | | | | | | |
Gross expenses | | | 1.32 | %4 | | | 1.49 | %5 |
Net expenses6,7 | | | 1.18 | 4 | | | 1.15 | 5 |
Net investment income | | | 3.08 | | | | 0.25 | 5 |
| | |
| Portfolio turnover rate | | | 18 | % | | | 23 | %8 |
| 1 | Per share amounts have been calculated using the average shares method. |
| 2 | For the period July 16, 2018 (inception date) to September 30, 2018. |
| 3 | Performance figures, exclusive of sales charges, may reflect compensating balance arrangements, fee waivers and/or expense reimbursements. In the absence of compensating balance arrangements, fee waivers and/or expense reimbursements, the total return would have been lower. Past performance is no guarantee of future results. Total returns for periods of less than one year are not annualized. |
| 4 | Reflects recapture of expenses waived/reimbursed from prior fiscal years. |
| 6 | Reflects fee waivers and/or expense reimbursements. |
| 7 | As a result of expense limitation arrangements the ratio of total annual fund operating expenses, other than interest, brokerage commissions, dividend expense on short sales, taxes, extraordinary expenses and acquired fund fees and expenses, to average net assets of Class A shares did not exceed 1.30%. This expense limitation arrangement cannot be terminated prior to December 31, 2020 without the Board of Trustees’ consent. |
| 8 | For the year ended September 30, 2018. |
See Notes to Financial Statements.
| | |
| 22 | | Martin Currie Emerging Markets Fund 2019 Annual Report |
| | | | | | | | |
For a share of each class of beneficial interest outstanding throughout each year ended September 30, unless otherwise noted: | |
| Class C Shares1 | | 2019 | | | 20182 | |
| | |
| Net asset value, beginning of year | | | $11.68 | | | | $12.54 | |
| | |
| Income (loss) from operations: | | | | | | | | |
Net investment income (loss) | | | 0.30 | | | | (0.01) | |
Net realized and unrealized gain (loss) | | | 0.04 | | | | (0.85) | |
Total income (loss) from operations | | | 0.34 | | | | (0.86) | |
| | |
| Less distributions from: | | | | | | | | |
Net investment income | | | (0.06) | | | | — | |
Total distributions | | | (0.06) | | | | — | |
| | |
| Net asset value, end of year | | | $11.96 | | | | $11.68 | |
Total return3 | | | 2.95 | % | | | (6.86) | % |
| | |
| Net assets, end of year (000s) | | | $136 | | | | $47 | |
| | |
| Ratios to average net assets: | | | | | | | | |
Gross expenses | | | 2.07 | %4 | | | 2.23 | %5 |
Net expenses6,7 | | | 1.934 | | | | 1.90 | 5 |
Net investment income (loss) | | | 2.55 | | | | (0.49) | 5 |
| | |
| Portfolio turnover rate | | | 18 | % | | | 23 | %8 |
| 1 | Per share amounts have been calculated using the average shares method. |
| 2 | For the period July 16, 2018 (inception date) to September 30, 2018. |
| 3 | Performance figures, exclusive of CDSC, may reflect compensating balance arrangements, fee waivers and/or expense reimbursements. In the absence of compensating balance arrangements, fee waivers and/or expense reimbursements, the total return would have been lower. Past performance is no guarantee of future results. Total returns for periods of less than one year are not annualized. |
| 4 | Reflects recapture of expenses waived/reimbursed from prior fiscal years. |
| 6 | Reflects fee waivers and/or expense reimbursements. |
| 7 | As a result of expense limitation arrangements the ratio of total annual fund operating expenses, other than interest, brokerage commissions, dividend expense on short sales, taxes, extraordinary expenses and acquired fund fees and expenses, to average net assets of Class C shares did not exceed 2.05%. This expense limitation arrangement cannot be terminated prior to December 31, 2020 without the Board of Trustees’ consent. |
| 8 | For the year ended September 30, 2018. |
See Notes to Financial Statements.
| | |
| Martin Currie Emerging Markets Fund 2019 Annual Report | | 23 |
Financial highlights (cont’d)
| | | | | | | | | | | | | | | | | | | | |
For a share of each class of beneficial interest outstanding throughout each year ended September 30, unless otherwise noted: | |
| Class FI Shares1 | | 2019 | | | 2018 | | | 2017 | | | 2016 | | | 20152 | |
| | | | | |
| Net asset value, beginning of year | | | $11.70 | | | | $12.30 | | | | $9.70 | | | | $8.09 | | | | $10.00 | |
| | | | | |
| Income (loss) from operations: | | | | | | | | | | | | | | | | | | | | |
Net investment income | | | 0.27 | | | | 0.10 | | | | 0.05 | | | | 0.07 | | | | 0.07 | |
Net realized and unrealized gain (loss) | | | 0.13 | | | | (0.70) | | | | 2.69 | | | | 1.57 | | | | (1.98) | |
Total income (loss) from operations | | | 0.40 | | | | (0.60) | | | | 2.74 | | | | 1.64 | | | | (1.91) | |
| | | | | |
| Less distributions from: | | | | | | | | | | | | | | | | | | | | |
Net investment income | | | (0.08) | | | | (0.00) | 3 | | | (0.14) | | | | (0.03) | | | | — | |
Total distributions | | | (0.08) | | | | (0.00) | 3 | | | (0.14) | | | | (0.03) | | | | — | |
| | | | | |
| Net asset value, end of year | | | $12.02 | | | | $11.70 | | | | $12.30 | | | | $9.70 | | | | $8.09 | |
Total return4 | | | 3.48 | % | | | (4.87) | % | | | 28.81 | % | | | 20.32 | % | | | (19.10) | % |
| | | | | |
| Net assets, end of year (000s) | | | $416 | | | | $363 | | | | $26 | | | | $10 | | | | $8 | |
| | | | | |
| Ratios to average net assets: | | | | | | | | | | | | | | | | | | | | |
Gross expenses | | | 1.43 | %5 | | | 1.50 | %5 | | | 6.11 | %5 | | | 14.96 | % | | | 19.47 | %6 |
Net expenses7,8 | | | 1.30 | 5 | | | 1.30 | 5 | | | 1.44 | 5 | | | 1.31 | | | | 1.41 | 6 |
Net investment income | | | 2.35 | | | | 0.79 | | | | 0.46 | | | | 0.76 | | | | 2.25 | 6 |
| | | | | |
| Portfolio turnover rate | | | 18 | % | | | 23 | % | | | 7 | % | | | 28 | % | | | 23 | % |
| 1 | Per share amounts have been calculated using the average shares method. |
| 2 | For the period May 29, 2015 (inception date) to September 30, 2015. |
| 3 | Amount represents less than $0.005 per share. |
| 4 | Performance figures may reflect compensating balance arrangements, fee waivers and/or expense reimbursements. In the absence of compensating balance arrangements, fee waivers and/or expense reimbursements, the total return would have been lower. Past performance is no guarantee of future results. Total returns for periods of less than one year are not annualized. |
| 5 | Reflects recapture of expenses waived/reimbursed from prior fiscal years. |
| 7 | Reflects fee waivers and/or expense reimbursements. |
| 8 | As a result of an expense limitation arrangement, effective August 3, 2017, the ratio of total annual fund operating expenses, other than interest, brokerage commissions, dividend expense on short sales, taxes, extraordinary expenses and acquired fund fees and expenses, to average net assets of Class FI shares did not exceed 1.30%. This expense limitation arrangement cannot be terminated prior to December 31, 2020 without the Board of Trustees’ consent. Prior to August 3, 2017, as a result of an expense limitation arrangement, the ratio of total annual fund operating expenses to average net assets of Class FI shares did not exceed 1.50%. |
See Notes to Financial Statements.
| | |
| 24 | | Martin Currie Emerging Markets Fund 2019 Annual Report |
| | | | | | | | | | | | | | | | | | | | |
For a share of each class of beneficial interest outstanding throughout each year ended September 30, unless otherwise noted: | |
| Class I Shares1 | | 2019 | | | 2018 | | | 2017 | | | 2016 | | | 20152 | |
| | | | | |
| Net asset value, beginning of year | | | $11.76 | | | | $12.33 | | | | $9.71 | | | | $8.09 | | | | $10.00 | |
| | | | | |
| Income (loss) from operations: | | | | | | | | | | | | | | | | | | | | |
Net investment income | | | 0.45 | | | | 0.14 | | | | 0.11 | | | | 0.09 | | | | 0.06 | |
Net realized and unrealized gain (loss) | | | (0.01) | 3 | | | (0.71) | | | | 2.67 | | | | 1.58 | | | | (1.97) | |
Total income (loss) from operations | | | 0.44 | | | | (0.57) | | | | 2.78 | | | | 1.67 | | | | (1.91) | |
| | | | | |
| Less distributions from: | | | | | | | | | | | | | | | | | | | | |
Net investment income | | | (0.11) | | | | (0.00) | 4 | | | (0.16) | | | | (0.05) | | | | — | |
Total distributions | | | (0.11) | | | | (0.00) | 4 | | | (0.16) | | | | (0.05) | | | | — | |
| | | | | |
| Net asset value, end of year | | | $12.09 | | | | $11.76 | | | | $12.33 | | | | $9.71 | | | | $8.09 | |
Total return5 | | | 3.85 | % | | | (4.60) | % | | | 29.25 | % | | | 20.71 | % | | | (19.10) | % |
| | | | | |
| Net assets, end of year (000s) | | | $14,207 | | | | $4,341 | | | | $91 | | | | $48 | | | | $14 | |
| | | | | |
| Ratios to average net assets: | | | | | | | | | | | | | | | | | | | | |
Gross expenses | | | 1.14 | %6 | | | 1.35 | % | | | 6.11 | % | | | 14.08 | % | | | 18.64 | %7 |
Net expenses8,9 | | | 0.95 | 6 | | | 0.95 | | | | 1.11 | | | | 1.05 | | | | 1.15 | 7 |
Net investment income | | | 3.86 | | | | 1.17 | | | | 1.02 | | | | 1.02 | | | | 2.07 | 7 |
| | | | | |
| Portfolio turnover rate | | | 18 | % | | | 23 | % | | | 7 | % | | | 28 | % | | | 23 | % |
| 1 | Per share amounts have been calculated using the average shares method. |
| 2 | For the period May 29, 2015 (inception date) to September 30, 2015. |
| 3 | Calculation of the net gain per share (both realized and unrealized) does not correlate to the aggregate realized and unrealized losses presented in the Statement of Operations due to the timing of the of the sales and repurchases of Fund shares in relation to fluctuating market values of the investments of the Fund. |
| 4 | Amount represents less than $0.005 per share. |
| 5 | Performance figures may reflect compensating balance arrangements, fee waivers and/or expense reimbursements. In the absence of compensating balance arrangements, fee waivers and/or expense reimbursements, the total return would have been lower. Past performance is no guarantee of future results. Total returns for periods of less than one year are not annualized. |
| 6 | Reflects recapture of expenses waived/reimbursed from prior fiscal years. |
| 8 | Reflects fee waivers and/or expense reimbursements. |
| 9 | As a result of an expense limitation arrangement, effective August 3, 2017, the ratio of total annual fund operating expenses, other than interest, brokerage commissions, dividend expense on short sales, taxes, extraordinary expenses and acquired fund fees and expenses, to average net assets of Class I shares did not exceed 0.95%. This expense limitation arrangement cannot be terminated prior to December 31, 2020 without the Board of Trustees’ consent. Prior to August 3, 2017, as a result of an expense limitation arrangement, the ratio of total annual fund operating expenses to average net assets of Class I shares did not exceed 1.15%. |
See Notes to Financial Statements.
| | |
| Martin Currie Emerging Markets Fund 2019 Annual Report | | 25 |
Financial highlights (cont’d)
| | | | | | | | | | | | | | | | | | | | |
For a share of each class of beneficial interest outstanding throughout each year ended September 30, unless otherwise noted: | |
| Class IS Shares1 | | 2019 | | | 2018 | | | 2017 | | | 2016 | | | 20152 | |
| | | | | |
| Net asset value, beginning of year | | | $11.78 | | | | $12.36 | | | | $9.74 | | | | $8.10 | | | | $10.00 | |
| | | | | |
| Income (loss) from operations: | | | | | | | | | | | | | | | | | | | | |
Net investment income | | | 0.33 | | | | 0.14 | | | | 0.20 | | | | 0.11 | | | | 0.08 | |
Net realized and unrealized gain (loss) | | | 0.12 | | | | (0.70) | | | | 2.60 | | | | 1.58 | | | | (1.98) | |
Total income (loss) from operations | | | 0.45 | | | | (0.56) | | | | 2.80 | | | | 1.69 | | | | (1.90) | |
| | | | | |
| Less distributions from: | | | | | | | | | | | | | | | | | | | | |
Net investment income | | | (0.11) | | | | (0.02) | | | | (0.18) | | | | (0.05) | | | | — | |
Total distributions | | | (0.11) | | | | (0.02) | | | | (0.18) | | | | (0.05) | | | | — | |
| | | | | |
| Net asset value, end of year | | | $12.12 | | | | $11.78 | | | | $12.36 | | | | $9.74 | | | | $8.10 | |
Total return3 | | | 3.95 | % | | | (4.60) | % | | | 29.61 | % | | | 20.97 | % | | | (19.00) | % |
| | | | | |
| Net assets, end of year (000s) | | | $142,648 | | | | $110,494 | | | | $104,306 | | | | $2,920 | | | | $2,413 | |
| | | | | |
| Ratios to average net assets: | | | | | | | | | | | | | | | | | | | | |
Gross expenses | | | 0.97 | %4 | | | 1.08 | %4 | | | 2.88 | %4 | | | 14.42 | % | | | 19.11 | %5 |
Net expenses6,7 | | | 0.85 | 4 | | | 0.85 | 4 | | | 0.00 | 4 | | | 0.76 | | | | 1.05 | 5 |
Net investment income | | | 2.84 | | | | 1.06 | | | | 1.69 | | | | 1.31 | | | | 2.61 | 5 |
| | | | | |
| Portfolio turnover rate | | | 18 | % | | | 23 | % | | | 7 | % | | | 28 | % | | | 23 | % |
| 1 | Per share amounts have been calculated using the average shares method. |
| 2 | For the period May 29, 2015 (inception date) to September 30, 2015. |
| 3 | Performance figures may reflect compensating balance arrangements, fee waivers and/or expense reimbursements. In the absence of compensating balance arrangements, fee waivers and/or expense reimbursements, the total return would have been lower. Past performance is no guarantee of future results. Total returns for periods of less than one year are not annualized. |
| 4 | Reflects recapture of expenses waived/reimbursed from prior fiscal years. |
| 6 | Reflects fee waivers and/or expense reimbursements. |
| 7 | As a result of an expense limitation arrangement, effective August 3, 2017, the ratio of total annual fund operating expenses, other than interest, brokerage commissions, dividend expense on short sales, taxes, extraordinary expenses and acquired fund fees and expenses, to average net assets of Class IS shares did not exceed 0.85%. In addition, the ratio of total annual fund operating expenses for Class IS shares did not exceed the ratio of total annual fund operating expenses for Class I shares. These expense limitation arrangements cannot be terminated prior to December 31, 2020 without the Board of Trustees’ consent. Prior to August 3, 2017, as a result of an expense limitation arrangement, the ratio of total annual fund operating expenses to average net assets of Class IS shares did not exceed 1.05%. In addition, the ratio of total annual fund operating expenses for Class IS shares did not exceed the ratio of total annual fund operating expenses for Class I shares. |
See Notes to Financial Statements.
| | |
| 26 | | Martin Currie Emerging Markets Fund 2019 Annual Report |
Notes to financial statements
1. Organization and significant accounting policies
Martin Currie Emerging Markets Fund (the “Fund”) is a separate non-diversified investment series of Legg Mason Global Asset Management Trust (the “Trust”). The Trust, a Maryland statutory trust, is registered under the Investment Company Act of 1940, as amended (the “1940 Act”), as an open-end management investment company.
Effective March 8, 2019, the Fund’s classification changed from diversified to non-diversified, which means it may invest a larger percentage of its assets in a smaller number of issuers than a diversified fund. The Fund may invest in companies domiciled in any country that the subadviser believes to be appropriate to the Fund’s investment objective. Subject to the Fund’s 80% investment policy, the Fund may invest a substantial amount of assets (i.e. more than 25%) in issuers located in a single country or a limited number of countries, but will always be invested in or have exposure to no less than three different emerging market countries. The Fund may invest in securities denominated in foreign currencies or in U.S. dollars.
The following are significant accounting policies consistently followed by the Fund and are in conformity with U.S. generally accepted accounting principles (“GAAP”). Estimates and assumptions are required to be made regarding assets, liabilities and changes in net assets resulting from operations when financial statements are prepared. Changes in the economic environment, financial markets and any other parameters used in determining these estimates could cause actual results to differ. Subsequent events have been evaluated through the date the financial statements were issued.
(a) Investment valuation. Equity securities for which market quotations are available are valued at the last reported sales price or official closing price on the primary market or exchange on which they trade. The valuations for fixed income securities (which may include, but are not limited to, corporate, government, municipal, mortgage-backed, collateralized mortgage obligations and asset-backed securities) and certain derivative instruments are typically the prices supplied by independent third party pricing services, which may use market prices or broker/dealer quotations or a variety of valuation techniques and methodologies. The independent third party pricing services use inputs that are observable such as issuer details, interest rates, yield curves, prepayment speeds, credit risks/spreads, default rates and quoted prices for similar securities. Investments in open-end funds are valued at the closing net asset value per share of each fund on the day of valuation. When the Fund holds securities or other assets that are denominated in a foreign currency, the Fund will normally use the currency exchange rates as of 4:00 p.m. (Eastern Time). If independent third party pricing services are unable to supply prices for a portfolio investment, or if the prices supplied are deemed by the manager to be unreliable, the market price may be determined by the manager using quotations from one or more broker/dealers or at the transaction price if the security has recently been purchased and no value has yet been obtained from a pricing service or pricing broker. When reliable prices are not readily available, such as when the value of a security has been significantly affected by events after
| | |
| Martin Currie Emerging Markets Fund 2019 Annual Report | | 27 |
Notes to financial statements (cont’d)
the close of the exchange or market on which the security is principally traded, but before the Fund calculates its net asset value, the Fund values these securities as determined in accordance with procedures approved by the Fund’s Board of Trustees.
The Board of Trustees is responsible for the valuation process and has delegated the supervision of the daily valuation process to the Legg Mason North Atlantic Fund Valuation Committee (the “Valuation Committee”). The Valuation Committee, pursuant to the policies adopted by the Board of Trustees, is responsible for making fair value determinations, evaluating the effectiveness of the Fund’s pricing policies, and reporting to the Board of Trustees. When determining the reliability of third party pricing information for investments owned by the Fund, the Valuation Committee, among other things, conducts due diligence reviews of pricing vendors, monitors the daily change in prices and reviews transactions among market participants.
The Valuation Committee will consider pricing methodologies it deems relevant and appropriate when making fair value determinations. Examples of possible methodologies include, but are not limited to, multiple of earnings; discount from market of a similar freely traded security; discounted cash-flow analysis; book value or a multiple thereof; risk premium/yield analysis; yield to maturity; and/or fundamental investment analysis. The Valuation Committee will also consider factors it deems relevant and appropriate in light of the facts and circumstances. Examples of possible factors include, but are not limited to, the type of security; the issuer’s financial statements; the purchase price of the security; the discount from market value of unrestricted securities of the same class at the time of purchase; analysts’ research and observations from financial institutions; information regarding any transactions or offers with respect to the security; the existence of merger proposals or tender offers affecting the security; the price and extent of public trading in similar securities of the issuer or comparable companies; and the existence of a shelf registration for restricted securities.
For each portfolio security that has been fair valued pursuant to the policies adopted by the Board of Trustees, the fair value price is compared against the last available and next available market quotations. The Valuation Committee reviews the results of such back testing monthly and fair valuation occurrences are reported to the Board of Trustees quarterly.
The Fund uses valuation techniques to measure fair value that are consistent with the market approach and/or income approach, depending on the type of security and the particular circumstance. The market approach uses prices and other relevant information generated by market transactions involving identical or comparable securities. The income approach uses valuation techniques to discount estimated future cash flows to present value.
| | |
| 28 | | Martin Currie Emerging Markets Fund 2019 Annual Report |
GAAP establishes a disclosure hierarchy that categorizes the inputs to valuation techniques used to value assets and liabilities at measurement date. These inputs are summarized in the three broad levels listed below:
| • | | Level 1 — quoted prices in active markets for identical investments |
| • | | Level 2 — other significant observable inputs (including quoted prices for similar investments, interest rates, prepayment speeds, credit risk, etc.) |
| • | | Level 3 — significant unobservable inputs (including the Fund’s own assumptions in determining the fair value of investments) |
The inputs or methodologies used to value securities are not necessarily an indication of the risk associated with investing in those securities.
The following is a summary of the inputs used in valuing the Fund’s assets carried at fair value:
| | | | | | | | | | | | | | | | |
| ASSETS | |
| Description | | Quoted Prices (Level 1) | | | Other Significant Observable Inputs (Level 2) | | | Significant
Unobservable
Inputs (Level 3) | | | Total | |
| Long-Term Investments†: | | | | | | | | | | | | | | | | |
Common Stocks: | | | | | | | | | | | | | | | | |
Consumer Discretionary | | $ | 11,518,794 | | | $ | 11,892,013 | | | | — | | | $ | 23,410,807 | |
Energy | | | 3,730,155 | | | | 7,223,291 | | | | — | | | | 10,953,446 | |
Financials | | | 13,447,912 | | | | 25,841,443 | | | | — | | | | 39,289,355 | |
Health Care | | | 1,346,510 | | | | 2,641,865 | | | | — | | | | 3,988,375 | |
Information Technology | | | 14,897,794 | | | | 23,688,310 | | | | — | | | | 38,586,104 | |
Materials | | | 3,007,364 | | | | 7,528,600 | | | | — | | | | 10,535,964 | |
Other Common Stocks | | | — | | | | 23,182,678 | | | | — | | | | 23,182,678 | |
Preferred Stocks | | | 2,787,799 | | | | — | | | | — | | | | 2,787,799 | |
| Total Investments | | $ | 50,736,328 | | | $ | 101,998,200 | | | | — | | | $ | 152,734,528 | |
| † | See Schedule of Investments for additional detailed categorizations. |
(b) Foreign currency translation.Investment securities and other assets and liabilities denominated in foreign currencies are translated into U.S. dollar amounts based upon prevailing exchange rates on the date of valuation. Purchases and sales of investment securities and income and expense items denominated in foreign currencies are translated into U.S. dollar amounts based upon prevailing exchange rates on the respective dates of such transactions.
The Fund does not isolate that portion of the results of operations resulting from fluctuations in foreign exchange rates on investments from the fluctuations arising from changes in market prices of securities held. Such fluctuations are included with the net realized and unrealized gain or loss on investments.
| | |
| Martin Currie Emerging Markets Fund 2019 Annual Report | | 29 |
Notes to financial statements (cont’d)
Net realized foreign exchange gains or losses arise from sales of foreign currencies, including gains and losses on forward foreign currency contracts, currency gains or losses realized between the trade and settlement dates on securities transactions, and the difference between the amounts of dividends, interest, and foreign withholding taxes recorded on the Fund’s books and the U.S. dollar equivalent of the amounts actually received or paid. Net unrealized foreign exchange gains and losses arise from changes in the values of assets and liabilities, other than investments in securities, on the date of valuation, resulting from changes in exchange rates.
Foreign security and currency transactions may involve certain considerations and risks not typically associated with those of U.S. dollar denominated transactions as a result of, among other factors, the possibility of lower levels of governmental supervision and regulation of foreign securities markets and the possibility of political or economic instability.
(c) Foreign investment risks.The Fund’s investments in foreign securities may involve risks not present in domestic investments. Since securities may be denominated in foreign currencies, may require settlement in foreign currencies or pay interest or dividends in foreign currencies, changes in the relationship of these foreign currencies to the U.S. dollar can significantly affect the value of the investments and earnings of the Fund. Foreign investments may also subject the Fund to foreign government exchange restrictions, expropriation, taxation or other political, social or economic developments, all of which affect the market and/or credit risk of the investments.
(d) Security transactions and investment income.Security transactions are accounted for on a trade date basis. Interest income (including interest income frompayment-in-kind securities), adjusted for amortization of premium and accretion of discount, is recorded on the accrual basis. Dividend income is recorded on theex-dividend date for dividends received in cash and/or securities. Foreign dividend income is recorded on theex-dividend date or as soon as practicable after the Fund determines the existence of a dividend declaration after exercising reasonable due diligence. The cost of investments sold is determined by use of the specific identification method. To the extent any issuer defaults or a credit event occurs that impacts the issuer, the Fund may halt any additional interest income accruals and consider the realizability of interest accrued up to the date of default or credit event.
(e) Distributions to shareholders.Distributions from net investment income and distributions of net realized gains, if any, are declared at least annually. Distributions to shareholders of the Fund are recorded on theex-dividend date and are determined in accordance with income tax regulations, which may differ from GAAP.
(f) Share class accounting.Investment income, common expenses and realized/ unrealized gains (losses) on investments are allocated to the various classes of the Fund on the basis of daily net assets of each class. Fees relating to a specific class are charged directly to that share class.
| | |
| 30 | | Martin Currie Emerging Markets Fund 2019 Annual Report |
(g) Compensating balance arrangements.The Fund has an arrangement with its custodian bank whereby a portion of the custodian’s fees is paid indirectly by credits earned on the Fund’s cash on deposit with the bank.
(h) Federal and other taxes.It is the Fund’s policy to comply with the federal income and excise tax requirements of the Internal Revenue Code of 1986 (the “Code”), as amended, applicable to regulated investment companies. Accordingly, the Fund intends to distribute its taxable income and net realized gains, if any, to shareholders in accordance with timing requirements imposed by the Code. Therefore, no federal or state income tax provision is required in the Fund’s financial statements.
Management has analyzed the Fund’s tax positions taken on income tax returns for all open tax years and has concluded that as of September 30, 2019, no provision for income tax is required in the Fund’s financial statements. The Fund’s federal and state income and federal excise tax returns for tax years for which the applicable statutes of limitations have not expired are subject to examination by the Internal Revenue Service and state departments of revenue.
Under the applicable foreign tax laws, a withholding tax may be imposed on interest, dividends and capital gains at various rates.
(i) Reclassification.GAAP requires that certain components of net assets be reclassified to reflect permanent differences between financial and tax reporting. These reclassifications have no effect on net assets or net asset value per share. During the current year, the Fund had no reclassifications.
2. Investment management agreement and other transactions with affiliates
Legg Mason Partners Fund Advisor, LLC (“LMPFA”) is the Fund’s investment manager and Martin Currie Inc. (“Martin Currie”) is the Fund’s subadviser. Western Asset Management Company, LLC (“Western Asset”) manages the portion of the Fund’s cash and short-term instruments allocated to it. LMPFA, Martin Currie and Western Asset are wholly-owned subsidiaries of Legg Mason, Inc. (“Legg Mason”).
Under the investment management agreement, the Fund pays an investment management fee, calculated daily and paid monthly, in accordance with the following breakpoint schedule:
| | | | |
| Average Daily Net Assets | | Annual Rate | |
| First $1 billion | | | 0.750 | % |
| Next $1 billion | | | 0.700 | |
| Next $3 billion | | | 0.650 | |
| Next $5 billion | | | 0.600 | |
| Over $10 billion | | | 0.550 | |
| | |
| Martin Currie Emerging Markets Fund 2019 Annual Report | | 31 |
Notes to financial statements (cont’d)
LMPFA provides administrative and certain oversight services to the Fund. LMPFA delegates to the subadviser theday-to-day portfolio management of the Fund, except for the management of the portion of the cash and short-term instruments allocated to Western Asset. For its services, LMPFA pays Martin Currie a fee monthly, at an annual rate equal to 70% of the net management fee it receives from the Fund. For Western Asset’s services to the Fund, LMPFA pays Western Asset monthly 0.02% of the portion of the Fund’s average daily net assets that are allocated to Western Asset by LMPFA.
As a result of expense limitation arrangements between the Fund and LMPFA, the ratio of total annual fund operating expenses, other than interest, brokerage commissions, dividend expense on short sales, taxes, extraordinary expenses and acquired fund fees and expenses, to average net assets of Class A, Class C, Class FI, Class I and Class IS shares did not exceed 1.30%, 2.05%, 1.30%, 0.95% and 0.85%, respectively. In addition, the ratio of total annual fund operating expenses for Class IS shares did not exceed the ratio of total annual fund operating expenses for Class I shares. These expense limitation arrangements cannot be terminated prior to December 31, 2020 without the Board of Trustees’ consent.
During the year ended September 30, 2019, fees waived and/or expenses reimbursed amounted to $175,029.
LMPFA is permitted to recapture amounts waived and/or reimbursed to a class within three years after the fiscal year in which LMPFA earned the fee or incurred the expense if the class’ total annual operating expenses have fallen to a level below the expense limitation (“expense cap”) in effect at the time the fees were earned or the expenses incurred. In no case will LMPFA recapture any amount that would result, on any particular business day of the Fund, in the class’ total annual operating expenses exceeding the expense cap or any other lower limit then in effect.
Pursuant to these arrangements, at September 30, 2019, the Fund had remaining fee waivers and/or expense reimbursements subject to recapture by LMPFA and respective dates of expiration as follows:
| | | | | | | | | | | | | | | | | | | | |
| | | Class A | | | Class C | | | Class FI | | | Class I | | | Class IS | |
| Expires September 30, 2020 | | | — | | | | — | | | $ | 596 | | | $ | 3,524 | | | $ | 245,366 | |
| Expires September 30, 2021 | | $ | 1 | | | $ | 8 | | | | 357 | | | | 1,427 | | | | 244,768 | |
| Expires September 30, 2022 | | | 202 | | | | 134 | | | | 539 | | | | 16,746 | | | | 157,408 | |
| Total fee waivers/expense reimbursements subject to recapture | | $ | 203 | | | $ | 142 | | | $ | 1,492 | | | $ | 21,697 | | | $ | 647,542 | |
For the year ended September 30, 2019, fee waivers and/or expense reimbursements recaptured by LMPFA, if any, were as follows:
| | | | | | | | | | | | | | | | | | | | |
| | | Class A | | | Class C | | | Class FI | | | Class I | | | Class IS | |
| LMPFA recaptured | | $ | 33 | | | $ | 26 | | | $ | 210 | | | $ | 540 | | | $ | 3,513 | |
Legg Mason Investor Services, LLC (“LMIS”), a wholly-owned broker-dealer subsidiary of Legg Mason, serves as the Fund’s sole and exclusive distributor.
| | |
| 32 | | Martin Currie Emerging Markets Fund 2019 Annual Report |
There is a maximum initial sales charge of 5.75% for Class A shares. There is a contingent deferred sales charge (“CDSC”) of 1.00% on Class C shares, which applies if redemption occurs within 12 months from purchase payment. In certain cases, Class A shares have a 1.00% CDSC, which applies if redemption occurs within 18 months from purchase payment. This CDSC only applies to those purchases of Class A shares, which, when combined with current holdings of other shares of funds sold by LMIS, equal or exceed $1,000,000 in the aggregate. These purchases do not incur an initial sales charge.
For the year ended September 30, 2019, sales charges retained by and CDSCs paid to LMIS and its affiliates, if any, were as follows:
| | | | |
| | | Class A | |
| Sales charges | | $ | 54 | |
| CDSCs | | | — | |
Under a Deferred Compensation Plan (the “Plan”), Trustees may have elected to defer receipt of all or a specified portion of their compensation. A participating Trustee selected one or more funds managed by affiliates of Legg Mason in which his or her deferred trustee’s fees were deemed to be invested. Deferred amounts remain in the Fund until distributed in accordance with the Plan. In May 2015, the Board of Trustees approved an amendment to the Plan so that effective January 1, 2016, no compensation earned after that date may be deferred under the Plan.
All officers and one Trustee of the Trust are employees of Legg Mason or its affiliates and do not receive compensation from the Trust.
As of September 30, 2019, Legg Mason and its affiliates owned 64% of the Fund.
3. Investments
During the year ended September 30, 2019, the aggregate cost of purchases and proceeds from sales of investments (excluding short-term investments) were as follows:
| | | | |
| Purchases | | $ | 61,694,207 | |
| Sales | | | 24,883,638 | |
At September 30, 2019, the aggregate cost of investments and the aggregate gross unrealized appreciation and depreciation of investments for federal income tax purposes were as follows:
| | | | | | | | | | | | | | | | |
| | | Cost | | | Gross Unrealized Appreciation | | | Gross Unrealized Depreciation | | | Net Unrealized Appreciation | |
| Securities | | $ | 149,035,858 | | | $ | 13,668,563 | | | $ | (9,969,893) | | | $ | 3,698,670 | |
4. Derivative instruments and hedging activities
During the year ended September 30, 2019, the Fund did not invest in derivative instruments.
| | |
| Martin Currie Emerging Markets Fund 2019 Annual Report | | 33 |
Notes to financial statements (cont’d)
5. Class specific expenses, waivers and/or expense reimbursements
The Fund has adopted a Rule12b-1 shareholder services and distribution plan and under that plan the Fund pays service and/or distribution fees with respect to its Class A, Class C and Class FI shares calculated at the annual rate of 0.25%, 1.00% and 0.25% of the average daily net assets of each class, respectively. Service and/or distribution fees are accrued daily and paid monthly.
For the year ended September 30, 2019, class specific expenses were as follows:
| | | | | | | | |
| | | Service and/or
Distribution Fees | | | Transfer Agent
Fees | |
| Class A | | $ | 375 | | | $ | 145 | |
| Class C | | | 961 | | | | 86 | |
| Class FI | | | 1,043 | | | | 703 | |
| Class I | | | — | | | | 15,797 | |
| Class IS | | | — | | | | 1,889 | |
| Total | | $ | 2,379 | | | $ | 18,620 | |
For the year ended September 30, 2019, waivers and/or expense reimbursements by class were as follows:
| | | | |
| | | Waivers/Expense Reimbursements | |
| Class A | | $ | 202 | |
| Class C | | | 134 | |
| Class FI | | | 539 | |
| Class I | | | 16,746 | |
| Class IS | | | 157,408 | |
| Total | | $ | 175,029 | |
6. Distributions to shareholders by class
| | | | | | | | |
| | | Year Ended September 30, 2019 | | | Year Ended September 30, 2018 | |
| Net Investment Income: | | | | | | | | |
| Class A | | $ | 415 | | | | — | 1 |
| Class C | | | 222 | | | | — | 1 |
| Class FI | | | 2,438 | | | $ | 5 | |
| Class I | | | 43,239 | | | | 21 | |
| Class IS | | | 1,353,693 | | | | 189,983 | |
| Total | | $ | 1,400,007 | | | $ | 190,009 | |
| 1 | For the period July 16, 2018 (inception date) to September 30, 2018. |
7. Shares of beneficial interest
At September 30, 2019, the Trust had an unlimited number of shares of beneficial interest authorized with a par value of $0.00001 per share. The Fund has the ability to issue multiple classes of shares. Each class of shares represents an identical interest and has the same rights, except that each class bears certain direct expenses, including those specifically related to the distribution of its shares.
| | |
| 34 | | Martin Currie Emerging Markets Fund 2019 Annual Report |
Transactions in shares of each class were as follows:
| | | | | | | | | | | | | | | | |
| | | Year Ended
September 30, 2019 | | | Year Ended
September 30, 2018 | |
| | | Shares | | | Amount | | | Shares | | | Amount | |
| Class A | | | | |
| Shares sold | | | 18,877 | | | $ | 216,815 | | | | 3,987 | 1 | | $ | 50,000 | 1 |
| Shares issued on reinvestment | | | 40 | | | | 415 | | | | — | | | | — | |
| Shares repurchased | | | (6,221) | | | | (74,144) | | | | — | | | | — | |
| Net increase | | | 12,696 | | | $ | 143,086 | | | | 3,987 | 1 | | $ | 50,000 | 1 |
| | | | |
| Class C | | | | | | | | | | | | | | | | |
| Shares sold | | | 9,993 | | | $ | 121,170 | | | | 3,987 | 1 | | $ | 50,000 | 1 |
| Shares issued on reinvestment | | | 21 | | | | 222 | | | | — | | | | — | |
| Shares repurchased | | | (2,633) | | | | (29,515) | | | | — | | | | — | |
| Net increase | | | 7,381 | | | $ | 91,877 | | | | 3,987 | 1 | | $ | 50,000 | 1 |
| | | | |
| Class FI | | | | | | | | | | | | | | | | |
| Shares sold | | | 11,437 | | | $ | 127,014 | | | | 45,166 | | | $ | 583,852 | |
| Shares issued on reinvestment | | | 222 | | | | 2,315 | | | | 0 | 2 | | | 5 | |
| Shares repurchased | | | (8,015) | | | | (95,455) | | | | (16,283) | | | | (216,209) | |
| Net increase | | | 3,644 | | | $ | 33,874 | | | | 28,883 | | | $ | 367,648 | |
| | | | |
| Class I | | | | | | | | | | | | | | | | |
| Shares sold | | | 1,238,629 | | | $ | 14,522,703 | | | | 364,544 | | | $ | 4,250,671 | |
| Shares issued on reinvestment | | | 4,126 | | | | 43,239 | | | | 2 | | | | 21 | |
| Shares repurchased | | | (436,997) | | | | (4,946,918) | | | | (2,675) | | | | (34,204) | |
| Net increase | | | 805,758 | | | $ | 9,619,024 | | | | 361,871 | | | $ | 4,216,488 | |
| | | | |
| Class IS | | | | | | | | | | | | | | | | |
| Shares sold | | | 3,501,879 | | | $ | 38,892,248 | | | | 1,593,013 | | | $ | 19,368,777 | |
| Shares issued on reinvestment | | | 128,891 | | | | 1,353,359 | | | | 14,705 | | | | 189,983 | |
| Shares repurchased | | | (1,245,296) | | | | (14,611,567) | | | | (666,658) | | | | (8,945,000) | |
| Net increase | | | 2,385,474 | | | $ | 25,634,040 | | | | 941,060 | | | $ | 10,613,760 | |
| 1 | For the period July 16, 2018 (inception date) to September 30, 2018. |
8. Income tax information and distributions to shareholders
The tax character of distributions paid during the fiscal years ended September 30, was as follows:
| | | | | | | | |
| | | 2019 | | | 2018 | |
| Distributions paid from: | | | | | | | | |
| Ordinary income | | $ | 1,400,007 | | | $ | 190,009 | |
| | |
| Martin Currie Emerging Markets Fund 2019 Annual Report | | 35 |
Notes to financial statements (cont’d)
As of September 30, 2019, the components of accumulated earnings (losses) on a tax basis were as follows:
| | | | |
| Undistributed ordinary income — net | | $ | 4,031,088 | |
| Deferred capital losses* | | | (5,195,024) | |
| Other book/tax temporary differences (a) | | | (11,744) | |
| Unrealized appreciation (depreciation) (b) | | | 3,698,857 | |
| Total accumulated earnings (losses) — net | | $ | 2,523,177 | |
| * | These capital losses have been deferred in the current year as either short-term or long-term losses. The losses will be deemed to occur on the first day of the next taxable year in the same character as they were originally deferred and will be available to offset future taxable capital gains. |
| (a) | Other book/tax temporary differences are attributable to book/tax differences in the timing of the deductibility of various expenses. |
| (b) | The difference between book-basis andtax-basis unrealized appreciation (depreciation) is attributable to the tax deferral of losses on wash sales and the realization for tax purposes of unrealized gains on investments in passive foreign investment companies. |
9. Recent accounting pronouncements
The Fund has adopted the disclosure provisions of the Financial Accounting Standards Board Accounting Standards UpdateNo. 2018-13,Fair Value Measurement (Topic 820)—Disclosure Framework—Changes to the Disclosure Requirements for Fair Value Measurement(“ASU2018-13”) which introduces new fair value disclosure requirements as well as eliminates and modifies certain existing fair value disclosure requirements. ASU2018-13 would be effective for fiscal years beginning after December 15, 2019, and interim periods within those fiscal years; however, management has elected to early adopt ASU2018-13. The impact of the Fund’s adoption was limited to changes in the Fund’s financial statement disclosures regarding fair value, primarily those disclosures related to transfers between levels of the fair value hierarchy.
In August 2018, the Securities and Exchange Commission released its Final Rule on Disclosure Update and Simplification (the “Final Rule”) which is intended to simplify an issuer’s disclosure compliance efforts by removing redundant or outdated disclosure requirements without significantly altering the mix of information provided to investors. Effective with the current reporting period, the Fund adopted the Final Rule with the most notable impacts being that the Fund is no longer required to present the components of distributable earnings on the Statement of Assets and Liabilities or the sources of distributions to shareholders and the amount of undistributed net investment income on the Statements of Changes in Net Assets. The tax components of distributable earnings and distributions to shareholders continue to be disclosed within the Notes to Financial Statements.
| | |
| 36 | | Martin Currie Emerging Markets Fund 2019 Annual Report |
Report of independent registered public accounting firm
To the Board of Trustees of Legg Mason Global Asset Management Trust and Shareholders of Martin Currie Emerging Markets Fund
We have audited the accompanying statement of assets and liabilities, including the schedule of investments, of Martin Currie Emerging Markets Fund (one of the funds constituting Legg Mason Global Asset Management Trust, referred to hereafter as the “Fund”) as of September 30, 2019, the related statement of operations for the year ended September 30, 2019, the statement of changes in net assets for each of the two years in the period ended September 30, 2019, including the related notes, and the financial highlights for each of the periods indicated therein (collectively referred to as the “financial statements”). In our opinion, the financial statements present fairly, in all material respects, the financial position of the Fund as of September 30, 2019, the results of its operations for the year then ended, the changes in its net assets for each of the two years in the period ended September 30, 2019 and the financial highlights for each of the periods indicated therein in conformity with accounting principles generally accepted in the United States of America.
Basis for Opinion
These financial statements are the responsibility of the Fund’s management. Our responsibility is to express an opinion on the Fund’s financial statements based on our audits. We are a public accounting firm registered with the Public Company Accounting Oversight Board (United States) (PCAOB) and are required to be independent with respect to the Fund in accordance with the U.S. federal securities laws and the applicable rules and regulations of the Securities and Exchange Commission and the PCAOB.
We conducted our audits of these financial statements in accordance with the standards of the PCAOB. Those standards require that we plan and perform the audit to obtain reasonable assurance about whether the financial statements are free of material misstatement, whether due to error or fraud.
Our audits included performing procedures to assess the risks of material misstatement of the financial statements, whether due to error or fraud, and performing procedures that respond to those risks. Such procedures included examining, on a test basis, evidence regarding the amounts and disclosures in the financial statements. Our audits also included evaluating the accounting principles used and significant estimates made by management, as well as evaluating the overall presentation of the financial statements. Our procedures included confirmation of securities owned as of September 30, 2019 by correspondence with the custodian. We believe that our audits provide a reasonable basis for our opinion.
/s/PricewaterhouseCoopersLLP
Baltimore, Maryland
November 14, 2019
We have served as the auditor of one or more investment companies in Legg Mason investment company group since at least 1973. We have not been able to determine the specific year we began serving as auditor.
| | |
| Martin Currie Emerging Markets Fund 2019 Annual Report | | 37 |
Additional shareholder information(unaudited)
On March 8, 2019, a Special Meeting of Shareholders was held to approve changing the Fund’s classification from diversified tonon-diversified within the meaning of the Investment Company Act of 1940, as amended.
The following table provides the information concerning the matter voted on at the Special Meeting of Shareholders:
| | | | |
Dollar Value For | | Dollar Value Against | | Dollar Value Abstaining |
| $121,430,779 | | $201,748 | | $87,952 |
| | |
| 38 | | Martin Currie Emerging Markets Fund |
Additional information(unaudited)
Information about Trustees and Officers
The business and affairs of Martin Currie Emerging Markets Fund (the “Fund”) are conducted by management under the supervision and subject to the direction of its Board of Trustees. The business address of each Trustee is c/o Jane Trust, Legg Mason, 100 International Drive, 11th Floor, Baltimore, Maryland 21202. Information pertaining to the Trustees and officers of the Fund is set forth below.
The Statement of Additional Information includes additional information about Trustees and is available, without charge, upon request by calling the Fund at1-877-721-1926.
| | |
| Independent Trustees† | | |
| |
| Ruby P. Hearn | | |
| |
| Year of birth | | 1940 |
| Position(s) with Trust | | Trustee |
| Term of office1and length of time served2 | | Since 2004 |
| Principal occupation(s) during the past five years | | Senior Vice President Emerita of The Robert Wood Johnson Foundation(non-profit) (since 2001); Member of the Institute of Medicine (since 1982); formerly, Trustee of the New York Academy of Medicine (2004 to 2012); Director of the Institute for Healthcare Improvement (2002 to 2012); Senior Vice President of The Robert Wood Johnson Foundation (1996 to 2001); Fellow of The Yale Corporation (1992 to 1998) |
| Number of funds in fund complex overseen by Trustee | | 20 |
| Other board memberships held by Trustee during the past five years | | None |
| |
| Arnold L. Lehman | | |
| |
| Year of birth | | 1944 |
| Position(s) with Trust | | Trustee and Chairman |
| Term of office1and length of time served2 | | Since 1982 and since 2015 |
| Principal occupation(s) during the past five years | | Senior Advisor, Phillips (auction house) (since 2015); formerly, Fellow, Ford Foundation (2015 to 2016); Director of the Brooklyn Museum (1997 to 2015) |
| Number of funds in fund complex overseen by Trustee | | 20 |
| Other board memberships held by Trustee during the past five years | | Trustee of American Federation of Arts (since 2002) |
| |
| Robin J.W. Masters | | |
| |
| Year of birth | | 1955 |
| Position(s) with Trust | | Trustee |
| Term of office1and length of time served2 | | Since 2002 |
| Principal occupation(s) during the past five years | | Retired; formerly, Chief Investment Officer of ACE Limited (insurance) (1986 to 2000) |
| Number of funds in fund complex overseen by Trustee | | 20 |
| Other board memberships held by Trustee during the past five years | | Director of Cheyne Capital International Limited (investment advisory firm) (since 2005); formerly, Director/Trustee of Legg Mason Institutional Funds plc, Western Asset Fixed Income Funds plc and Western Asset Debt Securities Fund plc. (2007 to 2011) |
| | |
| Martin Currie Emerging Markets Fund | | 39 |
Additional information(unaudited) (cont’d)
Information about Trustees and Officers
| | |
| Independent Trustees†(cont’d) | | |
| |
| Jill E. McGovern | | |
| |
| Year of birth | | 1944 |
| Position(s) with Trust | | Trustee |
| Term of office1and length of time served2 | | Since 1989 |
| Principal occupation(s) during the past five years | | Senior Consultant, American Institute for Contemporary German Studies (AICGS) (since 2007); formerly, Chief Executive Officer of The Marrow Foundation(non-profit) (1993 to 2007); Executive Director of the Baltimore International Festival (1991 to 1993); Senior Assistant to the President of The Johns Hopkins University (1986 to 1990) |
| Number of funds in fund complex overseen by Trustee | | 20 |
| Other board memberships held by Trustee during the past five years | | Director of International Biomedical Research Alliance (2002 to 2010); Director of Lois Roth Endowment (2005 to 2012) |
| |
| Arthur S. Mehlman | | |
| |
| Year of birth | | 1942 |
| Position(s) with Trust | | Trustee |
| Term of office1and length of time served2 | | Since 2002 |
| Principal occupation(s) during the past five years | | Retired. Director, The University of Maryland Foundation (since 1992); formerly, Director, The League for People with Disabilities (2003 to 2017); Director, Municipal Mortgage & Equity LLC (2004 to 2011); Partner, KPMG LLP (international accounting firm) (1972 to 2002) |
| Number of funds in fund complex overseen by Trustee | | Trustee of all Legg Mason Funds consisting of 20 portfolios; Director/Trustee of the Royce Family of Funds consisting of 22 portfolios |
| Other board memberships held by Trustee during the past five years | | Director of Municipal Mortgage & Equity, LLC. (2004 to 2011) |
| |
| G. Peter O’Brien | | |
| |
| Year of birth | | 1945 |
| Position(s) with Trust | | Trustee |
| Term of office1and length of time served2 | | Since 1999 |
| Principal occupation(s) during the past five years | | Retired. Trustee Emeritus of Colgate University (since 2005); Board Member, Hill House, Inc. (residential home care) (since 1999); formerly, Board Member, Bridges School(pre-school) (2006 to 2017); Managing Director, Equity Capital Markets Group of Merrill Lynch & Co. (1971 to 1999) |
| Number of funds in fund complex overseen by Trustee | | Trustee of all Legg Mason funds consisting of 20 portfolios; Director/Trustee of the Royce Family of Funds consisting of 22 portfolios |
| Other board memberships held by Trustee during the past five years | | Director of TICC Capital Corp. (2003 to 2017) |
| | |
| 40 | | Martin Currie Emerging Markets Fund |
| | |
| Independent Trustees†(cont’d) | | |
| |
| S. Ford Rowan | | |
| |
| Year of birth | | 1943 |
| Position(s) with Trust | | Trustee |
| Term of office1and length of time served2 | | Since 2002 |
| Principal occupation(s) during the past five years | | Consultant to University of Maryland University College (since 2013); formerly, Chairman, National Center for Critical Incident Analysis (2004 to 2018); Lecturer in Organizational Sciences, George Washington University (2000 to 2014); Trustee, St. John’s College (2006 to 2012); Consultant, Rowan & Blewitt Inc. (management consulting) (1984 to 2007); Lecturer in Journalism, Northwestern University (1980 to 1993); Director, Santa Fe Institute (1999 to 2008) |
| Number of funds in fund complex overseen by Trustee | | 20 |
| Other board memberships held by Trustee during the past five years | | None |
| |
| Robert M. Tarola | | |
| |
| Year of birth | | 1950 |
| Position(s) with Trust | | Trustee |
| Term of office1and length of time served2 | | Since 2004 |
| Principal occupation(s) during the past five years | | President of Rights Advisory LLC (corporate finance and governance consulting) (since 2008); Member, Investor Advisory Group of the Public Company Accounting Oversight Board (since 2009); formerly, Chief Financial Officer, Little Company of Mary Hospital and Health Care Centers (healthcare provider network) (2018); Executive Vice President and Chief Financial Officer, Southcoast Health System, Inc. (healthcare provider network) (2015 to 2017); Senior Vice President and Chief Financial Officer of The Howard University (higher education and health care) (2009 to 2013); Senior Vice President and Chief Financial Officer of W.R. Grace & Co. (specialty chemicals) (1999 to 2008) and MedStar Health, Inc. (healthcare) (1996 to 1999); Partner, PriceWaterhouse, LLP (accounting and auditing) (1984 to 1996) |
| Number of funds in fund complex overseen by Trustee | | 20 |
| Other board memberships held by Trustee during the past five years | | Director of American Kidney Fund (renal disease assistance) (since 2008); Director and Board Chair of XBRL International, Inc. (global data standard setting) (since 2015); Director of Vista Outdoor, Inc. (consumer recreation products) (since 2015); formerly, Director of TeleTech Holdings, Inc. (business processing outsourcing) (since 2008) |
| | |
| Martin Currie Emerging Markets Fund | | 41 |
Additional information(unaudited) (cont’d)
Information about Trustees and Officers
| | |
| Interested Trustee and Officer | | |
| |
| Jane Trust, CFA3 | | |
| |
| Year of birth | | 1962 |
| Position(s) with Trust | | Trustee, President and Chief Executive Officer |
| Term of office1and length of time served2 | | Since 2015 |
| Principal occupation(s) during the past five years | | Senior Managing Director of Legg Mason & Co., LLC (“Legg Mason & Co.”) (since 2018); Managing Director of Legg Mason & Co. (2016 to 2018); Officer and/or Trustee/Director of 142 funds associated with Legg Mason Partners Fund Advisor, LLC (“LMPFA”) or its affiliates (since 2015); President and Chief Executive Officer of LMPFA (since 2015); formerly, Senior Vice President of LMPFA (2015); Director of ClearBridge, LLC (formerly, Legg Mason Capital Management, LLC) (2007 to 2014); Managing Director of Legg Mason Investment Counsel & Trust Co. (2000 to 2007) |
| Number of funds in fund complex overseen by Trustee | | 133 |
| Other board memberships held by Trustee during the past five years | | None |
| | | |
| Additional Officers | | |
| |
Christopher Berarducci*
Legg Mason
620 Eighth Avenue, 49th Floor, New York, NY 10018 | | |
| Year of birth | | 1974 |
| Position(s) with Trust | | Treasurer and Principal Financial Officer |
| Term of office1and length of time served2 | | Since 2010 and 2019 |
| Principal occupation(s) during the past five years | | Treasurer (since 2010) and Principal Financial Officer (since 2019) of certain mutual funds associated with Legg Mason & Co. or its affiliates; Director of Legg Mason & Co. (since 2015); formerly, Vice President of Legg Mason & Co. (2011 to 2015); Assistant Controller of certain mutual funds associated with Legg Mason & Co. or its affiliates (prior to 2010) |
|
Robert I. Frenkel Legg Mason
100 First Stamford Place, 6th Floor, Stamford, CT 06902 |
| |
| Year of birth | | 1954 |
| Position(s) with Trust | | Secretary and Chief Legal Officer |
| Term of office1and length of time served2 | | Since 2007 |
| Principal occupation(s) during the past five years | | Vice President and Deputy General Counsel of Legg Mason, Inc. (since 2006); Managing Director and General Counsel — U.S. Mutual Funds for Legg Mason & Co. (since 2006) and Legg Mason & Co. predecessors (since 1994); Secretary and Chief Legal Officer of certain mutual funds associated with Legg Mason & Co. or its affiliates (since 2006) and Legg Mason & Co. predecessors (prior to 2006) |
| | |
| 42 | | Martin Currie Emerging Markets Fund |
| | |
| Additional Officers (cont’d) | | |
|
Thomas C. Mandia Legg Mason 100 First Stamford Place, 6th Floor, Stamford, CT 06902 |
| Year of birth | | 1962 |
| Position(s) with Trust | | Assistant Secretary |
| Term of office1and length of time served2 | | Since 2007 |
| Principal occupation(s) during the past five years | | Managing Director and Deputy General Counsel of Legg Mason & Co. (since 2005) and Legg Mason & Co. predecessors (prior to 2005); Secretary of LMPFA (since 2006); Assistant Secretary of certain mutual funds associated with Legg Mason & Co. or its affiliates (since 2006) and Legg Mason & Co. predecessors (prior to 2006); Secretary of LM Asset Services, LLC (“LMAS”) (since 2002) and Legg Mason Fund Asset Management, Inc. (“LMFAM”) (since 2013) (formerly registered investment advisers) |
|
Ted P. Becker Legg Mason 620 Eighth Avenue, 49th Floor, New York, NY 10018 |
| Year of birth | | 1951 |
| Position(s) with Trust | | Chief Compliance Officer |
| Term of office1and length of time served2 | | Since 2007 |
| Principal occupation(s) during the past five years | | Director of Global Compliance at Legg Mason (since 2006); Chief Compliance Officer of LMPFA (since 2006); Managing Director of Compliance of Legg Mason & Co. (since 2005); Chief Compliance Officer of certain mutual funds associated with Legg Mason & Co. or its affiliates (since 2006) |
|
Susan Kerr Legg Mason 620 Eighth Avenue, 49th Floor, New York, NY 10018 |
| Year of birth | | 1949 |
| Position(s) with Trust | | Chief Anti-Money Laundering Compliance Officer |
| Term of office1and length of time served2 | | Since 2013 |
| Principal occupation(s) during the past five years | | Assistant Vice President of Legg Mason & Co. and Legg Mason Investor Services, LLC (“LMIS”) (since 2010); Chief Anti-Money Laundering Compliance Officer of certain mutual funds associated with Legg Mason & Co. or its affiliates (since 2013) and Anti-Money Laundering Compliance Officer of LMIS (since 2012); Senior Compliance Officer of LMIS (since 2011); formerly, AML Consultant, DTCC (2010); AML Consultant, Rabobank Netherlands, (2009); First Vice President, Director of Marketing & Advertising Compliance and Manager of Communications Review Group at Citigroup Inc. (1996 to 2008) |
| | |
| Martin Currie Emerging Markets Fund | | 43 |
Additional information(unaudited) (cont’d)
Information about Trustees and Officers
| | |
| Additional Officers (cont’d) | | |
|
Jenna Bailey Legg Mason 100 First Stamford Place, 5th Floor, Stamford, CT 06902 |
| Year of birth | | 1978 |
| Position(s) with Trust | | Identity Theft Prevention Officer |
| Term of office1and length of time served2 | | Since 2015 |
| Principal occupation(s) during the past five years | | Identity Theft Prevention Officer of certain mutual funds associated with Legg Mason & Co. or its affiliates (since 2015); Compliance Officer of Legg Mason & Co. (since 2013); Assistant Vice President of Legg Mason & Co. (since 2011); formerly, Associate Compliance Officer of Legg Mason & Co. (2011 to 2013) |
|
Jeanne M. Kelly Legg Mason 620 Eighth Avenue, 49th Floor, New York, NY 10018 |
| Year of birth | | 1951 |
| Position(s) with Trust | | Senior Vice President |
| Term of office1and length of time served2 | | Since 2007 |
| Principal occupation(s) during the past five years | | Senior Vice President of certain mutual funds associated with Legg Mason & Co. or its affiliates (since 2007); Senior Vice President of LMPFA (since 2006); President and Chief Executive Officer of LMAS and LMFAM (since 2015); Managing Director of Legg Mason & Co. (since 2005) and Legg Mason & Co. predecessors (prior to 2005); formerly, Senior Vice President of LMFAM (2013 to 2015) |
| † | Trustees who are not “interested persons” of the Fund within the meaning of Section 2(a)(19) of the Investment Company Act of 1940, as amended (the “1940 Act”). Each of the Independent Trustees serves on the standing committees of the Board of Trustees, which include the Audit Committee (chair: Arthur S. Mehlman), the Nominating Committee(co-chairs: G. Peter O’Brien and Jill E. McGovern), and the Independent Trustees Committee (chair: Arnold L. Lehman). |
| * | Effective September 27, 2019, Mr. Berarducci became Treasurer and Principal Financial Officer. |
| 1 | Each Trustee and officer serves until his or her respective successor has been duly elected and qualified or until his or her earlier death, resignation, retirement or removal. |
| 2 | Indicates the earliest year in which the Trustee became a board member for a fund in the Legg Mason fund complex or the officer took such office. |
| 3 | Ms. Trust is an “interested person” of the Fund, as defined in the 1940 Act, because of her position with LMPFA and/or certain of its affiliates. |
| | |
| 44 | | Martin Currie Emerging Markets Fund |
Important tax information(unaudited)
The following information is provided with respect to the distributions paid during the taxable year ended September 30, 2019:
| | | | |
| Record date: | | | 12/18/2018 | |
| Payable date: | | | 12/19/2018 | |
| Ordinary Income: | | | | |
Qualified Dividend Income for Individuals | | | 79.68 | % |
Dividends Qualifying for the Dividends | | | | |
Received Deduction for Corporations | | | 5.04 | % |
| Foreign Source Income | | | 87.18 | %* |
| Foreign Taxes Paid Per Share | | | $0.019903 | |
| * | Expressed as a percentage of the cash distributiongrossed-up for foreign taxes. |
The foreign taxes paid represent taxes incurred by the Fund on income received by the Fund from foreign sources. Foreign taxes paid may be included in taxable income with an offsetting deduction from gross income or may be taken as a credit for taxes paid to foreign governments. You should consult your tax adviser regarding the appropriate treatment of foreign taxes paid.
Please retain this information for your records.
| | |
| Martin Currie Emerging Markets Fund | | 45 |
Martin Currie
Emerging Markets Fund
Trustees
Ruby P. Hearn
Arnold L. Lehman
Chairman
Robin J.W. Masters
Jill E. McGovern
Arthur S. Mehlman
G. Peter O’Brien
S. Ford Rowan
Robert M. Tarola
Jane Trust
Investment manager
Legg Mason Partners Fund Advisor, LLC
Subadviser
Martin Currie Inc.
Distributor
Legg Mason Investor Services, LLC
Custodian
The Bank of New York Mellon
Transfer agent
BNY Mellon Investment Servicing (US) Inc.
4400 Computer Drive
Westborough, MA 01581
Independent registered public accounting firm
PricewaterhouseCoopers LLP
100 East Pratt Street
Baltimore, MD 21202
Martin Currie Emerging Markets Fund
The Fund is a separate investment series of Legg Mason Global Asset Management Trust, a Maryland statutory trust.
Martin Currie Emerging Markets Fund
Legg Mason Funds
620 Eighth Avenue, 49th Floor
New York, NY 10018
The Fund files its complete schedule of portfolio holdings with the Securities and Exchange Commission (“SEC”) for the first and third quarters of each fiscal year as an exhibit to its reports on FormN-PORT. Previously, the Fund filed a complete schedule of portfolio holdings with the SEC for the first and third quarters of each fiscal year on FormN-Q. The Fund’s FormsN-PORT andN-Q are available on the SEC’s website at www.sec.gov. To obtain information on FormsN-PORT andN-Q, shareholders can call the Fund at1-877-721-1926.
Information on how the Fund voted proxies relating to portfolio securities during the prior12-month period ended June 30th of each year and a description of the policies and procedures that the Fund uses to determine how to vote proxies related to portfolio transactions are available (1) without charge, upon request, by calling the Fund at1-877-721-1926, (2) at www.leggmason.com/mutualfunds and (3) on the SEC’s website at www.sec.gov.
This report is submitted for the general information of the shareholders of Martin Currie Emerging Markets Fund. This report is not authorized for distribution to prospective investors in the Fund unless preceded or accompanied by a current prospectus.
Investors should consider the Fund’s investment objectives, risks, charges and expenses carefully before investing. The prospectus contains this and other important information about the Fund. Please read the prospectus carefully before investing.
www.leggmason.com
© 2019 Legg Mason Investor Services, LLC
Member FINRA, SIPC
Legg Mason Funds Privacy and Security Notice
Your Privacy and the Security of Your Personal Information is Very Important to the Legg Mason Funds
This Privacy and Security Notice (the “Privacy Notice”) addresses the Legg Mason Funds’ privacy and data protection practices with respect to nonpublic personal information the Funds receive. The Legg Mason Funds include any funds sold by the Funds’ distributor, Legg Mason Investor Services, LLC, as well as Legg Mason-sponsoredclosed-end funds. The provisions of this Privacy Notice apply to your information both while you are a shareholder and after you are no longer invested with the Funds.
The Type of Nonpublic Personal Information the Funds Collect About You
The Funds collect and maintain nonpublic personal information about you in connection with your shareholder account. Such information may include, but is not limited to:
| • | | Personal information included on applications or other forms; |
| • | | Account balances, transactions, and mutual fund holdings and positions; |
| • | | Bank account information, legal documents, and identity verification documentation; |
| • | | Online account access user IDs, passwords, security challenge question responses; and |
| • | | Information received from consumer reporting agencies regarding credit history and creditworthiness (such as the amount of an individual’s total debt, payment history, etc.). |
How the Funds Use Nonpublic Personal Information About You
The Funds do not sell or share your nonpublic personal information with third parties or with affiliates for their marketing purposes, or with other financial institutions or affiliates for joint marketing purposes, unless you have authorized the Funds to do so. The Funds do not disclose any nonpublic personal information about you except as may be required to perform transactions or services you have authorized or as permitted or required by law. The Funds may disclose information about you to:
| • | | Employees, agents, and affiliates on a “need to know” basis to enable the Funds to conduct ordinary business or to comply with obligations to government regulators; |
| • | | Service providers, including the Funds’ affiliates, who assist the Funds as part of the ordinary course of business (such as printing, mailing services, or processing or servicing your account with us) or otherwise perform services on the Funds’ behalf, including companies that may perform statistical analysis, market research and marketing services solely for the Funds; |
| • | | Permit access to transfer, whether in the United States or countries outside of the United States to such Funds’ employees, agents and affiliates and service providers as required to enable the Funds to conduct ordinary business, or to comply with obligations to government regulators; |
| • | | The Funds’ representatives such as legal counsel, accountants and auditors to enable the Funds to conduct ordinary business, or to comply with obligations to government regulators; |
| • | | Fiduciaries or representatives acting on your behalf, such as an IRA custodian or trustee of a grantor trust. |
|
| NOT PART OF THE ANNUAL REPORT |
Legg Mason Funds Privacy and Security Notice (cont’d)
Except as otherwise permitted by applicable law, companies acting on the Funds’ behalf, including those outside the United States, are contractually obligated to keep nonpublic personal information the Funds provide to them confidential and to use the information the Funds share only to provide the services the Funds ask them to perform.
The Funds may disclose nonpublic personal information about you when necessary to enforce their rights or protect against fraud, or as permitted or required by applicable law, such as in connection with a law enforcement or regulatory request, subpoena, or similar legal process. In the event of a corporate action or in the event a Fund service provider changes, the Funds may be required to disclose your nonpublic personal information to third parties. While it is the Funds’ practice to obtain protections for disclosed information in these types of transactions, the Funds cannot guarantee their privacy policy will remain unchanged.
Keeping You Informed of the Funds’ Privacy and Security Practices
The Funds will notify you annually of their privacy policy as required by federal law. While the Funds reserve the right to modify this policy at any time they will notify you promptly if this privacy policy changes.
The Funds’ Security Practices
The Funds maintain appropriate physical, electronic and procedural safeguards designed to guard your nonpublic personal information. The Funds’ internal data security policies restrict access to your nonpublic personal information to authorized employees, who may use your nonpublic personal information for Fund business purposes only.
Although the Funds strive to protect your nonpublic personal information, they cannot ensure or warrant the security of any information you provide or transmit to them, and you do so at your own risk. In the event of a breach of the confidentiality or security of your nonpublic personal information, the Funds will attempt to notify you as necessary so you can take appropriate protective steps. If you have consented to the Funds using electronic communications or electronic delivery of statements, they may notify you under such circumstances using the most current email address you have on record with them.
In order for the Funds to provide effective service to you, keeping your account information accurate is very important. If you believe that your account information is incomplete, not accurate or not current, if you have questions about the Funds’ privacy practices, or our use of your nonpublic personal information, write the Funds using the contact information on your account statements, email the Funds by clicking on the Contact Us section of the Funds’ website at www.leggmason.com, or contact the Funds at1-877-721-1926.
Revised April 2018
|
| NOT PART OF THE ANNUAL REPORT |
www.leggmason.com
© 2019 Legg Mason Investor Services, LLC Member FINRA, SIPC
MCXX211453 11/19 SR19-3737
The registrant has adopted a code of ethics that applies to the registrant’s principal executive officer, principal financial officer, principal accounting officer or controller.
| ITEM 3. | AUDIT COMMITTEE FINANCIAL EXPERT. |
The Board of Trustees of the registrant has determined that Arthur S. Mehlman the Chairman of the Board’s Audit Committee and Robert M. Tarola, possess the technical attributes identified in Instruction 2(b) of Item 3 to FormN-CSR to qualify as “audit committee financial experts,” and have designated Mr. Mehlman and Mr. Tarola as the Audit Committee’s financial experts. Mr. Mehlman and Mr. Tarola are “independent” Trustees pursuant to paragraph (a) (2) of Item 3 toForm N-CSR.
| ITEM 4. | PRINCIPAL ACCOUNTANT FEES AND SERVICES. |
a)Audit Fees. The aggregate fees billed in the last two fiscal years ending September 30, 2018 and September 30, 2019 (the “Reporting Periods”) for professional services rendered by the Registrant’s principal accountant (the “Auditor”) for the audit of the Registrant’s annual financial statements, or services that are normally provided by the Auditor in connection with the statutory and regulatory filings or engagements for the Reporting Periods, were $306,746 in September 30, 2018 and $336,010 in September 30, 2019.
b)Audit-Related Fees. The aggregate fees billed in the Reporting Period for assurance and related services by the Auditor that are reasonably related to the performance of the Registrant’s financial statements were $0 in September 30, 2018 and $3,000 in September 30, 2019.
In addition, there were no Audit-Related Fees billed in the Reporting Period for assurance and related services by the Auditor to the Registrant’s investment adviser (not including anysub-adviser whose role is primarily portfolio management and is subcontracted with or overseen by another investment adviser), and any entity controlling, controlled by or under common control with the investment adviser that provides ongoing services to the Legg Mason Global Asset Management Trust (“service affiliates”), that were reasonably related to the performance of the annual audit of the service affiliates. Accordingly, there were no such fees that requiredpre-approval by the Audit Committee for the Reporting Period.
(c)Tax Fees. The aggregate fees billed in the Reporting Periods for professional services rendered by the Auditor for tax compliance, tax advice and tax planning (“Tax Services”) were $45,424 in September 30, 2018 and $0 in September 30, 2019. These services consisted of (i) review or preparation of U.S. federal, state, local and excise tax returns; (ii) U.S. federal, state and local tax planning, advice and assistance regarding statutory, regulatory or administrative developments, and (iii) tax advice regarding tax qualification matters and/or treatment of various financial instruments held or proposed to be acquired or held.
There were no fees billed for tax services by to the service affiliates during the Reporting Periods that requiredpre-approval by the Audit Auditors Committee.
d)All Other Fees. The aggregate fees for other fees billed in the Reporting Periods for products and services provided by the Auditor were $0 in September 30, 2018 and $0 in September 30, 2019, other than the services reported in paragraphs (a) through (c) of this item for the Legg Mason Global Asset Management Trust.
All Other Fees. There were no othernon-audit services rendered by the Auditor to Legg Mason Partners Fund Advisors, LLC (“LMPFA”), and any entity controlling, controlled by or under common control with LMPFA that provided ongoing services to Legg Mason Global Asset Management Trust requiringpre-approval by the Audit Committee in the Reporting Period.
(e) Audit Committee’s pre–approval policies and procedures described in paragraph (c)
(7) of Rule2-01 of RegulationS-X.
(1) The Charter for the Audit Committee (the “Committee”) of the Board of each registered investment company (the “Fund”) advised by LMPFA or one of their affiliates (each, an “Adviser”) requires that the Committee shall approve (a) all audit and permissiblenon-audit services to be provided to the Fund and (b) all permissiblenon-audit services to be provided by the Fund’s independent auditors to the Adviser and any Covered Service Providers if the engagement relates directly to the operations and financial reporting of the Fund. The Committee may implement policies and procedures by which such services are approved other than by the full Committee.
The Committee shall not approvenon-audit services that the Committee believes may impair the independence of the auditors. As of the date of the approval of this Audit Committee Charter, permissiblenon-audit services include any professional services (including tax services), that are not prohibited services as described below, provided to the Fund by the independent auditors, other than those provided to the Fund in connection with an audit or a review of the financial statements of the Fund. Permissiblenon-audit services may not include: (i) bookkeeping or other services related to the accounting records or financial statements of the Fund; (ii) financial information systems design and implementation; (iii) appraisal or valuation services, fairness opinions orcontribution-in-kind reports; (iv) actuarial services; (v) internal audit outsourcing services; (vi) management functions or human resources; (vii) broker or dealer, investment adviser or investment banking services; (viii) legal services and expert services unrelated to the audit; and (ix) any other service the Public Company Accounting Oversight Board determines, by regulation, is impermissible.
Pre-approval by the Committee of any permissiblenon-audit services is not required so long as: (i) the aggregate amount of all such permissiblenon-audit services provided to the Fund, the Adviser and any service providers controlling, controlled by or under common control with the Adviser that provide ongoing services to the Fund (“Covered Service Providers”) constitutes not more than 5% of the total amount of revenues paid to the independent auditors during the fiscal year in which the permissiblenon-audit services are provided to (a) the Fund, (b) the Adviser and (c) any entity controlling, controlled by or under common control with the Adviser that provides ongoing services to the Fund during the fiscal year in which the services are provided that would have to be approved by the Committee; (ii) the permissiblenon-audit services were not recognized by the Fund at the time of the engagement to benon-audit services; and (iii) such services are promptly brought to the attention of the Committee and approved by the Committee (or its delegate(s)) prior to the completion of the audit.
(2) For the Legg Mason Global Asset Management Trust, the percentage of fees that were approved by the audit committee, with respect to: Audit-Related Fees were 100% and 100% for September 30, 2018 and September 30, 2019; Tax Fees were 100% and 100% for September 30, 2018 and September 30, 2019; and Other Fees were 100% and 100% for September 30, 2018 and September 30, 2019.
(f) N/A
(g)Non-audit fees billed by the Auditor for services rendered to Legg Mason Global Asset Management Trust, LMPFA and any entity controlling, controlled by, or under common control with LMPFA that provides ongoing services to Legg Mason Global Asset Management Trust during the reporting period were $477,227 in September 30, 2018 and $386,151 in September 30, 2019.
(h) Yes. Legg Mason Global Asset Management Trust’s Audit Committee has considered whether the provision ofnon-audit services that were rendered to Service Affiliates, which were notpre-approved (not requiringpre-approval), is compatible with maintaining the Accountant’s independence. All services provided by the Auditor to the Legg Mason Global Asset Management Trust or to Service Affiliates, which were required to bepre-approved, werepre-approved as required.
| ITEM 5. | AUDIT COMMITTEE OF LISTED REGISTRANTS. |
| | a) | The independent board members are acting as the registrant’s audit committee as specified in Section 3(a)(58)(B) of the Exchange Act. The Audit Committee consists of the following Board members: |
Ruby P. Hearn
Arnold L. Lehman
Robin J.W. Masters
Jill E. McGovern
Arthur S. Mehlman
G. Peter O’Brien
S. Ford Rowan
Robert M. Tarola
b) Not applicable
| ITEM 6. | SCHEDULE OF INVESTMENTS. |
Included herein under Item 1.
| ITEM 7. | DISCLOSURE OF PROXY VOTING POLICIES AND PROCEDURES FORCLOSED-END MANAGEMENT INVESTMENT COMPANIES. |
Not applicable.
| ITEM 8. | PORTFOLIO MANAGERS OFCLOSED-END MANAGEMENT INVESTMENT COMPANIES. |
Not applicable.
| ITEM 9. | PURCHASES OF EQUITY SECURITIES BYCLOSED-END MANAGEMENT INVESTMENT COMPANY AND AFFILIATED PURCHASERS. |
Not applicable.
| ITEM 10. | SUBMISSION OF MATTERS TO A VOTE OF SECURITY HOLDERS. |
Not applicable.
| ITEM 11. | CONTROLS AND PROCEDURES. |
(a) The registrant’s principal executive officer and principal financial officer have concluded that the registrant’s disclosure controls and procedures (as defined in Rule30a- 3(c) under the Investment Company Act of 1940, as amended (the “1940 Act”)) are effective as of a date within 90 days of the filing date of this report that includes the disclosure required by this paragraph, based on their evaluation of the disclosure controls and procedures required by Rule30a-3(b) under the 1940 Act and15d-15(b) under the Securities Exchange Act of 1934.
(b) There were no changes in the registrant’s internal control over financial reporting (as defined in Rule30a-3(d) under the 1940 Act) that occurred during the second fiscal quarter of the period covered by this report that have materially affected, or are likely to materially affect the registrant’s internal control over financial reporting.
| ITEM 12. | DISCLOSURE OF SECURITIES LENDING ACTIVITIES FORCLOSED-END MANAGEMENT INVESTMENT COMPANIES. |
Not applicable.
(a) (1) Code of Ethics attached hereto.
Exhibit 99.CODE ETH
(a) (2) Certifications pursuant to section 302 of the Sarbanes-Oxley Act of 2002 attached hereto.
Exhibit 99.CERT
(b) Certifications pursuant to Section 906 of the Sarbanes-Oxley Act of 2002 attached hereto.
Exhibit 99.906CERT
SIGNATURES
Pursuant to the requirements of the Securities Exchange Act of 1934 and the Investment Company Act of 1940, the registrant has duly caused this Report to be signed on its behalf by the undersigned, there unto duly authorized.
Legg Mason Global Asset Management Trust
| | |
| By: | | /s/ Jane Trust |
| | Jane Trust |
| | Chief Executive Officer |
Date: November 21, 2019
Pursuant to the requirements of the Securities Exchange Act of 1934 and the Investment Company Act of 1940, this report has been signed below by the following persons on behalf of the registrant and in the capacities and on the dates indicated.
| | |
| By: | | /s/ Jane Trust |
| | Jane Trust |
| | Chief Executive Officer |
Date: November 21, 2019
| | |
| By: | | /s/ Christopher Berarducci |
| | Christopher Berarducci |
| | Principal Financial Officer |
Date: November 21, 2019