UNITED STATES
SECURITIES AND EXCHANGE COMMISSION
Washington, D.C. 20549
FORM N-CSR
CERTIFIED SHAREHOLDER REPORT OF REGISTERED
MANAGEMENT INVESTMENT COMPANIES
Investment Company Act file number 811-22338
Legg Mason Global Asset Management Trust
(Exact name of registrant as specified in charter)
620 Eighth Avenue, 47th Floor, New York, NY 10018
(Address of principal executive offices) (Zip code)
Marc A. De Oliveira
Franklin Templeton
100 First Stamford Place
Stamford, CT 06902
(Name and address of agent for service)
Registrant’s telephone number, including area code: 1-877-721-1926
Date of fiscal year end: September 30
Date of reporting period: September 30, 2021
| ITEM 1. | REPORT TO STOCKHOLDERS |
The Annual Report to Stockholders is filed herewith.

| | |
| Annual Report | | September 30, 2021 |
FRANKLIN
STRATEGIC REAL RETURN FUND
The Fund intends to no longer mail paper copies of the Fund’s shareholder reports like this one, unless you specifically request paper copies of the reports from the Fund or from your Service Agent or financial intermediary (such as a broker-dealer or bank). Instead, the reports will be made available on a website, and you will be notified by mail each time a report is posted and provided with a website link to access the report.
If you already elected to receive shareholder reports electronically (“e-delivery”), you will not be affected by this change and you need not take any action. If you have not already elected e-delivery, you may elect to receive shareholder reports and other communications from the Fund electronically by contacting your Service Agent or, if you are a direct shareholder with the Fund, by calling 1-877-721-1926.
You may elect to receive all future reports in paper free of charge. If you invest through a Service Agent, you can contact your Service Agent to request that you continue to receive paper copies of your shareholder reports. That election will apply to all Legg Mason Funds held in your account at that Service Agent. If you are a direct shareholder with the Fund, you can call the Fund at 1-877-721-1926, or write to the Fund by regular mail at Legg Mason Funds, P.O. Box 9699, Providence, RI 02940-9699 or by express, certified or registered mail to Legg Mason Funds, 4400 Computer Drive, Westborough, MA 01581 to let the Fund know you wish to continue receiving paper copies of your shareholder reports. That election will apply to all Legg Mason Funds held in your account held directly with the fund complex.
|
| INVESTMENT PRODUCTS: NOT FDIC INSURED • NO BANK GUARANTEE • MAY LOSE VALUE |
Fund objective
The Fund seeks to provide an attractive long-term real return.
Letter from the president

Dear Shareholder,
We are pleased to provide the annual report of Franklin Strategic Real Return Fund for the twelve-month reporting period ended September 30, 2021. Please read on for a detailed look at prevailing economic and market conditions during the Fund’s reporting period and to learn how those conditions have affected Fund performance.
Special shareholder notices
Effective August 7, 2021, QS Investors, LLC (“QS Investors”), a subadviser of the Fund and a wholly-owned subsidiary of Franklin Resources, Inc. (“Franklin Resources”), merged with and into Franklin Advisers, Inc. (“Franklin Advisers”), also a wholly-owned subsidiary of Franklin Resources. As a result of the merger, Franklin Advisers replaced QS Investors as the subadviser and QS Strategic Real Return Fund was renamed Franklin Strategic Real Return Fund. The merger did not change the manner in which the Fund’s portfolio is managed, nor did it result in any change in the nature or amount of services provided by, or the fees payable to, the subadviser. For more information, please see the Fund’ prospectus supplement dated July 6, 2021.
Effective August 7, 2021, Jacqueline Kenney, CFA and Laura Green, CFA joined the Fund’s portfolio management team. For more information, please see the Fund’s prospectus supplement dated July 6, 2021.
As always, we remain committed to providing you with excellent service and a full spectrum of investment choices. We also remain committed to supplementing the support you receive from your financial advisor. One way we accomplish this is through our website, www.franklintempleton.com. Here you can gain immediate access to market and investment information, including:
| • | | Fund prices and performance, |
| • | | Market insights and commentaries from our portfolio managers, and |
| • | | A host of educational resources. |
| | |
| II | | Franklin Strategic Real Return Fund |
We look forward to helping you meet your financial goals.
Sincerely,

Jane Trust, CFA
President and Chief Executive Officer
October 29, 2021
| | |
| Franklin Strategic Real Return Fund | | III |
Fund overview
Q. What is the Fund’s investment strategy?
A. Under normal market conditions, the Fund, using a tactical asset allocation program, seeks to provide an attractive long-term real return. The Fund defines real return as total return reduced by the impact of inflation. In seeking to meet its investment goal, the Fund implements a tactical asset allocation program overseen by its adviser and a subadviser, Franklin Advisers, Inc (“Franklin Advisers”) (prior to August 7, 2021, known as QS Investors, LLC). The Fund may allocate its assets among five investment “sleeves” which we believe are generally complementary to each other, with the following target allocations of the Fund’s net assets:
| • | | Inflation-Linked Debt Securities (40%) |
| • | | Global Equity Securities (20%) |
| • | | Commodity-Linked Securities (20%) |
| • | | Exchange-Traded Funds (“ETFs”) that invest in Real Estate Investment Trusts (“REITs”)i (10%) |
| • | | Tactical Strategy (10%) |
Actual allocations may deviate from each target allocation shown above by up to 50% of such target allocation. The composition and asset allocation of the Fund’s investment portfolio will vary over time, based on Franklin Advisers’ overall allocation decisions, and may be changed without shareholder approval. Asset allocation decisions are primarily based on Franklin Advisers’ evaluations of the relative attractiveness of the asset classes in which the Fund invests. The processes take into account several factors, including quantitative analysis, qualitative inputs and risk management guidelines. Holdings in a particular strategy may also vary because of performance differences among the different strategies.
The Fund utilizes a “multi-manager” approach, whereby the adviser and each subadviser provide day-to-day management for one or more of the investment sleeves. The adviser and each subadviser use different investment strategies in managing the sleeves, act independently from the others in their management of the investment sleeve for which they are responsible, and use their own methodology for selecting investments. Currently, Western Asset Management Company, LLC (“Western Asset”), Western Asset Management Company Limited in London (“WAML”) and Western Asset Management Company Ltd. in Japan (“Western Japan”) manage the Inflation-Linked Debt Securities Sleeve and Franklin Advisers manages the Global Equity Securities Sleeve, the Commodity-Linked Securities Sleeve, the REITs Sleeve and the Tactical Strategy Sleeve. Franklin Advisers may also allocate a portion of the Fund’s assets to ClearBridge Investments, LLC (“ClearBridge”), either in place of, or in addition to, the subadvisers named above. Western Asset also manages the portion of the Fund’s cash and short-term instruments allocated to it. The Fund may use commodity derivatives (swaps and S&P GSCI®ii futures) to gain exposure to commodities. These derivatives are fully collateralized with cash.
| | | | | | |
| Franklin Strategic Real Return Fund 2021 Annual Report | | | | | 1 | |
Fund overview (cont’d)
Q. What were the overall market conditions during the Fund’s reporting period?
A. Despite a global pandemic and economic disruptions, many of the world’s equity markets finished the twelve-month reporting period higher, as did longer-term U.S. Treasury yields.
Global equity markets advanced nearly across the board for the fourth quarter of 2020. The bulk of gains occurred in November following positive coronavirus vaccine trials and Joe Biden’s win in the U.S. presidential election. Positive news appeared to outweigh concerns that economic recoveries would stall amid renewed lockdowns resulting from rising coronavirus infection rates and the identification of a new, more infectious, COVID-19 strain. Sentiment was buoyed toward the end of the reporting period by the start of vaccinations. The U.S. Treasury yield curveiii steepened over the final quarter of 2020, with short-term yields moving lower while their longer-term counterparts rose.
While the bullish narrative began to deteriorate in January, global equity markets advanced modestly in the first quarter of 2021, led by the U.K. and the U.S., as investors weighed continued optimism around policy stimulus and economic reopening against concerns about higher bond yields and potential economic overheating. Credit markets influenced stock markets for much of the quarter, with the yield for the ten-year U.S. Treasury note finishing near its highest levels in more than a year amid rising inflation expectations and improving macro prospects. The backup in yields prompted a style rotation in equity markets, with companies with long-dated cash flows like technology and media names and equity sectors with fixed income characteristics like utilities and consumer staples mostly lagging, while commodity price-sensitive and other economically cyclical sectors (e.g., energy, industrials and financials) generally performing well.
Global equity markets overall advanced during the second quarter of 2021. Progress in vaccination campaigns and businesses reopening, along with ongoing monetary and fiscal stimulus, aided continued economic recovery in several parts of the world. Inflation was the dominant market theme during the quarter as supply chain disruptions and higher commodity prices combined with low base effects to drive up inflation around the globe. Investors assessed signals to determine if the inflation jump would be temporary and whether governments and central banks would begin tightening accommodative policies sooner than expected. Developed stock markets collectively advanced ahead of a global index while emerging equity markets overall lagged. In terms of investment style, global growth stocks outperformed global value equities. In the U.S., better-than-expected corporate earnings and forward guidance provided solid support for equities. The U.S. Treasury yield curve flattened over the quarter with longer-term yields moving lower while their shorter-maturity counterparts rose modestly. Crude oil prices rose to the highest level since April 2019 as OPEC (Organization of Petroleum Exporting Countries) and key allied producers outside the cartel (OPEC+) stuck to supply restraints. Rising forward demand expectations, amid limited new supply and ramped-up refinery production, also lifted prices.
| | | | |
| 2 | | | | Franklin Strategic Real Return Fund 2021 Annual Report |
Global equity markets edged down during 2021’s third quarter on mixed underlying results as a selloff in September erased the earlier gains of many markets. Late in the period, persistent inflation, more hawkish central bank messaging and a continued regulatory crackdown in China all affected investor sentiment. After peaking at all-time highs, broad gauges of the U.S. equity market sold off during the final weeks of 2021’s third quarter as investors grappled with a number of current and potential headwinds facing American businesses. U.S. Treasury yields generally rose throughout the quarter. Gold prices finished the quarter lower, while an emerging shortfall in global energy supplies helped push Brent crude front-month futures, the global benchmark for oil, to their highest price level in three years.
Q. How did we respond to these changing market conditions?
A. Our process focuses mostly on strategic allocation which diversifies among traditional and alternative asset classes and is designed to hedge against short-term and long-term inflation.
During the twelve-month period ended September 30, 2021, no changes were made to the strategic weights.
Performance review
For the twelve months ended September 30, 2021, Class A shares of Franklin Strategic Real Return Fund (prior to August 7, 2021, known as QS Strategic Real Return Fund), excluding sales charges, returned 23.37%. The Fund’s unmanaged benchmark, the Bloomberg U.S. Treasury Inflation-Linked Bond Indexiv, returned 5.19% for the same period. The Composite Indexv, representing the Fund’s underlying investments, returned 21.01% over the same time frame. The Lipper Real Return Funds Category Averagevi returned 25.38% over the same time frame.
| | | | | | | | |
| Performance Snapshot as of September 30, 2021 (unaudited) | |
| (excluding sales charges) | | 6 months | | | 12 months | |
| Franklin Strategic Real Return Fund: | | | | | | | | |
Class A | | | 8.16 | % | | | 23.37 | % |
Class C | | | 7.82 | % | | | 22.53 | % |
Class I | | | 8.38 | % | | | 23.72 | % |
Class IS | | | 8.40 | % | | | 23.88 | % |
| Bloomberg U.S. Treasury Inflation-Linked Bond Index | | | 5.06 | % | | | 5.19 | % |
| Composite Index | | | 8.26 | % | | | 21.01 | % |
| Lipper Real Return Funds Category Average | | | 7.84 | % | | | 25.38 | % |
The performance shown represents past performance. Past performance is no guarantee of future results and current performance may be higher or lower than the performance shown above. Principal value and investment returns will fluctuate and investors’ shares, when redeemed, may be worth more or less than their original cost. To obtain performance data current to the most recent month-end, please visit our website at www.franklintempleton.com.
| | | | | | |
| Franklin Strategic Real Return Fund 2021 Annual Report | | | | | 3 | |
Fund overview (cont’d)
All share class returns assume the reinvestment of all distributions at net asset value and the deduction of all Fund expenses. Returns have not been adjusted to include sales charges that may apply or the deduction of taxes that a shareholder would pay on Fund distributions. If sales charges were reflected, the performance quoted would be lower. Performance figures for periods shorter than one year represent cumulative figures and are not annualized.
Fund performance figures reflect fee waivers and/or expense reimbursements, without which the performance would have been lower.
|
| Total Annual Operating Expenses (unaudited) |
As of the Fund’s current prospectus dated January 29, 2021, the gross total annual fund operating expense ratios for Class A, Class C, Class I and Class IS shares were 1.84%, 2.48%, 1.31% and 1.20%, respectively.
Actual expenses may be higher. For example, expenses may be higher than those shown if average net assets decrease. Net assets are more likely to decrease and Fund expense ratios are more likely to increase when markets are volatile.
As a result of expense limitation arrangements, the ratio of total annual fund operating expenses, other than interest, brokerage commissions (except for brokerage commissions paid on purchases and sales of shares of exchange-traded funds (“ETFs”)), dividend expense on short sales, taxes and extraordinary expenses, to average net assets will not exceed 1.35% for Class A shares, 2.10% for Class C shares, 1.10% for Class I shares and 1.00% for Class IS shares. In addition, the ratio of total annual fund operating expenses for Class IS shares will not exceed the ratio of total annual fund operating expenses for Class I shares. Acquired fund fees and expenses are subject to these arrangements. These expense limitation arrangements cannot be terminated prior to December 31, 2022 without the Board of Trustees’ consent.
The manager is permitted to recapture amounts waived and/or reimbursed to a class within three years after the fiscal year in which the manager earned the fee or incurred the expense if the class’ total annual fund operating expenses have fallen to a level below the expense limitation (“expense cap”) in effect at the time the fees were earned or the expenses incurred. In no case will the manager recapture any amount that would result, on any particular business day of the Fund, in the class’ total annual fund operating expenses exceeding the expense cap or any other lower limit then in effect.
Q. What were the leading contributors to performance?
A. The leading contributor to absolute performance when considering return and weight in the portfolio was a 20% allocation to the Commodity-Linked Securities sleeve with a return of 56.0%. A 20% allocation to Global Equities with a return of 33.6% was also a strong contributor to absolute return as well as relative performance. The Tactical Sleeve and the Global Equities sleeve were also leading contributors relative to their respective benchmarks.
Q. What were the leading detractors from performance?
A. The allocation to Inflation-Linked Debt Securities, with the lowest return in the portfolio, was the leading detractor from absolute performance. Relative to their respective benchmarks, the leading detractors were the Commodity-Linked Securities and the Inflation-Linked Debt Securities sleeves.
| | | | |
| 4 | | | | Franklin Strategic Real Return Fund 2021 Annual Report |
Thank you for your investment in Franklin Strategic Real Return Fund. As always, we appreciate that you have chosen us to manage your assets and we remain focused on achieving the Fund’s investment goals.
Sincerely,
Franklin Advisers, Inc.
October 18, 2021
RISKS: The Fund is subject to interest rate, credit, income, prepayment and inflation risks. As interest rates rise, bond prices fall, reducing the value of a fixed income investment. Changes in inflation will cause the Fund’s income to fluctuate, sometimes substantially. Periods of deflation may adversely affect the Fund’s net asset value. Equity securities are subject to market and price fluctuations. The Fund is non-diversified, and therefore it is permitted to invest a larger percentage of its assets in a small number of issuers than a diversified fund, which may magnify the Fund’s losses from events affecting a particular issuer. The Fund is subject to the risks of the underlying funds in which it invests. In addition to the Fund’s operating expenses, you will indirectly bear the operating expenses of any underlying funds, including ETFs. Each underlying fund may engage in active and frequent trading, resulting in higher portfolio turnover and transaction costs. Derivatives, such as options and futures, can be illiquid, may disproportionately increase losses and have a potentially large impact on Fund performance. International investments are subject to special risks including currency fluctuations and social, economic and political uncertainties, which could increase volatility. These risks are magnified in emerging markets. Emerging market countries tend to have economic, political, and legal systems that are less developed and are less stable than those of more developed countries. The Fund may use leverage, which may increase volatility and possibility of loss. The Fund may invest in REITs, which are closely linked to the performance of the real estate markets. The Fund is subject to the illiquidity, credit and interest rate risks of REITs, as well as risks associated with small- and mid-cap investments. The model used to manage the Fund’s assets provides no assurance that the recommended allocation will either maximize returns or minimize risks. There is no assurance that a recommended allocation will prove the ideal allocation in all circumstances. The Fund may engage in short selling, which is a speculative strategy that involves special risks. Unlike the possible loss on a security that is purchased, there is no limit on the amount of loss on an appreciating security that is sold short. Additional risks may include those risks associated with investing in commodities, ETFs, exchange-traded notes (ETNs) and master limited partnerships (MLPs). Please see the Fund’s prospectus for a more complete discussion of these and other risks and the Fund’s investment strategies.
Portfolio holdings and breakdowns are as of September 30, 2021 and are subject to change and may not be representative of the portfolio managers’ current or future investments. Please refer to pages 13 through 24 for a list and percentage breakdown of the Fund’s holdings.
| | | | | | |
| Franklin Strategic Real Return Fund 2021 Annual Report | | | | | 5 | |
Fund overview (cont’d)
All investments are subject to risk including the possible loss of principal. Past performance is no guarantee of future results. All index performance reflects no deduction for fees, expenses or taxes. Please note that an investor cannot invest directly in an index.
The information provided is not intended to be a forecast of future events, a guarantee of future results or investment advice. Views expressed may differ from those of the firm as a whole.
| i | Real estate investment trusts (“REITs”) invest in real estate or loans secured by real estate and issue shares in such investments, which can be illiquid. |
| ii | The S&P GSCI® is a composite index of commodity sector returns representing an unleveraged, long-only investment in commodity futures that is broadly diversified across the spectrum of commodities. The returns are calculated on a fully collateralized basis with full reinvestment. |
| iii | The yield curve is the graphical depiction of the relationship between the yield on bonds of the same credit quality but different maturities. |
| iv | The Bloomberg U.S. Treasury Inflation-Linked Bond Index represents an unmanaged market index made up of U.S. Treasury Inflation Protected securities (TIPS). |
| v | The Composite Index reflects the blended rate of return of the following underlying indices: 40% Bloomberg U.S. Treasury Inflation-Linked Bond Index, 20% MSCI All Country World Index, 20% S&P GSCI®, 10% FTSE NAREIT All REITs Index and 10% FTSE 1-Month U.S. Treasury Bill Index. The Composite Index is hedged to 50% exposure to the U.S. dollar, as defined by the U.S. Dollar Index (USDX). The Composite Index’s unhedged currency exposure is predominantly U.S. dollar-based. The Fund’s target hedged currency exposure is 50% U.S. dollar, 50% non-U.S. dollar. The Fund may deviate, either up or down, from its target currency allocation due to market conditions. |
| vi | Lipper, Inc., a wholly-owned subsidiary of Refinitiv, provides independent insight on global collective investments. Returns are based on the period ended September 30, 2021, including the reinvestment of all distributions, including returns of capital, if any, calculated among the 94 funds for the six-month period and among the 93 funds for the twelve-month period in the Fund’s Lipper category, and excluding sales charges, if any. |
| | | | |
| 6 | | | | Franklin Strategic Real Return Fund 2021 Annual Report |
Fund at a glance† (unaudited)
Investment breakdown (%) as a percent of total investments
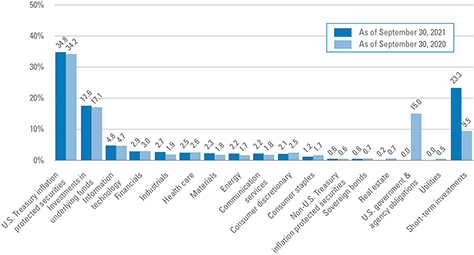
| † | The bar graph above represents the composition of the Fund’s investments as of September 30, 2021 and September 30, 2020 and does not include derivatives, such as futures contracts and forward foreign currency contracts. The Fund is actively managed. As a result, the composition of the Fund’s investments is subject to change at any time. |
| | | | | | |
| Franklin Strategic Real Return Fund 2021 Annual Report | | | | | 7 | |
Fund expenses (unaudited)
Example
As a shareholder of the Fund, you may incur two types of costs: (1) transaction costs, including front-end and back-end sales charges (loads) on purchase payments; and (2) ongoing costs, including management fees; service and/or distribution (12b-1) fees; and other Fund expenses. This example is intended to help you understand your ongoing costs (in dollars) of investing in the Fund and to compare these costs with the ongoing costs of investing in other mutual funds.
This example is based on an investment of $1,000 invested on April 1, 2021 and held for the six months ended September 30, 2021.
Actual expenses
The table below titled “Based on Actual Total Return” provides information about actual account values and actual expenses. You may use the information provided in this table, together with the amount you invested, to estimate the expenses that you paid over the period. To estimate the expenses you paid on your account, divide your ending account value by $1,000 (for example, an $8,600 ending account value divided by $1,000 = 8.6), then multiply the result by the number under the heading entitled “Expenses Paid During the Period”.
Hypothetical example for comparison purposes
The table below titled “Based on Hypothetical Total Return” provides information about hypothetical account values and hypothetical expenses based on the actual expense ratio and an assumed rate of return of 5.00% per year before expenses, which is not the Fund’s actual return. The hypothetical account values and expenses may not be used to estimate the actual ending account balance or expenses you paid for the period. You may use the information provided in this table to compare the ongoing costs of investing in the Fund and other funds. To do so, compare the 5.00% hypothetical example relating to the Fund with the 5.00% hypothetical examples that appear in the shareholder reports of the other funds.
Please note that the expenses shown in the table below are meant to highlight your ongoing costs only and do not reflect any transactional costs, such as front-end or back-end sales charges (loads). Therefore, the table is useful in comparing ongoing costs only, and will not help you determine the relative total costs of owning different funds. In addition, if these transaction costs were included, your costs would have been higher.
| | | | | | | | | | | | | | | | | | | | | | | | | | | | | | | | | | | | | | | | | | | | | | |
| | | |
| Based on actual total return1 | | | | | | | | | Based on hypothetical total return1 | |
| | | Actual
Total Return
Without
Sales
Charge2 | | | Beginning Account
Value | | | Ending
Account
Value | | | Annualized
Expense
Ratio3 | | | Expenses
Paid
During
the
Period4 | | | | | | | | Hypothetical
Annualized
Total Return | | | Beginning
Account
Value | | | Ending
Account
Value | | | Annualized
Expense
Ratio3 | | | Expenses
Paid
During
the
Period4 | |
| Class A | | | 8.16 | % | | $ | 1,000.00 | | | $ | 1,081.60 | | | | 1.30 | % | | $ | 6.78 | | | | | | | Class A | | | 5.00 | % | | $ | 1,000.00 | | | $ | 1,018.55 | | | | 1.30 | % | | $ | 6.58 | |
| Class C | | | 7.82 | | | | 1,000.00 | | | | 1,078.20 | | | | 2.04 | | | | 10.63 | | | | | | | Class C | | | 5.00 | | | | 1,000.00 | | | | 1,014.84 | | | | 2.04 | | | | 10.30 | |
| Class I | | | 8.38 | | | | 1,000.00 | | | | 1,083.80 | | | | 0.96 | | | | 5.01 | | | | | | | Class I | | | 5.00 | | | | 1,000.00 | | | | 1,020.26 | | | | 0.96 | | | | 4.86 | |
| Class IS | | | 8.40 | | | | 1,000.00 | | | | 1,084.00 | | | | 0.94 | | | | 4.91 | | | | | | | Class IS | | | 5.00 | | | | 1,000.00 | | | | 1,020.36 | | | | 0.94 | | | | 4.76 | |
| | | | |
| 8 | | | | Franklin Strategic Real Return Fund 2021 Annual Report |
Fund expenses (unaudited) (cont’d)
| 1 | For the six months ended September 30, 2021. |
| 2 | Assumes the reinvestment of all distributions, including returns of capital, if any, at net asset value and does not reflect the deduction of the applicable sales charge with respect to Class A shares or the applicable contingent deferred sales charge (“CDSC”) with respect to Class C shares. Total return is not annualized, as it may not be representative of the total return for the year. Performance figures may reflect compensating balance arrangements, fee waivers and/or expense reimbursements. In the absence of compensating balance arrangements, fee waivers and/or expense reimbursements, the total return would have been lower. Past performance is no guarantee of future results. |
| 3 | Does not include fees and expenses of the Underlying Funds in which the Fund invests. |
| 4 | Expenses (net of compensating balance arrangements, fee waivers and/or expense reimbursements) are equal to each class’ respective annualized expense ratio multiplied by the average account value over the period, multiplied by the number of days in the most recent fiscal half-year (183), then divided by 365. |
| | | | | | |
| Franklin Strategic Real Return Fund 2021 Annual Report | | | | | 9 | |
Fund performance (unaudited)
| | | | | | | | | | | | | | | | |
| Average annual total returns | | | | | | | | | | | | |
| Without sales charges1 | | Class A | | | Class C | | | Class I | | | Class IS | |
| Twelve Months Ended 9/30/21 | | | 23.37 | % | | | 22.53 | % | | | 23.72 | % | | | 23.88 | % |
| Five Years Ended 9/30/21 | | | 6.03 | | | | 5.23 | | | | 6.30 | | | | 6.40 | |
| Ten Years Ended 9/30/21 | | | 3.37 | | | | 2.60 | | | | 3.63 | | | | N/A | |
| Inception* through 9/30/21 | | | — | | | | — | | | | — | | | | 3.37 | |
| | | | |
| With sales charges2 | | Class A | | | Class C | | | Class I | | | Class IS | |
| Twelve Months Ended 9/30/21 | | | 16.32 | % | | | 21.53 | % | | | 23.72 | % | | | 23.88 | % |
| Five Years Ended 9/30/21 | | | 4.78 | | | | 5.23 | | | | 6.30 | | | | 6.40 | |
| Ten Years Ended 9/30/21 | | | 2.76 | | | | 2.60 | | | | 3.63 | | | | N/A | |
| Inception* through 9/30/21 | | | — | | | | — | | | | — | | | | 3.37 | |
| | | | |
| Cumulative total returns | |
| Without sales charges1 | | | |
| Class A (9/30/11 through 9/30/21) | | | 39.31 | % |
| Class C (9/30/11 through 9/30/21) | | | 29.31 | |
| Class I (9/30/11 through 9/30/21) | | | 42.88 | |
| Class IS (Inception date of 12/15/11 through 9/30/21) | | | 38.41 | |
All figures represent past performance and are not a guarantee of future results. Investment return and principal value of an investment will fluctuate so that an investor’s shares, when redeemed, may be worth more or less than their original cost. The returns shown do not reflect the deduction of taxes that a shareholder would pay on Fund distributions or the redemption of Fund shares. Performance figures may reflect compensating balance arrangements, fee waivers and/or expense reimbursements. In the absence of compensating balance arrangements, fee waivers and/or expense reimbursements, the total return would have been lower.
| 1 | Assumes the reinvestment of all distributions, including returns of capital, if any, at net asset value and does not reflect the deduction of the applicable sales charge with respect to Class A shares or the applicable contingent deferred sales charge (“CDSC”) with respect to Class C shares. |
| 2 | Assumes the reinvestment of all distributions, including returns of capital, if any, at net asset value. In addition, Class A shares reflect the deduction of the maximum initial sales charge of 5.75%. Class C shares reflect the deduction of a 1.00% CDSC, which applies if shares are redeemed within one year from purchase payment. |
| * | Inception dates for Class A, C, I and IS shares are February 26, 2010, February 26, 2010, February 26, 2010 and December 15, 2011, respectively. |
| | | | |
| 10 | | | | Franklin Strategic Real Return Fund 2021 Annual Report |
Fund performance (unaudited) (cont’d)
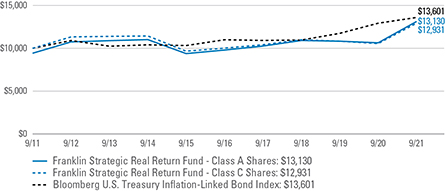
Historical performance
Value of $10,000 invested in
Class A and C Shares of Franklin Strategic Real Return Fund vs. Bloomberg U.S. Treasury Inflation-Linked Bond Index‡ — September 2011 - September 2021
Value of $1,000,000 invested in
Class I Shares of Franklin Strategic Real Return Fund vs. Bloomberg U.S. Treasury Inflation-Linked Bond Index‡ — September 2011 - September 2021
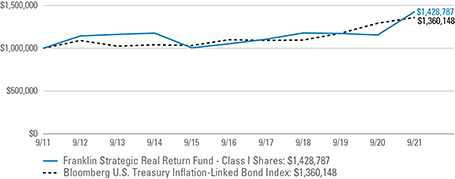
All figures represent past performance and are not a guarantee of future results. Investment return and principal value of an investment will fluctuate so that an investor’s shares, when redeemed, may be worth more or less than their original cost. The returns shown do not reflect the deduction of taxes that a shareholder would pay on Fund distributions or the redemption of Fund shares. Performance figures may reflect compensating balance arrangements, fee waivers and/or expense reimbursements. In the absence of compensating balance arrangements, fee waivers and/or expense reimbursements, the total return would have been lower.
| ‡ | Hypothetical illustration of $10,000 invested in Class A and C shares and $1,000,000 invested in Class I shares of Franklin Strategic Real Return Fund on September 30, 2011, assuming the deduction of the maximum initial sales charge of 5.75% at the time of investment for Class A shares and the reinvestment of all distributions, |
| | | | | | |
| Franklin Strategic Real Return Fund 2021 Annual Report | | | | | 11 | |
Fund performance (unaudited) (cont’d)
| including returns of capital, if any, at net asset value through September 30, 2021. The hypothetical illustration also assumes a $10,000 or $1,000,000 investment, as applicable, in the Bloomberg U.S. Treasury Inflation-Linked Bond Index. The Bloomberg U.S. Treasury Inflation-Linked Bond Index represents an unmanaged market index made up of U.S. Treasury Inflation-Linked Index securities. Please note that an investor cannot invest directly in an index. The performance of the Fund’s other classes may be greater or less than the Class A, C and I shares’ performance indicated on these charts, depending on whether greater or lesser sales charges and fees were incurred by shareholders investing in the other classes. |
| | | | |
| 12 | | | | Franklin Strategic Real Return Fund 2021 Annual Report |
Consolidated schedule of investments
September 30, 2021
Franklin Strategic Real Return Fund
(Percentages shown based on Fund net assets)
| | | | | | | | | | | | | | | | |
Security | | Rate | | | Maturity Date | | | Face Amount† | | | Value | |
| U.S. Treasury Inflation Protected Securities — 34.3% | | | | | | | | | | | | | | | | |
U.S. Treasury Bonds, Inflation Indexed | | | 2.500 | % | | | 1/15/29 | | | | 1,271,560 | | | $ | 1,629,670 | |
U.S. Treasury Bonds, Inflation Indexed | | | 3.875 | % | | | 4/15/29 | | | | 2,158,871 | | | | 3,013,201 | |
U.S. Treasury Bonds, Inflation Indexed | | | 2.125 | % | | | 2/15/40 | | | | 757,854 | | | | 1,129,263 | |
U.S. Treasury Bonds, Inflation Indexed | | | 2.125 | % | | | 2/15/41 | | | | 536,055 | | | | 808,111 | |
U.S. Treasury Bonds, Inflation Indexed | | | 0.750 | % | | | 2/15/42 | | | | 2,392,216 | | | | 2,917,762 | |
U.S. Treasury Bonds, Inflation Indexed | | | 1.375 | % | | | 2/15/44 | | | | 3,244,750 | | | | 4,461,836 | |
U.S. Treasury Notes, Inflation Indexed | | | 0.125 | % | | | 4/15/22 | | | | 2,020,626 | | | | 2,048,942 | |
U.S. Treasury Notes, Inflation Indexed | | | 0.125 | % | | | 1/15/23 | | | | 2,128,932 | | | | 2,201,209 | |
U.S. Treasury Notes, Inflation Indexed | | | 0.625 | % | | | 4/15/23 | | | | 2,198,160 | | | | 2,300,411 | |
U.S. Treasury Notes, Inflation Indexed | | | 0.375 | % | | | 7/15/23 | | | | 1,173,110 | | | | 1,236,113 | |
U.S. Treasury Notes, Inflation Indexed | | | 0.625 | % | | | 1/15/24 | | | | 1,638,042 | | | | 1,748,052 | |
U.S. Treasury Notes, Inflation Indexed | | | 0.500 | % | | | 4/15/24 | | | | 1,612,851 | | | | 1,722,851 | |
U.S. Treasury Notes, Inflation Indexed | | | 0.625 | % | | | 1/15/26 | | | | 5,951,561 | | | | 6,571,614 | |
U.S. Treasury Notes, Inflation Indexed | | | 0.125 | % | | | 4/15/26 | | | | 2,810,700 | | | | 3,044,009 | |
U.S. Treasury Notes, Inflation Indexed | | | 0.875 | % | | | 1/15/29 | | | | 432,476 | | | | 500,019 | |
U.S. Treasury Notes, Inflation Indexed | | | 0.250 | % | | | 7/15/29 | | | | 747,096 | | | | 831,761 | |
U.S. Treasury Notes, Inflation Indexed | | | 0.125 | % | | | 1/15/30 | | | | 1,803,870 | | | | 1,983,294 | |
Total U.S. Treasury Inflation Protected Securities (Cost — $35,764,392) | | | | | | | | | | | | | | | 38,148,118 | |
| | | | | | | | |
| | | Shares | | | | |
| Common Stocks — 20.5% | | | | | | | | |
| Communication Services — 2.2% | | | | | | | | |
Diversified Telecommunication Services — 0.1% | | | | | | | | |
LG Uplus Corp. | | | 9,934 | | | | 124,719 (a) | |
Entertainment — 0.6% | | | | | | | | |
Activision Blizzard Inc. | | | 1,738 | | | | 134,504 | |
Electronic Arts Inc. | | | 970 | | | | 137,982 | |
NetEase Inc., ADR | | | 1,430 | | | | 122,122 | |
Nintendo Co. Ltd. | | | 300 | | | | 145,938 | (a) |
Take-Two Interactive Software Inc. | | | 700 | | | | 107,849 | * |
Total Entertainment | | | | | | | 648,395 | |
Interactive Media & Services — 1.1% | | | | | | | | |
Alphabet Inc., Class A Shares | | | 153 | | | | 409,049 | * |
Alphabet Inc., Class C Shares | | | 140 | | | | 373,143 | * |
Auto Trader Group PLC | | | 14,233 | | | | 112,624 | (a) |
Baidu Inc., ADR | | | 832 | | | | 127,920 | * |
Facebook Inc., Class A Shares | | | 432 | | | | 146,617 | * |
Total Interactive Media & Services | | | | | | | 1,169,353 | |
See Notes to Consolidated Financial Statements.
| | | | | | |
| Franklin Strategic Real Return Fund 2021 Annual Report | | | | | 13 | |
Consolidated schedule of investments (cont’d)
September 30, 2021
Franklin Strategic Real Return Fund
(Percentages shown based on Fund net assets)
| | | | | | | | |
| Security | | Shares | | | Value | |
Wireless Telecommunication Services — 0.4% | | | | | | | | |
KDDI Corp. | | | 4,500 | | | $ | 148,714 | (a) |
MTN Group Ltd. | | | 17,300 | | | | 162,365 | *(a) |
SoftBank Corp. | | | 10,600 | | | | 143,919 | (a) |
Total Wireless Telecommunication Services | | | | | | | 454,998 | |
Total Communication Services | | | | | | | 2,397,465 | |
| Consumer Discretionary — 2.1% | | | | | | | | |
Auto Components — 0.1% | | | | | | | | |
Magna International Inc. | | | 2,100 | | | | 158,039 | |
Hotels, Restaurants & Leisure — 0.3% | | | | | | | | |
Brinker International Inc. | | | 2,278 | | | | 111,736 | * |
Jack in the Box Inc. | | | 1,195 | | | | 116,309 | |
Yum! Brands Inc. | | | 1,142 | | | | 139,678 | |
Total Hotels, Restaurants & Leisure | | | | | | | 367,723 | |
Household Durables — 0.1% | | | | | | | | |
PulteGroup Inc. | | | 2,400 | | | | 110,208 | |
Internet & Direct Marketing Retail — 0.5% | | | | | | | | |
Amazon.com Inc. | | | 122 | | | | 400,775 | * |
eBay Inc. | | | 2,100 | | | | 146,307 | |
Total Internet & Direct Marketing Retail | | | | | | | 547,082 | |
Multiline Retail — 0.1% | | | | | | | | |
Canadian Tire Corp. Ltd., Class A Shares | | | 800 | | | | 111,947 | |
Specialty Retail — 0.6% | | | | | | | | |
Home Depot Inc. | | | 388 | | | | 127,365 | |
Lowe’s Cos. Inc. | | | 1,669 | | | | 338,573 | |
TJX Cos. Inc. | | | 2,500 | | | | 164,950 | |
Total Specialty Retail | | | | | | | 630,888 | |
Textiles, Apparel & Luxury Goods — 0.4% | | | | | | | | |
Deckers Outdoor Corp. | | | 300 | | | | 108,060 | * |
Pandora A/S | | | 1,738 | | | | 210,767 | (a) |
Under Armour Inc., Class A Shares | | | 3,697 | | | | 74,606 | * |
Total Textiles, Apparel & Luxury Goods | | | | | | | 393,433 | |
Total Consumer Discretionary | | | | | | | 2,319,320 | |
| Consumer Staples — 1.2% | | | | | | | | |
Food & Staples Retailing — 0.6% | | | | | | | | |
Alimentation Couche-Tard Inc., Class B Shares | | | 3,000 | | | | 114,780 | |
George Weston Ltd. | | | 1,300 | | | | 140,223 | |
Walgreens Boots Alliance Inc. | | | 3,800 | | | | 178,790 | |
Walmart Inc. | | | 1,403 | | | | 195,550 | |
Total Food & Staples Retailing | | | | | | | 629,343 | |
See Notes to Consolidated Financial Statements.
| | | | |
| 14 | | | | Franklin Strategic Real Return Fund 2021 Annual Report |
Consolidated schedule of investments (cont’d)
September 30, 2021
Franklin Strategic Real Return Fund
(Percentages shown based on Fund net assets)
| | | | | | | | |
| Security | | Shares | | | Value | |
Food Products — 0.2% | | | | | | | | |
Ingredion Inc. | | | 1,017 | | | $ | 90,523 | |
JBS SA | | | 17,000 | | | | 115,441 | |
Total Food Products | | | | | | | 205,964 | |
Household Products — 0.2% | | | | | | | | |
Procter & Gamble Co. | | | 1,229 | | | | 171,814 | |
Personal Products — 0.1% | | | | | | | | |
Estee Lauder Cos. Inc., Class A Shares | | | 550 | | | | 164,961 | |
Tobacco — 0.1% | | | | | | | | |
Swedish Match AB | | | 15,710 | | | | 137,778 | (a) |
Total Consumer Staples | | | | | | | 1,309,860 | |
| Energy — 0.9% | | | | | | | | |
Oil, Gas & Consumable Fuels — 0.9% | | | | | | | | |
BP PLC | | | 42,400 | | | | 192,074 | (a) |
China Shenhua Energy Co. Ltd., Class H Shares | | | 54,500 | | | | 127,298 | (a) |
Exxon Mobil Corp. | | | 3,700 | | | | 217,634 | |
Lundin Energy AB | | | 4,200 | | | | 155,911 | (a) |
Marathon Petroleum Corp. | | | 2,300 | | | | 142,163 | |
Royal Dutch Shell PLC, Class A Shares | | | 8,900 | | | | 196,618 | (a) |
Total Energy | | | | | | | 1,031,698 | |
| Financials — 2.8% | | | | | | | | |
Banks — 1.3% | | | | | | | | |
Banco Bilbao Vizcaya Argentaria SA | | | 19,409 | | | | 128,032 | (a) |
Bank of America Corp. | | | 2,850 | | | | 120,982 | |
Citigroup Inc. | | | 2,433 | | | | 170,748 | |
Citizens Financial Group Inc. | | | 4,969 | | | | 233,444 | |
Comerica Inc. | | | 2,726 | | | | 219,443 | |
JPMorgan Chase & Co. | | | 750 | | | | 122,767 | |
Lloyds Banking Group PLC | | | 189,203 | | | | 117,694 | (a) |
Postal Savings Bank of China Co. Ltd., Class H Shares | | | 129,000 | | | | 88,942 | (a) |
Wells Fargo & Co. | | | 4,400 | | | | 204,204 | |
Total Banks | | | | | | | 1,406,256 | |
Capital Markets — 0.3% | | | | | | | | |
Ameriprise Financial Inc. | | | 826 | | | | 218,163 | |
CI Financial Corp. | | | 8,000 | | | | 162,388 | |
Total Capital Markets | | | | | | | 380,551 | |
Consumer Finance — 0.6% | | | | | | | | |
Capital One Financial Corp. | | | 1,533 | | | | 248,300 | |
Discover Financial Services | | | 2,006 | | | | 246,437 | |
Synchrony Financial | | | 4,482 | | | | 219,080 | |
Total Consumer Finance | | | | | | | 713,817 | |
See Notes to Consolidated Financial Statements.
| | | | | | |
| Franklin Strategic Real Return Fund 2021 Annual Report | | | | | 15 | |
Consolidated schedule of investments (cont’d)
September 30, 2021
Franklin Strategic Real Return Fund
(Percentages shown based on Fund net assets)
| | | | | | | | |
| Security | | Shares | | | Value | |
Insurance — 0.6% | | | | | | | | |
Allianz SE, Registered Shares | | | 909 | | | $ | 205,019 | (a) |
Allstate Corp. | | | 1,570 | | | | 199,877 | |
Legal & General Group PLC | | | 29,298 | | | | 110,637 | (a) |
Prudential Financial Inc. | | | 1,139 | | | | 119,823 | |
Total Insurance | | | | | | | 635,356 | |
Total Financials | | | | | | | 3,135,980 | |
| Health Care — 2.5% | | | | | | | | |
Biotechnology — 0.5% | | | | | | | | |
Biogen Inc. | | | 488 | | | | 138,099 | * |
Regeneron Pharmaceuticals Inc. | | | 329 | | | | 199,104 | * |
Vertex Pharmaceuticals Inc. | | | 960 | | | | 174,135 | * |
Total Biotechnology | | | | | | | 511,338 | |
Health Care Equipment & Supplies — 0.2% | | | | | | | | |
Masimo Corp. | | | 711 | | | | 192,475 | * |
Health Care Providers & Services — 1.0% | | | | | | | | |
Anthem Inc. | | | 530 | | | | 197,584 | |
Cardinal Health Inc. | | | 2,000 | | | | 98,920 | |
HCA Healthcare Inc. | | | 860 | | | | 208,739 | |
McKesson Corp. | | | 832 | | | | 165,884 | |
Molina Healthcare Inc. | | | 650 | | | | 176,351 | * |
UnitedHealth Group Inc. | | | 790 | | | | 308,685 | |
Total Health Care Providers & Services | | | | | | | 1,156,163 | |
Health Care Technology — 0.1% | | | | | | | | |
Veeva Systems Inc., Class A Shares | | | 500 | | | | 144,085 | * |
Life Sciences Tools & Services — 0.2% | | | | | | | | |
Bio-Rad Laboratories Inc., Class A Shares | | | 260 | | | | 193,947 | * |
Pharmaceuticals — 0.5% | | | | | | | | |
Novo Nordisk A/S, Class B Shares | | | 1,987 | | | | 191,120 | (a) |
Ono Pharmaceutical Co. Ltd. | | | 6,400 | | | | 145,968 | (a) |
Pfizer Inc. | | | 2,700 | | | | 116,127 | |
Shionogi & Co. Ltd. | | | 1,900 | | | | 130,160 | (a) |
Total Pharmaceuticals | | | | | | | 583,375 | |
Total Health Care | | | | | | | 2,781,383 | |
| Industrials — 2.7% | | | | | | | | |
Air Freight & Logistics — 0.3% | | | | | | | | |
Deutsche Post AG, Registered Shares | | | 2,600 | | | | 163,869 | (a) |
United Parcel Service Inc., Class B Shares | | | 880 | | | | 160,248 | |
Total Air Freight & Logistics | | | | | | | 324,117 | |
See Notes to Consolidated Financial Statements.
| | | | |
| 16 | | | | Franklin Strategic Real Return Fund 2021 Annual Report |
Franklin Strategic Real Return Fund
(Percentages shown based on Fund net assets)
| | | | | | | | | | | | | | | | |
| Security | | | | | | | | Shares | | | Value | |
Building Products — 0.2% | | | | | | | | | | | | | | | | |
Lennox International Inc. | | | | | | | | | | | 400 | | | | $117,668 | |
Masco Corp. | | | | | | | | | | | 2,000 | | | | 111,100 | |
Total Building Products | | | | | | | | | | | | | | | 228,768 | |
Electrical Equipment — 0.1% | | | | | | | | | | | | | | | | |
ABB Ltd., Registered Shares | | | | | | | | | | | 4,100 | | | | 136,662 | (a) |
Industrial Conglomerates — 0.3% | | | | | | | | | | | | | | | | |
3M Co. | | | | | | | | | | | 800 | | | | 140,336 | |
CITIC Ltd. | | | | | | | | | | | 65,000 | | | | 68,532 | (a) |
LG Corp. | | | | | | | | | | | 1,167 | | | | 90,761 | (a) |
Total Industrial Conglomerates | | | | | | | | | | | | | | | 299,629 | |
Machinery — 0.8% | | | | | | | | | | | | | | | | |
Caterpillar Inc. | | | | | | | | | | | 840 | | | | 161,255 | |
CNH Industrial NV | | | | | | | | | | | 9,000 | | | | 152,390 | (a) |
Cummins Inc. | | | | | | | | | | | 1,043 | | | | 234,216 | |
GEA Group AG | | | | | | | | | | | 2,500 | | | | 114,571 | (a) |
Volvo AB, Class B Shares | | | | | | | | | | | 6,300 | | | | 141,544 | (a) |
Zoomlion Heavy Industry Science and Technology Co. Ltd., Class H Shares | | | | | | | | | | | 125,200 | | | | 111,784 | (a) |
Total Machinery | | | | | | | | | | | | | | | 915,760 | |
Marine — 0.2% | | | | | | | | | | | | | | | | |
A.P. Moller - Maersk A/S, Class B Shares | | | | | | | | | | | 60 | | | | 162,298 | (a) |
Professional Services — 0.3% | | | | | | | | | | | | | | | | |
ManpowerGroup Inc. | | | | | | | | | | | 1,515 | | | | 164,044 | |
Wolters Kluwer NV | | | | | | | | | | | 1,617 | | | | 170,922 | (a) |
Total Professional Services | | | | | | | | | | | | | | | 334,966 | |
Trading Companies & Distributors — 0.5% | | | | | | | | | | | | | | | | |
Marubeni Corp. | | | | | | | | | | | 18,400 | | | | 150,970 | (a) |
Mitsubishi Corp. | | | | | | | | | | | 4,600 | | | | 143,900 | (a) |
Sumitomo Corp. | | | | | | | | | | | 10,800 | | | | 150,998 | (a) |
W.W. Grainger Inc. | | | | | | | | | | | 332 | | | | 130,496 | |
Total Trading Companies & Distributors | | | | | | | | | | | | | | | 576,364 | |
Total Industrials | | | | | | | | | | | | | | | 2,978,564 | |
| Information Technology — 4.8% | | | | | | | | | | | | | | | | |
Communications Equipment — 0.2% | | | | | | | | | | | | | | | | |
Cisco Systems Inc. | | | | | | | | | | | 4,008 | | | | 218,155 | |
Electronic Equipment, Instruments & Components — 0.1% | | | | | | | | | | | | | | | | |
Hon Hai Precision Industry Co. Ltd. | | | | | | | | | | | 32,000 | | | | 119,590 | (a) |
IT Services — 0.4% | | | | | | | | | | | | | | | | |
Adyen NV | | | | | | | | | | | 47 | | | | 130,687 | *(a) |
See Notes to Consolidated Financial Statements.
| | | | | | |
| Franklin Strategic Real Return Fund 2021 Annual Report | | | | | 17 | |
Consolidated schedule of investments (cont’d)
September 30, 2021
Franklin Strategic Real Return Fund
(Percentages shown based on Fund net assets)
| | | | | | | | | | | | |
| Security | | Shares | | | | | | Value | |
IT Services — continued | | | | | | | | | | | | |
CGI Inc. | | | 1,600 | | | | $ | | | | 135,910 | * |
Gartner Inc. | | | 600 | | | | | | | | 182,328 | * |
Total IT Services | | | | | | | | | | | 448,925 | |
Semiconductors & Semiconductor Equipment — 1.6% | | | | | | | | | | | | |
Applied Materials Inc. | | | 2,201 | | | | | | | | 283,335 | |
ASM International NV | | | 632 | | | | | | | | 246,758 | (a) |
ASML Holding NV | | | 430 | | | | | | | | 317,199 | (a) |
KLA Corp. | | | 672 | | | | | | | | 224,791 | |
MediaTek Inc. | | | 4,000 | | | | | | | | 128,933 | (a) |
Powertech Technology Inc. | | | 23,000 | | | | | | | | 85,059 | (a) |
QUALCOMM Inc. | | | 1,235 | | | | | | | | 159,290 | |
United Microelectronics Corp. | | | 131,000 | | | | | | | | 298,923 | (a) |
Total Semiconductors & Semiconductor Equipment | | | | | | | | | | | 1,744,288 | |
Software — 1.1% | | | | | | | | | | | | |
Check Point Software Technologies Ltd. | | | 1,224 | | | | | | | | 138,361 | * |
Fortinet Inc. | | | 600 | | | | | | | | 175,224 | * |
Microsoft Corp. | | | 3,220 | | | | | | | | 907,782 | |
Total Software | | | | | | | | | | | 1,221,367 | |
Technology Hardware, Storage & Peripherals — 1.4% | | | | | | | | | | | | |
Apple Inc. | | | 7,732 | | | | | | | | 1,094,078 | |
Logitech International SA, Registered Shares | | | 1,300 | | | | | | | | 115,133 | (a) |
Samsung Electronics Co. Ltd. | | | 5,026 | | | | | | | | 312,812 | (a) |
Total Technology Hardware, Storage & Peripherals | | | | | | | | | | | 1,522,023 | |
Total Information Technology | | | | | | | | | | | 5,274,348 | |
| Materials — 1.1% | | | | | | | | | | | | |
Chemicals — 0.1% | | | | | | | | | | | | |
Huntsman Corp. | | | 4,912 | | | | | | | | 145,346 | |
Metals & Mining — 0.9% | | | | | | | | | | | | |
Anglo American Platinum Ltd. | | | 1,016 | | | | | | | | 87,929 | (a) |
BHP Group PLC | | | 5,600 | | | | | | | | 139,571 | (a) |
First Quantum Minerals Ltd. | | | 6,600 | | | | | | | | 122,193 | |
Fortescue Metals Group Ltd. | | | 11,700 | | | | | | | | 123,383 | (a) |
Kinross Gold Corp. | | | 11,300 | | | | | | | | 60,577 | |
POSCO | | | 400 | | | | | | | | 111,174 | (a) |
Rio Tinto PLC | | | 2,750 | | | | | | | | 181,572 | (a) |
Vale SA | | | 9,800 | | | | | | | | 136,497 | |
Total Metals & Mining | | | | | | | | | | | 962,896 | |
Paper & Forest Products — 0.1% | | | | | | | | | | | | |
Louisiana-Pacific Corp. | | | 2,000 | | | | | | | | 122,740 | |
Total Materials | | | | | | | | | | | 1,230,982 | |
See Notes to Consolidated Financial Statements.
| | | | |
| 18 | | | | Franklin Strategic Real Return Fund 2021 Annual Report |
Franklin Strategic Real Return Fund
(Percentages shown based on Fund net assets)
| | | | | | | | | | | | | | | | |
| Security | | | | | | | | Shares | | | Value | |
| Real Estate — 0.2% | | | | | | | | | | | | | | | | |
Real Estate Management & Development — 0.2% | | | | | | | | | | | | | | | | |
Daito Trust Construction Co. Ltd. | | | | | | | | | | | 1,300 | | | $ | 151,779 | (a) |
Sun Hung Kai Properties Ltd. | | | | | | | | | | | 8,500 | | | | 105,633 | (a) |
Total Real Estate | | | | | | | | | | | | | | | 257,412 | |
Total Common Stocks (Cost — $15,520,365) | | | | | | | | | | | | | | | 22,717,012 | |
| Investments in Underlying Funds — 17.4% | | | | | | | | | | | | | | | | |
Invesco S&P 500 Quality ETF | | | | | | | | | | | 69,809 | | | | 3,389,227 | |
iShares Core High Dividend ETF | | | | | | | | | | | 11,471 | | | | 1,081,257 | |
Vanguard Dividend Appreciation ETF | | | | | | | | | | | 8,960 | | | | 1,376,256 | |
Vanguard Mega Cap Value ETF | | | | | | | | | | | 10,734 | | | | 1,050,322 | |
Vanguard Real Estate ETF | | | | | | | | | | | 121,890 | | | | 12,405,964 | |
Total Investments in Underlying Funds (Cost — $11,188,428) | | | | | | | | | | | | 19,303,026 | |
| | | | |
| | | Rate | | | Maturity
Date | | | Face
Amount† | | | | |
| Corporate Bonds & Notes — 2.4% | | | | | | | | | | | | | | | | |
| Energy — 1.2% | | | | | | | | | | | | | | | | |
Energy Equipment & Services — 0.0%†† | | | | | | | | | | | | | | | | |
Halliburton Co., Senior Notes | | | 3.800 | % | | | 11/15/25 | | | | 4,000 | | | | 4,383 | |
Oil, Gas & Consumable Fuels — 1.2% | | | | | | | | | | | | | | | | |
Apache Corp., Senior Notes | | | 2.625 | % | | | 1/15/23 | | | | 29,000 | | | | 29,327 | |
Apache Corp., Senior Notes | | | 4.750 | % | | | 4/15/43 | | | | 60,000 | | | | 65,078 | |
BP Capital Markets America Inc., Senior Notes | | | 3.588 | % | | | 4/14/27 | | | | 240,000 | | | | 265,174 | |
Devon Energy Corp., Senior Notes | | | 5.850 | % | | | 12/15/25 | | | | 230,000 | | | | 266,314 | |
Energy Transfer LP, Senior Notes | | | 2.900 | % | | | 5/15/25 | | | | 20,000 | | | | 20,972 | |
Enterprise Products Operating LLC, Senior Notes | | | 3.125 | % | | | 7/31/29 | | | | 120,000 | | | | 128,955 | |
Enterprise Products Operating LLC, Senior Notes | | | 2.800 | % | | | 1/31/30 | | | | 60,000 | | | | 62,731 | |
Exxon Mobil Corp., Senior Notes | | | 3.043 | % | | | 3/1/26 | | | | 50,000 | | | | 53,990 | |
Kinder Morgan Inc., Senior Notes | | | 4.300 | % | | | 6/1/25 | | | | 80,000 | | | | 88,391 | |
Occidental Petroleum Corp., Senior Notes | | | 5.550 | % | | | 3/15/26 | | | | 40,000 | | | | 44,452 | |
Occidental Petroleum Corp., Senior Notes | | | 3.000 | % | | | 2/15/27 | | | | 60,000 | | | | 60,063 | |
Occidental Petroleum Corp., Senior Notes | | | 3.500 | % | | | 8/15/29 | | | | 50,000 | | | | 50,918 | |
Targa Resources Partners LP/Targa Resources | | | | | | | | | | | | | | | | |
Partners Finance Corp., Senior Notes | | | 5.375 | % | | | 2/1/27 | | | | 100,000 | | | | 103,745 | |
Transcontinental Gas Pipe Line Co. LLC, Senior | | | | | | | | | | | | | | | | |
Notes | | | 7.850 | % | | | 2/1/26 | | | | 80,000 | | | | 99,789 | |
Western Midstream Operating LP, Senior Notes | | | 4.350 | % | | | 2/1/25 | | | | 30,000 | | | | 31,694 | |
Total Oil, Gas & Consumable Fuels | | | | | | | | | | | | | | | 1,371,593 | |
Total Energy | | | | | | | | | | | | | | | 1,375,976 | |
See Notes to Consolidated Financial Statements.
| | | | | | |
| Franklin Strategic Real Return Fund 2021 Annual Report | | | | | 19 | |
Consolidated schedule of investments (cont’d)
September 30, 2021
Franklin Strategic Real Return Fund
(Percentages shown based on Fund net assets)
| | | | | | | | | | | | | | | | |
| Security | | Rate | | | Maturity
Date | | | Face
Amount† | | | Value | |
| Materials — 1.2% | | | | | | | | | | | | | | | | |
Metals & Mining — 1.0% | | | | | | | | | | | | | | | | |
Anglo American Capital PLC, Senior Notes | | | 4.000 | % | | | 9/11/27 | | | | 200,000 | | | $ | 220,581 | (b) |
Antofagasta PLC, Senior Notes | | | 2.375 | % | | | 10/14/30 | | | | 200,000 | | | | 193,252 | (b) |
ArcelorMittal SA, Senior Notes | | | 7.000 | % | | | 10/15/39 | | | | 50,000 | | | | 70,623 | |
Glencore Funding LLC, Senior Notes | | | 4.125 | % | | | 3/12/24 | | | | 40,000 | | | | 42,863 | (b) |
Glencore Funding LLC, Senior Notes | | | 4.000 | % | | | 3/27/27 | | | | 50,000 | | | | 55,019 | (b) |
Glencore Funding LLC, Senior Notes | | | 3.875 | % | | | 10/27/27 | | | | 90,000 | | | | 98,357 | (b) |
Southern Copper Corp., Senior Notes | | | 5.250 | % | | | 11/8/42 | | | | 220,000 | | | | 273,625 | |
Teck Resources Ltd., Senior Notes | | | 3.750 | % | | | 2/1/23 | | | | 40,000 | | | | 40,879 | |
Vale Overseas Ltd., Senior Notes | | | 6.250 | % | | | 8/10/26 | | | | 50,000 | | | | 59,149 | |
Total Metals & Mining | | | | | | | | | | | | | | | 1,054,348 | |
Paper & Forest Products — 0.2% | | | | | | | | | | | | | | | | |
Inversiones CMPC SA, Senior Notes | | | 4.375 | % | | | 4/4/27 | | | | 200,000 | | | | 220,950 | (c) |
Total Materials | | | | | | | | | | | | | | | 1,275,298 | |
Total Corporate Bonds & Notes (Cost — $2,417,539) | | | | | | | | | | | | 2,651,274 | |
| Non-U.S. Treasury Inflation Protected Securities — 0.6% | | | | | | | | | | | | | |
Brazil — 0.3% | | | | | | | | | | | | | | | | |
Brazil Notas do Tesouro Nacional Serie B, Notes | | | 6.000 | % | | | 8/15/30 | | | | 1,707,792 | BRL | | | 342,057 | |
Canada — 0.3% | | | | | | | | | | | | | | | | |
Canadian Government Real Return Bond | | | 1.500 | % | | | 12/1/44 | | | | 172,336 | CAD | | | 174,373 | |
Canadian Government Real Return Bond | | | 0.500 | % | | | 12/1/50 | | | | 131,388 | CAD | | | 110,894 | |
Total Canada | | | | | | | | | | | | | | | 285,267 | |
Total Non-U.S. Treasury Inflation Protected Securities (Cost — $753,046) | | | | 627,324 | |
| Sovereign Bonds — 0.5% | | | | | | | | | | | | | | | | |
Indonesia — 0.2% | | | | | | | | | | | | | | | | |
Indonesia Government International Bond, Senior Notes | | | 4.750 | % | | | 2/11/29 | | | | 200,000 | | | | 233,447 | |
Peru — 0.1% | | | | | | | | | | | | | | | | |
Peruvian Government International Bond, Senior Notes | | | 2.783 | % | | | 1/23/31 | | | | 160,000 | | | | 158,736 | |
United Arab Emirates — 0.2% | | | | | | | | | | | | | | | | |
Abu Dhabi Government International Bond, Senior | | | | | | | | | | | | | | | | |
Notes | | | 2.500 | % | | | 9/30/29 | | | | 200,000 | | | | 209,104 | (b) |
Total Sovereign Bonds (Cost — $582,312) | | | | | | | | | | | | | | | 601,287 | |
Total Investments before Short-Term Investments (Cost — $66,226,082) | | | | | | | | 84,048,041 | |
See Notes to Consolidated Financial Statements.
| | | | |
| 20 | | | | Franklin Strategic Real Return Fund 2021 Annual Report |
Franklin Strategic Real Return Fund
(Percentages shown based on Fund net assets)
| | | | | | | | | | | | |
| Security | | Rate | | | Shares | | | Value | |
| Short-Term Investments — 23.0% | | | | | | | | | | | | |
Dreyfus Government Cash Management, | | | | | | | | | | | | |
Institutional Shares | | | 0.030 | % | | | 244,393 | | | $ | 244,393 | |
Invesco Government & Agency Portfolio, | | | | | | | | | | | | |
Institutional Class | | | 0.026 | % | | | 25,123,365 | | | | 25,123,365 | |
Invesco Treasury Portfolio, Institutional Class | | | 0.010 | % | | | 113,454 | | | | 113,454 | |
Total Short-Term Investments (Cost — $25,481,212) | | | | | | | | 25,481,212 | |
Total Investments — 98.7% (Cost — $91,707,294) | | | | | | | | | | | 109,529,253 | |
Other Assets in Excess of Liabilities — 1.3% | | | | | | | | | | | 1,493,537 | |
Total Net Assets — 100.0% | | | | | | | | | | $ | 111,022,790 | |
| † | Face amount denominated in U.S. dollars, unless otherwise noted. |
| †† | Represents less than 0.1%. |
| * | Non-income producing security. |
| (a) | Security is valued in good faith in accordance with procedures approved by the Board of Trustees (Note 1). |
| (b) | Security is exempt from registration under Rule 144A of the Securities Act of 1933. This security may be resold in transactions that are exempt from registration, normally to qualified institutional buyers. This security has been deemed liquid pursuant to guidelines approved by the Board of Trustees. |
| (c) | Security is exempt from registration under Regulation S of the Securities Act of 1933. Regulation S applies to securities offerings that are made outside of the United States and do not involve direct selling efforts in the United States. This security has been deemed liquid pursuant to guidelines approved by the Board of Trustees. |
| | |
Abbreviation(s) used in this schedule: |
| |
ADR | | — American Depositary Receipts |
| |
BRL | | — Brazilian Real |
| |
CAD | | — Canadian Dollar |
| |
ETF | | — Exchange-Traded Fund |
At September 30, 2021, the Fund had the following open futures contracts:
| | | | | | | | | | | | | | | | | | | | |
| | | Number of
Contracts | | | Expiration
Date | | | Notional
Amount | | | Market
Value | | | Unrealized
Appreciation
(Depreciation) | |
| Contracts to Buy: | | | | | | | | | | | | | | | | | | | | |
| Amsterdam Index | | | 5 | | | | 10/21 | | | $ | 912,530 | | | $ | 892,312 | | | $ | (20,218) | |
| Australian 10-Year Bonds | | | 111 | | | | 12/21 | | | | 11,541,366 | | | | 11,352,813 | | | | (188,553) | |
| CAC 40 Euro | | | 3 | | | | 10/21 | | | | 231,540 | | | | 226,504 | | | | (5,036) | |
| Canadian 10-Year Bonds | | | 15 | | | | 12/21 | | | | 1,708,063 | | | | 1,695,286 | | | | (12,777) | |
| DAX Index | | | 3 | | | | 12/21 | | | | 270,715 | | | | 265,633 | | | | (5,082) | |
| E-mini S&P 500 Index | | | 2 | | | | 12/21 | | | | 448,320 | | | | 429,775 | | | | (18,545) | |
| FTSE 100 Index | | | 3 | | | | 12/21 | | | | 282,772 | | | | 285,925 | | | | 3,153 | |
| FTSE/MIB Index | | | 2 | | | | 12/21 | | | | 293,529 | | | | 293,908 | | | | 379 | |
| IBEX 35 Index | | | 2 | | | | 10/21 | | | | 201,532 | | | | 204,249 | | | | 2,717 | |
| Japanese 10-Year Bonds | | | 40 | | | | 12/21 | | | | 5,462,016 | | | | 5,444,988 | | | | (17,028) | |
See Notes to Consolidated Financial Statements.
| | | | | | |
| Franklin Strategic Real Return Fund 2021 Annual Report | | | | | 21 | |
Consolidated schedule of investments (cont’d)
September 30, 2021
Franklin Strategic Real Return Fund
| | | | | | | | | | | | | | | | | | | | |
| | | Number of
Contracts | | | Expiration
Date | | | Notional
Amount | | | Market
Value | | | Unrealized
Appreciation
(Depreciation) | |
| Contracts to Buy continued | | | | | | | | | | | | | | | | | | | | |
| S&P GSCI | | | 170 | | | | 10/21 | | | $ | 22,190,211 | | | $ | 23,689,500 | | | $ | 1,499,289 | |
| S&P/TSX 60 Index | | | 1 | | | | 12/21 | | | | 191,837 | | | | 188,868 | | | | (2,969) | |
| SPI 200 Index | | | 3 | | | | 12/21 | | | | 399,936 | | | | 395,436 | | | | (4,500) | |
| Topix Index | | | 1 | | | | 12/21 | | | | 177,447 | | | | 182,443 | | | | 4,996 | |
| U.S. Treasury 10-Year Notes | | | 13 | | | | 12/21 | | | | 1,727,429 | | | | 1,710,922 | | | | (16,507) | |
| | | | | | | | | | | | | | | | | | | | 1,219,319 | |
| Contracts to Sell: | | | | | | | | | | | | | | | | | | | | |
| Euro-Bund | | | 39 | | | | 12/21 | | | | 7,782,861 | | | | 7,671,729 | | | | 111,132 | |
| U.S. Treasury 10-Year Notes | | | 62 | | | | 12/21 | | | | 8,269,194 | | | | 8,159,782 | | | | 109,412 | |
U.S. Treasury Long-Term Bonds | | | 4 | | | | 12/21 | | | | 649,368 | | | | 636,875 | | | | 12,493 | |
United Kingdom Long Gilt Bonds | | | 16 | | | | 12/21 | | | | 2,730,700 | | | | 2,698,033 | | | | 32,667 | |
| | | | | | | | | | | | | | | | | | | | 265,704 | |
| Net unrealized appreciation on open futures contracts | | | | | | | $ | 1,485,023 | |
At September 30, 2021, the Fund had the following open forward foreign currency contracts:
| | | | | | | | | | | | | | | | | | | | |
Currency
Purchased | | | Currency Sold | | | Counterparty | | Settlement
Date | | | Unrealized
Appreciation
(Depreciation) | |
| GBP | | | 3,035,000 | | | USD | | | 4,183,620 | | | Bank of New York | | | 10/8/21 | | | $ | (94,234) | |
| USD | | | 45,489 | | | GBP | | | 33,000 | | | Bank of New York | | | 10/8/21 | | | | 1,025 | |
| USD | | | 681,936 | | | NZD | | | 973,000 | | | Bank of New York | | | 10/8/21 | | | | 10,254 | |
| AUD | | | 807,000 | | | USD | | | 587,534 | | | Citibank N.A. | | | 10/8/21 | | | | (4,094) | |
| CAD | | | 695,000 | | | USD | | | 545,044 | | | Citibank N.A. | | | 10/8/21 | | | | 3,660 | |
| CAD | | | 1,051,000 | | | USD | | | 831,018 | | | Citibank N.A. | | | 10/8/21 | | | | (1,251) | |
| CAD | | | 3,205,000 | | | USD | | | 2,516,937 | | | Citibank N.A. | | | 10/8/21 | | | | 13,417 | |
| CHF | | | 18,000 | | | USD | | | 19,300 | | | Citibank N.A. | | | 10/8/21 | | | | 19 | |
| EUR | | | 2,360,000 | | | USD | | | 2,792,036 | | | Citibank N.A. | | | 10/8/21 | | | | (57,883) | |
| GBP | | | 44,000 | | | USD | | | 59,083 | | | Citibank N.A. | | | 10/8/21 | | | | 203 | |
| MXN | | | 47,050,000 | | | USD | | | 2,349,972 | | | Citibank N.A. | | | 10/8/21 | | | | (73,976) | |
| NOK | | | 5,900,000 | | | USD | | | 679,838 | | | Citibank N.A. | | | 10/8/21 | | | | (4,959) | |
| NOK | | | 20,440,000 | | | USD | | | 2,355,236 | | | Citibank N.A. | | | 10/8/21 | | | | (17,181) | |
| NOK | | | 24,360,000 | | | USD | | | 2,832,247 | | | Citibank N.A. | | | 10/8/21 | | | | (45,798) | |
| SEK | | | 12,780,000 | | | USD | | | 1,489,540 | | | Citibank N.A. | | | 10/8/21 | | | | (29,609) | |
| SEK | | | 39,010,000 | | | USD | | | 4,546,711 | | | Citibank N.A. | | | 10/8/21 | | | | (90,378) | |
| USD | | | 308,800 | | | EUR | | | 263,000 | | | Citibank N.A. | | | 10/8/21 | | | | 4,104 | |
| USD | | | 2,457,151 | | | EUR | | | 2,100,000 | | | Citibank N.A. | | | 10/8/21 | | | | 24,220 | |
See Notes to Consolidated Financial Statements.
| | | | |
| 22 | | | | Franklin Strategic Real Return Fund 2021 Annual Report |
Franklin Strategic Real Return Fund
| | | | | | | | | | | | | | | | | | | | |
Currency
Purchased | | | Currency Sold | | | Counterparty | | Settlement
Date | | | Unrealized
Appreciation
(Depreciation) | |
| USD | | | 31,939 | | | JPY | | | 3,500,000 | | | Citibank N.A. | | | 10/8/21 | | | $ | 489 | |
| USD | | | 1,662,361 | | | SEK | | | 14,300,000 | | | Citibank N.A. | | | 10/8/21 | | | | 28,791 | |
| AUD | | | 564,000 | | | USD | | | 409,435 | | | HSBC Securities Inc. | | | 10/8/21 | | | | (1,677) | |
| AUD | | | 1,225,000 | | | USD | | | 903,731 | | | HSBC Securities Inc. | | | 10/8/21 | | | | (18,088) | |
| AUD | | | 3,213,000 | | | USD | | | 2,375,269 | | | HSBC Securities Inc. | | | 10/8/21 | | | | (52,353) | |
| CAD | | | 2,666,000 | | | USD | | | 2,111,109 | | | HSBC Securities Inc. | | | 10/8/21 | | | | (6,297) | |
| CAD | | | 7,004,000 | | | USD | | | 5,546,214 | | | HSBC Securities Inc. | | | 10/8/21 | | | | (16,543) | |
| CHF | | | 1,158,000 | | | USD | | | 1,261,233 | | | HSBC Securities Inc. | | | 10/8/21 | | | | (18,409) | |
| CHF | | | 1,264,000 | | | USD | | | 1,378,229 | | | HSBC Securities Inc. | | | 10/8/21 | | | | (21,641) | |
| EUR | | | 17,147,000 | | | USD | | | 20,317,816 | | | HSBC Securities Inc. | | | 10/8/21 | | | | (452,348) | |
| GBP | | | 477,000 | | | USD | | | 651,804 | | | HSBC Securities Inc. | | | 10/8/21 | | | | (9,090) | |
| GBP | | | 1,018,000 | | | USD | | | 1,395,119 | | | HSBC Securities Inc. | | | 10/8/21 | | | | (23,457) | |
| JPY | | | 111,300,000 | | | USD | | | 1,014,075 | | | HSBC Securities Inc. | | | 10/8/21 | | | | (13,973) | |
| JPY | | | 315,500,000 | | | USD | | | 2,862,612 | | | HSBC Securities Inc. | | | 10/8/21 | | | | (27,642) | |
| JPY | | | 524,600,000 | | | USD | | | 4,759,830 | | | HSBC Securities Inc. | | | 10/8/21 | | | | (45,963) | |
| NOK | | | 1,370,000 | | | USD | | | 158,931 | | | HSBC Securities Inc. | | | 10/8/21 | | | | (2,222) | |
| NZD | | | 1,366,000 | | | USD | | | 938,499 | | | HSBC Securities Inc. | | | 10/8/21 | | | | 4,478 | |
| NZD | | | 1,808,000 | | | USD | | | 1,287,478 | | | HSBC Securities Inc. | | | 10/8/21 | | | | (39,380) | |
| NZD | | | 3,336,000 | | | USD | | | 2,369,792 | | | HSBC Securities Inc. | | | 10/8/21 | | | | (66,884) | |
| USD | | | 7,045,228 | | | AUD | | | 9,530,000 | | | HSBC Securities Inc. | | | 10/8/21 | | | | 155,285 | |
| USD | | | 2,480,140 | | | CAD | | | 3,140,000 | | | HSBC Securities Inc. | | | 10/8/21 | | | | 1,104 | |
| USD | | | 2,283,815 | | | CHF | | | 2,114,000 | | | HSBC Securities Inc. | | | 10/8/21 | | | | 14,965 | |
| USD | | | 4,730,167 | | | CHF | | | 4,343,000 | | | HSBC Securities Inc. | | | 10/8/21 | | | | 69,043 | |
| USD | | | 507,750 | | | EUR | | | 437,000 | | | HSBC Securities Inc. | | | 10/8/21 | | | | 1,468 | |
| USD | | | 3,475,369 | | | EUR | | | 2,933,000 | | | HSBC Securities Inc. | | | 10/8/21 | | | | 77,374 | |
| USD | | | 783,694 | | | GBP | | | 566,000 | | | HSBC Securities Inc. | | | 10/8/21 | | | | 21,061 | |
| USD | | | 1,802 | | | JPY | | | 200,000 | | | HSBC Securities Inc. | | | 10/8/21 | | | | 5 | |
| USD | | | 614,812 | | | JPY | | | 68,800,000 | | | HSBC Securities Inc. | | | 10/8/21 | | | | (3,400) | |
| USD | | | 79,664 | | | NOK | | | 690,000 | | | HSBC Securities Inc. | | | 10/8/21 | | | | 737 | |
| USD | | | 4,215 | | | NZD | | | 6,000 | | | HSBC Securities Inc. | | | 10/8/21 | | | | 73 | |
| USD | | | 6,448,732 | | | NZD | | | 9,078,000 | | | HSBC Securities Inc. | | | 10/8/21 | | | | 182,005 | |
| USD | | | 403,594 | | | SEK | | | 3,540,000 | | | HSBC Securities Inc. | | | 10/8/21 | | | | (800) | |
| USD | | | 877,024 | | | SEK | | | 7,630,000 | | | HSBC Securities Inc. | | | 10/8/21 | | | | 5,406 | |
| USD | | | 3,380,885 | | | SEK | | | 29,250,000 | | | HSBC Securities Inc. | | | 10/8/21 | | | | 39,492 | |
| AUD | | | 1,569,000 | | | USD | | | 1,127,816 | | | UBS Securities LLC | | | 10/8/21 | | | | 6,530 | |
| NOK | | | 12,140,000 | | | USD | | | 1,388,235 | | | UBS Securities LLC | | | 10/8/21 | | | | 414 | |
| USD | | | 5,422 | | | CHF | | | 5,000 | | | UBS Securities LLC | | | 10/8/21 | | | | 55 | |
| Total | | | | | | | | | | | | | | | | | | $ | (573,853) | |
See Notes to Consolidated Financial Statements.
| | | | | | |
| Franklin Strategic Real Return Fund 2021 Annual Report | | | | | 23 | |
Consolidated schedule of investments (cont’d)
September 30, 2021
Franklin Strategic Real Return Fund
| | |
Abbreviation(s) used in this table: |
| |
| AUD | | — Australian Dollar |
| |
| CAD | | — Canadian Dollar |
| |
| CHF | | — Swiss Franc |
| |
| EUR | | — Euro |
| |
| GBP | | — British Pound |
| |
| JPY | | — Japanese Yen |
| |
| MXN | | — Mexican Peso |
| |
| NOK | | — Norwegian Krone |
| |
| NZD | | — New Zealand Dollar |
| |
| SEK | | — Swedish Krona |
| |
| USD | | — United States Dollar |
See Notes to Consolidated Financial Statements.
| | | | |
| 24 | | | | Franklin Strategic Real Return Fund 2021 Annual Report |
Consolidated statement of assets and liabilities
September 30, 2021
| | | | |
| |
| Assets: | | | | |
Investments, at value (Cost — $91,707,294) | | $ | 109,529,253 | |
Foreign currency, at value (Cost — $120,947) | | | 108,400 | |
Deposits with brokers for open futures contracts | | | 1,886,479 | |
Unrealized appreciation on forward foreign currency contracts | | | 665,677 | |
Interest and dividends receivable | | | 175,646 | |
Receivable from broker — net variation margin on open futures contracts | | | 125,655 | |
Receivable for Fund shares sold | | | 473 | |
Prepaid expenses | | | 19,124 | |
Total Assets | | | 112,510,707 | |
| |
| Liabilities: | | | | |
Unrealized depreciation on forward foreign currency contracts | | | 1,239,530 | |
Foreign currency collateral received for open futures contracts, at value (Cost—$103,116) | | | 90,300 | |
Investment management fee payable | | | 51,819 | |
Trustees’ fees payable | | | 927 | |
Service and/or distribution fees payable | | | 365 | |
Payable for Fund shares repurchased | | | 285 | |
Accrued expenses | | | 104,691 | |
Total Liabilities | | | 1,487,917 | |
| Total Net Assets | | $ | 111,022,790 | |
| |
| Net Assets: | | | | |
Par value (Note 7) | | $ | 86 | |
Paid-in capital in excess of par value | | | 80,625,382 | |
Total distributable earnings (loss) | | | 30,397,322 | |
| Total Net Assets | | $ | 111,022,790 | |
See Notes to Consolidated Financial Statements.
| | | | | | |
| Franklin Strategic Real Return Fund 2021 Annual Report | | | | | 25 | |
Consolidated statement of assets and liabilities (cont’d)
September 30, 2021
| | | | |
| |
| Net Assets: | | | | |
Class A | | | $1,704,373 | |
Class C | | | $12,584 | |
Class I | | | $50,712 | |
Class IS | | | $109,255,121 | |
| |
| Shares Outstanding: | | | | |
Class A | | | 133,972 | |
Class C | | | 1,037 | |
Class I | | | 3,881 | |
Class IS | | | 8,462,792 | |
| |
| Net Asset Value: | | | | |
Class A (and redemption price) | | | $12.72 | |
Class C* | | | $12.14 | |
Class I (and redemption price) | | | $13.07 | |
Class IS (and redemption price) | | | $12.91 | |
| Maximum Public Offering Price Per Share: | | | | |
Class A (based on maximum initial sales charge of 5.75%) | | | $13.50 | |
| * | Redemption price per share is NAV of Class C shares reduced by a 1.00% CDSC if shares are redeemed within one year from purchase payment (Note 2). |
See Notes to Consolidated Financial Statements.
| | | | |
| 26 | | | | Franklin Strategic Real Return Fund 2021 Annual Report |
Consolidated statement of operations
For the Year Ended September 30, 2021
| | | | |
| |
| Investment Income: | | | | |
Dividends | | $ | 860,570 | |
Interest | | | 1,799,430 | |
Less: Foreign taxes withheld | | | (43,424) | |
Total Investment Income | | | 2,616,576 | |
| |
| Expenses: | | | | |
Investment management fee (Note 2) | | | 808,442 | |
Fund accounting fees | | | 118,596 | |
Registration fees | | | 75,149 | |
Audit and tax fees | | | 73,477 | |
Legal fees | | | 30,975 | |
Commodity pool reports | | | 15,750 | |
Trustees’ fees | | | 13,122 | |
Shareholder reports | | | 6,355 | |
Custody fees | | | 5,984 | |
Transfer agent fees (Note 5) | | | 5,741 | |
Service and/or distribution fees (Notes 2 and 5) | | | 4,124 | |
Insurance | | | 2,294 | |
Interest expense | | | 17 | |
Miscellaneous expenses | | | 10,974 | |
Total Expenses | | | 1,171,000 | |
Less: Fee waivers and/or expense reimbursements (Notes 2 and 5) | | | (137,615) | |
Net Expenses | | | 1,033,385 | |
| Net Investment Income | | | 1,583,191 | |
| |
| Realized and Unrealized Gain (Loss) on Investments, Futures Contracts, Forward Foreign Currency Contracts and Foreign Currency Transactions (Notes 1, 3 and 4): | | | | |
Net Realized Gain (Loss) From: | | | | |
Investment transactions | | | 5,436,035 | |
Futures contracts | | | 9,127,975 | |
Forward foreign currency contracts | | | (692,264) | |
Foreign currency transactions | | | (5,364) | |
Net Realized Gain | | | 13,866,382 | |
Change in Net Unrealized Appreciation (Depreciation) From: | | | | |
Investments | | | 5,269,101 | |
Futures contracts | | | 1,148,987 | |
Forward foreign currency contracts | | | 659,295 | |
Foreign currencies | | | 10,206 | |
Change in Net Unrealized Appreciation (Depreciation) | | | 7,087,589 | |
| Net Gain on Investments, Futures Contracts, Forward Foreign Currency Contracts and Foreign Currency Transactions | | | 20,953,971 | |
| Increase in Net Assets From Operations | | $ | 22,537,162 | |
See Notes to Consolidated Financial Statements.
| | | | | | |
| Franklin Strategic Real Return Fund 2021 Annual Report | | | | | 27 | |
Consolidated statements of changes in net assets
| | | | | | | | |
| For the Years Ended September 30, | | 2021 | | | 2020 | |
| | |
| Operations: | | | | | | | | |
Net investment income | | $ | 1,583,191 | | | $ | 724,551 | |
Net realized gain (loss) | | | 13,866,382 | | | | (3,079,783) | |
Change in net unrealized appreciation (depreciation) | | | 7,087,589 | | | | 410,740 | |
Increase (Decrease) in Net Assets From Operations | | | 22,537,162 | | | | (1,944,492) | |
| | |
| Distributions to Shareholders From (Notes 1 and 6): | | | | | | | | |
Total distributable earnings | | | (2,398,862) | | | | (3,815,822) | |
Decrease in Net Assets From Distributions to Shareholders | | | (2,398,862) | | | | (3,815,822) | |
| | |
| Fund Share Transactions (Note 7): | | | | | | | | |
Net proceeds from sale of shares | | | 4,081,591 | | | | 1,744,006 | |
Reinvestment of distributions | | | 2,397,295 | | | | 3,813,250 | |
Cost of shares repurchased | | | (10,536,194) | | | | (2,539,952) | |
Increase (Decrease) in Net Assets From Fund Share Transactions | | | (4,057,308) | | | | 3,017,304 | |
Increase (Decrease) in Net Assets | | | 16,080,992 | | | | (2,743,010) | |
| | |
| Net Assets: | | | | | | | | |
Beginning of year | | | 94,941,798 | | | | 97,684,808 | |
End of year | | $ | 111,022,790 | | | $ | 94,941,798 | |
See Notes to Consolidated Financial Statements.
| | | | |
| 28 | | | | Franklin Strategic Real Return Fund 2021 Annual Report |
Consolidated financial highlights
| | | | | | | | | | | | | | | | | | | | |
| For a share of each class of beneficial interest outstanding throughout each year ended September 30: | |
| Class A Shares1 | | 2021 | | | 2020 | | | 2019 | | | 2018 | | | 2017 | |
| | | | | |
| Net asset value, beginning of year | | $ | 10.54 | | | $ | 11.15 | | | $ | 12.24 | | | $ | 11.93 | | | $ | 11.63 | |
| | | | | |
| Income (loss) from operations: | | | | | | | | | | | | | | | | | | | | |
Net investment income | | | 0.21 | | | | 0.05 | | | | 0.14 | | | | 0.13 | | | | 0.05 | |
Net realized and unrealized gain (loss) | | | 2.23 | | | | (0.24) | | | | (0.30) | | | | 0.60 | | | | 0.49 | |
Total income (loss) from operations | | | 2.44 | | | | (0.19) | | | | (0.16) | | | | 0.73 | | | | 0.54 | |
| | | | | |
| Less distributions from: | | | | | | | | | | | | | | | | | | | | |
Net investment income | | | (0.16) | | | | (0.05) | | | | (0.49) | | | | (0.10) | | | | — | |
Net realized gains | | | (0.10) | | | | (0.37) | | | | (0.44) | | | | (0.32) | | | | (0.24) | |
Total distributions | | | (0.26) | | | | (0.42) | | | | (0.93) | | | | (0.42) | | | | (0.24) | |
| | | | | |
| Net asset value, end of year | | $ | 12.72 | | | $ | 10.54 | | | $ | 11.15 | | | $ | 12.24 | | | $ | 11.93 | |
Total return2 | | | 23.37 | % | | | (1.74) | % | | | (0.73) | % | | | 6.32 | % | | | 4.75 | % |
| | | | | |
| Net assets, end of year (000s) | | $ | 1,704 | | | $ | 259 | | | $ | 272 | | | $ | 324 | | | $ | 551 | |
| | | | | |
| Ratios to average net assets: | | | | | | | | | | | | | | | | | | | | |
Gross expenses3 | | | 1.63 | % | | | 1.81 | % | | | 1.68 | % | | | 1.54 | % | | | 1.49 | %4 |
Net expenses3,5,6 | | | 1.30 | | | | 1.31 | | | | 1.32 | | | | 1.33 | | | | 1.33 | 4 |
Net investment income | | | 1.75 | | | | 0.43 | | | | 1.27 | | | | 1.11 | | | | 0.46 | |
| | | | | |
| Portfolio turnover rate | | | 41 | % | | | 43 | % | | | 44 | % | | | 61 | % | | | 42 | % |
| 1 | Per share amounts have been calculated using the average shares method. |
| 2 | Performance figures, exclusive of sales charges, may reflect compensating balance arrangements, fee waivers and/or expense reimbursements. In the absence of compensating balance arrangements, fee waivers and/or expense reimbursements, the total return would have been lower. Past performance is no guarantee of future results. |
| 3 | Does not include fees and expenses of the Underlying Funds in which the Fund invests. |
| 4 | Reflects recapture of expenses waived/reimbursed from prior fiscal years. |
| 5 | Reflects fee waivers and/or expense reimbursements. |
| 6 | As a result of an expense limitation arrangement, the ratio of total annual fund operating expenses, other than interest, brokerage commissions (except for brokerage commissions paid on purchases and sales of shares of ETFs), dividend expense on short sales, taxes and extraordinary expenses, to average net assets of Class A shares did not exceed 1.35%. This expense limitation arrangement cannot be terminated prior to December 31, 2022 without the Board of Trustees’ consent. Acquired fund fees and expenses are subject to the expense limitation arrangement. |
See Notes to Consolidated Financial Statements.
| | | | | | |
| Franklin Strategic Real Return Fund 2021 Annual Report | | | | | 29 | |
Consolidated financial highlights (cont’d)
| | | | | | | | | | | | | | | | | | | | |
| For a share of each class of beneficial interest outstanding throughout each year ended September 30: | |
| Class C Shares1 | | 2021 | | | 2020 | | | 2019 | | | 2018 | | | 2017 | |
| | | | | |
| Net asset value, beginning of year | | $ | 10.13 | | | $ | 10.79 | | | $ | 11.82 | | | $ | 11.52 | | | $ | 11.31 | |
| | | | | |
| Income (loss) from operations: | | | | | | | | | | | | | | | | | | | | |
Net investment income (loss) | | | 0.02 | | | | (0.04) | | | | 0.04 | | | | 0.05 | | | | (0.02) | |
Net realized and unrealized gain (loss) | | | 2.23 | | | | (0.21) | | | | (0.27) | | | | 0.57 | | | | 0.47 | |
Total income (loss) from operations | | | 2.25 | | | | (0.25) | | | | (0.23) | | | | 0.62 | | | | 0.45 | |
| | | | | |
| Less distributions from: | | | | | | | | | | | | | | | | | | | | |
Net investment income | | | (0.14) | | | | (0.04) | | | | (0.36) | | | | — | | | | — | |
Net realized gains | | | (0.10) | | | | (0.37) | | | | (0.44) | | | | (0.32) | | | | (0.24) | |
Total distributions | | | (0.24) | | | | (0.41) | | | | (0.80) | | | | (0.32) | | | | (0.24) | |
| | | | | |
| Net asset value, end of year | | $ | 12.14 | | | $ | 10.13 | | | $ | 10.79 | | | $ | 11.82 | | | $ | 11.52 | |
Total return2 | | | 22.53 | % | | | (2.54) | % | | | (1.51) | % | | | 5.51 | % | | | 3.98 | % |
| | | | | |
| Net assets, end of year (000s) | | $ | 13 | | | $ | 54 | | | $ | 81 | | | $ | 183 | | | $ | 196 | |
| | | | | |
| Ratios to average net assets: | | | | | | | | | | | | | | | | | | | | |
Gross expenses3 | | | 2.42 | % | | | 2.45 | % | | | 2.42 | %4 | | | 2.34 | % | | | 2.28 | %4 |
Net expenses3,5,6 | | | 2.05 | | | | 2.06 | | | | 2.07 | 4 | | | 2.08 | | | | 2.08 | 4 |
Net investment income (loss) | | | 0.20 | | | | (0.37) | | | | 0.40 | | | | 0.44 | | | | (0.18) | |
| | | | | |
| Portfolio turnover rate | | | 41 | % | | | 43 | % | | | 44 | % | | | 61 | % | | | 42 | % |
| 1 | Per share amounts have been calculated using the average shares method. |
| 2 | Performance figures, exclusive of CDSC, may reflect compensating balance arrangements, fee waivers and/or expense reimbursements. In the absence of compensating balance arrangements, fee waivers and/or expense reimbursements, the total return would have been lower. Past performance is no guarantee of future results. |
| 3 | Does not include fees and expenses of the Underlying Funds in which the Fund invests. |
| 4 | Reflects recapture of expenses waived/reimbursed from prior fiscal years. |
| 5 | Reflects fee waivers and/or expense reimbursements. |
| 6 | As a result of an expense limitation arrangement, the ratio of total annual fund operating expenses, other than interest, brokerage commissions (except for brokerage commissions paid on purchases and sales of shares of ETFs), dividend expense on short sales, taxes and extraordinary expenses, to average net assets of Class C shares did not exceed 2.10%. This expense limitation arrangement cannot be terminated prior to December 31, 2022 without the Board of Trustees’ consent. Acquired fund fees and expenses are subject to the expense limitation arrangement. |
See Notes to Consolidated Financial Statements.
| | | | |
| 30 | | | | Franklin Strategic Real Return Fund 2021 Annual Report |
| | | | | | | | | | | | | | | | | | | | |
| For a share of each class of beneficial interest outstanding throughout each year ended September 30: | |
| Class I Shares1 | | 2021 | | | 2020 | | | 2019 | | | 2018 | | | 2017 | |
| | | | | |
| Net asset value, beginning of year | | $ | 10.81 | | | $ | 11.40 | | | $ | 12.52 | | | $ | 12.22 | | | $ | 11.87 | |
| | | | | |
| Income (loss) from operations: | | | | | | | | | | | | | | | | | | | | |
Net investment income | | | 0.05 | | | | 0.06 | | | | 0.16 | | | | 0.18 | | | | 0.11 | |
Net realized and unrealized gain (loss) | | | 2.48 | | | | (0.22) | | | | (0.31) | | | | 0.60 | | | | 0.48 | |
Total income (loss) from operations | | | 2.53 | | | | (0.16) | | | | (0.15) | | | | 0.78 | | | | 0.59 | |
| | | | | |
| Less distributions from: | | | | | | | | | | | | | | | | | | | | |
Net investment income | | | (0.17) | | | | (0.06) | | | | (0.53) | | | | (0.16) | | | | — | |
Net realized gains | | | (0.10) | | | | (0.37) | | | | (0.44) | | | | (0.32) | | | | (0.24) | |
Total distributions | | | (0.27) | | | | (0.43) | | | | (0.97) | | | | (0.48) | | | | (0.24) | |
| | | | | |
| Net asset value, end of year | | $ | 13.07 | | | $ | 10.81 | | | $ | 11.40 | | | $ | 12.52 | | | $ | 12.22 | |
Total return2 | | | 23.72 | % | | | (1.55) | % | | | (0.52) | % | | | 6.62 | % | | | 5.08 | % |
| | | | | |
| Net assets, end of year (000s) | | $ | 51 | | | $ | 515 | | | $ | 1,684 | | | $ | 1,854 | | | $ | 1,674 | |
| | | | | |
| Ratios to average net assets: | | | | | | | | | | | | | | | | | | | | |
Gross expenses3 | | | 1.50 | % | | | 1.31 | %4 | | | 1.30 | %4 | | | 1.18 | % | | | 1.20 | %4 |
Net expenses3,5,6 | | | 1.05 | | | | 1.06 | 4 | | | 1.07 | 4 | | | 1.08 | | | | 1.08 | 4 |
Net investment income | | | 0.44 | | | | 0.51 | | | | 1.41 | | | | 1.47 | | | | 0.97 | |
| | | | | |
| Portfolio turnover rate | | | 41 | % | | | 43 | % | | | 44 | % | | | 61 | % | | | 42 | % |
| 1 | Per share amounts have been calculated using the average shares method. |
| 2 | Performance figures may reflect compensating balance arrangements, fee waivers and/or expense reimbursements. In the absence of compensating balance arrangements, fee waivers and/or expense reimbursements, the total return would have been lower. Past performance is no guarantee of future results. |
| 3 | Does not include fees and expenses of the Underlying Funds in which the Fund invests. |
| 4 | Reflects recapture of expenses waived/reimbursed from prior fiscal years. |
| 5 | Reflects fee waivers and/or expense reimbursements. |
| 6 | As a result of an expense limitation arrangement, the ratio of total annual fund operating expenses, other than interest, brokerage commissions (except for brokerage commissions paid on purchases and sales of shares of ETFs), dividend expense on short sales, taxes and extraordinary expenses, to average net assets of Class I shares did not exceed 1.10%. This expense limitation arrangement cannot be terminated prior to December 31, 2022 without the Board of Trustees’ consent. Acquired fund fees and expenses are subject to the expense limitation arrangement. |
See Notes to Consolidated Financial Statements.
| | | | | | |
| Franklin Strategic Real Return Fund 2021 Annual Report | | | | | 31 | |
Consolidated financial highlights (cont’d)
| | | | | | | | | | | | | | | | | | | | |
| For a share of each class of beneficial interest outstanding throughout each year ended September 30: | |
| Class IS Shares1 | | 2021 | | | 2020 | | | 2019 | | | 2018 | | | 2017 | |
| | | | | |
| Net asset value, beginning of year | | $ | 10.67 | | | $ | 11.25 | | | $ | 12.36 | | | $ | 12.08 | | | $ | 11.73 | |
| | | | | |
| Income (loss) from operations: | | | | | | | | | | | | | | | | | | | | |
Net investment income | | | 0.18 | | | | 0.08 | | | | 0.18 | | | | 0.19 | | | | 0.11 | |
Net realized and unrealized gain (loss) | | | 2.33 | | | | (0.23) | | | | (0.31) | | | | 0.58 | | | | 0.48 | |
Total income (loss) from operations | | | 2.51 | | | | (0.15) | | | | (0.13) | | | | 0.77 | | | | 0.59 | |
| | | | | |
| Less distributions from: | | | | | | | | | | | | | | | | | | | | |
Net investment income | | | (0.17) | | | | (0.06) | | | | (0.54) | | | | (0.17) | | | | — | |
Net realized gains | | | (0.10) | | | | (0.37) | | | | (0.44) | | | | (0.32) | | | | (0.24) | |
Total distributions | | | (0.27) | | | | (0.43) | | | | (0.98) | | | | (0.49) | | | | (0.24) | |
| | | | | |
| Net asset value, end of year | | $ | 12.91 | | | $ | 10.67 | | | $ | 11.25 | | | $ | 12.36 | | | $ | 12.08 | |
Total return2 | | | 23.88 | % | | | (1.45) | % | | | (0.35) | % | | | 6.62 | % | | | 5.14 | % |
| | | | | |
| Net assets, end of year (000s) | | $ | 109,255 | | | $ | 93,150 | | | $ | 94,463 | | | $ | 102,792 | | | $ | 101,496 | |
| | | | | |
| Ratios to average net assets: | | | | | | | | | | | | | | | | | | | | |
Gross expenses3 | | | 1.08 | % | | | 1.17 | %4 | | | 1.17 | %4 | | | 1.11 | %4 | | | 1.08 | % |
Net expenses3,5,6 | | | 0.95 | | | | 0.96 | 4 | | | 0.97 | 4 | | | 0.98 | 4 | | | 0.98 | |
Net investment income | | | 1.48 | | | | 0.78 | | | | 1.65 | | | | 1.55 | | | | 0.91 | |
| | | | | |
| Portfolio turnover rate | | | 41 | % | | | 43 | % | | | 44 | % | | | 61 | % | | | 42 | % |
| 1 | Per share amounts have been calculated using the average shares method. |
| 2 | Performance figures may reflect compensating balance arrangements, fee waivers and/or expense reimbursements. In the absence of compensating balance arrangements, fee waivers and/or expense reimbursements, the total return would have been lower. Past performance is no guarantee of future results. |
| 3 | Does not include fees and expenses of the Underlying Funds in which the Fund invests. |
| 4 | Reflects recapture of expenses waived/reimbursed from prior fiscal years. |
| 5 | Reflects fee waivers and/or expense reimbursements. |
| 6 | As a result of an expense limitation arrangement, the ratio of total annual fund operating expenses, other than interest, brokerage commissions (except for brokerage commissions paid on purchases and sales of ETFs), dividend expense on short sales, taxes and extraordinary expenses, to average net assets of Class IS shares did not exceed 1.00%. In addition, the ratio of total annual fund operating expenses for Class IS shares did not exceed the ratio of total annual fund operating expenses for Class I shares. These expense limitation arrangements cannot be terminated prior to December 31, 2022 without the Board of Trustees’ consent. Acquired fund fees and expenses are subject to the expense limitation arrangement. |
See Notes to Consolidated Financial Statements.
| | | | |
| 32 | | | | Franklin Strategic Real Return Fund 2021 Annual Report |
Notes to consolidated financial statements
1. Organization and significant accounting policies
Franklin Strategic Real Return Fund (prior to August 7, 2021, the Fund was known as QS Strategic Real Return Fund) (the “Fund”) is a separate non-diversified investment series of Legg Mason Global Asset Management Trust (the “Trust”). The Trust, a Maryland statutory trust, is registered under the Investment Company Act of 1940, as amended (the “1940 Act”), as an open-end management investment company.
The Fund gains exposure to the commodities markets by investing a portion of its assets in a wholly-owned subsidiary, Real Return Fund Ltd. (the “Subsidiary”), organized under the laws of the Cayman Islands. Among other investments, the Subsidiary may invest in commodity-linked instruments. The Fund may invest up to 25% of its total assets in the Subsidiary. These financial statements are the consolidated financial statements of the Fund and the Subsidiary. All interfund transactions have been eliminated in consolidation.
The following are significant accounting policies consistently followed by the Fund and are in conformity with U.S. generally accepted accounting principles (“GAAP”). Estimates and assumptions are required to be made regarding assets, liabilities and changes in net assets resulting from operations when financial statements are prepared. Changes in the economic environment, financial markets and any other parameters used in determining these estimates could cause actual results to differ. Subsequent events have been evaluated through the date the financial statements were issued.
(a) Investment valuation. Equity securities for which market quotations are available are valued at the last reported sales price or official closing price on the primary market or exchange on which they trade. The valuations for fixed income securities (which may include, but are not limited to, corporate, government, municipal, mortgage-backed, collateralized mortgage obligations and asset-backed securities) and certain derivative instruments are typically the prices supplied by independent third party pricing services, which may use market prices or broker/dealer quotations or a variety of valuation techniques and methodologies. The independent third party pricing services typically use inputs that are observable such as issuer details, interest rates, yield curves, prepayment speeds, credit risks/spreads, default rates and quoted prices for similar securities. Investments in open-end funds are valued at the closing net asset value per share of each fund on the day of valuation. Futures contracts are valued daily at the settlement price established by the board of trade or exchange on which they are traded. When the Fund holds securities or other assets that are denominated in a foreign currency, the Fund will normally use the currency exchange rates as of 4:00 p.m. (Eastern Time). If independent third party pricing services are unable to supply prices for a portfolio investment, or if the prices supplied are deemed by the manager to be unreliable, the market price may be determined by the manager using quotations from one or more broker/dealers or at the transaction price if the security has recently been purchased and no value has yet been obtained from a pricing service or pricing broker. When reliable prices are not readily available, such as when the value of a security has been significantly affected by events after the close of the exchange or market on which the security is principally traded, but
| | | | | | |
| Franklin Strategic Real Return Fund 2021 Annual Report | | | | | 33 | |
Notes to financial statements (cont’d)
before the Fund calculates its net asset value, the Fund values these securities as determined in accordance with procedures approved by the Fund’s Board of Trustees.
The Board of Trustees is responsible for the valuation process and has delegated the supervision of the daily valuation process to the Global Fund Valuation Committee (formerly known as Legg Mason North Atlantic Fund Valuation Committee prior to March 1, 2021) (the “Valuation Committee”). The Valuation Committee, pursuant to the policies adopted by the Board of Trustees, is responsible for making fair value determinations, evaluating the effectiveness of the Fund’s pricing policies, and reporting to the Board of Trustees. When determining the reliability of third party pricing information for investments owned by the Fund, the Valuation Committee, among other things, conducts due diligence reviews of pricing vendors, monitors the daily change in prices and reviews transactions among market participants.
The Valuation Committee will consider pricing methodologies it deems relevant and appropriate when making fair value determinations. Examples of possible methodologies include, but are not limited to, multiple of earnings; discount from market of a similar freely traded security; discounted cash-flow analysis; book value or a multiple thereof; risk premium/yield analysis; yield to maturity; and/or fundamental investment analysis. The Valuation Committee will also consider factors it deems relevant and appropriate in light of the facts and circumstances. Examples of possible factors include, but are not limited to, the type of security; the issuer’s financial statements; the purchase price of the security; the discount from market value of unrestricted securities of the same class at the time of purchase; analysts’ research and observations from financial institutions; information regarding any transactions or offers with respect to the security; the existence of merger proposals or tender offers affecting the security; the price and extent of public trading in similar securities of the issuer or comparable companies; and the existence of a shelf registration for restricted securities.
For each portfolio security that has been fair valued pursuant to the policies adopted by the Board of Trustees, the fair value price is compared against the last available and next available market quotations. The Valuation Committee reviews the results of such back testing monthly and fair valuation occurrences are reported to the Board of Trustees quarterly.
The Fund uses valuation techniques to measure fair value that are consistent with the market approach and/or income approach, depending on the type of security and the particular circumstance. The market approach uses prices and other relevant information generated by market transactions involving identical or comparable securities. The income approach uses valuation techniques to discount estimated future cash flows to present value.
| | | | |
| 34 | | | | Franklin Strategic Real Return Fund 2021 Annual Report |
GAAP establishes a disclosure hierarchy that categorizes the inputs to valuation techniques used to value assets and liabilities at measurement date. These inputs are summarized in the three broad levels listed below:
| • | | Level 1 — quoted prices in active markets for identical investments |
| • | | Level 2 — other significant observable inputs (including quoted prices for similar investments, interest rates, prepayment speeds, credit risk, etc.) |
| • | | Level 3 — significant unobservable inputs (including the Fund’s own assumptions in determining the fair value of investments) |
The inputs or methodologies used to value securities are not necessarily an indication of the risk associated with investing in those securities.
The following is a summary of the inputs used in valuing the Fund’s assets and liabilities carried at fair value:
| | | | | | | | | | | | | | | | |
| ASSETS | |
| Description | | Quoted Prices
(Level 1) | | | Other Significant
Observable Inputs
(Level 2)* | | | Significant
Unobservable
Inputs (Level 3) | | | Total | |
| Long-Term Investments†: | | | | | | | | | | | | | | | | |
U.S. Treasury Inflation Protected Securities | | | — | | | $ | 38,148,118 | | | | — | | | $ | 38,148,118 | |
Common Stocks: | | | | | | | | | | | | | | | | |
Communication Services | | $ | 1,559,186 | | | | 838,279 | | | | — | | | | 2,397,465 | |
Consumer Discretionary | | | 2,108,553 | | | | 210,767 | | | | — | | | | 2,319,320 | |
Consumer Staples | | | 1,172,082 | | | | 137,778 | | | | — | | | | 1,309,860 | |
Energy | | | 359,797 | | | | 671,901 | | | | — | | | | 1,031,698 | |
Financials | | | 2,485,656 | | | | 650,324 | | | | — | | | | 3,135,980 | |
Health Care | | | 2,314,135 | | | | 467,248 | | | | — | | | | 2,781,383 | |
Industrials | | | 1,219,363 | | | | 1,759,201 | | | | — | | | | 2,978,564 | |
Information Technology | | | 3,519,254 | | | | 1,755,094 | | | | — | | | | 5,274,348 | |
Materials | | | 587,353 | | | | 643,629 | | | | — | | | | 1,230,982 | |
Real Estate | | | — | | | | 257,412 | | | | — | | | | 257,412 | |
Investments in Underlying Funds | | | 19,303,026 | | | | — | | | | — | | | | 19,303,026 | |
Corporate Bonds & Notes | | | — | | | | 2,651,274 | | | | — | | | | 2,651,274 | |
Non-U.S. Treasury Inflation Protected Securities | | | — | | | | 627,324 | | | | — | | | | 627,324 | |
Sovereign Bonds | | | — | | | | 601,287 | | | | — | | | | 601,287 | |
| Total Long-Term Investments | | | 34,628,405 | | | | 49,419,636 | | | | — | | | | 84,048,041 | |
| Short-Term Investments† | | | 25,481,212 | | | | — | | | | — | | | | 25,481,212 | |
| Total Investments | | $ | 60,109,617 | | | $ | 49,419,636 | | | | — | | | $ | 109,529,253 | |
| | | | | | |
| Franklin Strategic Real Return Fund 2021 Annual Report | | | | | 35 | |
Notes to financial statements (cont’d)
| | | | | | | | | | | | | | | | |
| ASSETS (cont’d) | |
| Description | | Quoted Prices
(Level 1) | | | Other Significant
Observable Inputs
(Level 2)* | | | Significant
Unobservable
Inputs (Level 3) | | | Total | |
| Other Financial Instruments: | | | | | | | | | | | | | | | | |
Futures Contracts†† | | $ | 1,776,238 | | | | — | | | | — | | | $ | 1,776,238 | |
Forward Foreign Currency Contracts†† | | | — | | | $ | 665,677 | | | | — | | | | 665,677 | |
| Total Other Financial Instruments | | $ | 1,776,238 | | | $ | 665,677 | | | | — | | | $ | 2,441,915 | |
| Total | | $ | 61,885,855 | | | $ | 50,085,313 | | | | — | | | $ | 111,971,168 | |
|
| LIABILITIES | |
| Description | | Quoted Prices
(Level 1) | | | Other Significant
Observable Inputs
(Level 2) | | | Significant
Unobservable
Inputs
(Level 3) | | | Total | |
| Other Financial Instruments: | | | | | | | | | | | | | | | | |
Futures Contracts†† | | $ | 291,215 | | | | — | | | | — | | | $ | 291,215 | |
Forward Foreign Currency Contracts†† | | | — | | | $ | 1,239,530 | | | | — | | | | 1,239,530 | |
| Total | | $ | 291,215 | | | $ | 1,239,530 | | | | — | | | $ | 1,530,745 | |
| * | As a result of the fair value pricing procedures for international equities utilized by the Fund, which account for events occurring after the close of the principal market of the security but prior to the calculation of the Fund’s net asset value, certain securities were classified as Level 2 within the fair value hierarchy. |
| † | See Consolidated Schedule of Investments for additional detailed categorizations. |
| †† | Reflects the unrealized appreciation (depreciation) of the instruments. |
(b) Futures contracts. The Fund uses futures contracts generally to gain exposure to, or hedge against, changes in interest rates or gain exposure to, or hedge against, changes in certain asset classes. A futures contract represents a commitment for the future purchase or sale of an asset at a specified price on a specified date.
Upon entering into a futures contract, the Fund is required to deposit cash or securities with a broker in an amount equal to a certain percentage of the contract amount. This is known as the ‘‘initial margin’’ and subsequent payments (‘‘variation margin’’) are made or received by the Fund each day, depending on the daily fluctuation in the value of the contract. For certain futures, including foreign denominated futures, variation margin is not settled daily, but is recorded as a net variation margin payable or receivable. The daily changes in contract value are recorded as unrealized appreciation or depreciation in the Consolidated Statement of Operations and the Fund recognizes a realized gain or loss when the contract is closed.
Futures contracts involve, to varying degrees, risk of loss in excess of the amounts reflected in the financial statements. In addition, there is the risk that the Fund may not be able to enter into a closing transaction because of an illiquid secondary market.
| | | | |
| 36 | | | | Franklin Strategic Real Return Fund 2021 Annual Report |
(c) Forward foreign currency contracts. The Fund enters into a forward foreign currency contract to maintain its target exposure to foreign currencies, to hedge against foreign currency exchange rate risk on its non-U.S. dollar denominated securities, to facilitate settlement of a foreign currency denominated portfolio transaction or to attempt to increase the Fund’s return. A forward foreign currency contract is an agreement between two parties to buy and sell a currency at a set price with delivery and settlement at a future date. The contract is marked-to-market daily and the change in value is recorded by the Fund as an unrealized gain or loss. When a forward foreign currency contract is closed, through either delivery or offset by entering into another forward foreign currency contract, the Fund recognizes a realized gain or loss equal to the difference between the value of the contract at the time it was opened and the value of the contract at the time it is closed.
Forward foreign currency contracts involve elements of market risk in excess of the amounts reflected on the Consolidated Statement of Assets and Liabilities. The Fund bears the risk of an unfavorable change in the foreign exchange rate underlying the forward foreign currency contract. Risks may also arise upon entering into these contracts from the potential inability of the counterparties to meet the terms of their contracts.
(d) Inflation-indexed bonds. Inflation-indexed bonds are fixed income securities whose principal value or interest rate is periodically adjusted according to the rate of inflation. As the index measuring inflation changes, the principal value or interest rate of inflation-indexed bonds will be adjusted accordingly. Inflation adjustments to the principal amount of inflation-indexed bonds are reflected as an increase or decrease to investment income on the Consolidated Statement of Operations. Repayment of the original bond principal upon maturity (as adjusted for inflation) is guaranteed in the case of U.S. Treasury inflation-indexed bonds. For bonds that do not provide a similar guarantee, the adjusted principal value of the bond repaid at maturity may be less than the original principal.
(e) Foreign currency translation. Investment securities and other assets and liabilities denominated in foreign currencies are translated into U.S. dollar amounts based upon prevailing exchange rates on the date of valuation. Purchases and sales of investment securities and income and expense items denominated in foreign currencies are translated into U.S. dollar amounts based upon prevailing exchange rates on the respective dates of such transactions.
The Fund does not isolate that portion of the results of operations resulting from fluctuations in foreign exchange rates on investments from the fluctuations arising from changes in market prices of securities held. Such fluctuations are included with the net realized and unrealized gain or loss on investments.
Net realized foreign exchange gains or losses arise from sales of foreign currencies, including gains and losses on forward foreign currency contracts, currency gains or losses realized between the trade and settlement dates on securities transactions, and the difference between the amounts of dividends, interest, and foreign withholding taxes recorded on the Fund’s books and the U.S. dollar equivalent of the amounts actually received or paid. Net unrealized foreign exchange gains and losses arise from changes in
| | | | | | |
| Franklin Strategic Real Return Fund 2021 Annual Report | | | | | 37 | |
Notes to consolidated financial statements (cont’d)
the values of assets and liabilities, other than investments in securities, on the date of valuation, resulting from changes in exchange rates.
Foreign security and currency transactions may involve certain considerations and risks not typically associated with those of U.S. dollar denominated transactions as a result of, among other factors, the possibility of lower levels of governmental supervision and regulation of foreign securities markets and the possibility of political or economic instability.
(f) Foreign investment risks. The Fund’s investments in foreign securities may involve risks not present in domestic investments. Since securities may be denominated in foreign currencies, may require settlement in foreign currencies or may pay interest or dividends in foreign currencies, changes in the relationship of these foreign currencies to the U.S. dollar can significantly affect the value of the investments and earnings of the Fund. Foreign investments may also subject the Fund to foreign government exchange restrictions, expropriation, taxation or other political, social or economic developments, all of which affect the market and/or credit risk of the investments.
(g) Counterparty risk and credit-risk-related contingent features of derivative instruments. The Fund may invest in certain securities or engage in other transactions where the Fund is exposed to counterparty credit risk in addition to broader market risks. The Fund may invest in securities of issuers, which may also be considered counterparties as trading partners in other transactions. This may increase the risk of loss in the event of default or bankruptcy by the counterparty or if the counterparty otherwise fails to meet its contractual obligations. The Fund’s subadviser attempts to mitigate counterparty risk by (i) periodically assessing the creditworthiness of its trading partners, (ii) monitoring and/or limiting the amount of its net exposure to each individual counterparty based on its assessment and (iii) requiring collateral from the counterparty for certain transactions. Market events and changes in overall economic conditions may impact the assessment of such counterparty risk by the subadviser. In addition, declines in the values of underlying collateral received may expose the Fund to increased risk of loss.
With exchange traded and centrally cleared derivatives, there is less counterparty risk to the Fund since the exchange or clearinghouse, as counterparty to such instruments, guarantees against a possible default. The clearinghouse stands between the buyer and the seller of the contract; therefore, the credit risk is limited to failure of the clearinghouse. While offset rights may exist under applicable law, the Fund does not have a contractual right of offset against a clearing broker or clearinghouse in the event of a default of the clearing broker or clearinghouse.
The Fund has entered into master agreements, such as an International Swaps and Derivatives Association, Inc. Master Agreement (“ISDA Master Agreement”) or similar agreement, with certain of its derivative counterparties that govern over-the-counter (“OTC”) derivatives and provide for general obligations, representations, agreements, collateral posting terms, netting provisions in the event of default or termination and credit related contingent features. The credit related contingent features include, but are not
| | | | |
| 38 | | | | Franklin Strategic Real Return Fund 2021 Annual Report |
limited to, a percentage decrease in the Fund’s net assets or net asset value per share over a specified period of time. If these credit related contingent features were triggered, the derivatives counterparty could terminate the positions and demand payment or require additional collateral.
Under an ISDA Master Agreement, the Fund may, under certain circumstances, offset with the counterparty certain derivative financial instruments’ payables and/or receivables with collateral held and/or posted and create one single net payment. However, absent an event of default by the counterparty or a termination of the agreement, the terms of the ISDA Master Agreements do not result in an offset of reported amounts of financial assets and financial liabilities in the Consolidated Statement of Assets and Liabilities across transactions between the Fund and the applicable counterparty. The enforceability of the right to offset may vary by jurisdiction.
Collateral requirements differ by type of derivative. Collateral or margin requirements are set by the broker or exchange clearinghouse for exchange traded derivatives while collateral terms are contract specific for OTC traded derivatives. Cash collateral that has been pledged to cover obligations of the Fund under derivative contracts, if any, will be reported separately in the Consolidated Statement of Assets and Liabilities. Securities pledged as collateral, if any, for the same purpose are noted in the Consolidated Schedule of Investments.
As of September 30, 2021, the Fund held forward foreign currency contracts with credit related contingent features which had a liability position of $1,239,530. If a contingent feature in the master agreements would have been triggered, the Fund would have been required to pay this amount to its derivatives counterparties.
(h) Security transactions and investment income. Security transactions are accounted for on a trade date basis. Interest income (including interest income from payment-in-kind securities), adjusted for amortization of premium and accretion of discount, is recorded on the accrual basis. Dividend income is recorded on the ex-dividend date for dividends received in cash and/or securities. Foreign dividend income is recorded on the ex-dividend date or as soon as practicable after the Fund determines the existence of a dividend declaration after exercising reasonable due diligence. The cost of investments sold is determined by use of the specific identification method. To the extent any issuer defaults or a credit event occurs that impacts the issuer, the Fund may halt any additional interest income accruals and consider the realizability of interest accrued up to the date of default or credit event.
(i) REIT distributions. The character of distributions received from Real Estate Investment Trusts (‘‘REITs’’) held by the Fund is generally comprised of net investment income, capital gains, and return of capital. It is the policy of the Fund to estimate the character of distributions received from underlying REITs based on historical data provided by the REITs. After each calendar year end, REITs report the actual tax character of these distributions. Differences between the estimated and actual amounts reported by the REITs are reflected
| | | | | | |
| Franklin Strategic Real Return Fund 2021 Annual Report | | | | | 39 | |
Notes to consolidated financial statements (cont’d)
in the Fund’s records in the year in which they are reported by the REITs by adjusting related investment cost basis, capital gains and income, as necessary.
(j) Distributions to shareholders. Distributions from net investment income and distributions of net realized gains, if any, are declared at least annually. Distributions to shareholders of the Fund are recorded on the ex-dividend date and are determined in accordance with income tax regulations, which may differ from GAAP.
(k) Share class accounting. Investment income, common expenses and realized/ unrealized gains (losses) on investments are allocated to the various classes of the Fund on the basis of daily net assets of each class. Fees relating to a specific class are charged directly to that share class.
(l) Compensating balance arrangements. The Fund has an arrangement with its custodian bank whereby a portion of the custodian’s fees is paid indirectly by credits earned on the Fund’s cash on deposit with the bank.
(m) Federal and other taxes. It is the Fund’s policy to comply with the federal income and excise tax requirements of the Internal Revenue Code of 1986 (the “Code”), as amended, applicable to regulated investment companies. Accordingly, the Fund intends to distribute its taxable income and net realized gains, if any, to shareholders in accordance with timing requirements imposed by the Code. Therefore, no federal or state income tax provision is required in the Fund’s financial statements.
Management has analyzed the Fund’s tax positions taken on income tax returns for all open tax years and has concluded that as of September 30, 2021, no provision for income tax is required in the Fund’s financial statements. The Fund’s federal and state income and federal excise tax returns for tax years for which the applicable statutes of limitations have not expired are subject to examination by the Internal Revenue Service and state departments of revenue.
Under the applicable foreign tax laws, a withholding tax may be imposed on interest, dividends and capital gains at various rates.
(n) Reclassification. GAAP requires that certain components of net assets be reclassified to reflect permanent differences between financial and tax reporting. These reclassifications have no effect on net assets or net asset value per share. During the current year, the Fund had no reclassifications.
2. Investment management agreement and other transactions with affiliates
Legg Mason Partners Fund Advisor, LLC (“LMPFA”) is the Fund’s investment manager. Effective August 7, 2021, Franklin Advisers, Inc. (“Franklin Advisers”) is the Fund’s adviser and a subadviser. Prior to August 7, 2021, QS Investors, LLC (“QS Investors”), was the Fund’s adviser and a subadviser. ClearBridge Investments, LLC (“ClearBridge”), Western Asset Management Company, LLC (“Western Asset”), Western Asset Management Company Limited in London (“Western Asset London”) and Western Asset Management Company Ltd in Japan (“Western Japan”) are also the Fund’s subadvisers. Western Asset also manages
| | | | |
| 40 | | | | Franklin Strategic Real Return Fund 2021 Annual Report |
the portion of the Fund’s cash and short-term instruments allocated to it pursuant to a separate subadvisory agreement between LMPFA and Western Asset (“Western Asset Agreement”). LMPFA, Franklin Advisers, ClearBridge, Western Asset, Western Asset London and Western Japan are wholly-owned subsidiaries of Franklin Resources, Inc. (“Franklin Resources”) and prior to August 7, 2021, QS Investors was a wholly-owned subsidiary of Franklin Resources. ClearBridge did not manage any portion of the Fund’s assets during the reporting period.
Under the investment management agreement, the Fund pays LMPFA an investment management fee, calculated daily and paid monthly, at an annual rate of 0.75% of the Fund’s average daily net assets.
LMPFA provides administrative and certain oversight services to the Fund. LMPFA delegates to Franklin Advisers the day-to-day portfolio management of the Fund, except for the management of the portion of the cash and short term instruments allocated to Western Asset. Franklin Advisers is responsible for monitoring and coordinating the overall management of the Fund, including rebalancing the Fund’s target asset allocations among itself and the subadvisers. Franklin Advisers also provides management for a portion of the Fund’s assets.
LMPFA pays Franklin Advisers for its services to the Fund an advisory fee, calculated daily and paid monthly, at an annual rate of 0.20% of the Fund’s average daily net assets. The Subsidiary has agreed to reimburse the Fund for the fees paid thereby for the services provided by Franklin Advisers to the Subsidiary. LMPFA pays Franklin Advisers, ClearBridge and Western Asset each a subadvisory fee for their services to the Fund, calculated daily and paid monthly, at annual rates of 0.45%, 0.35% and 0.25% of the average daily net assets managed by each, respectively. For Western Asset’s cash management services to the Fund pursuant to the Western Asset Agreement, LMPFA, not the Fund, pays Western Asset monthly 0.02% of the portion of the Fund’s average daily net assets that are allocated to them by LMPFA. Western Asset pays each of Western Asset London and Western Japan a subadvisory fee for their services to the Fund, calculated daily and paid monthly, at an annual rate of 0.25% of the average daily net assets managed by each.
LMPFA has agreed to waive fees and/or reimburse operating expenses (other than interest, brokerage commissions (except for brokerage commissions paid on purchases and sales of shares of ETFs), dividend expense on short sales, taxes and extraordinary expenses), subject to recapture as described below. As a result, total annual fund operating expenses did not exceed 1.35%, 2.10%, 1.10% and 1.00% for Class A, Class C, Class I and Class IS shares, respectively. In addition, the ratio of total annual fund operating expenses for Class IS shares did not exceed the ratio of total annual fund operating expenses for Class I shares. Acquired fund fees and expenses are subject to the expense limitation arrangements, and are calculated based on an average of the net expense ratio (as shown in the most recent prospectus or shareholder report for each acquired fund as of the date of the Fund’s most recent prospectus) of each acquired fund held by the Fund, weighted in proportion to the Fund’s investment allocation among the acquired funds. These arrangements are expected to continue until December 31, 2022, may be terminated prior to that date by agreement of
| | | | | | |
| Franklin Strategic Real Return Fund 2021 Annual Report | | | | | 41 | |
Notes to consolidated financial statements (cont’d)
LMPFA and the Board of Trustees, and may be terminated at any time after that date by LMPFA. The arrangements, however, may be modified by LMPFA to decrease total annual fund operating expenses at any time.
During the year ended September 30, 2021, fees waived and/or expenses reimbursed amounted to $137,615.
LMPFA is permitted to recapture amounts waived and/or reimbursed to a class within three years after the fiscal year in which LMPFA earned the fee or incurred the expense if the class’ total annual fund operating expenses have fallen to a level below the expense limitation (“expense cap”) in effect at the time the fees were earned or the expenses incurred. In no case will LMPFA recapture any amount that would result, on any particular business day of the Fund, in the class’ total annual fund operating expenses exceeding the expense cap or any other lower limit then in effect.
Pursuant to these arrangements, at September 30, 2021, the Fund had remaining fee waivers and/or expense reimbursements subject to recapture by LMPFA and respective dates of expiration as follows:
| | | | | | | | | | | | | | | | |
| | | Class A | | | Class C | | | Class I | | | Class IS | |
| Expires September 30, 2022 | | $ | 1,023 | | | $ | 405 | | | $ | 4,140 | | | $ | 194,718 | |
| Expires September 30, 2023 | | | 1,263 | | | | 264 | | | | 2,626 | | | | 188,674 | |
| Expires September 30, 2024 | | | 2,164 | | | | 176 | | | | 1,174 | | | | 129,364 | |
| Total fee waivers/expense reimbursements subject to recapture | | $ | 4,450 | | | $ | 845 | | | $ | 7,940 | | | $ | 512,756 | |
For the year ended September 30, 2021, LMPFA did not recapture any fees.
Franklin Distributors, LLC (known as Legg Mason Investor Services, LLC prior to July 7, 2021) (“Franklin Distributors”) serves as the Fund’s sole and exclusive distributor. Franklin Distributors is an indirect, wholly-owned broker-dealer subsidiary of Franklin Resources.
There is a maximum initial sales charge of 5.75% for Class A shares. There is a contingent deferred sales charge (“CDSC”) of 1.00% on Class C shares, which applies if redemption occurs within 12 months from purchase payment. In certain cases, Class A shares have a 1.00% CDSC, which applies if redemption occurs within 18 months from purchase payment. This CDSC only applies to those purchases of Class A shares, which, when combined with current holdings of other shares of Legg Mason funds, equal or exceed $1,000,000 in the aggregate. These purchases do not incur an initial sales charge.
There was a maximum initial sales charge of 5.75% for Class A2 shares. In certain cases, Class A2 shares had a 1.00% CDSC, which applied if redemption occurred within 18 months from purchase payment. This CDSC only applied to those purchases of Class A2, which when combined with holdings of other shares of Legg Mason funds, equaled or exceeded $1,000,000 in aggregate. Those purchases did not incur an initial sales charge.
| | | | |
| 42 | | | | Franklin Strategic Real Return Fund 2021 Annual Report |
For the year ended September 30, 2021, sales charges retained by and CDSCs paid to Franklin Distributors and its affiliates, if any, were as follows:
| | | | | | | | | | | | |
| | | Class A | | | Class A2† | | | Class C | |
| Sales charges | | $ | 213 | | | $ | 719 | | | | — | |
| CDSCs | | | — | | | | — | | | $ | 25 | |
| † | On June 24, 2021, the Fund converted its Class A2 shares into Class A shares. |
Under a Deferred Compensation Plan (the “Plan”), Trustees may have elected to defer receipt of all or a specified portion of their compensation. A participating Trustee selected one or more funds managed by LMPFA or an affiliate of LMPFA in which his or her deferred trustee’s fees were deemed to be invested. Deferred amounts remain in the Fund until distributed in accordance with the Plan. In May 2015, the Board of Trustees approved an amendment to the Plan so that effective January 1, 2016, no compensation earned after that date may be deferred under the Plan.
All officers and one Trustee of the Trust are employees of Franklin Resources or its affiliates and do not receive compensation from the Trust.
As of September 30, 2021, Franklin Resources and its affiliates owned 98% of the Fund.
3. Investments
During the year ended September 30, 2021, the aggregate cost of purchases and proceeds from sales of investments (excluding short-term investments) and U.S. Government & Agency Obligations were as follows:
| | | | | | | | |
| | | Investments | | | U.S. Government &
Agency Obligations | |
| Purchases | | $ | 9,486,043 | | | $ | 24,954,944 | |
| Sales | | | 12,565,480 | | | | 20,198,220 | |
At September 30, 2021, the aggregate cost of investments and the aggregate gross unrealized appreciation and depreciation of investments for federal income tax purposes were as follows:
| | | | | | | | | | | | | | | | |
| | | Cost | | | Gross
Unrealized
Appreciation | | | Gross
Unrealized
Depreciation | | | Net Unrealized
Appreciation
(Depreciation) | |
| Securities | | $ | 91,766,910 | | | $ | 18,281,953 | | | $ | (519,610) | | | $ | 17,762,343 | |
| Futures contracts | | | — | | | | 1,776,238 | | | | (291,215) | | | | 1,485,023 | |
| Forward foreign currency contracts | | | — | | | | 665,677 | | | | (1,239,530) | | | | (573,853) | |
| | | | | | |
| Franklin Strategic Real Return Fund 2021 Annual Report | | | | | 43 | |
Notes to consolidated financial statements (cont’d)
4. Derivative instruments and hedging activities
Below is a table, grouped by derivative type, that provides information about the fair value and the location of derivatives within the Consolidated Statement of Assets and Liabilities at September 30, 2021.
| | | | | | | | | | | | | | | | | | | | |
ASSET DERIVATIVES1 | |
| | | Interest Rate Risk | | | Foreign
Exchange Risk | | | Equity
Risk | | | Commodity
Risk | | | Total | |
| Futures contracts2 | | $ | 265,704 | | | | — | | | $ | 11,245 | | | $ | 1,499,289 | | | $ | 1,776,238 | |
| Forward foreign currency contracts | | | — | | | $ | 665,677 | | | | — | | | | — | | | | 665,677 | |
| Total | | $ | 265,704 | | | $ | 665,677 | | | $ | 11,245 | | | $ | 1,499,289 | | | $ | 2,441,915 | |
| | | | | | | | | | | | | | | | |
LIABILITY DERIVATIVES1 | |
| | | Interest
Rate Risk | | | Foreign
Exchange Risk | | | Equity Risk | | | Total | |
| Futures contracts2 | | $ | 234,865 | | | | — | | | $ | 56,350 | | | $ | 291,215 | |
| Forward foreign currency contracts | | | — | | | $ | 1,239,530 | | | | — | | | | 1,239,530 | |
| Total | | $ | 234,865 | | | $ | 1,239,530 | | | $ | 56,350 | | | $ | 1,530,745 | |
| 1 | Generally, the balance sheet location for asset derivatives is receivables/net unrealized appreciation and for liability derivatives is payables/net unrealized depreciation. |
| 2 | Includes cumulative unrealized appreciation (depreciation) of futures contracts as reported in the Consolidated Schedule of Investments. Only net variation margin is reported within the receivables and/or payables on the Consolidated Statement of Assets and Liabilities. |
The following tables provide information about the effect of derivatives and hedging activities on the Fund’s Consolidated Statement of Operations for the year ended September 30, 2021. The first table provides additional detail about the amounts and sources of gains (losses) realized on derivatives during the period. The second table provides additional information about the change in unrealized appreciation (depreciation) resulting from the Fund’s derivatives and hedging activities during the period.
| | | | | | | | | | | | | | | | | | | | |
| AMOUNT OF REALIZED GAIN (LOSS) ON DERIVATIVES RECOGNIZED | |
| | | Interest
Rate Risk | | | Foreign
Exchange Risk | | | Equity Risk | | | Commodity
Risk | | | Total | |
| Futures contracts | | $ | (35,311) | | | | — | | | $ | 247,350 | | | $ | 8,915,936 | | | $ | 9,127,975 | |
| Forward foreign currency contracts | | | — | | | $ | (692,264) | | | | — | | | | — | | | | (692,264) | |
| Total | | $ | (35,311) | | | $ | (692,264) | | | $ | 247,350 | | | $ | 8,915,936 | | | $ | 8,435,711 | |
CHANGE IN UNREALIZED APPRECIATION (DEPRECIATION) ON DERIVATIVES RECOGNIZED | |
| | | Interest
Rate Risk | | | Foreign
Exchange Risk | | | Equity Risk | | | Commodity
Risk | | | Total | |
| Futures contracts | | $ | (7,963) | | | | — | | | $ | (77,765) | | | $ | 1,234,715 | | | $ | 1,148,987 | |
| Forward foreign currency contracts | | | — | | | $ | 659,295 | | | | — | | | | — | | | | 659,295 | |
| Total | | $ | (7,963) | | | $ | 659,295 | | | $ | (77,765) | | | $ | 1,234,715 | | | $ | 1,808,282 | |
| | | | |
| 44 | | | | Franklin Strategic Real Return Fund 2021 Annual Report |
During the year ended September 30, 2021, the volume of derivative activity for the Fund was as follows:
| | | | |
| | | Average Market
Value | |
| Futures contracts (to buy) | | $ | 41,396,267 | |
| Futures contracts (to sell) | | | 19,158,232 | |
| Forward foreign currency contracts (to buy) | | | 69,993,276 | |
| Forward foreign currency contracts (to sell) | | | 25,201,993 | |
The following table presents the Fund’s OTC derivative assets and liabilities by counterparty net of amounts available for offset under an ISDA Master Agreement and net of the related collateral pledged (received) by the Fund as of September 30, 2021.
| | | | | | | | | | | | | | | | | | | | |
| Counterparty | | Gross Assets Subject to Master
Agreements1 | | | Gross Liabilities Subject to Master
Agreements1 | | | Net Assets (Liabilities) Subject to Master Agreements | | | Collateral
Pledged
(Received) | | | Net Amount2 | |
| Bank of New York | | $ | 11,279 | | | $ | (94,234) | | | $ | (82,955) | | | | — | | | $ | (82,955) | |
| Citibank N.A. | | | 74,903 | | | | (325,129) | | | | (250,226) | | | | — | | | | (250,226) | |
| HSBC Securities Inc. | | | 572,496 | | | | (820,167) | | | | (247,671) | | | | — | | | | (247,671) | |
| UBS Securities LLC | | | 6,999 | | | | — | | | | 6,999 | | | | — | | | | 6,999 | |
| Total | | $ | 665,677 | | | $ | (1,239,530) | | | $ | (573,853) | | | | — | | | $ | (573,853) | |
| 1 | Absent an event of default or early termination, derivative assets and liabilities are presented gross and not offset in the Consolidated Statement of Assets and Liabilities. |
| 2 | Represents the net amount receivable (payable) from (to) the counterparty in the event of default. |
5. Class specific expenses, waivers and/or expense reimbursements
The Fund has adopted a Rule 12b-1 shareholder services and distribution plan and under that plan the Fund pays service and/or distribution fees with respect to its Class A, Class A2 and Class C shares calculated at the annual rate of 0.25%, 0.25% and 1.00% of the average daily net assets of each class, respectively. Service and/or distribution fees are accrued daily and paid monthly.
For the year ended September 30, 2021, class specific expenses were as follows:
| | | | | | | | |
| | | Service and/or
Distribution Fees | | | Transfer Agent
Fees | |
| Class A | | $ | 1,686 | | | $ | 2,150 | |
| Class A2† | | | 1,949 | | | | 2,313 | |
| Class C | | | 489 | | | | 160 | |
| Class I | | | — | | | | 1,007 | |
| Class IS | | | — | | | | 111 | |
| Total | | $ | 4,124 | | | $ | 5,741 | |
| † | On June 24, 2021, the Fund converted its Class A2 shares into Class A shares. |
| | | | | | |
| Franklin Strategic Real Return Fund 2021 Annual Report | | | | | 45 | |
Notes to consolidated financial statements (cont’d)
For the year ended September 30, 2021, waivers and/or expense reimbursements by class were as follows:
| | | | |
| | | Waivers/Expense
Reimbursements | |
| Class A | | $ | 2,217 | |
| Class A2† | | | 1,188 | |
| Class C | | | 178 | |
| Class I | | | 1,176 | |
| Class IS | | | 132,856 | |
| Total | | $ | 137,615 | |
| † | On June 24, 2021, the Fund converted its Class A2 shares into Class A shares. |
6. Distributions to shareholders by class
| | | | | | | | |
| | | Year Ended
September 30, 2021 | | | Year Ended
September 30, 2020 | |
| Net Investment Income: | | | | | | | | |
| Class A | | $ | 3,970 | | | $ | 1,376 | |
| Class A2† | | | 14,355 | | | | 5,468 | |
| Class C | | | 704 | | | | 266 | |
| Class I | | | 8,545 | | | | 9,204 | |
| Class IS | | | 1,497,432 | | | | 558,687 | |
| Total | | $ | 1,525,006 | | | $ | 575,001 | |
| | |
| Net Realized Gains: | | | | | | | | |
| Class A | | $ | 2,418 | | | $ | 9,204 | |
| Class A2† | | | 9,093 | | | | 39,587 | |
| Class C | | | 486 | | | | 2,706 | |
| Class I | | | 4,744 | | | | 53,928 | |
| Class IS | | | 857,115 | | | | 3,135,396 | |
| Total | | $ | 873,856 | | | $ | 3,240,821 | |
| † | On June 24, 2021, the Fund converted its Class A2 shares into Class A shares. |
7. Shares of beneficial interest
At September 30, 2021, the Trust had an unlimited number of shares of beneficial interest authorized with a par value of $0.00001 per share. The Fund has the ability to issue multiple classes of shares. Each class of shares represents an identical interest and has the same rights, except that each class bears certain direct expenses, including those specifically related to the distribution of its shares.
| | | | |
| 46 | | | | Franklin Strategic Real Return Fund 2021 Annual Report |
Transactions in shares of each class were as follows:
| | | | | | | | | | | | | | | | |
| | | Year Ended
September 30, 2021 | | | Year Ended
September 30, 2020 | |
| | | Shares | | | Amount | | | Shares | | | Amount | |
| Class A | | | | | | | | | | | | | | | | |
| Shares sold | | | 129,977 | | | $ | 1,645,685 | | | | 2,065 | | | $ | 20,272 | |
| Shares issued on reinvestment | | | 430 | | | | 4,821 | | | | 722 | | | | 8,008 | |
| Shares repurchased | | | (20,987) | | | | (266,829) | | | | (2,608) | | | | (28,981) | |
| Net increase (decrease) | | | 109,420 | | | $ | 1,383,677 | | | | 179 | | | $ | (701) | |
| | | | |
| Class A2† | | | | | | | | | | | | | | | | |
| Shares sold | | | 35,453 | | | $ | 430,063 | | | | 8,735 | | | $ | 86,930 | |
| Shares issued on reinvestment | | | 2,135 | | | | 23,448 | | | | 4,143 | | | | 45,055 | |
| Shares repurchased | | | (131,052) | | | | (1,608,079) | | | | (27,707) | | | | (271,483) | |
| Net decrease | | | (93,464) | | | $ | (1,154,568) | | | | (14,829) | | | $ | (139,498) | |
| | | | |
| Class C | | | | | | | | | | | | | | | | |
| Shares sold | | | — | | | | — | | | | 246 | | | $ | 2,500 | |
| Shares issued on reinvestment | | | 111 | | | $ | 1,190 | | | | 277 | | | | 2,972 | |
| Shares repurchased | | | (4,358) | | | | (52,418) | | | | (2,738) | | | | (25,801) | |
| Net decrease | | | (4,247) | | | $ | (51,228) | | | | (2,215) | | | $ | (20,329) | |
| | | | |
| Class I | | | | | | | | | | | | | | | | |
| Shares sold | | | 4,359 | | | $ | 50,844 | | | | 12,257 | | | $ | 123,865 | |
| Shares issued on reinvestment | | | 1,154 | | | | 13,289 | | | | 5,559 | | | | 63,132 | |
| Shares repurchased | | | (49,240) | | | | (593,769) | | | | (117,995) | | | | (1,033,687) | |
| Net decrease | | | (43,727) | | | $ | (529,636) | | | | (100,179) | | | $ | (846,690) | |
| | | | |
| Class IS | | | | | | | | | | | | | | | | |
| Shares sold | | | 164,048 | | | $ | 1,954,999 | | | | 135,976 | | | $ | 1,510,439 | |
| Shares issued on reinvestment | | | 207,219 | | | | 2,354,547 | | | | 329,637 | | | | 3,694,083 | |
| Shares repurchased | | | (637,720) | | | | (8,015,099) | | | | (134,263) | | | | (1,180,000) | |
| Net increase (decrease) | | | (266,453) | | | $ | (3,705,553) | | | | 331,350 | | | $ | 4,024,522 | |
| † | On June 24, 2021, the Fund converted 109,490 Class A2 shares into 106,984 Class A shares, valued at $1,355,485. These amounts are reflected in the Class A shares sold and Class A2 shares repurchased, respectively. |
8. Income tax information and distributions to shareholders
The tax character of distributions paid during the fiscal years ended September 30, was as follows:
| | | | | | | | |
| | | 2021 | | | 2020 | |
| Distributions paid from: | | | | | | | | |
| Ordinary income | | $ | 1,525,006 | | | $ | 113,399 | |
| Net long-term capital gains | | | 873,856 | | | | 3,702,423 | |
| Total distributions paid | | $ | 2,398,862 | | | $ | 3,815,822 | |
| | | | | | |
| Franklin Strategic Real Return Fund 2021 Annual Report | | | | | 47 | |
Notes to consolidated financial statements (cont’d)
As of September 30, 2021, the components of distributable earnings (loss) on a tax basis were as follows:
| | | | |
| Undistributed ordinary income — net | | $ | 12,439,886 | |
| Undistributed long-term capital gains — net | | | 2,968,890 | |
| Total undistributed earnings | | $ | 15,408,776 | |
| Other book/tax temporary differences(a) | | | (2,186,178) | |
| Unrealized appreciation (depreciation)(b) | | | 17,174,724 | |
| Total distributable earnings (loss) — net | | $ | 30,397,322 | |
| (a) | Other book/tax temporary differences are attributable to the tax deferral of losses on straddles, the realization for tax purposes of unrealized gains (losses) on certain futures and foreign currency contracts and book/tax differences in the timing of the deductibility of various expenses. |
| (b) | The difference between book-basis and tax-basis unrealized appreciation (depreciation) is attributable to the tax deferral of losses on wash sales and the difference between the book and tax cost basis in underlying investments. |
9. Recent accounting pronouncement
In March 2020, the Financial Accounting Standards Board (FASB) issued Accounting Standards Update (ASU) No. 2020-04, Reference Rate Reform (Topic 848) – Facilitation of the Effects of Reference Rate Reform on Financial Reporting. In January 2021, the FASB issued ASU No. 2021-01, with further amendments to Topic 848. The amendments in the ASUs provide optional temporary accounting recognition and financial reporting relief from the effect of certain types of contract modifications due to the planned discontinuation of the LIBOR and other interbank-offered based reference rates as of the end of 2021 and 2023. The ASUs are effective for certain reference rate-related contract modifications that occur during the period March 12, 2020 through December 31, 2022. Management has reviewed the requirements and believes the adoption of these ASUs will not have a material impact on the financial statements.
10. Other matters
The outbreak of the respiratory illness COVID-19 (commonly referred to as “coronavirus”) has continued to rapidly spread around the world, causing considerable uncertainty for the global economy and financial markets. The ultimate economic fallout from the pandemic, and the long-term impact on economies, markets, industries and individual issuers, are not known. The COVID-19 pandemic could adversely affect the value and liquidity of the Fund’s investments, impair the Fund’s ability to satisfy redemption requests, and negatively impact the Fund’s performance. In addition, the outbreak of COVID-19, and measures taken to mitigate its effects, could result in disruptions to the services provided to the Fund by its service providers.
* * *
The Fund’s investments, payment obligations, and financing terms may be based on floating rates, such as the London Interbank Offered Rate, or “LIBOR,” which is the offered rate for short-term Eurodollar deposits between major international banks. On March 5, 2021, the ICE Benchmark Administration, the administrator of LIBOR, stated that it will cease the
| | | | |
| 48 | | | | Franklin Strategic Real Return Fund 2021 Annual Report |
publication of (i) the overnight and one-, three-, six- and twelve-month USD LIBOR settings immediately following the LIBOR publication on Friday, June 30, 2023 and (ii) all other LIBOR settings, including the one-week and two-month USD LIBOR settings, immediately following the LIBOR publication on Friday, December 31, 2021. There remains uncertainty regarding the nature of any replacement rate and the impact of the transition from LIBOR on the Fund’s transactions and the financial markets generally. As such, the potential effect of a transition away from LIBOR on the Fund or the Fund’s investments cannot yet be determined.
| | | | | | |
| Franklin Strategic Real Return Fund 2021 Annual Report | | | | | 49 | |
Report of independent registered public accounting firm
To the Board of Trustees of Legg Mason Global Asset Management Trust and Shareholders of Franklin Strategic Real Return Fund
Opinion on the Financial Statements
We have audited the accompanying consolidated statement of assets and liabilities, including the consolidated schedule of investments, of Franklin Strategic Real Return Fund and its subsidiary (one of the funds constituting Legg Mason Global Asset Management Trust, referred to hereafter as the “Fund”) as of September 30, 2021, the related consolidated statement of operations for the year ended September 30, 2021, the consolidated statement of changes in net assets for each of the two years in the period ended September 30, 2021, including the related notes, and the consolidated financial highlights, for each of the five years in the period ended September 30, 2021 (collectively referred to as the “financial statements”). In our opinion, the consolidated financial statements present fairly, in all material respects, the financial position of the Fund as of September 30, 2021, the results of its operations for the year then ended, the changes in its net assets for each of the two years in the period ended September 30, 2021 and the financial highlights for each of the five years in the period ended September 30, 2021 in conformity with accounting principles generally accepted in the United States of America.
Basis for Opinion
These consolidated financial statements are the responsibility of the Fund’s management. Our responsibility is to express an opinion on the Fund’s consolidated financial statements based on our audit. We are a public accounting firm registered with the Public Company Accounting Oversight Board (United States) (PCAOB) and are required to be independent with respect to the Fund in accordance with the U.S. federal securities laws and the applicable rules and regulations of the Securities and Exchange Commission and the PCAOB.
We conducted our audit of these consolidated financial statements in accordance with the standards of the PCAOB. Those standards require that we plan and perform the audit to obtain reasonable assurance about whether the consolidated financial statements are free of material misstatement, whether due to error or fraud.
Our audit included performing procedures to assess the risks of material misstatement of the consolidated financial statements, whether due to error or fraud, and performing procedures that respond to those risks. Such procedures included examining, on a test basis, evidence regarding the amounts and disclosures in the consolidated financial statements. Our audit also included evaluating the accounting principles used and significant estimates made by management, as well as evaluating the overall presentation of the consolidated financial statements. Our procedures included confirmation of securities owned as of September 30, 2021 by correspondence with the custodian and brokers. We believe that our audit provides a reasonable basis for our opinion.
/s/PricewaterhouseCoopers LLP
Baltimore, Maryland
November 18, 2021
We have served as the auditor of one or more investment companies in the Franklin Templeton Group of Funds since 1948.
| | | | |
| 50 | | | | Franklin Strategic Real Return Fund 2021 Annual Report |
Amended advisory and subadvisory agreements (unaudited)
Effective August 7, 2021, QS Investors, LLC (“QS Investors”), a wholly-owned subsidiary of Franklin Resources, Inc. (“Franklin Resources”), merged with and into Franklin Advisers, Inc. (“Franklin Advisers”), also a wholly-owned subsidiary of Franklin Resources. As a result of the QS Investors merger, Franklin Advisers became the adviser and a subadviser of the Fund. At a meeting of the Trust’s Board of Trustees held in May 2021, the Board, including a majority of the Trustees who are not “interested persons” (as defined in the Investment Company Act of 1940, as amended) of the Manager or Franklin Advisers (“Independent Trustees”), approved the amendment and restatement of advisory and subadvisory agreements to reflect that Franklin Advisers assumed the rights and obligations of QS Investors under the agreements. The Board received an opinion from legal counsel that the amended and restated agreements, which took effect upon the closing of the QS Investors merger, did not require shareholder approval. The Board considered that the amended and restated agreements under which Franklin Advisers would provide services to the Fund were substantially identical to the agreements to which QS Investors had been a party, that there would be no change in services provided to the Fund, that there would be no change in the fees payable by the Fund, and that the amended and restated agreements would not continue beyond the term of the agreements with QS Investors unless approved by the Board or shareholders of the Fund. The Board also considered that the agreements with QS Investors had been approved by the Board at a meeting of the Board held in April 2020. At such meeting, the Board considered information regarding the nature, extent and quality of the services provided to the Fund, the Fund’s performance, management fees and expense ratios, the profitability of the Manager and its affiliates in providing services to the Fund, whether there had been economies of scale with respect to the management of the Fund and other benefits received by the Manager and its affiliates as a result of their relationship with the Fund. At its May 2021 meeting, the Board received and reviewed updated information regarding the performance and expenses of the Fund. After considering the factors described above as well as other factors, and in the exercise of their business judgment, the Board, including the Independent Trustees, concluded that the amended and restated agreements, including the fees payable thereunder, were fair and reasonable and that entering into the amended and restated agreements was in the best interests of the Fund and its shareholders.
| | | | | | |
| Franklin Strategic Real Return Fund 2021 Annual Report | | | | | 51 | |
Additional shareholder information (unaudited)
Results of special meeting of shareholders
A special meeting of shareholders was held on June 15, 2021 for shareholders of record as of March 1, 2021 (the “Record Date”) to elect the Board of Trustees of the Trust.
Shareholders of the Fund and each other series of the Trust voted together as a single class to elect the Board.
Shareholders of the Trust voted as indicated below (vote totals are rounded to the nearest whole number). Effective July 1, 2021, the Board is composed of the following Trustees:
| | | | | | | | |
| Trustee | | For | | | Withheld | |
| Paul R. Ades | | | 11,915,712,078 | | | | 203,516,727 | |
| Andrew L. Breech | | | 11,923,087,811 | | | | 196,140,993 | |
| Althea L. Duersten | | | 11,972,830,693 | | | | 146,398,111 | |
| Stephen R. Gross | | | 11,919,258,594 | | | | 199,970,210 | |
| Susan M. Heilbron | | | 11,970,320,096 | | | | 148,908,708 | |
| Howard J. Johnson | | | 11,919,503,553 | | | | 199,725,251 | |
| Arnold L. Lehman | | | 11,920,774,188 | | | | 198,454,617 | |
| Robin J.W. Masters | | | 11,971,843,764 | | | | 147,385,040 | |
| Jerome H. Miller | | | 11,919,153,082 | | | | 200,075,722 | |
| Ken Miller | | | 11,922,645,083 | | | | 196,583,722 | |
| G. Peter O’Brien | | | 11,919,113,936 | | | | 200,114,868 | |
| Thomas F. Schlafly | | | 11,917,628,123 | | | | 201,600,682 | |
| Jane Trust | | | 11,985,902,999 | | | | 133,325,805 | |
The above Trustees have also been elected to serve as board members of other mutual funds within the Franklin Templeton fund complex.
| | | | |
| 52 | | | | Franklin Strategic Real Return Fund 2021 Annual Report |
Additional information (unaudited)
Information about Trustees and Officers
The business and affairs of Franklin Strategic Real Return Fund (the “Fund”) are conducted by management under the supervision and subject to the direction of its Board of Trustees. The business address of each Trustee is c/o Jane Trust, Legg Mason, 100 International Drive, 11th Floor, Baltimore, Maryland 21202. Information pertaining to the Trustees and officers of the Fund is set forth below.
Previously, the mutual funds of Legg Mason Global Asset Management Trust were overseen by one group of Trustees, and the mutual funds of Legg Mason Partners Investment Trust and Legg Mason Partners Variable Equity Trust (collectively, the “Funds”) were overseen by a different group of Trustees. A joint proxy statement was mailed to solicit shareholder approval for the election of a single slate of Trustees. Shareholders approved the proposed Trustees during a joint special meeting of shareholders on June 15, 2021. Effective July 1, 2021, the Trustees listed below oversee all of the Funds.
The Statement of Additional Information includes additional information about Trustees and is available, without charge, upon request by calling the Fund at 1-877-721-1926.
| | |
| Independent Trustees† | | |
| |
| Paul R. Ades | | |
| |
| Year of birth | | 1940 |
| Position(s) with Trust | | Trustee |
| Term of office1 and length of time served2 | | Since 1983 |
| Principal occupation(s) during the past five years | | Paul R. Ades, PLLC (law firm) (since 2000) |
| Number of funds in fund complex overseen by Trustee | | 61 |
| Other board memberships held by Trustee during the past five years | | None |
| |
| Andrew L. Breech | | |
| |
| Year of birth | | 1952 |
| Position(s) with Trust | | Trustee |
| Term of office1 and length of time served2 | | Since 1991 |
| Principal occupation(s) during the past five years | | President, Dealer Operating Control Service, Inc. (automotive retail management) (since 1985) |
| Number of funds in fund complex overseen by Trustee | | 61 |
| Other board memberships held by Trustee during the past five years | | None |
| | | | | | |
| Franklin Strategic Real Return Fund | | | | | 53 | |
Additional information (unaudited) (cont’d)
Information about Trustees and Officers
| | |
| Independent Trustees† (cont’d) | | |
| |
| Althea L. Duersten* | | |
| |
| Year of birth | | 1951 |
| Position(s) with Trust | | Trustee and Chair of the Board |
| Term of office1 and length of time served2 | | Since 2014 (Chair of the Board since 2021) |
| Principal occupation(s) during the past five years | | Retired (since 2011); formerly, Chief Investment Officer, North America, JPMorgan Chase (investment bank) and member of JPMorgan Executive Committee (2007 to 2011) |
| Number of funds in fund complex overseen by Trustee | | 61 |
| Other board memberships held by Trustee during the past five years | | Formerly, Non-Executive Director, Rokos Capital Management LLP (2019 to 2020) |
| |
| Stephen R. Gross | | |
| |
| Year of birth | | 1947 |
| Position(s) with Trust | | Trustee |
| Term of office1 and length of time served2 | | Since 1986 |
| Principal occupation(s) during the past five years | | Chairman Emeritus (since 2011) and formerly, Chairman, HLB Gross Collins, P.C. (accounting and consulting firm) (1979 to 2011); Executive Director of Business Builders Team, LLC (since 2005); Principal, Gross Consulting Group, LLC (since 2011); CEO, Gross Capital Partners, LLC (since 2014); CEO, Trusted CFO Solutions, LLC (since 2011) |
| Number of funds in fund complex overseen by Trustee | | 61 |
| Other board memberships held by Trustee during the past five years | | None |
| |
| Susan M. Heilbron | | |
| |
| Year of birth | | 1945 |
| Position(s) with Trust | | Trustee |
| Term of office1 and length of time served2 | | Since 1991 |
| Principal occupation(s) during the past five years | | Retired; formerly, President, Lacey & Heilbron (communications consulting) (1990 to 2002); General Counsel and Executive Vice President, The Trump Organization (1986 to 1990); Senior Vice President, New York State Urban Development Corporation (1984 to 1986); Associate, Cravath, Swaine & Moore LLP (1980 to 1984 and 1977 to 1979) |
| Number of funds in fund complex overseen by Trustee | | 61 |
| Other board memberships held by Trustee during the past five years | | Formerly, Director, Lincoln Savings Bank FSB (1991 to 1994); Director, Trump Shuttle, Inc. (air transportation) (1989 to 1990); Director, Alexander’s Inc. (department store) (1987 to 1990) |
| | | | |
| 54 | | | | Franklin Strategic Real Return Fund |
| | |
| Independent Trustees† (cont’d) | | |
| |
| Howard J. Johnson | | |
| Year of birth | | 1938 |
| Position(s) with Trust | | Trustee |
| Term of office1 and length of time served2 | | From 1981 to 1998 and since 2000 |
| Principal occupation(s) during the past five years | | Retired; formerly, Chief Executive Officer, Genesis Imaging LLC (technology company) (2003 to 2012) |
| Number of funds in fund complex overseen by Trustee | | 61 |
| Other board memberships held by Trustee during the past five years | | None |
| |
| Arnold L. Lehman | | |
| |
| Year of birth | | 1944 |
| Position(s) with Trust | | Trustee |
| Term of office1 and length of time served2 | | Since 1982 |
| Principal occupation(s) during the past five years | | Senior Advisor, Phillips (auction house) (since 2015); formerly, Fellow, Ford Foundation (2015 to 2016); Director of the Brooklyn Museum (1997 to 2015) |
| Number of funds in fund complex overseen by Trustee | | 61 |
| Other board memberships held by Trustee during the past five years | | Trustee of American Federation of Arts (since 2002) |
| |
| Robin J. W. Masters | | |
| |
| Year of birth | | 1955 |
| Position(s) with Trust | | Trustee |
| Term of office1 and length of time served2 | | Since 2002 |
| Principal occupation(s) during the past five years | | Retired; formerly, Chief Investment Officer of ACE Limited (insurance) (1986 to 2000) |
| Number of funds in fund complex overseen by Trustee | | 61 |
| Other board memberships held by Trustee during the past five years | | Director of HSBC Managed Portfolios Limited and HSBC Specialist Funds Limited (since 2020); formerly, Director of Cheyne Capital International Limited (investment advisory firm) (2005 to 2020); Director/ Trustee of Legg Mason Institutional Funds plc, Western Asset Fixed Income Funds plc and Western Asset Debt Securities Fund plc. (2007 to 2011) |
| |
| Jerome H. Miller | | |
| |
| Year of birth | | 1938 |
| Position(s) with Trust | | Trustee |
| Term of office1 and length of time served2 | | Since 1995 |
| Principal occupation(s) during the past five years | | Retired; formerly, President, Shearson Lehman Asset Management (1991 to 1993), Vice Chairman, Shearson Lehman Hutton Inc. (1989 to 1992) and Senior Executive Vice President, E.F. Hutton Group Inc. (1986 to 1989) |
| Number of funds in fund complex overseen by Trustee | | 61 |
| Other board memberships held by Trustee during the past five years | | None |
| | | | | | |
| Franklin Strategic Real Return Fund | | | | | 55 | |
Additional information (unaudited) (cont’d)
Information about Trustees and Officers
| | |
| Independent Trustees† (cont’d) | | |
| |
| Ken Miller | | |
| Year of birth | | 1942 |
| Position(s) with Trust | | Trustee |
| Term of office1 and length of time served2 | | Since 1983 |
| Principal occupation(s) during the past five years | | Retired; formerly, President, Young Stuff Apparel Group, Inc. (apparel manufacturer), division of Li & Fung (1963 to 2012) |
| Number of funds in fund complex overseen by Trustee | | 61 |
| Other board memberships held by Trustee during the past five years | | None |
| |
| G. Peter O’Brien | | |
| |
| Year of birth | | 1945 |
| Position(s) with Trust | | Trustee |
| Term of office1 and length of time served2 | | Since 1999 |
| Principal occupation(s) during the past five years | | Retired, Trustee Emeritus of Colgate University (since 2005); Board Member, Hill House, Inc. (residential home care) (since 1999); formerly, Board Member, Bridges School (pre-school) (2006 to 2017); Managing Director, Equity Capital Markets Group of Merrill Lynch & Co. (1971 to 1999) |
| Number of funds in fund complex overseen by Trustee | | Trustee of Legg Mason funds consisting of 61 portfolios; Director/Trustee of the Royce Family of Funds consisting of 16 portfolios |
| Other board memberships held by Trustee during the past five years | | Formerly, Director of TICC Capital Corp. (2003 to 2017) |
| |
| Thomas F. Schlafly | | |
| |
| Year of birth | | 1948 |
| Position(s) with Trust | | Trustee |
| Term of office1 and length of time served2 | | Since 1983 |
| Principal occupation(s) during the past five years | | Chairman, The Saint Louis Brewery, LLC (brewery) (since 2012); formerly, President, The Saint Louis Brewery, Inc. (1989 to 2012); Senior Counsel (since 2017) and formerly, Partner (2009 to 2016), Thompson Coburn LLP (law firm) |
| Number of funds in fund complex overseen by Trustee | | 61 |
| Other board memberships held by Trustee during the past five years | | Director, CNB St. Louis Bank (since 2020); formerly, Director, Citizens National Bank of Greater St. Louis (2006 to 2020) |
| | | | |
| 56 | | | | Franklin Strategic Real Return Fund |
| | |
| Interested Trustee and Officer |
|
| Jane Trust, CFA3 |
| |
| Year of birth | | 1962 |
| Position(s) with Trust | | Trustee, President and Chief Executive Officer |
| Term of office1 and length of time served2 | | Since 2015 |
| Principal occupation(s) during the past five years | | Senior Vice President, Fund Board Management, Franklin Templeton (since 2020); Officer and/or Trustee/Director of 132 funds associated with LMPFA or its affiliates (since 2015); President and Chief Executive Officer of LMPFA (since 2015); formerly, Senior Managing Director (2018 to 2020) and Managing Director (2016 to 2018) of Legg Mason & Co., LLC (“Legg Mason & Co.”); Senior Vice President of LMPFA (2015) |
| Number of funds in fund complex overseen by Trustee | | 130 |
| Other board memberships held by Trustee during the past five years | | None |
| | |
| Additional Officers |
|
Ted P. Becker
Franklin Templeton 620 Eighth Avenue, 47th Floor, New York, NY 10018 |
| |
| Year of birth | | 1951 |
| Position(s) with Trust | | Chief Compliance Officer |
| Term of office1 and length of time served2 | | Since 2007 |
| Principal occupation(s) during the past five years | | Vice President, Global Compliance of Franklin Templeton (since 2020); Chief Compliance Officer of LMPFA (since 2006); Chief Compliance Officer of certain funds associated with Legg Mason & Co. or its affiliates (since 2006); formerly, Director of Global Compliance at Legg Mason, Inc. (2006 to 2020); Managing Director of Compliance of Legg Mason & Co. (2005 to 2020) |
|
Susan Kerr
Franklin Templeton 620 Eighth Avenue, 47th Floor, New York, NY 10018 |
| |
| Year of birth | | 1949 |
| Position(s) with Trust | | Chief Anti-Money Laundering Compliance Officer |
| Term of office1 and length of time served2 | | Since 2013 |
| Principal occupation(s) during the past five years | | Senior Compliance Analyst, Franklin Templeton (since 2020); Chief Anti-Money Laundering Compliance Officer of certain funds associated with Legg Mason & Co. or its affiliates (since 2013) and Anti-Money Laundering Compliance Officer (since 2012), Senior Compliance Officer (since 2011) and Assistant Vice President (since 2010) of Franklin Distributors, LLC; formerly, Assistant Vice President of Legg Mason & Co. (2010 to 2020) |
| | | | | | |
| Franklin Strategic Real Return Fund | | | | | 57 | |
Additional information (unaudited) (cont’d)
Information about Trustees and Officers
| | |
| Additional Officers (cont’d) |
|
Jenna Bailey
Franklin Templeton
100 First Stamford Place, 5th Floor, Stamford, CT 06902 |
| |
| Year of birth | | 1978 |
| Position(s) with Trust | | Identity Theft Prevention Officer |
| Term of office1 and length of time served2 | | Since 2015 |
| Principal occupation(s) during the past five years | | Senior Compliance Analyst of Franklin Templeton (since 2020); Identity Theft Prevention Officer of certain funds associated with Legg Mason & Co. or its affiliates (since 2015); formerly, Compliance Officer of Legg Mason & Co. (2013 to 2020); Assistant Vice President of Legg Mason & Co. (2011 to 2020) |
|
Marc A. De Oliveira
Franklin Templeton
100 First Stamford Place, 6th Floor, Stamford, CT 06902 |
| |
| Year of birth | | 1971 |
| Position(s) with Trust | | Secretary and Chief Legal Officer |
| Term of office1 and length of time served2 | | Since 2020 |
| Principal occupation(s) during the past five years | | Associate General Counsel of Franklin Templeton (since 2020); Assistant Secretary of certain funds associated with Legg Mason & Co. or its affiliates (since 2006); formerly, Managing Director (2016 to 2020) and Associate General Counsel of Legg Mason & Co. (2005 to 2020) |
|
Thomas C. Mandia
Franklin Templeton
100 First Stamford Place, 6th Floor, Stamford, CT 06902 |
| |
| Year of birth | | 1962 |
| Position(s) with Trust | | Senior Vice President |
| Term of office1 and length of time served2 | | Since 2020 |
| Principal occupation(s) during the past five years | | Senior Associate General Counsel of Franklin Templeton (since 2020); Secretary of LMPFA (since 2006); Assistant Secretary of certain funds associated with Legg Mason & Co. or its affiliates (since 2006); Secretary of LM Asset Services, LLC (“LMAS”) (since 2002) and Legg Mason Fund Asset Management, Inc. (“LMFAM”) (since 2013) (formerly registered investment advisers); formerly, Managing Director and Deputy General Counsel of Legg Mason & Co. (2005 to 2020) |
| | | | |
| 58 | | | | Franklin Strategic Real Return Fund |
| | |
| Additional Officers (cont’d) |
|
Christopher Berarducci Franklin Templeton 620 Eighth Avenue, 47th Floor, New York, NY 10018 |
| |
| Year of birth | | 1974 |
| Position(s) with Trust | | Treasurer and Principal Financial Officer |
| Term of office1 and length of time served2 | | Since 2014 and 2019 |
| Principal occupation(s) during the past five years | | Vice President, Fund Administration and Reporting, Franklin Templeton (since 2020); Treasurer (since 2010) and Principal Financial Officer (since 2019) of certain funds associated with Legg Mason & Co. or its affiliates; formerly, Managing Director (2020), Director (2015 to 2020), and Vice President (2011 to 2015) of Legg Mason & Co. |
|
Jeanne M. Kelly Franklin Templeton 620 Eighth Avenue, 47th Floor, New York, NY 10018 |
| |
| Year of birth | | 1951 |
| Position(s) with Trust | | Senior Vice President |
| Term of office1 and length of time served2 | | Since 2007 |
| Principal occupation(s) during the past five years | | U.S. Fund Board Team Manager, Franklin Templeton (since 2020); Senior Vice President of certain funds associated with Legg Mason & Co. or its affiliates (since 2007); Senior Vice President of LMPFA (since 2006); President and Chief Executive Officer of LMAS and LMFAM (since 2015); formerly, Managing Director of Legg Mason & Co. (2005 to 2020); Senior Vice President of LMFAM (2013 to 2015) |
| † | Trustees who are not “interested persons” of the Fund within the meaning of Section 2(a)(19) of the Investment Company Act of 1940, as amended (the “1940 Act”). |
| * | Effective July 1, 2021, Ms. Duersten became Chair. |
| 1 | Each Trustee and officer serves until his or her respective successor has been duly elected and qualified or until his or her earlier death, resignation, retirement or removal. |
| 2 | Indicates the earliest year in which the Trustee became a board member for a fund in the Legg Mason fund complex or the officer took such office. |
| 3 | Ms. Trust is an “interested person” of the Fund, as defined in the 1940 Act, because of her position with LMPFA and/or certain of its affiliates. |
| | | | | | |
| Franklin Strategic Real Return Fund | | | | | 59 | |
Important tax information (unaudited)
By mid-February, tax information related to a shareholder’s proportionate share of distributions paid during the preceding calendar year will be received, if applicable. Please also refer to www.franklintempleton.com for per share tax information related to any distributions paid during the preceding calendar year. Shareholders are advised to consult with their tax advisors for further information on the treatment of these amounts on their tax returns.
The following tax information for the Fund is required to be furnished to shareholders with respect to income earned and distributions paid during its fiscal year.
The Fund hereby reports the following amounts, or if subsequently determined to be different, the maximum allowable amounts, for the fiscal year ended September 30, 2021:
| | | | | | | | |
| | | Pursuant to: | | | Amount Reported | |
| Long-Term Capital Gain Dividends | | | §852(b)(3)(C) | | | | $873,856 | |
| Dividends Received Deduction (DRD) | | | §854(b)(1)(A) | | | | $178,296 | |
| Qualified Dividend Income (QDI) | | | §854(b)(1)(B) | | | | $500,166 | |
| Interest-Related Dividends | | | §871(k)(1)(C) | | | | $1,771,243 | |
| Qualified Business Income Dividends | | | §199A | | | | $83,893 | |
| Section 163(j) Interest Dividends | | | §163(j) | | | | $1,972,368 | |
| Interest from Federal Obligations | | | Note (1) | | | | $1,840,804 | |
Note (1) - The law varies in each state as to whether and what percentage of dividend income attributable to Federal obligations is exempt from state income tax. Shareholders are advised to consult with their tax advisors to determine if any portion of the dividends received is exempt from state income taxes.
| | | | |
| 60 | | | | Franklin Strategic Real Return Fund |
Franklin
Strategic Real Return Fund
Trustees*
Paul R. Ades
Andrew L. Breech
Althea L. Duersten**
Chair
Stephen R. Gross
Susan M. Heilbron
Howard J. Johnson
Arnold L. Lehman
Robin J.W. Masters
Jerome H. Miller
Ken Miller
G. Peter O’Brien
Thomas F. Schlafly
Jane Trust
| * | During a June 15, 2021 special meeting of shareholders, a new group of Trustees were elected to oversee the mutual funds of Legg Mason Global Asset Management Trust, Legg Mason Partners Investment Trust (prior to September 1, 2021, known as Legg Mason Partners Equity Trust) and Legg Mason Partners Variable Equity Trust, effective July 1, 2021. |
| ** | Effective July 1, 2021, Ms. Duersten became Chair. |
Investment manager
Legg Mason Partners Fund Advisor, LLC
Investment adviser
Franklin Advisers, Inc.†
Subadvisers
Franklin Advisers, Inc.†
ClearBridge Investments, LLC
Western Asset Management Company, LLC
Western Asset Management Company Limited
Western Asset Management Company Ltd
Distributor
Franklin Distributors, LLC††
Custodian
The Bank of New York Mellon
| † | Effective August 7, 2021, QS Investors merged with and into Franklin Advisers, Inc. |
| †† | Effective July 7, 2021, Legg Mason Investor Services, LLC was renamed Franklin Distributors, LLC. |
Transfer agent
BNY Mellon Investment
Servicing (US) Inc.
4400 Computer Drive
Westborough, MA 01581
Independent registered public accounting firm
PricewaterhouseCoopers LLP
Baltimore, MD
Franklin Strategic Real Return Fund
The Fund is a separate investment series of Legg Mason Global Asset Management Trust, a Maryland statutory trust.
Franklin Strategic Real Return Fund
Legg Mason Funds
620 Eighth Avenue, 47th Floor
New York, NY 10018
The Fund files its complete schedule of portfolio holdings with the Securities and Exchange Commission (“SEC”) for the first and third quarters of each fiscal year as an exhibit to its reports on Form N-PORT. The Fund’s Forms N-PORT are available on the SEC’s website at www.sec.gov. To obtain information on Form N-PORT, shareholders can call the Fund at 1-877-721-1926.
Information on how the Fund voted proxies relating to portfolio securities during the prior 12-month period ended June 30th of each year and a description of the policies and procedures that the Fund uses to determine how to vote proxies related to portfolio transactions are available (1) without charge, upon request, by calling the Fund at 1-877-721-1926, (2) at www.franklintempleton.com and (3) on the SEC’s website at www.sec.gov.
This report is submitted for the general information of the shareholders of Franklin Strategic Real Return Fund. This report is not authorized for distribution to prospective investors in the Fund unless preceded or accompanied by a current prospectus.
Investors should consider the Fund’s investment objectives, risks, charges and expenses carefully before investing. The prospectus contains this and other important information about the Fund. Please read the prospectus carefully before investing.
www.franklintempleton.com
© 2021 Franklin Distributors, LLC,
Member FINRA/SIPC. All rights reserved.
Legg Mason Funds Privacy and Security Notice
Your Privacy and the Security of Your Personal Information is Very Important to the Legg Mason Funds
This Privacy and Security Notice (the “Privacy Notice”) addresses the Legg Mason Funds’ privacy and data protection practices with respect to nonpublic personal information the Funds receive. The Legg Mason Funds include any funds sold by the Funds’ distributor, Franklin Distributors, LLC, as well as Legg Mason-sponsored closed-end funds. The provisions of this Privacy Notice apply to your information both while you are a shareholder and after you are no longer invested with the Funds.
The Type of Nonpublic Personal Information the Funds Collect About You
The Funds collect and maintain nonpublic personal information about you in connection with your shareholder account. Such information may include, but is not limited to:
| • | | Personal information included on applications or other forms; |
| • | | Account balances, transactions, and mutual fund holdings and positions; |
| • | | Bank account information, legal documents, and identity verification documentation; |
| • | | Online account access user IDs, passwords, security challenge question responses; and |
| • | | Information received from consumer reporting agencies regarding credit history and creditworthiness (such as the amount of an individual’s total debt, payment history, etc.). |
How the Funds Use Nonpublic Personal Information About You
The Funds do not sell or share your nonpublic personal information with third parties or with affiliates for their marketing purposes, or with other financial institutions or affiliates for joint marketing purposes, unless you have authorized the Funds to do so. The Funds do not disclose any nonpublic personal information about you except as may be required to perform transactions or services you have authorized or as permitted or required by law.
The Funds may disclose information about you to:
| • | | Employees, agents, and affiliates on a “need to know” basis to enable the Funds to conduct ordinary business, or to comply with obligations to government regulators; |
| • | | Service providers, including the Funds’ affiliates, who assist the Funds as part of the ordinary course of business (such as printing, mailing services, or processing or servicing your account with us) or otherwise perform services on the Funds’ behalf, including companies that may perform statistical analysis, market research and marketing services solely for the Funds; |
| • | | Permit access to transfer, whether in the United States or countries outside of the United States to such Funds’ employees, agents and affiliates and service providers as required to enable the Funds to conduct ordinary business, or to comply with obligations to government regulators; |
| • | | The Funds’ representatives such as legal counsel, accountants and auditors to enable the Funds to conduct ordinary business, or to comply with obligations to government regulators; |
| • | | Fiduciaries or representatives acting on your behalf, such as an IRA custodian or trustee of a grantor trust. |
|
| NOT PART OF THE ANNUAL REPORT |
Legg Mason Funds Privacy and Security Notice (cont’d)
Except as otherwise permitted by applicable law, companies acting on the Funds’ behalf, including those outside the United States, are contractually obligated to keep nonpublic personal information the Funds provide to them confidential and to use the information the Funds share only to provide the services the Funds ask them to perform. The Funds may disclose nonpublic personal information about you when necessary to enforce their rights or protect against fraud, or as permitted or required by applicable law, such as in connection with a law enforcement or regulatory request, subpoena, or similar legal process. In the event of a corporate action or in the event a Fund service provider changes, the Funds may be required to disclose your nonpublic personal information to third parties. While it is the Funds’ practice to obtain protections for disclosed information in these types of transactions, the Funds cannot guarantee their privacy policy will remain unchanged.
Keeping You Informed of the Funds’ Privacy and Security Practices
The Funds will notify you annually of their privacy policy as required by federal law. While the Funds reserve the right to modify this policy at any time they will notify you promptly if this privacy policy changes.
The Funds’ Security Practices
The Funds maintain appropriate physical, electronic and procedural safeguards designed to guard your nonpublic personal information. The Funds’ internal data security policies restrict access to your nonpublic personal information to authorized employees, who may use your nonpublic personal information for Fund business purposes only.
Although the Funds strive to protect your nonpublic personal information, they cannot ensure or warrant the security of any information you provide or transmit to them, and you do so at your own risk. In the event of a breach of the confidentiality or security of your nonpublic personal information, the Funds will attempt to notify you as necessary, so you can take appropriate protective steps. If you have consented to the Funds using electronic communications or electronic delivery of statements, they may notify you under such circumstances using the most current email address you have on record with them.
In order for the Funds to provide effective service to you, keeping your account information accurate is very important. If you believe that your account information is incomplete, not accurate or not current, if you have questions about the Funds’ privacy practices, or our use of your nonpublic personal information, write the Funds using the contact information on your account statements, email the Funds by clicking on the Contact Us section of the Funds’ website at www.franklintempleton.com, or contact the Fund at 1-877-721-1926.
Revised April 2018
|
| NOT PART OF THE ANNUAL REPORT |
Legg Mason Funds Privacy and Security Notice (cont’d)
Legg Mason California Consumer Privacy Act Policy
Although much of the personal information we collect is “nonpublic personal information” subject to federal law, residents of California may, in certain circumstances, have additional rights under the California Consumer Privacy Act (“CCPA”). For example, if you are a broker, dealer, agent, fiduciary, or representative acting by or on behalf of, or for, the account of any other person(s) or household, or a financial advisor, or if you have otherwise provided personal information to us separate from the relationship we have with personal investors, the provisions of this Privacy Policy apply to your personal information (as defined by the CCPA).
| • | | In addition to the provisions of the Legg Mason Funds Security and Privacy Notice, you may have the right to know the categories and specific pieces of personal information we have collected about you. |
| • | | You also have the right to request the deletion of the personal information collected or maintained by the Funds. |
If you wish to exercise any of the rights you have in respect of your personal information, you should advise the Funds by contacting them as set forth below. The rights noted above are subject to our other legal and regulatory obligations and any exemptions under the CCPA. You may designate an authorized agent to make a rights request on your behalf, subject to the identification process described below. We do not discriminate based on requests for information related to our use of your personal information, and you have the right not to receive discriminatory treatment related to the exercise of your privacy rights.
We may request information from you in order to verify your identity or authority in making such a request. If you have appointed an authorized agent to make a request on your behalf, or you are an authorized agent making such a request (such as a power of attorney or other written permission), this process may include providing a password/passcode, a copy of government issued identification, affidavit or other applicable documentation, i.e. written permission. We may require you to verify your identity directly even when using an authorized agent, unless a power of attorney has been provided. We reserve the right to deny a request submitted by an agent if suitable and appropriate proof is not provided.
For the 12-month period prior to the date of this Privacy Policy, the Legg Mason Funds have not sold any of your personal information; nor do we have any plans to do so in the future.
Contact Information
Address: Data Privacy Officer, 100 International Dr., Baltimore, MD 21202
Email: DataProtectionOfficer@franklintempleton.com
Phone: 1-800-396-4748
Revised October 2020
|
| NOT PART OF THE ANNUAL REPORT |
www.franklintempleton.com
© 2021 Franklin Distributors, LLC, Member FINRA/SIPC. All rights reserved.
LMFX013120 11/21 SR21-4266
The registrant has adopted a code of ethics that applies to the registrant’s principal executive officer, principal financial officer, principal accounting officer or controller.
| ITEM 3. | AUDIT COMMITTEE FINANCIAL EXPERT. |
The Board of Trustees of the registrant has determined that Stephen R. Gross possesses the technical attributes identified in Instruction 2(b) of Item 3 to Form N-CSR to qualify as an “audit committee financial expert,” and has designated Stephen R. Gross as the Audit Committee’s financial expert. Stephen R. Gross is an “independent” Trustees pursuant to paragraph (a)(2) of Item 3 to Form N-CSR.
| ITEM 4. | PRINCIPAL ACCOUNTANT FEES AND SERVICES. |
(a) Audit Fees. The aggregate fees billed in the last two fiscal years ending September 30, 2020 and September 30, 2021 (the “Reporting Periods”) for professional services rendered by the Registrant’s principal accountant (the “Auditor”) for the audit of the Registrant’s annual financial statements, or services that are normally provided by the Auditor in connection with the statutory and regulatory filings or engagements for the Reporting Periods, were $322,330 in September 30, 2020 and $322,330 in September 30, 2021.
(b) Audit-Related Fees. The aggregate fees billed in the Reporting Period for assurance and related services by the Auditor that are reasonably related to the performance of the Registrant’s financial statements were $0 in September 30, 2020 and $0 in September 30, 2021.
(c) Tax Fees. The aggregate fees billed in the Reporting Periods for professional services rendered by the Auditor for tax compliance, tax advice and tax planning (“Tax Services”) were $0 in September 30, 2020 and $80,500 in September 30, 2021. These services consisted of (i) review or preparation of U.S. federal, state, local and excise tax returns; (ii) U.S. federal, state and local tax planning, advice and assistance regarding statutory, regulatory or administrative developments, and (iii) tax advice regarding tax qualification matters and/or treatment of various financial instruments held or proposed to be acquired or held.
There were no fees billed for tax services by to the service affiliates during the Reporting Periods that required pre-approval by the Audit Auditors Committee.
(d) All Other Fees. The aggregate fees for other fees billed in the Reporting Periods for products and services provided by the Auditor were $0 in September 30, 2020 and $0 in September 30, 2021, other than the services reported in paragraphs (a) through (c) of this item for the Legg Mason Global Asset Management Trust.
All Other Fees. There were no other non-audit services rendered by the Auditor to Legg Mason Partners Fund Advisors, LLC (“LMPFA”), and any entity controlling, controlled by or under common control with LMPFA that provided ongoing services to Legg Mason Global Asset Management Trust requiring pre-approval by the Audit Committee in the Reporting Period.
(e) Audit Committee’s pre–approval policies and procedures described in paragraph (c) (7) of Rule 2-01 of Regulation S-X.
(1) The Charter for the Audit Committee (the “Committee”) of the Board of each registered investment company (the “Fund”) advised by LMPFA or one of their affiliates (each, an “Adviser”) requires that the Committee shall approve (a) all audit and permissible non-audit services to be provided to the Fund and (b) all permissible non-audit services to be provided by the Fund’s independent auditors to the Adviser and any Covered Service Providers if the engagement relates directly to the operations and financial reporting of the Fund. The Committee may implement policies and procedures by which such services are approved other than by the full Committee.
The Committee shall not approve non-audit services that the Committee believes may impair the independence of the auditors. As of the date of the approval of this Audit Committee Charter, permissible non-audit services include any professional services (including tax services), that are not prohibited services as described below, provided to the Fund by the independent auditors, other than those provided to the Fund in connection with an audit or a review of the financial statements of the Fund. Permissible non-audit services may not include: (i) bookkeeping or other services related to the accounting records or financial statements of the Fund; (ii) financial information systems design and implementation; (iii) appraisal or valuation services, fairness opinions or contribution-in-kind reports; (iv) actuarial services; (v) internal audit outsourcing services; (vi) management functions or human resources; (vii) broker or dealer, investment adviser or investment banking services; (viii) legal services and expert services unrelated to the audit; and (ix) any other service the Public Company Accounting Oversight Board determines, by regulation, is impermissible.
Pre-approval by the Committee of any permissible non-audit services is not required so long as: (i) the aggregate amount of all such permissible non-audit services provided to the Fund, the Adviser and any service providers controlling, controlled by or under common control with the Adviser that provide ongoing services to the Fund (“Covered Service Providers”) constitutes not more than 5% of the total amount of revenues paid to the independent auditors during the fiscal year in which the permissible non-audit services are provided to (a) the Fund, (b) the Adviser and (c) any entity controlling, controlled by or under common control with the Adviser that provides ongoing services to the Fund during the fiscal year in which the services are provided that would have to be approved by the Committee; (ii) the permissible non-audit services were not recognized by the Fund at the time of the engagement to be non-audit services; and (iii) such services are promptly brought to the attention of the Committee and approved by the Committee (or its delegate(s)) prior to the completion of the audit.
(2) For the Legg Mason Global Asset Management Trust, the percentage of fees that were approved by the audit committee, with respect to: Audit-Related Fees were 100% and 100% for September 30, 2020 and September 30, 2021; Tax Fees were 100% and 100% for September 30, 2020 and September 30, 2021; and Other Fees were 100% and 100% for September 30, 2020 and September 30, 2021.
(f) N/A
(g) Non-audit fees billed by the Auditor for services rendered to Legg Mason Global Asset Management Trust, LMPFA and any entity controlling, controlled by, or under common control with LMPFA that provides ongoing services to Legg Mason Global Asset Management Trust during the reporting period were $1,105,712 in September 30, 2020 and $1,124,357 in September 30, 2021.
(h) Yes. Legg Mason Global Asset Management Trust’s Audit Committee has considered whether the provision of non-audit services that were rendered to Service Affiliates, which were not pre-approved (not requiring pre-approval), is compatible with maintaining the Accountant’s independence. All services provided by the Auditor to the Legg Mason Global Asset Management Trust or to Service Affiliates, which were required to be pre-approved, were pre-approved as required.
| ITEM 5. | AUDIT COMMITTEE OF LISTED REGISTRANTS. |
| | a) | The independent board members are acting as the registrant’s audit committee as specified in Section 3(a)(58)(B) of the Exchange Act. The Audit Committee consists of the following Board members: |
Paul R. Ades
Andrew L. Breech
Althea L. Duersten**
Stephen R. Gross
Susan M. Heilbron
Howard J. Johnson
Arnold L. Lehman
Robin J.W. Masters
Jerome H. Miller
Ken Miller
G. Peter O’Brien
Thomas F. Schlafly
| * | During a June 15, 2021 special meeting of shareholders, a new group of Trustees were elected to oversee the mutual funds of Legg Mason Global Asset Management Trust, Legg Mason Partners Investment Trust (prior to September 1, 2021, known as Legg Mason Equity Trust) and Legg Mason Partners Variable Equity Trust, effective July 1, 2021. |
| ** | Effective July 1, 2021, Ms. Duersten became Chair. |
| ITEM 6. | SCHEDULE OF INVESTMENTS. |
Included herein under Item 1.
| ITEM 7. | DISCLOSURE OF PROXY VOTING POLICIES AND PROCEDURES FOR CLOSED-END MANAGEMENT INVESTMENT COMPANIES. |
Not applicable.
| ITEM 8. | PORTFOLIO MANAGERS OF CLOSED-END MANAGEMENT INVESTMENT COMPANIES. |
Not applicable.
| ITEM 9. | PURCHASES OF EQUITY SECURITIES BY CLOSED-END MANAGEMENT INVESTMENT COMPANY AND AFFILIATED PURCHASERS. |
Not applicable.
| ITEM 10. | SUBMISSION OF MATTERS TO A VOTE OF SECURITY HOLDERS. |
Not applicable.
| ITEM 11. | CONTROLS AND PROCEDURES. |
| | (a) | The registrant’s principal executive officer and principal financial officer have concluded that the registrant’s disclosure controls and procedures (as defined in Rule 30a- 3(c) under the Investment Company Act of 1940, as amended (the “1940 Act”)) are effective as of a date within 90 days of the filing date of this report that includes the disclosure required by this paragraph, based on their evaluation of the disclosure controls and procedures required by Rule 30a-3(b) under the 1940 Act and 15d-15(b) under the Securities Exchange Act of 1934. |
| | (b) | There were no changes in the registrant’s internal control over financial reporting (as defined in Rule 30a-3(d) under the 1940 Act) that occurred during the second fiscal quarter of the period covered by this report that have materially affected, or are likely to materially affect the registrant’s internal control over financial reporting. |
| ITEM 12. | DISCLOSURE OF SECURITIES LENDING ACTIVITIES FOR CLOSED-END MANAGEMENT INVESTMENT COMPANIES. |
Not applicable.
(a) (1) Code of Ethics attached hereto.
Exhibit 99.CODE ETH
(a) (2) Certifications pursuant to section 302 of the Sarbanes-Oxley Act of 2002 attached hereto.
Exhibit 99.CERT
(b) Certifications pursuant to Section 906 of the Sarbanes-Oxley Act of 2002 attached hereto.
Exhibit 99.906CERT
SIGNATURES
Pursuant to the requirements of the Securities Exchange Act of 1934 and the Investment Company Act of 1940, the registrant has duly caused this Report to be signed on its behalf by the undersigned, there unto duly authorized.
| | |
| Legg Mason Global Asset Management Trust |
| |
| By: | | /s/ Jane Trust |
| | Jane Trust |
| | Chief Executive Officer |
| |
| Date: | | November 24, 2021 |
Pursuant to the requirements of the Securities Exchange Act of 1934 and the Investment Company Act of 1940, this report has been signed below by the following persons on behalf of the registrant and in the capacities and on the dates indicated.
| | |
| By: | | /s/ Jane Trust |
| | Jane Trust |
| | Chief Executive Officer |
| |
| Date: | | November 24, 2021 |
| | |
| By: | | /s/ Christopher Berarducci |
| | Christopher Berarducci |
| | Principal Financial Officer |
| |
| Date: | | November 24, 2021 |