UNITED STATES
SECURITIES AND EXCHANGE COMMISSION
Washington, D.C. 20549
FORM N-CSR
CERTIFIED SHAREHOLDER REPORT OF REGISTERED
MANAGEMENT INVESTMENT COMPANIES
Investment Company Act file number 811-22338
Legg Mason Global Asset Management Trust
(Exact name of registrant as specified in charter)
620 Eighth Avenue, 47th Floor,
New York, NY 10018
(Address of principal executive offices) (Zip code)
Marc A. De Oliveira
Franklin Templeton
100 First Stamford Place
Stamford, CT 06902
(Name and address of agent for service)
Registrant’s telephone number, including area code: 1-877-721-1926
Date of fiscal year end: September 30
Date of reporting period: September 30, 2021
| ITEM 1. | REPORT TO STOCKHOLDERS |
The Annual Report to Stockholders is filed herewith.

| | |
| Annual Report | | September 30, 2021 |
BrandywineGLOBAL —
GLOBAL HIGH YIELD FUND
The Fund intends to no longer mail paper copies of the Fund’s shareholder reports like this one, unless you specifically request paper copies of the reports from the Fund or from your Service Agent or financial intermediary (such as a broker-dealer or bank). Instead, the reports will be made available on a website, and you will be notified by mail each time a report is posted and provided with a website link to access the report.
If you already elected to receive shareholder reports electronically (“e-delivery”), you will not be affected by this change and you need not take any action. If you have not already elected e-delivery, you may elect to receive shareholder reports and other communications from the Fund electronically by contacting your Service Agent or, if you are a direct shareholder with the Fund, by calling 1-877-721-1926.
You may elect to receive all future reports in paper free of charge. If you invest through a Service Agent, you can contact your Service Agent to request that you continue to receive paper copies of your shareholder reports. That election will apply to all Legg Mason Funds held in your account at that Service Agent. If you are a direct shareholder with the Fund, you can call the Fund at 1-877-721-1926, or write to the Fund by regular mail at Legg Mason Funds, P.O. Box 9699, Providence, RI 02940-9699 or by express, certified or registered mail to Legg Mason Funds, 4400 Computer Drive, Westborough, MA 01581 to let the Fund know you wish to continue receiving paper copies of your shareholder reports. That election will apply to all Legg Mason Funds held in your account held directly with the fund complex.

|
| INVESTMENT PRODUCTS: NOT FDIC INSURED • NO BANK GUARANTEE • MAY LOSE VALUE |
Fund objectives
The Fund’s primary objective is to provide a high level of current income. Long-term capital appreciation is its secondary objective.
Letter from the president

Dear Shareholder,
We are pleased to provide the annual report of BrandywineGLOBAL — Global High Yield Fund for the twelve-month reporting period ended September 30, 2021. Please read on for a detailed look at prevailing economic and market conditions during the Fund’s reporting period and to learn how those conditions have affected Fund performance.
As always, we remain committed to providing you with excellent service and a full spectrum of investment choices. We also remain committed to supplementing the support you receive from your financial advisor. One way we accomplish this is through our website, www.franklintempleton.com. Here you can gain immediate access to market and investment information, including:
| • | | Fund prices and performance, |
| • | | Market insights and commentaries from our portfolio managers, and |
| • | | A host of educational resources. |
We look forward to helping you meet your financial goals.
Sincerely,

Jane Trust, CFA
President and Chief Executive Officer
October 29, 2021
| | |
II | | BrandywineGLOBAL — Global High Yield Fund |
Fund overview
Q. What is the Fund’s investment strategy?
A. The Fund’s primary objective is to provide a high level of current income. Long-term capital appreciation is its secondary objective. Under normal market conditions, the Fund will invest at least 80% of its total assets in high yield securities. High yield securities are those rated below investment grade (that is, securities rated below Baa/BBB assigned by at least one Nationally Recognized Statistical Rating Organization (“NRSRO”) that provide such a rating) or unrated securities that we determined to be of comparable credit quality; they are commonly known as “junk bonds.” The Fund’s high yield securities may include distressed and defaulted securities.
As a global fund, the Fund can seek investment opportunities anywhere in the world, and under normal market conditions, the Fund will be invested in at least three countries, which may include the United States. The Fund can invest without limit in securities of issuers in the United States or in any other country, including countries with developing or emerging markets. The Fund’s investments may be denominated in foreign currency or U.S. dollar-denominated.
Under normal market conditions, the investment universe primarily consists of high yield debt of corporate or sovereign issuers. We may also consider investment in other instruments including bank loans, defaulted bonds, defaulted bank loans, debtor-in possession loans (“DIP loans”), investment grade corporate bonds, U.S. Treasuries and agencies, mortgage-backed securities, asset-backed securities, zero coupon bonds, securities representing securitized assets, currencies, preferred stock, convertible bonds, and other fixed income securities.
The Fund may enter into various derivative transactions including, but not limited to, forwards, futures, swaps and credit default swaps (index and single name). Derivatives may be used by the Fund as a hedging technique in an attempt to manage risk; as a substitute for buying or selling securities; to provide additional exposure to investment types or market factors; to change the characteristics of the Fund’s portfolio; in an attempt to enhance returns; and to manage cash. These instruments are taken into account when determining compliance with the Fund’s 80% policy.
The Fund may invest in currency forwards in order to hedge its currency exposure in bond positions or to gain currency exposure. These investments may be significant at times. Although we have the flexibility to make use of currency forwards, we may choose not to for a variety of reasons, even under very volatile market conditions. The Fund may invest in securities of any maturity. The weighted average effective durationi of the Fund’s portfolio, including derivatives, is expected to range from 0 to 7 years.
The Fund’s investment style is disciplined, active, value-driven, and strategic. The investment strategy combines top-down analysis of macro-economic conditions with bottom-up fundamental analysis in an effort to determine where the most attractive valuations exist during the business cycle — while considering credit quality, sector
| | | | | | |
| BrandywineGLOBAL — Global High Yield Fund 2021 Annual Report | | | | | 1 | |
Fund overview (cont’d)
allocation and security selection. We use the strategy to identify and invest in foreign or U.S. bonds which we believe have attractive “real” and “risk” adjusted yields. We rotate portfolio positions mindful of credit quality, sector allocation and security selection given the state of the economy, and endeavor to control risk by purchasing securities we believe to be undervalued. We consider secular trends, political and monetary conditions and business cycle risks when making investment decisions. We also take into account the relative risk and return characteristics of prospective investments when determining how to achieve desired exposures.
Q. What were the overall market conditions during the Fund’s reporting period?
A. The economy and financial markets continued to be impacted by the COVID-19 pandemic during the twelve-month reporting period ended September 30, 2021. Looking at the U.S. economy, fourth quarter 2020 annualized gross domestic product (GDP)ii growth was 4.3%. The Commerce Department then reported that first and second quarter 2021 annualized GDP growth was 6.3% and 6.7%, respectively. Finally, the initial estimate for third quarter GDP — released after the reporting period ended — was 2.0%.
The Federal Reserve Board (the “Fed”)iii maintained its accommodative monetary policy stance during the reporting period, keeping the federal funds rateiv in a range between 0.00% and 0.25% and maintaining its monthly bond purchases. However, the central bank announced its intention to remove some of its stimulus in late 2021. In the statement following its September 2021 meeting the Fed said, “Last December 2020, the Committee indicated that it would continue to increase its holdings of Treasury securities by at least $80 billion per month and of agency mortgage backed securities by at least $40 billion per month until substantial further progress has been made toward its maximum employment and price stability goals. Since then, the economy has made progress toward these goals. If progress continues broadly as expected, the Committee judges that a moderation in the pace of asset purchases may soon be warranted.” In addition, the Fed now expects two interest rate increases by the end of 2023.
Turning to the fixed income markets, they experienced periods of volatility and, overall, declined over the twelve months ended September 30, 2021. A number of factors impacted the market, including the repercussions from the COVID-19 pandemic, sharply falling and then rising global growth, inflation concerns and rising interest rates. Most spread sectors (non-Treasuries) outperformed similar duration Treasuries. This was partially driven by investors’ search for higher yields in the low interest rate environment.
Both short- and longer-term U.S. Treasury yields moved higher over the reporting period. Short-term U.S. Treasury yields rose as the economy rebounded and the Fed telegraphed its intervention to tighten monetary policy. The yield for the two-year Treasury note began the reporting period at 0.13% and ended the period at 0.28%. Rising yields for the long-term U.S. Treasury were driven by improving economic growth, rising inflation and indications that the Fed will begin remove its monetary policy accommodations. The yield for the ten-year Treasury began the reporting period at 0.69% and ended the period at 1.52%.
| | | | |
2 | | | | BrandywineGLOBAL — Global High Yield Fund 2021 Annual Report |
All told, the Bloomberg U.S. Aggregate Indexv returned -0.90% for the twelve months ended September 30, 2021. For comparison purposes, riskier fixed income securities, including high-yield bond and emerging market debt, produced stronger results. Over the fiscal year, the Bloomberg U.S. Corporate High Yield 2% Issuer Cap Indexvi and the JPMorgan Emerging Markets Bond Index Global (“EMBI Global”)vii returned 11.27% and 3.88%, respectively.
Q. How did we respond to these changing market conditions?
A. During the reporting period, the Fund was roughly 60% invested in the U.S. and approximately 24% invested in emerging markets, the latter being almost all allocated to hard currency bonds. From a currency standpoint, the allocation remained relatively consistent over the reporting period, favoring the U.S. dollar over the euro and closing the allocation to the Egyptian pound.
The credit quality of the portfolio shifted slightly, as we pared our allocation to BB-rated bonds and redeployed the assets B-rated securities. The vast majority of our allocation remains relatively short in duration, with only 7% of the portfolio having a duration of 5+ years. The overall portfolio duration remains approximately 1.5 years under the Bloomberg Global High Yield Indexviii. Our view remains that rates may drift higher as inflationary pressure may prove to be less than transitory over the short term and the Fed may be forced to respond faster than expected.
From a sector perspective, the Fund has large overweights to Basic Industries1 and Consumer Non-Cyclicals2. The largest underweights were hard currency sovereign emerging markets and capital goods. Our Basic Industry allocation is being actively reviewed due to the negative China credit environment and a pause in the commodity rally over the third quarter of 2021. Our largest underweight was the sovereign segment, where we think global growth, coupled with inflationary pressures, might continue to send government bond rates higher. Lastly, we have a long credit exposure via several single-name credit default swaps (“CDS”). We also continue to utilize the credit default index to tactically manage the risk profile of the portfolio.
Performance review
For the twelve months ended September 30, 2021, Class IS shares of BrandywineGLOBAL — Global High Yield Fund returned 10.67%. The Fund’s unmanaged benchmark, the Bloomberg Global High Yield Index, returned 9.40% for the same period. The Lipper Global High Yield Funds Category Averageix returned 10.58% over the same time frame.
| 1 | Basic Industries consists of the following industries: Chemicals, Metals & Mining and Paper. |
| 2 | Consumer Non-Cyclicals consists of the following industries: Beverages—Brewers · Beverages—Distillers / Wineries · Beverages—Non-Alcoholic · Fishing / Farming · Food Processing. |
| | | | | | |
| BrandywineGLOBAL — Global High Yield Fund 2021 Annual Report | | | | | 3 | |
Fund overview (cont’d)
| | | | | | | | |
Performance Snapshot as of September 30, 2021
(unaudited) | |
| (excluding sales charges) | | 6 months | | | 12 months | |
| BrandywineGLOBAL — Global High Yield Fund: | | | | | | | | |
Class A | | | 2.51 | % | | | 10.23 | % |
Class C | | | 2.02 | % | | | 9.29 | % |
Class FI | | | 2.40 | % | | | 10.22 | % |
Class I | | | 2.55 | % | | | 10.43 | % |
Class IS | | | 2.72 | % | | | 10.67 | % |
| Bloomberg Global High Yield Index | | | 2.60 | % | | | 9.40 | % |
| Lipper Global High Yield Funds Category Average | | | 2.94 | % | | | 10.58 | % |
The performance shown represents past performance. Past performance is no guarantee of future results and current performance may be higher or lower than the performance shown above. Principal value, investment returns and yields will fluctuate and investors’ shares, when redeemed, may be worth more or less than their original cost. To obtain performance data current to the most recent month-end, please visit our website at www.franklintempleton.com.
All share class returns assume the reinvestment of all distributions at net asset value and the deduction of all Fund expenses. Returns have not been adjusted to include sales charges that may apply or the deduction of taxes that a shareholder would pay on Fund distributions. If sales charges were reflected, the performance quoted would be lower. Performance figures for periods shorter than one year represent cumulative figures and are not annualized.
Fund performance figures reflect fee waivers and/or expense reimbursements, without which the performance would have been lower.
The 30-Day SEC Yields for the period ended September 30, 2021 for Class A, Class C, Class FI, Class I and Class IS shares were 3.23%, 2.61%, 3.37%, 3.68% and 3.77%, respectively. Absent fee waivers and/or expense reimbursements, the 30-Day SEC Yields for Class A, Class C, Class FI, Class I and Class IS shares would have been 2.83%, 2.06%, 3.18%, 3.16% and 3.21%, respectively. The 30-Day SEC Yield, calculated pursuant to the standard SEC formula, is based on the Fund’s investments over an annualized trailing 30-day period, and not on the distributions paid by the Fund, which may differ.
This Fund is the successor to an institutional account (the “Predecessor”). On November 30, 2012, the Predecessor transferred its assets to the Fund in exchange for the Fund’s Class IS shares.
|
| Total Annual Operating Expenses (unaudited) |
As of the Fund’s current prospectus dated January 29, 2021, the gross total annual fund operating expense ratios for Class A, Class C, Class FI, Class I and Class IS shares were 2.13%, 2.55%, 1.80%, 1.48% and 1.39%, respectively.
Actual expenses may be higher. For example, expenses may be higher than those shown if average net assets decrease. Net assets are more likely to decrease and Fund expense ratios are more likely to increase when markets are volatile.
As a result of expense limitation arrangements, the ratio of total annual fund operating expenses, other than interest, brokerage commissions, dividend expense on short sales, taxes, extraordinary expenses and acquired fund fees and expenses, to average net assets will not exceed 1.15% for Class A shares, 1.90% for Class C shares, 1.15% for Class FI shares, 0.85% for Class I shares and
| | | | |
4 | | | | BrandywineGLOBAL — Global High Yield Fund 2021 Annual Report |
0.75% for Class IS shares. In addition, the ratio of total annual fund operating expenses for Class IS shares will not exceed the ratio of total annual fund operating expenses for Class I shares. Total annual fund operating expenses, after waiving fees and/or reimbursing expenses, exceed the expense limitation (“expense cap”) for each class as a result of acquired fund fees and expenses. These expense limitation arrangements cannot be terminated prior to December 31, 2022 without the Board of Trustees’ consent. In addition, the manager has agreed to waive the Fund’s management fee to an extent sufficient to offset the net management fee payable in connection with any investment in an affiliated money market fund. This management fee waiver is not subject to the recapture provision discussed below.
The manager is permitted to recapture amounts waived and/or reimbursed to a class within three years after the fiscal year in which the manager earned the fee or incurred the expense if the class’ total annual fund operating expenses have fallen to a level below the expense cap in effect at the time the fees were earned, or the expenses incurred. In no case will the manager recapture any amount that would result, on any particular business day of the Fund, in the class’ total annual fund operating expenses exceeding the expense cap or any other lower limit then in effect.
Q. What were the leading contributors to performance?
A. Among the Fund’s largest contributors to performance was the bottom-up security selection within our reflationary trade thematic during the fourth quarter of 2020. In Basic Industry, the impressive commodity price gains over the last calendar year were very supportive to high-yield copper miners. Additionally, in the Industrials sector, emerging market corporates were lifted on the back of stronger global demand.
Meanwhile, the Fund’s bullish position on spread product was also additive. We maintain positions in single-name CDS, U.S. high-yield credit default swaps, and European high-yield CDS, as we believe credit spreads will be fairly stable for the foreseeable future.
Additionally, from a government bond perspective, positions in emerging market quasi-sovereigns, such as Petrobras, contributed to performance. Much of their outperformance occurred after the successful vaccine news at the end of 2020 as risk assets appreciated.
Q. What were the leading detractors from performance?
A. The Fund maintained a 10% underweight to the Euro currency over the reporting period. This was based on the view that U.S. growth would ultimately outpace European growth, and higher interest rates in the U.S. would continue to attract capital from abroad. This thesis was questioned during the period as Europe “caught up” with the U.S. in terms of the Purchasing Managers’ Index and the euro enjoyed a minor rally against the U.S. dollar during the second quarter of 2021.
The Fund added small allocations to a basket of commodity-sensitive emerging market currencies. However, local political uncertainty, most notably in South America, saw those trades ultimately work against the portfolio during the first half of 2021. We continue to see significant risk in the emerging market sovereign bond space, mostly due to weak vaccination rates and a slowing China credit environment, which should eventually flow through to a reduction in global commodity prices. While a mini-commodity “super-cycle”
| | | | | | |
| BrandywineGLOBAL — Global High Yield Fund 2021 Annual Report | | | | | 5 | |
Fund overview (cont’d)
helped raise U.S. dollar funding for emerging market governments globally, we feel this spike will be short-lived, and we expect commodity prices to generally retrace to earlier levels.
Finally, the Fund experienced a negative contribution from a single-name CDS on a high-yield energy issuer. This company, while having no near-term debt maturities, engaged with banks to discuss a potential voluntary restructuring, which caused spreads to materially widen. The position was exited as a result.
Thank you for your investment in BrandywineGLOBAL — Global High Yield Fund. As always, we appreciate that you have chosen us to manage your assets and we remain focused on achieving the Fund’s investment goals.
Sincerely,

Brian L. Kloss, JD, CPA
Portfolio Manager
Brandywine Global Investment Management, LLC

Tracy Chen, CFA, CAIA
Portfolio Manager
Brandywine Global Investment Management, LLC

Renato Latini, CFA
Portfolio Manager
Brandywine Global Investment Management, LLC

Michael Arno, CFA
Portfolio Manager
Brandywine Global Investment Management, LLC
October 18, 2021
| | | | |
6 | | | | BrandywineGLOBAL — Global High Yield Fund 2021 Annual Report |
RISKS: Fixed income securities involve interest rate, credit, inflation, and reinvestment risks. As interest rates rise, the value of fixed income securities falls. High-yield bonds, known as “junk bonds”, possess greater price volatility, illiquidity, and possibility of default. International investments are subject to special risks including currency fluctuations, social, economic, and political uncertainties, which could increase volatility. These risks are magnified in emerging markets. Emerging market countries tend to have economic, political, and legal systems that are less developed and are less stable than those of more developed countries. Derivatives, such as options and futures, can be illiquid, may disproportionately increase losses, and have a potentially large impact on fund performance. As a non-diversified fund, the Fund is permitted to invest a larger percentage of its assets in a smaller number of issuers than a diversified fund, which may magnify the Fund’s losses from events affecting a particular issuer. Because the Fund may focus a significant portion of its investments in a single country or currency, it will be more susceptible to factors adversely affecting such currency or issuers within that country than would a more diversified portfolio of securities. Please see the Fund’s prospectus for a more complete discussion of these and other risks and the Fund’s investment strategies.
Portfolio holdings and breakdowns are as of September 30, 2021 and are subject to change and may not be representative of the portfolio managers’ current or future investments. Please refer to pages 15 through 24 for a list and percentage breakdown of the Fund’s holdings.
The mention of sector breakdowns is for informational purposes only and should not be construed as a recommendation to purchase or sell any securities. The information provided regarding such sectors is not a sufficient basis upon which to make an investment decision. Investors seeking financial advice regarding the appropriateness of investing in any securities or investment strategies discussed should consult their financial professional. The Fund’s top five sector holdings (as a percentage of net assets) as of September 30, 2021 were: Energy (16.7%), Communication Services (14.9%), Consumer Discretionary (13.0%), Materials (12.7%), and Health Care (9.6%). The Fund’s portfolio composition is subject to change at any time.
All investments are subject to risk including the possible loss of principal. Past performance is no guarantee of future results. All index performance reflects no deduction for fees, expenses or taxes. Please note that an investor cannot invest directly in an index.
The information provided is not intended to be a forecast of future events, a guarantee of future results or investment advice. Views expressed may differ from those of the firm as a whole.
| | | | | | |
| BrandywineGLOBAL — Global High Yield Fund 2021 Annual Report | | | | | 7 | |
Fund overview (cont’d)
| i | Effective duration is a duration calculation for bonds with embedded options. Effective duration takes into account that expected cash flows will fluctuate as interest rates change. Please note, duration measures the sensitivity of price (the value of principal) of a fixed income investment to a change in interest rates. |
| ii | Gross domestic product (“GDP”) is the market value of all final goods and services produced within a country in a given period of time. |
| iii | The Federal Reserve Board (the “Fed”) is responsible for the formulation of U.S. policies designed to promote economic growth, full employment, stable prices, and a sustainable pattern of international trade and payments. |
| iv | The federal funds rate is the rate charged by one depository institution on an overnight sale of immediately available funds (balances at the Federal Reserve) to another depository institution; the rate may vary from depository institution to depository institution and from day to day. |
| v | The Bloomberg U.S. Aggregate Index is a broad-based bond index comprised of government, corporate, mortgage-and asset-backed issues, rated investment grade or higher, and having at least one year to maturity. |
| vi | The Bloomberg U.S. Corporate High Yield — 2% Issuer Cap Index is an index of the 2% Issuer Cap component of the Bloomberg U.S. Corporate High Yield Index, which covers the U.S. dollar-denominated, non-investment grade, fixed-rate, taxable corporate bond market. |
| vii | The JPMorgan Emerging Markets Bond Index Global (“EMBI Global”) tracks total returns for U.S. dollar-denominated debt instruments issued by emerging market sovereign and quasi-sovereign entities: Brady bonds, loans, Eurobonds and local market instruments. |
| viii | The Bloomberg Global High Yield Index provides a broad-based measure of the global high-yield fixed-income markets, representing the union of the U.S. High-Yield, Pan-European High-Yield, U.S. Emerging Markets High-Yield, CMBS High-Yield and Pan European Emerging Markets High-Yield Indices. |
| ix | Lipper, Inc., a wholly-owned subsidiary of Refinitiv, provides independent insight on global collective investments. Returns are based on the period ended September 30, 2021, including the reinvestment of all distributions, including returns of capital, if any, calculated among the 105 funds for the six-month period and among the 105 funds for the twelve-month period in the Fund’s Lipper category, and excluding sales charges, if any. |
| | | | |
8 | | | | BrandywineGLOBAL — Global High Yield Fund 2021 Annual Report |
Fund at a glance† (unaudited)
Investment breakdown (%) as a percent of total investments
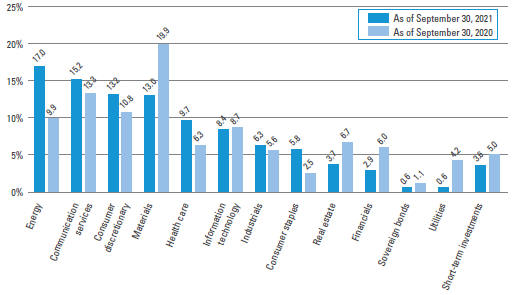
| † | The bar graph above represents the composition of the Fund’s investments as of September 30, 2021 and September 30, 2020 and does not include derivatives, such as forward foreign currency contracts and swap contracts. The Fund is actively managed. As a result, the composition of the Fund’s investments is subject to change at any time. |
| | | | | | |
| BrandywineGLOBAL — Global High Yield Fund 2021 Annual Report | | | | | 9 | |
Fund expenses (unaudited)
Example
As a shareholder of the Fund, you may incur two types of costs: (1) transaction costs, including front-end and back-end sales charges (loads) on purchase payments; and (2) ongoing costs, including management fees; service and/or distribution (12b-1) fees; and other Fund expenses. This example is intended to help you understand your ongoing costs (in dollars) of investing in the Fund and to compare these costs with the ongoing costs of investing in other mutual funds.
This example is based on an investment of $1,000 invested on April 1, 2021 and held for the six months ended September 30, 2021.
Actual expenses
The table below titled “Based on Actual Total Return” provides information about actual account values and actual expenses. You may use the information provided in this table, together with the amount you invested, to estimate the expenses that you paid over the period. To estimate the expenses you paid on your account, divide your ending account value by $1,000 (for example, an $8,600 ending account value divided by $1,000 = 8.6), then multiply the result by the number under the heading entitled “Expenses Paid During the Period”.
Hypothetical example for comparison purposes
The table below titled “Based on Hypothetical Total Return” provides information about hypothetical account values and hypothetical expenses based on the actual expense ratio and an assumed rate of return of 5.00% per year before expenses, which is not the Fund’s actual return. The hypothetical account values and expenses may not be used to estimate the actual ending account balance or expenses you paid for the period. You may use the information provided in this table to compare the ongoing costs of investing in the Fund and other funds. To do so, compare the 5.00% hypothetical example relating to the Fund with the 5.00% hypothetical examples that appear in the shareholder reports of the other funds.
Please note that the expenses shown in the table below are meant to highlight your ongoing costs only and do not reflect any transactional costs, such as front-end or back-end sales charges (loads). Therefore, the table is useful in comparing ongoing costs only, and will not help you determine the relative total costs of owning different funds. In addition, if these transaction costs were included, your costs would have been higher.
| | | | | | | | | | | | | | | | | | | | | | | | | | | | | | | | | | | | | | | | | | | | | | |
| | | |
| Based on actual total return1 | | | | | | | | | Based on hypothetical total return1 | |
| | | Actual
Total Return
Without
Sales
Charge2 | | | Beginning
Account
Value | | | Ending
Account
Value | | | Annualized
Expense
Ratio | | | Expenses
Paid
During
the
Period3 | | | | | | | | Hypothetical
Annualized
Total Return | | | Beginning
Account
Value | | | Ending
Account
Value | | | Annualized
Expense
Ratio | | | Expenses
Paid
During
the
Period3 | |
| Class A | | | 2.51 | % | | | $1,000.00 | | | $ | 1,025.10 | | | | 1.15 | % | | $ | 5.84 | | | | | | | Class A | | | 5.00 | % | | $ | 1,000.00 | | | $ | 1,019.30 | | | | 1.15 | % | | $ | 5.82 | |
| Class C | | | 2.02 | | | | 1,000.00 | | | | 1,020.20 | | | | 1.90 | | | | 9.62 | | | | | | | Class C | | | 5.00 | | | | 1,000.00 | | | | 1,015.54 | | | | 1.90 | | | | 9.60 | |
| Class FI | | | 2.40 | | | | 1,000.00 | | | | 1,024.00 | | | | 1.15 | | | | 5.83 | | | | | | | Class FI | | | 5.00 | | | | 1,000.00 | | | | 1,019.30 | | | | 1.15 | | | | 5.82 | |
| Class I | | | 2.55 | | | | 1,000.00 | | | | 1,025.50 | | | | 0.85 | | | | 4.32 | | | | | | | Class I | | | 5.00 | | | | 1,000.00 | | | | 1,020.81 | | | | 0.85 | | | | 4.31 | |
| Class IS | | | 2.72 | | | | 1,000.00 | | | | 1,027.20 | | | | 0.75 | | | | 3.81 | | | | | | | Class IS | | | 5.00 | | | | 1,000.00 | | | | 1,021.31 | | | | 0.75 | | | | 3.80 | |
| | | | |
10 | | | | BrandywineGLOBAL — Global High Yield Fund 2021 Annual Report |
| 1 | For the six months ended September 30, 2021. |
| 2 | Assumes the reinvestment of all distributions, including returns of capital, if any, at net asset value and does not reflect the deduction of the applicable sales charge with respect to Class A shares or the applicable contingent deferred sales charge (“CDSC”) with respect to Class C shares. Total return is not annualized, as it may not be representative of the total return for the year. Performance figures may reflect compensating balance arrangements, fee waivers and/or expense reimbursements. In the absence of compensating balance arrangements, fee waivers and/or expense reimbursements, the total return would have been lower. Past performance is no guarantee of future results. |
| 3 | Expenses (net of compensating balance arrangements, fee waivers and/or expense reimbursements) are equal to each class’ respective annualized expense ratio multiplied by the average account value over the period, multiplied by the number of days in the most recent fiscal half-year (183), then divided by 365. |
| | | | | | |
| BrandywineGLOBAL — Global High Yield Fund 2021 Annual Report | | | | | 11 | |
Fund performance (unaudited)
The BrandywineGLOBAL — Global High Yield Fund (the “Fund”) is the successor to an institutional account (the “Predecessor”). The performance in the accompanying table and line graph for Class IS shares includes performance of the Predecessor. The Predecessor’s inception date was December 28, 2009. On November 30, 2012, the Predecessor transferred its assets to the Fund in exchange for the Fund’s Class IS shares. The investment policies, objectives, guidelines and restrictions of the Fund are in all material respects equivalent to those of the Predecessor. In addition, Tracy Chen and Brian Kloss, who are currently portfolio managers of the Fund, served as portfolio managers to the Predecessor. As a mutual fund registered under the Investment Company Act of 1940, the Fund is subject to certain restrictions under the 1940 Act and the Internal Revenue Code to which the Predecessor was not subject. Had the Predecessor been registered under the 1940 Act and been subject to the provisions of the 1940 Act and the Code, its investment performance may have been adversely affected. The performance information reflects the gross expenses of the Predecessor adjusted to reflect the higher fees and expenses of Class IS of the Fund. The performance is shown net of annual management fees and other expenses, which reflects the application of the Class IS expense limitation agreement. If the expense limitation agreement were not applicable, expenses would be higher and performance lower.
The Predecessor did not have distribution policies. The Predecessor was an unregistered separately managed account, did not qualify as a regulated investment company for federal income tax purposes and did not pay dividends or distributions.
| | | | | | | | | | | | | | | | | | | | |
| Average annual total returns | | | | | | | | | | | | | |
| Without sales charges1 | | Class A | | | Class C | | | Class FI | | | Class I | | | Class IS | |
| Twelve Months Ended 9/30/21 | | | 10.23 | % | | | 9.29 | % | | | 10.22 | % | | | 10.43 | % | | | 10.67 | % |
| Five Years Ended 9/30/21 | | | 5.34 | | | | 4.60 | | | | 5.38 | | | | 5.70 | | | | 5.80 | |
| Ten Years Ended 9/30/21 | | | N/A | | | | N/A | | | | N/A | | | | N/A | | | | 6.54 | |
| Inception* through 9/30/21 | | | 4.14 | | | | 3.38 | | | | 4.18 | | | | 4.48 | | | | — | |
| | | | | |
| With sales charges2 | | Class A | | | Class C | | | Class FI | | | Class I | | | Class IS | |
| Twelve Months Ended 9/30/21 | | | 5.55 | % | | | 8.29 | % | | | 10.22 | % | | | 10.43 | % | | | 10.67 | % |
| Five Years Ended 9/30/21 | | | 4.43 | | | | 4.60 | | | | 5.38 | | | | 5.70 | | | | 5.80 | |
| Ten Years Ended 9/30/21 | | | N/A | | | | N/A | | | | N/A | | | | N/A | | | | 6.54 | |
| Inception* through 9/30/21 | | | 3.55 | | | | 3.38 | | | | 4.18 | | | | 4.48 | | | | — | |
| | | | |
| Cumulative total returns | |
| |
| Without sales charges1 | | | |
| Class A (Inception date of 2/18/14 through 9/30/21) | | | 36.17 | % |
| Class C (Inception date of 2/18/14 through 9/30/21) | | | 28.83 | |
| Class FI (Inception date of 2/18/14 through 9/30/21) | | | 36.54 | |
| Class I (Inception date of 2/18/14 through 9/30/21) | | | 39.56 | |
| Class IS (9/30/11 through 9/30/21) | | | 88.39 | |
All figures represent past performance and are not a guarantee of future results. Investment return and principal value of an investment will fluctuate so that an investor’s shares, when redeemed, may be worth more or less than their original cost. The returns shown do not reflect the deduction of taxes that a shareholder would pay on Fund distributions or the redemption of Fund shares. Performance figures may reflect compensating balance arrangements, fee waivers and/or expense reimbursements. In the absence of compensating balance arrangements, fee waivers and/or expense reimbursements, the total return would have been lower.
| | | | |
12 | | | | BrandywineGLOBAL — Global High Yield Fund 2021 Annual Report |
| 1 | Assumes the reinvestment of all distributions, including returns of capital, if any, at net asset value and does not reflect the deduction of the applicable sales charge with respect to Class A shares or the applicable contingent deferred sales charge (“CDSC”) with respect to Class C shares. |
| 2 | Assumes the reinvestment of all distributions, including returns of capital, if any, at net asset value. In addition, Class A shares reflect the deduction of the maximum initial sales charge of 4.25% and Class C shares reflect the deduction of a 1.00% CDSC, which applies if shares are redeemed within one year from purchase payment. |
| * | Inception dates for Class A, C, FI, I and IS shares are February 18, 2014, February 18, 2014, February 18, 2014, February 18, 2014 and December 28, 2009, respectively. |
| | | | | | |
| BrandywineGLOBAL — Global High Yield Fund 2021 Annual Report | | | | | 13 | |
Fund performance (unaudited) (cont’d)
Historical performance
Value of $1,000,000 invested in
Class IS Shares of BrandywineGLOBAL — Global High Yield Fund vs. Bloomberg Global High Yield Index† — September 2011 - September 2021
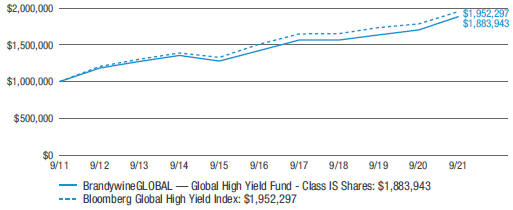
All figures represent past performance and are not a guarantee of future results. Investment return and principal value of an investment will fluctuate so that an investor’s shares, when redeemed, may be worth more or less than their original cost. The returns shown do not reflect the deduction of taxes that a shareholder would pay on Fund distributions or the redemption of Fund shares. Performance figures may reflect compensating balance arrangements, fee waivers and/or expense reimbursements. In the absence of compensating balance arrangements, fee waivers and/or expense reimbursements, the total return would have been lower.
| † | Hypothetical illustration of $1,000,000 invested in Class IS shares of BrandywineGLOBAL — Global High Yield Fund on September 30, 2011, assuming the reinvestment of all distributions, including returns of capital, if any, at net asset value through September 30, 2021. The hypothetical illustration also assumes a $1,000,000 investment, as applicable, in the Bloomberg Global High Yield Index. The Bloomberg Global High Yield Index (the “Index”) provides a broad-based measure of the global high-yield fixed-income markets. The Index is unmanaged and is not subject to the same management and trading expenses as a mutual fund. Please note that an investor cannot invest directly in an index. The performance of the Fund’s other classes may be greater or less than Class IS shares’ performance indicated on this chart, depending on whether greater or lesser sales charges and fees were incurred by shareholders investing in the other classes. |
| | | | |
14 | | | | BrandywineGLOBAL — Global High Yield Fund 2021 Annual Report |
Schedule of investments
September 30, 2021
BrandywineGLOBAL — Global High Yield Fund
(Percentages shown based on Fund net assets)
| | | | | | | | | | | | | | | | |
| Security | | Rate | | | Maturity
Date | | | Face
Amount† | | | Value | |
| Corporate Bonds & Notes — 89.4% | | | | | | | | | | | | | | | | |
| Communication Services — 12.5% | | | | | | | | | | | | | | | | |
Diversified Telecommunication Services — 3.2% | | | | | | | | | | | | | | | | |
Consolidated Communications Inc., Senior Secured Notes | | | 5.000 | % | | | 10/1/28 | | | | 210,000 | | | $ | 217,098 | (a) |
Consolidated Communications Inc., Senior Secured Notes | | | 6.500 | % | | | 10/1/28 | | | | 135,000 | | | | 146,815 | (a) |
Embarq Corp., Senior Notes | | | 7.995 | % | | | 6/1/36 | | | | 325,000 | | | | 349,052 | |
Level 3 Financing Inc., Senior Notes | | | 4.625 | % | | | 9/15/27 | | | | 330,000 | | | | 339,916 | (a) |
Total Diversified Telecommunication Services | | | | | | | | | | | | | | | 1,052,881 | |
Interactive Media & Services — 0.3% | | | | | | | | | | | | | | | | |
Rackspace Technology Global Inc., Senior Secured Notes | | | 3.500 | % | | | 2/15/28 | | | | 120,000 | | | | 115,983 | (a) |
Media — 6.2% | | | | | | | | | | | | | | | | |
Altice France Holding SA, Senior Notes | | | 6.000 | % | | | 2/15/28 | | | | 420,000 | | | | 404,006 | (a) |
Altice France SA, Senior Secured Notes | | | 3.375 | % | | | 1/15/28 | | | | 335,000 | EUR | | | 374,335 | (a) |
Colombia Telecomunicaciones SA ESP, Senior Notes | | | 4.950 | % | | | 7/17/30 | | | | 200,000 | | | | 209,852 | (a) |
Liberty Interactive LLC, Senior Notes | | | 8.250 | % | | | 2/1/30 | | | | 125,000 | | | | 139,263 | |
Sinclair Television Group Inc., Senior Notes | | | 5.875 | % | | | 3/15/26 | | | | 475,000 | | | | 485,688 | (a) |
Sinclair Television Group Inc., Senior Notes | | | 5.500 | % | | | 3/1/30 | | | | 165,000 | | | | 163,914 | (a) |
TEGNA Inc., Senior Notes | | | 4.625 | % | | | 3/15/28 | | | | 270,000 | | | | 276,372 | |
Total Media | | | | | | | | | | | | | | | 2,053,430 | |
Wireless Telecommunication Services — 2.8% | | | | | | | | | | | | | | | | |
Kenbourne Invest SA, Senior Notes | | | 4.700 | % | | | 1/22/28 | | | | 450,000 | | | | 453,262 | (a) |
Switch Ltd., Senior Notes | | | 4.125 | % | | | 6/15/29 | | | | 75,000 | | | | 77,063 | (a) |
T-Mobile USA Inc., Senior Notes | | | 3.500 | % | | | 4/15/31 | | | | 180,000 | | | | 190,059 | |
Vmed O2 UK Financing I PLC, Senior Secured Notes | | | 4.750 | % | | | 7/15/31 | | | | 200,000 | | | | 204,586 | (a) |
Total Wireless Telecommunication Services | | | | | | | | | | | | | | | 924,970 | |
Total Communication Services | | | | | | | | | | | | | | | 4,147,264 | |
| Consumer Discretionary — 13.0% | | | | | | | | | | | | | | | | |
Hotels, Restaurants & Leisure — 7.7% | | | | | | | | | | | | | | | | |
Carrols Restaurant Group Inc., Senior Notes | | | 5.875 | % | | | 7/1/29 | | | | 140,000 | | | | 131,963 | (a) |
GPS Hospitality Holding Co. LLC/GPS Finco Inc., Senior Secured Notes | | | 7.000 | % | | | 8/15/28 | | | | 290,000 | | | | 288,199 | (a) |
International Game Technology PLC, Senior Secured Notes | | | 4.125 | % | | | 4/15/26 | | | | 50,000 | | | | 52,031 | (a) |
Marriott Ownership Resorts Inc., Senior Notes | | | 4.500 | % | | | 6/15/29 | | | | 130,000 | | | | 131,788 | (a) |
Mohegan Gaming & Entertainment, Secured Notes | | | 8.000 | % | | | 2/1/26 | | | | 630,000 | | | | 657,468 | (a) |
Scientific Games International Inc., Senior Notes | | | 8.625 | % | | | 7/1/25 | | | | 340,000 | | | | 368,623 | (a) |
Scientific Games International Inc., Senior Notes | | | 7.000 | % | | | 5/15/28 | | | | 155,000 | | | | 167,400 | (a) |
See Notes to Financial Statements.
| | | | | | |
| BrandywineGLOBAL — Global High Yield Fund 2021 Annual Report | | | | | 15 | |
Schedule of investments (cont’d)
September 30, 2021
BrandywineGLOBAL — Global High Yield Fund
(Percentages shown based on Fund net assets)
| | | | | | | | | | | | | | | | |
| Security | | Rate | | | Maturity
Date | | | Face
Amount† | | | Value | |
Hotels, Restaurants & Leisure — continued | | | | | | | | | | | | | | | | |
Scientific Games International Inc., Senior Secured Notes | | | 5.000 | % | | | 10/15/25 | | | | 130,000 | | | $ | 133,900 | (a) |
Travel + Leisure Co., Senior Secured Notes | | | 6.000 | % | | | 4/1/27 | | | | 550,000 | | | | 610,538 | |
Total Hotels, Restaurants & Leisure | | | | | | | | | | | | | | | 2,541,910 | |
Household Durables — 0.4% | | | | | | | | | | | | | | | | |
KB Home, Senior Notes | | | 4.000 | % | | | 6/15/31 | | | | 145,000 | | | | 148,988 | |
Leisure Products — 0.5% | | | | | | | | | | | | | | | | |
Vista Outdoor Inc., Senior Notes | | | 4.500 | % | | | 3/15/29 | | | | 160,000 | | | | 162,451 | (a) |
Specialty Retail — 4.4% | | | | | | | | | | | | | | | | |
Bath & Body Works Inc., Senior Notes | | | 6.625 | % | | | 10/1/30 | | | | 80,000 | | | | 90,900 | (a) |
Carvana Co., Senior Notes | | | 5.500 | % | | | 4/15/27 | | | | 430,000 | | | | 439,438 | (a) |
Foot Locker Inc., Senior Notes | | | 4.000 | % | | | 10/1/29 | | | | 145,000 | | | | 145,544 | (a)(b) |
Grupo Axo SAPI de CV, Senior Notes | | | 5.750 | % | | | 6/8/26 | | | | 200,000 | | | | 205,299 | (a) |
Michaels Cos. Inc., Senior Notes | | | 7.875 | % | | | 5/1/29 | | | | 160,000 | | | | 166,476 | (a) |
Michaels Cos. Inc., Senior Secured Notes | | | 5.250 | % | | | 5/1/28 | | | | 380,000 | | | | 392,445 | (a) |
Total Specialty Retail | | | | | | | | | | | | | | | 1,440,102 | |
Total Consumer Discretionary | | | | | | | | | | | | | | | 4,293,451 | |
| Consumer Staples — 5.7% | | | | | | | | | | | | | | | | |
Food Products — 3.5% | | | | | | | | | | | | | | | | |
Amaggi Luxembourg International Sarl, Senior Notes | | | 5.250 | % | | | 1/28/28 | | | | 455,000 | | | | 467,399 | (a) |
JBS USA Food Co., Senior Notes | | | 7.000 | % | | | 1/15/26 | | | | 200,000 | | | | 209,340 | (a) |
Minerva Luxembourg SA, Senior Notes | | | 4.375 | % | | | 3/18/31 | | | | 200,000 | | | | 193,440 | (a) |
Simmons Foods Inc./Simmons Prepared Foods Inc./
Simmons Pet Food Inc./Simmons Feed
Ingredients Inc., Secured Notes | | | 4.625 | % | | | 3/1/29 | | | | 270,000 | | | | 272,374 | (a) |
Total Food Products | | | | | | | | | | | | | | | 1,142,553 | |
Household Products — 1.0% | | | | | | | | | | | | | | | | |
Central Garden & Pet Co., Senior Notes | | | 4.125 | % | | | 10/15/30 | | | | 315,000 | | | | 322,481 | |
Personal Products — 0.3% | | | | | | | | | | | | | | | | |
Edgewell Personal Care Co., Senior Notes | | | 5.500 | % | | | 6/1/28 | | | | 105,000 | | | | 111,025 | (a) |
Tobacco — 0.9% | | | | | | | | | | | | | | | | |
Vector Group Ltd., Senior Secured Notes | | | 5.750 | % | | | 2/1/29 | | | | 305,000 | | | | 305,455 | (a) |
Total Consumer Staples | | | | | | | | | | | | | | | 1,881,514 | |
| Energy — 16.7% | | | | | | | | | | | | | | | | |
Oil, Gas & Consumable Fuels — 16.7% | | | | | | | | | | | | | | | | |
Bonanza Creek Energy Inc., Senior Notes | | | 7.500 | % | | | 4/30/26 | | | | 315,000 | | | | 317,789 | |
CITGO Petroleum Corp., Senior Secured Notes | | | 6.375 | % | | | 6/15/26 | | | | 345,000 | | | | 352,509 | (a) |
CNX Resources Corp., Senior Notes | | | 6.000 | % | | | 1/15/29 | | | | 335,000 | | | | 354,681 | (a) |
See Notes to Financial Statements.
| | | | |
16 | | | | BrandywineGLOBAL — Global High Yield Fund 2021 Annual Report |
BrandywineGLOBAL — Global High Yield Fund
(Percentages shown based on Fund net assets)
| | | | | | | | | | | | | | | | |
| Security | | Rate | | | Maturity
Date | | | Face
Amount† | | | Value | |
Oil, Gas & Consumable Fuels — continued | | | | | | | | | | | | | | | | |
Energean Israel Finance Ltd., Senior Secured Notes | | | 5.875 | % | | | 3/30/31 | | | | 430,000 | | | $ | 442,624 | (a)(c) |
Geopark Ltd., Senior Notes | | | 5.500 | % | | | 1/17/27 | | | | 450,000 | | | | 443,970 | (a) |
Magnolia Oil & Gas Operating LLC/Magnolia Oil & Gas Finance Corp., Senior Notes | | | 6.000 | % | | | 8/1/26 | | | | 270,000 | | | | 277,682 | (a) |
New Fortress Energy Inc., Senior Secured Notes | | | 6.750 | % | | | 9/15/25 | | | | 105,000 | | | | 101,220 | (a) |
New Fortress Energy Inc., Senior Secured Notes | | | 6.500 | % | | | 9/30/26 | | | | 215,000 | | | | 205,863 | (a) |
Occidental Petroleum Corp., Senior Notes | | | 3.000 | % | | | 2/15/27 | | | | 375,000 | | | | 375,394 | |
Occidental Petroleum Corp., Senior Notes | | | 6.625 | % | | | 9/1/30 | | | | 315,000 | | | | 388,631 | |
Petroleos Mexicanos, Senior Notes | | | 5.350 | % | | | 2/12/28 | | | | 800,000 | | | | 789,744 | |
Petroleos Mexicanos, Senior Notes | | | 6.950 | % | | | 1/28/60 | | | | 490,000 | | | | 428,880 | |
SierraCol Energy Andina LLC, Senior Notes | | | 6.000 | % | | | 6/15/28 | | | | 325,000 | | | | 318,196 | (a) |
Talos Production Inc., Secured Notes | | | 12.000 | % | | | 1/15/26 | | | | 370,000 | | | | 396,499 | |
Teine Energy Ltd., Senior Notes | | | 6.875 | % | | | 4/15/29 | | | | 325,000 | | | | 331,263 | (a) |
Total Energy | | | | | | | | | | | | | | | 5,524,945 | |
| Financials — 2.8% | | | | | | | | | | | | | | | | |
Banks — 0.6% | | | | | | | | | | | | | | | | |
Natwest Group PLC, Junior Subordinated Notes
(4.600% to 12/28/31 then 5 year Treasury Constant
Maturity Rate + 3.100%) | | | 4.600 | % | | | 6/28/31 | | | | 200,000 | | | | 201,460 | (d)(e) |
Capital Markets — 1.8% | | | | | | | | | | | | | | | | |
Owl Rock Capital Corp., Senior Notes | | | 4.000 | % | | | 3/30/25 | | | | 260,000 | | | | 274,918 | |
XP Inc., Senior Notes | | | 3.250 | % | | | 7/1/26 | | | | 320,000 | | | | 311,664 | (a) |
Total Capital Markets | | | | | | | | | | | | | | | 586,582 | |
Insurance — 0.4% | | | | | | | | | | | | | | | | |
Genworth Holdings Inc., Senior Notes | | | 4.900 | % | | | 8/15/23 | | | | 135,000 | | | | 138,182 | |
Total Financials | | | | | | | | | | | | | | | 926,224 | |
| Health Care — 8.5% | | | | | | | | | | | | | | | | |
Health Care Providers & Services — 1.0% | | | | | | | | | | | | | | | | |
ModivCare Escrow Issuer Inc., Senior Notes | | | 5.000 | % | | | 10/1/29 | | | | 80,000 | | | | 83,024 | (a) |
Tenet Healthcare Corp., Senior Secured Notes | | | 4.250 | % | | | 6/1/29 | | | | 230,000 | | | | 233,737 | (a) |
Total Health Care Providers & Services | | | | | | | | | | | | | | | 316,761 | |
Pharmaceuticals — 7.5% | | | | | | | | | | | | | | | | |
Bausch Health Cos. Inc., Senior Notes | | | 6.125 | % | | | 4/15/25 | | | | 434,000 | | | | 443,505 | (a) |
Bausch Health Cos. Inc., Senior Notes | | | 6.250 | % | | | 2/15/29 | | | | 455,000 | | | | 450,878 | (a) |
Bausch Health Cos. Inc., Senior Notes | | | 7.250 | % | | | 5/30/29 | | | | 120,000 | | | | 123,148 | (a) |
Endo Dac/Endo Finance LLC/Endo Finco Inc., Senior
Secured Notes | | | 5.875 | % | | | 10/15/24 | | | | 545,000 | | | | 535,694 | (a) |
See Notes to Financial Statements.
| | | | | | |
| BrandywineGLOBAL — Global High Yield Fund 2021 Annual Report | | | | | 17 | |
Schedule of investments (cont’d)
September 30, 2021
BrandywineGLOBAL — Global High Yield Fund
(Percentages shown based on Fund net assets)
| | | | | | | | | | | | | | | | |
| Security | | Rate | | | Maturity
Date | | | Face
Amount† | | | Value | |
Pharmaceuticals — continued | | | | | | | | | | | | | | | | |
Teva Pharmaceutical Finance Netherlands III BV,
Senior Notes | | | 7.125 | % | | | 1/31/25 | | | | 350,000 | | | $ | 383,250 | |
Teva Pharmaceutical Finance Netherlands III BV,
Senior Notes | | | 3.150 | % | | | 10/1/26 | | | | 570,000 | | | | 546,487 | |
Total Pharmaceuticals | | | | | | | | | | | | | | | 2,482,962 | |
Total Health Care | | | | | | | | 2,799,723 | |
| Industrials — 6.2% | | | | | | | | | | | | | | | | |
Airlines — 1.7% | | | | | | | | | | | | | | | | |
Gol Finance SA, Senior Secured Notes | | | 8.000 | % | | | 6/30/26 | | | | 555,000 | | | | 558,971 | (a) |
Commercial Services & Supplies — 0.5% | | | | | | | | | | | | | | | | |
Deluxe Corp., Senior Notes | | | 8.000 | % | | | 6/1/29 | | | | 145,000 | | | | 151,706 | (a) |
Construction & Engineering — 0.6% | | | | | | | | | | | | | | | | |
ATP Tower Holdings LLC/Andean Tower Partners Colombia SAS/Andean Telecom Par, Senior Secured Notes | | | 4.050 | % | | | 4/27/26 | | | | 200,000 | | | | 200,750 | (a) |
Electrical Equipment — 0.3% | | | | | | | | | | | | | | | | |
Sensata Technologies Inc., Senior Notes | | | 4.375 | % | | | 2/15/30 | | | | 85,000 | | | | 91,612 | (a) |
Industrial Conglomerates — 1.4% | | | | | | | | | | | | | | | | |
Icahn Enterprises LP/Icahn Enterprises Finance Corp., Senior Notes | | | 6.250 | % | | | 5/15/26 | | | | 435,000 | | | | 455,119 | |
Marine — 1.0% | | | | | | | | | | | | | | | | |
Navios South American Logistics Inc./Navios Logistics Finance U.S. Inc., Senior Secured Notes | | | 10.750 | % | | | 7/1/25 | | | | 320,000 | | | | 348,738 | (a) |
Road & Rail — 0.4% | | | | | | | | | | | | | | | | |
Uber Technologies Inc., Senior Notes | | | 6.250 | % | | | 1/15/28 | | | | 130,000 | | | | 139,587 | (a) |
Trading Companies & Distributors — 0.3% | | | | | | | | | | | | | | | | |
Boise Cascade Co., Senior Notes | | | 4.875 | % | | | 7/1/30 | | | | 95,000 | | | | 101,586 | (a) |
Total Industrials | | | | | | | | 2,048,069 | |
| Information Technology — 7.1% | | | | | | | | | | | | | | | | |
Communications Equipment — 4.5% | | | | | | | | | | | | | | | | |
CommScope Inc., Senior Notes | | | 8.250 | % | | | 3/1/27 | | | | 275,000 | | | | 288,193 | (a) |
CommScope Inc., Senior Notes | | | 7.125 | % | | | 7/1/28 | | | | 100,000 | | | | 102,188 | (a) |
CommScope Inc., Senior Secured Notes | | | 6.000 | % | | | 3/1/26 | | | | 250,000 | | | | 259,895 | (a) |
Connect Finco SARL/Connect US Finco LLC, Senior
Secured Notes | | | 6.750 | % | | | 10/1/26 | | | | 535,000 | | | | 560,445 | (a) |
Viasat Inc., Senior Secured Notes | | | 5.625 | % | | | 4/15/27 | | | | 275,000 | | | | 287,031 | (a) |
Total Communications Equipment | | | | | | | | | | | | | | | 1,497,752 | |
Semiconductors & Semiconductor Equipment — 0.2% | | | | | | | | | | | | | | | | |
Synaptics Inc., Senior Notes | | | 4.000 | % | | | 6/15/29 | | | | 70,000 | | | | 71,703 | (a) |
See Notes to Financial Statements.
| | | | |
18 | | | | BrandywineGLOBAL — Global High Yield Fund 2021 Annual Report |
BrandywineGLOBAL — Global High Yield Fund
(Percentages shown based on Fund net assets)
| | | | | | | | | | | | | | | | |
| Security | | Rate | | | Maturity
Date | | | Face
Amount† | | | Value | |
Software — 1.2% | | | | | | | | | | | | | | | | |
Elastic NV, Senior Notes | | | 4.125 | % | | | 7/15/29 | | | | 70,000 | | | $ | 70,437 | (a) |
MicroStrategy Inc., Senior Secured Notes | | | 6.125 | % | | | 6/15/28 | | | | 325,000 | | | | 328,702 | (a) |
Total Software | | | | | | | | | | | | | | | 399,139 | |
Technology Hardware, Storage & Peripherals — 1.2% | | | | | | | | | | | | | | | | |
Dell International LLC/EMC Corp., Senior Notes | | | 7.125 | % | | | 6/15/24 | | | | 385,000 | | | | 394,188 | (a) |
Total Information Technology | | | | | | | | | | | | | | | 2,362,782 | |
| Materials — 12.7% | | | | | | | | | | | | | | | | |
Chemicals — 2.4% | | | | | | | | | | | | | | | | |
Braskem Idesa SAPI, Senior Secured Notes | | | 7.450 | % | | | 11/15/29 | | | | 345,000 | | | | 366,340 | (a) |
Tronox Inc., Senior Secured Notes | | | 6.500 | % | | | 5/1/25 | | | | 405,000 | | | | 425,623 | (a) |
Total Chemicals | | | | | | | | | | | | | | | 791,963 | |
Containers & Packaging — 1.1% | | | | | | | | | | | | | | | | |
Ardagh Packaging Finance PLC/Ardagh Holdings USA Inc., Senior Notes | | | 5.250 | % | | | 8/15/27 | | | | 370,000 | | | | 377,169 | (a) |
Metals & Mining — 9.2% | | | | | | | | | | | | | | | | |
Alcoa Nederland Holding BV, Senior Notes | | | 4.125 | % | | | 3/31/29 | | | | 410,000 | | | | 427,171 | (a) |
Allegheny Technologies Inc., Senior Notes | | | 7.875 | % | | | 8/15/23 | | | | 325,000 | | | | 366,031 | |
Arconic Corp., Secured Notes | | | 6.125 | % | | | 2/15/28 | | | | 140,000 | | | | 148,578 | (a) |
Cleveland-Cliffs Inc., Senior Notes | | | 5.875 | % | | | 6/1/27 | | | | 450,000 | | | | 466,312 | |
First Quantum Minerals Ltd., Senior Notes | | | 7.250 | % | | | 4/1/23 | | | | 200,000 | | | | 203,750 | (a) |
First Quantum Minerals Ltd., Senior Notes | | | 6.875 | % | | | 10/15/27 | | | | 825,000 | | | | 873,543 | (a) |
Taseko Mines Ltd., Senior Secured Notes | | | 7.000 | % | | | 2/15/26 | | | | 535,000 | | | | 543,025 | (a) |
Total Metals & Mining | | | | | | | | | | | | | | | 3,028,410 | |
Total Materials | | | | | | | | 4,197,542 | |
| Real Estate — 3.6% | | | | | | | | | | | | | | | | |
Equity Real Estate Investment Trusts (REITs) — 1.7% | | | | | | | | | | | | | | | | |
Iron Mountain Inc., Senior Notes | | | 5.250 | % | | | 3/15/28 | | | | 335,000 | | | | 350,493 | (a) |
XHR LP, Senior Secured Notes | | | 4.875 | % | | | 6/1/29 | | | | 220,000 | | | | 226,235 | (a) |
Total Equity Real Estate Investment Trusts (REITs) | | | | | | | | | | | | | | | 576,728 | |
Real Estate Management & Development — 1.9% | | | | | | | | | | | | | | | | |
Realogy Group LLC/Realogy Co-Issuer Corp.,
Secured Notes | | | 7.625 | % | | | 6/15/25 | | | | 575,000 | | | | 614,790 | (a) |
Total Real Estate | | | | | | | | 1,191,518 | |
| Utilities — 0.6% | | | | | | | | | | | | | | | | |
Electric Utilities — 0.6% | | | | | | | | | | | | | | | | |
NRG Energy Inc., Senior Notes | | | 6.625 | % | | | 1/15/27 | | | | 187,000 | | | | 193,956 | |
Total Corporate Bonds & Notes (Cost — $28,583,918) | | | | 29,566,988 | |
See Notes to Financial Statements.
| | | | | | |
| BrandywineGLOBAL — Global High Yield Fund 2021 Annual Report | | | | | 19 | |
Schedule of investments (cont’d)
September 30, 2021
BrandywineGLOBAL — Global High Yield Fund
(Percentages shown based on Fund net assets)
| | | | | | | | | | | | | | | | |
| Security | | Rate | | | Maturity
Date | | | Face
Amount† | | | Value | |
| Convertible Bonds & Notes — 4.5% | | | | | | | | | | | | | | | | |
| Communication Services — 2.4% | | | | | | | | | | | | | | | | |
Media — 2.4% | | | | | | | | | | | | | | | | |
DISH Network Corp., Senior Notes | | | 3.375 | % | | | 8/15/26 | | | | 760,000 | | | $ | 791,920 | |
| Health Care — 1.1% | | | | | | | | | | | | | | | | |
Health Care Equipment & Supplies — 1.1% | | | | | | | | | | | | | | | | |
Haemonetics Corp., Senior Notes | | | 0.000 | % | | | 3/1/26 | | | | 400,000 | | | | 346,938 | (a) |
| Information Technology — 1.0% | | | | | | | | | | | | | | | | |
Electronic Equipment, Instruments & Components — 1.0% | | | | | | | | | | | | | | | | |
Vishay Intertechnology Inc., Senior Notes | | | 2.250 | % | | | 6/15/25 | | | | 330,000 | | | | 340,660 | |
Total Convertible Bonds & Notes (Cost — $1,346,998) | | | | | | | | 1,479,518 | |
| Sovereign Bonds — 0.6% | | | | | | | | | | | | | | | | |
Ukraine — 0.6% | | | | | | | | | | | | | | | | |
Ukraine Government International Bond, Senior Notes (Cost — $200,000) | | | 7.253 | % | | | 3/15/33 | | | | 200,000 | | | | 203,155 | (a) |
Total Investments before Short-Term Investments (Cost — $30,130,916) | | | | 31,249,661 | |
| | | | | | | | | Shares | | | | |
| Short-Term Investments — 3.5% | | | | | | | | | | | | | | | | |
Western Asset Premier Institutional U.S. Treasury Reserves, Premium Shares (Cost — $1,178,626) | | | 0.010 | % | | | | | | | 1,178,626 | | | | 1,178,626 | (f) |
Total Investments — 98.0% (Cost — $31,309,542) | | | | | | | | | | | | | | | 32,428,287 | |
Other Assets in Excess of Liabilities — 2.0% | | | | | | | | | | | | | | | 646,790 | |
Total Net Assets — 100.0% | | | | | | | | | | | | | | $ | 33,075,077 | |
| † | Face amount denominated in U.S. dollars, unless otherwise noted. |
| (a) | Security is exempt from registration under Rule 144A of the Securities Act of 1933. This security may be resold in transactions that are exempt from registration, normally to qualified institutional buyers. This security has been deemed liquid pursuant to guidelines approved by the Board of Trustees. |
| (b) | Securities traded on a when-issued or delayed delivery basis. |
| (c) | Security is exempt from registration under Regulation S of the Securities Act of 1933. Regulation S applies to securities offerings that are made outside of the United States and do not involve direct selling efforts in the United States. This security has been deemed liquid pursuant to guidelines approved by the Board of Trustees. |
| (d) | Security has no maturity date. The date shown represents the next call date. |
| (e) | Variable rate security. Interest rate disclosed is as of the most recent information available. Certain variable rate securities are not based on a published reference rate and spread but are determined by the issuer or agent and are based on current market conditions. These securities do not indicate a reference rate and spread in their description above. |
| (f) | In this instance, as defined in the Investment Company Act of 1940, an “Affiliated Company” represents Fund ownership of at least 5% of the outstanding voting securities of an issuer, or a company which is under common ownership or control with the Fund. At September 30, 2021, the total market value of investments in Affiliated Companies was $1,178,626 and the cost was $1,178,626 (Note 8). |
See Notes to Financial Statements.
| | | | |
20 | | | | BrandywineGLOBAL — Global High Yield Fund 2021 Annual Report |
BrandywineGLOBAL — Global High Yield Fund
| | |
Abbreviation(s) used in this schedule: |
| |
| EUR | | — Euro |
At September 30, 2021, the Fund had the following open forward foreign currency contracts:
| | | | | | | | | | | | | | | | | | | | |
Currency
Purchased | | | Currency
Sold | | | Counterparty | | Settlement
Date | | | Unrealized
Depreciation | |
| EUR | | | 1,160,000 | | | USD | | | 1,371,329 | | | Citibank N.A. | | | 10/26/21 | | | $ | (26,984 | ) |
| GBP | | | 470,000 | | | USD | | | 650,087 | | | Citibank N.A. | | | 11/23/21 | | | | (16,792 | ) |
| Total | | | | | | | | | | | | | | | | | | $ | (43,776 | ) |
| | |
Abbreviation(s) used in this table: |
| |
| EUR | | — Euro |
| |
| GBP | | — British Pound |
| |
| USD | | — United States Dollar |
At September 30, 2021, the Fund had the following open swap contracts:
| | | | | | | | | | | | | | | | | | | | | | | | | | |
| OTC CREDIT DEFAULT SWAPS ON CORPORATE ISSUES — SELL PROTECTION1 | |
Swap Counterparty
(Reference Entity) | | Notional
Amount2* | | | Termination
Date | | | Implied
Credit
Spread at
September 30,
20213 | | | Periodic
Payments
Received by
the Fund† | | Market
Value | | | Upfront
Premiums
Paid
(Received) | | | Unrealized
Appreciation
(Depreciation) | |
| Barclays Bank PLC (T-Mobile USA Inc., 4.000%, due 4/15/22) | | $ | 230,000 | | | | 6/20/22 | | | | 0.417 | % | | 5.000% quarterly | | $ | 7,679 | | | $ | 6,951 | | | $ | 728 | |
| Goldman Sachs Group Inc. (Goodyear Tire & Rubber Co., 5.000%, due 5/31/26) | | | 670,000 | | | | 6/20/22 | | | | 0.449 | % | | 5.000% quarterly | | | 22,210 | | | | 19,022 | | | | 3,188 | |
| JPMorgan Chase & Co. (Altice France SA, 5.875%, due 2/1/27) | | | 515,000 | EUR | | | 12/20/25 | | | | 3.041 | % | | 5.000% quarterly | | | 47,105 | | | | 47,945 | | | | (840) | |
See Notes to Financial Statements.
| | | | | | |
| BrandywineGLOBAL — Global High Yield Fund 2021 Annual Report | | | | | 21 | |
Schedule of investments (cont’d)
September 30, 2021
BrandywineGLOBAL — Global High Yield Fund
| | | | | | | | | | | | | | | | | | | | | | | | |
| OTC CREDIT DEFAULT SWAPS ON CORPORATE ISSUES — SELL PROTECTION1 (cont’d) | |
Swap Counterparty
(Reference Entity) | | Notional
Amount2* | | Termination
Date | | | Implied
Credit
Spread at September 30,
20213 | | | Periodic Payments
Received by
the Fund† | | Market
Value | | | Upfront
Premiums
Paid (Received) | | | Unrealized
Appreciation (Depreciation) | |
| JPMorgan Chase & Co. (Altice Luxembourg SA, 7.250%, due 5/15/22) | | $530,000EUR | | | 12/20/25 | | | | 4.059 | % | | 5.000% quarterly | | $ | 22,665 | | | $ | 34,979 | | | $ | (12,314) | |
| Morgan Stanley & Co. Inc. (Dell Inc., 7.100%, due 4/15/28) | | 325,000 | | | 6/20/22 | | | | 0.133 | % | | 1.000% quarterly | | | 2,056 | | | | (3,637) | | | | 5,693 | |
| Morgan Stanley & Co. Inc. (Dell Inc., 7.100%, due 4/15/28) | | 510,000 | | | 6/20/22 | | | | 0.133 | % | | 1.000% quarterly | | | 3,226 | | | | (5,712) | | | | 8,938 | |
| Morgan Stanley & Co. Inc. (Lumen Technologies Inc., 7.500%, due 4/1/24) | | 380,000 | | | 6/20/23 | | | | 1.214 | % | | 1.000% quarterly | | | (1,397) | | | | (8,685) | | | | 7,288 | |
| Morgan Stanley & Co. Inc. (Lumen Technologies Inc., 7.500%, due 4/1/24) | | 415,000 | | | 6/20/25 | | | | 2.115 | % | | 1.000% quarterly | | | (16,528) | | | | (32,394) | | | | 15,866 | |
| Total | | | | | | | | | | | | | | $ | 87,016 | | | $ | 58,469 | | | $ | 28,547 | |
| | | | | | | | | | | | | | | | | | | | | | |
| CENTRALLY CLEARED CREDIT DEFAULT SWAPS ON CREDIT INDICES — SELL PROTECTION1 | |
| Reference Entity | | Notional
Amount2* | | | Termination
Date | | | Periodic
Payments
Received by
the Fund† | | Market
Value4 | | | Upfront
Premiums
Paid
(Received) | | | Unrealized
Appreciation | |
| Markit iTraxx Crossover Index | | | 3,320,111 | EUR | | | 12/20/25 | | | 5.000% quarterly | | $ | 463,613 | | | $ | 379,734 | | | $ | 83,879 | |
See Notes to Financial Statements.
| | | | |
22 | | | | BrandywineGLOBAL — Global High Yield Fund 2021 Annual Report |
BrandywineGLOBAL — Global High Yield Fund
| 1 | If the Fund is a seller of protection and a credit event occurs, as defined under the terms of that particular swap agreement, the Fund will either (i) pay to the buyer of protection an amount equal to the notional amount of the swap and take delivery of the referenced obligation or underlying securities comprising the referenced index or (ii) pay a net settlement amount in the form of cash or securities equal to the notional amount of the swap less the recovery value of the referenced obligation or underlying securities comprising the referenced index. |
| 2 | The maximum potential amount the Fund could be required to pay as a seller of credit protection or receive as a buyer of credit protection if a credit event occurs as defined under the terms of that particular swap agreement. |
| 3 | Implied credit spreads, utilized in determining the market value of credit default swap agreements on corporate or sovereign issues as of period end, serve as an indicator of the current status of the payment/performance risk and represent the likelihood or risk of default for the credit derivative. The implied credit spread of a particular referenced entity reflects the cost of buying/selling protection and may include upfront payments required to be made to enter into the agreement. Wider credit spreads represent a deterioration of the referenced entity’s credit soundness and a greater likelihood or risk of default or other credit event occurring as defined under the terms of the agreement. A credit spread identified as “Defaulted” indicates a credit event has occurred for the referenced entity or obligation. |
| 4 | The quoted market prices and resulting values for credit default swap agreements on asset-backed securities and credit indices serve as an indicator of the current status of the payment/performance risk and represent the likelihood of an expected loss (or profit) for the credit derivative had the notional amount of the swap agreement been closed/sold as of the period end. Decreasing market values (sell protection) or increasing market values (buy protection) when compared to the notional amount of the swap, represent a deterioration of the referenced entity’s credit soundness and a greater likelihood or risk of default or other credit event occurring as defined under the terms of the agreement. |
| † | Percentage shown is an annual percentage rate. |
| * | Notional amount denominated in U.S. dollars, unless otherwise noted. |
| | |
Abbreviation(s) used in this table: |
| |
| EUR | | — Euro |
See Notes to Financial Statements.
| | | | | | |
| BrandywineGLOBAL — Global High Yield Fund 2021 Annual Report | | | | | 23 | |
Schedule of investments (cont’d)
September 30, 2021
BrandywineGLOBAL — Global High Yield Fund
| | | | |
| Summary of Investments by Country* (unaudited) | | | |
| United States | | | 63.8 | % |
| Mexico | | | 5.5 | |
| Brazil | | | 4.7 | |
| Israel | | | 4.2 | |
| Zambia | | | 3.3 | |
| Colombia | | | 3.0 | |
| United Kingdom | | | 3.0 | |
| Canada | | | 2.7 | |
| Chile | | | 2.0 | |
| Luxembourg | | | 1.3 | |
| France | | | 1.2 | |
| Uruguay | | | 1.1 | |
| Ukraine | | | 0.6 | |
| Short-Term Investments | | | 3.6 | |
| | | | 100.0 | % |
| * | As a percentage of total investments. Please note that the Fund holdings are as of September 30, 2021 and are subject to change. |
See Notes to Financial Statements.
| | | | |
24 | | | | BrandywineGLOBAL — Global High Yield Fund 2021 Annual Report |
Statement of assets and liabilities
September 30, 2021
| | | | |
| |
| Assets: | | | | |
Investments in unaffiliated securities, at value (Cost — $30,130,916) | | $ | 31,249,661 | |
Investments in affiliated securities, at value (Cost — $1,178,626) | | | 1,178,626 | |
Foreign currency, at value (Cost — $15,511) | | | 15,301 | |
Interest receivable | | | 471,516 | |
Deposits with brokers for centrally cleared swap contracts | | | 328,237 | |
OTC swaps, at value (net premiums paid — $99,548) | | | 104,941 | |
Receivable from broker — net variation margin on centrally cleared swap contracts | | | 34,228 | |
Receivable for Fund shares sold | | | 20,869 | |
Receivable for open OTC swap contracts | | | 3,722 | |
Prepaid expenses | | | 32,501 | |
Total Assets | | | 33,439,602 | |
| |
| Liabilities: | | | | |
Payable for securities purchased | | | 145,000 | |
Deposits from brokers for OTC derivatives | | | 80,000 | |
Unrealized depreciation on forward foreign currency contracts | | | 43,776 | |
OTC swaps, at value (premiums received — $41,079) | | | 17,925 | |
Payable for Fund shares repurchased | | | 3,347 | |
Investment management fee payable | | | 2,421 | |
Distributions payable | | | 774 | |
Trustees’ fees payable | | | 311 | |
Service and/or distribution fees payable | | | 164 | |
Accrued expenses | | | 70,807 | |
Total Liabilities | | | 364,525 | |
| Total Net Assets | | $ | 33,075,077 | |
| |
| Net Assets: | | | | |
Par value (Note 7) | | $ | 37 | |
Paid-in capital in excess of par value | | | 32,406,326 | |
Total distributable earnings (loss) | | | 668,714 | |
| Total Net Assets | | $ | 33,075,077 | |
See Notes to Financial Statements.
| | | | | | |
| BrandywineGLOBAL — Global High Yield Fund 2021 Annual Report | | | | | 25 | |
Statement of assets and liabilities (cont’d)
September 30, 2021
| | | | |
| |
| Net Assets: | | | | |
Class A | | | $347,151 | |
Class C | | | $74,034 | |
Class FI | | | $141,970 | |
Class I | | | $1,873,021 | |
Class IS | | | $30,638,901 | |
| |
| Shares Outstanding: | | | | |
Class A | | | 38,540 | |
Class C | | | 8,213 | |
Class FI | | | 15,726 | |
Class I | | | 207,632 | |
Class IS | | | 3,397,738 | |
| |
| Net Asset Value: | | | | |
Class A (and redemption price) | | | $9.01 | |
Class C* | | | $9.01 | |
Class FI (and redemption price) | | | $9.03 | |
Class I (and redemption price) | | | $9.02 | |
Class IS (and redemption price) | | | $9.02 | |
| Maximum Public Offering Price Per Share: | | | | |
Class A (based on maximum initial sales charge of 4.25%) | | | $9.41 | |
| * | Redemption price per share is NAV of Class C shares reduced by a 1.00% CDSC if shares are redeemed within one year from purchase payment (Note 2). |
See Notes to Financial Statements.
| | | | |
26 | | | | BrandywineGLOBAL — Global High Yield Fund 2021 Annual Report |
Statement of operations
For the Year Ended September 30, 2021
| | | | |
| |
| Investment Income: | | | | |
Interest from unaffiliated investments | | $ | 2,160,192 | |
Interest from affiliated investments | | | 46 | |
Less: Foreign taxes withheld | | | (14,302) | |
Total Investment Income | | | 2,145,936 | |
| |
| Expenses: | | | | |
Investment management fee (Note 2) | | | 251,071 | |
Registration fees | | | 79,307 | |
Fund accounting fees | | | 71,289 | |
Audit and tax fees | | | 47,218 | |
Legal fees | | | 21,674 | |
Transfer agent fees (Note 5) | | | 5,877 | |
Shareholder reports | | | 5,248 | |
Trustees’ fees | | | 5,218 | |
Custody fees | | | 2,545 | |
Service and/or distribution fees (Notes 2 and 5) | | | 2,437 | |
Commitment fees (Note 9) | | | 1,577 | |
Excise tax (Note 1) | | | 1,211 | |
Insurance | | | 1,065 | |
Interest expense | | | 92 | |
Miscellaneous expenses | | | 8,185 | |
Total Expenses | | | 504,014 | |
Less: Fee waivers and/or expense reimbursements (Notes 2 and 5) | | | (209,845) | |
Net Expenses | | | 294,169 | |
| Net Investment Income | | | 1,851,767 | |
| |
| Realized and Unrealized Gain (Loss) on Investments, Futures Contracts, Swap Contracts, Forward Foreign Currency Contracts and Foreign Currency Transactions (Notes 1, 3 and 4): | | | | |
Net Realized Gain (Loss) From: | | | | |
Investment transactions in unaffiliated securities | | | 1,539,086 | † |
Futures contracts | | | 164,432 | |
Swap contracts | | | 250,100 | |
Forward foreign currency contracts | | | (225,891) | |
Foreign currency transactions | | | (5,414) | |
Net Realized Gain | | | 1,722,313 | |
Change in Net Unrealized Appreciation (Depreciation) From: | | | | |
Investments in unaffiliated securities | | | 334,583 | |
Swap contracts | | | 89,220 | |
Forward foreign currency contracts | | | 101,683 | |
Foreign currencies | | | (691) | |
Change in Net Unrealized Appreciation (Depreciation) | | | 524,795 | |
| Net Gain on Investments, Futures Contracts, Swap Contracts, Forward Foreign Currency Contracts and Foreign Currency Transactions | | | 2,247,108 | |
| Increase in Net Assets From Operations | | $ | 4,098,875 | |
| † | Net of foreign capital gains tax of $99. |
See Notes to Financial Statements.
| | | | | | |
| BrandywineGLOBAL — Global High Yield Fund 2021 Annual Report | | | | | 27 | |
Statements of changes in net assets
| | | | | | | | |
| For the Years Ended September 30, | | 2021 | | | 2020 | |
| | |
| Operations: | | | | | | | | |
Net investment income | | $ | 1,851,767 | | | $ | 1,778,800 | |
Net realized gain (loss) | | | 1,722,313 | | | | (13,637) | |
Change in net unrealized appreciation (depreciation) | | | 524,795 | | | | (126,393) | |
Increase in Net Assets From Operations | | | 4,098,875 | | | | 1,638,770 | |
| | |
| Distributions to Shareholders From (Notes 1 and 6): | | | | | | | | |
Total distributable earnings | | | (2,151,629) | | | | (1,988,950) | |
Decrease in Net Assets From Distributions to Shareholders | | | (2,151,629) | | | | (1,988,950) | |
| | |
| Fund Share Transactions (Note 7): | | | | | | | | |
Net proceeds from sale of shares | | | 6,315,468 | | | | 9,028,972 | |
Reinvestment of distributions | | | 2,077,036 | | | | 1,927,091 | |
Cost of shares repurchased | | | (17,844,099) | | | | (4,997,354) | |
Increase (Decrease) in Net Assets From Fund Share Transactions | | | (9,451,595) | | | | 5,958,709 | |
Increase (Decrease) in Net Assets | | | (7,504,349) | | | | 5,608,529 | |
| | |
| Net Assets: | | | | | | | | |
Beginning of year | | | 40,579,426 | | | | 34,970,897 | |
End of year | | $ | 33,075,077 | | | $ | 40,579,426 | |
See Notes to Financial Statements.
| | | | |
28 | | | | BrandywineGLOBAL — Global High Yield Fund 2021 Annual Report |
Financial highlights
| | | | | | | | | | | | | | | | | | | | | | | | |
For a share of each class of beneficial interest outstanding throughout each year ended September 30,
unless otherwise noted: | |
| Class A Shares1 | | 2021 | | | 2020 | | | 2019 | | | 2018 | | | 20172 | | | 20163 | |
| | | | | | |
| Net asset value, beginning of year | | $ | 8.60 | | | $ | 8.74 | | | $ | 8.82 | | | $ | 9.23 | | | $ | 8.80 | | | $ | 8.46 | |
| | | | | | |
| Income (loss) from operations: | | | | | | | | | | | | | | | | | | | | | | | | |
Net investment income | | | 0.38 | | | | 0.40 | | | | 0.35 | | | | 0.37 | | | | 0.40 | | | | 0.36 | |
Net realized and unrealized gain (loss) | | | 0.49 | | | | (0.09) | | | | (0.01) | | | | (0.40) | | | | 0.42 | | | | 0.33 | |
Total income (loss) from operations | | | 0.87 | | | | 0.31 | | | | 0.34 | | | | (0.03) | | | | 0.82 | | | | 0.69 | |
| | | | | | |
| Less distributions from: | | | | | | | | | | | | | | | | | | | | | | | | |
Net investment income | | | (0.46) | | | | (0.45) | | | | (0.42) | | | | (0.38) | | | | (0.32) | | | | (0.17) | |
Return of capital | | | — | | | | — | | | | — | | | | — | | | | (0.07) | | | | (0.18) | |
Total distributions | | | (0.46) | | | | (0.45) | | | | (0.42) | | | | (0.38) | | | | (0.39) | | | | (0.35) | |
| | | | | | |
| Net asset value, end of year | | $ | 9.01 | | | $ | 8.60 | | | $ | 8.74 | | | $ | 8.82 | | | $ | 9.23 | | | $ | 8.80 | |
Total return4 | | | 10.23 | % | | | 3.71 | % | | | 4.06 | % | | | (0.38) | % | | | 9.51 | % | | | 8.35 | % |
| | | | | | |
| Net assets, end of year (000s) | | $ | 347 | | | $ | 101 | | | $ | 121 | | | $ | 122 | | | $ | 238 | | | $ | 460 | |
| | | | | | |
| Ratios to average net assets: | | | | | | | | | | | | | | | | | | | | | | | | |
Gross expenses | | | 1.75 | % | | | 2.14 | %5 | | | 1.91 | %5 | | | 1.87 | %5 | | | 1.76 | %6 | | | 2.32 | %5 |
Net expenses7,8 | | | 1.15 | | | | 1.15 | 5 | | | 1.15 | 5 | | | 1.15 | 5 | | | 1.15 | 6 | | | 1.15 | 5 |
Net investment income | | | 4.27 | | | | 4.66 | | | | 4.05 | | | | 4.11 | | | | 4.90 | 6 | | | 4.23 | |
| | | | | | |
| Portfolio turnover rate | | | 76 | % | | | 94 | % | | | 104 | % | | | 93 | % | | | 78 | % | | | 96 | % |
| 1 | Per share amounts have been calculated using the average shares method. |
| 2 | For the period November 1, 2016 to September 30, 2017. |
| 3 | For the year ended October 31. |
| 4 | Performance figures, exclusive of sales charges, may reflect compensating balance arrangements, fee waivers and/or expense reimbursements. In the absence of compensating balance arrangements, fee waivers and/or expense reimbursements, the total return would have been lower. Past performance is no guarantee of future results. Total returns for periods of less than one year are not annualized. |
| 5 | Reflects recapture of expenses waived/reimbursed from prior fiscal years. |
| 7 | Reflects fee waivers and/or expense reimbursements. |
| 8 | As a result of an expense limitation arrangement, the ratio of total annual fund operating expenses, other than interest, brokerage commissions, dividend expense on short sales, taxes, extraordinary expenses and acquired fund fees and expenses, to average net assets of Class A shares did not exceed 1.15%. This expense limitation arrangement cannot be terminated prior to December 31, 2022 without the Board of Trustees’ consent. In addition, the manager has agreed to waive the Fund’s management fee to an extent sufficient to offset the net management fee payable in connection with any investment in an affiliated money market fund. |
See Notes to Financial Statements.
| | | | | | |
| BrandywineGLOBAL — Global High Yield Fund 2021 Annual Report | | | | | 29 | |
Financial highlights (cont’d)
| | | | | | | | | | | | | | | | | | | | | | | | |
For a share of each class of beneficial interest outstanding throughout each year ended September 30,
unless otherwise noted: | |
| Class C Shares1 | | 2021 | | | 2020 | | | 2019 | | | 2018 | | | 20172 | | | 20163 | |
| | | | | | |
| Net asset value, beginning of year | | | $8.61 | | | | $8.75 | | | | $8.83 | | | | $9.24 | | | | $8.79 | | | | $8.46 | |
| | | | | | |
| Income (loss) from operations: | | | | | | | | | | | | | | | | | | | | | | | | |
Net investment income | | | 0.33 | | | | 0.33 | | | | 0.28 | | | | 0.29 | | | | 0.34 | | | | 0.30 | |
Net realized and unrealized gain (loss) | | | 0.46 | | | | (0.08) | | | | (0.01) | | | | (0.39) | | | | 0.45 | | | | 0.32 | |
Total income (loss) from operations | | | 0.79 | | | | 0.25 | | | | 0.27 | | | | (0.10) | | | | 0.79 | | | | 0.62 | |
| | | | | | |
| Less distributions from: | | | | | | | | | | | | | | | | | | | | | | | | |
Net investment income | | | (0.39) | | | | (0.39) | | | | (0.35) | | | | (0.31) | | | | (0.28) | | | | (0.14) | |
Return of capital | | | — | | | | — | | | | — | | | | — | | | | (0.06) | | | | (0.15) | |
Total distributions | | | (0.39) | | | | (0.39) | | | | (0.35) | | | | (0.31) | | | | (0.34) | | | | (0.29) | |
| | | | | | |
| Net asset value, end of year | | | $9.01 | | | | $8.61 | | | | $8.75 | | | | $8.83 | | | | $9.24 | | | | $8.79 | |
Total return4 | | | 9.29 | % | | | 2.93 | % | | | 3.28 | % | | | (1.13) | % | | | 9.11 | % | | | 7.47 | % |
| | | | | | |
| Net assets, end of year (000s) | | | $74 | | | | $93 | | | | $179 | | | | $173 | | | | $349 | | | | $395 | |
| | | | | | |
| Ratios to average net assets: | | | | | | | | | | | | | | | | | | | | | | | | |
Gross expenses | | | 2.46 | % | | | 2.58 | %5 | | | 2.54 | %5 | | | 2.48 | % | | | 2.27 | %6 | | | 2.40 | % |
Net expenses7,8 | | | 1.90 | | | | 1.90 | 5 | | | 1.90 | 5 | | | 1.90 | | | | 1.82 | 6 | | | 1.80 | |
Net investment income | | | 3.66 | | | | 3.89 | | | | 3.31 | | | | 3.15 | | | | 4.10 | 6 | | | 3.52 | |
| | | | | | |
| Portfolio turnover rate | | | 76 | % | | | 94 | % | | | 104 | % | | | 93 | % | | | 78 | % | | | 96 | % |
| 1 | Per share amounts have been calculated using the average shares method. |
| 2 | For the period November 1, 2016 to September 30, 2017. |
| 3 | For the year ended October 31. |
| 4 | Performance figures, exclusive of CDSC, may reflect compensating balance arrangements, fee waivers and/or expense reimbursements. In the absence of compensating balance arrangements, fee waivers and/or expense reimbursements, the total return would have been lower. Past performance is no guarantee of future results. Total returns for periods of less than one year are not annualized. |
| 5 | Reflects recapture of expenses waived/reimbursed from prior fiscal years. |
| 7 | Reflects fee waivers and/or expense reimbursements. |
| 8 | As a result of an expense limitation arrangement, the ratio of total annual fund operating expenses, other than interest, brokerage commissions, dividend expense on short sales, taxes, extraordinary expenses and acquired fund fees and expenses, to average net assets of Class C shares did not exceed 1.90%. This expense limitation arrangement cannot be terminated prior to December 31, 2022 without the Board of Trustees’ consent. In addition, the manager has agreed to waive the Fund’s management fee to an extent sufficient to offset the net management fee payable in connection with any investment in an affiliated money market fund. |
See Notes to Financial Statements.
| | | | |
30 | | | | BrandywineGLOBAL — Global High Yield Fund 2021 Annual Report |
| | | | | | | | | | | | | | | | | | | | | | | | |
For a share of each class of beneficial interest outstanding throughout each year ended September 30,
unless otherwise noted: | |
| Class FI Shares1 | | 2021 | | | 2020 | | | 2019 | | | 2018 | | | 20172 | | | 20163 | |
| | | | | | |
| Net asset value, beginning of year | | | $8.62 | | | | $8.77 | | | | $8.85 | | | | $9.26 | | | | $8.81 | | | | $8.46 | |
| | | | | | |
| Income (loss) from operations: | | | | | | | | | | | | | | | | | | | | | | | | |
Net investment income | | | 0.40 | | | | 0.40 | | | | 0.35 | | | | 0.34 | | | | 0.40 | | | | 0.40 | |
Net realized and unrealized gain (loss) | | | 0.47 | | | | (0.10) | | | | (0.01) | | | | (0.38) | | | | 0.45 | | | | 0.30 | |
Total income (loss) from operations | | | 0.87 | | | | 0.30 | | | | 0.34 | | | | (0.04) | | | | 0.85 | | | | 0.70 | |
| | | | | | |
| Less distributions from: | | | | | | | | | | | | | | | | | | | | | | | | |
Net investment income | | | (0.46) | | | | (0.45) | | | | (0.42) | | | | (0.37) | | | | (0.33) | | | | (0.17) | |
Return of capital | | | — | | | | — | | | | — | | | | — | | | | (0.07) | | | | (0.18) | |
Total distributions | | | (0.46) | | | | (0.45) | | | | (0.42) | | | | (0.37) | | | | (0.40) | | | | (0.35) | |
| | | | | | |
| Net asset value, end of year | | | $9.03 | | | | $8.62 | | | | $8.77 | | | | $8.85 | | | | $9.26 | | | | $8.81 | |
Total return4 | | | 10.22 | % | | | 3.59 | % | | | 4.09 | % | | | (0.40) | % | | | 9.82 | % | | | 8.51 | % |
| | | | | | |
| Net assets, end of year (000s) | | | $142 | | | | $202 | | | | $104 | | | | $104 | | | | $99 | | | | $100 | |
| | | | | | |
| Ratios to average net assets: | | | | | | | | | | | | | | | | | | | | | | | | |
Gross expenses | | | 1.75 | % | | | 1.89 | %5 | | | 1.83 | %5 | | | 1.82 | % | | | 1.69 | %6 | | | 1.62 | % |
Net expenses7,8 | | | 1.15 | | | | 1.15 | 5 | | | 1.15 | 5 | | | 1.15 | | | | 1.14 | 6 | | | 1.02 | |
Net investment income | | | 4.40 | | | | 4.69 | | | | 4.06 | | | | 3.75 | | | | 4.79 | 6 | | | 4.41 | |
| | | | | | |
| Portfolio turnover rate | | | 76 | % | | | 94 | % | | | 104 | % | | | 93 | % | | | 78 | % | | | 96 | % |
| 1 | Per share amounts have been calculated using the average shares method. |
| 2 | For the period November 1, 2016 to September 30, 2017. |
| 3 | For the year ended October 31. |
| 4 | Performance figures may reflect compensating balance arrangements, fee waivers and/or expense reimbursements. In the absence of compensating balance arrangements, fee waivers and/or expense reimbursements, the total return would have been lower. Past performance is no guarantee of future results. Total returns for periods of less than one year are not annualized. |
| 5 | Reflects recapture of expenses waived/reimbursed from prior fiscal years. |
| 7 | Reflects fee waivers and/or expense reimbursements. |
| 8 | As a result of an expense limitation arrangement, the ratio of total annual fund operating expenses, other than interest, brokerage commissions, dividend expense on short sales, taxes, extraordinary expenses and acquired fund fees and expenses, to average net assets of Class FI shares did not exceed 1.15%. This expense limitation arrangement cannot be terminated prior to December 31, 2022 without the Board of Trustees’ consent. In addition, the manager has agreed to waive the Fund’s management fee to an extent sufficient to offset the net management fee payable in connection with any investment in an affiliated money market fund. |
See Notes to Financial Statements.
| | | | | | |
| BrandywineGLOBAL — Global High Yield Fund 2021 Annual Report | | | | | 31 | |
Financial highlights (cont’d)
| | | | | | | | | | | | | | | | | | | | | | | | |
For a share of each class of beneficial interest outstanding throughout each year ended September 30,
unless otherwise noted: | |
| Class I Shares1 | | 2021 | | | 2020 | | | 2019 | | | 2018 | | | 20172 | | | 20163 | |
| | | | | | |
| Net asset value, beginning of year | | | $8.62 | | | | $8.76 | | | | $8.84 | | | | $9.24 | | | | $8.80 | | | | $8.46 | |
| | | | | | |
| Income (loss) from operations: | | | | | | | | | | | | | | | | | | | | | | | | |
Net investment income | | | 0.43 | | | | 0.42 | | | | 0.37 | | | | 0.40 | | | | 0.41 | | | | 0.38 | |
Net realized and unrealized gain (loss) | | | 0.46 | | | | (0.08) | | | | (0.01) | | | | (0.40) | | | | 0.44 | | | | 0.34 | |
Total income from operations | | | 0.89 | | | | 0.34 | | | | 0.36 | | | | 0.00 | 4 | | | 0.85 | | | | 0.72 | |
| | | | | | |
| Less distributions from: | | | | | | | | | | | | | | | | | | | | | | | | |
Net investment income | | | (0.49) | | | | (0.48) | | | | (0.44) | | | | (0.40) | | | | (0.34) | | | | (0.19) | |
Return of capital | | | — | | | | — | | | | — | | | | — | | | | (0.07) | | | | (0.19) | |
Total distributions | | | (0.49) | | | | (0.48) | | | | (0.44) | | | | (0.40) | | | | (0.41) | | | | (0.38) | |
| | | | | | |
| Net asset value, end of year | | | $9.02 | | | | $8.62 | | | | $8.76 | | | | $8.84 | | | | $9.24 | | | | $8.80 | |
Total return5 | | | 10.43 | % | | | 4.01 | % | | | 4.36 | % | | | 0.04 | % | | | 9.94 | % | | | 8.74 | % |
| | | | | | |
| Net assets, end of year (000s) | | | $1,873 | | | | $2,756 | | | | $2,331 | | | | $2,445 | | | | $3,737 | | | | $2,804 | |
| | | | | | |
| Ratios to average net assets: | | | | | | | | | | | | | | | | | | | | | | | | |
Gross expenses | | | 1.39 | % | | | 1.50 | %6 | | | 1.50 | %6 | | | 1.42 | %6 | | | 1.34 | %7 | | | 1.41 | % |
Net expenses8,9 | | | 0.85 | | | | 0.85 | 6 | | | 0.85 | 6 | | | 0.85 | 6 | | | 0.84 | 7 | | | 0.78 | |
Net investment income | | | 4.73 | | | | 4.96 | | | | 4.35 | | | | 4.37 | | | | 5.01 | 7 | | | 4.49 | |
| | | | | | |
| Portfolio turnover rate | | | 76 | % | | | 94 | % | | | 104 | % | | | 93 | % | | | 78 | % | | | 96 | % |
| 1 | Per share amounts have been calculated using the average shares method. |
| 2 | For the period November 1, 2016 to September 30, 2017. |
| 3 | For the year ended October 31. |
| 4 | Amount represents less than $0.005 per share. |
| 5 | Performance figures may reflect compensating balance arrangements, fee waivers and/or expense reimbursements. In the absence of compensating balance arrangements, fee waivers and/or expense reimbursements, the total return would have been lower. Past performance is no guarantee of future results. Total returns for periods of less than one year are not annualized. |
| 6 | Reflects recapture of expenses waived/reimbursed from prior fiscal years. |
| 8 | Reflects fee waivers and/or expense reimbursements. |
| 9 | As a result of an expense limitation arrangement, the ratio of total annual fund operating expenses, other than interest, brokerage commissions, dividend expense on short sales, taxes, extraordinary expenses and acquired fund fees and expenses, to average net assets of Class I shares did not exceed 0.85%. This expense limitation arrangement cannot be terminated prior to December 31, 2022 without the Board of Trustees’ consent. In addition, the manager has agreed to waive the Fund’s management fee to an extent sufficient to offset the net management fee payable in connection with any investment in an affiliated money market fund. |
See Notes to Financial Statements.
| | | | |
32 | | | | BrandywineGLOBAL — Global High Yield Fund 2021 Annual Report |
| | | | | | | | | | | | | | | | | | | | | | | | |
For a share of each class of beneficial interest outstanding throughout each year ended September 30,
unless otherwise noted: | |
| Class IS Shares1 | | 2021 | | | 2020 | | | 2019 | | | 2018 | | | 20172 | | | 20163 | |
| | | | | | |
| Net asset value, beginning of year | | | $8.61 | | | | $8.75 | | | | $8.83 | | | | $9.24 | | | | $8.79 | | | | $8.46 | |
| | | | | | |
| Income (loss) from operations: | | | | | | | | | | | | | | | | | | | | | | | | |
Net investment income | | | 0.43 | | | | 0.43 | | | | 0.38 | | | | 0.41 | | | | 0.42 | | | | 0.39 | |
Net realized and unrealized gain (loss) | | | 0.47 | | | | (0.09) | | | | (0.00) | 4 | | | (0.41) | | | | 0.45 | | | | 0.32 | |
Total income from operations | | | 0.90 | | | | 0.34 | | | | 0.38 | | | | 0.00 | 4 | | | 0.87 | | | | 0.71 | |
| | | | | | |
| Less distributions from: | | | | | | | | | | | | | | | | | | | | | | | | |
Net investment income | | | (0.49) | | | | (0.48) | | | | (0.46) | | | | (0.41) | | | | (0.35) | | | | (0.19) | |
Return of capital | | | — | | | | — | | | | — | | | | — | | | | (0.07) | | | | (0.19) | |
Total distributions | | | (0.49) | | | | (0.48) | | | | (0.46) | | | | (0.41) | | | | (0.42) | | | | (0.38) | |
| | | | | | |
| Net asset value, end of year | | | $9.02 | | | | $8.61 | | | | $8.75 | | | | $8.83 | | | | $9.24 | | | | $8.79 | |
Total return5 | | | 10.67 | % | | | 4.11 | % | | | 4.50 | % | | | (0.01) | % | | | 10.16 | % | | | 8.66 | % |
| | | | | | |
| Net assets, end of year (000s) | | | $30,639 | | | | $37,427 | | | | $32,235 | | | | $32,719 | | | | $36,778 | | | | $37,586 | |
| | | | | | |
| Ratios to average net assets: | | | | | | | | | | | | | | | | | | | | | | | | |
Gross expenses | | | 1.29 | % | | | 1.39 | %6 | | | 1.39 | %6 | | | 1.38 | %6 | | | 1.21 | %7 | | | 1.35 | % |
Net expenses8,9 | | | 0.75 | | | | 0.75 | 6 | | | 0.75 | 6 | | | 0.75 | 6 | | | 0.75 | 7 | | | 0.75 | |
Net investment income | | | 4.81 | | | | 5.06 | | | | 4.46 | | | | 4.55 | | | | 5.13 | 7 | | | 4.53 | |
| | | | | | |
| Portfolio turnover rate | | | 76 | % | | | 94 | % | | | 104 | % | | | 93 | % | | | 78 | % | | | 96 | % |
| 1 | Per share amounts have been calculated using the average shares method. |
| 2 | For the period November 1, 2016 to September 30, 2017. |
| 3 | For the year ended October 31. |
| 4 | Amount represents less than $0.005 per share. |
| 5 | Performance figures may reflect compensating balance arrangements, fee waivers and/or expense reimbursements. In the absence of compensating balance arrangements, fee waivers and/or expense reimbursements, the total return would have been lower. Past performance is no guarantee of future results. Total returns for periods of less than one year are not annualized. |
| 6 | Reflects recapture of expenses waived/reimbursed from prior fiscal years. |
| 8 | Reflects fee waivers and/or expense reimbursements. |
| 9 | As a result of an expense limitation arrangement, the ratio of total annual fund operating expenses, other than interest, brokerage commissions, dividend expense on short sales, taxes, extraordinary expenses and acquired fund fees and expenses, to average net assets of Class IS shares did not exceed 0.75%. In addition, the ratio of total annual fund operating expenses for Class IS shares did not exceed the ratio of total annual fund operating expenses for Class I shares. These expense limitation arrangements cannot be terminated prior to December 31, 2022 without the Board of Trustees’ consent. In addition, the manager has agreed to waive the Fund’s management fee to an extent sufficient to offset the net management fee payable in connection with any investment in an affiliated money market fund. |
See Notes to Financial Statements.
| | | | | | |
| BrandywineGLOBAL — Global High Yield Fund 2021 Annual Report | | | | | 33 | |
Notes to financial statements
1. Organization and significant accounting policies
BrandywineGLOBAL — Global High Yield Fund (the “Fund”) is a separate non-diversified investment series of Legg Mason Global Asset Management Trust (the “Trust”). The Trust, a Maryland statutory trust, is registered under the Investment Company Act of 1940, as amended (the “1940 Act”), as an open-end management investment company.
The following are significant accounting policies consistently followed by the Fund and are in conformity with U.S. generally accepted accounting principles (“GAAP”). Estimates and assumptions are required to be made regarding assets, liabilities and changes in net assets resulting from operations when financial statements are prepared. Changes in the economic environment, financial markets and any other parameters used in determining these estimates could cause actual results to differ. Subsequent events have been evaluated through the date the financial statements were issued.
(a) Investment valuation. The valuations for fixed income securities (which may include, but are not limited to, corporate, government, municipal, mortgage-backed, collateralized mortgage obligations and asset-backed securities) and certain derivative instruments are typically the prices supplied by independent third party pricing services, which may use market prices or broker/dealer quotations or a variety of valuation techniques and methodologies. The independent third party pricing services typically use inputs that are observable such as issuer details, interest rates, yield curves, prepayment speeds, credit risks/spreads, default rates and quoted prices for similar securities. Investments in open-end funds are valued at the closing net asset value per share of each fund on the day of valuation. Futures contracts are valued daily at the settlement price established by the board of trade or exchange on which they are traded. Equity securities for which market quotations are available are valued at the last reported sales price or official closing price on the primary market or exchange on which they trade. When the Fund holds securities or other assets that are denominated in a foreign currency, the Fund will normally use the currency exchange rates as of 4:00 p.m. (Eastern Time). If independent third party pricing services are unable to supply prices for a portfolio investment, or if the prices supplied are deemed by the manager to be unreliable, the market price may be determined by the manager using quotations from one or more broker/dealers or at the transaction price if the security has recently been purchased and no value has yet been obtained from a pricing service or pricing broker. When reliable prices are not readily available, such as when the value of a security has been significantly affected by events after the close of the exchange or market on which the security is principally traded, but before the Fund calculates its net asset value, the Fund values these securities as determined in accordance with procedures approved by the Fund’s Board of Trustees.
The Board of Trustees is responsible for the valuation process and has delegated the supervision of the daily valuation process to the Global Fund Valuation Committee (formerly known as Legg Mason North Atlantic Fund Valuation Committee prior to March 1, 2021) (the “Valuation Committee”). The Valuation Committee, pursuant to the policies adopted by the Board of Trustees, is responsible for making fair value determinations, evaluating the effectiveness of the Fund’s pricing policies, and reporting to the Board of Trustees. When determining the reliability of third party pricing information for investments owned by the
| | | | |
34 | | | | BrandywineGLOBAL — Global High Yield Fund 2021 Annual Report |
Fund, the Valuation Committee, among other things, conducts due diligence reviews of pricing vendors, monitors the daily change in prices and reviews transactions among market participants.
The Valuation Committee will consider pricing methodologies it deems relevant and appropriate when making fair value determinations. Examples of possible methodologies include, but are not limited to, multiple of earnings; discount from market of a similar freely traded security; discounted cash-flow analysis; book value or a multiple thereof; risk premium/yield analysis; yield to maturity; and/or fundamental investment analysis. The Valuation Committee will also consider factors it deems relevant and appropriate in light of the facts and circumstances. Examples of possible factors include, but are not limited to, the type of security; the issuer’s financial statements; the purchase price of the security; the discount from market value of unrestricted securities of the same class at the time of purchase; analysts’ research and observations from financial institutions; information regarding any transactions or offers with respect to the security; the existence of merger proposals or tender offers affecting the security; the price and extent of public trading in similar securities of the issuer or comparable companies; and the existence of a shelf registration for restricted securities.
For each portfolio security that has been fair valued pursuant to the policies adopted by the Board of Trustees, the fair value price is compared against the last available and next available market quotations. The Valuation Committee reviews the results of such back testing monthly and fair valuation occurrences are reported to the Board of Trustees quarterly.
The Fund uses valuation techniques to measure fair value that are consistent with the market approach and/or income approach, depending on the type of security and the particular circumstance. The market approach uses prices and other relevant information generated by market transactions involving identical or comparable securities. The income approach uses valuation techniques to discount estimated future cash flows to present value.
GAAP establishes a disclosure hierarchy that categorizes the inputs to valuation techniques used to value assets and liabilities at measurement date. These inputs are summarized in the three broad levels listed below:
| • | | Level 1 — quoted prices in active markets for identical investments |
| • | | Level 2 — other significant observable inputs (including quoted prices for similar investments, interest rates, prepayment speeds, credit risk, etc.) |
| • | | Level 3 — significant unobservable inputs (including the Fund’s own assumptions in determining the fair value of investments) |
The inputs or methodologies used to value securities are not necessarily an indication of the risk associated with investing in those securities.
| | | | | | |
| BrandywineGLOBAL — Global High Yield Fund 2021 Annual Report | | | | | 35 | |
Notes to financial statements (cont’d)
The following is a summary of the inputs used in valuing the Fund’s assets and liabilities carried at fair value:
| | | | | | | | | | | | | | | | |
| ASSETS | |
| Description | | Quoted Prices
(Level 1) | | | Other Significant
Observable Inputs
(Level 2) | | | Significant
Unobservable
Inputs
(Level 3) | | | Total | |
| Long-Term Investments†: | | | | | | | | | | | | | | | | |
Corporate Bonds & Notes | | | — | | | $ | 29,566,988 | | | | — | | | $ | 29,566,988 | |
Convertible Bonds & Notes | | | — | | | | 1,479,518 | | | | — | | | | 1,479,518 | |
Sovereign Bonds | | | — | | | | 203,155 | | | | — | | | | 203,155 | |
| Total Long-Term Investments | | | — | | | | 31,249,661 | | | | — | | | | 31,249,661 | |
| Short-Term Investments† | | $ | 1,178,626 | | | | — | | | | — | | | | 1,178,626 | |
| Total Investments | | $ | 1,178,626 | | | $ | 31,249,661 | | | | — | | | $ | 32,428,287 | |
| Other Financial Instruments: | | | | | | | | | | | | | | | | |
OTC Credit Default Swaps on Corporate Issues — Sell Protection‡ | | | — | | | $ | 104,941 | | | | — | | | $ | 104,941 | |
Centrally Cleared Credit Default Swaps on Credit Indices — Sell Protection†† | | | — | | | | 83,879 | | | | — | | | | 83,879 | |
| Total Other Financial Instruments | | | — | | | $ | 188,820 | | | | — | | | $ | 188,820 | |
| Total | | $ | 1,178,626 | | | $ | 31,438,481 | | | | — | | | $ | 32,617,107 | |
|
| LIABILITIES | |
| Description | | Quoted Prices
(Level 1) | | | Other Significant
Observable Inputs
(Level 2) | | | Significant
Unobservable
Inputs
(Level 3) | | | Total | |
| Other Financial Instruments: | | | | | | | | | | | | | | | | |
Forward Foreign Currency Contracts†† | | | — | | | $ | 43,776 | | | | — | | | $ | 43,776 | |
OTC Credit Default Swaps on Corporate Issues — Sell Protection‡ | | | — | | | | 17,925 | | | | — | | | | 17,925 | |
| Total | | | — | | | $ | 61,701 | | | | — | | | $ | 61,701 | |
| † | See Schedule of Investments for additional detailed categorizations. |
| ‡ | Value includes any premium paid or received with respect to swap contracts. |
| †† | Reflects the unrealized appreciation (depreciation) of the instruments. |
(b) Futures contracts. The Fund uses futures contracts generally to gain exposure to, or hedge against, changes in interest rates or gain exposure to, or hedge against, changes in certain asset classes. A futures contract represents a commitment for the future purchase or sale of an asset at a specified price on a specified date.
| | | | |
36 | | | | BrandywineGLOBAL — Global High Yield Fund 2021 Annual Report |
Upon entering into a futures contract, the Fund is required to deposit cash or securities with a broker in an amount equal to a certain percentage of the contract amount. This is known as the ‘‘initial margin’’ and subsequent payments (‘‘variation margin’’) are made or received by the Fund each day, depending on the daily fluctuation in the value of the contract. For certain futures, including foreign denominated futures, variation margin is not settled daily, but is recorded as a net variation margin payable or receivable. The daily changes in contract value are recorded as unrealized appreciation or depreciation in the Statement of Operations and the Fund recognizes a realized gain or loss when the contract is closed.
Futures contracts involve, to varying degrees, risk of loss in excess of the amounts reflected in the financial statements. In addition, there is the risk that the Fund may not be able to enter into a closing transaction because of an illiquid secondary market.
(c) Forward foreign currency contracts. The Fund enters into a forward foreign currency contract to hedge exposure of bond positions or in an attempt to increase the Fund’s return. A forward foreign currency contract is an agreement between two parties to buy and sell a currency at a set price with delivery and settlement at a future date. The contract is marked-to-market daily and the change in value is recorded by the Fund as an unrealized gain or loss. When a forward foreign currency contract is closed, through either delivery or offset by entering into another forward foreign currency contract, the Fund recognizes a realized gain or loss equal to the difference between the value of the contract at the time it was opened and the value of the contract at the time it is closed.
Forward foreign currency contracts involve elements of market risk in excess of the amounts reflected on the Statement of Assets and Liabilities. The Fund bears the risk of an unfavorable change in the foreign exchange rate underlying the forward foreign currency contract. Risks may also arise upon entering into these contracts from the potential inability of the counterparties to meet the terms of their contracts.
(d) Swap agreements. The Fund invests in swaps for the purpose of managing its exposure to interest rate, credit or market risk, or for other purposes. The use of swaps involves risks that are different from those associated with other portfolio transactions. Swap agreements are privately negotiated in the over-the-counter market and may be entered into as a bilateral contract (“OTC Swaps”) or centrally cleared (“Centrally Cleared Swaps”). Unlike Centrally Cleared Swaps, the Fund has credit exposure to the counterparties of OTC Swaps.
In a Centrally Cleared Swap, immediately following execution of the swap, the swap agreement is submitted to a clearinghouse or central counterparty (the “CCP”) and the CCP becomes the ultimate counterparty of the swap agreement. The Fund is required to interface with the CCP through a broker, acting in an agency capacity. All payments are settled with the CCP through the broker. Upon entering into a Centrally Cleared Swap, the Fund is required to deposit initial margin with the broker in the form of cash or securities.
Swap contracts are marked-to-market daily and changes in value are recorded as unrealized appreciation (depreciation). The daily change in valuation of Centrally Cleared Swaps, if any, is recorded as a net receivable or payable for variation margin on the Statement of Assets and Liabilities. Gains or losses are realized upon termination of the swap agreement. Collateral, in the form of restricted cash or securities, may be required to be held in segregated accounts with the Fund’s custodian in compliance with the terms of the
| | | | | | |
| BrandywineGLOBAL — Global High Yield Fund 2021 Annual Report | | | | | 37 | |
Notes to financial statements (cont’d)
swap contracts. Securities posted as collateral for swap contracts are identified in the Schedule of Investments and restricted cash, if any, is identified on the Statement of Assets and Liabilities. Risks may exceed amounts recorded in the Statement of Assets and Liabilities. These risks include changes in the returns of the underlying instruments, failure of the counterparties to perform under the contracts’ terms, and the possible lack of liquidity with respect to the swap agreements.
OTC Swap payments received or made at the beginning of the measurement period are reflected as a premium or deposit, respectively, on the Statement of Assets and Liabilities. These upfront payments are amortized over the life of the swap and are recognized as realized gain or loss in the Statement of Operations. Net periodic payments received or paid by the Fund are recognized as a realized gain or loss in the Statement of Operations.
The Fund’s maximum exposure in the event of a defined credit event on a credit default swap to sell protection is the notional amount. As of September 30, 2021, the total notional value of all credit default swaps to sell protection was $2,530,000 and EUR 4,365,111. These amounts would be offset by the value of the swaps’ reference entity, upfront premiums received on the swap and any amounts received from the settlement of a credit default swap where the Fund bought protection for the same referenced security/entity.
For average notional amounts of swaps held during the year ended September 30, 2021, see Note 4.
Credit default swaps
The Fund enters into credit default swap (“CDS”) contracts for investment purposes, to manage its credit risk or to add leverage. CDS agreements involve one party making a stream of payments to another party in exchange for the right to receive a specified return in the event of a default by a third party, typically corporate or sovereign issuers, on a specified obligation, or in the event of a write-down, principal shortfall, interest shortfall or default of all or part of the referenced entities comprising a credit index. The Fund may use a CDS to provide protection against defaults of the issuers (i.e., to reduce risk where the Fund has exposure to an issuer) or to take an active long or short position with respect to the likelihood of a particular issuer’s default. As a seller of protection, the Fund generally receives an upfront payment or a stream of payments throughout the term of the swap provided that there is no credit event. If the Fund is a seller of protection and a credit event occurs, as defined under the terms of that particular swap agreement, the maximum potential amount of future payments (undiscounted) that the Fund could be required to make under a credit default swap agreement would be an amount equal to the notional amount of the agreement. These amounts of potential payments will be partially offset by any recovery of values from the respective referenced obligations. As a seller of protection, the Fund effectively adds leverage to its portfolio because, in addition to its total net assets, the Fund is subject to investment exposure on the notional amount of the swap. As a buyer of protection, the Fund generally receives an amount up to the notional value of the swap if a credit event occurs.
Implied spreads are the theoretical prices a lender receives for credit default protection. When spreads rise, market perceived credit risk rises and when spreads fall, market perceived credit risk falls. The implied credit spread of a particular referenced entity reflects
| | | | |
38 | | | | BrandywineGLOBAL — Global High Yield Fund 2021 Annual Report |
the cost of buying/selling protection and may include upfront payments required to enter into the agreement. Wider credit spreads and decreasing market values, when compared to the notional amount of the swap, represent a deterioration of the referenced entity’s credit soundness and a greater likelihood or risk of default or other credit event occurring as defined under the terms of the agreement. Credit spreads utilized in determining the period end market value of credit default swap agreements on corporate or sovereign issues are disclosed in the Schedule of Investments and serve as an indicator of the current status of the payment/performance risk and represent the likelihood or risk of default for credit derivatives. For credit default swap agreements on asset-backed securities and credit indices, the quoted market prices and resulting values, particularly in relation to the notional amount of the contract as well as the annual payment rate, serve as an indication of the current status of the payment/performance risk.
The Fund’s maximum risk of loss from counterparty risk, as the protection buyer, is the fair value of the contract (this risk is mitigated by the posting of collateral by the counterparty to the Fund to cover the Fund’s exposure to the counterparty). As the protection seller, the Fund’s maximum risk is the notional amount of the contract. Credit default swaps are considered to have credit risk-related contingent features since they require payment by the protection seller to the protection buyer upon the occurrence of a defined credit event.
Entering into a CDS agreement involves, to varying degrees, elements of credit, market and documentation risk in excess of the related amounts recognized on the Statement of Assets and Liabilities. Such risks involve the possibility that there will be no liquid market for these agreements, that the counterparty to the agreement may default on its obligation to perform or disagree as to the meaning of the contractual terms in the agreement, and that there will be unfavorable changes in net interest rates.
(e) Securities traded on a when-issued and delayed delivery basis. The Fund may trade securities on a when-issued or delayed delivery basis. In when-issued and delayed delivery transactions, the securities are purchased or sold by the Fund with payment and delivery taking place in the future in order to secure what is considered to be an advantageous price and yield to the Fund at the time of entering into the transaction.
Purchasing such securities involves risk of loss if the value of the securities declines prior to settlement. These securities are subject to market fluctuations and their current value is determined in the same manner as for other securities.
(f) Foreign currency translation. Investment securities and other assets and liabilities denominated in foreign currencies are translated into U.S. dollar amounts based upon prevailing exchange rates on the date of valuation. Purchases and sales of investment securities and income and expense items denominated in foreign currencies are translated into U.S. dollar amounts based upon prevailing exchange rates on the respective dates of such transactions.
The Fund does not isolate that portion of the results of operations resulting from fluctuations in foreign exchange rates on investments from the fluctuations arising from changes in market prices of securities held. Such fluctuations are included with the net realized and unrealized gain or loss on investments.
| | | | | | |
| BrandywineGLOBAL — Global High Yield Fund 2021 Annual Report | | | | | 39 | |
Notes to financial statements (cont’d)
Net realized foreign exchange gains or losses arise from sales of foreign currencies, including gains and losses on forward foreign currency contracts, currency gains or losses realized between the trade and settlement dates on securities transactions, and the difference between the amounts of dividends, interest, and foreign withholding taxes recorded on the Fund’s books and the U.S. dollar equivalent of the amounts actually received or paid. Net unrealized foreign exchange gains and losses arise from changes in the values of assets and liabilities, other than investments in securities, on the date of valuation, resulting from changes in exchange rates.
Foreign security and currency transactions may involve certain considerations and risks not typically associated with those of U.S. dollar denominated transactions as a result of, among other factors, the possibility of lower levels of governmental supervision and regulation of foreign securities markets and the possibility of political or economic instability.
(g) Credit and market risk. Investments in securities that are collateralized by real estate mortgages are subject to certain credit and liquidity risks. When market conditions result in an increase in default rates of the underlying mortgages and the foreclosure values of underlying real estate properties are materially below the outstanding amount of these underlying mortgages, collection of the full amount of accrued interest and principal on these investments may be doubtful. Such market conditions may significantly impair the value and liquidity of these investments and may result in a lack of correlation between their credit ratings and values.
The Fund invests in high-yield and emerging market instruments that are subject to certain credit and market risks. The yields of high-yield and emerging market debt obligations reflect, among other things, perceived credit and market risks. The Fund’s investments in securities rated below investment grade typically involve risks not associated with higher rated securities including, among others, greater risk related to timely and ultimate payment of interest and principal, greater market price volatility and less liquid secondary market trading. The consequences of political, social, economic or diplomatic changes may have disruptive effects on the market prices of investments held by the Fund. The Fund’s investments in non-U.S. dollar denominated securities may also result in foreign currency losses caused by devaluations and exchange rate fluctuations.
(h) Foreign investment risks. The Fund’s investments in foreign securities may involve risks not present in domestic investments. Since securities may be denominated in foreign currencies, may require settlement in foreign currencies or may pay interest or dividends in foreign currencies, changes in the relationship of these foreign currencies to the U.S. dollar can significantly affect the value of the investments and earnings of the Fund. Foreign investments may also subject the Fund to foreign government exchange restrictions, expropriation, taxation or other political, social or economic developments, all of which affect the market and/or credit risk of the investments.
(i) Counterparty risk and credit- risk- related contingent features of derivative instruments. The Fund may invest in certain securities or engage in other transactions where the Fund is exposed to counterparty credit risk in addition to broader market risks. The Fund may invest in securities of issuers, which may also be considered counterparties
| | | | |
40 | | | | BrandywineGLOBAL — Global High Yield Fund 2021 Annual Report |
as trading partners in other transactions. This may increase the risk of loss in the event of default or bankruptcy by the counterparty or if the counterparty otherwise fails to meet its contractual obligations. The Fund’s subadviser attempts to mitigate counterparty risk by (i) periodically assessing the creditworthiness of its trading partners, (ii) monitoring and/or limiting the amount of its net exposure to each individual counterparty based on its assessment and (iii) requiring collateral from the counterparty for certain transactions. Market events and changes in overall economic conditions may impact the assessment of such counterparty risk by the subadviser. In addition, declines in the values of underlying collateral received may expose the Fund to increased risk of loss.
With exchange traded and centrally cleared derivatives, there is less counterparty risk to the Fund since the exchange or clearinghouse, as counterparty to such instruments, guarantees against a possible default. The clearinghouse stands between the buyer and the seller of the contract; therefore, the credit risk is limited to failure of the clearinghouse. While offset rights may exist under applicable law, the Fund does not have a contractual right of offset against a clearing broker or clearinghouse in the event of a default of the clearing broker or clearinghouse.
The Fund has entered into master agreements, such as an International Swaps and Derivatives Association, Inc. Master Agreement (“ISDA Master Agreement”) or similar agreement, with certain of its derivative counterparties that govern over-the-counter (“OTC”) derivatives and provide for general obligations, representations, agreements, collateral posting terms, netting provisions in the event of default or termination and credit related contingent features. The credit related contingent features include, but are not limited to, a percentage decrease in the Fund’s net assets or net asset value per share over a specified period of time. If these credit related contingent features were triggered, the derivatives counterparty could terminate the positions and demand payment or require additional collateral.
Under an ISDA Master Agreement, the Fund may, under certain circumstances, offset with the counterparty certain derivative financial instruments’ payables and/or receivables with collateral held and/or posted and create one single net payment. However, absent an event of default by the counterparty or a termination of the agreement, the terms of the ISDA Master Agreements do not result in an offset of reported amounts of financial assets and financial liabilities in the Statement of Assets and Liabilities across transactions between the Fund and the applicable counterparty. The enforceability of the right to offset may vary by jurisdiction.
Collateral requirements differ by type of derivative. Collateral or margin requirements are set by the broker or exchange clearinghouse for exchange traded derivatives while collateral terms are contract specific for OTC traded derivatives. Cash collateral that has been pledged to cover obligations of the Fund under derivative contracts, if any, will be reported separately in the Statement of Assets and Liabilities. Securities pledged as collateral, if any, for the same purpose are noted in the Schedule of Investments.
| | | | | | |
| BrandywineGLOBAL — Global High Yield Fund 2021 Annual Report | | | | | 41 | |
Notes to financial statements (cont’d)
As of September 30, 2021, the Fund held forward foreign currency contracts and OTC credit default swaps with credit related contingent features which had a liability position of $61,701. If a contingent feature in the master agreements would have been triggered, the Fund would have been required to pay this amount to its derivatives counterparties.
At September 30, 2021, the Fund held cash collateral from JPMorgan Chase & Co. in the amount of $80,000. This amount could be used to reduce the Fund’s exposure to the counterparty in the event of default.
(j) Security transactions and investment income. Security transactions are accounted for on a trade date basis. Interest income (including interest income from payment-in-kind securities), adjusted for amortization of premium and accretion of discount, is recorded on the accrual basis. Paydown gains and losses on mortgage- and asset-backed securities are recorded as adjustments to interest income. Dividend income is recorded on the ex-dividend date for dividends received in cash and/or securities. Foreign dividend income is recorded on the ex-dividend date or as soon as practicable after the Fund determines the existence of a dividend declaration after exercising reasonable due diligence. The cost of investments sold is determined by use of the specific identification method. To the extent any issuer defaults or a credit event occurs that impacts the issuer, the Fund may halt any additional interest income accruals and consider the realizability of interest accrued up to the date of default or credit event.
(k) Distributions to shareholders. Distributions from net investment income of the Fund are declared each business day to shareholders of record and are paid monthly. Distributions of net realized gains, if any, are declared at least annually. Distributions to shareholders of the Fund are recorded on the ex-dividend date and are determined in accordance with income tax regulations, which may differ from GAAP.
(l) Share class accounting. Investment income, common expenses and realized/ unrealized gains (losses) on investments are allocated to the various classes of the Fund on the basis of daily net assets of each class. Fees relating to a specific class are charged directly to that share class.
(m) Compensating balance arrangements. The Fund has an arrangement with its custodian bank whereby a portion of the custodian’s fees is paid indirectly by credits earned on the Fund’s cash on deposit with the bank.
(n) Federal and other taxes. It is the Fund’s policy to comply with the federal income and excise tax requirements of the Internal Revenue Code of 1986 (the “Code”), as amended, applicable to regulated investment companies. Accordingly, the Fund intends to distribute its taxable income and net realized gains, if any, to shareholders in accordance with timing requirements imposed by the Code. Therefore, no federal or state income tax provision is required in the Fund’s financial statements.
However, due to the timing of when distributions are made by the Fund, the Fund may be subject to an excise tax of 4% of the amount by which 98% of the Fund’s annual taxable income and 98.2% of net realized gains exceed the distributions from such taxable income and realized gains for the calendar year. During the year, the Fund paid $1,211 of federal excise taxes attributable to calendar year 2020.
| | | | |
42 | | | | BrandywineGLOBAL — Global High Yield Fund 2021 Annual Report |
Management has analyzed the Fund’s tax positions taken on income tax returns for all open tax years and has concluded that as of September 30, 2021, no provision for income tax is required in the Fund’s financial statements. The Fund’s federal and state income and federal excise tax returns for tax years for which the applicable statutes of limitations have not expired are subject to examination by the Internal Revenue Service and state departments of revenue.
Under the applicable foreign tax laws, a withholding tax may be imposed on interest, dividends and capital gains at various rates. Realized gains upon disposition of securities issued in or by certain foreign countries are subject to capital gains tax imposed by those countries.
(o) Reclassification. GAAP requires that certain components of net assets be reclassified to reflect permanent differences between financial and tax reporting. These reclassifications have no effect on net assets or net asset value per share. During the current year, the following reclassifications have been made:
| | | | | | | | |
| | | Total Distributable
Earnings (Loss) | | | Paid-in
Capital | |
| (a) | | $ | 1,211 | | | $ | (1,211) | |
| (a) | Reclassifications are due to an excise tax paid by the Fund. |
2. Investment management agreement and other transactions with affiliates
Legg Mason Partners Fund Advisor, LLC (“LMPFA”) is the Fund’s investment manager and Brandywine Global Investment Management, LLC (“Brandywine Global”) is the Fund’s subadviser. LMPFA and Brandywine Global are indirect, wholly-owned subsidiaries of Franklin Resources, Inc. (“Franklin Resources”).
Under the investment management agreement, the Fund pays an investment management fee, calculated daily and paid monthly, at an annual rate of 0.65% of the Fund’s average daily net assets.
LMPFA provides administrative and certain oversight services to the Fund. LMPFA delegates to the subadviser the day-to-day portfolio management of the Fund. For its services, LMPFA pays Brandywine Global a fee monthly, at an annual rate equal to 90% of the net management fee it receives from the Fund.
As a result of expense limitation arrangements between the Fund and LMPFA, the ratio of total annual fund operating expenses, other than interest, brokerage commissions, dividend expense on short sales, taxes, extraordinary expenses and acquired fund fees and expenses, to average net assets of Class A, Class C, Class FI, Class I and Class IS shares did not exceed 1.15%, 1.90%, 1.15%, 0.85% and 0.75%, respectively. In addition, the ratio of total annual fund operating expenses for Class IS shares did not exceed the ratio of total annual fund operating expenses for Class I shares. These expense limitation arrangements cannot be terminated prior to December 31, 2022 without the Board of Trustees’ consent. In addition, the manager has agreed to waive the Fund’s management fee to an extent sufficient to offset the net management fee payable in connection with any investment in an affiliated money market fund (the “affiliated money market fund waiver”). The affiliated money market fund waiver is not subject to the recapture provision discussed below.
| | | | | | |
| BrandywineGLOBAL — Global High Yield Fund 2021 Annual Report | | | | | 43 | |
Notes to financial statements (cont’d)
During the year ended September 30, 2021, fees waived and/or expenses reimbursed amounted to $209,845, which included an affiliated money market fund waiver of $19.
LMPFA is permitted to recapture amounts waived and/or reimbursed to a class within three years after the fiscal year in which LMPFA earned the fee or incurred the expense if the class’ total annual fund operating expenses have fallen to a level below the expense limitation (“expense cap”) in effect at the time the fees were earned or the expenses incurred. In no case will LMPFA recapture any amount that would result, on any particular business day of the Fund, in the class’ total annual fund operating expenses exceeding the expense cap or any other lower limit then in effect.
Pursuant to these arrangements, at September 30, 2021, the Fund had remaining fee waivers and/or expense reimbursements subject to recapture by LMPFA and respective dates of expiration as follows:
| | | | | | | | | | | | | | | | | | | | |
| | | Class A | | | Class C | | | Class FI | | | Class I | | | Class IS | |
| Expires September 30, 2022 | | $ | 892 | | | $ | 1,090 | | | $ | 754 | | | $ | 14,619 | | | $ | 216,538 | |
| Expires September 30, 2023 | | | 1,075 | | | | 896 | | | | 2,245 | | | | 15,905 | | | | 207,386 | |
| Expires September 30, 2024 | | | 2,053 | | | | 490 | | | | 1,688 | | | | 10,920 | | | | 193,543 | |
| Total fee waivers/expense reimbursements subject to recapture | | $ | 4,020 | | | $ | 2,476 | | | $ | 4,687 | | | $ | 41,444 | | | $ | 617,467 | |
For the year ended September 30, 2021, LMPFA did not recapture any fees.
Franklin Distributors, LLC (known as Legg Mason Investor Services, LLC prior to July 7, 2021) (“Franklin Distributors”) serves as the Fund’s sole and exclusive distributor. Franklin Distributors is an indirect, wholly-owned broker-dealer subsidiary of Franklin Resources.
There is a maximum initial sales charge of 4.25% for Class A shares. There is a contingent deferred sales charge (“CDSC”) of 1.00% on Class C shares, which applies if redemption occurs within 12 months from purchase payment. In certain cases, Class A shares have a 1.00% CDSC, which applies if redemption occurs within 18 months from purchase payment. This CDSC only applies to those purchases of Class A shares, which, when combined with current holdings of other shares of Legg Mason funds, equal or exceed $1,000,000 in the aggregate. These purchases do not incur an initial sales charge.
For the year ended September 30, 2021, sales charges retained by and CDSCs paid to Franklin Distributors and its affiliates, if any, were as follows:
| | | | |
| | | Class A | |
| Sales charges | | $ | 179 | |
| CDSCs | | | — | |
Under a Deferred Compensation Plan (the “Plan”), Trustees may have elected to defer receipt of all or a specified portion of their compensation. A participating Trustee selected one or more funds managed by LMPFA or an affiliate of LMPFA in which his or her deferred trustee’s fees were deemed to be invested. Deferred amounts remain in the Fund until distributed in accordance with the Plan. In May 2015, the Board of Trustees approved an amendment to the Plan so that effective January 1, 2016, no compensation earned after that date may be deferred under the Plan.
| | | | |
44 | | | | BrandywineGLOBAL — Global High Yield Fund 2021 Annual Report |
All officers and one Trustee of the Trust are employees of Franklin Resources or its affiliates and do not receive compensation from the Trust.
3. Investments
During the year ended September 30, 2021, the aggregate cost of purchases and proceeds from sales of investments (excluding short-term investments) were as follows:
| | | | |
| Purchases | | $ | 27,403,191 | |
| Sales | | | 36,671,737 | |
At September 30, 2021, the aggregate cost of investments and the aggregate gross unrealized appreciation and depreciation of investments for federal income tax purposes were as follows:
| | | | | | | | | | | | | | | | |
| | | Cost/Premiums
Paid (Received) | | | Gross
Unrealized
Appreciation | | | Gross
Unrealized
Depreciation | | | Net
Unrealized
Appreciation
(Depreciation) | |
| Securities | | $ | 31,313,975 | | | $ | 1,199,560 | | | $ | (85,248) | | | $ | 1,114,312 | |
| Forward foreign currency contracts | | | — | | | | — | | | | (43,776) | | | | (43,776) | |
| Swap contracts | | | 438,203 | | | | 125,580 | | | | (13,154) | | | | 112,426 | |
4. Derivative instruments and hedging activities
Below is a table, grouped by derivative type, that provides information about the fair value and the location of derivatives within the Statement of Assets and Liabilities at September 30, 2021.
| | | | | | | | | | | | |
| ASSET DERIVATIVES1 | |
| | | | | | | | | Credit
Risk | |
| OTC swap contracts2 | | | | | | | | | | $ | 104,941 | |
| Centrally cleared swap contracts3 | | | | | | | | | | | 83,879 | |
| Total | | | | | | | | | | $ | 188,820 | |
|
| LIABILITY DERIVATIVES1 | |
| | | Foreign
Exchange Risk | | | Credit
Risk | | | Total | |
| Forward foreign currency contracts | | $ | 43,776 | | | | — | | | | $43,776 | |
| OTC swap contracts2 | | | — | | | $ | 17,925 | | | | 17,925 | |
| Total | | $ | 43,776 | | | $ | 17,925 | | | $ | 61,701 | |
| | | | | | |
| BrandywineGLOBAL — Global High Yield Fund 2021 Annual Report | | | | | 45 | |
Notes to financial statements (cont’d)
| 1 | Generally, the balance sheet location for asset derivatives is receivables/net unrealized appreciation and for liability derivatives is payables/net unrealized depreciation. |
| 2 | Values include premiums paid (received) on swap contracts which are shown separately in the Statement of Assets and Liabilities. |
| 3 | Includes cumulative unrealized appreciation (depreciation) of centrally cleared swap contracts as reported in the Schedule of Investments. Only net variation margin is reported within the receivables and/or payables on the Statement of Assets and Liabilities. |
The following tables provide information about the effect of derivatives and hedging activities on the Fund’s Statement of Operations for the year ended September 30, 2021. The first table provides additional detail about the amounts and sources of gains (losses) realized on derivatives during the period. The second table provides additional information about the change in unrealized appreciation (depreciation) resulting from the Fund’s derivatives and hedging activities during the period.
| | | | | | | | | | | | | | | | |
| AMOUNT OF REALIZED GAIN (LOSS) ON DERIVATIVES RECOGNIZED | |
| | | Interest
Rate Risk | | | Foreign
Exchange
Risk | | | Credit
Risk | | | Total | |
| Futures contracts | | $ | 164,432 | | | | — | | | | — | | | $ | 164,432 | |
| Swap contracts | | | — | | | | — | | | $ | 250,100 | | | | 250,100 | |
| Forward foreign currency contracts | | | — | | | $ | (225,891) | | | | — | | | | (225,891) | |
| Total | | $ | 164,432 | | | $ | (225,891) | | | $ | 250,100 | | | $ | 188,641 | |
|
| CHANGE IN UNREALIZED APPRECIATION (DEPRECIATION) ON DERIVATIVES RECOGNIZED | |
| | | | | | Foreign
Exchange Risk | | | Credit
Risk | | | Total | |
| Swap contracts | | | | | | | — | | | $ | 89,220 | | | $ | 89,220 | |
| Forward foreign currency contracts | | | | | | $ | 101,683 | | | | — | | | | 101,683 | |
| Total | | | | | | $ | 101,683 | | | $ | 89,220 | | | $ | 190,903 | |
During the year ended September 30, 2021, the volume of derivative activity for the Fund was as follows:
| | | | |
| | | Average Market
Value | |
| Futures contracts (to sell)† | | $ | 94,486 | |
| Forward foreign currency contracts (to buy) | | | 4,053,846 | |
| Forward foreign currency contracts (to sell) | | | 1,234,608 | |
| |
| | | Average Notional
Balance | |
| Credit default swap contracts (buy protection)† | | $ | 306,538 | |
| Credit default swap contracts (sell protection) | | | 9,466,615 | |
| † | At September 30, 2021, there were no open positions held in this derivative. |
| | | | |
46 | | | | BrandywineGLOBAL — Global High Yield Fund 2021 Annual Report |
The following table presents the Fund’s OTC derivative assets and liabilities by counterparty net of amounts available for offset under an ISDA Master Agreement and net of the related collateral pledged (received) by the Fund as of September 30, 2021.
| | | | | | | | | | | | | | | | | | | | |
| Counterparty | | Gross Assets
Subject to
Master
Agreements1 | | | Gross
Liabilities
Subject to
Master
Agreements1 | | | Net Assets
(Liabilities)
Subject to
Master
Agreements | | | Collateral
Pledged
(Received)2,3 | | | Net
Amount4,5 | |
| Barclays Bank PLC | | $ | 7,679 | | | | — | | | $ | 7,679 | | | | — | | | $ | 7,679 | |
| Citibank N.A. | | | — | | | $ | (43,776) | | | | (43,776) | | | | — | | | | (43,776) | |
| Goldman Sachs Group Inc. | | | 22,210 | | | | — | | | | 22,210 | | | | — | | | | 22,210 | |
| JPMorgan Chase & Co. | | | 69,770 | | | | — | | | | 69,770 | | | $ | (69,770) | | | | — | |
| Morgan Stanley & Co. Inc. | | | 5,282 | | | | (17,925) | | | | (12,643) | | | | — | | | | (12,643) | |
| Total | | $ | 104,941 | | | $ | (61,701) | | | $ | 43,240 | | | $ | (69,770) | | | $ | (26,530) | |
| 1 | Absent an event of default or early termination, derivative assets and liabilities are presented gross and not offset in the Statement of Assets and Liabilities. |
| 2 | Gross amounts are not offset in the Statement of Assets and Liabilities. |
| 3 | In some instances, the actual collateral received and/or pledged may be more than the amount shown here due to overcollateralization. |
| 4 | Net amount may also include forward foreign currency exchange contracts that are not required to be collateralized. |
| 5 | Represents the net amount receivable (payable) from (to) the counterparty in the event of default. |
5. Class specific expenses, waivers and/or expense reimbursements
The Fund has adopted a Rule 12b-1 shareholder services and distribution plan and under that plan the Fund pays service and/or distribution fees with respect to its Class A, Class C and Class FI shares calculated at the annual rate of 0.25%, 1.00% and 0.25% of the average daily net assets of each class, respectively. Service and/or distribution fees are accrued daily and paid monthly.
For the year ended September 30, 2021, class specific expenses were as follows:
| | | | | | | | |
| | | Service and/or
Distribution
Fees | | | Transfer Agent
Fees | |
| Class A | | $ | 851 | | | $ | 711 | |
| Class C | | | 881 | | | | 150 | |
| Class FI | | | 705 | | | | 649 | |
| Class I | | | — | | | | 2,220 | |
| Class IS | | | — | | | | 2,147 | |
| Total | | $ | 2,437 | | | $ | 5,877 | |
| | | | | | |
| BrandywineGLOBAL — Global High Yield Fund 2021 Annual Report | | | | | 47 | |
Notes to financial statements (cont’d)
For the year ended September 30, 2021, waivers and/or expense reimbursements by class were as follows:
| | | | |
| | | Waivers/Expense
Reimbursements | |
| Class A | | $ | 2,062 | |
| Class C | | | 493 | |
| Class FI | | | 1,694 | |
| Class I | | | 10,976 | |
| Class IS | | | 194,620 | |
| Total | | $ | 209,845 | |
6. Distributions to shareholders by class
| | | | | | | | |
| | | Year Ended
September 30, 2021 | | | Year Ended
September 30, 2020 | |
| Net Investment Income: | | | | | | | | |
| Class A | | $ | 15,220 | | | $ | 5,785 | |
| Class C | | | 3,894 | | | | 6,225 | |
| Class FI | | | 13,866 | | | | 18,623 | |
| Class I | | | 115,182 | | | | 134,391 | |
| Class IS | | | 2,003,467 | | | | 1,823,926 | |
| Total | | $ | 2,151,629 | | | $ | 1,988,950 | |
7. Shares of beneficial interest
At September 30, 2021, the Trust had an unlimited number of shares of beneficial interest authorized with a par value of $0.00001 per share. The Fund has the ability to issue multiple classes of shares. Each class of shares represents an identical interest and has the same rights, except that each class bears certain direct expenses, including those specifically related to the distribution of its shares.
Transactions in shares of each class were as follows:
| | | | | | | | | | | | | | | | |
| | | Year Ended
September 30, 2021 | | | Year Ended
September 30, 2020 | |
| | | Shares | | | Amount | | | Shares | | | Amount | |
| Class A | | | | | | | | | | | | | | | | |
| Shares sold | | | 251,049 | | | $ | 2,253,017 | | | | 5,124 | | | $ | 44,823 | |
| Shares issued on reinvestment | | | 1,183 | | | | 10,665 | | | | 678 | | | | 5,780 | |
| Shares repurchased | | | (225,473) | | | | (2,046,854) | | | | (7,871) | | | | (65,521) | |
| Net increase (decrease) | | | 26,759 | | | $ | 216,828 | | | | (2,069) | | | $ | (14,918) | |
| Class C | | | | | | | | | | | | | | | | |
| Shares sold | | | — | | | | — | | | | 4,260 | | | $ | 37,406 | |
| Shares issued on reinvestment | | | 433 | | | $ | 3,894 | | | | 726 | | | | 6,225 | |
| Shares repurchased | | | (2,993) | | | | (27,048) | | | | (14,721) | | | | (128,900) | |
| Net decrease | | | (2,560) | | | $ | (23,154) | | | | (9,735) | | | $ | (85,269) | |
| | | | |
48 | | | | BrandywineGLOBAL — Global High Yield Fund 2021 Annual Report |
| | | | | | | | | | | | | | | | |
| | | Year Ended
September 30, 2021 | | | Year Ended
September 30, 2020 | |
| | | Shares | | | Amount | | | Shares | | | Amount | |
| Class FI | | | | | | | | | | | | | | | | |
| Shares sold | | | 45,082 | | | $ | 408,493 | | | | 79,843 | | | $ | 693,110 | |
| Shares issued on reinvestment | | | 1,535 | | | | 13,827 | | | | 2,138 | | | | 18,542 | |
| Shares repurchased | | | (54,356) | | | | (492,467) | | | | (70,346) | | | | (615,074) | |
| Net increase (decrease) | | | (7,739) | | | $ | (70,147) | | | | 11,635 | | | $ | 96,578 | |
| Class I | | | | | | | | | | | | | | | | |
| Shares sold | | | 35,747 | | | $ | 323,717 | | | | 101,223 | | | $ | 821,258 | |
| Shares issued on reinvestment | | | 12,827 | | | | 115,145 | | | | 15,712 | | | | 134,352 | |
| Shares repurchased | �� | | (160,781) | | | | (1,446,829) | | | | (63,211) | | | | (526,767) | |
| Net increase (decrease) | | | (112,207) | | | $ | (1,007,967) | | | | 53,724 | | | $ | 428,843 | |
| Class IS | | | | | | | | | | | | | | | | |
| Shares sold | | | 372,780 | | | $ | 3,330,241 | | | | 888,923 | | | $ | 7,432,375 | |
| Shares issued on reinvestment | | | 215,083 | | | | 1,933,505 | | | | 206,269 | | | | 1,762,192 | |
| Shares repurchased | | | (1,537,235) | | | | (13,830,901) | | | | (430,768) | | | | (3,661,092) | |
| Net increase (decrease) | | | (949,372) | | | $ | (8,567,155) | | | | 664,424 | | | $ | 5,533,475 | |
8. Transactions with affiliated company
As defined by the 1940 Act, an affiliated company is one in which the Fund owns 5% or more of the outstanding voting securities, or a company which is under common ownership or control with the Fund. The following company was considered an affiliated company for all or some portion of the year ended September 30, 2021. The following transactions were effected in such company for the year ended September 30, 2021.
| | | | | | | | | | | | | | | | | | | | |
| | | Affiliate
Value at
September 30,
2020 | | | Purchased | | | Sold | |
| | | Cost | | | Shares | | | Cost | | | Shares | |
| Western Asset Premier Institutional U.S. Treasury Reserves, Premium Shares | | | — | | | $ | 6,350,582 | | | | 6,350,582 | | | $ | 5,171,956 | | | | 5,171,956 | |
| | | | | | | | | | | | | | | | |
| (cont’d) | | Realized
Gain
(Loss) | | | Interest
Income | | | Net Increase
(Decrease) in
Unrealized
Appreciation
(Depreciation) | | | Affiliate
Value at
September 30,
2021 | |
| Western Asset Premier | | | | | | | | | | | | | | | | |
| Institutional U.S. | | | | | | | | | | | | | | | | |
| Treasury Reserves, | | | | | | | | | | | | | | | | |
| Premium Shares | | | — | | | $ | 46 | | | | — | | | $ | 1,178,626 | |
9. Redemption facility
Effective February 5, 2021, the Fund’s redemption facility (the “Redemption Facility”) was terminated and the Fund and certain other participating funds within the Trust, together
| | | | | | |
| BrandywineGLOBAL — Global High Yield Fund 2021 Annual Report | | | | | 49 | |
Notes to financial statements (cont’d)
with other U.S. registered and foreign investment funds (collectively, the “Borrowers”) managed by LMPFA or Franklin Resources, became borrowers in a joint syndicated senior unsecured credit facility totaling $2.675 billion (the “Global Credit Facility”). The Global Credit Facility provides a source of funds to the Borrowers for temporary and emergency purposes, including the ability to meet future unanticipated or unusually large redemption requests. Unless renewed, the Global Credit Facility will terminate on February 4, 2022.
Under the terms of the Global Credit Facility, the Fund shall, in addition to interest charged on any borrowings made by the Fund and other costs incurred by the Fund, pay its share of fees and expenses incurred in connection with the implementation and maintenance of the Global Credit Facility, based upon its relative share of the aggregate net assets of all the Borrowers, including an annual commitment fee of 0.15% based upon the unused portion of the Global Credit Facility; there is no upfront fee. Under the Redemption Facility, the Fund had access to the aggregate amount of $190 million, and the following terms were in effect: the annual commitment fee to maintain the Redemption Facility was 0.15% incurred on the unused portion of the facility and there was an annual upfront fee of 0.06% of the $190 million Redemption Facility; prior to November 16, 2020, there was no upfront fee. The aggregate commitment fees under the Global Credit Facility and Redemption Facility are reflected in the Statement of Operations. The Fund did not utilize the Global Credit Facility nor the Redemption Facility during the year ended September 30, 2021.
10. Income tax information and distributions to shareholders
The tax character of distributions paid during the fiscal years ended September 30, was as follows:
| | | | | | | | |
| | | 2021 | | | 2020 | |
| Distributions paid from: | | | | | | | | |
| Ordinary income | | $ | 2,151,629 | | | $ | 1,988,950 | |
As of September 30, 2021, the components of distributable earnings (loss) on a tax basis were as follows:
| | | | |
| Undistributed ordinary income — net | | $ | 435,152 | |
| Deferred capital losses* | | | (944,144) | |
| Other book/tax temporary differences(a) | | | (4,794) | |
| Unrealized appreciation (depreciation)(b) | | | 1,182,500 | |
| Total distributable earnings (loss) — net | | $ | 668,714 | |
| * | These capital losses have been deferred in the current year as either short-term or long-term losses. The losses will be deemed to occur on the first day of the next taxable year in the same character as they were originally deferred and will be available to offset future taxable capital gains. |
| (a) | Other book/tax temporary differences are attributable to the realization for tax purposes of unrealized gains (losses) on certain foreign currency contracts and book/tax differences in the timing of the deductibility of various expenses. |
| (b) | The difference between book-basis and tax-basis unrealized appreciation (depreciation) is attributable to the tax deferral of losses on wash sales. |
| | | | |
50 | | | | BrandywineGLOBAL — Global High Yield Fund 2021 Annual Report |
11. Recent accounting pronouncement
In March 2020, the Financial Accounting Standards Board (FASB) issued Accounting Standards Update (ASU) No. 2020-04, Reference Rate Reform (Topic 848) — Facilitation of the Effects of Reference Rate Reform on Financial Reporting. In January 2021, the FASB issued ASU No. 2021-01, with further amendments to Topic 848. The amendments in the ASUs provide optional temporary accounting recognition and financial reporting relief from the effect of certain types of contract modifications due to the planned discontinuation of the LIBOR and other interbank-offered based reference rates as of the end of 2021 and 2023. The ASUs are effective for certain reference rate-related contract modifications that occur during the period March 12, 2020 through December 31, 2022. Management has reviewed the requirements and believes the adoption of these ASUs will not have a material impact on the financial statements.
12. Other matters
The outbreak of the respiratory illness COVID-19 (commonly referred to as “coronavirus”) has continued to rapidly spread around the world, causing considerable uncertainty for the global economy and financial markets. The ultimate economic fallout from the pandemic, and the long-term impact on economies, markets, industries and individual issuers, are not known. The COVID-19 pandemic could adversely affect the value and liquidity of the Fund’s investments, impair the Fund’s ability to satisfy redemption requests, and negatively impact the Fund’s performance. In addition, the outbreak of COVID-19, and measures taken to mitigate its effects, could result in disruptions to the services provided to the Fund by its service providers.
* * *
The Fund’s investments, payment obligations, and financing terms may be based on floating rates, such as the London Interbank Offered Rate, or “LIBOR,” which is the offered rate for short-term Eurodollar deposits between major international banks. On March 5, 2021, the ICE Benchmark Administration, the administrator of LIBOR, stated that it will cease the publication of (i) the overnight and one-, three-, six- and twelve-month USD LIBOR settings immediately following the LIBOR publication on Friday, June 30, 2023 and (ii) all other LIBOR settings, including the one-week and two-month USD LIBOR settings, immediately following the LIBOR publication on Friday, December 31, 2021. There remains uncertainty regarding the nature of any replacement rate and the impact of the transition from LIBOR on the Fund’s transactions and the financial markets generally. As such, the potential effect of a transition away from LIBOR on the Fund or the Fund’s investments cannot yet be determined.
| | | | | | |
| BrandywineGLOBAL — Global High Yield Fund 2021 Annual Report | | | | | 51 | |
Report of independent registered public accounting firm
To the Board of Trustees of Legg Mason Global Asset Management Trust and Shareholders of BrandywineGLOBAL-Global High Yield Fund
Opinion on the Financial Statements
We have audited the accompanying statement of assets and liabilities, including the schedule of investments, of BrandywineGLOBAL - Global High Yield Fund (one of the funds constituting Legg Mason Global Asset Management Trust, referred to hereafter as the “Fund”) as of September 30, 2021, the related statement of operations for the year ended September 30, 2021, the statement of changes in net assets for each of the two years in the period ended September 30, 2021, including the related notes, and the financial highlights for each of the periods indicated therein (collectively referred to as the “financial statements”). In our opinion, the financial statements present fairly, in all material respects, the financial position of the Fund as of September 30, 2021, the results of its operations for the year then ended, the changes in its net assets for each of the two years in the period ended September 30, 2021 and the financial highlights for each of the periods indicated therein in conformity with accounting principles generally accepted in the United States of America.
Basis for Opinion
These financial statements are the responsibility of the Fund’s management. Our responsibility is to express an opinion on the Fund’s financial statements based on our audits. We are a public accounting firm registered with the Public Company Accounting Oversight Board (United States) (PCAOB) and are required to be independent with respect to the Fund in accordance with the U.S. federal securities laws and the applicable rules and regulations of the Securities and Exchange Commission and the PCAOB.
We conducted our audits of these financial statements in accordance with the standards of the PCAOB. Those standards require that we plan and perform the audit to obtain reasonable assurance about whether the financial statements are free of material misstatement, whether due to error or fraud.
Our audits included performing procedures to assess the risks of material misstatement of the financial statements, whether due to error or fraud, and performing procedures that respond to those risks. Such procedures included examining, on a test basis, evidence regarding the amounts and disclosures in the financial statements. Our audits also included evaluating the accounting principles used and significant estimates made by management, as well as evaluating the overall presentation of the financial statements. Our procedures included confirmation of securities owned as of September 30, 2021 by correspondence with the custodian and brokers; when replies were not received from brokers, we performed other auditing procedures. We believe that our audits provide a reasonable basis for our opinion.
/s/PricewaterhouseCoopers LLP
Baltimore, Maryland
November 18, 2021
We have served as the auditor of one or more investment companies in the Franklin Templeton Group of Funds since 1948.
| | | | |
52 | | | | BrandywineGLOBAL — Global High Yield Fund 2021 Annual Report |
Additional shareholder information (unaudited)
Results of special meeting of shareholders
A special meeting of shareholders was held on June 15, 2021 for shareholders of record as of March 1, 2021 (the “Record Date”) to elect the Board of Trustees of the Trust.
Shareholders of the Fund and each other series of the Trust voted together as a single class to elect the Board.
Shareholders of the Trust voted as indicated below (vote totals are rounded to the nearest whole number). Effective July 1, 2021, the Board is composed of the following Trustees:
| | | | |
| | |
| Trustee | | For | | Withheld |
| Paul R. Ades | | 11,915,712,078 | | 203,516,727 |
| Andrew L. Breech | | 11,923,087,811 | | 196,140,993 |
| Althea L. Duersten | | 11,972,830,693 | | 146,398,111 |
| Stephen R. Gross | | 11,919,258,594 | | 199,970,210 |
| Susan M. Heilbron | | 11,970,320,096 | | 148,908,708 |
| Howard J. Johnson | | 11,919,503,553 | | 199,725,251 |
| Arnold L. Lehman | | 11,920,774,188 | | 198,454,617 |
| Robin J.W. Masters | | 11,971,843,764 | | 147,385,040 |
| Jerome H. Miller | | 11,919,153,082 | | 200,075,722 |
| Ken Miller | | 11,922,645,083 | | 196,583,722 |
| G. Peter O’Brien | | 11,919,113,936 | | 200,114,868 |
| Thomas F. Schlafly | | 11,917,628,123 | | 201,600,682 |
| Jane Trust | | 11,985,902,999 | | 133,325,805 |
The above Trustees have also been elected to serve as board members of other mutual funds within the Franklin Templeton fund complex.
| | | | | | |
| BrandywineGLOBAL — Global High Yield Fund | | | | | 53 | |
Additional information (unaudited)
Information about Trustees and Officers
The business and affairs of BrandywineGLOBAL — Global High Yield Fund (the “Fund”) are conducted by management under the supervision and subject to the direction of its Board of Trustees. The business address of each Trustee is c/o Jane Trust, Legg Mason, 100 International Drive, 11th Floor, Baltimore, Maryland 21202. Information pertaining to the Trustees and officers of the Fund is set forth below.
Previously, the mutual funds of Legg Mason Global Asset Management Trust were overseen by one group of Trustees, and the mutual funds of Legg Mason Partners Investment Trust and Legg Mason Partners Variable Equity Trust (collectively, the “Funds”) were overseen by a different group of Trustees. A joint proxy statement was mailed to solicit shareholder approval for the election of a single slate of Trustees. Shareholders approved the proposed Trustees during a joint special meeting of shareholders on June 15, 2021. Effective July 1, 2021, the Trustees listed below oversee all of the Funds.
The Statement of Additional Information includes additional information about Trustees and is available, without charge, upon request by calling the Fund at 1-877-721-1926.
| | |
| Independent Trustees† | | |
|
| Paul R. Ades |
| |
| Year of birth | | 1940 |
| Position(s) with Trust | | Trustee |
| Term of office1 and length of time served2 | | Since 1983 |
| Principal occupation(s) during the past five years | | Paul R. Ades, PLLC (law firm) (since 2000) |
| Number of funds in fund complex overseen by Trustee | | 61 |
| Other board memberships held by Trustee during the past five years | | None |
| |
| Andrew L. Breech | | |
| Year of birth | | 1952 |
| |
| Position(s) with Trust | | Trustee |
| |
| Term of office1 and length of time served2 | | Since 1991 |
| |
| Principal occupation(s) during the past five years | | President, Dealer Operating Control Service, Inc. (automotive |
| |
| | | retail management) (since 1985) |
| |
| Number of funds in fund complex overseen by Trustee | | 61 |
| |
| Other board memberships held by Trustee during the past five years | | None |
| | | | |
54 | | | | BrandywineGLOBAL — Global High Yield Fund |
| | |
| Independent Trustees† (cont’d) | | |
| |
| Althea L. Duersten* | | |
| |
| Year of birth | | 1951 |
| Position(s) with Trust | | Trustee and Chair of the Board |
| Term of office1 and length of time served2 | | Since 2014 (Chair of the Board since 2021) |
| Principal occupation(s) during the past five years | | Retired (since 2011); formerly, Chief Investment Officer, North America, JPMorgan Chase (investment bank) and member of JPMorgan Executive Committee (2007 to 2011) |
| Number of funds in fund complex overseen by Trustee | | 61 |
| Other board memberships held by Trustee during the past five years | | Formerly, Non-Executive Director, Rokos Capital Management LLP (2019 to 2020) |
| |
| Stephen R. Gross | | |
| |
| Year of birth | | 1947 |
| Position(s) with Trust | | Trustee |
| Term of office1 and length of time served2 | | Since 1986 |
| Principal occupation(s) during the past five years | | Chairman Emeritus (since 2011) and formerly, Chairman, HLB Gross Collins, P.C. (accounting and consulting firm) (1979 to 2011); Executive Director of Business Builders Team, LLC (since 2005); Principal, Gross Consulting Group, LLC (since 2011); CEO, Gross Capital Partners, LLC (since 2014); CEO, Trusted CFO Solutions, LLC (since 2011) |
| Number of funds in fund complex overseen by Trustee | | 61 |
| Other board memberships held by Trustee during the past five years | | None |
| |
| Susan M. Heilbron | | |
| |
| Year of birth | | 1945 |
| Position(s) with Trust | | Trustee |
| Term of office1 and length of time served2 | | Since 1991 |
| Principal occupation(s) during the past five years | | Retired; formerly, President, Lacey & Heilbron (communications consulting) (1990 to 2002); General Counsel and Executive Vice President, The Trump Organization (1986 to 1990); Senior Vice President, New York State Urban Development Corporation (1984 to 1986); Associate, Cravath, Swaine & Moore LLP (1980 to 1984 and 1977 to 1979) |
| Number of funds in fund complex overseen by Trustee | | 61 |
| Other board memberships held by Trustee during the past five years | | Formerly, Director, Lincoln Savings Bank FSB (1991 to 1994); Director, Trump Shuttle, Inc. (air transportation) (1989 to 1990); Director, Alexander’s Inc. (department store) (1987 to 1990) |
| | | | | | |
| BrandywineGLOBAL — Global High Yield Fund | | | | | 55 | |
Additional information (unaudited) (cont’d)
Information about Trustees and Officers
| | |
| Independent Trustees† (cont’d) | | |
| |
| Howard J. Johnson | | |
| |
| Year of birth | | 1938 |
| Position(s) with Trust | | Trustee |
| Term of office1 and length of time served2 | | From 1981 to 1998 and since 2000 |
| Principal occupation(s) during the past five years | | Retired; formerly, Chief Executive Officer, Genesis Imaging LLC (technology company) (2003 to 2012) |
| Number of funds in fund complex overseen by Trustee | | 61 |
| Other board memberships held by Trustee during the past five years | | None |
| |
| Arnold L. Lehman | | |
| |
| Year of birth | | 1944 |
| Position(s) with Trust | | Trustee |
| Term of office1 and length of time served2 | | Since 1982 |
| Principal occupation(s) during the past five years | | Senior Advisor, Phillips (auction house) (since 2015); formerly, Fellow, Ford Foundation (2015 to 2016); Director of the Brooklyn Museum (1997 to 2015) |
| Number of funds in fund complex overseen by Trustee | | 61 |
| Other board memberships held by Trustee during the past five years | | Trustee of American Federation of Arts (since 2002) |
| |
| Robin J. W. Masters | | |
| |
| Year of birth | | 1955 |
| Position(s) with Trust | | Trustee |
| Term of office1 and length of time served2 | | Since 2002 |
| Principal occupation(s) during the past five years | | Retired; formerly, Chief Investment Officer of ACE Limited (insurance) (1986 to 2000) |
| Number of funds in fund complex overseen by Trustee | | 61 |
| Other board memberships held by Trustee during the past five years | | Director of HSBC Managed Portfolios Limited and HSBC Specialist Funds Limited (since 2020); formerly, Director of Cheyne Capital International Limited (investment advisory firm) (2005 to 2020); Director/ Trustee of Legg Mason Institutional Funds plc, Western Asset Fixed Income Funds plc and Western Asset Debt Securities Fund plc. (2007 to 2011) |
| |
| Jerome H. Miller | | |
| |
| Year of birth | | 1938 |
| Position(s) with Trust | | Trustee |
| Term of office1 and length of time served2 | | Since 1995 |
| Principal occupation(s) during the past five years | | Retired; formerly, President, Shearson Lehman Asset Management (1991 to 1993), Vice Chairman, Shearson Lehman Hutton Inc. (1989 to 1992) and Senior Executive Vice President, E.F. Hutton Group Inc. (1986 to 1989) |
| Number of funds in fund complex overseen by Trustee | | 61 |
| Other board memberships held by Trustee during the past five years | | None |
| | | | |
56 | | | | BrandywineGLOBAL — Global High Yield Fund |
| | |
| Independent Trustees† (cont’d) | | |
| |
| Ken Miller | | |
| |
| Year of birth | | 1942 |
| Position(s) with Trust | | Trustee |
| Term of office1 and length of time served2 | | Since 1983 |
| Principal occupation(s) during the past five years | | Retired; formerly, President, Young Stuff Apparel Group, Inc. (apparel manufacturer), division of Li & Fung (1963 to 2012) |
| Number of funds in fund complex overseen by Trustee | | 61 |
| Other board memberships held by Trustee during the past five years | | None |
| |
| G. Peter O’Brien | | |
| |
| Year of birth | | 1945 |
| Position(s) with Trust | | Trustee |
| Term of office1 and length of time served2 | | Since 1999 |
| Principal occupation(s) during the past five years | | Retired, Trustee Emeritus of Colgate University (since 2005); Board Member, Hill House, Inc. (residential home care) (since 1999); formerly, Board Member, Bridges School (pre-school) (2006 to 2017); Managing Director, Equity Capital Markets Group of Merrill Lynch & Co. (1971 to 1999) |
| Number of funds in fund complex overseen by Trustee | | Trustee of Legg Mason funds consisting of 61 portfolios; Director/Trustee of the Royce Family of Funds consisting of 16 portfolios |
| Other board memberships held by Trustee during the past five years | | Formerly, Director of TICC Capital Corp. (2003 to 2017) |
| |
| Thomas F. Schlafly | | |
| |
| Year of birth | | 1948 |
| Position(s) with Trust | | Trustee |
| Term of office1 and length of time served2 | | Since 1983 |
| Principal occupation(s) during the past five years | | Chairman, The Saint Louis Brewery, LLC (brewery) (since 2012); formerly, President, The Saint Louis Brewery, Inc. (1989 to 2012); Senior Counsel (since 2017) and formerly, Partner (2009 to 2016), Thompson Coburn LLP (law firm) |
| Number of funds in fund complex overseen by Trustee | | 61 |
| Other board memberships held by Trustee during the past five years | | Director, CNB St. Louis Bank (since 2020); formerly, Director, Citizens National Bank of Greater St. Louis (2006 to 2020) |
| | | | | | |
| BrandywineGLOBAL — Global High Yield Fund | | | | | 57 | |
Additional information (unaudited) (cont’d)
Information about Trustees and Officers
| | |
| Interested Trustee and Officer | | |
| |
| Jane Trust, CFA3 | | |
| |
| Year of birth | | 1962 |
| Position(s) with Trust | | Trustee, President and Chief Executive Officer |
| Term of office1 and length of time served2 | | Since 2015 |
| Principal occupation(s) during the past five years | | Senior Vice President, Fund Board Management, Franklin Templeton (since 2020); Officer and/or Trustee/Director of 132 funds associated with LMPFA or its affiliates (since 2015); President and Chief Executive Officer of LMPFA (since 2015); formerly, Senior Managing Director (2018 to 2020) and Managing Director (2016 to 2018) of Legg Mason & Co., LLC (“Legg Mason & Co.”); Senior Vice President of LMPFA (2015) |
| Number of funds in fund complex overseen by Trustee | | 130 |
| Other board memberships held by Trustee during the past five years | | None |
| | |
| Additional Officers | | |
| |
Ted P. Becker
Franklin Templeton 620 Eighth Avenue, 47th Floor, New York, NY 10018 | | |
| |
| Year of birth | | 1951 |
| Position(s) with Trust | | Chief Compliance Officer |
| Term of office1 and length of time served2 | | Since 2007 |
| Principal occupation(s) during the past five years | | Vice President, Global Compliance of Franklin Templeton (since 2020); Chief Compliance Officer of LMPFA (since 2006); Chief Compliance Officer of certain funds associated with Legg Mason & Co. or its affiliates (since 2006); formerly, Director of Global Compliance at Legg Mason, Inc. (2006 to 2020); Managing Director of Compliance of Legg Mason & Co. (2005 to 2020) |
| |
Susan Kerr
Franklin Templeton
620 Eighth Avenue, 47th Floor, New York, NY 10018 | | |
| |
| Year of birth | | 1949 |
| Position(s) with Trust | | Chief Anti-Money Laundering Compliance Officer |
| Term of office1 and length of time served2 | | Since 2013 |
| Principal occupation(s) during the past five years | | Senior Compliance Analyst, Franklin Templeton (since 2020); Chief Anti-Money Laundering Compliance Officer of certain funds associated with Legg Mason & Co. or its affiliates (since 2013) and Anti-Money Laundering Compliance Officer (since 2012), Senior Compliance Officer (since 2011) and Assistant Vice President (since 2010) of Franklin Distributors, LLC; formerly, Assistant Vice President of Legg Mason & Co. (2010 to 2020) |
| | | | |
58 | | | | BrandywineGLOBAL — Global High Yield Fund |
| | |
| Additional Officers (cont’d) | | |
| |
Jenna Bailey
Franklin Templeton 100 First Stamford Place, 5th Floor, Stamford, CT 06902 | | |
| |
| Year of birth | | 1978 |
| Position(s) with Trust | | Identity Theft Prevention Officer |
| Term of office1 and length of time served2 | | Since 2015 |
| Principal occupation(s) during the past five years | | Senior Compliance Analyst of Franklin Templeton (since 2020); Identity Theft Prevention Officer of certain funds associated with Legg Mason & Co. or its affiliates (since 2015); formerly, Compliance Officer of Legg Mason & Co. (2013 to 2020); Assistant Vice President of Legg Mason & Co. (2011 to 2020) |
| |
Marc A. De Oliveira
Franklin Templeton 100 First Stamford Place, 6th Floor, Stamford, CT 06902 | | |
| |
| Year of birth | | 1971 |
| Position(s) with Trust | | Secretary and Chief Legal Officer |
| Term of office1 and length of time served2 | | Since 2020 |
| Principal occupation(s) during the past five years | | Associate General Counsel of Franklin Templeton (since 2020); Assistant Secretary of certain funds associated with Legg Mason & Co. or its affiliates (since 2006); formerly, Managing Director (2016 to 2020) and Associate General Counsel of Legg Mason & Co. (2005 to 2020) |
| |
Thomas C. Mandia Franklin Templeton
100 First Stamford Place, 6th Floor, Stamford, CT 06902 | | |
| |
| Year of birth | | 1962 |
| Position(s) with Trust | | Senior Vice President |
| Term of office1 and length of time served2 | | Since 2020 |
| Principal occupation(s) during the past five years | | Senior Associate General Counsel of Franklin Templeton (since 2020); Secretary of LMPFA (since 2006); Assistant Secretary of certain funds associated with Legg Mason & Co. or its affiliates (since 2006); Secretary of LM Asset Services, LLC (“LMAS”) (since 2002) and Legg Mason Fund Asset Management, Inc. (“LMFAM”) (since 2013) (formerly registered investment advisers); formerly, Managing Director and Deputy General Counsel of Legg Mason & Co. (2005 to 2020) |
| | | | | | |
| BrandywineGLOBAL — Global High Yield Fund | | | | | 59 | |
Additional information (unaudited) (cont’d)
Information about Trustees and Officers
| | |
| Additional Officers (cont’d) | | |
| |
Christopher Berarducci
Franklin Templeton 620 Eighth Avenue, 47th Floor, New York, NY 10018 | | |
| |
| Year of birth | | 1974 |
| Position(s) with Trust | | Treasurer and Principal Financial Officer |
| Term of office1 and length of time served2 | | Since 2014 and 2019 |
| Principal occupation(s) during the past five years | | Vice President, Fund Administration and Reporting, Franklin Templeton (since 2020); Treasurer (since 2010) and Principal Financial Officer (since 2019) of certain funds associated with Legg Mason & Co. or its affiliates; formerly, Managing Director (2020), Director (2015 to 2020), and Vice President (2011 to 2015) of Legg Mason & Co. |
| |
Jeanne M. Kelly
Franklin Templeton 620 Eighth Avenue, 47th Floor, New York, NY 10018 | | |
| |
| Year of birth | | 1951 |
| Position(s) with Trust | | Senior Vice President |
| Term of office1 and length of time served2 | | Since 2007 |
| Principal occupation(s) during the past five years | | U.S. Fund Board Team Manager, Franklin Templeton (since 2020); Senior Vice President of certain funds associated with Legg Mason & Co. or its affiliates (since 2007); Senior Vice President of LMPFA (since 2006); President and Chief Executive Officer of LMAS and LMFAM (since 2015); formerly, Managing Director of Legg Mason & Co. (2005 to 2020); Senior Vice President of LMFAM (2013 to 2015) |
| † | Trustees who are not “interested persons” of the Fund within the meaning of Section 2(a)(19) of the Investment Company Act of 1940, as amended (the “1940 Act”). |
| * | Effective July 1, 2021, Ms. Duersten became Chair. |
| 1 | Each Trustee and officer serves until his or her respective successor has been duly elected and qualified or until his or her earlier death, resignation, retirement or removal. |
| 2 | Indicates the earliest year in which the Trustee became a board member for a fund in the Legg Mason fund complex or the officer took such office. |
| 3 | Ms. Trust is an “interested person” of the Fund, as defined in the 1940 Act, because of her position with LMPFA and/or certain of its affiliates. |
| | | | |
60 | | | | BrandywineGLOBAL — Global High Yield Fund |
Important tax information (unaudited)
By mid-February, tax information related to a shareholder’s proportionate share of distributions paid during the preceding calendar year will be received, if applicable. Please also refer to www.franklintempleton.com for per share tax information related to any distributions paid during the preceding calendar year. Shareholders are advised to consult with their tax advisors for further information on the treatment of these amounts on their tax returns.
The following tax information for the Fund is required to be furnished to shareholders with respect to income earned and distributions paid during its fiscal year.
The Fund hereby reports the following amounts, or if subsequently determined to be different, the maximum allowable amounts, for the fiscal year ended September 30, 2021:
| | | | |
| | | Pursuant to: | | Amount Reported |
| Interest-Related Dividends | | §871(k)(1)(C) | | $987,985 |
| Section 163(j) Interest Dividends | | §163(j) | | $2,167,216 |
| | | | | | |
| BrandywineGLOBAL — Global High Yield Fund | | | | | 61 | |
BrandywineGLOBAL —
Global High Yield Fund
Trustees*
Paul R. Ades
Andrew L. Breech
Althea L. Duersten**
Chair
Stephen R. Gross
Susan M. Heilbron
Howard J. Johnson
Arnold L. Lehman
Robin J. W. Masters
Jerome H. Miller
Ken Miller
G. Peter O’Brien
Thomas F. Schlafly
Jane Trust
| * | During a June 15, 2021 special meeting of shareholders, a new group of Trustees were elected to oversee the mutual funds of Legg Mason Global Asset Management Trust, Legg Mason Partners Investment Trust (prior to September 1, 2021, known as Legg Mason Partners Equity Trust) and Legg Mason Partners Variable Equity Trust, effective July 1, 2021. |
| ** | Effective July 1, 2021, Ms. Duersten became Chair. |
Investment manager
Legg Mason Partners Fund Advisor, LLC
Subadviser
Brandywine Global Investment
Management, LLC
Distributor
Franklin Distributors, LLC†
Custodian
The Bank of New York Mellon
† Effective July 7, 2021, Legg Mason Investor Services, LLC was renamed Franklin Distributors, LLC.
Transfer agent
BNY Mellon Investment
Servicing (US) Inc.
4400 Computer Drive
Westborough, MA 01581
Independent registered public accounting firm
PricewaterhouseCoopers LLP
Baltimore, MD
BrandywineGLOBAL — Global High Yield Fund
The Fund is a separate investment series of Legg Mason Global Asset Management Trust, a Maryland statutory trust.
BrandywineGLOBAL — Global High Yield Fund
Legg Mason Funds
620 Eighth Avenue, 47th Floor
New York, NY 10018
The Fund files its complete schedule of portfolio holdings with the Securities and Exchange Commission (“SEC”) for the first and third quarters of each fiscal year as an exhibit to its reports on Form N-PORT. The Fund’s Forms N-PORT are available on the SEC’s website at www.sec.gov. To obtain information on Form N-PORT, shareholders can call the Fund at 1-877-721-1926.
Information on how the Fund voted proxies relating to portfolio securities during the prior 12-month period ended June 30th of each year and a description of the policies and procedures that the Fund uses to determine how to vote proxies related to portfolio transactions are available (1) without charge, upon request, by calling the Fund at 1-877-721-1926, (2) at www.franklintempleton.com and (3) on the SEC’s website at www.sec.gov.
This report is submitted for the general information of the shareholders of BrandywineGLOBAL — Global High Yield Fund. This report is not authorized for distribution to prospective investors in the Fund unless preceded or accompanied by a current prospectus.
Investors should consider the Fund’s investment objectives, risks, charges and expenses carefully before investing. The prospectus contains this and other important information about the Fund. Please read the prospectus carefully before investing.
www.franklintempleton.com
© 2021 Franklin Distributors, LLC, Member FINRA/SIPC. All rights reserved.
Legg Mason Funds Privacy and Security Notice
Your Privacy and the Security of Your Personal Information is Very Important to the Legg Mason Funds
This Privacy and Security Notice (the “Privacy Notice”) addresses the Legg Mason Funds privacy and data protection practices with respect to nonpublic personal information the Funds receive. The Legg Mason Funds include any funds sold by the Funds distributor, Franklin Distributors, LLC, as well as Legg Mason-sponsored closed-end funds. The provisions of this Privacy Notice apply to your information both while you are a shareholder and after you are no longer invested with the Funds.
The Type of Nonpublic Personal Information the Funds Collect About You
The Funds collect and maintain nonpublic personal information about you in connection with your shareholder account. Such information may include, but is not limited to:
| • | | Personal information included on applications or other forms; |
| • | | Account balances, transactions, and mutual fund holdings and positions; |
| • | | Bank account information, legal documents, and identity verification documentation; |
| • | | Online account access user IDs, passwords, security challenge question responses; and |
| • | | Information received from consumer reporting agencies regarding credit history and creditworthiness (such as the amount of an individual’s total debt, payment history, etc.). |
How the Funds Use Nonpublic Personal Information About You
The Funds do not sell or share your nonpublic personal information with third parties or with affiliates for their marketing purposes, or with other financial institutions or affiliates for joint marketing purposes, unless you have authorized the Funds to do so. The Funds do not disclose any nonpublic personal information about you except as may be required to perform transactions or services you have authorized or as permitted or required by law.
The Funds may disclose information about you to:
| • | | Employees, agents, and affiliates on a “need to know” basis to enable the Funds to conduct ordinary business, or to comply with obligations to government regulators; |
| • | | Service providers, including the Funds’ affiliates, who assist the Funds as part of the ordinary course of business (such as printing, mailing services, or processing or servicing your account with us) or otherwise perform services on the Funds’ behalf, including companies that may perform statistical analysis, market research and marketing services solely for the Funds; |
| • | | Permit access to transfer, whether in the United States or countries outside of the United States to such Funds’ employees, agents and affiliates and service providers as required to enable the Funds to conduct ordinary business, or to comply with obligations to government regulators; |
| • | | The Funds’ representatives such as legal counsel, accountants and auditors to enable the Funds to conduct ordinary business, or to comply with obligations to government regulators; |
| • | | Fiduciaries or representatives acting on your behalf, such as an IRA custodian or trustee of a grantor trust. |
|
| NOT PART OF THE ANNUAL REPORT |
Legg Mason Funds Privacy and Security Notice (cont’d)
Except as otherwise permitted by applicable law, companies acting on the Funds’ behalf, including those outside the United States, are contractually obligated to keep nonpublic personal information the Funds provide to them confidential and to use the information the Funds share only to provide the services the Funds ask them to perform. The Funds may disclose nonpublic personal information about you when necessary to enforce their rights or protect against fraud, or as permitted or required by applicable law, such as in connection with a law enforcement or regulatory request, subpoena, or similar legal process. In the event of a corporate action or in the event a Fund service provider changes, the Funds may be required to disclose your nonpublic personal information to third parties. While it is the Funds’ practice to obtain protections for disclosed information in these types of transactions, the Funds cannot guarantee their privacy policy will remain unchanged.
Keeping You Informed of the Funds’ Privacy and Security Practices
The Funds will notify you annually of their privacy policy as required by federal law. While the Funds reserve the right to modify this policy at any time they will notify you promptly if this privacy policy changes.
The Funds’ Security Practices
The Funds maintain appropriate physical, electronic and procedural safeguards designed to guard your nonpublic personal information. The Funds’ internal data security policies restrict access to your nonpublic personal information to authorized employees, who may use your nonpublic personal information for Fund business purposes only.
Although the Funds strive to protect your nonpublic personal information, they cannot ensure or warrant the security of any information you provide or transmit to them, and you do so at your own risk. In the event of a breach of the confidentiality or security of your nonpublic personal information, the Funds will attempt to notify you as necessary, so you can take appropriate protective steps. If you have consented to the Funds using electronic communications or electronic delivery of statements, they may notify you under such circumstances using the most current email address you have on record with them.
In order for the Funds to provide effective service to you, keeping your account information accurate is very important. If you believe that your account information is incomplete, not accurate or not current, if you have questions about the Funds’ privacy practices, or our use of your nonpublic personal information, write the Funds using the contact information on your account statements, email the Funds by clicking on the Contact Us section of the Funds’ website at www.franklintempleton.com, or contact the Fund at 1-877-721-1926.
Revised April 2018
Legg Mason California Consumer Privacy Act Policy
Although much of the personal information we collect is “nonpublic personal information” subject to federal law, residents of California may, in certain circumstances, have additional rights under the California Consumer Privacy Act (“CCPA”). For example, if you are a broker,
|
| NOT PART OF THE ANNUAL REPORT |
Legg Mason Funds Privacy and Security Notice (cont’d)
dealer, agent, fiduciary, or representative acting by or on behalf of, or for, the account of any other person(s) or household, or a financial advisor, or if you have otherwise provided personal information to us separate from the relationship we have with personal investors, the provisions of this Privacy Policy apply to your personal information (as defined by the CCPA).
| • | | In addition to the provisions of the Legg Mason Funds Security and Privacy Notice, you may have the right to know the categories and specific pieces of personal information we have collected about you. |
| • | | You also have the right to request the deletion of the personal information collected or maintained by the Funds. |
If you wish to exercise any of the rights you have in respect of your personal information, you should advise the Funds by contacting them as set forth below. The rights noted above are subject to our other legal and regulatory obligations and any exemptions under the CCPA. You may designate an authorized agent to make a rights request on your behalf, subject to the identification process described below. We do not discriminate based on requests for information related to our use of your personal information, and you have the right not to receive discriminatory treatment related to the exercise of your privacy rights.
We may request information from you in order to verify your identity or authority in making such a request. If you have appointed an authorized agent to make a request on your behalf, or you are an authorized agent making such a request (such as a power of attorney or other written permission), this process may include providing a password/passcode, a copy of government issued identification, affidavit or other applicable documentation, i.e. written permission. We may require you to verify your identity directly even when using an authorized agent, unless a power of attorney has been provided. We reserve the right to deny a request submitted by an agent if suitable and appropriate proof is not provided.
For the 12-month period prior to the date of this Privacy Policy, the Legg Mason Funds have not sold any of your personal information; nor do we have any plans to do so in the future.
Contact Information
Address: Data Privacy Officer, 100 International Dr., Baltimore, MD 21202
Email: DataProtectionOfficer@franklintempleton.com
Phone: 1-800-396-4748
Revised October 2020
|
| NOT PART OF THE ANNUAL REPORT |
www.franklintempleton.com
© 2021 Franklin Distributors, LLC, Member FINRA/SIPC. All rights reserved.
BWXX016048 11/21 SR21-4265
The registrant has adopted a code of ethics that applies to the registrant’s principal executive officer, principal financial officer, principal accounting officer or controller.
| ITEM 3. | AUDIT COMMITTEE FINANCIAL EXPERT. |
The Board of Trustees of the registrant has determined that Stephen R. Gross possesses the technical attributes identified in Instruction 2(b) of Item 3 to Form N-CSR to qualify as an “audit committee financial expert,” and has designated Stephen R. Gross as the Audit Committee’s financial expert. Stephen R. Gross is an “independent” Trustees pursuant to paragraph (a)(2) of Item 3 to Form N-CSR.
| ITEM 4. | PRINCIPAL ACCOUNTANT FEES AND SERVICES. |
(a) Audit Fees. The aggregate fees billed in the last two fiscal years ending September 30, 2020 and September 30, 2021 (the “Reporting Periods”) for professional services rendered by the Registrant’s principal accountant (the “Auditor”) for the audit of the Registrant’s annual financial statements, or services that are normally provided by the Auditor in connection with the statutory and regulatory filings or engagements for the Reporting Periods, were $322,330 in September 30, 2020 and $322,330 in September 30, 2021.
(b) Audit-Related Fees. The aggregate fees billed in the Reporting Period for assurance and related services by the Auditor that are reasonably related to the performance of the Registrant’s financial statements were $0 in September 30, 2020 and $0 in September 30, 2021.
(c) Tax Fees. The aggregate fees billed in the Reporting Periods for professional services rendered by the Auditor for tax compliance, tax advice and tax planning (“Tax Services”) were $0 in September 30, 2020 and $80,500 in September 30, 2021. These services consisted of (i) review or preparation of U.S. federal, state, local and excise tax returns; (ii) U.S. federal, state and local tax planning, advice and assistance regarding statutory, regulatory or administrative developments, and (iii) tax advice regarding tax qualification matters and/or treatment of various financial instruments held or proposed to be acquired or held.
There were no fees billed for tax services by to the service affiliates during the Reporting Periods that required pre-approval by the Audit Auditors Committee.
(d) All Other Fees. The aggregate fees for other fees billed in the Reporting Periods for products and services provided by the Auditor were $0 in September 30, 2020 and $0 in September 30, 2021, other than the services reported in paragraphs (a) through (c) of this item for the Legg Mason Global Asset Management Trust.
All Other Fees. There were no other non-audit services rendered by the Auditor to Legg Mason Partners Fund Advisors, LLC (“LMPFA”), and any entity controlling, controlled by or under common control with LMPFA that provided ongoing services to Legg Mason Global Asset Management Trust requiring pre-approval by the Audit Committee in the Reporting Period.
(e) Audit Committee’s pre–approval policies and procedures described in paragraph (c) (7) of Rule 2-01 of Regulation S-X.
(1) The Charter for the Audit Committee (the “Committee”) of the Board of each registered investment company (the “Fund”) advised by LMPFA or one of their affiliates (each, an “Adviser”) requires that the Committee shall approve (a) all audit and permissible non-audit services to be provided to the Fund and (b) all permissible non-audit services to be provided by the Fund’s independent auditors to the Adviser and any Covered Service Providers if the engagement relates directly to the operations and financial reporting of the Fund. The
Committee may implement policies and procedures by which such services are approved other than by the full Committee.
The Committee shall not approve non-audit services that the Committee believes may impair the independence of the auditors. As of the date of the approval of this Audit Committee Charter, permissible non-audit services include any professional services (including tax services), that are not prohibited services as described below, provided to the Fund by the independent auditors, other than those provided to the Fund in connection with an audit or a review of the financial statements of the Fund. Permissible non-audit services may not include: (i) bookkeeping or other services related to the accounting records or financial statements of the Fund; (ii) financial information systems design and implementation; (iii) appraisal or valuation services, fairness opinions or contribution-in-kind reports; (iv) actuarial services; (v) internal audit outsourcing services; (vi) management functions or human resources; (vii) broker or dealer, investment adviser or investment banking services; (viii) legal services and expert services unrelated to the audit; and (ix) any other service the Public Company Accounting Oversight Board determines, by regulation, is impermissible.
Pre-approval by the Committee of any permissible non-audit services is not required so long as: (i) the aggregate amount of all such permissible non-audit services provided to the Fund, the Adviser and any service providers controlling, controlled by or under common control with the Adviser that provide ongoing services to the Fund (“Covered Service Providers”) constitutes not more than 5% of the total amount of revenues paid to the independent auditors during the fiscal year in which the permissible non-audit services are provided to (a) the Fund, (b) the Adviser and (c) any entity controlling, controlled by or under common control with the Adviser that provides ongoing services to the Fund during the fiscal year in which the services are provided that would have to be approved by the Committee; (ii) the permissible non-audit services were not recognized by the Fund at the time of the engagement to be non-audit services; and (iii) such services are promptly brought to the attention of the Committee and approved by the Committee (or its delegate(s)) prior to the completion of the audit.
(2) For the Legg Mason Global Asset Management Trust, the percentage of fees that were approved by the audit committee, with respect to: Audit-Related Fees were 100% and 100% for September 30, 2020 and September 30, 2021; Tax Fees were 100% and 100% for September 30, 2020 and September 30, 2021; and Other Fees were 100% and 100% for September 30, 2020 and September 30, 2021.
(f) N/A
(g) Non-audit fees billed by the Auditor for services rendered to Legg Mason Global Asset Management Trust, LMPFA and any entity controlling, controlled by, or under common control with LMPFA that provides ongoing services to Legg Mason Global Asset Management Trust during the reporting period were $1,105,712 in September 30, 2020 and $1,124,357 in September 30, 2021.
(h) Yes. Legg Mason Global Asset Management Trust’s Audit Committee has considered whether the provision of non-audit services that were rendered to Service Affiliates, which were not pre-approved (not requiring pre-approval), is compatible with maintaining the Accountant’s independence. All services provided by the Auditor to the Legg Mason Global Asset Management Trust or to Service Affiliates, which were required to be pre-approved, were pre-approved as required.
| ITEM 5. | AUDIT COMMITTEE OF LISTED REGISTRANTS. |
a) The independent board members are acting as the registrant’s audit committee as specified in Section 3(a)(58)(B) of the Exchange Act. The Audit Committee consists of the following Board members:
Paul R. Ades
Andrew L. Breech
Althea L. Duersten**
Stephen R. Gross
Susan M. Heilbron
Howard J. Johnson
Arnold L. Lehman
Robin J.W. Masters
Jerome H. Miller
Ken Miller
G. Peter O’Brien
Thomas F. Schlafly
| | * | During a June 15, 2021 special meeting of shareholders, a new group of Trustees were elected to oversee the mutual funds of Legg Mason Global Asset Management Trust, Legg Mason Partners Investment Trust (prior to September 1, 2021, known as Legg Mason Equity Trust) and Legg Mason Partners Variable Equity Trust, effective July 1, 2021. |
| | ** | Effective July 1, 2021, Ms. Duersten became Chair. |
| ITEM 6. | SCHEDULE OF INVESTMENTS. |
Included herein under Item 1.
| ITEM 7. | DISCLOSURE OF PROXY VOTING POLICIES AND PROCEDURES FOR CLOSED-END MANAGEMENT INVESTMENT COMPANIES. |
Not applicable.
| ITEM 8. | PORTFOLIO MANAGERS OF CLOSED-END MANAGEMENT INVESTMENT COMPANIES. |
Not applicable.
| ITEM 9. | PURCHASES OF EQUITY SECURITIES BY CLOSED-END MANAGEMENT INVESTMENT COMPANY AND AFFILIATED PURCHASERS. |
Not applicable.
| ITEM 10. | SUBMISSION OF MATTERS TO A VOTE OF SECURITY HOLDERS. |
Not applicable.
| ITEM 11. | CONTROLS AND PROCEDURES. |
| | (a) | The registrant’s principal executive officer and principal financial officer have concluded that the registrant’s disclosure controls and procedures (as defined in Rule 30a- 3(c) under the Investment Company Act of 1940, as amended (the “1940 Act”)) are effective as of a date within 90 days of the filing date of this report that includes the disclosure required by this paragraph, based on their evaluation of the disclosure controls and procedures required by Rule 30a-3(b) under the 1940 Act and 15d-15(b) under the Securities Exchange Act of 1934. |
| | (b) | There were no changes in the registrant’s internal control over financial reporting (as defined in Rule 30a-3(d) under the 1940 Act) that occurred during the second fiscal |
| | quarter of the period covered by this report that have materially affected, or are likely to materially affect the registrant’s internal control over financial reporting. |
| ITEM 12. | DISCLOSURE OF SECURITIES LENDING ACTIVITIES FOR CLOSED-END MANAGEMENT INVESTMENT COMPANIES. |
Not applicable.
(a) (1) Code of Ethics attached hereto.
Exhibit 99.CODE ETH
(a) (2) Certifications pursuant to section 302 of the Sarbanes-Oxley Act of 2002 attached hereto.
Exhibit 99.CERT
(b) Certifications pursuant to Section 906 of the Sarbanes-Oxley Act of 2002 attached hereto.
Exhibit 99.906CERT
SIGNATURES
Pursuant to the requirements of the Securities Exchange Act of 1934 and the Investment Company Act of 1940, the registrant has duly caused this Report to be signed on its behalf by the undersigned, there unto duly authorized.
Legg Mason Global Asset Management Trust
| | |
| By: | | /s/ Jane Trust |
| | Jane Trust |
| | Chief Executive Officer |
| |
| Date: | | November 24, 2021 |
Pursuant to the requirements of the Securities Exchange Act of 1934 and the Investment Company Act of 1940, this report has been signed below by the following persons on behalf of the registrant and in the capacities and on the dates indicated.
| | |
| By: | | /s/ Jane Trust |
| | Jane Trust |
| | Chief Executive Officer |
| |
| Date: | | November 24, 2021 |
| | |
| By: | | /s/ Christopher Berarducci |
| | Christopher Berarducci |
| | Principal Financial Officer |
| |
| Date: | | November 24, 2021 |