UNITED STATES
SECURITIES AND EXCHANGE COMMISSION
Washington, D.C. 20549
FORM N-CSR
CERTIFIED SHAREHOLDER REPORT OF REGISTERED
MANAGEMENT INVESTMENT COMPANIES
Investment Company Act file number 811-22338
Legg Mason Global Asset Management Trust
(Exact name of registrant as specified in charter)
100 International Drive, Baltimore, MD, 21202
(Address of principal executive offices) (Zip code)
Marc A. De Oliveira
Franklin Templeton
100 First Stamford Place
Stamford, CT 06902
(Name and address of agent for service)
Registrant’s telephone number, including area code: 877-6LM-FUND/656-3863
Date of fiscal year end: December 31
Date of reporting period: December 31, 2022
| ITEM 1. | REPORT TO STOCKHOLDERS |
The Annual Report to Stockholders is filed herewith.

| | |
| Annual Report | | December 31, 2022 |
BrandywineGLOBAL —
GLOBAL OPPORTUNITIES
BOND FUND

|
| INVESTMENT PRODUCTS: NOT FDIC INSURED • NO BANK GUARANTEE • MAY LOSE VALUE |
Fund objective
The Fund’s investment objective is to maximize total return consisting of income and capital appreciation.
Letter from the president

Dear Shareholder,
We are pleased to provide the annual report of BrandywineGLOBAL — Global Opportunities Bond Fund for the twelve-month reporting period ended December 31, 2022. Please read on for a detailed look at prevailing economic and market conditions during the Fund’s reporting period and to learn how those conditions have affected Fund performance.
As always, we remain committed to providing you with excellent service and a full spectrum of investment choices. We also remain committed to supplementing the support you receive from your financial advisor. One way we accomplish this is through our website, www.franklintempleton.com. Here you can gain immediate access to market and investment information, including:
| • | | Fund prices and performance, |
| • | | Market insights and commentaries from our portfolio managers, and |
| • | | A host of educational resources. |
We look forward to helping you meet your financial goals.
Sincerely,

Jane Trust, CFA
President and Chief Executive Officer
January 31, 2023
| | |
| II | | BrandywineGLOBAL — Global Opportunities Bond Fund |
Fund overview
Q. What is the Fund’s investment strategy?
A. The Fund seeks to maximize total return consisting of income and capital appreciation. Under normal market conditions, the Fund will invest at least 80% of its net assets in fixed income securities of issuers located in developed market countries. Any country that, at the time of purchase, has a sovereign debt rating of A- or better from at least one nationally recognized statistical ratings organization (“NRSRO”) or is included in the FTSE World Government Bond Indexi is considered a developed country. The Fund will invest in both investment grade and below investment grade fixed income securities, and intends to invest less than 35% of its net assets in below investment grade fixed income securities (commonly known as “high yield debt” or “junk bonds”). We intend to maintain an average weighted portfolio quality of A- or better, whether composed of rated securities or unrated securities that we deemed to be of comparable quality. The Fund’s investments may include securities of sovereign governments and supranational organizations. The Fund may invest up to 25% of its net assets in convertible debt securities.
The Fund may invest in currency forwards in order to hedge its currency exposure in bond positions or to gain currency exposure. In addition, the Fund may engage in a variety of transactions using derivatives such as bond futures, interest rate futures, swaps, credit default swaps and options. The Fund may use derivatives to enhance total return, to hedge against fluctuations in securities prices, interest rates or currency exchange rates, to change the effective duration of its portfolio, to manage certain investment risks and/or as a substitute for the purchase or sale of securities or currencies. These investments may be significant at times. Although we have the flexibility to use these instruments for hedging purposes, we may choose not to for a variety of reasons, even under very volatile market conditions. Derivative instruments are taken into account when determining compliance with the Fund’s 80% investment policy. The Fund will normally hold a portfolio of fixed income securities of issuers located in a minimum of six countries.
Although the Fund invests primarily in issuers in developed market countries as defined above, the Fund may also invest in issuers in emerging market countries, and some of the countries that the Fund considers to be developed may still have certain economic or other characteristics that are considered developing and are similar to emerging market countries.
The Fund may invest in securities of any maturity. The weighted average effective duration of the Fund’s portfolio, including derivatives, is expected to range from one to ten years, but for individual markets may be greater or lesser depending on our view of the prospects for lower interest rates and potential capital gains.
We follow a value approach to investing and, therefore, seek to identify relative value in the global bond markets. We define as undervalued, those markets where we believe real interest rates are high and the currency is undervalued with the potential to appreciate. We will focus investments in those undervalued markets where we believe cyclical business conditions as well as secular economic and political trends provide the best opportunity for declining interest rates and a return to lower real rates over time.
| | | | | | |
| BrandywineGLOBAL — Global Opportunities Bond Fund 2022 Annual Report | | | | | 1 | |
Fund overview (cont’d)
Q. What were the overall market conditions during the Fund’s reporting period?
A. The global fixed income market generated a negative total return during the twelve-month reporting period ended December 31, 2022. Global yields moved sharply higher, which negatively impacted fixed income assets. Rising yields were driven by a number of factors, including elevated inflation that prompted most global central banks to aggressively raise interest rates. The market also experienced periods of volatility given the repercussions from the war in Ukraine, the impact from the COVID-19 pandemic and its variants, the weakening global economy, and concerns over the trajectory for corporate profits. Against this backdrop, most spread sectors (non-U.S. Treasuries) posted double-digit declines over the reporting period.
On the monetary policy front, the U.S. Federal Reserve Board (the “Fed”) initially characterized surging inflation as being transitory. This proved to be incorrect, as supply chain issues persisted and the war in Ukraine added fuel to the inflation fire. This left the central bank no choice but to abruptly reverse course and aggressively raise rates in an attempt to rein in a four-decade high in inflation, even if this could trigger a recession. The Fed raised rates seven times and a total of 4.25% in 2022, the most since 1980. While the central bank raised rates 50 basis points in December, versus 75 basis points hikes at its previous four meetings, the Fed remained hawkish and expects to make additional rate hikes in 2023. Both the European Central Bank and the Bank of England also aggressively raised rates, by 250 basis points and 325 basis points, respectively, in 2022. At the end of the reporting period, rates in both regions were the highest since 2008. The Bank of Japan kept rates on hold during the reporting period, but in December the central bank surprised the market by raising the target range for the ten-year bond from 0.25% to 0.50%. The market interpreted this as being the first step toward normalizing its ultra-easy monetary policy. Elsewhere, emerging market central banks generally raised rates as well in 2022 given high inflation, causing their yields to move higher and dragging down their bond markets.
Looking at the currency market, the major story in 2022 was the strength of the U.S. dollar. The greenback appreciated roughly 17% over the first nine months of the reporting period given the Fed’s rate hikes, the resilient U.S. economy, and Fed Chair Jerome Powell’s vow to continue tightening monetary policy “until the job is done.” However, after reaching a twenty-one-year high in late September 2022, the U.S. dollar gave back around half of its gain in the fourth quarter. This turnaround was partially driven by concerns the economy could fall into a recession. Still, the U.S. dollar gained 8.2% in 2022, its strongest return since 2014. For the year as a whole, most developed and emerging market currencies fell sharply versus the greenback.
All told, the Bloomberg Global Aggregate Bond Indexii returned -16.25% during the twelve months ended December 31, 2022. Investors who took on additional risk also generated poor results over the reporting period. Global high yield corporate bonds, as measured by the Bloomberg Global High Yield Index (USD Hedged)iii, returned -11.05%. Meanwhile, the JPMorgan Emerging Markets Bond Index Globaliv returned -16.45%. Within the currency markets, the U.S. dollar generally rose against most other currencies.
| | | | |
| 2 | | | | BrandywineGLOBAL — Global Opportunities Bond Fund 2022 Annual Report |
Q. How did we respond to these changing market conditions?
A. The global themes of 2022 were high inflation and extreme tightening of monetary conditions. We increased our U.S. dollar weighting, from a large underweight to slightly underweight the FTSE World Government Bond Index, as we believed the U.S. dollar’s strength was justified given the deteriorating economic landscape. In terms of the U.S. dollar, the currency was in high demand as the market’s sentiment quickly turned from risk-on to risk-adverse. Factors contributing to the U.S. dollar’s historic strength were a global growth in investor savings, relatively tight U.S. central bank monetary policy, and shifting investor demand towards U.S. assets. Other core developed market currencies, like the euro and yen, were underweighted, while we remained slightly overweight select emerging market currencies, like Chilean peso and Brazilian real. The yen underweight was reversed in the third quarter of the reporting period, as the currency hit historical lows and inflation pressure questioned the Bank of Japan’s yield curve control policy.
The Fund increased safety in the portfolio as inflation remained elevated. Total duration was underweight the benchmark until midway through the reporting period, which was advantageous in a period of unexpected yield acceleration. We saw an opportunity to overweight duration during the third quarter of 2022 because yields had climbed steadily and a soft economic landing in the U.S. was still a possibility. Our duration was predominantly long-dated U.S. Treasuries and select emerging market countries with attractive valuations and fundamentals.
Mortgage-backed securities (“MBS”), primarily composed of U.S. residential agency passthroughs, were added during the third and fourth quarter of 2022 as mortgage rates breached 7%. Despite pressures in the housing market, the pent-up demand for homes, as well as most American mortgages being fixed, kept housing market fundamentals solid. MBS was attractively valued relative to corporate credit.
The Fund used developed market sovereign bond futures to help manage its bond exposure. The use of these instruments detracted from performance. Currency forwards, which were used to help manage the Fund’s currency exposures, were also a headwind for results.
Performance review
For the twelve months ended December 31, 2022, Class IS shares of BrandywineGLOBAL — Global Opportunities Bond Fund returned -15.67%. The Fund’s unmanaged benchmark, the FTSE World Government Bond Index (USD) (Unhedged), returned -18.26% for the same period. The Lipper Global Income Funds Category Averagev returned -13.50% over the same time frame.
| | | | | | |
| BrandywineGLOBAL — Global Opportunities Bond Fund 2022 Annual Report | | | | | 3 | |
Fund overview (cont’d)
| | | | | | | | |
| Performance Snapshot as of December 31, 2022 (unaudited) | |
| (excluding sales charges) | | 6 months | | | 12 months | |
| BrandywineGLOBAL — Global Opportunities Bond Fund: | | | | | | | | |
Class A | | | -2.45 | % | | | -16.03 | % |
Class C | | | -2.77 | % | | | -16.60 | % |
Class C11 | | | -2.57 | % | | | -16.36 | %2 |
Class FI | | | -2.49 | % | | | -16.05 | % |
Class R | | | -2.59 | % | | | -16.19 | % |
Class I | | | -2.31 | % | | | -15.80 | % |
Class IS | | | -2.23 | % | | | -15.67 | % |
| FTSE World Government Bond Index (USD) (Unhedged) | | | -4.08 | % | | | -18.26 | % |
| Lipper Global Income Funds Category Average | | | -1.20 | % | | | -13.50 | % |
The performance shown represents past performance. Past performance is no guarantee of future results and current performance may be higher or lower than the performance shown above. Principal value, investment returns and yields will fluctuate and investors’ shares, when redeemed, may be worth more or less than their original cost. To obtain performance data current to the most recent month-end, please visit our website at www.franklintempleton.com.
All share class returns assume the reinvestment of all distributions at net asset value and the deduction of all Fund expenses. Returns have not been adjusted to include sales charges that may apply or the deduction of taxes that a shareholder would pay on Fund distributions. If sales charges were reflected, the performance quoted would be lower. Performance figures for periods shorter than one year represent cumulative figures and are not annualized.
Fund performance figures reflect fee waivers and/or expense reimbursements, without which the performance would have been lower.
The 30-Day SEC Yields for the period ended December 31, 2022 for Class A, Class C, Class C1, Class FI, Class R, Class I and Class IS shares were 4.64%, 4.34%, 5.30%, 4.73%, 4.57%, 5.14% and 5.29%, respectively. Absent fee waivers and/or expense reimbursements, the 30-Day SEC Yield for Class R shares would have been 4.50%. The 30-Day SEC Yield, calculated pursuant to the standard SEC formula, is based on the Fund’s investments over an annualized trailing 30-day period, and not on the distributions paid by the Fund, which may differ.
|
| Total Annual Operating Expenses (unaudited) |
As of the Fund’s current prospectus dated May 1, 2022, the gross total annual fund operating expense ratios for Class A, Class C, Class C1, Class FI, Class R, Class I and Class IS shares were 1.00%, 1.69%, 1.45%, 0.97%, 1.30%, 0.66% and 0.56%, respectively.
Actual expenses may be higher. For example, expenses may be higher than those shown if average net assets decrease. Net assets are more likely to decrease and Fund expense ratios are more likely to increase when markets are volatile.
| 1 | Class C1 shares are not available for purchase by new or existing investors (except for certain retirement plan programs). Class C1 shares continue to be available for dividend reinvestment and incoming exchanges. |
| 2 | Total return information is based on net asset values calculated for shareholder transactions. Certain adjustments were made to the net assets of the Fund at December 31, 2022 for financial reporting purposes. Accordingly, adjusted total returns have been disclosed in the Financial Highlights and differ from those reported here. |
| | | | |
| 4 | | | | BrandywineGLOBAL — Global Opportunities Bond Fund 2022 Annual Report |
As a result of expense limitation arrangements, the ratio of total annual fund operating expenses, other than interest, brokerage commissions, dividend expense on short sales, taxes, extraordinary expenses and acquired fund fees and expenses, to average net assets will not exceed 1.00% for Class A shares, 1.75% for Class C shares, 1.45% for Class C1 shares, 1.00% for Class FI shares, 1.25% for Class R shares, 0.75% for Class I shares and 0.65% for Class IS shares. In addition, the ratio of total annual fund operating expenses for Class IS shares will not exceed the ratio of total annual fund operating expenses for Class I shares. These expense limitation arrangements cannot be terminated prior to December 31, 2024 without the Board of Trustees’ consent. In addition, the manager has agreed to waive the Fund’s management fee to an extent sufficient to offset the net management fee payable in connection with any investment in an affiliated money market fund. This management fee waiver is not subject to the recapture provision discussed below.
The manager is permitted to recapture amounts waived and/or reimbursed to a class within three years after the fiscal year in which the manager earned the fee or incurred the expense if the class’ total annual fund operating expenses have fallen to a level below the expense limitation (“expense cap”) in effect at the time the fees were earned or the expenses incurred. In no case will the manager recapture any amount that would result, on any particular business day of the Fund, in the class’ total annual fund operating expenses exceeding the expense cap or any other lower limit then in effect.
Q. What were the leading contributors to performance?
A. The Fed’s aggressive monetary tightening put upward pressure on developed market yields as other global central banks raced to stymie inflation. As a result, the Fund’s underweight of select developed market duration, like Germany and the U.K., was additive on a relative basis. Additionally, the Fund’s overweight yen position, which was initiated during the third quarter of 2022, was accretive as the currency bounced from its historical lows.
Overweight local Brazilian government bonds resulted in strong relative performance against the benchmark, from both a currency and bond perspective, as the country rallied from its diverse mix of commodity exports. An overweight Mexican peso position helped as the Latin American country was one of few currencies to outperform the U.S. dollar. Mexico remains a fortunate beneficiary from the U.S. – China trade war because of its competitiveness from low wages, proximity to the U.S., and strong diversified manufacturing sector anchored by the automotive industry.
Q. What were the leading detractors from performance?
A. Our U.S. dollar underweight detracted from performance as the currency remained in high demand given the heightened macroeconomic uncertainty. We believe the U.S. dollar has likely found a top and is expensively valued against historical valuations. An overweight of emerging market currency in peripheral Europe, like the Polish zloty and Hungarian forint, detracted from performance as the outbreak of war in Ukraine sent the currencies lower.
The largest detractor among our bond allocations was an overweight in South Korean sovereign bonds. The developed nation was adversely affected by persistent inflation and the growth slowdown from China’s zero COVID-19 policy. An overweight in Mexican bonos also detracted from performance as yields rose precipitously in the country.
| | | | | | |
| BrandywineGLOBAL — Global Opportunities Bond Fund 2022 Annual Report | | | | | 5 | |
Fund overview (cont’d)
Thank you for your investment in BrandywineGLOBAL — Global Opportunities Bond Fund. As always, we appreciate that you have chosen us to manage your assets and we remain focused on achieving the Fund’s investment goals.
Sincerely,

David F. Hoffman, CFA
Portfolio Manager
Brandywine Global Investment Management, LLC

John (“Jack”) P. McIntyre, CFA
Portfolio Manager
Brandywine Global Investment Management, LLC

Anujeet Sareen, CFA
Portfolio Manager
Brandywine Global Investment Management, LLC

Brian L. Kloss, JD, CPA
Portfolio Manager
Brandywine Global Investment Management, LLC

Tracy Chen, CFA, CAIA
Portfolio Manager
Brandywine Global Investment Management, LLC
January 13, 2023
RISKS: Foreign securities involve special risks such as currency fluctuations and social, political, and economic uncertainties, which could increase volatility. These risks are magnified in emerging markets. Emerging market countries tend to have economic, political, and legal systems that are less developed and are less stable than those of more developed countries.
| | | | |
| 6 | | | | BrandywineGLOBAL — Global Opportunities Bond Fund 2022 Annual Report |
Sovereign government and supranational debt involve many of the risks of foreign and emerging markets investments as well as the risk of debt moratorium, repudiation or renegotiation and the Fund may be unable to enforce its rights against the issuers. Fixed income securities involve interest rate, credit, inflation, and reinvestment risks. The Fund’s share price may decline as interest rates rise. Below investment grade debt securities (commonly known as “high yield debt” or “junk bonds”) involve greater volatility than higher-rated securities. To the extent that the Fund invests in asset- and mortgage-backed securities, its exposure to prepayment and extension risks may be greater than investment in other fixed income securities. The Fund may engage in derivative transactions, which involve special risks and costs and may increase losses and have a potentially large impact on Fund performance. As a non-diversified fund, the Fund is permitted to invest a larger percentage of its assets in a smaller number of issuers than a diversified fund, which may magnify the Fund’s losses from events affecting a particular issuer. Please see the Fund’s prospectus for a more complete discussion of these and other risks and the Fund’s investment strategies.
All investments are subject to risk including the possible loss of principal. Past performance is no guarantee of future results. All index performance reflects no deduction for fees, expenses or taxes. Please note that an investor cannot invest directly in an index.
The information provided is not intended to be a forecast of future events, a guarantee of future results or investment advice. Views expressed may differ from those of the firm as a whole.
| i | The FTSE World Government Bond Index (USD) (Unhedged) measures the performance of fixed-rate, local currency, investment-grade sovereign bonds and is stated in U.S. dollar terms. |
| ii | The Bloomberg Global Aggregate Bond Index measures the performance of the global investment-grade, fixed-rate bond markets. The benchmark includes government, government-related and corporate bonds, as well as asset-backed, mortgage-backed and commercial mortgage-backed securities from both developed and emerging markets issuers. |
| iii | The Bloomberg Global High Yield Index (USD Hedged) provides a broad-based measure of the global high-yield fixed income markets, representing the union of the U.S. High-Yield, Pan-European High-Yield, U.S. Emerging Markets High-Yield, CMBS High-Yield and Pan European Emerging Markets High-Yield Indices. |
| iv | The JPMorgan Emerging Markets Bond Index Global tracks total returns for U.S. dollar denominated debt instruments issued by emerging market sovereign and quasi-sovereign entities: Brady bonds, loans, Eurobonds and local market instruments. |
| v | Lipper, Inc., a wholly-owned subsidiary of Refinitiv, provides independent insight on global collective investments.Returns are based on the period ended December 31, 2022, including the reinvestment of all distributions, including returns of capital, if any, calculated among the 249 funds for the six-month period and among the 243 funds for the twelve-month period in the Fund’s Lipper category, and excluding sales charges, if any. |
| | | | | | |
| BrandywineGLOBAL — Global Opportunities Bond Fund 2022 Annual Report | | | | | 7 | |
Fund at a glance† (unaudited)
Investment breakdown (%) as a percent of total investments
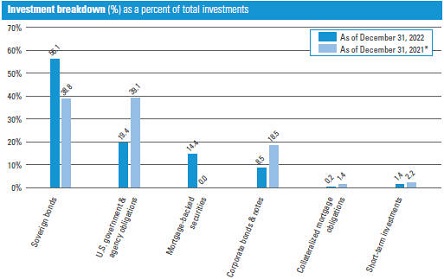
| † | The bar graph above represents the composition of the Fund’s investments as of December 31, 2022 and December 31, 2021 and does not include derivatives, such as futures contracts and forward foreign currency contracts. The Fund is actively managed. As a result, the composition of the Fund’s investments is subject to change at any time. |
| * | Prior year percentages have been restated to reflect current classifications. |
| | | | |
| 8 | | | | BrandywineGLOBAL — Global Opportunities Bond Fund 2022 Annual Report |
Fund expenses (unaudited)
Example
As a shareholder of the Fund, you may incur two types of costs: (1) transaction costs, including front-end and back-end sales charges (loads) on purchase payments; and (2) ongoing costs, including management fees; service and/or distribution (12b-1) fees; and other Fund expenses. This example is intended to help you understand your ongoing costs (in dollars) of investing in the Fund and to compare these costs with the ongoing costs of investing in other mutual funds.
This example is based on an investment of $1,000 invested on July 1, 2022 and held for the six months ended December 31, 2022.
Actual expenses
The table below titled “Based on actual total return” provides information about actual account values and actual expenses. You may use the information provided in this table, together with the amount you invested, to estimate the expenses that you paid over the period. To estimate the expenses you paid on your account, divide your ending account value by $1,000 (for example, an $8,600 ending account value divided by $1,000 = 8.6), then multiply the result by the number under the heading entitled “Expenses Paid During the Period”.
Hypothetical example for comparison purposes
The table below titled “Based on hypothetical total return” provides information about hypothetical account values and hypothetical expenses based on the actual expense ratio and an assumed rate of return of 5.00% per year before expenses, which is not the Fund’s actual return. The hypothetical account values and expenses may not be used to estimate the actual ending account balance or expenses you paid for the period. You may use the information provided in this table to compare the ongoing costs of investing in the Fund and other funds. To do so, compare the 5.00% hypothetical example relating to the Fund with the 5.00% hypothetical examples that appear in the shareholder reports of the other funds.
Please note that the expenses shown in the table below are meant to highlight your ongoing costs only and do not reflect any transactional costs, such as front-end or back-end sales charges (loads). Therefore, the table is useful in comparing ongoing costs only, and will not help you determine the relative total costs of owning different funds. In addition, if these transaction costs were included, your costs would have been higher.
| | | | | | | | | | | | | | | | | | | | | | | | | | | | | | | | | | | | | | | | | | | | | | |
| | |
| Based on actual total return1 | | | | | | Based on hypothetical total return1 | |
| | | Actual Total Return Without Sales Charge2 | | | Beginning Account Value | | | Ending Account Value | | | Annualized Expense Ratio | | | Expenses Paid During the Period3 | | | | | | | | Hypothetical Annualized Total Return | | | Beginning Account Value | | | Ending Account Value | | | Annualized Expense Ratio | | | Expenses Paid During the Period3 | |
| Class A | | | -2.45 | % | | $ | 1,000.00 | | | $ | 975.50 | | | | 1.00 | % | | $ | 4.98 | | | | | | | Class A | | | 5.00 | % | | $ | 1,000.00 | | | $ | 1,020.16 | | | | 1.00 | % | | $ | 5.09 | |
| Class C | | | -2.77 | | | | 1,000.00 | | | | 972.30 | | | | 1.62 | | | | 8.05 | | | | | | | Class C | | | 5.00 | | | | 1,000.00 | | | | 1,017.04 | | | | 1.62 | | | | 8.24 | |
| Class C1 | | | -2.57 | | | | 1,000.00 | | | | 974.30 | | | | 1.45 | | | | 7.22 | | | | | | | Class C1 | | | 5.00 | | | | 1,000.00 | | | | 1,017.90 | | | | 1.45 | | | | 7.38 | |
| Class FI | | | -2.49 | | | | 1,000.00 | | | | 975.10 | | | | 1.03 | | | | 5.13 | | | | | | | Class FI | | | 5.00 | | | | 1,000.00 | | | | 1,020.01 | | | | 1.03 | | | | 5.24 | |
| Class R | | | -2.59 | | | | 1,000.00 | | | | 974.10 | | | | 1.25 | | | | 6.22 | | | | | | | Class R | | | 5.00 | | | | 1,000.00 | | | | 1,018.90 | | | | 1.25 | | | | 6.36 | |
| Class I | | | -2.31 | | | | 1,000.00 | | | | 976.90 | | | | 0.71 | | | | 3.54 | | | | | | | Class I | | | 5.00 | | | | 1,000.00 | | | | 1,021.63 | | | | 0.71 | | | | 3.62 | |
| Class IS | | | -2.23 | | | | 1,000.00 | | | | 977.70 | | | | 0.57 | | | | 2.84 | | | | | | | Class IS | | | 5.00 | | | | 1,000.00 | | | | 1,022.33 | | | | 0.57 | | | | 2.91 | |
| | | | | | |
| BrandywineGLOBAL — Global Opportunities Bond Fund 2022 Annual Report | | | | | 9 | |
Fund expenses (unaudited) (cont’d)
| 1 | For the six months ended December 31, 2022. |
| 2 | Assumes the reinvestment of all distributions, including returns of capital, if any, at net asset value and does not reflect the deduction of the applicable sales charge with respect to Class A shares or the applicable contingent deferred sales charge (“CDSC”) with respect to Class C shares and Class C1 shares. Total return is not annualized, as it may not be representative of the total return for the year. Performance figures may reflect compensating balance arrangements, fee waivers and/or expense reimbursements. In the absence of compensating balance arrangements, fee waivers and/or expense reimbursements, the total return would have been lower. Past performance is no guarantee of future results. |
| 3 | Expenses (net of compensating balance arrangements, fee waivers and/or expense reimbursements) are equal to each class’ respective annualized expense ratio multiplied by the average account value over the period, multiplied by the number of days in the most recent fiscal half-year (184), then divided by 365. |
| | | | |
| 10 | | | | BrandywineGLOBAL — Global Opportunities Bond Fund 2022 Annual Report |
Fund performance (unaudited)
| | | | | | | | | | | | | | | | | | | | | | | | | | | | |
| Average annual total returns | |
Without sales charges1
| | Class A | | | Class C | | | Class C12 | | | Class FI | | | Class R | | | Class I | | | Class IS | |
| Twelve Months Ended 12/31/22 | | | -16.03 | % | | | -16.60 | % | | | -16.36 | %3 | | | -16.05 | % | | | -16.19 | % | | | -15.80 | % | | | -15.67 | % |
| Five Years Ended 12/31/22 | | | -1.74 | | | | -2.44 | | | | -1.63 | | | | -1.73 | | | | -2.01 | | | | -1.45 | | | | -1.34 | |
| Ten Years Ended 12/31/22 | | | -0.05 | | | | -0.78 | | | | -0.21 | | | | -0.06 | | | | -0.33 | | | | 0.23 | | | | 0.34 | |
| | | | | | | |
| With sales charges4 | | Class A | | | Class C | | | Class C12 | | | Class FI | | | Class R | | | Class I | | | Class IS | |
| Twelve Months Ended 12/31/22 | | | -19.59 | % | | | -17.39 | % | | | -17.15 | %3 | | | -16.05 | % | | | -16.19 | % | | | -15.80 | % | | | -15.67 | % |
| Five Years Ended 12/31/22 | | | -2.59 | | | | -2.44 | | | | -1.63 | | | | -1.73 | | | | -2.01 | | | | -1.45 | | | | -1.34 | |
| Ten Years Ended 12/31/22 | | | -0.48 | | | | -0.78 | | | | -0.21 | | | | -0.06 | | | | -0.33 | | | | 0.23 | | | | 0.34 | |
| | | | |
| Cumulative total returns | | | |
| Without sales charges1 | | | |
| Class A (12/31/12 through 12/31/22) | | | -0.53 | % |
| Class C (12/31/12 through 12/31/22) | | | -7.50 | |
| Class C1 (12/31/12 through 12/31/22) | | | -2.07 | |
| Class FI (12/31/12 through 12/31/22) | | | -0.63 | |
| Class R (12/31/12 through 12/31/22) | | | -3.24 | |
| Class I (12/31/12 through 12/31/22) | | | 2.30 | |
| Class IS (12/31/12 through 12/31/22) | | | 3.48 | |
All figures represent past performance and are not a guarantee of future results. Investment return and principal value of an investment will fluctuate so that an investor’s shares, when redeemed, may be worth more or less than their original cost. The returns shown do not reflect the deduction of taxes that a shareholder would pay on Fund distributions or the redemption of Fund shares. Performance figures may reflect compensating balance arrangements, fee waivers and/or expense reimbursements. In the absence of compensating balance arrangements, fee waivers and/or expense reimbursements, the total return would have been lower.
| 1 | Assumes the reinvestment of all distributions, including returns of capital, if any, at net asset value and does not reflect the deduction of the applicable sales charge with respect to Class A shares or the applicable contingent deferred sales charge (“CDSC”) with respect to Class C shares and Class C1 shares. |
| 2 | On August 1, 2012, Class C shares were reclassified as Class C1 shares. |
| 3 | Total return information is based on net asset values calculated for shareholder transactions. Certain adjustments were made to the net assets of the Fund at December 31, 2022 for financial reporting purposes. Accordingly, adjusted total returns have been disclosed in the Financial Highlights and differ from those reported here. |
| 4 | Assumes the reinvestment of all distributions, including returns of capital, if any, at net asset value. In addition, Class A shares reflect the deduction of the maximum initial sales charge of 3.75% (4.25% prior to August 15, 2022). Class C shares and Class C1 shares reflect the deduction of a 1.00% CDSC, which applies if shares are redeemed within one year from purchase payment. |
| | | | | | |
| BrandywineGLOBAL — Global Opportunities Bond Fund 2022 Annual Report | | | | | 11 | |
Fund performance (unaudited) (cont’d)
Historical performance
Value of $1,000,000 invested in
Class IS Shares of BrandywineGLOBAL — Global Opportunities Bond Fund vs. FTSE World Government Bond Index (USD) (Unhedged)† — December 2012 - December 2022
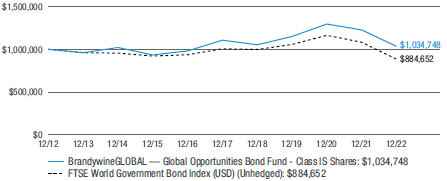
All figures represent past performance and are not a guarantee of future results. Investment return and principal value of an investment will fluctuate so that an investor’s shares, when redeemed, may be worth more or less than their original cost. The returns shown do not reflect the deduction of taxes that a shareholder would pay on Fund distributions or the redemption of Fund shares. Performance figures may reflect compensating balance arrangements, fee waivers and/or expense reimbursements. In the absence of compensating balance arrangements, fee waivers and/or expense reimbursements, the total return would have been lower.
| † | Hypothetical illustration of $1,000,000 invested in Class IS shares of BrandywineGLOBAL — Global Opportunities Bond Fund on December 31, 2012 assuming the reinvestment of all distributions, including returns of capital, if any, at net asset value through December 31, 2022. The hypothetical illustration also assumes a $1,000,000 investment in the FTSE World Government Bond Index (USD) (Unhedged). The FTSE World Government Bond Index (the “Index”) measures the performance of fixed-rate, local currency, investment grade sovereign bonds. The Index is unmanaged and is not subject to the same management and trading expenses as a mutual fund. Please note that an investor cannot invest directly in an index. The performance of the Fund’s other classes may be greater or less than Class IS shares’ performance indicated on this chart, depending on whether greater or lesser charges and fees were incurred by shareholders investing in the other classes. |
| | | | |
| 12 | | | | BrandywineGLOBAL — Global Opportunities Bond Fund 2022 Annual Report |
Schedule of investments
December 31, 2022
BrandywineGLOBAL — Global Opportunities Bond Fund
(Percentages shown based on Fund net assets)
| | | | | | | | | | | | | | | | |
| Security | | Rate | | | Maturity Date | | | Face Amount† | | | Value | |
| Sovereign Bonds — 54.5% | | | | | | | | | | | | | | | | |
Australia — 2.6% | | | | | | | | | | | | | | | | |
New South Wales Treasury Corp. | | | 4.000 | % | | | 4/20/23 | | | | 14,375,000 | AUD | | $ | 9,808,900 | |
Queensland Treasury Corp. | | | 4.250 | % | | | 7/21/23 | | | | 28,885,000 | AUD | | | 19,752,660 | (a) |
Western Australian Treasury Corp. | | | 6.000 | % | | | 10/16/23 | | | | 30,940,000 | AUD | | | 21,448,696 | |
Total Australia | | | | | | | | | | | | | | | 51,010,256 | |
Brazil — 5.6% | | | | | | | | | | | | | | | | |
Brazil Notas do Tesouro Nacional Serie F, Notes | | | 10.000 | % | | | 1/1/27 | | | | 286,900,000 | BRL | | | 50,197,990 | |
Brazil Notas do Tesouro Nacional Serie F, Notes | | | 10.000 | % | | | 1/1/29 | | | | 91,165,000 | BRL | | | 15,458,746 | |
Brazil Notas do Tesouro Nacional Serie F, Notes | | | 10.000 | % | | | 1/1/31 | | | | 94,695,000 | BRL | | | 15,676,195 | |
Brazil Notas do Tesouro Nacional Serie F, Notes | | | 10.000 | % | | | 1/1/33 | | | | 176,000,000 | BRL | | | 28,632,606 | |
Total Brazil | | | | | | | | | | | | | | | 109,965,537 | |
Colombia — 4.3% | | | | | | | | | | | | | | | | |
Colombian TES, Bonds | | | 6.250 | % | | | 11/26/25 | | | | 133,300,000,000 | COP | | | 23,564,745 | |
Colombian TES, Bonds | | | 6.000 | % | | | 4/28/28 | | | | 205,550,000,000 | COP | | | 31,731,414 | |
Colombian TES, Bonds | | | 7.000 | % | | | 3/26/31 | | | | 152,300,000,000 | COP | | | 22,251,133 | |
Colombian TES, Bonds | | | 7.250 | % | | | 10/26/50 | | | | 68,890,000,000 | COP | | | 8,086,951 | |
Total Colombia | | | | | | | | | | | | | | | 85,634,243 | |
France — 6.2% | | | | | | | | | | | | | | | | |
French Republic Government Bond OAT | | | 0.000 | % | | | 5/25/32 | | | | 115,510,000 | EUR | | | 93,619,222 | (a) |
French Republic Government Bond OAT | | | 0.750 | % | | | 5/25/52 | | | | 50,180,000 | EUR | | | 28,907,792 | (a) |
Total France | | | | | | | | | | | | | | | 122,527,014 | |
Germany — 5.3% | | | | | | | | | | | | | | | | |
Bundesrepublik Deutschland Bundesanleihe, Bonds | | | 1.700 | % | | | 8/15/32 | | | | 104,490,000 | EUR | | | 104,304,600 | (a) |
Malaysia — 2.9% | | | | | | | | | | | | | | | | |
Malaysia Government Bond | | | 3.480 | % | | | 3/15/23 | | | | 120,440,000 | MYR | | | 27,328,938 | |
Malaysia Government Bond | | | 3.955 | % | | | 9/15/25 | | | | 49,290,000 | MYR | | | 11,247,433 | |
Malaysia Government Bond | | | 3.899 | % | | | 11/16/27 | | | | 83,240,000 | MYR | | | 18,932,620 | |
Total Malaysia | | | | | | | | | | | | | | | 57,508,991 | |
Mexico — 12.1% | | | | | | | | | | | | | | | | |
Mexican Bonos, Bonds | | | 8.000 | % | | | 11/7/47 | | | | 794,800,000 | MXN | | | 36,404,218 | |
Mexican Bonos, Bonds | | | 8.000 | % | | | 7/31/53 | | | | 875,600,000 | MXN | | | 40,073,660 | |
Mexican Bonos, Senior Notes | | | 8.500 | % | | | 5/31/29 | | | | 1,093,700,000 | MXN | | | 54,628,032 | |
See Notes to Financial Statements.
| | | | | | |
| BrandywineGLOBAL — Global Opportunities Bond Fund 2022 Annual Report | | | | | 13 | |
Schedule of investments (cont’d)
December 31, 2022
BrandywineGLOBAL — Global Opportunities Bond Fund
(Percentages shown based on Fund net assets)
| | | | | | | | | | | | | | | | |
| Security | | Rate | | | Maturity Date | | | Face Amount† | | | Value | |
Mexico — continued | | | | | | | | | | | | | | | | |
Mexican Bonos, Senior Notes | | | 8.500 | % | | | 11/18/38 | | | | 1,156,300,000 | MXN | | $ | 56,201,289 | |
Mexican Bonos, Senior Notes | | | 7.750 | % | | | 11/13/42 | | | | 1,138,300,000 | MXN | | | 51,028,248 | |
Total Mexico | | | | | | | | | | | | | | | 238,335,447 | |
Poland — 4.1% | | | | | | | | | | | | | | | | |
Republic of Poland Government Bond | | | 1.750 | % | | | 4/25/32 | | | | 546,300,000 | PLN | | | 81,969,626 | |
Russia — 0.2% | | | | | | | | | | | | | | | | |
Russian Federal Bond — OFZ | | | 7.650 | % | | | 4/10/30 | | | | 859,000,000 | RUB | | | 3,144,814 | *(b) |
South Africa — 4.1% | | | | | | | | | | | | | | | | |
Republic of South Africa Government | | | | | | | | | | | | | | | | |
Bond, Senior Notes | | | 6.500 | % | | | 2/28/41 | | | | 1,069,200,000 | ZAR | | | 39,388,847 | |
Republic of South Africa Government | | | | | | | | | | | | | | | | |
Bond, Senior Notes | | | 8.750 | % | | | 2/28/48 | | | | 885,500,000 | ZAR | | | 40,748,765 | |
Total South Africa | | | | | | | | | | | | | | | 80,137,612 | |
South Korea — 7.1% | | | | | | | | | | | | | | | | |
Korea Treasury Bond, Senior Notes | | | 2.000 | % | | | 6/10/31 | | | | 153,600,000,000 | KRW | | | 105,909,680 | |
Korea Treasury Bond, Senior Notes | | | 1.875 | % | | | 3/10/51 | | | | 62,000,000,000 | KRW | | | 33,747,031 | |
Total South Korea | | | | | | | | | | | | | | | 139,656,711 | |
Total Sovereign Bonds (Cost — $1,362,746,323) | | | | | | | | | | | | 1,074,194,851 | |
| U.S. Government & Agency Obligations — 18.8% | | | | | | | | | | | | | |
U.S. Government Obligations — 18.8% | | | | | | | | | | | | | | | | |
U.S. Treasury Bonds | | | 1.875 | % | | | 11/15/51 | | | | 51,690,000 | | | | 32,756,518 | |
U.S. Treasury Bonds | | | 2.250 | % | | | 2/15/52 | | | | 139,270,000 | | | | 96,901,455 | |
U.S. Treasury Bonds | | | 3.000 | % | | | 8/15/52 | | | | 111,760,000 | | | | 92,114,687 | |
U.S. Treasury Notes (3 mo. U.S. Treasury Money Market Yield - 0.075%) | | | 4.323 | % | | | 4/30/24 | | | | 43,130,000 | | | | 43,049,750 | (c) |
U.S. Treasury Notes (3 mo. U.S. Treasury Money Market Yield + 0.037%) | | | 4.435 | % | | | 7/31/24 | | | | 59,945,000 | | | | 59,879,407 | (c) |
U.S. Treasury Notes | | | 1.875 | % | | | 2/15/32 | | | | 54,480,000 | | | | 46,233,516 | |
Total U.S. Government & Agency Obligations (Cost — $430,254,007) | | | | 370,935,333 | |
| Mortgage-Backed Securities — 14.0% | | | | | | | | | | | | | | | | |
FHLMC — 7.2% | | | | | | | | | | | | | | | | |
Federal Home Loan Mortgage Corp. (FHLMC) | | | 5.000 | % | | | 8/1/52-11/1/52 | | | | 34,693,777 | | | | 34,246,513 | |
Federal Home Loan Mortgage Corp. (FHLMC) | | | 4.500 | % | | | 9/1/52-10/1/52 | | | | 54,952,354 | | | | 52,947,021 | |
Federal Home Loan Mortgage Corp. (FHLMC) | | | 5.500 | % | | | 12/1/52 | | | | 54,061,417 | | | | 54,257,207 | |
Total FHLMC | | | | | | | | | | | | | | | 141,450,741 | |
See Notes to Financial Statements.
| | | | |
| 14 | | | | BrandywineGLOBAL — Global Opportunities Bond Fund 2022 Annual Report |
BrandywineGLOBAL — Global Opportunities Bond Fund
(Percentages shown based on Fund net assets)
| | | | | | | | | | | | | | | | |
| Securit\y | | Rate | | | Maturity Date | | | Face Amount† | | | Value | |
FNMA — 6.8% | | | | | | | | | | | | | | | | |
Federal National Mortgage Association (FNMA) | | | 4.500 | % | | | 9/1/52 | | | | 46,133,649 | | | $ | 44,450,624 | |
Federal National Mortgage Association (FNMA) | | | 5.000 | % | | | 10/1/52-12/1/52 | | | | 50,587,993 | | | | 49,935,824 | |
Federal National Mortgage Association (FNMA) | | | 5.500 | % | | | 12/1/52 | | | | 39,156,337 | | | | 39,298,147 | |
Total FNMA | | | | | | | | | | | | | | | 133,684,595 | |
Total Mortgage-Backed Securities (Cost — $273,445,750) | | | | | | | | 275,135,336 | |
| Corporate Bonds & Notes — 8.2% | | | | | | | | | | | | | | | | |
| Financials — 8.2% | | | | | | | | | | | | | | | | |
Banks — 2.1% | | | | | | | | | | | | | | | | |
Commonwealth Bank of Australia, Senior Notes (SOFR + 0.740%) | | | 5.046 | % | | | 3/14/25 | | | | 42,300,000 | | | | 42,137,844 | (c)(d) |
Capital Markets — 6.1% | | | | | | | | | | | | | | | | |
Goldman Sachs Group Inc., Senior Notes | | | 5.700 | % | | | 11/1/24 | | | | 39,900,000 | | | | 40,403,861 | |
Jackson National Life Global Funding, Secured Notes (SOFR + 1.150%) | | | 5.473 | % | | | 6/28/24 | | | | 38,470,000 | | | | 38,485,899 | (c)(d) |
Macquarie Group Ltd., Senior Notes | | | 6.207 | % | | | 11/22/24 | | | | 41,040,000 | | | | 41,337,061 | (d) |
Total Capital Markets | | | | | | | | | | | | | | | 120,226,821 | |
Total Corporate Bonds & Notes (Cost — $161,689,460) | | | | | | | | 162,364,665 | |
| Collateralized Mortgage Obligations (e) — 0.2% | | | | | | | | | | | | | |
IM Pastor FTA, 4 A (3 mo. EURIBOR + 0.140%, 0.000% floor)
(Cost—$4,604,103) | | | 2.221 | % | | | 3/22/44 | | | | 3,742,974 | EUR | | | 3,395,942 | (a)(c) |
Total Investments before Short-Term Investments (Cost — $2,232,739,643) | | | | 1,886,026,127 | |
| | | | |
| | | | | | | | | Shares | | | | |
| Short-Term Investments — 1.3% | | | | | | | | | | | | | | | | |
Western Asset Premier Institutional U.S. Treasury Reserves, Premium Shares (Cost — $26,323,460) | | | 4.024 | % | | | | | | | 26,323,460 | | | | 26,323,460 | (f)(g) |
Total Investments — 97.0% (Cost — $2,259,063,103) | | | | | | | | | | | | 1,912,349,587 | |
Other Assets in Excess of Liabilities — 3.0% | | | | | | | | | | | | | | | 59,562,489 | |
Total Net Assets — 100.0% | | | | | | | | | | | | | | $ | 1,971,912,076 | |
See Notes to Financial Statements.
| | | | | | |
| BrandywineGLOBAL — Global Opportunities Bond Fund 2022 Annual Report | | | | | 15 | |
Schedule of investments (cont’d)
December 31, 2022
BrandywineGLOBAL — Global Opportunities Bond Fund
| † | Face amount denominated in U.S. dollars, unless otherwise noted. |
| * | Non-income producing security. |
| (a) | Security is exempt from registration under Regulation S of the Securities Act of 1933. Regulation S applies to securities offerings that are made outside of the United States and do not involve direct selling efforts in the United States. This security has been deemed liquid pursuant to guidelines approved by the Board of Trustees. |
| (b) | The coupon payment on this security is currently in default as of December 31, 2022. |
| (c) | Variable rate security. Interest rate disclosed is as of the most recent information available. Certain variable rate securities are not based on a published reference rate and spread but are determined by the issuer or agent and are based on current market conditions. These securities do not indicate a reference rate and spread in their description above. |
| (d) | Security is exempt from registration under Rule 144A of the Securities Act of 1933. This security may be resold in transactions that are exempt from registration, normally to qualified institutional buyers. This security has been deemed liquid pursuant to guidelines approved by the Board of Trustees. |
| (e) | Collateralized mortgage obligations are secured by an underlying pool of mortgages or mortgage pass-through certificates that are structured to direct payments on underlying collateral to different series or classes of the obligations. The interest rate may change positively or inversely in relation to one or more interest rates, financial indices or other financial indicators and may be subject to an upper and/or lower limit. |
| (f) | Rate shown is one-day yield as of the end of the reporting period. |
| (g) | In this instance, as defined in the Investment Company Act of 1940, an “Affiliated Company” represents Fund ownership of at least 5% of the outstanding voting securities of an issuer, or a company which is under common ownership or control with the Fund. At December 31, 2022, the total market value of investments in Affiliated Companies was $26,323,460 and the cost was $26,323,460 (Note 8). |
| | |
Abbreviation(s) used in this schedule: |
| |
| AUD | | — Australian Dollar |
| |
| BRL | | — Brazilian Real |
| |
| COP | | — Colombian Peso |
| |
| EUR | | — Euro |
| |
| EURIBOR | | — Euro Interbank Offered Rate |
| |
| KRW | | — South Korean Won |
| |
| MXN | | — Mexican Peso |
| |
| MYR | | — Malaysian Ringgit |
| |
| OAT | | — Obligations Assimilables du Trésor (French Treasury Bonds) |
| |
| OFZ | | — Obligatsyi Federal’novo Zaima (Russian Federal Loan Obligation) |
| |
| PLN | | — Polish Zloty |
| |
| RUB | | — Russian Ruble |
| |
| SOFR | | — Secured Overnight Financing Rate |
| |
| ZAR | | — South African Rand |
At December 31, 2022, the Fund had the following open futures contracts:
| | | | | | | | | | | | | | | | | | | | |
| | | Number of
Contracts | | | Expiration
Date | | | Notional Amount | | | Market Value | | | Unrealized
Depreciation | |
| Contracts to Buy: | | | | | | | | | | | | | | | | | | | | |
| U.S. Treasury Ultra Long-Term Bonds | | | 1,071 | | | | 3/23 | | | $ | 147,852,343 | | | $ | 143,848,688 | | | $ | (4,003,655) | |
See Notes to Financial Statements.
| | | | |
| 16 | | | | BrandywineGLOBAL — Global Opportunities Bond Fund 2022 Annual Report |
BrandywineGLOBAL — Global Opportunities Bond Fund
At December 31, 2022, the Fund had the following open forward foreign currency contracts:
| | | | | | | | | | | | | | | | | | | | | | | | |
Currency Purchased | | | Currency Sold | | | Counterparty | | | Settlement
Date | | | Unrealized Appreciation
(Depreciation) | |
| BRL | | | 23,000,000 | | | | USD | | | | 4,385,547 | | | | HSBC Securities Inc. | | | | 1/19/23 | | | $ | (46,905) | |
| BRL | | | 94,000,000 | | | | USD | | | | 18,037,033 | | | | HSBC Securities Inc. | | | | 1/19/23 | | | | (305,192) | |
| USD | | | 68,746,623 | | | | BRL | | | | 368,970,000 | | | | HSBC Securities Inc. | | | | 1/19/23 | | | | (854,627) | |
| PLN | | | 36,500,000 | | | | USD | | | | 7,270,772 | | | | Citibank N.A. | | | | 1/20/23 | | | | 1,045,517 | |
| MXN | | | 930,000,000 | | | | USD | | | | 46,475,368 | | | | Citibank N.A. | | | | 1/24/23 | | | | 1,018,076 | |
| USD | | | 236,390,351 | | | | MXN | | | | 4,826,500,000 | | | | Citibank N.A. | | | | 1/24/23 | | | | (10,090,410) | |
| MXN | | | 330,000,000 | | | | USD | | | | 16,573,236 | | | | JPMorgan Chase & Co. | | | | 1/24/23 | | | | 279,276 | |
| USD | | | 58,975,435 | | | | COP | | | | 295,060,000,000 | | | | JPMorgan Chase & Co. | | | | 1/27/23 | | | | (1,560,302) | |
| EUR | | | 226,470,000 | | | | USD | | | | 227,388,359 | | | | Barclays Bank PLC | | | | 2/3/23 | | | | 15,630,850 | |
| EUR | | | 3,440,000 | | | | USD | | | | 3,638,200 | | | | Citibank N.A. | | | | 2/3/23 | | | | 53,176 | |
| USD | | | 101,473,933 | | | | EUR | | | | 94,670,000 | | | | Morgan Stanley & Co. Inc. | | | | 2/3/23 | | | | (114,041) | |
| USD | | | 2,444,626 | | | | SEK | | | | 25,300,000 | | | | Citibank N.A. | | | | 2/6/23 | | | | 14,646 | |
| SEK | | | 1,071,600,000 | | | | USD | | | | 97,782,644 | | | | HSBC Securities Inc. | | | | 2/6/23 | | | | 5,140,919 | |
| THB | | | 782,100,000 | | | | USD | | | | 20,826,842 | | | | HSBC Securities Inc. | | | | 2/10/23 | | | | 1,850,769 | |
| USD | | | 82,396,036 | | | | ZAR | | | | 1,435,100,000 | | | | HSBC Securities Inc. | | | | 2/15/23 | | | | (1,714,471) | |
| ZAR | | | 137,200,000 | | | | USD | | | | 7,842,483 | | | | Morgan Stanley & Co. Inc. | | | | 2/15/23 | | | | 198,742 | |
| CLP | | | 6,070,000,000 | | | | USD | | | | 6,679,468 | | | | HSBC Securities Inc. | | | | 3/6/23 | | | | 416,047 | |
| USD | | | 48,519,923 | | | | AUD | | | | 71,320,000 | | | | JPMorgan Chase & Co. | | | | 3/7/23 | | | | (170,739) | |
| KRW | | | 15,340,000,000 | | | | USD | | | | 11,818,182 | | | | Citibank N.A. | | | | 3/8/23 | | | | 335,715 | |
| USD | | | 83,005,807 | | | | KRW | | | | 107,920,000,000 | | | | Citibank N.A. | | | | 3/8/23 | | | | (2,499,311) | |
| JPY | | | 58,280,000,000 | | | | USD | | | | 431,902,059 | | | | JPMorgan Chase & Co. | | | | 3/14/23 | | | | 16,653,489 | |
| CLP | | | 96,260,000,000 | | | | USD | | | | 110,760,167 | | | | HSBC Securities Inc. | | | | 3/20/23 | | | | 1,493,338 | |
| NOK | | | 987,700,000 | | | | USD | | | | 101,800,111 | | | | Morgan Stanley & Co. Inc. | | | | 3/20/23 | | | | (626,064) | |
| USD | | | 54,499,658 | | | | MYR | | | | 239,090,000 | | | | Barclays Bank PLC | | | | 3/21/23 | | | | 34,018 | |
| Total | | | | | | | | | | | | | | | | | | | $ | 26,182,516 | |
See Notes to Financial Statements.
| | | | | | |
| BrandywineGLOBAL — Global Opportunities Bond Fund 2022 Annual Report | | | | | 17 | |
Schedule of investments (cont’d)
December 31, 2022
BrandywineGLOBAL — Global Opportunities Bond Fund
| | |
Abbreviation(s) used in this table: |
| |
| AUD | | — Australian Dollar |
| |
| BRL | | — Brazilian Real |
| |
| CLP | | — Chilean Peso |
| |
| COP | | — Colombian Peso |
| |
| EUR | | — Euro |
| |
| JPY | | — Japanese Yen |
| |
| KRW | | — South Korean Won |
| |
| MXN | | — Mexican Peso |
| |
| MYR | | — Malaysian Ringgit |
| |
| NOK | | — Norwegian Krone |
| |
| PLN | | — Polish Zloty |
| |
| SEK | | — Swedish Krona |
| |
| THB | | — Thai Baht |
| |
| USD | | — United States Dollar |
| |
| ZAR | | — South African Rand |
| | | | |
| Summary of Investments by Country** (unaudited) | | | |
| United States | | | 37.9 | % |
| Mexico | | | 12.5 | |
| South Korea | | | 7.3 | |
| Australia | | | 7.0 | |
| France | | | 6.4 | |
| Brazil | | | 5.7 | |
| Germany | | | 5.4 | |
| Colombia | | | 4.5 | |
| Poland | | | 4.3 | |
| South Africa | | | 4.2 | |
| Malaysia | | | 3.0 | |
| Spain | | | 0.2 | |
| Russia | | | 0.2 | |
| Short-Term Investments | | | 1.4 | |
| | | | 100.0 | % |
| ** | As a percentage of total investments. Please note that the Fund holdings are as of December 31, 2022 and are subject to change. For purposes of the Fund’s policy to invest at least 80% of its net assets in fixed income securities of issuers located in developed market countries, a country will be considered developed if, at the time of purchase, it has a sovereign debt rating of A- or better from at least one nationally recognized statistical ratings organization or is included in the FTSE World Government Bond Index. |
See Notes to Financial Statements.
| | | | |
| 18 | | | | BrandywineGLOBAL — Global Opportunities Bond Fund 2022 Annual Report |
Statement of assets and liabilities
December 31, 2022
| | | | |
| |
| Assets: | | | | |
Investments in unaffiliated securities, at value (Cost — $2,232,739,643) | | $ | 1,886,026,127 | |
Investments in affiliated securities, at value (Cost — $26,323,460) | | | 26,323,460 | |
Cash | | | 2,391,000 | |
Unrealized appreciation on forward foreign currency contracts | | | 44,164,578 | |
Interest receivable | | | 25,382,461 | |
Deposits with brokers for open futures contracts | | | 8,423,707 | |
Deposits with brokers for OTC derivatives | | | 4,300,000 | |
Receivable for Fund shares sold | | | 2,972,548 | |
Dividends receivable from affiliated investments | | | 231,182 | |
Prepaid expenses | | | 54,094 | |
Total Assets | | | 2,000,269,157 | |
| |
| Liabilities: | | | | |
Unrealized depreciation on forward foreign currency contracts | | | 17,982,062 | |
Payable for Fund shares repurchased | | | 7,878,644 | |
Investment management fee payable | | | 861,866 | |
Payable to brokers — net variation margin on open futures contracts | | | 535,500 | |
Deposits from brokers for OTC derivatives | | | 310,000 | |
Trustees’ fees payable | | | 34,243 | |
Service and/or distribution fees payable | | | 29,913 | |
Foreign currency due to custodian, at value (Cost — $62) | | | 62 | |
Accrued expenses | | | 724,791 | |
Total Liabilities | | | 28,357,081 | |
| Total Net Assets | | $ | 1,971,912,076 | |
| |
| Net Assets: | | | | |
Par value (Note 7) | | $ | 2,257 | |
Paid-in capital in excess of par value | | | 2,703,617,005 | |
Total distributable earnings (loss) | | | (731,707,186) | |
| Total Net Assets | | $ | 1,971,912,076 | |
See Notes to Financial Statements.
| | | | | | |
| BrandywineGLOBAL — Global Opportunities Bond Fund 2022 Annual Report | | | | | 19 | |
Statement of assets and liabilities (cont’d)
December 31, 2022
| | | | |
| |
| Net Assets: | | | | |
Class A | | | $98,888,029 | |
Class C | | | $2,355,461 | |
Class C1 | | | $58,082 | |
Class FI | | | $15,825,934 | |
Class R | | | $6,500,036 | |
Class I | | | $625,044,865 | |
Class IS | | | $1,223,239,669 | |
| |
| Shares Outstanding: | | | | |
Class A | | | 11,286,417 | |
Class C | | | 275,660 | |
Class C1 | | | 6,490 | |
Class FI | | | 1,831,623 | |
Class R | | | 748,806 | |
Class I | | | 71,640,499 | |
Class IS | | | 139,917,958 | |
| |
| Net Asset Value: | | | | |
Class A (and redemption price) | | | $8.76 | |
Class C* | | | $8.54 | |
Class C1* | | | $8.95 | |
Class FI (and redemption price) | | | $8.64 | |
Class R (and redemption price) | | | $8.68 | |
Class I (and redemption price) | | | $8.72 | |
Class IS (and redemption price) | | | $8.74 | |
| |
| Maximum Public Offering Price Per Share: | | | | |
Class A (based on maximum initial sales charge of 3.75%; 4.25% prior to August 15, 2022) | | | $9.10 | |
| * | Redemption price per share is NAV of Class C and Class C1 shares reduced by a 1.00% CDSC if shares are redeemed within one year from purchase payment (Note 2). |
See Notes to Financial Statements.
| | | | |
| 20 | | | | BrandywineGLOBAL — Global Opportunities Bond Fund 2022 Annual Report |
Statement of operations
For the Year Ended December 31, 2022
| | | | |
| |
| Investment Income: | | | | |
Interest | | $ | 81,149,448 | |
Dividends from affiliated investments | | | 797,317 | |
Less: Foreign taxes withheld | | | (685,062) | |
Total Investment Income | | | 81,261,703 | |
| |
| Expenses: | | | | |
Investment management fee (Note 2) | | | 11,092,289 | |
Transfer agent fees (Note 5) | | | 1,196,123 | |
Custody fees | | | 511,213 | |
Service and/or distribution fees (Notes 2 and 5) | | | 405,908 | |
Registration fees | | | 179,865 | |
Trustees’ fees | | | 179,060 | |
Fund accounting fees | | | 89,205 | |
Legal fees | | | 79,022 | |
Audit and tax fees | | | 57,193 | |
Shareholder reports | | | 24,147 | |
Commitment fees (Note 9) | | | 17,268 | |
Insurance | | | 10,098 | |
Interest expense | | | 2,888 | |
Miscellaneous expenses | | | 25,394 | |
Total Expenses | | | 13,869,673 | |
Less: Fee waivers and/or expense reimbursements (Notes 2 and 5) | | | (45,626) | |
Net Expenses | | | 13,824,047 | |
| Net Investment Income | | | 67,437,656 | |
| |
| Realized and Unrealized Gain (Loss)on Investments, Futures Contracts, Forward Foreign Currency Contracts and Foreign Currency Transactions (Notes 1, 3 and 4): | | | | |
Net Realized Loss From: | | | | |
Investment transactions in unaffiliated securities | | | (48,372,433) | † |
Futures contracts | | | (84,173,936) | |
Forward foreign currency contracts | | | (199,851,897) | |
Foreign currency transactions | | | (2,239,226) | |
Net Realized Loss | | | (334,637,492) | |
Change in Net Unrealized Appreciation (Depreciation) From: | | | | |
Investments in unaffiliated securities | | | (167,643,257) | ‡ |
Futures contracts | | | (647,745) | |
Forward foreign currency contracts | | | 31,575,786 | |
Foreign currencies | | | 431,314 | |
Change in Net Unrealized Appreciation (Depreciation) | | | (136,283,902) | |
| Net Loss on Investments, Futures Contracts, Forward Foreign Currency Contracts and Foreign Currency Transactions | | | (470,921,394) | |
| Decrease in Net Assets From Operations | | $ | (403,483,738) | |
| † | Net of foreign capital gains tax of $135,581. |
| ‡ | Net of change in accrued foreign capital gains tax of $(337,557). |
See Notes to Financial Statements.
| | | | | | |
| BrandywineGLOBAL — Global Opportunities Bond Fund 2022 Annual Report | | | | | 21 | |
Statements of changes in net assets
| | | | | | | | |
| For the Years Ended December 31, | | 2022 | | | 2021 | |
| | |
| Operations: | | | | | | | | |
Net investment income | | $ | 67,437,656 | | | $ | 51,550,384 | |
Net realized gain (loss) | | | (334,637,492) | | | | 36,348,605 | |
Change in net unrealized appreciation (depreciation) | | | (136,283,902) | | | | (221,735,488) | |
Decrease in Net Assets From Operations | | | (403,483,738) | | | | (133,836,499) | |
| | |
| Distributions to Shareholders From (Notes 1 and 6): | | | | | | | | |
Total distributable earnings | | | (128,000,392) | | | | (54,850,370) | |
Decrease in Net Assets From Distributions to Shareholders | | | (128,000,392) | | | | (54,850,370) | |
| | |
| Fund Share Transactions (Note 7): | | | | | | | | |
Net proceeds from sale of shares | | | 645,954,602 | | | | 1,085,517,436 | |
Reinvestment of distributions | | | 121,471,288 | | | | 51,740,210 | |
Cost of shares repurchased | | | (782,529,552) | | | | (761,022,242) | |
Increase (Decrease) in Net Assets From Fund Share Transactions | | | (15,103,662) | | | | 376,235,404 | |
Increase (Decrease) in Net Assets | | | (546,587,792) | | | | 187,548,535 | |
| | |
| Net Assets: | | | | | | | | |
Beginning of year | | | 2,518,499,868 | | | | 2,330,951,333 | |
End of year | | $ | 1,971,912,076 | | | $ | 2,518,499,868 | |
See Notes to Financial Statements.
| | | | |
| 22 | | | | BrandywineGLOBAL — Global Opportunities Bond Fund 2022 Annual Report |
Financial highlights
| | | | | | | | | | | | | | | | | | | | |
| For a share of each class of beneficial interest outstanding throughout each year ended December 31: | |
| Class A Shares1 | | 2022 | | | 2021 | | | 2020 | | | 2019 | | | 2018 | |
| | | | | |
| Net asset value, beginning of year | | | $11.08 | | | | $11.96 | | | | $10.68 | | | | $9.94 | | | | $10.85 | |
| | | | | |
| Income (loss) from operations: | | | | | | | | | | | | | | | | | | | | |
Net investment income | | | 0.26 | | | | 0.20 | | | | 0.27 | | | | 0.32 | | | | 0.32 | |
Net realized and unrealized gain (loss) | | | (2.04) | | | | (0.88) | | | | 1.03 | | | | 0.55 | | | | (0.88) | |
Total income (loss) from operations | | | (1.78) | | | | (0.68) | | | | 1.30 | | | | 0.87 | | | | (0.56) | |
| | | | | |
| Less distributions from: | | | | | | | | | | | | | | | | | | | | |
Net investment income | | | (0.54) | | | | (0.20) | | | | — | | | | (0.11) | | | | (0.34) | |
Net realized gains | | | — | | | | — | | | | — | | | | — | | | | (0.01) | |
Return of capital | | | — | | | | — | | | | (0.02) | | | | (0.02) | | | | — | |
Total distributions | | | (0.54) | | | | (0.20) | | | | (0.02) | | | | (0.13) | | | | (0.35) | |
| | | | | |
| Net asset value, end of year | | | $8.76 | | | | $11.08 | | | | $11.96 | | | | $10.68 | | | | $9.94 | |
Total return2 | | | (16.03) | % | | | (5.68) | % | | | 12.17 | % | | | 8.82 | % | | | (5.28) | % |
| | | | | |
| Net assets, end of year (000s) | | | $98,888 | | | | $130,976 | | | | $151,095 | | | | $160,399 | | | | $157,146 | |
| | | | | |
| Ratios to average net assets: | | | | | | | | | | | | | | | | | | | | |
Gross expenses | | | 1.00 | % | | | 1.00 | %3 | | | 1.01 | % | | | 1.01 | %3 | | | 0.97 | % |
Net expenses4 | | | 1.00 | 5 | | | 1.00 | 3,5 | | | 1.00 | 5 | | | 1.00 | 3,5 | | | 0.97 | |
Net investment income | | | 2.66 | | | | 1.72 | | | | 2.51 | | | | 3.16 | | | | 3.06 | |
| | | | | |
| Portfolio turnover rate | | | 90 | % | | | 51 | % | | | 99 | % | | | 103 | %6 | | | 58 | % |
| 1 | Per share amounts have been calculated using the average shares method. |
| 2 | Performance figures, exclusive of sales charges, may reflect compensating balance arrangements, fee waivers and/or expense reimbursements. In the absence of compensating balance arrangements, fee waivers and/or expense reimbursements, the total return would have been lower. Past performance is no guarantee of future results. |
| 3 | Reflects recapture of expenses waived/reimbursed from prior fiscal years. |
| 4 | As a result of an expense limitation arrangement, the ratio of total annual fund operating expenses, other than interest, brokerage commissions, dividend expense on short sales, taxes, extraordinary expenses and acquired fund fees and expenses, to average net assets of Class A shares did not exceed 1.00%. This expense limitation arrangement cannot be terminated prior to December 31, 2024 without the Board of Trustees’ consent. In addition, the manager has agreed to waive the Fund’s management fee to an extent sufficient to offset the net management fee payable in connection with any investment in an affiliated money market fund. |
| 5 | Reflects fee waivers and/or expense reimbursements. |
| 6 | Excludes securities delivered as a result of a redemption in-kind. |
See Notes to Financial Statements.
| | | | | | |
| BrandywineGLOBAL — Global Opportunities Bond Fund 2022 Annual Report | | | | | 23 | |
Financial highlights (cont’d)
| | | | | | | | | | | | | | | | | | | | |
| For a share of each class of beneficial interest outstanding throughout each year ended December 31: | |
| Class C Shares1 | | 2022 | | | 2021 | | | 2020 | | | 2019 | | | 2018 | |
| | | | | |
| Net asset value, beginning of year | | | $10.81 | | | | $11.67 | | | | $10.47 | | | | $9.77 | | | | $10.67 | |
| | | | | |
| Income (loss) from operations: | | | | | | | | | | | | | | | | | | | | |
Net investment income | | | 0.18 | | | | 0.12 | | | | 0.19 | | | | 0.25 | | | | 0.24 | |
Net realized and unrealized gain (loss) | | | (1.98) | | | | (0.86) | | | | 1.01 | | | | 0.52 | | | | (0.87) | |
Total income (loss) from operations | | | (1.80) | | | | (0.74) | | | | 1.20 | | | | 0.77 | | | | (0.63) | |
| | | | | |
| Less distributions from: | | | | | | | | | | | | | | | | | | | | |
Net investment income | | | (0.47) | | | | (0.12) | | | | — | | | | (0.06) | | | | (0.26) | |
Net realized gains | | | — | | | | — | | | | — | | | | — | | | | (0.01) | |
Return of capital | | | — | | | | — | | | | — | | | | (0.01) | | | | — | |
Total distributions | | | (0.47) | | | | (0.12) | | | | — | | | | (0.07) | | | | (0.27) | |
| | | | | |
| Net asset value, end of year | | | $8.54 | | | | $10.81 | | | | $11.67 | | | | $10.47 | | | | $9.77 | |
Total return2 | | | (16.60) | % | | | (6.31) | % | | | 11.46 | % | | | 7.94 | % | | | (5.98) | % |
| | | | | |
| Net assets, end of year (000s) | | | $2,355 | | | | $6,198 | | | | $7,815 | | | | $10,447 | | | | $14,972 | |
| | | | | |
| Ratios to average net assets: | | | | | | | | | | | | | | | | | | | | |
Gross expenses | | | 1.67 | % | | | 1.69 | % | | | 1.69 | % | | | 1.73 | % | | | 1.71 | % |
Net expenses3 | | | 1.66 | 4 | | | 1.69 | 4 | | | 1.69 | 4 | | | 1.73 | | | | 1.71 | 4 |
Net investment income | | | 1.85 | | | | 1.03 | | | | 1.82 | | | | 2.45 | | | | 2.33 | |
| | | | | |
| Portfolio turnover rate | | | 90 | % | | | 51 | % | | | 99 | % | | | 103 | %5 | | | 58 | % |
| 1 | Per share amounts have been calculated using the average shares method. |
| 2 | Performance figures, exclusive of CDSC, may reflect compensating balance arrangements, fee waivers and/or expense reimbursements. In the absence of compensating balance arrangements, fee waivers and/or expense reimbursements, the total return would have been lower. Past performance is no guarantee of future results. |
| 3 | As a result of an expense limitation arrangement, the ratio of total annual fund operating expenses, other than interest, brokerage commissions, dividend expense on short sales, taxes, extraordinary expenses and acquired fund fees and expenses, to average net assets of Class C shares did not exceed 1.75%. This expense limitation arrangement cannot be terminated prior to December 31, 2024 without the Board of Trustees’ consent. In addition, the manager has agreed to waive the Fund’s management fee to an extent sufficient to offset the net management fee payable in connection with any investment in an affiliated money market fund. |
| 4 | Reflects fee waivers and/or expense reimbursements. |
| 5 | Excludes securities delivered as a result of a redemption in-kind. |
See Notes to Financial Statements.
| | | | |
| 24 | | | | BrandywineGLOBAL — Global Opportunities Bond Fund 2022 Annual Report |
| | | | | | | | | | | | | | | | | | | | |
| For a share of each class of beneficial interest outstanding throughout each year ended December 31: | |
| Class C1 Shares1 | | 2022 | | | 2021 | | | 2020 | | | 2019 | | | 2018 | |
| | | | | |
| Net asset value, beginning of year | | | $11.32 | | | | $11.80 | | | | $10.56 | | | | $9.84 | | | | $10.74 | |
| | | | | |
| Income (loss) from operations: | | | | | | | | | | | | | | | | | | | | |
Net investment income | | | 0.23 | | | | 0.16 | | | | 0.22 | | | | 0.29 | | | | 0.27 | |
Net realized and unrealized gain (loss) | | | (2.09) | | | | (0.60) | | | | 1.02 | | | | 0.53 | | | | (0.87) | |
Total income (loss) from operations | | | (1.86) | | | | (0.44) | | | | 1.24 | | | | 0.82 | | | | (0.60) | |
| | | | | |
| Less distributions from: | | | | | | | | | | | | | | | | | | | | |
Net investment income | | | (0.51) | | | | (0.04) | | | | — | | | | (0.08) | | | | (0.29) | |
Net realized gains | | | — | | | | — | | | | — | | | | — | | | | (0.01) | |
Return of capital | | | — | | | | — | | | | — | | | | (0.02) | | | | — | |
Total distributions | | | (0.51) | | | | (0.04) | | | | — | | | | (0.10) | | | | (0.30) | |
| | | | | |
| Net asset value, end of year | | | $8.95 | | | | $11.32 | | | | $11.80 | | | | $10.56 | | | | $9.84 | |
Total return2 | | | (16.38) | % | | | (3.70) | %3 | | | 11.74 | % | | | 8.35 | % | | | (5.64) | % |
| | | | | |
| Net assets, end of year (000s) | | | $58 | | | | $64 | | | | $1,061 | | | | $2,562 | | | | $5,746 | |
| | | | | |
| Ratios to average net assets: | | | | | | | | | | | | | | | | | | | | |
Gross expenses | | | 1.53 | % | | | 1.45 | % | | | 1.41 | % | | | 1.39 | % | | | 1.38 | % |
Net expenses4 | | | 1.45 | 5 | | | 1.45 | 5 | | | 1.41 | 5 | | | 1.39 | | | | 1.38 | |
Net investment income | | | 2.28 | | | | 1.37 | | | | 2.11 | | | | 2.82 | | | | 2.64 | |
| | | | | |
| Portfolio turnover rate | | | 90 | % | | | 51 | % | | | 99 | % | |
| 103
| %6
| | | 58 | % |
| 1 | Per share amounts have been calculated using the average shares method. |
| 2 | Performance figures, exclusive of CDSC, may reflect compensating balance arrangements, fee waivers and/or expense reimbursements. In the absence of compensating balance arrangements, fee waivers and/or expense reimbursements, the total return would have been lower. Past performance is no guarantee of future results. |
| 3 | The total return includes a payment by an affiliate to reimburse for an error. Absent this payment, total return would have been (6.25)% for the year ended December 31, 2021. |
| 4 | As a result of an expense limitation arrangement, the ratio of total annual fund operating expenses, other than interest, brokerage commissions, dividend expense on short sales, taxes, extraordinary expenses and acquired fund fees and expenses, to average net assets of Class C1 shares did not exceed 1.45%. This expense limitation arrangement cannot be terminated prior to December 31, 2024 without the Board of Trustees’ consent. In addition, the manager has agreed to waive the Fund’s management fee to an extent sufficient to offset the net management fee payable in connection with any investment in an affiliated money market fund. |
| 5 | Reflects fee waivers and/or expense reimbursements. |
| 6 | Excludes securities delivered as a result of a redemption in-kind. |
See Notes to Financial Statements.
| | | | | | |
| BrandywineGLOBAL — Global Opportunities Bond Fund 2022 Annual Report | | | | | 25 | |
Financial highlights (cont’d)
| | | | | | | | | | | | | | | | | | | | |
| For a share of each class of beneficial interest outstanding throughout each year ended December 31: | |
| Class FI Shares1 | | 2022 | | | 2021 | | | 2020 | | | 2019 | | | 2018 | |
| | | | | |
| Net asset value, beginning of year | | | $10.94 | | | | $11.81 | | | | $10.54 | | | | $9.82 | | | | $10.71 | |
| | | | | |
| Income (loss) from operations: | | | | | | | | | | | | | | | | | | | | |
Net investment income | | | 0.25 | | | | 0.20 | | | | 0.27 | | | | 0.32 | | | | 0.31 | |
Net realized and unrealized gain (loss) | | | (2.01) | | | | (0.86) | | | | 1.01 | | | | 0.53 | | | | (0.86) | |
Total income (loss) from operations | | | (1.76) | | | | (0.66) | | | | 1.28 | | | | 0.85 | | | | (0.55) | |
| | | | | |
| Less distributions from: | | | | | | | | | | | | | | | | | | | | |
Net investment income | | | (0.54) | | | | (0.21) | | | | — | | | | (0.11) | | | | (0.33) | |
Net realized gains | | | — | | | | — | | | | — | | | | — | | | | (0.01) | |
Return of capital | | | — | | | | — | | | | (0.01) | | | | (0.02) | | | | — | |
Total distributions | | | (0.54) | | | | (0.21) | | | | (0.01) | | | | (0.13) | | | | (0.34) | |
| | | | | |
| Net asset value, end of year | | | $8.64 | | | | $10.94 | | | | $11.81 | | | | $10.54 | | | | $9.82 | |
Total return2 | | | (16.05) | % | | | (5.62) | % | | | 12.23 | % | | | 8.74 | % | | | (5.22) | % |
| | | | | |
| Net assets, end of year (000s) | | | $15,826 | | | | $22,278 | | | | $16,906 | | | | $18,227 | | | | $27,623 | |
| | | | | |
| Ratios to average net assets: | | | | | | | | | | | | | | | | | | | | |
Gross expenses | | | 1.00 | % | | | 0.97 | % | | | 0.98 | % | | | 0.98 | % | | | 0.99 | % |
Net expenses3 | | | 1.00 | 4 | | | 0.97 | 4 | | | 0.98 | 4 | | | 0.98 | | | | 0.99 | 4 |
Net investment income | | | 2.63 | | | | 1.73 | | | | 2.53 | | | | 3.20 | | | | 2.99 | |
| | | | | |
| Portfolio turnover rate | | | 90 | % | | | 51 | % | | | 99 | % | | | 103 | %5 | | | 58 | % |
| 1 | Per share amounts have been calculated using the average shares method. |
| 2 | Performance figures may reflect compensating balance arrangements, fee waivers and/or expense reimbursements. In the absence of compensating balance arrangements, fee waivers and/or expense reimbursements, the total return would have been lower. Past performance is no guarantee of future results. |
| 3 | As a result of an expense limitation arrangement, the ratio of total annual fund operating expenses, other than interest, brokerage commissions, dividend expense on short sales, taxes, extraordinary expenses and acquired fund fees and expenses, to average net assets of Class FI shares did not exceed 1.00%. This expense limitation arrangement cannot be terminated prior to December 31, 2024 without the Board of Trustees’ consent. In addition, the manager has agreed to waive the Fund’s management fee to an extent sufficient to offset the net management fee payable in connection with any investment in an affiliated money market fund. |
| 4 | Reflects fee waivers and/or expense reimbursements. |
| 5 | Excludes securities delivered as a result of a redemption in-kind. |
See Notes to Financial Statements.
| | | | |
| 26 | | | | BrandywineGLOBAL — Global Opportunities Bond Fund 2022 Annual Report |
| | | | | | | | | | | | | | | | | | | | |
| For a share of each class of beneficial interest outstanding throughout each year ended December 31: | |
| Class R Shares1 | | 2022 | | | 2021 | | | 2020 | | | 2019 | | | 2018 | |
| | | | | |
| Net asset value, beginning of year | | | $10.98 | | | | $11.86 | | | | $10.60 | | | | $9.88 | | | | $10.79 | |
| | | | | |
| Income (loss) from operations: | | | | | | | | | | | | | | | | | | | | |
Net investment income | | | 0.23 | | | | 0.17 | | | | 0.24 | | | | 0.30 | | | | 0.29 | |
Net realized and unrealized gain (loss) | | | (2.01) | | | | (0.87) | | | | 1.02 | | | | 0.53 | | | | (0.88) | |
Total income (loss) from operations | | | (1.78) | | | | (0.70) | | | | 1.26 | | | | 0.83 | | | | (0.59) | |
| | | | | |
| Less distributions from: | | | | | | | | | | | | | | | | | | | | |
Net investment income | | | (0.52) | | | | (0.18) | | | | — | | | | (0.09) | | | | (0.31) | |
Net realized gains | | | — | | | | — | | | | — | | | | — | | | | (0.01) | |
Return of capital | | | — | | | | — | | | | — | | | | (0.02) | | | | — | |
Total distributions | | | (0.52) | | | | (0.18) | | | | — | | | | (0.11) | | | | (0.32) | |
| | | | | |
| Net asset value, end of year | | | $8.68 | | | | $10.98 | | | | $11.86 | | | | $10.60 | | | | $9.88 | |
Total return2 | | | (16.19) | % | | | (5.95) | % | | | 11.89 | % | | | 8.47 | % | | | (5.55) | % |
| | | | | |
| Net assets, end of year (000s) | | | $6,500 | | | | $8,083 | | | | $6,717 | | | | $9,658 | | | | $11,832 | |
| | | | | |
| Ratios to average net assets: | | | | | | | | | | | | | | | | | | | | |
Gross expenses | | | 1.26 | % | | | 1.30 | % | | | 1.31 | % | | | 1.30 | %3 | | | 1.30 | %3 |
Net expenses4,5 | | | 1.25 | | | | 1.25 | | | | 1.25 | | | | 1.25 | 3 | | | 1.25 | 3 |
Net investment income | | | 2.44 | | | | 1.44 | | | | 2.26 | | | | 2.91 | | | | 2.78 | |
| | | | | |
| Portfolio turnover rate | | | 90 | % | | | 51 | % | | | 99 | % | | | 103 | %6 | | | 58 | % |
| 1 | Per share amounts have been calculated using the average shares method. |
| 2 | Performance figures may reflect compensating balance arrangements, fee waivers and/or expense reimbursements. In the absence of compensating balance arrangements, fee waivers and/or expense reimbursements, the total return would have been lower. Past performance is no guarantee of future results. |
| 3 | Reflects recapture of expenses waived/reimbursed from prior fiscal years. |
| 4 | As a result of an expense limitation arrangement, the ratio of total annual fund operating expenses, other than interest, brokerage commissions, dividend expense on short sales, taxes, extraordinary expenses and acquired fund fees and expenses, to average net assets of Class R shares did not exceed 1.25%. This expense limitation arrangement cannot be terminated prior to December 31, 2024 without the Board of Trustees’ consent. In addition, the manager has agreed to waive the Fund’s management fee to an extent sufficient to offset the net management fee payable in connection with any investment in an affiliated money market fund. |
| 5 | Reflects fee waivers and/or expense reimbursements. |
| 6 | Excludes securities delivered as a result of a redemption in-kind. |
See Notes to Financial Statements.
| | | | | | |
| BrandywineGLOBAL — Global Opportunities Bond Fund 2022 Annual Report | | | | | 27 | |
Financial highlights (cont’d)
| | | | | | | | | | | | | | | | | | | | |
| For a share of each class of beneficial interest outstanding throughout each year ended December 31: | |
| Class I Shares1 | | 2022 | | | 2021 | | | 2020 | | | 2019 | | | 2018 | |
| | | | | |
| Net asset value, beginning of year | | | $11.04 | | | | $11.92 | | | | $10.63 | | | | $9.89 | | | | $10.80 | |
| | | | | |
| Income (loss) from operations: | | | | | | | | | | | | | | | | | | | | |
Net investment income | | | 0.29 | | | | 0.24 | | | | 0.30 | | | | 0.36 | | | | 0.35 | |
Net realized and unrealized gain (loss) | | | (2.04) | | | | (0.88) | | | | 1.02 | | | | 0.54 | | | | (0.88) | |
Total income (loss) from operations | | | (1.75) | | | | (0.64) | | | | 1.32 | | | | 0.90 | | | | (0.53) | |
| | | | | |
| Less distributions from: | | | | | | | | | | | | | | | | | | | | |
Net investment income | | | (0.57) | | | | (0.24) | | | | — | | | | (0.13) | | | | (0.37) | |
Net realized gains | | | — | | | | — | | | | — | | | | — | | | | (0.01) | |
Return of capital | | | — | | | | — | | | | (0.03) | | | | (0.03) | | | | — | |
Total distributions | | | (0.57) | | | | (0.24) | | | | (0.03) | | | | (0.16) | | | | (0.38) | |
| | | | | |
| Net asset value, end of year | | | $8.72 | | | | $11.04 | | | | $11.92 | | | | $10.63 | | | | $9.89 | |
Total return2 | | | (15.80) | % | | | (5.36) | % | | | 12.52 | % | | | 9.14 | % | | | (4.99) | % |
| | | | | |
| Net assets, end of year (millions) | | | $625 | | | | $772 | | | | $723 | | | | $851 | | | | $908 | |
| | | | | |
| Ratios to average net assets: | | | | | | | | | | | | | | | | | | | | |
Gross expenses | | | 0.67 | % | | | 0.66 | % | | | 0.68 | % | | | 0.68 | % | | | 0.67 | % |
Net expenses3 | | | 0.67 | 4 | | | 0.65 | 4 | | | 0.68 | 4 | | | 0.68 | | | | 0.67 | |
Net investment income | | | 3.00 | | | | 2.05 | | | | 2.83 | | | | 3.48 | | | | 3.38 | |
| | | | | |
| Portfolio turnover rate | | | 90 | % | | | 51 | % | | | 99 | % | | | 103 | %5 | | | 58 | % |
| 1 | Per share amounts have been calculated using the average shares method. |
| 2 | Performance figures may reflect compensating balance arrangements, fee waivers and/or expense reimbursements. In the absence of compensating balance arrangements, fee waivers and/or expense reimbursements, the total return would have been lower. Past performance is no guarantee of future results. |
| 3 | As a result of an expense limitation arrangement, the ratio of total annual fund operating expenses, other than interest, brokerage commissions, dividend expense on short sales, taxes, extraordinary expenses and acquired fund fees and expenses, to average net assets of Class I shares did not exceed 0.75%. This expense limitation arrangement cannot be terminated prior to December 31, 2024 without the Board of Trustees’ consent. In addition, the manager has agreed to waive the Fund’s management fee to an extent sufficient to offset the net management fee payable in connection with any investment in an affiliated money market fund. |
| 4 | Reflects fee waivers and/or expense reimbursements. |
| 5 | Excludes securities delivered as a result of a redemption in-kind. |
See Notes to Financial Statements.
| | | | |
| 28 | | | | BrandywineGLOBAL — Global Opportunities Bond Fund 2022 Annual Report |
| | | | | | | | | | | | | | | | | | | | |
| For a share of each class of beneficial interest outstanding throughout each year ended December 31: | |
| Class IS Shares1 | | 2022 | | | 2021 | | | 2020 | | | 2019 | | | 2018 | |
| | | | | |
| Net asset value, beginning of year | | | $11.06 | | | | $11.94 | | | | $10.64 | | | | $9.90 | | | | $10.81 | |
| | | | | |
| Income (loss) from operations: | | | | | | | | | | | | | | | | | | | | |
Net investment income | | | 0.30 | | | | 0.25 | | | | 0.31 | | | | 0.37 | | | | 0.37 | |
Net realized and unrealized gain (loss) | | | (2.03) | | | | (0.88) | | | | 1.03 | | | | 0.54 | | | | (0.89) | |
Total income (loss) from operations | | | (1.73) | | | | (0.63) | | | | 1.34 | | | | 0.91 | | | | (0.52) | |
| | | | | |
| Less distributions from: | | | | | | | | | | | | | | | | | | | | |
Net investment income | | | (0.59) | | | | (0.25) | | | | — | | | | (0.14) | | | | (0.38) | |
Net realized gains | | | — | | | | — | | | | — | | | | — | | | | (0.01) | |
Return of capital | | | — | | | | — | | | | (0.04) | | | | (0.03) | | | | — | |
Total distributions | | | (0.59) | | | | (0.25) | | | | (0.04) | | | | (0.17) | | | | (0.39) | |
| | | | | |
| Net asset value, end of year | | | $8.74 | | | | $11.06 | | | | $11.94 | | | | $10.64 | | | | $9.90 | |
Total return2 | | | (15.67) | % | | | (5.26) | % | | | 12.66 | % | | | 9.21 | % | | | (4.90) | % |
| | | | | |
| Net assets, end of year (millions) | | | $1,223 | | | | $1,579 | | | | $1,411 | | | | $1,881 | | | | $2,039 | |
| | | | | |
| Ratios to average net assets: | | | | | | | | | | | | | | | | | | | | |
Gross expenses | | | 0.56 | % | | | 0.56 | % | | | 0.58 | % | | | 0.58 | % | | | 0.58 | % |
Net expenses3 | | | 0.56 | 4 | | | 0.55 | 4 | | | 0.58 | 4 | | | 0.58 | | | | 0.58 | |
Net investment income | | | 3.11 | | | | 2.15 | | | | 2.93 | | | | 3.58 | | | | 3.50 | |
| | | | | |
| Portfolio turnover rate | | | 90 | % | | | 51 | % | | | 99 | % | |
| 103
| %5
| | | 58 | % |
| 1 | Per share amounts have been calculated using the average shares method. |
| 2 | Performance figures may reflect compensating balance arrangements, fee waivers and/or expense reimbursements. In the absence of compensating balance arrangements, fee waivers and/or expense reimbursements, the total return would have been lower. Past performance is no guarantee of future results. |
| 3 | As a result of an expense limitation arrangement, the ratio of total annual fund operating expenses, other than interest, brokerage commissions, dividend expense on short sales, taxes, extraordinary expenses and acquired fund fees and expenses, to average net assets of Class IS shares did not exceed 0.65%. In addition, the ratio of total annual fund operating expenses for Class IS shares did not exceed the ratio of total annual fund operating expenses for Class I shares. These expense limitation arrangements cannot be terminated prior to December 31, 2024 without the Board of Trustees’ consent. In addition, the manager has agreed to waive the Fund’s management fee to an extent sufficient to offset the net management fee payable in connection with any investment in an affiliated money market fund. |
| 4 | Reflects fee waivers and/or expense reimbursements. |
| 5 | Excludes securities delivered as a result of a redemption in-kind. |
See Notes to Financial Statements.
| | | | | | |
| BrandywineGLOBAL — Global Opportunities Bond Fund 2022 Annual Report | | | | | 29 | |
Notes to financial statements
1. Organization and significant accounting policies
BrandywineGLOBAL — Global Opportunities Bond Fund (the “Fund”) is a separate non-diversified investment series of Legg Mason Global Asset Management Trust (the “Trust”). The Trust, a Maryland statutory trust, is registered under the Investment Company Act of 1940, as amended (the “1940 Act”), as an open-end management investment company.
The Fund follows the accounting and reporting guidance in Financial Accounting Standards Board (“FASB”) Accounting Standards Codification Topic 946, Financial Services – Investment Companies (“ASC 946”). The following are significant accounting policies consistently followed by the Fund and are in conformity with U.S. generally accepted accounting principles (“GAAP”), including, but not limited to, ASC 946. Estimates and assumptions are required to be made regarding assets, liabilities and changes in net assets resulting from operations when financial statements are prepared. Changes in the economic environment, financial markets and any other parameters used in determining these estimates could cause actual results to differ. Subsequent events have been evaluated through the date the financial statements were issued.
(a) Investment valuation. The valuations for fixed income securities (which may include, but are not limited to, corporate, government, municipal, mortgage-backed, collateralized mortgage obligations and asset-backed securities) and certain derivative instruments are typically the prices supplied by independent third party pricing services, which may use market prices or broker/dealer quotations or a variety of valuation techniques and methodologies. The independent third party pricing services typically use inputs that are observable such as issuer details, interest rates, yield curves, prepayment speeds, credit risks/spreads, default rates and quoted prices for similar securities. Investments in open-end funds are valued at the closing net asset value per share of each fund on the day of valuation. Futures contracts are valued daily at the settlement price established by the board of trade or exchange on which they are traded. Equity securities for which market quotations are available are valued at the last reported sales price or official closing price on the primary market or exchange on which they trade. When the Fund holds securities or other assets that are denominated in a foreign currency, the Fund will normally use the currency exchange rates as of 4:00 p.m. (Eastern Time). If independent third party pricing services are unable to supply prices for a portfolio investment, or if the prices supplied are deemed by the manager to be unreliable, the market price may be determined by the manager using quotations from one or more broker/dealers or at the transaction price if the security has recently been purchased and no value has yet been obtained from a pricing service or pricing broker. When reliable prices are not readily available, such as when the value of a security has been significantly affected by events after the close of the exchange or market on which the security is principally traded, but before the Fund calculates its net asset value, the Fund values these securities as determined in accordance with procedures approved by the Fund’s Board of Trustees.
Pursuant to policies adopted by the Board of Trustees, the Fund’s manager has been designated as the valuation designee and is responsible for the oversight of the daily valuation process. The Fund’s manager is assisted by the Global Fund Valuation Committee (the “Valuation Committee”). The Valuation Committee is responsible for making fair value determinations, evaluating the effectiveness of the Fund’s pricing policies, and reporting to the Fund’s manager and the Board of Trustees. When determining the reliability of third party pricing information for investments owned by the Fund, the Valuation Committee,
| | | | |
| 30 | | | | BrandywineGLOBAL — Global Opportunities Bond Fund 2022 Annual Report |
among other things, conducts due diligence reviews of pricing vendors, monitors the daily change in prices and reviews transactions among market participants.
The Valuation Committee will consider pricing methodologies it deems relevant and appropriate when making fair value determinations. Examples of possible methodologies include, but are not limited to, multiple of earnings; discount from market of a similar freely traded security; discounted cash-flow analysis; book value or a multiple thereof; risk premium/yield analysis; yield to maturity; and/or fundamental investment analysis. The Valuation Committee will also consider factors it deems relevant and appropriate in light of the facts and circumstances. Examples of possible factors include, but are not limited to, the type of security; the issuer’s financial statements; the purchase price of the security; the discount from market value of unrestricted securities of the same class at the time of purchase; analysts’ research and observations from financial institutions; information regarding any transactions or offers with respect to the security; the existence of merger proposals or tender offers affecting the security; the price and extent of public trading in similar securities of the issuer or comparable companies; and the existence of a shelf registration for restricted securities.
For each portfolio security that has been fair valued pursuant to the policies adopted by the Board of Trustees, the fair value price is compared against the last available and next available market quotations. The Valuation Committee reviews the results of such back testing monthly and fair valuation occurrences are reported to the Board of Trustees quarterly.
The Fund uses valuation techniques to measure fair value that are consistent with the market approach and/or income approach, depending on the type of security and the particular circumstance. The market approach uses prices and other relevant information generated by market transactions involving identical or comparable securities. The income approach uses valuation techniques to discount estimated future cash flows to present value.
GAAP establishes a disclosure hierarchy that categorizes the inputs to valuation techniques used to value assets and liabilities at measurement date. These inputs are summarized in the three broad levels listed below:
| • | | Level 1 — unadjusted quoted prices in active markets for identical investments |
| • | | Level 2 — other significant observable inputs (including quoted prices for similar investments, interest rates, prepayment speeds, credit risk, etc.) |
| • | | Level 3 — significant unobservable inputs (including the Fund’s own assumptions in determining the fair value of investments) |
The inputs or methodologies used to value securities are not necessarily an indication of the risk associated with investing in those securities.
| | | | | | |
| BrandywineGLOBAL — Global Opportunities Bond Fund 2022 Annual Report | | | | | 31 | |
Notes to financial statements (cont’d)
The following is a summary of the inputs used in valuing the Fund’s assets and liabilities carried at fair value:
| | | | | | | | | | | | | | | | |
| ASSETS | |
| Description | | Quoted Prices
(Level 1) | | | Other Significant
Observable Inputs (Level 2) | | | Significant
Unobservable
Inputs (Level 3) | | | Total | |
| Long-Term Investments†: | | | | | | | | | | | | | | | | |
Sovereign Bonds | | | — | | | $ | 1,074,194,851 | | | | — | | | $ | 1,074,194,851 | |
U.S. Government & Agency | | | | | | | | | | | | | | | | |
Obligations | | | — | | | | 370,935,333 | | | | — | | | | 370,935,333 | |
Mortgage-Backed Securities | | | — | | | | 275,135,336 | | | | — | | | | 275,135,336 | |
Corporate Bonds & Notes | | | — | | | | 162,364,665 | | | | — | | | | 162,364,665 | |
Collateralized Mortgage Obligations | | | — | | | | 3,395,942 | | | | — | | | | 3,395,942 | |
| Total Long-Term Investments | | | — | | | | 1,886,026,127 | | | | — | | | | 1,886,026,127 | |
| Short-Term Investments† | | $ | 26,323,460 | | | | — | | | | — | | | | 26,323,460 | |
| Total Investments | | $ | 26,323,460 | | | $ | 1,886,026,127 | | | | — | | | $ | 1,912,349,587 | |
| Other Financial Instruments: | | | | | | | | | | | | | | | | |
Forward Foreign Currency Contracts†† | | | — | | | $ | 44,164,578 | | | | — | | | $ | 44,164,578 | |
| Total | | $ | 26,323,460 | | | $ | 1,930,190,705 | | | | — | | | $ | 1,956,514,165 | |
|
| LIABILITIES | |
| Description | | Quoted Prices
(Level 1) | | | Other Significant
Observable Inputs (Level 2) | | | Significant
Unobservable
Inputs (Level 3) | | | Total | |
| Other Financial Instruments: | | | | | | | | | | | | | | | | |
Futures Contracts†† | | $ | 4,003,655 | | | | — | | | | — | | | $ | 4,003,655 | |
Forward Foreign Currency Contracts†† | | | — | | | $ | 17,982,062 | | | | — | | | | 17,982,062 | |
| Total | | $ | 4,003,655 | | | $ | 17,982,062 | | | | — | | | $ | 21,985,717 | |
| † | See Schedule of Investments for additional detailed categorizations. |
| †† | Reflects the unrealized appreciation (depreciation) of the instruments. |
(b) Futures contracts. The Fund uses futures contracts generally to gain exposure to, or hedge against, changes in interest rates or gain exposure to, or hedge against, changes in certain asset classes. A futures contract represents a commitment for the future purchase or sale of an asset at a specified price on a specified date.
Upon entering into a futures contract, the Fund is required to deposit cash or securities with a broker in an amount equal to a certain percentage of the contract amount. This is known as the ‘‘initial margin’’ and subsequent payments (‘‘variation margin’’) are made or received by the Fund each day, depending on the daily fluctuation in the value of the contract. For certain futures, including foreign denominated futures, variation margin is not settled daily, but is recorded as a net variation margin payable or receivable. The daily changes in
| | | | |
| 32 | | | | BrandywineGLOBAL — Global Opportunities Bond Fund 2022 Annual Report |
contract value are recorded as unrealized appreciation or depreciation in the Statement of Operations and the Fund recognizes a realized gain or loss when the contract is closed.
Futures contracts involve, to varying degrees, risk of loss in excess of the amounts reflected in the financial statements. In addition, there is the risk that the Fund may not be able to enter into a closing transaction because of an illiquid secondary market.
(c) Forward foreign currency contracts. The Fund enters into a forward foreign currency contract to hedge exposure of bond positions or in an attempt to increase the Fund’s return. A forward foreign currency contract is an agreement between two parties to buy and sell a currency at a set price with delivery and settlement at a future date. The contract is marked-to-market daily and the change in value is recorded by the Fund as an unrealized gain or loss. When a forward foreign currency contract is closed, through either delivery or offset by entering into another forward foreign currency contract, the Fund recognizes a realized gain or loss equal to the difference between the value of the contract at the time it was opened and the value of the contract at the time it is closed.
Non-deliverable forward foreign currency exchange contracts are settled with the counterparty in cash without the delivery of foreign currency.
Forward foreign currency contracts involve elements of market risk in excess of the amounts reflected on the Statement of Assets and Liabilities. The Fund bears the risk of an unfavorable change in the foreign exchange rate underlying the forward foreign currency contract. Risks may also arise upon entering into these contracts from the potential inability of the counterparties to meet the terms of their contracts.
(d) Foreign currency translation. Investment securities and other assets and liabilities denominated in foreign currencies are translated into U.S. dollar amounts based upon prevailing exchange rates on the date of valuation. Purchases and sales of investment securities and income and expense items denominated in foreign currencies are translated into U.S. dollar amounts based upon prevailing exchange rates on the respective dates of such transactions.
The Fund does not isolate that portion of the results of operations resulting from fluctuations in foreign exchange rates on investments from the fluctuations arising from changes in market prices of securities held. Such fluctuations are included with the net realized and unrealized gain or loss on investments.
Net realized foreign exchange gains or losses arise from sales of foreign currencies, including gains and losses on forward foreign currency contracts, currency gains or losses realized between the trade and settlement dates on securities transactions, and the difference between the amounts of dividends, interest, and foreign withholding taxes recorded on the Fund’s books and the U.S. dollar equivalent of the amounts actually received or paid. Net unrealized foreign exchange gains and losses arise from changes in the values of assets and liabilities, other than investments in securities, on the date of valuation, resulting from changes in exchange rates.
Foreign security and currency transactions may involve certain considerations and risks not typically associated with those of U.S. dollar denominated transactions as a result of,
| | | | | | |
| BrandywineGLOBAL — Global Opportunities Bond Fund 2022 Annual Report | | | | | 33 | |
Notes to financial statements (cont’d)
among other factors, the possibility of lower levels of governmental supervision and regulation of foreign securities markets and the possibility of political or economic instability.
(e) Credit and market risk. The Fund invests in high-yield and emerging market instruments that are subject to certain credit and market risks. The yields of high-yield and emerging market debt obligations reflect, among other things, perceived credit and market risks. The Fund’s investments in securities rated below investment grade typically involve risks not associated with higher rated securities including, among others, greater risk related to timely and ultimate payment of interest and principal, greater market price volatility and less liquid secondary market trading. The consequences of political, social, economic or diplomatic changes may have disruptive effects on the market prices of investments held by the Fund. The Fund’s investments in non-U.S. dollar denominated securities may also result in foreign currency losses caused by devaluations and exchange rate fluctuations.
Investments in securities that are collateralized by real estate mortgages are subject to certain credit and liquidity risks. When market conditions result in an increase in default rates of the underlying mortgages and the foreclosure values of underlying real estate properties are materially below the outstanding amount of these underlying mortgages, collection of the full amount of accrued interest and principal on these investments may be doubtful. Such market conditions may significantly impair the value and liquidity of these investments and may result in a lack of correlation between their credit ratings and values.
(f) Foreign investment risks. The Fund’s investments in foreign securities may involve risks not present in domestic investments. Since securities may be denominated in foreign currencies, may require settlement in foreign currencies or may pay interest or dividends in foreign currencies, changes in the relationship of these foreign currencies to the U.S. dollar can significantly affect the value of the investments and earnings of the Fund. Foreign investments may also subject the Fund to foreign government exchange restrictions, expropriation, taxation or other political, social or economic developments, all of which affect the market and/or credit risk of the investments.
(g) Counterparty risk and credit-risk-related contingent features of derivative instruments. The Fund may invest in certain securities or engage in other transactions where the Fund is exposed to counterparty credit risk in addition to broader market risks. The Fund may invest in securities of issuers, which may also be considered counterparties as trading partners in other transactions. This may increase the risk of loss in the event of default or bankruptcy by the counterparty or if the counterparty otherwise fails to meet its contractual obligations. The Fund’s subadviser attempts to mitigate counterparty risk by (i) periodically assessing the creditworthiness of its trading partners, (ii) monitoring and/or limiting the amount of its net exposure to each individual counterparty based on its assessment and (iii) requiring collateral from the counterparty for certain transactions. Market events and changes in overall economic conditions may impact the assessment of such counterparty risk by the subadviser. In addition, declines in the values of underlying collateral received may expose the Fund to increased risk of loss.
With exchange traded and centrally cleared derivatives, there is less counterparty risk to the Fund since the exchange or clearinghouse, as counterparty to such instruments, guarantees against a possible default. The clearinghouse stands between the buyer and the
| | | | |
| 34 | | | | BrandywineGLOBAL — Global Opportunities Bond Fund 2022 Annual Report |
seller of the contract; therefore, the credit risk is limited to failure of the clearinghouse. While offset rights may exist under applicable law, the Fund does not have a contractual right of offset against a clearing broker or clearinghouse in the event of a default of the clearing broker or clearinghouse.
The Fund has entered into master agreements, such as an International Swaps and Derivatives Association, Inc. Master Agreement (“ISDA Master Agreement”) or similar agreement, with certain of its derivative counterparties that govern over-the-counter (“OTC”) derivatives and provide for general obligations, representations, agreements, collateral posting terms, netting provisions in the event of default or termination and credit related contingent features. The credit related contingent features include, but are not limited to, a percentage decrease in the Fund’s net assets or net asset value per share over a specified period of time. If these credit related contingent features were triggered, the derivatives counterparty could terminate the positions and demand payment or require additional collateral.
Under an ISDA Master Agreement, the Fund may, under certain circumstances, offset with the counterparty certain derivative financial instruments’ payables and/or receivables with collateral held and/or posted and create one single net payment. However, absent an event of default by the counterparty or a termination of the agreement, the terms of the ISDA Master Agreements do not result in an offset of reported amounts of financial assets and financial liabilities in the Statement of Assets and Liabilities across transactions between the Fund and the applicable counterparty. The enforceability of the right to offset may vary by jurisdiction.
Collateral requirements differ by type of derivative. Collateral or margin requirements are set by the broker or exchange clearinghouse for exchange traded derivatives while collateral terms are contract specific for OTC traded derivatives. Cash collateral that has been pledged to cover obligations of the Fund under derivative contracts, if any, will be reported separately in the Statement of Assets and Liabilities. Securities pledged as collateral, if any, for the same purpose are noted in the Schedule of Investments.
As of December 31, 2022, the Fund held forward foreign currency contracts with credit related contingent features which had a liability position of $17,982,062. If a contingent feature in the master agreements would have been triggered, the Fund would have been required to pay this amount to its derivatives counterparties As of December 31, 2022, the Fund had posted with its counterparties cash and/or securities as collateral to cover the net liability of these derivatives amounting to $4,300,000 which could be used to reduce the required payment.
At December 31, 2022, the Fund held cash collateral from Barclays Bank PLC in the amount of $310,000. This amount could be used to reduce the Fund’s exposure to the counterparty in the event of default.
(h) Security transactions and investment income. Security transactions are accounted for on a trade date basis. Interest income (including interest income from payment-in-kind securities), adjusted for amortization of premium and accretion of discount, is recorded on the accrual basis. Paydown gains and losses on mortgage- and asset-backed securities are recorded as adjustments to interest income. Dividend income is recorded on the ex-dividend date for dividends received in cash and/or securities. Foreign dividend income is recorded
| | | | | | |
| BrandywineGLOBAL — Global Opportunities Bond Fund 2022 Annual Report | | | | | 35 | |
Notes to financial statements (cont’d)
on the ex-dividend date or as soon as practicable after the Fund determines the existence of a dividend declaration after exercising reasonable due diligence. The cost of investments sold is determined by use of the specific identification method. To the extent any issuer defaults or a credit event occurs that impacts the issuer, the Fund may halt any additional interest income accruals and consider the realizability of interest accrued up to the date of default or credit event.
(i) Distributions to shareholders. Distributions from net investment income of the Fund, if any, are declared and paid on a quarterly basis. Distributions of net realized gains, if any, are declared at least annually. Distributions to shareholders of the Fund are recorded on the ex-dividend date and are determined in accordance with income tax regulations, which may differ from GAAP.
(j) Share class accounting. Investment income, common expenses and realized/ unrealized gains (losses) on investments are allocated to the various classes of the Fund on the basis of daily net assets of each class. Fees relating to a specific class are charged directly to that share class.
(k) Compensating balance arrangements. The Fund has an arrangement with its custodian bank whereby a portion of the custodian’s fees are paid indirectly by credits earned on the Fund’s cash on deposit with the bank.
(l) Federal and other taxes. It is the Fund’s policy to comply with the federal income and excise tax requirements of the Internal Revenue Code of 1986 (the “Code”), as amended, applicable to regulated investment companies. Accordingly, the Fund intends to distribute its taxable income and net realized gains, if any, to shareholders in accordance with timing requirements imposed by the Code. Therefore, no federal or state income tax provision is required in the Fund’s financial statements.
Management has analyzed the Fund’s tax positions taken on income tax returns for all open tax years and has concluded that as of December 31, 2022, no provision for income tax is required in the Fund’s financial statements. The Fund’s federal and state income and federal excise tax returns for tax years for which the applicable statutes of limitations have not expired are subject to examination by the Internal Revenue Service and state departments of revenue.
Under the applicable foreign tax laws, a withholding tax may be imposed on interest, dividends and capital gains at various rates. Realized gains upon disposition of securities issued in or by certain foreign countries are subject to capital gains tax imposed by those countries.
(m) Reclassification. GAAP requires that certain components of net assets be reclassified to reflect permanent differences between financial and tax reporting. These reclassifications have no effect on net assets or net asset value per share. During the current year, the following reclassifications have been made:
| | | | | | |
| | | Total Distributable
Earnings (Loss) | | | | Paid-in
Capital |
| (a) | | $7,680,595 | | | | $(7,680,595) |
| (a) | Reclassifications are due to a taxable overdistribution. |
| | | | |
| 36 | | | | BrandywineGLOBAL — Global Opportunities Bond Fund 2022 Annual Report |
2. Investment management agreement and other transactions with affiliates
Legg Mason Partners Fund Advisor, LLC (“LMPFA”) is the Fund’s investment manager and Brandywine Global Investment Management, LLC (“Brandywine Global”) is the Fund’s subadviser. LMPFA and Brandywine Global are indirect, wholly-owned subsidiaries of Franklin Resources, Inc. (“Franklin Resources”).
LMPFA provides administrative and certain oversight services to the Fund. The Fund pays an investment management fee, calculated daily and paid monthly, at an annual rate of 0.50% of the Fund’s average daily net assets. LMPFA delegates to the subadviser the day-to-day portfolio management of the Fund. For its services, LMPFA pays Brandywine Global a fee monthly, at an annual rate equal to 90% of the net management fee it receives from the Fund.
As a result of expense limitation arrangements between the Fund and LMPFA, the ratio of total annual fund operating expenses, other than interest, brokerage commissions, dividend expense on short sales, taxes, extraordinary expenses and acquired fund fees and expenses, to average net assets of Class A, Class C, Class C1, Class FI, Class R, Class I and Class IS shares did not exceed 1.00%, 1.75%, 1.45%, 1.00%, 1.25%, 0.75% and 0.65%, respectively. In addition, the ratio of total annual fund operating expenses for Class IS shares did not exceed the ratio of total annual fund operating expenses for Class I shares. These expense limitation arrangements cannot be terminated prior to December 31, 2024 without the Board of Trustees’ consent. In addition, the manager has agreed to waive the Fund’s management fee to an extent sufficient to offset the net management fee payable in connection with any investment in an affiliated money market fund (the “affiliated money market fund waiver”). The affiliated money market fund waiver is not subject to the recapture provision discussed below.
During the year ended December 31, 2022, fees waived and/or expenses reimbursed amounted to $45,626, which included an affiliated money market fund waiver of $41,085.
LMPFA is permitted to recapture amounts waived and/or reimbursed to a class within three years after the fiscal year in which LMPFA earned the fee or incurred the expense if the class’ total annual fund operating expenses have fallen to a level below the expense limitation (“expense cap”) in effect at the time the fees were earned or the expenses incurred. In no case will LMPFA recapture any amount that would result, on any particular business day of the Fund, in the class’ total annual fund operating expenses exceeding the expense cap or any other lower limit then in effect.
Pursuant to these arrangements, at December 31, 2022, the Fund had remaining fee waivers and/or expense reimbursements subject to recapture by LMPFA and respective dates of expiration as follows:
| | | | | | | | | | | | | | | | |
| | | Class A | | | Class C1 | | | Class FI | | | Class R | |
| Expires December 31, 2023 | | $ | 19,492 | | | | — | | | | — | | | | $4,617 | |
| Expires December 31, 2024 | | | — | | | $ | 7 | | | | — | | | | 3,421 | |
| Expires December 31, 2025 | | | 1,491 | | | | 50 | | | | $547 | | | | 848 | |
| Total fee waivers/expense reimbursements subject to recapture | | $ | 20,983 | | | $ | 57 | | | $ | 547 | | | $ | 8,886 | |
For the year ended December 31, 2022, LMPFA did not recapture any fees.
| | | | | | |
| BrandywineGLOBAL — Global Opportunities Bond Fund 2022 Annual Report | | | | | 37 | |
Notes to financial statements (cont’d)
Franklin Distributors, LLC (“Franklin Distributors”) serves as the Fund’s sole and exclusive distributor. Franklin Distributors is an indirect, wholly-owned broker-dealer subsidiary of Franklin Resources.
There is a maximum initial sales charge of 3.75% (4.25% prior to August 15, 2022) for Class A shares. There is a contingent deferred sales charge (“CDSC”) of 1.00% on Class C and Class C1 shares, which applies if redemption occurs within 12 months from purchase payment. In certain cases, Class A shares have a 1.00% CDSC, which applies if redemption occurs within 18 months from purchase payment. This CDSC only applies to those purchases of Class A shares, which, when combined with current holdings of other shares of funds sold by Franklin Distributors, equal or exceed $500,000 ($1,000,000 prior to August 15, 2022) in the aggregate. These purchases do not incur an initial sales charge.
For the year ended December 31, 2022, sales charges retained by and CDSCs paid to Franklin Distributors and its affiliates, if any, were as follows:
| | | | |
| | | Class A | |
| Sales charges | | $ | 7,218 | |
| CDSCs | | | 452 | |
Under a Deferred Compensation Plan (the “Plan”), Trustees may have elected to defer receipt of all or a specified portion of their compensation. A participating Trustee selected one or more funds managed by LMPFA or an affiliate of LMPFA in which his or her deferred trustee’s fees were deemed to be invested. Deferred amounts remain in the Fund until distributed in accordance with the Plan. In May 2015, the Board of Trustees approved an amendment to the Plan so that effective January 1, 2016, no compensation earned after that date may be deferred under the Plan.
All officers and one Trustee of the Trust are employees of Franklin Resources or its affiliates and do not receive compensation from the Trust.
3. Investments
During the year ended December 31, 2022, the aggregate cost of purchases and proceeds from sales of investments (excluding short-term investments) and U.S. Government & Agency Obligations were as follows:
| | | | | | | | |
| | | Investments | | | U.S. Government &
Agency Obligations | |
| Purchases | | $ | 781,531,663 | | | $ | 1,164,313,792 | |
| Sales | | | 820,325,660 | | | | 1,445,138,372 | |
| | | | |
| 38 | | | | BrandywineGLOBAL — Global Opportunities Bond Fund 2022 Annual Report |
At December 31, 2022, the aggregate cost of investments and the aggregate gross unrealized appreciation and depreciation of investments for federal income tax purposes were as follows:
| | | | | | | | | | | | | | | | |
| | | Cost | | | Gross
Unrealized
Appreciation | | | Gross
Unrealized
Depreciation | | | Net
Unrealized
Appreciation
(Depreciation) | |
| Securities | | $ | 2,261,753,223 | | | $ | 9,895,168 | | | $ | (359,298,804) | | | $ | (349,403,636) | |
| Futures contracts | | | — | | | | — | | | | (4,003,655) | | | | (4,003,655) | |
| Forward foreign currency contracts | | | — | | | | 44,164,578 | | | | (17,982,062) | | | | 26,182,516 | |
4. Derivative instruments and hedging activities
Below is a table, grouped by derivative type, that provides information about the fair value and the location of derivatives within the Statement of Assets and Liabilities at December 31, 2022.
| | | | | | | | | | | | |
| ASSET DERIVATIVES1 | |
| | | | | | | | | Foreign
Exchange Risk | |
| Forward foreign currency contracts | | | | | | | | | | $ | 44,164,578 | |
|
| LIABILITY DERIVATIVES1 | |
| | | Interest
Rate Risk | | | Foreign
Exchange Risk | | | Total | |
| Futures contracts2 | | $ | 4,003,655 | | | | — | | | $ | 4,003,655 | |
| Forward foreign currency contracts | | | — | | | $ | 17,982,062 | | | | 17,982,062 | |
| Total | | $ | 4,003,655 | | | $ | 17,982,062 | | | $ | 21,985,717 | |
| 1 | Generally, the balance sheet location for asset derivatives is receivables/net unrealized appreciation and for liability derivatives is payables/net unrealized depreciation. |
| 2 | Includes cumulative unrealized appreciation (depreciation) of futures contracts as reported in the Schedule of Investments. Only net variation margin is reported within the receivables and/or payables on the Statement of Assets and Liabilities. |
The following tables provide information about the effect of derivatives and hedging activities on the Fund’s Statement of Operations for the year ended December 31, 2022. The first table provides additional detail about the amounts and sources of gains (losses) realized on derivatives during the period. The second table provides additional information about the change in net unrealized appreciation (depreciation) resulting from the Fund’s derivatives and hedging activities during the period.
| | | | | | | | | | | | |
| AMOUNT OF NET REALIZED GAIN (LOSS) ON DERIVATIVES RECOGNIZED | |
| | | Interest Rate Risk | | | Foreign Exchange Risk | | | Total | |
| Futures contracts | | $ | (84,173,936) | | | | — | | | $ | (84,173,936) | |
| Forward foreign currency contracts | | | — | | | $ | (199,851,897) | | | | (199,851,897) | |
| Total | | $ | (84,173,936) | | | $ | (199,851,897) | | | $ | (284,025,833) | |
| | | | | | |
| BrandywineGLOBAL — Global Opportunities Bond Fund 2022 Annual Report | | | | | 39 | |
Notes to financial statements (cont’d)
| | | | | | | | | | | | |
| CHANGE IN NET UNREALIZED APPRECIATION (DEPRECIATION) ON DERIVATIVES RECOGNIZED | |
| | | Interest
Rate Risk | | | Foreign
Exchange Risk | | | Total | |
| Futures contracts | | $ | (647,745) | | | | — | | | $ | (647,745) | |
| Forward foreign currency contracts | | | — | | | $ | 31,575,786 | | | | 31,575,786 | |
| Total | | $ | (647,745) | | | $ | 31,575,786 | | | $ | 30,928,041 | |
During the year ended December 31, 2022, the volume of derivative activity for the Fund was as follows:
| | | | |
| | | Average Market
Value | |
| Futures contracts (to buy) | | $ | 305,105,096 | |
| Forward foreign currency contracts (to buy) | | | 1,830,177,142 | |
| Forward foreign currency contracts (to sell) | | | 1,135,650,964 | |
The following table presents the Fund’s OTC derivative assets and liabilities by counterparty net of amounts available for offset under an ISDA Master Agreement and net of the related collateral pledged (received) by the Fund as of December 31, 2022.
| | | | | | | | | | | | | | | | | | | | |
| Counterparty | | Gross Assets
Subject to
Master
Agreements1 | | | Gross
Liabilities
Subject to
Master
Agreements1 | | | Net Assets
(Liabilities)
Subject to
Master
Agreements | | | Collateral
Pledged
(Received)2,3 | | | Net
Amount4,5 | |
| Barclays Bank PLC | | $ | 15,664,868 | | | | — | | | $ | 15,664,868 | | | $ | (310,000) | | | $ | 15,354,868 | |
| Citibank N.A. | | | 2,467,130 | | | $ | (12,589,721) | | | | (10,122,591) | | | | 2,140,000 | | | | (7,982,591) | |
| HSBC Securities Inc. | | | 8,901,073 | | | | (2,921,195) | | | | 5,979,878 | | | | 490,000 | | | | 6,469,878 | |
| JPMorgan Chase & Co. | | | 16,932,765 | | | | (1,731,041) | | | | 15,201,724 | | | | 1,670,000 | | | | 16,871,724 | |
| Morgan Stanley & Co. Inc. | | | 198,742 | | | | (740,105) | | | | (541,363) | | | | — | | | | (541,363) | |
| Total | | $ | 44,164,578 | | | $ | (17,982,062) | | | $ | 26,182,516 | | | $ | 3,990,000 | | | $ | 30,172,516 | |
| 1 | Absent an event of default or early termination, derivative assets and liabilities are presented gross and not offset in the Statement of Assets and Liabilities. |
| 2 | Gross amounts are not offset in the Statement of Assets and Liabilities. |
| 3 | In some instances, the actual collateral received and/or pledged may be more than the amount shown here due to overcollateralization. |
| 4 | Net amount may also include forward foreign currency exchange contracts that are not required to be collateralized. |
| 5 | Represents the net amount receivable (payable) from (to) the counterparty in the event of default. |
5. Class specific expenses, waivers and/or expense reimbursements
The Fund has adopted a Rule 12b-1 shareholder services and distribution plan and under that plan the Fund pays service and/or distribution fees with respect to its Class A, Class C, Class C1, Class FI and Class R shares calculated at the annual rate of 0.25%, 1.00%, 0.70%, 0.25% and 0.50% of the average daily net assets of each class, respectively. Service and/or distribution fees are accrued daily and paid monthly.
| | | | |
| 40 | | | | BrandywineGLOBAL — Global Opportunities Bond Fund 2022 Annual Report |
For the year ended December 31, 2022, class specific expenses were as follows:
| | | | | | | | |
| | | Service and/or
Distribution Fees | | | Transfer Agent
Fees | |
| Class A | | $ | 278,616 | † | | $ | 223,015 | |
| Class C | | | 44,655 | | | | 5,118 | |
| Class C1 | | | 416 | | | | 169 | |
| Class FI | | | 47,028 | | | | 37,717 | |
| Class R | | | 35,193 | | | | 14,709 | |
| Class I | | | — | | | | 847,111 | |
| Class IS | | | — | | | | 68,284 | |
| Total | | $ | 405,908 | | | $ | 1,196,123 | |
| † | Amount shown is exclusive of expense reimbursements. For the year ended December 31, 2022, the service and/or distribution fees reimbursed amounted to $1,605 for Class A shares. |
For the year ended December 31, 2022, waivers and/or expense reimbursements by class were as follows:
| | | | |
| | | Waivers/Expense
Reimbursements | |
| Class A | | $ | 5,157 | |
| Class C | | | 80 | |
| Class C1 | | | 50 | |
| Class FI | | | 893 | |
| Class R | | | 978 | |
| Class I | | | 13,057 | |
| Class IS | | | 25,411 | |
| Total | | $ | 45,626 | |
6. Distributions to shareholders by class
| | | | | | | | |
| | | Year Ended
December 31, 2022 | | | Year Ended
December 31, 2021 | |
| Net Investment Income: | | | | | | | | |
| Class A | | $ | 5,919,454 | | | $ | 2,556,582 | |
| Class A2 | | | — | | | | — | |
| Class C | | | 158,241 | | | | 73,427 | |
| Class C1 | | | 3,186 | | | | 1,531 | |
| Class FI | | | 968,501 | | | | 415,519 | |
| Class R | | | 378,136 | | | | 117,506 | |
| Class I | | | 40,613,459 | | | | 16,745,850 | |
| Class IS | | | 79,959,415 | | | | 34,939,955 | |
| Total | | $ | 128,000,392 | | | $ | 54,850,370 | |
7. Shares of beneficial interest
At December 31, 2022, the Trust had an unlimited number of shares of beneficial interest authorized with a par value of $0.00001 per share. The Fund has the ability to issue multiple classes of shares. Each class of shares represents an identical interest and has the same
| | | | | | |
| BrandywineGLOBAL — Global Opportunities Bond Fund 2022 Annual Report | | | | | 41 | |
Notes to financial statements (cont’d)
rights, except that each class bears certain direct expenses, including those specifically related to the distribution of its shares.
Transactions in shares of each class were as follows:
| | | | | | | | | | | | | | | | |
| | | Year Ended
December 31, 2022 | | | Year Ended
December 31, 2021 | |
| | | Shares | | | Amount | | | Shares | | | Amount | |
| Class A | | | | | | | | | | | | | | | | |
| Shares sold | | | 3,200,290 | | | $ | 30,967,894 | | | | 5,191,198 | | | $ | 60,315,766 | |
| Shares issued on reinvestment | | | 601,447 | | | | 5,329,139 | | | | 207,025 | | | | 2,330,343 | |
| Shares repurchased | | | (4,337,587) | | | | (41,869,584) | | | | (6,206,713) | | | | (71,011,894) | |
| Net decrease | | | (535,850) | | | $ | (5,572,551) | | | | (808,490) | | | $ | (8,365,785) | |
| | | | |
| Class A2† | | | | | | | | | | | | | | | | |
| Shares sold | | | — | | | | — | | | | 64,902 | | | $ | 761,658 | |
| Shares issued on reinvestment | | | — | | | | — | | | | — | | | | — | |
| Shares repurchased | | | — | | | | — | | | | (1,167,412) | | | | (13,679,904) | |
| Net decrease | | | — | | | | — | | | | (1,102,510) | | | $ | (12,918,246) | |
| | | | |
| Class C | | | | | | | | | | | | | | | | |
| Shares sold | | | 33,986 | | | $ | 321,306 | | | | 230,737 | | | $ | 2,644,078 | |
| Shares issued on reinvestment | | | 17,594 | | | | 150,857 | | | | 6,550 | | | | 71,262 | |
| Shares repurchased | | | (349,236) | | | | (3,205,122) | | | | (333,664) | | | | (3,783,397) | |
| Net decrease | | | (297,656) | | | $ | (2,732,959) | | | | (96,377) | | | $ | (1,068,057) | |
| | | | |
| Class C1 | | | | | | | | | | | | | | | | |
| Shares sold | | | 763 | | | $ | 7,536 | | | | 1,687 | | | $ | 20,821 | |
| Shares issued on reinvestment | | | 354 | | | | 3,186 | | | | 133 | | | | 1,531 | |
| Shares repurchased | | | (285) | | | | (2,756) | | | | (86,081) | | | | (988,380) | |
| Net increase (decrease) | | | 832 | | | $ | 7,966 | | | | (84,261) | | | $ | (966,028) | |
| | | | |
| Class FI | | | | | | | | | | | | | | | | |
| Shares sold | | | 553,169 | | | $ | 5,254,816 | | | | 1,276,416 | | | $ | 14,675,531 | |
| Shares issued on reinvestment | | | 108,250 | | | | 947,506 | | | | 37,015 | | | | 410,260 | |
| Shares repurchased | | | (866,980) | | | | (8,072,723) | | | | (707,312) | | | | (8,056,867) | |
| Net increase (decrease) | | | (205,561) | | | $ | (1,870,401) | | | | 606,119 | | | $ | 7,028,924 | |
| | | | |
| Class R | | | | | | | | | | | | | | | | |
| Shares sold | | | 212,153 | | | $ | 2,073,863 | | | | 472,158 | | | $ | 5,399,240 | |
| Shares issued on reinvestment | | | 43,153 | | | | 377,645 | | | | 10,609 | | | | 117,371 | |
| Shares repurchased | | | (242,416) | | | | (2,310,147) | | | | (312,958) | | | | (3,599,165) | |
| Net increase | | | 12,890 | | | $ | 141,361 | | | | 169,809 | | | $ | 1,917,446 | |
| | | | |
| Class I | | | | | | | | | | | | | | | | |
| Shares sold | | | 28,232,738 | | | $ | 275,004,016 | | | | 30,632,171 | | | $ | 352,654,070 | |
| Shares issued on reinvestment | | | 4,141,221 | | | | 36,666,274 | | | | 1,318,817 | | | | 14,757,307 | |
| Shares repurchased | | | (30,648,176) | | | | (289,914,829) | | | | (22,691,357) | | | | (259,244,600) | |
| Net increase | | | 1,725,783 | | | $ | 21,755,461 | | | | 9,259,631 | | | $ | 108,166,777 | |
| | | | |
| 42 | | | | BrandywineGLOBAL — Global Opportunities Bond Fund 2022 Annual Report |
| | | | | | | | | | | | | | | | |
| | | Year Ended
December 31, 2022 | | | Year Ended
December 31, 2021 | |
| | | Shares | | | Amount | | | Shares | | | Amount | |
| Class IS | | | | | | | | | | | | | | | | |
| Shares sold | | | 33,859,911 | | | $ | 332,325,171 | | | | 56,365,400 | | | $ | 649,046,272 | |
| Shares issued on reinvestment | | | 8,788,684 | | | | 77,996,681 | | | | 3,034,351 | | | | 34,052,136 | |
| Shares repurchased | | | (45,551,298) | | | | (437,154,391) | | | | (34,757,918) | | | | (400,658,035) | |
| Net increase (decrease) | | | (2,902,703) | | | $ | (26,832,539) | | | | 24,641,833 | | | $ | 282,440,373 | |
| † | On June 24, 2021, the Fund converted 1,061,508 Class A2 shares into 1,056,854 Class A shares, valued at $12,439,181. These amounts are reflected in the Class A shares sold and Class A2 shares repurchased, respectively. |
8. Transactions with affiliated company
As defined by the 1940 Act, an affiliated company is one in which the Fund owns 5% or more of the outstanding voting securities, or a company which is under common ownership or control with the Fund. The following company was considered an affiliated company for all or some portion of the year ended December 31, 2022. The following transactions were effected in such company for the year ended December 31, 2022.
| | | | | | | | | | | | | | | | | | | | |
| | | Affiliate
Value at
December 31,
2021 | | | Purchased | | | Sold | |
|
|
| | Cost | | | Shares | | | Proceeds | | | Shares | |
| Western Asset Premier Institutional U.S. Treasury Reserves, Premium Shares | | $ | 53,872,477 | | | $ | 1,535,284,477 | | | | 1,535,284,477 | | | $ | 1,562,833,494 | | | | 1,562,833,494 | |
| | | | | | | | | | | | | | | | |
| (cont’d) | | Realized
Gain (Loss) | | | Dividend
Income | | | Net Increase
(Decrease) in
Unrealized
Appreciation
(Depreciation) | | | Affiliate Value at
December 31,
2022 | |
| Western Asset Premier Institutional U.S. Treasury Reserves, Premium Shares | | | — | | | $ | 797,317 | | | | — | | | $ | 26,323,460 | |
9. Redemption facility
The Fund and certain other participating funds within the Trust, together with other U.S. registered and foreign investment funds (collectively, the “Borrowers”) managed by LMPFA or Franklin Resources, are borrowers in a joint syndicated senior unsecured credit facility totaling $2.675 billion (the “Global Credit Facility”). The Global Credit Facility provides a source of funds to the Borrowers for temporary and emergency purposes, including the ability to meet future unanticipated or unusually large redemption requests. Unless renewed, the Global Credit Facility will terminate on February 2, 2024.
Under the terms of the Global Credit Facility, the Fund shall, in addition to interest charged on any borrowings made by the Fund and other costs incurred by the Fund, pay its share of fees and expenses incurred in connection with the implementation and maintenance of the
| | | | | | |
| BrandywineGLOBAL — Global Opportunities Bond Fund 2022 Annual Report | | | | | 43 | |
Notes to financial statements (cont’d)
Global Credit Facility, based upon its relative share of the aggregate net assets of all the Borrowers, including an annual commitment fee of 0.15% based upon the unused portion of the Global Credit Facility. These fees are reflected in the Statement of Operations. The Fund did not utilize the Global Credit Facility during the year ended December 31, 2022.
10. Income tax information and distributions to shareholders
The tax character of distributions paid during the fiscal years ended December 31, was as follows:
| | | | | | | | |
| | | 2022 | | | 2021 | |
| Distributions paid from: | | | | | | | | |
| Ordinary income | | $ | 128,000,392 | | | $ | 54,850,370 | |
As of December 31, 2022, the components of distributable earnings (loss) on a tax basis were as follows:
| | | | |
| Deferred capital losses* | | $ | (341,494,570) | |
| Other book/tax temporary differences(a) | | | (62,913,791) | |
| Unrealized appreciation (depreciation)(b) | | | (327,298,825) | |
| Total distributable earnings (loss) — net | | $ | (731,707,186) | |
| * | These capital losses have been deferred in the current year as either short-term or long-term losses. The losses will be deemed to occur on the first day of the next taxable year in the same character as they were originally deferred and will be available to offset future taxable capital gains. |
| (a) | Other book/tax temporary differences are attributable to the tax deferral of losses on straddles, the realization for tax purposes of unrealized gains (losses) on certain forwards and foreign currency contracts, the deferral of certain late year losses for tax purposes and book/tax differences in the timing of the deductibility of various expenses. |
| (b) | The difference between book-basis and tax-basis unrealized appreciation (depreciation) is attributable to the tax deferral of losses on wash sales and book/tax differences in the accrual of interest income on securities in default. |
11. Recent accounting pronouncement
In March 2020, the Financial Accounting Standards Board (FASB) issued Accounting Standards Update (ASU) No. 2020-04, Reference Rate Reform (Topic 848) – Facilitation of the Effects of Reference Rate Reform on Financial Reporting. In January 2021, the FASB issued ASU No. 2021-01, with further amendments to Topic 848. The amendments in the ASUs provide optional temporary accounting recognition and financial reporting relief from the effect of certain types of contract modifications due to the planned discontinuation of the LIBOR and other interbank-offered based reference rates as of the end of 2021 and 2023. The ASUs are effective for certain reference rate-related contract modifications that occur during the period March 12, 2020 through December 31, 2022. Management has reviewed the requirements and believes the adoption of these ASUs will not have a material impact on the financial statements.
12. Other matters
The outbreak of the respiratory illness COVID-19 (commonly referred to as “coronavirus”) has continued to rapidly spread around the world, causing considerable uncertainty for the global economy and financial markets. The ultimate economic fallout from the pandemic, and the long-term impact on economies, markets, industries and individual issuers, are not
| | | | |
| 44 | | | | BrandywineGLOBAL — Global Opportunities Bond Fund 2022 Annual Report |
known. The COVID-19 pandemic could adversely affect the value and liquidity of the Fund’s investments, impair the Fund’s ability to satisfy redemption requests, and negatively impact the Fund’s performance. In addition, the outbreak of COVID-19, and measures taken to mitigate its effects, could result in disruptions to the services provided to the Fund by its service providers.
* * *
The Fund’s investments, payment obligations, and financing terms may be based on floating rates, such as the London Interbank Offered Rate, or “LIBOR,” which is the offered rate for short-term Eurodollar deposits between major international banks. On March 5, 2021, the ICE Benchmark Administration, the administrator of LIBOR, stated that it will cease the publication of the overnight and one-, three-, six- and twelve-month USD LIBOR settings immediately following the LIBOR publication on Friday, June 30, 2023. All other LIBOR settings, including the one-week and two-month USD LIBOR settings, have ceased publication as of January 1, 2022. In March 2022, the U.S. federal government enacted legislation to establish a process for replacing LIBOR in certain existing contracts that do not already provide for the use of a clearly defined or practicable replacement benchmark rate as described in the legislation. Generally speaking, for contracts that do not contain a fallback provision as described in the legislation, a benchmark replacement recommended by the Federal Reserve Board will effectively automatically replace the USD LIBOR benchmark in the contract after June 30, 2023. The recommended benchmark replacement will be based on the Secured Overnight Financing Rate (SOFR) published by the Federal Reserve Bank of New York, including certain spread adjustments and benchmark replacement conforming changes. There remains uncertainty regarding the impact of the transition from LIBOR on the Fund’s transactions and the financial markets generally.
* * *
Russia’s military invasion of Ukraine in February 2022, the resulting responses by the United States and other countries, and the potential for wider conflict could increase volatility and uncertainty in the financial markets and adversely affect regional and global economies. The United States and other countries have imposed broad-ranging economic sanctions on Russia and certain Russian individuals, banking entities and corporations as a response to its invasion of Ukraine. The United States and other countries have also imposed economic sanctions on Belarus and may impose sanctions on other countries that support Russia’s military invasion. These sanctions, as well as any other economic consequences related to the invasion, such as additional sanctions, boycotts or changes in consumer or purchaser preferences or cyberattacks on governments, companies or individuals, may further decrease the value and liquidity of certain Russian securities and securities of issuers in other countries that are subject to economic sanctions related to the invasion. To the extent that the Fund has exposure to Russian investments or investments in countries affected by the invasion, the Fund’s ability to price, buy, sell, receive or deliver such investments was impaired. The Fund could determine at any time that certain of the most affected securities have little or no value. In addition, any exposure that the Fund may have to counterparties in Russia or in countries affected by the invasion could negatively impact the Fund’s portfolio. The extent and duration of Russia’s military actions and the repercussions of such actions (including any retaliatory actions or countermeasures that may be taken by those subject to sanctions) are impossible to predict, but could result in significant market disruptions, including in the oil and natural gas markets, and may
| | | | | | |
| BrandywineGLOBAL — Global Opportunities Bond Fund 2022 Annual Report | | | | | 45 | |
Notes to financial statements (cont’d)
negatively affect global supply chains, inflation and global growth. These and any related events could significantly impact the Fund’s performance and the value of an investment in the Fund, even beyond any direct exposure the Fund may have to Russian issuers or issuers in other countries affected by the invasion. At December 31, 2022, the Fund had 0.16% of its net assets invested in securities with significant economic risk or exposure to Russia.
| | | | |
| 46 | | | | BrandywineGLOBAL — Global Opportunities Bond Fund 2022 Annual Report |
Report of independent registered public accounting firm
To the Board of Trustees of Legg Mason Global Asset Management Trust and Shareholders of BrandywineGLOBAL — Global Opportunities Bond Fund
Opinion on the Financial Statements
We have audited the accompanying statement of assets and liabilities, including the schedule of investments, of BrandywineGLOBAL — Global Opportunities Bond Fund (one of the funds constituting Legg Mason Global Asset Management Trust, referred to hereafter as the “Fund”) as of December 31, 2022, the related statement of operations for the year ended December 31, 2022, the statement of changes in net assets for each of the two years in the period ended December 31, 2022, including the related notes, and the financial highlights for each of the five years in the period ended December 31, 2022 (collectively referred to as the “financial statements”). In our opinion, the financial statements present fairly, in all material respects, the financial position of the Fund as of December 31, 2022, the results of its operations for the year then ended, the changes in its net assets for each of the two years in the period ended December 31, 2022 and the financial highlights for each of the five years in the period ended December 31, 2022 in conformity with accounting principles generally accepted in the United States of America.
Basis for Opinion
These financial statements are the responsibility of the Fund’s management. Our responsibility is to express an opinion on the Fund’s financial statements based on our audits. We are a public accounting firm registered with the Public Company Accounting Oversight Board (United States) (PCAOB) and are required to be independent with respect to the Fund in accordance with the U.S. federal securities laws and the applicable rules and regulations of the Securities and Exchange Commission and the PCAOB.
We conducted our audits of these financial statements in accordance with the standards of the PCAOB. Those standards require that we plan and perform the audit to obtain reasonable assurance about whether the financial statements are free of material misstatement, whether due to error or fraud.
Our audits included performing procedures to assess the risks of material misstatement of the financial statements, whether due to error or fraud, and performing procedures that respond to those risks. Such procedures included examining, on a test basis, evidence regarding the amounts and disclosures in the financial statements. Our audits also included evaluating the accounting principles used and significant estimates made by management, as well as evaluating the overall presentation of the financial statements. Our procedures included confirmation of securities owned as of December 31, 2022 by correspondence with the custodian and brokers. We believe that our audits provide a reasonable basis
for our opinion.
/s/PricewaterhouseCoopers LLP
Baltimore, Maryland
February 22, 2023
We have served as the auditor of one or more investment companies in the Franklin Templeton Group of Funds since 1948.
| | | | | | |
| BrandywineGLOBAL — Global Opportunities Bond Fund 2022 Annual Report | | | | | 47 | |
Additional information (unaudited)
Information about Trustees and Officers
The business and affairs of BrandywineGLOBAL — Global Opportunities Bond Fund (the “Fund”) are conducted by management under the supervision and subject to the direction of its Board of Trustees. The business address of each Trustee is c/o Jane Trust, Franklin Templeton, 100 International Drive, 11th Floor, Baltimore, Maryland 21202.
Information pertaining to the Trustees and officers of the Fund is set forth below. The Statement of Additional Information includes additional information about Trustees and is available, without charge, upon request by calling the Fund at 877-6LM-FUND/656-3863.
| | |
| Independent Trustees† | | |
| |
| Paul R. Ades | | |
| |
| Year of birth | | 1940 |
| Position(s) with Trust | | Trustee |
| Term of office1 and length of time served2 | | Since 1983 |
| Principal occupation(s) during the past five years | | Paul R. Ades, PLLC (law firm) (since 2000) |
| Number of funds in fund complex overseen by Trustee | | 57 |
| Other board memberships held by Trustee during the past five years | | None |
| |
| Andrew L. Breech | | |
| |
| Year of birth | | 1952 |
| Position(s) with Trust | | Trustee |
| Term of office1 and length of time served2 | | Since 1991 |
| Principal occupation(s) during the past five years | | President, Dealer Operating Control Service, Inc. (automotive retail management) (since 1985) |
| Number of funds in fund complex overseen by Trustee | | 57 |
| Other board memberships held by Trustee during the past five years | | None |
| |
| Althea L. Duersten | | |
| |
| Year of birth | | 1951 |
| Position(s) with Trust | | Trustee and Chair of the Board |
| Term of office1 and length of time served2 | | Since 2014 (Chair of the Board since 2021) |
| Principal occupation(s) during the past five years | | Retired (since 2011); formerly, Chief Investment Officer, North America, JPMorgan Chase (investment bank) and member of JPMorgan Executive Committee (2007 to 2011) |
| Number of funds in fund complex overseen by Trustee | | 57 |
| Other board memberships held by Trustee during the past five years | | Formerly, Non-Executive Director, Rokos Capital Management LLP (2019 to 2020) |
| | | | |
| 48 | | | | BrandywineGLOBAL — Global Opportunities Bond Fund |
| | |
| Independent Trustees† (cont’d) | | |
| |
| Stephen R. Gross | | |
| |
| Year of birth | | 1947 |
| Position(s) with Trust | | Trustee |
| Term of office1 and length of time served2 | | Since 1986 |
| Principal occupation(s) during the past five years | | Chairman Emeritus (since 2011) and formerly, Chairman, HLB Gross Collins, P.C. (accounting and consulting firm) (1979 to 2011); Executive Director of Business Builders Team, LLC (since 2005); Principal, Gross Consulting Group, LLC (since 2011); CEO, Gross Capital Partners, LLC (since 2014); CEO, Trusted CFO Solutions, LLC (since 2011) |
| Number of funds in fund complex overseen by Trustee | | 57 |
| Other board memberships held by Trustee during the past five years | | None |
| |
| Susan M. Heilbron | | |
| |
| Year of birth | | 1945 |
| Position(s) with Trust | | Trustee |
| Term of office1 and length of time served2 | | Since 1991 |
| Principal occupation(s) during the past five years | | Retired; formerly, President, Lacey & Heilbron (communications consulting) (1990 to 2002); General Counsel and Executive Vice President, The Trump Organization (1986 to 1990); Senior Vice President, New York State Urban Development Corporation (1984 to 1986); Associate, Cravath, Swaine & Moore LLP (1980 to 1984 and 1977 to 1979) |
| Number of funds in fund complex overseen by Trustee | | 57 |
| Other board memberships held by Trustee during the past five years | | None |
| |
| Arnold L. Lehman | | |
| |
| Year of birth | | 1944 |
| Position(s) with Trust | | Trustee |
| Term of office1 and length of time served2 | | Since 1982 |
| Principal occupation(s) during the past five years | | Senior Advisor, Phillips (auction house) (since 2015); formerly, Fellow, Ford Foundation (2015 to 2016); Director of the Brooklyn Museum (1997 to 2015) |
| Number of funds in fund complex overseen by Trustee | | 57 |
| Other board memberships held by Trustee during the past five years | | Trustee of American Federation of Arts (since 2002) |
| | | | | | |
| BrandywineGLOBAL — Global Opportunities Bond Fund | | | | | 49 | |
Additional information (unaudited) (cont’d)
Information about Trustees and Officers
| | |
| Independent Trustees† (cont’d) | | |
| |
| Robin J. W. Masters | | |
| |
| Year of birth | | 1955 |
| Position(s) with Trust | | Trustee |
| Term of office1 and length of time served2 | | Since 2002 |
| Principal occupation(s) during the past five years | | Retired; formerly, Chief Investment Officer of ACE Limited (insurance) (1986 to 2000) |
| Number of funds in fund complex overseen by Trustee | | 57 |
| Other board memberships held by Trustee during the past five years | | Director of HSBC Managed Portfolios Limited and HSBC Specialist Funds Limited (since 2020); formerly, Director of Cheyne Capital International Limited (investment advisory firm) (2005 to 2020); Director/ Trustee of Legg Mason Institutional Funds plc, Western Asset Fixed Income Funds plc and Western Asset Debt Securities Fund plc. (2007 to 2011) |
| |
| Ken Miller | | |
| |
| Year of birth | | 1942 |
| |
| Position(s) with Trust | | Trustee |
| Term of office1 and length of time served2 | | Since 1983 |
| Principal occupation(s) during the past five years | | Retired; formerly, President, Young Stuff Apparel Group, Inc. (apparel manufacturer), division of Li & Fung (1963 to 2012) |
| Number of funds in fund complex overseen by Trustee | | 57 |
| Other board memberships held by Trustee during the past five years | | None |
| |
| G. Peter O’Brien | | |
| |
| Year of birth | | 1945 |
| Position(s) with Trust | | Trustee |
| Term of office1 and length of time served2 | | Since 1999 |
| Principal occupation(s) during the past five years | | Retired, Trustee Emeritus of Colgate University (since 2005); Board Member, Hill House, Inc. (residential home care) (since 1999); formerly, Board Member, Bridges School (pre-school) (2006 to 2017); Managing Director, Equity Capital Markets Group of Merrill Lynch & Co. (1971 to 1999) |
| Number of funds in fund complex overseen by Trustee | | Trustee of Legg Mason funds consisting of 57 portfolios; Director/Trustee of the Royce Family of Funds consisting of 16 portfolios |
| Other board memberships held by Trustee during the past five years | | Formerly, Director of TICC Capital Corp. (2003 to 2017) |
| | | | |
| 50 | | | | BrandywineGLOBAL — Global Opportunities Bond Fund |
| | |
| Independent Trustees† (cont’d) | | |
| |
| Thomas F. Schlafly | | |
| |
| Year of birth | | 1948 |
| Position(s) with Trust | | Trustee |
| Term of office1 and length of time served2 | | Since 1983 |
| Principal occupation(s) during the past five years | | Chairman, The Saint Louis Brewery, LLC (brewery) (since 2012); formerly, President, The Saint Louis Brewery, Inc. (1989 to 2012); Senior Counsel (since 2017) and formerly, Partner (2009 to 2016), Thompson Coburn LLP (law firm) |
| Number of funds in fund complex overseen by Trustee | | 57 |
| Other board memberships held by Trustee during the past five years | | Director, CNB St. Louis Bank (since 2020); formerly, Director, Citizens National Bank of Greater St. Louis (2006 to 2020) |
| | |
| Interested Trustee and Officer | | |
| |
| Jane Trust, CFA3 | | |
| |
| Year of birth | | 1962 |
| |
| Position(s) with Trust | | Trustee, President and Chief Executive Officer |
| |
| Term of office1 and length of time served2 | | Since 2015 |
| |
| Principal occupation(s) during the past five years | | Senior Vice President, Fund Board Management, Franklin Templeton (since 2020); Officer and/or Trustee/Director of 127 funds associated with LMPFA or its affiliates (since 2015); President and Chief Executive Officer of LMPFA (since 2015); formerly, Senior Managing Director (2018 to 2020) and Managing Director (2016 to 2018) of Legg Mason & Co., LLC (“Legg Mason & Co.”); Senior Vice President of LMPFA (2015) |
| |
| Number of funds in fund complex overseen by Trustee | | 127 |
| |
| Other board memberships held by Trustee during the past five years | | None |
| | | |
| Additional Officers | | |
| |
Ted P. Becker Franklin Templeton 280 Park Avenue, 8th Floor, New York, NY 10017 | | |
| |
| Year of birth | | 1951 |
| |
| Position(s) with Trust | | Chief Compliance Officer |
| |
| Term of office1 and length of time served2 | | Since 2007 |
| Principal occupation(s) during the past five years | | Vice President, Global Compliance of Franklin Templeton (since 2020); Chief Compliance Officer of LMPFA (since 2006); Chief Compliance Officer of certain funds associated with Legg Mason & Co. or its affiliates (since 2006); formerly, Director of Global Compliance at Legg Mason, Inc. (2006 to 2020); Managing Director of Compliance of Legg Mason & Co. (2005 to 2020) |
| | | | | | |
| BrandywineGLOBAL — Global Opportunities Bond Fund | | | | | 51 | |
Additional information (unaudited) (cont’d)
Information about Trustees and Officers
| | |
| Additional Officers (cont’d) | | |
| |
Susan Kerr Franklin Templeton 280 Park Avenue, 8th Floor, New York, NY 10017 | | |
| |
| Year of birth | | 1949 |
| Position(s) with Trust | | Chief Anti-Money Laundering Compliance Officer |
| Term of office1 and length of time served2 | | Since 2013 |
| Principal occupation(s) during the past five years | | Senior Compliance Analyst, Franklin Templeton (since 2020); Chief Anti-Money Laundering Compliance Officer of certain funds associated with Legg Mason & Co. or its affiliates (since 2013) and Anti-Money Laundering Compliance Officer (since 2012), Senior Compliance Officer (since 2011) and Assistant Vice President (since 2010) of Franklin Distributors, LLC; formerly, Assistant Vice President of Legg Mason & Co. (2010 to 2020) |
| |
Marc A. De Oliveira Franklin Templeton 100 First Stamford Place, 6th Floor, Stamford, CT 06902 | | |
| |
| Year of birth | | 1971 |
| |
| Position(s) with Trust | | Secretary and Chief Legal Officer |
| Term of office1 and length of time served2 | | Since 2020 |
| Principal occupation(s) during the past five years | | Associate General Counsel of Franklin Templeton (since 2020); Assistant Secretary of certain funds associated with Legg Mason & Co. or its affiliates (since 2006); formerly, Managing Director (2016 to 2020) and Associate General Counsel of Legg Mason & Co. (2005 to 2020) |
| |
Thomas C. Mandia Franklin Templeton 100 First Stamford Place, 6th Floor, Stamford, CT 06902 | | |
| |
| Year of birth | | 1962 |
| Position(s) with Trust | | Senior Vice President |
| Term of office1 and length of time served2 | | Since 2020 |
| Principal occupation(s) during the past five years | | Senior Associate General Counsel of Franklin Templeton (since 2020); Secretary of LMPFA (since 2006); Assistant Secretary of certain funds associated with Legg Mason & Co. or its affiliates (since 2006); Secretary of LM Asset Services, LLC (“LMAS”) (since 2002) and Legg Mason Fund Asset Management, Inc. (“LMFAM”) (since 2013) (formerly registered investment advisers); formerly, Managing Director and Deputy General Counsel of Legg Mason & Co. (2005 to 2020) |
| | | | |
| 52 | | | | BrandywineGLOBAL — Global Opportunities Bond Fund |
| | |
| Additional Officers (cont’d) | | |
| |
Christopher Berarducci Franklin Templeton 280 Park Avenue, 8th Floor, New York, NY 10017 | | |
| |
| Year of birth | | 1974 |
| Position(s) with Trust | | Treasurer and Principal Financial Officer |
| Term of office1 and length of time served2 | | Since 2010 and 2019 |
| Principal occupation(s) during the past five years | | Vice President, Fund Administration and Reporting, Franklin Templeton (since 2020); Treasurer (since 2010) and Principal Financial Officer (since 2019) of certain funds associated with Legg Mason & Co. or its affiliates; formerly, Managing Director (2020), Director (2015 to 2020), and Vice President (2011 to 2015) of Legg Mason & Co. |
| |
Jeanne M. Kelly Franklin Templeton 280 Park Avenue, 8th Floor, New York, NY 10017 | | |
| |
| Year of birth | | 1951 |
| Position(s) with Trust | | Senior Vice President |
| Term of office1 and length of time served2 | | Since 2007 |
| Principal occupation(s) during the past five years | | U.S. Fund Board Team Manager, Franklin Templeton (since 2020); Senior Vice President of certain funds associated with Legg Mason & Co. or its affiliates (since 2007); Senior Vice President of LMPFA (since 2006); President and Chief Executive Officer of LMAS and LMFAM (since 2015); formerly, Managing Director of Legg Mason & Co. (2005 to 2020); Senior Vice President of LMFAM (2013 to 2015) |
| † | Trustees who are not “interested persons” of the Fund within the meaning of Section 2(a)(19) of the Investment Company Act of 1940, as amended (the “1940 Act”). |
| 1 | Each Trustee and officer serves until his or her respective successor has been duly elected and qualified or until his or her earlier death, resignation, retirement or removal. |
| 2 | Indicates the earliest year in which the Trustee became a board member for a fund in the Legg Mason fund complex or the officer took such office. |
| 3 | Ms. Trust is an “interested person” of the Fund, as defined in the 1940 Act, because of her position with LMPFA and/or certain of its affiliates. |
| | | | | | |
| BrandywineGLOBAL — Global Opportunities Bond Fund | | | | | 53 | |
Important tax information (unaudited)
By mid-February, tax information related to a shareholder’s proportionate share of distributions paid during the preceding calendar year will be received, if applicable. Please also refer to www.franklintempleton.com for per share tax information related to any distributions paid during the preceding calendar year. Shareholders are advised to consult with their tax advisors for further information on the treatment of these amounts on their tax returns.
The following tax information for the Fund is required to be furnished to shareholders with respect to income earned and distributions paid during its fiscal year.
The Fund hereby reports the following amounts, or if subsequently determined to be different, the maximum allowable amounts, for the fiscal year ended December 31, 2022:
| | | | | | | | |
| | | Pursuant to: | | | Amount Reported | |
| Section 163(j) Interest Earned | | § | 163(j) | | | | $81,672,310 | |
| Interest Earned from Federal Obligations | | | Note (1) | | | | $16,636,505 | |
Note (1) - The law varies in each state as to whether and what percentage of dividend income attributable to Federal obligations is exempt from state income tax. Shareholders are advised to consult with their tax advisors to determine if any portion of the dividends received is exempt from state income taxes.
| | | | |
| 54 | | | | BrandywineGLOBAL — Global Opportunities Bond Fund |
BrandywineGLOBAL—
Global Opportunities Bond Fund
Trustees
Paul R. Ades
Andrew L. Breech
Althea L. Duersten
Chair
Stephen R. Gross
Susan M. Heilbron
Arnold L. Lehman
Robin J. W. Masters
Ken Miller
G. Peter O’Brien
Thomas F. Schlafly
Jane Trust
Investment manager
Legg Mason Partners Fund Advisor, LLC
Subadviser
Brandywine Global Investment Management, LLC
Distributor
Franklin Distributors, LLC
Custodian
The Bank of New York Mellon
Transfer agent
Franklin Templeton Investor
Services, LLC
3344 Quality Drive
Rancho Cordova, CA 95670-7313
Independent registered public accounting firm
PricewaterhouseCoopers LLP
Baltimore, MD
BrandywineGLOBAL — Global Opportunities Bond Fund
The Fund is a separate investment series of Legg Mason Global Asset Management Trust, a Maryland statutory trust.
BrandywineGLOBAL — Global Opportunities Bond Fund
Legg Mason Funds
620 Eighth Avenue, 47th Floor
New York, NY 10018
The Fund files its complete schedule of portfolio holdings with the Securities and Exchange Commission (“SEC”) for the first and third quarters of each fiscal year as an exhibit to its reports on Form N-PORT. The Fund’s Forms N-PORT are available on the SEC’s website at www.sec.gov. To obtain information on Form N-PORT, shareholders can call the Fund at 877-6LM-FUND/656-3863.
Information on how the Fund voted proxies relating to portfolio securities during the prior 12-month period ended June 30th of each year and a description of the policies and procedures that the Fund uses to determine how to vote proxies related to portfolio transactions are available (1) without charge, upon request, by calling the Fund at 877-6LM-FUND/656- 3863, (2) at www.franklintempleton.com and (3) on the SEC’s website at www.sec.gov.
This report is submitted for the general information of the shareholders of BrandywineGLOBAL — Global Opportunities Bond Fund. This report is not authorized for distribution to prospective investors in the Fund unless preceded or accompanied by a current prospectus.
Investors should consider the Fund’s investment objectives, risks, charges and expenses carefully before investing. The prospectus contains this and other important information about the Fund. Please read the prospectus carefully before investing.
www.franklintempleton.com
© 2023 Franklin Distributors, LLC, Member FINRA/SIPC. All rights reserved.
Legg Mason Funds Privacy and Security Notice
Your Privacy Is Our Priority
Franklin Templeton* is committed to safeguarding your personal information. This notice is designed to provide you with a summary of the non-public personal information Franklin Templeton may collect and maintain about current or former individual investors; our policy regarding the use of that information; and the measures we take to safeguard the information. We do not sell individual investors’ non-public personal information to anyone and only share it as described in this notice.
Information We Collect
When you invest with us, you provide us with your non-public personal information. We collect and use this information to service your accounts and respond to your requests. The non-public personal information we may collect falls into the following categories:
| • | | Information we receive from you or your financial intermediary on applications or other forms, whether we receive the form in writing or electronically. For example, this information may include your name, address, tax identification number, birth date, investment selection, beneficiary information, and your personal bank account information and/or email address if you have provided that information. |
| • | | Information about your transactions and account history with us, or with other companies that are part of Franklin Templeton, including transactions you request on our website or in our app. This category also includes your communications to us concerning your investments. |
| • | | Information we receive from third parties (for example, to update your address if you move, obtain or verify your email address or obtain additional information to verify your identity). |
| • | | Information collected from you online, such as your IP address or device ID and data gathered from your browsing activity and location. (For example, we may use cookies to collect device and browser information so our website recognizes your online preferences and device information.) Our website contains more information about cookies and similar technologies and ways you may limit them. |
| • | | Other general information that we may obtain about you such as demographic information. |
Disclosure Policy
To better service your accounts and process transactions or services you requested, we may share non-public personal information with other Franklin Templeton companies. From time to time we may also send you information about products/services offered by other Franklin Templeton companies although we will not share your non-public personal information with these companies without first offering you the opportunity to prevent that sharing.
We will only share non-public personal information with outside parties in the limited circumstances permitted by law. For example, this includes situations where we need to share information with companies who work on our behalf to service or maintain your account or process transactions you requested, when the disclosure is to companies assisting us with our own marketing efforts, when the disclosure is to a party representing you, or when required by law (for example, in response to legal process). Additionally, we will ensure that any outside
|
| NOT PART OF THE ANNUAL REPORT |
Legg Mason Funds Privacy and Security Notice (cont’d)
companies working on our behalf, or with whom we have joint marketing agreements, are under contractual obligations to protect the confidentiality of your information, and to use it only to provide the services we asked them to perform.
Confidentiality and Security
Our employees are required to follow procedures with respect to maintaining the confidentiality of our investors’ non-public personal information. Additionally, we maintain physical, electronic and procedural safeguards to protect the information. This includes performing ongoing evaluations of our systems containing investor information and making changes when appropriate.
At all times, you may view our current privacy notice on our website at franklintempleton.com or contact us for a copy at (800) 632-2301.
* For purposes of this privacy notice Franklin Templeton shall refer to the following entities:
Fiduciary Trust International of the South (FTIOS), as custodian for individual retirement plans
Franklin Advisers, Inc.
Franklin Distributors, LLC, including as program manager of the Franklin Templeton 529 College
Savings Plan and the NJBEST 529 College Savings Plan
Franklin Mutual Advisers, LLC
Franklin, Templeton and Mutual Series Funds
Franklin Templeton Institutional, LLC
Franklin Templeton Investments Corp., Canada
Franklin Templeton Investments Management, Limited UK
Franklin Templeton Portfolio Advisors, Inc.
Legg Mason Funds serviced by Franklin Templeton Investor Services, LLC
Templeton Asset Management, Limited
Templeton Global Advisors, Limited
Templeton Investment Counsel, LLC
If you are a customer of other Franklin Templeton affiliates and you receive notices from them, you will need to read those notices separately.
|
| NOT PART OF THE ANNUAL REPORT |
www.franklintempleton.com
© 2023 Franklin Distributors, LLC, Member FINRA/SIPC. All rights reserved.
LMFX013158 2/23 SR23-4586
The registrant has adopted a code of ethics that applies to the registrant’s principal executive officer, principal financial officer, principal accounting officer or controller.
| ITEM 3. | AUDIT COMMITTEE FINANCIAL EXPERT. |
The Board of Trustees of the registrant has determined that Stephen R. Gross possesses the technical attributes identified in Instruction 2(b) of Item 3 to Form N-CSR to qualify as an “audit committee financial expert,” and has designated Stephen R. Gross as the Audit Committee’s financial expert. Stephen R. Gross is an “independent” Trustees pursuant to paragraph (a)(2) of Item 3 to Form N-CSR.
| ITEM 4. | PRINCIPAL ACCOUNTANT FEES AND SERVICES. |
(a) Audit Fees. The aggregate fees billed in the last two fiscal years ending December 31, 2021 and December 31, 2022 (the “Reporting Periods”) for professional services rendered by the Registrant’s principal accountant (the “Auditor”) for the audit of the Registrant’s annual financial statements, or services that are normally provided by the Auditor in connection with the statutory and regulatory filings or engagements for the Reporting Periods, were $184,816 in December 31, 2021 and $210,621 in December 31, 2022.
(b) Audit-Related Fees. The aggregate fees billed in the Reporting Period for assurance and related services by the Auditor that are reasonably related to the performance of the Registrant’s financial statements were $0 in December 31, 2021 and $0 in December 31, 2022.
(c) Tax Fees. The aggregate fees billed in the Reporting Periods for professional services rendered by the Auditor for tax compliance, tax advice and tax planning (“Tax Services”) were $43,000 in December 31, 2021 and $53,000 in December 31, 2022. These services consisted of (i) review or preparation of U.S. federal, state, local and excise tax returns; (ii) U.S. federal, state and local tax planning, advice and assistance regarding statutory, regulatory or administrative developments, and (iii) tax advice regarding tax qualification matters and/or treatment of various financial instruments held or proposed to be acquired or held.
There were no fees billed for tax services by to the service affiliates during the Reporting Periods that required pre-approval by the Audit Auditors Committee.
(d) All Other Fees. The aggregate fees for other fees billed in the Reporting Periods for products and services provided by the Auditor were $0 in December 31, 2021 and $0 in December 31, 2022, other than the services reported in paragraphs (a) through (c) of this item for the Legg Mason Global Asset Management Trust.
All Other Fees. There were no other non-audit services rendered by the Auditor to Legg Mason Partners Fund Advisors, LLC (“LMPFA”), and any entity controlling, controlled by or under common control with LMPFA that provided ongoing services to Legg Mason Global Asset Management Trust requiring pre-approval by the Audit Committee in the Reporting Period.
(e) Audit Committee’s pre–approval policies and procedures described in paragraph (c) (7) of Rule 2-01 of Regulation S-X.
(1) The Charter for the Audit Committee (the “Committee”) of the Board of each registered investment company (the “Fund”) advised by LMPFA or one of their affiliates (each, an “Adviser”) requires that the Committee shall approve (a) all audit and permissible non-audit services to be provided to the Fund and (b) all permissible non-audit services to be provided by the Fund’s independent auditors to the Adviser and any Covered Service Providers if the engagement relates directly to the operations and financial reporting of the Fund. The Committee may implement policies and procedures by which such services are approved other than by the full Committee.
The Committee shall not approve non-audit services that the Committee believes may impair the independence of the auditors. As of the date of the approval of this Audit Committee Charter, permissible non-audit services include any professional services (including tax services), that are not prohibited services as described below, provided to the Fund by the independent auditors, other than those provided to the Fund in connection with an audit or a review of the financial statements of the Fund. Permissible non-audit services may not include: (i) bookkeeping or other services related to the accounting records or financial statements of the Fund; (ii) financial information systems design and implementation; (iii) appraisal or valuation services, fairness opinions or contribution-in-kind reports; (iv) actuarial services; (v) internal audit outsourcing services; (vi) management functions or human resources; (vii) broker or dealer, investment adviser or investment banking services; (viii) legal services and expert services unrelated to the audit; and (ix) any other service the Public Company Accounting Oversight Board determines, by regulation, is impermissible.
Pre-approval by the Committee of any permissible non-audit services is not required so long as: (i) the aggregate amount of all such permissible non-audit services provided to the Fund, the Adviser and any service providers controlling, controlled by or under common control with the Adviser that provide ongoing services to the Fund (“Covered Service Providers”) constitutes not more than 5% of the total amount of revenues paid to the independent auditors during the fiscal year in which the permissible non-audit services are provided to (a) the Fund, (b) the Adviser and (c) any entity controlling, controlled by or under common control with the Adviser that provides ongoing services to the Fund during the fiscal year in which the services are provided that would have to be approved by the Committee; (ii) the permissible non-audit services were not recognized by the Fund at the time of the engagement to be non-audit services; and (iii) such services are promptly brought to the attention of the Committee and approved by the Committee (or its delegate(s)) prior to the completion of the audit.
(2) None of the services described in paragraphs (b) through (d) of this Item were performed in reliance on paragraph (c)(7)(i)(C) of Rule 2-01 of Regulation S-X.
(f) Not applicable.
(g) Non-audit fees billed by the Auditor for services rendered to Legg Mason Global Asset Management Trust, LMPFA and any entity controlling, controlled by, or under common control with LMPFA that provides ongoing services to Legg Mason Global Asset Management Trust during the reporting period were $1,470,739 in December 31, 2021 and $744,135 in December 31, 2022.
(h) Yes. Legg Mason Global Asset Management Trust’s Audit Committee has considered whether the provision of non-audit services that were rendered to Service Affiliates, which were not pre-approved (not requiring pre-approval), is compatible with maintaining the Accountant’s independence. All services provided by the Auditor to the Legg Mason Global Asset Management Trust or to Service Affiliates, which were required to be pre-approved, were pre-approved as required.
(i) Not applicable.
(j) Not applicable.
| ITEM 5. | AUDIT COMMITTEE OF LISTED REGISTRANTS. |
| | a) | The independent board members are acting as the registrant’s audit committee as specified in Section 3(a)(58)(B) of the Exchange Act. The Audit Committee consists of the following Board members: |
Paul R. Ades
Andrew L. Breech
Althea L. Duersten
Stephen R. Gross
Susan M. Heilbron
Arnold L. Lehman
Robin J. W. Masters
Ken Miller
G. Peter O’Brien
Thomas F. Schlafly
| ITEM 6. | SCHEDULE OF INVESTMENTS. |
Included herein under Item 1.
| ITEM 7. | DISCLOSURE OF PROXY VOTING POLICIES AND PROCEDURES FOR CLOSED-END MANAGEMENT INVESTMENT COMPANIES. |
Not applicable.
| ITEM 8. | PORTFOLIO MANAGERS OF CLOSED-END MANAGEMENT INVESTMENT COMPANIES. |
Not applicable.
| ITEM 9. | PURCHASES OF EQUITY SECURITIES BY CLOSED-END MANAGEMENT INVESTMENT COMPANY AND AFFILIATED PURCHASERS. |
Not applicable.
| ITEM 10. | SUBMISSION OF MATTERS TO A VOTE OF SECURITY HOLDERS. |
Not applicable.
| ITEM 11. | CONTROLS AND PROCEDURES. |
| | (a) | The registrant’s principal executive officer and principal financial officer have concluded that the registrant’s disclosure controls and procedures (as defined in Rule 30a- 3(c) under the Investment Company Act of 1940, as amended (the “1940 Act”)) are effective as of a date within 90 days of the filing date of this report that includes the disclosure required by this paragraph, based on their evaluation of the disclosure controls and procedures required by Rule 30a-3(b) under the 1940 Act and 15d-15(b) under the Securities Exchange Act of 1934. |
| | (b) | There were no changes in the registrant’s internal control over financial reporting (as defined in Rule 30a-3(d) under the 1940 Act) that occurred during the period covered by this report that have materially affected, or are likely to materially affect the registrant’s internal control over financial reporting. |
| ITEM 12. | DISCLOSURE OF SECURITIES LENDING ACTIVITIES FOR CLOSED-END MANAGEMENT INVESTMENT COMPANIES. |
Not applicable.
(a) (1) Code of Ethics attached hereto.
Exhibit 99.CODE ETH
(a) (2) Certifications pursuant to section 302 of the Sarbanes-Oxley Act of 2002 attached hereto.
Exhibit 99.CERT
(b) Certifications pursuant to Section 906 of the Sarbanes-Oxley Act of 2002 attached hereto.
Exhibit 99.906CERT
SIGNATURES
Pursuant to the requirements of the Securities Exchange Act of 1934 and the Investment Company Act of 1940, the registrant has duly caused this Report to be signed on its behalf by the undersigned, there unto duly authorized.
Legg Mason Global Asset Management Trust
| | |
| By: | | /s/ Jane Trust |
| | Jane Trust |
| | Chief Executive Officer |
| |
| Date: | | February 28, 2023 |
Pursuant to the requirements of the Securities Exchange Act of 1934 and the Investment Company Act of 1940, this report has been signed below by the following persons on behalf of the registrant and in the capacities and on the dates indicated.
| | |
| By: | | /s/ Jane Trust |
| | Jane Trust |
| | Chief Executive Officer |
| |
Date: | | February 28, 2023 |
| | |
| By: | | /s/ Christopher Berarducci |
| | Christopher Berarducci |
| | Principal Financial Officer |
| |
Date: | | February 28, 2023 |