UNITED STATES
SECURITIES AND EXCHANGE COMMISSION
Washington, D.C. 20549
FORM N-CSR
CERTIFIED SHAREHOLDER REPORT OF REGISTERED
MANAGEMENT INVESTMENT COMPANIES
Investment Company Act file number 811-22338
Legg Mason Global Asset Management Trust
(Exact name of registrant as specified in charter)
100 International Drive, Baltimore, MD, 21202
(Address of principal executive offices) (Zip code)
Marc A. De Oliveira
Franklin Templeton
100 First Stamford Place
Stamford, CT 06902
(Name and address of agent for service)
Registrant’s telephone number, including area code: 877-6LM-FUND/656-3863
Date of fiscal year end: December 31
Date of reporting period: December 31, 2022
| ITEM 1. | REPORT TO STOCKHOLDERS |
The Annual Report to Stockholders is filed herewith.

| | |
| Annual Report | | December 31, 2022 |
BrandywineGLOBAL —
SMALL CAP VALUE FUND

|
| INVESTMENT PRODUCTS: NOT FDIC INSURED • NO BANK GUARANTEE • MAY LOSE VALUE |
Fund objective
The Fund seeks to provide long-term capital appreciation.
Letter from the president

Dear Shareholder,
We are pleased to provide the annual report of BrandywineGLOBAL — Small Cap Value Fund for the period since the Fund’s inception on August 31, 2022 through December 31, 2022. Please read on for a detailed look at prevailing economic and market conditions during the Fund’s reporting period and to learn how those conditions have affected Fund performance.
As always, we remain committed to providing you with excellent service and a full spectrum of investment choices. We also remain committed to supplementing the support you receive from your financial advisor. One way we accomplish this is through our website, www.franklintempleton.com. Here you can gain immediate access to market and investment information, including:
| • | | Fund prices and performance, |
| • | | Market insights and commentaries from our portfolio managers, and |
| • | | A host of educational resources. |
We look forward to helping you meet your financial goals.
Sincerely,

Jane Trust, CFA
President and Chief Executive Officer
January 31, 2023
| | |
| II | | BrandywineGLOBAL—Small Cap Value Fund |
Fund overview
Q. What is the Fund’s investment strategy?
A. The Fund seeks long-term capital appreciation. Under normal circumstances, the Fund invests at least 80% of its net assets in equity securities of small-cap companies. Small-cap companies are companies whose market capitalizations at the time of investment are similar to market capitalizations of companies in the Russell 2000 Indexi (the “Index”), which varies due to market conditions and the composition of the Index. The Portfolio had a strong performance for the quarter and outperformed the benchmark. Generally, the Fund invests in securities that we believe are undervalued, defined as trading for less than intrinsic value or asset value. To determine intrinsic value of a potential investment, we will examine a company’s financials, management, competition and earnings cycle as well as its industry’s short-term and long-term trends. The Fund will typically acquire securities if we believe their intrinsic value is greater than their current market valuation and their inclusion would be beneficial to the overall portfolio.
Equity securities in which the Fund may invest include common stock, preferred securities, convertible securities, warrants, options, and securities of other investment companies (including exchange-traded Funds (“ETFs”)) and of real estate investment companies (“REITs”). The Fund may invest up to 25% of its net assets in equity securities of foreign issuers.
Q. What were the overall market conditions during the Fund’s reporting period?
A. Trading during the reporting period continued to be dominated by macroeconomic data releases with investors searching for signs of a reprieve from continued interest rate increases. The Federal Reserve Board (the “Fed”) funds rate is at 4.5% today and is expected to go above 5% this year. The Fed is doing its best to bring a soft landing to the economy to cool inflation. But the still strong job market and rising wage rates have been problematic. This is clearly the Fed’s priority, as we are seeing prices of most other things — gasoline, cargo containers, trucking, commodities of all types — come back into a normalized range. Wages have not. Considering that 70% of our economy is service oriented, we expect to see further inflationary pressure in this area. We do not expect to see the Fed pause until they feel they have employment and wage pressure under control. After all, history shows that the only way to cool labor cost inflation is to create a recession. It doesn’t have to be deep, but enough to create some excess labor supply.
A slowing economy likely means lower revenues and lower earnings for a vast majority of the companies in our universe. Analysts still have rising earnings expectations of around 5% for small-cap stocks this year. We are not so sure of that. And even if that were to be true, the opportunities we are seeing today are not the same as we have seen at prior stock market bottoms. We have yet to see what a slowing economy does to earnings and how the market values those earnings to reach intrinsic value.
We have begun to see a hint of what our portfolio will do when interest rates, and the U.S. dollar, reverse course. Markets always rerate stock multiples before the fundamentals actually turn, and, aside from a few stock-specific situations, that’s largely what we have
| | | | | | |
| BrandywineGLOBAL—Small Cap Value Fund 2022 Annual Report | | | | | 1 | |
Fund overview (cont’d)
seen since October. We wish we had a strong short-term view on inflation and interest rates, but it’s never been our strength. Evaluating businesses and finding stocks trading at a discount to their intrinsic value is. On that, the market continues to be a better opportunity set than 2021, and we continue to reduce/sell names which we believe have reached fair value and add/buy names which improve the risk/reward and future return profile of the portfolio.
Q. How did we respond to these changing market conditions?
A. We pay close attention to balance sheets. We do that for numerous reasons. First and foremost is that the balance sheet tells us how much debt a company has. It is critically important to understand that equity holders are entitled to the residual cash flows of a business, which is after interest expense and expenses to keep operations moving forward. For the last decade, even highly leveraged companies didn’t really have to worry about interest expense because interest rates were so low. Many companies were able to issue debt at 0.5%, for an after-tax rate of 0.375%. As interest rates rise, more of that cash flow is going to go toward interest expense, which means there is less cash flow on which to value the business. For those companies the Fund owns that have debt, we have gone through and penciled in the expected increase in interest expense and what that means to valuations. If the cash flows we were expecting changed significantly, we exited the position.
A refrain that has worked well the last twelve years or so has been “Don’t fight the Fed.” Everyone loved that statement from 2009 to 2021. After all, it was one of the longest bull markets in market history. During 2022, the Fed changed its tune from easy money to tight money. We have moved from years of easy money to a period of tight money. The environment is certainly different, and we too don’t believe it is wise to fight the Fed. It is believed the Fed will pause rates at some point during the year. We think that makes sense, as there are lag effects to monetary policy changes that have not come through the economy fully, as evidenced by the job market today. Yet a pause is still tightening. Just because it’s not getting worse doesn’t mean it’s a better environment. During the 1970s, the last major inflation cycle we experienced, inflation fluctuated from 4% in 1972 to 12% in 1974, then back to a low of 4.5% in 1976, only to peak at just under 15% in 1980. The Dow Jones Industrial Average Indexii largely stayed in a 200 point (about 25%) trading range between 1972 to 1982. While we do believe 2023 will be a better stock market than 2022, could this trading range type of market be the future we are looking at? This is what we will be thinking about as the year progresses.
Hayward Holdings (“HAYW”) is a stock we added to the portfolio this quarter and a good example of the kind of opportunities we are seeing today. HAYW is a leading manufacturer of residential pool equipment. Residential pool construction exploded over the past couple of years, and we know the reasons why. With economic fears and the likelihood that pool construction falls back to its historical growth trend, shares of HAYW retreated from a peak of $28 per share in late 2021 to $11 per share today. This is a good business with favorable
| | | | |
| 2 | | | | BrandywineGLOBAL—Small Cap Value Fund 2022 Annual Report |
secular trends. Its business revolves around aftermarket parts to pools already installed, meaning, sales will continue even in a recession. When we look at the valuation today, it will likely be some time before shares reach that prior peak again, but we do believe there is a decent enough gap between today’s pricing and fair value to warrant a position. Should prices go lower and no material changes to our fundamental expectations occur, we would likely increase our position. Should we reach what we believe to be fair value quickly, we’ll sell and capture a modest profit.
Performance review
For the four months ended December 31, 2022, Class IS shares of BrandywineGLOBAL — Small Cap Value Fund, excluding sales charges, returned 0.30%. The Fund’s unmanaged benchmark, the Russell 2000 Value Indexiii, returned -2.63% for the same period. The Lipper Small-Cap Value Funds Category Averageiv returned 0.82% over the same period.
| | | | |
Performance Snapshot as of December 31, 2022
(unaudited) | |
| (excluding sales charges) | | Since Fund
Inception* | |
| BrandywineGLOBAL — Small Cap Value Fund: | | | | |
Class A | | | 0.28 | % |
Class C | | | -0.03 | % |
Class R | | | 0.11 | % |
Class I | | | 0.29 | % |
Class IS | | | 0.30 | % |
| Russell 2000 Value Index | | | -2.63 | % |
| Lipper Small-Cap Value Funds Category Average | | | 0.82 | % |
The performance shown represents past performance. Past performance is no guarantee of future results and current performance may be higher or lower than the performance shown above. Principal value and investment returns will fluctuate and investors’ shares, when redeemed, may be worth more or less than their original cost. To obtain performance data current to the most recent month-end, please visit our website at www.franklintempleton.com.
All share class returns assume the reinvestment of all distributions at net asset value and the deduction of all Fund expenses. Returns have not been adjusted to include sales charges that may apply or the deduction of taxes that a shareholder would pay on Fund distributions. If sales charges were reflected, the performance quoted would be lower. Performance figures for periods shorter than one year represent cumulative figures and are not annualized.
Fund performance figures reflect fee waivers and/or expense reimbursements, without which the performance would have been lower.
* The Fund’s inception date is August 31, 2022.
The Fund is the successor to an unregistered private fund (the “Predecessor Fund”). On August 31, 2022, the Predecessor Fund transferred its assets to the Fund in exchange for the Fund’s Class IS shares.
| | | | | | |
| BrandywineGLOBAL—Small Cap Value Fund 2022 Annual Report | | | | | 3 | |
Fund overview (cont’d)
|
| Total Annual Operating Expenses (unaudited) |
As of the Fund’s current prospectus dated August 31, 2022, the gross total annual fund operating expense ratios for Class A, Class C, Class R, Class I and Class IS shares were 1.47%, 2.22%, 1.82%, 1.22% and 1.12%, respectively.
Actual expenses may be higher. For example, expenses may be higher than those shown if average net assets decrease. Net assets are more likely to decrease and Fund expense ratios are more likely to increase when markets are volatile.
As a result of expense limitation arrangements, the ratio of total annual fund operating expenses, other than interest, brokerage commissions, dividend expense on short sales, taxes, extraordinary expenses and acquired fund fees and expenses, to average net assets will not exceed 1.25% for Class A shares, 2.00% for Class C shares, 1.60% for Class R shares, 1.00% for Class I shares and 0.90% for Class IS shares. In addition, the ratio of total annual fund operating expenses for Class IS shares will not exceed the ratio of total annual fund operating expenses for Class I shares. These expense limitation arrangements cannot be terminated prior to December 31, 2024 without the Board of Trustees’ consent. In addition, the manager has agreed to waive the Fund’s management fee to an extent sufficient to offset the net management fee payable in connection with any investment in an affiliated money market fund. The management fee waiver is not subject to the recapture provision discussed below.
The manager is permitted to recapture amounts waived and/or reimbursed to a class within three years after the fiscal year in which the manger earned the fee or incurred the expense if the class’ total annual fund operating expenses have fallen to a level below the expense limitation (“expense cap”) in effect at the time the fees were earned or the expenses incurred. In no case will the manager recapture any amount that would result, on any particular business day of the Fund, in the class’ total annual fund operating expenses exceeding the expense cap or any other lower limit then in effect.
Q. What were the leading contributors to performance?
A. Fortunately, the markets gave us a respite from the record-breaking negative returns heading into the fourth quarter of 2022 with small-cap value stocks increasing about 8.2%. The Portfolio had a strong performance for the quarter and outperformed the benchmark. On a sector level, health care was our best-performing sector, led by gains from some of the Fund’s pharmaceutical holdings, which are starting to be revalued higher.
On a stock basis, our strongest contribution to returns for the quarter came from Vertiv Holdings (“VRT”). VRT is a distributor and installer of communications equipment. While this was our best performer in the fourth quarter, it was our worst performer in the third quarter after it announced that earnings and revenue would be under previously announced expectations. The reason was they simply didn’t price the product right. They quickly changed their pricing strategy while maintaining demand and forecast better results moving forward. While the stock has rebounded, we believe it still to be trading at a substantial discount to intrinsic value.
| | | | |
| 4 | | | | BrandywineGLOBAL—Small Cap Value Fund 2022 Annual Report |
Q. What were the leading detractors from performance?
A. Our biggest detractor to performance was the utilities sector, due entirely to our lack of investment there. The worst detractor to returns this reporting period came from our investment in Rogers Corp (“ROG”). ROG was to be acquired by DuPont for $280 a share in cash. Unfortunately, this deal was being processed at the same time as geopolitical relations between the United States and China were fracturing. Due to a significant subsidiary of ROG being located in China, it was required that its regulatory agency sign off on the deal. During the fourth quarter of 2022, it became apparent that China was not going to give its approval in a time frame needed by Dupont and ROG. For this reason only, Dupont broke off the deal, believing it better to pay a massive breakup fee to ROG rather than wait on China to acquiesce. As a result, ROG’s stock retreated to a level of around $120 a share, a substantial decline. While we were surprised by the deal failing, at current levels, we see substantial upside for the business as a stand-alone and added to the position.
Q. Were there any significant changes to the Fund during the reporting period?
A. We reduced our financial and consumer discretionary exposure by 1.2% and 1.8%, respectively, while increasing our exposure to the industrials and health care sectors by 2.9% and 1.3%, respectively.
Thank you for your investment in BrandywineGLOBAL — Small Cap Value Fund. As always, we appreciate that you have chosen us to manage your assets and we remain focused on achieving the Fund’s investment goals.
Sincerely,

Justin C. Bennitt
Portfolio Manager
Brandywine Global Investment Management, LLC

Gregory P. Manley
Portfolio Manager
Brandywine Global Investment Management, LLC
| | | | | | |
| BrandywineGLOBAL—Small Cap Value Fund 2022 Annual Report | | | | | 5 | |
Fund overview (cont’d)

Steven Shin
Portfolio Manager
Brandywine Global Investment Management, LLC
January 19, 2023
RISKS: Equity securities are subject to market and price fluctuations. Stocks of small capitalization companies may involve a higher degree of risk and volatility than stocks of larger capitalization companies. Value stocks may underperform the overall equity market while the market concentrates on growth stocks. The Fund’s investments in securities of foreign issuers or issuers with significant exposure to foreign markets involve additional risk as compared to investments in U.S. securities or issuers with predominantly domestic exposure, such as less liquid, less transparent, less regulated and more volatile markets. The value of the Fund’s investments may decline because of factors affecting the particular issuer as well as foreign markets and issuers generally, such as unfavorable or unsuccessful government actions, reduction of government or central bank support, inadequate accounting standards, lack of information and political, economic, financial or social instability. Please see the Fund’s prospectus for a more complete discussion of these and other risks and the Fund’s investment strategies.
Portfolio holdings and breakdowns are as of December 31, 2022 and are subject to change and may not be representative of the portfolio managers’ current or future investments. The Fund’s top ten holdings (as a percentage of net assets) as of December 31, 2022 were: Ingredion Inc. (3.4%), Vertiv Holdings Co. (3.2%), JELD-WEN Holding Inc. (3.0%), NerdWallet Inc. (2.9%), Equity Commonwealth (2.8%), Globus Medical Inc. (2.8%), Associated Banc-Corp. (2.7%), Essent Group Ltd. (2.7%), Purple Innovation Inc. (2.6%) and Ryman Hospitality Properties Inc. (2.6%). Please refer to pages 14 through 17 for a list and percentage breakdown of the Fund’s holdings.
The mention of sector breakdowns is for informational purposes only and should not be construed as a recommendation to purchase or sell any securities. The information provided regarding such sectors is not a sufficient basis upon which to make an investment decision. Investors seeking financial advice regarding the appropriateness of investing in any securities or investment strategies discussed should consult their financial professional. Portfolio holdings are subject to change at any time and may not be representative of the portfolio managers’ current or future investments. The Fund’s top five sector holdings (as a percentage of net assets) as of December 31, 2022 were: financials (29.3%), industrials (15.4%), consumer discretionary (11.4%), real estate (11.4%) and information technology (8.0%). The Fund’s portfolio composition is subject to change at any time.
All investments are subject to risk including the possible loss of principal. Past performance is no guarantee of future results. All index performance reflects no deduction for fees, expenses or taxes. Please note that an investor cannot invest directly in an index.
The information provided is not intended to be a forecast of future events, a guarantee of future results or investment advice. Views expressed may differ from those of the firm as a whole.
| | | | |
| 6 | | | | BrandywineGLOBAL—Small Cap Value Fund 2022 Annual Report |
| i | The Russell 2000 Index measures the performance of the small-cap segment of the U.S. equity universe. The Russell 2000 is a subset of the Russell 3000 Index representing approximately 10% of the total market capitalization of that index. It includes approximately 2,000 of the smallest securities based on a combination of their market cap and current index membership. The Russell 3000 Index measures the performance of the 3,000 largest U.S. companies based on total market capitalization, which represents approximately 98% of the U.S. equity market. |
| ii | The Dow Jones Industrial Average (“DJIA”) is a widely followed measurement of the stock market. The average is comprised of thirty stocks that represent leading companies in major industries. These stocks, widely held by both individual and institutional investors, are considered to be all blue-chip companies. |
| iii | The Russell 2000 Value Index measures the performance of those Russell 2000 Index companies with lower price- to-book ratios and lower forecasted growth values. (A price-to-book ratio is the price of a stock compared to the difference between a company’s assets and liabilities.) |
| iv | Lipper, Inc., a wholly-owned subsidiary of Refinitiv, provides independent insight on global collective investments. Returns are based on the four-month period ended December 31, 2022, including the reinvestment of all distributions, including returns of capital, if any, calculated among the 183 funds in the Fund’s Lipper category, and excluding sales charges, if any. |
| | | | | | |
| BrandywineGLOBAL—Small Cap Value Fund 2022 Annual Report | | | | | 7 | |
Fund at a glance† (unaudited)
Investment breakdown (%) as a percent of total investments
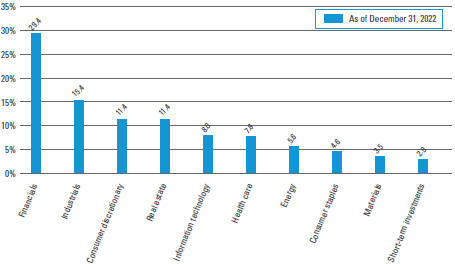
| † | The bar graph above represents the composition of the Fund’s investments as of December 31, 2022. The Fund is actively managed. As a result, the composition of the Fund’s investments is subject to change at any time. |
| | | | |
| 8 | | | | BrandywineGLOBAL—Small Cap Value Fund 2022 Annual Report |
Fund expenses (unaudited)
Example
As a shareholder of the Fund, you may incur two types of costs: (1) transaction costs, including front-end and back-end sales charges (loads) on purchase payments; and (2) ongoing costs, including management fees; service and/or distribution (12b-1) fees; and other Fund expenses. This example is intended to help you understand your ongoing costs (in dollars) of investing in the Fund and to compare these costs with the ongoing costs of investing in other mutual funds.
This example is based on an investment of $1,000 invested on July 1, 2022 and held for the six months ended December 31, 2022, unless otherwise noted.
Actual expenses
The table below titled “Based on actual total return” provides information about actual account values and actual expenses. You may use the information provided in this table, together with the amount you invested, to estimate the expenses that you paid over the period. To estimate the expenses you paid on your account, divide your ending account value by $1,000 (for example, an $8,600 ending account value divided by $1,000 = 8.6), then multiply the result by the number under the heading entitled “Expenses Paid During the Period”.
Hypothetical example for comparison purposes
The table below titled “Based on hypothetical total return” provides information about hypothetical account values and hypothetical expenses based on the actual expense ratio and an assumed rate of return of 5.00% per year before expenses, which is not the Fund’s actual return. The hypothetical account values and expenses may not be used to estimate the actual ending account balance or expenses you paid for the period. You may use the information provided in this table to compare the ongoing costs of investing in the Fund and other funds. To do so, compare the 5.00% hypothetical example relating to the Fund with the 5.00% hypothetical examples that appear in the shareholder reports of the other funds.
Please note that the expenses shown in the table below are meant to highlight your ongoing costs only and do not reflect any transactional costs, such as front-end or back-end sales charges (loads). Therefore, the table is useful in comparing ongoing costs only, and will not help you determine the relative total costs of owning different funds. In addition, if these transaction costs were included, your costs would have been higher.
| | | | | | | | | | | | | | | | | | | | | | | | | | | | | | | | | | | | | | | | | | | | | | |
| | |
| Based on actual total return1 | | | | | | Based on hypothetical total return4 | |
| | | Actual Total Return
Without
Sales
Charge2 | | | Beginning
Account
Value | | | Ending
Account
Value | | | Annualized
Expense
Ratio | | | Expenses
Paid During the Period3 | | | | | | | | Hypothetical
Annualized
Total Return | | | Beginning Account Value | | | Ending
Account
Value | | | Annualized Expense
Ratio | | | Expenses
Paid During the
Period5 | |
| Class A | | | 0.28 | % | | $ | 1,000.00 | | | $ | 1,002.80 | | | | 1.25 | % | | $ | 4.18 | | | | | | | Class A | | | 5.00 | % | | $ | 1,000.00 | | | $ | 1,018.90 | | | | 1.25 | % | | $ | 6.36 | |
| Class C | | | -0.03 | | | | 1,000.00 | | | | 999.70 | | | | 2.00 | | | | 6.68 | | | | | | | Class C | | | 5.00 | | | | 1,000.00 | | | | 1,015.12 | | | | 2.00 | | | | 10.16 | |
| Class R | | | 0.11 | | | | 1,000.00 | | | | 1,001.10 | | | | 1.60 | | | | 5.35 | | | | | | | Class R | | | 5.00 | | | | 1,000.00 | | | | 1,017.14 | | | | 1.60 | | | | 8.13 | |
| Class I | | | 0.29 | | | | 1,000.00 | | | | 1,002.90 | | | | 1.00 | | | | 3.35 | | | | | | | Class I | | | 5.00 | | | | 1,000.00 | | | | 1,020.16 | | | | 1.00 | | | | 5.09 | |
| Class IS | | | 0.30 | | | | 1,000.00 | | | | 1,003.00 | | | | 0.90 | | | | 3.01 | | | | | | | Class IS | | | 5.00 | | | | 1,000.00 | | | | 1,020.67 | | | | 0.90 | | | | 4.58 | |
| | | | | | |
| BrandywineGLOBAL—Small Cap Value Fund 2022 Annual Report | | | | | 9 | |
Fund expenses (unaudited) (cont’d)
| 1 | For the period August 31, 2022 (inception date) to December 31, 2022. |
| 2 | Assumes the reinvestment of all distributions, including returns of capital, if any, at net asset value and does not reflect the deduction of the applicable sales charge with respect to Class A shares or the applicable contingent deferred sales charge (“CDSC”) with respect to Class C shares. Total return is not annualized, as it may not be representative of the total return for the year. Performance figures may reflect compensating balance arrangements, fee waivers and/or expense reimbursements. In the absence of compensating balance arrangements, fee waivers and/or expense reimbursements, the total return would have been lower. Past performance is no guarantee of future results. |
| 3 | Expenses (net of compensating balance arrangements, fee waivers and/or expense reimbursements) are equal to each class’ respective annualized expense ratio multiplied by the average account value over the period, multiplied by the number of days in the most recent fiscal period (122), then divided by 365. |
| 4 | For the six months ended December 31, 2022. |
| 5 | Expenses (net of compensating balance arrangements, fee waivers and/or expense reimbursements) are equal to each class’ respective annualized expense ratio multiplied by the average account value over the period, multiplied by the number of days in the most recent fiscal half-year (184), then divided by 365. |
| | | | |
| 10 | | | | BrandywineGLOBAL—Small Cap Value Fund 2022 Annual Report |
Fund performance (unaudited)
BrandywineGlobal — Small Cap Value Fund (the “Fund”) is the successor to an unregistered private fund (the “Predecessor Fund”). The performance in the accompanying table and line graph for Class IS shares includes performance of the Predecessor Fund. The Predecessor Fund’s inception date was December 31, 2015. On August 31, 2022, the Predecessor Fund transferred its assets to the Fund in exchange for the Fund’s Class IS shares. The investment policies, objectives, guidelines and restrictions of the fund are in all material respects equivalent to those of the Predecessor Fund. In addition, the Predecessor Fund’s portfolio managers are the current portfolio managers of the fund. As a mutual fund registered under the Investment Company Act of 1940 (the “1940 Act”), the Fund is subject to certain restrictions under the 1940 Act to which the Predecessor Fund was not subject. As a regulated investment company under the Internal Revenue Code of 1986, as amended (the “Code”), the Fund is subject to certain restrictions under the Code to which the Predecessor Fund was not subject. Had the Predecessor Fund been registered under the 1940 Act and been subject to the provisions of the Code applicable to the Fund, its performance may have been adversely affected. The Predecessor Fund’s performance has been restated in the table and line graph to reflect the fees and net expenses of the Fund’s Class IS shares. Returns after taxes on distributions are not shown for periods prior to the Fund’s registration as a registered investment company fund because the Predecessor Fund was not required to make distributions to its investors. The Predecessor Fund did not have distribution policies. The Predecessor Fund was an unregistered private fund, did not qualify as a regulated investment company for federal income tax purposes and did not pay dividends or distributions.
| | | | | | | | | | | | | | | | | | | | |
| Average annual total returns | | | | | | | | | | | | | |
| Without sales charges1 | | Class A2 | | | Class C2 | | | Class R2 | | | Class I2 | | | Class IS | |
| Twelve Months Ended 12/31/22 | | | N/A | | | | N/A | | | | N/A | | | | N/A | | | | -18.68 | % |
| Five Years Ended 12/31/22 | | | N/A | | | | N/A | | | | N/A | | | | N/A | | | | 5.19 | |
| Inception* through 12/31/22 | | | 0.28 | % | | | -0.03 | % | | | 0.11 | % | | | 0.29 | % | | | 9.00 | |
| | | | | |
| With sales charges3 | | Class A2 | | | Class C2 | | | Class R2 | | | Class I2 | | | Class IS | |
| Twelve Months Ended 12/31/22 | | | N/A | | | | N/A | | | | N/A | | | | N/A | | | | -18.68 | % |
| Five Years Ended 12/31/22 | | | N/A | | | | N/A | | | | N/A | | | | N/A | | | | 5.19 | |
| Inception* through 12/31/22 | | | -5.21 | % | | | -1.02 | % | | | 0.11 | % | | | 0.29 | % | | | 9.00 | |
| | | | |
| Cumulative total returns | | | |
| Without sales charges1 | | | |
| Class A (Inception date of 8/31/22 through 12/31/22) | | | 0.28 | % |
| Class C (Inception date of 8/31/22 through 12/31/22) | | | -0.03 | |
| Class R (Inception date of 8/31/22 through 12/31/22) | | | 0.11 | |
| Class I (Inception date of 8/31/22 through 12/31/22) | | | 0.29 | |
| Class IS (Inception date of 12/31/15 through 12/31/22) | | | 82.84 | |
All figures represent past performance and are not a guarantee of future results. Investment return and principal value of an investment will fluctuate so that an investor’s shares, when redeemed, may be worth more or less than their original cost. The returns shown do not reflect the deduction of taxes that a shareholder would pay on Fund distributions or the redemption of Fund shares. Performance figures may reflect compensating balance arrangements, fee waivers and/or expense reimbursements. In the absence of compensating balance arrangements, fee waivers and/or expense reimbursements, the total return would have been lower.
| | | | | | |
| BrandywineGLOBAL—Small Cap Value Fund 2022 Annual Report | | | | | 11 | |
Fund performance (unaudited) (cont’d)
| 1 | Assumes the reinvestment of all distributions, including returns of capital, if any, at net asset value and does not reflect the deduction of the applicable sales charge with respect to Class A shares or the applicable contingent deferred sales charge (“CDSC”) with respect to Class C shares. |
| 3 | Assumes the reinvestment of all distributions, including returns of capital, if any, at net asset value. In addition, Class A shares reflect the deduction of the maximum initial sales charge of 5.50%. Class C shares reflect the deduction of a 1.00% CDSC, which applies if shares are redeemed within one year from purchase payment. |
| * | Inception dates for Class A, C, R, I and IS shares are August 31, 2022, August 31, 2022, August 31, 2022, August 31, 2022 and December 31, 2015, respectively. |
| | | | |
| 12 | | | | BrandywineGLOBAL—Small Cap Value Fund 2022 Annual Report |
Historical performance
Value of $1,000,000 invested in
Class IS Shares of BrandywineGLOBAL — Small Cap Value Fund vs. Russell 2000 Index and Russell 2000 Value Index† — December 31, 2015 - December 31, 2022
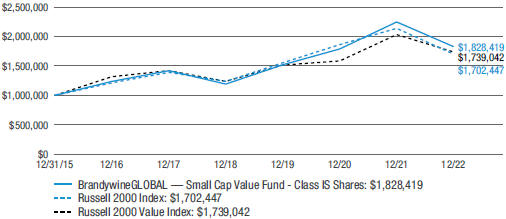
All figures represent past performance and are not a guarantee of future results. Investment return and principal value of an investment will fluctuate so that an investor’s shares, when redeemed, may be worth more or less than their original cost. The returns shown do not reflect the deduction of taxes that a shareholder would pay on Fund distributions or the redemption of Fund shares. Performance figures may reflect compensating balance arrangements, fee waivers and/or expense reimbursements. In the absence of compensating balance arrangements, fee waivers and/or expense reimbursements, the total return would have been lower.
| † | Hypothetical illustration of $1,000,000 invested in Class IS shares of BrandywineGLOBAL — Small Cap Value Fund on December 31, 2015 (inception date of the Predecessor Fund), assuming the reinvestment of all distributions, including returns of capital, if any, at net asset value through December 31, 2022. The hypothetical illustration also assumes a $1,000,000 investment in the Russell 2000 Index and the Russell 2000 Value Index (together, the “Indices”). The Russell 2000 Index measures the performance of the small-cap segment of the U.S. equity market. The Russell 2000 Value Index measures the performance of those Russell 2000 Index companies with lower price-to-book ratios and lower forecasted growth values. (A price-to-book ratio is the price of a stock compared to the difference between a company’s assets and liabilities.) The Indices are unmanaged and are not subject to the same management and trading expenses as a mutual fund. Please note that an investor cannot invest directly in an index. The performance of the Fund’s other classes may be greater or less than the Class IS shares’ performance indicated on this chart, depending on whether greater or lesser sales charges and fees were incurred by shareholders investing in the other classes. |
| | | | | | |
| BrandywineGLOBAL—Small Cap Value Fund 2022 Annual Report | | | | | 13 | |
Schedule of investments
December 31, 2022
BrandywineGLOBAL—Small Cap Value Fund
(Percentages shown based on Fund net assets)
| | | | | | | | | | | | | | | | |
| Security | | | | | | | | Shares | | | Value | |
| Common Stocks — 97.0% | | | | | | | | | | | | | | | | |
| Consumer Discretionary — 11.4% | | | | | | | | | | | | | | | | |
Automobiles — 1.4% | | | | | | | | | | | | | | | | |
Thor Industries Inc. | | | | | | | | | | | 2,802 | | | $ | 211,523 | |
Household Durables — 4.7% | | | | | | | | | | | | | | | | |
LGI Homes Inc. | | | | | | | | | | | 3,530 | | | | 326,878 | * |
Purple Innovation Inc. | | | | | | | | | | | 85,840 | | | | 411,173 | * |
Total Household Durables | | | | | | | | | | | | | | | 738,051 | |
Internet & Direct Marketing Retail — 5.3% | | | | | | | | | | | | | | | | |
Poshmark Inc., Class A Shares | | | | | | | | | | | 12,910 | | | | 230,831 | * |
Vivid Seats Inc., Class A Shares | | | | | | | | | | | 37,890 | | | | 276,597 | * |
Wayfair Inc., Class A Shares | | | | | | | | | | | 9,910 | | | | 325,940 | * |
Total Internet & Direct Marketing Retail | | | | | | | | | | | | | | | 833,368 | |
Total Consumer Discretionary | | | | | | | | | | | | | | | 1,782,942 | |
| Consumer Staples — 4.6% | | | | | | | | | | | | | | | | |
Beverages — 1.2% | | | | | | | | | | | | | | | | |
Boston Beer Co. Inc., Class A Shares | | | | | | | | | | | 550 | | | | 181,236 | * |
Food Products — 3.4% | | | | | | | | | | | | | | | | |
Ingredion Inc. | | | | | | | | | | | 5,481 | | | | 536,754 | |
Total Consumer Staples | | | | | | | | | | | | | | | 717,990 | |
| Energy — 5.6% | | | | | | | | | | | | | | | | |
Energy Equipment & Services — 2.8% | | | | | | | | | | | | | | | | |
Cactus Inc., Class A Shares | | | | | | | | | | | 5,640 | | | | 283,466 | |
Expro Group Holdings NV | | | | | | | | | | | 8,961 | | | | 162,463 | * |
Total Energy Equipment & Services | | | | | | | | | | | | | | | 445,929 | |
Oil, Gas & Consumable Fuels — 2.8% | | | | | | | | | | | | | | | | |
Callon Petroleum Co. | | | | | | | | | | | 5,160 | | | | 191,384 | * |
Laredo Petroleum Inc. | | | | | | | | | | | 4,670 | | | | 240,132 | * |
Total Oil, Gas & Consumable Fuels | | | | | | | | | | | | | | | 431,516 | |
Total Energy | | | | | | | | | | | | | | | 877,445 | |
| Financials — 29.3% | | | | | | | | | | | | | | | | |
Banks — 13.9% | | | | | | | | | | | | | | | | |
Associated Banc-Corp. | | | | | | | | | | | 18,340 | | | | 423,471 | |
First Foundation Inc. | | | | | | | | | | | 12,180 | | | | 174,539 | |
HomeStreet Inc. | | | | | | | | | | | 13,061 | | | | 360,222 | |
PacWest Bancorp | | | | | | | | | | | 8,500 | | | | 195,075 | |
Popular Inc. | | | | | | | | | | | 2,082 | | | | 138,078 | |
Synovus Financial Corp. | | | | | | | | | | | 3,660 | | | | 137,433 | |
Texas Capital Bancshares Inc. | | | | | | | | | | | 6,600 | | | | 398,046 | * |
Umpqua Holdings Corp. | | | | | | | | | | | 19,390 | | | | 346,112 | |
Total Banks | | | | | | | | | | | | | | | 2,172,976 | |
See Notes to Financial Statements.
| | | | |
| 14 | | | | BrandywineGLOBAL—Small Cap Value Fund 2022 Annual Report |
BrandywineGLOBAL—Small Cap Value Fund
(Percentages shown based on Fund net assets)
| | | | | | | | | | | | | | | | |
| Security | | | | | | | | Shares | | | Value | |
Capital Markets — 2.6% | | | | | | | | | | | | | | | | |
Invesco Ltd. | | | | | | | | | | | 10,170 | | | $ | 182,958 | |
New Mountain Finance Corp. | | | | | | | | | | | 17,760 | | | | 219,691 | |
Total Capital Markets | | | | | | | | | | | | | | | 402,649 | |
Consumer Finance — 7.0% | | | | | | | | | | | | | | | | |
Bread Financial Holdings Inc. | | | | | | | | | | | 8,610 | | | | 324,253 | |
NerdWallet Inc., Class A Shares | | | | | | | | | | | 48,074 | | | | 461,510 | * |
SLM Corp. | | | | | | | | | | | 19,250 | | | | 319,550 | |
Total Consumer Finance | | | | | | | | | | | | | | | 1,105,313 | |
Thrifts & Mortgage Finance — 5.8% | | | | | | | | | | | | | | | | |
Essent Group Ltd. | | | | | | | | | | | 10,880 | | | | 423,015 | |
loanDepot Inc., Class A Shares | | | | | | | | | | | 130,780 | | | | 215,787 | |
New York Community Bancorp Inc. | | | | | | | | | | | 32,442 | | | | 279,001 | |
Total Thrifts & Mortgage Finance | | | | | | | | | | | | | | | 917,803 | |
Total Financials | | | | | | | | | | | | | | | 4,598,741 | |
| Health Care — 7.8% | | | | | | | | | | | | | | | | |
Health Care Equipment & Supplies — 3.8% | | | | | | | | | | | | | | | | |
Globus Medical Inc., Class A Shares | | | | | | | | | | | 5,813 | | | | 431,731 | * |
Tactile Systems Technology Inc. | | | | | | | | | | | 13,620 | | | | 156,358 | * |
Total Health Care Equipment & Supplies | | | | | | | | | | | | | | | 588,089 | |
Health Care Providers & Services — 1.4% | | | | | | | | | | | | | | | | |
PetIQ Inc. | | | | | | | | | | | 24,470 | | | | 225,614 | * |
Pharmaceuticals — 2.6% | | | | | | | | | | | | | | | | |
ANI Pharmaceuticals Inc. | | | | | | | | | | | 4,270 | | | | 171,782 | * |
Collegium Pharmaceutical Inc. | | | | | | | | | | | 10,339 | | | | 239,865 | * |
Total Pharmaceuticals | | | | | | | | | | | | | | | 411,647 | |
Total Health Care | | | | | | | | | | | | | | | 1,225,350 | |
| Industrials — 15.4% | | | | | | | | | | | | | | | | |
Airlines — 3.2% | | | | | | | | | | | | | | | | |
Alaska Air Group Inc. | | | | | | | | | | | 7,320 | | | | 314,321 | * |
Allegiant Travel Co. | | | | | | | | | | | 2,784 | | | | 189,284 | * |
Total Airlines | | | | | | | | | | | | | | | 503,605 | |
Building Products — 5.0% | | | | | | | | | | | | | | | | |
Hayward Holdings Inc. | | | | | | | | | | | 17,620 | | | | 165,628 | * |
JELD-WEN Holding Inc. | | | | | | | | | | | 48,190 | | | | 465,034 | * |
Trex Co. Inc. | | | | | | | | | | | 3,580 | | | | 151,541 | * |
Total Building Products | | | | | | | | | | | | | | | 782,203 | |
Commercial Services & Supplies — 2.9% | | | | | | | | | | | | | | | | |
ACV Auctions Inc., Class A Shares | | | | | | | | | | | 34,670 | | | | 284,641 | * |
MillerKnoll Inc. | | | | | | | | | | | 7,750 | | | | 162,827 | |
Total Commercial Services & Supplies | | | | | | | | | | | | | | | 447,468 | |
See Notes to Financial Statements.
| | | | | | |
| BrandywineGLOBAL—Small Cap Value Fund 2022 Annual Report | | | | | 15 | |
Schedule of investments (cont’d)
December 31, 2022
BrandywineGLOBAL—Small Cap Value Fund
(Percentages shown based on Fund net assets)
| | | | | | | | | | | | | | | | |
| Security | | | | | | | | Shares | | | Value | |
Electrical Equipment — 3.1% | | | | | | | | | | | | | | | | |
Vertiv Holdings Co. | | | | | | | | | | | 36,180 | | | $ | 494,219 | |
Road & Rail — 1.2% | | | | | | | | | | | | | | | | |
Lyft Inc., Class A Shares | | | | | | | | | | | 16,910 | | | | 186,348 | * |
Total Industrials | | | | | | | | | | | | | | | 2,413,843 | |
| Information Technology — 8.0% | | | | | | | | | | | | | | | | |
Electronic Equipment, Instruments & Components — 5.4% | | | | | | | | | | | | | | | | |
IPG Photonics Corp. | | | | | | | | | | | 1,890 | | | | 178,926 | * |
Knowles Corp. | | | | | | | | | | | 11,760 | | | | 193,099 | * |
Rogers Corp. | | | | | | | | | | | 2,828 | | | | 337,494 | * |
Vontier Corp. | | | | | | | | | | | 7,290 | | | | 140,916 | |
Total Electronic Equipment, Instruments & Components | | | | | | | | | | | | | | | 850,435 | |
Semiconductors & Semiconductor Equipment — 2.6% | | | | | | | | | | | | | | | | |
Cohu Inc. | | | | | | | | | | | 7,070 | | | | 226,594 | * |
Ichor Holdings Ltd. | | | | | | | | | | | 6,370 | | | | 170,843 | * |
Total Semiconductors & Semiconductor Equipment | | | | | | | | | | | | | | | 397,437 | |
Total Information Technology | | | | | | | | | | | | | | | 1,247,872 | |
| Materials — 3.5% | | | | | | | | | | | | | | | | |
Metals & Mining — 3.5% | | | | | | | | | | | | | | | | |
Alamos Gold Inc., Class A Shares | | | | | | | | | | | 40,350 | | | | 407,938 | |
Haynes International Inc. | | | | | | | | | | | 3,030 | | | | 138,441 | |
Total Materials | | | | | | | | | | | | | | | 546,379 | |
| Real Estate — 11.4% | | | | | | | | | | | | | | | | |
Equity Real Estate Investment Trusts (REITs) — 10.2% | | | | | | | | | | | | | | | | |
EPR Properties | | | | | | | | | | | 6,480 | | | | 244,426 | |
Equity Commonwealth | | | | | | | | | | | 17,600 | | | | 439,472 | |
Franklin Street Properties Corp. | | | | | | | | | | | 55,015 | | | | 150,191 | |
Ryman Hospitality Properties Inc. | | | | | | | | | | | 5,000 | | | | 408,900 | |
Sunstone Hotel Investors Inc. | | | | | | | | | | | 35,820 | | | | 346,021 | |
Total Equity Real Estate Investment Trusts (REITs) | | | | | | | | | | | | | | | 1,589,010 | |
Real Estate Management & Development — 1.2% | | | | | | | | | | | | | | | | |
Howard Hughes Corp. | | | | | | | | | | | 2,510 | | | | 191,814 | * |
Total Real Estate | | | | | | | | | | | | | | | 1,780,824 | |
Total Investments before Short-Term Investments (Cost — $16,208,433) | | | | | | | | | | | | | | | 15,191,386 | |
See Notes to Financial Statements.
| | | | |
| 16 | | | | BrandywineGLOBAL—Small Cap Value Fund 2022 Annual Report |
BrandywineGLOBAL—Small Cap Value Fund
(Percentages shown based on Fund net assets)
| | | | | | | | | | | | | | | | |
| Security | | | | | Rate | | | Shares | | | Value | |
| Short-Term Investments — 3.0% | | | | | | | | | | | | | | | | |
Western Asset Premier Institutional U.S. Treasury Reserves, Premium Shares (Cost — $464,093) | | | | | | | 4.024% | | | | 464,093 | | | $ | 464,093 | (a)(b) |
Total Investments — 100.0% (Cost — $16,672,526) | | | | | | | | | | | | | | | 15,655,479 | |
Other Assets in Excess of Liabilities — 0.0%†† | | | | | | | | | | | | | | | 7,207 | |
Total Net Assets — 100.0% | | | | | | | | | | | | | | $ | 15,662,686 | |
| †† | Represents less than 0.1%. |
| * | Non-income producing security. |
| (a) | Rate shown is one-day yield as of the end of the reporting period. |
| (b) | In this instance, as defined in the Investment Company Act of 1940, an “Affiliated Company” represents Fund ownership of at least 5% of the outstanding voting securities of an issuer, or a company which is under common ownership or control with the Fund. At December 31, 2022, the total market value of investments in Affiliated Companies was $464,093 and the cost was $464,093 (Note 8). |
See Notes to Financial Statements.
| | | | | | |
| BrandywineGLOBAL—Small Cap Value Fund 2022 Annual Report | | | | | 17 | |
Statement of assets and liabilities
December 31, 2022
| | | | |
| |
| Assets: | | | | |
Investments in unaffiliated securities, at value (Cost — $16,208,433) | | $ | 15,191,386 | |
Investments in affiliated securities, at value (Cost — $464,093) | | | 464,093 | |
Deferred offering costs | | | 135,698 | |
Receivable from investment manager | | | 15,936 | |
Dividends receivable from unaffiliated investments | | | 13,703 | |
Dividends receivable from affiliated investments | | | 1,636 | |
Receivable for Fund shares sold | | | 78 | |
Total Assets | | | 15,822,530 | |
| |
| Liabilities: | | | | |
Payable to investment manager (Note 2) | | | 128,296 | |
Fund accounting fees payable | | | 22,596 | |
Trustees’ fees payable | | | 248 | |
Service and/or distribution fees payable | | | 15 | |
Accrued expenses | | | 8,689 | |
Total Liabilities | | | 159,844 | |
| Total Net Assets | | $ | 15,662,686 | |
| |
| Net Assets: | | | | |
Par value (Note 7) | | $ | 16 | |
Paid-in capital in excess of par value | | | 15,737,056 | |
Total distributable earnings (loss) | | | (74,386) | |
| Total Net Assets | | $ | 15,662,686 | |
See Notes to Financial Statements.
| | | | |
| 18 | | | | BrandywineGLOBAL—Small Cap Value Fund 2022 Annual Report |
| | | | |
| |
| Net Assets: | | | | |
Class A | | | $35,821 | |
Class C | | | $4,963 | |
Class R | | | $4,964 | |
Class I | | | $4,969 | |
Class IS | | | $15,611,969 | |
| |
| Shares Outstanding: | | | | |
Class A | | | 3,602 | |
Class C | | | 500 | |
Class R | | | 500 | |
Class I | | | 500 | |
Class IS | | | 1,570,339 | |
| |
| Net Asset Value: | | | | |
Class A (and redemption price) | | | $9.94 | |
Class C* | | | $9.93 | |
Class R (and redemption price) | | | $9.93 | |
Class I (and redemption price) | | | $9.94 | |
Class IS (and redemption price) | | | $9.94 | |
| |
| Maximum Public Offering Price Per Share: | | | | |
Class A (based on maximum initial sales charge of 5.50%) | | | $10.52 | |
| * | Redemption price per share is NAV of Class C shares reduced by a 1.00% CDSC if shares are redeemed within one year from purchase payment (Note 2). |
See Notes to Financial Statements.
| | | | | | |
| BrandywineGLOBAL—Small Cap Value Fund 2022 Annual Report | | | | | 19 | |
Statement of operations
For the Period Ended December 31, 2022†
| | | | |
| |
| Investment Income: | | | | |
Dividends from unaffiliated investments | | $ | 112,948 | |
Dividends from affiliated investments | | | 5,055 | |
Less: Foreign taxes withheld | | | (843) | |
Total Investment Income | | | 117,160 | |
| |
| Expenses: | | | | |
Offering costs (Note 1) | | | 68,127 | |
Investment management fee (Note 2) | | | 41,606 | |
Audit and tax fees | | | 29,805 | |
Fund accounting fees | | | 22,596 | |
Organization costs (Note 1) | | | 21,475 | |
Legal fees | | | 10,000 | |
Shareholder reports | | | 5,328 | |
Trustees’ fees | | | 553 | |
Transfer agent fees (Note 5) | | | 66 | |
Service and/or distribution fees (Notes 2 and 5) | | | 47 | |
Custody fees | | | 33 | |
Miscellaneous expenses | | | 1,666 | |
Total Expenses | | | 201,302 | |
Less: Fee waivers and/or expense reimbursements (Notes 2 and 5) | | | (154,546) | |
Net Expenses | | | 46,756 | |
| Net Investment Income | | | 70,404 | |
| |
| Realized and Unrealized Gain (Loss) on Investments (Notes 1 and 3): | | | | |
Net Realized Loss From Unaffiliated Investment Transactions | | | (313,416) | |
Change in Net Unrealized Appreciation (Depreciation) From Unaffiliated Investments | | | 291,995 | |
| Net Loss on Investments | | | (21,421) | |
| Increase in Net Assets From Operations | | $ | 48,983 | |
| † | For the period August 31, 2022 (inception date) to December 31, 2022. |
See Notes to Financial Statements.
| | | | |
| 20 | | | | BrandywineGLOBAL—Small Cap Value Fund 2022 Annual Report |
Statement of changes in net assets
| | | | |
| For the Period Ended December 31, 2022† | | 2022 | |
| |
| Operations: | | | | |
Net investment income | | $ | 70,404 | |
Net realized loss | | | (313,416) | |
Change in net unrealized appreciation (depreciation) | | | 291,995 | |
Increase in Net Assets From Operations | | | 48,983 | |
| |
| Distributions to Shareholders From (Notes 1 and 6): | | | | |
Total distributable earnings | | | (144,501) | |
Decrease in Net Assets From Distributions to Shareholders | | | (144,501) | |
| |
| Fund Share Transactions (Note 7): | | | | |
Net proceeds from sale of shares | | | 70,664 | |
Reinvestment of distributions | | | 144,338 | |
Cost of shares repurchased | | | (20,000) | |
In-kind capital contribution (Note 9) | | | 15,563,202 | |
Increase in Net Assets From Fund Share Transactions | | | 15,758,204 | |
Increase in Net Assets | | | 15,662,686 | |
| |
| Net Assets: | | | | |
Beginning of period | | | — | |
End of period | | $ | 15,662,686 | |
| † | For the period August 31, 2022 (inception date) to December 31, 2022. |
See Notes to Financial Statements.
| | | | | | |
| BrandywineGLOBAL—Small Cap Value Fund 2022 Annual Report | | | | | 21 | |
Financial highlights
| | | | |
For a share of each class of beneficial interest outstanding throughout each year ended December 31,
unless otherwise noted: | |
| Class A Shares1 | | 20222 | |
| |
| Net asset value, beginning of period | | | $10.00 | |
| |
| Income (loss) from operations: | | | | |
Net investment income | | | 0.04 | |
Net realized and unrealized loss | | | (0.02) | |
Total income from operations | | | 0.02 | |
| |
| Less distributions from: | | | | |
Net investment income | | | (0.08) | |
Total distributions | | | (0.08) | |
| |
| Net asset value, end of period | | | $9.94 | |
Total return3 | | | 0.28 | % |
| |
| Net assets, end of period (000s) | | | $36 | |
| |
| Ratios to average net assets: | | | | |
Gross expenses4,5 | | | 4.22 | % |
Net expenses4,6,7 | | | 1.25 | |
Net investment income4 | | | 1.20 | |
| |
| Portfolio turnover rate8 | | | 21 | % |
| 1 | Per share amounts have been calculated using the average shares method. |
| 2 | For the period August 31, 2022 (inception date) to December 31, 2022. |
| 3 | Performance figures, exclusive of sales charges, may reflect compensating balance arrangements, fee waivers and/or expense reimbursements. In the absence of compensating balance arrangements, fee waivers and/or expense reimbursements, the total return would have been lower. Past performance is no guarantee of future results. Total returns for periods of less than one year are not annualized. |
| 5 | Ratio includes 1.75% of non-recurring organizational and offering costs related to the inception of the Fund. |
| 6 | As a result of an expense limitation arrangement, the ratio of total annual fund operating expenses, other than interest, brokerage commissions, dividend expense on short sales, taxes, extraordinary expenses and acquired fund fees and expenses, to average net assets of Class A shares did not exceed 1.25%. This expense limitation arrangement cannot be terminated prior to December 31, 2024 without the Board of Trustees’ consent. In addition, the manager has agreed to waive the Fund’s management fee to an extent sufficient to offset the net management fee payable in connection with any investment in an affiliated money market fund. |
| 7 | Reflects fee waivers and/or expense reimbursements. |
| 8 | Excludes securities received as a result of a contribution in-kind. |
See Notes to Financial Statements.
| | | | |
| 22 | | | | BrandywineGLOBAL—Small Cap Value Fund 2022 Annual Report |
| | | | |
For a share of each class of beneficial interest outstanding throughout each year ended December 31,
unless otherwise noted: | |
| Class C Shares1 | | 20222 | |
| |
| Net asset value, beginning of period | | | $10.00 | |
| |
| Income (loss) from operations: | | | | |
Net investment income | | | 0.01 | |
Net realized and unrealized loss | | | (0.01) | |
Total income from operations | | | 0.00 | 3 |
| |
| Less distributions from: | | | | |
Net investment income | | | (0.07) | |
Total distributions | | | (0.07) | |
| |
| Net asset value, end of period | | | $9.93 | |
Total return4 | | | (0.03) | % |
| |
| Net assets, end of period (000s) | | | $5 | |
| |
| Ratios to average net assets: | | | | |
Gross expenses5,6 | | | 5.40 | % |
Net expenses5,7,8 | | | 2.00 | |
Net investment income5 | | | 0.25 | |
| |
| Portfolio turnover rate9 | | | 21 | % |
| 1 | Per share amounts have been calculated using the average shares method. |
| 2 | For the period August 31, 2022 (inception date) to December 31, 2022. |
| 3 | Amount represents less than $0.005 per share. |
| 4 | Performance figures, exclusive of CDSC, may reflect compensating balance arrangements, fee waivers and/or expense reimbursements. In the absence of compensating balance arrangements, fee waivers and/or expense reimbursements, the total return would have been lower. Past performance is no guarantee of future results. Total returns for periods of less than one year are not annualized. |
| 6 | Ratio includes 1.73% of non-recurring organizational and offering costs related to the inception of the Fund. |
| 7 | As a result of an expense limitation arrangement, the ratio of total annual fund operating expenses, other than interest, brokerage commissions, dividend expense on short sales, taxes, extraordinary expenses and acquired fund fees and expenses, to average net assets of Class C shares did not exceed 2.00%. This expense limitation arrangement cannot be terminated prior to December 31, 2024 without the Board of Trustees’ consent. In addition, the manager has agreed to waive the Fund’s management fee to an extent sufficient to offset the net management fee payable in connection with any investment in an affiliated money market fund. |
| 8 | Reflects fee waivers and/or expense reimbursements. |
| 9 | Excludes securities received as a result of a contribution in-kind. |
See Notes to Financial Statements.
| | | | | | |
| BrandywineGLOBAL—Small Cap Value Fund 2022 Annual Report | | | | | 23 | |
Financial highlights (cont’d)
| | | | |
For a share of each class of beneficial interest outstanding throughout each year ended December 31,
unless otherwise noted: | |
| Class R Shares1 | | 20222 | |
| |
| Net asset value, beginning of period | | | $10.00 | |
| |
| Income (loss) from operations: | | | | |
Net investment income | | | 0.02 | |
Net realized and unrealized loss | | | (0.01) | |
Total income from operations | | | 0.01 | |
| |
| Less distributions from: | | | | |
Net investment income | | | (0.08) | |
Total distributions | | | (0.08) | |
| |
| Net asset value, end of period | | | $9.93 | |
Total return3 | | | 0.11 | % |
| |
| Net assets, end of period (000s) | | | $5 | |
| |
| Ratios to average net assets: | | | | |
Gross expenses4,5 | | | 4.90 | % |
Net expenses4,6,7 | | | 1.60 | |
Net investment income4 | | | 0.65 | |
| |
| Portfolio turnover rate8 | | | 21 | % |
| 1 | Per share amounts have been calculated using the average shares method. |
| 2 | For the period August 31, 2022 (inception date) to December 31, 2022. |
| 3 | Performance figures may reflect compensating balance arrangements, fee waivers and/or expense reimbursements. In the absence of compensating balance arrangements, fee waivers and/or expense reimbursements, the total return would have been lower. Past performance is no guarantee of future results. Total returns for periods of less than one year are not annualized. |
| 5 | Ratio includes 1.73% of non-recurring organizational and offering costs related to the inception of the Fund. |
| 6 | As a result of an expense limitation arrangement, the ratio of total annual fund operating expenses, other than interest, brokerage commissions, dividend expense on short sales, taxes, extraordinary expenses and acquired fund fees and expenses, to average net assets of Class R shares did not exceed 1.60%. This expense limitation arrangement cannot be terminated prior to December 31, 2024 without the Board of Trustees’ consent. In addition, the manager has agreed to waive the Fund’s management fee to an extent sufficient to offset the net management fee payable in connection with any investment in an affiliated money market fund. |
| 7 | Reflects fee waivers and/or expense reimbursements. |
| 8 | Excludes securities received as a result of a contribution in-kind. |
See Notes to Financial Statements.
| | | | |
| 24 | | | | BrandywineGLOBAL—Small Cap Value Fund 2022 Annual Report |
| | | | |
For a share of each class of beneficial interest outstanding throughout each year ended December 31,
unless otherwise noted: | |
| Class I Shares1 | | 20222 | |
| |
| Net asset value, beginning of period | | | $10.00 | |
| |
| Income (loss) from operations: | | | | |
Net investment income | | | 0.04 | |
Net realized and unrealized loss | | | (0.01) | |
Total income from operations | | | 0.03 | |
| |
| Less distributions from: | | | | |
Net investment income | | | (0.09) | |
Total distributions | | | (0.09) | |
| |
| Net asset value, end of period | | | $9.94 | |
Total return3 | | | 0.29 | % |
| |
| Net assets, end of period (000s) | | | $5 | |
| |
| Ratios to average net assets: | | | | |
Gross expenses4,5 | | | 4.40 | % |
Net expenses4,6,7 | | | 1.00 | |
Net investment income4 | | | 1.25 | |
| |
| Portfolio turnover rate8 | | | 21 | % |
| 1 | Per share amounts have been calculated using the average shares method. |
| 2 | For the period August 31, 2022 (inception date) to December 31, 2022. |
| 3 | Performance figures may reflect compensating balance arrangements, fee waivers and/or expense reimbursements. In the absence of compensating balance arrangements, fee waivers and/or expense reimbursements, the total return would have been lower. Past performance is no guarantee of future results. Total returns for periods of less than one year are not annualized. |
| 5 | Ratio includes 1.73% of non-recurring organizational and offering costs related to the inception of the Fund. |
| 6 | As a result of an expense limitation arrangement, the ratio of total annual fund operating expenses, other than interest, brokerage commissions, dividend expense on short sales, taxes, extraordinary expenses and acquired fund fees and expenses, to average net assets of Class I shares did not exceed 1.00%. This expense limitation arrangement cannot be terminated prior to December 31, 2024 without the Board of Trustees’ consent. In addition, the manager has agreed to waive the Fund’s management fee to an extent sufficient to offset the net management fee payable in connection with any investment in an affiliated money market fund. |
| 7 | Reflects fee waivers and/or expense reimbursements. |
| 8 | Excludes securities received as a result of a contribution in-kind. |
See Notes to Financial Statements.
| | | | | | |
| BrandywineGLOBAL—Small Cap Value Fund 2022 Annual Report | | | | | 25 | |
Financial highlights (cont’d)
| | | | |
For a share of each class of beneficial interest outstanding throughout each year ended December 31,
unless otherwise noted: | |
| Class IS Shares1 | | 20222 | |
| |
| Net asset value, beginning of period | | | $10.00 | |
| |
| Income (loss) from operations: | | | | |
Net investment income | | | 0.05 | |
Net realized and unrealized loss | | | (0.02) | |
Total income from operations | | | 0.03 | |
| |
| Less distributions from: | | | | |
Net investment income | | | (0.09) | |
Total distributions | | | (0.09) | |
| |
| Net asset value, end of period | | | $9.94 | |
Total return3 | | | 0.30 | % |
| |
| Net assets, end of period (000s) | | | $15,612 | |
| |
| Ratios to average net assets: | | | | |
Gross expenses4,5 | | | 3.87 | % |
Net expenses4,6,7 | | | 0.90 | |
Net investment income4 | | | 1.35 | |
| |
| Portfolio turnover rate8 | | | 21 | % |
| 1 | Per share amounts have been calculated using the average shares method. |
| 2 | For the period August 31, 2022 (inception date) to December 31, 2022. |
| 3 | Performance figures may reflect compensating balance arrangements, fee waivers and/or expense reimbursements. In the absence of compensating balance arrangements, fee waivers and/or expense reimbursements, the total return would have been lower. Past performance is no guarantee of future results. Total returns for periods of less than one year are not annualized. |
| 5 | Ratio includes 1.72% of non-recurring organizational and offering costs related to the inception of the Fund. |
| 6 | As a result of an expense limitation arrangement, the ratio of total annual fund operating expenses, other than interest, brokerage commissions, dividend expense on short sales, taxes, extraordinary expenses and acquired fund fees and expenses, to average net assets of Class IS shares did not exceed 0.90%. In addition, the ratio of total annual fund operating expenses for Class IS shares did not exceed the ratio of total annual fund operating expenses for Class I shares. These expense limitation arrangements cannot be terminated prior to December 31, 2024 without the Board of Trustees’ consent. In addition, the manager has agreed to waive the Fund’s management fee to an extent sufficient to offset the net management fee payable in connection with any investment in an affiliated money market fund. |
| 7 | Reflects fee waivers and/or expense reimbursements. |
| 8 | Excludes securities received as a result of a contribution in-kind. |
See Notes to Financial Statements.
| | | | |
| 26 | | | | BrandywineGLOBAL—Small Cap Value Fund 2022 Annual Report |
Notes to financial statements
1. Organization and significant accounting policies
BrandywineGLOBAL — Small Cap Value Fund (the “Fund”) is a separate diversified investment series of Legg Mason Global Asset Management Trust (the “Trust”). The Trust, a Maryland statutory trust, is registered under the Investment Company Act of 1940, as amended (the “1940 Act”), as an open-end management investment company.
The Fund follows the accounting and reporting guidance in Financial Accounting Standards Board (“FASB”) Accounting Standards Codification Topic 946, Financial Services –Investment Companies (“ASC 946”). The following are significant accounting policies consistently followed by the Fund and are in conformity with U.S. generally accepted accounting principles (“GAAP”), including, but not limited to, ASC 946. Estimates and assumptions are required to be made regarding assets, liabilities and changes in net assets resulting from operations when financial statements are prepared. Changes in the economic environment, financial markets and any other parameters used in determining these estimates could cause actual results to differ. Subsequent events have been evaluated through the date the financial statements were issued.
(a) Investment valuation. Equity securities for which market quotations are available are valued at the last reported sales price or official closing price on the primary market or exchange on which they trade. The valuations for fixed income securities (which may include, but are not limited to, corporate, government, municipal, mortgage-backed, collateralized mortgage obligations and asset-backed securities) and certain derivative instruments are typically the prices supplied by independent third party pricing services, which may use market prices or broker/dealer quotations or a variety of valuation techniques and methodologies. The independent third party pricing services typically use inputs that are observable such as issuer details, interest rates, yield curves, prepayment speeds, credit risks/spreads, default rates and quoted prices for similar securities. Investments in open-end funds are valued at the closing net asset value per share of each fund on the day of valuation. When the Fund holds securities or other assets that are denominated in a foreign currency, the Fund will normally use the currency exchange rates as of 4:00 p.m. (Eastern Time). If independent third party pricing services are unable to supply prices for a portfolio investment, or if the prices supplied are deemed by the manager to be unreliable, the market price may be determined by the manager using quotations from one or more broker/dealers or at the transaction price if the security has recently been purchased and no value has yet been obtained from a pricing service or pricing broker. When reliable prices are not readily available, such as when the value of a security has been significantly affected by events after the close of the exchange or market on which the security is principally traded, but before the Fund calculates its net asset value, the Fund values these securities as determined in accordance with procedures approved by the Fund’s Board of Trustees.
Pursuant to policies adopted by the Board of Trustees, the Fund’s manager has been designated as the valuation designee and is responsible for the oversight of the daily valuation process. The Fund’s manager is assisted by the Global Fund Valuation Committee (the “Valuation Committee”). The Valuation Committee is responsible for making fair value determinations, evaluating the effectiveness of the Fund’s pricing policies, and reporting to the Fund’s manager and the Board of Trustees. When determining the reliability of third
| | | | | | |
| BrandywineGLOBAL—Small Cap Value Fund 2022 Annual Report | | | | | 27 | |
Notes to financial statements (cont’d)
party pricing information for investments owned by the Fund, the Valuation Committee, among other things, conducts due diligence reviews of pricing vendors, monitors the daily change in prices and reviews transactions among market participants.
The Valuation Committee will consider pricing methodologies it deems relevant and appropriate when making fair value determinations. Examples of possible methodologies include, but are not limited to, multiple of earnings; discount from market of a similar freely traded security; discounted cash-flow analysis; book value or a multiple thereof; risk premium/yield analysis; yield to maturity; and/or fundamental investment analysis. The Valuation Committee will also consider factors it deems relevant and appropriate in light of the facts and circumstances. Examples of possible factors include, but are not limited to, the type of security; the issuer’s financial statements; the purchase price of the security; the discount from market value of unrestricted securities of the same class at the time of purchase; analysts’ research and observations from financial institutions; information regarding any transactions or offers with respect to the security; the existence of merger proposals or tender offers affecting the security; the price and extent of public trading in similar securities of the issuer or comparable companies; and the existence of a shelf registration for restricted securities.
For each portfolio security that has been fair valued pursuant to the policies adopted by the Board of Trustees, the fair value price is compared against the last available and next available market quotations. The Valuation Committee reviews the results of such back testing monthly and fair valuation occurrences are reported to the Board of Trustees quarterly.
The Fund uses valuation techniques to measure fair value that are consistent with the market approach and/or income approach, depending on the type of security and the particular circumstance. The market approach uses prices and other relevant information generated by market transactions involving identical or comparable securities. The income approach uses valuation techniques to discount estimated future cash flows to present value.
GAAP establishes a disclosure hierarchy that categorizes the inputs to valuation techniques used to value assets and liabilities at measurement date. These inputs are summarized in the three broad levels listed below:
| • | | Level 1 — unadjusted quoted prices in active markets for identical investments |
| • | | Level 2 — other significant observable inputs (including quoted prices for similar investments, interest rates, prepayment speeds, credit risk, etc.) |
| • | | Level 3 — significant unobservable inputs (including the Fund’s own assumptions in determining the fair value of investments) |
The inputs or methodologies used to value securities are not necessarily an indication of the risk associated with investing in those securities.
| | | | |
| 28 | | | | BrandywineGLOBAL—Small Cap Value Fund 2022 Annual Report |
The following is a summary of the inputs used in valuing the Fund’s assets carried at fair value:
| | | | | | | | | | | | | | | | |
| ASSETS | |
| Description | | Quoted Prices
(Level 1) | | | Other Significant
Observable Inputs (Level 2) | | | Significant
Unobservable
Inputs (Level 3) | | | Total | |
| Common Stocks† | | $ | 15,191,386 | | | | — | | | | — | | | $ | 15,191,386 | |
| Short-Term Investments† | | | 464,093 | | | | — | | | | — | | | | 464,093 | |
| Total Investments | | $ | 15,655,479 | | | | — | | | | — | | | $ | 15,655,479 | |
| † | See Schedule of Investments for additional detailed categorizations. |
(b) Foreign investment risks. The Fund’s investments in foreign securities may involve risks not present in domestic investments. Since securities may be denominated in foreign currencies, may require settlement in foreign currencies or may pay interest or dividends in foreign currencies, changes in the relationship of these foreign currencies to the U.S. dollar can significantly affect the value of the investments and earnings of the Fund. Foreign investments may also subject the Fund to foreign government exchange restrictions, expropriation, taxation or other political, social or economic developments, all of which affect the market and/or credit risk of the investments.
(c) Security transactions and investment income. Security transactions are accounted for on a trade date basis. Interest income (including interest income from payment-in-kind securities), adjusted for amortization of premium and accretion of discount, is recorded on the accrual basis. Dividend income is recorded on the ex-dividend date for dividends received in cash and/or securities. The cost of investments sold is determined by use of the specific identification method. To the extent any issuer defaults or a credit event occurs that impacts the issuer, the Fund may halt any additional interest income accruals and consider the realizability of interest accrued up to the date of default or credit event.
(d) REIT distributions. The character of distributions received from Real Estate Investment Trusts (‘‘REITs’’) held by the Fund is generally comprised of net investment income, capital gains, and return of capital. It is the policy of the Fund to estimate the character of distributions received from underlying REITs based on historical data provided by the REITs. After each calendar year end, REITs report the actual tax character of these distributions. Differences between the estimated and actual amounts reported by the REITs are reflected in the Fund’s records in the year in which they are reported by the REITs by adjusting related investment cost basis, capital gains and income, as necessary.
(e) Distributions to shareholders. Distributions from net investment income and distributions of net realized gains, if any, are declared at least annually. Distributions to shareholders of the Fund are recorded on the ex-dividend date and are determined in accordance with income tax regulations, which may differ from GAAP.
(f) Share class accounting. Investment income, common expenses and realized/ unrealized gains (losses) on investments are allocated to the various classes of the Fund on the basis of daily net assets of each class. Fees relating to a specific class are charged directly to that share class.
| | | | | | |
| BrandywineGLOBAL—Small Cap Value Fund 2022 Annual Report | | | | | 29 | |
Notes to financial statements (cont’d)
(g) Compensating balance arrangements. The Fund has an arrangement with its custodian bank whereby a portion of the custodian’s fees are paid indirectly by credits earned on the Fund’s cash on deposit with the bank.
(h) Organization costs. Organization costs associated with the establishment of the Fund are charged to expense as they are incurred.
(i) Offering costs. Costs incurred by the Fund in connection with offering of the Fund’s shares at the commencement of the Fund’s operations are being amortized on a straight line basis over twelve months.
(j) Federal and other taxes. It is the Fund’s policy to comply with the federal income and excise tax requirements of the Internal Revenue Code of 1986 (the “Code”), as amended, applicable to regulated investment companies. Accordingly, the Fund intends to distribute its taxable income and net realized gains, if any, to shareholders in accordance with timing requirements imposed by the Code. Therefore, no federal or state income tax provision is required in the Fund’s financial statements.
Under the applicable foreign tax laws, a withholding tax may be imposed on interest, dividends and capital gains at various rates.
(k) Reclassification. GAAP requires that certain components of net assets be reclassified to reflect permanent differences between financial and tax reporting. These reclassifications have no effect on net assets or net asset value per share. During the current period, the following reclassifications have been made:
| | | | | | | | |
| | | Total Distributable
Earnings (Loss) | | | Paid-in
Capital | |
| (a) | | $ | 21,132 | | | $ | (21,132) | |
| (a) | Reclassifications are due to non-deductible offering and organization costs. |
2. Investment management agreement and other transactions with affiliates
Legg Mason Partners Fund Advisor, LLC (“LMPFA”) is the Fund’s investment manager and Brandywine Global Investment Management, LLC (“Brandywine Global”) is the Fund’s subadviser. LMPFA and Brandywine Global are indirect, wholly-owned subsidiaries of Franklin Resources, Inc. (“Franklin Resources”).
Under the investment management agreement, the Fund pays an investment management fee, calculated daily and paid monthly, in accordance with the following breakpoint schedule:
| | | | |
| Average Daily Net Assets | | Annual Rate | |
| First $1 billion | | | 0.800 | % |
| Next $2 billion | | | 0.750 | |
| Over $3 billion | | | 0.700 | |
LMPFA provides administrative and certain oversight services to the Fund. LMPFA delegates to the subadviser the day-to-day portfolio management of the Fund. For its services, LMPFA pays Brandywine Global a fee monthly, at an annual rate equal to 70% of the net management fee it receives from the Fund.
| | | | |
| 30 | | | | BrandywineGLOBAL—Small Cap Value Fund 2022 Annual Report |
As a result of expense limitation arrangements between the Fund and LMPFA, the ratio of total annual fund operating expenses, other than interest, brokerage commissions, dividend expense on short sales, taxes, extraordinary expenses and acquired fund fees and expenses, to average net assets of Class A, Class C, Class R, Class I and Class IS shares did not exceed 1.25%, 2.00%, 1.60%, 1.00% and 0.90%, respectively. In addition, the ratio of total annual fund operating expenses for Class IS shares did not exceed the ratio of total annual fund operating expenses for Class I shares. These expense limitation arrangements cannot be terminated prior to December 31, 2024 without the Board of Trustees’ consent. In addition, the manager has agreed to waive the Fund’s management fee to an extent sufficient to offset the net management fee payable in connection with any investment in an affiliated money market fund (the “affiliated money market fund waiver”). The affiliated money market fund waiver is not subject to the recapture provision discussed below. During the period ended December 31, 2022, fees waived and/or expenses reimbursed amounted to $154,546, which included an affiliated money market fund waiver of $113. LMPFA is permitted to recapture amounts waived and/or reimbursed to a class within three years after the fiscal year in which LMPFA earned the fee or incurred the expense if the class’ total annual fund operating expenses have fallen to a level below the expense limitation (“expense cap”) in effect at the time the fees were earned or the expenses incurred. In no case will LMPFA recapture any amount that would result, on any particular business day of the Fund, in the class’ total annual fund operating expenses exceeding the expense cap or any other lower limit then in effect.
Pursuant to these arrangements, at December 31, 2022, the Fund had remaining fee waivers and/or expense reimbursements subject to recapture by LMPFA and respective dates of expiration as follows:
| | | | | | | | | | | | | | | | | | | | |
| | | Class A | | | Class C | | | Class R | | | Class I | | | Class IS | |
| Expires December 31, 2025 | �� | $ | 256 | | | $ | 56 | | | $ | 55 | | | $ | 57 | | | $ | 154,009 | |
For the period ended December 31, 2022, LMPFA did not recapture any fees.
At December 31, 2022, $128,296 was payable to LMPFA by the Fund for reimbursement of fund organizational and offering expenses paid by LMPFA on behalf of the Fund.
Franklin Templeton Investor Services, LLC (“Investor Services”) serves as the Fund’s shareholder servicing agent and acts as the Fund’s transfer agent and dividend-paying agent. Investor Services is an indirect, wholly-owned subsidiary of Franklin Resources. Franklin Distributors, LLC (“Franklin Distributors”) serves as the Fund’s sole and exclusive distributor. Franklin Distributors is an indirect, wholly-owned broker-dealer subsidiary of Franklin Resources.
There is a maximum initial sales charge of 5.50% for Class A shares. There is a contingent deferred sales charge (“CDSC”) of 1.00% on Class C shares, which applies if redemption occurs within 12 months from purchase payment. In certain cases, Class A shares have a 1.00% CDSC, which applies if redemption occurs within 18 months from purchase payment. This CDSC only applies to those purchases of Class A shares, which, when combined with current holdings of other shares of funds sold by Franklin Distributors, equal or exceed $1,000,000 in the aggregate. These purchases do not incur an initial sales charge.
| | | | | | |
| BrandywineGLOBAL—Small Cap Value Fund 2022 Annual Report | | | | | 31 | |
Notes to financial statements (cont’d)
For the period ended December 31, 2022, sales charges retained by and CDSCs paid to Franklin Distributors and its affiliates, if any, were as follows:
| | | | |
| | | Class A | |
| Sales charges | | $ | 6 | |
| CDSCs | | | — | |
All officers and one Trustee of the Trust are employees of Franklin Resources or its affiliates and do not receive compensation from the Trust.
3. Investments
During the period ended December 31, 2022, the aggregate cost of purchases and proceeds from sales of investments (excluding short-term investments) were as follows:
| | | | |
| Purchases | | $ | 3,276,982 | * |
| Sales | | | 3,154,940 | |
| * | Excludes the cost of portfolio securities received as a result of a contribution in-kind, totaling $16,399,807. |
At December 31, 2022, the aggregate cost of investments and the aggregate gross unrealized appreciation and depreciation of investments for federal income tax purposes were as follows:
| | | | | | | | | | | | | | | | |
| | | Cost | | | Gross
Unrealized
Appreciation | | | Gross
Unrealized
Depreciation | | | Net
Unrealized
Depreciation | |
| Securities | | $ | 16,712,292 | | | $ | 1,658,940 | | | $ | (2,715,753) | | | $ | (1,056,813) | |
4. Derivative instruments and hedging activities
During the period ended December 31, 2022, the Fund did not invest in derivative instruments.
5. Class specific expenses, waivers and/or expense reimbursements
The Fund has adopted a Rule 12b-1 shareholder services and distribution plan and under that plan the Fund pays service and/or distribution fees with respect to its Class A, Class C and Class R shares calculated at the annual rate of 0.25%, 1.00% and 0.50% of the average daily net assets of each class, respectively. Service and/or distribution fees are accrued daily and paid monthly.
For the period ended December 31, 2022, class specific expenses were as follows:
| | | | | | | | |
| | | Service and/or
Distribution Fees† | | | Transfer Agent
Fees† | |
| Class A | | $ | 22 | | | $ | 8 | |
| Class C | | | 17 | | | | 8 | |
| Class R | | | 8 | | | | 9 | |
| Class I | | | — | | | | 9 | |
| Class IS | | | — | | | | 32 | |
| Total | | $ | 47 | | | $ | 66 | |
| † | For the period August 31, 2022 (inception date) to December 31, 2022. |
| | | | |
| 32 | | | | BrandywineGLOBAL—Small Cap Value Fund 2022 Annual Report |
For the period ended December 31, 2022, waivers and/or expense reimbursements by class were as follows:
| | | | |
| | | Waivers/Expense
Reimbursements† | |
| Class A | | $ | 256 | |
| Class C | | | 56 | |
| Class R | | | 55 | |
| Class I | | | 57 | |
| Class IS | | | 154,122 | |
| Total | | $ | 154,546 | |
| † | For the period August 31, 2022 (inception date) to December 31, 2022. |
6. Distributions to shareholders by class
| | | | |
| | | Period Ended
December 31, 2022† | |
| Net Investment Income: | | | | |
| Class A | | $ | 261 | |
| Class C | | | 35 | |
| Class R | | | 42 | |
| Class I | | | 46 | |
| Class IS | | | 144,117 | |
| Total | | $ | 144,501 | |
| † | For the period August 31, 2022 (inception date) to December 31, 2022. |
7. Shares of beneficial interest
At December 31, 2022, the Trust had an unlimited number of shares of beneficial interest authorized with a par value of $0.00001 per share. The Fund has the ability to issue multiple classes of shares. Each class of shares represents an identical interest and has the same rights, except that each class bears certain direct expenses, including those specifically related to the distribution of its shares.
Transactions in shares of each class were as follows:
| | | | | | | | |
| | | Period Ended
December 31, 2022† | |
| | | Shares | | | Amount | |
| Class A | | | | | | | | |
| Shares sold | | | 5,551 | | | $ | 55,664 | |
| Shares issued on reinvestment | | | 21 | | | | 221 | |
| Shares repurchased | | | (1,970) | | | | (20,000) | |
| Net increase | | | 3,602 | | | $ | 35,885 | |
| | | | | | |
| BrandywineGLOBAL—Small Cap Value Fund 2022 Annual Report | | | | | 33 | |
Notes to financial statements (cont’d)
| | | | | | | | |
| | | Period Ended
December 31, 2022† | |
| | | Shares | | | Amount | |
| Class C | | | | | | | | |
| Shares sold | | | 500 | | | $ | 5,000 | |
| Shares issued on reinvestment | | | — | | | | — | |
| Shares repurchased | | | — | | | | — | |
| Net increase | | | 500 | | | $ | 5,000 | |
| Class R | | | | | | | | |
| Shares sold | | | 500 | | | $ | 5,000 | |
| Shares issued on reinvestment | | | — | | | | — | |
| Shares repurchased | | | — | | | | — | |
| Net increase | | | 500 | | | $ | 5,000 | |
| Class I | | | | | | | | |
| Shares sold | | | 500 | | | $ | 5,000 | |
| Shares issued on reinvestment | | | — | | | | — | |
| Shares repurchased | | | — | | | | — | |
| Net increase | | | 500 | | | $ | 5,000 | |
| Class IS | | | | | | | | |
| Shares sold | | | — | | | | — | |
| Shares issued on reinvestment | | | 14,019 | | | $ | 144,117 | |
| Shares repurchased | | | — | | | | — | |
| In-kind capital contribution | | | 1,556,320 | | | | 15,563,202 | |
| Net increase | | | 1,570,339 | | | $ | 15,707,319 | |
| † | For the period August 31, 2022 (inception date) to December 31, 2022. |
8. Transactions with affiliated company
As defined by the 1940 Act, an affiliated company is one in which the Fund owns 5% or more of the outstanding voting securities, or a company which is under common ownership or control with the Fund. The following company was considered an affiliated company for all or some portion of the period ended December 31, 2022. The following transactions were effected in such company for the period ended December 31, 2022.
| | | | | | | | | | | | | | | | | | | | |
| | | Affiliate Value at
August 31, 2022 (inception | | | Purchased | | | Sold | |
| | date) | | | Cost | | | Shares | | | Proceeds | | | Shares | |
| Western Asset Premier Institutional U.S. Treasury Reserves, Premium Shares | | | — | | | $ | 2,157,143 | | | | 2,157,143 | | | $ | 1,693,050 | | | | 1,693,050 | |
| | | | |
| 34 | | | | BrandywineGLOBAL—Small Cap Value Fund 2022 Annual Report |
| | | | | | | | | | | | | | | | |
| (cont’d) | | Realized
Gain (Loss) | | | Dividend
Income | | | Net Increase
(Decrease) in
Unrealized
Appreciation
(Depreciation) | | | Affiliate
Value at
December 31,
2022 | |
| Western Asset Premier Institutional U.S. Treasury Reserves, Premium Shares | | | — | | | $ | 5,055 | | | | — | | | $ | 464,093 | |
9. In-kind transfer of securities
On August 31, 2022, the Fund’s Class IS shares received a contribution in-kind of investment securities, cash and other receivables in the amount of $15,563,202. The securities contributed in-kind had net unrealized depreciation of $1,309,042. This contribution was determined to be tax-free under the Internal Revenue Code Section 351 and no gain or loss was realized.
10. Income tax information and distributions to shareholders
The tax character of distributions paid during the tax period ended December 31, 2022, was as follows:
| | | | |
| | | 2022 | |
| Distributions paid from: | | | | |
| Ordinary income | | $ | 144,501 | |
As of December 31, 2022, the components of distributable earnings (loss) on a tax basis were as follows:
| | | | |
| Undistributed ordinary income — net | | $ | 34,566 | |
| Deferred capital losses* | | | (356,931) | |
| Other book/tax temporary differences(a) | | | (4,250) | |
| Unrealized appreciation (depreciation)(b) | | | 252,229 | |
| Total distributable earnings (loss) — net | | $ | (74,386) | |
| * | These capital losses have been deferred in the current year as either short-term or long-term losses. The losses will be deemed to occur on the first day of the next taxable year in the same character as they were originally deferred and will be available to offset future taxable capital gains. |
| (a) | Other book/tax temporary differences are attributable to book/tax differences in the timing of the deductibility of various expenses. |
| (b) | The difference between book-basis and tax-basis unrealized appreciation (depreciation) is attributable to the realization for tax purposes of unrealized gains on investments in passive foreign investment companies. |
11. Recent accounting pronouncements
In June 2022, the Financial Accounting Standards Board (FASB) issued Accounting Standards Update (ASU) No. 2022-03, Fair Value Measurement (Topic 820) – Fair Value Measurement of Equity Securities Subject to Contractual Sale Restrictions. The amendments in the ASU clarify that a contractual restriction on the sale of an equity security is not considered part of the unit of account of the equity security and, therefore, should not be considered in measuring fair value. The ASU is effective for interim and annual reporting periods beginning after December 15, 2023, with the option of early
| | | | | | |
| BrandywineGLOBAL—Small Cap Value Fund 2022 Annual Report | | | | | 35 | |
Notes to financial statements (cont’d)
adoption. Management has reviewed the requirements and believes that the adoption of the ASU will not have a material impact on the financial statements.
* * *
In March 2020, the Financial Accounting Standards Board (FASB) issued Accounting Standards Update (ASU) No. 2020-04, Reference Rate Reform (Topic 848) – Facilitation of the Effects of Reference Rate Reform on Financial Reporting. In January 2021, the FASB issued ASU No. 2021-01, with further amendments to Topic 848. The amendments in the ASUs provide optional temporary accounting recognition and financial reporting relief from the effect of certain types of contract modifications due to the planned discontinuation of the LIBOR and other interbank-offered based reference rates as of the end of 2021 and 2023. The ASUs are effective for certain reference rate-related contract modifications that occur during the period March 12, 2020 through December 31, 2022. Management has reviewed the requirements and believes the adoption of these ASUs will not have a material impact on the financial statements.
12. Other matters
The outbreak of the respiratory illness COVID-19 (commonly referred to as “coronavirus”) has continued to rapidly spread around the world, causing considerable uncertainty for the global economy and financial markets. The ultimate economic fallout from the pandemic, and the long-term impact on economies, markets, industries and individual issuers, are not known. The COVID-19 pandemic could adversely affect the value and liquidity of the Fund’s investments, impair the Fund’s ability to satisfy redemption requests, and negatively impact the Fund’s performance. In addition, the outbreak of COVID-19, and measures taken to mitigate its effects, could result in disruptions to the services provided to the Fund by its service providers.
* * *
On February 24, 2022, Russia engaged in military actions in the sovereign territory of Ukraine. The current political and financial uncertainty surrounding Russia and Ukraine may increase market volatility and the economic risk of investing in securities in these countries and may also cause uncertainty for the global economy and broader financial markets. The ultimate fallout and long-term impact from these events are not known. The Fund will continue to assess the impact on valuations and liquidity and will take any potential actions needed in accordance with procedures approved by the Board of Trustees.
13. Subsequent event
On February 3, 2023, the Fund, together with other U.S. registered and foreign investment funds (collectively, the “Borrowers”) managed by Franklin Resources or its affiliates, became a borrower in a joint syndicated senior unsecured credit facility totaling $2.675 billion (the “Global Credit Facility”). The Global Credit Facility provides a source of funds to the Borrowers for temporary and emergency purposes, including the ability to meet future unanticipated or unusually large redemption requests. Unless renewed, the Global Credit Facility will terminate on February 2, 2024.
| | | | |
| 36 | | | | BrandywineGLOBAL—Small Cap Value Fund 2022 Annual Report |
Report of independent registered public accounting firm
To the Board of Trustees of Legg Mason Global Asset Management Trust and Shareholders of BrandywineGLOBAL—Small Cap Value Fund
Opinion on the Financial Statements
We have audited the accompanying statement of assets and liabilities, including the schedule of investments, of BrandywineGLOBAL — Small Cap Value Fund (one of the funds constituting Legg Mason Global Asset Management Trust, referred to hereafter as the “Fund”) as of December 31, 2022, and the related statements of operations and changes in net assets, including the related notes, and the financial highlights for the period August 31, 2022 (inception date) through December 31, 2022 (collectively referred to as the “financial statements”). In our opinion, the financial statements present fairly, in all material respects, the financial position of the Fund as of December 31, 2022, and the results of its operations, changes in its net assets, and the financial highlights for the period August 31, 2022 (inception date) through December 31, 2022 in conformity with accounting principles generally accepted in the United States of America.
Basis for Opinion
These financial statements are the responsibility of the Fund’s management. Our responsibility is to express an opinion on the Fund’s financial statements based on our audit. We are a public accounting firm registered with the Public Company Accounting Oversight Board (United States) (PCAOB) and are required to be independent with respect to the Fund in accordance with the U.S. federal securities laws and the applicable rules and regulations of the Securities and Exchange Commission and the PCAOB.
We conducted our audit of these financial statements in accordance with the standards of the PCAOB. Those standards require that we plan and perform the audit to obtain reasonable assurance about whether the financial statements are free of material misstatement, whether due to error or fraud.
Our audit included performing procedures to assess the risks of material misstatement of the financial statements, whether due to error or fraud, and performing procedures that respond to those risks. Such procedures included examining, on a test basis, evidence regarding the amounts and disclosures in the financial statements. Our audit also included evaluating the accounting principles used and significant estimates made by management, as well as evaluating the overall presentation of the financial statements. Our procedures included confirmation of securities owned as of December 31, 2022 by correspondence with the custodian. We believe that our audit provides a reasonable basis for our opinion.
/s/PricewaterhouseCoopers LLP
Baltimore, Maryland
February 20, 2023
We have served as the auditor of one or more investment companies in the Franklin Templeton Group of Funds since 1948.
| | | | | | |
| BrandywineGLOBAL—Small Cap Value Fund 2022 Annual Report | | | | | 37 | |
Initial Board approval of management and subadvisory agreements (unaudited)
At an in-person meeting of the Board of Trustees of Legg Mason Global Asset Management Trust (the “Trust”) held on May 4 and 5, 2022, the Board, including the Trustees who are not considered to be “interested persons” of the Trust (the “Independent Trustees”) under the Investment Company Act of 1940, as amended (the “1940 Act”), approved for an initial two-year period the management agreement (the “Management Agreement”) between the Trust and Legg Mason Partners Fund Advisor, LLC (the “Manager”) with respect to BrandywineGLOBAL – Small Cap Value Fund, a series of the Trust (the “Fund”), and the sub-advisory agreement pursuant to which Brandywine Global Investment Management, LLC (the “Subadviser”) provides day-to-day management of the Fund’s portfolio. The management agreement and sub-advisory agreement are collectively referred to as the “Agreements.”
Background
The Board received extensive information in advance of the meeting to assist it in its consideration of the Agreements and asked questions and requested additional information from management. Prior to the meeting the Independent Trustees met with their independent legal counsel to discuss and consider the information provided and submitted questions to management, and they considered the responses provided. The Board received and considered a variety of information about the Manager and the Subadviser, as well as the management, advisory and sub-advisory arrangements for other funds overseen by the Board, certain portions of which are discussed below. The information received and considered by the Board was both written and oral.
The discussion below covers both the advisory and the administrative functions to be rendered by the Manager, both of which functions are encompassed by the Management Agreement, as well as the advisory functions to be rendered by the Subadviser pursuant to the Sub-Advisory Agreement.
The Independent Trustees were advised by separate independent legal counsel throughout the process. The Independent Trustees considered the Management Agreement and the Sub-Advisory Agreement separately in the course of their review. In doing so, they noted the respective roles of the Manager and the Subadviser in providing services to the Fund.
In approving the Agreements, the Board, including the Independent Trustees, considered a variety of factors, including those factors discussed below. No single factor reviewed by the Board was identified by the Board as the principal factor in determining whether to approve the Management Agreement and the Sub-Advisory Agreement. Each Trustee may have attributed different weight to the various factors in evaluating the Management Agreement and the Sub-Advisory Agreement.
| | | | |
| 38 | | | | BrandywineGLOBAL—Small Cap Value Fund |
After considering all relevant factors and information, the Board, exercising its business judgment, determined that the Agreements were in the best interests of the Fund and its shareholders and approved each Agreement.
Nature, extent and quality of the services under the management agreement and sub-advisory agreement
The Board received and considered information regarding the nature, extent and quality of services to be provided to the Fund by the Manager and the Subadviser under the Management Agreement and the Sub-Advisory Agreement, respectively. The Board noted information received at regular meetings throughout the year related to the services rendered by the Manager in its management of other funds in the fund complex overseen by the Trustees, including the Manager’s role in coordinating the activities of the Fund’s other service providers. The Board’s evaluation of the services to be provided by the Manager and the Subadviser took into account the Board’s knowledge gained as Trustees of funds in the fund complex overseen by the Trustees, including knowledge gained regarding the scope and quality of the investment management and other capabilities of the Manager and the Subadviser, and the quality of the Manager’s administrative and other services. The Board observed that the scope of services to be provided by the Manager and the Subadviser, and of the undertakings required of the Manager and Subadviser in connection with those services, including maintaining and monitoring their own compliance programs, liquidity management programs and cybersecurity programs and those of funds in the fund complex overseen by the Trustees, had expanded over time as a result of regulatory, market and other developments. The Board also considered the risks associated with the Fund to be borne by the Manager and its affiliates (such as entrepreneurial, operational, reputational, litigation and regulatory risk), as well as the Manager’s and the Subadviser’s risk management processes.
The Board reviewed the qualifications, backgrounds and responsibilities of the Manager’s and the Subadviser’s senior personnel and the team of investment professionals that would be primarily responsible for the day-to-day portfolio management of the Fund. The Board discussed with representatives of management the portfolio management strategy of the Fund’s portfolio managers. The Board also considered, based on its knowledge of the Manager and the Manager’s affiliates, the financial resources of Franklin Resources, Inc., the parent organization of the Manager and the Subadviser. The Board recognized the importance of having a fund manager with significant resources.
The Board considered the division of responsibilities between the Manager and the Subadviser and the oversight to be provided by the Manager. The Board also considered the policies and practices of the Manager and the Subadviser regarding the selection of brokers and dealers and the execution of portfolio transactions, based upon reports provided in connection with the Board’s oversight of other funds in the fund complex overseen by the
| | | | | | |
| BrandywineGLOBAL—Small Cap Value Fund | | | | | 39 | |
Initial Board approval of management and subadvisory agreements (unaudited) (cont’d)
Trustees. The Board considered management’s periodic reports to the Board on, among other things, its business plans, any organizational changes and portfolio manager compensation.
The Board received and considered historical performance results of Classic Small Cap Value Equity Portfolio, a series of the Brandywine Investment Trust and an unregistered private fund managed by the Subadviser under the same investment strategy used to manage the Fund (the “Predecessor Fund”). The Board noted that, following a planned transfer of the Predecessor Fund’s assets to the Fund, the Fund was to become the successor to the Predecessor Fund. The Board also noted that the team of investment professionals that were primarily responsible for the day-to-day portfolio management of the Predecessor Fund were expected to serve as portfolio managers of the Fund.
The Board concluded that, overall, the nature, extent and quality of services to be provided under the Management Agreement and the Sub-Advisory Agreement were sufficient for approval.
Management fees and expense ratios
The Board reviewed and considered the proposed contractual management fee payable by the Fund to the Manager (the “Contractual Management Fee”) in light of the nature, extent and quality of the management and sub-advisory services to be provided by the Manager and the Subadviser, respectively. The Board noted that the compensation paid to the Subadviser is the responsibility and expense of the Manager, not the Fund. The Board also noted that the Manager would waive fees and reimburse expenses to the extent necessary to maintain specified expense levels until December 31, 2023, unless the Board consents to an earlier termination. In addition, the Manager provided and discussed with the Board a comparison with the fees of other registered investment companies managed in the same investment category.
The Board considered the overall management fee, the fee of the Subadviser and the amount of the management fee to be retained by the Manager after payment of the subadvisory fee, in each case in light of the services to be rendered for those amounts. Taking all of the above into consideration, as well as the factors identified below, the Board determined that the management fee and the subadvisory fee for the Fund were reasonable in light of the nature, extent and quality of the services to be provided to the Fund under the Management Agreement and the Sub-Advisory Agreement.
Manager profitability and economies of scale
With respect to profitability, the Board noted the start-up status of the Fund and that the Manager and the Subadviser did not have any operating history or past profitability with respect to the Fund.
| | | | |
| 40 | | | | BrandywineGLOBAL—Small Cap Value Fund |
The Board noted that breakpoints are instituted in the Fund’s Contractual Management Fee, reflecting the potential for reducing the blended rate of the Contractual Management Fee as the Fund grows. The Board considered whether the breakpoint fee structure was a reasonable means of sharing any economies of scale or other efficiencies that might accrue from increases in the Fund’s asset levels.
The Board considered other benefits expected to be received by the Manager, the Subadviser and their affiliates as a result of their relationship with the Fund, including the opportunity to offer additional products and services to Fund shareholders, including the appointment of an affiliate of the Manager as the transfer agent of the Fund.
In light of the expected costs of providing investment management and other services to the Fund and the commitment of the Manager and the Subadviser to the Fund, the Board considered that the ancillary benefits that the Manager, the Subadviser and their affiliates expected to receive were reasonable.
| | | | | | |
| BrandywineGLOBAL—Small Cap Value Fund | | | | | 41 | |
Additional information (unaudited)
Information about Trustees and Officers
The business and affairs of BrandywineGLOBAL — Small Cap Value Fund (the “Fund”) are conducted by management under the supervision and subject to the direction of its Board of Trustees. The business address of each Trustee is c/o Jane Trust, Franklin Templeton, 100 International Drive, 11th Floor, Baltimore, Maryland 21202.
Information pertaining to the Trustees and officers of the Fund is set forth below. The Statement of Additional Information includes additional information about Trustees and is available, without charge, upon request by calling the Fund at 877-6LM-FUND/656-3863.
| | |
| Independent Trustees† |
| |
| Paul R. Ades | | |
| |
| Year of birth | | 1940 |
| |
| Position(s) with Trust | | Trustee |
| Term of office1 and length of time served2 | | Since 1983 |
| Principal occupation(s) during the past five years | | Paul R. Ades, PLLC (law firm) (since 2000) |
| Number of funds in fund complex overseen by Trustee | | 57 |
| Other board memberships held by Trustee during the past five years | | None |
| |
| Andrew L. Breech | | |
| |
| Year of birth | | 1952 |
| |
| Position(s) with Trust | | Trustee |
| Term of office1 and length of time served2 | | Since 1991 |
| Principal occupation(s) during the past five years | | President, Dealer Operating Control Service, Inc. (automotive retail management) (since 1985) |
| Number of funds in fund complex overseen by Trustee | | 57 |
| Other board memberships held by Trustee during the past five years | | None |
| |
| Althea L. Duersten | | |
| |
| Year of birth | | 1951 |
| |
| Position(s) with Trust | | Trustee and Chair of the Board |
| Term of office1 and length of time served2 | | Since 2014 (Chair of the Board since 2021) |
| Principal occupation(s) during the past five years | | Retired (since 2011); formerly, Chief Investment Officer, North America, JPMorgan Chase (investment bank) and member of JPMorgan Executive Committee (2007 to 2011) |
| Number of funds in fund complex overseen by Trustee | | 57 |
| Other board memberships held by Trustee during the past five years | | Formerly, Non-Executive Director, Rokos Capital Management LLP (2019 to 2020) |
| | | | |
| 42 | | | | BrandywineGLOBAL—Small Cap Value Fund |
| | |
| Independent Trustees† (cont’d) |
| |
| Stephen R. Gross | | |
| |
| Year of birth | | 1947 |
| |
| Position(s) with Trust | | Trustee |
| Term of office1 and length of time served2 | | Since 1986 |
| Principal occupation(s) during the past five years | | Chairman Emeritus (since 2011) and formerly, Chairman, HLB Gross Collins, P.C. (accounting and consulting firm) (1979 to 2011); Executive Director of Business Builders Team, LLC (since 2005); Principal, Gross Consulting Group, LLC (since 2011); CEO, Gross Capital Partners, LLC (since 2014); CEO, Trusted CFO Solutions, LLC (since 2011) |
| Number of funds in fund complex overseen by Trustee | | 57 |
| Other board memberships held by Trustee during the past five years | | None |
| |
| Susan M. Heilbron | | |
| |
| Year of birth | | 1945 |
| |
| Position(s) with Trust | | Trustee |
| Term of office1 and length of time served2 | | Since 1991 |
| Principal occupation(s) during the past five years | | Retired; formerly, President, Lacey & Heilbron (communications consulting) (1990 to 2002); General Counsel and Executive Vice President, The Trump Organization (1986 to 1990); Senior Vice President, New York State Urban Development Corporation (1984 to 1986); Associate, Cravath, Swaine & Moore LLP (1980 to 1984 and 1977 to 1979) |
| Number of funds in fund complex overseen by Trustee | | 57 |
| Other board memberships held by Trustee during the past five years | | None |
| |
| Arnold L. Lehman | | |
| Year of birth | | 1944 |
| Position(s) with Trust | | Trustee |
| |
| Term of office1 and length of time served2 | | Since 1982 |
| |
| Principal occupation(s) during the past five years | | Senior Advisor, Phillips (auction house) (since 2015); formerly, Fellow, Ford Foundation (2015 to 2016); Director of the Brooklyn Museum (1997 to 2015) |
| |
| Number of funds in fund complex overseen by Trustee | | 57 |
| |
| Other board memberships held by Trustee during the past five years | | Trustee of American Federation of Arts (since 2002) |
| | | | | | |
| BrandywineGLOBAL—Small Cap Value Fund | | | | | 43 | |
Additional information (unaudited) (con’d)
Information about Trustees and Officers
| | |
| Independent Trustees† (cont’d) |
| |
| Robin J. W. Masters | | |
| Year of birth | | 1955 |
| Position(s) with Trust | | Trustee |
| Term of office1 and length of time served2 | | Since 2002 |
| Principal occupation(s) during the past five years | | Retired; formerly, Chief Investment Officer of ACE Limited (insurance) (1986 to 2000) |
| Number of funds in fund complex overseen by Trustee | | 57 |
| Other board memberships held by Trustee during the past five years | | Director of HSBC Managed Portfolios Limited and HSBC Specialist Funds Limited (since 2020); formerly, Director of Cheyne Capital International Limited (investment advisory firm) (2005 to 2020); Director/ Trustee of Legg Mason Institutional Funds plc, Western Asset Fixed Income Funds plc and Western Asset Debt Securities Fund plc. (2007 to 2011) |
| |
| Ken Miller | | |
| Year of birth | | 1942 |
| Position(s) with Trust | | Trustee |
| |
| Term of office1 and length of time served2 | | Since 1983 |
| |
| Principal occupation(s) during the past five years | | Retired; formerly, President, Young Stuff Apparel Group, Inc. (apparel manufacturer), division of Li & Fung (1963 to 2012) |
| |
| Number of funds in fund complex overseen by Trustee | | 57 |
| |
| Other board memberships held by Trustee during the past five years | | None |
| |
| G. Peter O’Brien | | |
| Year of birth | | 1945 |
| Position(s) with Trust | | Trustee |
| Term of office1 and length of time served2 | | Since 1999 |
| Principal occupation(s) during the past five years | | Retired, Trustee Emeritus of Colgate University (since 2005); Board Member, Hill House, Inc. (residential home care) (since 1999); formerly, Board Member, Bridges School (pre-school) (2006 to 2017); Managing Director, Equity Capital Markets Group of Merrill Lynch & Co. (1971 to 1999) |
| Number of funds in fund complex overseen by Trustee | | Trustee of Legg Mason funds consisting of 57 portfolios; Director/Trustee of the Royce Family of Funds consisting of 16 portfolios |
| Other board memberships held by Trustee during the past five years | | Formerly, Director of TICC Capital Corp. (2003 to 2017) |
| | | | |
| 44 | | | | BrandywineGLOBAL—Small Cap Value Fund |
| | |
| Independent Trustees† (cont’d) | | |
| |
| Thomas F. Schlafly | | |
| Year of birth | | 1948 |
| Position(s) with Trust | | Trustee |
| |
| Term of office1 and length of time served2 | | Since 1983 |
| |
| Principal occupation(s) during the past five years | | Chairman, The Saint Louis Brewery, LLC (brewery) (since 2012); formerly, President, The Saint Louis Brewery, Inc. (1989 to 2012); Senior Counsel (since 2017) and formerly, Partner (2009 to 2016), Thompson Coburn LLP (law firm) |
| |
| Number of funds in fund complex overseen by Trustee | | 57 |
| |
| Other board memberships held by Trustee during the past five years | | Director, CNB St. Louis Bank (since 2020); formerly, Director, Citizens National Bank of Greater St. Louis (2006 to 2020) |
| | |
| Interested Trustee and Officer | | |
| |
| Jane Trust, CFA3 | | |
| Year of birth | | 1962 |
| Position(s) with Trust | | Trustee, President and Chief Executive Officer |
| |
| Term of office1 and length of time served2 | | Since 2015 |
| |
| Principal occupation(s) during the past five years | | Senior Vice President, Fund Board Management, Franklin Templeton (since 2020); Officer and/or Trustee/Director of 127 funds associated with LMPFA or its affiliates (since 2015); President and Chief Executive Officer of LMPFA (since 2015); formerly, Senior Managing Director (2018 to 2020) and Managing Director (2016 to 2018) of Legg Mason & Co., LLC (“Legg Mason & Co.”); Senior Vice President of LMPFA (2015) |
| |
| Number of funds in fund complex overseen by Trustee | | 127 |
| |
| Other board memberships held by Trustee during the past five years | | None |
| | |
| Additional Officers | | |
|
Ted P. Becker Franklin Templeton 280 Park Avenue, 8th Floor, New York, NY 10017 |
| Year of birth | | 1951 |
| Position(s) with Trust | | Chief Compliance Officer |
| |
| Term of office1 and length of time served2 | | Since 2007 |
| |
| Principal occupation(s) during the past five years | | Vice President, Global Compliance of Franklin Templeton (since 2020); Chief Compliance Officer of LMPFA (since 2006); Chief Compliance Officer of certain funds associated with Legg Mason & Co. or its affiliates (since 2006); formerly, Director of Global Compliance at Legg Mason, Inc. (2006 to 2020); Managing Director of Compliance of Legg Mason & Co. (2005 to 2020) |
| | | | | | |
| BrandywineGLOBAL—Small Cap Value Fund | | | | | 45 | |
Additional information (unaudited) (con’d)
Information about Trustees and Officers
| | |
| Additional Officers (cont’d) | | |
| |
| Susan Kerr | | |
| Franklin Templeton | | |
| 280 Park Avenue, 8th Floor, New York, NY 10017 |
| Year of birth | | 1949 |
| Position(s) with Trust | | Chief Anti-Money Laundering Compliance Officer |
| |
| Term of office1 and length of time served2 | | Since 2013 |
| |
| Principal occupation(s) during the past five years | | Senior Compliance Analyst, Franklin Templeton (since 2020); Chief Anti-Money Laundering Compliance Officer of certain funds associated with Legg Mason & Co. or its affiliates (since 2013) and Anti-Money Laundering Compliance Officer (since 2012), Senior Compliance Officer (since 2011) and Assistant Vice President (since 2010) of Franklin Distributors, LLC; formerly, Assistant Vice President of Legg Mason & Co. (2010 to 2020) |
| |
| Marc A. De Oliveira | | |
| Franklin Templeton | | |
| 100 First Stamford Place, 6th Floor, Stamford, CT 06902 |
| Year of birth | | 1971 |
| Position(s) with Trust | | Secretary and Chief Legal Officer |
| |
| Term of office1 and length of time served2 | | Since 2020 |
| |
| Principal occupation(s) during the past five years | | Associate General Counsel of Franklin Templeton (since 2020); Assistant Secretary of certain funds associated with Legg Mason & Co. or its affiliates (since 2006); formerly, Managing Director (2016 to 2020) and Associate General Counsel of Legg Mason & Co. (2005 to 2020) |
| |
| Thomas C. Mandia | | |
| Franklin Templeton | | |
| 100 First Stamford Place, 6th Floor, Stamford, CT 06902 |
| Year of birth | | 1962 |
| Position(s) with Trust | | Senior Vice President |
| |
| Term of office1 and length of time served2 | | Since 2020 |
| |
| Principal occupation(s) during the past five years | | Senior Associate General Counsel of Franklin Templeton (since 2020); Secretary of LMPFA (since 2006); Assistant Secretary of certain funds associated with Legg Mason & Co. or its affiliates (since 2006); Secretary of LM Asset Services, LLC (“LMAS”) (since 2002) and Legg Mason Fund Asset Management, Inc. (“LMFAM”) (since 2013) (formerly registered investment advisers); formerly, Managing Director and Deputy General Counsel of Legg Mason & Co. (2005 to 2020) |
| | | | |
| 46 | | | | BrandywineGLOBAL—Small Cap Value Fund |
| | |
| Additional Officers (cont’d) | | |
| |
| Christopher Berarducci | | |
| Franklin Templeton | | |
| 280 Park Avenue, 8th Floor, New York, NY 10017 |
| Year of birth | | 1974 |
| Position(s) with Trust | | Treasurer and Principal Financial Officer |
| |
| Term of office1 and length of time served2 | | Since 2014 and 2019 |
| |
| Principal occupation(s) during the past five years | | Vice President, Fund Administration and Reporting, Franklin Templeton (since 2020); Treasurer (since 2010) and Principal Financial Officer (since 2019) of certain funds associated with Legg Mason & Co. or its affiliates; formerly, Managing Director (2020), Director (2015 to 2020), and Vice President (2011 to 2015) of Legg Mason & Co. |
| |
| Jeanne M. Kelly | | |
| Franklin Templeton | | |
| 280 Park Avenue, 8th Floor, New York, NY 10017 |
| Year of birth | | 1951 |
| Position(s) with Trust | | Senior Vice President |
| |
| Term of office1 and length of time served2 | | Since 2007 |
| |
| Principal occupation(s) during the past five years | | U.S. Fund Board Team Manager, Franklin Templeton (since 2020); Senior Vice President of certain funds associated with Legg Mason & Co. or its affiliates (since 2007); Senior Vice President of LMPFA (since 2006); President and Chief Executive Officer of LMAS and LMFAM (since 2015); formerly, Managing Director of Legg Mason & Co. (2005 to 2020); Senior Vice President of LMFAM (2013 to 2015) |
† Trustees who are not “interested persons” of the Fund within the meaning of Section 2(a)(19) of the Investment Company Act of 1940, as amended (the “1940 Act”).
| 1 | Each Trustee and officer serves until his or her respective successor has been duly elected and qualified or until his or her earlier death, resignation, retirement or removal. |
| 2 | Indicates the earliest year in which the Trustee became a board member for a fund in the Legg Mason fund complex or the officer took such office. |
| 3 | Ms. Trust is an “interested person” of the Fund, as defined in the 1940 Act, because of her position with LMPFA and/or certain of its affiliates. |
| | | | | | |
| BrandywineGLOBAL—Small Cap Value Fund | | | | | 47 | |
Important tax information (unaudited)
By mid-February, tax information related to a shareholder’s proportionate share of distributions paid during the preceding calendar year will be received, if applicable. Please also refer to www.franklintempleton.com for per share tax information related to any distributions paid during the preceding calendar year. Shareholders are advised to consult with their tax advisors for further information on the treatment of these amounts on their tax returns.
The following tax information for the Fund is required to be furnished to shareholders with respect to income earned and distributions paid during its fiscal year.
The Fund hereby reports the following amounts, or if subsequently determined to be different, the maximum allowable amounts, for the fiscal year ended December 31, 2022:
| | | | | | | | |
| | | Pursuant to: | | | Amount Reported | |
| Income Eligible for Dividends Received Deduction (DRD) | | | §854(b)(1)(A) | | | | $51,825 | |
| Qualified Dividend Income Earned (QDI) | | | §854(b)(1)(B) | | | | $53,843 | |
| | | | |
| 48 | | | | BrandywineGLOBAL—Small Cap Value Fund |
BrandywineGLOBAL —
Small Cap Value Fund
Trustees
Paul R. Ades
Andrew L. Breech
Althea L. Duersten
Chair
Stephen R. Gross
Susan M. Heilbron
Arnold L. Lehman
Robin J. W. Masters
Ken Miller
G. Peter O’Brien
Thomas F. Schlafly
Jane Trust
Investment manager
Legg Mason Partners Fund Advisor, LLC
Subadviser
Brandywine Global Investment Management, LLC
Distributor
Franklin Distributors, LLC
Custodian
The Bank of New York Mellon
Transfer agent
Franklin Templeton Investor Services, LLC
3344 Quality Drive
Rancho Cordova, CA 95670-7313
Independent registered public accounting firm
PricewaterhouseCoopers LLP Baltimore, MD
BrandywineGLOBAL — Small Cap Value Fund
The Fund is a separate investment series of Legg Mason Global Asset Management Trust, a Maryland statutory trust.
BrandywineGLOBAL — Small Cap Value Fund
Legg Mason Funds
100 International Drive
Baltimore, MD 21202
The Fund files its complete schedule of portfolio holdings with the Securities and Exchange Commission (“SEC”) for the first and third quarters of each fiscal year as an exhibit to its reports on Form N-PORT. The Fund’s Forms N-PORT are available on the SEC’s website at www.sec.gov. To obtain information on Form N-PORT, shareholders can call the Fund at 877-6LM-FUND/656-3863.
Information on how the Fund voted proxies relating to portfolio securities during the prior 12-month period ended June 30th of each year and a description of the policies and procedures that the Fund uses to determine how to vote proxies related to portfolio transactions are available (1) without charge, upon request, by calling the Fund at 877-6LM-FUND/656-3863, (2) at www.franklintempleton.com and (3) on the SEC’s website at www.sec.gov.
This report is submitted for the general information of the shareholders of BrandywineGLOBAL — Small Cap Value Fund. This report is not authorized for distribution to prospective investors in the Fund unless preceded or accompanied by a current prospectus.
Investors should consider the Fund’s investment objectives, risks, charges and expenses carefully before investing. The prospectus contains this and other important information about the Fund. Please read the prospectus carefully before investing.
www.franklintempleton.com
© 2023 Franklin Distributors, LLC, Member FINRA/SIPC. All rights reserved.
Legg Mason Funds Privacy and Security Notice
Your Privacy Is Our Priority
Franklin Templeton* is committed to safeguarding your personal information. This notice is designed to provide you with a summary of the non-public personal information Franklin Templeton may collect and maintain about current or former individual investors; our policy regarding the use of that information; and the measures we take to safeguard the information. We do not sell individual investors’ non-public personal information to anyone and only share it as described in this notice.
Information We Collect
When you invest with us, you provide us with your non-public personal information. We collect and use this information to service your accounts and respond to your requests. The non-public personal information we may collect falls into the following categories:
| • | | Information we receive from you or your financial intermediary on applications or other forms, whether we receive the form in writing or electronically. For example, this information may include your name, address, tax identification number, birth date, investment selection, beneficiary information, and your personal bank account information and/or email address if you have provided that information. |
| • | | Information about your transactions and account history with us, or with other companies that are part of Franklin Templeton, including transactions you request on our website or in our app. This category also includes your communications to us concerning your investments. |
| • | | Information we receive from third parties (for example, to update your address if you move, obtain or verify your email address or obtain additional information to verify your identity). |
| • | | Information collected from you online, such as your IP address or device ID and data gathered from your browsing activity and location. (For example, we may use cookies to collect device and browser information so our website recognizes your online preferences and device information.) Our website contains more information about cookies and similar technologies and ways you may limit them. |
| • | | Other general information that we may obtain about you such as demographic information. |
Disclosure Policy
To better service your accounts and process transactions or services you requested, we may share non-public personal information with other Franklin Templeton companies. From time to time we may also send you information about products/services offered by other Franklin Templeton companies although we will not share your non-public personal information with these companies without first offering you the opportunity to prevent that sharing.
We will only share non-public personal information with outside parties in the limited circumstances permitted by law. For example, this includes situations where we need to share information with companies who work on our behalf to service or maintain your account or
|
| NOT PART OF THE ANNUAL REPORT |
Legg Mason Funds Privacy and Security Notice (cont’d)
process transactions you requested, when the disclosure is to companies assisting us with our own marketing efforts, when the disclosure is to a party representing you, or when required by law (for example, in response to legal process). Additionally, we will ensure that any outside companies working on our behalf, or with whom we have joint marketing agreements, are under contractual obligations to protect the confidentiality of your information, and to use it only to provide the services we asked them to perform.
Confidentiality and Security
Our employees are required to follow procedures with respect to maintaining the confidentiality of our investors’ non-public personal information. Additionally, we maintain physical, electronic and procedural safeguards to protect the information. This includes performing ongoing evaluations of our systems containing investor information and making changes when appropriate.
At all times, you may view our current privacy notice on our website at franklintempleton.com or contact us for a copy at (800) 632-2301.
*For purposes of this privacy notice Franklin Templeton shall refer to the following entities:
Fiduciary Trust International of the South (FTIOS), as custodian for individual retirement plans Franklin Advisers, Inc.
Franklin Distributors, LLC, including as program manager of the Franklin Templeton 529 College Savings Plan and the NJBEST 529 College Savings Plan
Franklin Mutual Advisers, LLC
Franklin, Templeton and Mutual Series Funds
Franklin Templeton Institutional, LLC Franklin Templeton Investments Corp., Canada
Franklin Templeton Investments Management, Limited UK
Franklin Templeton Portfolio Advisors, Inc.
Legg Mason Funds serviced by Franklin Templeton Investor Services, LLC
Templeton Asset Management, Limited
Templeton Global Advisors, Limited Templeton Investment Counsel, LLC
If you are a customer of other Franklin Templeton affiliates and you receive notices from them, you will need to read those notices separately.
|
| NOT PART OF THE ANNUAL REPORT |
www.franklintempleton.com
© 2023 Franklin Distributors, LLC, Member FINRA/SIPC. All rights reserved.
34317-A 2/23 SR23-4611
| | |
| ITEM 2. | | CODE OF ETHICS. |
| |
| | The registrant has adopted a code of ethics that applies to the registrant’s principal executive officer, principal financial officer, principal accounting officer or controller. |
| |
| ITEM 3. | | AUDIT COMMITTEE FINANCIAL EXPERT. |
| |
| | The Board of Trustees of the registrant has determined that Stephen R. Gross possesses the technical attributes identified in Instruction 2(b) of Item 3 to Form N-CSR to qualify as an “audit committee financial expert,” and has designated Stephen R. Gross as the Audit Committee’s financial expert. Stephen R. Gross is an “independent” Trustees pursuant to paragraph (a)(2) of Item 3 to Form N-CSR. |
| |
| ITEM 4. | | PRINCIPAL ACCOUNTANT FEES AND SERVICES. |
| |
| | (a) Audit Fees. The aggregate fees billed in the last two fiscal years ending December 31, 2021 and December 31, 2022 (the “Reporting Periods”) for professional services rendered by the Registrant’s principal accountant (the “Auditor”) for the audit of the Registrant’s annual financial statements, or services that are normally provided by the Auditor in connection with the statutory and regulatory filings or engagements for the Reporting Periods, were $184,816 in December 31, 2021 and $210,621 in December 31, 2022. (b) Audit-Related Fees. The aggregate fees billed in the Reporting Period for assurance and related services by the Auditor that are reasonably related to the performance of the Registrant’s financial statements were $0 in December 31, 2021 and $0 in December 31, 2022. (c) Tax Fees. The aggregate fees billed in the Reporting Periods for professional services rendered by the Auditor for tax compliance, tax advice and tax planning (“Tax Services”) were $43,000 in December 31, 2021 and $53,000 in December 31, 2022. These services consisted of (i) review or preparation of U.S. federal, state, local and excise tax returns; (ii) U.S. federal, state and local tax planning, advice and assistance regarding statutory, regulatory or administrative developments, and (iii) tax advice regarding tax qualification matters and/or treatment of various financial instruments held or proposed to be acquired or held. There were no fees billed for tax services by to the service affiliates during the Reporting Periods that required pre-approval by the Audit Auditors Committee. (d) All Other Fees. The aggregate fees for other fees billed in the Reporting Periods for products and services provided by the Auditor were $0 in December 31, 2021 and $0 in December 31, 2022, other than the services reported in paragraphs (a) through (c) of this item for the Legg Mason Global Asset Management Trust. All Other Fees. There were no other non-audit services rendered by the Auditor to Legg Mason Partners Fund Advisors, LLC (“LMPFA”), and any entity controlling, controlled by or under common control with LMPFA that provided ongoing services to Legg Mason Global Asset Management Trust requiring pre-approval by the Audit Committee in the Reporting Period. (e) Audit Committee’s pre–approval policies and procedures described in paragraph (c) (7) of Rule 2-01 of Regulation S-X. (1) The Charter for the Audit Committee (the “Committee”) of the Board of each registered investment company (the “Fund”) advised by LMPFA or one of their affiliates (each, an “Adviser”) requires that the Committee shall approve (a) all audit and permissible non-audit services to be provided to the Fund and (b) all permissible non-audit services to be provided by the Fund’s independent auditors to the Adviser and any Covered Service Providers if the engagement relates directly to the operations and financial reporting of the Fund. The Committee may implement policies and procedures by which such services are approved other than by the full Committee. |
| | |
| | The Committee shall not approve non-audit services that the Committee believes may impair the independence of the auditors. As of the date of the approval of this Audit Committee Charter, permissible non-audit services include any professional services (including tax services), that are not prohibited services as described below, provided to the Fund by the independent auditors, other than those provided to the Fund in connection with an audit or a review of the financial statements of the Fund. Permissible non-audit services may not include: (i) bookkeeping or other services related to the accounting records or financial statements of the Fund; (ii) financial information systems design and implementation; (iii) appraisal or valuation services, fairness opinions or contribution-in-kind reports; (iv) actuarial services; (v) internal audit outsourcing services; (vi) management functions or human resources; (vii) broker or dealer, investment adviser or investment banking services; (viii) legal services and expert services unrelated to the audit; and (ix) any other service the Public Company Accounting Oversight Board determines, by regulation, is impermissible. Pre-approval by the Committee of any permissible non-audit services is not required so long as: (i) the aggregate amount of all such permissible non-audit services provided to the Fund, the Adviser and any service providers controlling, controlled by or under common control with the Adviser that provide ongoing services to the Fund (“Covered Service Providers”) constitutes not more than 5% of the total amount of revenues paid to the independent auditors during the fiscal year in which the permissible non-audit services are provided to (a) the Fund, (b) the Adviser and (c) any entity controlling, controlled by or under common control with the Adviser that provides ongoing services to the Fund during the fiscal year in which the services are provided that would have to be approved by the Committee; (ii) the permissible non-audit services were not recognized by the Fund at the time of the engagement to be non-audit services; and (iii) such services are promptly brought to the attention of the Committee and approved by the Committee (or its delegate(s)) prior to the completion of the audit. (2) None of the services described in paragraphs (b) through (d) of this Item were performed in reliance on paragraph (c)(7)(i)(C) of Rule 2-01 of Regulation S-X. (f) Not applicable. (g) Non-audit fees billed by the Auditor for services rendered to Legg Mason Global Asset Management Trust, LMPFA and any entity controlling, controlled by, or under common control with LMPFA that provides ongoing services to Legg Mason Global Asset Management Trust during the reporting period were $1,470,739 in December 31, 2021 and $744,135 in December 31, 2022. (h) Yes. Legg Mason Global Asset Management Trust’s Audit Committee has considered whether the provision of non-audit services that were rendered to Service Affiliates, which were not pre-approved (not requiring pre-approval), is compatible with maintaining the Accountant’s independence. All services provided by the Auditor to the Legg Mason Global Asset Management Trust or to Service Affiliates, which were required to be pre-approved, were pre-approved as required. (i) Not applicable. (j) Not applicable. |
| | |
| ITEM 5. | | AUDIT COMMITTEE OF LISTED REGISTRANTS. |
| |
| | a) The independent board members are acting as the registrant’s audit committee as specified in Section 3(a)(58)(B) of the Exchange Act. The Audit Committee consists of the following Board members: |
| | Paul R. Ades Andrew L. Breech Althea L. Duersten Stephen R. Gross Susan M. Heilbron Arnold L. Lehman Robin J. W. Masters Ken Miller G. Peter O’Brien Thomas F. Schlafly |
| |
| | b) Not applicable |
| |
| ITEM 6. | | SCHEDULE OF INVESTMENTS. |
| |
| | Included herein under Item 1. |
| |
| ITEM 7. | | DISCLOSURE OF PROXY VOTING POLICIES AND PROCEDURES FOR CLOSED-END MANAGEMENT INVESTMENT COMPANIES. |
| |
| | Not applicable. |
| |
| ITEM 8. | | PORTFOLIO MANAGERS OF CLOSED-END MANAGEMENT INVESTMENT COMPANIES. |
| |
| | Not applicable. |
| |
| ITEM 9. | | PURCHASES OF EQUITY SECURITIES BY CLOSED-END MANAGEMENT INVESTMENT COMPANY AND AFFILIATED PURCHASERS. |
| |
| | Not applicable. |
| |
| ITEM 10. | | SUBMISSION OF MATTERS TO A VOTE OF SECURITY HOLDERS. |
| |
| | Not applicable. |
| |
| ITEM 11. | | CONTROLS AND PROCEDURES. |
| | (a) The registrant’s principal executive officer and principal financial officer have concluded that the registrant’s disclosure controls and procedures (as defined in Rule 30a- 3(c) under the Investment Company Act of 1940, as amended (the “1940 Act”)) are effective as of a date within 90 days of the filing date of this report that includes the disclosure required by this paragraph, based on their evaluation of the disclosure controls and procedures required by Rule 30a-3(b) under the 1940 Act and 15d-15(b) under the Securities Exchange Act of 1934. (b) There were no changes in the registrant’s internal control over financial reporting (as defined in Rule 30a-3(d) under the 1940 Act) that occurred during the period covered by this report that have materially affected, or are likely to materially affect the registrant’s internal control over financial reporting. |
SIGNATURES
Pursuant to the requirements of the Securities Exchange Act of 1934 and the Investment Company Act of 1940, the registrant has duly caused this Report to be signed on its behalf by the undersigned, there unto duly authorized.
| | |
| Legg Mason Global Asset Management Trust |
| |
| By: | | /s/ Jane Trust |
| | Jane Trust |
| | Chief Executive Officer |
| |
| Date: | | February 23, 2023 |
Pursuant to the requirements of the Securities Exchange Act of 1934 and the Investment Company Act of 1940, this report has been signed below by the following persons on behalf of the registrant and in the capacities and on the dates indicated.
| | |
| By: | | /s/ Jane Trust |
| | Jane Trust |
| | Chief Executive Officer |
| |
| Date: | | February 23, 2023 |
| |
| By: | | /s/ Christopher Berarducci |
| | Christopher Berarducci |
| | Principal Financial Officer |
| |
| Date: | | February 23, 2023 |