UNITED STATES
SECURITIES AND EXCHANGE COMMISSION
Washington, D.C. 20549
FORM N-CSR
CERTIFIED SHAREHOLDER REPORT OF REGISTERED
MANAGEMENT INVESTMENT COMPANIES
Investment Company Act file number 811-22338
Legg Mason Global Asset Management Trust
(Exact name of registrant as specified in charter)
100 International Drive, Baltimore, MD, 21202
(Address of principal executive offices) (Zip code)
Marc A. De Oliveira
Franklin Templeton
100 First Stamford Place
Stamford, CT 06902
(Name and address of agent for service)
Registrant’s telephone number, including area code: 877-6LM-FUND/656-3863
Date of fiscal year end: December 31
Date of reporting period: June 30, 2023
| ITEM 1. | REPORT TO STOCKHOLDERS. |
The Semi-Annual Report to Stockholders is filed herewith.

| | |
| Semi-Annual Report | | June 30, 2023 |
BrandywineGLOBAL —
FLEXIBLE BOND FUND
The Securities and Exchange Commission has adopted new regulations that will result in changes to the design and delivery of annual and semi-annual shareholder reports beginning in July 2024.
If you have previously elected to receive shareholder reports electronically, you will continue to do so and need not take any action.
Otherwise, paper copies of the Fund’s shareholder reports will be mailed to you beginning in July 2024. If you would like to receive shareholder reports and other communications from the Fund electronically instead of by mail, you may make that request at any time by contacting your financial intermediary (such as a broker-dealer or bank) or, if you are a direct investor, enrolling at franklintempleton.com.
You may access franklintempleton.com by scanning the code below.


|
| INVESTMENT PRODUCTS: NOT FDIC INSURED • NO BANK GUARANTEE • MAY LOSE VALUE |
Fund objective
The Fund seeks current income and capital appreciation.
Letter from the president

Dear Shareholder,
We are pleased to provide the semi-annual report of BrandywineGLOBAL — Flexible Bond Fund for the six-month reporting period ended June 30, 2023. Please read on for Fund performance information during the Fund’s reporting period.
As always, we remain committed to providing you with excellent service and a full spectrum of investment choices. We also remain committed to supplementing the support you receive from your financial advisor. One way we accomplish this is through our website, www.franklintempleton.com. Here you can gain immediate access to market and investment information, including:
| • | | Fund prices and performance, |
| • | | Market insights and commentaries from our portfolio managers, and |
| • | | A host of educational resources. |
We look forward to helping you meet your financial goals.
Sincerely,

Jane Trust, CFA
President and Chief Executive Officer
July 31, 2023
| | |
II | | BrandywineGLOBAL — Flexible Bond Fund |
Performance review
For the six months ended June 30, 2023, Class IS shares of BrandywineGLOBAL — Flexible Bond Fund returned 4.91%. The Fund’s unmanaged benchmark, the Bloomberg U.S. Aggregate Indexi, returned 2.09% for the same period.
| | | | |
| Performance Snapshot as of June 30, 2023 (unaudited) | |
| (excluding sales charges) | | 6 months | |
| BrandywineGLOBAL — Flexible Bond Fund: | | | | |
Class A | | | 4.76 | % |
Class C | | | 4.40 | % |
Class I | | | 4.87 | % |
Class IS | | | 4.91 | % |
| Bloomberg U.S. Aggregate Index | | | 2.09 | % |
The performance shown represents past performance. Past performance is no guarantee of future results and current performance may be higher or lower than the performance shown above. Principal value, investment returns and yields will fluctuate and investors’ shares, when redeemed, may be worth more or less than their original cost. To obtain performance data current to the most recent month-end, please visit our website at www.franklintempleton.com.
All share class returns assume the reinvestment of all distributions, including returns of capital, if any, at net asset value and the deduction of all Fund expenses. Returns have not been adjusted to include sales charges that may apply or the deduction of taxes that a shareholder would pay on Fund distributions. If sales charges were reflected, the performance quoted would be lower. Performance figures for periods shorter than one year represent cumulative figures and are not annualized.
Fund performance figures reflect fee waivers and/or expense reimbursements, without which the performance would have been lower.
The 30-Day SEC Yields for the period ended June 30, 2023 for Class A, Class C, Class I and Class IS shares were 5.92%, 5.41%, 6.38% and 6.48%, respectively. The 30-Day SEC Yield, calculated pursuant to the standard SEC formula, is based on the Fund’s investments over an annualized trailing 30-day period, and not on the distributions paid by the Fund, which may differ.
This Fund is the successor to an unregistered private fund (the “Predecessor”). Immediately prior to the Fund commencing operations, the Predecessor transferred its assets to the Fund in exchange for the Fund’s Class IS shares.
|
| Total Annual Operating Expenses (unaudited) |
As of the Fund’s current prospectus dated May 1, 2023, the gross total annual fund operating expense ratios for Class A, Class C, Class I and Class IS shares were 1.10%, 1.86%, 0.85% and 0.71%, respectively.
Actual expenses may be higher. For example, expenses may be higher than those shown if average net assets decrease. Net assets are more likely to decrease and Fund expense ratios are more likely to increase when markets are volatile.
As a result of expense limitation arrangements, the ratio of total annual fund operating expenses, other than interest, brokerage commissions, dividend and interest expense on securities sold short,
| | | | |
| BrandywineGLOBAL — Flexible Bond Fund | | | | III |
Performance review (cont’d)
taxes, extraordinary expenses and acquired fund fees and expenses, to average net assets will not exceed 1.10% for Class A shares, 1.85% for Class C shares, 0.75% for Class I shares and 0.65% for Class IS shares. In addition, the ratio of total annual fund operating expenses for Class IS shares will not exceed the ratio of total annual fund operating expenses for Class I shares. These expense limitation arrangements cannot be terminated prior to December 31, 2024 without the Board of Trustees’ consent. In addition, the manager has agreed to waive the Fund’s management fee to an extent sufficient to offset the net management fee payable in connection with any investment in an affiliated money market fund. This management fee waiver is not subject to the recapture provision discussed below.
The manager is permitted to recapture amounts waived and/or reimbursed to a class within three years after the fiscal year in which the manager earned the fee or incurred the expense if the class’ total annual fund operating expenses have fallen to a level below the expense limitation (“expense cap”) in effect at the time the fees were earned or the expenses incurred. In no case will the manager recapture any amount that would result, on any particular business day of the Fund, in the class’ total annual fund operating expenses exceeding the expense cap or any other lower limit then in effect.
As always, thank you for your confidence in our stewardship of your assets.
Sincerely,
Jane Trust, CFA
President and Chief Executive Officer
July 31, 2023
RISKS: Fixed income securities involve interest rate, credit, inflation, and reinvestment risks. As interest rates rise, the value of fixed income securities falls. “High yield” or “junk” bonds are subject to greater price volatility, illiquidity, and possibility of default. Asset-backed, mortgage-backed, or mortgage-related securities are subject to prepayment and extension risks. International investments are subject to special risks, including currency fluctuations and social, economic, and political uncertainties, which could increase volatility. These risks are magnified in emerging markets. Emerging market countries tend to have economic, political, and legal systems that are less developed and are less stable than those of more developed countries. Equity securities are subject to market and price fluctuations. Derivatives, such as options and futures, can be illiquid, may disproportionately increase losses, and have a potentially large impact on Fund performance. The Fund may use derivatives to a significant extent, which could result in substantial losses and greater volatility in the Fund’s net assets. Leverage may increase volatility and possibility of loss. Active and frequent trading may increase a shareholder’s tax liability and transaction costs, which could detract from Fund performance. As a non-diversified fund, the Fund is permitted to invest a larger percentage of its assets in a smaller number of issuers than a diversified fund, which may magnify the Fund’s losses from events affecting a
| | | | |
IV | | | | BrandywineGLOBAL — Flexible Bond Fund |
particular issuer. The manager’s investment style may become out of favor and/ or the manager’s selection process may prove incorrect, which may have a negative impact on the Fund’s performance. The market values of securities or other assets will fluctuate, sometimes sharply and unpredictably, due to changes in general market conditions, overall economic trends or events, governmental actions or intervention, actions taken by the U.S. Federal Reserve or foreign central banks, market disruptions caused by trade disputes or other factors, political developments, armed conflicts, economic sanctions and countermeasures in response to sanctions, major cybersecurity events, investor sentiment, the global and domestic effects of a pandemic, and other factors that may or may not be related to the issuer of the security or other asset. Please see the Fund’s prospectus for a more complete discussion of these and other risks and the Fund’s investment strategies.
All investments are subject to risk including the possible loss of principal. Past performance is no guarantee of future results. All index performance reflects no deduction for fees, expenses or taxes. Please note that an investor cannot invest directly in an index.
| i | The Bloomberg U.S. Aggregate Index is a broad-based bond index comprised of government, corporate, mortgage- and asset-backed issues, rated investment grade or higher, and having at least one year to maturity. |
| | |
| BrandywineGLOBAL — Flexible Bond Fund | | V |
Fund at a glance† (unaudited)
Investment breakdown (%) as a percent of total investments
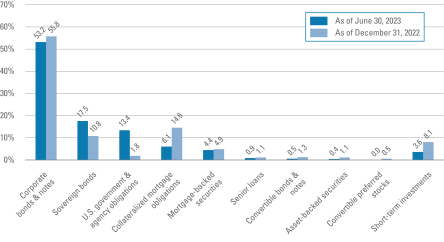
| † | The bar graph above represents the composition of the Fund’s investments as of June 30, 2023 and December 31, 2022 and does not include derivatives, such as futures contracts, forward foreign currency contracts and swap contracts. The Fund is actively managed. As a result, the composition of the Fund’s investments is subject to change at any time. |
| | | | |
| BrandywineGLOBAL — Flexible Bond Fund 2023 Semi-Annual Report | | | | 1 |
Fund expenses (unaudited)
Example
As a shareholder of the Fund, you may incur two types of costs: (1) transaction costs, including front-end and back-end sales charges (loads) on purchase payments; and (2) ongoing costs, including management fees; service and/or distribution (12b-1) fees; and other Fund expenses. This example is intended to help you understand your ongoing costs (in dollars) of investing in the Fund and to compare these costs with the ongoing costs of investing in other mutual funds. This example is based on an investment of $1,000 invested on January 1, 2023 and held for the six months ended June 30, 2023.
Actual expenses
The table below titled “Based on actual total return” provides information about actual account values and actual expenses. You may use the information provided in this table, together with the amount you invested, to estimate the expenses that you paid over the period. To estimate the expenses you paid on your account, divide your ending account value by $1,000 (for example, an $8,600 ending account value divided by $1,000 = 8.6), then multiply the result by the number under the heading entitled “Expenses Paid During the Period”.
Hypothetical example for comparison purposes
The table below titled “Based on hypothetical total return” provides information about hypothetical account values and hypothetical expenses based on the actual expense ratio and an assumed rate of return of 5.00% per year before expenses, which is not the Fund’s actual return. The hypothetical account values and expenses may not be used to estimate the actual ending account balance or expenses you paid for the period. You may use the information provided in this table to compare the ongoing costs of investing in the Fund and other funds. To do so, compare the 5.00% hypothetical example relating to the Fund with the 5.00% hypothetical examples that appear in the shareholder reports of the other funds.
Please note that the expenses shown in the table below are meant to highlight your ongoing costs only and do not reflect any transactional costs, such as front-end or back-end sales charges (loads). Therefore, the table is useful in comparing ongoing costs only, and will not help you determine the relative total costs of owning different funds. In addition, if these transaction costs were included, your costs would have been higher.
| | | | | | | | | | | | | | | | | | | | | | | | | | | | | | | | | | | | | | | | | | | | | | |
| | |
| Based on actual total return1 | | | | | | Based on hypothetical total return1 | |
| | | Actual
Total Return
Without
Sales
Charge2 | | | Beginning
Account
Value | | | Ending
Account
Value | | | Annualized
Expense
Ratio | | | Expenses
Paid
During
the
Period3 | | | | | | | | Hypothetical
Annualized
Total Return | | | Beginning
Account
Value | | | Ending
Account
Value | | | Annualized
Expense
Ratio | | | Expenses
Paid
During
the
Period3 | |
| Class A | | | 4.76 | % | | $ | 1,000.00 | | | $ | 1,047.60 | | | | 0.98 | % | | $ | 4.98 | | | | | | | Class A | | | 5.00 | % | | $ | 1,000.00 | | | $ | 1,019.93 | | | | 0.98 | % | | $ | 4.91 | |
| Class C | | | 4.40 | | | | 1,000.00 | | | | 1,044.00 | | | | 1.70 | | | | 8.62 | | | | | | | Class C | | | 5.00 | | | | 1,000.00 | | | | 1,016.36 | | | | 1.70 | | | | 8.50 | |
| Class I | | | 4.87 | | | | 1,000.00 | | | | 1,048.70 | | | | 0.74 | | | | 3.76 | | | | | | | Class I | | | 5.00 | | | | 1,000.00 | | | | 1,021.12 | | | | 0.74 | | | | 3.71 | |
| Class IS | | | 4.91 | | | | 1,000.00 | | | | 1,049.10 | | | | 0.65 | | | | 3.30 | | | | | | | Class IS | | | 5.00 | | | | 1,000.00 | | | | 1,021.57 | | | | 0.65 | | | | 3.26 | |
| | | | |
2 | | | | BrandywineGLOBAL — Flexible Bond Fund 2023 Semi-Annual Report |
| 1 | For the six months ended June 30, 2023. |
| 2 | Assumes the reinvestment of all distributions, including returns of capital, if any, at net asset value and does not reflect the deduction of the applicable sales charge with respect to Class A shares or the applicable contingent deferred sales charge (“CDSC”) with respect to Class C shares. Total return is not annualized, as it may not be representative of the total return for the year. Performance figures may reflect compensating balance arrangements, fee waivers and/or expense reimbursements. In the absence of compensating balance arrangements, fee waivers and/or expense reimbursements, the total return would have been lower. Past performance is no guarantee of future results. |
| 3 | Expenses (net of compensating balance arrangements, fee waivers and/or expense reimbursements) are equal to each class’ respective annualized expense ratio multiplied by the average account value over the period, multiplied by the number of days in the most recent fiscal half-year (181), then divided by 365. |
| | | | |
| BrandywineGLOBAL — Flexible Bond Fund 2023 Semi-Annual Report | | | | 3 |
Schedule of investments (unaudited)
June 30, 2023
BrandywineGLOBAL — Flexible Bond Fund
(Percentages shown based on Fund net assets)
| | | | | | | | | | | | | | | | |
| Security | | Rate | | | Maturity
Date | | | Face
Amount† | | | Value | |
| Corporate Bonds & Notes — 52.6% | | | | | | | | | | | | | | | | |
| Communication Services — 2.6% | | | | | | | | | | | | | | | | |
Diversified Telecommunication Services — 0.5% | | | | | | | | | | | | | |
Altice Financing SA, Senior Secured Notes | | | 5.750 | % | | | 8/15/29 | | | | 290,000 | | | $ | 224,953 | (a) |
Altice France Holding SA, Senior Notes | | | 6.000 | % | | | 2/15/28 | | | | 1,270,000 | | | | 620,682 | (a) |
Consolidated Communications Inc., Senior Secured Notes | | | 5.000 | % | | | 10/1/28 | | | | 1,065,000 | | | | 800,454 | (a) |
Level 3 Financing Inc., Senior Notes | | | 3.750 | % | | | 7/15/29 | | | | 715,000 | | | | 431,383 | (a) |
Total Diversified Telecommunication Services | | | | | | | | | | | | 2,077,472 | |
Entertainment — 0.1% | | | | | | | | | | | | | | | | |
ROBLOX Corp., Senior Notes | | | 3.875 | % | | | 5/1/30 | | | | 455,000 | | | | 383,990 | (a) |
Interactive Media & Services — 0.7% | | | | | | | | | | | | | | | | |
GrubHub Holdings Inc., Senior Notes | | | 5.500 | % | | | 7/1/27 | | | | 4,357,000 | | | | 2,507,879 | (a) |
Weibo Corp., Senior Notes | | | 3.375 | % | | | 7/8/30 | | | | 520,000 | | | | 414,512 | |
Total Interactive Media & Services | | | | | | | | | | | | | | | 2,922,391 | |
Media — 0.3% | | | | | | | | | | | | | | | | |
Liberty Interactive LLC, Senior Notes | | | 8.250 | % | | | 2/1/30 | | | | 250,000 | | | | 87,831 | |
Nexstar Media Inc., Senior Notes | | | 4.750 | % | | | 11/1/28 | | | | 710,000 | | | | 616,727 | (a) |
Univision Communications Inc., Senior Secured Notes | | | 6.625 | % | | | 6/1/27 | | | | 600,000 | | | | 580,847 | (a) |
Total Media | | | | | | | | | | | | | | | 1,285,405 | |
Wireless Telecommunication Services — 1.0% | | | | | | | | | | | | | | | | |
Kenbourne Invest SA, Senior Notes | | | 6.875 | % | | | 11/26/24 | | | | 1,030,000 | | | | 897,382 | (b) |
Sprint Spectrum Co. LLC/Sprint Spectrum Co. II LLC/Sprint Spectrum Co. III LLC, Senior Secured Notes | | | 5.152 | % | | | 3/20/28 | | | | 1,995,000 | | | | 1,974,479 | (a) |
Vmed O2 UK Financing I PLC, Senior Secured Notes | | | 4.750 | % | | | 7/15/31 | | | | 1,495,000 | | | | 1,244,682 | (a) |
Xiaomi Best Time International Ltd., Senior Notes | | | 3.375 | % | | | 4/29/30 | | | | 600,000 | | | | 487,930 | (a) |
Total Wireless Telecommunication Services | | | | | | | | | | | | 4,604,473 | |
Total Communication Services | | | | | | | | | | | | | | | 11,273,731 | |
| Consumer Discretionary — 5.7% | | | | | | | | | | | | | | | | |
Automobiles — 2.2% | | | | | | | | | | | | | | | | |
Ford Motor Credit Co. LLC, Senior Notes | | | 3.664 | % | | | 9/8/24 | | | | 780,000 | | | | 754,436 | |
Ford Motor Credit Co. LLC, Senior Notes | | | 2.300 | % | | | 2/10/25 | | | | 1,170,000 | | | | 1,094,827 | |
Ford Motor Credit Co. LLC, Senior Notes | | | 6.950 | % | | | 6/10/26 | | | | 1,730,000 | | | | 1,740,242 | |
Hyundai Capital America, Senior Notes | | | 2.000 | % | | | 6/15/28 | | | | 2,180,000 | | | | 1,834,502 | (a) |
See Notes to Financial Statements.
| | | | |
4 | | | | BrandywineGLOBAL — Flexible Bond Fund 2023 Semi-Annual Report |
BrandywineGLOBAL — Flexible Bond Fund
(Percentages shown based on Fund net assets)
| | | | | | | | | | | | | | | | |
| Security | | Rate | | | Maturity
Date | | | Face
Amount† | | | Value | |
Automobiles — continued | | | | | | | | | | | | | | | | |
Nissan Motor Co. Ltd., Senior Notes | | | 4.345 | % | | | 9/17/27 | | | | 3,570,000 | | | $ | 3,249,474 | (a) |
Stellantis Finance US Inc., Senior Notes | | | 6.375 | % | | | 9/12/32 | | | | 970,000 | | | | 990,740 | (a) |
Total Automobiles | | | | | | | | | | | | | | | 9,664,221 | |
Broadline Retail — 0.7% | | | | | | | | | | | | | | | | |
Nordstrom Inc., Senior Notes | | | 2.300 | % | | | 4/8/24 | | | | 3,250,000 | | | | 3,130,595 | |
Hotels, Restaurants & Leisure — 2.8% | | | | | | | | | | | | | | | | |
Allwyn Entertainment Financing UK PLC, Senior Secured Notes | | | 7.875 | % | | | 4/30/29 | | | | 1,650,000 | | | | 1,677,242 | (a) |
IRB Holding Corp., Senior Secured Notes | | | 7.000 | % | | | 6/15/25 | | | | 2,080,000 | | | | 2,093,135 | (a) |
Mohegan Tribal Gaming Authority, Secured Notes | | | 8.000 | % | | | 2/1/26 | | | | 3,380,000 | | | | 3,231,111 | (a) |
Travel + Leisure Co., Senior Secured Notes | | | 6.625 | % | | | 7/31/26 | | | | 490,000 | | | | 486,717 | (a) |
Viking Cruises Ltd., Senior Notes | | | 6.250 | % | | | 5/15/25 | | | | 1,250,000 | | | | 1,226,413 | (a) |
Viking Cruises Ltd., Senior Secured Notes | | | 13.000 | % | | | 5/15/25 | | | | 680,000 | | | | 714,470 | (a) |
Wynn Las Vegas LLC/Wynn Las Vegas Capital Corp., Senior Notes | | | 5.500 | % | | | 3/1/25 | | | | 2,480,000 | | | | 2,442,594 | (a) |
Total Hotels, Restaurants & Leisure | | | | | | | | | | | | | | | 11,871,682 | |
Leisure Products — 0.0%†† | | | | | | | | | | | | | | | | |
Vista Outdoor Inc., Senior Notes | | | 4.500 | % | | | 3/15/29 | | | | 175,000 | | | | 141,929 | (a) |
Total Consumer Discretionary | | | | | | | | | | | | | | | 24,808,427 | |
| Consumer Staples — 3.3% | | | | | | | | | | | | | | | | |
Food Products — 1.9% | | | | | | | | | | | | | | | | |
Amaggi Luxembourg International Sarl, Senior Notes | | | 5.250 | % | | | 1/28/28 | | | | 380,000 | | | | 346,161 | (a) |
JBS USA LUX SA/JBS USA Food Co./JBS USA Finance Inc., Senior Notes | | | 5.125 | % | | | 2/1/28 | | | | 3,535,000 | | | | 3,397,199 | (a) |
Minerva Luxembourg SA, Senior Notes | | | 4.375 | % | | | 3/18/31 | | | | 355,000 | | | | 278,033 | (a) |
Pilgrim’s Pride Corp., Senior Notes | | | 5.875 | % | | | 9/30/27 | | | | 2,100,000 | | | | 2,077,157 | (a) |
Pilgrim’s Pride Corp., Senior Notes | | | 4.250 | % | | | 4/15/31 | | | | 2,400,000 | | | | 2,060,363 | |
Total Food Products | | | | | | | | | | | | | | | 8,158,913 | |
Tobacco — 1.4% | | | | | | | | | | | | | | | | |
BAT Capital Corp., Senior Notes | | | 7.750 | % | | | 10/19/32 | | | | 1,430,000 | | | | 1,574,851 | |
Philip Morris International Inc., Senior Notes | | | 5.750 | % | | | 11/17/32 | | | | 570,000 | | | | 584,049 | |
Philip Morris International Inc., Senior Notes | | | 5.375 | % | | | 2/15/33 | | | | 1,284,000 | | | | 1,281,880 | |
See Notes to Financial Statements.
| | | | |
| BrandywineGLOBAL — Flexible Bond Fund 2023 Semi-Annual Report | | | | 5 |
Schedule of investments (unaudited) (cont’d)
June 30, 2023
BrandywineGLOBAL — Flexible Bond Fund
(Percentages shown based on Fund net assets)
| | | | | | | | | | | | | | | | |
| Security | | Rate | | | Maturity
Date | | | Face
Amount† | | | Value | |
Tobacco — continued | | | | | | | | | | | | | | | | |
Turning Point Brands Inc., Senior Secured Notes | | | 5.625 | % | | | 2/15/26 | | | | 1,570,000 | | | $ | 1,434,234 | (a) |
Vector Group Ltd., Senior Secured Notes | | | 5.750 | % | | | 2/1/29 | | | | 1,420,000 | | | | 1,237,176 | (a) |
Total Tobacco | | | | | | | | | | | | | | | 6,112,190 | |
Total Consumer Staples | | | | | | | | | | | | | | | 14,271,103 | |
| Energy — 14.4% | | | | | | | | | | | | | | | | |
Oil, Gas & Consumable Fuels — 14.4% | | | | | | | | | | | | | | | | |
Aethon United BR LP/Aethon United Finance Corp., Senior Notes | | | 8.250 | % | | | 2/15/26 | | | | 960,000 | | | | 944,074 | (a) |
Baytex Energy Corp., Senior Notes | | | 8.750 | % | | | 4/1/27 | | | | 3,500,000 | | | | 3,547,513 | (a) |
Baytex Energy Corp., Senior Notes | | | 8.500 | % | | | 4/30/30 | | | | 2,700,000 | | | | 2,639,519 | (a) |
Callon Petroleum Co., Senior Notes | | | 8.000 | % | | | 8/1/28 | | | | 4,950,000 | | | | 4,900,075 | (a) |
Cheniere Corpus Christi Holdings LLC, Senior Secured Notes | | | 2.742 | % | | | 12/31/39 | | | | 685,000 | | | | 540,558 | |
Citgo Holding Inc., Senior Secured Notes | | | 9.250 | % | | | 8/1/24 | | | | 600,000 | | | | 600,744 | (a) |
Civitas Resources Inc., Senior Notes | | | 5.000 | % | | | 10/15/26 | | | | 5,350,000 | | | | 5,049,517 | (a) |
Civitas Resources Inc., Senior Notes | | | 8.375 | % | | | 7/1/28 | | | | 1,740,000 | | | | 1,761,837 | (a) |
CNX Resources Corp., Senior Notes | | | 7.250 | % | | | 3/14/27 | | | | 4,210,000 | | | | 4,170,065 | (a) |
Devon Energy Corp., Senior Notes | | | 5.600 | % | | | 7/15/41 | | | | 2,480,000 | | | | 2,337,188 | |
Diamondback Energy Inc., Senior Notes | | | 6.250 | % | | | 3/15/33 | | | | 1,280,000 | | | | 1,324,661 | |
Ecopetrol SA, Senior Notes | | | 4.125 | % | | | 1/16/25 | | | | 685,000 | | | | 658,520 | |
Ecopetrol SA, Senior Notes | | | 8.875 | % | | | 1/13/33 | | | | 590,000 | | | | 584,746 | |
Ecopetrol SA, Senior Notes | | | 5.875 | % | | | 5/28/45 | | | | 340,000 | | | | 233,269 | |
Energean Israel Finance Ltd., Senior Secured Notes | | | 4.500 | % | | | 3/30/24 | | | | 3,720,000 | | | | 3,684,087 | (b) |
Energean Israel Finance Ltd., Senior Secured Notes | | | 5.375 | % | | | 3/30/28 | | | | 2,180,000 | | | | 1,971,287 | (b) |
Geopark Ltd., Senior Notes | | | 5.500 | % | | | 1/17/27 | | | | 650,000 | | | | 528,213 | (a) |
Hess Corp., Senior Notes | | | 7.125 | % | | | 3/15/33 | | | | 2,670,000 | | | | 2,914,417 | |
Leviathan Bond Ltd., Senior Secured Notes | | | 6.125 | % | | | 6/30/25 | | | | 1,830,000 | | | | 1,793,400 | (b) |
Leviathan Bond Ltd., Senior Secured Notes | | | 6.750 | % | | | 6/30/30 | | | | 320,000 | | | | 298,903 | (b) |
Magnolia Oil & Gas Operating LLC/ Magnolia Oil & Gas Finance Corp., Senior Notes | | | 6.000 | % | | | 8/1/26 | | | | 2,310,000 | | | | 2,237,254 | (a) |
New Fortress Energy Inc., Senior Secured Notes | | | 6.750 | % | | | 9/15/25 | | | | 4,150,000 | | | | 3,897,389 | (a) |
New Fortress Energy Inc., Senior Secured Notes | | | 6.500 | % | | | 9/30/26 | | | | 1,845,000 | | | | 1,652,689 | (a) |
PDC Energy Inc., Senior Notes | | | 5.750 | % | | | 5/15/26 | | | | 1,090,000 | | | | 1,086,617 | |
Talos Production Inc., Secured Notes | | | 12.000 | % | | | 1/15/26 | | | | 3,659,000 | | | | 3,832,473 | |
See Notes to Financial Statements.
| | | | |
6 | | | | BrandywineGLOBAL — Flexible Bond Fund 2023 Semi-Annual Report |
BrandywineGLOBAL — Flexible Bond Fund
(Percentages shown based on Fund net assets)
| | | | | | | | | | | | | | | | |
| Security | | Rate | | | Maturity
Date | | | Face
Amount† | | | Value | |
Oil, Gas & Consumable Fuels — continued | | | | | | | | | | | | | | | | |
Teine Energy Ltd., Senior Notes | | | 6.875 | % | | | 4/15/29 | | | | 3,100,000 | | | $ | 2,845,556 | (a) |
Var Energi ASA, Senior Notes | | | 7.500 | % | | | 1/15/28 | | | | 255,000 | | | | 262,543 | (a) |
Var Energi ASA, Senior Notes | | | 8.000 | % | | | 11/15/32 | | | | 520,000 | | | | 551,452 | (a) |
Venture Global LNG Inc., Senior Secured Notes | | | 8.125 | % | | | 6/1/28 | | | | 2,790,000 | | | | 2,836,746 | (a) |
YPF SA, Senior Secured Notes | | | 9.000 | % | | | 2/12/26 | | | | 2,741,538 | | | | 2,724,523 | (b) |
Total Energy | | | | | | | | | | | | | | | 62,409,835 | |
| Financials — 11.4% | | | | | | | | | | | | | | | | |
Banks — 3.5% | | | | | | | | | | | | | | | | |
Banco do Brasil SA, Senior Notes | | | 3.250 | % | | | 9/30/26 | | | | 480,000 | | | | 443,071 | (a) |
Citigroup Inc., Subordinated Notes (6.174% to 5/25/33 then SOFR + 2.661%) | | | 6.174 | % | | | 5/25/34 | | | | 810,000 | | | | 817,498 | (c) |
HSBC Holdings PLC, Senior Notes (4.292% to 9/12/25 then 3 mo. Term SOFR + 1.609%) | | | 4.292 | % | | | 9/12/26 | | | | 600,000 | | | | 577,298 | (c) |
KeyBank NA, Senior Notes (SOFR + 0.340%) | | | 5.432 | % | | | 1/3/24 | | | | 3,690,000 | | | | 3,636,149 | (c) |
NatWest Group PLC, Junior Subordinated Notes (4.600% to 12/28/31 then 5 year Treasury Constant Maturity Rate + 3.100%) | | | 4.600 | % | | | 6/28/31 | | | | 340,000 | | | | 236,300 | (c)(d) |
Synchrony Bank, Senior Notes | | | 5.400 | % | | | 8/22/25 | | | | 5,560,000 | | | | 5,323,811 | |
Texas Capital Bancshares Inc., Subordinated Notes (4.000% to 5/6/26 then 5 year Treasury Constant Maturity Rate + 3.150%) | | | 4.000 | % | | | 5/6/31 | | | | 1,080,000 | | | | 784,167 | (c) |
Truist Financial Corp., Senior Notes (6.047% to 6/8/26 then SOFR + 2.050%) | | | 6.047 | % | | | 6/8/27 | | | | 3,380,000 | | | | 3,382,925 | (c) |
Total Banks | | | | | | | | | | | | | | | 15,201,219 | |
Capital Markets — 4.5% | | | | | | | | | | | | | | | | |
Antares Holdings LP, Senior Notes | | | 2.750 | % | | | 1/15/27 | | | | 645,000 | | | | 530,475 | (a) |
Ares Capital Corp., Senior Notes | | | 3.250 | % | | | 7/15/25 | | | | 745,000 | | | | 689,492 | |
Ares Capital Corp., Senior Notes | | | 2.150 | % | | | 7/15/26 | | | | 4,294,000 | | | | 3,726,860 | |
Ares Capital Corp., Senior Notes | | | 2.875 | % | | | 6/15/28 | | | | 300,000 | | | | 248,454 | |
Bain Capital Specialty Finance Inc., Senior Notes | | | 2.950 | % | | | 3/10/26 | | | | 1,105,000 | | | | 981,006 | |
Blackstone Secured Lending Fund, Senior Notes | | | 3.650 | % | | | 7/14/23 | | | | 90,000 | | | | 89,901 | |
Blackstone Secured Lending Fund, Senior Notes | | | 3.625 | % | | | 1/15/26 | | | | 3,480,000 | | | | 3,202,947 | |
See Notes to Financial Statements.
| | | | |
| BrandywineGLOBAL — Flexible Bond Fund 2023 Semi-Annual Report | | | | 7 |
Schedule of investments (unaudited) (cont’d)
June 30, 2023
BrandywineGLOBAL — Flexible Bond Fund
(Percentages shown based on Fund net assets)
| | | | | | | | | | | | | | | | |
| Security | | Rate | | | Maturity
Date | | | Face
Amount† | | | Value | |
Capital Markets — continued | | | | | | | | | | | | | | | | |
Blackstone Secured Lending Fund, Senior Notes | | | 2.125 | % | | | 2/15/27 | | | | 480,000 | | | $ | 405,728 | |
Blackstone Secured Lending Fund, Senior Notes | | | 2.850 | % | | | 9/30/28 | | | | 250,000 | | | | 205,120 | |
FS KKR Capital Corp., Senior Notes | | | 3.125 | % | | | 10/12/28 | | | | 725,000 | | | | 590,921 | |
Golub Capital BDC Inc., Senior Notes | | | 2.500 | % | | | 8/24/26 | | | | 1,080,000 | | | | 934,936 | |
Golub Capital BDC Inc., Senior Notes | | | 2.050 | % | | | 2/15/27 | | | | 65,000 | | | | 54,728 | |
Hercules Capital Inc., Senior Notes | | | 2.625 | % | | | 9/16/26 | | | | 1,868,000 | | | | 1,600,080 | |
Main Street Capital Corp., Senior Notes | | | 3.000 | % | | | 7/14/26 | | | | 1,215,000 | | | | 1,069,482 | |
Owl Rock Capital Corp., Senior Notes | | | 4.000 | % | | | 3/30/25 | | | | 560,000 | | | | 525,413 | |
Owl Rock Capital Corp., Senior Notes | | | 2.625 | % | | | 1/15/27 | | | | 365,000 | | | | 310,160 | |
Owl Rock Core Income Corp., Senior Notes | | | 3.125 | % | | | 9/23/26 | | | | 1,300,000 | | | | 1,121,521 | |
Owl Rock Core Income Corp., Senior Notes | | | 7.750 | % | | | 9/16/27 | | | | 510,000 | | | | 507,926 | (a) |
Owl Rock Technology Finance Corp., Senior Notes | | | 4.750 | % | | | 12/15/25 | | | | 685,000 | | | | 620,734 | (a) |
Owl Rock Technology Finance Corp., Senior Notes | | | 3.750 | % | | | 6/17/26 | | | | 835,000 | | | | 731,441 | (a) |
UBS AG, Senior Notes | | | 0.700 | % | | | 8/9/24 | | | | 220,000 | | | | 207,483 | (a) |
XP Inc., Senior Notes | | | 3.250 | % | | | 7/1/26 | | | | 1,405,000 | | | | 1,246,196 | (a) |
Total Capital Markets | | | | | | | | | | | | | | | 19,601,004 | |
Consumer Finance — 1.1% | | | | | | | | | | | | | | | | |
Capital One Financial Corp., Senior Notes (6.312% to 6/8/28 then SOFR + 2.640%) | | | 6.312 | % | | | 6/8/29 | | | | 750,000 | | | | 745,557 | (c) |
PRA Group Inc., Senior Notes | | | 5.000 | % | | | 10/1/29 | | | | 1,640,000 | | | | 1,243,104 | (a) |
Synchrony Financial, Subordinated Notes | | | 7.250 | % | | | 2/2/33 | | | | 1,000,000 | | | | 901,521 | |
World Acceptance Corp., Senior Notes | | | 7.000 | % | | | 11/1/26 | | | | 2,000,000 | | | | 1,751,860 | (a) |
Total Consumer Finance | | | | | | | | | | | | | | | 4,642,042 | |
Financial Services — 1.1% | | | | | | | | | | | | | | | | |
Blue Owl Finance LLC, Senior Notes | | | 3.125 | % | | | 6/10/31 | | | | 1,035,000 | | | | 788,555 | (a) |
Freedom Mortgage Corp., Senior Notes | | | 8.125 | % | | | 11/15/24 | | | | 1,155,000 | | | | 1,145,519 | (a) |
Freedom Mortgage Corp., Senior Notes | | | 8.250 | % | | | 4/15/25 | | | | 1,000,000 | | | | 976,091 | (a) |
GGAM Finance Ltd., Senior Notes | | | 7.750 | % | | | 5/15/26 | | | | 1,700,000 | | | | 1,707,939 | (a) |
Global Payments Inc., Senior Notes | | | 1.200 | % | | | 3/1/26 | | | | 360,000 | | | | 320,088 | |
Total Financial Services | | | | | | | | | | | | | | | 4,938,192 | |
Insurance — 1.2% | | | | | | | | | | | | | | | | |
Athene Global Funding, Secured Notes | | | 0.914 | % | | | 8/19/24 | | | | 4,660,000 | | | | 4,356,417 | (a) |
RenaissanceRe Holdings Ltd., Senior Notes | | | 5.750 | % | | | 6/5/33 | | | | 860,000 | | | | 843,024 | |
Total Insurance | | | | | | | | | | | | | | | 5,199,441 | |
Total Financials | | | | | | | | | | | | | | | 49,581,898 | |
See Notes to Financial Statements.
| | | | |
8 | | | | BrandywineGLOBAL — Flexible Bond Fund 2023 Semi-Annual Report |
BrandywineGLOBAL — Flexible Bond Fund
(Percentages shown based on Fund net assets)
| | | | | | | | | | | | | | | | |
| Security | | Rate | | | Maturity
Date | | | Face
Amount† | | | Value | |
| Health Care — 0.4% | | | | | | | | | | | | | | | | |
Health Care Providers & Services — 0.2% | | | | | | | | | | | | | | | | |
CHS/Community Health Systems Inc., Senior Secured Notes | | | 8.000 | % | | | 3/15/26 | | | | 960,000 | | | $ | 936,007 | (a) |
Life Sciences Tools & Services — 0.2% | | | | | | | | | | | | | | | | |
Syneos Health Inc., Senior Notes | | | 3.625 | % | | | 1/15/29 | | | | 778,000 | | | | 761,499 | (a) |
Pharmaceuticals — 0.0%†† | | | | | | | | | | | | | | | | |
Teva Pharmaceutical Finance Netherlands III BV, Senior Notes | | | 2.800 | % | | | 7/21/23 | | | | 238,000 | | | | 237,694 | |
Total Health Care | | | | | | | | | | | | | | | 1,935,200 | |
| Industrials — 6.0% | | | | | | | | | | | | | | | | |
Aerospace & Defense — 0.9% | | | | | | | | | | | | | | | | |
Avolon Holdings Funding Ltd., Senior Notes | | | 6.375 | % | | | 5/4/28 | | | | 3,310,000 | | | | 3,277,569 | (a) |
Embraer Netherlands Finance BV, Senior Notes | | | 6.950 | % | | | 1/17/28 | | | | 535,000 | | | | 532,559 | (a) |
Total Aerospace & Defense | | | | | | | | | | | | | | | 3,810,128 | |
Air Freight & Logistics — 0.1% | | | | | | | | | | | | | | | | |
FedEx Corp., Senior Notes | | | 0.450 | % | | | 5/4/29 | | | | 370,000 | EUR | | | 327,462 | |
Commercial Services & Supplies — 0.1% | | | | | | | | | | | | | | | | |
Harsco Corp., Senior Notes | | | 5.750 | % | | | 7/31/27 | | | | 395,000 | | | | 344,286 | (a) |
Construction & Engineering — 0.3% | | | | | | | | | | | | | | | | |
ATP Tower Holdings LLC/Andean Tower Partners Colombia SAS/Andean Telecom Par, Senior Secured Notes | | | 4.050 | % | | | 4/27/26 | | | | 1,390,000 | | | | 1,196,698 | (a) |
Electrical Equipment — 1.0% | | | | | | | | | | | | | | | | |
Regal Rexnord Corp., Senior Notes | | | 6.300 | % | | | 2/15/30 | | | | 310,000 | | | | 309,303 | (a) |
Regal Rexnord Corp., Senior Notes | | | 6.400 | % | | | 4/15/33 | | | | 310,000 | | | | 309,948 | (a) |
WESCO Distribution Inc., Senior Notes | | | 7.125 | % | | | 6/15/25 | | | | 3,500,000 | | | | 3,540,022 | (a) |
Total Electrical Equipment | | | | | | | | | | | | | | | 4,159,273 | |
Ground Transportation — 0.8% | | | | | | | | | | | | | | | | |
Penske Truck Leasing Co. LP/PTL Finance Corp., Senior Notes | | | 6.200 | % | | | 6/15/30 | | | | 2,950,000 | | | | 2,968,215 | (a) |
Rumo Luxembourg Sarl, Senior Notes | | | 4.200 | % | | | 1/18/32 | | | | 675,000 | | | | 539,757 | (a) |
Total Ground Transportation | | | | | | | | | | | | | | | 3,507,972 | |
Industrial Conglomerates — 0.1% | | | | | | | | | | | | | | | | |
Siemens Financieringsmaatschappij NV, Senior Notes | | | 0.650 | % | | | 3/11/24 | | | | 600,000 | | | | 580,605 | (a) |
Passenger Airlines — 1.6% | | | | | | | | | | | | | | | | |
Air Canada Pass-Through Trust | | | 3.600 | % | | | 3/15/27 | | | | 3,039,136 | | | | 2,825,200 | (a) |
Air Canada Pass-Through Trust | | | 5.250 | % | | | 4/1/29 | | | | 1,049,185 | | | | 1,018,464 | (a) |
See Notes to Financial Statements.
| | | | |
| BrandywineGLOBAL — Flexible Bond Fund 2023 Semi-Annual Report | | | | 9 |
Schedule of investments (unaudited) (cont’d)
June 30, 2023
BrandywineGLOBAL — Flexible Bond Fund
(Percentages shown based on Fund net assets)
| | | | | | | | | | | | | | | | |
| Security | | Rate | | | Maturity
Date | | | Face
Amount† | | | Value | |
Passenger Airlines — continued | | | | | | | | | | | | | | | | |
Air Canada Pass-Through Trust | | | 3.300 | % | | | 1/15/30 | | | | 307,840 | | | $ | 273,032 | (a) |
Allegiant Travel Co., Senior Secured Notes | | | 7.250 | % | | | 8/15/27 | | | | 1,190,000 | | | | 1,186,811 | (a) |
Delta Air Lines Inc./SkyMiles IP Ltd., Senior Secured Notes | | | 4.500 | % | | | 10/20/25 | | | | 651,006 | | | | 637,088 | (a) |
Mileage Plus Holdings LLC/Mileage Plus Intellectual Property Assets Ltd., Senior Secured Notes | | | 6.500 | % | | | 6/20/27 | | | | 1,228,000 | | | | 1,232,171 | (a) |
Total Passenger Airlines | | | | | | | | | | | | | | | 7,172,766 | |
Professional Services — 0.2% | | | | | | | | | | | | | | | | |
Block Financial LLC, Senior Notes | | | 3.875 | % | | | 8/15/30 | | | | 945,000 | | | | 834,363 | |
Trading Companies & Distributors — 0.9% | | | | | | | | | | | | | | | | |
Air Lease Corp., Senior Notes | | | 0.800 | % | | | 8/18/24 | | | | 3,880,000 | | | | 3,656,286 | |
Ashtead Capital Inc., Senior Notes | | | 5.500 | % | | | 8/11/32 | | | | 420,000 | | | | 406,502 | (a) |
Total Trading Companies & Distributors | | | | | | | | | | | | | | | 4,062,788 | |
Total Industrials | | | | | | | | | | | | | | | 25,996,341 | |
| Information Technology — 3.0% | | | | | | | | | | | | | | | | |
Communications Equipment — 0.5% | | | | | | | | | | | | | | | | |
CommScope Inc., Senior Notes | | | 7.125 | % | | | 7/1/28 | | | | 1,830,000 | | | | 1,301,698 | (a) |
Viasat Inc., Senior Secured Notes | | | 5.625 | % | | | 4/15/27 | | | | 895,000 | | | | 836,431 | (a) |
Total Communications Equipment | | | | | | | | | | | | | | | 2,138,129 | |
Electronic Equipment, Instruments & Components — 1.2% | | | | | | | | | |
Jabil Inc., Senior Notes | | | 3.600 | % | | | 1/15/30 | | | | 1,600,000 | | | | 1,433,290 | |
Vontier Corp., Senior Notes | | | 1.800 | % | | | 4/1/26 | | | | 2,010,000 | | | | 1,788,012 | |
Vontier Corp., Senior Notes | | | 2.400 | % | | | 4/1/28 | | | | 610,000 | | | | 508,883 | |
Vontier Corp., Senior Notes | | | 2.950 | % | | | 4/1/31 | | | | 1,590,000 | | | | 1,273,404 | |
Total Electronic Equipment, Instruments & Components | | | | | | | | 5,003,589 | |
IT Services — 0.4% | | | | | | | | | | | | | | | | |
Sabre GLBL Inc., Senior Secured Notes | | | 7.375 | % | | | 9/1/25 | | | | 2,200,000 | | | | 1,955,371 | (a) |
Semiconductors & Semiconductor Equipment — 0.2% | | | | | | | | | | | | | |
Broadcom Inc., Senior Notes | | | 1.950 | % | | | 2/15/28 | | | | 1,010,000 | | | | 874,150 | (a) |
Software — 0.5% | | | | | | | | | | | | | | | | |
Black Knight InfoServ LLC, Senior Notes | | | 3.625 | % | | | 9/1/28 | | | | 1,310,000 | | | | 1,183,611 | (a) |
MicroStrategy Inc., Senior Secured Notes | | | 6.125 | % | | | 6/15/28 | | | | 1,026,000 | | | | 920,835 | (a) |
Total Software | | | | | | | | | | | | | | | 2,104,446 | |
Technology Hardware, Storage & Peripherals — 0.2% | | | | | | | | | | | | | |
Seagate HDD Cayman, Senior Notes | | | 4.125 | % | | | 1/15/31 | | | | 1,000,000 | | | | 820,423 | |
Total Information Technology | | | | | | | | | | | | | | | 12,896,108 | |
See Notes to Financial Statements.
| | | | |
10 | | | | BrandywineGLOBAL — Flexible Bond Fund 2023 Semi-Annual Report |
BrandywineGLOBAL — Flexible Bond Fund
(Percentages shown based on Fund net assets)
| | | | | | | | | | | | | | | | |
| Security | | Rate | | | Maturity
Date | | | Face
Amount† | | | Value | |
| Materials — 5.2% | | | | | | | | | | | | | | | | |
Chemicals — 1.5% | | | | | | | | | | | | | | | | |
Braskem Idesa SAPI, Senior Secured Notes | | | 7.450 | % | | | 11/15/29 | | | | 610,000 | | | $ | 410,042 | (a) |
Mativ Holdings Inc., Senior Notes | | | 6.875 | % | | | 10/1/26 | | | | 2,445,000 | | | | 2,142,822 | (a) |
Valvoline Inc., Senior Notes | | | 4.250 | % | | | 2/15/30 | | | | 3,960,000 | | | | 3,891,888 | (a) |
Total Chemicals | | | | | | | | | | | | | | | 6,444,752 | |
Containers & Packaging — 1.0% | | | | | | | | | | | | | | | | |
Ardagh Packaging Finance PLC/Ardagh | | | | | | | | | | | | | | | | |
Holdings USA Inc., Senior Secured Notes | | | 4.125 | % | | | 8/15/26 | | | | 2,020,000 | | | | 1,883,956 | (a) |
Graham Packaging Co. Inc., Senior Notes | | | 7.125 | % | | | 8/15/28 | | | | 1,030,000 | | | | 880,758 | (a) |
Graphic Packaging International LLC, Senior Secured Notes | | | 1.512 | % | | | 4/15/26 | | | | 1,339,000 | | | | 1,194,063 | (a) |
Pactiv Evergreen Group Issuer Inc/Pactiv Evergreen Group Issuer LLC, Senior Secured Notes | | | 4.000 | % | | | 10/15/27 | | | | 630,000 | | | | 557,860 | (a) |
Total Containers & Packaging | | | | | | | | | | | | | | | 4,516,637 | |
Metals & Mining — 2.7% | | | | | | | | | | | | | | | | |
First Quantum Minerals Ltd., Senior Notes | | | 7.500 | % | | | 4/1/25 | | | | 1,600,000 | | | | 1,600,257 | (a) |
First Quantum Minerals Ltd., Senior Notes | | | 6.875 | % | | | 3/1/26 | | | | 2,045,000 | | | | 2,015,937 | (a) |
First Quantum Minerals Ltd., Senior Notes | | | 6.875 | % | | | 10/15/27 | | | | 2,705,000 | | | | 2,642,826 | (a) |
Glencore Funding LLC, Senior Notes | | | 4.875 | % | | | 3/12/29 | | | | 1,020,000 | | | | 983,066 | (a) |
Taseko Mines Ltd., Senior Secured Notes | | | 7.000 | % | | | 2/15/26 | | | | 4,705,000 | | | | 4,293,082 | (a) |
Total Metals & Mining | | | | | | | | | | | | | | | 11,535,168 | |
Total Materials | | | | | | | | | | | | | | | 22,496,557 | |
| Real Estate — 0.2% | | | | | | | | | | | | | | | | |
Specialized REITs — 0.2% | | | | | | | | | | | | | | | | |
Outfront Media Capital LLC/Outfront Media Capital Corp., Senior Notes | | | 4.250 | % | | | 1/15/29 | | | | 780,000 | | | | 656,308 | (a) |
| Utilities — 0.4% | | | | | | | | | | | | | | | | |
Electric Utilities — 0.4% | | | | | | | | | | | | | | | | |
AES Panama Generation Holdings SRL, Senior Secured Notes | | | 4.375 | % | | | 5/31/30 | | | | 847,346 | | | | 724,375 | (a) |
DPL Inc., Senior Notes | | | 4.125 | % | | | 7/1/25 | | | | 1,285,000 | | | | 1,225,196 | |
Total Utilities | | | | | | | | | | | | | | | 1,949,571 | |
Total Corporate Bonds & Notes (Cost — $237,752,466) | | | | | | | | 228,275,079 | |
| Sovereign Bonds — 17.2% | | | | | | | | | | | | | | | | |
Brazil — 5.0% | | | | | | | | | | | | | | | | |
Brazil Notas do Tesouro Nacional Serie F, Notes | | | 10.000 | % | | | 1/1/33 | | | | 107,400,000 | BRL | | | 21,621,284 | |
See Notes to Financial Statements.
| | | | |
| BrandywineGLOBAL — Flexible Bond Fund 2023 Semi-Annual Report | | | | 11 |
Schedule of investments (unaudited) (cont’d)
June 30, 2023
BrandywineGLOBAL — Flexible Bond Fund
(Percentages shown based on Fund net assets)
| | | | | | | | | | | | | | | | |
| Security | | Rate | | | Maturity
Date | | | Face
Amount† | | | Value | |
Colombia — 5.4% | | | | | | | | | | | | | | | | |
Colombian TES, Bonds | | | 7.000 | % | | | 3/26/31 | | | | 116,140,000,000 | COP | | $ | 23,492,090 | |
Germany — 1.8% | | | | | | | | | | | | | | | | |
Bundesrepublik Deutschland Bundesanleihe, Bonds | | | 1.800 | % | | | 8/15/53 | | | | 8,170,000 | EUR | | | 7,791,801 | (b) |
Mexico — 3.9% | | | | | | | | | | | | | | | | |
Mexican Bonos, Bonds | | | 8.000 | % | | | 7/31/53 | | | | 320,700,000 | MXN | | | 17,003,451 | |
Spain — 1.1% | | | | | | | | | | | | | | | | |
Spain Government Bond, Senior Notes | | | 2.350 | % | | | 7/30/33 | | | | 5,000,000 | EUR | | | 4,975,086 | (b) |
Total Sovereign Bonds (Cost — $65,857,230) | | | | | | | | | | | | 74,883,712 | |
| U.S. Government & Agency Obligations — 13.2% | | | | | | | | | | | | | |
U.S. Government Obligations — 13.2% | | | | | | | | | | | | | | | | |
U.S. Treasury Notes (3 mo. U.S. Treasury Money Market Yield + 0.200%) | | | 5.449 | % | | | 1/31/25 | | | | 9,200,000 | | | | 9,216,431 | (c) |
U.S. Treasury Notes | | | 3.500 | % | | | 2/15/33 | | | | 49,360,000 | | | | 48,087,437 | |
Total U.S. Government & Agency Obligations (Cost — $59,160,802) | | | | 57,303,868 | |
| Collateralized Mortgage Obligations (e) — 6.0% | | | | | | | | | | | | | |
Bellemeade RE Ltd., 2020-2A M2 (1 mo. USD LIBOR + 6.000%) | | | 11.150 | % | | | 8/26/30 | | | | 4,287,731 | | | | 4,367,195 | (a)(c) |
Bellemeade Re Ltd., 2020-3A M2 (1 mo. USD LIBOR + 4.850%) | | | 10.000 | % | | | 10/25/30 | | | | 690,000 | | | | 721,476 | (a)(c) |
BX Commercial Mortgage Trust, 2021-VOLT F (1 mo. USD LIBOR + 2.400%) | | | 7.593 | % | | | 9/15/36 | | | | 260,000 | | | | 243,168 | (a)(c) |
Eagle RE Ltd., 2019-1 M2 (1 mo. USD LIBOR + 3.300%) | | | 8.450 | % | | | 4/25/29 | | | | 1,609,196 | | | | 1,631,141 | (a)(c) |
Federal Home Loan Mortgage Corp. (FHLMC) REMIC, Structured Agency Credit Risk Debt Notes, 2020-DNA3 B1 (1 mo. USD LIBOR + 5.100%) | | | 10.250 | % | | | 6/25/50 | | | | 899,562 | | | | 968,923 | (a)(c) |
Federal Home Loan Mortgage Corp. (FHLMC) REMIC, Structured Agency Credit Risk Debt Notes, 2020-HQA4 B1 (1 mo. USD LIBOR + 5.250%) | | | 10.400 | % | | | 9/25/50 | | | | 643,773 | | | | 687,062 | (a)(c) |
Federal Home Loan Mortgage Corp. (FHLMC) REMIC, Structured Agency Credit Risk Debt Notes, 2021-DNA5 B1 (30 Day Average SOFR + 3.050%) | | | 8.117 | % | | | 1/25/34 | | | | 1,935,000 | | | | 1,904,309 | (a)(c) |
Federal Home Loan Mortgage Corp. (FHLMC) Structured Agency Credit Risk Debt Notes, 2018-HRP2 B1 (1 mo. USD LIBOR + 4.200%) | | | 9.350 | % | | | 2/25/47 | | | | 2,810,000 | | | | 3,008,062 | (a)(c) |
See Notes to Financial Statements.
| | | | |
12 | | | | BrandywineGLOBAL — Flexible Bond Fund 2023 Semi-Annual Report |
BrandywineGLOBAL — Flexible Bond Fund
(Percentages shown based on Fund net assets)
| | | | | | | | | | | | | | | | |
| Security | | Rate | | | Maturity
Date | | | Face
Amount† | | | Value | |
| Collateralized Mortgage Obligations (e) — continued | | | | | | | | | | | | | |
Federal Home Loan Mortgage Corp. (FHLMC) Structured Agency Credit Risk Debt Notes, 2020-HQA5 B1 (30 Day Average SOFR + 4.000%) | | | 9.067 | % | | | 11/25/50 | | | | 1,500,000 | | | $ | 1,532,804 | (a)(c) |
Federal Home Loan Mortgage Corp. (FHLMC) Structured Agency Credit Risk Debt Notes, 2021-HQA1 M2 (30 Day Average SOFR + 2.250%) | | | 7.317 | % | | | 8/25/33 | | | | 2,457,319 | | | | 2,422,622 | (a)(c) |
Federal Home Loan Mortgage Corp. (FHLMC) Structured Agency Credit Risk Debt Notes, 2022-DNA4 M1B (30 Day Average SOFR + 3.350%) | | | 8.417 | % | | | 5/25/42 | | | | 1,500,000 | | | | 1,518,658 | (a)(c) |
Federal National Mortgage Association (FNMA) — CAS, 2017-C02 2M2C (1 mo. USD LIBOR + 3.650%) | | | 8.800 | % | | | 9/25/29 | | | | 845,000 | | | | 876,618 | (c) |
Federal National Mortgage Association (FNMA) — CAS, 2017-C06 2M2 (1 mo. USD LIBOR + 2.800%) | | | 7.950 | % | | | 2/25/30 | | | | 635,328 | | | | 646,959 | (c) |
Federal National Mortgage Association (FNMA) — CAS, 2019-R01 2B1 (1 mo. USD LIBOR + 4.350%) | | | 9.500 | % | | | 7/25/31 | | | | 60,000 | | | | 63,681 | (a)(c) |
Federal National Mortgage Association (FNMA) — CAS, 2019-R05 1B1 (1 mo. USD LIBOR + 4.100%) | | | 9.250 | % | | | 7/25/39 | | | | 654,589 | | | | 672,838 | (a)(c) |
Federal National Mortgage Association (FNMA) — CAS, 2019-R07 1B1 (1 mo. USD LIBOR + 3.400%) | | | 8.550 | % | | | 10/25/39 | | | | 115,000 | | | | 115,982 | (a)(c) |
Federal National Mortgage Association (FNMA) — CAS, 2020-R01 1B1 (1 mo. USD LIBOR + 3.250%) | | | 8.400 | % | | | 1/25/40 | | | | 1,450,000 | | | | 1,423,521 | (a)(c) |
Federal National Mortgage Association (FNMA) — CAS, 2020-R02 2M2 (1 mo. USD LIBOR + 2.000%) | | | 7.150 | % | | | 1/25/40 | | | | 3,477,346 | | | | 3,482,352 | (a)(c) |
Total Collateralized Mortgage Obligations (Cost — $26,302,070) | | | | | | | | 26,287,371 | |
| Mortgage-Backed Securities — 4.3% | | | | | | | | | | | | | | | | |
FHLMC — 2.2% | | | | | | | | | | | | | | | | |
Federal Home Loan Mortgage Corp. (FHLMC) | | | 4.500 | % | |
| 9/1/52-
10/1/52 |
| | | 9,758,231 | | | | 9,389,360 | |
See Notes to Financial Statements.
| | | | |
| BrandywineGLOBAL — Flexible Bond Fund 2023 Semi-Annual Report | | | | 13 |
Schedule of investments (unaudited) (cont’d)
June 30, 2023
BrandywineGLOBAL — Flexible Bond Fund
(Percentages shown based on Fund net assets)
| | | | | | | | | | | | | | | | |
| Security | | Rate | | | Maturity
Date | | | Face
Amount† | | | Value | |
FNMA — 2.1% | | | | | | | | | | | | | | | | |
Federal National Mortgage Association (FNMA) | | | 4.500 | % | | | 9/1/52 | | | | 9,726,328 | | | $ | 9,358,748 | |
Total Mortgage-Backed Securities (Cost — $19,133,926) | | | | | | | | 18,748,108 | |
| Senior Loans — 0.9% | | | | | | | | | | | | | | | | |
| Consumer Discretionary — 0.2% | | | | | | | | | | | | | | | | |
Hotels, Restaurants & Leisure — 0.2% | | | | | | | | | | | | | | | | |
Flutter Entertainment PLC, Third Amendment 2028 Term Loan B | | | — | | | | 7/22/28 | | | | 992,500 | | | | 995,487 | (f) |
| Consumer Staples — 0.4% | | | | | | | | | | | | | | | | |
Beverages — 0.4% | | | | | | | | | | | | | | | | |
Phinia Inc., Term Loan B | | | — | | | | 6/8/28 | | | | 1,700,000 | | | | 1,700,000 | (f)(g) |
| Information Technology — 0.3% | | | | | | | | | | | | | | | | |
IT Services — 0.3% | | | | | | | | | | | | | | | | |
Sabre GLBL Inc., 2022 Term Loan B2 (1 mo. Term SOFR + 5.100%) | | | 10.202 | % | | | 6/30/28 | | | | 1,426,476 | | | | 1,144,034 | (c)(h)(i) |
Total Senior Loans (Cost — $3,936,514) | | | | | | | | | | | | | | | 3,839,521 | |
| Convertible Bonds & Notes — 0.5% | | | | | | | | | | | | | | | | |
| Communication Services — 0.5% | | | | | | | | | | | | | | | | |
Media — 0.5% | | | | | | | | | | | | | | | | |
DISH Network Corp., Senior Notes (Cost — $3,585,418) | | | 3.375 | % | | | 8/15/26 | | | | 3,949,000 | | | | 2,023,863 | |
| Asset-Backed Securities — 0.4% | | | | | | | | | | | | | | | | |
DT Auto Owner Trust, 2021-1A E (Cost — $1,795,300) | | | 2.380 | % | | | 1/18/28 | | | | 1,800,000 | | | | 1,636,934 | (a) |
Total Investments before Short-Term Investments (Cost — $417,523,726) | | | | 412,998,456 | |
| | | | |
| | | | | | | | | Shares | | | | |
| Short-Term Investments — 3.6% | | | | | | | | | | | | | | | | |
Western Asset Premier Institutional U.S. Treasury Reserves, Premium Shares
(Cost — $15,674,324) | | | 5.058 | % | | | | | | | 15,674,324 | | | | 15,674,324 | (j)(k) |
Total Investments — 98.7% (Cost — $433,198,050) | | | | | | | | | | | | 428,672,780 | |
Other Assets in Excess of Liabilities — 1.3% | | | | | | | | | | | | | | | 5,707,526 | |
Total Net Assets — 100.0% | | | | | | | | | | | | | | $ | 434,380,306 | |
See Notes to Financial Statements.
| | | | |
14 | | | | BrandywineGLOBAL — Flexible Bond Fund 2023 Semi-Annual Report |
BrandywineGLOBAL — Flexible Bond Fund
| † | Face amount denominated in U.S. dollars, unless otherwise noted. |
| †† | Represents less than 0.1%. |
| (a) | Security is exempt from registration under Rule 144A of the Securities Act of 1933. This security may be resold in transactions that are exempt from registration, normally to qualified institutional buyers. This security has been deemed liquid pursuant to guidelines approved by the Board of Trustees. |
| (b) | Security is exempt from registration under Regulation S of the Securities Act of 1933. Regulation S applies to securities offerings that are made outside of the United States and do not involve direct selling efforts in the United States. This security has been deemed liquid pursuant to guidelines approved by the Board of Trustees. |
| (c) | Variable rate security. Interest rate disclosed is as of the most recent information available. Certain variable rate securities are not based on a published reference rate and spread but are determined by the issuer or agent and are based on current market conditions. These securities do not indicate a reference rate and spread in their description above. |
| (d) | Security has no maturity date. The date shown represents the next call date. |
| (e) | Collateralized mortgage obligations are secured by an underlying pool of mortgages or mortgage pass-through certificates that are structured to direct payments on underlying collateral to different series or classes of the obligations. The interest rate may change positively or inversely in relation to one or more interest rates, financial indices or other financial indicators and may be subject to an upper and/or lower limit. |
| (f) | All or a portion of this loan has not settled as of June 30, 2023. Interest rates are not effective until settlement date. Interest rates shown, if any, are for the settled portion of the loan. |
| (g) | Security is valued using significant unobservable inputs (Note 1). |
| (h) | Interest rates disclosed represent the effective rates on senior loans. Ranges in interest rates are attributable to multiple contracts under the same loan. |
| (i) | Senior loans may be considered restricted in that the Fund ordinarily is contractually obligated to receive approval from the agent bank and/or borrower prior to the disposition of a senior loan. |
| (j) | Rate shown is one-day yield as of the end of the reporting period. |
| (k) | In this instance, as defined in the Investment Company Act of 1940, an “Affiliated Company” represents Fund ownership of at least 5% of the outstanding voting securities of an issuer, or a company which is under common ownership or control with the Fund. At June 30, 2023, the total market value of investments in Affiliated Companies was $15,674,324 and the cost was $15,674,324 (Note 8). |
| | |
Abbreviation(s) used in this schedule: |
| |
| BRL | | — Brazilian Real |
| |
| CAS | | — Connecticut Avenue Securities |
| |
| COP | | — Colombian Peso |
| |
| EUR | | — Euro |
| |
| LIBOR | | — London Interbank Offered Rate |
| |
| MXN | | — Mexican Peso |
| |
| REMIC | | — Real Estate Mortgage Investment Conduit |
| |
| SOFR | | — Secured Overnight Financing Rate |
| |
| USD | | — United States Dollar |
See Notes to Financial Statements.
| | | | |
| BrandywineGLOBAL — Flexible Bond Fund 2023 Semi-Annual Report | | | | 15 |
Schedule of investments (unaudited) (cont’d)
June 30, 2023
BrandywineGLOBAL — Flexible Bond Fund
At June 30, 2023, the Fund had the following open futures contracts:
| | | | | | | | | | | | | | | | | | | | |
| | | Number of
Contracts | | | Expiration
Date | | | Notional
Amount | | | Market
Value | | | Unrealized
Appreciation
(Depreciation) | |
| Contracts to Buy: | |
| U.S. Treasury Ultra 10-Year Notes | | | 210 | | | | 9/23 | | | $ | 25,132,220 | | | $ | 24,871,875 | | | $ | (260,345) | |
| U.S. Treasury Ultra Long- Term Bonds | | | 489 | | | | 9/23 | | | | 66,000,472 | | | | 66,610,969 | | | | 610,497 | |
| | | | | | | | | | | | | | | | | | | | 350,152 | |
| Contracts to Sell: | | | | | | | | | | | | | | | | | | | | |
| Japanese 10-Year Bonds | | | 92 | | | | 9/23 | | | | 94,412,796 | | | | 94,712,915 | | | | (300,119) | |
| Net unrealized appreciation on open futures contracts | | | $ | 50,033 | |
At June 30, 2023, the Fund had the following open forward foreign currency contracts:
| | | | | | | | | | | | | | | | | | | | |
Currency
Purchased | | | Currency
Sold | | | Counterparty | | Settlement
Date | | | Unrealized
Appreciation
(Depreciation) | |
| BRL | | | 75,990,000 | | | USD | | | 15,121,485 | | | HSBC Securities Inc. | | | 7/19/23 | | | $ | 692,468 | |
| USD | | | 1,250,733 | | | BRL | | | 6,400,000 | | | HSBC Securities Inc. | | | 7/19/23 | | | | (81,144) | |
| USD | | | 13,953,721 | | | BRL | | | 69,590,000 | | | HSBC Securities Inc. | | | 7/19/23 | | | | (528,355) | |
| MXN | | | 194,600,000 | | | USD | | | 10,783,553 | | | Citibank N.A. | | | 7/28/23 | | | | 520,714 | |
| USD | | | 10,568,620 | | | MXN | | | 194,600,000 | | | Citibank N.A. | | | 7/28/23 | | | | (735,648) | |
| COP | | | 16,000,000,000 | | | USD | | | 3,382,249 | | | JPMorgan Chase & Co. | | | 7/28/23 | | | | 416,155 | |
| COP | | | 27,570,000,000 | | | USD | | | 5,987,621 | | | JPMorgan Chase & Co. | | | 7/28/23 | | | | 557,504 | |
| USD | | | 9,548,082 | | | COP | | | 43,570,000,000 | | | JPMorgan Chase & Co. | | | 7/28/23 | | | | (795,446) | |
| USD | | | 552,664 | | | EUR | | | 500,000 | | | HSBC Securities Inc. | | | 8/4/23 | | | | 6,080 | |
| USD | | | 4,981,314 | | | EUR | | | 4,640,000 | | | JPMorgan Chase & Co. | | | 8/4/23 | | | | (90,986) | |
| USD | | | 7,206,105 | | | EUR | | | 6,510,000 | | | Morgan Stanley & Co. Inc. | | | 8/4/23 | | | | 89,581 | |
| KRW | | | 10,760,000,000 | | | USD | | | 8,294,150 | | | Citibank N.A. | | | 9/13/23 | | | | (95,669) | |
| USD | | | 8,387,248 | | | KRW | | | 10,760,000,000 | | | Citibank N.A. | | | 9/13/23 | | | | 188,767 | |
| JPY | | | 1,703,000,000 | | | USD | | | 12,387,977 | | | JPMorgan Chase & Co. | | | 9/19/23 | | | | (436,607) | |
| Net unrealized depreciation on open forward foreign currency contracts | | | | | | $ | (292,586) | |
| | |
Abbreviation(s) used in this table: |
| |
| BRL | | — Brazilian Real |
| |
| COP | | — Colombian Peso |
| |
| EUR | | — Euro |
| |
| JPY | | — Japanese Yen |
| |
| KRW | | — South Korean Won |
| |
| MXN | | — Mexican Peso |
| |
| USD | | — United States Dollar |
See Notes to Financial Statements.
| | | | |
16 | | | | BrandywineGLOBAL — Flexible Bond Fund 2023 Semi-Annual Report |
BrandywineGLOBAL — Flexible Bond Fund
At June 30, 2023, the Fund had the following open swap contracts:
| | | | | | | | | | | | | | | | | | | | | | |
| CENTRALLY CLEARED CREDIT DEFAULT SWAPS ON CREDIT INDICES — SELL PROTECTION1 | |
| Reference Entity | | Notional
Amount2* | | | Termination
Date | | | Periodic
Payments
Received by
the Fund† | | Market Value3 | | | Upfront
Premiums
Paid
(Received) | | | Unrealized
Appreciation | |
| Markit CDX.NA.HY.31 Index | | $ | 20,141,200 | | | | 12/20/23 | | | 5.000% quarterly | | $ | 384,760 | | | $ | 287,366 | | | $ | 97,394 | |
| Markit CDX.NA.IG.34 Index | | | 14,685,000 | | | | 6/20/25 | | | 1.000% quarterly | | | 162,836 | | | | 61,875 | | | | 100,961 | |
| Markit iTraxx Europe Index | | | 295,000 | EUR | | | 12/20/24 | | | 1.000% quarterly | | | 3,482 | | | | 24 | | | | 3,458 | |
| Markit iTraxx Europe Index | | | 5,150,000 | EUR | | | 6/20/25 | | | 1.000% quarterly | | | 72,695 | | | | 56,202 | | | | 16,493 | |
| Total | | | | | | | | | | | | $ | 623,773 | | | $ | 405,467 | | | $ | 218,306 | |
| 1 | If the Fund is a seller of protection and a credit event occurs, as defined under the terms of that particular swap agreement, the Fund will either (i) pay to the buyer of protection an amount equal to the notional amount of the swap and take delivery of the referenced obligation or underlying securities comprising the referenced index or (ii) pay a net settlement amount in the form of cash or securities equal to the notional amount of the swap less the recovery value of the referenced obligation or underlying securities comprising the referenced index. |
| 2 | The maximum potential amount the Fund could be required to pay as a seller of credit protection or receive as a buyer of credit protection if a credit event occurs as defined under the terms of that particular swap agreement. |
| 3 | The quoted market prices and resulting values for credit default swap agreements on asset-backed securities and credit indices serve as an indicator of the current status of the payment/performance risk and represent the likelihood of an expected loss (or profit) for the credit derivative had the notional amount of the swap agreement been closed/sold as of the period end. Decreasing market values (sell protection) or increasing market values (buy protection) when compared to the notional amount of the swap, represent a deterioration of the referenced entity’s credit soundness and a greater likelihood or risk of default or other credit event occurring as defined under the terms of the agreement. |
| † | Percentage shown is an annual percentage rate. |
| * | Notional amount denominated in U.S. dollars, unless otherwise noted. |
| | |
Abbreviation(s) used in this table: |
| |
| EUR | | — Euro |
See Notes to Financial Statements.
| | | | |
| BrandywineGLOBAL — Flexible Bond Fund 2023 Semi-Annual Report | | | | 17 |
Schedule of investments (unaudited) (cont’d)
June 30, 2023
BrandywineGLOBAL — Flexible Bond Fund
| | | | |
| Summary of Investments by Country* | | | |
| United States | | | 62.4 | % |
| Colombia | | | 5.9 | |
| Brazil | | | 5.8 | |
| Canada | | | 4.2 | |
| Mexico | | | 4.1 | |
| Germany | | | 1.9 | |
| Israel | | | 1.9 | |
| Bermuda | | | 1.8 | |
| Zambia | | | 1.5 | |
| Ireland | | | 1.4 | |
| Spain | | | 1.2 | |
| United Kingdom | | | 0.9 | |
| Japan | | | 0.8 | |
| Argentina | | | 0.6 | |
| Chile | | | 0.5 | |
| Czech Republic | | | 0.4 | |
| Australia | | | 0.2 | |
| China | | | 0.2 | |
| Luxembourg | | | 0.2 | |
| Norway | | | 0.2 | |
| Panama | | | 0.2 | |
| Switzerland | | | 0.0 | † |
| Short-Term Investments | | | 3.7 | |
| | | | 100.0 | % |
| * | As a percentage of total investments. Please note that the Fund holdings are as of June 30, 2023 and are subject to change. |
| † | Represents less than 0.1%. |
See Notes to Financial Statements.
| | | | |
18 | | | | BrandywineGLOBAL — Flexible Bond Fund 2023 Semi-Annual Report |
Statement of assets and liabilities (unaudited)
June 30, 2023
| | | | |
| |
| Assets: | | | | |
Investments in unaffiliated securities, at value (Cost — $417,523,726) | | $ | 412,998,456 | |
Investments in affiliated securities, at value (Cost — $15,674,324) | | | 15,674,324 | |
Foreign currency, at value (Cost — $250) | | | 257 | |
Cash | | | 1,652,645 | |
Interest receivable | | | 6,835,352 | |
Deposits with brokers for open futures contracts | | | 5,798,890 | |
Unrealized appreciation on forward foreign currency contracts | | | 2,471,269 | |
Deposits with brokers for centrally cleared swap contracts | | | 879,830 | |
Receivable from brokers — net variation margin on open futures contracts | | | 743,727 | |
Receivable for Fund shares sold | | | 709,229 | |
Receivable from brokers — net variation margin on centrally cleared swap contracts | | | 320,205 | |
Dividends receivable from affiliated investments | | | 61,604 | |
Prepaid expenses | | | 349 | |
Total Assets | | | 448,146,137 | |
| |
| Liabilities: | | | | |
Payable for securities purchased | | | 8,058,423 | |
Unrealized depreciation on forward foreign currency contracts | | | 2,763,855 | |
Payable for Fund shares repurchased | | | 1,977,768 | |
Foreign currency collateral due to brokers for open futures contracts, at value (Cost — $409,285) | | | 369,748 | |
Deposits from brokers for OTC derivatives | | | 270,000 | |
Investment management fee payable | | | 201,312 | |
Distributions payable | | | 38,389 | |
Service and/or distribution fees payable | | | 9,657 | |
Trustees’ fees payable | | | 3,670 | |
Accrued expenses | | | 73,009 | |
Total Liabilities | | | 13,765,831 | |
| Total Net Assets | | $ | 434,380,306 | |
| |
| Net Assets: | | | | |
Par value (Note 7) | | $ | 450 | |
Paid-in capital in excess of par value | | | 466,306,508 | |
Total distributable earnings (loss) | | | (31,926,652) | |
| Total Net Assets | | $ | 434,380,306 | |
See Notes to Financial Statements.
| | | | |
| BrandywineGLOBAL — Flexible Bond Fund 2023 Semi-Annual Report | | | | 19 |
Statement of assets and liabilities (unaudited) (cont’d)
June 30, 2023
| | | | |
| |
| Net Assets: | | | | |
Class A | | | $37,888,204 | |
Class C | | | $2,606,193 | |
Class I | | | $235,086,540 | |
Class IS | | | $158,799,369 | |
| |
| Shares Outstanding: | | | | |
Class A | | | 3,927,264 | |
Class C | | | 271,868 | |
Class I | | | 24,342,789 | |
Class IS | | | 16,424,919 | |
| |
| Net Asset Value: | | | | |
Class A (and redemption price) | | | $9.65 | |
Class C* | | | $9.59 | |
Class I (and redemption price) | | | $9.66 | |
Class IS (and redemption price) | | | $9.67 | |
| Maximum Public Offering Price Per Share: | | | | |
Class A (based on maximum initial sales charge of 3.75%) | | | $10.03 | |
| * | Redemption price per share is NAV of Class C shares reduced by a 1.00% CDSC if shares are redeemed within one year from purchase payment (Note 2). |
See Notes to Financial Statements.
| | | | |
20 | | | | BrandywineGLOBAL — Flexible Bond Fund 2023 Semi-Annual Report |
Statement of operations (unaudited)
For the Six Months Ended June 30, 2023
| | | | |
| |
| Investment Income: | | | | |
Interest | | $ | 10,208,740 | |
Dividends from affiliated investments | | | 478,486 | |
Less: Foreign taxes withheld | | | (75,107) | |
Total Investment Income | | | 10,612,119 | |
| |
| Expenses: | | | | |
Investment management fee (Note 2) | | | 964,345 | |
Transfer agent fees (Note 5) | | | 105,010 | |
Registration fees | | | 82,599 | |
Service and/or distribution fees (Notes 2 and 5) | | | 47,932 | |
Fund accounting fees | | | 34,778 | |
Audit and tax fees | | | 22,972 | |
Legal fees | | | 16,548 | |
Trustees’ fees | | | 9,380 | |
Fees recaptured by investment manager (Note 2) | | | 7,991 | |
Shareholder reports | | | 6,813 | |
Custody fees | | | 3,706 | |
Commitment fees (Note 9) | | | 1,011 | |
Insurance | | | 752 | |
Interest expense | | | 346 | |
Miscellaneous expenses | | | 7,337 | |
Total Expenses | | | 1,311,520 | |
Less: Fee waivers and/or expense reimbursements (Notes 2 and 5) | | | (18,290) | |
Net Expenses | | | 1,293,230 | |
| Net Investment Income | | | 9,318,889 | |
|
Realized and Unrealized Gain (Loss) on Investments, Futures Contracts,
Swap Contracts, Forward Foreign Currency Contracts and Foreign Currency Transactions (Notes 1, 3 and 4): | |
Net Realized Gain (Loss) From: | | | | |
Investment transactions in unaffiliated securities | | | (4,897,885) | |
Futures contracts | | | (3,943,995) | |
Swap contracts | | | 288,430 | |
Forward foreign currency contracts | | | (302,444) | |
Foreign currency transactions | | | (63,808) | |
Net Realized Loss | | | (8,919,702) | |
Change in Net Unrealized Appreciation (Depreciation) From: | | | | |
Investments in unaffiliated securities | | | 12,091,899 | |
Futures contracts | | | 1,182,720 | |
Swap contracts | | | 379,612 | |
Forward foreign currency contracts | | | (1,127,917) | |
Foreign currencies | | | 159,584 | |
Change in Net Unrealized Appreciation (Depreciation) | | | 12,685,898 | |
| Net Gain on Investments, Futures Contracts, Swap Contracts, Forward Foreign Currency Contracts and Foreign Currency Transactions | | | 3,766,196 | |
| Increase in Net Assets From Operations | | $ | 13,085,085 | |
See Notes to Financial Statements.
| | | | |
| BrandywineGLOBAL — Flexible Bond Fund 2023 Semi-Annual Report | | | | 21 |
Statements of changes in net assets
| | | | | | | | |
For the Six Months Ended June 30, 2023 (unaudited) and the Year Ended December 31, 2022 | | 2023 | | | 2022 | |
| | |
| Operations: | | | | | | | | |
Net investment income | | $ | 9,318,889 | | | $ | 7,094,440 | |
Net realized loss | | | (8,919,702) | | | | (19,134,475) | |
Change in net unrealized appreciation (depreciation) | | | 12,685,898 | | | | (16,814,893) | |
Increase (Decrease) in Net Assets From Operations | | | 13,085,085 | | | | (28,854,928) | |
| | |
| Distributions to Shareholders From (Notes 1 and 6): | | | | | | | | |
Total distributable earnings | | | (8,800,038) | | | | (6,076,005) | |
Return of capital | | | — | | | | (1,009,029) | |
Decrease in Net Assets From Distributions to Shareholders | | | (8,800,038) | | | | (7,085,034) | |
| | |
| Fund Share Transactions (Note 7): | | | | | | | | |
Net proceeds from sale of shares | | | 253,741,130 | | | | 228,348,447 | |
Reinvestment of distributions | | | 8,740,183 | | | | 7,043,732 | |
Cost of shares repurchased | | | (56,186,728) | | | | (218,460,258) | |
Increase in Net Assets From Fund Share Transactions | | | 206,294,585 | | | | 16,931,921 | |
Increase (Decrease) in Net Assets | | | 210,579,632 | | | | (19,008,041) | |
| | |
| Net Assets: | | | | | | | | |
Beginning of period | | | 223,800,674 | | | | 242,808,715 | |
End of period | | $ | 434,380,306 | | | $ | 223,800,674 | |
See Notes to Financial Statements.
| | | | |
22 | | | | BrandywineGLOBAL — Flexible Bond Fund 2023 Semi-Annual Report |
Financial highlights
| | | | | | | | | | | | | | | | | | | | | | | | |
For a share of each class of beneficial interest outstanding throughout each year ended December 31,
unless otherwise noted: | |
| Class A Shares1 | | 20232 | | | 2022 | | | 2021 | | | 2020 | | | 2019 | | | 2018 | |
| | | | | | |
| Net asset value, beginning of period | | | $9.41 | | | | $10.89 | | | | $11.09 | | | | $10.01 | | | | $9.59 | | | | $10.15 | |
| | | | | | |
| Income (loss) from operations: | | | | | | | | | | | | | | | | | | | | | | | | |
Net investment income | | | 0.24 | | | | 0.28 | | | | 0.27 | | | | 0.29 | | | | 0.25 | | | | 0.28 | |
Net realized and unrealized gain (loss) | | | 0.20 | | | | (1.48) | | | | (0.18) | | | | 1.18 | | | | 0.75 | | | | (0.52) | |
Total income (loss) from operations | | | 0.44 | | | | (1.20) | | | | 0.09 | | | | 1.47 | | | | 1.00 | | | | (0.24) | |
| | | | | | |
| Less distributions from: | | | | | | | | | | | | | | | | | | | | | | | | |
Net investment income | | | (0.20) | | | | (0.24) | | | | (0.27) | | | | (0.30) | | | | (0.46) | | | | (0.30) | |
Net realized gains | | | — | | | | — | | | | (0.02) | | | | (0.09) | | | | (0.12) | | | | (0.02) | |
Return of capital | | | — | | | | (0.04) | | | | — | | | | — | | | | — | | | | — | |
Total distributions | | | (0.20) | | | | (0.28) | | | | (0.29) | | | | (0.39) | | | | (0.58) | | | | (0.32) | |
| | | | | | |
| Net asset value, end of period | | | $9.65 | | | | $9.41 | | | | $10.89 | | | | $11.09 | | | | $10.01 | | | | $9.59 | |
Total return3 | | | 4.76 | % | | | (11.15) | % | | | 0.79 | % | | | 14.84 | % | | | 10.41 | % | | | (2.34) | % |
| | | | | | |
| Net assets, end of period (000s) | | | $37,888 | | | | $23,467 | | | | $20,721 | | | | $18,028 | | | | $165 | | | | $150 | |
| | | | | | |
| Ratios to average net assets: | | | | | | | | | | | | | | | | | | | | | | | | |
Gross expenses | | | 0.99 | %4 | | | 1.10 | % | | | 1.07 | % | | | 1.97 | % | | | 4.05 | % | | | 4.60 | % |
Net expenses5,6 | | | 0.98 | 4 | | | 1.04 | | | | 0.95 | | | | 0.96 | | | | 0.98 | | | | 0.95 | |
Net investment income | | | 5.06 | 4 | | | 2.81 | | | | 2.41 | | | | 2.73 | | | | 2.45 | | | | 2.87 | |
| | | | | | |
| Portfolio turnover rate | | | 76 | % | | | 122 | % | | | 55 | % | | | 104 | % | | | 356 | % | | | 192 | % |
| 1 | Per share amounts have been calculated using the average shares method. |
| 2 | For the six months ended June 30, 2023 (unaudited). |
| 3 | Performance figures, exclusive of sales charges, may reflect compensating balance arrangements, fee waivers and/or expense reimbursements. In the absence of compensating balance arrangements, fee waivers and/or expense reimbursements, the total return would have been lower. Past performance is no guarantee of future results. Total returns for periods of less than one year are not annualized. |
| 5 | Reflects fee waivers and/or expense reimbursements. |
| 6 | As a result of an expense limitation arrangement, the ratio of total annual fund operating expenses, other than interest, brokerage commissions, dividend and interest expense on securities sold short, taxes, extraordinary expenses and acquired fund fees and expenses, to average net assets of Class A shares did not exceed 1.10%. This expense limitation arrangement cannot be terminated prior to December 31, 2024 without the Board of Trustees’ consent. In addition, the manager has agreed to waive the Fund’s management fee to an extent sufficient to offset the net management fee payable in connection with any investment in an affiliated money market fund. |
See Notes to Financial Statements.
| | | | |
| BrandywineGLOBAL — Flexible Bond Fund 2023 Semi-Annual Report | | | | 23 |
Financial highlights (cont’d)
| | | | | | | | | | | | |
For a share of each class of beneficial interest outstanding throughout each year ended December 31,
unless otherwise noted: | |
| Class C Shares1 | | 20232 | | | 2022 | | | 20213 | |
| | | |
| Net asset value, beginning of period | | | $9.35 | | | | $10.88 | | | | $11.03 | |
| | | |
| Income (loss) from operations: | | | | | | | | | | | | |
Net investment income | | | 0.21 | | | | 0.28 | | | | 0.03 | |
Net realized and unrealized gain (loss) | | | 0.20 | | | | (1.56) | | | | (0.10) | |
Total income (loss) from operations | | | 0.41 | | | | (1.28) | | | | (0.07) | |
| | | |
| Less distributions from: | | | | | | | | | | | | |
Net investment income | | | (0.17) | | | | (0.18) | | | | (0.06) | |
Net realized gains | | | — | | | | — | | | | (0.02) | |
Return of capital | | | — | | | | (0.07) | | | | — | |
Total distributions | | | (0.17) | | | | (0.25) | | | | (0.08) | |
| | | |
| Net asset value, end of period | | | $9.59 | | | | $9.35 | | | | $10.88 | |
Total return4 | | | 4.40 | % | | | (11.79) | % | | | (0.68) | % |
| | | |
| Net assets, end of period (000s) | | | $2,606 | | | | $1,280 | | | | $43 | |
| | | |
| Ratios to average net assets: | | | | | | | | | | | | |
Gross expenses | | | 1.71 | %5 | | | 1.86 | %6 | | | 2.05 | %5 |
Net expenses7,8 | | | 1.70 | 5 | | | 1.80 | 6 | | | 1.85 | 5 |
Net investment income | | | 4.41 | 5 | | | 2.91 | | | | 1.07 | 5 |
| | | |
| Portfolio turnover rate | | | 76 | % | | | 122 | % | | | 55 | %9 |
| 1 | Per share amounts have been calculated using the average shares method. |
| 2 | For the six months ended June 30, 2023 (unaudited). |
| 3 | For the period September 30, 2021 (inception date) to December 31, 2021. |
| 4 | Performance figures, exclusive of CDSC, may reflect compensating balance arrangements, fee waivers and/or expense reimbursements. In the absence of compensating balance arrangements, fee waivers and/or expense reimbursements, the total return would have been lower. Past performance is no guarantee of future results. Total returns for periods of less than one year are not annualized. |
| 6 | Reflects recapture of expenses waived/reimbursed from prior fiscal years. |
| 7 | Reflects fee waivers and/or expense reimbursements. |
| 8 | As a result of an expense limitation arrangement, the ratio of total annual fund operating expenses, other than interest, brokerage commissions, dividend and interest expense on securities sold short, taxes, extraordinary expenses and acquired fund fees and expenses, to average net assets of Class C shares did not exceed 1.85%. This expense limitation arrangement cannot be terminated prior to December 31, 2024 without the Board of Trustees’ consent. In addition, the manager has agreed to waive the Fund’s management fee to an extent sufficient to offset the net management fee payable in connection with any investment in an affiliated money market fund. |
| 9 | For the year ended December 31, 2021. |
See Notes to Financial Statements.
| | | | |
24 | | | | BrandywineGLOBAL — Flexible Bond Fund 2023 Semi-Annual Report |
| | | | | | | | | | | | | | | | | | | | | | | | |
For a share of each class of beneficial interest outstanding throughout each year ended December 31,
unless otherwise noted: | |
| Class I Shares1 | | 20232 | | | 2022 | | | 2021 | | | 2020 | | | 2019 | | | 2018 | |
| | | | | | |
| Net asset value, beginning of period | | | $9.41 | | | | $10.90 | | | | $11.10 | | | | $10.01 | | | | $9.59 | | | | $10.15 | |
| | | | | | |
| Income (loss) from operations: | | | | | | | | | | | | | | | | | | | | | | | | |
Net investment income | | | 0.25 | | | | 0.31 | | | | 0.28 | | | | 0.36 | | | | 0.28 | | | | 0.31 | |
Net realized and unrealized gain (loss) | | | 0.21 | | | | (1.49) | | | | (0.16) | | | | 1.13 | | | | 0.75 | | | | (0.52) | |
Total income (loss) from operations | | | 0.46 | | | | (1.18) | | | | 0.12 | | | | 1.49 | | | | 1.03 | | | | (0.21) | |
| | | | | | |
| Less distributions from: | | | | | | | | | | | | | | | | | | | | | | | | |
Net investment income | | | (0.21) | | | | (0.26) | | | | (0.30) | | | | (0.31) | | | | (0.49) | | | | (0.33) | |
Net realized gains | | | — | | | | — | | | | (0.02) | | | | (0.09) | | | | (0.12) | | | | (0.02) | |
Return of capital | | | — | | | | (0.05) | | | | — | | | | — | | | | — | | | | — | |
Total distributions | | | (0.21) | | | | (0.31) | | | | (0.32) | | | | (0.40) | | | | (0.61) | | | | (0.35) | |
| | | | | | |
| Net asset value, end of period | | | $9.66 | | | | $9.41 | | | | $10.90 | | | | $11.10 | | | | $10.01 | | | | $9.59 | |
Total return3 | | | 4.87 | % | | | (10.86) | % | | | 1.05 | % | | | 15.00 | % | | | 10.84 | % | | | (2.07) | % |
| | | | | | |
| Net assets, end of period (000s) | | | $235,087 | | | | $150,839 | | | | $115,293 | | | | $22,371 | | | | $126 | | | | $111 | |
| | | | | | |
| Ratios to average net assets: | | | | | | | | | | | | | | | | | | | | | | | | |
Gross expenses | | | 0.75 | %4,5 | | | 0.85 | % | | | 0.82 | % | | | 1.69 | % | | | 3.75 | % | | | 4.34 | % |
Net expenses6,7 | | | 0.74 | 4,5 | | | 0.75 | | | | 0.70 | | | | 0.68 | | | | 0.68 | | | | 0.69 | |
Net investment income | | | 5.28 | 4 | | | 3.16 | | | | 2.55 | | | | 3.30 | | | | 2.75 | | | | 3.12 | |
| | | | | | |
| Portfolio turnover rate | | | 76 | % | | | 122 | % | | | 55 | % | | | 104 | % | | | 356 | % | | | 192 | % |
| 1 | Per share amounts have been calculated using the average shares method. |
| 2 | For the six months ended June 30, 2023 (unaudited). |
| 3 | Performance figures may reflect compensating balance arrangements, fee waivers and/or expense reimbursements. In the absence of compensating balance arrangements, fee waivers and/or expense reimbursements, the total return would have been lower. Past performance is no guarantee of future results. Total returns for periods of less than one year are not annualized. |
| 5 | Reflects recapture of expenses waived/reimbursed from prior fiscal years. |
| 6 | Reflects fee waivers and/or expense reimbursements. |
| 7 | As a result of an expense limitation arrangement, the ratio of total annual fund operating expenses, other than interest, brokerage commissions, dividend and interest expense on securities sold short, taxes, extraordinary expenses and acquired fund fees and expenses, to average net assets of Class I shares did not exceed 0.75%. This expense limitation arrangement cannot be terminated prior to December 31, 2024 without the Board of Trustees’ consent. In addition, the manager has agreed to waive the Fund’s management fee to an extent sufficient to offset the net management fee payable in connection with any investment in an affiliated money market fund. |
See Notes to Financial Statements.
| | | | |
| BrandywineGLOBAL — Flexible Bond Fund 2023 Semi-Annual Report | | | | 25 |
Financial highlights (cont’d)
| | | | | | | | | | | | | | | | | | | | | | | | |
For a share of each class of beneficial interest outstanding throughout each year ended December 31,
unless otherwise noted: | |
| Class IS Shares1 | | 20232 | | | 2022 | | | 2021 | | | 2020 | | | 2019 | | | 2018 | |
| | | | | | |
| Net asset value, beginning of period | | | $9.42 | | | | $10.91 | | | | $11.11 | | | | $10.02 | | | | $9.59 | | | | $10.15 | |
| | | | | | |
| Income (loss) from operations: | | | | | | | | | | | | | | | | | | | | | | | | |
Net investment income | | | 0.26 | | | | 0.30 | | | | 0.29 | | | | 0.32 | | | | 0.28 | | | | 0.32 | |
Net realized and unrealized gain (loss) | | | 0.20 | | | | (1.47) | | | | (0.17) | | | | 1.18 | | | | 0.76 | | | | (0.52) | |
Total income (loss) from operations | | | 0.46 | | | | (1.17) | | | | 0.12 | | | | 1.50 | | | | 1.04 | | | | (0.20) | |
| | | | | | |
| Less distributions from: | | | | | | | | | | | | | | | | | | | | | | | | |
Net investment income | | | (0.21) | | | | (0.28) | | | | (0.30) | | | | (0.32) | | | | (0.49) | | | | (0.34) | |
Net realized gains | | | — | | | | — | | | | (0.02) | | | | (0.09) | | | | (0.12) | | | | (0.02) | |
Return of capital | | | — | | | | (0.04) | | | | — | | | | — | | | | — | | | | — | |
Total distributions | | | (0.21) | | | | (0.32) | | | | (0.32) | | | | (0.41) | | | | (0.61) | | | | (0.36) | |
| | | | | | |
| Net asset value, end of period | | | $9.67 | | | | $9.42 | | | | $10.91 | | | | $11.11 | | | | $10.02 | | | | $9.59 | |
Total return3 | | | 4.91 | % | | | (10.77) | % | | | 1.09 | % | | | 15.12 | % | | | 10.87 | % | | | (2.03) | % |
| | | | | | |
| Net assets, end of period (000s) | | | $158,799 | | | | $48,214 | | | | $106,752 | | | | $27,676 | | | | $6,140 | | | | $5,540 | |
| | | | | | |
| Ratios to average net assets: | | | | | | | | | | | | | | | | | | | | | | | | |
Gross expenses | | | 0.66 | %4 | | | 0.71 | % | | | 0.77 | % | | | 1.66 | % | | | 3.73 | %5 | | | 4.33 | %5 |
Net expenses6,7 | | | 0.65 | 4 | | | 0.65 | | | | 0.65 | | | | 0.65 | | | | 0.65 | 5 | | | 0.65 | 5 |
Net investment income | | | 5.45 | 4 | | | 2.96 | | | | 2.65 | | | | 2.99 | | | | 2.78 | | | | 3.18 | |
| | | | | | |
| Portfolio turnover rate | | | 76 | % | | | 122 | % | | | 55 | % | | | 104 | % | | | 356 | % | | | 192 | % |
| 1 | Per share amounts have been calculated using the average shares method. |
| 2 | For the six months ended June 30, 2023 (unaudited). |
| 3 | Performance figures may reflect compensating balance arrangements, fee waivers and/or expense reimbursements. In the absence of compensating balance arrangements, fee waivers and/or expense reimbursements, the total return would have been lower. Past performance is no guarantee of future results. Total returns for periods of less than one year are not annualized. |
| 5 | Reflects recapture of expenses waived/reimbursed from prior fiscal years. |
| 6 | Reflects fee waivers and/or expense reimbursements. |
| 7 | As a result of an expense limitation arrangement, the ratio of total annual fund operating expenses, other than interest, brokerage commissions, dividend and interest expense on securities sold short, taxes, extraordinary expenses and acquired fund fees and expenses, to average net assets of Class IS shares did not exceed 0.65%. In addition, the ratio of total annual fund operating expenses for Class IS shares did not exceed the ratio of total annual fund operating expenses for Class I shares. These expense limitation arrangements cannot be terminated prior to December 31, 2024 without the Board of Trustees’ consent. In addition, the manager has agreed to waive the Fund’s management fee to an extent sufficient to offset the net management fee payable in connection with any investment in an affiliated money market fund. |
See Notes to Financial Statements.
| | | | |
26 | | | | BrandywineGLOBAL — Flexible Bond Fund 2023 Semi-Annual Report |
Notes to financial statements (unaudited)
1. Organization and significant accounting policies
BrandywineGLOBAL — Flexible Bond Fund (the “Fund”) is a separate non-diversified investment series of Legg Mason Global Asset Management Trust (the “Trust”). The Trust, a Maryland statutory trust, is registered under the Investment Company Act of 1940, as amended (the “1940 Act”), as an open-end management investment company.
The Fund follows the accounting and reporting guidance in Financial Accounting Standards Board (“FASB”) Accounting Standards Codification Topic 946, Financial Services — Investment Companies (“ASC 946”). The following are significant accounting policies consistently followed by the Fund and are in conformity with U.S. generally accepted accounting principles (“GAAP”), including, but not limited to, ASC 946. Estimates and assumptions are required to be made regarding assets, liabilities and changes in net assets resulting from operations when financial statements are prepared. Changes in the economic environment, financial markets and any other parameters used in determining these estimates could cause actual results to differ. Subsequent events have been evaluated through the date the financial statements were issued.
(a) Investment valuation. The valuations for fixed income securities (which may include, but are not limited to, corporate, government, municipal, mortgage-backed, collateralized mortgage obligations and asset-backed securities) and certain derivative instruments are typically the prices supplied by independent third party pricing services, which may use market prices or broker/dealer quotations or a variety of valuation techniques and methodologies. The independent third party pricing services typically use inputs that are observable such as issuer details, interest rates, yield curves, prepayment speeds, credit risks/spreads, default rates and quoted prices for similar securities. Investments in open-end funds are valued at the closing net asset value per share of each fund on the day of valuation. Futures contracts are valued daily at the settlement price established by the board of trade or exchange on which they are traded. Equity securities for which market quotations are available are valued at the last reported sales price or official closing price on the primary market or exchange on which they trade. When the Fund holds securities or other assets that are denominated in a foreign currency, the Fund will normally use the currency exchange rates as of 4:00 p.m. (Eastern Time). If independent third party pricing services are unable to supply prices for a portfolio investment, or if the prices supplied are deemed by the manager to be unreliable, the market price may be determined by the manager using quotations from one or more broker/dealers or at the transaction price if the security has recently been purchased and no value has yet been obtained from a pricing service or pricing broker. When reliable prices are not readily available, such as when the value of a security has been significantly affected by events after the close of the exchange or market on which the security is principally traded, but before the Fund calculates its net asset value, the Fund values these securities as determined in accordance with procedures approved by the Fund’s Board of Trustees.
Pursuant to policies adopted by the Board of Trustees, the Fund’s manager has been designated as the valuation designee and is responsible for the oversight of the daily valuation process. The Fund’s manager is assisted by the Global Fund Valuation Committee (the “Valuation Committee”). The Valuation Committee is responsible for making fair value determinations, evaluating the effectiveness of the Fund’s pricing policies, and reporting to the Fund’s manager and the Board of Trustees. When determining the reliability of third party pricing information for investments owned by the Fund, the Valuation Committee,
| | | | |
| BrandywineGLOBAL — Flexible Bond Fund 2023 Semi-Annual Report | | | | 27 |
Notes to financial statements (unaudited) (cont’d)
among other things, conducts due diligence reviews of pricing vendors, monitors the daily change in prices and reviews transactions among market participants.
The Valuation Committee will consider pricing methodologies it deems relevant and appropriate when making fair value determinations. Examples of possible methodologies include, but are not limited to, multiple of earnings; discount from market of a similar freely traded security; discounted cash-flow analysis; book value or a multiple thereof; risk premium/yield analysis; yield to maturity; and/or fundamental investment analysis. The Valuation Committee will also consider factors it deems relevant and appropriate in light of the facts and circumstances. Examples of possible factors include, but are not limited to, the type of security; the issuer’s financial statements; the purchase price of the security; the discount from market value of unrestricted securities of the same class at the time of purchase; analysts’ research and observations from financial institutions; information regarding any transactions or offers with respect to the security; the existence of merger proposals or tender offers affecting the security; the price and extent of public trading in similar securities of the issuer or comparable companies; and the existence of a shelf registration for restricted securities.
For each portfolio security that has been fair valued pursuant to the policies adopted by the Board of Trustees, the fair value price is compared against the last available and next available market quotations. The Valuation Committee reviews the results of such back testing monthly and fair valuation occurrences are reported to the Board of Trustees quarterly.
The Fund uses valuation techniques to measure fair value that are consistent with the market approach and/or income approach, depending on the type of security and the particular circumstance. The market approach uses prices and other relevant information generated by market transactions involving identical or comparable securities. The income approach uses valuation techniques to discount estimated future cash flows to present value.
GAAP establishes a disclosure hierarchy that categorizes the inputs to valuation techniques used to value assets and liabilities at measurement date. These inputs are summarized in the three broad levels listed below:
| • | | Level 1 — unadjusted quoted prices in active markets for identical investments |
| • | | Level 2 — other significant observable inputs (including quoted prices for similar investments, interest rates, prepayment speeds, credit risk, etc.) |
| • | | Level 3 — significant unobservable inputs (including the Fund’s own assumptions in determining the fair value of investments) |
The inputs or methodologies used to value securities are not necessarily an indication of the risk associated with investing in those securities.
| | | | |
28 | | | | BrandywineGLOBAL — Flexible Bond Fund 2023 Semi-Annual Report |
The following is a summary of the inputs used in valuing the Fund’s assets and liabilities carried at fair value:
| | | | | | | | | | | | | | | | |
| ASSETS | |
| Description | | Quoted Prices
(Level 1) | | | Other Significant
Observable Inputs
(Level 2) | | | Significant
Unobservable
Inputs
(Level 3) | | | Total | |
| Long-Term Investments†: | | | | | | | | | | | | | | | | |
Corporate Bonds & Notes | | | — | | | $ | 228,275,079 | | | | — | | | $ | 228,275,079 | |
Sovereign Bonds | | | — | | | | 74,883,712 | | | | — | | | | 74,883,712 | |
U.S. Government & Agency Obligations | | | — | | | | 57,303,868 | | | | — | | | | 57,303,868 | |
Collateralized Mortgage Obligations | | | — | | | | 26,287,371 | | | | — | | | | 26,287,371 | |
Mortgage-Backed Securities | | | — | | | | 18,748,108 | | | | — | | | | 18,748,108 | |
Senior Loans: | | | | | | | | | | | | | | | | |
Consumer Staples | | | — | | | | — | | | $ | 1,700,000 | | | | 1,700,000 | |
Other Senior Loans | | | — | | | | 2,139,521 | | | | — | | | | 2,139,521 | |
Convertible Bonds & Notes | | | — | | | | 2,023,863 | | | | — | | | | 2,023,863 | |
Asset-Backed Securities | | | — | | | | 1,636,934 | | | | — | | | | 1,636,934 | |
| Total Long-Term Investments | | | — | | | | 411,298,456 | | | | 1,700,000 | | | | 412,998,456 | |
| Short-Term Investments† | | $ | 15,674,324 | | | | — | | | | — | | | | 15,674,324 | |
| Total Investments | | $ | 15,674,324 | | | $ | 411,298,456 | | | $ | 1,700,000 | | | $ | 428,672,780 | |
| Other Financial Instruments: | | | | | | | | | | | | | | | | |
Futures Contracts†† | | $ | 610,497 | | | | — | | | | — | | | $ | 610,497 | |
Forward Foreign Currency Contracts†† | | | — | | | $ | 2,471,269 | | | | — | | | | 2,471,269 | |
Centrally Cleared Credit Default Swaps on Credit Indices — Sell Protection†† | | | — | | | | 218,306 | | | | — | | | | 218,306 | |
| Total Other Financial Instruments | | $ | 610,497 | | | $ | 2,689,575 | | | | — | | | $ | 3,300,072 | |
| Total | | $ | 16,284,821 | | | $ | 413,988,031 | | | $ | 1,700,000 | | | $ | 431,972,852 | |
|
| LIABILITIES | |
| Description | | Quoted Prices
(Level 1) | | | Other Significant
Observable Inputs
(Level 2) | | | Significant
Unobservable
Inputs
(Level 3) | | | Total | |
| Other Financial Instruments: | | | | | | | | | | | | | | | | |
Futures Contracts†† | | $ | 560,464 | | | | — | | | | — | | | $ | 560,464 | |
Forward Foreign Currency Contracts†† | | | — | | | $ | 2,763,855 | | | | — | | | | 2,763,855 | |
| Total | | $ | 560,464 | | | $ | 2,763,855 | | | | — | | | $ | 3,324,319 | |
| † | See Schedule of Investments for additional detailed categorizations. |
| †† | Reflects the unrealized appreciation (depreciation) of the instruments. |
| | | | |
| BrandywineGLOBAL — Flexible Bond Fund 2023 Semi-Annual Report | | | | 29 |
Notes to financial statements (unaudited) (cont’d)
(b) Futures contracts. The Fund uses futures contracts generally to gain exposure to, or hedge against, changes in interest rates or gain exposure to, or hedge against, changes in certain asset classes. A futures contract represents a commitment for the future purchase or sale of an asset at a specified price on a specified date.
Upon entering into a futures contract, the Fund is required to deposit cash or securities with a broker in an amount equal to a certain percentage of the contract amount. This is known as the ‘‘initial margin’’ and subsequent payments (‘‘variation margin’’) are made or received by the Fund each day, depending on the daily fluctuation in the value of the contract. For certain futures, including foreign denominated futures, variation margin is not settled daily, but is recorded as a net variation margin payable or receivable. The daily changes in contract value are recorded as unrealized appreciation or depreciation in the Statement of Operations and the Fund recognizes a realized gain or loss when the contract is closed.
Futures contracts involve, to varying degrees, risk of loss in excess of the amounts reflected in the financial statements. In addition, there is the risk that the Fund may not be able to enter into a closing transaction because of an illiquid secondary market.
(c) Forward foreign currency contracts. The Fund enters into a forward foreign currency contract to hedge exposure of bond positions or in an attempt to increase the Fund’s return. A forward foreign currency contract is an agreement between two parties to buy and sell a currency at a set price with delivery and settlement at a future date. The contract is marked-to-market daily and the change in value is recorded by the Fund as an unrealized gain or loss. When a forward foreign currency contract is closed, through either delivery or offset by entering into another forward foreign currency contract, the Fund recognizes a realized gain or loss equal to the difference between the value of the contract at the time it was opened and the value of the contract at the time it is closed.
Non-deliverable forward foreign currency exchange contracts are settled with the counterparty in cash without the delivery of foreign currency.
Forward foreign currency contracts involve elements of market risk in excess of the amounts reflected on the Statement of Assets and Liabilities. The Fund bears the risk of an unfavorable change in the foreign exchange rate underlying the forward foreign currency contract. Risks may also arise upon entering into these contracts from the potential inability of the counterparties to meet the terms of their contracts.
(d) Swap agreements. The Fund invests in swaps for the purpose of managing its exposure to interest rate, credit or market risk, or for other purposes. The use of swaps involves risks that are different from those associated with other portfolio transactions. Swap agreements are privately negotiated in the over-the-counter market and may be entered into as a bilateral contract (“OTC Swaps”) or centrally cleared (“Centrally Cleared Swaps”). Unlike Centrally Cleared Swaps, the Fund has credit exposure to the counterparties of OTC Swaps.
In a Centrally Cleared Swap, immediately following execution of the swap, the swap agreement is submitted to a clearinghouse or central counterparty (the “CCP”) and the CCP becomes the ultimate counterparty of the swap agreement. The Fund is required to interface with the CCP through a broker, acting in an agency capacity. All payments are
| | | | |
30 | | | | BrandywineGLOBAL — Flexible Bond Fund 2023 Semi-Annual Report |
settled with the CCP through the broker. Upon entering into a Centrally Cleared Swap, the Fund is required to deposit initial margin with the broker in the form of cash or securities.
Swap contracts are marked-to-market daily and changes in value are recorded as unrealized appreciation (depreciation). The daily change in valuation of Centrally Cleared Swaps, if any, is recorded as a net receivable or payable for variation margin on the Statement of Assets and Liabilities. Gains or losses are realized upon termination of the swap agreement. Collateral, in the form of restricted cash or securities, may be required to be held in segregated accounts with the Fund’s custodian in compliance with the terms of the swap contracts. Securities posted as collateral for swap contracts are identified in the
Schedule of Investments and restricted cash, if any, is identified on the Statement of Assets and Liabilities. Risks may exceed amounts recorded in the Statement of Assets and Liabilities. These risks include changes in the returns of the underlying instruments, failure of the counterparties to perform under the contracts’ terms, and the possible lack of liquidity with respect to the swap agreements.
OTC Swap payments received or made at the beginning of the measurement period are reflected as a premium or deposit, respectively, on the Statement of Assets and Liabilities. These upfront payments are amortized over the life of the swap and are recognized as realized gain or loss in the Statement of Operations. Net periodic payments received or paid by the Fund are recognized as a realized gain or loss in the Statement of Operations.
The Fund’s maximum exposure in the event of a defined credit event on a credit default swap to sell protection is the notional amount. As of June 30, 2023, the total notional value of all credit default swaps to sell protection was EUR 5,445,000 and $34,866,200. These amounts would be offset by the value of the swap’s reference entity, upfront premiums received on the swap and any amounts received from the settlement of a credit default swap where the Fund bought protection for the same referenced security/entity.
For average notional amounts of swaps held during the six months ended June 30, 2023, see Note 4.
Credit default swaps
The Fund enters into credit default swap (“CDS”) contracts for investment purposes, to manage its credit risk or to add leverage. CDS agreements involve one party making a stream of payments to another party in exchange for the right to receive a specified return in the event of a default by a third party, typically corporate or sovereign issuers, on a specified obligation, or in the event of a write-down, principal shortfall, interest shortfall or default of all or part of the referenced entities comprising a credit index. The Fund may use a CDS to provide protection against defaults of the issuers (i.e., to reduce risk where the Fund has exposure to an issuer) or to take an active long or short position with respect to the likelihood of a particular issuer’s default. As a seller of protection, the Fund generally receives an upfront payment or a stream of payments throughout the term of the swap provided that there is no credit event. If the Fund is a seller of protection and a credit event occurs, as defined under the terms of that particular swap agreement, the maximum potential amount of future payments (undiscounted) that the Fund could be required to make under a CDS agreement would be an amount equal to the notional amount of the agreement. These amounts of potential payments will be partially offset by any recovery of values from the respective referenced obligations. As a seller of protection, the Fund
| | | | |
| BrandywineGLOBAL — Flexible Bond Fund 2023 Semi-Annual Report | | | | 31 |
Notes to financial statements (unaudited) (cont’d)
effectively adds leverage to its portfolio because, in addition to its total net assets, the Fund is subject to investment exposure on the notional amount of the swap. As a buyer of protection, the Fund generally receives an amount up to the notional value of the swap if a credit event occurs.
Implied spreads are the theoretical prices a lender receives for credit default protection. When spreads rise, market perceived credit risk rises and when spreads fall, market perceived credit risk falls. The implied credit spread of a particular referenced entity reflects the cost of buying/selling protection and may include upfront payments required to enter into the agreement. Wider credit spreads and decreasing market values, when compared to the notional amount of the swap, represent a deterioration of the referenced entity’s credit soundness and a greater likelihood or risk of default or other credit event occurring as defined under the terms of the agreement. Credit spreads utilized in determining the period end market value of CDS agreements on corporate or sovereign issues are disclosed in the Schedule of Investments and serve as an indicator of the current status of the payment/ performance risk and represent the likelihood or risk of default for credit derivatives. For CDS agreements on asset-backed securities and credit indices, the quoted market prices and resulting values, particularly in relation to the notional amount of the contract as well as the annual payment rate, serve as an indication of the current status of the payment/ performance risk.
The Fund’s maximum risk of loss from counterparty risk, as the protection buyer, is the fair value of the contract (this risk is mitigated by the posting of collateral by the counterparty to the Fund to cover the Fund’s exposure to the counterparty). As the protection seller, the Fund’s maximum risk is the notional amount of the contract. CDS are considered to have credit risk-related contingent features since they require payment by the protection seller to the protection buyer upon the occurrence of a defined credit event.
Entering into a CDS agreement involves, to varying degrees, elements of credit, market and documentation risk in excess of the related amounts recognized on the Statement of Assets and Liabilities. Such risks involve the possibility that there will be no liquid market for these agreements, that the counterparty to the agreement may default on its obligation to perform or disagree as to the meaning of the contractual terms in the agreement, and that there will be unfavorable changes in net interest rates.
(e) Foreign currency translation. Investment securities and other assets and liabilities denominated in foreign currencies are translated into U.S. dollar amounts based upon prevailing exchange rates on the date of valuation. Purchases and sales of investment securities and income and expense items denominated in foreign currencies are translated into U.S. dollar amounts based upon prevailing exchange rates on the respective dates of such transactions.
The Fund does not isolate that portion of the results of operations resulting from fluctuations in foreign exchange rates on investments from the fluctuations arising from changes in market prices of securities held. Such fluctuations are included with the net realized and unrealized gain or loss on investments.
Net realized foreign exchange gains or losses arise from sales of foreign currencies, including gains and losses on forward foreign currency contracts, currency gains or losses
| | | | |
32 | | | | BrandywineGLOBAL — Flexible Bond Fund 2023 Semi-Annual Report |
realized between the trade and settlement dates on securities transactions, and the difference between the amounts of dividends, interest, and foreign withholding taxes recorded on the Fund’s books and the U.S. dollar equivalent of the amounts actually received or paid. Net unrealized foreign exchange gains and losses arise from changes in the values of assets and liabilities, other than investments in securities, on the date of valuation, resulting from changes in exchange rates.
Foreign security and currency transactions may involve certain considerations and risks not typically associated with those of U.S. dollar denominated transactions as a result of, among other factors, the possibility of lower levels of governmental supervision and regulation of foreign securities markets and the possibility of political or economic instability.
(f) Credit and market risk. The Fund invests in high-yield and emerging market instruments that are subject to certain credit and market risks. The yields of high-yield and emerging market debt obligations reflect, among other things, perceived credit and market risks. The Fund’s investments in securities rated below investment grade typically involve risks not associated with higher rated securities including, among others, greater risk related to timely and ultimate payment of interest and principal, greater market price volatility and less liquid secondary market trading. The consequences of political, social,
economic or diplomatic changes may have disruptive effects on the market prices of investments held by the Fund. The Fund’s investments in non-U.S. dollar denominated securities may also result in foreign currency losses caused by devaluations and exchange rate fluctuations.
Investments in securities that are collateralized by real estate mortgages are subject to certain credit and liquidity risks. When market conditions result in an increase in default rates of the underlying mortgages and the foreclosure values of underlying real estate properties are materially below the outstanding amount of these underlying mortgages, collection of the full amount of accrued interest and principal on these investments may be doubtful. Such market conditions may significantly impair the value and liquidity of these investments and may result in a lack of correlation between their credit ratings and values.
(g) Foreign investment risks. The Fund’s investments in foreign securities may involve risks not present in domestic investments. Since securities may be denominated in foreign currencies, may require settlement in foreign currencies or may pay interest or dividends in foreign currencies, changes in the relationship of these foreign currencies to the U.S. dollar can significantly affect the value of the investments and earnings of the Fund. Foreign investments may also subject the Fund to foreign government exchange restrictions, expropriation, taxation or other political, social or economic developments, all of which affect the market and/or credit risk of the investments.
(h) Counterparty risk and credit-risk-related contingent features of derivative instruments. The Fund may invest in certain securities or engage in other transactions where the Fund is exposed to counterparty credit risk in addition to broader market risks. The Fund may invest in securities of issuers, which may also be considered counterparties as trading partners in other transactions. This may increase the risk of loss in the event of default or bankruptcy by the counterparty or if the counterparty otherwise fails to meet its contractual obligations. The Fund’s subadviser attempts to mitigate counterparty risk by (i)
| | | | |
| BrandywineGLOBAL — Flexible Bond Fund 2023 Semi-Annual Report | | | | 33 |
Notes to financial statements (unaudited) (cont’d)
periodically assessing the creditworthiness of its trading partners, (ii) monitoring and/or limiting the amount of its net exposure to each individual counterparty based on its assessment and (iii) requiring collateral from the counterparty for certain transactions. Market events and changes in overall economic conditions may impact the assessment of such counterparty risk by the subadviser. In addition, declines in the values of underlying collateral received may expose the Fund to increased risk of loss.
With exchange traded and centrally cleared derivatives, there is less counterparty risk to the Fund since the exchange or clearinghouse, as counterparty to such instruments, guarantees against a possible default. The clearinghouse stands between the buyer and the seller of the contract; therefore, the credit risk is limited to failure of the clearinghouse. While offset rights may exist under applicable law, the Fund does not have a contractual right of offset against a clearing broker or clearinghouse in the event of a default of the clearing broker or clearinghouse.
The Fund has entered into master agreements, such as an International Swaps and Derivatives Association, Inc. Master Agreement (“ISDA Master Agreement”) or similar agreement, with certain of its derivative counterparties that govern over-the-counter (“OTC”) derivatives and provide for general obligations, representations, agreements, collateral posting terms, netting provisions in the event of default or termination and credit related contingent features. The credit related contingent features include, but are not limited to, a percentage decrease in the Fund’s net assets or net asset value per share over a specified period of time. If these credit related contingent features were triggered, the derivatives counterparty could terminate the positions and demand payment or require additional collateral.
Under an ISDA Master Agreement, the Fund may, under certain circumstances, offset with the counterparty certain derivative financial instruments’ payables and/or receivables with collateral held and/or posted and create one single net payment. However, absent an event of default by the counterparty or a termination of the agreement, the terms of the ISDA Master Agreements do not result in an offset of reported amounts of financial assets and financial liabilities in the Statement of Assets and Liabilities across transactions between the Fund and the applicable counterparty. The enforceability of the right to offset may vary by jurisdiction.
Collateral requirements differ by type of derivative. Collateral or margin requirements are set by the broker or exchange clearinghouse for exchange traded derivatives while collateral terms are contract specific for OTC traded derivatives. Cash collateral that has been pledged to cover obligations of the Fund under derivative contracts, if any, will be reported separately in the Statement of Assets and Liabilities. Securities pledged as collateral, if any, for the same purpose are noted in the Schedule of Investments.
As of June 30, 2023, the Fund held forward foreign currency contracts with credit related contingent features which had a liability position of $2,763,855. If a contingent feature in the master agreements would have been triggered, the Fund would have been required to pay this amount to its derivatives counterparties.
| | | | |
34 | | | | BrandywineGLOBAL — Flexible Bond Fund 2023 Semi-Annual Report |
At June 30, 2023, the fund held cash collateral from JPMorgan Chase & Co. and HSBC Securities Inc. in the amounts of $180,000 and $90,000, respectively. These amounts could be used to reduce the Fund’s exposure to the counterparty in the event of default.
(i) Security transactions and investment income. Security transactions are accounted for on a trade date basis. Interest income (including interest income from payment-in-kind securities), adjusted for amortization of premium and accretion of discount, is recorded on the accrual basis. Paydown gains and losses on mortgage- and asset-backed securities are recorded as adjustments to interest income. Dividend income is recorded on the ex-dividend date for dividends received in cash and/or securities. Foreign dividend income is recorded on the ex-dividend date or as soon as practicable after the Fund determines the existence of a dividend declaration after exercising reasonable due diligence. The cost of investments sold is determined by use of the specific identification method. To the extent any issuer defaults or a credit event occurs that impacts the issuer, the Fund may halt any additional interest income accruals and consider the realizability of interest accrued up to the date of default or credit event.
(j) Distributions to shareholders. Distributions from net investment income of the Fund, if any, are declared and paid on a quarterly basis. Distributions of net realized gains, if any, are declared at least annually. Distributions to shareholders of the Fund are recorded on the ex-dividend date and are determined in accordance with income tax regulations, which may differ from GAAP.
(k) Share class accounting. Investment income, common expenses and realized/ unrealized gains (losses) on investments are allocated to the various classes of the Fund on the basis of daily net assets of each class. Fees relating to a specific class are charged directly to that share class.
(l) Compensating balance arrangements. The Fund has an arrangement with its custodian bank whereby a portion of the custodian’s fees is paid indirectly by credits earned on the Fund’s cash on deposit with the bank.
(m) Federal and other taxes. It is the Fund’s policy to comply with the federal income and excise tax requirements of the Internal Revenue Code of 1986 (the “Code”), as amended, applicable to regulated investment companies. Accordingly, the Fund intends to distribute its taxable income and net realized gains, if any, to shareholders in accordance with timing requirements imposed by the Code. Therefore, no federal or state income tax provision is required in the Fund’s financial statements.
Management has analyzed the Fund’s tax positions taken on income tax returns for all open tax years and has concluded that as of December 31, 2022, no provision for income tax is required in the Fund’s financial statements. The Fund’s federal and state income and federal excise tax returns for tax years for which the applicable statutes of limitations have not expired are subject to examination by the Internal Revenue Service and state departments of revenue.
Under the applicable foreign tax laws, a withholding tax may be imposed on interest, dividends and capital gains at various rates. Realized gains upon disposition of securities issued in or by certain foreign countries are subject to capital gains tax imposed by those countries.
| | | | |
| BrandywineGLOBAL — Flexible Bond Fund 2023 Semi-Annual Report | | | | 35 |
Notes to financial statements (unaudited) (cont’d)
(n) Reclassification. GAAP requires that certain components of net assets be reclassified to reflect permanent differences between financial and tax reporting. These reclassifications have no effect on net assets or net asset value per share.
2. Investment management agreement and other transactions with affiliates
Legg Mason Partners Fund Advisor, LLC (“LMPFA”) is the Fund’s investment manager and Brandywine Global Investment Management, LLC (“Brandywine Global”) is the Fund’s subadviser. LMPFA and Brandywine Global are indirect, wholly-owned subsidiaries of Franklin Resources, Inc. (“Franklin Resources”).
LMPFA provides administrative and certain oversight services to the Fund. The Fund pays an investment management fee, calculated daily and paid monthly, at an annual rate of 0.55% of the Fund’s average daily net assets. LMPFA has delegated to Brandywine Global the day-to-day portfolio management of the Fund. For its services, LMPFA pays Brandywine Global a fee monthly, at an annual rate equal to 90% of the net management fee it receives from the Fund.
As a result of expense limitation arrangements between the Fund and LMPFA, the ratio of total annual fund operating expenses, other than interest, brokerage commissions, dividend and interest expense on securities sold short, taxes, extraordinary expenses and acquired fund fees and expenses, to average net assets of Class A, Class C, Class I and Class IS shares did not exceed 1.10%, 1.85%, 0.75% and 0.65%, respectively. In addition, the ratio of total annual fund operating expenses for Class IS shares did not exceed the ratio of total annual fund operating expenses for Class I shares. These expense limitation arrangements cannot be terminated prior to December 31, 2024 without the Board of Trustees’ consent. In addition, the manager has agreed to waive the Fund’s management fee to an extent sufficient to offset the net management fee payable in connection with any investment in an affiliated money market fund (the “affiliated money market fund waiver”). The affiliated money market fund waiver is not subject to the recapture provision discussed below.
During the six months ended June 30, 2023, fees waived and/or expenses reimbursed amounted to $18,290, which included an affiliated money market fund waiver of $9,145.
LMPFA is permitted to recapture amounts waived and/or reimbursed to a class within three years after the fiscal year in which LMPFA earned the fee or incurred the expense if the class’ total annual fund operating expenses have fallen to a level below the expense limitation (“expense cap”) in effect at the time the fees were earned or the expenses incurred. In no case will LMPFA recapture any amount that would result, on any particular business day of the Fund, in the class’ total annual fund operating expenses exceeding the expense cap or any other lower limit then in effect.
| | | | |
36 | | | | BrandywineGLOBAL — Flexible Bond Fund 2023 Semi-Annual Report |
Pursuant to these arrangements, at June 30, 2023, the Fund had remaining fee waivers and/or expense reimbursements subject to recapture by LMPFA and respective dates of expiration as follows:
| | | | | | | | | | | | | | | | |
| | | Class A | | | Class C | | | Class I | | | Class IS | |
| Expires December 31, 2023 | | $ | 72,723 | | | | — | | | $ | 39,508 | | | $ | 89,643 | |
| Expires December 31, 2024 | | | 24,266 | | | $ | 7 | | | | 65,710 | | | | 51,105 | |
| Expires December 31, 2025 | | | 15,712 | | | | 315 | | | | 135,216 | | | | 43,131 | |
| Expires December 31, 2026 | | | 718 | | | | 44 | | | | 4,681 | | | | 3,702 | |
| Total fee waivers/expense reimbursements subject to recapture | | $ | 113,419 | | | $ | 366 | | | $ | 245,115 | | | $ | 187,581 | |
For the six months ended June 30, 2023, fee waivers and/or expense reimbursements recaptured by LMPFA, if any, were as follows:
| | | | |
| | | Class I | |
| LMPFA recaptured | | $ | 7,991 | |
Franklin Templeton Investor Services, LLC (“Investor Services”) serves as the Fund’s shareholder servicing agent and acts as the Fund’s transfer agent and dividend-paying agent. Investor Services is an indirect, wholly-owned subsidiary of Franklin Resources. Franklin Distributors, LLC (“Franklin Distributors”) serves as the Fund’s sole and exclusive distributor. Franklin Distributors is an indirect, wholly-owned broker-dealer subsidiary of Franklin Resources.
There is a maximum initial sales charge of 3.75% for Class A shares. There is a contingent deferred sales charge (“CDSC”) of 1.00% on Class C shares, which applies if redemption occurs within 12 months from purchase payment. In certain cases, Class A shares have a 1.00% CDSC, which applies if redemption occurs within 18 months from purchase payment. This CDSC only applies to those purchases of Class A shares, which, when combined with current holdings of other shares of funds sold by Franklin Distributors, equal or exceed $500,000 in the aggregate. These purchases do not incur an initial sales charge.
For the six months ended June 30, 2023, sales charges retained by and CDSCs paid to Franklin Distributors and its affiliates, if any, were as follows:
| | | | |
| | | Class A | |
| Sales charges | | $ | 7,256 | |
| CDSCs | | | 325 | |
All officers and one Trustee of the Trust are employees of Franklin Resources or its affiliates and do not receive compensation from the Trust.
| | | | |
| BrandywineGLOBAL — Flexible Bond Fund 2023 Semi-Annual Report | | | | 37 |
Notes to financial statements (unaudited) (cont’d)
3. Investments
During the six months ended June 30, 2023, the aggregate cost of purchases and proceeds from sales of investments (excluding short-term investments) and U.S. Government & Agency Obligations were as follows:
| | | | | | | | |
| | | Investments | | | U.S. Government &
Agency Obligations | |
| Purchases | | $ | 206,225,544 | | | $ | 236,098,888 | |
| Sales | | | 70,938,777 | | | | 175,548,299 | |
At June 30, 2023, the aggregate cost of investments and the aggregate gross unrealized appreciation and depreciation of investments for federal income tax purposes were substantially as follows:
| | | | | | | | | | | | | | | | |
| | | Cost/Premiums
Paid (Received) | | | Gross
Unrealized
Appreciation | | | Gross
Unrealized
Depreciation | | | Net
Unrealized
Appreciation
(Depreciation) | |
| Securities | | $ | 433,198,050 | | | $ | 11,115,241 | | | $ | (15,640,511) | | | $ | (4,525,270) | |
| Futures contracts | | | — | | | | 610,497 | | | | (560,464) | | | | 50,033 | |
| Forward foreign currency contracts | | | — | | | | 2,471,269 | | | | (2,763,855) | | | | (292,586) | |
| Swap contracts | | | 405,467 | | | | 218,306 | | | | — | | | | 218,306 | |
4. Derivative instruments and hedging activities
Below is a table, grouped by derivative type, that provides information about the fair value and the location of derivatives within the Statement of Assets and Liabilities at June 30, 2023.
| | | | | | | | | | | | | | | | |
| ASSET DERIVATIVES1 | |
| | | Interest
Rate Risk | | | Foreign
Exchange Risk | | | Credit
Risk | | | Total | |
| Futures contracts2 | | $ | 610,497 | | | | — | | | | — | | | $ | 610,497 | |
| Forward foreign currency contracts | | | — | | | $ | 2,471,269 | | | | — | | | | 2,471,269 | |
| Centrally cleared swap contracts3 | | | — | | | | — | | | $ | 218,306 | | | | 218,306 | |
| Total | | $ | 610,497 | | | $ | 2,471,269 | | | $ | 218,306 | | | $ | 3,300,072 | |
|
| LIABILITY DERIVATIVES1 | |
| | | | | | Interest
Rate Risk | | | Foreign
Exchange Risk | | | Total | |
| Futures contracts2 | | | | | | $ | 560,464 | | | | — | | | $ | 560,464 | |
| Forward foreign currency contracts | | | | | | | — | | | $ | 2,763,855 | | | | 2,763,855 | |
| Total | | | | | | $ | 560,464 | | | $ | 2,763,855 | | | $ | 3,324,319 | |
| | | | |
38 | | | | BrandywineGLOBAL — Flexible Bond Fund 2023 Semi-Annual Report |
| 1 | Generally, the balance sheet location for asset derivatives is receivables/net unrealized appreciation and for liability derivatives is payables/net unrealized depreciation. |
| 2 | Includes cumulative unrealized appreciation (depreciation) of futures contracts as reported in the Schedule of Investments. Only net variation margin is reported within the receivables and/or payables on the Statement of Assets and Liabilities. |
| 3 | Includes cumulative unrealized appreciation (depreciation) of centrally cleared swap contracts as reported in the Schedule of Investments. Only net variation margin is reported within the receivables and/or payables on the Statement of Assets and Liabilities. |
The following tables provide information about the effect of derivatives and hedging activities on the Fund’s Statement of Operations for the six months ended June 30, 2023. The first table provides additional detail about the amounts and sources of gains (losses) realized on derivatives during the period. The second table provides additional information about the change in net unrealized appreciation (depreciation) resulting from the Fund’s derivatives and hedging activities during the period.
| | | | | | | | | | | | | | | | |
| AMOUNT OF NET REALIZED GAIN (LOSS) ON DERIVATIVES RECOGNIZED | |
| | | Interest
Rate Risk | | | Foreign
Exchange
Risk | | | Credit
Risk | | | Total | |
| Futures contracts | | $ | (3,943,995) | | | | — | | | | — | | | $ | (3,943,995) | |
| Swap contracts | | | — | | | | — | | | $ | 288,430 | | | | 288,430 | |
| Forward foreign currency contracts | | | — | | | $ | (302,444) | | | | — | | | | (302,444) | |
| Total | | $ | (3,943,995) | | | $ | (302,444) | | | $ | 288,430 | | | $ | (3,958,009) | |
|
| CHANGE IN NET UNREALIZED APPRECIATION (DEPRECIATION) ON DERIVATIVES RECOGNIZED | |
| | | Interest
Rate Risk | | | Foreign
Exchange
Risk | | | Credit
Risk | | | Total | |
| Futures contracts | | $ | 1,182,720 | | | | — | | | | — | | | $ | 1,182,720 | |
| Swap contracts | | | — | | | | — | | | $ | 379,612 | | | | 379,612 | |
| Forward foreign currency contracts | | | — | | | $ | (1,127,917) | | | | — | | | | (1,127,917) | |
| Total | | $ | 1,182,720 | | | $ | (1,127,917) | | | $ | 379,612 | | | $ | 434,415 | |
During the six months ended June 30, 2023, the volume of derivative activity for the Fund was as follows:
| | | | |
| | | Average Market
Value | |
| Futures contracts (to buy) | | $ | 34,893,081 | |
| Futures contracts (to sell) | | | 62,101,881 | |
| Forward foreign currency contracts (to buy) | | | 38,708,120 | |
| Forward foreign currency contracts (to sell) | | | 35,880,542 | |
| |
| | | Average Notional
Balance | |
| Credit default swap contracts (sell protection) | | $ | 40,708,200 | |
| | | | |
| BrandywineGLOBAL — Flexible Bond Fund 2023 Semi-Annual Report | | | | 39 |
Notes to financial statements (unaudited) (cont’d)
The following table presents the Fund’s OTC derivative assets and liabilities by counterparty net of amounts available for offset under an ISDA Master Agreement and net of the related collateral pledged (received) by the Fund as of June 30, 2023.
| | | | | | | | | | | | | | | | | | | | |
| Counterparty | | Gross
Assets
Subject to
Master
Agreements1
| | | Gross Liabilities Subject to Master
Agreements1
| | | Net Assets
(Liabilities)
Subject to
Master
Agreements | | | Collateral
Pledged
(Received)2,3
| | | Net
Amount4,5 | |
| Citibank N.A. | | $ | 709,481 | | | $ | (831,317) | | | $ | (121,836) | | | | — | | | $ | (121,836) | |
| HSBC Securities Inc. | | | 698,548 | | | | (609,499) | | | | 89,049 | | | $ | (90,000) | | | | (951) | |
| JPMorgan Chase & Co. | | | 973,659 | | | | (1,323,039) | | | | (349,380) | | | | (180,000) | | | | (529,380) | |
| Morgan Stanley & Co. Inc. | | | 89,581 | | | | — | | | | 89,581 | | | | — | | | | 89,581 | |
| Total | | $ | 2,471,269 | | | $ | (2,763,855) | | | $ | (292,586) | | | $ | (270,000) | | | $ | (562,586) | |
| 1 | Absent an event of default or early termination, derivative assets and liabilities are presented gross and not offset in the Statement of Assets and Liabilities. |
| 2 | Gross amounts are not offset in the Statement of Assets and Liabilities. |
| 3 | In some instances, the actual collateral received and/or pledged may be more than the amount shown here due to overcollateralization. |
| 4 | Net amount may also include forward foreign currency exchange contracts that are not required to be collateralized. |
| 5 | Represents the net amount receivable (payable) from (to) the counterparty in the event of default. |
5. Class specific expenses, waivers and/or expense reimbursements
The Fund has adopted a Rule 12b-1 shareholder services and distribution plan and under that plan the Fund pays service and/or distribution fees with respect to its Class A and Class C shares calculated at the annual rate of 0.25% and 1.00% of the average daily net assets of each class, respectively. Service and/or distribution fees are accrued daily and paid monthly.
For the six months ended June 30, 2023, class specific expenses were as follows:
| | | | | | | | |
| | | Service and/or
Distribution Fees | | | Transfer Agent
Fees | |
| Class A | | $ | 38,472 | | | $ | 13,244 | |
| Class C | | | 9,460 | | | | 483 | |
| Class I | | | — | | | | 90,320 | |
| Class IS | | | — | | | | 963 | |
| Total | | $ | 47,932 | | | $ | 105,010 | |
| | | | |
40 | | | | BrandywineGLOBAL — Flexible Bond Fund 2023 Semi-Annual Report |
For the six months ended June 30, 2023, waivers and/or expense reimbursements by class were as follows:
| | | | |
| | | Waivers/Expense
Reimbursements | |
| Class A | | $ | 1,516 | |
| Class C | | | 91 | |
| Class I | | | 9,968 | |
| Class IS | | | 6,715 | |
| Total | | $ | 18,290 | |
6. Distributions to shareholders by class
| | | | | | | | |
| | | Six Months Ended
June 30, 2023 | | | Year Ended
December 31, 2022 | |
| Net Investment Income: | | | | | | | | |
| Class A | | $ | 728,687 | | | $ | 598,588 | |
| Class C | | | 42,367 | | | | 22,464 | |
| Class I | | | 4,757,706 | | | | 3,925,094 | |
| Class IS | | | 3,271,278 | | | | 1,529,859 | |
| Total | | $ | 8,800,038 | | | $ | 6,076,005 | |
| | |
| Return of Capital: | | | | | | | | |
| Class A | | | — | | | $ | 99,406 | |
| Class C | | | — | | | | 3,731 | |
| Class I | | | — | | | | 651,832 | |
| Class IS | | | — | | | | 254,060 | |
| Total | | | — | | | $ | 1,009,029 | |
7. Shares of beneficial interest
At June 30, 2023, the Trust had an unlimited number of shares of beneficial interest authorized with a par value of $0.00001 per share. The Fund has the ability to issue multiple classes of shares. Each class of shares represents an identical interest and has the same rights, except that each class bears certain direct expenses, including those specifically
related to the distribution of its shares.
Transactions in shares of each class were as follows:
| | | | | | | | | | | | | | | | |
| | | Six Months Ended
June 30, 2023 | | | Year Ended
December 31, 2022 | |
| | | Shares | | | Amount | | | Shares | | | Amount | |
| Class A | | | | | | | | | | | | | | | | |
| Shares sold | | | 1,840,388 | | | $ | 17,755,611 | | | | 2,826,366 | | | $ | 28,574,986 | |
| Shares issued on reinvestment | | | 74,267 | | | | 716,680 | | | | 71,952 | | | | 690,318 | |
| Shares repurchased | | | (482,569) | | | | (4,656,264) | | | | (2,306,244) | | | | (22,382,665) | |
| Net increase | | | 1,432,086 | | | $ | 13,816,027 | | | | 592,074 | | | $ | 6,882,639 | |
| | | | |
| BrandywineGLOBAL — Flexible Bond Fund 2023 Semi-Annual Report | | | | 41 |
Notes to financial statements (unaudited) (cont’d)
| | | | | | | | | | | | | | | | |
| | | Six Months Ended
June 30, 2023 | | | Year Ended
December 31, 2022 | |
| | | Shares | | | Amount | | | Shares | | | Amount | |
| Class C | | | | | | | | | | | | | | | | |
| Shares sold | | | 252,464 | | | $ | 2,419,448 | | | | 142,751 | | | $ | 1,393,161 | |
| Shares issued on reinvestment | | | 4,389 | | | | 42,089 | | | | 2,741 | | | | 25,796 | |
| Shares repurchased | | | (121,857) | | | | (1,158,334) | | | | (12,534) | | | | (117,545) | |
| Net increase | | | 134,996 | | | $ | 1,303,203 | | | | 132,958 | | | $ | 1,301,412 | |
| | | | |
| Class I | | | | | | | | | | | | | | | | |
| Shares sold | | | 11,969,736 | | | $ | 116,138,250 | | | | 16,547,420 | | | $ | 166,523,307 | |
| Shares issued on reinvestment | | | 487,749 | | | | 4,711,657 | | | | 474,894 | | | | 4,543,699 | |
| Shares repurchased | | | (4,140,424) | | | | (40,028,461) | | | | (11,575,055) | | | | (114,829,242) | |
| Net increase | | | 8,317,061 | | | $ | 80,821,446 | | | | 5,447,259 | | | $ | 56,237,764 | |
| | | | |
| Class IS | | | | | | | | | | | | | | | | |
| Shares sold | | | 12,039,440 | | | $ | 117,427,821 | | | | 3,073,901 | | | $ | 31,856,993 | |
| Shares issued on reinvestment | | | 338,134 | | | | 3,269,757 | | | | 185,401 | | | | 1,783,919 | |
| Shares repurchased | | | (1,070,136) | | | | (10,343,669) | | | | (7,927,326) | | | | (81,130,806) | |
| Net increase (decrease) | | | 11,307,438 | | | $ | 110,353,909 | | | | (4,668,024) | | | $ | (47,489,894) | |
8. Transactions with affiliated company
As defined by the 1940 Act, an affiliated company is one in which the Fund owns 5% or more of the outstanding voting securities, or a company which is under common ownership or control with the Fund. The following company was considered an affiliated company for all or some portion of the six months ended June 30, 2023. The following transactions were
effected in such company for the six months ended June 30, 2023.
| | | | | | | | | | | | | | | | | | | | |
| | | Affiliate
Value at
December 31,
2022 | | | Purchased | | | Sold | |
|
| | Cost | | | Shares | | | Proceeds | | | Shares | |
| Western Asset Premier Institutional U.S. Treasury Reserves, Premium Shares | | $ | 17,617,308 | | | $ | 209,068,069 | | | | 209,068,069 | | | $ | 211,011,053 | | | | 211,011,053 | |
| | | | | | | | | | | | | | | | |
| (cont’d) | | Realized
Gain (Loss) | | | Dividend
Income | | | Net Increase
(Decrease) in
Unrealized
Appreciation
(Depreciation) | | | Affiliate
Value at
June 30,
2023 | |
| Western Asset Premier Institutional U.S. Treasury Reserves, Premium Shares | | | — | | | $ | 478,486 | | | | — | | | $ | 15,674,324 | |
| | | | |
42 | | | | BrandywineGLOBAL — Flexible Bond Fund 2023 Semi-Annual Report |
9. Redemption facility
The Fund, together with other U.S. registered and foreign investment funds (collectively, the “Borrowers”) managed by Franklin Resources or its affiliates, is a borrower in a joint syndicated senior unsecured credit facility totaling $2.675 billion (the “Global Credit Facility”). The Global Credit Facility provides a source of funds to the Borrowers for temporary and emergency purposes, including the ability to meet future unanticipated or unusually large redemption requests. Unless renewed, the Global Credit Facility will terminate on February 2, 2024.
Under the terms of the Global Credit Facility, the Fund shall, in addition to interest charged on any borrowings made by the Fund and other costs incurred by the Fund, pay its share of fees and expenses incurred in connection with the implementation and maintenance of the Global Credit Facility, based upon its relative share of the aggregate net assets of all the Borrowers, including an annual commitment fee of 0.15% based upon the unused portion of the Global Credit Facility. These fees are reflected in the Statement of Operations. The Fund did not utilize the Global Credit Facility during the six months ended June 30, 2023.
10. Deferred capital losses
As of December 31, 2022, the Fund had deferred capital losses of $19,113,361, which have no expiration date, that will be available to offset future taxable capital gains.
11. Recent accounting pronouncement
In March 2020, the Financial Accounting Standards Board (FASB) issued Accounting Standards Update (ASU) No. 2020-04, Reference Rate Reform (Topic 848) – Facilitation of the Effects of Reference Rate Reform on Financial Reporting. In January 2021 and December 2022, the FASB issued ASU No. 2021-01 and ASU No. 2022-06, with further amendments to Topic 848. The amendments in the ASUs provide optional temporary accounting recognition and financial reporting relief from the effect of certain types of contract modifications due to the planned discontinuation of the London Interbank Offered Rate (LIBOR) and other interbank-offered based reference rates as of the end of 2021 for certain LIBOR settings and 2023 for the remainder. The ASUs are effective for certain reference rate-related contract modifications that occur during the period March 12, 2020 through December 31, 2024. Management has reviewed the requirements and believes the adoption of these ASUs will not have a material impact on the financial statements.
12. Other matter
The Fund’s investments, payment obligations, and financing terms may be based on floating rates, such as the London Interbank Offered Rate, or “LIBOR,” which was the offered rate for short-term Eurodollar deposits between major international banks. In 2017, the U.K. Financial Conduct Authority (“FCA”) announced its intention to cease compelling banks to provide the quotations needed to sustain LIBOR after 2021. In addition, global regulators have announced that, with limited exceptions, no new LIBOR-based contracts should be entered into after 2021. In connection with the global transition away from LIBOR led by regulators and market participants, LIBOR is no longer published on a representative basis. Alternative references rates have been established in most major currencies. In March 2022, the U.S. federal government enacted legislation to establish a process for replacing LIBOR in certain existing contracts that do not already provide for the use of a clearly defined or practicable replacement benchmark rate as described in the legislation.
| | | | |
| BrandywineGLOBAL — Flexible Bond Fund 2023 Semi-Annual Report | | | | 43 |
Notes to financial statements (unaudited) (cont’d)
Generally speaking, for contracts that do not contain a fallback provision as described in the legislation, a benchmark replacement recommended by the Federal Reserve Board effectively automatically replaced the USD LIBOR benchmark in the contract upon LIBOR’s cessation at the end of June 2023. The recommended benchmark replacement is based on the Secured Overnight Financing Rate (SOFR) published by the Federal Reserve Bank of New York, including certain spread adjustments and benchmark replacement conforming changes. Various industry groups are in the process of facilitating the transition away from LIBOR, but there remains uncertainty regarding the impact of the transition from LIBOR on the Fund’s transactions and the financial markets generally.
| | | | |
44 | | | | BrandywineGLOBAL — Flexible Bond Fund 2023 Semi-Annual Report |
Board approval of management and subadvisory agreements (unaudited)
At an in-person meeting of the Board of Trustees of Legg Mason Global Asset Management Trust (the “Trust”) held on May 3-4, 2023, the Board, including the Trustees who are not considered to be “interested persons” of the Trust (the “Independent Trustees”) under the Investment Company Act of 1940, as amended (the “1940 Act”), approved for an annual period the continuation of the management agreement (the “Management Agreement”) between the Trust and Legg Mason Partners Fund Advisor, LLC (the “Manager”) with respect to BrandywineGLOBAL – Flexible Bond Fund, a series of the Trust (the “Fund”), and the sub-advisory agreement pursuant to which Brandywine Global Investment Management, LLC (the “Subadviser”) provides day-to-day management of the Fund’s portfolio. The management agreement and sub-advisory agreement are collectively referred to as the “Agreements.”
Background
The Board received extensive information in advance of the meeting to assist it in its consideration of the Agreements and asked questions and requested additional information from management. Throughout the year the Board (including its various committees) had met with representatives of the Manager and the Subadviser, and had received information relevant to the renewal of the Agreements. Prior to the meeting the Independent Trustees met with their independent legal counsel to discuss and consider the information provided and submitted questions to management, and they considered the responses provided. The Board received and considered a variety of information about the Manager and the Subadviser, as well as the management, advisory and sub-advisory arrangements for the Fund and other funds overseen by the Board, certain portions of which are discussed below. The information received and considered by the Board both in conjunction with the May 2023 meeting and throughout the year was both written and oral. The contractual arrangements discussed below are the product of multiple years of review and negotiation and information received and considered by the Board during those years.
The information provided and presentations made to the Board encompassed the Fund and all funds for which the Board has responsibility. The discussion below covers both the advisory and the administrative functions being rendered by the Manager, both of which functions are encompassed by the Management Agreement, as well as the advisory functions rendered by the Subadviser pursuant to the Sub-Advisory Agreement.
Board approval of management agreement and sub-advisory agreement
The Independent Trustees were advised by separate independent legal counsel throughout the process. Prior to voting, the Independent Trustees received a memorandum from their independent legal counsel discussing the legal standards for their consideration of the proposed continuation of the Agreements. The Independent Trustees also reviewed the proposed continuation of the Management Agreement and the Sub-Advisory Agreement in private sessions with their independent legal counsel at which no representatives of the
| | | | |
| BrandywineGLOBAL — Flexible Bond Fund | | | | 45 |
Board approval of management and subadvisory agreements (unaudited) (cont’d)
Manager and Subadviser were present. The Independent Trustees considered the Management Agreement and the Sub-Advisory Agreement separately in the course of their review. In doing so, they noted the respective roles of the Manager and the Subadviser in providing services to the Fund.
In approving the Agreements, the Board, including the Independent Trustees, considered a variety of factors, including those factors discussed below. No single factor reviewed by the Board was identified by the Board as the principal factor in determining whether to approve the Management Agreement and the Sub-Advisory Agreement. Each Trustee may have attributed different weight to the various factors in evaluating the Management Agreement and the Sub-Advisory Agreement.
After considering all relevant factors and information, the Board, exercising its business judgment, determined that the continuation of the Agreements was in the best interests of the Fund and its shareholders and approved the continuation of each such agreement for another year.
Nature, extent and quality of the services under the management agreement and sub-advisory agreement
The Board received and considered information regarding the nature, extent and quality of services provided to the Fund by the Manager and the Subadviser under the Management Agreement and the Sub-Advisory Agreement, respectively, during the past year. The Board noted information received at regular meetings throughout the year related to the services rendered by the Manager in its management of the Fund’s affairs and the Manager’s role in coordinating the activities of the Fund’s other service providers. The Board’s evaluation of the services provided by the Manager and the Subadviser took into account the Board’s knowledge gained as Trustees of funds in the fund complex overseen by the Trustees, including knowledge gained regarding the scope and quality of the investment management and other capabilities of the Manager and the Subadviser, and the quality of the Manager’s administrative and other services. The Board observed that the scope of services provided by the Manager and the Subadviser, and of the undertakings required of the Manager and Subadviser in connection with those services, including maintaining and monitoring their own and the Fund’s compliance programs, liquidity management programs, derivatives risk management programs, cybersecurity programs and valuation-related policies, had expanded over time as a result of regulatory, market and other developments. The Board also noted that on a regular basis it received and reviewed information from the Manager regarding the Fund’s compliance policies and procedures established pursuant to Rule 38a-1 under the 1940 Act. The Board also considered the risks associated with the Fund borne by the Manager and its affiliates (such as entrepreneurial, operational, reputational, litigation and regulatory risk), as well as the Manager’s and the Subadviser’s risk management processes.
| | | | |
46 | | | | BrandywineGLOBAL — Flexible Bond Fund |
The Board reviewed the qualifications, backgrounds and responsibilities of the Manager’s and the Subadviser’s senior personnel and the team of investment professionals primarily responsible for the day-to-day portfolio management of the Fund. The Board also considered, based on its knowledge of the Manager and the Manager’s affiliates, the financial resources of Franklin Resources, Inc., the parent organization of the Manager and the Subadviser. The Board recognized the importance of having a fund manager with significant resources.
The Board considered the division of responsibilities between the Manager and the Subadviser and the oversight provided by the Manager. The Board also considered the policies and practices of the Manager and the Subadviser regarding the selection of brokers and dealers and the execution of portfolio transactions. The Board considered management’s periodic reports to the Board on, among other things, its business plans, any organizational changes and portfolio manager compensation.
The Board received and considered performance information for the Fund as well as for a group of funds (the “Performance Universe”) selected by Broadridge Financial Solutions, Inc. (“Broadridge”), an independent provider of investment company data, based on classifications provided by Thomson Reuters Lipper (“Lipper”). The Board was provided with a description of the methodology used to determine the similarity of the Fund with the funds included in the Performance Universe. It was noted that while the Board found the Broadridge data generally useful, they recognized its limitations, including that the data may vary depending on the end date selected and that the results of the performance comparisons may vary depending on the selection of the peer group and its composition over time. The Board also noted that it had received and discussed with management information throughout the year at periodic intervals comparing the Fund’s performance against its benchmark and against the Fund’s peers. The Board also considered the Fund’s performance in light of overall financial market conditions.
The information comparing the Fund’s performance to that of its Performance Universe, consisting of funds (including the Fund) classified as multi-sector income funds by Lipper, showed, among other data, that the performance of the Fund’s Class I shares for the one-, three- and five-year periods ended December 31, 2022 and the period since the Fund’s inception (May 31, 2016) through December 31, 2022 was above the median performance of the funds in the Performance Universe for each period and ranked in the first quintile of the funds in the Performance Universe for the three- and five-year and since inception periods.
The Board concluded that, overall, the nature, extent and quality of services provided (and expected to be provided), including performance, under the Management Agreement and the Sub-Advisory Agreement were sufficient for renewal.
| | | | |
| BrandywineGLOBAL — Flexible Bond Fund | | | | 47 |
Board approval of management and subadvisory agreements (unaudited) (cont’d)
Management fees and expense ratios
The Board reviewed and considered the contractual management fee payable by the Fund to the Manager (the “Contractual Management Fee”) and the actual management fees paid by the Fund to the Manager after giving effect to breakpoints and waivers, if any (the “Actual Management Fee”), in light of the nature, extent and quality of the management and sub-advisory services provided by the Manager and the Subadviser, respectively. The Board also considered that fee waiver and/or expense reimbursement arrangements are currently in place for the Fund. The Board also noted that the compensation paid to the Subadviser is the responsibility and expense of the Manager, not the Fund.
The Board received and considered information provided by Broadridge comparing the Contractual Management Fee and the Actual Management Fee and the Fund’s total actual expenses with those of funds in both the relevant expense group and a broader group of funds, each selected by Broadridge based on classifications provided by Lipper. It was noted that while the Board found the Broadridge data generally useful, they recognized its limitations, including that the data may vary depending on the selection of the peer group. The Board also reviewed information regarding fees charged by the Manager and/or the Subadviser to other U.S. clients investing primarily in an asset class similar to that of the Fund, including, institutional separate and commingled accounts.
The Manager reviewed with the Board the differences in services provided to these different types of accounts, noting that the Fund is provided with certain administrative services, office facilities, and Fund officers (including the Fund’s chief executive, chief financial and chief compliance officers), and that the Manager coordinates and oversees the provision of services to the Fund by other Fund service providers. The Board considered the fee comparisons in light of the differences in management of these different types of accounts, and the differences in the degree of entrepreneurial and other risks borne by the Manager in managing the Fund and in managing other types of accounts.
The Board considered the overall management fee, the fees of the Subadviser and the amount of the management fee retained by the Manager after payment of the subadvisory fees, in each case in light of the services rendered for those amounts. The Board also received an analysis of complex-wide management fees provided by the Manager, which, among other things, set out a framework of fees based on asset classes.
The Board also received and considered information comparing the Fund’s Contractual Management Fee and Actual Management Fee as well as its actual total expense ratio with those of a group of funds consisting of 12 multi-sector income funds (including the Fund) selected by Broadridge to be comparable to the Fund (the “Expense Group”), and a broader group of funds selected by Broadridge consisting of multi-sector income funds (including the Fund) (the “Expense Universe”). This information showed that the Fund’s Contractual Management Fee was approximately equivalent to the median of management fees
| | | | |
48 | | | | BrandywineGLOBAL — Flexible Bond Fund |
payable by the funds in the Expense Group and that the Fund’s Actual Management Fee was below the median of management fees paid by the funds in the Expense Group and below the median of management fees paid by the funds in the Expense Universe. This information also showed that the Fund’s actual total expense ratio was approximately equivalent to the median of the total expense ratios of the funds in the Expense Group and above the median of the actual total expense ratios of the funds in the Expense Universe. The Board took into account management’s discussion of the Fund’s expenses. The Board also considered that the current limitation on the Fund’s expenses is expected to continue until and expire on December 31, 2024.
Taking all of the above into consideration, as well as the factors identified below, the Board determined that the management fee and the subadvisory fees for the Fund were reasonable in light of the nature, extent and quality of the services provided to the Fund under the Management Agreement and the Sub-Advisory Agreement.
Manager profitability
The Board received and considered an analysis of the profitability of the Manager and its affiliates in providing services to the Fund. The Board also received profitability information with respect to the Legg Mason Funds complex as a whole. The Board received information with respect to the Manager’s allocation methodologies used in preparing this profitability data. It was noted that the allocation methodologies had previously been reviewed by an outside consultant. The profitability of the Manager and its affiliates was considered by the Board not excessive in light of the nature, extent and quality of the services provided to the Fund.
Economies of scale
The Board received and discussed information concerning whether the Manager realizes economies of scale with respect to the management of the Fund as the Fund’s assets grow. The Board also noted the size of the Fund.
The Board determined that the management fee structure for the Fund was reasonable.
Other benefits to the manager and the subadviser
The Board considered other benefits received by the Manager, the Subadviser and their affiliates as a result of their relationship with the Fund, including the opportunity to offer additional products and services to Fund shareholders, including the appointment of an affiliate of the Manager as the transfer agent of the Fund.
In light of the costs of providing investment management and other services to the Fund and the ongoing commitment of the Manager and the Subadviser to the Fund, the Board considered that the ancillary benefits that the Manager, the Subadviser and their affiliates received were reasonable.
| | | | |
| BrandywineGLOBAL — Flexible Bond Fund | | | | 49 |
Statement regarding liquidity risk management program (unaudited)
Each of the Franklin Templeton and Legg Mason Funds has adopted and implemented a written Liquidity Risk Management Program (the “LRMP”) as required by Rule 22e-4 under the Investment Company Act of 1940 (the “Liquidity Rule”). The LRMP is designed to assess and manage each Fund’s liquidity risk, which is defined as the risk that the Fund could not meet requests to redeem shares issued by the Fund without significant dilution of remaining investors’ interests in the Fund. In accordance with the Liquidity Rule, the LRMP includes policies and procedures that provide for: (1) assessment, management, and review (no less frequently than annually) of each Fund’s liquidity risk; (2) classification of each Fund’s portfolio holdings into one of four liquidity categories (Highly Liquid, Moderately Liquid, Less Liquid, and Illiquid); (3) for Funds that do not primarily hold assets that are Highly Liquid, establishing and maintaining a minimum percentage of the Fund’s net assets in Highly Liquid investments (called a “Highly Liquid Investment Minimum” or “HLIM”); and (4) prohibiting the Fund’s acquisition of Illiquid investments that would result in the Fund holding more than 15% of its net assets in Illiquid assets. The LRMP also requires reporting to the Securities and Exchange Commission (“SEC”) (on a non-public basis) and to the Board if the Fund’s holdings of Illiquid assets exceed 15% of the Fund’s net assets. Funds with HLIMs must have procedures for addressing HLIM shortfalls, including reporting to the Board and, with respect to HLIM shortfalls lasting more than seven consecutive calendar days, reporting to the SEC (on a non-public basis).
The Director of Liquidity Risk within the Investment Risk Management Group (the “IRMG”) is the appointed Administrator of the LRMP. The IRMG maintains the Investment Liquidity Committee (the “ILC”) to provide oversight and administration of policies and procedures governing liquidity risk management for Franklin Templeton and Legg Mason products and portfolios. The ILC includes representatives from Franklin Templeton’s Risk, Trading, Global Compliance, Legal, Investment Compliance, Investment Operations, Valuation Committee, Product Management and Global Product Strategy.
In assessing and managing each Fund’s liquidity risk, the ILC considers, as relevant, a variety of factors, including the Fund’s investment strategy and the liquidity of its portfolio investments during both normal and reasonably foreseeable stressed conditions; its short and long-term cash flow projections; and its cash holdings and access to other funding sources including the Funds’ interfund lending facility and line of credit. Classification of the Fund’s portfolio holdings in the four liquidity categories is based on the number of days it is reasonably expected to take to convert the investment to cash (for Highly Liquid and Moderately Liquid holdings) or sell or dispose of the investment (for Less Liquid and Illiquid investments), in current market conditions without significantly changing the investment’s market value.
Each Fund primarily holds liquid assets that are defined under the Liquidity Rule as “Highly Liquid Investments,” and therefore is not required to establish an HLIM. Highly Liquid
| | | | |
50 | | | | BrandywineGLOBAL — Flexible Bond Fund |
Investments are defined as cash and any investment reasonably expected to be convertible to cash in current market conditions in three business days or less without the conversion to cash significantly changing the market value of the investment.
At meetings of the Funds’ Board of Trustees held in May 2023, the Program Administrator provided a written report to the Board addressing the adequacy and effectiveness of the program for the year ended December 31, 2022. The Program Administrator report concluded that (i.) the LRMP, as adopted and implemented, remains reasonably designed to assess and manage each Fund’s liquidity risk; (ii.) the LRMP, including the Highly Liquid Investment Minimum (“HLIM”) where applicable, was implemented and operated effectively to achieve the goal of assessing and managing each Fund’s liquidity risk; and (iii.) each Fund was able to meet requests for redemption without significant dilution of remaining investors’ interests in the Fund.
| | | | |
| BrandywineGLOBAL — Flexible Bond Fund | | | | 51 |
BrandywineGLOBAL —
Flexible Bond Fund
Trustees
Paul R. Ades
Andrew L. Breech
Althea L. Duersten
Chair
Stephen R. Gross
Susan M. Heilbron
Arnold L. Lehman
Robin J. W. Masters
Ken Miller
G. Peter O’Brien
Thomas F. Schlafly
Jane Trust
Investment manager
Legg Mason Partners Fund Advisor, LLC
Subadviser
Brandywine Global Investment
Management, LLC
Distributor
Franklin Distributors, LLC
Custodian
The Bank of New York Mellon
Transfer agent
Franklin Templeton Investor Services, LLC
3344 Quality Drive
Rancho Cordova, CA 95670-7313
Independent registered public accounting firm
PricewaterhouseCoopers LLP
Baltimore, MD
BrandywineGLOBAL — Flexible Bond Fund
The Fund is a separate investment series of Legg Mason Global Asset Management Trust, a Maryland statutory trust.
BrandywineGLOBAL — Flexible Bond Fund
Legg Mason Funds
100 International Drive
Baltimore, MD 21202
The Fund files its complete schedule of portfolio holdings with the Securities and Exchange Commission (“SEC”) for the first and third quarters of each fiscal year as an exhibit to its reports on Form N-PORT. The Fund’s Forms N-PORT are available on the SEC’s website at www.sec.gov. To obtain information on Form N-PORT, shareholders can call the Fund at 877-6LM-FUND/656-3863.
Information on how the Fund voted proxies relating to portfolio securities during the prior 12-month period ended June 30th of each year and a description of the policies and procedures that the Fund uses to determine how to vote proxies related to portfolio transactions are available (1) without charge, upon request, by calling the Fund at 877-6LM-FUND/656-3863, (2) at www.franklintempleton.com and (3) on the SEC’s website at www.sec.gov.
This report is submitted for the general information of the shareholders of BrandywineGLOBAL — Flexible Bond Fund. This report is not authorized for distribution to prospective investors in the Fund unless preceded or accompanied by a current prospectus.
Investors should consider the Fund’s investment objectives, risks, charges and expenses carefully before investing. The prospectus contains this and other important information about the Fund. Please read the prospectus carefully before investing.
www.franklintempleton.com
© 2023 Franklin Distributors, LLC, Member FINRA/SIPC. All rights reserved.
Legg Mason Funds Privacy and Security Notice
Your Privacy Is Our Priority
Franklin Templeton* is committed to safeguarding your personal information. This notice is designed to provide you with a summary of the non-public personal information Franklin Templeton may collect and maintain about current or former individual investors; our policy regarding the use of that information; and the measures we take to safeguard the information. We do not sell individual investors’ non-public personal information to anyone and only share it as described in this notice.
Information We Collect
When you invest with us, you provide us with your non-public personal information. We collect and use this information to service your accounts and respond to your requests. The non-public personal information we may collect falls into the following categories:
| • | | Information we receive from you or your financial intermediary on applications or other forms, whether we receive the form in writing or electronically. For example, this information may include your name, address, tax identification number, birth date, investment selection, beneficiary information, and your personal bank account information and/or email address if you have provided that information. |
| • | | Information about your transactions and account history with us, or with other companies that are part of Franklin Templeton, including transactions you request on our website or in our app. This category also includes your communications to us concerning your investments. |
| • | | Information we receive from third parties (for example, to update your address if you move, obtain or verify your email address or obtain additional information to verify your identity). |
| • | | Information collected from you online, such as your IP address or device ID and data gathered from your browsing activity and location. (For example, we may use cookies to collect device and browser information so our website recognizes your online preferences and device information.) Our website contains more information about cookies and similar technologies and ways you may limit them. |
| • | | Other general information that we may obtain about you such as demographic information. |
Disclosure Policy
To better service your accounts and process transactions or services you requested, we may share non-public personal information with other Franklin Templeton companies. From time to time we may also send you information about products/services offered by other Franklin Templeton companies although we will not share your non-public personal information with these companies without first offering you the opportunity to prevent that sharing.
We will only share non-public personal information with outside parties in the limited circumstances permitted by law. For example, this includes situations where we need to share information with companies who work on our behalf to service or maintain your account or process transactions you requested, when the disclosure is to companies assisting us with our own marketing efforts, when the disclosure is to a party representing you, or when required by law (for example, in response to legal process). Additionally, we will ensure that any outside
|
| NOT PART OF THE SEMI-ANNUAL REPORT |
Legg Mason Funds Privacy and Security Notice (cont’d)
companies working on our behalf, or with whom we have joint marketing agreements, are under contractual obligations to protect the confidentiality of your information, and to use it only to provide the services we asked them to perform.
Confidentiality and Security
Our employees are required to follow procedures with respect to maintaining the confidentiality of our investors’ non-public personal information. Additionally, we maintain physical, electronic and procedural safeguards to protect the information. This includes performing ongoing evaluations of our systems containing investor information and making changes when appropriate.
At all times, you may view our current privacy notice on our website at franklintempleton.com or contact us for a copy at (800) 632-2301.
*For purposes of this privacy notice Franklin Templeton shall refer to the following entities: Fiduciary Trust International of the South (FTIOS), as custodian for individual retirement plans
Franklin Advisers, Inc.
Franklin Distributors, LLC, including as program manager of the Franklin Templeton 529 College Savings Plan and the NJBEST 529 College Savings Plan
Franklin Mutual Advisers, LLC
Franklin, Templeton and Mutual Series Funds
Franklin Templeton Institutional, LLC
Franklin Templeton Investments Corp., Canada
Franklin Templeton Investments Management, Limited UK
Franklin Templeton Portfolio Advisors, Inc.
Legg Mason Funds serviced by Franklin Templeton Investor Services, LLC
Templeton Asset Management, Limited
Templeton Global Advisors, Limited
Templeton Investment Counsel, LLC
If you are a customer of other Franklin Templeton affiliates and you receive notices from them, you will need to read those notices separately.
|
| NOT PART OF THE SEMI-ANNUAL REPORT |
www.franklintempleton.com
© 2023 Franklin Distributors, LLC, Member FINRA/SIPC. All rights reserved.
BWXX292184 08/23 SR23-4714
Not applicable.
| ITEM 3. | AUDIT COMMITTEE FINANCIAL EXPERT. |
Not applicable.
| ITEM 4. | PRINCIPAL ACCOUNTANT FEES AND SERVICES. |
Not applicable.
| ITEM 5. | AUDIT COMMITTEE OF LISTED REGISTRANTS. |
Not applicable.
| ITEM 6. | SCHEDULE OF INVESTMENTS. |
Included herein under Item 1.
| ITEM 7. | DISCLOSURE OF PROXY VOTING POLICIES AND PROCEDURES FOR CLOSED-END MANAGEMENT INVESTMENT COMPANIES. |
Not applicable.
| ITEM 8. | PORTFOLIO MANAGERS OF CLOSED-END MANAGEMENT INVESTMENT COMPANIES. |
Not applicable.
| ITEM 9. | PURCHASES OF SECURITIES BY CLOSED-END MANAGEMENT INVESTMENT COMPANY AND AFFILIATED PURCHASERS. |
Not applicable.
| ITEM 10. | SUBMISSION OF MATTERS TO A VOTE OF SECURITY HOLDERS. |
Not applicable.
| ITEM 11. | CONTROLS AND PROCEDURES. |
| | (a) | The registrant’s principal executive officer and principal financial officer have concluded that the registrant’s disclosure controls and procedures (as defined in Rule 30a- 3(c) under the Investment Company Act of 1940, as amended (the “1940 Act”)) are effective as of a date within 90 days of the filing date of this report that includes the disclosure required by this paragraph, based on their evaluation of the disclosure controls and procedures required by Rule 30a-3(b) under the 1940 Act and 15d-15(b) under the Securities Exchange Act of 1934. |
| | (b) | There were no changes in the registrant’s internal control over financial reporting (as defined in Rule 30a-3(d) under the 1940 Act) that occurred during the period covered by this report that have materially affected, or are likely to materially affect the registrant’s internal control over financial reporting. |
| ITEM 12. | DISCLOSURE OF SECURITIES LENDING ACTIVITIES FOR CLOSED-END MANAGEMENT INVESTMENT COMPANIES. |
Not applicable.
(a) (1) Not applicable.
Exhibit 99.CODE ETH
(a) (2) Certifications pursuant to section 302 of the Sarbanes-Oxley Act of 2002 attached hereto.
Exhibit 99.CERT
(b) Certifications pursuant to Section 906 of the Sarbanes-Oxley Act of 2002 attached hereto.
Exhibit 99.906CERT
SIGNATURES
Pursuant to the requirements of the Securities Exchange Act of 1934 and the Investment Company Act of 1940, the registrant has duly caused this Report to be signed on its behalf by the undersigned, there unto duly authorized.
Legg Mason Global Asset Management Trust
| | |
| By: | | /s/ Jane Trust |
| | Jane Trust |
| | Chief Executive Officer |
| |
| Date: | | August 24, 2023 |
Pursuant to the requirements of the Securities Exchange Act of 1934 and the Investment Company Act of 1940, this report has been signed below by the following persons on behalf of the registrant and in the capacities and on the dates indicated.
| | |
| By: | | /s/ Jane Trust |
| | Jane Trust |
| | Chief Executive Officer |
| |
| Date: | | August 24, 2023 |
| |
| By: | | /s/ Christopher Berarducci |
| | Christopher Berarducci |
| | Principal Financial Officer |
| |
| Date: | | August 24, 2023 |