UNITED STATES
SECURITIES AND EXCHANGE COMMISSION
Washington, D.C. 20549
FORM N-CSR
CERTIFIED SHAREHOLDER REPORT OF REGISTERED
MANAGEMENT INVESTMENT COMPANIES
Investment Company Act file number 811-22338
Legg Mason Global Asset Management Trust
(Exact name of registrant as specified in charter)
100 International Drive, Baltimore, MD, 21202
(Address of principal executive offices) (Zip code)
Marc A. De Oliveira
Franklin Templeton
100 First Stamford Place
Stamford, CT 06902
(Name and address of agent for service)
Registrant’s telephone number, including area code: 877-6LM-FUND/656-3863
Date of fiscal year end: October 31
Date of reporting period: October 31, 2023
| ITEM 1. | REPORT TO STOCKHOLDERS |
The Annual Report to Stockholders is filed herewith.

| | |
| Annual Report | | October 31, 2023 |
BrandywineGLOBAL —
GLOBAL UNCONSTRAINED
BOND FUND
The Securities and Exchange Commission has adopted new regulations that will result in changes to the design and delivery of annual and semi-annual shareholder reports beginning in July 2024.
If you have previously elected to receive shareholder reports electronically, you will continue to do so and need not take any action.
Otherwise, paper copies of the Fund’s shareholder reports will be mailed to you beginning in July 2024. If you would like to receive shareholder reports and other communications from the Fund electronically instead of by mail, you may make that request at any time by contacting your financial intermediary (such as a broker-dealer or bank) or, if you are a direct investor, enrolling at franklintempleton.com.
You may access franklintempleton.com by scanning the code below.


|
| INVESTMENT PRODUCTS: NOT FDIC INSURED • NO BANK GUARANTEE • MAY LOSE VALUE |
Fund objective
The Fund seeks to generate positive returns that are independent of market cycles.
Letter from the president

Dear Shareholder,
We are pleased to provide the annual report of BrandywineGLOBAL — Global Unconstrained Bond Fund for the twelve-month reporting period ended October 31, 2023. Please read on for a detailed look at prevailing economic and market conditions during the Fund’s reporting period and to learn how those conditions have affected Fund performance.
As always, we remain committed to providing you with excellent service and a full spectrum of investment choices. We also remain committed to supplementing the support you receive from your financial advisor. One way we accomplish this is through our website, www.franklintempleton.com. Here you can gain immediate access to market and investment information, including:
| • | | Fund prices and performance, |
| • | | Market insights and commentaries from our portfolio managers, and |
| • | | A host of educational resources. |
We look forward to helping you meet your financial goals.
Sincerely,

Jane Trust, CFA
President and Chief Executive Officer
November 30, 2023
| | |
II | | BrandywineGLOBAL — Global Unconstrained Bond Fund |
Fund overview
Q. What is the Fund’s investment strategy?
A. The Fund seeks to generate positive returns that are independent of market cycles. Under normal market conditions, the Fund seeks to meet its investment objective through strategic investments in domestic and foreign fixed income securities, currencies and derivatives. The Fund will initiate long and short exposures by investing across bond sectors, including sovereign debt and corporate bonds; currencies; and derivative instruments. Short exposure will be established primarily through the use of derivatives, including currency forwards, interest rate swaps and futures. The Fund is “unconstrained” in that we do not attempt to keep the portfolio structure or the Fund’s performance consistent with any designated stock, bond or market index.
The Fund normally invests at least 80% of its net assets, plus the amount of borrowings for investment purposes, if any, in fixed income securities or other instruments with similar economic characteristics. Fixed income securities in which the Fund may invest are debt securities issued or guaranteed by national governments, their agencies or instrumentalities and political sub-divisions (including inflation index linked securities and municipal bonds); debt securities of supranational organizations such as bonds, debentures and freely transferable promissory notes; corporate debt securities, including debentures, bonds (including zero coupon bonds), convertible and non-convertible notes, commercial paper, certificates of deposits, freely transferable promissory notes and bankers acceptances issued by industrial, utility, finance, commercial banking or bank holding company organizations; mortgage-backed securities (including collateralized debt obligations); asset-backed securities; emerging markets debt; and high yield debt (often called “junk bonds”).
While the Fund may invest in securities of any rating level, or unrated securities, we intend to maintain an average weighted portfolio quality of A- or better, whether composed of rated securities or unrated securities that we deemed to be of comparable quality. The Fund will invest in both investment grade and below investment grade securities (commonly known as “junk bonds”) and currencies of developed and emerging countries.
The Fund typically has significant exposure to foreign currencies and foreign countries. As a global fund, under normal market conditions, the Fund will invest in or have exposure to at least three countries, which may include the United States. The Fund may invest a significant portion of its assets in a particular geographic region or country, including emerging market countries. Normally, the Fund will not invest more than 20% of the Fund’s assets in securities or issuers in any one foreign country, other than the United States, Canada, the United Kingdom, Japan, Australia and member countries of the European Union, or denominated in any one currency, other than the U.S. dollar, the Canadian dollar, the pound, the euro, the Australian dollar or the yen.
The Fund may invest in securities of any maturity. The weighted average effective duration of the Fund’s portfolio, including derivatives, is expected to range from -5 to +8 years. The
| | | | | | |
| BrandywineGLOBAL — Global Unconstrained Bond Fund 2023 Annual Report | | | | | 1 | |
Fund overview (cont’d)
Fund may have a negative weighted average effective duration due to holding certain instruments that have negative effective duration, such as through the use of derivative instruments.
The Fund achieves certain investment exposures, including short positions, primarily through derivative transactions, including foreign currency forwards, bond futures, interest rate futures, swaps (including interest rate, total return and inflation swaps), credit default swaps, credit default swap index products, instruments involved in currency risk management strategies, including cross hedges, options and options on futures and warrants. The Fund may use derivatives in an effort to enhance total return, to hedge against fluctuations in securities prices, interest rates or currency exchange rates, to change the effective duration of its portfolio, to manage certain investment risks and/or as a substitute for the purchase or sale of securities or currencies. These instruments are taken into account when determining compliance with the Fund’s 80% policy. The Fund’s use of derivatives may be extensive. However, the notional principal of the Fund’s aggregate net short currency exposure will not be greater than 70% of the Fund’s total assets.
The Fund’s broad mandate gives us strategic flexibility to change allocations and shift between long and short exposures in an attempt to take advantage of evolving opportunities. In making investment decisions on behalf of the Fund, we apply a top-down, macro-driven investment process and invest where we believe opportunities exist with respect to interest rate levels and currency valuations. Long investments are typically concentrated in sovereign debt or currencies of six to twelve countries, or corporate debt of issuers in those countries, that we believe offer the most attractive absolute return opportunities. Short positions are typically established in interest rates, bonds or currencies that we believe are overvalued, will fall in value and can potentially generate returns. We take into account the relative risk and return characteristics of prospective investments when determining how to achieve desired exposures.
Q. What were the overall market conditions during the Fund’s reporting period?
A. The overall global fixed income markets generated weak results over the twelve-month reporting period ended October 31, 2023. The market was negatively impacted by a number of factors, including continued elevated inflation, aggressive central bank rate hikes, unrest in the banking industry, and several geopolitical issues. In an attempt to combat persistent inflation, central banks in the U.S. and abroad aggressively tightened monetary policy. The U.S. Federal Reserve Board (the “Fed”) raised rates at eleven meetings from March 2022 (before the reporting period began) through July 2023—pushing the federal funds rate to 5.25%-5.50%—a twenty-two year high. While the Fed paused from raising rates at its meetings in September and November 2023, it did not rule out the possibility of raising rates again when it convenes in mid-December. Elsewhere, the European Central Bank (“ECB”) raised interest rates to a record high of 4.00% in September 2023, its tenth hike in the last fourteen months. The ECB then held rates steady in October 2023. Meanwhile, after
| | | | |
2 | | | | BrandywineGLOBAL — Global Unconstrained Bond Fund 2023 Annual Report |
fourteen consecutive hikes, the Bank of England held its Bank Rate at 5.25% in September 2023, a fifteen year high.
Against this backdrop the International Monetary Fund (“IMF”) forecasted moderating, but still positive, economic growth in 2023. In its October 2023 World Economic Outlook Update, the IMF said, “The global economy continues to recover slowly from the blows of the pandemic, Russia’s invasion of Ukraine, and the cost-of-living crisis. In retrospect, the resilience has been remarkable. Despite the disruption in energy and food markets caused by the war and the unprecedented tightening of global monetary conditions to combat decades-high inflation, the global economy has slowed, but not stalled. Yet growth remains slow and uneven, with growing global divergences.” The IMF now forecasts global gross domestic product (“GDP”) will be 3.0% in 2023, versus 3.5% in 2022. From a regional perspective, the IMF projects U.S. GDP will be 2.1% in 2023, the same as in 2022. Elsewhere, the IMF expects 2023 GDP of 0.7% in the eurozone (from 3.3% in 2022), 0.5% in the U.K. (from 4.1% in 2022) and 2.0% in Japan (versus 1.0% in 2022).
During the reporting period, government sovereign yields moved higher and bond prices declined (bond prices and yields generally move in the opposite direction). All told, the Bloomberg Global Aggregate Indexi and the Bloomberg U.S. Aggregate Indexii returned 1.72% and 0.36%, respectively, for the twelve months ended October 31, 2023. Riskier fixed income securities, including high yield bonds and emerging market debt, produced better results. Over the fiscal year, the Bloomberg U.S. Corporate High Yield 2% Issuer Cap Indexiii and the JPMorgan Emerging Markets Bond Index Globaliv returned 6.23% and 6.94%, respectively.
Q. How did we respond to these changing market conditions?
A. Our investment framework is based on the idea that large moves in bond yields and currencies create economic responses that ultimately lead to investment opportunities. So far, the U.S. economy, as well as equity, credit and real estate markets, have held up remarkably well in the face of a 250 basis point (bp) (2.50%) increase in yield for the ten-year U.S. Treasury note over the past eighteen months. The Fund’s macroeconomic view is that the long and variable lags of aggressive monetary tightening should result in some type of slowdown in the U.S. Given this view, the Fund increased its duration posture during the reporting period by adding more ballast to the portfolio in the form of U.S. Treasuries. At a yield curve level, we shifted the Fund’s duration overweight from the long end of the curve to the belly of the curve. The Fund’s additional developed market bond exposures consisted of long U.K. gilts and short Japanese government bonds. We overweighted the U.K. because the economy is clearly slowing in response to aggressive Bank of England policy tightening, and we underweighted duration in Japan because of the recent regime shift in inflation dynamics. Within the structured sector, the Fund overweighted U.S. agency mortgage-backed securities (“MBS”) as their spreads hit the highest levels seen during this most recent economic cycle.
| | | | | | |
| BrandywineGLOBAL — Global Unconstrained Bond Fund 2023 Annual Report | | | | | 3 | |
Fund overview (cont’d)
The Fund’s credit exposure was primarily allocated to emerging market sovereign bonds instead of corporate bonds. Select Latin American countries were flashing cheap at the end of 2022—spreads and real yields in Colombia, Mexico, and Brazil were very compelling—and we overweighted each at this time. The positions were trimmed over the second and third quarters of 2023, because both the rates and their currencies performed well on the back of growth surprises and falling inflation. We were largely underweight low-yielding Asian emerging market sovereigns given unfavorable valuations and the spillover effects from China’s economic weakness. Additionally, the Fund held a small overweight to corporate credit throughout the reporting period. We were primarily positioned on the short end of the corporate curve and viewed investment-grade corporate credit as a proxy for cash.
From a currency perspective, the Fund was largely underweight the U.S. dollar, as we have a medium-term bearish view on the currency. We believed that the U.S. dollar was expensive on a range of valuation measures. The Fund’s positioning is barbelled between longs in select emerging market currencies and overweights in the Japanese yen and the euro. We believe certain emerging market currencies offer a mix of attractive valuations, positive balance of payments dynamics, and historically high real short rates. Meanwhile, the Japanese yen is extremely cheap versus both the U.S. dollar and other G10 currencies. The possibility of foreign exchange (“FX”) intervention should prevent further significant weakness in the yen, in our view.
The Fund utilized currency forwards and interest rate futures over the reporting period. Currency forwards were used to hedge foreign currency risk, as well as to take active currency positions in the Fund. Currency hedges were employed over the period in select emerging markets, such as Brazil, Poland, Peru, and Mexico. Foreign currency risk was also managed for positions in the United Kingdom and European Union. Larger active currency positions were taken in developed markets such as Japan, Switzerland, and Norway, with smaller positions diversified across emerging markets. The net effect of currency forward positioning detracted from overall Fund performance. In a period where the U.S. dollar consistently traded at high levels last observed twenty years ago, non-dollar currency investments were challenged. Select emerging markets offering higher interest rates than the U.S., along with improving inflation outlooks, outperformed the dollar. Some of these markets were partially hedged in the Fund, thus detracting from performance. On the other hand, developed market currencies that the Fund owned, notably the Japanese Yen and Norwegian Krone, underperformed over the period due to widening interest rate gaps as those markets followed a less aggressive monetary policy relative to the United States.
Interest rate futures were used to manage duration, both along the curve and geographically. They detracted from Fund performance. Moderate losses from investments in long-term U.S. bonds were offset by gains generated by shorting long-term U.K. Gilts and Japanese Government Bonds, as well as a tactical long position in Italian BTPs.
| | | | |
4 | | | | BrandywineGLOBAL — Global Unconstrained Bond Fund 2023 Annual Report |
Performance review
For the twelve months ended October 31, 2023, Class A shares of BrandywineGLOBAL — Global Unconstrained Bond Fund, excluding sales charges, returned -2.17%. The Fund’s unmanaged benchmark, the FTSE 3-Month U.S. Treasury Bill Indexv, returned 4.94% for the same period.
| | | | | | | | |
Performance Snapshot as of October 31, 2023
(unaudited) | |
| (excluding sales charges) | | 6 months | | | 12 months | |
| BrandywineGLOBAL — Global Unconstrained Bond Fund: | | | | | | | | |
Class A | | | -8.32 | % | | | -2.17 | % |
Class C | | | -8.70 | % | | | -2.92 | % |
Class FI | | | -8.31 | % | | | -2.20 | % |
Class R | | | -8.49 | % | | | -2.41 | % |
Class I | | | -8.20 | % | | | -1.83 | % |
Class IS | | | -8.21 | % | | | -1.87 | % |
| FTSE 3-Month U.S. Treasury Bill Index | |
| 2.72
| %
| |
| 4.94
| %
|
The performance shown represents past performance. Past performance is no guarantee of future results and current performance may be higher or lower than the performance shown above. Principal value, investment returns and yields will fluctuate and investors’ shares, when redeemed, may be worth more or less than their original cost. To obtain performance data current to the most recent month-end, please visit our website at www.franklintempleton.com.
All share class returns assume the reinvestment of all distributions at net asset value and the deduction of all Fund expenses. Returns have not been adjusted to include sales charges that may apply or the deduction of taxes that a shareholder would pay on Fund distributions. If sales charges were reflected, the performance quoted would be lower. Performance figures for periods shorter than one year represent cumulative figures and are not annualized.
Fund performance figures reflect fee waivers and/or expense reimbursements, without which the performance would have been lower.
The 30-Day SEC Yields for the period ended October 31, 2023, for Class A, Class C, Class FI, Class R, Class I and Class IS shares were 6.15%, 5.54%, 6.34%, 5.92%, 6.45% and 6.56%, respectively. The 30-Day SEC Yield, calculated pursuant to the standard SEC formula, is based on the Fund’s investments over an annualized trailing 30-day period, and not on the distributions paid by the Fund, which may differ.
|
| Total Annual Operating Expenses (unaudited) |
As of the Fund’s current prospectus dated March 1, 2023, the gross total annual fund operating expense ratios for Class A, Class C, Class FI, Class R, Class I and Class IS shares were 1.11%, 1.88%, 1.15%, 1.39%, 0.90% and 0.77%, respectively.
Actual expenses may be higher. For example, expenses may be higher than those shown if average net assets decrease. Net assets are more likely to decrease and Fund expense ratios are more likely to increase when markets are volatile.
| | | | | | |
| BrandywineGLOBAL — Global Unconstrained Bond Fund 2023 Annual Report | | | | | 5 | |
Fund overview (cont’d)
As a result of expense limitation arrangements, the ratio of total annual fund operating expenses, other than interest, brokerage commissions, dividend expense on short sales, taxes, extraordinary expenses and acquired fund fees and expenses, to average net assets will not exceed 1.20% for Class A shares, 1.95% for Class C shares, 1.20% for Class FI shares, 1.45% for Class R shares, 0.85% for Class I shares and 0.75% for Class IS shares. In addition, the ratio of total annual fund operating expenses for Class IS shares will not exceed the ratio of total annual fund operating expenses for Class I shares. These expense limitation arrangements cannot be terminated prior to December 31, 2025 without the Board of Trustees’ consent. In addition, the manager has agreed to waive the Fund’s management fee to an extent sufficient to offset the net management fee payable in connection with any investment in an affiliated money market fund. This management fee waiver is not subject to the recapture provision discussed below.
The manager is permitted to recapture amounts waived and/or reimbursed to a class within three years after the fiscal year in which the manager earned the fee or incurred the expense if the class’ total annual fund operating expenses have fallen to a level below the expense limitation (“expense cap”) in effect at the time the fees were earned or the expenses incurred. In no case will the manager recapture any amount that would result, on any particular business day of the Fund, in the class’ total annual fund operating expenses exceeding the expense cap or any other lower limit then in effect.
Q. What were the leading contributors to performance?
A. The Fund’s local emerging market debt overweight provided the strongest contribution to performance over the reporting period. Colombia was the best performing country, from both a rates and FX perspective. Colombia was a value opportunity with peak pessimism on the information risk side, coupled with an extreme valuation anomaly. Information risk was extreme due to fears that President Gustavo Petro would drive the country left and the valuation was cheap because inflation was not falling. As the reporting period progressed, political tensions waned slightly and inflation fell from its peak, thus the strong performance from the currency and the bonds. Partially hedged Brazilian government bonds also contributed to performance from a rates perspective. Brazilian growth has proven more resilient than market expectations. Much of the economic strength came from the agricultural sector, which produced a record grain harvest earlier in 2023. Finally, the Fund’s small overweight to the short end of the corporate investment-grade market was modestly beneficial for performance over the reporting period. Elevated yields have helped offset the minimal interest rate sensitivity present in these holdings.
Q. What were the leading detractors from performance?
A. The Fund’s overweight to U.S. government duration was the largest detractor over the reporting period. The U.S. yield curve has moved higher amidst stickier than expected inflation, an unexpectedly resilient U.S. economy (notably in labor market and GDP forecasts), and a steadfast hawkish Fed. The failure of Silicon Valley Bank led to broader negative price action across the banking sector in March 2023, leading to some rallying at the long end of the curve. Fears of a hard economic landing, and the subsequent rally in long-bonds, proved short-term in nature as the broad market recovered. The long-end of the curve has especially pushed higher since late summer, with the U.S. government credit
| | | | |
6 | | | | BrandywineGLOBAL — Global Unconstrained Bond Fund 2023 Annual Report |
quality downgrade serving as the primary catalyst. Investors have become increasingly concerned about the functioning of the U.S. government. Expansionary fiscal policy in the U.S. has raised concerns around U.S. Treasury technicals, with the supply of bonds increasing while some demand, especially from foreign investors, decreased. Much of the upward moves on the long-end of the curve in late-summer and fall of 2023 resulted more from investor sentiment rather than hard economic data.
The second largest detractor was the Fund’s overweight to the Japanese yen. The currency moved in lockstep with U.S. rates given the interest rate differential between the U.S. and Japan widened significantly. Meanwhile, Japan’s corporate and consumer sectors are accelerating, which points to higher long-term inflation. Current negative interest rate policy from the Bank of Japan appears no longer appropriate. The possibility of FX intervention should prevent further significant weakness in the yen, in our view.
Thank you for your investment in the BrandywineGLOBAL — Global Unconstrained Bond Fund. As always, we appreciate that you have chosen us to manage your assets and we remain focused on achieving the Fund’s investment goals.
Sincerely,

David F. Hoffman, CFA
Portfolio Manager
Brandywine Global Investment Management, LLC

John (“Jack”) P. Mclntyre, CFA
Portfolio Manager
Brandywine Global Investment Management, LLC

Anujeet Sareen, CFA
Portfolio Manager
Brandywine Global Investment Management, LLC
| | | | | | |
| BrandywineGLOBAL — Global Unconstrained Bond Fund 2023 Annual Report | | | | | 7 | |
Fund overview (cont’d)

Brian Kloss, JD, CPA
Portfolio Manager
Brandywine Global Investment Management, LLC

Tracy Chen, CFA, CAIA
Portfolio Manager
Brandywine Global Investment Management, LLC
November 14, 2023
RISKS: Fixed income securities are subject to interest rate, credit, inflation, and reinvestment risks. As interest rates rise, the value of fixed income securities falls. High yield bonds are generally subject to greater price volatility, illiquidity, and possibility of default than investment grade bonds. International investments are subject to special risks, including currency fluctuations and social, economic and political uncertainties, which could increase volatility. These risks are magnified in emerging markets. Emerging market countries tend to have economic, political and legal systems that are less developed and are less stable than those of more developed countries. Sovereign government and supranational debt involve many of the risks of foreign and emerging markets investments as well as the risk of debt moratorium, repudiation or renegotiation and the Fund may be unable to enforce its rights against the issuers. The Fund may be significantly overweight or underweight in certain companies, industries or market sectors, which may cause the Fund’s performance to be more sensitive to developments affecting those companies, industries or market sectors. While the portfolio managers may invest in long positions and short positions, there is the risk that the investments will not perform as expected and losses on one type of position could more than offset gains on the other, or the Fund could lose money on both positions, if the portfolio managers judge the market incorrectly. Short selling is a speculative strategy. Unlike the possible loss on a security that is purchased, there is no limit on the amount of loss on an appreciating security that is sold short. The portfolio manager does not attempt to keep the portfolio structure or the Fund’s performance consistent with any designated stock, bond or market index and during times of market rallies, the Fund may not perform as well as other Funds that seek to outperform an index. Derivatives, such as options and futures, can be illiquid, may disproportionately increase losses, and have a potentially large impact on Fund performance. Leverage may increase volatility and possibility of loss. Active management does not ensure gains or protect against market declines. As a non-diversified fund, it is permitted to invest a larger percentage of its assets in a smaller number of issuers than a diversified fund, which may magnify the Fund’s losses from events affecting a particular issuer. The market values of securities or other assets will fluctuate, sometimes sharply and unpredictably, due to changes in general market conditions, overall economic trends or events, governmental actions or intervention, actions taken by the U.S. Federal Reserve or
| | | | |
8 | | | | BrandywineGLOBAL — Global Unconstrained Bond Fund 2023 Annual Report |
foreign central banks, market disruptions caused by trade disputes or other factors, political developments, armed conflicts, economic sanctions and countermeasures in response to sanctions, major cybersecurity events, investor sentiment, the global and domestic effects of a pandemic, and other factors that may or may not be related to the issuer of the security or other asset. Please see the Fund’s prospectus for a more complete discussion of these and other risks and the Fund’s investment strategies.
Portfolio holdings and breakdowns are as of October 31, 2023 and are subject to change and may not be representative of the portfolio managers’ current or future investments. Please refer to pages 16 through 21 for a list and percentage breakdown of the Fund’s holdings.
All investments are subject to risk including the possible loss of principal. Past performance is no guarantee of future results. All index performance reflects no deduction for fees, expenses or taxes. Please note that an investor cannot invest directly in an index.
The information provided is not intended to be a forecast of future events, a guarantee of future results or investment advice. Views expressed may differ from those of the firm as a whole.
| i | The Bloomberg Global Aggregate Index is a market-weighted index of global government, government-related agencies, corporate and securitized fixed-income investments. |
| ii | The Bloomberg U.S. Aggregate Index is a broad-based bond index comprised of government, corporate, mortgage and asset-backed issues, rated investment grade or higher, and having at least one year to maturity. |
| iii | The Bloomberg U.S. Corporate High Yield — 2% Issuer Cap Index is an index of the 2% Issuer Cap component of the Bloomberg U.S. Corporate High Yield Index, which covers the U.S. dollar-denominated, non-investment grade, fixed-rate, taxable corporate bond market. |
| iv | The JPMorgan Emerging Markets Bond Index Global tracks total returns for U.S. dollar-denominated debt instruments issued by emerging market sovereign and quasi-sovereign entities: Brady bonds, loans, Eurobonds and local market instruments. |
| v | The FTSE 3-Month U.S. Treasury Bill Index is an unmanaged index generally representative of the average yield of 3-month U.S. Treasury bills. |
| | | | | | |
| BrandywineGLOBAL — Global Unconstrained Bond Fund 2023 Annual Report | | | | | 9 | |
Fund at a glance† (unaudited)
Investment breakdown (%) as a percent of total investments
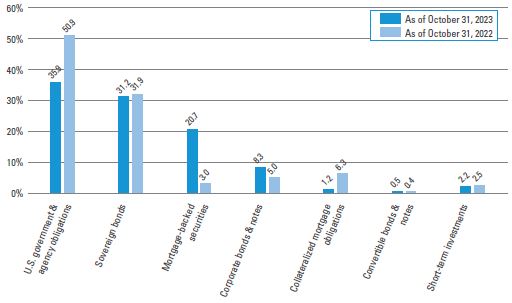
| † | The bar graph above represents the composition of the Fund’s investments as of October 31, 2023 and October 31, 2022 and does not include derivatives, such as futures contracts and forward foreign currency contracts. The Fund is actively managed. As a result, the composition of the Fund’s investments is subject to change at any time. |
| | | | |
10 | | | | BrandywineGLOBAL — Global Unconstrained Bond Fund 2023 Annual Report |
Fund expenses (unaudited)
Example
As a shareholder of the Fund, you may incur two types of costs: (1) transaction costs, including front-end and back-end sales charges (loads) on purchase payments; and (2) ongoing costs, including management fees; service and/or distribution (12b-1) fees; and other Fund expenses. This example is intended to help you understand your ongoing costs (in dollars) of investing in the Fund and to compare these costs with the ongoing costs of investing in other mutual funds.
This example is based on an investment of $1,000 invested on May 1, 2023 and held for the six months ended October 31, 2023.
Actual expenses
The table below titled “Based on actual total return” provides information about actual account values and actual expenses. You may use the information provided in this table, together with the amount you invested, to estimate the expenses that you paid over the period. To estimate the expenses you paid on your account, divide your ending account value by $1,000 (for example, an $8,600 ending account value divided by $1,000 = 8.6), then multiply the result by the number under the heading entitled “Expenses Paid During the Period”.
Hypothetical example for comparison purposes
The table below titled “Based on hypothetical total return” provides information about hypothetical account values and hypothetical expenses based on the actual expense ratio and an assumed rate of return of 5.00% per year before expenses, which is not the Fund’s actual return. The hypothetical account values and expenses may not be used to estimate the actual ending account balance or expenses you paid for the period. You may use the information provided in this table to compare the ongoing costs of investing in the Fund and other funds. To do so, compare the 5.00% hypothetical example relating to the Fund with the 5.00% hypothetical examples that appear in the shareholder reports of the other funds.
Please note that the expenses shown in the table below are meant to highlight your ongoing costs only and do not reflect any transactional costs, such as front-end or back-end sales charges (loads). Therefore, the table is useful in comparing ongoing costs only, and will not help you determine the relative total costs of owning different funds. In addition, if these transaction costs were included, your costs would have been higher.
| | | | | | | | | | | | | | | | | | | | | | | | | | | | | | | | | | | | | | | | | | | | | | | | | | | | | | | | | |
| | | |
| Based on actual total return1 | | | | | | Based on hypothetical total return1 |
| | | Actual
Total Return
Without
Sales
Charge2 | | Beginning
Account
Value | | Ending
Account
Value | | Annualized
Expense
Ratio | | Expenses
Paid During
the
Period3 | | | | | | Hypothetical
Annualized
Total Return | | Beginning Account Value | | Ending
Account
Value | | Annualized
Expense
Ratio | | Expenses
Paid During
the
Period3 |
| Class A | | | | -8.32 | % | | | $ | 1,000.00 | | | | $ | 916.80 | | | | | 1.01 | % | | | $ | 4.88 | | | | | | | | Class A | | | | 5.00 | % | | | $ | 1,000.00 | | | | $ | 1,020.11 | | | | | 1.01 | % | | | $ | 5.14 | |
| Class C | | | | -8.70 | | | | | 1,000.00 | | | | | 913.00 | | | | | 1.76 | | | | | 8.49 | | | | | | | | Class C | | | | 5.00 | | | | | 1,000.00 | | | | | 1,016.33 | | | | | 1.76 | | | | | 8.94 | |
| Class FI | | | | -8.31 | | | | | 1,000.00 | | | | | 916.90 | | | | | 0.99 | | | | | 4.78 | | | | | | | | Class FI | | | | 5.00 | | | | | 1,000.00 | | | | | 1,020.21 | | | | | 0.99 | | | | | 5.04 | |
| Class R | | | | -8.49 | | | | | 1,000.00 | | | | | 915.10 | | | | | 1.31 | | | | | 6.32 | | | | | | | | Class R | | | | 5.00 | | | | | 1,000.00 | | | | | 1,018.60 | | | | | 1.31 | | | | | 6.67 | |
| Class I | | | | -8.20 | | | | | 1,000.00 | | | | | 918.00 | | | | | 0.85 | | | | | 4.11 | | | | | | | | Class I | | | | 5.00 | | | | | 1,000.00 | | | | | 1,020.92 | | | | | 0.85 | | | | | 4.33 | |
| Class IS | | | | -8.21 | | | | | 1,000.00 | | | | | 917.90 | | | | | 0.75 | | | | | 3.63 | | | | | | | | Class IS | | | | 5.00 | | | | | 1,000.00 | | | | | 1,021.42 | | | | | 0.75 | | | | | 3.82 | |
| | | | | | |
| BrandywineGLOBAL — Global Unconstrained Bond Fund 2023 Annual Report | | | | | 11 | |
Fund expenses (unaudited) (cont’d)
| 1 | For the six months ended October 31, 2023. |
| 2 | Assumes the reinvestment of all distributions, including returns of capital, if any, at net asset value and does not reflect the deduction of the applicable sales charge with respect to Class A shares or the applicable contingent deferred sales charge (“CDSC”) with respect to Class C shares. Total return is not annualized, as it may not be representative of the total return for the year. Performance figures may reflect compensating balance arrangements, fee waivers and/or expense reimbursements. In the absence of compensating balance arrangements, fee waivers and/or expense reimbursements, the total return would have been lower. Past performance is no guarantee of future results. |
| 3 | Expenses (net of compensating balance arrangements, fee waivers and/or expense reimbursements) are equal to each class’ respective annualized expense ratio multiplied by the average account value over the period, multiplied by the number of days in the most recent fiscal half-year (184), then divided by 365. |
| | | | |
12 | | | | BrandywineGLOBAL — Global Unconstrained Bond Fund 2023 Annual Report |
Fund performance (unaudited)
| | | | | | | | | | | | | | | | | | | | | | | | |
| Average annual total returns | | | | | | | | | | | | | |
| Without sales charges1 | | Class A | | | Class C | | | Class FI | | | Class R | | | Class I | | | Class IS | |
| Twelve Months Ended 10/31/23 | | | -2.17 | % | | | -2.92 | % | | | -2.20 | % | | | -2.41 | % | | | -1.83 | % | | | -1.87 | % |
| Five Years Ended 10/31/23 | | | -0.05 | | | | -0.69 | | | | 0.07 | | | | -0.31 | | | | 0.26 | | | | 0.36 | |
| Ten Years Ended 10/31/23 | | | 0.50 | | | | -0.14 | | | | 0.56 | | | | 0.24 | | | | 0.83 | | | | 0.95 | |
| | | | | | |
| With sales charges2 | | Class A | | | Class C | | | Class FI | | | Class R | | | Class I | | | Class IS | |
| Twelve Months Ended 10/31/23 | | | -4.34 | % | | | -3.87 | % | | | -2.20 | % | | | -2.41 | % | | | -1.83 | % | | | -1.87 | % |
| Five Years Ended 10/31/23 | | | -0.52 | | | | -0.69 | | | | 0.07 | | | | -0.31 | | | | 0.26 | | | | 0.36 | |
| Ten Years Ended 10/31/23 | | | 0.27 | | | | -0.14 | | | | 0.56 | | | | 0.24 | | | | 0.83 | | | | 0.95 | |
| | | | |
| Cumulative total returns | | | |
| Without sales charges1 | | | |
| Class A (10/31/13 through 10/31/23) | | | 5.16 | % |
| Class C (10/31/13 through 10/31/23) | | | -1.38 | |
| Class FI (10/31/13 through 10/31/23) | | | 5.73 | |
| Class R (10/31/13 through 10/31/23) | | | 2.44 | |
| Class I (10/31/13 through 10/31/23) | | | 8.66 | |
| Class IS (10/31/13 through 10/31/23) | | | 9.88 | |
All figures represent past performance and are not a guarantee of future results. Investment return and principal value of an investment will fluctuate so that an investor’s shares, when redeemed, may be worth more or less than their original cost. The returns shown do not reflect the deduction of taxes that a shareholder would pay on Fund distributions or the redemption of Fund shares. Performance figures may reflect compensating balance arrangements, fee waivers and/or expense reimbursements. In the absence of compensating balance arrangements, fee waivers and/or expense reimbursements, the total return would have been lower.
| 1 | Assumes the reinvestment of all distributions, including returns of capital, if any, at net asset value and does not reflect the deduction of the applicable sales charge with respect to Class A shares or the applicable contingent deferred sales charge (“CDSC”) with respect to Class C shares. |
| 2 | Assumes the reinvestment of all distributions, including returns of capital, if any, at net asset value. In addition, Class A shares reflect the deduction of the maximum initial sales charge of 2.25%. Class C shares reflect the deduction of a 1.00% CDSC, which applies if shares are redeemed within one year from purchase payment. |
| | | | | | |
| BrandywineGLOBAL — Global Unconstrained Bond Fund 2023 Annual Report | | | | | 13 | |
Fund performance (unaudited) (cont’d)
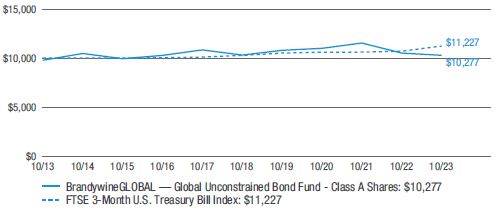
Historical performance
Value of $10,000 invested in
Class A Shares of BrandywineGLOBAL — Global Unconstrained Bond Fund vs. FTSE 3-Month U.S. Treasury Bill Index† — October 2013 - October 2023
Value of $1,000,000 invested in
Class I Shares of BrandywineGLOBAL — Global Unconstrained Bond Fund vs. FTSE 3-Month U.S. Treasury Bill Index† — October 2013 - October 2023
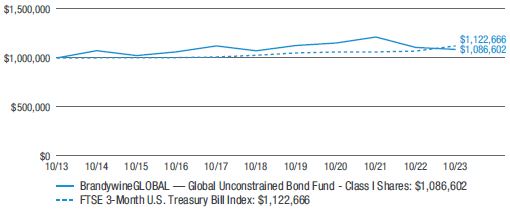
All figures represent past performance and are not a guarantee of future results. Investment return and principal value of an investment will fluctuate so that an investor’s shares, when redeemed, may be worth more or less than their original cost. The returns shown do not reflect the deduction of taxes that a shareholder would pay on Fund distributions or the redemption of Fund shares. Performance figures may reflect compensating balance arrangements, fee waivers and/or expense reimbursements. In the absence of compensating balance arrangements, fee waivers and/or expense reimbursements, the total return would have been lower.
| | | | |
14 | | | | BrandywineGLOBAL — Global Unconstrained Bond Fund 2023 Annual Report |
| † | Hypothetical illustration of $10,000 invested in Class A shares and $1,000,000 invested in Class I shares of BrandywineGLOBAL — Global Unconstrained Bond Fund on October 31, 2013, assuming the deduction of the maximum initial sales charge of 2.25% at the time of investment for Class A shares and the reinvestment of all distributions, including returns of capital, if any, at net asset value through October 31, 2023. The hypothetical illustration also assumes a $10,000 or $1,000,000 investment, as applicable, in the FTSE 3-Month U.S. Treasury Bill Index. The FTSE 3-Month U.S. Treasury Bill Index (the “Index”) is an index generally representative of the average yield of 3-month U.S. Treasury bills. It is comprised of a single issue purchased at the beginning of the month and held for a full month. Each month the Index is rebalanced and the issue selected is the outstanding U.S. Treasury Bill that matures closest to, but not beyond 3 months from the rebalancing date. The Index is unmanaged and is not subject to the same management and trading expenses as a mutual fund. Please note that an investor cannot invest directly in an index. The performance of the Fund’s other classes may be greater or less than the Class A and I shares’ performance indicated on these charts, depending on whether greater or lesser sales charges and fees were incurred by shareholders investing in the other classes. |
| | | | | | |
| BrandywineGLOBAL — Global Unconstrained Bond Fund 2023 Annual Report | | | | | 15 | |
Schedule of investments
October 31, 2023
BrandywineGLOBAL — Global Unconstrained Bond Fund
(Percentages shown based on Fund net assets)
| | | | | | | | | | | | | | | | |
| Security | | Rate | | | Maturity
Date | | | Face
Amount† | | | Value | |
| U.S. Government & Agency Obligations — 35.4% | |
U.S. Government Obligations — 35.4% | |
U.S. Treasury Notes (3 mo. U.S. Treasury Money Market Yield + 0.200%) | | | 4.931 | % | | | 1/31/25 | | | | 2,330,000 | | | $ | 2,334,055 | (a) |
U.S. Treasury Notes (3 mo. U.S. Treasury Money Market Yield + 0.169%) | | | 5.567 | % | | | 4/30/25 | | | | 51,080,000 | | | | 51,134,409 | (a) |
U.S. Treasury Notes | | | 2.750 | % | | | 8/15/32 | | | | 32,040,000 | | | | 27,108,844 | |
Total U.S. Government & Agency Obligations (Cost — $82,309,585) | | | | 80,577,308 | |
| Sovereign Bonds — 30.7% | |
Brazil — 9.7% | |
Brazil Notas do Tesouro Nacional Serie F, Notes | | | 10.000 | % | | | 1/1/31 | | | | 103,300,000 | BRL | | | 18,822,415 | |
Brazil Notas do Tesouro Nacional Serie F, Notes | | | 10.000 | % | | | 1/1/33 | | | | 18,140,000 | BRL | | | 3,245,727 | |
Total Brazil | | | | | | | | | | | | | | | 22,068,142 | |
Colombia — 6.6% | |
Colombian TES, Bonds | | | 9.250 | % | | | 5/28/42 | | | | 28,850,000,000 | COP | | | 5,596,133 | |
Colombian TES, Bonds | | | 7.250 | % | | | 10/26/50 | | | | 61,450,000,000 | COP | | | 9,387,287 | |
Total Colombia | | | | | | | | | | | | | | | 14,983,420 | |
Mexico — 5.8% | |
Mexican Bonos, Bonds | | | 8.000 | % | | | 11/7/47 | | | | 88,300,000 | MXN | | | 3,976,757 | |
Mexican Bonos, Bonds | | | 8.000 | % | | | 7/31/53 | | | | 206,000,000 | MXN | | | 9,192,017 | |
Total Mexico | | | | | | | | | | | | | | | 13,168,774 | |
New Zealand — 2.4% | |
New Zealand Government Bond | | | 2.750 | % | | | 5/15/51 | | | | 15,730,000 | NZD | | | 5,453,360 | |
South Africa — 4.0% | |
Republic of South Africa Government Bond, Senior Notes | | | 8.750 | % | | | 2/28/48 | | | | 246,000,000 | ZAR | | | 9,252,636 | |
United Kingdom — 2.2% | |
United Kingdom Gilt, Bonds | | | 1.250 | % | | | 7/31/51 | | | | 9,150,000 | GBP | | | 4,963,938 | (b) |
Total Sovereign Bonds (Cost — $74,670,993) | | | | 69,890,270 | |
| Mortgage-Backed Securities — 20.4% | |
FHLMC — 7.2% | |
Federal Home Loan Mortgage Corp. (FHLMC) | | | 5.000 | % | | | 8/1/52-11/1/52 | | | | 5,134,047 | | | | 4,745,144 | |
Federal Home Loan Mortgage Corp. (FHLMC) | | | 4.500 | % | | | 9/1/52-10/1/52 | | | | 6,280,418 | | | | 5,617,251 | |
Federal Home Loan Mortgage Corp. (FHLMC) | | | 5.500 | % | | | 12/1/52 | | | | 6,433,954 | | | | 6,112,757 | |
Total FHLMC | | | | | | | | | | | | | | | 16,475,152 | |
See Notes to Financial Statements.
| | | | |
16 | | | | BrandywineGLOBAL — Global Unconstrained Bond Fund 2023 Annual Report |
BrandywineGLOBAL — Global Unconstrained Bond Fund
(Percentages shown based on Fund net assets)
| | | | | | | | | | | | | | | | |
| Security | | Rate | | | Maturity
Date | | | Face
Amount† | | | Value | |
FNMA — 8.2% | | | | | | | �� | | | | | | | | | |
Federal National Mortgage Association (FNMA) | | | 4.500 | % | | | 9/1/52 | | | | 5,098,381 | | | $ | 4,559,980 | |
Federal National Mortgage Association (FNMA) | | | 5.000 | % | | | 10/1/52-12/1/52 | | | | 8,891,765 | | | | 8,209,910 | |
Federal National Mortgage Association (FNMA) | | | 5.500 | % | | | 12/1/52 | | | | 6,074,138 | | | | 5,770,589 | |
Total FNMA | | | | | | | | | | | | | | | 18,540,479 | |
GNMA — 5.0% | | | | | | | | | | | | | | | | |
Government National Mortgage Association (GNMA) II | | | 5.500 | % | | | 2/20/53-6/20/53 | | | | 11,979,526 | | | | 11,469,441 | |
Total Mortgage-Backed Securities (Cost — $49,049,953) | | | | | | | | 46,485,072 | |
| Corporate Bonds & Notes — 8.2% | | | | | | | | | | | | | | | | |
| Consumer Discretionary — 4.2% | | | | | | | | | | | | | | | | |
Automobiles — 4.2% | | | | | | | | | | | | | | | | |
General Motors Financial Co. Inc., Senior Notes | | | 5.400 | % | | | 4/6/26 | | | | 4,870,000 | | | | 4,767,330 | |
Toyota Motor Credit Corp., Senior Notes | | | 4.450 | % | | | 5/18/26 | | | | 4,850,000 | | | | 4,738,512 | |
Total Consumer Discretionary | | | | | | | | 9,505,842 | |
| Energy — 1.0% | | | | | | | | | | | | | | | | |
Oil, Gas & Consumable Fuels — 1.0% | | | | | | | | | | | | | | | | |
Petroleos Mexicanos, Senior Notes | | | 6.950 | % | | | 1/28/60 | | | | 4,090,000 | | | | 2,319,201 | |
| Financials — 2.4% | | | | | | | | | | | | | | | | |
Banks — 2.4% | | | | | | | | | | | | | | | | |
Commonwealth Bank of Australia, Senior Notes (SOFR + 0.740%) | | | 6.084 | % | | | 3/14/25 | | | | 5,440,000 | | | | 5,456,911 | (a)(c) |
| Information Technology — 0.6% | | | | | | | | | | | | | | | | |
Electronic Equipment, Instruments & Components — 0.6% | | | | | | | | | | | | | |
Jabil Inc., Senior Notes | | | 3.000 | % | | | 1/15/31 | | | | 1,770,000 | | | | 1,402,959 | |
Total Corporate Bonds & Notes (Cost — $19,435,051) | | | | | | | | 18,684,913 | |
| Collateralized Mortgage Obligations (d) —1.2% | | | | | | | | | | | | | | | | |
Federal Home Loan Mortgage Corp. (FHLMC) Multifamily Structured Pass-Through Certificates, K087 A2 (Cost — $3,001,307) | | | 3.771 | % | | | 12/25/28 | | | | 2,850,000 | | | | 2,644,345 | |
| Convertible Bonds & Notes — 0.5% | | | | | | | | | | | | | | | | |
| Communication Services — 0.5% | | | | | | | | | | | | | | | | |
Media — 0.5% | | | | | | | | | | | | | | | | |
DISH Network Corp., Senior Notes (Cost — $2,040,005) | | | 3.375 | % | | | 8/15/26 | | | | 1,980,000 | | | | 1,024,650 | |
Total Investments before Short-Term Investments (Cost — $230,506,894) | | | | | �� | | | 219,306,558 | |
See Notes to Financial Statements.
| | | | | | |
| BrandywineGLOBAL — Global Unconstrained Bond Fund 2023 Annual Report | | | | | 17 | |
Schedule of investments (cont’d)
October 31, 2023
BrandywineGLOBAL — Global Unconstrained Bond Fund
(Percentages shown based on Fund net assets)
| | | | | | | | | | | | | | | | |
| Security | | | | | Rate | | | Shares | | | Value | |
| Short-Term Investments — 2.1% | | | | | | | | | | | | | | | | |
Western Asset Premier Institutional U.S. Treasury Reserves, Premium Shares (Cost — $4,850,260) | | | | | | | 5.315% | | | | 4,850,260 | | | $ | 4,850,260 | (e)(f) |
Total Investments — 98.5% (Cost — $235,357,154) | | | | | | | | 224,156,818 | |
Other Assets in Excess of Liabilities — 1.5% | | | | | | | | | | | | | | | 3,453,520 | |
Total Net Assets — 100.0% | | | | | | | | | | | | | | $ | 227,610,338 | |
| † | Face amount denominated in U.S. dollars, unless otherwise noted. |
| (a) | Variable rate security. Interest rate disclosed is as of the most recent information available. Certain variable rate securities are not based on a published reference rate and spread but are determined by the issuer or agent and are based on current market conditions. These securities do not indicate a reference rate and spread in their description above. |
| (b) | Security is exempt from registration under Regulation S of the Securities Act of 1933. Regulation S applies to securities offerings that are made outside of the United States and do not involve direct selling efforts in the United States. This security has been deemed liquid pursuant to guidelines approved by the Board of Trustees. |
| (c) | Security is exempt from registration under Rule 144A of the Securities Act of 1933. This security may be resold in transactions that are exempt from registration, normally to qualified institutional buyers. This security has been deemed liquid pursuant to guidelines approved by the Board of Trustees. |
| (d) | Collateralized mortgage obligations are secured by an underlying pool of mortgages or mortgage pass-through certificates that are structured to direct payments on underlying collateral to different series or classes of the obligations. The interest rate may change positively or inversely in relation to one or more interest rates, financial indices or other financial indicators and may be subject to an upper and/or lower limit. |
| (e) | Rate shown is one-day yield as of the end of the reporting period. |
| (f) | In this instance, as defined in the Investment Company Act of 1940, an “Affiliated Company” represents Fund ownership of at least 5% of the outstanding voting securities of an issuer, or a company which is under common ownership or control with the Fund. At October 31, 2023, the total market value of investments in Affiliated Companies was $4,850,260 and the cost was $4,850,260 (Note 8). |
| | |
Abbreviation(s) used in this schedule: |
| |
| BRL | | — Brazilian Real |
| |
| COP | | — Colombian Peso |
| |
| GBP | | — British Pound |
| |
| MXN | | — Mexican Peso |
| |
| NZD | | — New Zealand Dollar |
| |
| SOFR | | — Secured Overnight Financing Rate |
| |
| ZAR | | — South African Rand |
See Notes to Financial Statements.
| | | | |
18 | | | | BrandywineGLOBAL — Global Unconstrained Bond Fund 2023 Annual Report |
BrandywineGLOBAL — Global Unconstrained Bond Fund
At October 31, 2023, the Fund had the following open futures contracts:
| | | | | | | | | | | | | | | | | | | | |
| | | Number of
Contracts | | | Expiration
Date | | | Notional
Amount | | | Market
Value | | | Unrealized
Appreciation
(Depreciation) | |
| Contracts to Buy: | | | | | | | | | | | | | | | | | | | | |
| U.S. Treasury 10-Year Notes | | | 831 | | | | 12/23 | | | $ | 91,476,438 | | | $ | 88,228,832 | | | $ | (3,247,606) | |
| Contracts to Sell: | | | | | | | | | | | | | | | | | | | | |
| Japanese 10-Year Bonds | | | 35 | | | | 12/23 | | | | 33,763,776 | | | | 33,193,139 | | | | 570,637 | |
| Net unrealized depreciation on open futures contracts | | | | | | | $ | (2,676,969) | |
At October 31, 2023, the Fund had the following open forward foreign currency contracts:
| | | | | | | | | | | | | | | | | | | | |
Currency
Purchased | | | Currency
Sold | | | Counterparty | | Settlement
Date | | | Unrealized
Appreciation
(Depreciation) | |
| USD | | | 4,563,319 | | | EUR | | | 4,140,000 | | | Citibank N.A. | | | 11/7/23 | | | $ | 181,576 | |
| USD | | | 285,344 | | | EUR | | | 260,000 | | | HSBC Securities Inc. | | | 11/7/23 | | | | 10,163 | |
| EUR | | | 23,340,000 | | | USD | | | 25,820,225 | | | JPMorgan Chase & Co. | | | 11/7/23 | | | | (1,117,356) | |
| USD | | | 16,900,000 | | | EUR | | | 16,000,000 | | | JPMorgan Chase & Co. | | | 11/7/23 | | | | (34,272) | |
| EUR | | | 4,380,000 | | | USD | | | 4,781,383 | | | Morgan Stanley & Co. Inc. | | | 11/7/23 | | | | (145,626) | |
| USD | | | 7,348,795 | | | EUR | | | 6,980,000 | | | Standard Chartered PLC | | | 11/7/23 | | | | (38,781) | |
| USD | | | 363,617 | | | EUR | | | 340,000 | | | UBS Securities LLC | | | 11/7/23 | | | | 3,763 | |
| CLP | | | 6,760,000,000 | | | USD | | | 7,868,425 | | | HSBC Securities Inc. | | | 11/8/23 | | | | (318,727) | |
| PEN | | | 1,500,000 | | | USD | | | 405,077 | | | HSBC Securities Inc. | | | 11/8/23 | | | | (14,753) | |
| PEN | | | 1,840,000 | | | USD | | | 476,437 | | | HSBC Securities Inc. | | | 11/8/23 | | | | 2,360 | |
| PEN | | | 3,480,000 | | | USD | | | 912,428 | | | HSBC Securities Inc. | | | 11/8/23 | | | | (6,877) | |
| PEN | | | 3,740,000 | | | USD | | | 974,466 | | | HSBC Securities Inc. | | | 11/8/23 | | | | (1,259) | |
| PEN | | | 3,770,000 | | | USD | | | 984,334 | | | HSBC Securities Inc. | | | 11/8/23 | | | | (3,321) | |
| PEN | | | 4,000,000 | | | USD | | | 1,051,525 | | | HSBC Securities Inc. | | | 11/8/23 | | | | (10,662) | |
| PEN | | | 4,290,000 | | | USD | | | 1,123,037 | | | HSBC Securities Inc. | | | 11/8/23 | | | | (6,711) | |
| PEN | | | 5,370,000 | | | USD | | | 1,408,709 | | | HSBC Securities Inc. | | | 11/8/23 | | | | (11,351) | |
| PEN | | | 11,230,000 | | | USD | | | 2,911,816 | | | HSBC Securities Inc. | | | 11/8/23 | | | | 10,407 | |
| USD | | | 3,676,511 | | | CLP | | | 3,340,000,000 | | | HSBC Securities Inc. | | | 11/8/23 | | | | (53,665) | |
| USD | | | 3,792,836 | | | CLP | | | 3,420,000,000 | | | HSBC Securities Inc. | | | 11/8/23 | | | | (26,686) | |
| USD | | | 10,513,900 | | | PEN | | | 39,220,000 | | | HSBC Securities Inc. | | | 11/8/23 | | | | 308,239 | |
| HUF | | | 2,550,000,000 | | | USD | | | 6,954,103 | | | Barclays Bank PLC | | | 11/14/23 | | | | 83,279 | |
| USD | | | 14,198,514 | | | HUF | | | 5,350,000,000 | | | Barclays Bank PLC | | | 11/14/23 | | | | (566,189) | |
| HUF | | | 1,820,000,000 | | | USD | | | 5,127,483 | | | Morgan Stanley & Co. Inc. | | | 11/14/23 | | | | (104,724) | |
| HUF | | | 3,530,000,000 | | | USD | | | 9,802,560 | | | Morgan Stanley & Co. Inc. | | | 11/14/23 | | | | (60,616) | |
| ZAR | | | 18,000,000 | | | USD | | | 948,578 | | | Barclays Bank PLC | | | 11/15/23 | | | | 15,928 | |
| USD | | | 10,034,401 | | | ZAR | | | 189,600,000 | | | Goldman Sachs Group Inc. | | | 11/15/23 | | | | (125,059) | |
| ZAR | | | 4,800,000 | | | USD | | | 254,009 | | | HSBC Securities Inc. | | | 11/15/23 | | | | 3,193 | |
| ZAR | | | 120,500,000 | | | USD | | | 6,416,195 | | | Morgan Stanley & Co. Inc. | | | 11/15/23 | | | | 40,634 | |
See Notes to Financial Statements.
| | | | | | |
| BrandywineGLOBAL — Global Unconstrained Bond Fund 2023 Annual Report | | | | | 19 | |
Schedule of investments (cont’d)
October 31, 2023
BrandywineGLOBAL — Global Unconstrained Bond Fund
| | | | | | | | | | | | | | | | | | | | |
Currency
Purchased | | | Currency
Sold | | | Counterparty | | Settlement
Date | | | Unrealized
Appreciation
(Depreciation) | |
| USD | | | 9,803,295 | | | CZK | | | 230,000,000 | | | Barclays Bank PLC | | | 11/16/23 | | | $ | (95,963) | |
| CZK | | | 163,000,000 | | | USD | | | 7,071,430 | | | Citibank N.A. | | | 11/16/23 | | | | (55,869) | |
| CZK | | | 281,000,000 | | | USD | | | 12,353,549 | | | Citibank N.A. | | | 11/16/23 | | | | (259,239) | |
| USD | | | 9,373,796 | | | CZK | | | 219,000,000 | | | Goldman Sachs Group Inc. | | | 11/16/23 | | | | (52,019) | |
| CZK | | | 169,000,000 | | | USD | | | 7,379,784 | | | Morgan Stanley & Co. Inc. | | | 11/16/23 | | | | (105,982) | |
| USD | | | 6,959,592 | | | CZK | | | 164,000,000 | | | Morgan Stanley & Co. Inc. | | | 11/16/23 | | | | (99,009) | |
| CNH | | | 57,130,000 | | | USD | | | 7,933,180 | | | JPMorgan Chase & Co. | | | 11/17/23 | | | | (141,549) | |
| USD | | | 7,897,101 | | | CNH | | | 57,130,000 | | | JPMorgan Chase & Co. | | | 11/17/23 | | | | 105,470 | |
| GBP | | | 6,700,000 | | | USD | | | 8,507,158 | | | Barclays Bank PLC | | | 12/8/23 | | | | (361,397) | |
| GBP | | | 560,000 | | | USD | | | 703,795 | | | HSBC Securities Inc. | | | 12/8/23 | | | | (22,955) | |
| GBP | | | 600,000 | | | USD | | | 731,937 | | | HSBC Securities Inc. | | | 12/8/23 | | | | (2,466) | |
| GBP | | | 3,960,000 | | | USD | | | 5,037,417 | | | JPMorgan Chase & Co. | | | 12/8/23 | | | | (222,908) | |
| GBP | | | 4,440,000 | | | USD | | | 5,397,708 | | | JPMorgan Chase & Co. | | | 12/8/23 | | | | 378 | |
| USD | | | 25,486,991 | | | GBP | | | 20,270,000 | | | JPMorgan Chase & Co. | | | 12/8/23 | | | | 843,027 | |
| INR | | | 1,058,300,000 | | | USD | | | 12,665,302 | | | Barclays Bank PLC | | | 12/11/23 | | | | 32,059 | |
| USD | | | 12,709,259 | | | INR | | | 1,058,300,000 | | | Barclays Bank PLC | | | 12/11/23 | | | | 11,898 | |
| USD | | | 49,315,348 | | | CHF | | | 43,560,000 | | | Goldman Sachs Group Inc. | | | 12/12/23 | | | | 1,196,580 | |
| USD | | | 7,572,692 | | | JPY | | | 1,119,000,000 | | | Barclays Bank PLC | | | 12/15/23 | | | | 132,930 | |
| USD | | | 12,331,212 | | | JPY | | | 1,791,000,000 | | | Citibank N.A. | | | 12/15/23 | | | | 423,604 | |
| JPY | | | 7,956,000,000 | | | USD | | | 54,764,724 | | | JPMorgan Chase & Co. | | | 12/15/23 | | | | (1,868,617) | |
| USD | | | 7,053,735 | | | JPY | | | 1,047,000,000 | | | Morgan Stanley & Co. Inc. | | | 12/15/23 | | | | 92,671 | |
| USD | | | 7,069,994 | | | JPY | | | 1,060,000,000 | | | Morgan Stanley & Co. Inc. | | | 12/15/23 | | | | 22,499 | |
| USD | | | 5,822,572 | | | NZD | | | 9,740,000 | | | Barclays Bank PLC | | | 1/12/24 | | | | 146,606 | |
| NOK | | | 183,300,000 | | | USD | | | 17,048,942 | | | Morgan Stanley & Co. Inc. | | | 1/18/24 | | | | (603,197) | |
| USD | | | 7,028,481 | | | NOK | | | 77,000,000 | | | Morgan Stanley & Co. Inc. | | | 1/18/24 | | | | 120,012 | |
| USD | | | 9,854,180 | | | NOK | | | 106,300,000 | | | Morgan Stanley & Co. Inc. | | | 1/18/24 | | | | 316,904 | |
| BRL | | | 41,240,000 | | | USD | | | 8,257,083 | | | HSBC Securities Inc. | | | 1/19/24 | | | | (153,813) | |
| USD | | | 22,365,928 | | | BRL | | | 114,480,000 | | | HSBC Securities Inc. | | | 1/19/24 | | | | (128,311) | |
| CLP | | | 2,140,000,000 | | | USD | | | 2,312,389 | | | Morgan Stanley & Co. Inc. | | | 1/26/24 | | | | 65,903 | |
| CLP | | | 4,160,000,000 | | | USD | | | 4,464,477 | | | Morgan Stanley & Co. Inc. | | | 1/26/24 | | | | 158,744 | |
| COP | | | 12,300,000,000 | | | USD | | | 2,925,507 | | | JPMorgan Chase & Co. | | | 1/30/24 | | | | (358) | |
| USD | | | 2,846,135 | | | COP | | | 12,300,000,000 | | | JPMorgan Chase & Co. | | | 1/30/24 | | | | (79,013) | |
| EUR | | | 15,560,000 | | | USD | | | 16,510,171 | | | JPMorgan Chase & Co. | | | 2/7/24 | | | | 31,257 | |
| Net unrealized depreciation on open forward foreign currency contracts | | | | | | $ | (2,539,216) | |
See Notes to Financial Statements.
| | | | |
20 | | | | BrandywineGLOBAL — Global Unconstrained Bond Fund 2023 Annual Report |
BrandywineGLOBAL — Global Unconstrained Bond Fund
| | |
Abbreviation(s) used in this table: |
| |
| BRL | | — Brazilian Real |
| |
| CHF | | — Swiss Franc |
| |
| CLP | | — Chilean Peso |
| |
| CNH | | — Chinese Offshore Yuan |
| |
| COP | | — Colombian Peso |
| |
| CZK | | — Czech Koruna |
| |
| EUR | | — Euro |
| |
| GBP | | — British Pound |
| |
| HUF | | — Hungarian Forint |
| |
| INR | | — Indian Rupee |
| |
| JPY | | — Japanese Yen |
| |
| NOK | | — Norwegian Krone |
| |
| NZD | | — New Zealand Dollar |
| |
| PEN | | — Peruvian Nuevo Sol |
| |
| USD | | — United States Dollar |
| |
| ZAR | | — South African Rand |
| | | | |
| Summary of Investments by Country* (unaudited) | | | |
| United States | | | 63.2 | % |
| Brazil | | | 9.9 | |
| Mexico | | | 6.9 | |
| Colombia | | | 6.7 | |
| South Africa | | | 4.1 | |
| Australia | | | 2.4 | |
| New Zealand | | | 2.4 | |
| United Kingdom | | | 2.2 | |
| Short-Term Investments | | | 2.2 | |
| | | | 100.0 | % |
| * | As a percentage of total investments. Please note that the Fund holdings are as of October 31, 2023 and are subject to change. |
See Notes to Financial Statements.
| | | | | | |
| BrandywineGLOBAL — Global Unconstrained Bond Fund 2023 Annual Report | | | | | 21 | |
Statement of assets and liabilities
October 31, 2023
| | | | |
| |
| Assets: | | | | |
Investments in unaffiliated securities, at value (Cost — $230,506,894) | | $ | 219,306,558 | |
Investments in affiliated securities, at value (Cost — $4,850,260) | | | 4,850,260 | |
Unrealized appreciation on forward foreign currency contracts | | | 4,360,084 | |
Deposits with brokers for open futures contracts | | | 2,734,176 | |
Interest receivable | | | 2,488,237 | |
Deposits with brokers for OTC derivatives | | | 750,000 | |
Foreign currency collateral for open futures contracts, at value (Cost — $462,604) | | | 457,629 | |
Receivable for Fund shares sold | | | 204,014 | |
Receivable from brokers — net variation margin on open futures contracts | | | 74,196 | |
Dividends receivable from affiliated investments | | | 28,759 | |
Deposits with brokers | | | 1,000 | |
Prepaid expenses | | | 14,652 | |
Total Assets | | | 235,269,565 | |
| |
| Liabilities: | | | | |
Unrealized depreciation on forward foreign currency contracts | | | 6,899,300 | |
Payable for Fund shares repurchased | | | 445,665 | |
Investment management fee payable | | | 147,068 | |
Trustees’ fees payable | | | 5,622 | |
Service and/or distribution fees payable | | | 2,691 | |
Accrued expenses | | | 158,881 | |
Total Liabilities | | | 7,659,227 | |
| Total Net Assets | | $ | 227,610,338 | |
| |
| Net Assets: | | | | |
Par value (Note 7) | | $ | 215 | |
Paid-in capital in excess of par value | | | 368,785,650 | |
Total distributable earnings (loss) | | | (141,175,527) | |
| Total Net Assets | | $ | 227,610,338 | |
See Notes to Financial Statements.
| | | | |
22 | | | | BrandywineGLOBAL — Global Unconstrained Bond Fund 2023 Annual Report |
| | | | |
| |
| Net Assets: | | | | |
Class A | | | $10,530,533 | |
Class C | | | $419,147 | |
Class FI | | | $84,820 | |
Class R | | | $45,107 | |
Class I | | | $101,586,501 | |
Class IS | | | $114,944,230 | |
| |
| Shares Outstanding: | | | | |
Class A | | | 1,003,823 | |
Class C | | | 40,187 | |
Class FI | | | 7,994 | |
Class R | | | 4,322 | |
Class I | | | 9,626,420 | |
Class IS | | | 10,866,132 | |
| |
| Net Asset Value: | | | | |
Class A (and redemption price) | | | $10.49 | |
Class C* | | | $10.43 | |
Class FI (and redemption price) | | | $10.61 | |
Class R (and redemption price) | | | $10.44 | |
Class I (and redemption price) | | | $10.55 | |
Class IS (and redemption price) | | | $10.58 | |
| Maximum Public Offering Price Per Share: | | | | |
Class A (based on maximum initial sales charge of 2.25%) | | | $10.73 | |
| * | Redemption price per share is NAV of Class C shares reduced by a 1.00% CDSC if shares are redeemed within one year from purchase payment (Note 2). |
See Notes to Financial Statements.
| | | | | | |
| BrandywineGLOBAL — Global Unconstrained Bond Fund 2023 Annual Report | | | | | 23 | |
Statement of operations
For the Year Ended October 31, 2023
| | | | |
| |
| Investment Income: | | | | |
Interest | | $ | 22,999,719 | |
Dividends from affiliated investments | | | 468,883 | |
Less: Foreign taxes withheld | | | (324,629) | |
Total Investment Income | | | 23,143,973 | |
| |
| Expenses: | | | | |
Investment management fee (Note 2) | | | 2,400,787 | |
Transfer agent fees (Notes 2 and 5) | | | 215,968 | |
Registration fees | | | 132,943 | |
Fund accounting fees | | | 94,786 | |
Audit and tax fees | | | 45,520 | |
Service and/or distribution fees (Notes 2 and 5) | | | 38,608 | |
Legal fees | | | 35,124 | |
Trustees’ fees | | | 28,525 | |
Shareholder reports | | | 15,332 | |
Interest expense | | | 8,669 | |
Fees recaptured by investment manager (Note 2) | | | 7,044 | |
Commitment fees (Note 9) | | | 3,904 | |
Insurance | | | 3,081 | |
Custody fees | | | (28,384) | |
Miscellaneous expenses | | | 5,234 | |
Total Expenses | | | 3,007,141 | |
Less: Fee waivers and/or expense reimbursements (Notes 2 and 5) | | | (22,115) | |
Net Expenses | | | 2,985,026 | |
| Net Investment Income | | | 20,158,947 | |
| |
| Realized and Unrealized Gain (Loss) on Investments, Futures Contracts, Forward Foreign Currency Contracts and Foreign Currency Transactions (Notes 1, 3 and 4): | | | | |
Net Realized Gain (Loss) From: | | | | |
Investment transactions in unaffiliated securities | | | (21,957,477) | |
Futures contracts | | | (3,480,807) | |
Forward foreign currency contracts | | | (14,816,712) | |
Foreign currency transactions | | | 166,599 | |
Net Realized Loss | | | (40,088,397) | |
Change in Net Unrealized Appreciation (Depreciation) From: | | | | |
Investments in unaffiliated securities | | | 39,335,057 | ‡ |
Futures contracts | | | (2,232,171) | |
Forward foreign currency contracts | | | (6,628,361) | |
Foreign currencies | | | 70,508 | |
Change in Net Unrealized Appreciation (Depreciation) | | | 30,545,033 | |
| Net Loss on Investments, Futures Contracts, Forward Foreign Currency Contracts and Foreign Currency Transactions | | | (9,543,364) | |
| Increase in Net Assets From Operations | | $ | 10,615,583 | |
| ‡ | Net of change in accrued foreign capital gains tax of $(102,469). |
See Notes to Financial Statements.
| | | | |
24 | | | | BrandywineGLOBAL — Global Unconstrained Bond Fund 2023 Annual Report |
Statements of changes in net assets
| | | | | | | | |
| For the Years Ended October 31, | | 2023 | | | 2022 | |
| | |
| Operations: | | | | | | | | |
Net investment income | | $ | 20,158,947 | | | $ | 13,573,086 | |
Net realized loss | | | (40,088,397) | | | | (33,656,244) | |
Change in net unrealized appreciation (depreciation) | | | 30,545,033 | | | | (26,092,385) | |
Increase (Decrease) in Net Assets From Operations | | | 10,615,583 | | | | (46,175,543) | |
| | |
| Distributions to Shareholders From (Notes 1 and 6): | | | | | | | | |
Total distributable earnings | | | (13,455,059) | | | | (2,500,030) | |
Decrease in Net Assets From Distributions to Shareholders | | | (13,455,059) | | | | (2,500,030) | |
| | |
| Fund Share Transactions (Note 7): | | | | | | | | |
Net proceeds from sale of shares | | | 105,355,357 | | | | 235,959,597 | |
Reinvestment of distributions | | | 7,555,788 | | | | 1,934,610 | |
Cost of shares repurchased | | | (338,716,474) | | | | (481,402,407) | |
Decrease in Net Assets From Fund Share Transactions | | | (225,805,329) | | | | (243,508,200) | |
Decrease in Net Assets | | | (228,644,805) | | | | (292,183,773) | |
| | |
| Net Assets: | | | | | | | | |
Beginning of year | | | 456,255,143 | | | | 748,438,916 | |
End of year | | $ | 227,610,338 | | | $ | 456,255,143 | |
See Notes to Financial Statements.
| | | | | | |
| BrandywineGLOBAL — Global Unconstrained Bond Fund 2023 Annual Report | | | | | 25 | |
Financial highlights
| | | | | | | | | | | | | | | | | | | | |
| For a share of each class of beneficial interest outstanding throughout each year ended October 31: | |
| Class A Shares1 | | 2023 | | | 2022 | | | 2021 | | | 2020 | | | 2019 | |
| | | | | |
| Net asset value, beginning of year | | | $11.04 | | | | $12.15 | | | | $11.79 | | | | $11.62 | | | | $11.14 | |
| | | | | |
| Income (loss) from operations: | | | | | | | | | | | | | | | | | | | | |
Net investment income | | | 0.60 | | | | 0.25 | | | | 0.20 | | | | 0.22 | | | | 0.38 | |
Net realized and unrealized gain (loss) | | | (0.80) | | | | (1.33) | | | | 0.38 | | | | (0.00) | 2 | | | 0.14 | |
Total income (loss) from operations | | | (0.20) | | | | (1.08) | | | | 0.58 | | | | 0.22 | | | | 0.52 | |
| | | | | |
| Less distributions from: | | | | | | | | | | | | | | | | | | | | |
Net investment income | | | (0.35) | | | | (0.03) | | | | (0.22) | | | | (0.05) | | | | (0.04) | |
Total distributions | | | (0.35) | | | | (0.03) | | | | (0.22) | | | | (0.05) | | | | (0.04) | |
| | | | | |
| Net asset value, end of year | | | $10.49 | | | | $11.04 | | | | $12.15 | | | | $11.79 | | | | $11.62 | |
Total return3 | | | (2.17) | % | | | (8.89) | % | | | 4.90 | % | | | 1.89 | % | | | 4.69 | % |
| | | | | |
| Net assets, end of year (000s) | | | $10,531 | | | | $13,585 | | | | $21,603 | | | | $21,145 | | | | $29,822 | |
| | | | | |
| Ratios to average net assets: | | | | | | | | | | | | | | | | | | | | |
Gross expenses | | | 1.06 | % | | | 1.11 | % | | | 1.20 | %4 | | | 1.21 | %4 | | | 1.39 | %4 |
Net expenses5,6 | | | 1.05 | | | | 1.10 | | | | 1.20 | 4 | | | 1.20 | 4 | | | 1.20 | 4 |
Net investment income | | | 5.29 | | | | 2.13 | | | | 1.64 | | | | 1.87 | | | | 3.28 | |
| | | | | |
| Portfolio turnover rate | | | 129 | % | | | 99 | % | | | 79 | % | | | 107 | % | | | 44 | % |
| 1 | Per share amounts have been calculated using the average shares method. |
| 2 | Amount represents less than $0.005 or greater than $(0.005) per share. |
| 3 | Performance figures, exclusive of sales charges, may reflect compensating balance arrangements, fee waivers and/or expense reimbursements. In the absence of compensating balance arrangements, fee waivers and/or expense reimbursements, the total return would have been lower. Past performance is no guarantee of future results. |
| 4 | Reflects recapture of fees waived and/or expenses reimbursed from prior fiscal years. |
| 5 | As a result of an expense limitation arrangement, the ratio of total annual fund operating expenses, other than interest, brokerage commissions, dividend expense on short sales, taxes, extraordinary expenses and acquired fund fees and expenses, to average net assets of Class A shares did not exceed 1.20%. This expense limitation arrangement cannot be terminated prior to December 31, 2025 without the Board of Trustees’ consent. In addition, the manager has agreed to waive the Fund’s management fee to an extent sufficient to offset the net management fee payable in connection with any investment in an affiliated money market fund. |
| 6 | Reflects fee waivers and/or expense reimbursements. |
See Notes to Financial Statements.
| | | | |
26 | | | | BrandywineGLOBAL — Global Unconstrained Bond Fund 2023 Annual Report |
| | | | | | | | | | | | | | | | | | | | |
| For a share of each class of beneficial interest outstanding throughout each year ended October 31: | |
| Class C Shares1 | | 2023 | | | 2022 | | | 2021 | | | 2020 | | | 2019 | |
| | | | | |
| Net asset value, beginning of year | | | $10.89 | | | | $12.03 | | | | $11.61 | | | | $11.49 | | | | $11.07 | |
| | | | | |
| Income (loss) from operations: | | | | | | | | | | | | | | | | | | | | |
Net investment income | | | 0.51 | | | | 0.16 | | | | 0.12 | | | | 0.14 | | | | 0.30 | |
Net realized and unrealized gain (loss) | | | (0.80) | | | | (1.29) | | | | 0.38 | | | | (0.01) | | | | 0.15 | |
Total income (loss) from operations | | | (0.29) | | | | (1.13) | | | | 0.50 | | | | 0.13 | | | | 0.45 | |
| | | | | |
| Less distributions from: | | | | | | | | | | | | | | | | | | | | |
Net investment income | | | (0.17) | | | | (0.01) | | | | (0.08) | | | | (0.01) | | | | (0.03) | |
Total distributions | | | (0.17) | | | | (0.01) | | | | (0.08) | | | | (0.01) | | | | (0.03) | |
| | | | | |
| Net asset value, end of year | | | $10.43 | | | | $10.89 | | | | $12.03 | | | | $11.61 | | | | $11.49 | |
Total return2 | | | (2.92) | % | | | (9.42) | % | | | 4.27 | % | | | 1.18 | % | | | 4.13 | % |
| | | | | |
| Net assets, end of year (000s) | | | $419 | | | | $664 | | | | $977 | | | | $2,341 | | | | $3,064 | |
| | | | | |
| Ratios to average net assets: | | | | | | | | | | | | | | | | | | | | |
Gross expenses | | | 1.82 | % | | | 1.88 | % | | | 1.83 | % | | | 1.85 | % | | | 1.84 | % |
Net expenses3,4 | | | 1.82 | | | | 1.87 | | | | 1.83 | | | | 1.85 | | | | 1.84 | |
Net investment income | | | 4.49 | | | | 1.37 | | | | 0.96 | | | | 1.21 | | | | 2.65 | |
| | | | | |
| Portfolio turnover rate | | | 129 | % | | | 99 | % | | | 79 | % | | | 107 | % | | | 44 | % |
| 1 | Per share amounts have been calculated using the average shares method. |
| 2 | Performance figures, exclusive of CDSC, may reflect compensating balance arrangements, fee waivers and/or expense reimbursements. In the absence of compensating balance arrangements, fee waivers and/or expense reimbursements, the total return would have been lower. Past performance is no guarantee of future results. |
| 3 | As a result of an expense limitation arrangement, the ratio of total annual fund operating expenses, other than interest, brokerage commissions, dividend expense on short sales, taxes, extraordinary expenses and acquired fund fees and expenses, to average net assets of Class C shares did not exceed 1.95%. This expense limitation arrangement cannot be terminated prior to December 31, 2025 without the Board of Trustees’ consent. In addition, the manager has agreed to waive the Fund’s management fee to an extent sufficient to offset the net management fee payable in connection with any investment in an affiliated money market fund. |
| 4 | Reflects fee waivers and/or expense reimbursements. |
See Notes to Financial Statements.
| | | | | | |
| BrandywineGLOBAL — Global Unconstrained Bond Fund 2023 Annual Report | | | | | 27 | |
Financial highlights (cont’d)
| | | | | | | | | | | | | | | | | | | | |
| For a share of each class of beneficial interest outstanding throughout each year ended October 31: | |
| Class FI Shares1 | | 2023 | | | 2022 | | | 2021 | | | 2020 | | | 2019 | |
| | | | | |
| Net asset value, beginning of year | | | $11.16 | | | | $12.30 | | | | $11.93 | | | | $11.76 | | | | $11.20 | |
| | | | | |
| Income (loss) from operations: | | | | | | | | | | | | | | | | | | | | |
Net investment income | | | 0.61 | | | | 0.26 | | | | 0.21 | | | | 0.21 | | | | 0.42 | |
Net realized and unrealized gain (loss) | | | (0.81) | | | | (1.36) | | | | 0.38 | | | | 0.01 | 2 | | | 0.17 | |
Total income (loss) from operations | | | (0.20) | | | | (1.10) | | | | 0.59 | | | | 0.22 | | | | 0.59 | |
| | | | | |
| Less distributions from: | | | | | | | | | | | | | | | | | | | | |
Net investment income | | | (0.35) | | | | (0.04) | | | | (0.22) | | | | (0.05) | | | | (0.03) | |
Total distributions | | | (0.35) | | | | (0.04) | | | | (0.22) | | | | (0.05) | | | | (0.03) | |
| | | | | |
| Net asset value, end of year | | | $10.61 | | | | $11.16 | | | | $12.30 | | | | $11.93 | | | | $11.76 | |
Total return3 | | | (2.20) | % | | | (8.90) | % | | | 4.95 | % | | | 1.90 | % | | | 5.31 | % |
| | | | | |
| Net assets, end of year (000s) | | | $85 | | | | $129 | | | | $75 | | | | $73 | | | | $49 | |
| | | | | |
| Ratios to average net assets: | | | | | | | | | | | | | | | | | | | | |
Gross expenses | | | 1.06 | % | | | 1.15 | % | | | 1.17 | % | | | 1.18 | % | | | 1.25 | %4 |
Net expenses5,6 | | | 1.06 | | | | 1.13 | | | | 1.16 | | | | 1.18 | | | | 1.20 | 4 |
Net investment income | | | 5.24 | | | | 2.21 | | | | 1.67 | | | | 1.79 | | | | 3.29 | 4 |
| | | | | |
| Portfolio turnover rate | | | 129 | % | | | 99 | % | | | 79 | % | | | 107 | % | | | 44 | % |
| 1 | Per share amounts have been calculated using the average shares method. |
| 2 | Calculation of the net gain per share (both realized and unrealized) does not correlate to the aggregate realized and unrealized losses presented in the Statement of Operations due to the timing of the sales and repurchases of Fund shares in relation to fluctuating market values of the investments of the Fund. |
| 3 | Performance figures may reflect compensating balance arrangements, fee waivers and/or expense reimbursements. In the absence of compensating balance arrangements, fee waivers and/or expense reimbursements, the total return would have been lower. Past performance is no guarantee of future results. |
| 4 | Ratios for the year ended October 31, 2019 do not reflect the one-time transfer agent fee adjustment of $306 related to a prior period over accrual. If this adjustment were included, the gross expense, net expense and net investment income ratios for Class FI shares for the year ended October 31, 2019 would have been 0.81%, 0.81%, and 3.68%, respectively. |
| 5 | As a result of an expense limitation arrangement, the ratio of total annual fund operating expenses, other than interest, brokerage commissions, dividend expense on short sales, taxes, extraordinary expenses and acquired fund fees and expenses, to average net assets of Class FI shares did not exceed 1.20%. This expense limitation arrangement cannot be terminated prior to December 31, 2025 without the Board of Trustees’ consent. In addition, the manager has agreed to waive the Fund’s management fee to an extent sufficient to offset the net management fee payable in connection with any investment in an affiliated money market fund. |
| 6 | Reflects fee waivers and/or expense reimbursements. |
See Notes to Financial Statements.
| | | | |
28 | | | | BrandywineGLOBAL — Global Unconstrained Bond Fund 2023 Annual Report |
| | | | | | | | | | | | | | | | | | | | |
| For a share of each class of beneficial interest outstanding throughout each year ended October 31: | |
| Class R Shares1 | | 2023 | | | 2022 | | | 2021 | | | 2020 | | | 2019 | |
| | | | | |
| Net asset value, beginning of year | | | $10.97 | | | | $12.10 | | | | $11.73 | | | | $11.58 | | | | $11.12 | |
| | | | | |
| Income (loss) from operations: | | | | | | | | | | | | | | | | | | | | |
Net investment income | | | 0.57 | | | | 0.22 | | | | 0.17 | | | | 0.18 | | | | 0.34 | |
Net realized and unrealized gain (loss) | | | (0.80) | | | | (1.33) | | | | 0.38 | | | | 0.01 | 2 | | | 0.15 | |
Total income (loss) from operations | | | (0.23) | | | | (1.11) | | | | 0.55 | | | | 0.19 | | | | 0.49 | |
| | | | | |
| Less distributions from: | | | | | | | | | | | | | | | | | | | | |
Net investment income | | | (0.30) | | | | (0.02) | | | | (0.18) | | | | (0.04) | | | | (0.03) | |
Total distributions | | | (0.30) | | | | (0.02) | | | | (0.18) | | | | (0.04) | | | | (0.03) | |
| | | | | |
| Net asset value, end of year | | | $10.44 | | | | $10.97 | | | | $12.10 | | | | $11.73 | | | | $11.58 | |
Total return3 | | | (2.41) | % | | | (9.18) | % | | | 4.65 | % | | | 1.64 | % | | | 4.43 | % |
| | | | | |
| Net assets, end of year (000s) | | | $45 | | | | $47 | | | | $52 | | | | $51 | | | | $50 | |
| | | | | |
| Ratios to average net assets: | | | | | | | | | | | | | | | | | | | | |
Gross expenses | | | 1.34 | % | | | 1.40 | %4 | | | 1.46 | % | | | 1.47 | %4 | | | 1.47 | %4 |
Net expenses5,6 | | | 1.33 | | | | 1.39 | 4 | | | 1.45 | | | | 1.45 | 4 | | | 1.45 | 4 |
Net investment income | | | 5.03 | | | | 1.91 | | | | 1.39 | | | | 1.58 | | | | 2.98 | |
| | | | | |
| Portfolio turnover rate | | | 129 | % | | | 99 | % | | | 79 | % | | | 107 | % | | | 44 | % |
| 1 | Per share amounts have been calculated using the average shares method. |
| 2 | Calculation of the net gain per share (both realized and unrealized) does not correlate to the aggregate realized and unrealized losses presented in the Statement of Operations due to the timing of the sales and repurchases of Fund shares in relation to fluctuating market values of the investments of the Fund. |
| 3 | Performance figures may reflect compensating balance arrangements, fee waivers and/or expense reimbursements. In the absence of compensating balance arrangements, fee waivers and/or expense reimbursements, the total return would have been lower. Past performance is no guarantee of future results. |
| 4 | Reflects recapture of fees waived and/or expenses reimbursed from prior fiscal years. |
| 5 | As a result of an expense limitation arrangement, the ratio of total annual fund operating expenses, other than interest, brokerage commissions, dividend expense on short sales, taxes, extraordinary expenses and acquired fund fees and expenses, to average net assets of Class R shares did not exceed 1.45%. This expense limitation arrangement cannot be terminated prior to December 31, 2025 without the Board of Trustees’ consent. In addition, the manager has agreed to waive the Fund’s management fee to an extent sufficient to offset the net management fee payable in connection with any investment in an affiliated money market fund. |
| 6 | Reflects fee waivers and/or expense reimbursements. |
See Notes to Financial Statements.
| | | | | | |
| BrandywineGLOBAL — Global Unconstrained Bond Fund 2023 Annual Report | | | | | 29 | |
Financial highlights (cont’d)
| | | | | | | | | | | | | | | | | | | | |
| For a share of each class of beneficial interest outstanding throughout each year ended October 31: | |
| Class I Shares1 | | 2023 | | | 2022 | | | 2021 | | | 2020 | | | 2019 | |
| | | | | |
| Net asset value, beginning of year | | | $11.12 | | | | $12.22 | | | | $11.88 | | | | $11.69 | | | | $11.18 | |
| | | | | |
| Income (loss) from operations: | | | | | | | | | | | | | | | | | | | | |
Net investment income | | | 0.62 | | | | 0.27 | | | | 0.25 | | | | 0.26 | | | | 0.41 | |
Net realized and unrealized gain (loss) | | | (0.80) | | | | (1.33) | | | | 0.38 | | | | (0.00) | 2 | | | 0.15 | |
Total income (loss) from operations | | | (0.18) | | | | (1.06) | | | | 0.63 | | | | 0.26 | | | | 0.56 | |
| | | | | |
| Less distributions from: | | | | | | | | | | | | | | | | | | | | |
Net investment income | | | (0.39) | | | | (0.04) | | | | (0.29) | | | | (0.07) | | | | (0.05) | |
Total distributions | | | (0.39) | | | | (0.04) | | | | (0.29) | | | | (0.07) | | | | (0.05) | |
| | | | | |
| Net asset value, end of year | | | $10.55 | | | | $11.12 | | | | $12.22 | | | | $11.88 | | | | $11.69 | |
Total return3 | | | (1.83) | % | | | (8.78) | % | | | 5.33 | % | | | 2.24 | % | | | 5.05 | % |
| | | | | |
| Net assets, end of year (millions) | | | $102 | | | | $193 | | | | $504 | | | | $465 | | | | $541 | |
| | | | | |
| Ratios to average net assets: | | | | | | | | | | | | | | | | | | | | |
Gross expenses | | | 0.86 | % | | | 0.90 | % | | | 0.97 | % | | | 0.98 | %4 | | | 0.99 | %4 |
Net expenses5,6 | | | 0.85 | | | | 0.85 | | | | 0.85 | | | | 0.85 | 4 | | | 0.85 | 4 |
Net investment income | | | 5.40 | | | | 2.26 | | | | 1.99 | | | | 2.20 | | | | 3.60 | |
| | | | | |
| Portfolio turnover rate | | | 129 | % | | | 99 | % | | | 79 | % | | | 107 | % | | | 44 | % |
| 1 | Per share amounts have been calculated using the average shares method. |
| 2 | Amount represents less than $0.005 or greater than $(0.005) per share. |
| 3 | Performance figures may reflect compensating balance arrangements, fee waivers and/or expense reimbursements. In the absence of compensating balance arrangements, fee waivers and/or expense reimbursements, the total return would have been lower. Past performance is no guarantee of future results. |
| 4 | Reflects recapture of fees waived and/or expenses reimbursed from prior fiscal years. |
| 5 | As a result of an expense limitation arrangement, the ratio of total annual fund operating expenses, other than interest, brokerage commissions, dividend expense on short sales, taxes, extraordinary expenses and acquired fund fees and expenses, to average net assets of Class I shares did not exceed 0.85%. This expense limitation arrangement cannot be terminated prior to December 31, 2025 without the Board of Trustees’ consent. In addition, the manager has agreed to waive the Fund’s management fee to an extent sufficient to offset the net management fee payable in connection with any investment in an affiliated money market fund. |
| 6 | Reflects fee waivers and/or expense reimbursements. |
See Notes to Financial Statements.
| | | | |
30 | | | | BrandywineGLOBAL — Global Unconstrained Bond Fund 2023 Annual Report |
| | | | | | | | | | | | | | | | | | | | |
| For a share of each class of beneficial interest outstanding throughout each year ended October 31: | |
| Class IS Shares1 | | 2023 | | | 2022 | | | 2021 | | | 2020 | | | 2019 | |
| | | | | |
| Net asset value, beginning of year | | | $11.17 | | | | $12.26 | | | | $11.92 | | | | $11.73 | | | | $11.20 | |
| | | | | |
| Income (loss) from operations: | | | | | | | | | | | | | | | | | | | | |
Net investment income | | | 0.64 | | | | 0.31 | | | | 0.26 | | | | 0.27 | | | | 0.43 | |
Net realized and unrealized gain (loss) | | | (0.81) | | | | (1.36) | | | | 0.38 | | | | (0.01) | | | | 0.16 | |
Total income (loss) from operations | | | (0.17) | | | | (1.05) | | | | 0.64 | | | | 0.26 | | | | 0.59 | |
| | | | | |
| Less distributions from: | | | | | | | | | | | | | | | | | | | | |
Net investment income | | | (0.42) | | | | (0.04) | | | | (0.30) | | | | (0.07) | | | | (0.06) | |
Total distributions | | | (0.42) | | | | (0.04) | | | | (0.30) | | | | (0.07) | | | | (0.06) | |
| | | | | |
| Net asset value, end of year | | | $10.58 | | | | $11.17 | | | | $12.26 | | | | $11.92 | | | | $11.73 | |
Total return2 | | | (1.87) | % | | | (8.57) | % | | | 5.39 | % | | | 2.28 | % | | | 5.26 | % |
| | | | | |
| Net assets, end of year (millions) | | | $115 | | | | $249 | | | | $222 | | | | $250 | | | | $422 | |
| | | | | |
| Ratios to average net assets: | | | | | | | | | | | | | | | | | | | | |
Gross expenses | | | 0.75 | %3 | | | 0.77 | % | | | 0.75 | %3 | | | 0.76 | %3 | | | 0.76 | % |
Net expenses4,5 | | | 0.75 | 3 | | | 0.75 | | | | 0.74 | 3 | | | 0.75 | 3 | | | 0.75 | |
Net investment income | | | 5.52 | | | | 2.66 | | | | 2.08 | | | | 2.34 | | | | 3.71 | |
| | | | | |
| Portfolio turnover rate | | | 129 | % | | | 99 | % | | | 79 | % | | | 107 | % | | | 44 | % |
| 1 | Per share amounts have been calculated using the average shares method. |
| 2 | Performance figures may reflect compensating balance arrangements, fee waivers and/or expense reimbursements. In the absence of compensating balance arrangements, fee waivers and/or expense reimbursements, the total return would have been lower. Past performance is no guarantee of future results. |
| 3 | Reflects recapture of fees waived and/or expenses reimbursed from prior fiscal years. |
| 4 | As a result of an expense limitation arrangement, the ratio of total annual fund operating expenses, other than interest, brokerage commissions, dividend expense on short sales, taxes, extraordinary expenses and acquired fund fees and expenses, to average net assets of Class IS shares did not exceed 0.75%. In addition, the ratio of total annual fund operating expenses for Class IS shares did not exceed the ratio of total annual fund operating expenses for Class I shares. These expense limitation arrangements cannot be terminated prior to December 31, 2025 without the Board of Trustees’ consent. In addition, the manager has agreed to waive the Fund’s management fee to an extent sufficient to offset the net management fee payable in connection with any investment in an affiliated money market fund. |
| 5 | Reflects fee waivers and/or expense reimbursements. |
See Notes to Financial Statements.
| | | | | | |
| BrandywineGLOBAL — Global Unconstrained Bond Fund 2023 Annual Report | | | | | 31 | |
Notes to financial statements
1. Organization and significant accounting policies
BrandywineGLOBAL — Global Unconstrained Bond Fund (the “Fund”) is a separate non-diversified investment series of Legg Mason Global Asset Management Trust (the “Trust”). The Trust, a Maryland statutory trust, is registered under the Investment Company Act of 1940, as amended (the “1940 Act”), as an open-end management investment company.
The Fund follows the accounting and reporting guidance in Financial Accounting Standards Board (“FASB”) Accounting Standards Codification Topic 946, Financial Services – Investment Companies (“ASC 946”). The following are significant accounting policies consistently followed by the Fund and are in conformity with U.S. generally accepted accounting principles (“GAAP”), including, but not limited to, ASC 946. Estimates and assumptions are required to be made regarding assets, liabilities and changes in net assets resulting from operations when financial statements are prepared. Changes in the economic environment, financial markets and any other parameters used in determining these estimates could cause actual results to differ. Subsequent events have been evaluated through the date the financial statements were issued.
(a) Investment valuation. The valuations for fixed income securities (which may include, but are not limited to, corporate, government, municipal, mortgage-backed, collateralized mortgage obligations and asset-backed securities) and certain derivative instruments are typically the prices supplied by independent third party pricing services, which may use market prices or broker/dealer quotations or a variety of valuation techniques and methodologies. The independent third party pricing services typically use inputs that are observable such as issuer details, interest rates, yield curves, prepayment speeds, credit risks/spreads, default rates and quoted prices for similar securities. Investments in open-end funds are valued at the closing net asset value per share of each fund on the day of valuation. Futures contracts are valued daily at the settlement price established by the board of trade or exchange on which they are traded. When the Fund holds securities or other assets that are denominated in a foreign currency, the Fund will normally use the currency exchange rates as of 4:00 p.m. (Eastern Time). If independent third party pricing services are unable to supply prices for a portfolio investment, or if the prices supplied are deemed by the manager to be unreliable, the market price may be determined by the manager using quotations from one or more broker/dealers or at the transaction price if the security has recently been purchased and no value has yet been obtained from a pricing service or pricing broker. When reliable prices are not readily available, such as when the value of a security has been significantly affected by events after the close of the exchange or market on which the security is principally traded, but before the Fund calculates its net asset value, the Fund values these securities as determined in accordance with procedures approved by the Fund’s Board of Trustees.
Pursuant to policies adopted by the Board of Trustees, the Fund’s manager has been designated as the valuation designee and is responsible for the oversight of the daily valuation process. The Fund’s manager is assisted by the Global Fund Valuation Committee (the “Valuation Committee”). The Valuation Committee is responsible for making fair value determinations, evaluating the effectiveness of the Fund’s pricing policies, and reporting to the Fund’s manager and the Board of Trustees. When determining the reliability of third
| | | | |
32 | | | | BrandywineGLOBAL — Global Unconstrained Bond Fund 2023 Annual Report |
party pricing information for investments owned by the Fund, the Valuation Committee, among other things, conducts due diligence reviews of pricing vendors, monitors the daily change in prices and reviews transactions among market participants.
The Valuation Committee will consider pricing methodologies it deems relevant and appropriate when making fair value determinations. Examples of possible methodologies include, but are not limited to, multiple of earnings; discount from market of a similar freely traded security; discounted cash-flow analysis; book value or a multiple thereof; risk premium/yield analysis; yield to maturity; and/or fundamental investment analysis. The Valuation Committee will also consider factors it deems relevant and appropriate in light of the facts and circumstances. Examples of possible factors include, but are not limited to, the type of security; the issuer’s financial statements; the purchase price of the security; the discount from market value of unrestricted securities of the same class at the time of purchase; analysts’ research and observations from financial institutions; information regarding any transactions or offers with respect to the security; the existence of merger proposals or tender offers affecting the security; the price and extent of public trading in similar securities of the issuer or comparable companies; and the existence of a shelf registration for restricted securities.
For each portfolio security that has been fair valued pursuant to the policies adopted by the Board of Trustees, the fair value price is compared against the last available and next available market quotations. The Valuation Committee reviews the results of such back testing monthly and fair valuation occurrences are reported to the Board of Trustees quarterly.
The Fund uses valuation techniques to measure fair value that are consistent with the market approach and/or income approach, depending on the type of security and the particular circumstance. The market approach uses prices and other relevant information generated by market transactions involving identical or comparable securities. The income approach uses valuation techniques to discount estimated future cash flows to present value.
GAAP establishes a disclosure hierarchy that categorizes the inputs to valuation techniques used to value assets and liabilities at measurement date. These inputs are summarized in the three broad levels listed below:
| • | | Level 1 — unadjusted quoted prices in active markets for identical investments |
| • | | Level 2 — other significant observable inputs (including quoted prices for similar investments, interest rates, prepayment speeds, credit risk, etc.) |
| • | | Level 3 — significant unobservable inputs (including the Fund’s own assumptions in determining the fair value of investments) |
The inputs or methodologies used to value securities are not necessarily an indication of the risk associated with investing in those securities.
| | | | | | |
| BrandywineGLOBAL — Global Unconstrained Bond Fund 2023 Annual Report | | | | | 33 | |
Notes to financial statements (cont’d)
The following is a summary of the inputs used in valuing the Fund’s assets and liabilities carried at fair value:
| | | | | | | | | | | | | | | | | | | | |
| ASSETS |
| Description | | Quoted Prices
(Level 1) | | Other Significant
Observable Inputs (Level 2) | | Significant
Unobservable
Inputs (Level 3) | | Total |
| Long-Term Investments†: | | | | | | | | | | | | | | | | | | | | |
U.S. Government & Agency Obligations | | | | — | | | | $ | 80,577,308 | | | | | — | | | | $ | 80,577,308 | |
Sovereign Bonds | | | | — | | | | | 69,890,270 | | | | | — | | | | | 69,890,270 | |
Mortgage-Backed Securities | | | | — | | | | | 46,485,072 | | | | | — | | | | | 46,485,072 | |
Corporate Bonds & Notes | | | | — | | | | | 18,684,913 | | | | | — | | | | | 18,684,913 | |
Collateralized Mortgage Obligations | | | | — | | | | | 2,644,345 | | | | | — | | | | | 2,644,345 | |
Convertible Bonds & Notes | | | | — | | | | | 1,024,650 | | | | | — | | | | | 1,024,650 | |
| Total Long-Term Investments | | | | — | | | | | 219,306,558 | | | | | — | | | | | 219,306,558 | |
| Short-Term Investments† | | | $ | 4,850,260 | | | | | — | | | | | — | | | | | 4,850,260 | |
| Total Investments | | | $ | 4,850,260 | | | | $ | 219,306,558 | | | | | — | | | | $ | 224,156,818 | |
| Other Financial Instruments: | | | | | | | | | | | | | | | | | | | | |
Futures Contracts†† | | | $ | 570,637 | | | | | — | | | | | — | | | | $ | 570,637 | |
Forward Foreign Currency Contracts†† | | | | — | | | | $ | 4,360,084 | | | | | — | | | | | 4,360,084 | |
| Total Other Financial Instruments | | | $ | 570,637 | | | | $ | 4,360,084 | | | | | — | | | | $ | 4,930,721 | |
| Total | | | $ | 5,420,897 | | | | $ | 223,666,642 | | | | | — | | | | $ | 229,087,539 | |
|
| LIABILITIES |
| Description | | Quoted Prices
(Level 1) | | Other Significant
Observable Inputs (Level 2) | | Significant
Unobservable
Inputs (Level 3) | | Total |
| Other Financial Instruments: | | | | | | | | | | | | | | | | | | | | |
Futures Contracts†† | | | $ | 3,247,606 | | | | | — | | | | | — | | | | $ | 3,247,606 | |
Forward Foreign Currency Contracts†† | | | | — | | | | $ | 6,899,300 | | | | | — | | | | | 6,899,300 | |
| Total | | | $ | 3,247,606 | | | | $ | 6,899,300 | | | | | — | | | | $ | 10,146,906 | |
| † | See Schedule of Investments for additional detailed categorizations. |
| †† | Reflects the unrealized appreciation (depreciation) of the instruments. |
(b) Futures contracts. The Fund uses futures contracts generally to gain exposure to, or hedge against, changes in interest rates or gain exposure to, or hedge against, changes in certain asset classes. A futures contract represents a commitment for the future purchase or sale of an asset at a specified price on a specified date.
Upon entering into a futures contract, the Fund is required to deposit cash or securities with a broker in an amount equal to a certain percentage of the contract amount. This is known as the ‘‘initial margin’’ and subsequent payments (‘‘variation margin’’) are made or received
| | | | |
34 | | | | BrandywineGLOBAL — Global Unconstrained Bond Fund 2023 Annual Report |
by the Fund each day, depending on the daily fluctuation in the value of the contract. For certain futures, including foreign denominated futures, variation margin is not settled daily, but is recorded as a net variation margin payable or receivable. The daily changes in contract value are recorded as unrealized appreciation or depreciation in the Statement of Operations and the Fund recognizes a realized gain or loss when the contract is closed.
Futures contracts involve, to varying degrees, risk of loss in excess of the amounts reflected in the financial statements. In addition, there is the risk that the Fund may not be able to enter into a closing transaction because of an illiquid secondary market.
(c) Forward foreign currency contracts. The Fund enters into a forward foreign currency contract to hedge exposure of bond positions or in an attempt to increase the Fund’s return. A forward foreign currency contract is an agreement between two parties to buy and sell a currency at a set price with delivery and settlement at a future date. The contract is marked-to-market daily and the change in value is recorded by the Fund as an unrealized gain or loss. When a forward foreign currency contract is closed, through either delivery or offset by entering into another forward foreign currency contract, the Fund recognizes a realized gain or loss equal to the difference between the value of the contract at the time it was opened and the value of the contract at the time it is closed.
Non-deliverable forward foreign currency exchange contracts are settled with the counterparty in cash without the delivery of foreign currency.
Forward foreign currency contracts involve elements of market risk in excess of the amounts reflected on the Statement of Assets and Liabilities. The Fund bears the risk of an unfavorable change in the foreign exchange rate underlying the forward foreign currency contract. Risks may also arise upon entering into these contracts from the potential inability of the counterparties to meet the terms of their contracts.
(d) Foreign currency translation. Investment securities and other assets and liabilities denominated in foreign currencies are translated into U.S. dollar amounts based upon prevailing exchange rates on the date of valuation. Purchases and sales of investment securities and income and expense items denominated in foreign currencies are translated into U.S. dollar amounts based upon prevailing exchange rates on the respective dates of such transactions.
The Fund does not isolate that portion of the results of operations resulting from fluctuations in foreign exchange rates on investments from the fluctuations arising from changes in market prices of securities held. Such fluctuations are included with the net realized and unrealized gain or loss on investments.
Net realized foreign exchange gains or losses arise from sales of foreign currencies, including gains and losses on forward foreign currency contracts, currency gains or losses realized between the trade and settlement dates on securities transactions, and the difference between the amounts of dividends, interest, and foreign withholding taxes recorded on the Fund’s books and the U.S. dollar equivalent of the amounts actually received or paid. Net unrealized foreign exchange gains and losses arise from changes in the values of assets and liabilities, other than investments in securities, on the date of valuation, resulting from changes in exchange rates.
| | | | | | |
| BrandywineGLOBAL — Global Unconstrained Bond Fund 2023 Annual Report | | | | | 35 | |
Notes to financial statements (cont’d)
Foreign security and currency transactions may involve certain considerations and risks not typically associated with those of U.S. dollar denominated transactions as a result of, among other factors, the possibility of lower levels of governmental supervision and regulation of foreign securities markets and the possibility of political or economic instability.
(e) Credit and market risk. The Fund invests in high-yield and emerging market instruments that are subject to certain credit and market risks. The yields of high-yield and emerging market debt obligations reflect, among other things, perceived credit and market risks. The Fund’s investments in securities rated below investment grade typically involve risks not associated with higher rated securities including, among others, greater risk related to timely and ultimate payment of interest and principal, greater market price volatility and less liquid secondary market trading. The consequences of political, social, economic or diplomatic changes may have disruptive effects on the market prices of investments held by the Fund. The Fund’s investments in non-U.S. dollar denominated securities may also result in foreign currency losses caused by devaluations and exchange rate fluctuations.
Investments in securities that are collateralized by real estate mortgages are subject to certain credit and liquidity risks. When market conditions result in an increase in default rates of the underlying mortgages and the foreclosure values of underlying real estate properties are materially below the outstanding amount of these underlying mortgages, collection of the full amount of accrued interest and principal on these investments may be doubtful. Such market conditions may significantly impair the value and liquidity of these investments and may result in a lack of correlation between their credit ratings and values.
(f) Foreign investment risks. The Fund’s investments in foreign securities may involve risks not present in domestic investments. Since securities may be denominated in foreign currencies, may require settlement in foreign currencies or may pay interest or dividends in foreign currencies, changes in the relationship of these foreign currencies to the U.S. dollar can significantly affect the value of the investments and earnings of the Fund. Foreign investments may also subject the Fund to foreign government exchange restrictions, expropriation, taxation or other political, social or economic developments, all of which affect the market and/or credit risk of the investments.
(g) Counterparty risk and credit-risk-related contingent features of derivative instruments. The Fund may invest in certain securities or engage in other transactions where the Fund is exposed to counterparty credit risk in addition to broader market risks. The Fund may invest in securities of issuers, which may also be considered counterparties as trading partners in other transactions. This may increase the risk of loss in the event of default or bankruptcy by the counterparty or if the counterparty otherwise fails to meet its contractual obligations. The Fund’s subadviser attempts to mitigate counterparty risk by (i) periodically assessing the creditworthiness of its trading partners, (ii) monitoring and/or limiting the amount of its net exposure to each individual counterparty based on its assessment and (iii) requiring collateral from the counterparty for certain transactions. Market events and changes in overall economic conditions may impact the assessment of such counterparty risk by the subadviser. In addition, declines in the values of underlying collateral received may expose the Fund to increased risk of loss.
| | | | |
36 | | | | BrandywineGLOBAL — Global Unconstrained Bond Fund 2023 Annual Report |
With exchange traded and centrally cleared derivatives, there is less counterparty risk to the Fund since the exchange or clearinghouse, as counterparty to such instruments, guarantees against a possible default. The clearinghouse stands between the buyer and the seller of the contract; therefore, the credit risk is limited to failure of the clearinghouse. While offset rights may exist under applicable law, the Fund does not have a contractual right of offset against a clearing broker or clearinghouse in the event of a default of the clearing broker or clearinghouse.
The Fund has entered into master agreements, such as an International Swaps and Derivatives Association, Inc. Master Agreement (“ISDA Master Agreement”) or similar agreement, with certain of its derivative counterparties that govern over-the-counter (“OTC”) derivatives and provide for general obligations, representations, agreements, collateral posting terms, netting provisions in the event of default or termination and credit related contingent features. The credit related contingent features include, but are not limited to, a percentage decrease in the Fund’s net assets or net asset value per share over a specified period of time. If these credit related contingent features were triggered, the derivatives counterparty could terminate the positions and demand payment or require additional collateral.
Under an ISDA Master Agreement, the Fund may, under certain circumstances, offset with the counterparty certain derivative financial instruments’ payables and/or receivables with collateral held and/or posted and create one single net payment. However, absent an event of default by the counterparty or a termination of the agreement, the terms of the ISDA Master Agreements do not result in an offset of reported amounts of financial assets and financial liabilities in the Statement of Assets and Liabilities across transactions between the Fund and the applicable counterparty. The enforceability of the right to offset may vary by jurisdiction.
Collateral requirements differ by type of derivative. Collateral or margin requirements are set by the broker or exchange clearinghouse for exchange traded derivatives while collateral terms are contract specific for OTC traded derivatives. Cash collateral that has been pledged to cover obligations of the Fund under derivative contracts, if any, will be reported separately in the Statement of Assets and Liabilities. Securities pledged as collateral, if any, for the same purpose are noted in the Schedule of Investments.
As of October 31, 2023, the Fund held forward foreign currency contracts with credit related contingent features which had a liability position of $6,899,300. If a contingent feature in the master agreements would have been triggered, the Fund would have been required to pay this amount to its derivatives counterparties. As of October 31, 2023, the Fund had posted with its counterparties cash and/or securities as collateral to cover the net liability of these derivatives amounting to $750,000 which could be used to reduce the required payment.
(h) Security transactions and investment income. Security transactions are accounted for on a trade date basis. Interest income (including interest income from payment-in-kind securities) is recorded on the accrual basis. Amortization of premiums and accretion of discounts on debt securities are recorded to interest income over the lives of the respective securities, except for premiums on certain callable debt securities which are amortized to
| | | | | | |
| BrandywineGLOBAL — Global Unconstrained Bond Fund 2023 Annual Report | | | | | 37 | |
Notes to financial statements (cont’d)
the earliest call date. Dividend income is recorded on the ex-dividend date for dividends received in cash and/or securities. The cost of investments sold is determined by use of the specific identification method. To the extent any issuer defaults or a credit event occurs that impacts the issuer, the Fund may halt any additional interest income accruals and consider the realizability of interest accrued up to the date of default or credit event.
(i) Distributions to shareholders. Distributions from net investment income of the Fund, if any, are declared and paid on a quarterly basis. Distributions of net realized gains, if any, are declared at least annually. Distributions to shareholders of the Fund are recorded on the ex-dividend date and are determined in accordance with income tax regulations, which may differ from GAAP.
(j) Share class accounting. Investment income, common expenses and realized/ unrealized gains (losses) on investments are allocated to the various classes of the Fund on the basis of daily net assets of each class. Fees relating to a specific class are charged directly to that share class.
(k) Compensating balance arrangements. The Fund has an arrangement with its custodian bank whereby a portion of the custodian’s fees is paid indirectly by credits earned on the Fund’s cash on deposit with the bank.
(l) Federal and other taxes. It is the Fund’s policy to comply with the federal income and excise tax requirements of the Internal Revenue Code of 1986 (the “Code”), as amended, applicable to regulated investment companies. Accordingly, the Fund intends to distribute its taxable income and net realized gains, if any, to shareholders in accordance with timing requirements imposed by the Code. Therefore, no federal or state income tax provision is required in the Fund’s financial statements.
Management has analyzed the Fund’s tax positions taken on income tax returns for all open tax years and has concluded that as of October 31, 2023, no provision for income tax is required in the Fund’s financial statements. The Fund’s federal and state income and federal excise tax returns for tax years for which the applicable statutes of limitations have not expired are subject to examination by the Internal Revenue Service and state departments of revenue.
Under the applicable foreign tax laws, a withholding tax may be imposed on interest, dividends and capital gains at various rates.
(m) Reclassification. GAAP requires that certain components of net assets be reclassified to reflect permanent differences between financial and tax reporting. These reclassifications have no effect on net assets or net asset value per share. During the current year, the following reclassifications have been made:
| | | | | | | | |
| | | Total Distributable
Earnings (Loss) | | | Paid-in
Capital | |
| (a) | | $ | (3,655) | | | $ | 3,655 | |
| (a) | Reclassifications are due to distributions paid in connection with the redemption of Fund shares. |
| | | | |
38 | | | | BrandywineGLOBAL — Global Unconstrained Bond Fund 2023 Annual Report |
2. Investment management agreement and other transactions with affiliates
Legg Mason Partners Fund Advisor, LLC (“LMPFA”) (effective November 30, 2023, renamed Franklin Templeton Fund Adviser, LLC) is the Fund’s investment manager and Brandywine Global Investment Management, LLC (“Brandywine Global”) is the Fund’s subadviser. LMPFA and Brandywine Global are indirect, wholly-owned subsidiaries of Franklin Resources, Inc. (“Franklin Resources”).
Under the investment management agreement, the Fund pays an investment management fee, calculated daily and paid monthly, in accordance with the following breakpoint schedule:
| | | | |
| Average Daily Net Assets | | Annual Rate | |
| First $1 billion | | | 0.650 | % |
| Next $1 billion | | | 0.625 | |
| Next $3 billion | | | 0.600 | |
| Next $5 billion | | | 0.575 | |
| Over $10 billion | | | 0.550 | |
LMPFA provides administrative and certain oversight services to the Fund. LMPFA delegates to the subadviser the day-to-day portfolio management of the Fund. For its services, LMPFA pays Brandywine Global a fee monthly, at an annual rate equal to 70% of the net management fee it receives from the Fund.
As a result of expense limitation arrangements between the Fund and LMPFA, the ratio of total annual fund operating expenses, other than interest, brokerage commissions, dividend expense on short sales, taxes, extraordinary expenses and acquired fund fees and expenses, to average net assets of Class A, Class C, Class FI, Class R, Class I and Class IS shares did not exceed 1.20%, 1.95%, 1.20%, 1.45%, 0.85% and 0.75%, respectively. In addition, the ratio of total annual fund operating expenses for Class IS shares did not exceed the ratio of total annual fund operating expenses for Class I shares. These expense limitation arrangements cannot be terminated prior to December 31, 2025 without the Board of Trustees’ consent. In addition, the manager has agreed to waive the Fund’s management fee to an extent sufficient to offset the net management fee payable in connection with any investment in an affiliated money market fund (the “affiliated money market fund waiver”). The affiliated money market fund waiver is not subject to the recapture provision discussed below.
During the year ended October 31, 2023, fees waived and/or expenses reimbursed amounted to $22,115, which included an affiliated money market fund waiver of $8,238.
LMPFA is permitted to recapture amounts waived and/or reimbursed to a class within three years after the fiscal year in which LMPFA earned the fee or incurred the expense if the class’ total annual fund operating expenses have fallen to a level below the expense limitation (“expense cap”) in effect at the time the fees were earned or the expenses incurred. In no case will LMPFA recapture any amount that would result, on any particular business day of the Fund, in the class’ total annual fund operating expenses exceeding the expense cap or any other lower limit then in effect.
| | | | | | |
| BrandywineGLOBAL — Global Unconstrained Bond Fund 2023 Annual Report | | | | | 39 | |
Notes to financial statements (cont’d)
Pursuant to these arrangements, at October 31, 2023, the Fund had remaining fee waivers and/or expense reimbursements subject to recapture by LMPFA and respective dates of expiration as follows:
| | | | | | | | | | | | | | | | | | | | | | | | | | | | | | |
| | | Class A | | Class C | | Class FI | | Class R | | Class I | | Class IS |
| Expires October 31, 2024 | | | | — | | | | | — | | | | | — | | | | | — | | | | $ | 581,961 | | | | | — | |
| Expires October 31, 2025 | | | $ | 1,957 | | | | $ | 94 | | | | $ | 14 | | | | $ | 5 | | | | | 152,700 | | | | $ | 23,223 | |
| Expires October 31, 2026 | | | | — | | | | | — | | | | | — | | | | | — | | | | | 13,877 | | | | | — | |
| Total fee waivers/expense reimbursements subject to recapture | | | $ | 1,957 | | | | $ | 94 | | | | $ | 14 | | | | $ | 5 | | | | $ | 748,538 | | | | $ | 23,223 | |
For the year ended October 31, 2023, fee waivers and/or expense reimbursements recaptured by LMPFA, if any, were as follows:
| | | | | |
| | | Class IS |
| LMPFA recaptured | | | $ | 7,044 | |
Franklin Distributors, LLC (“Franklin Distributors”) serves as the Fund’s sole and exclusive distributor. Franklin Distributors is an indirect, wholly-owned broker-dealer subsidiary of Franklin Resources. Franklin Templeton Investor Services, LLC (“Investor Services”) serves as the Fund’s shareholder servicing agent and acts as the Fund’s transfer agent and dividend-paying agent. Investor Services is an indirect, wholly-owned subsidiary of Franklin Resources. For the year ended October 31, 2023, the Fund incurred transfer agent fees as reported on the Statement of Operations, of which $5,031 was earned by Investor Services.
There is a maximum initial sales charge of 2.25% for Class A shares. In certain cases, Class A shares have a 0.50% contingent deferred sales charge (“CDSC”), which applies if redemption occurs within 18 months from purchase payment. This CDSC only applies to those purchases of Class A shares, which, when combined with current holdings of other shares of funds sold by Franklin Distributors, equal or exceed $500,000 in the aggregate. These purchases do not incur an initial sales charge. There is a CDSC of 1.00% on Class C shares which applies if redemption occurs within 12 months from purchase payment.
For the year ended October 31, 2023, sales charges retained by and CDSCs paid to Franklin Distributors and its affiliates, if any, were as follows:
| | | | | |
| | | Class A |
| Sales charges | | | $ | 177 | |
| CDSCs | | | | — | |
Under a Deferred Compensation Plan (the “Plan”), Trustees may have elected to defer receipt of all or a specified portion of their compensation. A participating Trustee selected one or more funds managed by LMPFA or an affiliate of LMPFA in which his or her deferred trustee’s fees were deemed to be invested. Deferred amounts remain in the Fund until distributed in accordance with the Plan. In May 2015, the Board of Trustees approved an amendment to the Plan so that effective January 1, 2016, no compensation earned after that date may be deferred under the Plan.
| | | | |
40 | | | | BrandywineGLOBAL — Global Unconstrained Bond Fund 2023 Annual Report |
All officers and one Trustee of the Trust are employees of Franklin Resources or its affiliates and do not receive compensation from the Trust.
3. Investments
During the year ended October 31, 2023, the aggregate cost of purchases and proceeds from sales of investments (excluding short-term investments) and U.S. Government & Agency Obligations were as follows:
| | | | | | | | |
| | | Investments | | | U.S. Government &
Agency Obligations | |
| Purchases | | $ | 114,036,687 | | | $ | 338,166,991 | |
| Sales | | | 239,732,919 | | | | 450,797,079 | |
At October 31, 2023, the aggregate cost of investments and the aggregate gross unrealized appreciation and depreciation of investments for federal income tax purposes were as follows:
| | | | | | | | | | | | | | | | |
| | | Cost | | | Gross
Unrealized
Appreciation | | | Gross
Unrealized
Depreciation | | | Net
Unrealized
Depreciation | |
| Securities | | $ | 238,563,049 | | | $ | 1,630,928 | | | $ | (16,037,159) | | | $ | (14,406,231) | |
| Futures contracts | | | — | | | | 570,637 | | | | (3,247,606) | | | | (2,676,969) | |
| Forward foreign currency contracts | | | — | | | | 4,360,084 | | | | (6,899,300) | | | | (2,539,216) | |
4. Derivative instruments and hedging activities
Below is a table, grouped by derivative type, that provides information about the fair value and the location of derivatives within the Statement of Assets and Liabilities at October 31, 2023.
| | | | | | | | | | | | |
| ASSET DERIVATIVES1 | |
| | | Interest
Rate Risk | | | Foreign
Exchange Risk | | | Total | |
| Futures contracts2 | | $ | 570,637 | | | | — | | | $ | 570,637 | |
| Forward foreign currency contracts | | | — | | | $ | 4,360,084 | | | | 4,360,084 | |
| Total | | $ | 570,637 | | | $ | 4,360,084 | | | $ | 4,930,721 | |
|
| LIABILITY DERIVATIVES1 | |
| | | Interest
Rate Risk | | | Foreign
Exchange Risk | | | Total | |
| Futures contracts2 | | $ | 3,247,606 | | | | — | | | $ | 3,247,606 | |
| Forward foreign currency contracts | | | — | | | $ | 6,899,300 | | | | 6,899,300 | |
| Total | | $ | 3,247,606 | | | $ | 6,899,300 | | | $ | 10,146,906 | |
| 1 | Generally, the balance sheet location for asset derivatives is receivables/net unrealized appreciation and for liability derivatives is payables/net unrealized depreciation. |
| 2 | Includes cumulative unrealized appreciation (depreciation) of futures contracts as reported in the Schedule of Investments. Only net variation margin is reported within the receivables and/or payables on the Statement of Assets and Liabilities. |
| | | | | | |
| BrandywineGLOBAL — Global Unconstrained Bond Fund 2023 Annual Report | | | | | 41 | |
Notes to financial statements (cont’d)
The following tables provide information about the effect of derivatives and hedging activities on the Fund’s Statement of Operations for the year ended October 31, 2023. The first table provides additional detail about the amounts and sources of gains (losses) realized on derivatives during the period. The second table provides additional information about the change in net unrealized appreciation (depreciation) resulting from the Fund’s derivatives and hedging activities during the period.
| | | | | | | | | | | | |
| AMOUNT OF NET REALIZED GAIN (LOSS) ON DERIVATIVES RECOGNIZED | |
| | | Interest
Rate Risk | | | Foreign
Exchange Risk | | | Total | |
| Futures contracts | | $ | (3,480,807) | | | | — | | | $ | (3,480,807) | |
| Forward foreign currency contracts | | | — | | | $ | (14,816,712) | | | | (14,816,712) | |
| Total | | $ | (3,480,807) | | | $ | (14,816,712) | | | $ | (18,297,519) | |
| | | | | | | | | | | | |
| CHANGE IN NET UNREALIZED APPRECIATION (DEPRECIATION) ON DERIVATIVES RECOGNIZED | |
| | | Interest
Rate Risk | | | Foreign
Exchange Risk | | | Total | |
| Futures contracts | | $ | (2,232,171) | | | | — | | | $ | (2,232,171) | |
| Forward foreign currency contracts | | | — | | | $ | (6,628,361) | | | | (6,628,361) | |
| Total | | $ | (2,232,171) | | | $ | (6,628,361) | | | $ | (8,860,532) | |
During the year ended October 31, 2023, the volume of derivative activity for the Fund was as follows:
| | | | |
| | | Average Market
Value | |
| Futures contracts (to buy) | | $ | 73,980,920 | |
| Futures contracts (to sell) | | | 96,555,511 | |
| Forward foreign currency contracts (to buy) | | | 359,265,484 | |
| Forward foreign currency contracts (to sell) | | | 390,179,206 | |
The following table presents the Fund’s OTC derivative assets and liabilities by counterparty net of amounts available for offset under an ISDA Master Agreement and net of the related collateral pledged (received) by the Fund as of October 31, 2023.
| | | | | | | | | | | | | | | | | | | | |
| Counterparty | | Gross Assets
Subject to
Master
Agreements1 | | | Gross
Liabilities
Subject to
Master
Agreements1 | | | Net Assets
(Liabilities)
Subject to
Master
Agreements | | | Collateral
Pledged
(Received)2,3 | | | Net
Amount4,5 | |
| Barclays Bank PLC | | $ | 422,700 | | | $ | (1,023,549) | | | $ | (600,849) | | | | — | | | $ | (600,849) | |
| Citibank N.A. | | | 605,180 | | | | (315,108) | | | | 290,072 | | | | — | | | | 290,072 | |
| Goldman Sachs Group Inc. | | | 1,196,580 | | | | (177,078) | | | | 1,019,502 | | | | — | | | | 1,019,502 | |
| HSBC Securities Inc. | | | 334,362 | | | | (761,557) | | | | (427,195) | | | $ | 670,000 | | | | 242,805 | |
| JPMorgan Chase & Co. | | | 980,132 | | | | (3,464,073) | | | | (2,483,941) | | | | 80,000 | | | | (2,403,941) | |
| Morgan Stanley & Co. Inc. | | | 817,367 | | | | (1,119,154) | | | | (301,787) | | | | — | | | | (301,787) | |
| | | | |
42 | | | | BrandywineGLOBAL — Global Unconstrained Bond Fund 2023 Annual Report |
| | | | | | | | | | | | | | | | | | | | |
| Counterparty (cont’d) | | Gross Assets
Subject to
Master
Agreements1 | | | Gross
Liabilities
Subject to
Master
Agreements1 | | | Net Assets
(Liabilities)
Subject to
Master
Agreements | | | Collateral
Pledged
(Received)2,3 | | | Net
Amount4,5 | |
| Standard Chartered PLC | | | — | | | $ | (38,781) | | | $ | (38,781) | | | | — | | | $ | (38,781) | |
| UBS Securities LLC | | $ | 3,763 | | | | — | | | | 3,763 | | | | — | | | | 3,763 | |
| Total | | $ | 4,360,084 | | | $ | (6,899,300) | | | $ | (2,539,216) | | | $ | 750,000 | | | $ | (1,789,216) | |
| 1 | Absent an event of default or early termination, derivative assets and liabilities are presented gross and not offset in the Statement of Assets and Liabilities. |
| 2 | Gross amounts are not offset in the Statement of Assets and Liabilities. |
| 3 | In some instances, the actual collateral received and/or pledged may be more than the amount shown here due to overcollateralization. |
| 4 | Net amount may also include forward foreign currency exchange contracts that are not required to be collateralized. |
| 5 | Represents the net amount receivable (payable) from (to) the counterparty in the event of default. |
5. Class specific expenses, waivers and/or expense reimbursements
The Fund has adopted a Rule 12b-1 shareholder services and distribution plan and under that plan the Fund pays service and/or distribution fees with respect to its Class A, Class C, Class FI and Class R shares calculated at the annual rate of 0.25%, 1.00%, 0.25% and 0.50% of the average daily net assets of each class, respectively. Service and/or distribution fees are accrued daily and paid monthly.
For the year ended October 31, 2023, class specific expenses were as follows:
| | | | | | | | |
| | | Service and/or
Distribution Fees | | | Transfer Agent
Fees | |
| Class A | | $ | 32,614 | | | $ | 8,214 | |
| Class C | | | 5,498 | | | | 438 | |
| Class FI | | | 251 | | | | 66 | |
| Class R | | | 245 | | | | 47 | |
| Class I | | | — | | | | 198,788 | |
| Class IS | | | — | | | | 8,415 | |
| Total | | $ | 38,608 | | | $ | 215,968 | |
For the year ended October 31, 2023, waivers and/or expense reimbursements by class were as follows:
| | | | |
| | | Waivers/Expense
Reimbursements | |
| Class A | | $ | 295 | |
| Class C | | | 12 | |
| Class FI | | | 2 | |
| Class R | | | 1 | |
| Class I | | | 17,631 | |
| Class IS | | | 4,174 | |
| Total | | $ | 22,115 | |
| | | | | | |
| BrandywineGLOBAL — Global Unconstrained Bond Fund 2023 Annual Report | | | | | 43 | |
Notes to financial statements (cont’d)
6. Distributions to shareholders by class
| | | | | | | | |
| | | Year Ended October 31, 2023 | | | Year Ended
October 31, 2022 | |
| Net Investment Income: | | | | | | | | |
| Class A | | $ | 396,113 | | | $ | 57,353 | |
| Class C | | | 7,989 | | | | 548 | |
| Class FI | | | 3,226 | | | | 444 | |
| Class R | | | 1,288 | | | | 93 | |
| Class I | | | 5,973,055 | | | | 1,670,738 | |
| Class IS | | | 7,073,388 | | | | 770,854 | |
| Total | | $ | 13,455,059 | | | $ | 2,500,030 | |
7. Shares of beneficial interest
At October 31, 2023, the Trust had an unlimited number of shares of beneficial interest authorized with a par value of $0.00001 per share. The Fund has the ability to issue multiple classes of shares. Each class of shares represents an identical interest and has the same rights, except that each class bears certain direct expenses, including those specifically related to the distribution of its shares.
Transactions in shares of each class were as follows:
| | | | | | | | | | | | | | | | |
| | | Year Ended
October 31, 2023 | | | Year Ended
October 31, 2022 | |
| | | Shares | | | Amount | | | Shares | | | Amount | |
| Class A | | | | | | | | | | | | | | | | |
| Shares sold | | | 222,869 | | | $ | 2,524,972 | | | | 201,032 | | | $ | 2,364,185 | |
| Shares issued on reinvestment | | | 31,572 | | | | 360,961 | | | | 4,006 | | | | 48,834 | |
| Shares repurchased | | | (481,567) | | | | (5,449,297) | | | | (752,220) | | | | (8,736,717) | |
| Net decrease | | | (227,126) | | | $ | (2,563,364) | | | | (547,182) | | | $ | (6,323,698) | |
| | | | |
| Class C | | | | | | | | | | | | | | | | |
| Shares sold | | | 9,703 | | | $ | 112,529 | | | | 24,345 | | | $ | 288,079 | |
| Shares issued on reinvestment | | | 576 | | | | 6,576 | | | | 35 | | | | 416 | |
| Shares repurchased | | | (31,086) | | | | (352,820) | | | | (44,614) | | | | (513,378) | |
| Net decrease | | | (20,807) | | | $ | (233,715) | | | | (20,234) | | | $ | (224,883) | |
| | | | |
| Class FI | | | | | | | | | | | | | | | | |
| Shares sold | | | — | | | | — | | | | 5,390 | | | $ | 67,000 | |
| Shares issued on reinvestment | | | 211 | | | $ | 2,436 | | | | 29 | | | | 357 | |
| Shares repurchased | | | (3,729) | | | | (44,779) | | | | (1) | | | | (6) | |
| Net increase (decrease) | | | (3,518) | | | $ | (42,343) | | | | 5,418 | | | $ | 67,351 | |
| | | | |
| Class R | | | | | | | | | | | | | | | | |
| Shares sold | | | — | | | | — | | | | 2 | | | $ | 16 | |
| Shares issued on reinvestment | | | 0 | * | | $ | 2 | | | | 0 | * | | | 0 | ‡ |
| Shares repurchased | | | (2) | | | | (28) | | | | (2) | | | | (15) | |
| Net increase (decrease) | | | (2) | | | $ | (26) | | | | 0 | * | | $ | 1 | |
| | | | |
44 | | | | BrandywineGLOBAL — Global Unconstrained Bond Fund 2023 Annual Report |
| | | | | | | | | | | | | | | | |
| | | Year Ended
October 31, 2023 | | | Year Ended
October 31, 2022 | |
| | | Shares | | | Amount | | | Shares | | | Amount | |
| Class I | | | | | | | | | | | | | | | | |
| Shares sold | | | 4,185,248 | | | $ | 48,164,709 | | | | 8,845,634 | | | $ | 104,170,327 | |
| Shares issued on reinvestment | | | 279,366 | | | | 3,215,929 | | | | 91,297 | | | | 1,119,305 | |
| Shares repurchased | | | (12,198,132) | | | | (141,841,322) | | | | (32,768,251) | | | | (389,134,743) | |
| Net decrease | | | (7,733,518) | | | $ | (90,460,684) | | | | (23,831,320) | | | $ | (283,845,111) | |
| | | | |
| Class IS | | | | | | | | | | | | | | | | |
| Shares sold | | | 4,729,975 | | | $ | 54,553,147 | | | | 11,156,173 | | | $ | 129,069,990 | |
| Shares issued on reinvestment | | | 344,657 | | | | 3,969,884 | | | | 62,252 | | | | 765,698 | |
| Shares repurchased | | | (16,482,561) | | | | (191,028,228) | | | | (7,065,979) | | | | (83,017,548) | |
| Net increase (decrease) | | | (11,407,929) | | | $ | (132,505,197) | | | | 4,152,446 | | | $ | 46,818,140 | |
| ‡ | Amount represents less than $1. |
8. Transactions with affiliated company
As defined by the 1940 Act, an affiliated company is one in which the Fund owns 5% or more of the outstanding voting securities, or a company which is under common ownership or control with the Fund. The following company was considered an affiliated company for all or some portion of the year ended October 31, 2023. The following transactions were effected in such company for the year ended October 31, 2023.
| | | | | | | | | | | | | | | | | | | | |
| | | Affiliate
Value at
October 31,
2022 | | | Purchased | | | Sold | |
| | Cost | | | Shares | | | Proceeds | | | Shares | |
| Western Asset Premier Institutional U.S. Treasury Reserves, Premium Shares | | $ | 11,203,667 | | | $ | 389,713,611 | | | | 389,713,611 | | | $ | 396,067,018 | | | | 396,067,018 | |
| | | | | | | | | | | | | | | | |
| (cont’d) | | Realized
Gain (Loss) | | | Dividend
Income | | | Net Increase
(Decrease) in
Unrealized
Appreciation
(Depreciation) | | | Affiliate
Value at
October 31,
2023 | |
| Western Asset Premier Institutional U.S. Treasury Reserves, Premium Shares | | | — | | | $ | 468,883 | | | | — | | | $ | 4,850,260 | |
9. Redemption facility
The Fund, together with other U.S. registered and foreign investment funds (collectively, the “Borrowers”) managed by Franklin Resources or its affiliates, is a borrower in a joint syndicated senior unsecured credit facility totaling $2.675 billion (the “Global Credit Facility”). The Global Credit Facility provides a source of funds to the Borrowers for temporary and emergency purposes, including the ability to meet future unanticipated or
| | | | | | |
| BrandywineGLOBAL — Global Unconstrained Bond Fund 2023 Annual Report | | | | | 45 | |
Notes to financial statements (cont’d)
unusually large redemption requests. Unless renewed, the Global Credit Facility will terminate on February 2, 2024.
Under the terms of the Global Credit Facility, the Fund shall, in addition to interest charged on any borrowings made by the Fund and other costs incurred by the Fund, pay its share of fees and expenses incurred in connection with the implementation and maintenance of the Global Credit Facility, based upon its relative share of the aggregate net assets of all the Borrowers, including an annual commitment fee of 0.15% based upon the unused portion of the Global Credit Facility. These fees are reflected in the Statement of Operations. The Fund did not utilize the Global Credit Facility during the year ended October 31, 2023.
10. Income tax information and distributions to shareholders
The tax character of distributions paid during the fiscal years ended October 31, was as follows:
| | | | | | | | |
| | | 2023 | | | 2022 | |
| Distributions paid from: | | | | | | | | |
| Ordinary income | | $ | 13,455,059 | | | $ | 2,500,030 | |
As of October 31, 2023, the components of distributable earnings (loss) on a tax basis were as follows:
| | | | |
| Undistributed ordinary income — net | | $ | 2,363,968 | |
| Deferred capital losses* | | | (128,382,017) | |
| Other book/tax temporary differences(a) | | | 4,506,690 | |
| Unrealized appreciation (depreciation)(b) | | | (19,664,168) | |
| Total distributable earnings (loss) — net | | $ | (141,175,527) | |
| * | These capital losses have been deferred in the current year as either short-term or long-term losses. The losses will be deemed to occur on the first day of the next taxable year in the same character as they were originally deferred and will be available to offset future taxable capital gains. |
| (a) | Other book/tax temporary differences are attributable to the tax deferral of losses on straddles, the realization for tax purposes of unrealized gains (losses) on futures and foreign currency contracts and book/tax differences in the timing of the deductibility of various expenses. |
| (b) | The difference between book-basis and tax-basis unrealized appreciation (depreciation) is attributable to the tax deferral of losses on wash sales. |
| | | | |
46 | | | | BrandywineGLOBAL — Global Unconstrained Bond Fund 2023 Annual Report |
Report of independent registered public accounting firm
To the Board of Trustees of Legg Mason Global Asset Management Trust and Shareholders of BrandywineGLOBAL — Global Unconstrained Bond Fund
Opinion on the Financial Statements
We have audited the accompanying statement of assets and liabilities, including the schedule of investments, of BrandywineGLOBAL — Global Unconstrained Bond Fund (one of the funds constituting Legg Mason Global Asset Management Trust, referred to hereafter as the “Fund”) as of October 31, 2023, the related statement of operations for the year ended October 31, 2023, the statement of changes in net assets for each of the two years in the period ended October 31, 2023, including the related notes, and the financial highlights for each of the five years in the period ended October 31, 2023 (collectively referred to as the “financial statements”). In our opinion, the financial statements present fairly, in all material respects, the financial position of the Fund as of October 31, 2023, the results of its operations for the year then ended, the changes in its net assets for each of the two years in the period ended October 31, 2023 and the financial highlights for each of the five years in the period ended October 31, 2023 in conformity with accounting principles generally accepted in the United States of America.
Basis for Opinion
These financial statements are the responsibility of the Fund’s management. Our responsibility is to express an opinion on the Fund’s financial statements based on our audits. We are a public accounting firm registered with the Public Company Accounting Oversight Board (United States) (PCAOB) and are required to be independent with respect to the Fund in accordance with the U.S. federal securities laws and the applicable rules and regulations of the Securities and Exchange Commission and the PCAOB.
We conducted our audits of these financial statements in accordance with the standards of the PCAOB. Those standards require that we plan and perform the audit to obtain reasonable assurance about whether the financial statements are free of material misstatement, whether due to error or fraud.
Our audits included performing procedures to assess the risks of material misstatement of the financial statements, whether due to error or fraud, and performing procedures that respond to those risks. Such procedures included examining, on a test basis, evidence regarding the amounts and disclosures in the financial statements. Our audits also included evaluating the accounting principles used and significant estimates made by management, as well as evaluating the overall presentation of the financial statements. Our procedures included confirmation of securities owned as of October 31, 2023 by correspondence with the custodian and brokers. We believe that our audits provide a reasonable basis for our opinion.
/s/PricewaterhouseCoopers LLP
Baltimore, Maryland
December 20, 2023
We have served as the auditor of one or more investment companies in the Franklin Templeton Group of Funds since 1948.
| | | | | | |
| BrandywineGLOBAL — Global Unconstrained Bond Fund 2023 Annual Report | | | | | 47 | |
Board approval of management and subadvisory agreements (unaudited)
At an in-person meeting of the Board of Trustees of Legg Mason Global Asset Management Trust (the “Trust”) held on May 3-4, 2023, the Board, including the Trustees who are not considered to be “interested persons” of the Trust (the “Independent Trustees”) under the Investment Company Act of 1940, as amended (the “1940 Act”), approved for an annual period the continuation of the management agreement (the “Management Agreement”) between the Trust and Legg Mason Partners Fund Advisor, LLC (the “Manager”) with respect to BrandywineGLOBAL – Global Unconstrained Bond Fund, a series of the Trust (the “Fund”), and the sub-advisory agreement pursuant to which Brandywine Global Investment Management, LLC (the “Subadviser”) provides day-to-day management of the Fund’s portfolio. The management agreement and sub-advisory agreement are collectively referred to as the “Agreements.”
Background
The Board received extensive information in advance of the meeting to assist it in its consideration of the Agreements and asked questions and requested additional information from management. Throughout the year the Board (including its various committees) had met with representatives of the Manager and the Subadviser, and had received information relevant to the renewal of the Agreements. Prior to the meeting the Independent Trustees met with their independent legal counsel to discuss and consider the information provided and submitted questions to management, and they considered the responses provided. The Board received and considered a variety of information about the Manager and the Subadviser, as well as the management, advisory and sub-advisory arrangements for the Fund and other funds overseen by the Board, certain portions of which are discussed below. The information received and considered by the Board both in conjunction with the May 2023 meeting and throughout the year was both written and oral. The contractual arrangements discussed below are the product of multiple years of review and negotiation and information received and considered by the Board during those years.
The information provided and presentations made to the Board encompassed the Fund and all funds for which the Board has responsibility. The discussion below covers both the advisory and the administrative functions being rendered by the Manager, both of which functions are encompassed by the Management Agreement, as well as the advisory functions rendered by the Subadviser pursuant to the Sub-Advisory Agreement.
Board approval of management agreement and sub-advisory agreement
The Independent Trustees were advised by separate independent legal counsel throughout the process. Prior to voting, the Independent Trustees received a memorandum from their independent legal counsel discussing the legal standards for their consideration of the proposed continuation of the Agreements. The Independent Trustees also reviewed the proposed continuation of the Management Agreement and the Sub-Advisory Agreement in private sessions with their independent legal counsel at which no representatives of the
| | | | |
48 | | | | BrandywineGLOBAL — Global Unconstrained Bond Fund |
Manager and Subadviser were present. The Independent Trustees considered the Management Agreement and the Sub-Advisory Agreement separately in the course of their review. In doing so, they noted the respective roles of the Manager and the Subadviser in providing services to the Fund.
In approving the Agreements, the Board, including the Independent Trustees, considered a variety of factors, including those factors discussed below. No single factor reviewed by the Board was identified by the Board as the principal factor in determining whether to approve the Management Agreement and the Sub-Advisory Agreement. Each Trustee may have attributed different weight to the various factors in evaluating the Management Agreement and the Sub-Advisory Agreement.
After considering all relevant factors and information, the Board, exercising its business judgment, determined that the continuation of the Agreements was in the best interests of the Fund and its shareholders and approved the continuation of each such agreement for another year.
Nature, extent and quality of the services under the management agreement and sub-advisory agreement
The Board received and considered information regarding the nature, extent and quality of services provided to the Fund by the Manager and the Subadviser under the Management Agreement and the Sub-Advisory Agreement, respectively, during the past year. The Board noted information received at regular meetings throughout the year related to the services rendered by the Manager in its management of the Fund’s affairs and the Manager’s role in coordinating the activities of the Fund’s other service providers. The Board’s evaluation of the services provided by the Manager and the Subadviser took into account the Board’s knowledge gained as Trustees of funds in the fund complex overseen by the Trustees, including knowledge gained regarding the scope and quality of the investment management and other capabilities of the Manager and the Subadviser, and the quality of the Manager’s administrative and other services. The Board observed that the scope of services provided by the Manager and the Subadviser, and of the undertakings required of the Manager and Subadviser in connection with those services, including maintaining and monitoring their own and the Fund’s compliance programs, liquidity management programs, derivatives risk management programs, cybersecurity programs and valuation-related policies, had expanded over time as a result of regulatory, market and other developments. The Board also noted that on a regular basis it received and reviewed information from the Manager regarding the Fund’s compliance policies and procedures established pursuant to Rule 38a-1 under the 1940 Act. The Board also considered the risks associated with the Fund borne by the Manager and its affiliates (such as entrepreneurial, operational, reputational, litigation and regulatory risk), as well as the Manager’s and the Subadviser’s risk management processes.
| | | | | | |
| BrandywineGLOBAL — Global Unconstrained Bond Fund | | | | | 49 | |
Board approval of management and subadvisory agreements (unaudited) (cont’d)
The Board reviewed the qualifications, backgrounds and responsibilities of the Manager’s and the Subadviser’s senior personnel and the team of investment professionals primarily responsible for the day-to-day portfolio management of the Fund. The Board also considered, based on its knowledge of the Manager and the Manager’s affiliates, the financial resources of Franklin Resources, Inc., the parent organization of the Manager and the Subadviser. The Board recognized the importance of having a fund manager with significant resources.
The Board considered the division of responsibilities among the Manager and the Subadviser and the oversight provided by the Manager. The Board also considered the policies and practices of the Manager and the Subadviser regarding the selection of brokers and dealers and the execution of portfolio transactions. The Board considered management’s periodic reports to the Board on, among other things, its business plans, any organizational changes and portfolio manager compensation.
The Board received and considered performance information for the Fund as well as for a group of funds (the “Performance Universe”) selected by Broadridge Financial Solutions, Inc. (“Broadridge”), an independent provider of investment company data, based on classifications provided by Thomson Reuters Lipper (“Lipper”). The Board was provided with a description of the methodology used to determine the similarity of the Fund with the funds included in the Performance Universe. It was noted that while the Board found the Broadridge data generally useful, they recognized its limitations, including that the data may vary depending on the end date selected and that the results of the performance comparisons may vary depending on the selection of the peer group and its composition over time. The Board also noted that it had received and discussed with management information throughout the year at periodic intervals comparing the Fund’s performance against its benchmark and against the Fund’s peers. The Board also considered the Fund’s performance in light of overall financial market conditions.
The information comparing the Fund’s performance to that of its Performance Universe, consisting of funds (including the Fund) classified as alternative global macro funds by Lipper, showed, among other data, that the performance of the Fund’s Class I shares for the 1-, 3-, 5- and 10-year periods ended December 31, 2022 was above the median performance of the funds in the Performance Universe for the 1-year period and below the median performance of the funds in the Performance Universe for the 3-, 5- and 10-year periods. The Board noted the explanations from the Manager and the Subadviser concerning the reasons for the Fund’s relative performance versus the peer group for the various periods. The Board also noted that the Fund’s performance was ahead of its benchmark for the quarter ended March 31, 2023.
| | | | |
50 | | | | BrandywineGLOBAL — Global Unconstrained Bond Fund |
The Board concluded that, overall, the nature, extent and quality of services provided (and expected to be provided), including performance, under the Management Agreement and the Sub-Advisory Agreement were sufficient for renewal.
Management fees and expense ratios
The Board reviewed and considered the contractual management fee payable by the Fund to the Manager (the “Contractual Management Fee”) and the actual management fees paid by the Fund to the Manager after giving effect to breakpoints and waivers, if any (the “Actual Management Fee”), in light of the nature, extent and quality of the management and sub-advisory services provided by the Manager and the Subadviser, respectively. The Board also considered that fee waiver and/or expense reimbursement arrangements are currently in place for the Fund. The Board also noted that the compensation paid to the Subadviser is the responsibility and expense of the Manager, not the Fund.
The Board received and considered information provided by Broadridge comparing the Contractual Management Fee and the Actual Management Fee and the Fund’s total actual expenses with those of funds in both the relevant expense group and a broader group of funds, each selected by Broadridge based on classifications provided by Lipper. It was noted that while the Board found the Broadridge data generally useful, they recognized its limitations, including that the data may vary depending on the selection of the peer group. The Board also reviewed information regarding fees charged by the Manager and/or the Subadviser to other U.S. clients investing primarily in an asset class similar to that of the Fund, including, institutional separate and commingled accounts.
The Manager reviewed with the Board the differences in services provided to these different types of accounts, noting that the Fund is provided with certain administrative services, office facilities, and Fund officers (including the Fund’s chief executive, chief financial and chief compliance officers), and that the Manager coordinates and oversees the provision of services to the Fund by other Fund service providers. The Board considered the fee comparisons in light of the differences in management of these different types of accounts, and the differences in the degree of entrepreneurial and other risks borne by the Manager in managing the Fund and in managing other types of accounts.
The Board considered the overall management fee, the fees of the Subadviser and the amount of the management fee retained by the Manager after payment of the subadvisory fees, in each case in light of the services rendered for those amounts. The Board also received an analysis of complex-wide management fees provided by the Manager, which, among other things, set out a framework of fees based on asset classes.
The Board also received and considered information comparing the Fund’s Contractual Management Fee and Actual Management Fee as well as its actual total expense ratio with those of a group of funds consisting of 11 alternative global macro funds (including the
| | | | | | |
| BrandywineGLOBAL — Global Unconstrained Bond Fund | | | | | 51 | |
Board approval of management and subadvisory agreements (unaudited) (cont’d)
Fund) selected by Broadridge to be comparable to the Fund (the “Expense Group”), and a broader group of funds selected by Broadridge consisting of alternative global macro funds (including the Fund) (the “Expense Universe”). This information showed that the Fund’s Contractual Management Fee was below the median of management fees payable by the funds in the Expense Group and that the Fund’s Actual Management Fee was below the median of management fees paid by the funds in the Expense Group and below the median of management fees paid by the funds in the Expense Universe. This information also showed that the Fund’s actual total expense ratio was below the median of the total expense ratios of the funds in the Expense Group and below the median of the actual total expense ratios of the funds in the Expense Universe. The Board also considered that the current limitation on the Fund’s expenses is expected to continue until and expire on December 31, 2024.
Taking all of the above into consideration, as well as the factors identified below, the Board determined that the management fee and the subadvisory fees for the Fund were reasonable in light of the nature, extent and quality of the services provided to the Fund under the Management Agreement and the Sub-Advisory Agreement.
Manager profitability
The Board received and considered an analysis of the profitability of the Manager and its affiliates in providing services to the Fund. The Board also received profitability information with respect to the Legg Mason Funds complex as a whole. The Board received information with respect to the Manager’s allocation methodologies used in preparing this profitability data. It was noted that the allocation methodologies had previously been reviewed by an outside consultant. The profitability of the Manager and its affiliates was considered by the Board not excessive in light of the nature, extent and quality of the services provided to the Fund.
Economies of scale
The Board received and discussed information concerning whether the Manager realizes economies of scale with respect to the management of the Fund as the Fund’s assets grow. The Board noted that the Manager had previously agreed to institute breakpoints in the Fund’s Contractual Management Fee, reflecting the potential for reducing the blended rate of the Contractual Management Fee as the Fund grows. The Board considered whether the breakpoint fee structure was a reasonable means of sharing with Fund investors any economies of scale or other efficiencies that might accrue from increases in the Fund’s asset levels. The Board noted that the Fund had not reached the specified asset level at which a breakpoint to its Contractual Management Fee would be triggered. The Board also noted the size of the Fund.
The Board determined that the management fee structure for the Fund, including breakpoints, was reasonable.
| | | | |
52 | | | | BrandywineGLOBAL — Global Unconstrained Bond Fund |
Other benefits to the manager and the subadviser
The Board considered other benefits received by the Manager, the Subadviser and their affiliates as a result of their relationship with the Fund, including the opportunity to offer additional products and services to Fund shareholders, including the appointment of an affiliate of the Manager as the transfer agent of the Fund.
In light of the costs of providing investment management and other services to the Fund and the ongoing commitment of the Manager and the Subadviser to the Fund, the Board considered that the ancillary benefits that the Manager, the Subadviser and their affiliates received were reasonable.
| | | | | | |
| BrandywineGLOBAL — Global Unconstrained Bond Fund | | | | | 53 | |
Statement regarding liquidity risk management program (unaudited)
Each of the Franklin Templeton and Legg Mason Funds has adopted and implemented a written Liquidity Risk Management Program (the “LRMP”) as required by Rule 22e-4 under the Investment Company Act of 1940 (the “Liquidity Rule”). The LRMP is designed to assess and manage each Fund’s liquidity risk, which is defined as the risk that the Fund could not meet requests to redeem shares issued by the Fund without significant dilution of remaining investors’ interests in the Fund. In accordance with the Liquidity Rule, the LRMP includes policies and procedures that provide for: (1) assessment, management, and review (no less frequently than annually) of each Fund’s liquidity risk; (2) classification of each Fund’s portfolio holdings into one of four liquidity categories (Highly Liquid, Moderately Liquid, Less Liquid, and Illiquid); (3) for Funds that do not primarily hold assets that are Highly Liquid, establishing and maintaining a minimum percentage of the Fund’s net assets in Highly Liquid investments (called a “Highly Liquid Investment Minimum” or “HLIM”); and (4) prohibiting the Fund’s acquisition of Illiquid investments that would result in the Fund holding more than 15% of its net assets in Illiquid assets. The LRMP also requires reporting to the Securities and Exchange Commission (“SEC”) (on a non-public basis) and to the Board if the Fund’s holdings of Illiquid assets exceed 15% of the Fund’s net assets. Funds with HLIMs must have procedures for addressing HLIM shortfalls, including reporting to the Board and, with respect to HLIM shortfalls lasting more than seven consecutive calendar days, reporting to the SEC (on a non-public basis).
The Director of Liquidity Risk within the Investment Risk Management Group (the “IRMG”) is the appointed Administrator of the LRMP. The IRMG maintains the Investment Liquidity Committee (the “ILC”) to provide oversight and administration of policies and procedures governing liquidity risk management for Franklin Templeton and Legg Mason products and portfolios. The ILC includes representatives from Franklin Templeton’s Risk, Trading, Global Compliance, Legal, Investment Compliance, Investment Operations, Valuation Committee, Product Management and Global Product Strategy.
In assessing and managing each Fund’s liquidity risk, the ILC considers, as relevant, a variety of factors, including the Fund’s investment strategy and the liquidity of its portfolio investments during both normal and reasonably foreseeable stressed conditions; its short and long-term cash flow projections; and its cash holdings and access to other funding sources including the Funds’ interfund lending facility and line of credit. Classification of the Fund’s portfolio holdings in the four liquidity categories is based on the number of days it is reasonably expected to take to convert the investment to cash (for Highly Liquid and Moderately Liquid holdings) or sell or dispose of the investment (for Less Liquid and Illiquid investments), in current market conditions without significantly changing the investment’s market value.
Each Fund primarily holds liquid assets that are defined under the Liquidity Rule as “Highly Liquid Investments,” and therefore is not required to establish an HLIM. Highly Liquid
| | | | |
54 | | | | BrandywineGLOBAL — Global Unconstrained Bond Fund |
Investments are defined as cash and any investment reasonably expected to be convertible to cash in current market conditions in three business days or less without the conversion to cash significantly changing the market value of the investment.
At meetings of the Funds’ Board of Trustees held in May 2023, the Program Administrator provided a written report to the Board addressing the adequacy and effectiveness of the program for the year ended December 31, 2022. The Program Administrator report concluded that (i.) the LRMP, as adopted and implemented, remains reasonably designed to assess and manage each Fund’s liquidity risk; (ii.) the LRMP, including the Highly Liquid Investment Minimum (“HLIM”) where applicable, was implemented and operated effectively to achieve the goal of assessing and managing each Fund’s liquidity risk; and (iii.) each Fund was able to meet requests for redemption without significant dilution of remaining investors’ interests in the Fund.
| | | | | | |
| BrandywineGLOBAL — Global Unconstrained Bond Fund | | | | | 55 | |
Additional information (unaudited)
Information about Trustees and Officers
The business and affairs of BrandywineGLOBAL — Global Unconstrained Bond Fund (the “Fund”) are conducted by management under the supervision and subject to the direction of its Board of Trustees. The business address of each Trustee is c/o Jane Trust, Franklin Templeton, 280 Park Avenue, 8th Floor, New York, New York 10017.
Information pertaining to the Trustees and officers of the Fund is set forth below. The Statement of Additional Information includes additional information about Trustees and is available, without charge, upon request by calling the Fund at 877-6LM-FUND/656-3863.
| | |
| Independent Trustees† | | |
| |
| Paul R. Ades | | |
| Year of birth | | 1940 |
| Position(s) with Trust | | Trustee |
| Term of office1 and length of time served2 | | Since 1983 |
| Principal occupation(s) during the past five years | | Paul R. Ades, PLLC (law firm) (since 2000) |
| Number of funds in fund complex overseen by Trustee | | 55 |
| Other board memberships held by Trustee during the past five years | | None |
| |
| Andrew L. Breech | | |
| |
| Year of birth | | 1952 |
| Position(s) with Trust | | Trustee |
| Term of office1 and length of time served2 | | Since 1991 |
| Principal occupation(s) during the past five years | | President, Dealer Operating Control Service, Inc. (automotive retail management) (since 1985) |
| Number of funds in fund complex overseen by Trustee | | 55 |
| Other board memberships held by Trustee during the past five years | | None |
| |
| Althea L. Duersten | | |
| |
| Year of birth | | 1951 |
| Position(s) with Trust | | Trustee and Chair of the Board |
| Term of office1 and length of time served2 | | Since 2014 (Chair of the Board since 2021) |
| Principal occupation(s) during the past five years | | Retired (since 2011); formerly, Chief Investment Officer, North America, JPMorgan Chase (investment bank) and member of JPMorgan Executive Committee (2007 to 2011) |
| Number of funds in fund complex overseen by Trustee | | 55 |
| Other board memberships held by Trustee during the past five years | | Formerly, Non-Executive Director, Rokos Capital Management LLP (2019 to 2020) |
| | | | |
56 | | | | BrandywineGLOBAL — Global Unconstrained Bond Fund |
| | |
| Independent Trustees† (cont’d) | | |
| |
| Stephen R. Gross | | |
| |
| Year of birth | | 1947 |
| Position(s) with Trust | | Trustee |
| Term of office1 and length of time served2 | | Since 1986 |
| Principal occupation(s) during the past five years | | Chairman Emeritus (since 2011) and formerly, Chairman, HLB Gross Collins, P.C. (accounting and consulting firm) (1979 to 2011); Executive Director of Business Builders Team, LLC (since 2005); Principal, Gross Consulting Group, LLC (since 2011); CEO, Gross Capital Partners, LLC (since 2014); CEO, Trusted CFO Solutions, LLC (since 2011) |
| Number of funds in fund complex overseen by Trustee | | 55 |
| Other board memberships held by Trustee during the past five years | | None |
| |
| Susan M. Heilbron | | |
| |
| Year of birth | | 1945 |
| Position(s) with Trust | | Trustee |
| Term of office1 and length of time served2 | | Since 1991 |
| Principal occupation(s) during the past five years | | Retired; formerly, President, Lacey & Heilbron (communications consulting) (1990 to 2002); General Counsel and Executive Vice President, The Trump Organization (1986 to 1990); Senior Vice President, New York State Urban Development Corporation (1984 to 1986); Associate, Cravath, Swaine & Moore LLP (1980 to 1984 and 1977 to 1979) |
| Number of funds in fund complex overseen by Trustee | | 55 |
| Other board memberships held by Trustee during the past five years | | None |
| |
| Arnold L. Lehman | | |
| |
| Year of birth | | 1944 |
| Position(s) with Trust | | Trustee |
| Term of office1 and length of time served2 | | Since 1982 |
| Principal occupation(s) during the past five years | | Senior Advisor, Phillips (auction house) (since 2015); formerly, Fellow, Ford Foundation (2015 to 2016); Director of the Brooklyn Museum (1997 to 2015) |
| Number of funds in fund complex overseen by Trustee | | 55 |
| Other board memberships held by Trustee during the past five years | | Trustee of American Federation of Arts (since 2002) |
| | | | | | |
| BrandywineGLOBAL — Global Unconstrained Bond Fund | | | | | 57 | |
Additional information (unaudited) (cont’d)
Information about Trustees and Officers
| | |
| Independent Trustees† (cont’d) | | |
| |
| Robin J. W. Masters | | |
| |
| Year of birth | | 1955 |
| Position(s) with Trust | | Trustee |
| Term of office1 and length of time served2 | | Since 2002 |
| Principal occupation(s) during the past five years | | Retired; formerly, Chief Investment Officer of ACE Limited (insurance) (1986 to 2000) |
| Number of funds in fund complex overseen by Trustee | | 55 |
| Other board memberships held by Trustee during the past five years | | Director of HSBC Managed Portfolios Limited and HSBC Specialist Funds Limited (since 2020); formerly, Director of Cheyne Capital International Limited (investment advisory firm) (2005 to 2020); Director/ Trustee of Legg Mason Institutional Funds plc, Western Asset Fixed Income Funds plc and Western Asset Debt Securities Fund plc. (2007 to 2011) |
| |
| Ken Miller | | |
| |
| Year of birth | | 1942 |
| Position(s) with Trust | | Trustee |
| Term of office1 and length of time served2 | | Since 1983 |
| Principal occupation(s) during the past five years | | Retired; formerly, President, Young Stuff Apparel Group, Inc. (apparel manufacturer), division of Li & Fung (1963 to 2012) |
| Number of funds in fund complex overseen by Trustee | | 55 |
| Other board memberships held by Trustee during the past five years | | None |
| |
| G. Peter O’Brien | | |
| |
| Year of birth | | 1945 |
| Position(s) with Trust | | Trustee |
| Term of office1 and length of time served2 | | Since 1999 |
| Principal occupation(s) during the past five years | | Retired, Trustee Emeritus of Colgate University (since 2005); Board Member, Hill House, Inc. (residential home care) (since 1999); formerly, Board Member, Bridges School (pre-school) (2006 to 2017); Managing Director, Equity Capital Markets Group of Merrill Lynch & Co. (1971 to 1999) |
| Number of funds in fund complex overseen by Trustee | | Trustee of Legg Mason funds consisting of 55 portfolios; Director/Trustee of the Royce Family of Funds consisting of 16 portfolios |
| Other board memberships held by Trustee during the past five years | | Formerly, Director of TICC Capital Corp. (2003 to 2017) |
| | | | |
58 | | | | BrandywineGLOBAL — Global Unconstrained Bond Fund |
| | |
| Independent Trustees† (cont’d) | | |
| |
| Thomas F. Schlafly | | |
| |
| Year of birth | | 1948 |
| Position(s) with Trust | | Trustee |
| Term of office1 and length of time served2 | | Since 1983 |
| Principal occupation(s) during the past five years | | Chairman, The Saint Louis Brewery, LLC (brewery) (since 2012); formerly, President, The Saint Louis Brewery, Inc. (1989 to 2012); Senior Counsel (since 2017) and formerly, Partner (2009 to 2016), Thompson Coburn LLP (law firm) |
| Number of funds in fund complex overseen by Trustee | | 55 |
| Other board memberships held by Trustee during the past five years | | Director, CNB St. Louis Bank (since 2020); formerly, Director, Citizens National Bank of Greater St. Louis (2006 to 2020) |
| | |
| Interested Trustee and Officer | | |
| |
| Jane Trust, CFA3 | | |
| |
| Year of birth | | 1962 |
| Position(s) with Trust | | Trustee, President and Chief Executive Officer |
| Term of office1 and length of time served2 | | Since 2015 |
| Principal occupation(s) during the past five years | | Senior Vice President, Fund Board Management, Franklin Templeton (since 2020); Officer and/or Trustee/Director of 123 funds associated with LMPFA or its affiliates (since 2015); President and Chief Executive Officer of LMPFA (since 2015); formerly, Senior Managing Director (2018 to 2020) and Managing Director (2016 to 2018) of Legg Mason & Co., LLC (“Legg Mason & Co.”); and Senior Vice President of LMPFA (2015) |
| Number of funds in fund complex overseen by Trustee | | 123 |
| Other board memberships held by Trustee during the past five years | | None |
| | |
| Additional Officers | | |
| |
| Ted P. Becker | | |
| |
| Franklin Templeton | | |
| |
| 280 Park Avenue, 8th Floor, New York, NY 10017 | | |
| |
| Year of birth | | 1951 |
| Position(s) with Trust | | Chief Compliance Officer |
| Term of office1 and length of time served2 | | Since 2007 |
| Principal occupation(s) during the past five years | | Vice President, Global Compliance of Franklin Templeton (since 2020); Chief Compliance Officer of LMPFA (since 2006); Chief Compliance Officer of certain funds associated with Legg Mason & Co. or its affiliates (since 2006); formerly, Director of Global Compliance at Legg Mason, Inc. (2006 to 2020); Managing Director of Compliance of Legg Mason & Co. (2005 to 2020) |
| | | | | | |
| BrandywineGLOBAL — Global Unconstrained Bond Fund | | | | | 59 | |
Additional information (unaudited) (cont’d)
Information about Trustees and Officers
| | |
| Additional Officers (cont’d) | | |
| |
| Susan Kerr | | |
| |
| Franklin Templeton | | |
| |
| 280 Park Avenue, 8th Floor, New York, NY 10017 | | |
| |
| Year of birth | | 1949 |
| Position(s) with Trust | | Chief Anti-Money Laundering Compliance Officer |
| Term of office1 and length of time served2 | | Since 2013 |
| Principal occupation(s) during the past five years | | Senior Compliance Analyst, Franklin Templeton (since 2020); Chief Anti-Money Laundering Compliance Officer of certain funds associated with Legg Mason & Co. or its affiliates (since 2013) and Anti-Money Laundering Compliance Officer (since 2012), Senior Compliance Officer (since 2011) and Assistant Vice President (since 2010) of Franklin Distributors, LLC; formerly, Assistant Vice President of Legg Mason & Co. (2010 to 2020) |
| |
| Marc A. De Oliveira | | |
| |
| Franklin Templeton | | |
| |
| 100 First Stamford Place, 6th Floor, Stamford, CT 06902 | | |
| |
| Year of birth | | 1971 |
| Position(s) with Trust | | Secretary and Chief Legal Officer |
| Term of office1 and length of time served2 | | Since 2020 |
| Principal occupation(s) during the past five years | | Associate General Counsel of Franklin Templeton (since 2020); Assistant Secretary of certain funds associated with Legg Mason & Co. or its affiliates (since 2006); formerly, Managing Director (2016 to 2020) and Associate General Counsel of Legg Mason & Co. (2005 to 2020) |
| |
| Thomas C. Mandia | | |
| |
| Franklin Templeton | | |
| |
| 100 First Stamford Place, 6th Floor, Stamford, CT 06902 | | |
| |
| Year of birth | | 1962 |
| Position(s) with Trust | | Senior Vice President |
| Term of office1 and length of time served2 | | Since 2020 |
| Principal occupation(s) during the past five years | | Senior Associate General Counsel of Franklin Templeton (since 2020); Secretary of LMPFA (since 2006); Assistant Secretary of certain funds associated with Legg Mason & Co. or its affiliates (since 2006); Secretary of LM Asset Services, LLC (“LMAS”) (since 2002) and Legg Mason Fund Asset Management, Inc. (“LMFAM”) (since 2013) (formerly registered investment advisers); formerly, Managing Director and Deputy General Counsel of Legg Mason & Co. (2005 to 2020) |
| | | | |
60 | | | | BrandywineGLOBAL — Global Unconstrained Bond Fund |
| | |
| Additional Officers (cont’d) | | |
| |
| Christopher Berarducci | | |
| |
| Franklin Templeton | | |
| |
| 280 Park Avenue, 8th Floor, New York, NY 10017 | | |
| |
| Year of birth | | 1974 |
| Position(s) with Trust | | Treasurer and Principal Financial Officer |
| Term of office1 and length of time served2 | | Since 2010 and 2019 |
| Principal occupation(s) during the past five years | | Vice President, Fund Administration and Reporting, Franklin Templeton (since 2020); Treasurer (since 2010) and Principal Financial Officer (since 2019) of certain funds associated with Legg Mason & Co. or its affiliates; formerly, Managing Director (2020), Director (2015 to 2020), and Vice President (2011 to 2015) of Legg Mason & Co. |
| |
| Jeanne M. Kelly | | |
| |
| Franklin Templeton | | |
| |
| 280 Park Avenue, 8th Floor, New York, NY 10017 | | |
| |
| Year of birth | | 1951 |
| Position(s) with Trust | | Senior Vice President |
| Term of office1 and length of time served2 | | Since 2007 |
| Principal occupation(s) during the past five years | | U.S. Fund Board Team Manager, Franklin Templeton (since 2020); Senior Vice President of certain funds associated with Legg Mason & Co. or its affiliates (since 2007); Senior Vice President of LMPFA (since 2006); President and Chief Executive Officer of LMAS and LMFAM (since 2015); formerly, Managing Director of Legg Mason & Co. (2005 to 2020); Senior Vice President of LMFAM (2013 to 2015) |
| † | Trustees who are not “interested persons” of the Fund within the meaning of Section 2(a)(19) of the Investment Company Act of 1940, as amended (the “1940 Act”). |
| 1 | Each Trustee and officer serves until his or her respective successor has been duly elected and qualified or until his or her earlier death, resignation, retirement or removal. |
| 2 | Indicates the earliest year in which the Trustee became a board member for a fund in the Legg Mason fund complex or the officer took such office. |
| 3 | Ms. Trust is an “interested person” of the Fund, as defined in the 1940 Act, because of her position with LMPFA and/or certain of its affiliates. |
| | | | | | |
| BrandywineGLOBAL — Global Unconstrained Bond Fund | | | | | 61 | |
Important tax information (unaudited)
By mid-February, tax information related to a shareholder’s proportionate share of distributions paid during the preceding calendar year will be received, if applicable. Please also refer to www.franklintempleton.com for per share tax information related to any distributions paid during the preceding calendar year. Shareholders are advised to consult with their tax advisors for further information on the treatment of these amounts on their tax returns.
The following tax information for the Fund is required to be furnished to shareholders with respect to income earned and distributions paid during its fiscal year.
The Fund hereby reports the following amounts, or if subsequently determined to be different, the maximum allowable amounts, for the fiscal year ended October 31, 2023:
| | | | | | | | |
| | | Pursuant to: | | | Amount Reported | |
| Qualified Net Interest Income (QII) | | § | 871(k)(1)(C) | | | | $6,684,491 | |
| Section 163(j) Interest Earned | | § | 163(j) | | | | $22,502,246 | |
| Interest Earned from Federal Obligations | | | Note (1) | | | | $4,280,420 | |
Note (1) - The law varies in each state as to whether and what percentage of dividend income attributable to Federal obligations is exempt from state income tax. Shareholders are advised to consult with their tax advisors to determine if any portion of the dividends received is exempt from state income taxes.
| | | | |
62 | | | | BrandywineGLOBAL — Global Unconstrained Bond Fund |
BrandywineGLOBAL —
Global Unconstrained Bond Fund
Trustees
Paul R. Ades
Andrew L. Breech
Althea L. Duersten
Chair
Stephen R. Gross
Susan M. Heilbron
Arnold L. Lehman
Robin J. W. Masters
Ken Miller
G. Peter O’Brien
Thomas F. Schlafly
Jane Trust
Investment manager
Franklin Templeton Fund Adviser, LLC*
Subadviser
Brandywine Global Investment
Management, LLC
Distributor
Franklin Distributors, LLC
Custodian
The Bank of New York Mellon
| * | Formerly known as Legg Mason Partners Fund Advisor, LLC. |
Transfer agent
Franklin Templeton Investor
Services, LLC
3344 Quality Drive
Rancho Cordova, CA 95670-7313
Independent registered public accounting firm
PricewaterhouseCoopers LLP
Baltimore, MD
BrandywineGLOBAL — Global Unconstrained Bond Fund
The Fund is a separate investment series of Legg Mason Global Asset Management Trust, a Maryland statutory trust.
BrandywineGLOBAL — Global Unconstrained Bond Fund
Legg Mason Funds
100 International Drive
Baltimore, MD 21202
The Fund files its complete schedule of portfolio holdings with the Securities and Exchange Commission (“SEC”) for the first and third quarters of each fiscal year as an exhibit to its reports on Form N-PORT. The Fund’s Forms N-PORT are available on the SEC’s website at www.sec.gov. To obtain information on Form N-PORT, shareholders can call the Fund at 877-6LM-FUND/656-3863.
Information on how the Fund voted proxies relating to portfolio securities during the prior 12-month period ended June 30th of each year and a description of the policies and procedures that the Fund uses to determine how to vote proxies related to portfolio transactions are available (1) without charge, upon request, by calling the Fund at 877-6LM-FUND/656-3863, (2) at www.franklintempleton.com and (3) on the SEC’s website at www.sec.gov.
This report is submitted for the general information of the shareholders of BrandywineGLOBAL — Global Unconstrained Bond Fund. This report is not authorized for distribution to prospective investors in the Fund unless preceded or accompanied by a current prospectus.
Investors should consider the Fund’s investment objectives, risks, charges and expenses carefully before investing. The prospectus contains this and other important information about the Fund. Please read the prospectus carefully before investing.
www.franklintempleton.com
© 2023 Franklin Distributors, LLC, Member FINRA/SIPC. All rights reserved.
Legg Mason Funds Privacy and Security Notice
Your Privacy Is Our Priority
Franklin Templeton* is committed to safeguarding your personal information. This notice is designed to provide you with a summary of the non-public personal information Franklin Templeton may collect and maintain about current or former individual investors; our policy regarding the use of that information; and the measures we take to safeguard the information. We do not sell individual investors’ non-public personal information to anyone and only share it as described in this notice.
Information We Collect
When you invest with us, you provide us with your non-public personal information. We collect and use this information to service your accounts and respond to your requests. The non-public personal information we may collect falls into the following categories:
| • | | Information we receive from you or your financial intermediary on applications or other forms, whether we receive the form in writing or electronically. For example, this information may include your name, address, tax identification number, birth date, investment selection, beneficiary information, and your personal bank account information and/or email address if you have provided that information. |
| • | | Information about your transactions and account history with us, or with other companies that are part of Franklin Templeton, including transactions you request on our website or in our app. This category also includes your communications to us concerning your investments. |
| • | | Information we receive from third parties (for example, to update your address if you move, obtain or verify your email address or obtain additional information to verify your identity). |
| • | | Information collected from you online, such as your IP address or device ID and data gathered from your browsing activity and location. (For example, we may use cookies to collect device and browser information so our website recognizes your online preferences and device information.) Our website contains more information about cookies and similar technologies and ways you may limit them. |
| • | | Other general information that we may obtain about you such as demographic information. |
Disclosure Policy
To better service your accounts and process transactions or services you requested, we may share non-public personal information with other Franklin Templeton companies. From time to time we may also send you information about products/services offered by other Franklin Templeton companies although we will not share your non-public personal information with these companies without first offering you the opportunity to prevent that sharing.
We will only share non-public personal information with outside parties in the limited circumstances permitted by law. For example, this includes situations where we need to share information with companies who work on our behalf to service or maintain your account or
|
| NOT PART OF THE ANNUAL REPORT |
Legg Mason Funds Privacy and Security Notice (cont’d)
process transactions you requested, when the disclosure is to companies assisting us with our own marketing efforts, when the disclosure is to a party representing you, or when required by law (for example, in response to legal process). Additionally, we will ensure that any outside companies working on our behalf, or with whom we have joint marketing agreements, are under contractual obligations to protect the confidentiality of your information, and to use it only to provide the services we asked them to perform.
Confidentiality and Security
Our employees are required to follow procedures with respect to maintaining the confidentiality of our investors’ non-public personal information. Additionally, we maintain physical, electronic and procedural safeguards to protect the information. This includes performing ongoing evaluations of our systems containing investor information and making changes when appropriate.
At all times, you may view our current privacy notice on our website at franklintempleton.com or contact us for a copy at (800) 632-2301.
*For purposes of this privacy notice Franklin Templeton shall refer to the following entities:
Fiduciary Trust International of the South (FTIOS), as custodian for individual retirement plans
Franklin Advisers, Inc.
Franklin Distributors, LLC, including as program manager of the Franklin Templeton 529 College Savings Plan and the NJBEST 529 College Savings Plan
Franklin Mutual Advisers, LLC
Franklin, Templeton and Mutual Series Funds
Franklin Templeton Institutional, LLC
Franklin Templeton Investments Corp., Canada
Franklin Templeton Investments Management, Limited UK
Franklin Templeton Portfolio Advisors, Inc.
Legg Mason Funds serviced by Franklin Templeton Investor Services, LLC
Templeton Asset Management, Limited
Templeton Global Advisors, Limited
Templeton Investment Counsel, LLC
If you are a customer of other Franklin Templeton affiliates and you receive notices from them, you will need to read those notices separately.
|
| NOT PART OF THE ANNUAL REPORT |
www.franklintempleton.com
© 2023 Franklin Distributors, LLC, Member FINRA/SIPC. All rights reserved.
LMFX014206 12/23 SR23-4782
The registrant has adopted a code of ethics that applies to the registrant’s principal executive officer, principal financial officer, principal accounting officer or controller.
| ITEM 3. | AUDIT COMMITTEE FINANCIAL EXPERT. |
The Board of Trustees of the registrant has determined that Stephen R. Gross possesses the technical attributes identified in Instruction 2(b) of Item 3 to Form N-CSR to qualify as an “audit committee financial expert,” and has designated Stephen R. Gross as the Audit Committee’s financial expert. Stephen R. Gross is an “independent” Trustees pursuant to paragraph (a)(2) of Item 3 to Form N-CSR.
| ITEM 4. | PRINCIPAL ACCOUNTANT FEES AND SERVICES. |
(a) Audit Fees. The aggregate fees billed in the last two fiscal years ending October 31, 2022 and October 31, 2023 (the “Reporting Periods”) for professional services rendered by the Registrant’s principal accountant (the “Auditor”) for the audit of the Registrant’s annual financial statements, or services that are normally provided by the Auditor in connection with the statutory and regulatory filings or engagements for the Reporting Periods, were $200,329 in October 31, 2022 and $200,329 in October 31, 2023.
(b) Audit-Related Fees. The aggregate fees billed in the Reporting Period for assurance and related services by the Auditor that are reasonably related to the performance of the Registrant’s financial statements were $0 in October 31, 2022 and $0 in October 31, 2023.
(c) Tax Fees. The aggregate fees billed in the Reporting Periods for professional services rendered by the Auditor for tax compliance, tax advice and tax planning (“Tax Services”) were $52,000 in October 31, 2022 and $52,000 in October 31, 2023. These services consisted of (i) review or preparation of U.S. federal, state, local and excise tax returns; (ii) U.S. federal, state and local tax planning, advice and assistance regarding statutory, regulatory or administrative developments, and (iii) tax advice regarding tax qualification matters and/or treatment of various financial instruments held or proposed to be acquired or held.
There were no fees billed for tax services by to the service affiliates during the Reporting Periods that required pre-approval by the Audit Auditors Committee.
(d) All Other Fees. The aggregate fees for other fees billed in the Reporting Periods for products and services provided by the Auditor were $0 in October 31, 2022 and $0 in October 31, 2023, other than the services reported in paragraphs (a) through (c) of this item for the Legg Mason Global Asset Management Trust.
All Other Fees. There were no other non-audit services rendered by the Auditor to Legg Mason Partners Fund Advisors, LLC (“LMPFA”), and any entity controlling, controlled by or under common control with LMPFA that provided ongoing services to Legg Mason Global Asset Management Trust requiring pre-approval by the Audit Committee in the Reporting Period.
(e) Audit Committee’s pre–approval policies and procedures described in paragraph (c) (7) of Rule 2-01 of Regulation S-X.
(1) The Charter for the Audit Committee (the “Committee”) of the Board of each registered investment company (the “Fund”) advised by LMPFA or one of their affiliates (each, an “Adviser”) requires that the Committee shall approve (a) all audit and permissible non-audit services to be provided to the Fund and (b) all permissible non-audit services to be provided by the Fund’s independent auditors to the Adviser and any Covered Service Providers if the engagement relates directly to the operations and financial reporting of the Fund. The Committee may implement policies and procedures by which such services are approved other than by the full Committee.
The Committee shall not approve non-audit services that the Committee believes may impair the independence of the auditors. As of the date of the approval of this Audit Committee Charter, permissible non-audit services include any professional services (including tax services), that are not prohibited services as described below, provided to the Fund by the independent auditors, other than those provided to the Fund in connection with an audit or a review of the financial statements of the Fund. Permissible non-audit services may not include: (i) bookkeeping or other services related to the accounting records or financial statements of the Fund; (ii) financial information systems design and implementation; (iii) appraisal or valuation services, fairness opinions or contribution-in-kind reports; (iv) actuarial services; (v) internal audit outsourcing services; (vi) management functions or human resources; (vii) broker or dealer, investment adviser or investment banking services; (viii) legal services and expert services unrelated to the audit; and (ix) any other service the Public Company Accounting Oversight Board determines, by regulation, is impermissible.
Pre-approval by the Committee of any permissible non-audit services is not required so long as: (i) the aggregate amount of all such permissible non-audit services provided to the Fund, the Adviser and any service providers controlling, controlled by or under common control with the Adviser that provide ongoing services to the Fund (“Covered Service Providers”) constitutes not more than 5% of the total amount of revenues paid to the independent auditors during the fiscal year in which the permissible non-audit services are provided to (a) the Fund, (b) the Adviser and (c) any entity controlling, controlled by or under common control with the Adviser that provides ongoing services to the Fund during the fiscal year in which the services are provided that would have to be approved by the Committee; (ii) the permissible non-audit services were not recognized by the Fund at the time of the engagement to be non-audit services; and (iii) such services are promptly brought to the attention of the Committee and approved by the Committee (or its delegate(s)) prior to the completion of the audit.
(2) None of the services described in paragraphs (b) through (d) of this Item were performed in reliance on paragraph (c)(7)(i)(C) of Rule 2-01 of Regulation S-X.
(f) Not applicable.
(g) Non-audit fees billed by the Auditor for services rendered to Legg Mason Global Asset Management Trust, LMPFA and any entity controlling, controlled by, or under common control with LMPFA that provides ongoing services to Legg Mason Global Asset Management Trust during the reporting period were $824,290 in October 31, 2022 and $835,053 in October 31, 2023.
(h) Yes. Legg Mason Global Asset Management Trust’s Audit Committee has considered whether the provision of non-audit services that were rendered to Service Affiliates, which were not pre-approved (not requiring pre-approval), is compatible with maintaining the Accountant’s independence. All services provided by the Auditor to the Legg Mason Global Asset Management Trust or to Service Affiliates, which were required to be pre-approved, were pre-approved as required.
(i) Not applicable.
(j) Not applicable.
| ITEM 5. | AUDIT COMMITTEE OF LISTED REGISTRANTS. |
| | a) | The independent board members are acting as the registrant’s audit committee as specified in Section 3(a)(58)(B) of the Exchange Act. The Audit Committee consists of the following Board members: |
Paul R. Ades
Andrew L. Breech
Althea L. Duersten
Stephen R. Gross
Susan M. Heilbron
Arnold L. Lehman
Robin J. W. Masters
Ken Miller
G. Peter O’Brien
Thomas F. Schlafly
| ITEM 6. | SCHEDULE OF INVESTMENTS. |
Included herein under Item 1.
| ITEM 7. | DISCLOSURE OF PROXY VOTING POLICIES AND PROCEDURES FOR CLOSED-END MANAGEMENT INVESTMENT COMPANIES. |
Not applicable.
| ITEM 8. | PORTFOLIO MANAGERS OF CLOSED-END MANAGEMENT INVESTMENT COMPANIES. |
Not applicable.
| ITEM 9. | PURCHASES OF EQUITY SECURITIES BY CLOSED-END MANAGEMENT INVESTMENT COMPANY AND AFFILIATED PURCHASERS. |
Not applicable.
| ITEM 10. | SUBMISSION OF MATTERS TO A VOTE OF SECURITY HOLDERS. |
Not applicable.
| ITEM 11. | CONTROLS AND PROCEDURES. |
| | (a) | The registrant’s principal executive officer and principal financial officer have concluded that the registrant’s disclosure controls and procedures (as defined in Rule 30a- 3(c) under the Investment Company Act of 1940, as amended (the “1940 Act”)) are effective as of a date within 90 days of the filing date of this report that includes the disclosure required by this paragraph, based on their evaluation of the disclosure controls and procedures required by Rule 30a-3(b) under the 1940 Act and 15d-15(b) under the Securities Exchange Act of 1934. |
| | (b) | There were no changes in the registrant’s internal control over financial reporting (as defined in Rule 30a-3(d) under the 1940 Act) that occurred during the period covered by this report that have materially affected, or are likely to materially affect the registrant’s internal control over financial reporting. |
SIGNATURES
Pursuant to the requirements of the Securities Exchange Act of 1934 and the Investment Company Act of 1940, the registrant has duly caused this Report to be signed on its behalf by the undersigned, there unto duly authorized.
Legg Mason Global Asset Management Trust
| | |
| By: | | /s/ Jane Trust |
| | Jane Trust |
| | Chief Executive Officer |
| |
| Date: | | December 27, 2023 |
Pursuant to the requirements of the Securities Exchange Act of 1934 and the Investment Company Act of 1940, this report has been signed below by the following persons on behalf of the registrant and in the capacities and on the dates indicated.
| | |
| By: | | /s/ Jane Trust |
| | Jane Trust |
| | Chief Executive Officer |
| |
| Date: | | December 27, 2023 |
| |
| By: | | /s/ Christopher Berarducci |
| | Christopher Berarducci |
| | Principal Financial Officer |
| |
| Date: | | December 27, 2023 |