UNITED STATES
SECURITIES AND EXCHANGE COMMISSION
Washington, D.C. 20549
FORM N-CSR
CERTIFIED SHAREHOLDER REPORT OF REGISTERED
MANAGEMENT INVESTMENT COMPANIES
Investment Company Act file number 811-22338
Legg Mason Global Asset Management Trust
(Exact name of registrant as specified in charter)
100 International Drive, Baltimore, MD, 21202
(Address of principal executive offices) (Zip code)
Marc A. De Oliveira
Franklin Templeton
100 First Stamford Place
Stamford, CT 06902
(Name and address of agent for service)
Registrant’s telephone number, including area code: 877-6LM-FUND/656-3863
Date of fiscal year end: December 31
Date of reporting period: December 31, 2023
| ITEM 1. | REPORT TO STOCKHOLDERS |
The Annual Report to Stockholders is filed herewith.

| | |
| Annual Report | | December 31, 2023 |
FRANKLIN
U.S. SMALL CAP EQUITY FUND
The Securities and Exchange Commission has adopted new regulations that will result in changes to the design and delivery of annual and semi-annual shareholder reports beginning in July 2024.
If you have previously elected to receive shareholder reports electronically, you will continue to do so and need not take any action.
Otherwise, paper copies of the Fund’s shareholder reports will be mailed to you beginning in July 2024. If you would like to receive shareholder reports and other communications from the Fund electronically instead of by mail, you may make that request at any time by contacting your financial intermediary (such as a broker-dealer or bank) or, if you are a direct investor, enrolling at franklintempleton.com.
You may access franklintempleton.com by scanning the code below.

|
| INVESTMENT PRODUCTS: NOT FDIC INSURED • NO BANK GUARANTEE • MAY LOSE VALUE |
Fund objective
The Fund seeks long-term capital appreciation.
| | |
| II | | Franklin U.S. Small Cap Equity Fund |
Letter from the president

Dear Shareholder,
We are pleased to provide the annual report of Franklin U.S. Small Cap Equity Fund for the twelve-month reporting period ended December 31, 2023. Please read on for a detailed look at prevailing economic and market conditions during the Fund’s reporting period and to learn how those conditions have affected Fund performance.
Special shareholder notice
Effective September 1, 2023, Sundaram Chettiappan, CFA and Chandra Seethamraju, PhD joined the Fund’s portfolio management team and Joseph Giroux ceased to be a member of the Fund’s portfolio management team. For more information, please see the Fund’s prospectus supplement dated September 1, 2023.
As always, we remain committed to providing you with excellent service and a full spectrum of investment choices. We also remain committed to supplementing the support you receive from your financial advisor. One way we accomplish this is through our website, www.franklintempleton.com. Here you can gain immediate access to market and investment information, including:
| • | | Fund prices and performance, |
| • | | Market insights and commentaries from our portfolio managers, and |
| • | | A host of educational resources. |
We look forward to helping you meet your financial goals.
Sincerely,

Jane Trust, CFA
President and Chief Executive Officer
January 31, 2024
| | |
| Franklin U.S. Small Cap Equity Fund | | III |
Fund overview
Q. What is the Fund’s investment strategy?
A. The Fund’s investment objective is long-term capital appreciation. Under normal market conditions, the Fund will invest at least 80% of net assets, plus any borrowings for investment purposes, in equity securities of companies with small market capitalizations domiciled, or having their principal activities, in the United States, at the time of investment or other investments with similar economic characteristics. The Fund normally intends to hold a portfolio that is generally comparable to, but not the same as, the Russell 2000 Indexi in terms of economic sector weightings and market capitalization but may depart from this if we believe it to be in the best interests of the Fund. The Fund may also invest in securities of foreign companies in the form of American Depositary Receipts (“ADRs”).
At Franklin Advisers, Inc., the Fund’s subadviser, we use a bottom-up, quantitative stock selection process. The cornerstone of this process is a proprietary stock selection model that ranks the stocks in the Fund’s investable universe by our determination of their relative attractiveness.
Q. What were the overall market conditions during the Fund’s reporting period?
A. The U.S. small cap equity performance as measured by the Russell 2000 Index advanced for the twelve-month reporting period ending December 31, 2023, returning 16.93%. Virtually all sectors posted positive returns, most in double digits. The consumer discretionary, information technology, and industrials sectors were the best performing while only the utilities sector and the banks portion of the financials sector posted negative returns.
Key U.S. equity indexes ended the first quarter of 2023 with gains despite a bout of heightened financial market volatility in March due to turmoil in the banking industry. Two mid-sized U.S. banks collapsed, and a Swiss bank was forced into a merger. However, quick intervention by the authorities helped to calm these fears, while better-than-feared corporate earnings reports and smaller interest-rate increases from the U.S. Federal Reserve Board (the “Fed”) also supported investor sentiment.
Key measures of U.S. stocks rose during the second quarter of 2023, driven by better-than-expected first-quarter corporate earnings reports, the suspension of the debt ceiling, subsiding concerns about U.S. regional banks, resilient economic growth, and hopes for an end to the Fed’s campaign of interest-rate hikes. Investor enthusiasm for artificial intelligence bolstered technology-related stocks in the information technology (“IT”), consumer discretionary and communication services sectors.
The first-half 2023 rally in U.S. equities initially stretched into July, but Fitch Ratings downgraded the country’s credit rating to AA+ from AAA early in August, and U.S. stocks fell during August and September amid a significant rise in U.S. Treasury yields as the Fed indicated it would keep interest rates higher for longer than investors had previously expected. Stock market losses for the third calendar quarter of 2023 were broad-based as nearly all sectors of a key U.S. index declined. The Fed raised the federal funds target rate
| | | | |
| Franklin U.S. Small Cap Equity Fund 2023 Annual Report | | | | 1 |
Fund overview (cont’d)
in July to the highest level since 2001 but paused in September. In August, the core personal consumption expenditures price index — which excludes food and energy prices and is the Fed preferred inflation gauge — reached the lowest level since May 2021 but remained significantly higher than the Fed 2.0% long-run inflation target.
U.S. stocks surged in November and December, rebounding from three consecutive monthly declines, and ended 2023’s fourth quarter and full year with strong gains. Moderating inflation and a softening but resilient job market led to investor optimism that the Fed has concluded its rate-hiking cycle and can maneuver the U.S. economy into a soft landing. A drop in U.S. Treasury yields (with the yield on the 10-year Treasury note retreating substantially from the 5% level reached in October), better-than-expected earnings from some companies, and the Fed’s indication following its December meeting that it is considering more 2024 rate cuts than it previously forecasted further bolstered investor sentiment.
Q. How did we respond to these changing market conditions?
A. We believe that fundamentals, the very basis of our investment process, will continue to be the primary driver of long-term returns. As a result, we continue to adhere to our investment philosophy while continuing to enhance our process to address sustainable market shifts. We also believe that integrated risk management is an important element of portfolio construction and our investment process will continue to reflect these long-held views. We strongly believe, particularly during times of extreme market volatility, in the value of a broadly diversified, rules-based, risk-controlled process.
Much of our research continues to be focused on developing tools to enhance performance regardless of market environment. This includes both individual factor research as well as factor allocation strategies.
Performance review
For the twelve months ended December 31, 2023, Class I shares of Franklin U.S. Small Cap Equity Fund returned 18.81%. The Fund’s unmanaged benchmark, the Russell 2000 Index, returned 16.93% for the same period.
| | | | | | | | |
Performance Snapshot as of December 31, 2023 (unaudited) | | | | | | |
| (excluding sales charges) | | 6 months | | | 12 months | |
| Franklin U.S. Small Cap Equity Fund: | | | | | | | | |
Class A | | | 12.91 | % | | | 18.54 | % |
Class C | | | 12.42 | % | | | 17.68 | % |
Class FI | | | 12.89 | % | | | 18.47 | % |
Class I | | | 12.98 | % | | | 18.81 | % |
Class IS | | | 13.09 | % | | | 18.95 | % |
| Russell 2000 Index | | | 8.18 | % | | | 16.93 | % |
| | | | |
| 2 | | | | Franklin U.S. Small Cap Equity Fund 2023 Annual Report |
The performance shown represents past performance. Past performance is no guarantee of future results and current performance may be higher or lower than the performance shown above. Principal value and investment returns will fluctuate and investors’ shares, when redeemed, may be worth more or less than their original cost. To obtain performance data current to the most recent month-end, please visit our website at www.franklintempleton.com.
All share class returns assume the reinvestment of all distributions at net asset value and the deduction of all Fund expenses. Returns have not been adjusted to include sales charges that may apply or the deduction of taxes that a shareholder would pay on Fund distributions. If sales charges were reflected, the performance quoted would be lower. Performance figures for periods shorter than one year represent cumulative figures and are not annualized.
Fund performance figures reflect fee waivers and/or expense reimbursements, without which the performance would have been lower.
|
| Total Annual Operating Expenses (unaudited) |
As of the Fund’s current prospectus dated May 1, 2023, the gross total annual fund operating expense ratios for Class A, Class C, Class FI, Class I and Class IS shares were 1.36%, 2.11%, 1.78%, 1.11% and 0.88%, respectively.
Actual expenses may be higher. For example, expenses may be higher than those shown if average net assets decrease. Net assets are more likely to decrease and Fund expense ratios are more likely to increase when markets are volatile.
As a result of expense limitation arrangements, the ratio of total annual fund operating expenses, other than interest, brokerage commissions, dividend expense on short sales, taxes, extraordinary expenses and acquired fund fees and expenses, to average net assets will not exceed 1.30% for Class A shares, 2.05% for Class C shares, 1.30% for Class FI shares, 1.00% for Class I shares and 0.75% for Class IS shares. In addition, the ratio of total annual fund operating expenses for Class IS shares will not exceed the ratio of total annual fund operating expenses for Class I shares. These expense limitation arrangements cannot be terminated prior to December 31, 2025 without the Board of Trustees’ consent.
The manager has also agreed to voluntarily waive fees and/or reimburse operating expenses, other than interest, brokerage commissions, dividend expense on short sales, taxes, extraordinary expenses and acquired fund fees and expenses, so that annual fund operating expenses will not exceed 1.20% for Class A shares, 1.95% for Class C shares, 1.20% for Class FI shares and 0.90% for Class I shares. These arrangements are expected to continue until December 31, 2025 but may be terminated at any time by the manager.
The manager is permitted to recapture amounts waived and/or reimbursed to a class within three years after the fiscal year in which the manager earned the fee or incurred the expense if the class’ total annual fund operating expenses have fallen to a level below the expense limitation (“expense cap”) in effect at the time the fees were earned or the expenses incurred. In no case will the manager recapture any amount that would result, on any particular business day of the Fund, in the class’ total annual operating expenses exceeding the expense cap or any other lower limit then in effect.
| | | | |
| Franklin U.S. Small Cap Equity Fund 2023 Annual Report | | | | 3 |
Fund overview (cont’d)
Q. What were the leading contributors to performance?
A. Stock selection was the leading contributor to performance for the year, adding value in most sectors. Selection was especially strong in the consumer discretionary, IT and utilities sectors and added meaningful value in the communication services and consumer staples sectors. An overweight to the industrials sector was also a contributor.
At the security level, the leading contributor was an overweight to thermal management company Modine Manufacturing, which returned over 200% for the year. Overweights to Beazer Homes USA and Consolidated Water. were also strong contributors as the securities returned 165% and 144% respectively in the portfolio.
Q. What were the leading detractors from performance?
A. Stock selection in the materials, industrials and energy sectors was the leading detractor from relative return for the period. Sector allocation decisions were also a detractor, specifically an overweight to communication services and an underweight to information technology.
First Horizon, which is not in the Russell 2000 Index, was the leading detractor at the security level; in May, Canada’s TD Bank called off its $13.4 billion takeover, triggering a near 40% fall in its regional bank’s shares. Rayonier Advanced Materials, a chemical company specializing in cellulose-based products which reported a net loss from continuing operations, and Hanmi Financial, a holding company for Hanmi Bank which experienced declining earnings and lower revenues, were also leading detractors. All had double-digit negative returns in a positive return environment.
Thank you for your investment in the Franklin U.S. Small Cap Equity Fund. As always, we appreciate that you have chosen us to manage your assets and we remain focused on achieving the Fund’s investment goals.
Sincerely,
Franklin Advisers, Inc.
January 11, 2024
RISKS: Equity securities are subject to market and price fluctuations. Investments in small-cap companies may involve greater risks and volatility than investments in larger, more established companies. Small-cap companies may have limited product lines, operating histories, markets or financial resources. The Fund may use derivatives, such as options and futures, which can be illiquid, may disproportionately increase losses, and may have a potentially large impact on Fund performance. The market values of securities or other assets will fluctuate, sometimes sharply and unpredictably, due to changes in general market conditions, overall economic trends or events, governmental actions or intervention, actions taken by the U.S. Federal Reserve or foreign central banks, market disruptions caused by trade disputes or other factors, political developments, armed conflicts, economic sanctions and countermeasures in response to sanctions, major cybersecurity events, investor sentiment, the global and domestic effects of a
| | | | |
| 4 | | | | Franklin U.S. Small Cap Equity Fund 2023 Annual Report |
pandemic, and other factors that may or may not be related to the issuer of the security or other asset. Pease see the Fund’s prospectus for a more complete discussion of these and other risks and the Fund’s investment strategies.
Portfolio holdings and breakdowns are as of December 31, 2023 and are subject to change and may not be representative of the portfolio managers’ current or future investments. The Fund’s top ten holdings (as a percentage of net assets) as of December 31, 2023 were: Super Micro Computer Inc. (1.1%), Modine Manufacturing Co. (1.0%), Consolidated Water Co. Ltd. (0.9%), Coca-Cola Consolidated Inc. (0.9%), Ensign Group Inc. (0.9%), Meritage Homes Corp. (0.9%), Beazer Homes USA Inc. (0.8%), Radian Group Inc. (0.8%), Qualys Inc. (0.8%) and M/I Homes Inc. (0.8%). Please refer to pages 11 through 23 for a list and percentage breakdown of the Fund’s holdings.
The mention of sector breakdowns is for informational purposes only and should not be construed as a recommendation to purchase or sell any securities. The information provided regarding such sectors is not a sufficient basis upon which to make an investment decision. Investors seeking financial advice regarding the appropriateness of investing in any securities or investment strategies discussed should consult their financial professional. The Fund’s top five sector holdings (as a percentage of net assets) as of December 31, 2023 were: industrials (17.3%), financials (16.9%), health care (14.8%), information technology (12.7%) and consumer discretionary (11.8%). The Fund’s portfolio composition is subject to change at any time.
All investments are subject to risk including the possible loss of principal. Past performance is no guarantee of future results. All index performance reflects no deduction for fees, expenses or taxes. Please note that an investor cannot invest directly in an index.
The information provided is not intended to be a forecast of future events, a guarantee of future results or investment advice. Views expressed may differ from those of the firm as a whole.
| i | The Russell 2000 Index measures the performance of the small-cap segment of the U.S. equity universe. The Russell 2000 is a subset of the Russell 3000 Index representing approximately 10% of the total market capitalization of that index. It includes approximately 2,000 of the smallest securities based on a combination of their market cap and current index membership. The Russell 3000 Index measures the performance of the 3,000 largest U.S. companies based on total market capitalization, which represents approximately 98% of the U.S. equity market. |
| | | | |
| Franklin U.S. Small Cap Equity Fund 2023 Annual Report | | | | 5 |
Fund at a glance† (unaudited)
Investment breakdown (%) as a percent of total investments
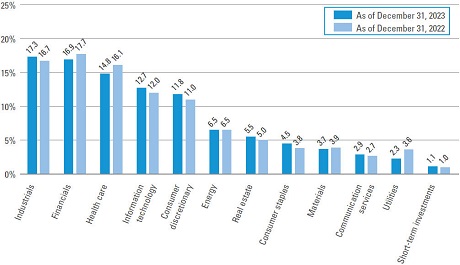
| † | The bar graph above represents the composition of the Fund’s investments as of December 31, 2023 and December 31, 2022. The Fund is actively managed. As a result, the composition of the Fund’s investments is subject to change at any time. |
| | | | |
| 6 | | | | Franklin U.S. Small Cap Equity Fund 2023 Annual Report |
Fund expenses (unaudited)
Example
As a shareholder of the Fund, you may incur two types of costs: (1) transaction costs, including front-end and back-end sales charges (loads) on purchase payments; and (2) ongoing costs, including management fees; service and/or distribution (12b-1) fees; and other Fund expenses. This example is intended to help you understand your ongoing costs (in dollars) of investing in the Fund and to compare these costs with the ongoing costs of investing in other mutual funds.
This example is based on an investment of $1,000 invested on July 1, 2023 and held for the six months ended December 31, 2023.
Actual expenses
The table below titled “Based on actual total return” provides information about actual account values and actual expenses. You may use the information provided in this table, together with the amount you invested, to estimate the expenses that you paid over the period. To estimate the expenses you paid on your account, divide your ending account value by $1,000 (for example, an $8,600 ending account value divided by $1,000 = 8.6), then multiply the result by the number under the heading entitled “Expenses Paid During the Period”.
Hypothetical example for comparison purposes
The table below titled “Based on hypothetical total return” provides information about hypothetical account values and hypothetical expenses based on the actual expense ratio and an assumed rate of return of 5.00% per year before expenses, which is not the Fund’s actual return. The hypothetical account values and expenses may not be used to estimate the actual ending account balance or expenses you paid for the period. You may use the information provided in this table to compare the ongoing costs of investing in the Fund and other funds. To do so, compare the 5.00% hypothetical example relating to the Fund with the 5.00% hypothetical examples that appear in the shareholder reports of the other funds.
Please note that the expenses shown in the table below are meant to highlight your ongoing costs only and do not reflect any transactional costs, such as front-end or back-end sales charges (loads). Therefore, the table is useful in comparing ongoing costs only, and will not help you determine the relative total costs of owning different funds. In addition, if these transaction costs were included, your costs would have been higher.
| | | | | | | | | | | | | | | | | | | | | | | | | | | | | | | | | | | | | | | | | | | | | | |
| | | |
| Based on actual total return1 | | | | | | | | | Based on hypothetical total return1 | |
| | | | | | | | | | | | |
| | | Actual Total Return Without Sales Charge2 | | | Beginning Account Value | | | Ending Account Value | | | Annualized Expense Ratio | | | Expenses Paid During the Period3 | | | | | | | | Hypothetical Annualized Total Return | | | Beginning Account Value | | | Ending Account Value | | | Annualized Expense Ratio | | | Expenses Paid During the Period3 | |
| Class A | | | 12.91 | % | | $ | 1,000.00 | | | $ | 1,129.10 | | | | 1.20 | % | | $ | 6.44 | | | | | | | Class A | | | 5.00 | % | | $ | 1,000.00 | | | $ | 1,019.16 | | | | 1.20 | % | | $ | 6.11 | |
| Class C | | | 12.42 | | | | 1,000.00 | | | | 1,124.20 | | | | 1.95 | | | | 10.44 | | | | | | | Class C | | | 5.00 | | | | 1,000.00 | | | | 1,015.38 | | | | 1.95 | | | | 9.91 | |
| Class FI | | | 12.89 | | | | 1,000.00 | | | | 1,128.90 | | | | 1.20 | | | | 6.44 | | | | | | | Class FI | | | 5.00 | | | | 1,000.00 | | | | 1,019.16 | | | | 1.20 | | | | 6.11 | |
| Class I | | | 12.98 | | | | 1,000.00 | | | | 1,129.80 | | | | 0.90 | | | | 4.83 | | | | | | | Class I | | | 5.00 | | | | 1,000.00 | | | | 1,020.67 | | | | 0.90 | | | | 4.58 | |
| Class IS | | | 13.09 | | | | 1,000.00 | | | | 1,130.90 | | | | 0.75 | | | | 4.03 | | | | | | | Class IS | | | 5.00 | | | | 1,000.00 | | | | 1,021.42 | | | | 0.75 | | | | 3.82 | |
| | | | |
| Franklin U.S. Small Cap Equity Fund 2023 Annual Report | | | | 7 |
Fund expenses (unaudited) (cont’d)
| 1 | For the six months ended December 31, 2023. |
| 2 | Assumes the reinvestment of all distributions, including returns of capital, if any, at net asset value and does not reflect the deduction of the applicable sales charge with respect to Class A shares or the applicable contingent deferred sales charge (“CDSC”) with respect to Class C shares. Total return is not annualized, as it may not be representative of the total return for the year. Performance figures may reflect compensating balance arrangements, fee waivers and/or expense reimbursements. In the absence of compensating balance arrangements, fee waivers and/or expense reimbursements, the total return would have been lower. Past performance is no guarantee of future results. |
| 3 | Expenses (net of compensating balance arrangements, fee waivers and/or expense reimbursements) are equal to each class’ respective annualized expense ratio multiplied by the average account value over the period, multiplied by the number of days in the most recent fiscal half-year (184), then divided by 365. |
| | | | |
| 8 | | | | Franklin U.S. Small Cap Equity Fund 2023 Annual Report |
Fund performance (unaudited)
| | | | | | | | | | | | | | | | | | | | |
| Average annual total returns | |
| Without sales charges1 | | Class A | | | Class C | | | Class FI | | | Class I | | | Class IS | |
| Twelve Months Ended 12/31/23 | | | 18.54 | % | | | 17.68 | % | | | 18.47 | % | | | 18.81 | % | | | 18.95 | % |
| Five Years Ended 12/31/23 | | | 11.75 | | | | 10.88 | | | | 11.71 | | | | 12.03 | | | | 12.20 | |
| Ten Years Ended 12/31/23 | | | 7.06 | | | | 6.25 | | | | 7.01 | | | | 7.37 | | | | 7.50 | |
| | | | | |
| With sales charges2 | | Class A | | | Class C | | | Class FI | | | Class I | | | Class IS | |
| Twelve Months Ended 12/31/23 | | | 12.04 | % | | | 16.68 | % | | | 18.47 | % | | | 18.81 | % | | | 18.95 | % |
| Five Years Ended 12/31/23 | | | 10.43 | | | | 10.88 | | | | 11.71 | | | | 12.03 | | | | 12.20 | |
| Ten Years Ended 12/31/23 | | | 6.43 | | | | 6.25 | | | | 7.01 | | | | 7.37 | | | | 7.50 | |
| | | | |
| Cumulative total returns | | | |
| Without sales charges1 | | | |
| Class A (12/31/13 through 12/31/23) | | | 97.78 | % |
| Class C (12/31/13 through 12/31/23) | | | 83.34 | |
| Class FI (12/31/13 through 12/31/23) | | | 96.93 | |
| Class I (12/31/13 through 12/31/23) | | | 103.58 | |
| Class IS (12/31/13 through 12/31/23) | | | 106.16 | |
All figures represent past performance and are not a guarantee of future results. Investment return and principal value of an investment will fluctuate so that an investor’s shares, when redeemed, may be worth more or less than their original cost. The returns shown do not reflect the deduction of taxes that a shareholder would pay on Fund distributions or the redemption of Fund shares. Performance figures may reflect compensating balance arrangements, fee waivers and/or expense reimbursements. In the absence of compensating balance arrangements, fee waivers and/or expense reimbursements, the total return would have been lower.
| 1 | Assumes the reinvestment of all distributions, including returns of capital, if any, at net asset value and does not reflect the deduction of the applicable sales charge with respect to Class A shares or the applicable contingent deferred sales charge (“CDSC”) with respect to Class C shares. |
| 2 | Assumes the reinvestment of all distributions, including returns of capital, if any, at net asset value. In addition, Class A shares reflect the deduction of the maximum initial sales charge of 5.75% on purchases made prior to August 15, 2022. Purchases made on or after August 15, 2022 incur a maximum initial sales charge of 5.50%. Class C shares reflect the deduction of a 1.00% CDSC, which applies if shares are redeemed within one year from purchase payment. |
| | | | |
| Franklin U.S. Small Cap Equity Fund 2023 Annual Report | | | | 9 |
Fund performance (unaudited) (cont’d)
Historical performance
Value of $1,000,000 invested in
Class I Shares of Franklin U.S. Small Cap Equity Fund vs. Russell 2000 Index† — December 2013 - December 2023
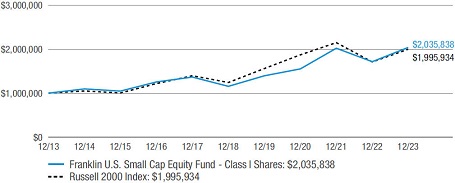
All figures represent past performance and are not a guarantee of future results. Investment return and principal value of an investment will fluctuate so that an investor’s shares, when redeemed, may be worth more or less than their original cost. The returns shown do not reflect the deduction of taxes that a shareholder would pay on Fund distributions or the redemption of Fund shares. Performance figures may reflect compensating balance arrangements, fee waivers and/or expense reimbursements. In the absence of compensating balance arrangements, fee waivers and/or expense reimbursements, the total return would have been lower.
| † | Hypothetical illustration of $1,000,000 invested in Class I shares of Franklin U.S. Small Cap Equity Fund on December 31, 2013, assuming the reinvestment of all distributions, including returns of capital, if any, at net asset value through December 31, 2023. The hypothetical illustration also assumes a $1,000,000 investment in the Russell 2000 Index. The Russell 2000 Index (the “Index”) measures the performance of the small-cap segment of the U.S. equity universe. The Index is a subset of the Russell 3000 Index representing approximately 10% of the total market capitalization of that index. It includes approximately 2,000 of the smallest securities based on a combination of their market cap and current index membership. The Russell 3000 Index measures the performance of the 3,000 largest U.S. companies based on total market capitalization, which represents approximately 98% of the U.S. equity market. The Index is unmanaged and is not subject to the same management and trading expenses as a mutual fund. Please note that an investor cannot invest directly in an index. The performance of the Fund’s other classes may be greater or less than the Class I shares’ performance indicated on this chart, depending on whether greater or lesser sales charges and fees were incurred by shareholders investing in the other classes. |
| | | | |
| 10 | | | | Franklin U.S. Small Cap Equity Fund 2023 Annual Report |
Schedule of investments
December 31, 2023
Franklin U.S. Small Cap Equity Fund
(Percentages shown based on Fund net assets)
| | | | | | | | |
| Security | | Shares | | | Value | |
| Common Stocks — 99.0% | | | | | | | | |
| Communication Services — 3.0% | | | | | | | | |
Diversified Telecommunication Services — 0.2% | | | | | | | | |
EchoStar Corp., Class A Shares | | | 10,986 | | | | $182,038 | * |
Entertainment — 0.3% | | | | | | | | |
Marcus Corp. | | | 14,879 | | | | 216,936 | |
Skillz Inc. | | | 10,869 | | | | 67,823 | * |
Total Entertainment | | | | | | | 284,759 | |
Interactive Media & Services — 1.3% | | | | | | | | |
Angi Inc. | | | 40,340 | | | | 100,447 | * |
Cargurus Inc. | | | 9,416 | | | | 227,491 | * |
EverQuote Inc., Class A Shares | | | 3,073 | | | | 37,613 | * |
TrueCar Inc. | | | 57,551 | | | | 199,126 | * |
Yelp Inc. | | | 13,602 | | | | 643,919 | * |
Total Interactive Media & Services | | | | | | | 1,208,596 | |
Media — 0.5% | | | | | | | | |
Gannett Co. Inc. | | | 41,855 | | | | 96,266 | * |
Perion Network Ltd. | | | 13,079 | | | | 403,749 | * |
Total Media | | | | | | | 500,015 | |
Wireless Telecommunication Services — 0.7% | | | | | | | | |
Spok Holdings Inc. | | | 18,000 | | | | 278,640 | |
Telephone and Data Systems Inc. | | | 6,173 | | | | 113,274 | |
United States Cellular Corp. | | | 5,516 | | | | 229,135 | * |
Total Wireless Telecommunication Services | | | | | | | 621,049 | |
Total Communication Services | | | | | | | 2,796,457 | |
| Consumer Discretionary — 11.8% | | | | | | | | |
Automobile Components — 1.8% | | | | | | | | |
Goodyear Tire & Rubber Co. | | | 29,758 | | | | 426,135 | * |
Modine Manufacturing Co. | | | 15,493 | | | | 924,932 | * |
Patrick Industries Inc. | | | 3,140 | | | | 315,099 | |
Total Automobile Components | | | | | | | 1,666,166 | |
Automobiles — 0.2% | | | | | | | | |
Winnebago Industries Inc. | | | 3,191 | | | | 232,560 | |
Broadline Retail — 0.2% | | | | | | | | |
Macy’s Inc. | | | 10,463 | | | | 210,515 | |
Diversified Consumer Services — 1.5% | | | | | | | | |
2U Inc. | | | 27,956 | | | | 34,386 | * |
American Public Education Inc. | | | 13,312 | | | | 128,461 | * |
Chegg Inc. | | | 12,529 | | | | 142,329 | * |
Duolingo Inc. | | | 2,300 | | | | 521,755 | * |
See Notes to Financial Statements.
| | | | |
| Franklin U.S. Small Cap Equity Fund 2023 Annual Report | | | | 11 |
Schedule of investments (cont’d)
December 31, 2023
Franklin U.S. Small Cap Equity Fund
(Percentages shown based on Fund net assets)
| | | | | | | | |
| Security | | Shares | | | Value | |
Diversified Consumer Services — continued | | | | | | | | |
Graham Holdings Co., Class B Shares | | | 510 | | | | $355,225 | |
Perdoceo Education Corp. | | | 14,649 | | | | 257,237 | |
Total Diversified Consumer Services | | | | | | | 1,439,393 | |
Hotels, Restaurants & Leisure — 1.9% | | | | | | | | |
BJ’s Restaurants Inc. | | | 7,596 | | | | 273,532 | * |
Carrols Restaurant Group Inc. | | | 45,000 | | | | 354,600 | |
Cracker Barrel Old Country Store Inc. | | | 629 | | | | 48,483 | |
International Game Technology PLC | | | 15,662 | | | | 429,296 | |
Penn Entertainment Inc. | | | 3,138 | | | | 81,651 | * |
Playa Hotels & Resorts NV | | | 34,456 | | | | 298,044 | * |
Red Robin Gourmet Burgers Inc. | | | 2,929 | | | | 36,525 | * |
SeaWorld Entertainment Inc. | | | 4,698 | | | | 248,195 | * |
Total Hotels, Restaurants & Leisure | | | | | | | 1,770,326 | |
Household Durables — 3.0% | | | | | | | | |
Beazer Homes USA Inc. | | | 23,803 | | | | 804,303 | * |
Ethan Allen Interiors Inc. | | | 9,939 | | | | 317,253 | |
M/I Homes Inc. | | | 5,442 | | | | 749,581 | * |
MDC Holdings Inc. | | | 3,661 | | | | 202,270 | |
Meritage Homes Corp. | | | 4,710 | | | | 820,482 | |
Total Household Durables | | | | | | | 2,893,889 | |
Leisure Products — 0.5% | | | | | | | | |
JAKKS Pacific Inc. | | | 13,312 | | | | 473,242 | * |
Specialty Retail — 2.1% | | | | | | | | |
American Eagle Outfitters Inc. | | | 21,600 | | | | 457,056 | |
Dick’s Sporting Goods Inc. | | | 3,140 | | | | 461,423 | |
Genesco Inc. | | | 3,244 | | | | 114,221 | * |
Signet Jewelers Ltd. | | | 6,802 | | | | 729,583 | |
Stitch Fix Inc., Class A Shares | | | 55,000 | | | | 196,350 | * |
Total Specialty Retail | | | | | | | 1,958,633 | |
Textiles, Apparel & Luxury Goods — 0.6% | | | | | | | | |
G-III Apparel Group Ltd. | | | 10,000 | | | | 339,800 | * |
Movado Group Inc. | | | 7,324 | | | | 220,818 | |
Total Textiles, Apparel & Luxury Goods | | | | | | | 560,618 | |
Total Consumer Discretionary | | | | | | | 11,205,342 | |
| Consumer Staples — 4.5% | | | | | | | | |
Beverages — 0.9% | | | | | | | | |
Coca-Cola Consolidated Inc. | | | 943 | | | | 875,481 | |
See Notes to Financial Statements.
| | | | |
| 12 | | | | Franklin U.S. Small Cap Equity Fund 2023 Annual Report |
Franklin U.S. Small Cap Equity Fund
(Percentages shown based on Fund net assets)
| | | | | | | | |
| Security | | Shares | | | Value | |
Consumer Staples Distribution & Retail — 0.9% | | | | | | | | |
Andersons Inc. | | | 5,873 | | | | $337,932 | |
Sprouts Farmers Market Inc. | | | 10,180 | | | | 489,760 | * |
Total Consumer Staples Distribution & Retail | | | | | | | 827,692 | |
Food Products — 0.8% | | | | | | | | |
Cal-Maine Foods Inc. | | | 1,488 | | | | 85,396 | |
John B Sanfilippo & Son Inc. | | | 3,140 | | | | 323,546 | |
Simply Good Foods Co. | | | 8,893 | | | | 352,163 | * |
Total Food Products | | | | | | | 761,105 | |
Personal Care Products — 1.3% | | | | | | | | |
e.l.f. Beauty Inc. | | | 4,400 | | | | 635,096 | * |
Edgewell Personal Care Co. | | | 6,656 | | | | 243,809 | |
Nature’s Sunshine Products Inc. | | | 8,998 | | | | 155,576 | * |
USANA Health Sciences Inc. | | | 3,800 | | | | 203,680 | * |
Total Personal Care Products | | | | | | | 1,238,161 | |
Tobacco — 0.6% | | | | | | | | |
Turning Point Brands Inc. | | | 5,755 | | | | 151,472 | |
Vector Group Ltd. | | | 34,530 | | | | 389,498 | |
Total Tobacco | | | | | | | 540,970 | |
Total Consumer Staples | | | | | | | 4,243,409 | |
| Energy — 6.4% | | | | | | | | |
Energy Equipment & Services — 1.5% | | | | | | | | |
Helmerich & Payne Inc. | | | 8,065 | | | | 292,114 | |
Nabors Industries Ltd. | | | 1,567 | | | | 127,914 | * |
Newpark Resources Inc. | | | 42,000 | | | | 278,880 | * |
RPC Inc. | | | 25,059 | | | | 182,430 | |
Weatherford International PLC | | | 5,800 | | | | 567,414 | * |
Total Energy Equipment & Services | | | | | | | 1,448,752 | |
Oil, Gas & Consumable Fuels — 4.9% | | | | | | | | |
California Resources Corp. | | | 8,614 | | | | 471,014 | |
DHT Holdings Inc. | | | 31,324 | | | | 307,288 | |
Gulfport Energy Corp. | | | 2,000 | | | | 266,400 | * |
Murphy Oil Corp. | | | 15,695 | | | | 669,549 | |
Par Pacific Holdings Inc. | | | 8,500 | | | | 309,145 | * |
PBF Energy Inc., Class A Shares | | | 9,397 | | | | 413,092 | |
Peabody Energy Corp. | | | 14,100 | | | | 342,912 | |
SandRidge Energy Inc. | | | 32,849 | | | | 449,046 | |
Scorpio Tankers Inc. | | | 4,698 | | | | 285,638 | |
See Notes to Financial Statements.
| | | | |
| Franklin U.S. Small Cap Equity Fund 2023 Annual Report | | | | 13 |
Schedule of investments (cont’d)
December 31, 2023
Franklin U.S. Small Cap Equity Fund
(Percentages shown based on Fund net assets)
| | | | | | | | |
| Security | | Shares | | | Value | |
Oil, Gas & Consumable Fuels — continued | | | | | | | | |
SM Energy Co. | | | 18,311 | | | | $709,002 | |
Teekay Tankers Ltd., Class A Shares | | | 8,927 | | | | 446,082 | |
Total Oil, Gas & Consumable Fuels | | | | | | | 4,669,168 | |
Total Energy | | | | | | | 6,117,920 | |
| Financials — 16.9% | | | | | | | | |
Banks — 8.9% | | | | | | | | |
Associated Banc-Corp. | | | 14,879 | | | | 318,262 | |
Bancorp Inc. | | | 7,000 | | | | 269,920 | * |
BankUnited Inc. | | | 12,529 | | | | 406,315 | |
Berkshire Hills Bancorp Inc. | | | 14,649 | | | | 363,735 | |
Carter Bankshares Inc. | | | 23,510 | | | | 351,945 | * |
Central Pacific Financial Corp. | | | 8,998 | | | | 177,081 | |
Columbia Banking System Inc. | | | 7,481 | | | | 199,593 | |
CrossFirst Bankshares Inc. | | | 15,662 | | | | 212,690 | * |
Customers Bancorp Inc. | | | 8,065 | | | | 464,705 | * |
Eagle Bancorp Inc. | | | 8,100 | | | | 244,134 | |
Equity Bancshares Inc., Class A Shares | | | 7,481 | | | | 253,606 | |
Financial Institutions Inc. | | | 7,847 | | | | 167,141 | |
First BanCorp | | | 42,880 | | | | 705,376 | |
First Commonwealth Financial Corp. | | | 17,079 | | | | 263,700 | |
First Financial Corp. | | | 5,179 | | | | 222,852 | |
First Horizon Corp. | | | 20,927 | | | | 296,326 | |
First Internet Bancorp | | | 4,708 | | | | 113,886 | |
Flushing Financial Corp. | | | 15,695 | | | | 258,654 | |
Hanmi Financial Corp. | | | 23,919 | | | | 464,029 | |
HarborOne Bancorp Inc. | | | 12,000 | | | | 143,760 | |
Heartland Financial USA Inc. | | | 2,877 | | | | 108,204 | |
Heritage Financial Corp. | | | 6,801 | | | | 145,473 | |
HomeStreet Inc. | | | 5,755 | | | | 59,276 | |
HomeTrust Bancshares Inc. | | | 6,278 | | | | 169,004 | |
Hope Bancorp Inc. | | | 25,270 | | | | 305,262 | |
Independent Bank Corp. | | | 6,000 | | | | 156,120 | |
Midland States Bancorp Inc. | | | 11,136 | | | | 306,908 | |
New York Community Bancorp Inc. | | | 31,508 | | | | 322,327 | |
Northeast Community Bancorp Inc. | | | 14,000 | | | | 248,360 | |
OFG Bancorp | | | 14,461 | | | | 541,998 | |
WaFd Inc. | | | 7,831 | | | | 258,110 | |
Total Banks | | | | | | | 8,518,752 | |
See Notes to Financial Statements.
| | | | |
| 14 | | | | Franklin U.S. Small Cap Equity Fund 2023 Annual Report |
Franklin U.S. Small Cap Equity Fund
(Percentages shown based on Fund net assets)
| | | | | | | | |
| Security | | Shares | | | Value | |
Capital Markets — 0.4% | | | | | | | | |
CION Investment Corp. | | | 17,463 | | | | $197,507 | |
Evercore Inc., Class A Shares | | | 1,047 | | | | 179,089 | |
Total Capital Markets | | | | | | | 376,596 | |
Consumer Finance — 1.1% | | | | | | | | |
Bread Financial Holdings Inc. | | | 2,877 | | | | 94,768 | |
Enova International Inc. | | | 12,529 | | | | 693,606 | * |
Navient Corp. | | | 12,529 | | | | 233,290 | |
Total Consumer Finance | | | | | | | 1,021,664 | |
Financial Services — 4.5% | | | | | | | | |
A-Mark Precious Metals Inc. | | | 6,656 | | | | 201,344 | |
Essent Group Ltd. | | | 8,000 | | | | 421,920 | |
International Money Express Inc. | | | 14,095 | | | | 311,358 | * |
Jackson Financial Inc., Class A Shares | | | 11,746 | | | | 601,395 | |
MGIC Investment Corp. | | | 35,054 | | | | 676,192 | |
Mr. Cooper Group Inc. | | | 6,801 | | | | 442,881 | * |
NMI Holdings Inc., Class A Shares | | | 10,463 | | | | 310,542 | * |
Radian Group Inc. | | | 27,476 | | | | 784,440 | |
StoneCo Ltd., Class A Shares | | | 28,974 | | | | 522,401 | * |
Total Financial Services | | | | | | | 4,272,473 | |
Insurance — 1.7% | | | | | | | | |
Ambac Financial Group Inc. | | | 18,794 | | | | 309,725 | * |
Employers Holdings Inc. | | | 6,264 | | | | 246,802 | |
Enstar Group Ltd. | | | 1,253 | | | | 368,820 | * |
Genworth Financial Inc., Class A Shares | | | 78,479 | | | | 524,240 | * |
Greenlight Capital Re Ltd., Class A Shares | | | 15,000 | | | | 171,300 | * |
Total Insurance | | | | | | | 1,620,887 | |
Mortgage Real Estate Investment Trusts (REITs) — 0.3% | | | | | | | | |
Ladder Capital Corp. | | | 22,710 | | | | 261,392 | |
Total Financials | | | | | | | 16,071,764 | |
| Health Care — 14.8% | | | | | | | | |
Biotechnology — 6.9% | | | | | | | | |
2seventy bio Inc. | | | 9,397 | | | | 40,125 | * |
Abeona Therapeutics Inc. | | | 6,696 | | | | 33,547 | * |
ACADIA Pharmaceuticals Inc. | | | 14,252 | | | | 446,230 | * |
Achillion Pharmaceuticals Inc., CVR | | | 89,796 | | | | 0 | *(a)(b)(c) |
Aeglea BioTherapeutics Inc., CVR | | | 30,064 | | | | 0 | *(a)(b)(c) |
Agios Pharmaceuticals Inc. | | | 6,051 | | | | 134,756 | * |
Akebia Therapeutics Inc. | | | 62,783 | | | | 77,851 | * |
Alaunos Therapeutics Inc. | | | 100,850 | | | | 7,130 | * |
Alkermes PLC | | | 12,529 | | | | 347,554 | * |
See Notes to Financial Statements.
| | | | |
| Franklin U.S. Small Cap Equity Fund 2023 Annual Report | | | | 15 |
Schedule of investments (cont’d)
December 31, 2023
Franklin U.S. Small Cap Equity Fund
(Percentages shown based on Fund net assets)
| | | | | | | | |
| Security | | Shares | | | Value | |
Biotechnology — continued | | | | | | | | |
Anika Therapeutics Inc. | | | 3,923 | | | | $88,895 | * |
Aptevo Therapeutics Inc. | | | 10,288 | | | | 1,862 | * |
Arcturus Therapeutics Holdings Inc. | | | 5,873 | | | | 185,176 | * |
Ardelyx Inc. | | | 115,116 | | | | 713,719 | * |
Arrowhead Pharmaceuticals Inc. | | | 1,307 | | | | 39,994 | * |
Assembly Biosciences Inc. | | | 62,292 | | | | 51,086 | * |
Atara Biotherapeutics Inc. | | | 21,926 | | | | 11,244 | * |
Aurinia Pharmaceuticals Inc. | | | 18,794 | | | | 168,958 | * |
Beyondspring Inc. | | | 12,092 | | | | 10,738 | * |
Bluebird Bio Inc. | | | 18,011 | | | | 24,855 | * |
Blueprint Medicines Corp. | | | 3,400 | | | | 313,616 | * |
CareDx Inc. | | | 9,000 | | | | 108,000 | * |
Caribou Biosciences Inc. | | | 10,986 | | | | 62,950 | * |
CASI Pharmaceuticals Holdings Inc. | | | 18,577 | | | | 135,055 | * |
Catalyst Pharmaceuticals Inc. | | | 9,000 | | | | 151,290 | * |
Chimerix Inc. | | | 21,137 | | | | 20,344 | * |
CytomX Therapeutics Inc. | | | 26,159 | | | | 40,546 | * |
Deciphera Pharmaceuticals Inc. | | | 6,801 | | | | 109,700 | * |
Dynavax Technologies Corp. | | | 9,000 | | | | 125,820 | * |
Eagle Pharmaceuticals Inc. | | | 4,287 | | | | 22,421 | * |
Editas Medicine Inc. | | | 6,264 | | | | 63,454 | * |
Enanta Pharmaceuticals Inc. | | | 2,271 | | | | 21,370 | * |
Entrada Therapeutics Inc. | | | 4,000 | | | | 60,360 | * |
Fate Therapeutics Inc. | | | 14,879 | | | | 55,647 | * |
GlycoMimetics Inc. | | | 90,941 | | | | 214,621 | * |
Halozyme Therapeutics Inc. | | | 8,500 | | | | 314,160 | * |
Heron Therapeutics Inc. | | | 21,926 | | | | 37,274 | * |
Homology Medicines Inc. | | | 39,155 | | | | 23,806 | * |
Infinity Pharmaceuticals Inc. | | | 120,000 | | | | 300 | * |
Inovio Pharmaceuticals Inc. | | | 93,972 | | | | 47,926 | * |
Ironwood Pharmaceuticals Inc. | | | 11,746 | | | | 134,374 | * |
Kiniksa Pharmaceuticals Ltd., Class A Shares | | | 9,788 | | | | 171,682 | * |
MacroGenics Inc. | | | 25,059 | | | | 241,068 | * |
MiMedx Group Inc. | | | 12,000 | | | | 105,240 | * |
NextCure Inc. | | | 18,311 | | | | 20,875 | * |
PDL BioPharma Inc. | | | 152,500 | | | | 24,791 | *(a)(b) |
Poseida Therapeutics Inc. | | | 37,000 | | | | 124,320 | * |
Precigen Inc. | | | 26,159 | | | | 35,053 | * |
Precision BioSciences Inc. | | | 53,786 | | | | 19,632 | * |
Protagonist Therapeutics Inc. | | | 5,000 | | | | 114,650 | * |
See Notes to Financial Statements.
| | | | |
| 16 | | | | Franklin U.S. Small Cap Equity Fund 2023 Annual Report |
Franklin U.S. Small Cap Equity Fund
(Percentages shown based on Fund net assets)
| | | | | | | | |
| Security | | Shares | | | Value | |
Biotechnology — continued | | | | | | | | |
Protalix BioTherapeutics Inc. | | | 30,000 | | | | $53,400 | * |
Puma Biotechnology Inc. | | | 18,311 | | | | 79,287 | * |
REGENXBIO Inc. | | | 4,289 | | | | 76,988 | * |
Rigel Pharmaceuticals Inc. | | | 66,563 | | | | 96,516 | * |
Sangamo Therapeutics Inc. | | | 20,360 | | | | 11,062 | * |
Sio Gene Therapies Inc. | | | 41,855 | | | | 15,486 | * |
Surface Oncology Inc., CVR | | | 43,029 | | | | 4,800 | *(a)(b) |
Sutro Biopharma Inc. | | | 16,807 | | | | 72,102 | * |
Twist Bioscience Corp. | | | 4,100 | | | | 151,126 | * |
Vanda Pharmaceuticals Inc. | | | 14,649 | | | | 61,819 | * |
Vaxcyte Inc. | | | 939 | | | | 58,969 | * |
Vericel Corp. | | | 3,500 | | | | 124,635 | * |
Vir Biotechnology Inc. | | | 5,755 | | | | 57,895 | * |
Voyager Therapeutics Inc. | | | 13,446 | | | | 113,484 | * |
Xencor Inc. | | | 3,452 | | | | 73,286 | * |
Y-mAbs Therapeutics Inc. | | | 14,879 | | | | 101,475 | * |
Zymeworks Inc. | | | 12,000 | | | | 124,680 | * |
Total Biotechnology | | | | | | | 6,581,075 | |
Health Care Equipment & Supplies — 2.1% | | | | | | | | |
Avanos Medical Inc. | | | 4,656 | | | | 104,434 | * |
Electromed Inc. | | | 22,649 | | | | 247,101 | * |
Haemonetics Corp. | | | 4,300 | | | | 367,693 | * |
iRadimed Corp. | | | 3,295 | | | | 156,414 | |
Lantheus Holdings Inc. | | | 2,350 | | | | 145,700 | * |
Masimo Corp. | | | 1,492 | | | | 174,877 | * |
Semler Scientific Inc. | | | 6,734 | | | | 298,249 | * |
Varex Imaging Corp. | | | 9,416 | | | | 193,028 | * |
Zynex Inc. | | | 25,059 | | | | 272,892 | * |
Total Health Care Equipment & Supplies | | | | | | | 1,960,388 | |
Health Care Providers & Services — 3.4% | | | | | | | | |
Addus HomeCare Corp. | | | 2,878 | | | | 267,222 | * |
Alignment Healthcare Inc. | | | 14,722 | | | | 126,756 | * |
AMN Healthcare Services Inc. | | | 3,663 | | | | 274,285 | * |
Cross Country Healthcare Inc. | | | 10,180 | | | | 230,475 | * |
Ensign Group Inc. | | | 7,539 | | | | 845,951 | |
InfuSystem Holdings Inc. | | | 9,416 | | | | 99,245 | * |
Joint Corp. | | | 7,847 | | | | 75,410 | * |
ModivCare Inc. | | | 2,584 | | | | 113,670 | * |
Owens & Minor Inc. | | | 15,000 | | | | 289,050 | * |
See Notes to Financial Statements.
| | | | |
| Franklin U.S. Small Cap Equity Fund 2023 Annual Report | | | | 17 |
Schedule of investments (cont’d)
December 31, 2023
Franklin U.S. Small Cap Equity Fund
(Percentages shown based on Fund net assets)
| | | | | | | | |
| Security | | Shares | | | Value | |
Health Care Providers & Services — continued | | | | | | | | |
PetIQ Inc. | | | 23,493 | | | | $463,987 | * |
Tenet Healthcare Corp. | | | 6,278 | | | | 474,429 | * |
Total Health Care Providers & Services | | | | | | | 3,260,480 | |
Health Care Technology — 0.1% | | | | | | | | |
Veradigm Inc. | | | 9,788 | | | | 102,676 | * |
Life Sciences Tools & Services — 0.4% | | | | | | | | |
Adaptive Biotechnologies Corp. | | | 14,095 | | | | 69,066 | * |
Codexis Inc. | | | 27,408 | | | | 83,594 | * |
Harvard Bioscience Inc. | | | 14,000 | | | | 74,900 | * |
Quanterix Corp. | | | 5,481 | | | | 149,851 | * |
Total Life Sciences Tools & Services | | | | | | | 377,411 | |
Pharmaceuticals — 1.9% | | | | | | | | |
Amneal Pharmaceuticals Inc. | | | 21,000 | | | | 127,470 | * |
Amphastar Pharmaceuticals Inc. | | | 6,801 | | | | 420,642 | * |
Assertio Holdings Inc. | | | 50,433 | | | | 53,963 | * |
Assertio Holdings Inc., CVR | | | 62,783 | | | | 0 | *(a)(b)(c) |
Cara Therapeutics Inc. | | | 10,463 | | | | 7,774 | * |
Collegium Pharmaceutical Inc. | | | 4,000 | | | | 123,120 | * |
Corcept Therapeutics Inc. | | | 6,264 | | | | 203,455 | * |
EyePoint Pharmaceuticals Inc. | | | 9,000 | | | | 207,990 | * |
Harmony Biosciences Holdings Inc. | | | 7,000 | | | | 226,100 | * |
Ligand Pharmaceuticals Inc. | | | 3,500 | | | | 249,970 | * |
SIGA Technologies Inc. | | | 9,867 | | | | 55,255 | |
Theravance Biopharma Inc. | | | 7,847 | | | | 88,200 | * |
VYNE Therapeutics Inc. | | | 5,196 | | | | 12,107 | * |
Total Pharmaceuticals | | | | | | | 1,776,046 | |
Total Health Care | | | | | | | 14,058,076 | |
| Industrials — 17.3% | | | | | | | | |
Aerospace & Defense — 0.5% | | | | | | | | |
AAR Corp. | | | 7,847 | | | | 489,653 | * |
Building Products — 1.3% | | | | | | | | |
Alpha Pro Tech Ltd. | | | 16,543 | | | | 87,512 | * |
Apogee Enterprises Inc. | | | 5,716 | | | | 305,292 | |
JELD-WEN Holding Inc. | | | 13,800 | | | | 260,544 | * |
Masonite International Corp. | | | 6,907 | | | | 584,747 | * |
Total Building Products | | | | | | | 1,238,095 | |
Commercial Services & Supplies — 0.6% | | | | | | | | |
CoreCivic Inc. | | | 26,996 | | | | 392,252 | * |
GEO Group Inc. | | | 18,311 | | | | 198,308 | * |
Total Commercial Services & Supplies | | | | | | | 590,560 | |
See Notes to Financial Statements.
| | | | |
| 18 | | | | Franklin U.S. Small Cap Equity Fund 2023 Annual Report |
Franklin U.S. Small Cap Equity Fund
(Percentages shown based on Fund net assets)
| | | | | | | | |
| Security | | Shares | | | Value | |
Construction & Engineering — 1.9% | | | | | | | | |
Argan Inc. | | | 6,639 | | | | $310,639 | |
Dycom Industries Inc. | | | 4,186 | | | | 481,767 | * |
Granite Construction Inc. | | | 7,439 | | | | 378,347 | |
Limbach Holdings Inc. | | | 6,900 | | | | 313,743 | * |
MYR Group Inc. | | | 2,355 | | | | 340,604 | * |
Total Construction & Engineering | | | | | | | 1,825,100 | |
Electrical Equipment — 0.9% | | | | | | | | |
Atkore Inc. | | | 1,958 | | | | 313,280 | * |
Encore Wire Corp. | | | 2,350 | | | | 501,960 | |
Total Electrical Equipment | | | | | | | 815,240 | |
Ground Transportation — 1.1% | | | | | | | | |
ArcBest Corp. | | | 4,186 | | | | 503,199 | |
Covenant Logistics Group Inc. | | | 12,033 | | | | 553,999 | |
Total Ground Transportation | | | | | | | 1,057,198 | |
Machinery — 2.7% | | | | | | | | |
Blue Bird Corp. | | | 12,000 | | | | 323,520 | * |
Briggs & Stratton Corp. | | | 158,200 | | | | 0 | *(a)(b)(c) |
Commercial Vehicle Group Inc. | | | 23,300 | | | | 163,333 | * |
Greenbrier Cos. Inc. | | | 8,736 | | | | 385,956 | |
Manitowoc Co. Inc. | | | 18,311 | | | | 305,611 | * |
Terex Corp. | | | 9,416 | | | | 541,043 | |
Titan International Inc. | | | 40,611 | | | | 604,292 | * |
Wabash National Corp. | | | 9,397 | | | | 240,751 | |
Total Machinery | | | | | | | 2,564,506 | |
Marine Transportation — 0.5% | | | | | | | | |
Matson Inc. | | | 4,000 | | | | 438,400 | |
Passenger Airlines — 0.3% | | | | | | | | |
SkyWest Inc. | | | 5,700 | | | | 297,540 | * |
Professional Services — 3.8% | | | | | | | | |
Barrett Business Services Inc. | | | 3,290 | | | | 380,982 | |
CRA International Inc. | | | 3,663 | | | | 362,088 | |
ExlService Holdings Inc. | | | 19,625 | | | | 605,431 | * |
Heidrick & Struggles International Inc. | | | 5,755 | | | | 169,945 | |
IBEX Holdings Ltd. | | | 9,397 | | | | 178,637 | * |
Insperity Inc. | | | 5,651 | | | | 662,410 | |
Kforce Inc. | | | 9,417 | | | | 636,212 | |
TriNet Group Inc. | | | 3,916 | | | | 465,730 | * |
TrueBlue Inc. | | | 10,437 | | | | 160,104 | * |
Total Professional Services | | | | | | | 3,621,539 | |
See Notes to Financial Statements.
| | | | |
| Franklin U.S. Small Cap Equity Fund 2023 Annual Report | | | | 19 |
Schedule of investments (cont’d)
December 31, 2023
Franklin U.S. Small Cap Equity Fund
(Percentages shown based on Fund net assets)
| | | | | | | | |
| Security | | Shares | | | Value | |
Trading Companies & Distributors — 3.7% | | | | | | | | |
BlueLinx Holdings Inc. | | | 5,952 | | | | $674,421 | * |
Boise Cascade Co. | | | 4,186 | | | | 541,501 | |
Herc Holdings Inc. | | | 4,186 | | | | 623,254 | |
MRC Global Inc. | | | 36,623 | | | | 403,219 | * |
NOW Inc. | | | 52,319 | | | | 592,251 | * |
Rush Enterprises Inc., Class A Shares | | | 13,339 | | | | 670,952 | |
Total Trading Companies & Distributors | | | | | | | 3,505,598 | |
Total Industrials | | | | | | | 16,443,429 | |
| Information Technology — 12.7% | | | | | | | | |
Communications Equipment — 1.0% | | | | | | | | |
Extreme Networks Inc. | | | 23,543 | | | | 415,298 | * |
Infinera Corp. | | | 46,986 | | | | 223,183 | * |
NETGEAR Inc. | | | 11,746 | | | | 171,257 | * |
NetScout Systems Inc. | | | 7,585 | | | | 166,491 | * |
Total Communications Equipment | | | | | | | 976,229 | |
Electronic Equipment, Instruments & Components — 1.4% | | | | | | | | |
Arlo Technologies Inc. | | | 35,210 | | | | 335,199 | * |
Avnet Inc. | | | 3,138 | | | | 158,155 | |
Bel Fuse Inc., Class B Shares | | | 5,000 | | | | 333,850 | |
Sanmina Corp. | | | 6,278 | | | | 322,501 | * |
Vishay Intertechnology Inc. | | | 6,278 | | | | 150,484 | |
Total Electronic Equipment, Instruments & Components | | | | | | | 1,300,189 | |
IT Services — 0.8% | | | | | | | | |
Couchbase Inc. | | | 19,577 | | | | 440,874 | * |
DigitalOcean Holdings Inc. | | | 9,553 | | | | 350,500 | * |
Total IT Services | | | | | | | 791,374 | |
Semiconductors & Semiconductor Equipment — 2.6% | | | | | | | | |
Alpha & Omega Semiconductor Ltd. | | | 7,047 | | | | 183,645 | * |
Amkor Technology Inc. | | | 20,360 | | | | 677,377 | |
Axcelis Technologies Inc. | | | 3,916 | | | | 507,866 | * |
Kulicke & Soffa Industries Inc. | | | 7,831 | | | | 428,512 | |
Photronics Inc. | | | 20,927 | | | | 656,480 | * |
Total Semiconductors & Semiconductor Equipment | | | | | | | 2,453,880 | |
Software — 5.1% | | | | | | | | |
8x8 Inc. | | | 38,372 | | | | 145,046 | * |
A10 Networks Inc. | | | 26,891 | | | | 354,154 | |
Alarm.com Holdings Inc. | | | 3,924 | | | | 253,569 | * |
Appfolio Inc., Class A Shares | | | 1,000 | | | | 173,240 | * |
Box Inc., Class A Shares | | | 12,529 | | | | 320,868 | * |
Cleanspark Inc. | | | 27,000 | | | | 297,810 | * |
See Notes to Financial Statements.
| | | | |
| 20 | | | | Franklin U.S. Small Cap Equity Fund 2023 Annual Report |
Franklin U.S. Small Cap Equity Fund
(Percentages shown based on Fund net assets)
| | | | | | | | |
| Security | | Shares | | | Value | |
Software — continued | | | | | | | | |
CommVault Systems Inc. | | | 6,610 | | | $ | 527,808 | * |
Domo Inc., Class B Shares | | | 3,138 | | | | 32,290 | * |
eGain Corp. | | | 16,166 | | | | 134,663 | * |
InterDigital Inc. | | | 3,446 | | | | 374,029 | |
LiveRamp Holdings Inc. | | | 9,880 | | | | 374,254 | * |
Matterport Inc. | | | 55,365 | | | | 148,932 | * |
Qualys Inc. | | | 3,977 | | | | 780,606 | * |
Varonis Systems Inc. | | | 10,571 | | | | 478,655 | * |
Weave Communications Inc. | | | 26,000 | | | | 298,220 | * |
Yext Inc. | | | 31,324 | | | | 184,498 | * |
Total Software | | | | | | | 4,878,642 | |
Technology Hardware, Storage & Peripherals — 1.8% | | | | | | | | |
Immersion Corp. | | | 30,000 | | | | 211,800 | |
Stratasys Ltd. | | | 9,416 | | | | 134,461 | * |
Super Micro Computer Inc. | | | 3,681 | | | | 1,046,361 | * |
Xerox Holdings Corp. | | | 16,600 | | | | 304,278 | |
Total Technology Hardware, Storage & Peripherals | | | | | | | 1,696,900 | |
Total Information Technology | | | | | | | 12,097,214 | |
| Materials — 3.7% | | | | | | | | |
Chemicals — 1.2% | | | | | | | | |
AdvanSix Inc. | | | 9,416 | | | | 282,103 | |
American Vanguard Corp. | | | 10,044 | | | | 110,183 | |
Core Molding Technologies Inc. | | | 8,000 | | | | 148,240 | * |
Ecovyst Inc. | | | 21,143 | | | | 206,567 | * |
Rayonier Advanced Materials Inc. | | | 33,307 | | | | 134,893 | * |
Tronox Holdings PLC | | | 20,169 | | | | 285,593 | |
Total Chemicals | | | | | | | 1,167,579 | |
Containers & Packaging — 0.3% | | | | | | | | |
O-I Glass Inc. | | | 14,095 | | | | 230,876 | * |
Metals & Mining — 1.6% | | | | | | | | |
Kaiser Aluminum Corp. | | | 2,897 | | | | 206,237 | |
Olympic Steel Inc. | | | 4,698 | | | | 313,357 | |
Ryerson Holding Corp. | | | 7,831 | | | | 271,579 | |
SunCoke Energy Inc. | | | 66,847 | | | | 717,937 | |
Total Metals & Mining | | | | | | | 1,509,110 | |
Paper & Forest Products — 0.6% | | | | | | | | |
Clearwater Paper Corp. | | | 8,605 | | | | 310,813 | * |
Sylvamo Corp. | | | 5,873 | | | | 288,423 | |
Total Paper & Forest Products | | | | | | | 599,236 | |
Total Materials | | | | | | | 3,506,801 | |
See Notes to Financial Statements.
| | | | |
| Franklin U.S. Small Cap Equity Fund 2023 Annual Report | | | | 21 |
Schedule of investments (cont’d)
December 31, 2023
Franklin U.S. Small Cap Equity Fund
(Percentages shown based on Fund net assets)
| | | | | | | | |
| Security | | Shares | | | Value | |
| Real Estate — 5.5% | | | | | | | | |
Health Care REITs — 1.2% | | | | | | | | |
Diversified Healthcare Trust | | | 107,000 | | | | $400,180 | |
National Health Investors Inc. | | | 5,794 | | | | 323,595 | |
Sabra Health Care REIT Inc. | | | 30,000 | | | | 428,100 | |
Total Health Care REITs | | | | | | | 1,151,875 | |
Hotel & Resort REITs — 2.7% | | | | | | | | |
Apple Hospitality REIT Inc. | | | 26,159 | | | | 434,501 | |
Chatham Lodging Trust | | | 19,463 | | | | 208,643 | |
DiamondRock Hospitality Co. | | | 51,435 | | | | 482,975 | |
Park Hotels & Resorts Inc. | | | 10,571 | | | | 161,736 | |
Pebblebrook Hotel Trust | | | 13,602 | | | | 217,360 | |
RLJ Lodging Trust | | | 22,024 | | | | 258,121 | |
Ryman Hospitality Properties Inc. | | | 1,958 | | | | 215,498 | |
Service Properties Trust | | | 30,541 | | | | 260,820 | |
Summit Hotel Properties Inc. | | | 45,000 | | | | 302,400 | |
Total Hotel & Resort REITs | | | | | | | 2,542,054 | |
Industrial REITs — 0.2% | | | | | | | | |
Innovative Industrial Properties Inc. | | | 2,084 | | | | 210,109 | |
Office REITs — 0.4% | | | | | | | | |
Brandywine Realty Trust | | | 45,200 | | | | 244,080 | |
Piedmont Office Realty Trust Inc., Class A Shares | | | 18,572 | | | | 132,047 | |
Total Office REITs | | | | | | | 376,127 | |
Real Estate Management & Development — 0.4% | | | | | | | | |
Forestar Group Inc. | | | 8,700 | | | | 287,709 | * |
RE/MAX Holdings Inc., Class A Shares | | | 10,180 | | | | 135,699 | |
Total Real Estate Management & Development | | | | | | | 423,408 | |
Residential REITs — 0.2% | | | | | | | | |
Apartment Investment and Management Co., Class A Shares | | | 19,577 | | | | 153,288 | * |
Retail REITs — 0.4% | | | | | | | | |
Tanger Inc. | | | 12,500 | | | | 346,500 | |
Total Real Estate | | | | | | | 5,203,361 | |
| Utilities — 2.4% | | | | | | | | |
Electric Utilities — 1.0% | | | | | | | | |
ALLETE Inc. | | | 5,755 | | | | 351,976 | |
Portland General Electric Co. | | | 13,340 | | | | 578,156 | |
Total Electric Utilities | | | | | | | 930,132 | |
Gas Utilities — 0.4% | | | | | | | | |
National Fuel Gas Co. | | | 3,819 | | | | 191,599 | |
Northwest Natural Holding Co. | | | 5,441 | | | | 211,873 | |
Total Gas Utilities | | | | | | | 403,472 | |
See Notes to Financial Statements.
| | | | |
| 22 | | | | Franklin U.S. Small Cap Equity Fund 2023 Annual Report |
Franklin U.S. Small Cap Equity Fund
(Percentages shown based on Fund net assets)
| | | | | | | | | | | | |
| Security | | | | | Shares | | | Value | |
Water Utilities — 1.0% | | | | | | | | | | | | |
Consolidated Water Co. Ltd. | | | | | | | 25,059 | | | $ | 892,100 | |
Total Utilities | | | | | | | | | | | 2,225,704 | |
Total Investments before Short-Term Investments (Cost — $79,121,991) | | | | 93,969,477 | |
| | | |
| | | Rate | | | | | | | |
| Short-Term Investments — 1.1% | | | | | | | | | | | | |
Invesco Treasury Portfolio, Institutional Class (Cost — $1,056,066) | | | 5.622 | % | | | 1,056,066 | | | | 1,056,066 | (d) |
Total Investments — 100.1% (Cost — $80,178,057) | | | | | | | | | | | 95,025,543 | |
Liabilities in Excess of Other Assets — (0.1)% | | | | | | | | | | | (50,118 | ) |
Total Net Assets — 100.0% | | | | | | | | | | $ | 94,975,425 | |
| * | Non-income producing security. |
| (a) | Security is fair valued in accordance with procedures approved by the Board of Trustees (Note 1). |
| (b) | Security is valued using significant unobservable inputs (Note 1). |
| (c) | Value is less than $1. |
| (d) | Rate shown is one-day yield as of the end of the reporting period. |
| | |
Abbreviation(s) used in this schedule: |
| |
| CVR | | — Contingent Value Rights |
| |
| REIT | | — Real Estate Investment Trust |
See Notes to Financial Statements.
| | | | |
| Franklin U.S. Small Cap Equity Fund 2023 Annual Report | | | | 23 |
Statement of assets and liabilities
December 31, 2023
| | | | |
| |
| Assets: | | | | |
Investments, at value (Cost — $80,178,057) | | $ | 95,025,543 | |
Dividends receivable | | | 91,681 | |
Receivable for Fund shares sold | | | 17,794 | |
Other assets | | | 133,085 | |
Prepaid expenses | | | 4,414 | |
Total Assets | | | 95,272,517 | |
| |
| Liabilities: | | | | |
Trustees’ fees payable | | | 134,802 | |
Investment management fee payable | | | 41,254 | |
Audit and tax fees payable | | | 39,126 | |
Fund accounting fees payable | | | 27,536 | |
Transfer agent fees payable | | | 22,318 | |
Service and/or distribution fees payable | | | 13,572 | |
Payable for Fund shares repurchased | | | 9,154 | |
Accrued expenses | | | 9,330 | |
Total Liabilities | | | 297,092 | |
| Total Net Assets | | $ | 94,975,425 | |
| |
| Net Assets: | | | | |
Par value (Note 7) | | $ | 75 | |
Paid-in capital in excess of par value | | | 80,435,167 | |
Total distributable earnings (loss) | | | 14,540,183 | |
| Total Net Assets | | $ | 94,975,425 | |
| |
| Net Assets: | | | | |
Class A | | $ | 64,794,001 | |
Class C | | $ | 477,692 | |
Class FI | | $ | 20,089 | |
Class I | | $ | 2,124,748 | |
Class IS | | $ | 27,558,895 | |
| |
| Shares Outstanding: | | | | |
Class A | | | 5,147,193 | |
Class C | | | 43,997 | |
Class FI | | | 1,710 | |
Class I | | | 162,537 | |
Class IS | | | 2,191,957 | |
| |
| Net Asset Value: | | | | |
Class A (and redemption price) | | $ | 12.59 | |
Class C* | | $ | 10.86 | |
Class FI (and redemption price) | | $ | 11.75 | |
Class I (and redemption price) | | $ | 13.07 | |
Class IS (and redemption price) | | $ | 12.57 | |
| Maximum Public Offering Price Per Share: | | | | |
Class A (based on maximum initial sales charge of 5.50%) | | $ | 13.32 | |
| * | Redemption price per share is NAV of Class C shares reduced by a 1.00% CDSC if shares are redeemed within one year from purchase payment (Note 2). |
See Notes to Financial Statements.
| | | | |
| 24 | | | | Franklin U.S. Small Cap Equity Fund 2023 Annual Report |
Statement of operations
For the Year Ended December 31, 2023
| | | | |
| |
| Investment Income: | | | | |
Dividends | | $ | 1,480,953 | |
Less: Foreign taxes withheld | | | (4,329) | |
Total Investment Income | | | 1,476,624 | |
| |
| Expenses: | | | | |
Investment management fee (Note 2) | | | 664,772 | |
Service and/or distribution fees (Notes 2 and 5) | | | 146,705 | |
Transfer agent fees (Notes 2 and 5) | | | 136,770 | |
Registration fees | | | 73,379 | |
Fund accounting fees | | | 66,325 | |
Audit and tax fees | | | 39,126 | |
Legal fees | | | 30,664 | |
Shareholder reports | | | 13,449 | |
Trustees’ fees | | | 6,662 | |
Commitment fees (Note 8) | | | 808 | |
Insurance | | | 688 | |
Custody fees | | | 86 | |
Fees recaptured by investment manager (Note 2) | | | 68 | |
Miscellaneous expenses | | | 6,278 | |
Total Expenses | | | 1,185,780 | |
Less: Fee waivers and/or expense reimbursements (Notes 2 and 5) | | | (209,241) | |
Net Expenses | | | 976,539 | |
| Net Investment Income | | | 500,085 | |
|
| Realized and Unrealized Gain on Investments and Foreign Currency Transactions (Notes 1, 3 and 9): | |
Net Realized Gain From: | | | | |
Investment transactions | | | 2,232,348 | |
Foreign currency transactions | | | 1 | |
Net Realized Gain | | | 2,232,349 | |
Change in Net Unrealized Appreciation (Depreciation) From Investments | | | 14,514,425 | |
| Net Gain on Investments and Foreign Currency Transactions | | | 16,746,774 | |
| Increase in Net Assets From Operations | | $ | 17,246,859 | |
See Notes to Financial Statements.
| | | | |
| Franklin U.S. Small Cap Equity Fund 2023 Annual Report | | | | 25 |
Statements of changes in net assets
| | | | | | | | |
| For the Years Ended December 31, | | 2023 | | | 2022 | |
| | |
| Operations: | | | | | | | | |
Net investment income | | $ | 500,085 | | | $ | 325,459 | |
Net realized gain | | | 2,232,349 | | | | 10,445,934 | |
Change in net unrealized appreciation (depreciation) | | | 14,514,425 | | | | (37,624,863) | |
Increase (Decrease) in Net Assets From Operations | | | 17,246,859 | | | | (26,853,470) | |
| | |
| Distributions to Shareholders From (Notes 1 and 6): | | | | | | | | |
Total distributable earnings | | | (3,663,371) | | | | (5,718,112) | |
Decrease in Net Assets From Distributions to Shareholders | | | (3,663,371) | | | | (5,718,112) | |
| | |
| Fund Share Transactions (Note 7): | | | | | | | | |
Net proceeds from sale of shares | | | 10,409,204 | | | | 10,186,124 | |
Reinvestment of distributions | | | 3,653,575 | | | | 5,705,292 | |
Cost of shares repurchased | | | (33,873,019) | | | | (34,407,097) | |
Shares redeemed in-kind (Note 9) | | | — | | | | (37,396,485) | |
Decrease in Net Assets From Fund Share Transactions | | | (19,810,240) | | | | (55,912,166) | |
Decrease in Net Assets | | | (6,226,752) | | | | (88,483,748) | |
| | |
| Net Assets: | | | | | | | | |
Beginning of year | | | 101,202,177 | | | | 189,685,925 | |
End of year | | $ | 94,975,425 | | | $ | 101,202,177 | |
See Notes to Financial Statements.
| | | | |
| 26 | | | | Franklin U.S. Small Cap Equity Fund 2023 Annual Report |
Financial highlights
| | | | | | | | | | | | | | | | | | | | |
| For a share of each class of beneficial interest outstanding throughout each year ended December 31: | |
| Class A Shares1 | | 2023 | | | 2022 | | | 2021 | | | 2020 | | | 2019 | |
| | | | | |
| Net asset value, beginning of year | | | $11.02 | | | | $13.71 | | | | $13.09 | | | | $12.22 | | | | $10.29 | |
| | | | | |
| Income (loss) from operations: | | | | | | | | | | | | | | | | | | | | |
Net investment income | | | 0.04 | | | | 0.01 | | | | 0.04 | | | | 0.04 | | | | 0.04 | |
Net realized and unrealized gain (loss) | | | 1.98 | | | | (2.14) | | | | 3.84 | | | | 1.29 | | | | 2.05 | |
Total income (loss) from operations | | | 2.02 | | | | (2.13) | | | | 3.88 | | | | 1.33 | | | | 2.09 | |
| | | | | |
| Less distributions from: | | | | | | | | | | | | | | | | | | | | |
Net investment income | | | (0.01) | | | | (0.04) | | | | (0.00) | 2 | | | (0.10) | | | | (0.02) | |
Net realized gains | | | (0.44) | | | | (0.52) | | | | (3.26) | | | | (0.36) | | | | (0.14) | |
Total distributions | | | (0.45) | | | | (0.56) | | | | (3.26) | | | | (0.46) | | | | (0.16) | |
| | | | | |
| Net asset value, end of year | | | $12.59 | | | | $11.02 | | | | $13.71 | | | | $13.09 | | | | $12.22 | |
Total return3 | | | 18.54 | % | | | (15.42) | % | | | 30.03 | % | | | 10.99 | % | | | 20.43 | % |
| | | | | |
| Net assets, end of year (000s) | | | $64,794 | | | | $56,113 | | | | $68,716 | | | | $12,128 | | | | $13,223 | |
| | | | | |
| Ratios to average net assets: | | | | | | | | | | | | | | | | | | | | |
Gross expenses | | | 1.44 | % | | | 1.36 | % | | | 1.32 | % | | | 1.27 | % | | | 1.24 | % |
Net expenses4,5 | | | 1.20 | | | | 1.20 | | | | 1.19 | | | | 1.14 | | | | 1.12 | |
Net investment income | | | 0.37 | | | | 0.08 | | | | 0.23 | | | | 0.37 | | | | 0.38 | |
| | | | | |
| Portfolio turnover rate | | | 34 | % | | | 31 | %6 | | | 39 | % | | | 37 | % | | | 51 | % |
| 1 | Per share amounts have been calculated using the average shares method. |
| 2 | Amount represents less than $0.005 or greater than $(0.005) per share. |
| 3 | Performance figures, exclusive of sales charges, may reflect compensating balance arrangements, fee waivers and/or expense reimbursements. In the absence of compensating balance arrangements, fee waivers and/or expense reimbursements, the total return would have been lower. Past performance is no guarantee of future results. |
| 4 | As a result of an expense limitation arrangement, the ratio of total annual fund operating expenses to average net assets of Class A shares did not exceed 1.30%. This expense limitation arrangement cannot be terminated prior to December 31, 2025 without the Board of Trustees’ consent. The manager currently intends to voluntarily waive fees and/or reimburse expenses so that total annual fund operating expenses do not exceed 1.20%. This arrangement is expected to continue until December 31, 2025, but may be terminated at any time by the manager. These expense limitation arrangements do not include interest, brokerage commissions, dividend expense on short sales, taxes, extraordinary expenses and acquired fund fees and expenses. |
| 5 | Reflects fee waivers and/or expense reimbursements. |
| 6 | Excludes securities delivered as a result of a redemption in-kind. |
See Notes to Financial Statements.
| | | | |
| Franklin U.S. Small Cap Equity Fund 2023 Annual Report | | | | 27 |
Financial highlights (cont’d)
| | | | | | | | | | | | | | | | | | | | |
| For a share of each class of beneficial interest outstanding throughout each year ended December 31: | |
| | | | | |
| Class C Shares1 | | 2023 | | | 2022 | | | 2021 | | | 2020 | | | 2019 | |
| | | | | |
| Net asset value, beginning of year | | | $9.62 | | | | $12.10 | | | | $11.95 | | | | $11.17 | | | | $9.47 | |
| | | | | |
| Income (loss) from operations: | | | | | | | | | | | | | | | | | | | | |
Net investment loss | | | (0.04) | | | | (0.07) | | | | (0.12) | | | | (0.04) | | | | (0.05) | |
Net realized and unrealized gain (loss) | | | 1.72 | | | | (1.89) | | | | 3.53 | | | | 1.18 | | | | 1.89 | |
Total income (loss) from operations | | | 1.68 | | | | (1.96) | | | | 3.41 | | | | 1.14 | | | | 1.84 | |
| | | | | |
| Less distributions from: | | | | | | | | | | | | | | | | | | | | |
Net realized gains | | | (0.44) | | | | (0.52) | | | | (3.26) | | | | (0.36) | | | | (0.14) | |
Total distributions | | | (0.44) | | | | (0.52) | | | | (3.26) | | | | (0.36) | | | | (0.14) | |
| | | | | |
| Net asset value, end of year | | | $10.86 | | | | $9.62 | | | | $12.10 | | | | $11.95 | | | | $11.17 | |
Total return2 | | | 17.68 | % | | | (16.08) | % | | | 28.92 | % | | | 10.16 | % | | | 19.52 | % |
| | | | | |
| Net assets, end of year (000s) | | | $478 | | | | $366 | | | | $326 | | | | $640 | | | | $1,125 | |
| | | | | |
| Ratios to average net assets: | | | | | | | | | | | | | | | | | | | | |
Gross expenses | | | 2.14 | % | | | 2.11 | % | | | 2.04 | % | | | 2.05 | % | | | 2.04 | %3 |
Net expenses4,5 | | | 1.95 | | | | 1.95 | | | | 1.95 | | | | 1.91 | | | | 1.93 | 3 |
Net investment loss | | | (0.38) | | | | (0.64) | | | | (0.84) | | | | (0.42) | | | | (0.42) | |
| | | | | |
| Portfolio turnover rate | | | 34 | % | | | 31 | %6 | | | 39 | % | | | 37 | % | | | 51 | % |
| 1 | Per share amounts have been calculated using the average shares method. |
| 2 | Performance figures, exclusive of CDSC, may reflect compensating balance arrangements, fee waivers and/or expense reimbursements. In the absence of compensating balance arrangements, fee waivers and/or expense reimbursements, the total return would have been lower. Past performance is no guarantee of future results. |
| 3 | Reflects recapture of fees waived and/or expenses reimbursed from prior fiscal years. |
| 4 | As a result of an expense limitation arrangement, the ratio of total annual fund operating expenses to average net assets of Class C shares did not exceed 2.05%. This expense limitation arrangement cannot be terminated prior to December 31, 2025 without the Board of Trustees’ consent. The manager currently intends to voluntarily waive fees and/or reimburse expenses so that total annual fund operating expenses do not exceed 1.95%. This arrangement is expected to continue until December 31, 2025, but may be terminated at any time by the manager. These expense limitation arrangements do not include interest, brokerage commissions, dividend expense on short sales, taxes, extraordinary expenses and acquired fund fees and expenses. |
| 5 | Reflects fee waivers and/or expense reimbursements. |
| 6 | Excludes securities delivered as a result of a redemption in-kind. |
See Notes to Financial Statements.
| | | | |
| 28 | | | | Franklin U.S. Small Cap Equity Fund 2023 Annual Report |
| | | | | | | | | | | | | | | | | | | | |
| For a share of each class of beneficial interest outstanding throughout each year ended December 31: | |
| | | | | |
| Class FI Shares1 | | 2023 | | | 2022 | | | 2021 | | | 2020 | | | 2019 | |
| | | | | |
| Net asset value, beginning of year | | | $10.32 | | | | $12.86 | | | | $12.45 | | | | $11.61 | | | | $9.78 | |
| | | | | |
| Income (loss) from operations: | | | | | | | | | | | | | | | | | | | | |
Net investment income | | | 0.04 | | | | 0.01 | | | | 0.00 | 2 | | | 0.02 | | | | 0.04 | |
Net realized and unrealized gain (loss) | | | 1.84 | | | | (2.00) | | | | 3.67 | | | | 1.24 | | | | 1.95 | |
Total income (loss) from operations | | | 1.88 | | | | (1.99) | | | | 3.67 | | | | 1.26 | | | | 1.99 | |
| | | | | |
| Less distributions from: | | | | | | | | | | | | | | | | | | | | |
Net investment income | | | (0.01) | | | | (0.03) | | | | — | | | | (0.06) | | | | (0.02) | |
Net realized gains | | | (0.44) | | | | (0.52) | | | | (3.26) | | | | (0.36) | | | | (0.14) | |
Total distributions | | | (0.45) | | | | (0.55) | | | | (3.26) | | | | (0.42) | | | | (0.16) | |
| | | | | |
| Net asset value, end of year | | | $11.75 | | | | $10.32 | | | | $12.86 | | | | $12.45 | | | | $11.61 | |
Total return3 | | | 18.47 | % | | | (15.37) | % | | | 29.85 | % | | | 10.94 | % | | | 20.42 | % |
| | | | | |
| Net assets, end of year (000s) | | | $20 | | | | $18 | | | | $23 | | | | $18 | | | | $150 | |
| | | | | |
| Ratios to average net assets: | | | | | | | | | | | | | | | | | | | | |
Gross expenses | | | 1.67 | % | | | 1.78 | % | | | 1.77 | % | | | 1.72 | % | | | 1.41 | %4 |
Net expenses5,6 | | | 1.20 | | | | 1.20 | | | | 1.20 | | | | 1.20 | | | | 1.20 | 4 |
Net investment income | | | 0.37 | | | | 0.09 | | | | 0.03 | | | | 0.24 | | | | 0.33 | |
| | | | | |
| Portfolio turnover rate | | | 34 | % | | | 31 | %7 | | | 39 | % | | | 37 | % | | | 51 | % |
| 1 | Per share amounts have been calculated using the average shares method. |
| 2 | Amount represents less than $0.005 or greater than $(0.005) per share. |
| 3 | Performance figures may reflect compensating balance arrangements, fee waivers and/or expense reimbursements. In the absence of compensating balance arrangements, fee waivers and/or expense reimbursements, the total return would have been lower. Past performance is no guarantee of future results. |
| 4 | Reflects recapture of fees waived and/or expenses reimbursed from prior fiscal years. |
| 5 | As a result of an expense limitation arrangement, the ratio of total annual fund operating expenses to average net assets of Class FI shares did not exceed 1.30%. This expense limitation arrangement cannot be terminated prior to December 31, 2025 without the Board of Trustees’ consent. The manager currently intends to voluntarily waive fees and/or reimburse expenses so that total annual fund operating expenses do not exceed 1.20%. This arrangement is expected to continue until December 31, 2025, but may be terminated at any time by the manager. These expense limitation arrangements do not include interest, brokerage commissions, dividend expense on short sales, taxes, extraordinary expenses and acquired fund fees and expenses. |
| 6 | Reflects fee waivers and/or expense reimbursements. |
| 7 | Excludes securities delivered as a result of a redemption in-kind. |
See Notes to Financial Statements.
| | | | |
| Franklin U.S. Small Cap Equity Fund 2023 Annual Report | | | | 29 |
Financial highlights (cont’d)
| | | | | | | | | | | | | | | | | | | | |
| For a share of each class of beneficial interest outstanding throughout each year ended December 31: | |
| | | | | |
| Class I Shares1 | | 2023 | | | 2022 | | | 2021 | | | 2020 | | | 2019 | |
| | | | | |
| Net asset value, beginning of year | | | $11.43 | | | | $14.18 | | | | $13.43 | | | | $12.52 | | | | $10.53 | |
| | | | | |
| Income (loss) from operations: | | | | | | | | | | | | | | | | | | | | |
Net investment income | | | 0.08 | | | | 0.05 | | | | 0.04 | | | | 0.07 | | | | 0.07 | |
Net realized and unrealized gain (loss) | | | 2.05 | | | | (2.21) | | | | 3.97 | | | | 1.33 | | | | 2.11 | |
Total income (loss) from operations | | | 2.13 | | | | (2.16) | | | | 4.01 | | | | 1.40 | | | | 2.18 | |
| | | | | |
| Less distributions from: | | | | | | | | | | | | | | | | | | | | |
Net investment income | | | (0.05) | | | | (0.07) | | | | (0.00) | 2 | | | (0.13) | | | | (0.05) | |
Net realized gains | | | (0.44) | | | | (0.52) | | | | (3.26) | | | | (0.36) | | | | (0.14) | |
Total distributions | | | (0.49) | | | | (0.59) | | | | (3.26) | | | | (0.49) | | | | (0.19) | |
| | | | | |
| Net asset value, end of year | | | $13.07 | | | | $11.43 | | | | $14.18 | | | | $13.43 | | | | $12.52 | |
Total return3 | | | 18.81 | % | | | (15.10) | % | | | 30.22 | % | | | 11.26 | % | | | 20.74 | % |
| | | | | |
| Net assets, end of year (000s) | | | $2,125 | | | | $1,555 | | | | $2,274 | | | | $3,718 | | | | $4,257 | |
| | | | | |
| Ratios to average net assets: | | | | | | | | | | | | | | | | | | | | |
Gross expenses | | | 1.15 | % | | | 1.11 | % | | | 1.03 | % | | | 1.06 | % | | | 1.05 | %4 |
Net expenses5,6 | | | 0.90 | | | | 0.90 | | | | 0.90 | | | | 0.90 | | | | 0.90 | 4 |
Net investment income | | | 0.67 | | | | 0.37 | | | | 0.27 | | | | 0.60 | | | | 0.58 | |
| | | | | |
| Portfolio turnover rate | | | 34 | % | | | 31 | %7 | | | 39 | % | | | 37 | % | | | 51 | % |
| 1 | Per share amounts have been calculated using the average shares method. |
| 2 | Amount represents less than $0.005 or greater than $(0.005) per share. |
| 3 | Performance figures may reflect compensating balance arrangements, fee waivers and/or expense reimbursements. In the absence of compensating balance arrangements, fee waivers and/or expense reimbursements, the total return would have been lower. Past performance is no guarantee of future results. |
| 4 | Reflects recapture of fees waived and/or expenses reimbursed from prior fiscal years. |
| 5 | As a result of an expense limitation arrangement, the ratio of total annual fund operating expenses to average net assets of Class I shares did not exceed 1.00%. This expense limitation arrangement cannot be terminated prior to December 31, 2025 without the Board of Trustees’ consent. The manager currently intends to voluntarily waive fees and/or reimburse expenses so that total annual fund operating expenses do not exceed 0.90%. This arrangement is expected to continue until December 31, 2025, but may be terminated at any time by the manager. These expense limitation arrangements do not include interest, brokerage commissions, dividend expense on short sales, taxes, extraordinary expenses and acquired fund fees and expenses. |
| 6 | Reflects fee waivers and/or expense reimbursements. |
| 7 | Excludes securities delivered as a result of a redemption in-kind. |
See Notes to Financial Statements.
| | | | |
| 30 | | | | Franklin U.S. Small Cap Equity Fund 2023 Annual Report |
| | | | | | | | | | | | | | | | | | | | |
| For a share of each class of beneficial interest outstanding throughout each year ended December 31: | |
| | | | | |
| Class IS Shares1 | | 2023 | | | 2022 | | | 2021 | | | 2020 | | | 2019 | |
| | | | | |
| Net asset value, beginning of year | | | $11.01 | | | | $13.73 | | | | $13.07 | | | | $12.19 | | | | $10.26 | |
| | | | | |
| Income (loss) from operations: | | | | | | | | | | | | | | | | | | | | |
Net investment income | | | 0.09 | | | | 0.05 | | | | 0.07 | | | | 0.08 | | | | 0.09 | |
Net realized and unrealized gain (loss) | | | 1.97 | | | | (2.12) | | | | 3.85 | | | | 1.30 | | | | 2.05 | |
Total income (loss) from operations | | | 2.06 | | | | (2.07) | | | | 3.92 | | | | 1.38 | | | | 2.14 | |
| | | | | |
| Less distributions from: | | | | | | | | | | | | | | | | | | | | |
Net investment income | | | (0.06) | | | | (0.13) | | | | (0.00)2 | | | | (0.14) | | | | (0.07) | |
Net realized gains | | | (0.44) | | | | (0.52) | | | | (3.26) | | | | (0.36) | | | | (0.14) | |
Total distributions | | | (0.50) | | | | (0.65) | | | | (3.26) | | | | (0.50) | | | | (0.21) | |
| | | | | |
| Net asset value, end of year | | | $12.57 | | | | $11.01 | | | | $13.73 | | | | $13.07 | | | | $12.19 | |
Total return3 | | | 18.95 | % | | | (14.92 | )% | | | 30.38 | % | | | 11.47 | % | | | 20.92 | % |
| | | | | |
| Net assets, end of year (000s) | | | $27,559 | | | | $43,150 | | | | $118,348 | | | | $122,658 | | | | $126,394 | |
| | | | | |
| Ratios to average net assets: | | | | | | | | | | | | | | | | | | | | |
Gross expenses | | | 0.94% | | | | 0.88% | | | | 0.84% | | | | 0.89% | | | | 0.86%4 | |
Net expenses5,6 | | | 0.75 | | | | 0.75 | | | | 0.75 | | | | 0.75 | | | | 0.754 | |
Net investment income | | | 0.78 | | | | 0.39 | | | | 0.46 | | | | 0.76 | | | | 0.77 | |
| | | | | |
| Portfolio turnover rate | | | 34 | % | | | 31 | %7 | | | 39 | % | | | 37 | % | | | 51 | % |
| 1 | Per share amounts have been calculated using the average shares method. |
| 2 | Amount represents less than $0.005 or greater than $(0.005) per share. |
| 3 | Performance figures may reflect compensating balance arrangements, fee waivers and/or expense reimbursements. In the absence of compensating balance arrangements, fee waivers and/or expense reimbursements, the total return would have been lower. Past performance is no guarantee of future results. |
| 4 | Reflects recapture of fees waived and/or expenses reimbursed from prior fiscal years. |
| 5 | As a result of an expense limitation arrangement, the ratio of total annual fund operating expenses to average net assets of Class IS shares did not exceed 0.75%. In addition, the ratio of total annual fund operating expenses for Class IS shares did not exceed the ratio of total annual fund operating expenses for Class I shares. These expense limitation arrangements cannot be terminated prior to December 31, 2025 without the Board of Trustees’ consent. These expense limitation arrangements do not include interest, brokerage commissions, dividend expense on short sales, taxes, extraordinary expenses and acquired fund fees and expenses. |
| 6 | Reflects fee waivers and/or expense reimbursements. |
| 7 | Excludes securities delivered as a result of a redemption in-kind. |
See Notes to Financial Statements.
| | | | |
| Franklin U.S. Small Cap Equity Fund 2023 Annual Report | | | | 31 |
Notes to financial statements
1. Organization and significant accounting policies
Franklin U.S. Small Cap Equity Fund (the “Fund”) is a separate diversified investment series of Legg Mason Global Asset Management Trust (the “Trust”). The Trust, a Maryland statutory trust, is registered under the Investment Company Act of 1940, as amended (the “1940 Act”), as an open-end management investment company.
The Fund follows the accounting and reporting guidance in Financial Accounting Standards Board (“FASB”) Accounting Standards Codification Topic 946, Financial Services — Investment Companies (“ASC 946”). The following are significant accounting policies consistently followed by the Fund and are in conformity with U.S. generally accepted accounting principles (“GAAP”), including, but not limited to, ASC 946. Estimates and assumptions are required to be made regarding assets, liabilities and changes in net assets resulting from operations when financial statements are prepared. Changes in the economic environment, financial markets and any other parameters used in determining these estimates could cause actual results to differ. Subsequent events have been evaluated through the date the financial statements were issued.
(a) Investment valuation. Equity securities for which market quotations are available are valued at the last reported sales price or official closing price on the primary market or exchange on which they trade. The valuations for fixed income securities (which may include, but are not limited to, corporate, government, municipal, mortgage-backed, collateralized mortgage obligations and asset-backed securities) and certain derivative instruments are typically the prices supplied by independent third party pricing services, which may use market prices or broker/dealer quotations or a variety of valuation techniques and methodologies. The independent third party pricing services typically use inputs that are observable such as issuer details, interest rates, yield curves, prepayment speeds, credit risks/spreads, default rates and quoted prices for similar securities. Investments in open-end funds are valued at the closing net asset value per share of each fund on the day of valuation. When the Fund holds securities or other assets that are denominated in a foreign currency, the Fund will normally use the currency exchange rates as of 4:00 p.m. (Eastern Time). If independent third party pricing services are unable to supply prices for a portfolio investment, or if the prices supplied are deemed by the manager to be unreliable, the market price may be determined by the manager using quotations from one or more broker/dealers or at the transaction price if the security has recently been purchased and no value has yet been obtained from a pricing service or pricing broker. When reliable prices are not readily available, such as when the value of a security has been significantly affected by events after the close of the exchange or market on which the security is principally traded, but before the Fund calculates its net asset value, the Fund values these securities as determined in accordance with procedures approved by the Fund’s Board of Trustees.
Pursuant to policies adopted by the Board of Trustees, the Fund’s manager has been designated as the valuation designee and is responsible for the oversight of the daily valuation process. The Fund’s manager is assisted by the Global Fund Valuation Committee (the “Valuation Committee”). The Valuation Committee is responsible for making fair value
| | | | |
| 32 | | | | Franklin U.S. Small Cap Equity Fund 2023 Annual Report |
determinations, evaluating the effectiveness of the Fund’s pricing policies, and reporting to the Fund’s manager and the Board of Trustees. When determining the reliability of third party pricing information for investments owned by the Fund, the Valuation Committee, among other things, conducts due diligence reviews of pricing vendors, monitors the daily change in prices and reviews transactions among market participants.
The Valuation Committee will consider pricing methodologies it deems relevant and appropriate when making fair value determinations. Examples of possible methodologies include, but are not limited to, multiple of earnings; discount from market of a similar freely traded security; discounted cash-flow analysis; book value or a multiple thereof; risk premium/yield analysis; yield to maturity; and/or fundamental investment analysis. The Valuation Committee will also consider factors it deems relevant and appropriate in light of the facts and circumstances. Examples of possible factors include, but are not limited to, the type of security; the issuer’s financial statements; the purchase price of the security; the discount from market value of unrestricted securities of the same class at the time of purchase; analysts’ research and observations from financial institutions; information regarding any transactions or offers with respect to the security; the existence of merger proposals or tender offers affecting the security; the price and extent of public trading in similar securities of the issuer or comparable companies; and the existence of a shelf registration for restricted securities.
For each portfolio security that has been fair valued pursuant to the policies adopted by the Board of Trustees, the fair value price is compared against the last available and next available market quotations. The Valuation Committee reviews the results of such back testing monthly and fair valuation occurrences are reported to the Board of Trustees quarterly.
The Fund uses valuation techniques to measure fair value that are consistent with the market approach and/or income approach, depending on the type of security and the particular circumstance. The market approach uses prices and other relevant information generated by market transactions involving identical or comparable securities. The income approach uses valuation techniques to discount estimated future cash flows to present value.
GAAP establishes a disclosure hierarchy that categorizes the inputs to valuation techniques used to value assets and liabilities at measurement date. These inputs are summarized in the three broad levels listed below:
| • | | Level 1 — unadjusted quoted prices in active markets for identical investments |
| • | | Level 2 — other significant observable inputs (including quoted prices for similar investments, interest rates, prepayment speeds, credit risk, etc.) |
| • | | Level 3 — significant unobservable inputs (including the Fund’s own assumptions in determining the fair value of investments) |
The inputs or methodologies used to value securities are not necessarily an indication of the risk associated with investing in those securities.
| | | | |
| Franklin U.S. Small Cap Equity Fund 2023 Annual Report | | | | 33 |
Notes to financial statements (cont’d)
The following is a summary of the inputs used in valuing the Fund’s assets carried at fair value:
| | | | | | | | | | | | | | | | |
| | | ASSETS | | | | | | | |
| Description | | Quoted Prices (Level 1) | | | Other Significant Observable Inputs (Level 2) | | | Significant Unobservable Inputs (Level 3) | | | Total | |
| Long-Term Investments†: | | | | | | | | | | | | | | | | |
Common Stocks: | | | | | | | | | | | | | | | | |
Health Care | | $ | 14,028,485 | | | | — | | | $ | 29,591 | | | $ | 14,058,076 | |
Industrials | | | 16,443,429 | | | | — | | | | 0 | * | | | 16,443,429 | |
Other Common Stocks | | | 63,467,972 | | | | — | | | | — | | | | 63,467,972 | |
| Total Long-Term Investments | | | 93,939,886 | | | | — | | | | 29,591 | | | | 93,969,477 | |
| Short-Term Investments† | | | 1,056,066 | | | | — | | | | — | | | | 1,056,066 | |
| Total Investments | | $ | 94,995,952 | | | | — | | | $ | 29,591 | | | $ | 95,025,543 | |
| † | See Schedule of Investments for additional detailed categorizations. |
| * | Amount represents less than $1. |
(b) Foreign investment risks. The Fund’s investments in foreign securities may involve risks not present in domestic investments. Since securities may be denominated in foreign currencies, may require settlement in foreign currencies or may pay interest or dividends in foreign currencies, changes in the relationship of these foreign currencies to the U.S. dollar can significantly affect the value of the investments and earnings of the Fund. Foreign investments may also subject the Fund to foreign government exchange restrictions, expropriation, taxation or other political, social or economic developments, all of which affect the market and/or credit risk of the investments.
(c) Security transactions and investment income. Security transactions are accounted for on a trade date basis. Interest income (including interest income from payment-in-kind securities) is recorded on the accrual basis. Amortization of premiums and accretion of discounts on debt securities are recorded to interest income over the lives of the respective securities, except for premiums on certain callable debt securities, which are amortized to the earliest call date. Dividend income is recorded on the ex-dividend date for dividends received in cash and/or securities. Foreign dividend income is recorded on the ex-dividend date or as soon as practicable after the Fund determines the existence of a dividend declaration after exercising reasonable due diligence. The cost of investments sold is determined by use of the specific identification method. To the extent any issuer defaults or a credit event occurs that impacts the issuer, the Fund may halt any additional interest income accruals and consider the realizability of interest accrued up to the date of default or credit event.
(d) REIT distributions. The character of distributions received from Real Estate Investment Trusts (‘‘REITs’’) held by the Fund is generally comprised of net investment income, capital gains, and return of capital. It is the policy of the Fund to estimate the character of distributions received from underlying REITs based on historical data provided by the REITs. After each calendar year end, REITs report the actual tax character of these distributions.
| | | | |
| 34 | | | | Franklin U.S. Small Cap Equity Fund 2023 Annual Report |
Differences between the estimated and actual amounts reported by the REITs are reflected in the Fund’s records in the year in which they are reported by the REITs by adjusting related investment cost basis, capital gains and income, as necessary.
(e) Distributions to shareholders. Distributions from net investment income and distributions of net realized gains, if any, are declared at least annually. Distributions to shareholders of the Fund are recorded on the ex-dividend date and are determined in accordance with income tax regulations, which may differ from GAAP.
(f) Share class accounting. Investment income, common expenses and realized/ unrealized gains (losses) on investments are allocated to the various classes of the Fund on the basis of daily net assets of each class. Fees relating to a specific class are charged directly to that share class.
(g) Compensating balance arrangements. The Fund has an arrangement with its custodian bank whereby a portion of the custodian’s fees is paid indirectly by credits earned on the Fund’s cash on deposit with the bank.
(h) Federal and other taxes. It is the Fund’s policy to comply with the federal income and excise tax requirements of the Internal Revenue Code of 1986 (the “Code”), as amended, applicable to regulated investment companies. Accordingly, the Fund intends to distribute its taxable income and net realized gains, if any, to shareholders in accordance with timing requirements imposed by the Code. Therefore, no federal or state income tax provision is required in the Fund’s financial statements.
Management has analyzed the Fund’s tax positions taken on income tax returns for all open tax years and has concluded that as of December 31, 2023, no provision for income tax is required in the Fund’s financial statements. The Fund’s federal and state income and federal excise tax returns for tax years for which the applicable statutes of limitations have not expired are subject to examination by the Internal Revenue Service and state departments of revenue.
Under the applicable foreign tax laws, a withholding tax may be imposed on interest, dividends and capital gains at various rates.
(i) Reclassification. GAAP requires that certain components of net assets be reclassified to reflect permanent differences between financial and tax reporting. These reclassifications have no effect on net assets or net asset value per share. During the current year, the following reclassifications have been made:
| | | | | | | | |
| | | Total Distributable Earnings (Loss) | | | Paid-in Capital | |
| (a) | | $ | (339,708) | | | $ | 339,708 | |
| (a) | Reclassifications are due to distributions paid in connection with the redemption of Fund shares. |
2. Investment management agreement and other transactions with affiliates
Franklin Templeton Fund Adviser, LLC (“FTFA”) (formerly known as Legg Mason Partners Fund Advisor, LLC (“LMPFA”) prior to November 30, 2023) is the Fund’s investment manager.
| | | | |
| Franklin U.S. Small Cap Equity Fund 2023 Annual Report | | | | 35 |
Notes to financial statements (cont’d)
Franklin Advisers, Inc. (“Franklin Advisers”) is the Fund’s subadviser. Western Asset Management Company, LLC (“Western Asset”) manages the portion of the Fund’s cash and short-term instruments allocated to it. FTFA, Franklin Advisers and Western Asset are wholly-owned subsidiaries of Franklin Resources, Inc. (“Franklin Resources”).
Under the investment management agreement, the Fund pays an investment management fee, calculated daily and paid monthly, at an annual rate of 0.70% of the Fund’s average daily net assets.
FTFA provides administrative and certain oversight services to the Fund. FTFA delegates to the subadviser the day-to-day portfolio management of the Fund, except for the management of the portion of the cash and short-term instruments allocated to Western Asset. To the extent FTFA receives a management fee after taking into account its contractual obligation to limit expenses as discussed below, FTFA pays Franklin Advisers monthly the entire management fee it receives from the Fund, net of any fees paid to Western Asset. For Western Asset’s services to the Fund, FTFA pays Western Asset monthly 0.02% of the portion of the Fund’s average daily net assets that are allocated to Western Asset by FTFA.
As a result of expense limitation arrangements between the Fund and FTFA, the ratio of total annual fund operating expenses, other than interest, brokerage commissions, dividend expense on short sales, taxes, extraordinary expenses and acquired fund fees and expenses, to average net assets of Class A, Class C, Class FI, Class I and Class IS shares did not exceed 1.30%, 2.05%, 1.30%, 1.00% and 0.75%, respectively. In addition, the ratio of total annual fund operating expenses for Class IS shares did not exceed the ratio of total annual fund operating expenses for Class I shares. These expense limitation arrangements cannot be terminated prior to December 31, 2025 without the Board of Trustees’ consent.
As a result of voluntary expense limitation arrangements, the ratio of total annual fund operating expenses, other than interest, brokerage commissions, dividend expense on short sales, taxes, extraordinary expenses and acquired fund fees and expenses, to average net assets did not exceed 1.20%, 1.95%, 1.20% and 0.90% for Class A, Class C, Class FI and Class I shares, respectively. These arrangements are expected to continue until December 31, 2025, but may be terminated at any time by FTFA.
During the year ended December 31, 2023, fees waived and/or expenses reimbursed amounted to $209,241.
FTFA is permitted to recapture amounts waived and/or reimbursed to a class within three years after the fiscal year in which FTFA earned the fee or incurred the expense if the class’ total annual fund operating expenses have fallen to a level below the expense limitation (“expense cap”) in effect at the time the fees were earned or the expenses incurred. In no case will FTFA recapture any amount that would result, on any particular business day of the Fund, in the class’ total annual fund operating expenses exceeding the expense cap or any other lower limit then in effect.
| | | | |
| 36 | | | | Franklin U.S. Small Cap Equity Fund 2023 Annual Report |
Pursuant to these arrangements, at December 31, 2023, the Fund had remaining fee waivers and/or expense reimbursements subject to recapture by FTFA and respective dates of expiration as follows:
| | | | | | | | | | | | | | | | | | | | |
| | | Class A | | | Class C | | | Class FI | | | Class I | | | Class IS | |
| Expires December 31, 2024 | | $ | 48,505 | | | $ | 463 | | | $ | 119 | | | $ | 4,886 | | | $ | 109,106 | |
| Expires December 31, 2025 | | | 95,430 | | | | 428 | | | | 109 | | | | 3,753 | | | | 93,420 | |
| Expires December 31, 2026 | | | 134,801 | | | | 747 | | | | 84 | | | | 4,198 | | | | 69,411 | |
Total fee waivers/expense
reimbursements subject to recapture | | $ | 278,736 | | | $ | 1,638 | | | $ | 312 | | | $ | 12,837 | | | $ | 271,937 | |
For the year ended December 31, 2023, fee waivers and/or expense reimbursements recaptured by FTFA were as follows:
| | | | |
| | | Class C | |
| FTFA recaptured | | $ | 68 | |
Franklin Distributors, LLC (“Franklin Distributors”) serves as the Fund’s sole and exclusive distributor. Franklin Distributors is an indirect, wholly-owned broker-dealer subsidiary of Franklin Resources. Franklin Templeton Investor Services, LLC (“Investor Services”) serves as the Fund’s shareholder servicing agent and acts as the Fund’s transfer agent and dividend-paying agent. Investor Services is an indirect, wholly-owned subsidiary of Franklin Resources. Each class of shares of the Fund pays transfer agent fees to Investor Services for its performance of shareholder servicing obligations. Investor Services charges account-based fees based on the number of individual shareholder accounts, as well as a fixed percentage fee based on the total account-based fees charged. In addition, each class reimburses Investor Services for out of pocket expenses incurred. For the year ended December 31, 2023, the Fund incurred transfer agent fees as reported on the Statement of Operations, of which $3,950 was earned by Investor Services.
There is a maximum initial sales charge of 5.50% for Class A shares. There is a contingent deferred sales charge (“CDSC”) of 1.00% on Class C shares, which applies if redemption occurs within 12 months from purchase payment. In certain cases, Class A shares have a 1.00% CDSC, which applies if redemption occurs within 18 months from purchase payment. This CDSC only applies to those purchases of Class A shares, which, when combined with current holdings of other shares of funds sold by Franklin Distributors, equal or exceed $1,000,000 in the aggregate. These purchases do not incur an initial sales charge.
For the year ended December 31, 2023, sales charges retained by and CDSCs paid to Franklin Distributors and its affiliates, if any, were as follows:
| | | | |
| | | Class A | |
| Sales charges | | $ | 13,134 | |
| CDSCs | | | 139 | |
Under a Deferred Compensation Plan (the “Plan”), Trustees may have elected to defer receipt of all or a specified portion of their compensation. A participating Trustee selected one or more funds managed by FTFA or an affiliate of FTFA in which his or her deferred
| | | | |
| Franklin U.S. Small Cap Equity Fund 2023 Annual Report | | | | 37 |
Notes to financial statements (cont’d)
trustee’s fees were deemed to be invested. Until distributed in accordance with the Plan, deferred amounts remain in the Fund and are included in Trustees’ fee payable on the Statement of Assets and Liabilities. In May 2015, the Board of Trustees approved an amendment to the Plan so that effective January 1, 2016, no compensation earned after that date may be deferred under the Plan.
All officers and one Trustee of the Trust are employees of Franklin Resources or its affiliates and do not receive compensation from the Trust.
As of December 31, 2023, Franklin Resources and its affiliates owned 28% of the Fund.
3. Investments
During the year ended December 31, 2023, the aggregate cost of purchases and proceeds from sales of investments (excluding short-term investments) were as follows:
| | | | |
| Purchases | | $ | 31,480,289 | |
| Sales | | | 54,089,143 | |
At December 31, 2023, the aggregate cost of investments and the aggregate gross unrealized appreciation and depreciation of investments for federal income tax purposes were as follows:
| | | | | | | | | | | | | | | | |
| | | Cost | | | Gross Unrealized Appreciation | | | Gross Unrealized Depreciation | | | Net Unrealized Appreciation | |
| Securities | | $ | 80,508,964 | | | $ | 27,552,483 | | | $ | (13,035,904) | | | $ | 14,516,579 | |
4. Derivative instruments and hedging activities
During the year ended December 31, 2023, the Fund did not invest in derivative instruments.
5. Class specific expenses, waivers and/or expense reimbursements
The Fund has adopted a Rule 12b-1 shareholder services and distribution plan and under that plan the Fund pays service and/or distribution fees with respect to its Class A, Class C and Class FI shares calculated at the annual rate of 0.25%, 1.00% and 0.25% of the average daily net assets of each class, respectively. Service and/or distribution fees are accrued daily and paid monthly.
For the year ended December 31, 2023, class specific expenses were as follows:
| | | | | | | | |
| | | Service and/or Distribution Fees | | | Transfer Agent Fees | |
| Class A | | $ | 142,797 | | | $ | 132,534 | |
| Class C | | | 3,864 | | | | 665 | |
| Class FI | | | 44 | | | | 85 | |
| Class I | | | — | | | | 3,238 | |
| Class IS | | | — | | | | 248 | |
| Total | | $ | 146,705 | | | $ | 136,770 | |
| | | | |
| 38 | | | | Franklin U.S. Small Cap Equity Fund 2023 Annual Report |
For the year ended December 31, 2023, waivers and/or expense reimbursements by class were as follows:
| | | | |
| | | Waivers/Expense Reimbursements | |
| Class A | | $ | 134,801 | |
| Class C | | | 747 | |
| Class FI | | | 84 | |
| Class I | | | 4,198 | |
| Class IS | | | 69,411 | |
| Total | | $ | 209,241 | |
6. Distributions to shareholders by class
| | | | | | | | |
| | | Year Ended December 31, 2023 | | | Year Ended December 31, 2022 | |
| Net Investment Income: | | | | | | | | |
| Class A | | $ | 58,954 | | | $ | 196,777 | |
| Class C | | | — | | | | — | |
| Class FI | | | 23 | | | | 48 | |
| Class I | | | 7,563 | | | | 10,333 | |
| Class IS | | | 133,467 | | | | 582,848 | |
| Total | | $ | 200,007 | | | $ | 790,006 | |
| | |
| Net Realized Gains: | | | | | | | | |
| Class A | | $ | 2,183,808 | | | $ | 2,566,693 | |
| Class C | | | 15,994 | | | | 18,416 | |
| Class FI | | | 724 | | | | 848 | |
| Class I | | | 65,686 | | | | 74,650 | |
| Class IS | | | 1,197,152 | | | | 2,267,499 | |
| Total | | $ | 3,463,364 | | | $ | 4,928,106 | |
7. Shares of beneficial interest
At December 31, 2023, the Trust had an unlimited number of shares of beneficial interest authorized with a par value of $0.00001 per share. The Fund has the ability to issue multiple classes of shares. Each class of shares represents an identical interest and has the same rights, except that each class bears certain direct expenses, including those specifically related to the distribution of its shares.
| | | | |
| Franklin U.S. Small Cap Equity Fund 2023 Annual Report | | | | 39 |
Notes to financial statements (cont’d)
Transactions in shares of each class were as follows:
| | | | | | | | | | | | | | | | |
| | | Year Ended
December 31, 2023 | | | Year Ended
December 31, 2022 | |
| | | Shares | | | Amount | | | Shares | | | Amount | |
| Class A | | | | | | | | | | | | | | | | |
| Shares sold | | | 549,422 | | | $ | 6,288,217 | | | | 530,016 | | | $ | 6,387,034 | |
| Shares issued on reinvestment | | | 185,855 | | | | 2,235,095 | | | | 254,280 | | | | 2,752,178 | |
| Shares repurchased | | | (678,293) | | | | (7,717,118) | | | | (707,828) | | | | (8,435,125) | |
| Net increase | | | 56,984 | | | $ | 806,194 | | | | 76,468 | | | $ | 704,087 | |
| | | | |
| Class C | | | | | | | | | | | | | | | | |
| Shares sold | | | 15,761 | | | $ | 161,038 | | | | 21,032 | | | $ | 221,665 | |
| Shares issued on reinvestment | | | 1,540 | | | | 15,988 | | | | 1,935 | | | | 18,360 | |
| Shares repurchased | | | (11,351) | | | | (111,332) | | | | (11,878) | | | | (126,649) | |
| Net increase | | | 5,950 | | | $ | 65,694 | | | | 11,089 | | | $ | 113,376 | |
| | | | |
| Class FI | | | | | | | | | | | | | | | | |
| Shares sold | | | 210 | | | $ | 2,206 | | | | 139 | | | $ | 1,480 | |
| Shares issued on reinvestment | | | 67 | | | | 747 | | | | 88 | | | | 896 | |
| Shares repurchased | | | (305) | | | | (3,189) | | | | (245) | | | | (2,592) | |
| Net decrease | | | (28) | | | $ | (236) | | | | (18) | | | $ | (216) | |
| | | | |
| Class I | | | | | | | | | | | | | | | | |
| Shares sold | | | 57,090 | | | $ | 682,543 | | | | 4,211 | | | $ | 51,304 | |
| Shares issued on reinvestment | | | 5,670 | | | | 71,127 | | | | 7,433 | | | | 83,511 | |
| Shares repurchased | | | (36,268) | | | | (424,767) | | | | (35,949) | | | | (433,135) | |
| Net increase (decrease) | | | 26,492 | | | $ | 328,903 | | | | (24,305) | | | $ | (298,320) | |
| | | | |
| Class IS | | | | | | | | | | | | | | | | |
| Shares sold | | | 299,067 | | | $ | 3,275,200 | | | | 313,756 | | | $ | 3,524,641 | |
| Shares issued on reinvestment | | | 111,711 | | | | 1,330,618 | | | | 264,806 | | | | 2,850,347 | |
| Shares repurchased | | | (2,139,337) | | | | (25,616,613) | | | | (2,278,426) | | | | (25,409,596) | |
| Shares redeemed in-kind | | | — | | | | — | | | | (2,998,916) | | | | (37,396,485) | |
| Net decrease | | | (1,728,559) | | | $ | (21,010,795) | | | | (4,698,780) | | | $ | (56,431,093) | |
8. Redemption facility
The Fund, together with other U.S. registered and foreign investment funds (collectively, the “Borrowers”) managed by Franklin Resources or its affiliates, is a borrower in a joint syndicated senior unsecured credit facility totaling $2.675 billion (the “Global Credit Facility”). The Global Credit Facility provides a source of funds to the Borrowers for temporary and emergency purposes, including the ability to meet future unanticipated or unusually large redemption requests. Unless renewed, the Global Credit Facility will terminate on January 31, 2025.
Under the terms of the Global Credit Facility, the Fund shall, in addition to interest charged on any borrowings made by the Fund and other costs incurred by the Fund, pay its share of fees and expenses incurred in connection with the implementation and maintenance of the Global Credit Facility, based upon its relative share of the aggregate net assets of all the Borrowers, including an annual commitment fee of 0.15% based upon the unused portion of
| | | | |
| 40 | | | | Franklin U.S. Small Cap Equity Fund 2023 Annual Report |
the Global Credit Facility. These fees are reflected in the Statement of Operations. The Fund did not utilize the Global Credit Facility during the year ended December 31, 2023.
9. Redemptions in-kind
The Fund may make payment for Fund shares redeemed wholly or in part by distributing portfolio securities to shareholders. For the year ended December 31, 2023, the Fund had no redemptions in-kind. For the year ended December 31, 2022, the Fund had redemptions in-kind with total proceeds in the amount of $37,396,485. The net realized gain on these redemptions in-kind amounted to $6,152,307, which was not realized for tax purposes.
10. Income tax information and distributions to shareholders
The tax character of distributions paid during the fiscal years ended December 31, was as follows:
| | | | | | | | |
| | | 2023 | | | 2022 | |
| Distributions paid from: | | | | | | | | |
| Ordinary income | | $ | 398,856 | | | $ | 790,006 | |
| Net long-term capital gains | | | 3,264,515 | | | | 4,928,106 | |
| Total distributions paid | | $ | 3,663,371 | | | $ | 5,718,112 | |
As of December 31, 2023, the components of distributable earnings (loss) on a tax basis were as follows:
| | | | |
| Undistributed ordinary income — net | | $ | 364,913 | |
| Deferred capital losses* | | | (299,708 | ) |
| Other book/tax temporary differences(a) | | | (41,601 | ) |
| Unrealized appreciation (depreciation)(b) | | | 14,516,579 | |
| Total distributable earnings (loss) — net | | $ | 14,540,183 | |
| * | These capital losses have been deferred in the current year as either short-term or long-term losses. The losses will be deemed to occur on the first day of the next taxable year in the same character as they were originally deferred and will be available to offset future taxable capital gains. |
| (a) | Other book/tax temporary differences are attributable to book/tax differences in the timing of the deductibility of various expenses. |
| (b) | The difference between book-basis and tax-basis unrealized appreciation (depreciation) is attributable to the tax deferral of losses on wash sales and the realization for tax purposes of unrealized gains on investments in passive foreign investment companies. |
11. Recent accounting pronouncement
In June 2022, the Financial Accounting Standards Board (FASB) issued Accounting Standards Update (ASU) No. 2022-03, Fair Value Measurement (Topic 820) — Fair Value Measurement of Equity Securities Subject to Contractual Sale Restrictions. The amendments in the ASU clarify that a contractual restriction on the sale of an equity security is not considered part of the unit of account of the equity security and, therefore, should not be considered in measuring fair value. The ASU is effective for interim and annual reporting periods beginning after December 15, 2023, with the option of early adoption. Management has reviewed the requirements and believes that the adoption of the ASU will not have a material impact on the financial statements.
| | | | |
| Franklin U.S. Small Cap Equity Fund 2023 Annual Report | | | | 41 |
Report of independent registered public accounting firm
To the Board of Trustees of Legg Mason Global Asset Management Trust and Shareholders of Franklin U.S. Small Cap Equity Fund
Opinion on the Financial Statements
We have audited the accompanying statement of assets and liabilities, including the schedule of investments, of Franklin U.S. Small Cap Equity Fund (one of the funds constituting Legg Mason Global Asset Management Trust, referred to hereafter as the “Fund”) as of December 31, 2023, the related statement of operations for the year ended December 31, 2023, the statement of changes in net assets for each of the two years in the period ended December 31, 2023, including the related notes, and the financial highlights for each of the five years in the period ended December 31, 2023 (collectively referred to as the “financial statements”). In our opinion, the financial statements present fairly, in all material respects, the financial position of the Fund as of December 31, 2023, the results of its operations for the year then ended, the changes in its net assets for each of the two years in the period ended December 31, 2023 and the financial highlights for each of the five years in the period ended December 31, 2023 in conformity with accounting principles generally accepted in the United States of America.
Basis for Opinion
These financial statements are the responsibility of the Fund’s management. Our responsibility is to express an opinion on the Fund’s financial statements based on our audits. We are a public accounting firm registered with the Public Company Accounting Oversight Board (United States) (PCAOB) and are required to be independent with respect to the Fund in accordance with the U.S. federal securities laws and the applicable rules and regulations of the Securities and Exchange Commission and the PCAOB.
We conducted our audits of these financial statements in accordance with the standards of the PCAOB. Those standards require that we plan and perform the audit to obtain reasonable assurance about whether the financial statements are free of material misstatement, whether due to error or fraud.
Our audits included performing procedures to assess the risks of material misstatement of the financial statements, whether due to error or fraud, and performing procedures that respond to those risks. Such procedures included examining, on a test basis, evidence regarding the amounts and disclosures in the financial statements. Our audits also included evaluating the accounting principles used and significant estimates made by management, as well as evaluating the overall presentation of the financial statements. Our procedures included confirmation of securities owned as of December 31, 2023 by correspondence with the custodian. We believe that our audits provide a reasonable basis for our opinion.
/s/PricewaterhouseCoopers LLP
Baltimore, Maryland
February 13, 2024
We have served as the auditor of one or more investment companies in the Franklin Templeton Group of Funds since 1948.
| | | | |
| 42 | | | | Franklin U.S. Small Cap Equity Fund 2023 Annual Report |
Additional information (unaudited)
Information about Trustees and Officers
The business and affairs of Franklin U.S. Small Cap Equity Fund (the “Fund”) are conducted by management under the supervision and subject to the direction of its Board of Trustees. The business address of each Trustee is c/o Jane Trust, Franklin Templeton, 280 Park Avenue, 8th Floor, New York, New York 10017.
Information pertaining to the Trustees and officers of the Fund is set forth below. The Statement of Additional Information includes additional information about Trustees and is available, without charge, upon request by calling the Fund at 877-6LM-FUND/656-3863.
| | |
| Independent Trustees† |
| |
| Andrew L. Breech | | |
| |
| Year of birth | | 1952 |
| Position(s) with Trust | | Trustee |
| Term of office1 and length of time served2 | | Since 1991 |
| Principal occupation(s) during the past five years | | President, Dealer Operating Control Service, Inc. (automotive retail management) (since 1985) |
| Number of funds in fund complex overseen by Trustee | | 55 |
| Other board memberships held by Trustee during the past five years | | None |
| |
| Althea L. Duersten* | | |
| |
| Year of birth | | 1951 |
| Position(s) with Trust | | Trustee and Chair of the Board |
| Term of office1 and length of time served2 | | Since 2014 (Chair of the Board since 2021) |
| Principal occupation(s) during the past five years | | Retired (since 2011); formerly, Chief Investment Officer, North America, JPMorgan Chase (investment bank) and member of JPMorgan Executive Committee (2007 to 2011) |
| Number of funds in fund complex overseen by Trustee | | 55 |
| Other board memberships held by Trustee during the past five years | | Formerly, Non-Executive Director, Rokos Capital Management LLP (2019 to 2020) |
| |
| Stephen R. Gross | | |
| |
| Year of birth | | 1947 |
| Position(s) with Trust | | Trustee |
| Term of office1 and length of time served2 | | Since 1986 |
| Principal occupation(s) during the past five years | | Chairman Emeritus (since 2011) and formerly, Chairman, HLB Gross Collins, P.C. (accounting and consulting firm) (1979 to 2011); Executive Director of Business Builders Team, LLC (since 2005); Principal, Gross Consulting Group, LLC (since 2011); CEO, Gross Capital Partners, LLC (since 2014); CEO, Trusted CFO Solutions, LLC (since 2011) |
| Number of funds in fund complex overseen by Trustee | | 55 |
| Other board memberships held by Trustee during the past five years | | None |
| | | | |
| Franklin U.S. Small Cap Equity Fund | | | | 43 |
Additional information (unaudited) (cont’d)
Information about Trustees and Officers
| | |
| Independent Trustees† (cont’d) | | |
| |
| Susan M. Heilbron | | |
| |
| Year of birth | | 1945 |
| Position(s) with Trust | | Trustee |
| Term of office1 and length of time served2 | | Since 1991 |
| Principal occupation(s) during the past five years | | Retired; formerly, President, Lacey & Heilbron (communications consulting) (1990 to 2002); General Counsel and Executive Vice President, The Trump Organization (1986 to 1990); Senior Vice President, New York State Urban Development Corporation (1984 to 1986); Associate, Cravath, Swaine & Moore LLP (1980 to 1984 and 1977 to 1979) |
| Number of funds in fund complex overseen by Trustee | | 55 |
| Other board memberships held by Trustee during the past five years | | None |
| |
| Arnold L. Lehman | | |
| |
| Year of birth | | 1944 |
| Position(s) with Trust | | Trustee |
| Term of office1 and length of time served2 | | Since 1982 |
| Principal occupation(s) during the past five years | | Senior Advisor, Phillips (auction house) (since 2015); formerly, Fellow, Ford Foundation (2015 to 2016); Director of the Brooklyn Museum (1997 to 2015) |
| Number of funds in fund complex overseen by Trustee | | 55 |
| Other board memberships held by Trustee during the past five years | | Trustee of American Federation of Arts (since 2002) |
| |
| Robin J. W. Masters | | |
| |
| Year of birth | | 1955 |
| Position(s) with Trust | | Trustee |
| Term of office1 and length of time served2 | | Since 2002 |
| Principal occupation(s) during the past five years | | Retired; formerly, Chief Investment Officer of ACE Limited (insurance) (1986 to 2000) |
| Number of funds in fund complex overseen by Trustee | | 55 |
| Other board memberships held by Trustee during the past five years | | Director of HSBC Corporate Money Funds Limited, HSBC Managed Portfolios Limited and HSBC Specialist Funds Limited (since 2020); formerly, Director of Cheyne Capital International Limited (investment advisory firm) (2005 to 2020) |
| |
| Ken Miller | | |
| |
| Year of birth | | 1942 |
| Position(s) with Trust | | Trustee |
| Term of office1 and length of time served2 | | Since 1983 |
| Principal occupation(s) during the past five years | | Retired; formerly, President, Young Stuff Apparel Group, Inc. (apparel manufacturer), division of Li & Fung (1963 to 2012) |
| Number of funds in fund complex overseen by Trustee | | 55 |
| Other board memberships held by Trustee during the past five years | | None |
| | | | |
| 44 | | | | Franklin U.S. Small Cap Equity Fund |
| | |
| Independent Trustees† (cont’d) |
| |
| G. Peter O’Brien** | | |
| Year of birth | | 1945 |
| Position(s) with Trust | | Trustee |
| Term of office1 and length of time served2 | | Since 1999 |
| Principal occupation(s) during the past five years | | Retired, Trustee Emeritus of Colgate University (since 2005); Board Member, Hill House, Inc. (residential home care) (since 1999); formerly, Board Member, Bridges School (pre-school) (2006 to 2017); Managing Director, Equity Capital Markets Group of Merrill Lynch & Co. (1971 to 1999) |
| Number of funds in fund complex overseen by Trustee | | Trustee of Legg Mason funds consisting of 55 portfolios; Director/Trustee of the Royce Family of Funds consisting of 16 portfolios |
| Other board memberships held by Trustee during the past five years | | Formerly, Director of TICC Capital Corp. (2003 to 2017) |
| |
| Thomas F. Schlafly | | |
| |
| Year of birth | | 1948 |
| Position(s) with Trust | | Trustee |
| Term of office1 and length of time served2 | | Since 1983 |
| Principal occupation(s) during the past five years | | Chairman, The Saint Louis Brewery, LLC (brewery) (since 2012); formerly, President, The Saint Louis Brewery, Inc. (1989 to 2012); Senior Counsel (since 2017) and formerly, Partner (2009 to 2016), Thompson Coburn LLP (law firm) |
| Number of funds in fund complex overseen by Trustee | | 55 |
| Other board memberships held by Trustee during the past five years | | Director, CNB St. Louis Bank (since 2020); formerly, Director, Citizens National Bank of Greater St. Louis (2006 to 2020) |
| | |
| Interested Trustee and Officer |
| |
| Jane Trust, CFA3 | | |
| |
| Year of birth | | 1962 |
| Position(s) with Trust | | Trustee, President and Chief Executive Officer |
| Term of office1 and length of time served2 | | Since 2015 |
| Principal occupation(s) during the past five years | | Senior Vice President, Fund Board Management, Franklin Templeton (since 2020); Officer and/or Trustee/Director of 123 funds associated with FTFA or its affiliates (since 2015); President and Chief Executive Officer of FTFA (since 2015); formerly, Senior Managing Director (2018 to 2020) and Managing Director (2016 to 2018) of Legg Mason & Co., LLC (“Legg Mason & Co.”); and Senior Vice President of FTFA (2015) |
| Number of funds in fund complex overseen by Trustee | | 123 |
| Other board memberships held by Trustee during the past five years | | None |
| | | | |
| Franklin U.S. Small Cap Equity Fund | | | | 45 |
Additional information (unaudited) (cont’d)
Information about Trustees and Officers
| | |
| Additional Officers |
|
Ted P. Becker Franklin Templeton 280 Park Avenue, 8th Floor, New York, NY 10017 |
| |
| Year of birth | | 1951 |
| Position(s) with Trust | | Chief Compliance Officer |
| Term of office1 and length of time served2 | | Since 2007 |
| Principal occupation(s) during the past five years | | Vice President, Global Compliance of Franklin Templeton (since 2020); Chief Compliance Officer of FTFA (since 2006); Chief Compliance Officer of certain funds associated with Legg Mason & Co. or its affiliates (since 2006); formerly, Director of Global Compliance at Legg Mason, Inc. (2006 to 2020); Managing Director of Compliance of Legg Mason & Co. (2005 to 2020) |
|
Susan Kerr Franklin Templeton 280 Park Avenue, 8th Floor, New York, NY 10017 |
| |
| Year of birth | | 1949 |
| Position(s) with Trust | | Chief Anti-Money Laundering Compliance Officer |
| Term of office1 and length of time served2 | | Since 2013 |
| Principal occupation(s) during the past five years | | Senior Compliance Analyst, Franklin Templeton (since 2020); Chief Anti-Money Laundering Compliance Officer of certain funds associated with Legg Mason & Co. or its affiliates (since 2013) and Anti-Money Laundering Compliance Officer (since 2012), Senior Compliance Officer (since 2011) and Assistant Vice President (since 2010) of Franklin Distributors, LLC; formerly, Assistant Vice President of Legg Mason & Co. (2010 to 2020) |
|
Marc A. De Oliveira Franklin Templeton 100 First Stamford Place, 6th Floor, Stamford, CT 06902 |
| |
| Year of birth | | 1971 |
| Position(s) with Trust | | Secretary and Chief Legal Officer |
| Term of office1 and length of time served2 | | Since 2020 |
| Principal occupation(s) during the past five years | | Associate General Counsel of Franklin Templeton (since 2020); Assistant Secretary of certain funds associated with Legg Mason & Co. or its affiliates (since 2006); formerly, Managing Director (2016 to 2020) and Associate General Counsel of Legg Mason & Co. (2005 to 2020) |
| | | | |
| 46 | | | | Franklin U.S. Small Cap Equity Fund |
| | |
| Additional Officers (cont’d) |
|
Thomas C. Mandia
Franklin Templeton
100 First Stamford Place, 6th Floor, Stamford, CT 06902 |
| |
| Year of birth | | 1962 |
| Position(s) with Trust | | Senior Vice President |
| Term of office1 and length of time served2 | | Since 2020 |
| Principal occupation(s) during the past five years | | Senior Associate General Counsel of Franklin Templeton (since 2020); Secretary of FTFA (since 2006); Assistant Secretary of certain funds associated with Legg Mason & Co. or its affiliates (since 2006); Secretary of LM Asset Services, LLC (“LMAS”) (since 2002) and Legg Mason Fund Asset Management, Inc. (“LMFAM”) (since 2013) (formerly registered investment advisers); formerly, Managing Director and Deputy General Counsel of Legg Mason & Co. (2005 to 2020) |
|
Christopher Berarducci Franklin Templeton 280 Park Avenue, 8th Floor, New York, NY 10017 |
| |
| Year of birth | | 1974 |
| Position(s) with Trust | | Treasurer and Principal Financial Officer |
| Term of office1 and length of time served2 | | Since 2010 and 2019 |
| Principal occupation(s) during the past five years | | Vice President, Fund Administration and Reporting, Franklin Templeton (since 2020); Treasurer (since 2010) and Principal Financial Officer (since 2019) of certain funds associated with Legg Mason & Co. or its affiliates; formerly, Managing Director (2020), Director (2015 to 2020), and Vice President (2011 to 2015) of Legg Mason & Co. |
|
Jeanne M. Kelly Franklin Templeton 280 Park Avenue, 8th Floor, New York, NY 10017 |
| |
| Year of birth | | 1951 |
| Position(s) with Trust | | Senior Vice President |
| Term of office1 and length of time served2 | | Since 2007 |
| Principal occupation(s) during the past five years | | U.S. Fund Board Team Manager, Franklin Templeton (since 2020); Senior Vice President of certain funds associated with Legg Mason & Co. or its affiliates (since 2007); Senior Vice President of FTFA (since 2006); President and Chief Executive Officer of LMAS and LMFAM (since 2015); formerly, Managing Director of Legg Mason & Co. (2005 to 2020); Senior Vice President of LMFAM (2013 to 2015) |
| | FTFA, referenced above, was formerly known as LMPFA prior to November 30, 2023. |
| * | Effective February 7, 2024, Ms. Duersten retired from the Board. |
| ** | Effective February 7, 2024, Mr. O’Brien became Chair of the Board. |
| † | Trustees who are not “interested persons” of the Fund within the meaning of Section 2(a)(19) of the Investment Company Act of 1940, as amended (the “1940 Act”). |
| | | | |
| Franklin U.S. Small Cap Equity Fund | | | | 47 |
Additional information (unaudited) (cont’d)
Information about Trustees and Officers
| 1 | Each Trustee and officer serves until his or her respective successor has been duly elected and qualified or until his or her earlier death, resignation, retirement or removal. |
| 2 | Indicates the earliest year in which the Trustee became a board member for a fund in the Legg Mason fund complex or the officer took such office. |
| 3 | Ms. Trust is an “interested person” of the Fund, as defined in the 1940 Act, because of her position with FTFA and/or certain of its affiliates. |
| | | | |
| 48 | | | | Franklin U.S. Small Cap Equity Fund |
Important tax information (unaudited)
By mid-February, tax information related to a shareholder’s proportionate share of distributions paid during the preceding calendar year will be received, if applicable. Please also refer to www.franklintempleton.com for per share tax information related to any distributions paid during the preceding calendar year. Shareholders are advised to consult with their tax advisors for further information on the treatment of these amounts on their tax returns.
The following tax information for the Fund is required to be furnished to shareholders with respect to income earned and distributions paid during its fiscal year.
The Fund hereby reports the following amounts, or if subsequently determined to be different, the maximum allowable amounts, for the fiscal year ended December 31, 2023:
| | | | | | |
| | | Pursuant to: | | Amount Reported | |
| Long-Term Capital Gain Dividends Distributed | | §852(b)(3)(C) | | | $3,527,091 | |
| Income Eligible for Dividends Received Deduction (DRD) | | §854(b)(1)(A) | | | $1,195,894 | |
| Qualified Dividend Income Earned (QDI) | | §854(b)(1)(B) | | | $1,228,074 | |
| Short-Term Capital Gain Dividends Distributed | | §871(k)(2)(C) | | | $216,605 | |
| Qualified Business Income Dividends Earned | | §199A | | | $117,525 | |
| | | | |
| Franklin U.S. Small Cap Equity Fund | | | | 49 |
Franklin
U.S. Small Cap Equity Fund
Trustees
Andrew L. Breech
Stephen R. Gross
Susan M. Heilbron
Arnold L. Lehman
Robin J.W.Masters
Ken Miller
G. Peter O’Brien*
Chair
Thomas F. Schlafly
Jane Trust
Investment manager
Franklin Templeton Fund Adviser, LLC**
Subadviser
Franklin Advisers, Inc.
Distributor
Franklin Distributors, LLC
Custodian
The Bank of New York Mellon
Transfer agent
Franklin Templeton Investor Services, LLC
3344 Quality Drive
Rancho Cordova, CA 95670-7313
Independent registered public accounting firm
PricewaterhouseCoopers LLP
Baltimore, MD
| * | Effective February 7, 2024, Mr. O’Brien became Chair of the Board. |
| ** | Formerly known as Legg Mason Partners Fund Advisor, LLC. |
Franklin U.S. Small Cap Equity Fund
The Fund is a separate investment series of Legg Mason Global Asset Management Trust, a Maryland statutory trust.
Franklin U.S. Small Cap Equity Fund
Legg Mason Funds
100 International Drive
Baltimore, MD 21202
The Fund files its complete schedule of portfolio holdings with the Securities and Exchange Commission (“SEC”) for the first and third quarters of each fiscal year as an exhibit to its reports on Form N-PORT. The Fund’s Forms N-PORT are available on the SEC’s website at www.sec.gov. To obtain information on Form N-PORT, shareholders can call the Fund at 877-6LM-FUND/656-3863.
Information on how the Fund voted proxies relating to portfolio securities during the prior 12-month period ended June 30th of each year and a description of the policies and procedures that the Fund uses to determine how to vote proxies related to portfolio transactions are available (1) without charge, upon request, by calling the Fund at 877-6LM-FUND/656-3863, (2) at www.franklintempleton.com and (3) on the SEC’s website at www.sec.gov.
This report is submitted for the general information of the shareholders of Franklin U.S. Small Cap Equity Fund. This report is not authorized for distribution to prospective investors in the Fund unless preceded or accompanied by a current prospectus.
Investors should consider the Fund’s investment objectives, risks, charges and expenses carefully before investing. The prospectus contains this and other important information about the Fund. Please read the prospectus carefully before investing.
www.franklintempleton.com
© 2024 Franklin Distributors, LLC, Member FINRA/SIPC. All rights reserved.
Legg Mason Funds Privacy and Security Notice
Your Privacy Is Our Priority
Franklin Templeton* is committed to safeguarding your personal information. This notice is designed to provide you with a summary of the non-public personal information Franklin Templeton may collect and maintain about current or former individual investors; our policy regarding the use of that information; and the measures we take to safeguard the information. We do not sell individual investors’ non-public personal information to anyone and only share it as described in this notice.
Information We Collect
When you invest with us, you provide us with your non-public personal information. We collect and use this information to service your accounts and respond to your requests. The non-public personal information we may collect falls into the following categories:
| • | | Information we receive from you or your financial intermediary on applications or other forms, whether we receive the form in writing or electronically. For example, this information may include your name, address, tax identification number, birth date, investment selection, beneficiary information, and your personal bank account information and/or email address if you have provided that information. |
| • | | Information about your transactions and account history with us, or with other companies that are part of Franklin Templeton, including transactions you request on our website or in our app. This category also includes your communications to us concerning your investments. |
| • | | Information we receive from third parties (for example, to update your address if you move, obtain or verify your email address or obtain additional information to verify your identity). |
| • | | Information collected from you online, such as your IP address or device ID and data gathered from your browsing activity and location. (For example, we may use cookies to collect device and browser information so our website recognizes your online preferences and device information.) Our website contains more information about cookies and similar technologies and ways you may limit them. |
| • | | Other general information that we may obtain about you such as demographic information. |
Disclosure Policy
To better service your accounts and process transactions or services you requested, we may share non-public personal information with other Franklin Templeton companies. From time to time we may also send you information about products/services offered by other Franklin Templeton companies although we will not share your non-public personal information with these companies without first offering you the opportunity to prevent that sharing.
We will only share non-public personal information with outside parties in the limited circumstances permitted by law. For example, this includes situations where we need to share information with companies who work on our behalf to service or maintain your account or
|
| NOT PART OF THE ANNUAL REPORT |
Legg Mason Funds Privacy and Security Notice (cont’d)
process transactions you requested, when the disclosure is to companies assisting us with our own marketing efforts, when the disclosure is to a party representing you, or when required by law (for example, in response to legal process). Additionally, we will ensure that any outside companies working on our behalf, or with whom we have joint marketing agreements, are under contractual obligations to protect the confidentiality of your information, and to use it only to provide the services we asked them to perform.
Confidentiality and Security
Our employees are required to follow procedures with respect to maintaining the confidentiality of our investors’ non-public personal information. Additionally, we maintain physical, electronic and procedural safeguards to protect the information. This includes performing ongoing evaluations of our systems containing investor information and making changes when appropriate.
At all times, you may view our current privacy notice on our website at franklintempleton.com or contact us for a copy at (800) 632-2301.
*For purposes of this privacy notice Franklin Templeton shall refer to the following entities:
Fiduciary Trust International of the South (FTIOS), as custodian for individual retirement plans Franklin Advisers, Inc.
Franklin Distributors, LLC, including as program manager of the Franklin Templeton 529 College Savings Plan and the NJBEST 529 College Savings Plan
Franklin Mutual Advisers, LLC
Franklin, Templeton and Mutual Series Funds
Franklin Templeton Institutional, LLC
Franklin Templeton Investments Corp., Canada
Franklin Templeton Investments Management, Limited UK
Franklin Templeton Portfolio Advisors, Inc.
Legg Mason Funds serviced by Franklin Templeton Investor Services, LLC
Templeton Asset Management, Limited
Templeton Global Advisors, Limited
Templeton Investment Counsel, LLC
If you are a customer of other Franklin Templeton affiliates and you receive notices from them, you will need to read those notices separately.
|
| NOT PART OF THE ANNUAL REPORT |
www.franklintempleton.com
© 2024 Franklin Distributors, LLC, Member FINRA/SIPC. All rights reserved.
LMFX013159 2/24 SR24-4808
The registrant has adopted a code of ethics that applies to the registrant’s principal executive officer, principal financial officer, principal accounting officer or controller.
| ITEM 3. | AUDIT COMMITTEE FINANCIAL EXPERT. |
The Board of Trustees of the registrant has determined that Stephen R. Gross possesses the technical attributes identified in Instruction 2(b) of Item 3 to Form N-CSR to qualify as an “audit committee financial expert,” and has designated Stephen R. Gross as the Audit Committee’s financial expert. Stephen R. Gross is an “independent” Trustees pursuant to paragraph (a)(2) of Item 3 to Form N-CSR.
| ITEM 4. | PRINCIPAL ACCOUNTANT FEES AND SERVICES. |
(a) Audit Fees. The aggregate fees billed in the last two fiscal years ending December 31, 2022 and December 31, 2023 (the “Reporting Periods”) for professional services rendered by the Registrant’s principal accountant (the “Auditor”) for the audit of the Registrant’s annual financial statements, or services that are normally provided by the Auditor in connection with the statutory and regulatory filings or engagements for the Reporting Periods, were $210,621 in December 31, 2022 and $210,621 in December 31, 2023.
(b) Audit-Related Fees. The aggregate fees billed in the Reporting Period for assurance and related services by the Auditor that are reasonably related to the performance of the Registrant’s financial statements were $0 in December 31, 2022 and $0 in December 31, 2023.
(c) Tax Fees. The aggregate fees billed in the Reporting Periods for professional services rendered by the Auditor for tax compliance, tax advice and tax planning (“Tax Services”) were $53,000 in December 31, 2022 and $53,000 in December 31, 2023. These services consisted of (i) review or preparation of U.S. federal, state, local and excise tax returns; (ii) U.S. federal, state and local tax planning, advice and assistance regarding statutory, regulatory or administrative developments, and (iii) tax advice regarding tax qualification matters and/or treatment of various financial instruments held or proposed to be acquired or held.
There were no fees billed for tax services by to the service affiliates during the Reporting Periods that required pre-approval by the Audit Auditors Committee.
(d) All Other Fees. The aggregate fees for other fees billed in the Reporting Periods for products and services provided by the Auditor were $0 in December 31, 2022 and $0 in December 31, 2023, other than the services reported in paragraphs (a) through (c) of this item for the Legg Mason Global Asset Management Trust.
All Other Fees. There were no other non-audit services rendered by the Auditor to Franklin Templeton Fund Adviser, LLC (“FTFA”), and any entity controlling, controlled by or under common control with FTFA that provided ongoing services to Legg Mason Global Asset Management Trust requiring pre-approval by the Audit Committee in the Reporting Period.
(e) Audit Committee’s pre-approval policies and procedures described in paragraph (c) (7) of Rule 2-01 of Regulation S-X.
(1) The Charter for the Audit Committee (the “Committee”) of the Board of each registered investment company (the “Fund”) advised by FTFA or one of their affiliates (each, an “Adviser”) requires that the Committee shall approve (a) all audit and permissible non-audit services to be provided to the Fund and (b) all permissible non-audit services to be provided by the Fund’s independent auditors to the Adviser and any Covered Service Providers if the engagement relates directly to the operations and financial reporting of the Fund. The
Committee may implement policies and procedures by which such services are approved other than by the full Committee.
The Committee shall not approve non-audit services that the Committee believes may impair the independence of the auditors. As of the date of the approval of this Audit Committee Charter, permissible non-audit services include any professional services (including tax services), that are not prohibited services as described below, provided to the Fund by the independent auditors, other than those provided to the Fund in connection with an audit or a review of the financial statements of the Fund. Permissible non-audit services may not include: (i) bookkeeping or other services related to the accounting records or financial statements of the Fund; (ii) financial information systems design and implementation; (iii) appraisal or valuation services, fairness opinions or contribution-in-kind reports; (iv) actuarial services; (v) internal audit outsourcing services; (vi) management functions or human resources; (vii) broker or dealer, investment adviser or investment banking services; (viii) legal services and expert services unrelated to the audit; and (ix) any other service the Public Company Accounting Oversight Board determines, by regulation, is impermissible.
Pre-approval by the Committee of any permissible non-audit services is not required so long as: (i) the aggregate amount of all such permissible non-audit services provided to the Fund, the Adviser and any service providers controlling, controlled by or under common control with the Adviser that provide ongoing services to the Fund (“Covered Service Providers”) constitutes not more than 5% of the total amount of revenues paid to the independent auditors during the fiscal year in which the permissible non-audit services are provided to (a) the Fund, (b) the Adviser and (c) any entity controlling, controlled by or under common control with the Adviser that provides ongoing services to the Fund during the fiscal year in which the services are provided that would have to be approved by the Committee; (ii) the permissible non-audit services were not recognized by the Fund at the time of the engagement to be non-audit services; and (iii) such services are promptly brought to the attention of the Committee and approved by the Committee (or its delegate(s)) prior to the completion of the audit.
(2) None of the services described in paragraphs (b) through (d) of this Item were performed in reliance on paragraph (c)(7)(i)(C) of Rule 2-01 of Regulation S-X.
(f) Not applicable.
(g) Non-audit fees billed by the Auditor for services rendered to Legg Mason Global Asset Management Trust, FTFA and any entity controlling, controlled by, or under common control with FTFA that provides ongoing services to Legg Mason Global Asset Management Trust during the reporting period were $744,135 in December 31, 2022 and $752,124 in December 31, 2023.
(h) Yes. Legg Mason Global Asset Management Trust’s Audit Committee has considered whether the provision of non-audit services that were rendered to Service Affiliates, which were not pre-approved (not requiring pre-approval), is compatible with maintaining the Accountant’s independence. All services provided by the Auditor to the Legg Mason Global Asset Management Trust or to Service Affiliates, which were required to be pre-approved, were pre-approved as required.
(i) Not applicable.
(j) Not applicable.
| ITEM 5. | AUDIT COMMITTEE OF LISTED REGISTRANTS. |
| | a) | The independent board members are acting as the registrant’s audit committee as specified in Section 3(a)(58)(B) of the Exchange Act. The Audit Committee consists of the following Board members: |
Andrew L. Breech
Althea L. Duersten*
Stephen R. Gross
Susan M. Heilbron
Arnold L. Lehman
Robin J. W. Masters
Ken Miller
G. Peter O’Brien
Thomas F. Schlafly
| | * | Effective February 7, 2024, Ms. Duersten retired from the Board. |
| ITEM 6. | SCHEDULE OF INVESTMENTS. |
Included herein under Item 1.
| ITEM 7. | DISCLOSURE OF PROXY VOTING POLICIES AND PROCEDURES FOR CLOSED-END MANAGEMENT INVESTMENT COMPANIES. |
Not applicable.
| ITEM 8. | PORTFOLIO MANAGERS OF CLOSED-END MANAGEMENT INVESTMENT COMPANIES. |
Not applicable.
| ITEM 9. | PURCHASES OF EQUITY SECURITIES BY CLOSED-END MANAGEMENT INVESTMENT COMPANY AND AFFILIATED PURCHASERS. |
Not applicable.
| ITEM 10. | SUBMISSION OF MATTERS TO A VOTE OF SECURITY HOLDERS. |
Not applicable.
| ITEM 11. | CONTROLS AND PROCEDURES. |
| | (a) | The registrant’s principal executive officer and principal financial officer have concluded that the registrant’s disclosure controls and procedures (as defined in Rule 30a- 3(c) under the Investment Company Act of 1940, as amended (the “1940 Act”)) are effective as of a date within 90 days of the filing date of this report that includes the disclosure required by this paragraph, based on their evaluation of the disclosure controls and procedures required by Rule 30a-3(b) under the 1940 Act and 15d-15(b) under the Securities Exchange Act of 1934. |
| | (b) | There were no changes in the registrant’s internal control over financial reporting (as defined in Rule 30a-3(d) under the 1940 Act) that occurred during the period covered by this report that have materially affected, or are likely to materially affect the registrant’s internal control over financial reporting. |
| ITEM 12. | DISCLOSURE OF SECURITIES LENDING ACTIVITIES FOR CLOSED-END MANAGEMENT INVESTMENT COMPANIES. |
Not applicable.
| ITEM 13. | RECOVERY OF ERRONEOUSLY AWARDED COMPENSATION. |
(a) (1) Code of Ethics attached hereto.
Exhibit 99.CODE ETH
(a) (2) Certifications pursuant to section 302 of the Sarbanes-Oxley Act of 2002 attached hereto.
Exhibit 99.CERT
(b) Certifications pursuant to Section 906 of the Sarbanes-Oxley Act of 2002 attached hereto.
Exhibit 99.906CERT
SIGNATURES
Pursuant to the requirements of the Securities Exchange Act of 1934 and the Investment Company Act of 1940, the registrant has duly caused this Report to be signed on its behalf by the undersigned, there unto duly authorized.
| | |
| Legg Mason Global Asset Management Trust |
| |
| By: | | /s/ Jane Trust |
| | Jane Trust |
| | Chief Executive Officer |
| |
| Date: | | February 20, 2024 |
Pursuant to the requirements of the Securities Exchange Act of 1934 and the Investment Company Act of 1940, this report has been signed below by the following persons on behalf of the registrant and in the capacities and on the dates indicated.
| | |
| By: | | /s/ Jane Trust |
| | Jane Trust |
| | Chief Executive Officer |
| |
| Date: | | February 20, 2024 |
| |
| By: | | /s/ Christopher Berarducci |
| | Christopher Berarducci |
| | Principal Financial Officer |
| |
| Date: | | February 20, 2024 |