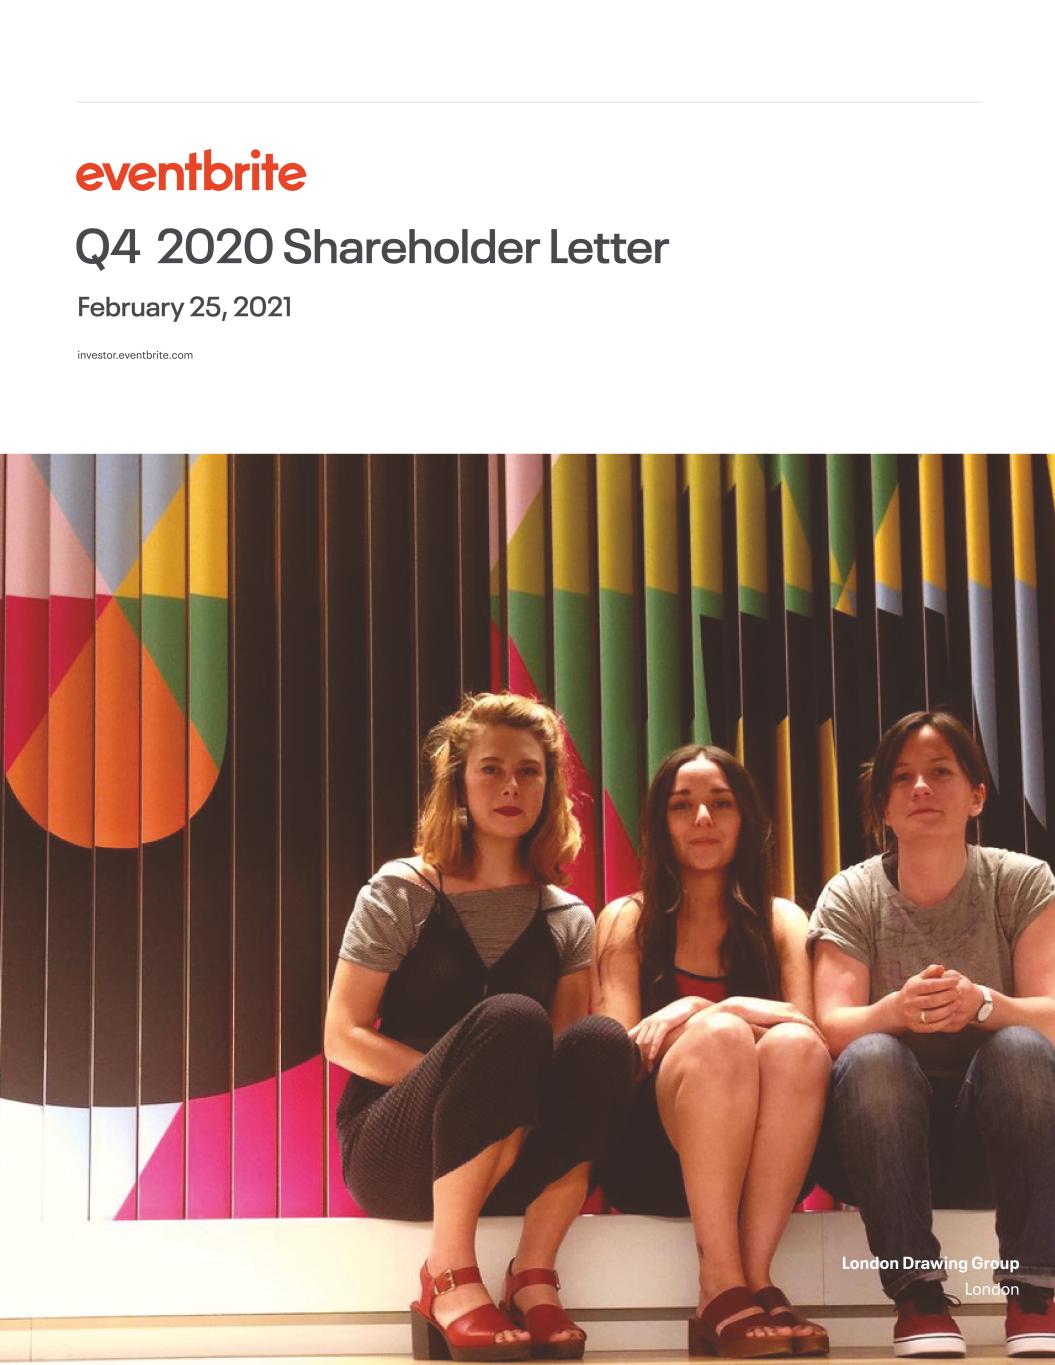
Q4 2020 Shareholder Letter February 25, 2021 investor.eventbrite.com London Drawing Group London
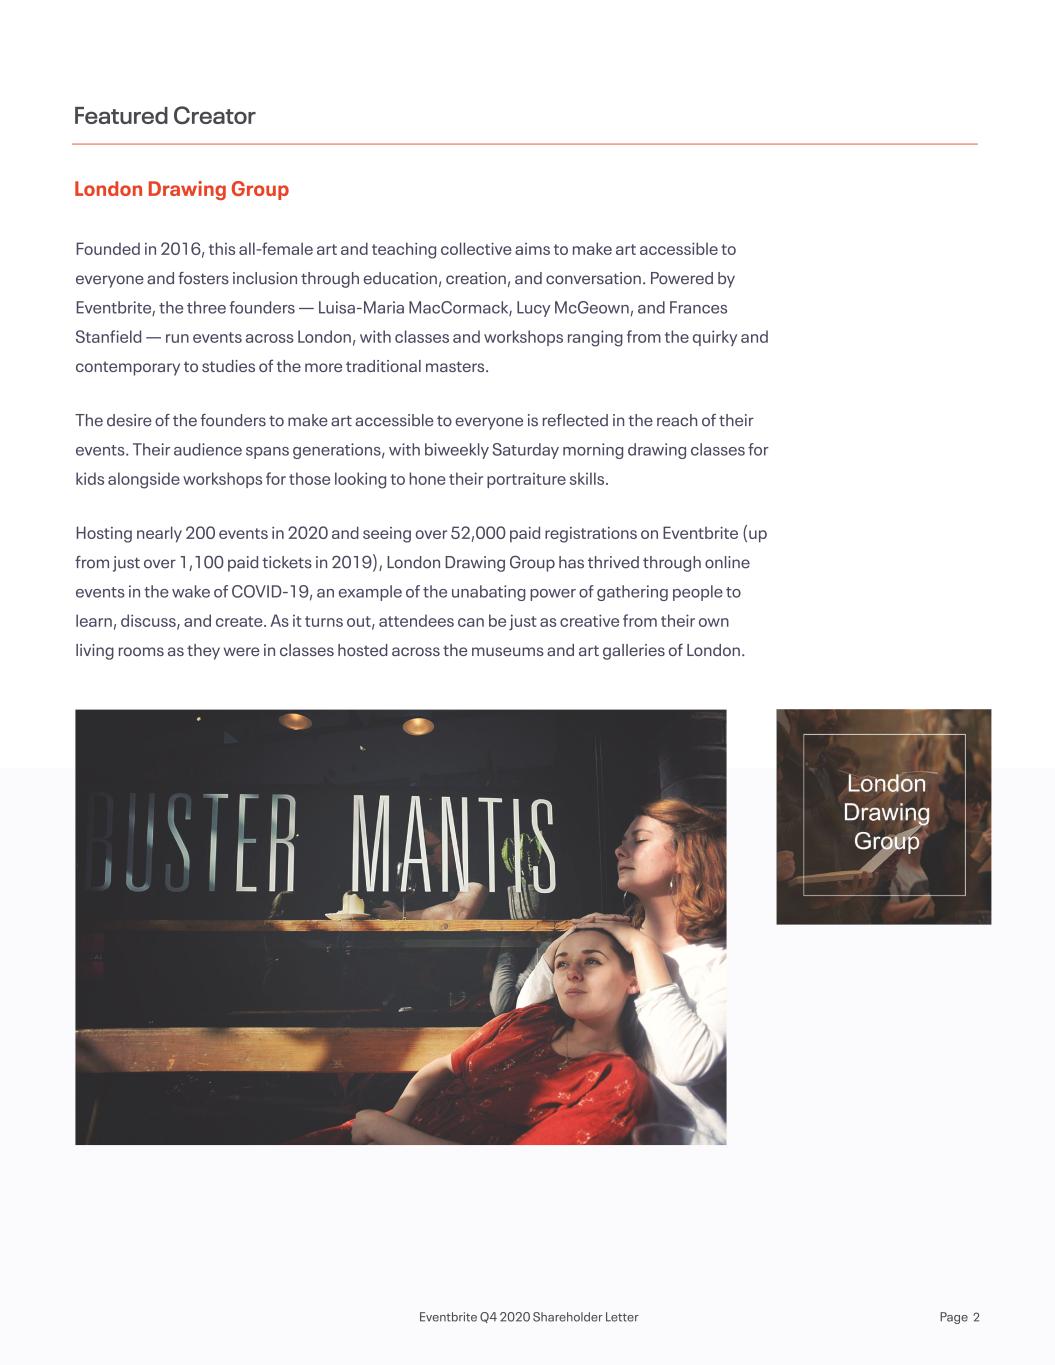
London Drawing Group Featured Creator Founded in 2016, this all-female art and teaching collective aims to make art accessible to everyone and fosters inclusion through education, creation, and conversation. Powered by Eventbrite, the three founders — Luisa-Maria MacCormack, Lucy McGeown, and Frances Stanfield — run events across London, with classes and workshops ranging from the quirky and contemporary to studies of the more traditional masters. The desire of the founders to make art accessible to everyone is reflected in the reach of their events. Their audience spans generations, with biweekly Saturday morning drawing classes for kids alongside workshops for those looking to hone their portraiture skills. Hosting nearly 200 events in 2020 and seeing over 52,000 paid registrations on Eventbrite (up from just over 1,100 paid tickets in 2019), London Drawing Group has thrived through online events in the wake of COVID-19, an example of the unabating power of gathering people to learn, discuss, and create. As it turns out, attendees can be just as creative from their own living rooms as they were in classes hosted across the museums and art galleries of London. Eventbrite Q4 2020 Shareholder Letter Page 2
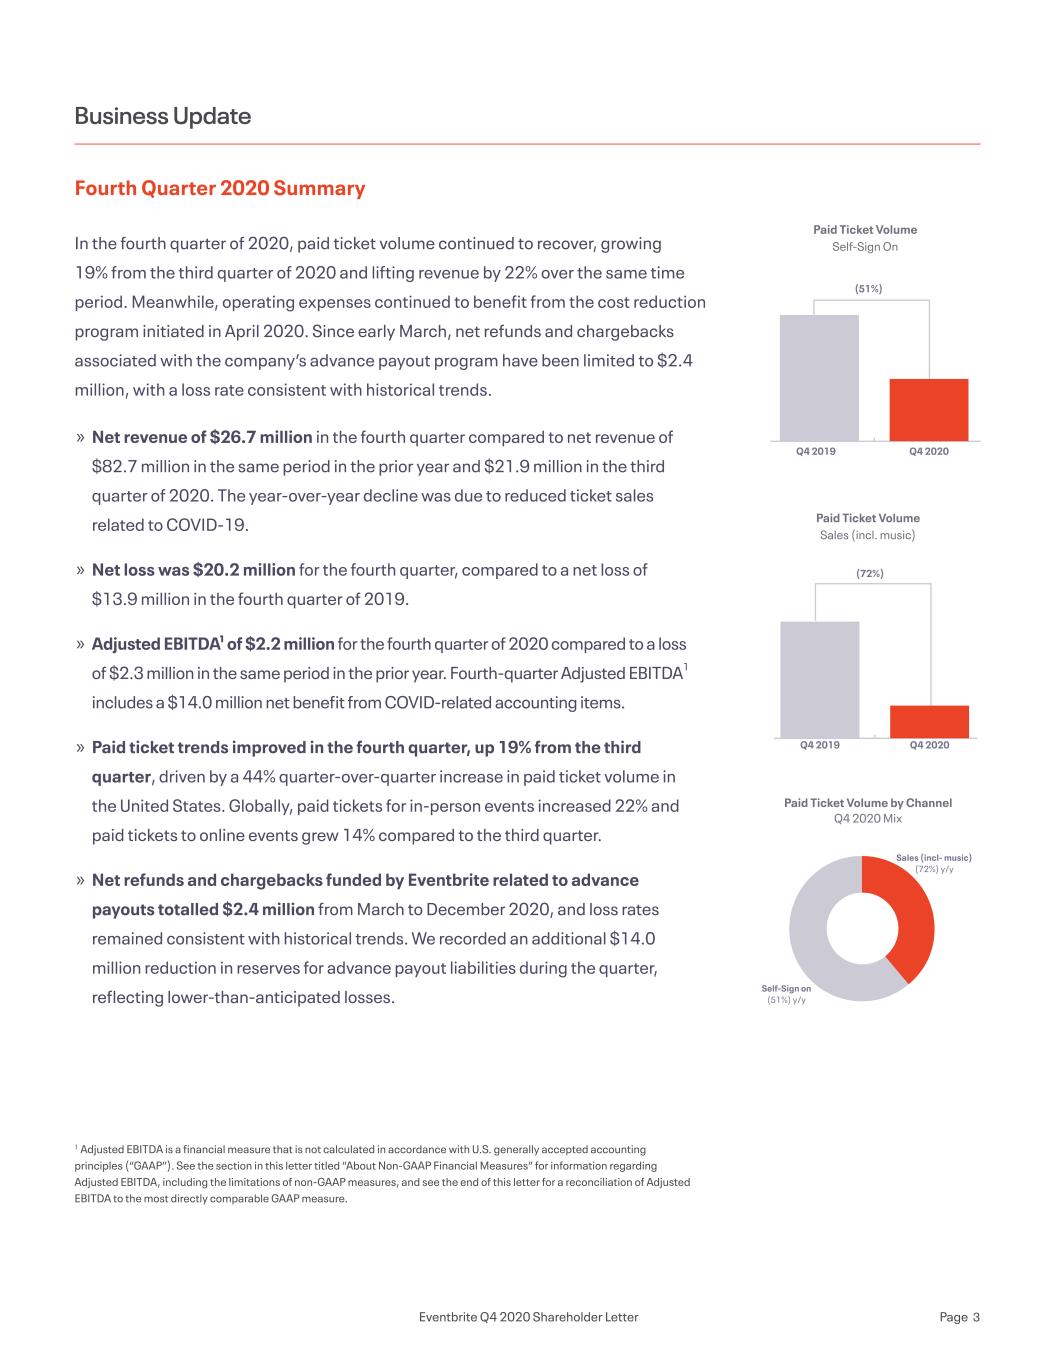
Business Update Fourth Quarter 2020 Summary In the fourth quarter of 2020, paid ticket volume continued to recover, growing 19% from the third quarter of 2020 and lifting revenue by 22% over the same time period. Meanwhile, operating expenses continued to benefit from the cost reduction program initiated in April 2020. Since early March, net refunds and chargebacks associated with the company’s advance payout program have been limited to $2.4 million, with a loss rate consistent with historical trends. 1 Adjusted EBITDA is a financial measure that is not calculated in accordance with U.S. generally accepted accounting principles (“GAAP”). See the section in this letter titled “About Non-GAAP Financial Measures” for information regarding Adjusted EBITDA, including the limitations of non-GAAP measures, and see the end of this letter for a reconciliation of Adjusted EBITDA to the most directly comparable GAAP measure. » Net revenue of $26.7 million in the fourth quarter compared to net revenue of $82.7 million in the same period in the prior year and $21.9 million in the third quarter of 2020. The year-over-year decline was due to reduced ticket sales related to COVID-19. » Net loss was $20.2 million for the fourth quarter, compared to a net loss of $13.9 million in the fourth quarter of 2019. » Adjusted EBITDA¹ of $2.2 million for the fourth quarter of 2020 compared to a loss of $2.3 million in the same period in the prior year. Fourth-quarter Adjusted EBITDA1 includes a $14.0 million net benefit from COVID-related accounting items. » Paid ticket trends improved in the fourth quarter, up 19% from the third quarter, driven by a 44% quarter-over-quarter increase in paid ticket volume in the United States. Globally, paid tickets for in-person events increased 22% and paid tickets to online events grew 14% compared to the third quarter. » Net refunds and chargebacks funded by Eventbrite related to advance payouts totalled $2.4 million from March to December 2020, and loss rates remained consistent with historical trends. We recorded an additional $14.0 million reduction in reserves for advance payout liabilities during the quarter, reflecting lower-than-anticipated losses. Paid Ticket Volume Sales (incl. music) Paid Ticket Volume Self-Sign On Paid Ticket Volume by Channel Q4 2020 Mix Q4 2020 Q4 2019 (51%) (72%) Q4 2020Q4 2019 Self-Sign on (51%) y/y Sales (incl- music) (72%) y/y Eventbrite Q4 2020 Shareholder Letter Page 3
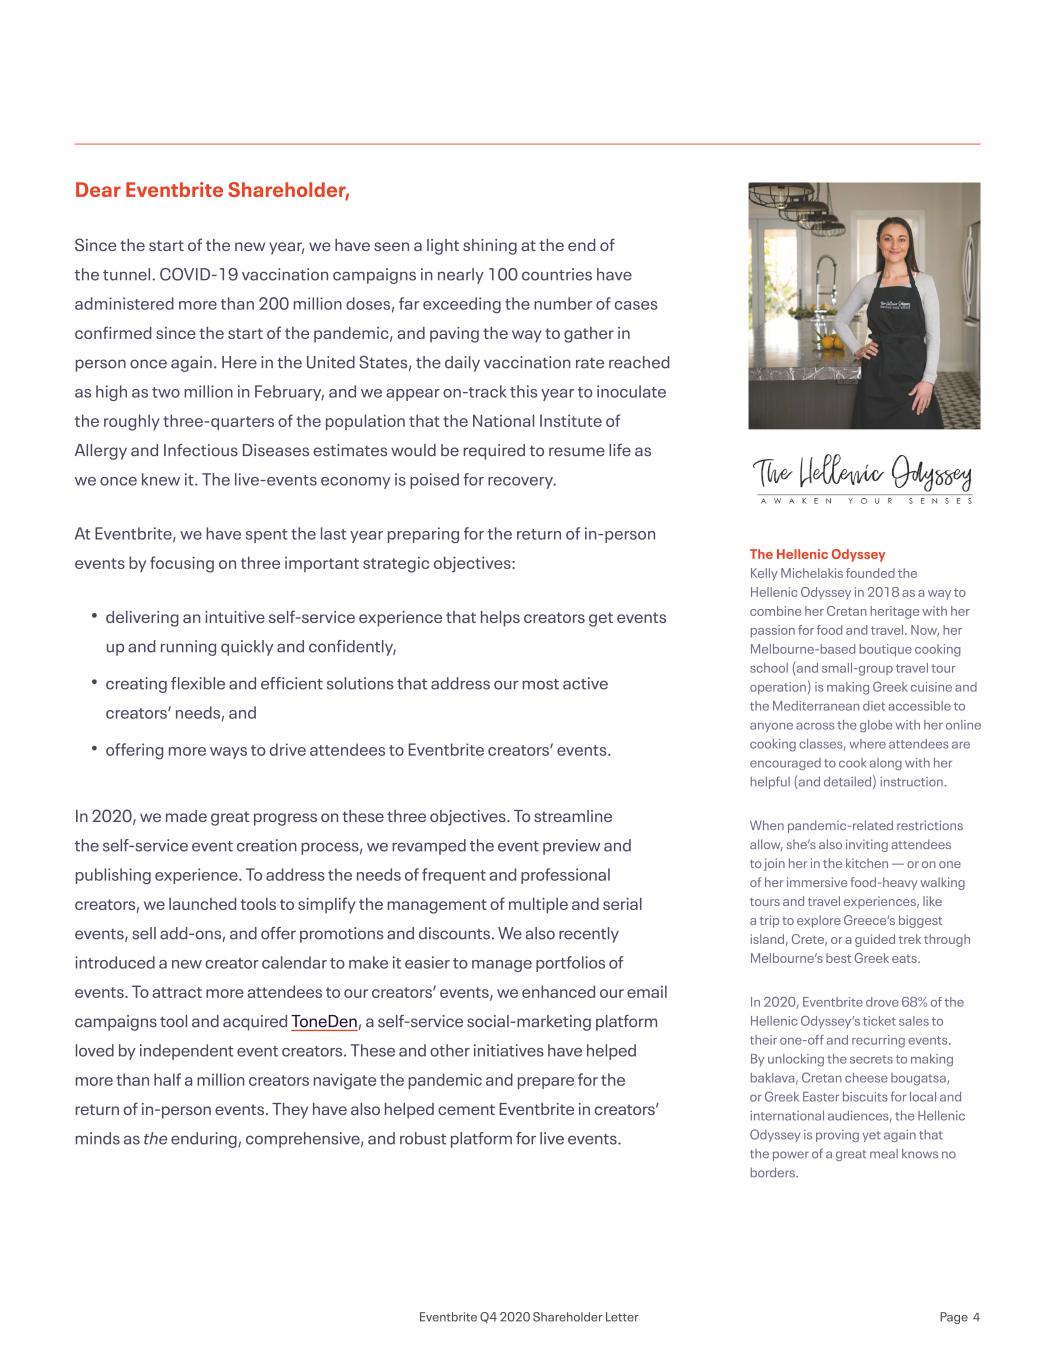
Dear Eventbrite Shareholder, Since the start of the new year, we have seen a light shining at the end of the tunnel. COVID-19 vaccination campaigns in nearly 100 countries have administered more than 200 million doses, far exceeding the number of cases confirmed since the start of the pandemic, and paving the way to gather in person once again. Here in the United States, the daily vaccination rate reached as high as two million in February, and we appear on-track this year to inoculate the roughly three-quarters of the population that the National Institute of Allergy and Infectious Diseases estimates would be required to resume life as we once knew it. The live-events economy is poised for recovery. At Eventbrite, we have spent the last year preparing for the return of in-person events by focusing on three important strategic objectives: • delivering an intuitive self-service experience that helps creators get events up and running quickly and confidently, • creating flexible and efficient solutions that address our most active creators’ needs, and • offering more ways to drive attendees to Eventbrite creators’ events. In 2020, we made great progress on these three objectives. To streamline the self-service event creation process, we revamped the event preview and publishing experience. To address the needs of frequent and professional creators, we launched tools to simplify the management of multiple and serial events, sell add-ons, and offer promotions and discounts. We also recently introduced a new creator calendar to make it easier to manage portfolios of events. To attract more attendees to our creators’ events, we enhanced our email campaigns tool and acquired ToneDen, a self-service social-marketing platform loved by independent event creators. These and other initiatives have helped more than half a million creators navigate the pandemic and prepare for the return of in-person events. They have also helped cement Eventbrite in creators’ minds as the enduring, comprehensive, and robust platform for live events. The Hellenic Odyssey Kelly Michelakis founded the Hellenic Odyssey in 2018 as a way to combine her Cretan heritage with her passion for food and travel. Now, her Melbourne-based boutique cooking school (and small-group travel tour operation) is making Greek cuisine and the Mediterranean diet accessible to anyone across the globe with her online cooking classes, where attendees are encouraged to cook along with her helpful (and detailed) instruction. When pandemic-related restrictions allow, she’s also inviting attendees to join her in the kitchen — or on one of her immersive food-heavy walking tours and travel experiences, like a trip to explore Greece’s biggest island, Crete, or a guided trek through Melbourne’s best Greek eats. In 2020, Eventbrite drove 68% of the Hellenic Odyssey’s ticket sales to their one-off and recurring events. By unlocking the secrets to making baklava, Cretan cheese bougatsa, or Greek Easter biscuits for local and international audiences, the Hellenic Odyssey is proving yet again that the power of a great meal knows no borders. Eventbrite Q4 2020 Shareholder Letter Page 4
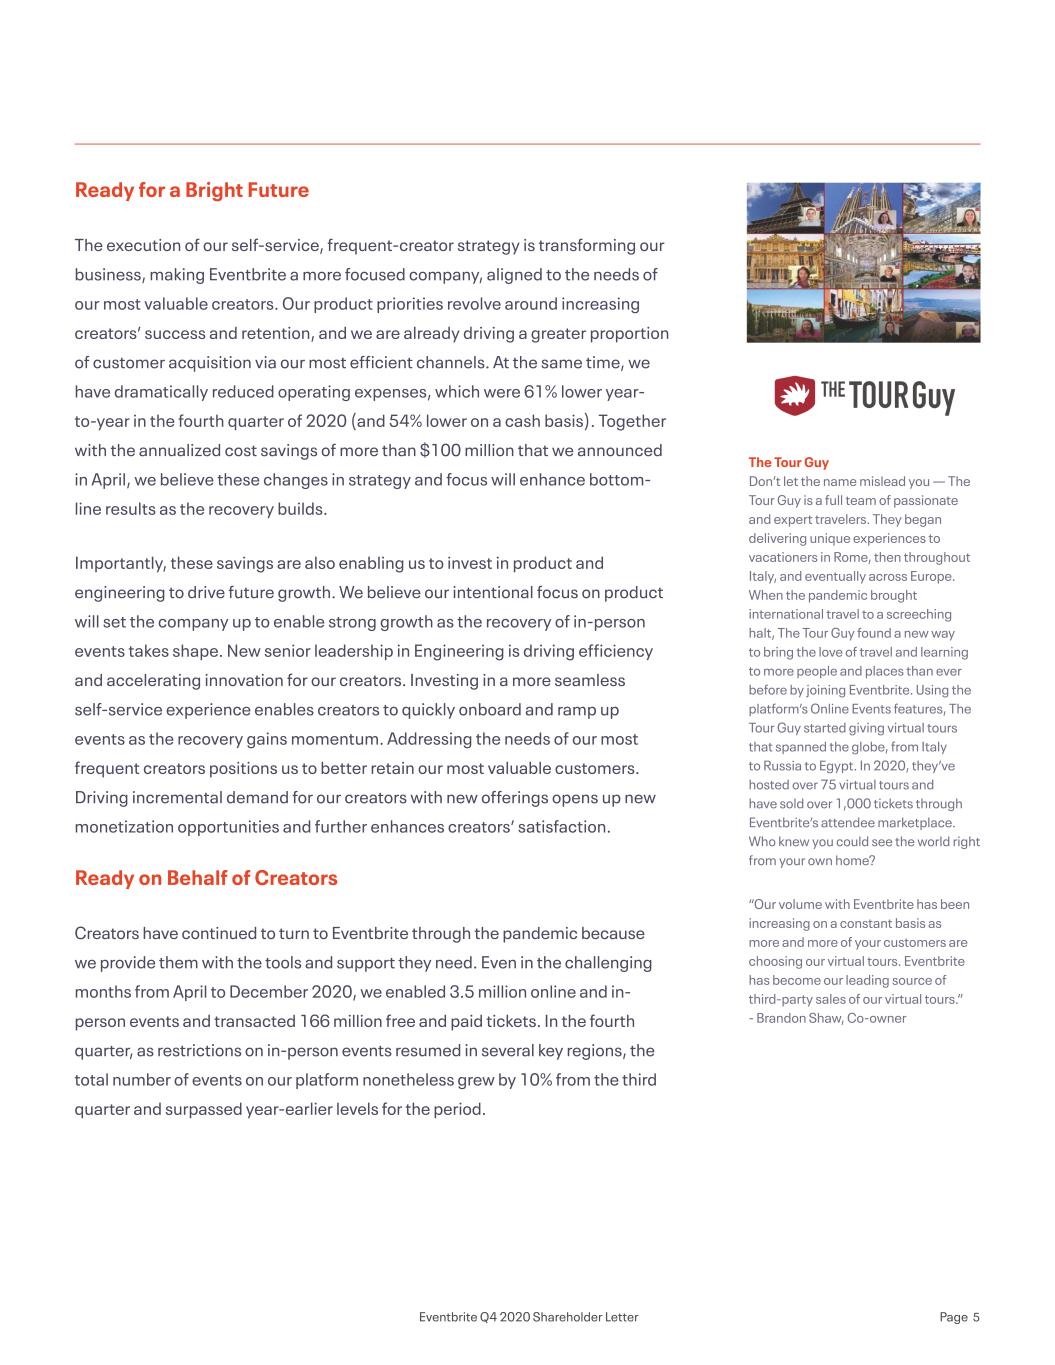
Ready for a Bright Future The execution of our self-service, frequent-creator strategy is transforming our business, making Eventbrite a more focused company, aligned to the needs of our most valuable creators. Our product priorities revolve around increasing creators’ success and retention, and we are already driving a greater proportion of customer acquisition via our most efficient channels. At the same time, we have dramatically reduced operating expenses, which were 61% lower year- to-year in the fourth quarter of 2020 (and 54% lower on a cash basis). Together with the annualized cost savings of more than $100 million that we announced in April, we believe these changes in strategy and focus will enhance bottom- line results as the recovery builds. Importantly, these savings are also enabling us to invest in product and engineering to drive future growth. We believe our intentional focus on product will set the company up to enable strong growth as the recovery of in-person events takes shape. New senior leadership in Engineering is driving efficiency and accelerating innovation for our creators. Investing in a more seamless self-service experience enables creators to quickly onboard and ramp up events as the recovery gains momentum. Addressing the needs of our most frequent creators positions us to better retain our most valuable customers. Driving incremental demand for our creators with new offerings opens up new monetization opportunities and further enhances creators’ satisfaction. Ready on Behalf of Creators Creators have continued to turn to Eventbrite through the pandemic because we provide them with the tools and support they need. Even in the challenging months from April to December 2020, we enabled 3.5 million online and in- person events and transacted 166 million free and paid tickets. In the fourth quarter, as restrictions on in-person events resumed in several key regions, the total number of events on our platform nonetheless grew by 10% from the third quarter and surpassed year-earlier levels for the period. The Tour Guy Don’t let the name mislead you — The Tour Guy is a full team of passionate and expert travelers. They began delivering unique experiences to vacationers in Rome, then throughout Italy, and eventually across Europe. When the pandemic brought international travel to a screeching halt, The Tour Guy found a new way to bring the love of travel and learning to more people and places than ever before by joining Eventbrite. Using the platform’s Online Events features, The Tour Guy started giving virtual tours that spanned the globe, from Italy to Russia to Egypt. In 2020, they’ve hosted over 75 virtual tours and have sold over 1,000 tickets through Eventbrite’s attendee marketplace. Who knew you could see the world right from your own home? “Our volume with Eventbrite has been increasing on a constant basis as more and more of your customers are choosing our virtual tours. Eventbrite has become our leading source of third-party sales of our virtual tours.” - Brandon Shaw, Co-owner Eventbrite Q4 2020 Shareholder Letter Page 5
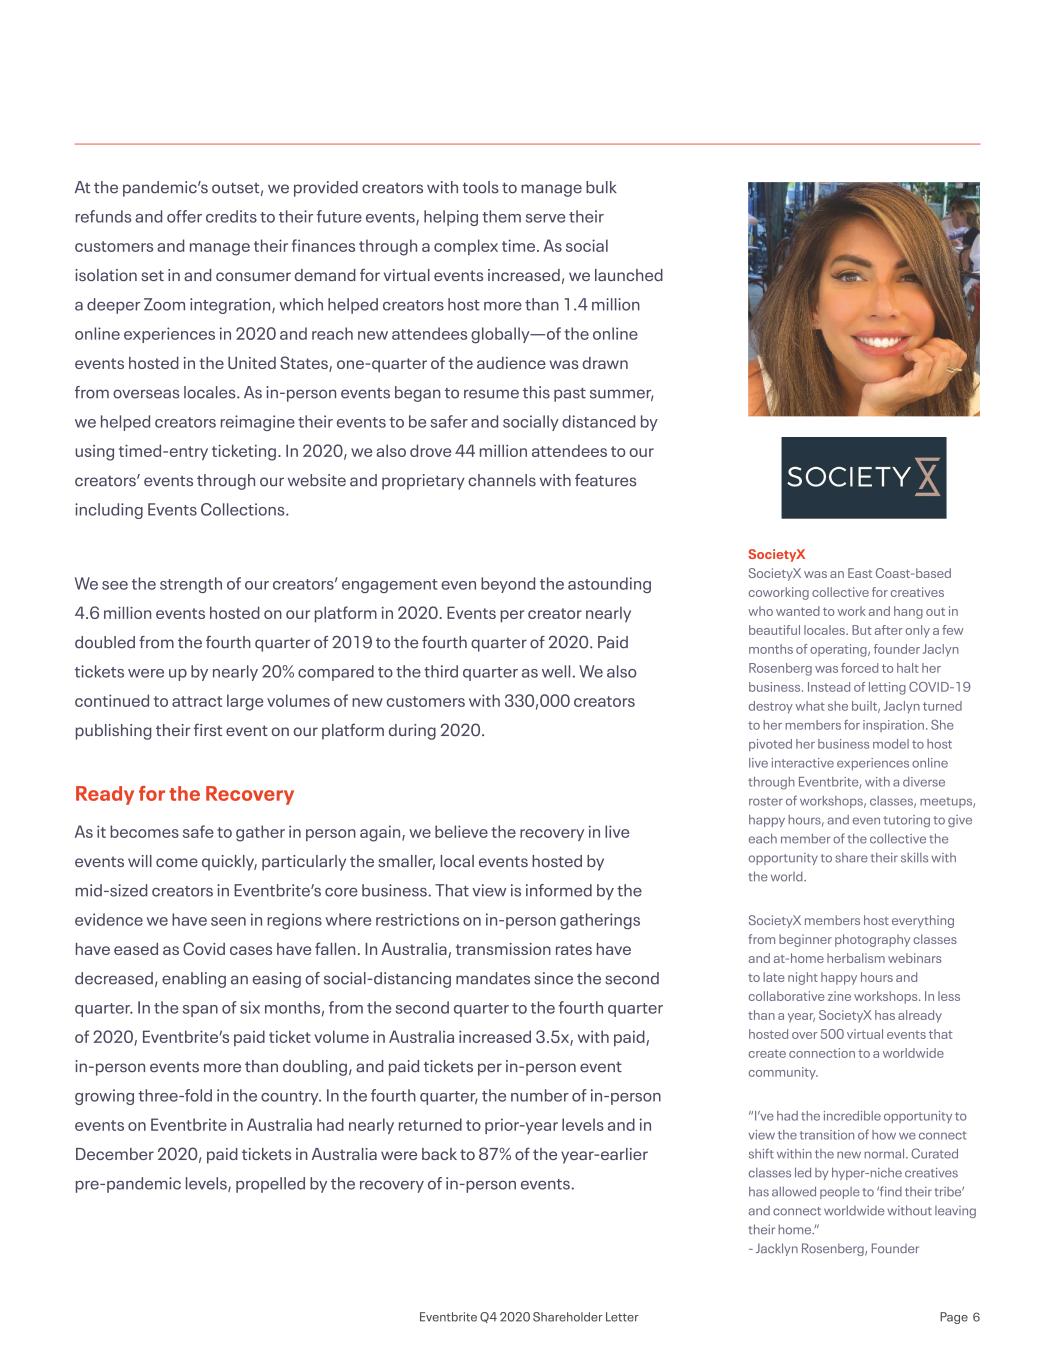
At the pandemic’s outset, we provided creators with tools to manage bulk refunds and offer credits to their future events, helping them serve their customers and manage their finances through a complex time. As social isolation set in and consumer demand for virtual events increased, we launched a deeper Zoom integration, which helped creators host more than 1.4 million online experiences in 2020 and reach new attendees globally—of the online events hosted in the United States, one-quarter of the audience was drawn from overseas locales. As in-person events began to resume this past summer, we helped creators reimagine their events to be safer and socially distanced by using timed-entry ticketing. In 2020, we also drove 44 million attendees to our creators’ events through our website and proprietary channels with features including Events Collections. We see the strength of our creators’ engagement even beyond the astounding 4.6 million events hosted on our platform in 2020. Events per creator nearly doubled from the fourth quarter of 2019 to the fourth quarter of 2020. Paid tickets were up by nearly 20% compared to the third quarter as well. We also continued to attract large volumes of new customers with 330,000 creators publishing their first event on our platform during 2020. Ready for the Recovery As it becomes safe to gather in person again, we believe the recovery in live events will come quickly, particularly the smaller, local events hosted by mid-sized creators in Eventbrite’s core business. That view is informed by the evidence we have seen in regions where restrictions on in-person gatherings have eased as Covid cases have fallen. In Australia, transmission rates have decreased, enabling an easing of social-distancing mandates since the second quarter. In the span of six months, from the second quarter to the fourth quarter of 2020, Eventbrite’s paid ticket volume in Australia increased 3.5x, with paid, in-person events more than doubling, and paid tickets per in-person event growing three-fold in the country. In the fourth quarter, the number of in-person events on Eventbrite in Australia had nearly returned to prior-year levels and in December 2020, paid tickets in Australia were back to 87% of the year-earlier pre-pandemic levels, propelled by the recovery of in-person events. SocietyX SocietyX was an East Coast-based coworking collective for creatives who wanted to work and hang out in beautiful locales. But after only a few months of operating, founder Jaclyn Rosenberg was forced to halt her business. Instead of letting COVID-19 destroy what she built, Jaclyn turned to her members for inspiration. She pivoted her business model to host live interactive experiences online through Eventbrite, with a diverse roster of workshops, classes, meetups, happy hours, and even tutoring to give each member of the collective the opportunity to share their skills with the world. SocietyX members host everything from beginner photography classes and at-home herbalism webinars to late night happy hours and collaborative zine workshops. In less than a year, SocietyX has already hosted over 500 virtual events that create connection to a worldwide community. “I’ve had the incredible opportunity to view the transition of how we connect shift within the new normal. Curated classes led by hyper-niche creatives has allowed people to ‘find their tribe’ and connect worldwide without leaving their home.” - Jacklyn Rosenberg, Founder Eventbrite Q4 2020 Shareholder Letter Page 6
These results demonstrate creators’ agility and consumers´ demand to return to in-person events when it is safe to do so. They also show how quickly Eventbrite creators can ramp-up large numbers of in-person events in a relatively short time frame by leveraging our easy-to-use self-service platform. In Summary... At Eventbrite, we stand in support of our creators now more than ever. We are ready to help them reimagine, rebuild, and reinvent the live experiences industry in a post-pandemic world. Our business is fortified and refocused through the dedication of our talented employees, and we believe we are emerging from this crisis as a stronger company, ready to drive enduring growth and strong bottom- line results for years to come. Sincerely, Julia Hartz CEO Lanny Baker CFO Eventbrite Q4 2020 Shareholder Letter Page 7
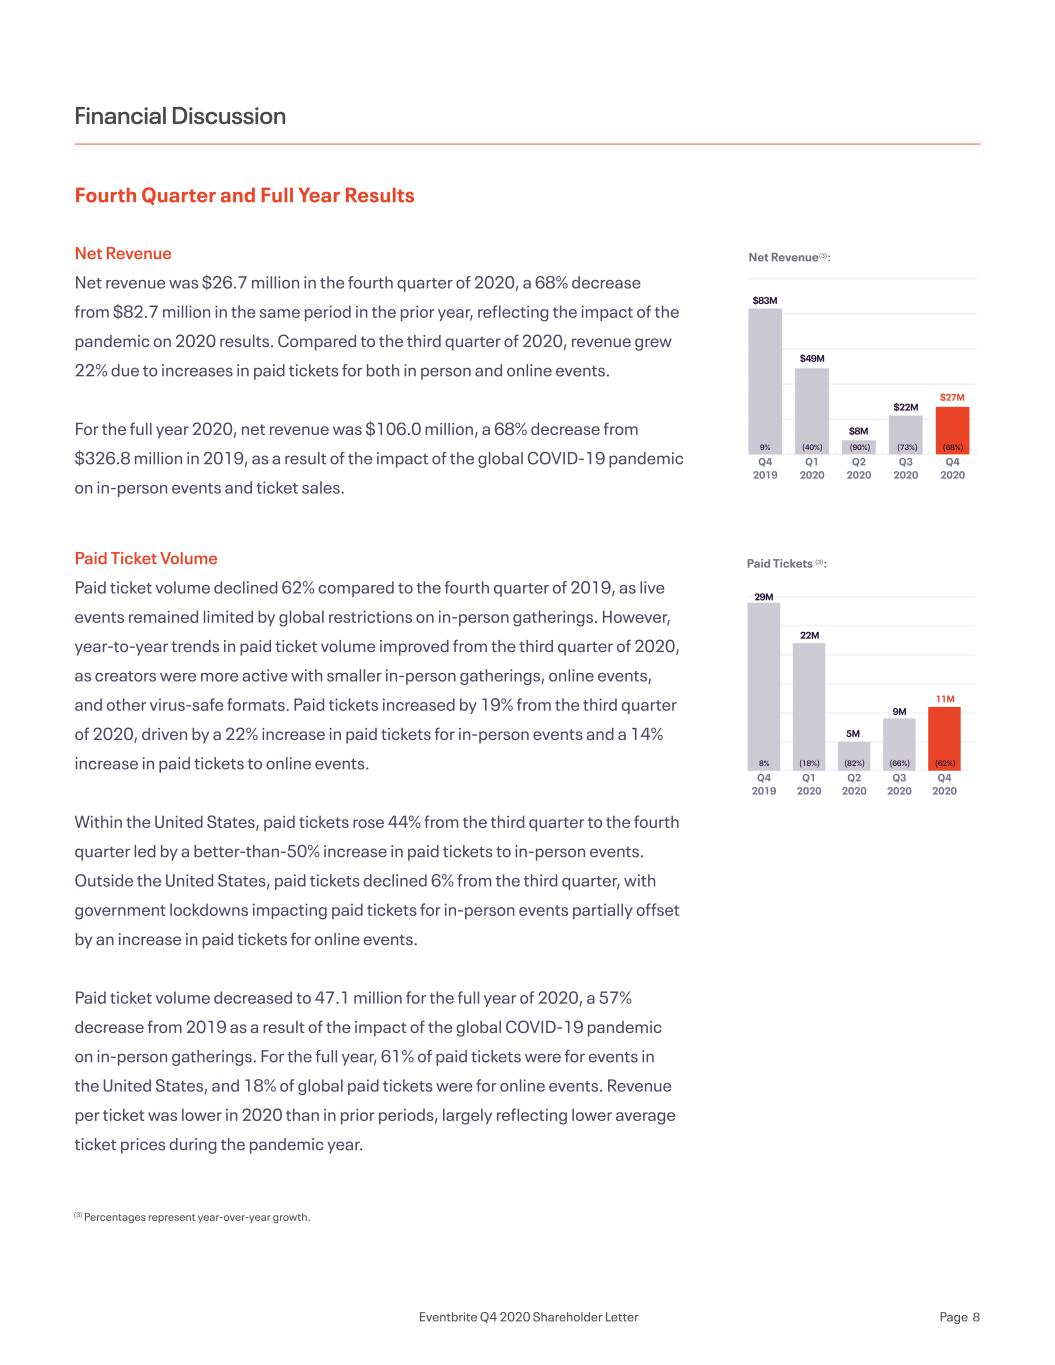
Fourth Quarter and Full Year Results Net Revenue Net revenue was $26.7 million in the fourth quarter of 2020, a 68% decrease from $82.7 million in the same period in the prior year, reflecting the impact of the pandemic on 2020 results. Compared to the third quarter of 2020, revenue grew 22% due to increases in paid tickets for both in person and online events. For the full year 2020, net revenue was $106.0 million, a 68% decrease from $326.8 million in 2019, as a result of the impact of the global COVID-19 pandemic on in-person events and ticket sales. Paid Ticket Volume Paid ticket volume declined 62% compared to the fourth quarter of 2019, as live events remained limited by global restrictions on in-person gatherings. However, year-to-year trends in paid ticket volume improved from the third quarter of 2020, as creators were more active with smaller in-person gatherings, online events, and other virus-safe formats. Paid tickets increased by 19% from the third quarter of 2020, driven by a 22% increase in paid tickets for in-person events and a 14% increase in paid tickets to online events. Within the United States, paid tickets rose 44% from the third quarter to the fourth quarter led by a better-than-50% increase in paid tickets to in-person events. Outside the United States, paid tickets declined 6% from the third quarter, with government lockdowns impacting paid tickets for in-person events partially offset by an increase in paid tickets for online events. Paid ticket volume decreased to 47.1 million for the full year of 2020, a 57% decrease from 2019 as a result of the impact of the global COVID-19 pandemic on in-person gatherings. For the full year, 61% of paid tickets were for events in the United States, and 18% of global paid tickets were for online events. Revenue per ticket was lower in 2020 than in prior periods, largely reflecting lower average ticket prices during the pandemic year. Financial Discussion (3) Percentages represent year-over-year growth. Net Revenue(3): Paid Tickets (3): Q4 2020 Q3 2020 Q2 2020 Q1 2020 Q4 2019 $83M $49M $8M $22M $27M (73%) (68%)(90%)(40%)9% 29M 22M 5M 9M 11M Q4 2020 Q3 2020 Q2 2020 Q1 2020 Q4 2019 8% (18%) (82%) (66%) (62%) Eventbrite Q4 2020 Shareholder Letter Page 8
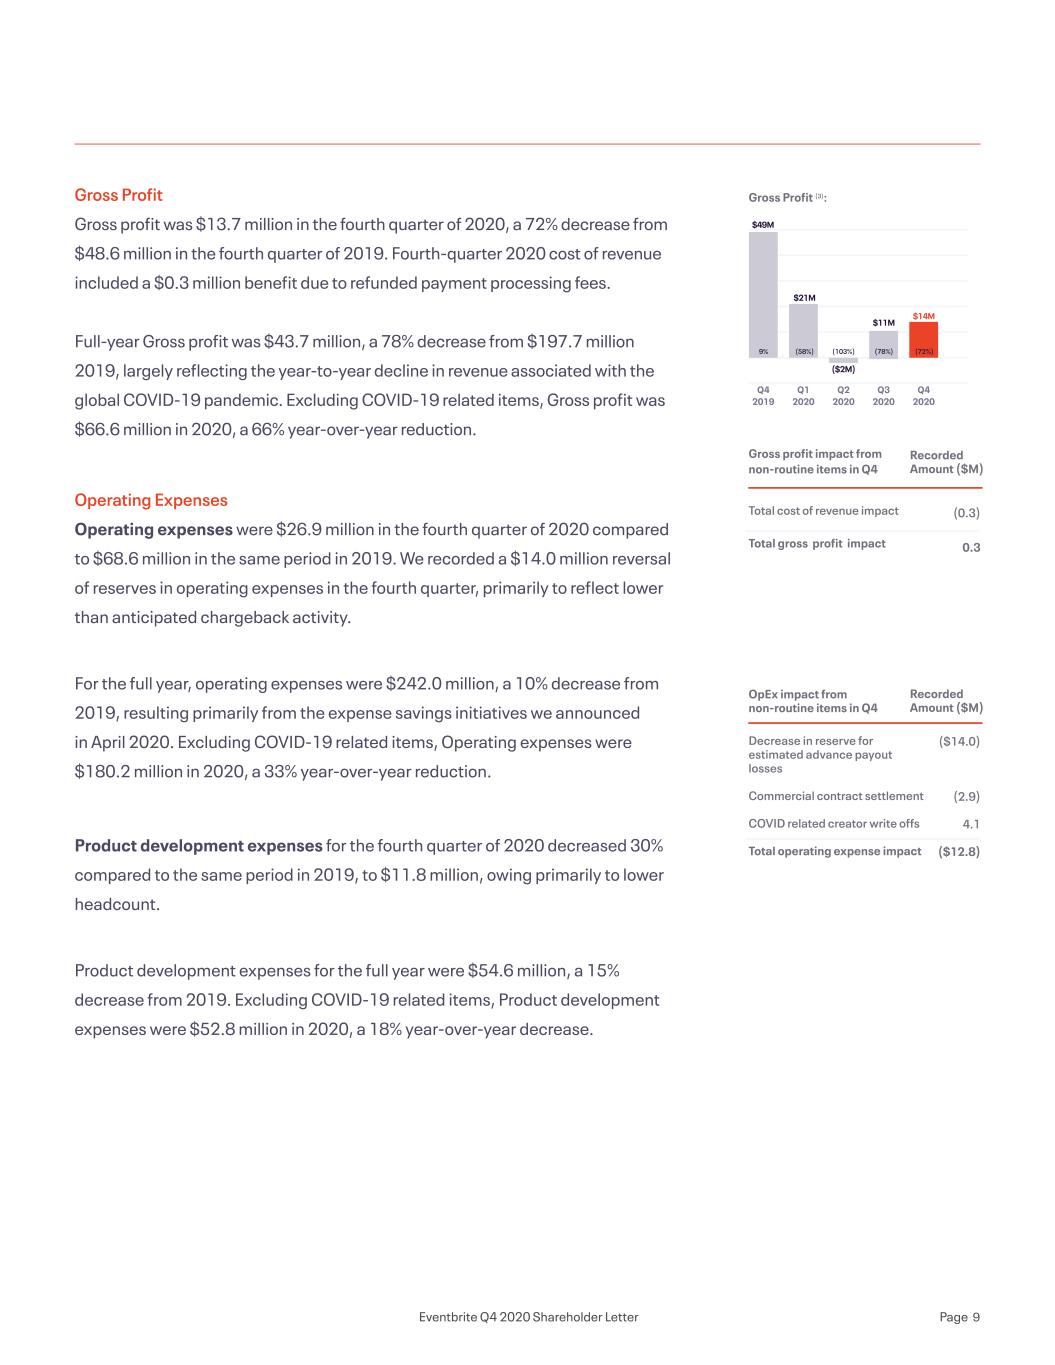
Gross Profit Gross profit was $13.7 million in the fourth quarter of 2020, a 72% decrease from $48.6 million in the fourth quarter of 2019. Fourth-quarter 2020 cost of revenue included a $0.3 million benefit due to refunded payment processing fees. Full-year Gross profit was $43.7 million, a 78% decrease from $197.7 million 2019, largely reflecting the year-to-year decline in revenue associated with the global COVID-19 pandemic. Excluding COVID-19 related items, Gross profit was $66.6 million in 2020, a 66% year-over-year reduction. Operating Expenses Operating expenses were $26.9 million in the fourth quarter of 2020 compared to $68.6 million in the same period in 2019. We recorded a $14.0 million reversal of reserves in operating expenses in the fourth quarter, primarily to reflect lower than anticipated chargeback activity. For the full year, operating expenses were $242.0 million, a 10% decrease from 2019, resulting primarily from the expense savings initiatives we announced in April 2020. Excluding COVID-19 related items, Operating expenses were $180.2 million in 2020, a 33% year-over-year reduction. Product development expenses for the fourth quarter of 2020 decreased 30% compared to the same period in 2019, to $11.8 million, owing primarily to lower headcount. Product development expenses for the full year were $54.6 million, a 15% decrease from 2019. Excluding COVID-19 related items, Product development expenses were $52.8 million in 2020, a 18% year-over-year decrease. Gross profit impact from non-routine items in Q4 Total cost of revenue impact Total gross profit impact OpEx impact from non-routine items in Q4 Decrease in reserve for estimated advance payout losses Commercial contract settlement COVID related creator write offs Total operating expense impact Recorded Amount ($M) Recorded Amount ($M) (0.3) 0.3 ($14.0) (2.9) 4.1 ($12.8) Gross Profit (3): $49M $21M ($2M) $14M $11M Q4 2020 Q3 2020 Q2 2020 Q1 2020 Q4 2019 9% (58%) (103%) (78%) (72%) Eventbrite Q4 2020 Shareholder Letter Page 9
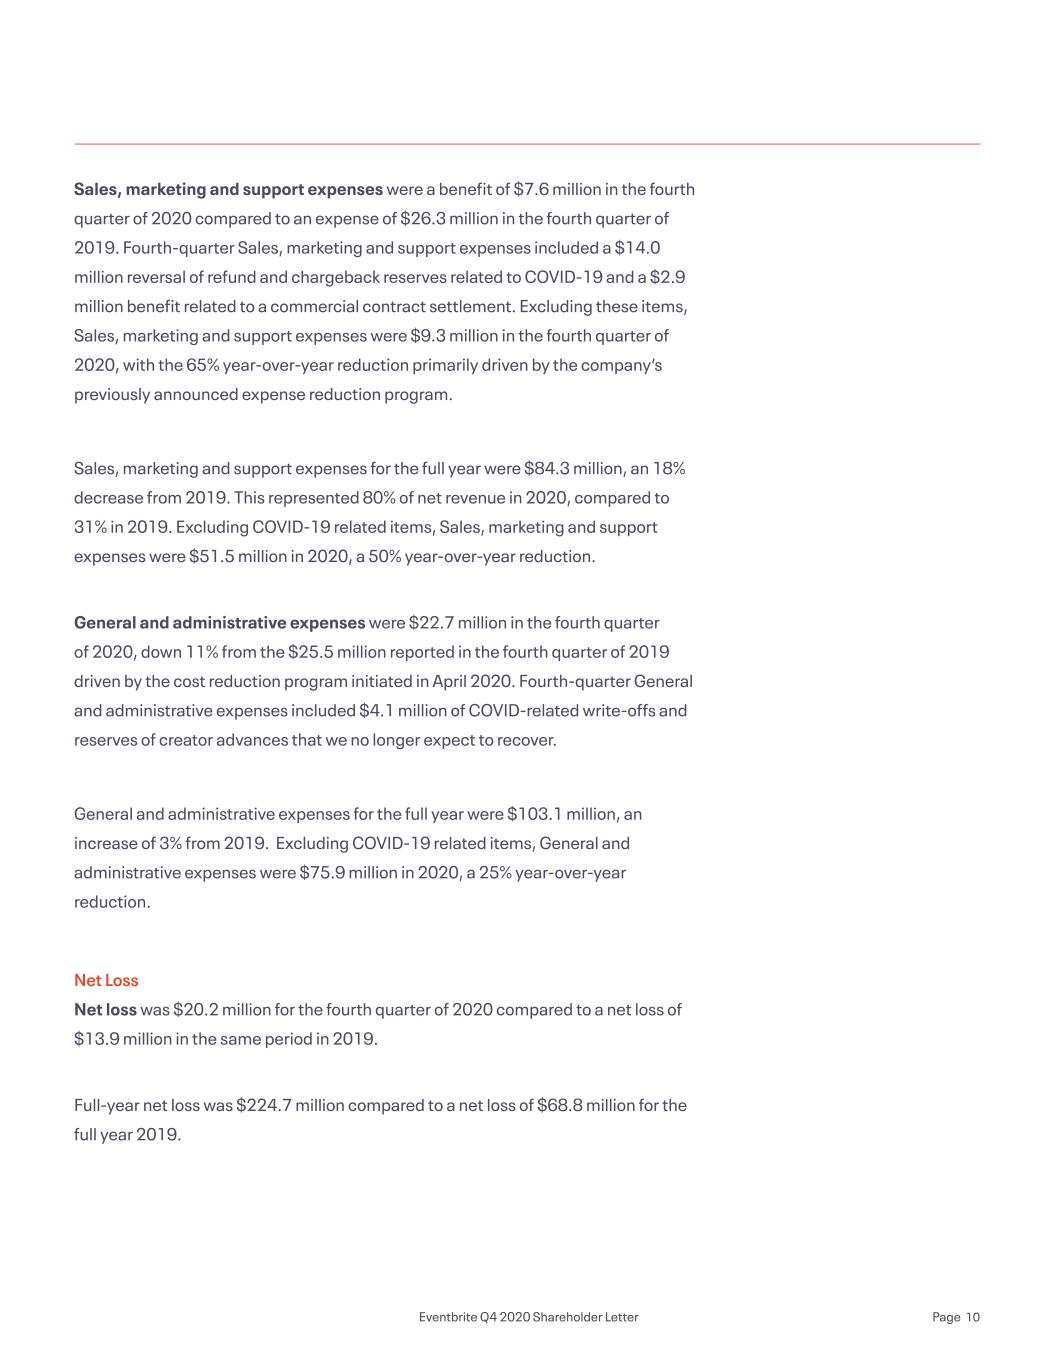
Sales, marketing and support expenses were a benefit of $7.6 million in the fourth quarter of 2020 compared to an expense of $26.3 million in the fourth quarter of 2019. Fourth-quarter Sales, marketing and support expenses included a $14.0 million reversal of refund and chargeback reserves related to COVID-19 and a $2.9 million benefit related to a commercial contract settlement. Excluding these items, Sales, marketing and support expenses were $9.3 million in the fourth quarter of 2020, with the 65% year-over-year reduction primarily driven by the company’s previously announced expense reduction program. Sales, marketing and support expenses for the full year were $84.3 million, an 18% decrease from 2019. This represented 80% of net revenue in 2020, compared to 31% in 2019. Excluding COVID-19 related items, Sales, marketing and support expenses were $51.5 million in 2020, a 50% year-over-year reduction. General and administrative expenses were $22.7 million in the fourth quarter of 2020, down 11% from the $25.5 million reported in the fourth quarter of 2019 driven by the cost reduction program initiated in April 2020. Fourth-quarter General and administrative expenses included $4.1 million of COVID-related write-offs and reserves of creator advances that we no longer expect to recover. General and administrative expenses for the full year were $103.1 million, an increase of 3% from 2019. Excluding COVID-19 related items, General and administrative expenses were $75.9 million in 2020, a 25% year-over-year reduction. Net Loss Net loss was $20.2 million for the fourth quarter of 2020 compared to a net loss of $13.9 million in the same period in 2019. Full-year net loss was $224.7 million compared to a net loss of $68.8 million for the full year 2019. ($7M) Eventbrite Q4 2020 Shareholder Letter Page 10
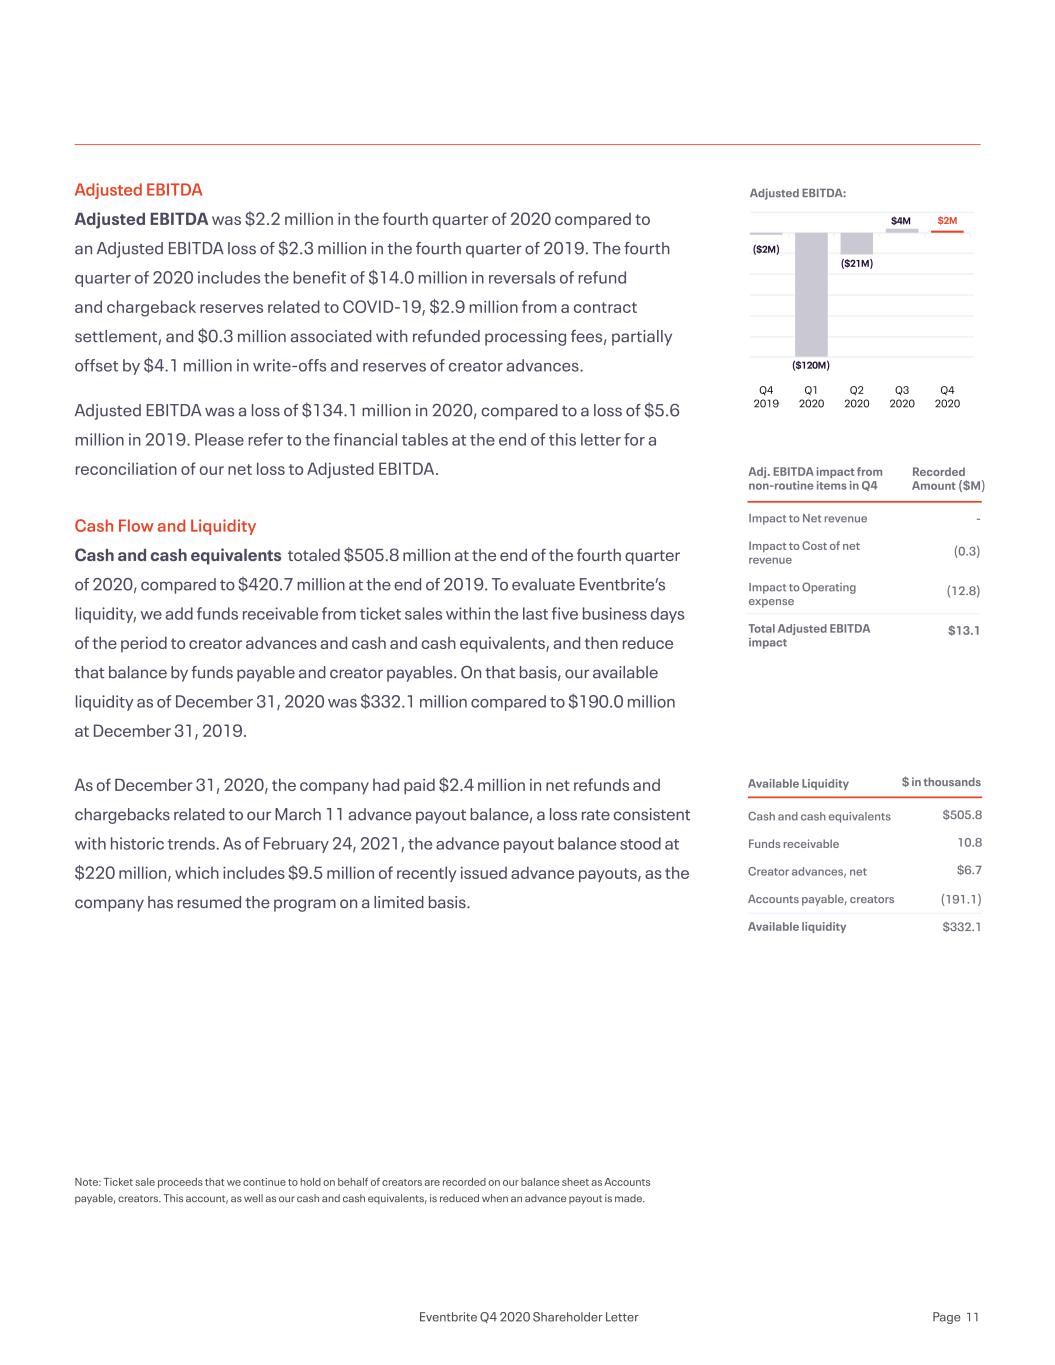
Adjusted EBITDA Adjusted EBITDA was $2.2 million in the fourth quarter of 2020 compared to an Adjusted EBITDA loss of $2.3 million in the fourth quarter of 2019. The fourth quarter of 2020 includes the benefit of $14.0 million in reversals of refund and chargeback reserves related to COVID-19, $2.9 million from a contract settlement, and $0.3 million associated with refunded processing fees, partially offset by $4.1 million in write-offs and reserves of creator advances. Adjusted EBITDA was a loss of $134.1 million in 2020, compared to a loss of $5.6 million in 2019. Please refer to the financial tables at the end of this letter for a reconciliation of our net loss to Adjusted EBITDA. Cash Flow and Liquidity Cash and cash equivalents totaled $505.8 million at the end of the fourth quarter of 2020, compared to $420.7 million at the end of 2019. To evaluate Eventbrite’s liquidity, we add funds receivable from ticket sales within the last five business days of the period to creator advances and cash and cash equivalents, and then reduce that balance by funds payable and creator payables. On that basis, our available liquidity as of December 31, 2020 was $332.1 million compared to $190.0 million at December 31, 2019. As of December 31, 2020, the company had paid $2.4 million in net refunds and chargebacks related to our March 11 advance payout balance, a loss rate consistent with historic trends. As of February 24, 2021, the advance payout balance stood at $220 million, which includes $9.5 million of recently issued advance payouts, as the company has resumed the program on a limited basis. Note: Ticket sale proceeds that we continue to hold on behalf of creators are recorded on our balance sheet as Accounts payable, creators. This account, as well as our cash and cash equivalents, is reduced when an advance payout is made. Available Liquidity Cash and cash equivalents Funds receivable Creator advances, net Accounts payable, creators Available liquidity $ in thousands $505.8 10.8 $6.7 (191.1) $332.1 Adj. EBITDA impact from non-routine items in Q4 Impact to Net revenue Impact to Cost of net revenue Impact to Operating expense Total Adjusted EBITDA impact Recorded Amount ($M) - (0.3) (12.8) $13.1 Adjusted EBITDA: ($2M) ($2M) $4M $2M ($21M) ($120M) Q4 2020 Q3 2020 Q2 2020 Q1 2020 Q4 2019 Eventbrite Q4 2020 Shareholder Letter Page 11
While paid ticket volume and revenue continued to recover at an approximately 20% rate from the third quarter to the fourth quarter of 2020, we expect a more modest pace of recovery in the first half of 2021, as social distancing mandates continue in our key geographies and as global vaccination efforts begin to ramp. The cost reduction plan we announced in April 2020 has yielded cash expense savings of more than $100 million on an annualized basis. Cash expenses were $29 million in the fourth quarter of 2020. We expect cash costs, excluding processing fees, of between $31 million and $33 million for the first quarter of 2021. Business Outlook Eventbrite Q4 2020 Shareholder Letter Page 12
Eventbrite will hold a conference call and live webcast today at 2:00 p.m. PST to discuss the fourth quarter and fiscal year 2020 financial results. To listen to a live audio webcast, please visit Eventbrite’s Investor Relations website at investor.eventbrite.com. A replay of the webcast will be available at the same website. About Eventbrite Eventbrite is a global self-service ticketing and experience technology platform that serves a community of hundreds of thousands of event creators in nearly 180 countries. Since inception, Eventbrite has been at the center of the experience economy, transforming the way people organize and attend events. The company was founded by Julia Hartz, Kevin Hartz and Renaud Visage, with a vision to build a self-service platform that would make it possible for anyone to create and sell tickets to live experiences. The Eventbrite platform provides an intuitive, secure, and reliable service that enables creators to plan and execute their live and online events, whether it’s an annual culinary festival attracting thousands of foodies, a professional webinar, a weekly yoga workshop or a youth dance class. With over 200 million tickets distributed to more than 4 million experiences in 2020, Eventbrite is where people all over the world discover new things to do or new ways to do more of what they love. Learn more at www.eventbrite.com. Earnings Webcast The neon icons can be used to convey abstract concepts and work well in presentations. They should feel active and expressive. Feel free to expand on these as you build out the experience. Eventbrite Q4 2020 Shareholder Letter Page 13
Forward-Looking Statements This letter contains forward-looking statements within the meaning of Section 27A of the Securities Act of 1933, as amended, and Section 21E of the Securities Exchange Act of 1934, as amended, that involve substantial risks and uncertainties. All statements other than statements of historical fact could be deemed forward-looking, including, but not limited to, statements regarding the future performance of Eventbrite, Inc. and its consolidated subsidiaries (the “Company”); the impacts of the COVID-19 global health pandemic, including its impact on the Company, its operations, or its future financial or operational results; the impact of the Company re-centering its business around a self-service model; the Company’s expectations regarding restructuring charges with respect to the workforce reduction implemented in response to the COVID-19 global health pandemic; the Company’s expectations regarding the timing of recovery of paid ticket volumes; growth strategies in the Company’s businesses and products; the Company’s expectations regarding the development of its platform and products; the Company’s expectations regarding scale, profitability, market trends, and the demand for or benefits from its products, product features, and services in the U.S. and in international markets; and the Company’s expectations regarding revenue, paid ticket volume, and cash costs described under “Business Outlook” above. In some cases, forward-looking statements can be identified by terms such as “may,” “will,” “appears,” “shall,” “should,” “expects,” “plans,” “anticipates,” “could,” “intends,” “target,” “projects,” “contemplates,” “believes,” “estimates,” “predicts,” “potential,” or “continue,” or the negative of these words or other similar terms or expressions that concern our expectations, strategy, plans, or intentions. Such statements are subject to a number of known and unknown risks, uncertainties, assumptions, and other factors that may cause the Company’s actual results, performance, or achievements to differ materially from results expressed or implied in this letter. Investors are cautioned not to place undue reliance on these statements. Actual results could differ materially from those expressed or implied, and reported results should not be considered as an indication of future performance. The forward-looking statements contained in this letter are also subject to additional risks, uncertainties and factors, including those more fully described in the Company’s filings with the Securities and Exchange Commission, including the Company’s Annual Report on 10-K for the year ended December 31, 2019. Further information on potential risks that could affect actual results will be included in the subsequent periodic and current reports and other filings that the Company makes with the Securities and Exchange Commission from time to time, including the Company's Annual Report on Form 10-Q for the quarter ended September 30, 2020. All forward-looking statements are based on information and estimates available to the Company at the time of this letter and are not guarantees of future performance. Except as required by law, the Company assumes no obligation to update any of the statements in this letter. About Non-GAAP Financial Measures We believe that the use of Adjusted EBITDA is helpful to our investors as it is a metric used by management in assessing the health of our business and our operating performance. This measure, which we refer to as one of our non-GAAP financial measures, is not prepared in accordance with GAAP and has limitations as an analytical tool, and you should not consider it in isolation or as a substitute for analysis of our results of operations as reported under GAAP. In addition, other companies may not calculate non-GAAP financial measures in the same manner as we calculate them, limiting their usefulness as comparative measures. You are encouraged to evaluate the adjustments and the reasons we consider them appropriate. Adjusted EBITDA Adjusted EBITDA is a key performance measure that our management uses to assess our operating performance. Because Adjusted EBITDA facilitates internal comparisons of our historical operating performance on a more consistent basis, we use this measure for business planning purposes and in evaluating acquisition opportunities. We calculate Adjusted EBITDA as net loss adjusted to exclude depreciation and amortization, stock-based compensation expense, interest expense, direct and indirect acquisition- related costs, employer taxes related to employee transactions and other income (expense), which consisted of interest income foreign exchange rate gains and losses, and income tax provision (benefit). Adjusted EBITDA should not be considered as an alternative to net loss or any other measure of financial performance calculated and presented in accordance with GAAP. Some of the limitations of Adjusted EBITDA include (i) Adjusted EBITDA does not properly reflect capital spending that occurs off of the income statement or account for future contractual commitments, (ii) although depreciation and amortization are non-cash charges, the underlying assets may need to be replaced and Adjusted EBITDA does not reflect these capital expenditures and (iii) Adjusted EBITDA does not reflect the interest and principal required to service our indebtedness. In evaluating Adjusted EBITDA, you should be aware that in the future we expect to incur expenses similar to the adjustments in this letter. Our presentation of Adjusted EBITDA should not be construed as an inference that our future results will be unaffected by these expenses or any unusual or non-recurring items. When evaluating our performance, you should consider Adjusted EBITDA alongside other financial performance measures, including our net loss and other GAAP results. Eventbrite Q4 2020 Shareholder Letter Page 14

Net revenue Cost of net revenue(1) Gross profit Operating expenses(1): Product development Sales, marketing and support General and administrative Total operating expenses Loss from operations Interest expense Loss on debt extinguishment Other income (expense), net Loss before income taxes Income tax provision (benefit) Net loss Net loss per share, basic and diluted Weighted-average shares outstanding used to compute net loss per share, basic and diluted (1) Includes stock-based compensation as follows: Cost of net revenue Product development Sales, marketing and support General and administrative Total 26,658 13,000 13,658 11,793 (7,572) 22,720 26,941 (13,283) (10,665) - 3,330 (20,618) (387) (20,231) (0.22) 91,972 256 3,088 1,165 5,166 9,675 106,006 62,330 43,676 54,551 84,259 103,146 241,956 (198,280) (24,586) - (1,932) (224,798) (80) (224,718) (2.52) 89,335 1,146 13,244 4,778 21,047 40,215 $ $ $ $ $ $ $ $ $ $ $ $ $ $ $ $ $ $ 82,665 34,068 48,597 16,760 26,332 25,484 68,576 (19,979) (8) - 6,872 (13,115) 754 (13,869) (0.16) 84,488 435 3,583 1,433 5,374 10,825 326,801 129,141 197,660 64,196 102,874 100,541 267,611 (69,951) (2,986) (1,742) 5,727 (68,952) (192) (68,760) (0.84) 81,979 1,397 11,130 5,471 19,596 37,594 Consolidated Statements of Operations ($ in thousands, except per share data)(Unaudited) Year Ended December 31, Three Months Ended December 31, 20202020 20192019 Eventbrite Q4 2020 Shareholder Letter Page 15
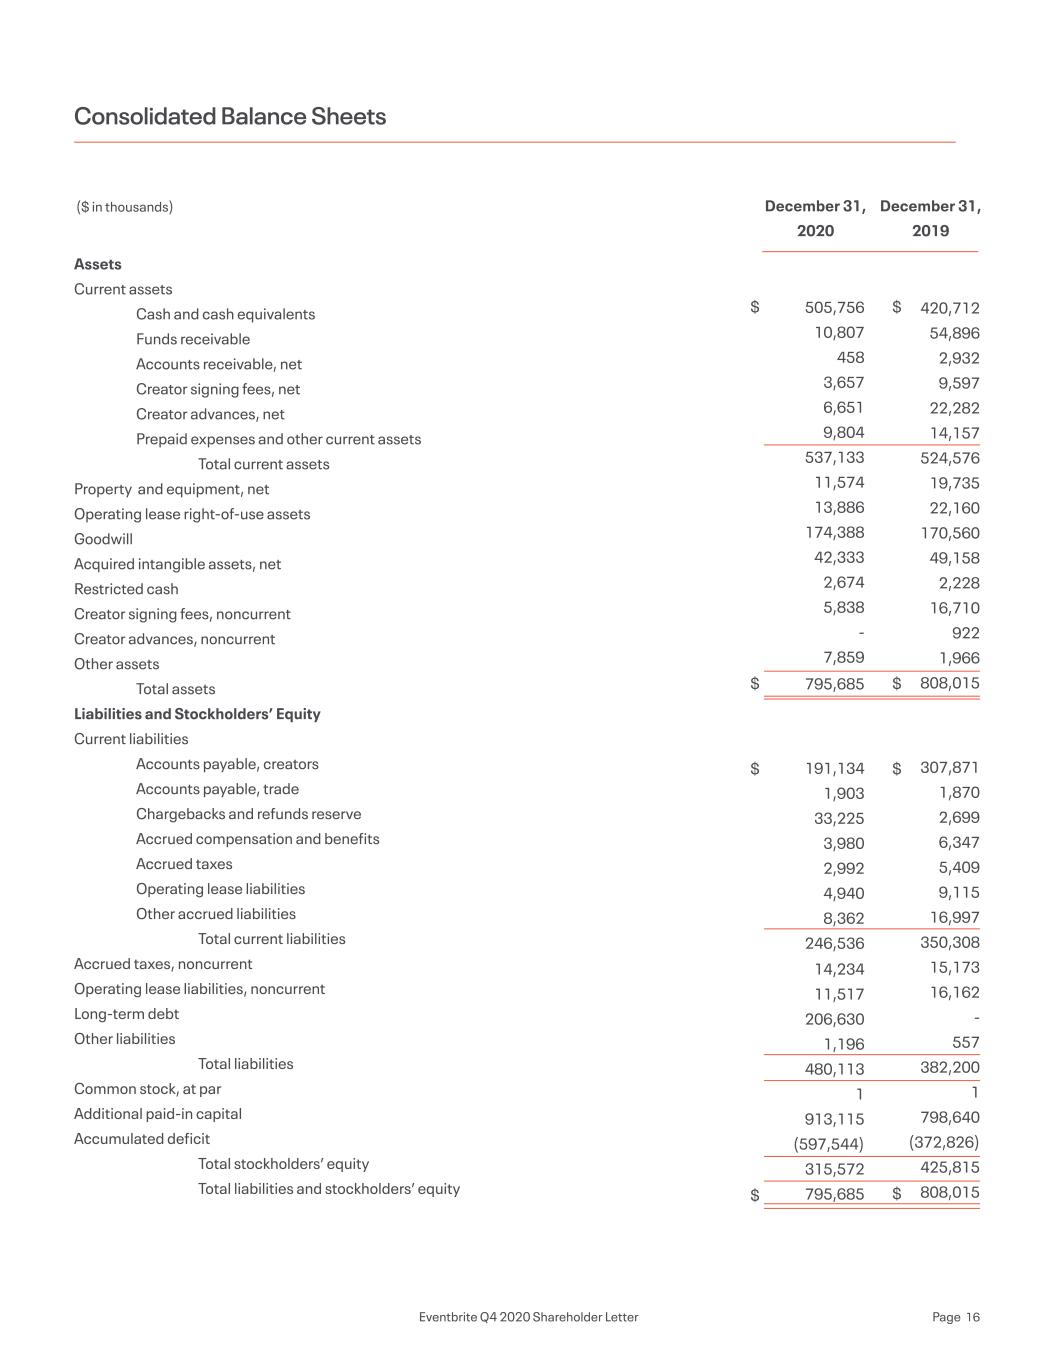
Assets Current assets Cash and cash equivalents Funds receivable Accounts receivable, net Creator signing fees, net Creator advances, net Prepaid expenses and other current assets Total current assets Property and equipment, net Operating lease right-of-use assets Goodwill Acquired intangible assets, net Restricted cash Creator signing fees, noncurrent Creator advances, noncurrent Other assets Total assets Liabilities and Stockholders’ Equity Current liabilities Accounts payable, creators Accounts payable, trade Chargebacks and refunds reserve Accrued compensation and benefits Accrued taxes Operating lease liabilities Other accrued liabilities Total current liabilities Accrued taxes, noncurrent Operating lease liabilities, noncurrent Long-term debt Other liabilities Total liabilities Common stock, at par Additional paid-in capital Accumulated deficit Total stockholders’ equity Total liabilities and stockholders’ equity 505,756 10,807 458 3,657 6,651 9,804 537,133 11,574 13,886 174,388 42,333 2,674 5,838 - 7,859 795,685 191,134 1,903 33,225 3,980 2,992 4,940 8,362 246,536 14,234 11,517 206,630 1,196 480,113 1 913,115 (597,544) 315,572 795,685 420,712 54,896 2,932 9,597 22,282 14,157 524,576 19,735 22,160 170,560 49,158 2,228 16,710 922 1,966 808,015 307,871 1,870 2,699 6,347 5,409 9,115 16,997 350,308 15,173 16,162 - 557 382,200 1 798,640 (372,826) 425,815 808,015 Consolidated Balance Sheets ($ in thousands) December 31, 2020 December 31, 2019 $ $ $ $ $ $ $ $ Eventbrite Q4 2020 Shareholder Letter Page 16
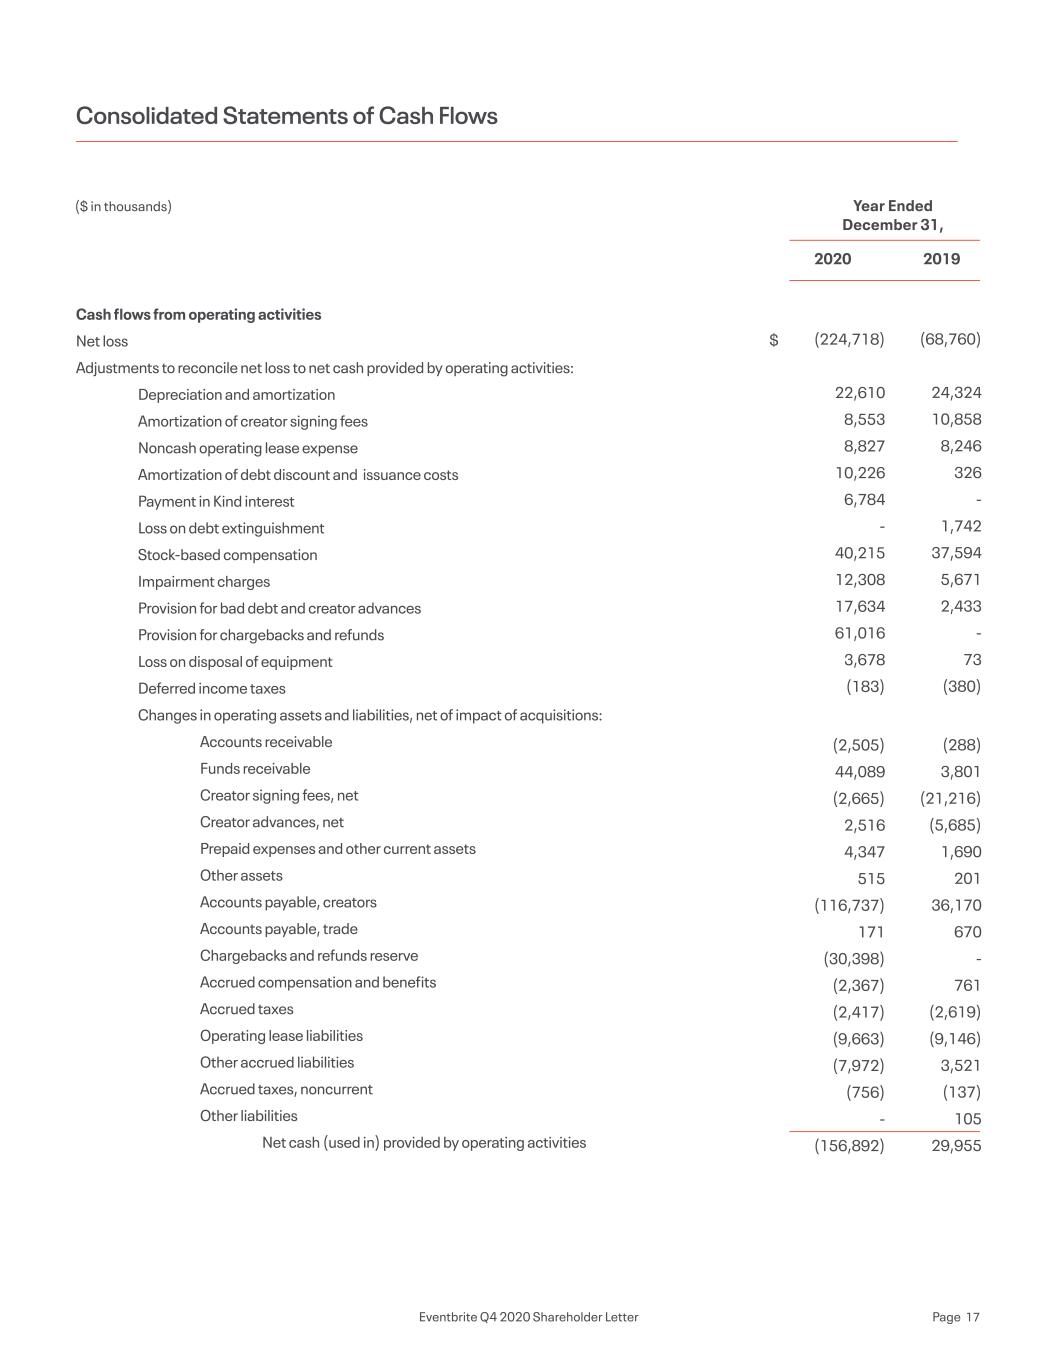
Cash flows from operating activities Net loss Adjustments to reconcile net loss to net cash provided by operating activities: Depreciation and amortization Amortization of creator signing fees Noncash operating lease expense Amortization of debt discount and issuance costs Payment in Kind interest Loss on debt extinguishment Stock-based compensation Impairment charges Provision for bad debt and creator advances Provision for chargebacks and refunds Loss on disposal of equipment Deferred income taxes Changes in operating assets and liabilities, net of impact of acquisitions: Accounts receivable Funds receivable Creator signing fees, net Creator advances, net Prepaid expenses and other current assets Other assets Accounts payable, creators Accounts payable, trade Chargebacks and refunds reserve Accrued compensation and benefits Accrued taxes Operating lease liabilities Other accrued liabilities Accrued taxes, noncurrent Other liabilities Net cash (used in) provided by operating activities (224,718) 22,610 8,553 8,827 10,226 6,784 - 40,215 12,308 17,634 61,016 3,678 (183) (2,505) 44,089 (2,665) 2,516 4,347 515 (116,737) 171 (30,398) (2,367) (2,417) (9,663) (7,972) (756) - (156,892) (68,760) 24,324 10,858 8,246 326 - 1,742 37,594 5,671 2,433 - 73 (380) (288) 3,801 (21,216) (5,685) 1,690 201 36,170 670 - 761 (2,619) (9,146) 3,521 (137) 105 29,955 Consolidated Statements of Cash Flows ($ in thousands) Year Ended December 31, 2020 2019 $ Eventbrite Q4 2020 Shareholder Letter Page 17
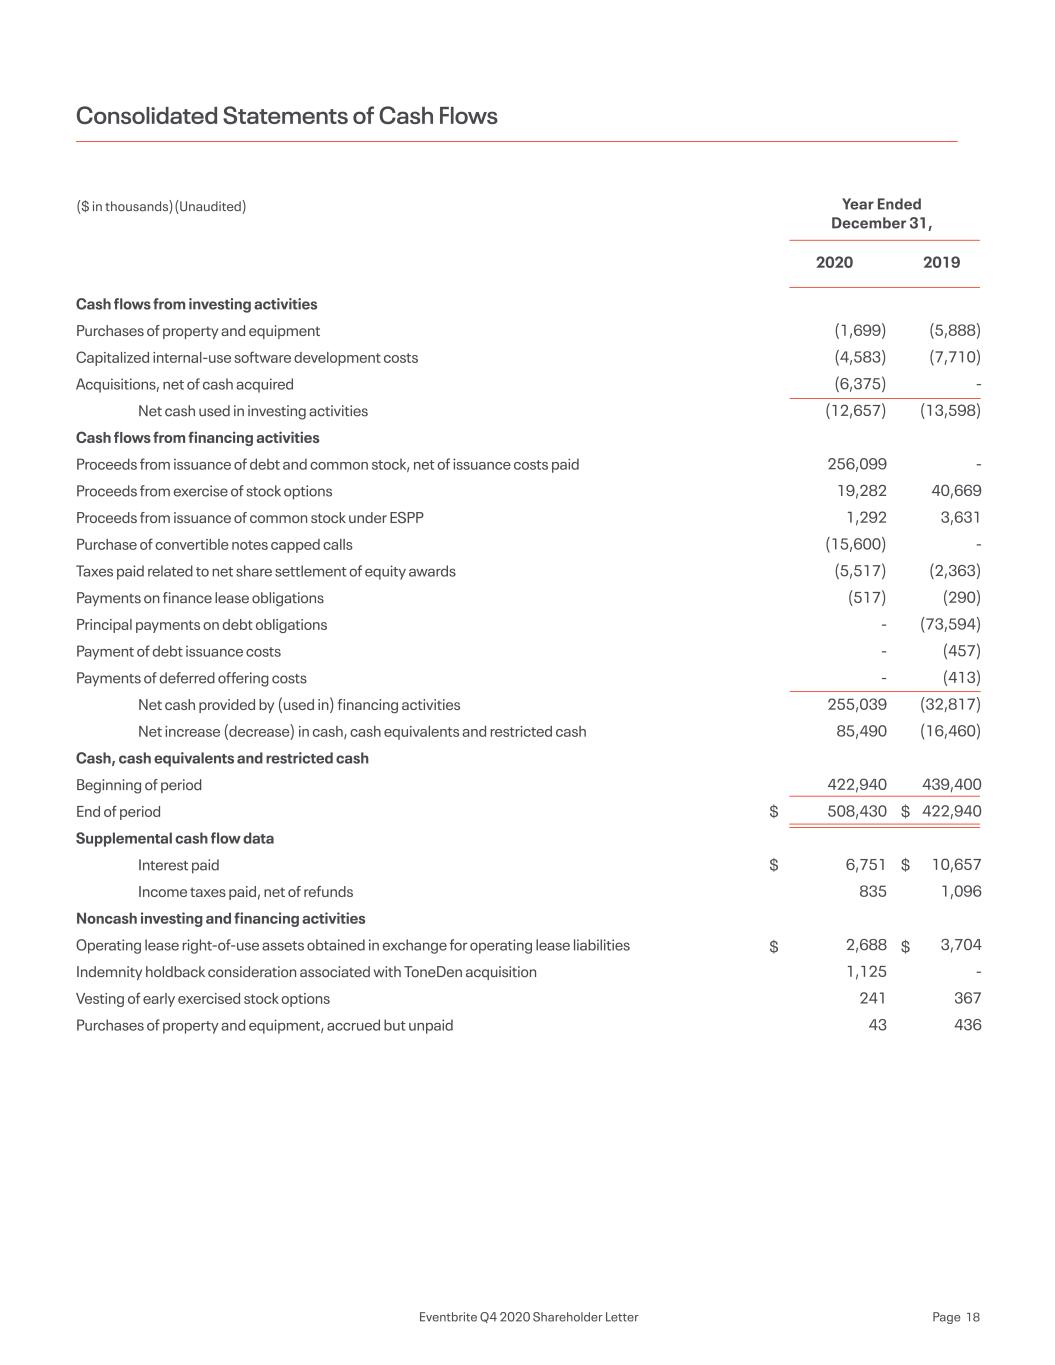
Cash flows from investing activities Purchases of property and equipment Capitalized internal-use software development costs Acquisitions, net of cash acquired Net cash used in investing activities Cash flows from financing activities Proceeds from issuance of debt and common stock, net of issuance costs paid Proceeds from exercise of stock options Proceeds from issuance of common stock under ESPP Purchase of convertible notes capped calls Taxes paid related to net share settlement of equity awards Payments on finance lease obligations Principal payments on debt obligations Payment of debt issuance costs Payments of deferred offering costs Net cash provided by (used in) financing activities Net increase (decrease) in cash, cash equivalents and restricted cash Cash, cash equivalents and restricted cash Beginning of period End of period Supplemental cash flow data Interest paid Income taxes paid, net of refunds Noncash investing and financing activities Operating lease right-of-use assets obtained in exchange for operating lease liabilities Indemnity holdback consideration associated with ToneDen acquisition Vesting of early exercised stock options Purchases of property and equipment, accrued but unpaid (1,699) (4,583) (6,375) (12,657) 256,099 19,282 1,292 (15,600) (5,517) (517) - - - 255,039 85,490 422,940 508,430 6,751 835 2,688 1,125 241 43 (5,888) (7,710) - (13,598) - 40,669 3,631 - (2,363) (290) (73,594) (457) (413) (32,817) (16,460) 439,400 422,940 10,657 1,096 3,704 - 367 436 Consolidated Statements of Cash Flows ($ in thousands)(Unaudited) Year Ended December 31, 2020 2019 $ $ $ $ $ $ Eventbrite Q4 2020 Shareholder Letter Page 18
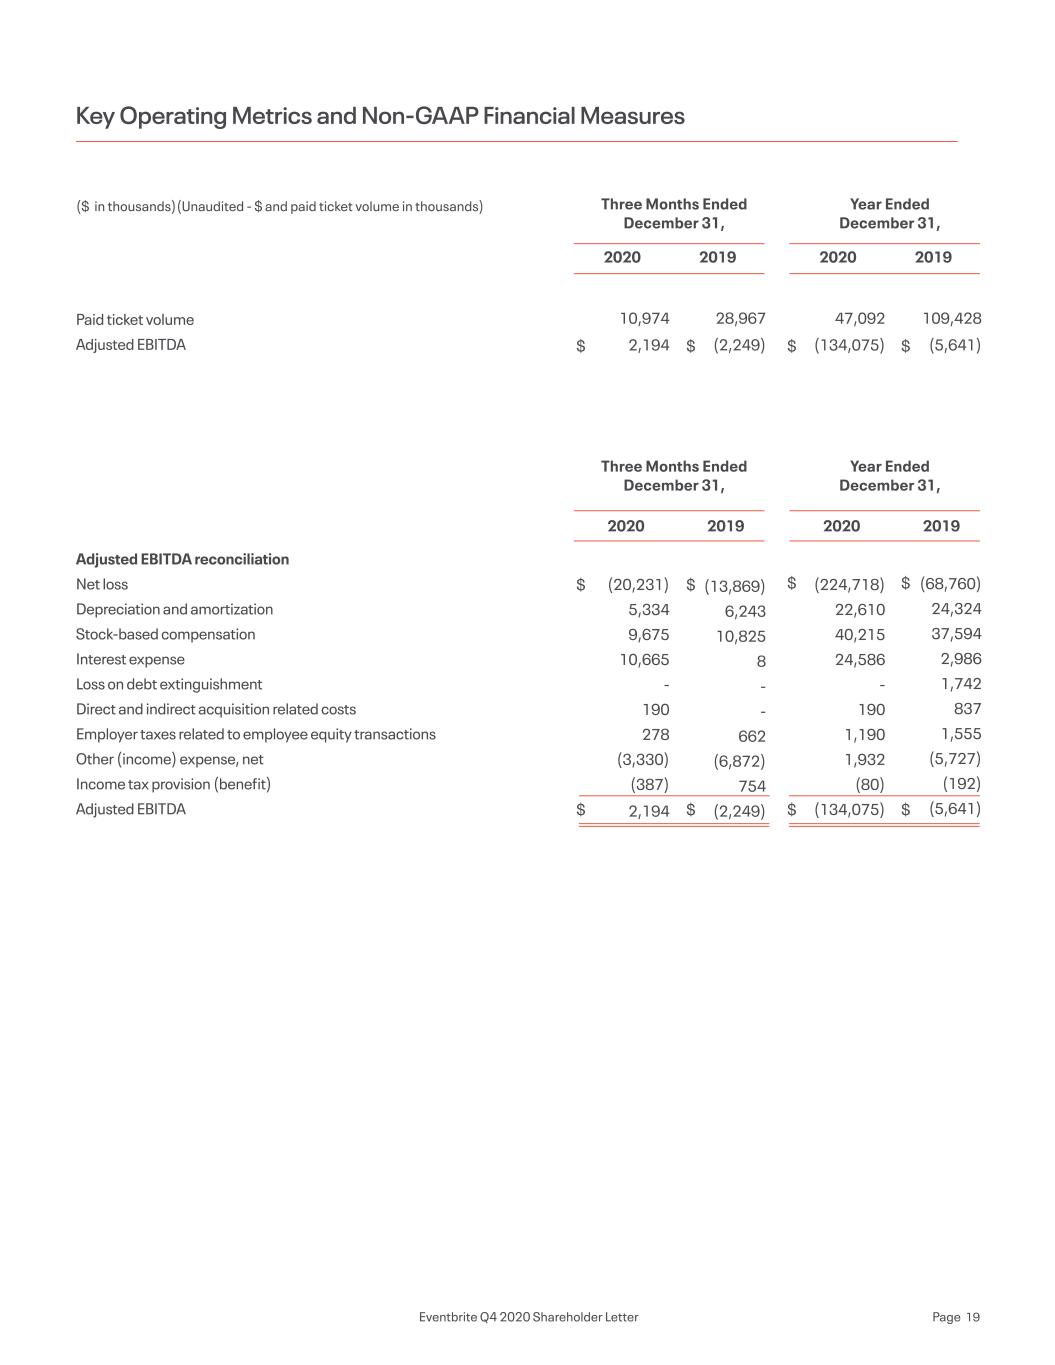
Paid ticket volume Adjusted EBITDA Adjusted EBITDA reconciliation Net loss Depreciation and amortization Stock-based compensation Interest expense Loss on debt extinguishment Direct and indirect acquisition related costs Employer taxes related to employee equity transactions Other (income) expense, net Income tax provision (benefit) Adjusted EBITDA 47,092 (134,075) (224,718) 22,610 40,215 24,586 - 190 1,190 1,932 (80) (134,075) 10,974 2,194 (20,231) 5,334 9,675 10,665 - 190 278 (3,330) (387) 2,194 109,428 (5,641) (68,760) 24,324 37,594 2,986 1,742 837 1,555 (5,727) (192) (5,641) 28,967 (2,249) (13,869) 6,243 10,825 8 - - 662 (6,872) 754 (2,249) Key Operating Metrics and Non-GAAP Financial Measures ($ in thousands)(Unaudited - $ and paid ticket volume in thousands) Year Ended December 31, Three Months Ended December 31, Year Ended December 31, Three Months Ended December 31, 20202020 20202020 20192019 20192019 $ $ $ $ $ $ $ $ $ $ $ $ Eventbrite Q4 2020 Shareholder Letter Page 19
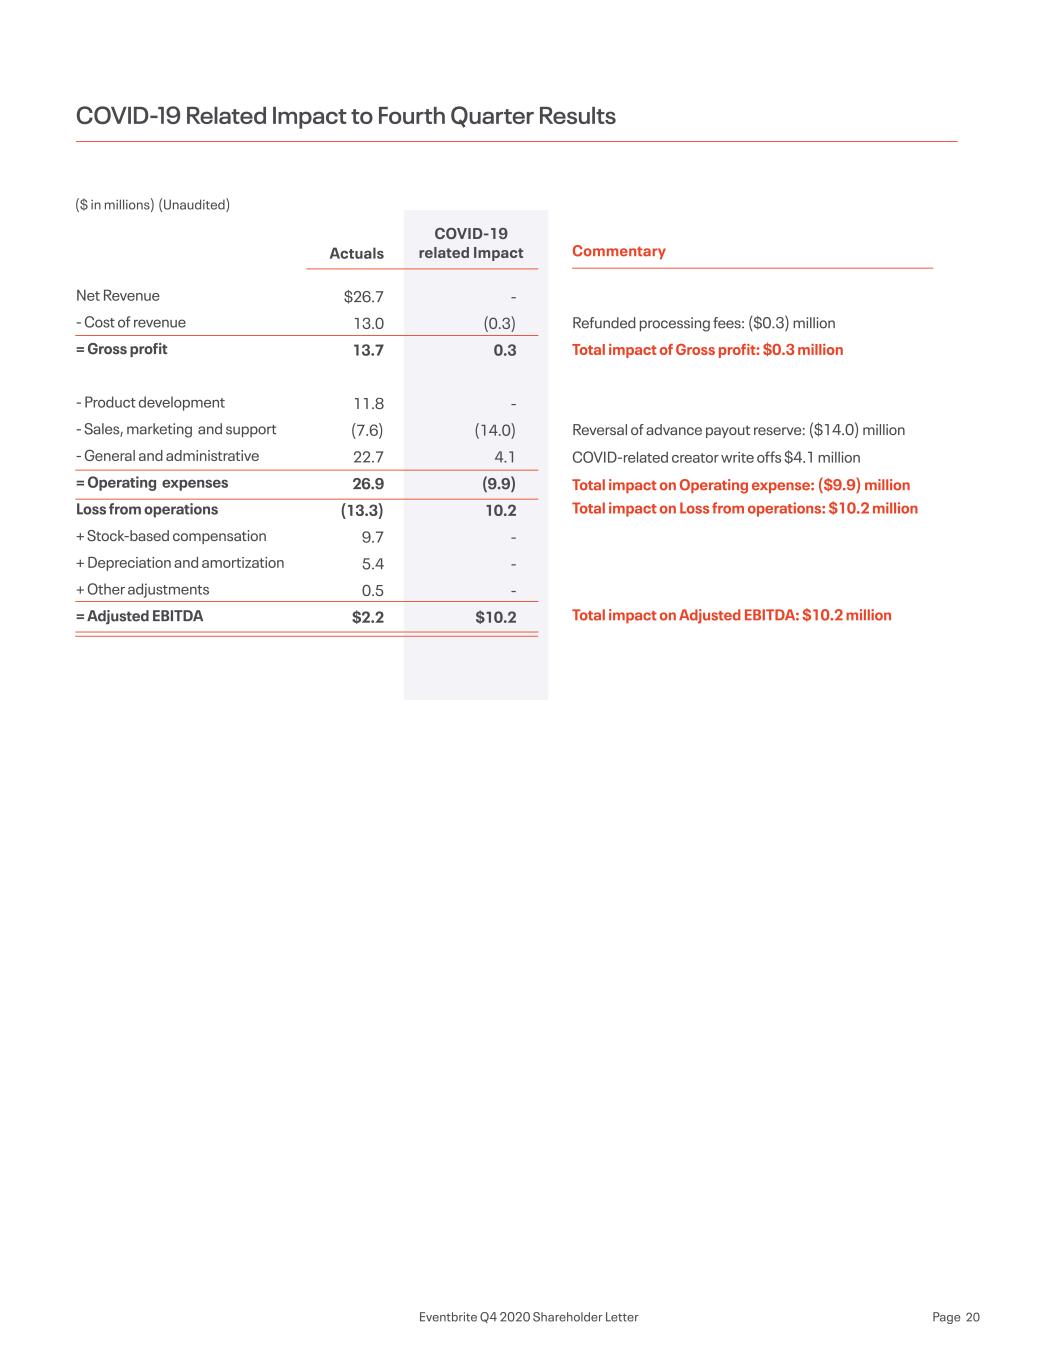
- (0.3) 0.3 - (14.0) 4.1 (9.9) 10.2 - - - $10.2 Net Revenue - Cost of revenue = Gross profit - Product development - Sales, marketing and support - General and administrative = Operating expenses Loss from operations + Stock-based compensation + Depreciation and amortization + Other adjustments = Adjusted EBITDA Refunded processing fees: ($0.3) million Total impact of Gross profit: $0.3 million Reversal of advance payout reserve: ($14.0) million COVID-related creator write offs $4.1 million Total impact on Operating expense: ($9.9) million Total impact on Loss from operations: $10.2 million Total impact on Adjusted EBITDA: $10.2 million COVID-19 Related Impact to Fourth Quarter Results Actuals COVID-19 related Impact Commentary $26.7 13.0 13.7 11.8 (7.6) 22.7 26.9 (13.3) 9.7 5.4 0.5 $2.2 ($ in millions) (Unaudited) Eventbrite Q4 2020 Shareholder Letter Page 20
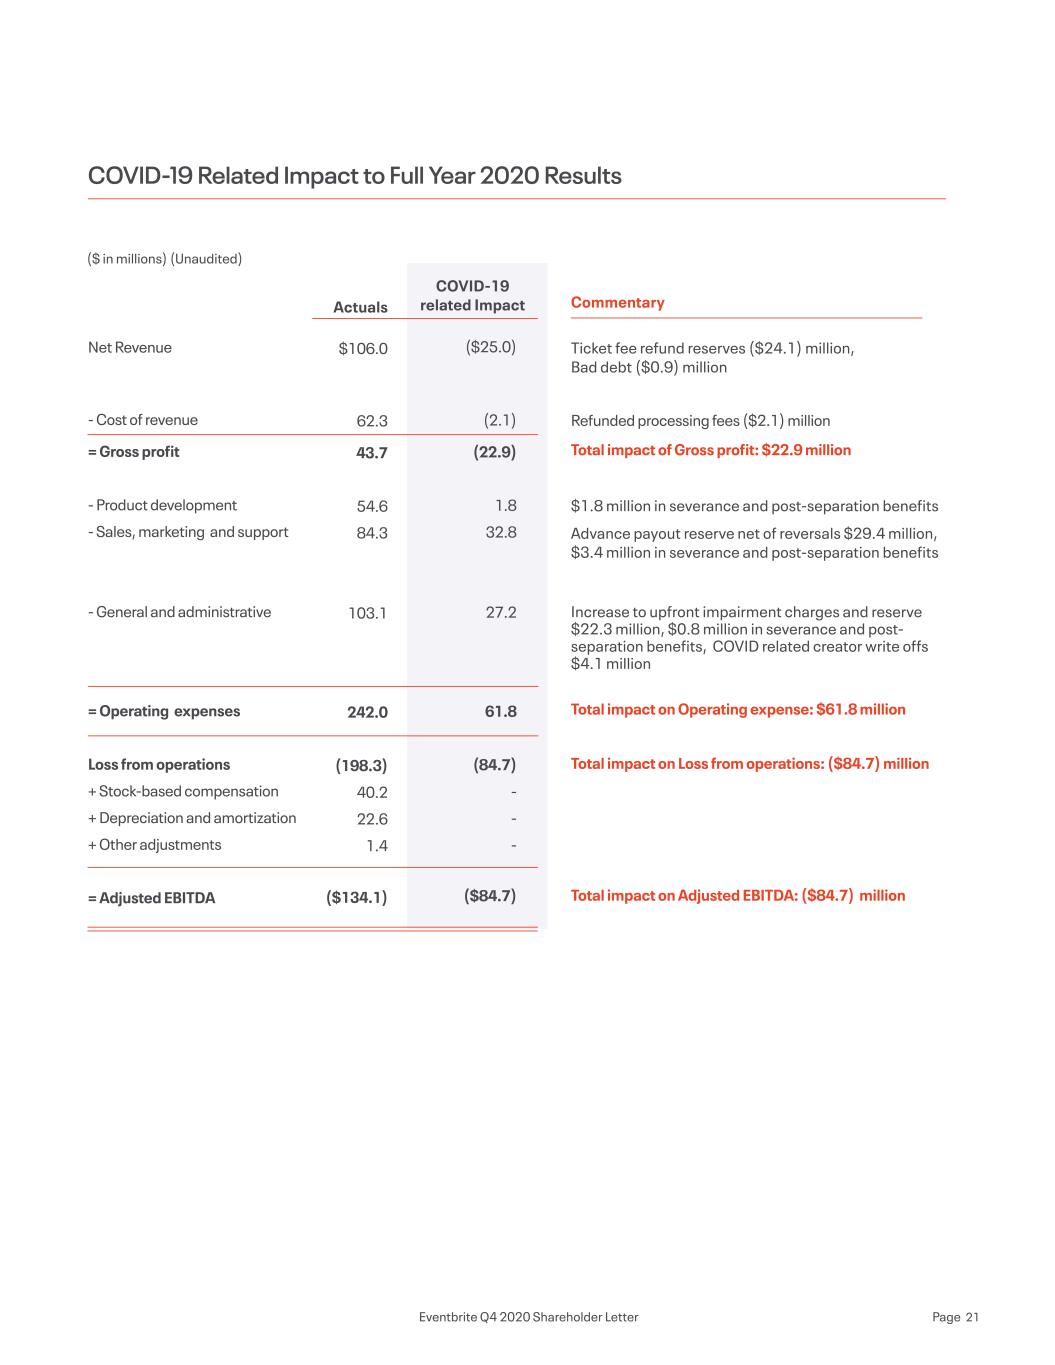
($25.0) (2.1) (22.9) 1.8 32.8 27.2 61.8 (84.7) - - - ($84.7) Net Revenue - Cost of revenue = Gross profit - Product development - Sales, marketing and support - General and administrative = Operating expenses Loss from operations + Stock-based compensation + Depreciation and amortization + Other adjustments = Adjusted EBITDA Ticket fee refund reserves ($24.1) million, Bad debt ($0.9) million Refunded processing fees ($2.1) million Total impact of Gross profit: $22.9 million $1.8 million in severance and post-separation benefits Advance payout reserve net of reversals $29.4 million, $3.4 million in severance and post-separation benefits Increase to upfront impairment charges and reserve $22.3 million, $0.8 million in severance and post- separation benefits, COVID related creator write offs $4.1 million Total impact on Operating expense: $61.8 million Total impact on Loss from operations: ($84.7) million Total impact on Adjusted EBITDA: ($84.7) million COVID-19 Related Impact to Full Year 2020 Results Actuals COVID-19 related Impact Commentary $106.0 62.3 43.7 54.6 84.3 103.1 242.0 (198.3) 40.2 22.6 1.4 ($134.1) ($ in millions) (Unaudited) Eventbrite Q4 2020 Shareholder Letter Page 21


