Table of Contents
UNITED STATES
SECURITIES AND EXCHANGE COMMISSION
Washington, D.C. 20549
Form 6-K
REPORT OF FOREIGN PRIVATE ISSUER
PURSUANT TO RULE 13a-16 OR 15d-16
UNDER THE SECURITIES EXCHANGE ACT OF 1934
For the month of August, 2011.
Commission File Number 333-170434
Sumitomo Mitsui Trust Holdings, Inc.
(Translation of registrant’s name into English)
9-2, Marunouchi, 1-chome
Chiyoda-ku, Tokyo 100-6611
Japan
(Address of principal executive office)
Indicate by check mark whether the registrant files or will file annual reports under cover of Form 20-F or Form 40-F. Form 20-F: x Form 40-F: ¨
Indicate by check mark if the registrant is submitting the Form 6-K in paper as permitted by Regulation S-T Rule 101(b)(1): ¨
Indicate by check mark if the registrant is submitting the Form 6-K in paper as permitted by Regulation S-T Rule 101(b)(7): ¨
Indicate by check mark whether the registrant by furnishing the information contained in this Form is also thereby furnishing the information to the Commission pursuant to Rule 12g3-2(b) under the Securities Exchange Act of 1934. Yes ¨ No ¨
If “Yes” is marked, indicate below the file number assigned to the registrant in connection with Rule 12g3-2(b): 82- .
Table of Contents
This report on Form 6-K contains the following:
| 1. | Capital Adequacy Ratio as of June 30, 2011 |
| 2. | IR Material for 1QFY2011 |
Table of Contents
SIGNATURES
Pursuant to the requirements of the Securities Exchange Act of 1934, the registrant has duly caused this report to be signed on its behalf by the undersigned, thereunto duly authorized.
| Sumitomo Mitsui Trust Holdings, Inc. | ||||
| Date: August 15, 2011 | By: | /s/ Tadashi Nishimura | ||
| Name: | Tadashi Nishimura | |||
| Title: | Executive Officer | |||
Table of Contents
August 15, 2011 |
Sumitomo Mitsui Trust Holdings, Inc.
(Code: 8309)
Capital Adequacy Ratio as of June 30, 2011
Sumitomo Mitsui Trust Holdings, Inc. hereby announces the capital adequacy ratio as of June 30, 2011 as follows:
<Sumitomo Mitsui Trust Holdings, Inc.>
[International standard]
| (Consolidated) | ||||
(Billions of yen) | June 30, 2011 | |||
(1) BIS capital adequacy ratio | 16.23 | % | ||
Tier I capital ratio | 11.50 | % | ||
(2) Tier I capital | 2,086.4 | |||
(3) Tier II capital | 967.0 | |||
(4) Deduction | 108.7 | |||
(5) Total qualifying capital (2)+(3)-(4) | 2,944.7 | |||
(6) Total risk-weighted assets | 18,133.9 | |||
(7) Total required capital (6) x 8% | 1,450.7 | |||
<The Chuo Mitsui Trust and Banking Company, Limited>
[Domestic standard]
| (Consolidated) | (Non-consolidated) | |||||||||||||||
| June 30, 2011 | March 31, 2011 | June 30, 2011 | ||||||||||||||
(Billions of yen) | Change | |||||||||||||||
(1) BIS capital adequacy ratio | 16.52 | % | 1.05 | % | 15.47 | % | 16.76 | % | ||||||||
Tier I capital ratio | 11.27 | % | 0.76 | % | 10.51 | % | 11.63 | % | ||||||||
(2) Tier I capital | 710.5 | 14.0 | 696.4 | 743.3 | ||||||||||||
(3) Tier II capital | 341.9 | (1.8 | ) | 343.7 | 341.9 | |||||||||||
(4) Deduction | 11.1 | (4.2 | ) | 15.4 | 14.3 | |||||||||||
(5) Total qualifying capital (2)+(3)-(4) | 1,041.2 | 16.4 | 1,024.7 | 1,070.9 | ||||||||||||
(6) Total risk-weighted assets | 6,300.5 | (322.0 | ) | 6,622.5 | 6,388.0 | |||||||||||
(7) Total required capital (6) x 8% | 504.0 | (25.7 | ) | 529.8 | 511.0 | |||||||||||
Note: Though the bank use domestic standard, as we have adopted the foundation internal ratings-based approach, we use 8% for calculation of total required capital.
<Chuo Mitsui Asset Trust and Banking Company, Limited>
[Domestic standard]
| (Non-consolidated) | ||||||||||||
| June 30, 2011 | March 31, 2011 | |||||||||||
(Billions of yen) | Change | |||||||||||
(1) BIS capital adequacy ratio | 33.18 | % | 1.74 | % | 31.44 | % | ||||||
Tier I capital ratio | 33.18 | % | 1.74 | % | 31.44 | % | ||||||
(2) Tier I capital | 36.8 | 1.5 | 35.2 | |||||||||
(3) Tier II capital | — | — | — | |||||||||
(4) Deduction | — | — | — | |||||||||
(5) Total qualifying capital (2)+(3)-(4) | 36.8 | 1.5 | 35.2 | |||||||||
(6) Total risk-weighted assets | 111.1 | (1.1 | ) | 112.2 | ||||||||
(7) Total required capital (6) x 4% | 4.4 | (0.0 | ) | 4.4 | ||||||||
<The Sumitomo Trust and Banking Co., Ltd.>
[International standard]
| (Consolidated) | (Non-consolidated) | |||||||||||||||
| June 30, 2011 | March 31, 2011 | June 30, 2011 | ||||||||||||||
(Billions of yen) | Change | |||||||||||||||
(1) BIS capital adequacy ratio | 16.12 | % | 0.49 | % | 15.63 | % | 17.57 | % | ||||||||
Tier I capital ratio | 11.60 | % | 0.51 | % | 11.09 | % | 12.78 | % | ||||||||
(2) Tier I capital | 1,355.1 | 21.2 | 1,333.9 | 1,395.8 | ||||||||||||
(3) Tier II capital | 625.1 | (21.5 | ) | 646.6 | 611.6 | |||||||||||
(4) Deduction | 97.5 | (2.0 | ) | 99.6 | 88.3 | |||||||||||
(5) Total qualifying capital (2)+(3)-(4) | 1,882.6 | 1.7 | 1,880.8 | 1,919.1 | ||||||||||||
(6) Total risk-weighted assets | 11,675.0 | (352.9 | ) | 12,028.0 | 10,921.7 | |||||||||||
(7) Total required capital (6) x 8% | 934.0 | (28.2 | ) | 962.2 | 873.7 | |||||||||||
For further information, please contact:
IR Office, Financial Planning Department
Sumitomo Mitsui Trust Holdings, Inc.
Telephone: +81-3-3286-8354, Fax: +81-3-3286-4654
Table of Contents
Sumitomo Mitsui Trust Holdings, Inc.
IR Material for 1QFY2011
August 15, 2011
“Status of capital” (Page10) was added, in accordance with the announcement of capital adequacy ratio as of June 30, 2011.
August 4, 2011
Table of Contents
This presentation material contains information that constitutes forward-looking statements. Such forward-looking statements are not guarantees of future performance and involve risks and uncertainties, and actual results may differ from those in the forward-looking statements as a result of various factors including changes in managerial circumstances. This presentation does not constitute an offer to sell or a solicitation of an offer to subscribe for or purchase any securities.
Definitions of terms in this document
Consolidated two-company total: Former Chuo Mitsui Trust Holdings (Consolidated) + Sumitomo Trust and Banking (Consolidated)
Non-consolidated (Three-company total): Chuo Mitsui Trust and Banking (Non-consolidated) + Chuo Mitsui Asset Trust and Banking (Non-consolidated) + Sumitomo Trust and Banking (Non-consolidated)
Non-consolidated (Two-company total): Chuo Mitsui Trust and Banking (Non-consolidated) + Sumitomo Trust and Banking
(Non-consolidated) CMTB+CMAB (Non-consolidated): Chuo Mitsui Trust and Banking (Non-consolidated) + Chuo Mitsui Asset Trust and Banking (Non-consolidated)
Accounting for Business combination related to Management Integration
Applying accounting method for business combination: “Purchase accounting method”, and its amount of effect: “Results of applying purchase accounting method”
Table of Contents
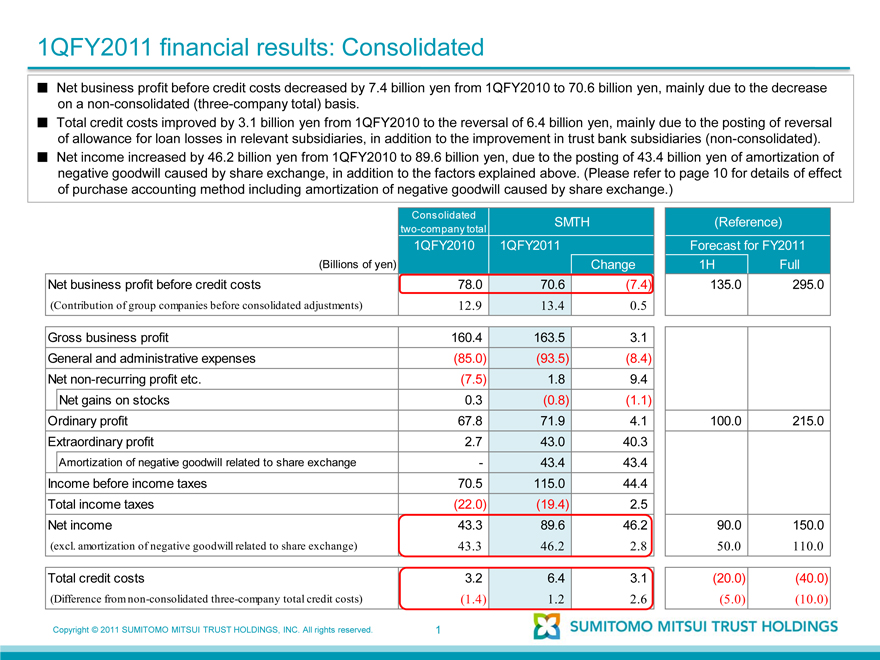
1QFY2011 financial results: Consolidated
Net business profit before credit costs decreased by 7.4 billion yen from 1QFY2010 to 70.6 billion yen, mainly due to the decrease on a non-consolidated (three-company total) basis.
Total credit costs improved by 3.1 billion yen from 1QFY2010 to the reversal of 6.4 billion yen, mainly due to the posting of reversal of allowance for loan losses in relevant subsidiaries, in addition to the improvement in trust bank subsidiaries (non-consolidated).
Net income increased by 46.2 billion yen from 1QFY2010 to 89.6 billion yen, due to the posting of 43.4 billion yen of amortization of negative goodwill caused by share exchange, in addition to the factors explained above. (Please refer to page 10 for details of effect of purchase accounting method including amortization of negative goodwill caused by share exchange.)
Consolidated
two-company total SMTH (Reference)
1QFY2010 1QFY2011 Forecast for FY2011
(Billions of yen) Change 1H Full
Net business profit before credit costs 78.0 70.6 (7.4) 135.0 295.0
(Contribution of group companies before consolidated adjustments) 12.9 13.4 0.5
Gross business profit 160.4 163.5 3.1
General and administrative expenses (85.0) (93.5) (8.4)
Net non-recurring profit etc. (7.5) 1.8 9.4
Net gains on stocks 0.3 (0.8) (1.1)
Ordinary profit 67.8 71.9 4.1 100.0 215.0
Extraordinary profit 2.7 43.0 40.3
Amortization of negative goodwill related to share exchange - 43.4 43.4
Income before income taxes 70.5 115.0 44.4
Total income taxes (22.0) (19.4) 2.5
Net income 43.3 89.6 46.2 90.0 150.0
(excl. amortization of negative goodwill related to share exchange) 43.3 46.2 2.8 50.0 110.0
Total credit costs 3.2 6.4 3.1 (20.0) (40.0)
(Difference from non-consolidated three-company total credit costs) (1.4) 1.2 2.6 (5.0) (10.0)
Copyright © 2011 SUMITOMO MITSUI TRUST HOLDINGS, INC. All rights reserved.
1
Table of Contents
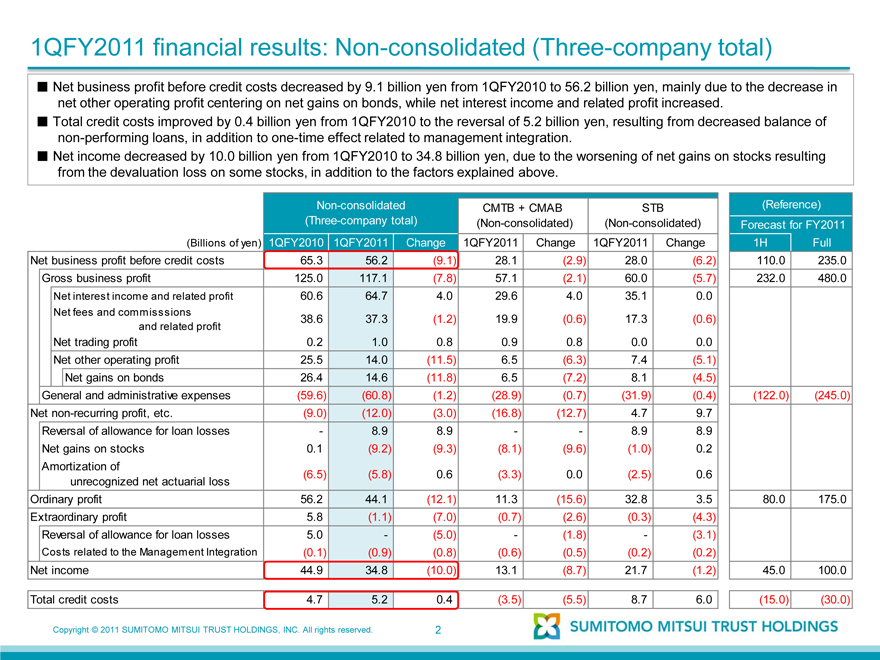
1QFY2011 financial results: Non-consolidated (Three-company total)
Net business profit before credit costs decreased by 9.1 billion yen from 1QFY2010 to 56.2 billion yen, mainly due to the decrease in net other operating profit centering on net gains on bonds, while net interest income and related profit increased.
Total credit costs improved by 0.4 billion yen from 1QFY2010 to the reversal of 5.2 billion yen, resulting from decreased balance of non-performing loans, in addition to one-time effect related to management integration.
Net income decreased by 10.0 billion yen from 1QFY2010 to 34.8 billion yen, due to the worsening of net gains on stocks resulting from the devaluation loss on some stocks, in addition to the factors explained above.
Non-consolidated CMTB + CMAB STB (Reference)
(Three-company total) (Non-consolidated) (Non-consolidated) Forecast for FY2011
(Billions of yen) 1QFY2010 1QFY2011 Change 1QFY2011 Change 1QFY2011 Change 1H Full
Net business profit before credit costs 65.3 56.2 (9.1) 28.1 (2.9) 28.0 (6.2) 110.0 235.0
Gross business profit 125.0 117.1 (7.8) 57.1 (2.1) 60.0 (5.7) 232.0 480.0
Net interest income and related profit 60.6 64.7 4.0 29.6 4.0 35.1 0.0
Net fees and commisssions 38.6 37.3 (1.2) 19.9 (0.6) 17.3 (0.6)
and related profit
Net trading profit 0.2 1.0 0.8 0.9 0.8 0.0 0.0
Net other operating profit 25.5 14.0 (11.5) 6.5 (6.3) 7.4 (5.1)
Net gains on bonds 26.4 14.6 (11.8) 6.5 (7.2) 8.1 (4.5)
General and administrative expenses (59.6) (60.8) (1.2) (28.9) (0.7) (31.9) (0.4) (122.0) (245.0)
Net non-recurring profit, etc. (9.0) (12.0) (3.0) (16.8) (12.7) 4.7 9.7
Reversal of allowance for loan losses - 8.9 8.9 - - 8.9 8.9
Net gains on stocks 0.1 (9.2) (9.3) (8.1) (9.6) (1.0) 0.2
Amortization of
unrecognized net actuarial loss (6.5) (5.8) 0.6 (3.3) 0.0 (2.5) 0.6
Ordinary profit 56.2 44.1 (12.1) 11.3 (15.6) 32.8 3.5 80.0 175.0
Extraordinary profit 5.8 (1.1) (7.0) (0.7) (2.6) (0.3) (4.3)
Reversal of allowance for loan losses 5.0 - (5.0) - (1.8) - (3.1)
Costs related to the Management Integration (0.1) (0.9) (0.8) (0.6) (0.5) (0.2) (0.2)
Net income 44.9 34.8 (10.0) 13.1 (8.7) 21.7 (1.2) 45.0 100.0
Total credit costs 4.7 5.2 0.4 (3.5) (5.5) 8.7 6.0 (15.0) (30.0)
Copyright © 2011 SUMITOMO MITSUI TRUST HOLDINGS, INC. All rights reserved.
2
Table of Contents
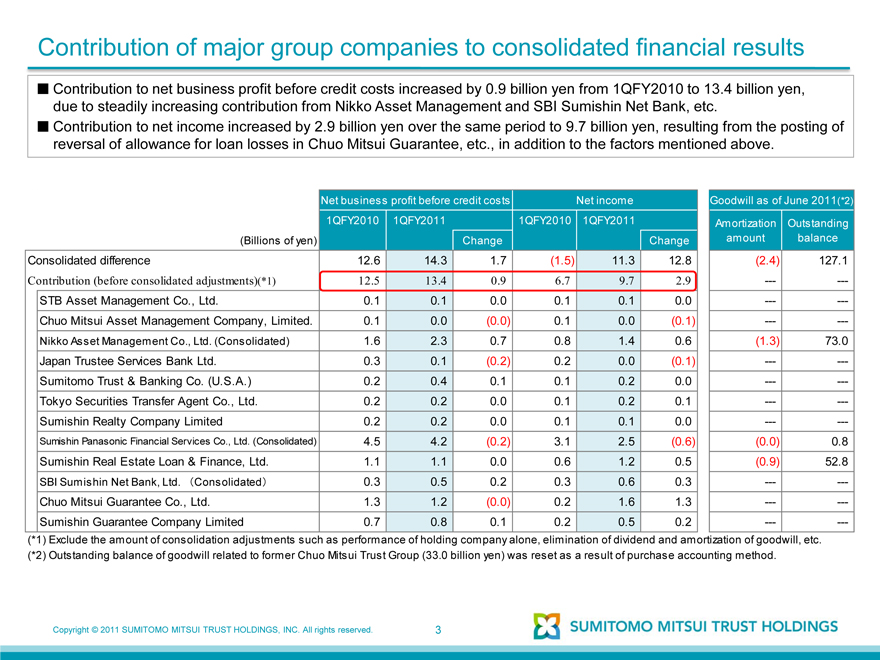
Contribution of major group companies to consolidated financial results
Contribution to net business profit before credit costs increased by 0.9 billion yen from 1QFY2010 to 13.4 billion yen, due to steadily increasing contribution from Nikko Asset Management and SBI Sumishin Net Bank, etc.
Contribution to net income increased by 2.9 billion yen over the same period to 9.7 billion yen, resulting from the posting of reversal of allowance for loan losses in Chuo Mitsui Guarantee, etc., in addition to the factors mentioned above.
Net business profit before credit costs Net income Goodwill as of June 2011(*2)
1QFY2010 1QFY2011 1QFY2010 1QFY2011 Amortization Outstanding
(Billions of yen) Change Change amount balance
Consolidated difference 12.6 14.3 1.7 (1.5) 11.3 12.8 (2.4) 127.1
Contribution (before consolidated adjustments)(*1) 12.5 13.4 0.9 6.7 9.7 2.9 - -
STB Asset Management Co., Ltd. 0.1 0.1 0.0 0.1 0.1 0.0 - -
Chuo Mitsui Asset Management Company, Limited. 0.1 0.0 (0.0) 0.1 0.0 (0.1) - -
Nikko Asset Management Co., Ltd. (Consolidated) 1.6 2.3 0.7 0.8 1.4 0.6 (1.3) 73.0
Japan Trustee Services Bank Ltd. 0.3 0.1 (0.2) 0.2 0.0 (0.1) - -
Sumitomo Trust & Banking Co. (U.S.A.) 0.2 0.4 0.1 0.1 0.2 0.0 - -
Tokyo Securities Transfer Agent Co., Ltd. 0.2 0.2 0.0 0.1 0.2 0.1 - -
Sumishin Realty Company Limited 0.2 0.2 0.0 0.1 0.1 0.0 - -
Sumishin Panasonic Financial Services Co., Ltd. (Consolidated) 4.5 4.2 (0.2) 3.1 2.5 (0.6) (0.0) 0.8
Sumishin Real Estate Loan & Finance, Ltd. 1.1 1.1 0.0 0.6 1.2 0.5 (0.9) 52.8
SBI Sumishin Net Bank, Ltd. (Consolidated) 0.3 0.5 0.2 0.3 0.6 0.3 - -
Chuo Mitsui Guarantee Co., Ltd. 1.3 1.2 (0.0) 0.2 1.6 1.3 - -
Sumishin Guarantee Company Limited 0.7 0.8 0.1 0.2 0.5 0.2 - -
(*1) Exclude the amount of consolidation adjustments such as performance of holding company alone, elimination of dividend and amortization of goodwill, etc.
(*2) Outstanding balance of goodwill related to former Chuo Mitsui Trust Group (33.0 billion yen) was reset as a result of purchase accounting method.
Copyright © 2011 SUMITOMO MITSUI TRUST HOLDINGS, INC. All rights reserved.
3
Table of Contents
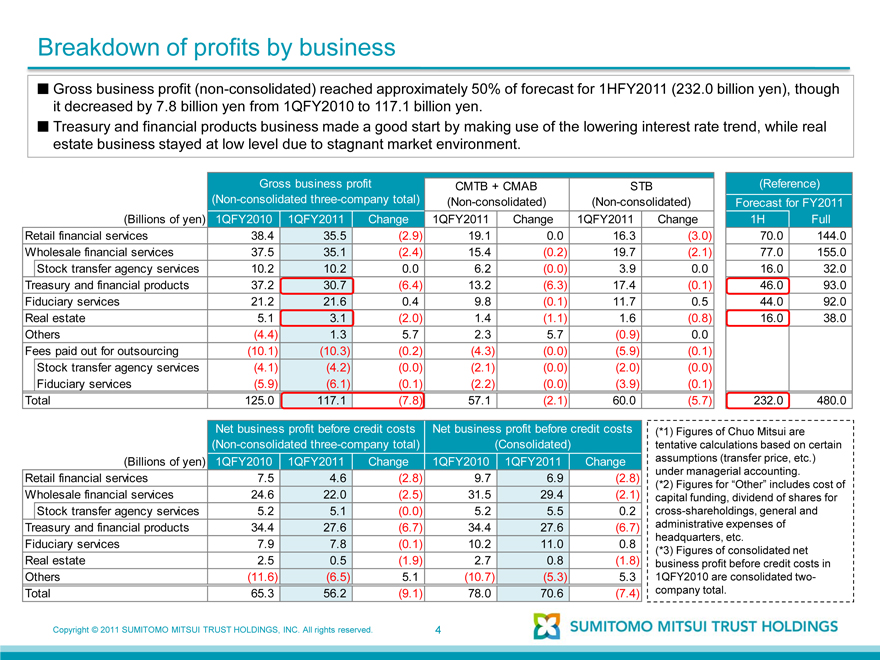
Breakdown of profits by business
Gross business profit (non-consolidated) reached approximately 50% of forecast for 1HFY2011 (232.0 billion yen), though it decreased by 7.8 billion yen from 1QFY2010 to 117.1 billion yen.
Treasury and financial products business made a good start by making use of the lowering interest rate trend, while real estate business stayed at low level due to stagnant market environment.
Gross business profit CMTB + CMAB STB (Reference)
(Non-consolidated three-company total) (Non-consolidated) (Non-consolidated) Forecast for FY2011
(Billions of yen) 1QFY2010 1QFY2011 Change 1QFY2011 Change 1QFY2011 Change 1H Full
Retail financial services 38.4 35.5 (2.9) 19.1 0.0 16.3 (3.0) 70.0 144.0
Wholesale financial services 37.5 35.1 (2.4) 15.4 (0.2) 19.7 (2.1) 77.0 155.0
Stock transfer agency services 10.2 10.2 0.0 6.2 (0.0) 3.9 0.0 16.0 32.0
Treasury and financial products 37.2 30.7 (6.4) 13.2 (6.3) 17.4 (0.1) 46.0 93.0
Fiduciary services 21.2 21.6 0.4 9.8 (0.1) 11.7 0.5 44.0 92.0
Real estate 5.1 3.1 (2.0) 1.4 (1.1) 1.6 (0.8) 16.0 38.0
Others (4.4) 1.3 5.7 2.3 5.7 (0.9) 0.0
Fees paid out for outsourcing (10.1) (10.3) (0.2) (4.3) (0.0) (5.9) (0.1)
Stock transfer agency services (4.1) (4.2) (0.0) (2.1) (0.0) (2.0) (0.0)
Fiduciary services (5.9) (6.1) (0.1) (2.2) (0.0) (3.9) (0.1)
Total 125.0 117.1 (7.8) 57.1 (2.1) 60.0 (5.7) 232.0 480.0
Net business profit before credit costs Net business profit before credit costs (*1) Figures of Chuo Mitsui are
(Non-consolidated three-company total) (Consolidated) tentative calculations based on certain
(Billions of yen) 1QFY2010 1QFY2011 Change 1QFY2010 1QFY2011 Change assumptions (transfer price, etc.)
Retail financial services 7.5 4.6 (2.8) 9.7 6.9 (2.8) under managerial accounting.
(*2) Figures for “Other” includes cost
Wholesale financial services 24.6 22.0 (2.5) 31.5 29.4 (2.1) of capital funding, dividend of shares
Stock transfer agency services 5.2 5.1 (0.0) 5.2 5.5 0.2 for cross-shareholdings, general and
Treasury and financial products 34.4 27.6 (6.7) 34.4 27.6 (6.7) administrative expenses of
Fiduciary services 7.9 7.8 (0.1) 10.2 11.0 0.8 headquarters, etc.
(*3) Figures of consolidated net
Real estate 2.5 0.5 (1.9) 2.7 0.8 (1.8) business profit before credit costs in
Others (11.6) (6.5) 5.1 (10.7) (5.3) 5.3 1QFY2010 are consolidated two-
Total 65.3 56.2 (9.1) 78.0 70.6 (7.4) company total.
Copyright © 2011 SUMITOMO MITSUI TRUST HOLDINGS, INC. All rights reserved.
4
Table of Contents
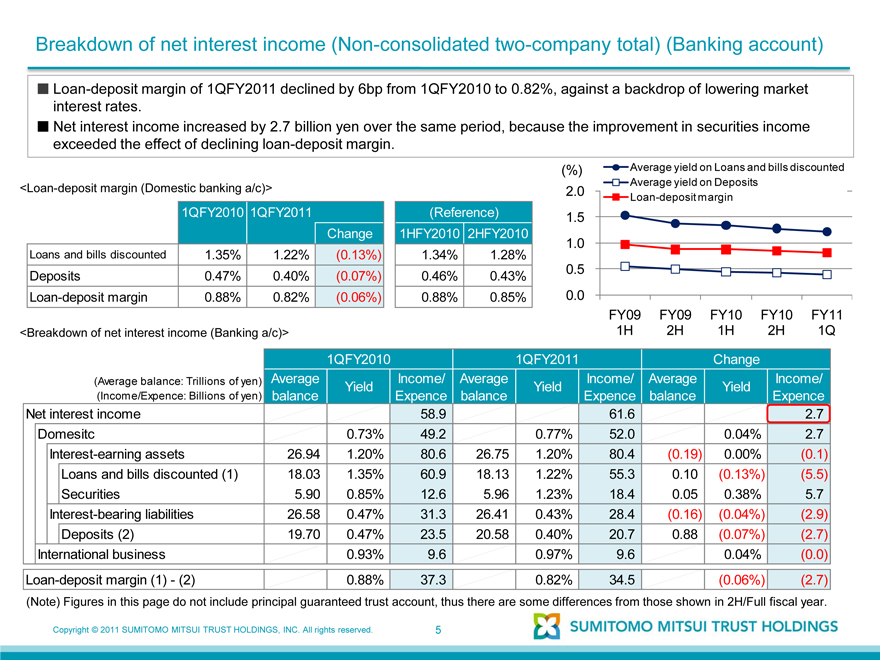
Breakdown of net interest income (Non-consolidated two-company total) (Banking account)
Loan-deposit margin of 1QFY2011 declined by 6bp from 1QFY2010 to 0.82%, against a backdrop of lowering market interest rates.
Net interest income increased by 2.7 billion yen over the same period, because the improvement in securities income exceeded the effect of declining loan-deposit margin.
<Loan-deposit margin (Domestic banking a/c)>
1QFY2010 1QFY2011 (Reference)
Change 1HFY2010 2HFY2010
Loans and bills discounted 1.35% 1.22% (0.13%) 1.34% 1.28%
Deposits 0.47% 0.40% (0.07%) 0.46% 0.43%
Loan-deposit margin 0.88% 0.82% (0.06%) 0.88% 0.85%
<Breakdown of net interest income (Banking a/c)>
(%) Average yield on Loans and bills discounted
Average yield on Deposits
2.0 Loan-deposit margin
1.5
1.0
0.5
0.0
FY09 FY09 FY10 FY10 FY11
1H 2H 1H 2H 1Q
1QFY2010 1QFY2011 Change
(Average balance: Trillions of yen) Average Yield Income/ Average Yield Income/ Average Yield Income/
(Income/Expence: Billions of yen) balance Expence balance Expence balance Expence
Net interest income 58.9 61.6 2.7
Domesitc 0.73% 49.2 0.77% 52.0 0.04% 2.7
Interest-earning assets 26.94 1.20% 80.6 26.75 1.20% 80.4 (0.19) 0.00% (0.1)
Loans and bills discounted (1) 18.03 1.35% 60.9 18.13 1.22% 55.3 0.10 (0.13%) (5.5)
Securities 5.90 0.85% 12.6 5.96 1.23% 18.4 0.05 0.38% 5.7
Interest-bearing liabilities 26.58 0.47% 31.3 26.41 0.43% 28.4 (0.16) (0.04%) (2.9)
Deposits (2) 19.70 0.47% 23.5 20.58 0.40% 20.7 0.88 (0.07%) (2.7)
International business 0.93% 9.6 0.97% 9.6 0.04% (0.0)
Loan-deposit margin (1) - (2) 0.88% 37.3 0.82% 34.5 (0.06%) (2.7)
(Note) Figures in this page do not include principal guaranteed trust account, thus there are some differences from those shown in 2H/Full fiscal year.
Copyright © 2011 SUMITOMO MITSUI TRUST HOLDINGS, INC. All rights reserved. 5
Table of Contents
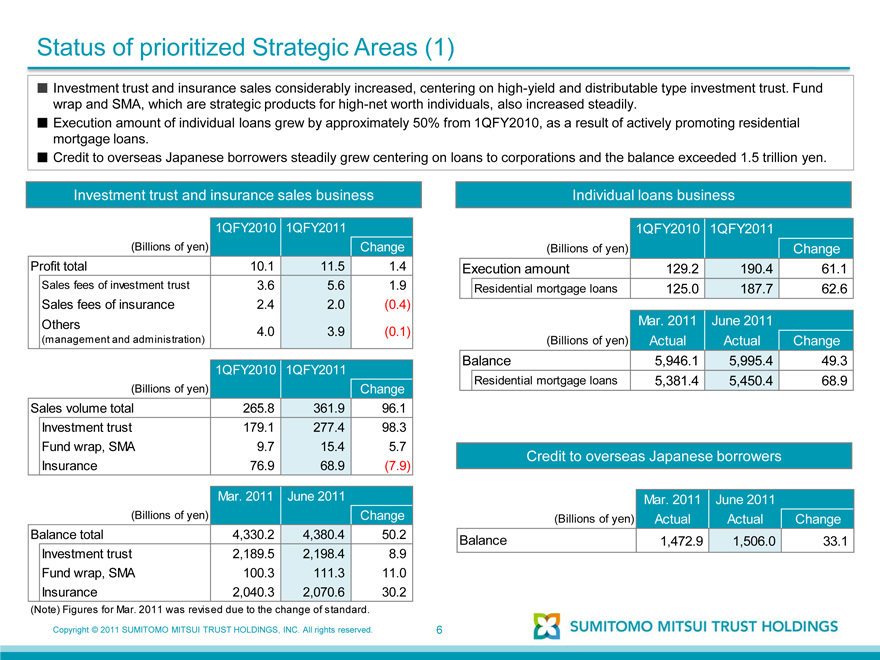
Status of prioritized Strategic Areas (1)
Investment trust and insurance sales considerably increased, centering on high-yield and distributable type investment trust. Fund wrap and SMA, which are strategic products for high-net worth individuals, also increased steadily.
Execution amount of individual loans grew by approximately 50% from 1QFY2010, as a result of actively promoting residential mortgage loans.
Credit to overseas Japanese borrowers steadily grew centering on loans to corporations and the balance exceeded 1.5 trillion yen.
Investment trust and insurance sales business
1QFY2010 1QFY2011
(Billions of yen) Change
Profit total 10.1 11.5 1.4
Sales fees of investment trust 3.6 5.6 1.9
Sales fees of insurance 2.4 2.0 (0.4)
Others 4.0 3.9 (0.1)
(management and administration)
1QFY2010 1QFY2011
(Billions of yen) Change
Sales volume total 265.8 361.9 96.1
Investment trust 179.1 277.4 98.3
Fund wrap, SMA 9.7 15.4 5.7
Insurance 76.9 68.9 (7.9)
Mar. 2011 June 2011
(Billions of yen) Change
Balance total 4,330.2 4,380.4 50.2
Investment trust 2,189.5 2,198.4 8.9
Fund wrap, SMA 100.3 111.3 11.0
Insurance 2,040.3 2,070.6 30.2
(Note) Figures for Mar. 2011 was revised due to the change of standard.
Individual loans business
1QFY2010 1QFY2011
(Billions of yen) Change
Execution amount 129.2 190.4 61.1
Residential mortgage loans 125.0 187.7 62.6
Mar. 2011 June 2011
(Billions of yen) Actual Actual Change
Balance 5,946.1 5,995.4 49.3
Residential mortgage loans 5,381.4 5,450.4 68.9
Credit to overseas Japanese borrowers
Mar. 2011 June 2011
(Billions of yen) Actual Actual Change
Balance 1,472.9 1,506.0 33.1
Copyright © 2011 SUMITOMO MITSUI TRUST HOLDINGS, INC. All rights reserved. 6
Table of Contents
Status of prioritized Strategic Areas (2)
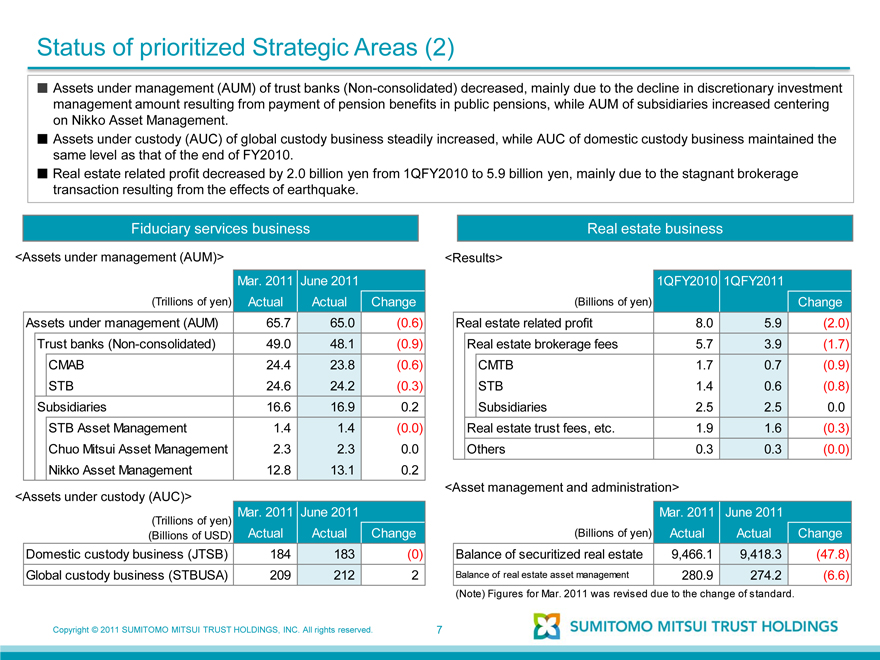
Assets under management (AUM) of trust banks (Non-consolidated) decreased, mainly due to the decline in discretionary investment management amount resulting from payment of pension benefits in public pensions, while AUM of subsidiaries increased centering on Nikko Asset Management.
Assets under custody (AUC) of global custody business steadily increased, while AUC of domestic custody business maintained the same level as that of the end of FY2010.
Real estate related profit decreased by 2.0 billion yen from 1QFY2010 to 5.9 billion yen, mainly due to the stagnant brokerage transaction resulting from the effects of earthquake.
Fiduciary services business Real estate business <Assets under management (AUM)> <Results>
Mar. 2011 June 2011 1QFY2010 1QFY2011
(Trillions of yen) Actual Actual Change (Billions of yen) Change
Assets under management (AUM) 65.7 65.0 (0.6) Real estate related profit 8.0 5.9 (2.0)
Trust banks (Non-consolidated) 49.0 48.1 (0.9) Real estate brokerage fees 5.7 3.9 (1.7)
CMAB 24.4 23.8 (0.6) CMTB 1.7 0.7 (0.9)
STB 24.6 24.2 (0.3) STB 1.4 0.6 (0.8)
Subsidiaries 16.6 16.9 0.2 Subsidiaries 2.5 2.5 0.0
STB Asset Management 1.4 1.4 (0.0) Real estate trust fees, etc. 1.9 1.6 (0.3)
Chuo Mitsui Asset Management 2.3 2.3 0.0 Others 0.3 0.3 (0.0)
Nikko Asset Management 12.8 13.1 0.2
<Assets under custody (AUC)>
Mar. 2011 June 2011 (Trillions of yen)
(Billions of USD) Actual Actual Change Domestic custody business (JTSB) 184 183 (0) Global custody business (STBUSA) 209 212 2
<Asset management and administration>
Mar. 2011 June 2011
(Billions of yen) Actual Actual Change
Balance of securitized real estate 9,466.1 9,418.3 (47.8)
Balance of real estate asset management 280.9 274.2 (6.6)
(Note) Figures for Mar. 2011 was revised due to the change of standard.
Copyright © 2011 SUMITOMO MITSUI TRUST HOLDINGS, INC. All rights reserved. 7
Table of Contents
Breakdown of total credit costs and problem assets based on the Financial Reconstruction Act
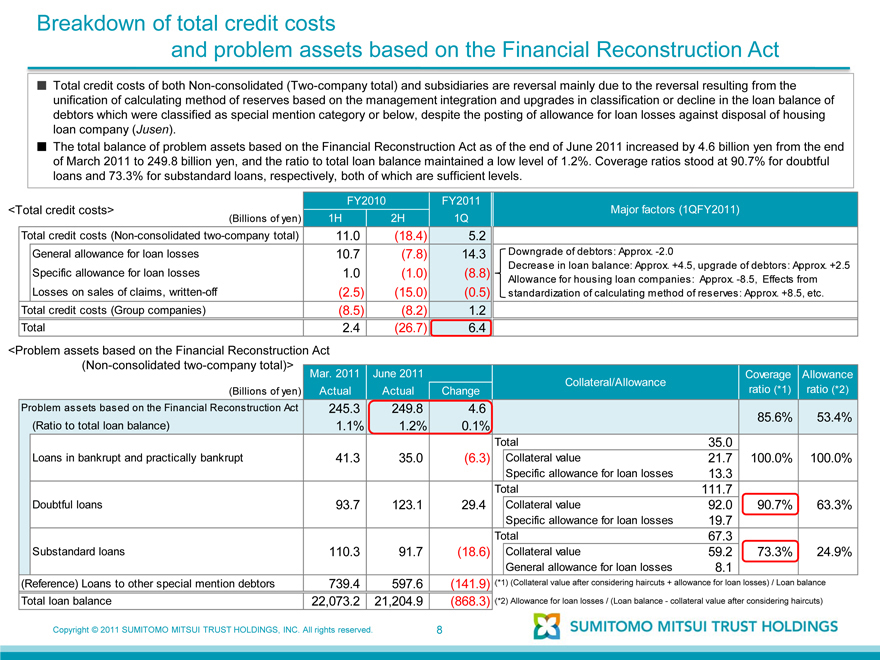
Total credit costs of both Non-consolidated (Two-company total) and subsidiaries are reversal mainly due to the reversal resulting from the unification of calculating method of reserves based on the management integration and upgrades in classification or decline in the loan balance of debtors which were classified as special mention category or below, despite the posting of allowance for loan losses against disposal of housing loan company (Jusen).
The total balance of problem assets based on the Financial Reconstruction Act as of the end of June 2011 increased by 4.6 billion yen from the end of March 2011 to 249.8 billion yen, and the ratio to total loan balance maintained a low level of 1.2%. Coverage ratios stood at 90.7% for doubtful loans and 73.3% for substandard loans, respectively, both of which are sufficient levels.
FY2010 FY2011
<Total credit costs> Major factors (1QFY2011)
(Billions of yen) 1H 2H 1Q
Total credit costs (Non-consolidated two-company total) 11.0 (18.4) 5.2
General allowance for loan losses 10.7 (7.8) 14.3 Downgrade of debtors: Approx. -2.0
Decrease in loan balance: Approx. +4.5, upgrade of debtors: Approx. +2.5
Specific allowance for loan losses 1.0 (1.0) (8.8) Allowance for housing loan companies: Approx. -8.5, Effects from
Losses on sales of claims, written-off (2.5) (15.0) (0.5) standardization of calculating method of reserves: Approx. +8.5, etc.
Total credit costs (Group companies) (8.5) (8.2) 1.2
Total 2.4 (26.7) 6.4
<Problem assets based on the Financial Reconstruction Act
(Non-consolidated two-company total)> Mar. 2011 June 2011 Coverage Allowance
Collateral/Allowance
(Billions of yen) Actual Actual Change ratio (*1) ratio (*2)
Problem assets based on the Financial Reconstruction Act 245.3 249.8 4.6
(Ratio to total loan balance) 1.1% 1.2% 0.1% 85.6% 53.4%
Total 35.0
Loans in bankrupt and practically bankrupt 41.3 35.0 (6.3) Collateral value 21.7 100.0% 100.0%
Specific allowance for loan losses 13.3
Total 111.7
Doubtful loans 93.7 123.1 29.4 Collateral value 92.0 90.7% 63.3%
Specific allowance for loan losses 19.7
Total 67.3
Substandard loans 110.3 91.7 (18.6) Collateral value 59.2 73.3% 24.9%
General allowance for loan losses 8.1
(Reference) Loans to other special mention debtors 739.4 597.6 (141.9) (*1) (Collateral value after considering haircuts + allowance for loan losses) / Loan balance
Total loan balance 22,073.2 21,204.9 (868.3) (*2) Allowance for loan losses / (Loan balance - collateral value after considering haircuts)
Copyright © 2011 SUMITOMO MITSUI TRUST HOLDINGS, INC. All rights reserved. 8
Table of Contents
Securities portfolio
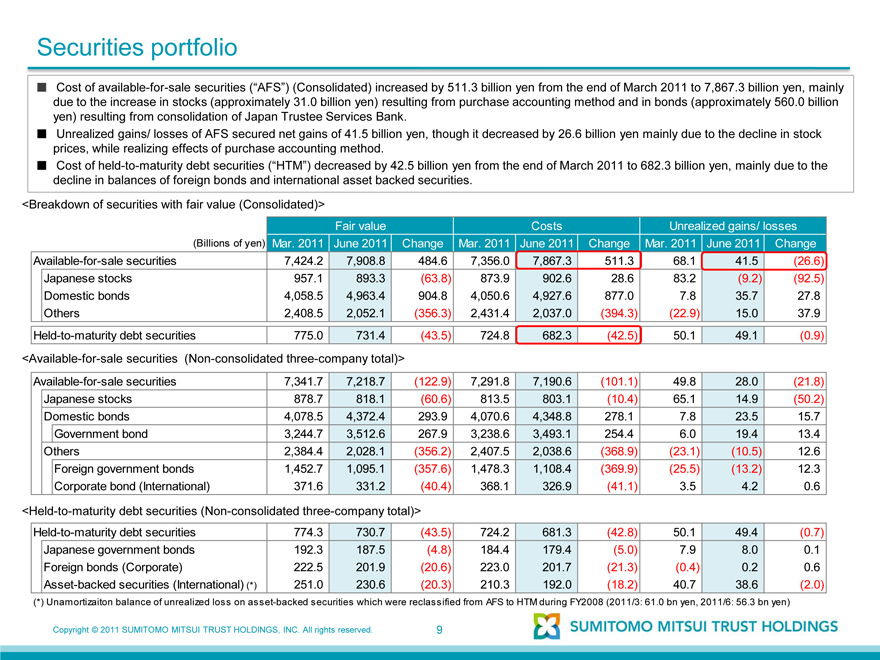
Cost of available-for-sale securities (“AFS”) (Consolidated) increased by 511.3 billion yen from the end of March 2011 to 7,867.3 billion yen, mainly due to the increase in stocks (approximately 31.0 billion yen) resulting from purchase accounting method and in bonds (approximately 560.0 billion yen) resulting from consolidation of Japan Trustee Services Bank.
Unrealized gains/ losses of AFS secured net gains of 41.5 billion yen, though it decreased by 26.6 billion yen mainly due to the decline in stock prices, while realizing effects of purchase accounting method.
Cost of held-to-maturity debt securities (“HTM”) decreased by 42.5 billion yen from the end of March 2011 to 682.3 billion yen, mainly due to the decline in balances of foreign bonds and international asset backed securities.
<Breakdown of securities with fair value (Consolidated)>
Fair value Costs Unrealized gains/ losses
(Billions of yen) Mar. 2011 June 2011 Change Mar. 2011 June 2011 Change Mar. 2011 June 2011 Change
Available-for-sale securities 7,424.2 7,908.8 484.6 7,356.0 7,867.3 511.3 68.1 41.5 (26.6)
Japanese stocks 957.1 893.3 (63.8) 873.9 902.6 28.6 83.2 (9.2) (92.5)
Domestic bonds 4,058.5 4,963.4 904.8 4,050.6 4,927.6 877.0 7.8 35.7 27.8
Others 2,408.5 2,052.1 (356.3) 2,431.4 2,037.0 (394.3) (22.9) 15.0 37.9
Held-to-maturity debt securities 775.0 731.4 (43.5) 724.8 682.3 (42.5) 50.1 49.1 (0.9)
<Available-for-sale securities (Non-consolidated three-company total)>
Available-for-sale securities 7,341.7 7,218.7 (122.9) 7,291.8 7,190.6 (101.1) 49.8 28.0 (21.8)
Japanese stocks 878.7 818.1 (60.6) 813.5 803.1 (10.4) 65.1 14.9 (50.2)
Domestic bonds 4,078.5 4,372.4 293.9 4,070.6 4,348.8 278.1 7.8 23.5 15.7
Government bond 3,244.7 3,512.6 267.9 3,238.6 3,493.1 254.4 6.0 19.4 13.4
Others 2,384.4 2,028.1 (356.2) 2,407.5 2,038.6 (368.9) (23.1) (10.5) 12.6
Foreign government bonds 1,452.7 1,095.1 (357.6) 1,478.3 1,108.4 (369.9) (25.5) (13.2) 12.3
Corporate bond (International) 371.6 331.2 (40.4) 368.1 326.9 (41.1) 3.5 4.2 0.6
<Held-to-maturity debt securities (Non-consolidated three-company total)>
Held-to-maturity debt securities 774.3 730.7 (43.5) 724.2 681.3 (42.8) 50.1 49.4 (0.7)
Japanese government bonds 192.3 187.5 (4.8) 184.4 179.4 (5.0) 7.9 8.0 0.1
Foreign bonds (Corporate) 222.5 201.9 (20.6) 223.0 201.7 (21.3) (0.4) 0.2 0.6
Asset-backed securities (International) (*) 251.0 230.6 (20.3) 210.3 192.0 (18.2) 40.7 38.6 (2.0)
(*) Unamortizaiton balance of unrealized loss on asset-backed securities which were reclassified from AFS to HTM during FY2008 (2011/3: 61.0 bn yen, 2011/6: 56.3 bn yen)
Copyright © 2011 SUMITOMO MITSUI TRUST HOLDINGS, INC. All rights reserved. 9
Table of Contents
Status of capital
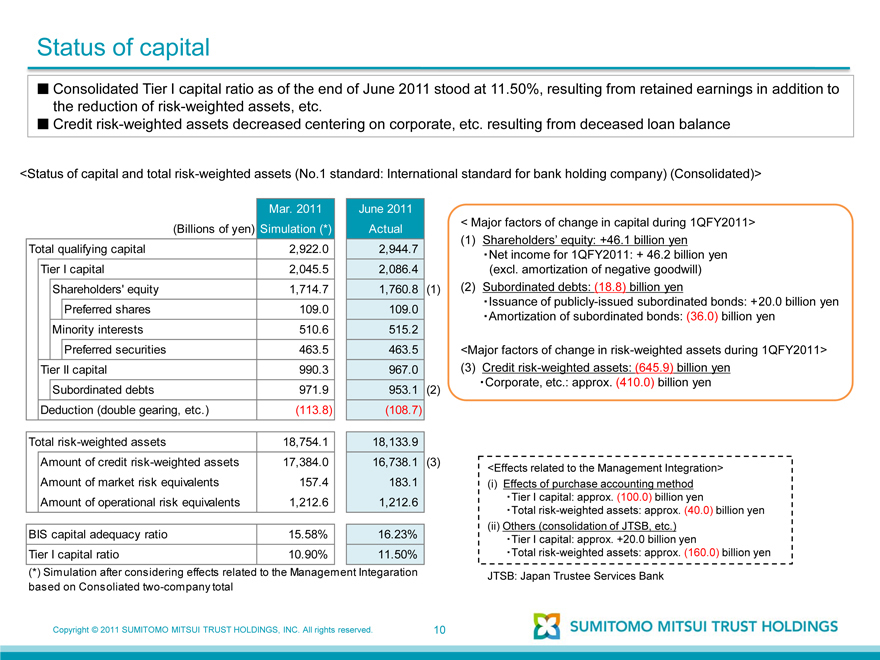
Consolidated Tier I capital ratio as of the end of June 2011 stood at 11.50%, resulting from retained earnings in addition to the reduction of risk-weighted assets, etc.
Credit risk-weighted assets decreased centering on corporate, etc. resulting from deceased loan balance
Mar. 2011 June 2011
<Status of capital and total risk-weighted assets (No.1 standard: International standard for bank holding company) (Consolidated)>
(Billions of yen) Simulation (*) Actual
Total qualifying capital 2,922.0 2,944.7
Tier I capital 2,045.5 2,086.4
Shareholders’ equity 1,714.7 1,760.8 (1)
Preferred shares 109.0 109.0
Minority interests 510.6 515.2
Preferred securities 463.5 463.5
Tier II capital 990.3 967.0
Subordinated debts 971.9 953.1 (2)
Deduction (double gearing, etc.) (113.8) (108.7)
Total risk-weighted assets 18,754.1 18,133.9
Amount of credit risk-weighted assets 17,384.0 16,738.1 (3)
Amount of market risk equivalents 157.4 183.1
Amount of operational risk equivalents 1,212.6 1,212.6
BIS capital adequacy ratio 15.58% 16.23%
Tier I capital ratio 10.90% 11.50%
(*) Simulation after considering effects related to the Management Integaration based on Consoliated two-company total
<Major factors of change in capital during 1QFY2011>
(1) Shareholders’ equity: +46.1 billion yen
Net income for 1QFY2011: + 46.2 billion yen
(excl. amortization of negative goodwill)
(2) Subordinated debts: (18.8) billion yen
Issuance of publicly-issued subordinated bonds: +20.0 billion yen
Amortization of subordinated bonds: (36.0) billion yen
<Major factors of change in risk-weighted assets during 1QFY2011>
(3) Credit risk-weighted assets: (645.9) billion yen
Corporate, etc.: approx. (410.0) billion yen
<Effects related to the Management Integration>
(i) Effects of purchase accounting method Tier I capital: approx. (100.0) billion yen Total risk-weighted assets: approx. (40.0) billion yen (ii) Others (consolidation of JTSB, etc.) Tier I capital: approx. +20.0 billion yen Total risk-weighted assets: approx. (160.0) billion yen JTSB: Japan Trustee Services Bank
Copyright © 2011 SUMITOMO MITSUI TRUST HOLDINGS, INC. All rights reserved.
10
Table of Contents
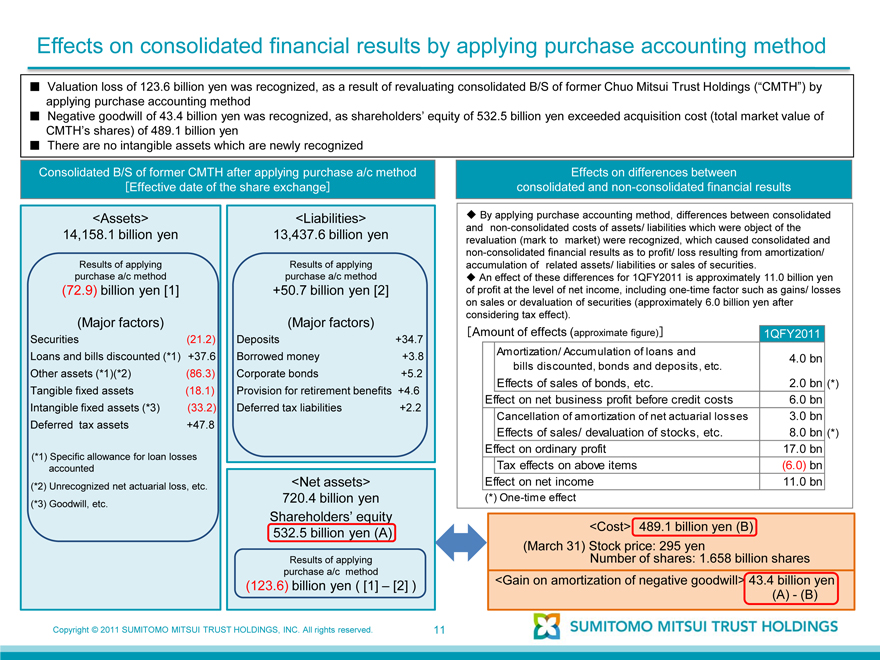
Effects on consolidated financial results by applying purchase accounting method
Valuation loss of 123.6 billion yen was recognized, as a result of revaluating consolidated B/S of former Chuo Mitsui Trust Holdings (“CMTH”) by applying purchase accounting method
Negative goodwill of 43.4 billion yen was recognized, as shareholders’ equity of 532.5 billion yen exceeded acquisition cost (total market value of CMTH’s shares) of 489.1 billion yen
There are no intangible assets which are newly recognized
Consolidated B/S of former CMTH after applying purchase a/c method
[Effective date of the share exchange]
<Assets> <Liabilities>
14,158.1 billion yen 13,437.6 billion yen
Results of applying purchase a/c method Results of applying purchase a/c method
(72.9) billion yen [1] +50.7 billion yen [2]
(Major factors) (Major factors)
Securities (21.2) Deposits +34.7
Borrowed money +3.8
Loans and bills discounted (*1) +37.6 Corporate bonds +5.2
Provision for retirement benefits +4.6
Other assets (*1)(*2) (86.3) Deferred tax liabilities +2.2
Tangible fixed assets (18.1)
Intangible fixed assets (*3) (33.2)
Deferred tax assets +47.8 <Net assets>
720.4 billion yen
(*1) Specific allowance for loan losses accounted
Shareholders’ equity 532.5 billion yen (A)
(*2) Unrecognized net actuarial loss, etc.
(*3) Goodwill, etc.
Results of applying purchase a/c method
(123.6) billion yen ( [1] – [2] )
Effects on differences between consolidated and non-consolidated financial results
By applying purchase accounting method, differences between consolidated and non-consolidated costs of assets/ liabilities which were object of the revaluation (mark to market) were recognized, which caused consolidated and non-consolidated financial results as to profit/ loss resulting from amortization/ accumulation of related assets/ liabilities or sales of securities.
An effect of these differences for 1QFY2011 is approximately 11.0 billion yen of profit at the level of net income, including one-time factor such as gains/ losses on sales or devaluation of securities (approximately 6.0 billion yen after considering tax effect).
[Amount of effects (approximate figure)] 1QFY2011
Amortization/ Accumulation of loans and 4.0 bn
bills discounted, bonds and deposits, etc.
Effects of sales of bonds, etc. 2.0 bn (*)
Effect on net business profit before credit costs 6.0 bn
Cancellation of amortization of net actuarial losses 3.0 bn
Effects of sales/ devaluation of stocks, etc. 8.0 bn (*)
Effect on ordinary profit 17.0 bn
Tax effects on above items (6.0) bn
Effect on net income 11.0 bn
(*) One-time effect
<Cost> 489.1 billion yen (B)
(March 31) Stock price: 295 yen
Number of shares: 1.658 billion shares
<Gain on amortization of negative goodwill> 43.4 billion yen
(A) - (B)
Copyright © 2011 SUMITOMO MITSUI TRUST HOLDINGS, INC. All rights reserved. 11
Table of Contents
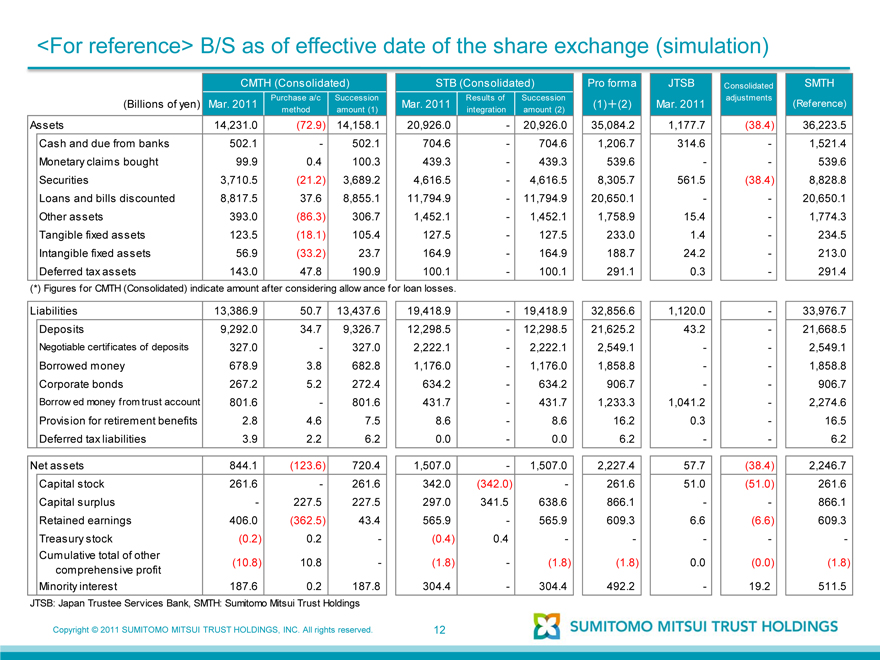
<For reference>B/S as of effective date of the share exchange (simulation)
CMTH (Consolidated) STB (Consolidated) Pro forma JTSB Consolidated SMTH
Purchase a/c Succession Results of Succession adjustments
(Billions of yen) Mar. 2011 Mar. 2011 (1)+(2) Mar. 2011 (Reference)
method amount (1) integration amount (2)
Assets 14,231.0 (72.9) 14,158.1 20,926.0 - 20,926.0 35,084.2 1,177.7 (38.4) 36,223.5
Cash and due from banks 502.1 - 502.1 704.6 - 704.6 1,206.7 314.6 - 1,521.4
Monetary claims bought 99.9 0.4 100.3 439.3 - 439.3 539.6 - - 539.6
Securities 3,710.5 (21.2) 3,689.2 4,616.5 - 4,616.5 8,305.7 561.5 (38.4) 8,828.8
Loans and bills discounted 8,817.5 37.6 8,855.1 11,794.9 - 11,794.9 20,650.1 - - 20,650.1
Other assets 393.0 (86.3) 306.7 1,452.1 - 1,452.1 1,758.9 15.4 - 1,774.3
Tangible fixed assets 123.5 (18.1) 105.4 127.5 - 127.5 233.0 1.4 - 234.5
Intangible fixed assets 56.9 (33.2) 23.7 164.9 - 164.9 188.7 24.2 - 213.0
Deferred tax assets 143.0 47.8 190.9 100.1 - 100.1 291.1 0.3 - 291.4
(*) Figures for CMTH (Consolidated) indicate amount after considering allowance for loan losses.
Liabilities 13,386.9 50.7 13,437.6 19,418.9 - 19,418.9 32,856.6 1,120.0 - 33,976.7
Deposits 9,292.0 34.7 9,326.7 12,298.5 - 12,298.5 21,625.2 43.2 - 21,668.5
Negotiable certificates of deposits 327.0 - 327.0 2,222.1 - 2,222.1 2,549.1 - - 2,549.1
Borrowed money 678.9 3.8 682.8 1,176.0 - 1,176.0 1,858.8 - - 1,858.8
Corporate bonds 267.2 5.2 272.4 634.2 - 634.2 906.7 - - 906.7
Borrowed money from trust account 801.6 - 801.6 431.7 - 431.7 1,233.3 1,041.2 - 2,274.6
Provision for retirement benefits 2.8 4.6 7.5 8.6 - 8.6 16.2 0.3 - 16.5
Deferred tax liabilities 3.9 2.2 6.2 0.0 - 0.0 6.2 - - 6.2
Net assets 844.1 (123.6) 720.4 1,507.0 - 1,507.0 2,227.4 57.7 (38.4) 2,246.7
Capital stock 261.6 - 261.6 342.0 (342.0) - 261.6 51.0 (51.0) 261.6
Capital surplus - 227.5 227.5 297.0 341.5 638.6 866.1 - - 866.1
Retained earnings 406.0 (362.5) 43.4 565.9 - 565.9 609.3 6.6 (6.6) 609.3
Treasury stock (0.2) 0.2 - (0.4) 0.4 - - - - -
Cumulative total of other
comprehensive profit (10.8) 10.8 - (1.8) - (1.8) (1.8) 0.0 (0.0) (1.8)
Minority interest 187.6 0.2 187.8 304.4 - 304.4 492.2 - 19.2 511.5
JTSB: Japan Trustee Services Bank, SMTH: Sumitomo Mitsui Trust Holdings
Copyright © 2011 SUMITOMO MITSUI TRUST HOLDINGS, INC. All rights reserved.
12
Table of Contents
Cautionary Statement Regarding Forward-Looking Statements
This material contains forward-looking statements (as defined in the U.S. Private Securities Litigation Reform Act of 1995) regarding our intent, belief or current expectations in respect to our future financial conditions, operating results and overall management. These forward-looking statements may be identified by words such as “believes”, “expects”, “anticipates”, “projects”, “intends”, “should”, “seeks”, “estimates”, “future”, or similar expressions or by discussion of, among other things, strategy, goals, plans or intentions. Such forward-looking statements are not guarantees of future performance and actual results may differ, owing to risks and uncertainties, including without limitation: (1) potential difficulties in integrating the management and business operations of our subsidiaries; (2) our ability to successfully execute our group business strategies; and (3) unanticipated events that result in an increase in our credit costs and a deterioration in the quality of our group companies’ loan portfolios. Given such risks and uncertainties, you should not place undue reliance on forward-looking statements, which speak only as of the release date of this material. We undertake no obligation to update or revise any forward-looking statements. In addition to this material, please refer to our most recently disclosed documents, such as our Form F-4 registration statement filed with the U.S. Securities and Exchange Commission, or press releases we have issued, for a more detailed description of matters that may affect our financial condition and operating results.
Copyright © 2011 SUMITOMO MITSUI TRUST HOLDINGS, INC. All rights reserved.