Table of Contents
UNITED STATES
SECURITIES AND EXCHANGE COMMISSION
Washington, D.C. 20549
Form 6-K
REPORT OF FOREIGN PRIVATE ISSUER
PURSUANT TO RULE 13a-16 OR 15d-16
UNDER THE SECURITIES EXCHANGE ACT OF 1934
For the month of November, 2011.
Commission File Number 333-170434
Sumitomo Mitsui Trust Holdings, Inc.
(Translation of registrant’s name into English)
9-2, Marunouchi, 1-chome
Chiyoda-ku, Tokyo 100-6611
Japan
(Address of principal executive office)
Indicate by check mark whether the registrant files or will file annual reports under cover of Form 20-F or Form 40-F. Form 20-F: x Form 40-F: ¨
Indicate by check mark if the registrant is submitting the Form 6-K in paper as permitted by Regulation S-T Rule 101(b)(1): ¨
Indicate by check mark if the registrant is submitting the Form 6-K in paper as permitted by Regulation S-T Rule 101(b)(7): ¨
Indicate by check mark whether the registrant by furnishing the information contained in this Form is also thereby furnishing the information to the Commission pursuant to Rule 12g3-2(b) under the Securities Exchange Act of 1934. Yes ¨ No ¨
If “Yes” is marked, indicate below the file number assigned to the registrant in connection with Rule 12g3-2(b): 82- .
Table of Contents
This report on Form 6-K contains the following:
| 1. | Financial Results |
| 2. | Explanatory Material 2nd Quarter of Fiscal Year 2011 ended on Sep. 30, 2011 |
| 3. | Supplemental material on financial results 2nd Quarter of Fiscal Year 2011 ended on Sep. 30, 2011 |
Table of Contents
SIGNATURES
Pursuant to the requirements of the Securities Exchange Act of 1934, the registrant has duly caused this report to be signed on its behalf by the undersigned, thereunto duly authorized.
| Sumitomo Mitsui Trust Holdings, Inc. | ||||||
| Date: November 14, 2011 | By: | /s/ Tadashi Nishimura | ||||
| Name: | Tadashi Nishimura | |||||
| Title: | Executive Officer | |||||
Table of Contents
Sumitomo Mitsui Trust Holdings, Inc. Financial Results for the First Half of the Fiscal Year 2011 [Japanese GAAP] (Consolidated) |  | |||
| November 14, 2011 | ||||
Stock exchange listings | : Tokyo, Osaka and Nagoya (code:8309) | |
URL | : http://www.smth.jp/en/index.html | |
Representative | : Kazuo Tanabe, President | |
For inquiry | : Tadashi Nishimura, Executive Officer, | |
| General Manager of Financial Planning Department | ||
| TEL +81-3-3286-8354 | ||
Filing date of quarterly securities report (Scheduled) | : November 29, 2011 | |
Trading accounts | : Established | |
Payment date of cash dividends (Scheduled) | : December 2, 2011 | |
Supplementary explanatory material | : Prepared | |
Information meeting (Scheduled) | : Yes (for institutional investors and analysts) | |
| (All amounts less than one million yen are disregarded.) | ||
1. Consolidated Financial Results for the First Half of the Fiscal Year 2011 (April 1, 2011 through September 30, 2011)
| (1) Consolidated Results of Operations | (%: Change from the same period in the previous fiscal year) |
| Ordinary Income | Ordinary Profit | Net income | ||||||||||||||||||||||
| Six months ended | Millions of Yen | % | Millions of Yen | % | Millions of Yen | % | ||||||||||||||||||
September 30, 2011 | 623,302 | 247.8 | 155,296 | 209.9 | 128,109 | 299.4 | ||||||||||||||||||
September 30, 2010 | 179,238 | (1.4 | ) | 50,104 | 45.7 | 32,071 | 68.0 | |||||||||||||||||
| (Note) Comprehensive Income: | September 30, 2011 93,946 millions of yen (–%); | |||||||
| September 30, 2010 — millions of yen (–%) | ||||||||
| Net Income per Common Share | Net Income per Common Share (Fully Diluted) | |||||||
| Six months ended | Yen | Yen | ||||||
September 30, 2011 | 30.29 | — | ||||||
September 30, 2010 | 19.34 | — | ||||||
(Note) | Net income per common share (fully diluted) for the first half of the fiscal year 2011 is not stated as there are no potential shares that would have a dilutive effect. | |
(Note) | Net income per common share (fully diluted) for the first half of the fiscal year 2010 is not stated as there are no potential shares. |
(2) Consolidated Financial Conditions
| Total Assets | Net Assets | Net Assets to Total Assets Ratio | Consolidated BIS Capital Adequacy Ratio | |||||||||||||
| As of | Millions of Yen | Millions of Yen | % | % | ||||||||||||
September 30, 2011 | 35,180,904 | 2,264,766 | 4.9 | 16.52 | ||||||||||||
March 31, 2011 | 14,231,070 | 844,130 | 4.6 | 16.46 | ||||||||||||
| (Reference) Net Assets less Minority Interests: | September 30, 2011 1,752,718 million yen; | |||
| March 31, 2011 656,476 million yen |
(Note) | Net Assets to Total Assets Ratio = (Net Assets - Subscription Rights to Shares - Minority Interests) / Total Assets | |
(Note) | BIS Capital Adequacy ratio is calculated in accordance with the “Standard for Determining Bank Holding Company Capital Adequacy in Light of Assets Held by a Bank Holding Company or its Subsidiaries, Pursuant to Article 52-25 of the Banking Act” (Financial Service Agency Notification No.20, 2006). The figure as of September 30, 2011 is the consolidated Net Assets to Total Assets Ratio for Sumitomo Mitsui Trust Holdings, Inc. (“SMTH”) for the six months ended September 30, 2011, calculated according to Standard 1. The figure as of March 31, 2011 is the consolidated Net Assets to Total Assets Ratio for the former Chuo Mitsui Trust Holdings, Inc (“CMTH”) for the fiscal year ended March 31, 2011, calculated according to Standard 2. Preliminary data for the six months ended September 30, 2011. |
2. Cash Dividends on Common Share
| Annual Cash Dividends per Common Share | ||||||||||||||||||||
| First Quarter-end | Second Quarter-end | Third Quarter-end | Year-end | Total | ||||||||||||||||
| Fiscal year ended | Yen | Yen | Yen | Yen | Yen | |||||||||||||||
March 31, 2011 | — | 4.00 | — | 4.00 | 8.00 | |||||||||||||||
Fiscal year ending | �� | |||||||||||||||||||
March 31, 2012 | — | 4.00 | ||||||||||||||||||
Fiscal year ending | ||||||||||||||||||||
March 31, 2012 (forecast) | — | 4.00 | 8.00 | |||||||||||||||||
(Note) | Revision of the latest dividend forecast announced: None | |
(Note) | The figures above show the cash dividends on common shares. For other classes of SMTH shares with differing rights, please refer to “Cash Dividends on Preferred Shares.” |
3. Consolidated Earnings Forecasts for the Fiscal Year 2011
(April 1, 2011 through March 31, 2012)
| (%: Change from the previous fiscal year) | ||||||||||||||||||||
| Ordinary Profit | Net Income | Net Income per Common Share | ||||||||||||||||||
| Fiscal year ending | Millions of Yen | % | Millions of Yen | % | Yen | |||||||||||||||
March 31, 2012 | 265,000 | 212.8 | 180,000 | 280.7 | 42.23 | |||||||||||||||
(Note) | Revision of the latest consolidated earnings forecast announced: Yes |
Table of Contents
4. Other Information
(1) Changes in Important Subsidiaries during the First Half of the Fiscal Year 2011: Yes | ||
(Changes in specified subsidiaries resulting from changes in the scope of the consolidation) | ||
Included: | 6 companies | The Sumitomo Trust and Banking Co. Ltd., STB Preferred Capital 2 (Cayman) Limited, | ||
| STB Preferred Capital 3 (Cayman) Limited, STB Preferred Capital 4 (Cayman) Limited, | ||||
| STB Preferred Capital 5 (Cayman) Limited, Japan Trustee Services Bank Ltd. | ||||
Excluded: | — |
(For details, please refer to page 2, “1. Other Information” in “Accompanying Materials.”)
| (2) | Changes in Accounting Policies, Changes in Accounting Estimates and Restatements |
Changes in accounting policies due to revision of accounting standards | : None | |
‚ Changes in accounting policies due to reasons other than the above | : None | |
ƒ Changes in accounting estimates | : None | |
„ Restatements | : None | |
| (3) | Number of Shares Issued (Common shares) |
| | Number of shares issued (including treasury stock) |
September 30, 2011 | 4,153,486,408 | shares | March 31, 2011 | 1,658,426,267 | shares |
| ‚ | Number of treasury stock |
September 30, 2011 | 733,379 | shares | March 31, 2011 | 411,673 | shares |
| ƒ | Average number of shares issued (first half of the fiscal year) |
September 30, 2011 | 4,152,838,119 | shares | September 30, 2010 | 1,658,055,685 | shares |
(Summary of Non-consolidated Financial Results)
Non-consolidated Financial Results for the First Half of the Fiscal Year 2011 (April 1, 2011 through September 30, 2011)
| (1) Non-consolidated Results of Operations | (%: Change from the same period in the previous fiscal year) |
| Operating Income | Operating Profit | Ordinary Profit | Net Income | |||||||||||||||||||||||||||||
| Six months ended | Millions of Yen | % | Millions of Yen | % | Millions of Yen | % | Millions of Yen | % | ||||||||||||||||||||||||
September 30, 2011 | 18,851 | (8.1 | ) | 12,963 | (14.9 | ) | 11,688 | (12.2 | ) | 11,685 | (10.3 | ) | ||||||||||||||||||||
September 30, 2010 | 20,512 | 77.7 | 15,230 | 148.6 | 13,315 | 118.8 | 13,031 | 114.6 | ||||||||||||||||||||||||
| Net Income per Common Share | ||||
| Six months ended | Yen | |||
September 30, 2011 | 2.25 | |||
September 30, 2010 | 7.85 | |||
(2) Non-consolidated Financial Conditions
| Total Assets | Net Assets | Net Assets to Total Assets Ratio | ||||||||||
| As of | Millions of Yen | Millions of Yen | % | |||||||||
September 30, 2011 | 1,935,230 | 1,743,641 | 90.1 | |||||||||
March 31, 2011 | 794,198 | 601,370 | 75.7 | |||||||||
(Reference) Net Assets: September 30, 2011 1,743,640 million yen; March 31, 2011 601,370 million yen
(Note) Net Assets to Total Assets Ratio = (Net Assets - Subscription Rights to Shares) / Total Assets
Statement Concerning the Status of the Interim Audit Process
This summary earnings report is not subject to interim audit pursuant to the Financial Instruments and Exchange Act, and at the time of the release of this summary earnings report an interim audit pursuant to the Financial Instruments and Exchange Act had not been completed.
Explanation for proper use of forecasts and other comments
| • | Forecasts presented herein are based on the information that is currently possessed by SMTH and certain reasonable assumptions. Actual results may differ materially from those forecasts depending on various future events and conditions. |
| • | As a specified business entity (a company engaged in the businesses specified in Article 17-15(2) of the Cabinet Office Ordinance on Disclosure of Corporate Affairs) SMTH has prepared consolidated and non-consolidated financial statements for the first half of this fiscal year. |
| • | SMTH conducted a share exchange on April 1, 2011 under which SMTH became the parent company and The Sumitomo Trust and Banking Co., Ltd. (“STB”) became the wholly owned subsidiary. Based on the Accounting Standard for Business Combinations, this share exchange is a reverse acquisition wherein SMTH is considered to be the acquired company and STB to be the acquiring company. Therefore, the consolidated assets and liabilities of SMTH were transferred to the consolidated balance sheets of STB at fair value. As a result, the figures for the first half of the fiscal year 2011 changed substantially when compared with those for the first half of fiscal year 2010 or fiscal year 2010. |
| • | SMTH intends to convene an earnings conference for institutional investors and analysts. We intend to post the content of this conference (audio) on our company website along with the materials presented during the conference. |
Table of Contents
(Cash Dividends on Preferred Shares)
Cash dividends per share on preferred shares are as below:
The First Series of Class 7 Preferred Shares | Annual Cash Dividends per Share | |||||||||||||||||||
| First Quarter-end | Second Quarter-end | Third Quarter-end | Year-end | Total | ||||||||||||||||
| Yen | Yen | Yen | Yen | Yen | ||||||||||||||||
Fiscal year ended | ||||||||||||||||||||
March 31, 2011 | ||||||||||||||||||||
Fiscal year ending | ||||||||||||||||||||
March 31, 2012 | — | 21.15 | ||||||||||||||||||
|
|
|
|
|
|
|
|
|
| |||||||||||
Fiscal year ending | ||||||||||||||||||||
March 31, 2012 (forecast) | — | 21.15 | 42.30 | |||||||||||||||||
| (Note) | Revision of the latest dividend forecast announced: None | |
| (Note) | The First Series of Class 7 Preferred Shares was issued on April 1, 2011 in exchange for the First Series of Class 2 Preferred Shares of STB due to the share exchange. |
(Reference) Cash Dividends on Common Share and the First Series of Class 2 Preferred Shares of The Sumitomo Trust and Banking Co., Ltd.
The Sumitomo Trust and Banking Co. Ltd. Common Shares | Annual Cash Dividends per Common Share | |||||||||||||||||||
| First Quarter-end | Second Quarter-end | Third Quarter-end | Year-end | Total | ||||||||||||||||
| Yen | Yen | Yen | Yen | Yen | ||||||||||||||||
Fiscal year ended | ||||||||||||||||||||
March 31, 2011 | — | 6.00 | — | 8.00 | 14.00 | |||||||||||||||
| (Note) | While all the common shares of STB were acquired by SMTH in the share exchange for common shares of SMTH on April 1, 2011, the year-end dividend for the fiscal year 2010 (from April 1, 2010, to March 31, 2011) was paid by STB based on the last Register of Shareholders as of March 31, 2011. |
The Sumitomo Trust and Banking Co., Ltd. First Series of Class 2 Preferred Shares | Annual Cash Dividends per Share | |||||||||||||||||||
| First Quarter-end | Second Quarter-end | Third Quarter-end | Year-end | Total | ||||||||||||||||
| Yen | Yen | Yen | Yen | Yen | ||||||||||||||||
Fiscal year ended | ||||||||||||||||||||
March 31, 2011 | — | 21.15 | — | 21.15 | 42.30 | |||||||||||||||
| (Note) | While all the First Series of Class 2 Preferred Shares of STB were acquired by SMTH in the share exchange for the First Series of Class 7 Preferred Shares of SMTH on April 1, 2011, the year-end dividends for the fiscal year 2010 (from April 1, 2010, to March 31, 2011) were paid by STB based on the last Register of Shareholders as of March 31, 2011. |
Table of Contents
[Accompanying Materials]
1
Table of Contents
| (1) | Changes in Important Subsidiaries during the First Half of the Fiscal Year 2011 |
(Changes in specified subsidiaries resulted in changes in the scope of consolidation)
Details of changes in specified subsidiaries resulting from changes in the scope of consolidation during the first half of the fiscal year 2011 (6 newly included companies) are as below.
Name | Address | Capital Stock (Millions of Yen) | Main Business Area | Share of Voting Rights Held | ||||||||
| (Consolidated subsidiaries) The Sumitomo Trust and Banking Co. Ltd. | Chuo-ku, Osaka | 342,037 | Trust Banking Business | 100.00 | % | |||||||
| STB Preferred Capital 2 (Cayman) Limited | George Town, Grand Cayman, British West Indies | 51,500 | Financial-related Business | 100.00 | % | |||||||
| STB Preferred Capital 3 (Cayman) Limited | George Town, Grand Cayman, British West Indies | 51,500 | Financial-related Business | 100.00 | % | |||||||
| STB Preferred Capital 4 (Cayman) Limited | George Town, Grand Cayman, British West Indies | 111,600 | Financial-related Business | 100.00 | % | |||||||
| STB Preferred Capital 5 (Cayman) Limited | George Town, Grand Cayman, British West Indies | 70,900 | Financial-related Business | 100.00 | % | |||||||
| Japan Trustee Services Bank, Ltd. | Chuo-ku, Tokyo | 51,000 | Trust Banking Business | 66.66 | % | |||||||
| (2) | Changes in Accounting Policies, Changes in Accounting Estimates and Restatements |
SMTH conducted a share exchange on April 1, 2011 under which SMTH became the parent company and STB became the wholly owned subsidiary. Based on the Accounting Standard for Business Combinations, this share exchange is a reverse acquisition wherein SMTH is considered the acquired company and STB the acquiring company. Therefore, the consolidated assets and liabilities of SMTH were transferred to the consolidated balance sheets of STB at fair value. Therefore, there is no continuity from our consolidated financial statements for the prior fiscal year to our interim consolidated financial statements.
SMTH adopted ASBJ Statement No. 24 “Accounting Standard for Accounting Changes and Error Corrections” (issued by ASBJ on December 4, 2009) and Implementation Guidance No. 24 “Guidance on Accounting Standard for Accounting Changes and Error Corrections” (issued by ASBJ on December 4, 2009) for accounting changes and corrections of past errors at the beginning of the first half of the fiscal year 2011, and we have presented financial data from CMTH for comparison.
2
Table of Contents
2. Interim Consolidated Financial Statements
(1) Interim Consolidated Balance Sheets
| (Millions of Yen) | ||||||||
| As of March 31, 2011 | As of September 30, 2011 | |||||||
Assets: | ||||||||
Cash and Due from Banks | 502,160 | 2,214,793 | ||||||
Call Loans and Bills Bought | 6,936 | 289,856 | ||||||
Receivables under Resale Agreements | — | 51,574 | ||||||
Receivables under Securities Borrowing Transactions | 9,378 | 7,764 | ||||||
Monetary Claims Bought | 99,921 | 483,836 | ||||||
Trading Assets | 36,568 | 666,536 | ||||||
Money Held in Trust | 2,065 | 24,256 | ||||||
Securities | 3,710,513 | 7,569,596 | ||||||
Loans and Bills Discounted | 8,864,266 | 20,593,126 | ||||||
Foreign Exchanges | 12,259 | 6,656 | ||||||
Lease Receivables and Investment Assets | — | 565,193 | ||||||
Other Assets | 393,956 | 1,470,991 | ||||||
Tangible Fixed Assets | 123,584 | 240,020 | ||||||
Intangible Fixed Assets | 56,994 | 208,025 | ||||||
Deferred Tax Assets | 143,055 | 278,854 | ||||||
Customers’ Liabilities for Acceptances and Guarantees | 317,098 | 660,480 | ||||||
Allowance for Loan Losses | (47,690 | ) | (150,660 | ) | ||||
|
|
|
| |||||
Total Assets | 14,231,070 | 35,180,904 | ||||||
|
|
|
| |||||
Liabilities: | ||||||||
Deposits | 9,292,002 | 22,191,060 | ||||||
Negotiable Certificates of Deposit | 327,020 | 2,679,771 | ||||||
Call Money and Bills Sold | 351,956 | 361,325 | ||||||
Payables under Repurchase Agreements | — | 140,533 | ||||||
Payables under Securities Lending Transactions | 1,161,653 | 648,420 | ||||||
Trading Liabilities | 7,716 | 179,664 | ||||||
Borrowed Money | 678,983 | 1,598,469 | ||||||
Foreign Exchanges | — | 70 | ||||||
Short-term Bonds Payable | — | 331,660 | ||||||
Bonds Payable | 267,247 | 949,527 | ||||||
Borrowed Money from Trust Account | 801,657 | 2,016,429 | ||||||
Other Liabilities | 156,055 | 1,090,524 | ||||||
Provision for Bonuses | 3,133 | 11,409 | ||||||
Provision for Directors’ Bonuses | — | 102 | ||||||
Provision for Retirement Benefits | 2,859 | 14,720 | ||||||
Provision for Directors’ Retirement Benefits | 253 | 184 | ||||||
Provision for Reimbursement of Deposits | 6,316 | |||||||
Provision for Contingent Loss | 15,335 | 17,705 | ||||||
Provision for Relocation Expenses | 9,090 | |||||||
Deferred Tax Liabilities | 3,967 | 3,544 | ||||||
Deferred Tax Liabilities for Land Revaluation | — | 5,124 | ||||||
Acceptances and Guarantees | 317,098 | 660,480 | ||||||
|
|
|
| |||||
Total Liabilities | 13,386,939 | 32,916,138 | ||||||
|
|
|
| |||||
3
Table of Contents
(Continued)
| (Millions of Yen) | ||||||||
| As of March 31, 2011 | As of September 30, 2011 | |||||||
Net Assets: | ||||||||
Capital Stock | 261,608 | 261,608 | ||||||
Capital Surplus | — | 859,497 | ||||||
Retained Earnings | 406,002 | 679,162 | ||||||
Treasury Stock | (282 | ) | (111 | ) | ||||
|
|
|
| |||||
Total Shareholders’ Equity | 667,328 | 1,800,158 | ||||||
|
|
|
| |||||
Valuation Difference on Available-for-Sale Securities | 4,408 | (20,090 | ) | |||||
Deferred Gains or Losses on Hedges | 3,406 | (7,240 | ) | |||||
Revaluation Reserve for Land | (16,537 | ) | (5,560 | ) | ||||
Foreign Currency Translation Adjustment | (2,129 | ) | (14,548 | ) | ||||
|
|
|
| |||||
Total Accumulated Other Comprehensive Income | (10,851 | ) | (47,439 | ) | ||||
|
|
|
| |||||
Subscription Rights to Shares | — | 1 | ||||||
Minority Interests | 187,653 | 512,046 | ||||||
|
|
|
| |||||
Total Net Assets | 844,130 | 2,264,766 | ||||||
|
|
|
| |||||
Total Liabilities and Net Assets | 14,231,070 | 35,180,904 | ||||||
|
|
|
| |||||
4
Table of Contents
(2) Interim Consolidated Statements of Income and Interim Consolidated Statement of Comprehensive Income
Interim Consolidated Statements of Income
| (Millions of Yen) | ||||||||
| Six Months Ended September 30, 2010 | Six Months Ended September 30, 2011 | |||||||
Ordinary Income: | 179,238 | 623,302 | ||||||
Trust Fees | 23,372 | 50,040 | ||||||
Interest Income: | 81,042 | 186,602 | ||||||
Interest on Loans and Discounts | 54,658 | 122,530 | ||||||
Interest and Dividends on Securities | 23,616 | 57,438 | ||||||
Fees and Commissions | 43,193 | 128,822 | ||||||
Trading Income | 1,494 | 3,276 | ||||||
Other Ordinary Income | 23,567 | 242,451 | ||||||
Other Income | 6,567 | 12,109 | ||||||
|
|
|
| |||||
Ordinary Expenses: | 129,133 | 468,005 | ||||||
|
|
|
| |||||
Interest Expenses: | 30,752 | 59,679 | ||||||
Interest on Deposits | 21,038 | 37,193 | ||||||
Fees and Commissions Payments | 10,549 | 31,370 | ||||||
Trading Expenses | 40 | 208 | ||||||
Other Ordinary Expenses | 4,852 | 159,039 | ||||||
General and Administrative Expenses | 69,713 | 190,390 | ||||||
Other Expenses | 13,224 | 27,315 | ||||||
|
|
|
| |||||
Ordinary Profit: | 50,104 | 155,296 | ||||||
|
|
|
| |||||
Extraordinary Income: | 7,503 | 46,340 | ||||||
Gain on Disposal of Noncurrent Assets | 13 | 279 | ||||||
Gain on Amortization of Negative Goodwill | — | 46,061 | ||||||
Reversal of Allowance for Loan Losses | 5,815 | |||||||
Recoveries of Written-off Claims | 1,675 | |||||||
Extraordinary Loss: | 2,774 | 7,213 | ||||||
Loss on Disposal of Noncurrent Assets | 161 | 289 | ||||||
Impairment Loss | — | 4,131 | ||||||
Management Integration Expenses | 2,132 | |||||||
Other Extraordinary Losses | 481 | 2,792 | ||||||
|
|
|
| |||||
Income before Income Taxes and Minority Interests | 54,833 | 194,423 | ||||||
|
|
|
| |||||
Income Taxes: | 18,796 | 55,400 | ||||||
Current | 3,621 | 20,389 | ||||||
Deferred | 15,175 | 35,011 | ||||||
|
|
|
| |||||
Income before Minority Interests | 36,037 | 139,022 | ||||||
|
|
|
| |||||
Minority Interests in Income | 3,965 | 10,913 | ||||||
|
|
|
| |||||
Net Income | 32,071 | 128,109 | ||||||
|
|
|
| |||||
5
Table of Contents
Interim Consolidated Statement of Comprehensive Income
| (Millions of Yen) | ||||
| Six Months Ended September 30, 2011 | ||||
Income before Minority Interests | 139,022 | |||
|
| |||
Other Comprehensive Income: | (45,075 | ) | ||
Valuation Difference on Available-for-Sale Securities | (26,303 | ) | ||
Deferred Gains or Losses on Hedges | (14,119 | ) | ||
Foreign Currency Translation Adjustment | (1,635 | ) | ||
Attributable to Equity Method Affiliates | (3,016 | ) | ||
|
| |||
Comprehensive Income: | 93,946 | |||
|
| |||
Comprehensive Income Attributable to Owners of the Parent | 83,388 | |||
Comprehensive Income Attributable to Minority Interests | 10,557 | |||
6
Table of Contents
(3) Interim Consolidated Statements of Changes in Net Assets
| (Millions of Yen) | ||||||||
| Six Months Ended September 30, 2010 | Six Months Ended September 30, 2011 | |||||||
Shareholders’ Equity: | ||||||||
Capital Stock: | ||||||||
Balance at the Beginning of the Current Period | 261,608 | 342,037 | ||||||
Changes during the Period | ||||||||
Increase from Share Exchange | — | (80,428 | ) | |||||
|
|
|
| |||||
Total Changes during the Period | — | (80,428 | ) | |||||
|
|
|
| |||||
Balance at the End of the Current Period | 261,608 | 261,608 | ||||||
|
|
|
| |||||
Capital Surplus: | ||||||||
Balance at the Beginning of the Current Period | — | 297,051 | ||||||
Changes during the Period | ||||||||
Cash Dividends | — | (6,632 | ) | |||||
Increase from Share Exchange | — | 569,542 | ||||||
Disposal of Treasury Stock | — | 18 | ||||||
Retirement of Treasury Stock | — | (482 | ) | |||||
|
|
|
| |||||
Total Changes during the Period | — | 562,446 | ||||||
|
|
|
| |||||
Balance at the End of the Current Period | — | 859,497 | ||||||
|
|
|
| |||||
Retained Earnings: | ||||||||
Balance at the Beginning of the Current Period | 377,619 | 565,908 | ||||||
Changes during the Period | ||||||||
Cash Dividends | (13,264 | ) | (15,701 | ) | ||||
Net Income | 32,071 | 128,109 | ||||||
Disposal of Treasury Stock | (1 | ) | — | |||||
Reversal of Revaluation Reserve for Land | — | 846 | ||||||
|
|
|
| |||||
Total Changes during the Period | 18,805 | 113,254 | ||||||
|
|
|
| |||||
Balance at the End of the Current Period | 396,425 | 679,162 | ||||||
|
|
|
| |||||
Treasury Stock: | ||||||||
Balance at the Beginning of the Current Period | (270 | ) | (482 | ) | ||||
Changes during the Period | ||||||||
Purchase of Treasury Stock | (5 | ) | (126 | ) | ||||
Disposal of Treasury Stock | 3 | 15 | ||||||
Retirement of Treasury Stock | — | 482 | ||||||
|
|
|
| |||||
Total Changes during the Period | (2 | ) | 371 | |||||
|
|
|
| |||||
Balance at the End of the Current Period | (272 | ) | (111 | ) | ||||
|
|
|
| |||||
Total Shareholders’ Equity: | ||||||||
Balance at the Beginning of the Current Period | 638,957 | 1,204,514 | ||||||
Changes during the Period | ||||||||
Cash Dividends | (13,264 | ) | (22,333 | ) | ||||
Net Income | 32,071 | 128,109 | ||||||
Increase from Share Exchange | — | 489,114 | ||||||
Purchase of Treasury Stock | (5 | ) | (126 | ) | ||||
Disposal of Treasury Stock | 1 | 34 | ||||||
Reversal of Revaluation Reserve for Land | — | 846 | ||||||
|
|
|
| |||||
Total Changes during the Period | 18,803 | 595,643 | ||||||
|
|
|
| |||||
Balance at the End of the Current Period | 657,761 | 1,800,158 | ||||||
|
|
|
| |||||
7
Table of Contents
(Continued)
| (Millions of Yen) | ||||||||
| Six Months Ended September 30, 2010 | Six Months Ended September 30, 2011 | |||||||
Accumulated Other Comprehensive Income: | ||||||||
Valuation Difference on Available-for-Sale Securities: | ||||||||
Balance at the Beginning of the Current Period | 35,002 | 6,064 | ||||||
Changes during the Period | ||||||||
Net Changes of Items other than Shareholders’ Equity | (17,251 | ) | (26,155 | ) | ||||
|
|
|
| |||||
Total Changes during the Period | (17,251 | ) | (26,155 | ) | ||||
|
|
|
| |||||
Balance at the End of the Current Period | 17,750 | (20,090 | ) | |||||
|
|
|
| |||||
Deferred Gains or Losses on Hedges: | ||||||||
Balance at the Beginning of the Current Period | 2,705 | 9,650 | ||||||
Changes during the Period | ||||||||
Net Changes of Items other than Shareholders’ Equity | 2,100 | (16,890 | ) | |||||
|
|
|
| |||||
Total Changes during the Period | 2,100 | (16,890 | ) | |||||
|
|
|
| |||||
Balance at the End of the Current Period | 4,805 | (7,240 | ) | |||||
|
|
|
| |||||
Revaluation Reserve for Land: | ||||||||
Balance at the Beginning of the Current Period | (15,532 | ) | (4,714 | ) | ||||
Changes during the Period | ||||||||
Net Changes of Items other than Shareholders’ Equity | — | (846 | ) | |||||
|
|
|
| |||||
Total Changes during the Period | — | (846 | ) | |||||
|
|
|
| |||||
Balance at the End of the Current Period | (15,532 | ) | (5,560 | ) | ||||
|
|
|
| |||||
Foreign Currency Translation Adjustment: | ||||||||
Balance at the Beginning of the Current Period | (1,738 | ) | (12,873 | ) | ||||
Changes during the Period | ||||||||
Net Changes of Items other than Shareholders’ Equity | (264 | ) | (1,674 | ) | ||||
|
|
|
| |||||
Total Changes during the Period | (264 | ) | (1,674 | ) | ||||
|
|
|
| |||||
Balance at the End of the Current Period | (2,002 | ) | (14,548 | ) | ||||
|
|
|
| |||||
Total Accumulated Other Comprehensive Income: | ||||||||
Balance at the Beginning of the Current Period | 20,436 | (1,872 | ) | |||||
Changes during the Period | ||||||||
Net Changes of Items other than Shareholders’ Equity | (15,415 | ) | (45,566 | ) | ||||
|
|
|
| |||||
Total Changes during the Period | (15,415 | ) | (45,566 | ) | ||||
|
|
|
| |||||
Balance at the End of the Current Period | 5,021 | (47,439 | ) | |||||
|
|
|
| |||||
Subscription Rights to Shares: | ||||||||
Balance at the Beginning of the Current Period | — | — | ||||||
Changes during the Period | ||||||||
Net Changes of Items other than Shareholders’ Equity | — | 1 | ||||||
|
|
|
| |||||
Total Changes during the Period | — | 1 | ||||||
|
|
|
| |||||
Balance at the End of the Current Period | — | 1 | ||||||
|
|
|
| |||||
Minority Interests: | ||||||||
Balance at the Beginning of the Current Period | 187,161 | 304,454 | ||||||
Changes during the Period | ||||||||
Net Changes of Items other than Shareholders’ Equity | 172 | 207,592 | ||||||
|
|
|
| |||||
Total Changes during the Period | 172 | 207,592 | ||||||
|
|
|
| |||||
Balance at the End of the Current Period | 187,333 | 512,046 | ||||||
|
|
|
| |||||
8
Table of Contents
(Continued)
| (Millions of Yen) | ||||||||
| Six Months Ended September 30, 2010 | Six Months Ended September 30, 2011 | |||||||
Total Net Assets: | ||||||||
Balance at the Beginning of the Current Period | 846,556 | 1,507,095 | ||||||
Changes during the Period | ||||||||
Cash Dividends | (13,264 | ) | (22,333 | ) | ||||
Net Income | 32,071 | 128,109 | ||||||
Increase from Share Exchange | — | 489,114 | ||||||
Purchase of Treasury Stock | (5 | ) | (126 | ) | ||||
Disposal of Treasury Stock | 1 | 34 | ||||||
Reversal of Revaluation Reserve for Land | — | 846 | ||||||
Net Changes of Items other than Shareholders’ Equity | (15,243 | ) | 162,026 | |||||
|
|
|
| |||||
Total Changes during the Period | 3,559 | 757,670 | ||||||
|
|
|
| |||||
Balance at the End of the Current Period | 850,115 | 2,264,766 | ||||||
|
|
|
| |||||
9
Table of Contents
(4) Note on Going Concern Assumptions
There is no applicable information.
10
Table of Contents
(5) Note on Business Combination
On August 24, 2010, CMTH concluded a share exchange agreement and a management integration agreement with STB. Subsequent to the approval at the extraordinary general meeting of shareholders held on December 22, 2010, the share exchange was performed on April 1, 2011 as the effective date. CMTH changed its trade name to Sumitomo Mitsui Trust Holdings, Inc. (“SMTH”).
1. Outline of Business Combination
(1) Name and Business Content of Acquired Company
| Name of acquired company | Chuo Mitsui Trust Holdings, Inc. | |
| Business content | Bank holding company |
(2) Main Reasons for Business Combination
CMTH and STB aim to create “The Trust Bank,” a new trust bank group that, with a combination of significant expertise and comprehensive capabilities, will provide better and swifter comprehensive solutions to their clients than ever before, by combining their personnel, know-how and other managerial resources and fusing both groups’ strengths, such as the diversity of the STB group and the agility of the CMTH group.
(3) Date of Business Combination
April 1, 2011
(4) Legal Form of Business Combination
Share exchange, under which CMTH became the parent company, and STB became the wholly owned subsidiary.
(5) Name of Company after Business Combination
Sumitomo Mitsui Trust Holdings, Inc.
(6) Acquired Voting Rights Ratio
100%
(7) Main Grounds for the Determination of the Acquiring Company
SMTH has adopted ASBJ Statement No.21 “Accounting Standard for Business Combinations” (issued by ASBJ on December 26, 2008) and Implementation Guidance No.10 “Guidance on Accounting Standard for Business Combinations and Accounting Standard for Business Divestitures” (issued by ASBJ on December 26, 2008). According to them, shareholders of STB, which is a wholly owned subsidiary company in the share exchange, hold the majority of voting rights of the company following the business combination. Therefore, it was decided that under the Accounting Standard for the Business Combinations, STB would be the acquiring company, with CMTH as the acquired company.
11
Table of Contents
2. Period of Earnings of the Acquired Company included in the Interim Consolidated Statements of Income Described at Acquisition Cost of the Acquired Company
April 1, 2011 through September 30, 2011
3. Acquisition Cost of the Acquired Company
489,114 million yen
4. Share Exchange Ratio by Type of Share, Calculation Method, and Number of Shares Delivered
(1) Share Exchange Ratio by Type of Share
(a) Common Shares
For each common share of STB, 1.49 shares of common share of SMTH have been allotted and delivered.
(b) Preferred Shares
For each First Series of Class 2 Preferred Shares of STB, one share of the First Series of Class 7 Preferred Shares of SMTH has been allotted and delivered.
(2) Calculation Method of the Share Exchange Ratio
(a) Common Shares
In order to support the respective efforts of CMTH and STB to ensure the fairness of the exchange ratio of common shares (hereinafter, “Common Share Exchange Ratio”) for this share exchange, CMTH had requested JP Morgan Securities Japan Co., Ltd. and Nomura Securities Co., Ltd. to perform financial analyses, while STB had requested UBS Securities Japan Ltd. and Daiwa Securities Capital Markets Co., Ltd., to perform similar analyses. Referring to the results of those financial analyses, CMTH and STB, on several occasions, conducted careful negotiations and discussions on the Common Share Exchange Ratio, comprehensively taking into consideration factors such as the financial position, assets, and future prospects of each party. As a result, CMTH and STB have reached the conclusion that the above Common Share Exchange Ratio is appropriate.
(b) Preferred Shares
CMTH and STB had agreed that the terms and conditions of the First Series of SMTH Class 7 Preferred Shares shall be substantially the same as those of the First Series of Class 2 Preferred Shares, and reached the conclusion that the above share exchange ratio for preferred shares is appropriate, after comprehensively taking into consideration the “bond-type” nature of those shares and the fact that there is no market price for the First Series of Class 2 Preferred Shares.
(3) Number of Shares Delivered
(a) Common Shares
2,495,060,141 shares
(b) Preferred Shares
109,000,000 shares
5. Amount of Gain on Amortization of Negative Goodwill and Reason for Recognizing Negative Goodwill
(1) Amount of Gain on Amortization of Negative Goodwill
43,431 million yen
(2) Reason for Recognizing Negative Goodwill
Negative goodwill was recognized as the shareholders’ equity (deducting minority interest from net of assets and liabilities acquired) exceeded the acquisition cost of acquired company.
6. Amount of Assets Acquired and Liabilities Acquired on Date of Business Combination
(1) Assets
Total Assets | 14,158,131 million yen | |||
Loans and Bills Discounted | 8,855,145 million yen |
(2) Liabilities
Total Liabilities | 13,437,699 million yen | |||
Deposits | 9,326,751 million yen |
12
Table of Contents
3. Interim Non-Consolidated Financial Statements
(1) Interim Non-Consolidated Balance Sheets
| (Millions of Yen) | ||||||||
| As of March 31, 2011 | As of September 30, 2011 | |||||||
Assets: | ||||||||
Current Assets: | ||||||||
Cash and Due from Banks | 1,462 | 1,843 | ||||||
Securities | 23,000 | 27,000 | ||||||
Accrued Income | 0 | 1 | ||||||
Income Tax Refunds Receivable | 3,438 | 2,955 | ||||||
Other Current Assets | 868 | 714 | ||||||
|
|
|
| |||||
Total Current Assets | 28,769 | 32,514 | ||||||
|
|
|
| |||||
Non-Current Assets: | ||||||||
Tangible Fixed Assets | 1 | 0 | ||||||
Intangible Fixed Assets | 7 | 6 | ||||||
Investments and Other Assets | 765,419 | 1,902,708 | ||||||
Investment Securities | 652 | 652 | ||||||
Investments in Subsidiaries and Affiliates | 764,391 | 1,901,700 | ||||||
Other Investments | 376 | 356 | ||||||
|
|
|
| |||||
Total Non-Current Assets | 765,428 | 1,902,715 | ||||||
|
|
|
| |||||
Total Assets | 794,198 | 1,935,230 | ||||||
|
|
|
| |||||
Liabilities: | ||||||||
Current Liabilities: | ||||||||
Accrued Expenses | 1,365 | 1,394 | ||||||
Income Taxes Payable | 2 | 9 | ||||||
Provision for Bonuses | 90 | 183 | ||||||
Other Current Liabilities | 296 | 135 | ||||||
|
|
|
| |||||
Total Current Liabilities | 1,755 | 1,722 | ||||||
|
|
|
| |||||
Non-Current Liabilities: | ||||||||
Bonds Payable | 189,700 | 189,700 | ||||||
Provision for Retirement Benefits | 1,177 | — | ||||||
Other Non-Current Liabilities | 195 | 166 | ||||||
|
|
|
| |||||
Total Non-Current Liabilities | 191,072 | 189,866 | ||||||
|
|
|
| |||||
Total Liabilities | 192,827 | 191,588 | ||||||
|
|
|
| |||||
Net Assets: | ||||||||
Shareholders’ Equity: | ||||||||
Capital Stock | 261,608 | 261,608 | ||||||
Capital Surplus | ||||||||
Legal Capital Surplus | 65,411 | 702,933 | ||||||
Other Capital Surplus | 53,254 | 553,011 | ||||||
|
|
|
| |||||
Total Capital Surplus | 118,665 | 1,255,945 | ||||||
|
|
|
| |||||
Retained Earnings | ||||||||
Other Retained Earnings | 221,379 | 226,432 | ||||||
Retained Earnings Brought Forward | 221,379 | 226,432 | ||||||
|
|
|
| |||||
Total Retained Earnings | 221,379 | 226,432 | ||||||
|
|
|
| |||||
Treasury Stock | (282 | ) | (346 | ) | ||||
|
|
|
| |||||
Total Shareholders’ Equity | 601,370 | 1,743,640 | ||||||
|
|
|
| |||||
Subscription Rights to Shares | — | 1 | ||||||
|
|
|
| |||||
Total Net Assets | 601,370 | 1,743,641 | ||||||
|
|
|
| |||||
Total Liabilities and Net Assets | 794,198 | 1,935,230 | ||||||
|
|
|
| |||||
13
Table of Contents
(2) Interim Non-Consolidated Statements of Income
| (Millions of Yen) | ||||||||
| Six Months Ended September 30, 2010 | Six Months Ended September 30, 2011 | |||||||
Operating Income: | ||||||||
Dividends Received from Subsidiaries | 17,068 | 14,771 | ||||||
Fees Received from Subsidiaries | 3,444 | 4,079 | ||||||
|
|
|
| |||||
Total Operating Income | 20,512 | 18,851 | ||||||
|
|
|
| |||||
Operating Expenses: | ||||||||
Interest on Bonds | 3,783 | 3,741 | ||||||
General and Administrative Expenses | 1,498 | 2,146 | ||||||
|
|
|
| |||||
Total Operating Expenses | 5,281 | 5,887 | ||||||
|
|
|
| |||||
Operating Profit | 15,230 | 12,963 | ||||||
|
|
|
| |||||
Non-Operating Income | 32 | 20 | ||||||
Non-Operating Expenses | 1,947 | 1,295 | ||||||
|
|
|
| |||||
Ordinary Profit | 13,315 | 11,688 | ||||||
|
|
|
| |||||
Extraordinary Income | 22 | — | ||||||
|
|
|
| |||||
Income before Income Taxes | 13,338 | 11,688 | ||||||
|
|
|
| |||||
Income Taxes: | 307 | 3 | ||||||
Current | 1 | 3 | ||||||
Deferred | 305 | — | ||||||
|
|
|
| |||||
Net Income | 13,031 | 11,685 | ||||||
|
|
|
| |||||
14
Table of Contents
(3) Interim Non-Consolidated Statements of Changes in Net Assets
| (Millions of Yen) | ||||||||
| Six Months Ended September 30, 2010 | Six Months Ended September 30, 2011 | |||||||
Shareholders’ Equity: | ||||||||
Capital Stock: | ||||||||
Balance at the Beginning of the Current Period | 261,608 | 261,608 | ||||||
Changes during the Period | ||||||||
|
|
|
| |||||
Total Changes during the Period | — | — | ||||||
|
|
|
| |||||
Balance at the End of the Current Period | 261,608 | 261,608 | ||||||
|
|
|
| |||||
Capital Surplus: | ||||||||
Legal Capital Surplus: | ||||||||
Balance at the Beginning of the Current Period | 65,411 | 65,411 | ||||||
Changes during the Period | ||||||||
Increase from Share Exchange | — | 1,137,308 | ||||||
Reversal of Legal Capital Surplus | — | (499,786 | ) | |||||
|
|
|
| |||||
Total Changes during the Period | — | 637,522 | ||||||
|
|
|
| |||||
Balance at the End of the Current Period | 65,411 | 702,933 | ||||||
|
|
|
| |||||
Other Capital Surplus: | ||||||||
Balance at the Beginning of the Current Period | 53,257 | 53,254 | ||||||
Changes during the Period | ||||||||
Reversal of Legal Capital Surplus | — | 499,786 | ||||||
Disposal of Treasury Stock | (1 | ) | (28 | ) | ||||
|
|
|
| |||||
Total Changes during the Period | (1 | ) | 499,757 | |||||
|
|
|
| |||||
Balance at the End of the Current Period | 53,255 | 553,011 | ||||||
|
|
|
| |||||
Total Capital Surplus: | ||||||||
Balance at the Beginning of the Current Period | 118,668 | 118,665 | ||||||
Changes during the Period | ||||||||
Increase from Share Exchange | — | 1,137,308 | ||||||
Disposal of Treasury Stock | (1 | ) | (28 | ) | ||||
|
|
|
| |||||
Total Changes during the Period | (1 | ) | 1,137,280 | |||||
|
|
|
| |||||
Balance at the End of the Current Period | 118,666 | 1,255,945 | ||||||
|
|
|
| |||||
Retained Earnings: | ||||||||
Other Retained Earnings: | ||||||||
Balance at the Beginning of the Current Period | 232,368 | 221,379 | ||||||
Changes during the Period | ||||||||
Cash Dividends | (13,264 | ) | (6,632 | ) | ||||
Net Income | 13,031 | 11,685 | ||||||
|
|
|
| |||||
Total Changes during the Period | (233 | ) | 5,053 | |||||
|
|
|
| |||||
Balance at the End of the Current Period | 232,135 | 226,432 | ||||||
|
|
|
| |||||
Total Retained Earnings: | ||||||||
Balance at the Beginning of the Current Period | 232,368 | 221,379 | ||||||
Changes during the Period | ||||||||
Cash Dividends | (13,264 | ) | (6,632 | ) | ||||
Net Income | 13,031 | 11,685 | ||||||
|
|
|
| |||||
Total Changes during the Period | (233 | ) | 5,053 | |||||
|
|
|
| |||||
Balance at the End of the Current Period | 232,135 | 226,432 | ||||||
|
|
|
| |||||
15
Table of Contents
(Continued)
| (Millions of Yen) | ||||||||
| Six Months Ended September 30, 2010 | Six Months Ended September 30, 2011 | |||||||
Treasury Stock: | ||||||||
Balance at the Beginning of the Current Period | (270 | ) | (282 | ) | ||||
Changes during the Period | ||||||||
Purchase of Treasury Stock | (5 | ) | (126 | ) | ||||
Disposal of Treasury Stock | 3 | 62 | ||||||
|
|
|
| |||||
Total Changes during the Period | (2 | ) | (64 | ) | ||||
|
|
|
| |||||
Balance at the End of the Current Period | (272 | ) | (346 | ) | ||||
|
|
|
| |||||
Total Shareholders’ Equity: | ||||||||
Balance at the Beginning of the Current Period | 612,375 | 601,370 | ||||||
Changes during the Period | ||||||||
Cash Dividends | (13,264 | ) | (6,632 | ) | ||||
Net Income | 13,031 | 11,685 | ||||||
Increase from Share Exchange | — | 1,137,308 | ||||||
Purchase of Treasury Stock | (5 | ) | (126 | ) | ||||
Disposal of Treasury Stock | 1 | 34 | ||||||
|
|
|
| |||||
Total Changes during the Period | (237 | ) | 1,142,269 | |||||
|
|
|
| |||||
Balance at the End of the Current Period | 612,138 | 1,743,640 | ||||||
|
|
|
| |||||
Subscription Rights to Shares: | ||||||||
Balance at the Beginning of the Current Period | — | — | ||||||
Changes during the Period | ||||||||
Net Changes of Items other than Shareholders’ Equity | — | 1 | ||||||
|
|
|
| |||||
Total Changes during the Period | — | 1 | ||||||
|
|
|
| |||||
Balance at the End of the Current Period | — | 1 | ||||||
|
|
|
| |||||
Total Net Assets: | ||||||||
Balance at the Beginning of the Current Period | 612,375 | 601,370 | ||||||
Changes during the Period | ||||||||
Cash Dividends | (13,264 | ) | (6,632 | ) | ||||
Net Income | 13,031 | 11,685 | ||||||
Increase from Share Exchange | — | 1,137,308 | ||||||
Purchase of Treasury Stock | (5 | ) | (126 | ) | ||||
Disposal of Treasury Stock | 1 | 34 | ||||||
Net Changes of Items other than Shareholders’ Equity | — | 1 | ||||||
|
|
|
| |||||
Total Changes during the Period | (237 | ) | 1,142,270 | |||||
|
|
|
| |||||
Balance at the End of the Current Period | 612,138 | 1,743,641 | ||||||
|
|
|
| |||||
16
Table of Contents
(4) Note on Going Concern Assumptions
There is no applicable information.
17
Table of Contents
Cautionary Statement Regarding Forward-Looking Statements
This material contains forward-looking statements (as defined in the U.S. Private Securities Litigation Reform Act of 1995) regarding our intent, belief or current expectations in respect to our future financial conditions, operating results and overall management. These forward-looking statements may be identified by words such as “believes”, “expects”, “anticipates”, “projects”, “intends”, “should”, “seeks”, “estimates”, “future”, or similar expressions or by discussion of, among other things, strategy, goals, plans or intentions. Such forward-looking statements are not guarantees of future performance and actual results may differ, owing to risks and uncertainties, including without limitation: (1) potential difficulties in integrating the management and business operations of our subsidiaries; (2) our ability to successfully execute our group business strategies; and (3) unanticipated events that result in an increase in our credit costs and a deterioration in the quality of our group companies’ loan portfolios. Given such risks and uncertainties, you should not place undue reliance on forward-looking statements, which speak only as of the release date of this material. We undertake no obligation to update or revise any forward-looking statements. In addition to this material, please refer to our most recently disclosed documents, such as our annual report on Form 20-F filed with the U.S. Securities and Exchange Commission, or press releases we have issued, for a more detailed description of matters that may affect our financial condition and operating results.
18
Table of Contents
2nd Quarter of Fiscal Year 2011
ended on Sep. 30, 2011

Table of Contents
Sumitomo Mitsui Trust Holdings, Inc.
Table of Contents
| < Definition of terms in this document > | ||
| SMTH : Sumitomo Mitsui Trust Holdings, Inc. | CMTH : Former Chuo Mitsui Trust Holdings, Inc. | |
CMTB : The Chuo Mitsui Trust and Banking Company, Limited | CMAB : Chuo Mitsui Asset Trust and Banking Company, Limited | |
| STB : The Sumitomo Trust and Banking, Co., Ltd. |
Legal Disclaimer
Regarding forward-looking Statements contained in this material This presentation material contains information that constitutes forward-looking statements. Such forward-looking statements are not guarantees of future performance and involve risks and uncertainties, and actual results may differ from those in the forward-looking statements as a result of various factors including but not limited to changes in managerial circumstances. By virtue of the aforementioned reasons, Sumitomo Mitsui Trust Holdings, Inc. hereby cautions against sole reliance on such forward-looking statements in making investment decisions.
Table of Contents
Summary of 1HFY2011 financial results
<Consolidated>
(1) Net business profit before credit costs <1> increased by 27.0 billion yen from 1HFY2010 to 175.6 billion yen, due to the effects on consolidated accounting method resulting from the management integration, in addition to the increase in market-related profit on a non-consolidated (CMTB + CMAB + STB) basis.
(2) Total credit costs <5> stood at the reversal of 0.0 billion yen, as a result of group companies’ limited credit costs, as well as those on a non-consolidated (CMTB + CMAB + STB) basis. And consolidated net gains on stocks <6> stood at the net loss of 11.0 billion yen mainly due to the devaluation of stocks.
(3) As a result, ordinary profit <2> increased by 43.6 billion yen from 1HFY2010 to 155.2 billion yen. Net income <3> increased by 42.0 billion yen to 128.1 billion yen over the same period, due to, in addition to the above mentioned, the gain on amortization of negative goodwill (43.4 billion yen) caused by share exchange. Meanwhile, net income excluding amortization of negative goodwill <4> decreased by 1.4 billion yen to 84.6 billion yen, mainly due to the disappearance of income boosting factor regarding tax effect accounting resulting from the reorganization of subsidiaries in 1HFY2010.
[Consolidated (SMTH)] | (in billions of Yen) | |||||||||||||||
| 1HFY2011 | 1HFY2010 | Change | ||||||||||||||
Net business profit before credit costs (*1) | 1 | 175.6 | 148.5 | 27.0 | ||||||||||||
Ordinary profit | 2 | 155.2 | 111.6 | 43.6 | ||||||||||||
Net income | 3 | 128.1 | 86.1 | 42.0 | ||||||||||||
(excl. amortization of negative goodwill) | 4 | 84.6 | 86.1 | (1.4 | ) | |||||||||||
|
|
|
|
|
| |||||||||||
Total credit costs | 5 | 0.0 | 2.4 | (2.3 | ) | |||||||||||
|
|
|
|
|
| |||||||||||
Net gains on stocks | 6 | (11.0 | ) | (1.1 | ) | (9.8 | ) | |||||||||
Losses on devaluation of stocks | 7 | (10.3 | ) | (5.0 | ) | (5.3 | ) | |||||||||
|
|
|
|
|
| |||||||||||
Return (Net income) on equity | 8 | 15.36 | % | 9.77 | % | 5.59 | % | |||||||||
|
|
|
|
|
| |||||||||||
(Difference from non-consolidated financial results) | ||||||||||||||||
Net business profit before credit costs (*2) | 9 | 46.0 | 28.8 | 17.1 | ||||||||||||
Net income (*2) | 10 | 70.4 | 1.1 | 69.2 | ||||||||||||
|
|
|
|
|
| |||||||||||
Total credit costs (*2) | 11 | 0.9 | (8.5 | ) | 9.4 | |||||||||||
|
|
|
|
|
| |||||||||||
| (*1) | Consolidated net business profit before credit costs = Non-consolidated net business profit before credit costs + Subsidiary companies’ ordinary profits (non-recurring effect adjusted) + Affiliates’ ordinary profits (non-recurring effect adjusted) x Ratio of equity holdings - Intra-group transaction (dividends, etc.) |
| (*2) | Differences between “Consolidated (SMTH)” and “Non-consolidated (CMTB + CMAB + STB)”. |
<Non-consolidated (CMTB + CMAB + STB)>
(1) Net business profit before credit costs <19> increased by 9.8 billion yen from 1HFY2010 to 129.5 billion yen, mainly due to a 16.0 billion yen increase in net gains on bonds <17>, while net interest income and related profit <13> and net fees and commissions and related profit <14> decreased.
(2) Total credit costs <35> stayed at 0.8 billion yen due to limited occurrence of new non-performing loans. And net gains on stocks <23> stood at the net loss of 23.2 billion yen, mainly due to the devaluation of some Japanese stocks resulting from the decline in stock prices.
(3) As a result, ordinary profit <26> decreased by 3.2 billion yen from 1HFY2010 to 87.5 billion yen, and net income <34> decreased by 27.2 billion yen to 57.6 billion yen over the same period mainly due to the disappearance of income boosting factor regarding tax effect accounting resulting from the reorganization of subsidiaries.
[Non-consolidated (CMTB + CMAB + STB)] | (in billions of Yen) | |||||||||||||||
| 1HFY2011 | 1HFY2010 | Change | ||||||||||||||
Gross business profit | 12 | 250.8 | 240.6 | 10.1 | ||||||||||||
|
|
|
|
|
| |||||||||||
Net interest income and related profit | 13 | 123.4 | 124.9 | (1.4 | ) | |||||||||||
Net fees and commissions and related profit | 14 | 79.4 | 83.7 | (4.2 | ) | |||||||||||
Net trading profit | 15 | 3.1 | 7.0 | (3.9 | ) | |||||||||||
Net other operating profit | 16 | 44.7 | 24.9 | 19.8 | ||||||||||||
Net gains on bonds | 17 | 50.6 | 34.6 | 16.0 | ||||||||||||
|
|
|
|
|
| |||||||||||
General and administrative expenses | 18 | (121.2 | ) | (120.9 | ) | (0.3 | ) | |||||||||
|
|
|
|
|
| |||||||||||
Net business profit before credit costs | 19 | 129.5 | 119.7 | 9.8 | ||||||||||||
|
|
|
|
|
| |||||||||||
Net non-recurring profit | 20 | (45.1 | ) | (28.8 | ) | (16.2 | ) | |||||||||
|
|
|
|
|
| |||||||||||
Banking a/c net credit costs | 21 | (6.4 | ) | (2.5 | ) | (3.9 | ) | |||||||||
Reversal of allowance for loan losses, etc. (*3) | 22 | 2.5 | — | 2.5 | ||||||||||||
Net gains on stocks | 23 | (23.2 | ) | (1.4 | ) | (21.8 | ) | |||||||||
Losses on devaluation of stocks | 24 | (21.7 | ) | (5.0 | ) | (16.6 | ) | |||||||||
Others | 25 | (17.9 | ) | (24.8 | ) | 6.9 | ||||||||||
|
|
|
|
|
| |||||||||||
Ordinary profit | 26 | 87.5 | 90.8 | (3.2 | ) | |||||||||||
|
|
|
|
|
| |||||||||||
Extraordinary profit/ loss | 27 | (7.5 | ) | (6.3 | ) | (1.2 | ) | |||||||||
|
|
|
|
|
| |||||||||||
Impairment loss on tangible fixed assets | 28 | (4.0 | ) | (0.3 | ) | (3.6 | ) | |||||||||
Impairment loss on shares of a subsidiary | 29 | — | (15.2 | ) | 15.2 | |||||||||||
Reversal of allowance for loan losses, etc. (*3) | 30 | — | 13.6 | (13.6 | ) | |||||||||||
Costs related to the Management Integration | 31 | (3.5 | ) | (4.3 | ) | 0.7 | ||||||||||
|
|
|
|
|
| |||||||||||
Income before income taxes | 32 | 79.9 | 84.5 | (4.5 | ) | |||||||||||
|
|
|
|
|
| |||||||||||
Total income taxes | 33 | (22.3 | ) | 0.4 | (22.7 | ) | ||||||||||
|
|
|
|
|
| |||||||||||
Net income | 34 | 57.6 | 84.9 | (27.2 | ) | |||||||||||
|
|
|
|
|
| |||||||||||
Total credit costs | 35 | (0.8 | ) | 11.0 | (11.8 | ) | ||||||||||
|
|
|
|
|
| |||||||||||
Overhead ratio (-18 / 12) | 36 | 48.35 | % | 50.26 | % | (1.91 | %) | |||||||||
|
|
|
|
|
| |||||||||||
| (*3) | “Reversal of allowance for loan losses” (1HFY2011:1.9bn yen, 1HFY2010:11.8bn yen) and “Recoveries of written-off claims” (1HFY2011:0.5bn yen, 1HFY2010:1.7bn yen) are included in “Net non-recurring profit” from this fiscal year, in accordance with the revision of “Practical Guidelines on Accounting Standards for Financial Instruments”. |
-Summary 1-
Table of Contents
(For reference) Overview of the business operation
<Balance of major accounts>
(1) Balance of major accounts (Banking a/c and Principal guaranteed trust a/c combined)
| [Non-consolidated (CMTB + STB)] | (in billions of Yen) | |||||||||||||
| Sep. 2011 (1HFY2011) (A) | Mar. 2011 (Full FY2010) (B) | Change from Mar. 2011 (A) - (B) | ||||||||||||
Loans | (Ending balance) | 21,246.5 | 21,417.2 | (170.7 | ) | |||||||||
| (Average balance) | 20,198.0 | 19,826.8 | 371.2 | |||||||||||
|
|
|
|
|
| |||||||||
Deposits, Trust principal (*) | (Ending balance) | 23,651.9 | 23,327.8 | 324.1 | ||||||||||
| (Average balance) | 23,283.2 | 22,463.9 | 819.3 | |||||||||||
|
|
|
|
|
| |||||||||
| (*) | Deposits: Excluding NCDs. |
(2) Yields and margins (Domestic Banking a/c and Principal guaranteed trust a/c combined)
| [Non-consolidated (CMTB + STB)] | (%) | |||||||||||||||||||
| 1HFY2011 | 2HFY2010 | 1HFY2010 | Change from 2HFY2010 | Change from 1HFY2010 | ||||||||||||||||
Loan deposit margin | 0.84 | 0.88 | 0.90 | (0.04 | ) | (0.06 | ) | |||||||||||||
Loans and bills discounted | 1.21 | 1.28 | 1.33 | (0.07 | ) | (0.12 | ) | |||||||||||||
Deposits and trust principal | 0.37 | 0.40 | 0.43 | (0.03 | ) | (0.06 | ) | |||||||||||||
|
|
|
|
|
|
|
|
|
| |||||||||||
(3) Status of loans (Banking a/c and Principal guaranteed trust a/c combined)
| [Non-consolidated (CMTB + STB)] | (in billions of Yen) | |||||||||||
| Sep. 2011 | Mar. 2011 | Change from Mar. 2011 | ||||||||||
Loans to individuals | 6,085.3 | 5,946.1 | 139.1 | |||||||||
Residential mortgage loans | 5,559.6 | 5,381.4 | 178.2 | |||||||||
|
|
|
|
|
| |||||||
Loans to corporations | 15,161.2 | 15,471.0 | (309.8 | ) | ||||||||
Japanese corporations operating overseas | 1,382.5 | 1,411.4 | (28.8 | ) | ||||||||
|
|
|
|
|
| |||||||
<Investment trust and Insurance>
(1) Sales volume and sales balance of investment trust/ insurance
[Non-consolidated (CMTB + STB)]
| <Sales volume> | (in billions of Yen) | |||||||||||||||||
| 1HFY2011 | 2HFY2010 | 1HFY2010 | Change from 2HFY2010 | Change from 1HFY2010 | ||||||||||||||
Total | 727.2 | 583.0 | 567.7 | 144.2 | 159.4 | |||||||||||||
|
|
|
|
|
|
|
|
| ||||||||||
Investment trust | 492.6 | 456.5 | 360.3 | 36.0 | 132.2 | |||||||||||||
Fund wrap, SMA | 34.0 | 31.1 | 25.0 | 2.9 | 9.0 | |||||||||||||
Insurance | 200.5 | 95.3 | 182.3 | 105.2 | 18.1 | |||||||||||||
|
|
|
|
|
|
|
|
| ||||||||||
| <Sales balance> | (in billions of Yen) | |||||||||||
| Sep. 2011 | Mar. 2011 | Change from Mar. 2011 | ||||||||||
Total | 4,115.2 | 4,330.2 | (214.9 | ) | ||||||||
|
|
|
|
|
| |||||||
Investment trust | 1,929.5 | 2,189.5 | (260.0 | ) | ||||||||
Fund wrap, SMA | 118.7 | 100.3 | 18.3 | |||||||||
Insurance (*) | 2,067.0 | 2,040.3 | 26.6 | |||||||||
|
|
|
|
|
| |||||||
| (*) | Definition has been standardized for the purpose of disclosing combined figure of CMTB and STB since this explanatory material. As a result, it differs from the simple sum of each company’s balance which is disclosed in FY2010 explanatory material. |
(2) Fees and commissions
| [Non-consolidated (CMTB + STB)] | (in billions of Yen) | |||||||||||
| 1HFY2011 | 1HFY2010 | Change from 1HFY2010 | ||||||||||
Total | 23.7 | 20.8 | 2.8 | |||||||||
|
|
|
|
|
| |||||||
Sales fees of investment trust/ insurance | 15.9 | 12.7 | 3.1 | |||||||||
Others (management and administration ) | 7.8 | 8.0 | (0.2 | ) | ||||||||
|
|
|
|
|
| |||||||
-Summary 2-
Table of Contents
<Overview of fiduciary services business>
Fees from fiduciary services business
| [Non-consolidated (CMTB + CMAB + STB)] | (in billions of Yen) | |||||||||||
| 1HFY2011 | 1HFY2010 | Change from 1HFY2010 | ||||||||||
Fees from fiduciary services business | 30.6 | 30.6 | (0.0 | ) | ||||||||
|
|
|
|
|
| |||||||
Gross business profit from fiduciary services business | 42.9 | 42.8 | 0.1 | |||||||||
Fees paid for outsourcing | (12.3 | ) | (12.1 | ) | (0.1 | ) | ||||||
|
|
|
|
|
| |||||||
<Overview of real estate business>
Fees from real estate business
| [Non-consolidated (CMTB + STB)] | (in billions of Yen) | |||||||||||
| 1HFY2011 | 1HFY2010 | Change from 1HFY2010 | ||||||||||
Fees from real estate business | 7.5 | 13.1 | (5.5 | ) | ||||||||
|
|
|
|
|
| |||||||
Real estate brokerage fees | 3.7 | 8.6 | (4.9 | ) | ||||||||
Real estate trust fees, etc. | 3.3 | 4.0 | (0.6 | ) | ||||||||
|
|
|
|
|
| |||||||
<Status of the holding securities>
(1) Consolidated cost of available-for-sale securities <1> decreased by 548.1 billion yen from the end of previous fiscal year, mainly due to the decrease in non-consolidated (CMTB + CMAB + STB) cost of others <11> centering on that of U.S. treasury. Meanwhile, cost of Japanese stocks <2> increased due to the revaluation of Japanese stocks in accordance with purchase accounting method, and that of Japanese bonds <3> increased mainly due to the consolidation of Japan Trustee Services Bank, Ltd. Unrealized gains/ losses of available-for-sale securities stood at the net gains of 15.3 billion yen, as a result of a 137.9 billion yen decrease in unrealized gains of Japanese stocks <2>, while unrealized gains/ losses of Japanese bonds <3> and others <5> improved.
(2) Consolidated cost of held-to-maturity debt securities <6> decreased by 75.4 billion yen from the end of previous fiscal year to 649.4 billion yen, mainly due to the decrease in the balance of international investment on a non-consolidated (CMTB + CMAB + STB) basis, and unrealized gains/ losses of those securities stood at the net gains of 36.3 billion yen.
Securities with fair value
[Consolidated (SMTH)] | (in billions of Yen) | |||||||||||
| Sep.2011 | ||||||||||||||||||||||||
| Cost | Fair value | Net | Change of cost from Mar. 2011 | Change of net from Mar. 2011 | ||||||||||||||||||||
Available-for-sale securities | 1 | 6,807.8 | 6,823.1 | 15.3 | (548.1 | ) | (52.8 | ) | ||||||||||||||||
|
|
|
|
|
|
|
|
|
| |||||||||||||||
Japanese stocks | 2 | 893.1 | 838.5 | (54.6 | ) | 19.2 | (137.9 | ) | ||||||||||||||||
Japanese bonds | 3 | 4,411.1 | 4,453.9 | 42.7 | 360.4 | 34.9 | ||||||||||||||||||
|
|
|
|
|
|
|
|
|
| |||||||||||||||
Government bonds | 4 | 3,600.3 | 3,639.6 | 39.2 | 361.6 | 33.2 | ||||||||||||||||||
|
|
|
|
|
|
|
|
|
| |||||||||||||||
Others | 5 | 1,503.5 | 1,530.7 | 27.2 | (927.8 | ) | 50.1 | |||||||||||||||||
|
|
|
|
|
|
|
|
|
| |||||||||||||||
Held-to-maturity debt securities | 6 | 649.4 | 685.8 | 36.3 | (75.4 | ) | (13.7 | ) | ||||||||||||||||
|
|
|
|
|
|
|
|
|
| |||||||||||||||
| [Non-consolidated (CMTB + CMAB + STB)] | (in billions of Yen) | |||||||||||||||||||||||
| Sep.2011 | ||||||||||||||||||||||||
| Cost | Fair value | Net | Change of cost from Mar. 2011 | Change of net from Mar. 2011 | ||||||||||||||||||||
Available-for-sale securities | 7 | 6,071.0 | 6,098.0 | 26.9 | (1,220.8 | ) | (22.9 | ) | ||||||||||||||||
|
|
|
|
|
|
|
|
|
| |||||||||||||||
Japanese stocks | 8 | 790.8 | 766.5 | (24.3 | ) | (22.7 | ) | (89.5 | ) | |||||||||||||||
Japanese bonds | 9 | 3,784.2 | 3,817.7 | 33.5 | (286.4 | ) | 25.6 | |||||||||||||||||
|
|
|
|
|
|
|
|
|
| |||||||||||||||
Government bonds | 10 | 2,954.9 | 2,983.5 | 28.6 | (283.7 | ) | 22.6 | |||||||||||||||||
|
|
|
|
|
|
|
|
|
| |||||||||||||||
Others | 11 | 1,495.9 | 1,513.7 | 17.7 | (911.6 | ) | 40.9 | |||||||||||||||||
|
|
|
|
|
|
|
|
|
| |||||||||||||||
Held-to-maturity debt securities | 12 | 648.5 | 685.1 | 36.6 | (75.7 | ) | (13.5 | ) | ||||||||||||||||
|
|
|
|
|
|
|
|
|
| |||||||||||||||
-Summary 3-
Table of Contents
<Reference 1> Breakdown of Available-for-sale securities (Others)
| [Non-consolidated (CMTB + CMAB + STB)] | (in billions of Yen) |
| Sep. 2011 | ||||||||||||||||||||||||
| Cost | Fair value | Net | Change of cost from Mar. 2011 | Change of net from Mar. 2011 | ||||||||||||||||||||
Domestic investment (*1) | 1 | 443.6 | 438.6 | (4.9 | ) | 55.9 | (0.7 | ) | ||||||||||||||||
International investment (*1) | 2 | 824.2 | 854.9 | 30.7 | (1,026.8 | ) | 42.9 | |||||||||||||||||
|
|
|
|
|
|
|
|
|
| |||||||||||||||
Foreign government bonds, etc. | 3 | 281.8 | 296.2 | 14.4 | (852.3 | ) | 36.9 | |||||||||||||||||
|
|
|
|
|
|
|
|
|
| |||||||||||||||
US treasury | 4 | 186.4 | 197.6 | 11.2 | (741.6 | ) | 29.0 | |||||||||||||||||
European government bonds (*2) | 5 | 19.7 | 20.0 | 0.3 | (143.3 | ) | 5.6 | |||||||||||||||||
|
|
|
|
|
|
|
|
|
| |||||||||||||||
US agency MBS (*3) | 6 | 236.7 | 243.6 | 6.8 | (107.4 | ) | 9.8 | |||||||||||||||||
|
|
|
|
|
|
|
|
|
| |||||||||||||||
Others (Investment trust, etc.) (*4) | 7 | 228.0 | 220.0 | (8.0 | ) | 59.2 | (1.2 | ) | ||||||||||||||||
|
|
|
|
|
|
|
|
|
| |||||||||||||||
Total | 8 | 1,495.9 | 1,513.7 | 17.7 | (911.6 | ) | 40.9 | |||||||||||||||||
|
|
|
|
|
|
|
|
|
| |||||||||||||||
| (*1) | Based on the location of final exposure |
| (*2) | Constituted by U.K. government bond only |
| (*3) | Constituted by GNMA only |
| (*4) | Uncategorizable into “Domestic investment” or “International investment” |
<Reference 2> Breakdown of Held-to-maturity debt securities
| [Non-consolidated (CMTB + CMAB + STB)] | (in billions of Yen) |
| Sep. 2011 | ||||||||||||||||||||||||
| Cost | Fair value | Net | Change of cost from Mar. 2011 | Change of net from Mar. 2011 | ||||||||||||||||||||
Japanese Government Bonds | 9 | 174.4 | 182.4 | 8.0 | (10.0 | ) | 0.1 | |||||||||||||||||
Japanese Local Government Bonds/ Corporate Bonds | 10 | 21.9 | 22.1 | 0.2 | (0.4 | ) | (0.0 | ) | ||||||||||||||||
Others | 11 | 452.1 | 480.5 | 28.3 | (65.2 | ) | (13.6 | ) | ||||||||||||||||
|
|
|
|
|
|
|
|
|
| |||||||||||||||
Domestic investment (*) | 12 | 88.1 | 90.7 | 2.5 | 4.0 | 0.8 | ||||||||||||||||||
International investment (*) | 13 | 364.0 | 389.8 | 25.7 | (69.3 | ) | (14.4 | ) | ||||||||||||||||
|
|
|
|
|
|
|
|
|
| |||||||||||||||
Total | 14 | 648.5 | 685.1 | 36.6 | (75.7 | ) | (13.5 | ) | ||||||||||||||||
|
|
|
|
|
|
|
|
|
| |||||||||||||||
| (*) | Based on the location of final exposure |
<Problem assets based on the Financial Reconstruction Act>
(1) The total balance of “Problem assets based on the Financial Reconstruction Act” <1> decreased by 4.5 billion yen from the end of previous fiscal year to 240.8 billion yen. The ratio of “Problem assets based on the Financial reconstruction Act” to the total balance <2> remained flat at 1.1% over the same period.
(2) Coverage ratios as of the end of September 2011 for “Doubtful” and “Substandard”, which are secured by collateral values and allowance for loan losses, stood at 91.7% and 75.4%, respectively, and coverage ratio for “Problem assets based on the Financial Reconstruction Act” stood at 87.9%, all of which represent sufficient levels.
| [Non-consolidated (CMTB + STB)] (Banking a/c and Principal guaranteed trust a/c combined) | (in billions of Yen) |
| Sep. 2011 | Mar. 2011 | Change from Mar. 2011 | Sep. 2011 | |||||||||||||||||||||
| Coverage ratio | Allowance ratio | |||||||||||||||||||||||
Problem assets based on the Financial Reconstruction Act | 1 | 240.8 | 245.3 | (4.5 | ) | 87.9 | % | 60.3 | % | |||||||||||||||
|
|
|
|
|
|
|
|
|
| |||||||||||||||
Ratio to total balance | 2 | (1.1 | %) | (1.1 | %) | (0.0 | %) | |||||||||||||||||
|
|
|
|
|
|
|
|
|
| |||||||||||||||
Bankrupt and practically bankrupt | 3 | 33.7 | 41.3 | (7.5 | ) | 100.0 | % | 100.0 | % | |||||||||||||||
Doubtful | 4 | 133.9 | 93.7 | 40.3 | 91.7 | % | 67.7 | % | ||||||||||||||||
Substandard (a) | 5 | 73.1 | 110.3 | (37.2 | ) | 75.4 | % | 26.4 | % | |||||||||||||||
|
|
|
|
|
|
|
|
|
| |||||||||||||||
Ordinary assets | 6 | 21,685.1 | 21,827.9 | (142.8 | ) | |||||||||||||||||||
|
|
|
|
|
| |||||||||||||||||||
Substandard debtors (excl. Substandard) (b) | 7 | 36.0 | 28.2 | 7.9 | ||||||||||||||||||||
Other special mention debtors (excl. (a) and (b)) | 8 | 690.5 | 711.2 | (20.7 | ) | |||||||||||||||||||
Ordinary debtors | 9 | 20,958.6 | 21,088.5 | (130.0 | ) | |||||||||||||||||||
|
|
|
|
|
| |||||||||||||||||||
-Summary 4-
Table of Contents
<Status of BIS capital adequacy ratio (No.1 standard)>
(1) Consolidated BIS capital adequacy ratio (No.1 standard) (preliminary) and Tier I capital ratio as of the end of September 2011 stood at 16.52% and 11.65%, respectively.
| [Consolidated (SMTH)] | (in billions of Yen) | |||||||
| Sep. 2011 (Preliminary) | ||||||||
BIS capital adequacy ratio | 1 | 16.52 | % | |||||
|
| |||||||
Tier I capital ratio | 2 | 11.65 | % | |||||
|
| |||||||
Total qualifying capital | 3 | 2,954.0 | ||||||
|
| |||||||
Tier I | 4 | 2,082.8 | ||||||
|
| |||||||
Total risk-weighted assets | 5 | 17,874.5 | ||||||
|
| |||||||
[Consolidated (SMTH)]
| (in billions of Yen) | ||||||||||||||||||||
| Forecast for FY2011 | ||||||||||||||||||||
| 1HFY2011 Actual | Revised forecast (A) | Previous forecast (B) | Change (A) - (B) | |||||||||||||||||
Net business profit before credit costs | 1 | 175.6 | 320.0 | 295.0 | 25.0 | |||||||||||||||
Ordinary profit | 2 | 155.2 | 265.0 | 215.0 | 50.0 | |||||||||||||||
Net income | 3 | 128.1 | 180.0 | 150.0 | 30.0 | |||||||||||||||
|
|
|
|
|
|
|
| |||||||||||||
Net income (excl. amortization of negative goodwill) | 4 | 84.6 | 135.0 | 110.0 | 25.0 | |||||||||||||||
|
|
|
|
|
|
|
| |||||||||||||
Total credit costs | 5 | 0.0 | (20.0 | ) | (40.0 | ) | 20.0 | |||||||||||||
|
|
|
|
|
|
|
| |||||||||||||
Dividend on common share (Yen) | 6 | 4.00 | 8.00 | 8.00 | — | |||||||||||||||
|
|
|
|
|
|
|
| |||||||||||||
Consolidated dividend payout ratio (*) | 7 | — | 25.5 | % | ||||||||||||||||
|
|
|
| |||||||||||||||||
| (*) | Consolidated dividend payout ratio for FY2011 is calculated by the formula below, excluding the one-off effect of a 43.4 billion yen amortization of negative goodwill. |
Consolidated dividend payout ratio = { Total amount of dividends for common shares / ( Consolidated net income (excl. amortization of negative goodwill) - Total amount of dividends for preferred shares )} x 100
[Non-consolidated (CMTB + CMAB + STB)]
| (in billions of Yen) | ||||||||||||||||||||
| Forecast for FY2011 | ||||||||||||||||||||
| 1HFY2011 Actual | Revised forecast (A) | Previous forecast (B) | Change (A) - (B) | |||||||||||||||||
Net business profit before credit costs | 8 | 129.5 | 235.0 | 235.0 | — | |||||||||||||||
|
|
|
|
|
|
|
| |||||||||||||
CMTB | 9 | 44.4 | 90.0 | 90.0 | — | |||||||||||||||
CMAB | 10 | 6.8 | 15.0 | 15.0 | — | |||||||||||||||
STB | 11 | 78.2 | 130.0 | 130.0 | — | |||||||||||||||
Ordinary profit | 12 | 87.5 | 165.0 | 175.0 | (10.0 | ) | ||||||||||||||
|
|
|
|
|
|
|
| |||||||||||||
CMTB | 13 | 20.4 | 57.0 | 67.0 | (10.0 | ) | ||||||||||||||
CMAB | 14 | 5.1 | 13.0 | 13.0 | — | |||||||||||||||
STB | 15 | 61.9 | 95.0 | 95.0 | — | |||||||||||||||
Net income | 16 | 57.6 | 100.0 | 100.0 | — | |||||||||||||||
|
|
|
|
|
|
|
| |||||||||||||
CMTB | 17 | 17.1 | 38.0 | 38.0 | — | |||||||||||||||
CMAB | 18 | 2.8 | 7.0 | 7.0 | — | |||||||||||||||
STB | 19 | 37.6 | 55.0 | 55.0 | — | |||||||||||||||
|
|
|
|
|
|
|
| |||||||||||||
Total credit costs | 20 | (0.8 | ) | (15.0 | ) | (30.0 | ) | 15.0 | ||||||||||||
|
|
|
|
|
|
|
| |||||||||||||
CMTB | 21 | (2.6 | ) | (5.0 | ) | (10.0 | ) | 5.0 | ||||||||||||
STB | 22 | 1.8 | (10.0 | ) | (20.0 | ) | 10.0 | |||||||||||||
|
|
|
|
|
|
|
| |||||||||||||
-Summary 5-
Table of Contents
4. Accounting for business combination related to the Management Integration
(Accounting for business combination)
| (1) | The accounting for the business combinations (hereinafter, “purchase accounting method”) is applied, and thus STB would be the acquiring company with CMTH as the acquired company. |
(Effect on assets and liabilities by applying purchase accounting method)
| (1) | As a result of revaluating (mark to market) assets and liabilities of CMTH (consolidated) as of March 31 by applying purchase accounting method, total assets decreased by 72.9 billion yen to 14,158.1 billion yen, and total liabilities increased by 50.7 billion yen to 13,437.6 billion yen. There are no intangible assets which are newly recognized. |
| (2) | Negative goodwill of 43.4 billion yen was recognized, as shareholders’ equity of 532.5 billion yen (deducting 187.8 billion yen of minority interest from 720.4 billion yen of net assets) exceeded acquisition cost of 489.1 billion yen ( total market value of CMTH’s shares based on the share price as of March 31). |
(Effect on financial results)
| (1) | Gain on amortization of negative goodwill of 43.4 billion yen is posted as an extraordinary profit in 1QFY2011 in accordance with the “Accounting Standard for Business Combinations”. |
| (2) | There are differences between consolidated and non-consolidated financial results as to profit/ loss resulting from amortization/ accumulation, sales, or devaluation of corresponding assets and liabilities, as the revaluation of assets and liabilities described above is a unique procedure for preparing consolidated financial statements. An effect of these differences for 1HFY2011 is approximately 19.0 billion yen of profit at the level of net income, including one-time factor such as gains/ losses on sales or devaluation of securities. |
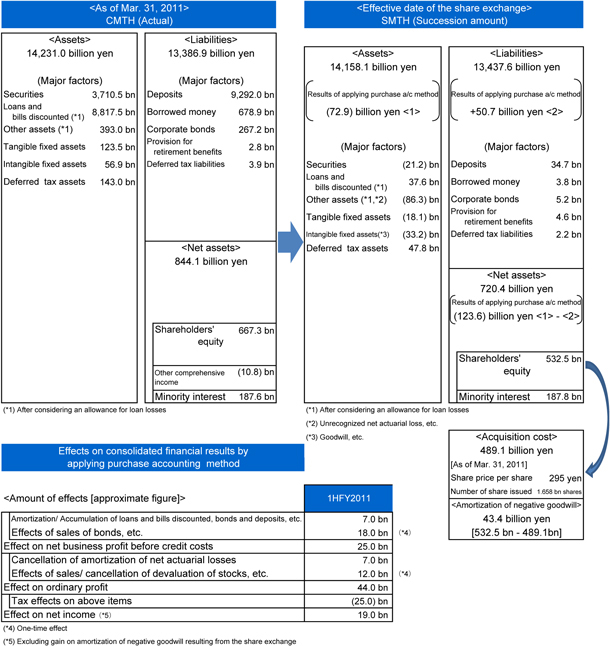
-Summary 6-
Table of Contents
Sumitomo Mitsui Trust Holdings, Inc.
Financial figures
[Consolidated]
| Millions of Yen | ||||||||||||||||
| 1HFY2011 | 1HFY2010 | Change | ||||||||||||||
Consolidated gross business profit (*1) | 1 | 359,905 | 314,378 | 45,527 | ||||||||||||
Consolidated gross business profit (after written-off of principal guaranteed trust a/c) (1 + 19) | 2 | 359,905 | 314,378 | 45,527 | ||||||||||||
|
|
|
|
|
| |||||||||||
Net interest income and related profit | 3 | 132,435 | 133,072 | (636 | ) | |||||||||||
Net interest income | 4 | 126,922 | 126,918 | 3 | ||||||||||||
Trust fees from principal guaranteed trust a/c (before written-off of principal guaranteed trust a/c) | 5 | 5,513 | 6,153 | (639 | ) | |||||||||||
Net fees and commissions and related profit | 6 | 141,978 | 128,487 | 13,491 | ||||||||||||
Net fees and commissions | 7 | 97,451 | 86,170 | 11,281 | ||||||||||||
Other trust fees | 8 | 44,527 | 42,317 | 2,210 | ||||||||||||
Net trading profit | 9 | 3,068 | 7,086 | (4,018 | ) | |||||||||||
Net other operating profit | 10 | 82,422 | 45,731 | 36,691 | ||||||||||||
Net gains on bonds | 11 | 69,153 | 34,657 | 34,496 | ||||||||||||
Net gains from derivatives other than for trading or hedging | 12 | (10,298 | ) | (14,505 | ) | 4,207 | ||||||||||
|
|
|
|
|
| |||||||||||
General and administrative expenses | 13 | (185,010 | ) | (171,979 | ) | (13,031 | ) | |||||||||
(excluding amortization of goodwill) | 14 | (180,561 | ) | (165,354 | ) | (15,207 | ) | |||||||||
Personnel expenses | 15 | (81,420 | ) | (77,696 | ) | (3,724 | ) | |||||||||
Non-personnel expenses excluding taxes | 16 | (97,047 | ) | (87,598 | ) | (9,449 | ) | |||||||||
Taxes other than income taxes | 17 | (6,542 | ) | (6,684 | ) | 142 | ||||||||||
|
|
|
|
|
| |||||||||||
Provision of general allowance for loan losses | 18 | — | 8,363 | (8,363 | ) | |||||||||||
Principal guaranteed trust a/c credit costs | 19 | — | — | — | ||||||||||||
Banking a/c credit costs | 20 | (1,412 | ) | (14,074 | ) | 12,662 | ||||||||||
Written-off of loans | 21 | (1,450 | ) | (3,647 | ) | 2,196 | ||||||||||
Provision of specific allowance for loan losses | 22 | — | (9,988 | ) | 9,988 | |||||||||||
Losses on sales of loans | 23 | 38 | (438 | ) | 477 | |||||||||||
Reversal of allowance for loan losses (*2) | 24 | 473 | — | 473 | ||||||||||||
Recoveries of written-off claims (*2) | 25 | 1,028 | — | 1,028 | ||||||||||||
Net gains on stocks | 26 | (11,034 | ) | (1,138 | ) | (9,895 | ) | |||||||||
Losses on devaluation of stocks | 27 | (10,393 | ) | (5,075 | ) | (5,317 | ) | |||||||||
Net income from affiliates by equity method | 28 | 1,928 | 1,438 | 490 | ||||||||||||
Others | 29 | (10,581 | ) | (25,352 | ) | 14,770 | ||||||||||
|
|
|
|
|
| |||||||||||
Ordinary profit | 30 | 155,296 | 111,634 | 43,662 | ||||||||||||
|
|
|
|
|
| |||||||||||
Extraordinary profit | 31 | 39,126 | (4,385 | ) | 43,512 | |||||||||||
Gain on amortization of negative goodwill related to share exchange | 32 | 43,431 | — | 43,431 | ||||||||||||
Goodwill impairment loss | 33 | — | (6,041 | ) | 6,041 | |||||||||||
Reversal of allowance for loan losses (*2) | 34 | — | 5,815 | (5,815 | ) | |||||||||||
Recoveries of written-off claims (*2) | 35 | — | 2,361 | (2,361 | ) | |||||||||||
|
|
|
|
|
| |||||||||||
Income before income tax | 36 | 194,423 | 107,248 | 87,174 | ||||||||||||
|
|
|
|
|
| |||||||||||
Total income taxes | 37 | (55,400 | ) | (10,501 | ) | (44,899 | ) | |||||||||
Income taxes-current | 38 | (20,389 | ) | (13,985 | ) | (6,403 | ) | |||||||||
Income taxes-deferred | 39 | (35,011 | ) | 3,483 | (38,495 | ) | ||||||||||
Net income before minority interests | 40 | 139,022 | 96,746 | 42,275 | ||||||||||||
Minority interest | 41 | (10,913 | ) | (10,639 | ) | (273 | ) | |||||||||
|
|
|
|
|
| |||||||||||
Net income | 42 | 128,109 | 86,107 | 42,002 | ||||||||||||
|
|
|
|
|
| |||||||||||
Net income (excluding gain on amortization of negative goodwill related to share exchange) (42 - 32) | 43 | 84,677 | 86,107 | (1,429 | ) | |||||||||||
|
|
|
|
|
| |||||||||||
Total credit costs (18 + 19 + 20 + 24 + 25 + 34 + 35) | 44 | 89 | 2,465 | (2,375 | ) | |||||||||||
|
|
|
|
|
| |||||||||||
Consolidated net business profit before credit costs (*3) | 45 | 175,629 | 148,560 | 27,068 | ||||||||||||
(Difference from non-consolidated (CMTB+CMAB+STB) net business profit before credit costs | 46 | 46,057 | 28,857 | 17,199 | ||||||||||||
|
|
|
|
|
| |||||||||||
| (*1) | Consolidated gross business profit = Trust fees + (Interest income - Interest expenses) + (Fees and commissions - Fees and commissions payments) + (Trading income - Trading expenses) + (Other operating income - Other operating expenses) |
| (*2) | Due to the amendment of “Practical Guidelines on Accounting Standards for Financial Instruments”, “Reversal of allowance for loan losses” and “Recoveries of written-off claims” has been relocated from this fiscal year. |
| (*3) | Consolidated net business profit before credit costs = Non-consolidated (CMTB+ CMAB+STB) net business profit before credit costs + Subsidiary companies’ ordinary profits (non-recurring effect adjusted) + Affiliates’ ordinary profits (non-recurring effect adjusted) x Ratio of equity holdings - Intra-group transaction (dividends, etc.) |
< Number of subsidiaries/ affiliates >
| Sep. 2011 | Mar. 2011 | Change | ||||||||||||||
Consolidated subsidiaries | 47 | 80 | 76 | 4 | ||||||||||||
|
|
|
|
|
| |||||||||||
Affiliates (subject to the equity method) | 48 | 14 | 13 | 1 | ||||||||||||
|
|
|
|
|
| |||||||||||
| Note: | Number of subsidiaries and affiliates at Mar. 2011 is combined total for those of CMTH and STB (for reference). Japan Trustee Services Bank, Ltd., an affiliate of both CMTH and STB, is counted as one entity as of Mar. 2011. |
1
Table of Contents
Sumitomo Mitsui Trust Holdings, Inc.
[Non-consolidated (CMTB + CMAB + STB)]
| Millions of Yen | ||||||||||||||||||||||||||||||||||||||||
| 1HFY2011 | 1HFY2010 | Change | ||||||||||||||||||||||||||||||||||||||
| Total | CMTB | CMAB | STB | Total | Total | CMTB | CMAB | STB | ||||||||||||||||||||||||||||||||
Gross business profit | 1 | 250,856 | 93,266 | 14,801 | 142,789 | 240,669 | 10,187 | (7,601 | ) | (8 | ) | 17,796 | ||||||||||||||||||||||||||||
Gross business profit (after written-off of principal guaranteed trust a/c) | 2 | 250,856 | 93,266 | 14,801 | 142,789 | 240,669 | 10,187 | (7,601 | ) | (8 | ) | 17,796 | ||||||||||||||||||||||||||||
|
|
|
|
|
|
|
|
|
|
|
|
|
|
|
|
|
| |||||||||||||||||||||||
Net interest income and related profit | 3 | 123,433 | 55,856 | 9 | 67,567 | 124,926 | (1,492 | ) | 2,356 | 4 | (3,854 | ) | ||||||||||||||||||||||||||||
Net interest income | 4 | 117,976 | 52,134 | 9 | 65,832 | 118,772 | (795 | ) | 2,772 | 4 | (3,572 | ) | ||||||||||||||||||||||||||||
Domestic | 5 | 102,239 | 43,023 | 9 | 59,205 | 99,045 | 3,194 | 3,704 | 4 | (514 | ) | |||||||||||||||||||||||||||||
International | 6 | 15,737 | 9,110 | — | 6,626 | 19,727 | (3,989 | ) | (932 | ) | — | (3,057 | ) | |||||||||||||||||||||||||||
Trust fees from principal guaranteed trust a/c (before written off of principal guaranteed trust a/c) | 7 | 5,456 | 3,721 | — | 1,734 | 6,153 | (696 | ) | (415 | ) | — | (281 | ) | |||||||||||||||||||||||||||
|
|
|
|
|
|
|
|
|
|
|
|
|
|
|
|
|
| |||||||||||||||||||||||
Net fees and commissions and related profit | 8 | 79,477 | 23,976 | 14,791 | 40,709 | 83,729 | (4,252 | ) | (3,223 | ) | (12 | ) | (1,016 | ) | ||||||||||||||||||||||||||
Net fees and commissions | 9 | 37,969 | 22,601 | (2,535 | ) | 17,903 | 41,366 | (3,396 | ) | (2,864 | ) | 174 | (707 | ) | ||||||||||||||||||||||||||
Other trust fees | 10 | 41,507 | 1,375 | 17,326 | 22,805 | 42,362 | (855 | ) | (358 | ) | (187 | ) | (308 | ) | ||||||||||||||||||||||||||
|
|
|
|
|
|
|
|
|
|
|
|
|
|
|
|
|
| |||||||||||||||||||||||
Net trading income | 11 | 3,151 | 1,626 | — | 1,524 | 7,086 | (3,935 | ) | 172 | — | (4,108 | ) | ||||||||||||||||||||||||||||
Net other operating income | 12 | 44,795 | 11,807 | — | 32,988 | 24,928 | 19,867 | (6,908 | ) | — | 26,775 | |||||||||||||||||||||||||||||
Net gains on foreign exchange transactions | 13 | 1,599 | (122 | ) | — | 1,722 | 1,685 | (85 | ) | (183 | ) | — | 97 | |||||||||||||||||||||||||||
Net gains on bonds | 14 | 50,680 | 13,678 | — | 37,002 | 34,625 | 16,054 | (5,639 | ) | — | 21,694 | |||||||||||||||||||||||||||||
Net gains from derivatives other than for trading or hedging | 15 | (10,264 | ) | (1,708 | ) | — | (8,555 | ) | (14,556 | ) | 4,291 | (1,116 | ) | — | 5,407 | |||||||||||||||||||||||||
|
|
|
|
|
|
|
|
|
|
|
|
|
|
|
|
|
| |||||||||||||||||||||||
General and administrative expenses | 16 | (121,284 | ) | (48,818 | ) | (7,953 | ) | (64,513 | ) | (120,966 | ) | (318 | ) | (83 | ) | (312 | ) | 77 | ||||||||||||||||||||||
Personnel expenses | 17 | (48,981 | ) | (21,607 | ) | (3,873 | ) | (23,500 | ) | (50,109 | ) | 1,127 | (153 | ) | (284 | ) | 1,565 | |||||||||||||||||||||||
Non-personnel expenses | 18 | (66,621 | ) | (24,802 | ) | (4,003 | ) | (37,815 | ) | (65,209 | ) | (1,411 | ) | (175 | ) | (25 | ) | (1,210 | ) | |||||||||||||||||||||
Taxes other than income taxes | 19 | (5,681 | ) | (2,407 | ) | (76 | ) | (3,197 | ) | (5,647 | ) | (34 | ) | 246 | (3 | ) | (277 | ) | ||||||||||||||||||||||
|
|
|
|
|
|
|
|
|
|
|
|
|
|
|
|
|
| |||||||||||||||||||||||
Net business profit before credit costs (1 + 16) | 20 | 129,571 | 44,448 | 6,847 | 78,275 | 119,702 | 9,868 | (7,684 | ) | (320 | ) | 17,874 | ||||||||||||||||||||||||||||
(Excluding Net gains on bonds) (20 - 14) | 21 | 78,891 | 30,769 | 6,847 | 41,273 | 85,077 | (6,185 | ) | (2,044 | ) | (320 | ) | (3,820 | ) | ||||||||||||||||||||||||||
|
|
|
|
|
|
|
|
|
|
|
|
|
|
|
|
|
| |||||||||||||||||||||||
Provision of general allowance for loan losses | 22 | 3,144 | 3,144 | — | — | — | 3,144 | 3,144 | — | — | ||||||||||||||||||||||||||||||
Principal guaranteed trust a/c credit costs | 23 | — | — | — | — | — | — | — | — | — | ||||||||||||||||||||||||||||||
Net business profit | 24 | 132,716 | 47,592 | 6,847 | 78,275 | 119,702 | 13,013 | (4,540 | ) | (320 | ) | 17,874 | ||||||||||||||||||||||||||||
Net non-recurring profit | 25 | (45,154 | ) | (27,156 | ) | (1,665 | ) | (16,332 | ) | (28,865 | ) | (16,289 | ) | (17,344 | ) | (374 | ) | 1,429 | ||||||||||||||||||||||
|
|
|
|
|
|
|
|
|
|
|
|
|
|
|
|
|
| |||||||||||||||||||||||
Banking a/c net credit costs | 26 | (6,463 | ) | (6,248 | ) | — | (214 | ) | (2,553 | ) | (3,910 | ) | (5,371 | ) | — | 1,461 | ||||||||||||||||||||||||
Written-off of loans | 27 | (627 | ) | (374 | ) | — | (253 | ) | (2,114 | ) | 1,487 | 503 | — | 984 | ||||||||||||||||||||||||||
Provision of specific allowance for loan losses | 28 | (5,874 | ) | (5,874 | ) | — | — | — | (5,874 | ) | (5,874 | ) | — | — | ||||||||||||||||||||||||||
Losses on sales of loans | 29 | 38 | — | — | 38 | (438 | ) | 477 | — | — | 477 | |||||||||||||||||||||||||||||
Reversal of allowance for loan losses (*) | 30 | 1,925 | — | — | 1,925 | — | 1,925 | — | — | 1,925 | ||||||||||||||||||||||||||||||
Recoveries of written-off claims (*) | 31 | 581 | 485 | — | 96 | — | 581 | 485 | — | 96 | ||||||||||||||||||||||||||||||
Net gains on stocks | 32 | (23,280 | ) | (12,661 | ) | — | (10,618 | ) | (1,419 | ) | (21,860 | ) | (14,230 | ) | — | (7,630 | ) | |||||||||||||||||||||||
Losses on devaluation of stocks | 33 | (21,713 | ) | (11,816 | ) | — | (9,896 | ) | (5,019 | ) | (16,694 | ) | (10,453 | ) | — | (6,240 | ) | |||||||||||||||||||||||
Others | 34 | (17,918 | ) | (8,731 | ) | (1,665 | ) | (7,521 | ) | (24,892 | ) | 6,974 | 1,771 | (374 | ) | 5,576 | ||||||||||||||||||||||||
Amortization of net actuarial losses/ prior service cost | 35 | (11,760 | ) | (5,356 | ) | (1,299 | ) | (5,104 | ) | (13,041 | ) | 1,280 | 194 | (39 | ) | 1,126 | ||||||||||||||||||||||||
Net gains on stock related derivatives | 36 | 18 | (43 | ) | — | 61 | 1,620 | (1,602 | ) | 388 | — | (1,990 | ) | |||||||||||||||||||||||||||
|
|
|
|
|
|
|
|
|
|
|
|
|
|
|
|
|
| |||||||||||||||||||||||
Ordinary profit | 37 | 87,561 | 20,436 | 5,182 | 61,942 | 90,837 | (3,276 | ) | (21,885 | ) | (695 | ) | 19,304 | |||||||||||||||||||||||||||
|
|
|
|
|
|
|
|
|
|
|
|
|
|
|
|
|
| |||||||||||||||||||||||
Extraordinary profit | 38 | (7,588 | ) | (3,087 | ) | (342 | ) | (4,158 | ) | (6,323 | ) | (1,265 | ) | (8,937 | ) | (50 | ) | 7,722 | ||||||||||||||||||||||
Impairment loss on tangible fixed assets | 39 | (4,064 | ) | (1,042 | ) | (56 | ) | (2,965 | ) | (389 | ) | (3,675 | ) | (1,042 | ) | (56 | ) | (2,576 | ) | |||||||||||||||||||||
Impairment loss on shares of a subsidiary | 40 | — | — | — | — | (15,211 | ) | 15,211 | — | — | 15,211 | |||||||||||||||||||||||||||||
Reversal of allowance for loan losses (*) | 41 | — | — | — | — | 11,857 | (11,857 | ) | (6,982 | ) | — | (4,874 | ) | |||||||||||||||||||||||||||
Recoveries of written-off claims (*) | 42 | — | — | — | — | 1,754 | (1,754 | ) | (1,070 | ) | — | (683 | ) | |||||||||||||||||||||||||||
Costs related to the Management Integration | 43 | (3,563 | ) | (1,874 | ) | (285 | ) | (1,404 | ) | (4,328 | ) | 764 | 41 | (18 | ) | 741 | ||||||||||||||||||||||||
|
|
|
|
|
|
|
|
|
|
|
|
|
|
|
|
|
| |||||||||||||||||||||||
Income before income taxes | 44 | 79,972 | 17,348 | 4,839 | 57,784 | 84,514 | (4,541 | ) | (30,822 | ) | (745 | ) | 27,027 | |||||||||||||||||||||||||||
|
|
|
|
|
|
|
|
|
|
|
|
|
|
|
|
|
| |||||||||||||||||||||||
Total income taxes | 45 | (22,310 | ) | (182 | ) | (1,943 | ) | (20,183 | ) | 401 | (22,711 | ) | 14,898 | 314 | (37,923 | ) | ||||||||||||||||||||||||
Income taxes-current | 46 | (12,322 | ) | (82 | ) | (2,420 | ) | (9,819 | ) | (6,736 | ) | (5,586 | ) | (1 | ) | 133 | (5,718 | ) | ||||||||||||||||||||||
Income taxes-deferred | 47 | (9,987 | ) | (100 | ) | 476 | (10,364 | ) | 7,137 | (17,124 | ) | 14,900 | 180 | (32,205 | ) | |||||||||||||||||||||||||
|
|
|
|
|
|
|
|
|
|
|
|
|
|
|
|
|
| |||||||||||||||||||||||
Net income | 48 | 57,662 | 17,166 | 2,895 | 37,600 | 84,915 | (27,252 | ) | (15,924 | ) | (431 | ) | (10,896 | ) | ||||||||||||||||||||||||||
|
|
|
|
|
|
|
|
|
|
|
|
|
|
|
|
|
| |||||||||||||||||||||||
Total credit costs (22 + 23 + 26 + 30 + 31 + 41 + 42) | 49 | (811 | ) | (2,619 | ) | — | 1,807 | 11,058 | (11,870 | ) | (9,795 | ) | — | (2,075 | ) | |||||||||||||||||||||||||
|
|
|
|
|
|
|
|
|
|
|
|
|
|
|
|
|
| |||||||||||||||||||||||
Overhead ratio (-16/1) | 50 | 48.35 | % | 52.34 | % | 53.74 | % | 45.18 | % | 50.26 | % | (1.91 | %) | 4.03 | % | 2.14 | % | (6.50 | %) | |||||||||||||||||||||
|
|
|
|
|
|
|
|
|
|
|
|
|
|
|
|
|
| |||||||||||||||||||||||
| (*) | Due to the amendment of Practical Guidance of Accounting for Financial Instruments, “Reversal of allowance for loan losses” and “Recoveries of written-off claims” has been relocated from this fiscal year. |
2
Table of Contents
Sumitomo Mitsui Trust Holdings, Inc.
| Billions of Yen | ||||||||||||||||||||||||
| Sumishin Panasonic Financial Services Co., Ltd. (Consolidated) | Sumishin Real Estate Loan & Finance, Ltd. | |||||||||||||||||||||||
| 1HFY2011 | 1HFY2010 | Change | 1HFY2011 | 1HFY2010 | Change | |||||||||||||||||||
Ordinary profit | 9.3 | 9.8 | (0.5 | ) | 2.2 | 2.0 | 0.1 | |||||||||||||||||
Net income | 5.5 | 6.0 | (0.4 | ) | 1.8 | 0.7 | 1.0 | |||||||||||||||||
|
|
|
|
|
|
|
|
|
|
|
| |||||||||||||
Total credit costs | (0.6 | ) | (0.4 | ) | (0.2 | ) | 0.0 | (0.1 | ) | 0.1 | ||||||||||||||
|
|
|
|
|
|
|
|
|
|
|
| |||||||||||||
| Sep. 2011 | Mar. 2011 | Change | Sep. 2011 | Mar. 2011 | Change | |||||||||||||||||||
Total assets | 1,051.6 | 1,126.9 | (75.2 | ) | 277.1 | 274.6 | 2.4 | |||||||||||||||||
Net assets | 135.7 | 130.3 | 5.4 | 27.0 | 24.9 | 2.0 | ||||||||||||||||||
|
|
|
|
|
|
|
|
|
|
|
| |||||||||||||
| Note: | Life Housing Loan, Ltd. has changed its corporate name to Sumishin Real Estate Loan & Finance, Ltd. as First Credit Corporation has transferred a part of its business to Life Housing Loan, Ltd. on September 30, 2010. |
| Billions of Yen | ||||||||||||
| Nikko Asset Management Co., Ltd. (Consolidated) | ||||||||||||
| 1HFY2011 | 1HFY2010 | Change | ||||||||||
Ordinary profit | 4.2 | 3.9 | 0.3 | |||||||||
Net income | 2.7 | 2.5 | 0.1 | |||||||||
|
|
|
|
|
| |||||||
| Sep. 2011 | Mar. 2011 | Change | ||||||||||
Total assets | 64.0 | 65.0 | (1.0 | ) | ||||||||
Net assets | 49.7 | 50.2 | (0.5 | ) | ||||||||
Assets under management | 12,091.9 | 12,810.3 | (718.4 | ) | ||||||||
|
|
|
|
|
| |||||||
3
Table of Contents
Sumitomo Mitsui Trust Holdings, Inc.
(1) Domestic banking a/c
[Non-consolidated (CMTB + STB)]
| Percentage points | ||||||||||||||||||||||||||||||||
| 1HFY2011 | 2HFY2010 | Change from 2HFY2010 | 1HFY2010 | |||||||||||||||||||||||||||||
| Total | CMTB | STB | Total | Total | CMTB | STB | Total | |||||||||||||||||||||||||
Average yield on interest-earning assets (A) | 1.18 | 1.18 | 1.18 | 1.18 | 0.00 | 0.03 | (0.02 | ) | 1.20 | |||||||||||||||||||||||
Loans and bills discounted (B) | 1.21 | 1.25 | 1.18 | 1.28 | (0.07 | ) | (0.08 | ) | (0.07 | ) | 1.34 | |||||||||||||||||||||
Securities | 1.20 | 1.38 | 1.08 | 0.94 | 0.26 | 0.42 | 0.16 | 0.86 | ||||||||||||||||||||||||
|
|
|
|
|
|
|
|
|
|
|
|
|
|
|
| |||||||||||||||||
Average yield on interest-bearing liabilities (C) | 0.42 | 0.43 | 0.41 | 0.45 | (0.03 | ) | (0.03 | ) | (0.02 | ) | 0.46 | |||||||||||||||||||||
Deposits (D) | 0.39 | 0.40 | 0.39 | 0.43 | (0.04 | ) | (0.04 | ) | (0.03 | ) | 0.46 | |||||||||||||||||||||
|
|
|
|
|
|
|
|
|
|
|
|
|
|
|
| |||||||||||||||||
Gross margin (A) - (C) | 0.76 | 0.75 | 0.77 | 0.73 | 0.03 | 0.06 | 0.00 | 0.74 | ||||||||||||||||||||||||
Loan-deposit margin (B) - (D) | 0.82 | 0.85 | 0.79 | 0.85 | (0.03 | ) | (0.04 | ) | (0.04 | ) | 0.88 | |||||||||||||||||||||
|
|
|
|
|
|
|
|
|
|
|
|
|
|
|
| |||||||||||||||||
(2) Domestic banking a/c and principal guaranteed trust a/c combined
[Non-consolidated (CMTB + STB)]
| Percentage points | ||||||||||||||||||||||||||||||||
| 1HFY2011 | 2HFY2010 | Change from 2HFY2010 | 1HFY2010 | |||||||||||||||||||||||||||||
| Total | CMTB | STB | Total | Total | CMTB | STB | Total | |||||||||||||||||||||||||
Average yield on interest-earning assets (A) | 1.16 | 1.14 | 1.18 | 1.16 | 0.00 | 0.03 | (0.02 | ) | 1.17 | |||||||||||||||||||||||
|
|
|
|
|
|
|
|
|
|
|
|
|
|
|
| |||||||||||||||||
Loans and bills discounted (B) | 1.21 | 1.25 | 1.18 | 1.28 | (0.07 | ) | (0.07 | ) | (0.07 | ) | 1.33 | |||||||||||||||||||||
Securities | 1.20 | 1.38 | 1.08 | 0.94 | 0.26 | 0.42 | 0.16 | 0.86 | ||||||||||||||||||||||||
|
|
|
|
|
|
|
|
|
|
|
|
|
|
|
| |||||||||||||||||
Average yield on interest-bearing liabilities (C) | 0.40 | 0.40 | 0.40 | 0.42 | (0.02 | ) | (0.03 | ) | (0.02 | ) | 0.44 | |||||||||||||||||||||
|
|
|
|
|
|
|
|
|
|
|
|
|
|
|
| |||||||||||||||||
Deposits, Trust principal (D) | 0.37 | 0.37 | 0.37 | 0.40 | (0.03 | ) | (0.03 | ) | (0.03 | ) | 0.43 | |||||||||||||||||||||
|
|
|
|
|
|
|
|
|
|
|
|
|
|
|
| |||||||||||||||||
Gross margin (A) - (C) | 0.76 | 0.74 | 0.78 | 0.74 | 0.02 | 0.06 | 0.00 | 0.73 | ||||||||||||||||||||||||
Loan-deposit margin (B) - (D) | 0.84 | 0.88 | 0.81 | 0.88 | (0.04 | ) | (0.04 | ) | (0.04 | ) | 0.90 | |||||||||||||||||||||
|
|
|
|
|
|
|
|
|
|
|
|
|
|
|
| |||||||||||||||||
[Consolidated]
| Millions of Yen | ||||||||||||
| 1HFY2011 | 1HFY2010 | Change | ||||||||||
Net gains on bonds | 69,153 | 34,657 | 34,496 | |||||||||
|
|
|
|
|
| |||||||
Gains on sales of bonds | 73,459 | 45,826 | 27,633 | |||||||||
Gains on redemption of bonds | 65 | 63 | 2 | |||||||||
Losses on sales of bonds | (4,371 | ) | (8,257 | ) | 3,885 | |||||||
Losses on redemption of bonds | — | (2,974 | ) | 2,974 | ||||||||
Losses on devaluation of bonds | — | — | — | |||||||||
|
|
|
|
|
| |||||||
Net gains on stocks | (11,034 | ) | (1,138 | ) | (9,895 | ) | ||||||
|
|
|
|
|
| |||||||
Gains on sales of stocks | 1,444 | 4,955 | (3,511 | ) | ||||||||
Losses on sales of stocks | (2,085 | ) | (1,018 | ) | (1,066 | ) | ||||||
Losses on devaluation of stocks | (10,393 | ) | (5,075 | ) | (5,317 | ) | ||||||
|
|
|
|
|
| |||||||
[Non-consolidated (CMTB + STB)]
| Millions of Yen | ||||||||||||||||||||||||||||
| 1HFY2011 | 1HFY2010 | Change | ||||||||||||||||||||||||||
| Total | CMTB | STB | Total | Total | CMTB | STB | ||||||||||||||||||||||
Net gains on bonds | 50,680 | 13,678 | 37,002 | 34,625 | 16,054 | (5,639 | ) | 21,694 | ||||||||||||||||||||
|
|
|
|
|
|
|
|
|
|
|
|
|
| |||||||||||||||
Gains on sales of bonds | 56,922 | 18,193 | 38,729 | 45,781 | 11,141 | (5,306 | ) | 16,448 | ||||||||||||||||||||
Gains on redemption of bonds | 46 | — | 46 | 61 | (15 | ) | — | (15 | ) | |||||||||||||||||||
Losses on sales of bonds | (6,288 | ) | (4,515 | ) | (1,773 | ) | (8,242 | ) | 1,953 | (333 | ) | 2,287 | ||||||||||||||||
Losses on redemption of bonds | — | — | — | (2,974 | ) | 2,974 | — | 2,974 | ||||||||||||||||||||
Losses on devaluation of bonds | — | — | — | — | — | — | — | |||||||||||||||||||||
|
|
|
|
|
|
|
|
|
|
|
|
|
| |||||||||||||||
Net gains on stocks | (23,280 | ) | (12,661 | ) | (10,618 | ) | (1,419 | ) | (21,860 | ) | (14,230 | ) | (7,630 | ) | ||||||||||||||
|
|
|
|
|
|
|
|
|
|
|
|
|
| |||||||||||||||
Gains on sales of stocks | 1,241 | 464 | 776 | 4,600 | (3,359 | ) | (2,730 | ) | (628 | ) | ||||||||||||||||||
Losses on sales of stocks | (2,808 | ) | (1,309 | ) | (1,498 | ) | (1,000 | ) | (1,807 | ) | (1,046 | ) | (760 | ) | ||||||||||||||
Losses on devaluation of stocks | (21,713 | ) | (11,816 | ) | (9,896 | ) | (5,019 | ) | (16,694 | ) | (10,453 | ) | (6,240 | ) | ||||||||||||||
|
|
|
|
|
|
|
|
|
|
|
|
|
| |||||||||||||||
4
Table of Contents
Sumitomo Mitsui Trust Holdings, Inc.
5. Unrealized gains/ losses on investment securities
(1) Securities with fair value
[Consolidated]
| Millions of Yen | ||||||||||||||||||||||||||||||||
| Sep. 2011 (*2) | Mar. 2011 | |||||||||||||||||||||||||||||||
| Cost | Net | Unrealized gains | Unrealized losses | Cost | Net | Change of Cost | Change of Net | |||||||||||||||||||||||||
Available-for-sale securities | 6,807,845 | 15,331 | 160,725 | (145,393 | ) | 7,356,023 | 68,190 | (548,177 | ) | (52,859 | ) | |||||||||||||||||||||
|
|
|
|
|
|
|
|
|
|
|
|
|
|
|
| |||||||||||||||||
Japanese stocks (*1) | 893,182 | (54,670 | ) | 68,626 | (123,296 | ) | 873,920 | 83,256 | 19,261 | (137,926 | ) | |||||||||||||||||||||
|
|
|
|
|
|
|
|
|
|
|
|
|
|
|
| |||||||||||||||||
Japanese bonds | 4,411,109 | 42,796 | 45,129 | (2,333 | ) | 4,050,679 | 7,837 | 360,429 | 34,958 | |||||||||||||||||||||||
|
|
|
|
|
|
|
|
|
|
|
|
|
|
|
| |||||||||||||||||
Government bonds | 3,600,395 | 39,273 | 39,466 | (193 | ) | 3,238,696 | 6,006 | 361,698 | 33,266 | |||||||||||||||||||||||
Local government bonds | 14,036 | 169 | 179 | (10 | ) | 20,681 | (8 | ) | (6,644 | ) | 177 | |||||||||||||||||||||
Corporate bonds | 796,677 | 3,353 | 5,483 | (2,130 | ) | 791,301 | 1,839 | 5,375 | 1,514 | |||||||||||||||||||||||
|
|
|
|
|
|
|
|
|
|
|
|
|
|
|
| |||||||||||||||||
Others | 1,503,553 | 27,205 | 46,969 | (19,763 | ) | 2,431,422 | (22,903 | ) | (927,868 | ) | 50,108 | |||||||||||||||||||||
|
|
|
|
|
|
|
|
|
|
|
|
|
|
|
| |||||||||||||||||
Held-to-maturity debt securities | 649,467 | 36,397 | 39,845 | (3,448 | ) | 724,894 | 50,180 | (75,427 | ) | (13,783 | ) | |||||||||||||||||||||
|
|
|
|
|
|
|
|
|
|
|
|
|
|
|
| |||||||||||||||||
| (*1) | Fair value of listed stocks included in “Available-for-sale securities” is basically determined based on the average quoted market price over the month preceding the consolidated balance sheet date. |
| (*2) | Figures as of September 2011 are those to which “Accounting Standard for Business Combinations” (ASBJ Statement No.21) was applied. |
| As to the effect of purchase accounting method, please refer to “4. Accounting for business combination related to the Management Integration” (Summary 6). |
[Non-consolidated (CMTB + CMAB + STB)]
| Millions of Yen | ||||||||||||||||||||||||||||||||
| Sep. 2011 | Mar. 2011 | |||||||||||||||||||||||||||||||
| Cost | Net | Unrealized gains | Unrealized losses | Cost | Net | Change of Cost | Change of Net | |||||||||||||||||||||||||
Available-for-sale securities | 6,071,057 | 26,945 | 180,235 | (153,290 | ) | 7,291,868 | 49,863 | (1,220,810 | ) | (22,917 | ) | |||||||||||||||||||||
|
|
|
|
|
|
|
|
|
|
|
|
|
|
|
| |||||||||||||||||
Japanese stocks (*) | 790,887 | (24,356 | ) | 96,180 | (120,536 | ) | 813,590 | 65,193 | (22,703 | ) | (89,550 | ) | ||||||||||||||||||||
|
|
|
|
|
|
|
|
|
|
|
|
|
|
|
| |||||||||||||||||
Japanese bonds | 3,784,246 | 33,525 | 40,637 | (7,111 | ) | 4,070,679 | 7,828 | (286,433 | ) | 25,696 | ||||||||||||||||||||||
|
|
|
|
|
|
|
|
|
|
|
|
|
|
|
| |||||||||||||||||
Government bonds | 2,954,903 | 28,632 | 33,255 | (4,623 | ) | 3,238,696 | 6,006 | (283,792 | ) | 22,625 | ||||||||||||||||||||||
Local government bonds | 14,033 | 173 | 183 | (10 | ) | 20,681 | (8 | ) | (6,648 | ) | 181 | |||||||||||||||||||||
Corporate bonds | 815,309 | 4,720 | 7,198 | (2,477 | ) | 811,301 | 1,830 | 4,007 | 2,890 | |||||||||||||||||||||||
|
|
|
|
|
|
|
|
|
|
|
|
|
|
|
| |||||||||||||||||
Others | 1,495,924 | 17,776 | 43,418 | (25,641 | ) | 2,407,598 | (23,159 | ) | (911,673 | ) | 40,935 | |||||||||||||||||||||
|
|
|
|
|
|
|
|
|
|
|
|
|
|
|
| |||||||||||||||||
Held-to-maturity debt securities | 648,528 | 36,649 | 39,970 | (3,321 | ) | 724,237 | 50,149 | (75,709 | ) | (13,500 | ) | |||||||||||||||||||||
|
|
|
|
|
|
|
|
|
|
|
|
|
|
|
| |||||||||||||||||
| (*) | Fair value of listed stocks included in “Available-for-sale securities” is determined based on the average quoted market price over the month preceding the consolidated balance sheet date. |
[Non-consolidated (CMTB)]
| Millions of Yen | ||||||||||||||||||||||||||||||||
| Sep. 2011 | Mar. 2011 | |||||||||||||||||||||||||||||||
| Cost | Net | Unrealized gains | Unrealized losses | Cost | Net | Change of Cost | Change of Net | |||||||||||||||||||||||||
Available-for-sale securities | 2,427,429 | (34,554 | ) | 50,817 | (85,372 | ) | 3,080,596 | (19,552 | ) | (653,166 | ) | (15,002 | ) | |||||||||||||||||||
|
|
|
|
|
|
|
|
|
|
|
|
|
|
|
| |||||||||||||||||
Japanese stocks (*) | 375,012 | (25,482 | ) | 35,729 | (61,211 | ) | 388,316 | 20,255 | (13,303 | ) | (45,738 | ) | ||||||||||||||||||||
|
|
|
|
|
|
|
|
|
|
|
|
|
|
|
| |||||||||||||||||
Japanese bonds | 1,280,543 | 560 | 5,939 | (5,378 | ) | 1,554,411 | (12,975 | ) | (273,867 | ) | 13,535 | |||||||||||||||||||||
|
|
|
|
|
|
|
|
|
|
|
|
|
|
|
| |||||||||||||||||
Government bonds | 1,016,150 | (1,551 | ) | 3,045 | (4,596 | ) | 1,283,546 | (14,296 | ) | (267,396 | ) | 12,745 | ||||||||||||||||||||
Local government bonds | 149 | 5 | 5 | — | 149 | 4 | 0 | 0 | ||||||||||||||||||||||||
Corporate bonds | 264,242 | 2,106 | 2,888 | (782 | ) | 270,714 | 1,316 | (6,471 | ) | 789 | ||||||||||||||||||||||
|
|
|
|
|
|
|
|
|
|
|
|
|
|
|
| |||||||||||||||||
Others | 771,873 | (9,632 | ) | 9,149 | (18,781 | ) | 1,137,869 | (26,832 | ) | (365,995 | ) | 17,199 | ||||||||||||||||||||
|
|
|
|
|
|
|
|
|
|
|
|
|
|
|
| |||||||||||||||||
Held-to-maturity debt securities | 273,066 | (522 | ) | 1,183 | (1,705 | ) | 297,092 | 352 | (24,025 | ) | (874 | ) | ||||||||||||||||||||
|
|
|
|
|
|
|
|
|
|
|
|
|
|
|
| |||||||||||||||||
| (*) | Fair value of listed stocks included in “Available-for-sale securities” is determined based on the average quoted market price over the month preceding the consolidated balance sheet date. |
[Non-consolidated (STB)]
| Millions of Yen | ||||||||||||||||||||||||||||||||
| Sep. 2011 | Mar. 2011 | |||||||||||||||||||||||||||||||
| Cost | Net | Unrealized gains | Unrealized losses | Cost | Net | Change of Cost | Change of Net | |||||||||||||||||||||||||
Available-for-sale securities | 3,613,631 | 61,502 | 129,417 | (67,915 | ) | 4,122,290 | 69,427 | (508,658 | ) | (7,925 | ) | |||||||||||||||||||||
|
|
|
|
|
|
|
|
|
|
|
|
|
|
|
| |||||||||||||||||
Japanese stocks (*1) | 415,874 | 1,125 | 60,451 | (59,325 | ) | 425,274 | 44,938 | (9,399 | ) | (43,812 | ) | |||||||||||||||||||||
|
|
|
|
|
|
|
|
|
|
|
|
|
|
|
| |||||||||||||||||
Japanese bonds | 2,473,706 | 32,967 | 34,697 | (1,730 | ) | 2,427,287 | 20,816 | 46,419 | 12,150 | |||||||||||||||||||||||
|
|
|
|
|
|
|
|
|
|
|
|
|
|
|
| |||||||||||||||||
Government bonds | 1,908,757 | 30,185 | 30,209 | (24 | ) | 1,866,168 | 20,315 | 42,588 | 9,869 | |||||||||||||||||||||||
Local government bonds | 13,883 | 167 | 178 | (10 | ) | 20,531 | (12 | ) | (6,648 | ) | 180 | |||||||||||||||||||||
Corporate bonds | 551,066 | 2,613 | 4,309 | (1,695 | ) | 540,587 | 513 | 10,479 | 2,100 | |||||||||||||||||||||||
|
|
|
|
|
|
|
|
|
|
|
|
|
|
|
| |||||||||||||||||
Others | 724,050 | 27,408 | 34,269 | (6,860 | ) | 1,269,729 | 3,673 | (545,678 | ) | 23,735 | ||||||||||||||||||||||
|
|
|
|
|
|
|
|
|
|
|
|
|
|
|
| |||||||||||||||||
Held-to-maturity debt securities | 375,461 | 37,171 | 38,787 | (1,615 | ) | 427,145 | 49,797 | (51,683 | ) | (12,625 | ) | |||||||||||||||||||||
|
|
|
|
|
|
|
|
|
|
|
|
|
|
|
| |||||||||||||||||
| (*1) | Fair value of listed stocks included in “Available-for-sale securities” is basically determined based on the average quoted market price over the month preceding the consolidated balance sheet date. |
| (*2) | Book value of floating rate government bonds and some of the overseas asset-backed securities have been changed from the market prices to the rationally calculated prices. |
| As a result, “Government bonds” has increased by 6.4 billion yen, while “Others” has almost unchanged, as of the end of September 2011. |
| (*3) | Fair value of some of the overseas asset-backed securities categorized in “Held-to-maturity debt securities” have been changed from the market prices to the rationally calculated prices. As a result, “Fair value” of the “Foreign bonds” have decreased by 1.0 billion yen, as of the end of September 2011. |
5
Table of Contents
Sumitomo Mitsui Trust Holdings, Inc.
< Reference 1 >
Breakdown of Available-for-sale securities (Others)
[Non-consolidated (CMTB + CMAB + STB)]
| Millions of Yen | ||||||||||||||||||||||||
| Sep. 2011 | Mar. 2011 | |||||||||||||||||||||||
| Cost | Net | Cost | Net | Change of Cost | Change of Net | |||||||||||||||||||
Domestic investment (*1) | 443,609 | (4,914 | ) | 387,683 | (4,194 | ) | 55,926 | (719 | ) | |||||||||||||||
|
|
|
|
|
|
|
|
|
|
|
| |||||||||||||
Asset-backed securities | 232,618 | (2,910 | ) | 267,285 | (3,245 | ) | (34,667 | ) | 335 | |||||||||||||||
Others | 210,991 | (2,003 | ) | 120,397 | (949 | ) | 90,593 | (1,054 | ) | |||||||||||||||
|
|
|
|
|
|
|
|
|
|
|
| |||||||||||||
International investment (*1) | 824,218 | 30,754 | 1,851,116 | (12,149 | ) | (1,026,898 | ) | 42,903 | ||||||||||||||||
|
|
|
|
|
|
|
|
|
|
|
| |||||||||||||
Foreign government bonds | 281,851 | 14,437 | 1,134,166 | (22,534 | ) | (852,315 | ) | 36,971 | ||||||||||||||||
o/w US Treasury | 186,418 | 11,269 | 928,080 | (17,735 | ) | (741,661 | ) | 29,004 | ||||||||||||||||
o/w European government bonds | 19,701 | 383 | 163,049 | (5,306 | ) | (143,347 | ) | 5,690 | ||||||||||||||||
US agency MBS (*2) | 236,721 | 6,888 | 344,149 | (2,988 | ) | (107,427 | ) | 9,876 | ||||||||||||||||
Corporate bonds | 301,583 | 1,958 | 368,110 | 3,580 | (66,527 | ) | (1,621 | ) | ||||||||||||||||
Asset-backed securities | 3,949 | 7,389 | 4,567 | 9,658 | (617 | ) | (2,269 | ) | ||||||||||||||||
Others | 113 | 80 | 122 | 134 | (9 | ) | (53 | ) | ||||||||||||||||
|
|
|
|
|
|
|
|
|
|
|
| |||||||||||||
Others (Investment trust, etc.) (*3) | 228,095 | (8,063 | ) | 168,797 | (6,815 | ) | 59,297 | (1,248 | ) | |||||||||||||||
|
|
|
|
|
|
|
|
|
|
|
| |||||||||||||
Total | 1,495,924 | 17,776 | 2,407,598 | (23,159 | ) | (911,673 | ) | 40,935 | ||||||||||||||||
|
|
|
|
|
|
|
|
|
|
|
| |||||||||||||
| (*1) | “Domestic investment” and “International investment” are categorized by the countries where final exposure is exist. |
| (*2) | Constituted by GNMA only. |
| (*3) | Uncategorizable into “Domestic investment” or “International investment” |
[CMTB Non-consolidated]
| Millions of Yen | ||||||||||||||||||||||||
| Sep. 2011 | Mar. 2011 | |||||||||||||||||||||||
| Cost | Net | Cost | Net | Change of Cost | Change of Net | |||||||||||||||||||
Domestic investment (*1) | 185,382 | (2,727 | ) | 111,672 | (1,041 | ) | 73,709 | (1,685 | ) | |||||||||||||||
|
|
|
|
|
|
|
|
|
|
|
| |||||||||||||
Asset-backed securities | 16,881 | (37 | ) | 23,286 | (50 | ) | (6,405 | ) | 12 | |||||||||||||||
Others | 168,500 | (2,689 | ) | 88,386 | (991 | ) | 80,114 | (1,698 | ) | |||||||||||||||
|
|
|
|
|
|
|
|
|
|
|
| |||||||||||||
International investment (*1) | 476,326 | 4,107 | 946,956 | (20,798 | ) | (470,630 | ) | 24,905 | ||||||||||||||||
|
|
|
|
|
|
|
|
|
|
|
| |||||||||||||
Foreign government bonds | 32,459 | (234 | ) | 352,575 | (16,549 | ) | (320,116 | ) | 16,314 | |||||||||||||||
o/w US Treasury | 32,459 | (234 | ) | 245,527 | (11,255 | ) | (213,068 | ) | 11,021 | |||||||||||||||
o/w European government bonds | — | — | 107,048 | (5,293 | ) | (107,048 | ) | 5,293 | ||||||||||||||||
US agency MBS (*2) | 236,721 | 6,888 | 344,149 | (2,988 | ) | (107,427 | ) | 9,876 | ||||||||||||||||
Corporate bonds | 207,145 | (2,547 | ) | 250,231 | (1,261 | ) | (43,086 | ) | (1,285 | ) | ||||||||||||||
Asset-backed securities | — | — | — | — | — | — | ||||||||||||||||||
Others | — | — | — | — | — | — | ||||||||||||||||||
|
|
|
|
|
|
|
|
|
|
|
| |||||||||||||
Others (Investment trust, etc.) (*3) | 110,165 | (11,012 | ) | 79,239 | (4,992 | ) | 30,926 | (6,020 | ) | |||||||||||||||
|
|
|
|
|
|
|
|
|
|
|
| |||||||||||||
Total | 771,873 | (9,632 | ) | 1,137,869 | (26,832 | ) | (365,995 | ) | 17,199 | |||||||||||||||
|
|
|
|
|
|
|
|
|
|
|
| |||||||||||||
| (*1) | “Domestic investment” and “International investment” are categorized by the countries where final exposure is exist. |
| (*2) | Constituted by GNMA only. |
| (*3) | Uncategorizable into “Domestic investment” or “International investment” |
[STB Non-consolidated]
| Millions of Yen | ||||||||||||||||||||||||
| Sep. 2011 | Mar. 2011 | |||||||||||||||||||||||
| Cost | Net | Cost | Net | Change of Cost | Change of Net | |||||||||||||||||||
Domestic investment (*1) | 258,227 | (2,186 | ) | 276,010 | (3,152 | ) | (17,783 | ) | 966 | |||||||||||||||
|
|
|
|
|
|
|
|
|
|
|
| |||||||||||||
Asset-backed securities | 215,737 | (2,872 | ) | 243,999 | (3,195 | ) | (28,262 | ) | 322 | |||||||||||||||
Others | 42,490 | 685 | 32,011 | 42 | 10,479 | 643 | ||||||||||||||||||
|
|
|
|
|
|
|
|
|
|
|
| |||||||||||||
International investment (*1) | 347,892 | 26,647 | 904,160 | 8,649 | (556,267 | ) | 17,997 | |||||||||||||||||
|
|
|
|
|
|
|
|
|
|
|
| |||||||||||||
Foreign government bonds | 249,391 | 14,671 | 781,590 | (5,985 | ) | (532,198 | ) | 20,657 | ||||||||||||||||
o/w US Treasury | 153,959 | 11,503 | 682,552 | (6,479 | ) | (528,593 | ) | 17,983 | ||||||||||||||||
o/w European government bonds | 19,701 | 383 | 56,001 | (13 | ) | (36,299 | ) | 396 | ||||||||||||||||
Corporate bonds | 94,438 | 4,505 | 117,879 | 4,841 | (23,441 | ) | (335 | ) | ||||||||||||||||
Asset-backed securities | 3,949 | 7,389 | 4,567 | 9,658 | (617 | ) | (2,269 | ) | ||||||||||||||||
Others | 113 | 80 | 122 | 134 | (9 | ) | (53 | ) | ||||||||||||||||
|
|
|
|
|
|
|
|
|
|
|
| |||||||||||||
Others (Investment trust, etc.) (*2) | 117,929 | 2,948 | 89,557 | (1,823 | ) | 28,371 | 4,771 | |||||||||||||||||
|
|
|
|
|
|
|
|
|
|
|
| |||||||||||||
Total | 724,050 | 27,408 | 1,269,729 | 3,673 | (545,678 | ) | 23,735 | |||||||||||||||||
|
|
|
|
|
|
|
|
|
|
|
| |||||||||||||
| (*1) | “Domestic investment” and “International investment” are categorized by the countries where final exposure is exist. |
| (*2) | Uncategorizable into “Domestic investment” or “International investment” |
6
Table of Contents
Sumitomo Mitsui Trust Holdings, Inc.
< Reference 2 >
Breakdown of Held-to-maturity debt securities
[Non-consolidated (CMTB + CMAB + STB)]
| Millions of Yen | ||||||||||||||||||||||||
| Sep. 2011 | Mar. 2011 | |||||||||||||||||||||||
| Cost | Net | Cost | Net | Change of Cost | Change of Net | |||||||||||||||||||
Held-to-maturity debt securities | 648,528 | 36,649 | 724,237 | 50,149 | (75,709 | ) | (13,500 | ) | ||||||||||||||||
Japanese Government Bonds | 174,439 | 8,058 | 184,444 | 7,907 | (10,004 | ) | 150 | |||||||||||||||||
Japanese Local Government Bonds | — | — | — | — | — | — | ||||||||||||||||||
Japanese Corporate Bonds | 21,926 | 220 | 22,405 | 270 | (479 | ) | (50 | ) | ||||||||||||||||
|
|
|
|
|
|
|
|
|
|
|
| |||||||||||||
Others | 452,161 | 28,370 | 517,386 | 41,970 | (65,225 | ) | (13,600 | ) | ||||||||||||||||
|
|
|
|
|
|
|
|
|
|
|
| |||||||||||||
Domestic investment (*) | 88,140 | 2,589 | 84,055 | 1,715 | 4,084 | 874 | ||||||||||||||||||
International investment (*) | 364,021 | 25,780 | 433,330 | 40,255 | (69,309 | ) | (14,474 | ) | ||||||||||||||||
|
|
|
|
|
|
|
|
|
|
|
| |||||||||||||
| (*) | “Domestic investment” and “International investment” are categorized by the countries where final exposure is exist. |
[CMTB Non-consolidated]
| Millions of Yen | ||||||||||||||||||||||||
| Sep. 2011 | Mar. 2011 | |||||||||||||||||||||||
| Cost | Net | Cost | Net | Change of Cost | Change of Net | |||||||||||||||||||
Held-to-maturity debt securities | 273,066 | (522 | ) | 297,092 | 352 | (24,025 | ) | (874 | ) | |||||||||||||||
Japanese Government Bonds | — | — | — | — | — | — | ||||||||||||||||||
Japanese Local Government Bonds | — | — | — | — | — | — | ||||||||||||||||||
Japanese Corporate Bonds | 21,926 | 220 | 22,405 | 270 | (479 | ) | (50 | ) | ||||||||||||||||
|
|
|
|
|
|
|
|
|
|
|
| |||||||||||||
Others | 251,140 | (742 | ) | 274,686 | 81 | (23,545 | ) | (824 | ) | |||||||||||||||
|
|
|
|
|
|
|
|
|
|
|
| |||||||||||||
Domestic investment (*) | 49,440 | 865 | 51,655 | 537 | (2,215 | ) | 327 | |||||||||||||||||
International investment (*) | 201,700 | (1,608 | ) | 223,030 | (456 | ) | (21,330 | ) | (1,152 | ) | ||||||||||||||
Foreign bonds | 201,700 | (1,608 | ) | 223,030 | (456 | ) | (21,330 | ) | (1,152 | ) | ||||||||||||||
|
|
|
|
|
|
|
|
|
|
|
| |||||||||||||
| (*) | “Domestic investment” and “International investment” are categorized by the countries where final exposure is exist. |
[STB Non-consolidated]
| Millions of Yen | ||||||||||||||||||||||||
| Sep. 2011 | Mar. 2011 | Change of Cost | Change of Net | |||||||||||||||||||||
| Cost | Net | Cost | Net | |||||||||||||||||||||
Held-to-maturity debt securities | 375,461 | 37,171 | 427,145 | 49,797 | (51,683 | ) | (12,625 | ) | ||||||||||||||||
Japanese Government Bonds | 174,439 | 8,058 | 184,444 | 7,907 | (10,004 | ) | 150 | |||||||||||||||||
Japanese Local Government Bonds | — | — | — | — | — | — | ||||||||||||||||||
Japanese Corporate Bonds | — | — | — | — | — | — | ||||||||||||||||||
|
|
|
|
|
|
|
|
|
|
|
| |||||||||||||
Others | 201,021 | 29,113 | 242,700 | 41,889 | (41,679 | ) | (12,776 | ) | ||||||||||||||||
|
|
|
|
|
|
|
|
|
|
|
| |||||||||||||
Domestic investment (*1) | 38,700 | 1,724 | 32,400 | 1,177 | 6,300 | 546 | ||||||||||||||||||
International investment (*1) | 162,321 | 27,389 | 210,300 | 40,711 | (47,979 | ) | (13,322 | ) | ||||||||||||||||
Asset-backed securities (*2) | 162,321 | 27,389 | 210,300 | 40,711 | (47,979 | ) | (13,322 | ) | ||||||||||||||||
|
|
|
|
|
|
|
|
|
|
|
| |||||||||||||
| (*1) | “Domestic investment” and “International investment” are categorized by the countries where final exposure is exist. |
| (*2) | As a result of using rationally calculated prices instead of market prices, “Fair value” of asset-backed securities decreased by 1.0 billion yen. |
| Unamortized amount of unrealized gains/ losses (before considering tax effect) resulting from reclassification is -47.6 billion yen as ofthe end of September 2011. |
| (2) | Securities with no available fair value |
[Non-consolidated (CMTB + CMAB + STB)]
| Millions of Yen | ||||||||||||||||||||||||||||
| Sep. 2011 | Mar. 2011 | Change | ||||||||||||||||||||||||||
| Cost | Cost | |||||||||||||||||||||||||||
| Total | o/w CMTB | o/w STB | Total | Total | o/w CMTB | o/w STB | ||||||||||||||||||||||
Available-for-sale securities | 319,856 | 221,767 | 97,873 | 329,669 | (9,813 | ) | 4,127 | (13,940 | ) | |||||||||||||||||||
|
|
|
|
|
|
|
|
|
|
|
|
|
| |||||||||||||||
Japanese stocks | 122,629 | 83,967 | 38,445 | 125,849 | (3,219 | ) | (319 | ) | (2,899 | ) | ||||||||||||||||||
Japanese bonds | — | — | — | 15,007 | (15,007 | ) | — | (15,007 | ) | |||||||||||||||||||
Others | 197,226 | 137,799 | 59,427 | 188,813 | 8,413 | 4,446 | 3,966 | |||||||||||||||||||||
|
|
|
|
|
|
|
|
|
|
|
|
|
| |||||||||||||||
Domestic investment (*1) | 172,863 | 131,231 | 41,632 | 162,566 | 10,297 | 5,226 | 5,071 | |||||||||||||||||||||
International investment (*1) | 24,363 | 6,567 | 17,795 | 26,247 | (1,884 | ) | (779 | ) | (1,104 | ) | ||||||||||||||||||
|
|
|
|
|
|
|
|
|
|
|
|
|
| |||||||||||||||
| (*1) | “Domestic investment” and “International investment” are categorized by the countries where final exposure is exist. |
[Non-consolidated (CMTB + STB)]
| Billions of Yen | ||||||||||||||||||||
| Sep. 2011 | Mar. 2011 | Change | ||||||||||||||||||
| Cost | Cost | |||||||||||||||||||
| Total | CMTB | STB | Total | |||||||||||||||||
Domestic LBO finance | 103.3 | 19.2 | 84.0 | 93.8 | 9.4 | |||||||||||||||
|
|
|
|
|
|
|
|
|
| |||||||||||
(4) Off-balance risk from Special Purpose Entities(SPEs)
| a) | SPE related transactions collateralized by overseas assets |
There are no transactions that STB sponsors or complements SPEs’ liquidity and/ or credit.
| b) | SPE related transactions collateralized by domestic assets |
STB complements liquidity and credit for the purpose of facilitating domestic Asset-backed Commercial Paper(ABCP) programs of SPEs which were established in order to meet customers’ needs such as raising funds and securitizing assets.
As of the end of September 2011, the balance of outstanding ABCP and collateral are 143.4 billion yen and 342.9 billion yen, respectively, and major collateralized assets are account receivables.
7
Table of Contents
Sumitomo Mitsui Trust Holdings, Inc.
6. Maturity ladder of securities
<Held-to-maturity debt securities with fair value and Available-for-sale securities with fair value>
[Consolidated]
| Millions of Yen | ||||||||||||||||||||||||||||||||||||||||
| Sep. 2011 | Mar. 2011 | |||||||||||||||||||||||||||||||||||||||
| Less than 1 year | 1 year to 5 years | 5 years to 10 years | Over 10 years | Total | Less than 1 year | 1 year to 5 years | 5 years to 10 years | Over 10 years | Total | |||||||||||||||||||||||||||||||
Japanese bonds | 1,700,632 | 1,467,569 | 1,267,946 | 214,798 | 4,650,947 | 724,834 | 1,633,209 | 1,567,862 | 339,953 | 4,265,859 | ||||||||||||||||||||||||||||||
|
|
|
|
|
|
|
|
|
|
|
|
|
|
|
|
|
|
|
| |||||||||||||||||||||
Government bonds | 1,601,520 | 897,773 | 1,153,113 | 162,161 | 3,814,569 | 688,857 | 995,319 | 1,453,540 | 291,921 | 3,429,639 | ||||||||||||||||||||||||||||||
Local government bonds | — | 8,604 | 5,602 | — | 14,206 | — | 10,792 | 9,881 | — | 20,673 | ||||||||||||||||||||||||||||||
Corporate bonds | 99,112 | 561,191 | 109,230 | 52,637 | 822,171 | 35,976 | 627,097 | 104,440 | 48,032 | 815,546 | ||||||||||||||||||||||||||||||
|
|
|
|
|
|
|
|
|
|
|
|
|
|
|
|
|
|
|
| |||||||||||||||||||||
Others | 98,515 | 751,705 | 378,192 | 588,691 | 1,817,104 | 171,468 | 1,046,417 | 754,050 | 842,496 | 2,814,432 | ||||||||||||||||||||||||||||||
|
|
|
|
|
|
|
|
|
|
|
|
|
|
|
|
|
|
|
| |||||||||||||||||||||
| (*) | Including NCDs in “Cash and Due from Banks”, trust beneficiary certificates backed by loans in “Monetary Claims Bought” and so on, as well as securities. |
[Non-consolidated (CMTB + STB)]
| Millions of Yen | ||||||||||||||||||||||||||||||||||||||||
| Sep. 2011 | Mar. 2011 | |||||||||||||||||||||||||||||||||||||||
| Less than 1 year | 1 year to 5 years | 5 years to 10 years | Over 10 years | Total | Less than 1 year | 1 year to 5 years | 5 years to 10 years | Over 10 years | Total | |||||||||||||||||||||||||||||||
Japanese bonds | 1,024,530 | 1,477,134 | 1,267,895 | 192,657 | 3,962,217 | 655,825 | 1,632,799 | 1,567,811 | 317,547 | 4,173,984 | ||||||||||||||||||||||||||||||
|
|
|
|
|
|
|
|
|
|
|
|
|
|
|
|
|
|
|
| |||||||||||||||||||||
Government bonds | 915,418 | 897,338 | 1,153,062 | 162,161 | 3,127,981 | 599,857 | 994,910 | 1,453,489 | 291,921 | 3,340,178 | ||||||||||||||||||||||||||||||
Local government bonds | — | 8,604 | 5,602 | — | 14,206 | — | 10,792 | 9,881 | — | 20,673 | ||||||||||||||||||||||||||||||
Corporate bonds | 109,111 | 571,191 | 109,230 | 30,496 | 820,029 | 55,967 | 627,097 | 104,440 | 25,626 | 813,131 | ||||||||||||||||||||||||||||||
|
|
|
|
|
|
|
|
|
|
|
|
|
|
|
|
|
|
|
| |||||||||||||||||||||
Others | 79,096 | 559,137 | 373,965 | 544,688 | 1,556,888 | 146,225 | 832,203 | 753,493 | 792,800 | 2,524,723 | ||||||||||||||||||||||||||||||
|
|
|
|
|
|
|
|
|
|
|
|
|
|
|
|
|
|
|
| |||||||||||||||||||||
| (*) | Including NCDs in “Cash and Due from Banks”, trust beneficiary certificates backed by loans in “Monetary Claims Bought” and so on, as well as securities. |
[Consolidated]
| Billions of Yen | ||||
| Sep. 2011 | ||||
Cost basis (A) | 892.4 | |||
Mark-to-market basis | 837.6 | |||
Tier I (B) | 2,082.8 | |||
|
| |||
Percentage (A) / (B) | 42.8 | % | ||
|
| |||
2) Selling amount of cross shareholdings (Cost basis)
[Non-consolidated (CMTB + STB)]
| Billions of Yen | ||||||||||||||||||||
| 1HFY2011 | FY2010 | |||||||||||||||||||
| Total | CMTB | STB | Full | 1H | ||||||||||||||||
Cost basis | 5.9 | 3.4 | 2.5 | 30.9 | 10.4 | |||||||||||||||
|
|
|
|
|
|
|
|
|
| |||||||||||
| (*1) | Figures for CMTH Equity Investments is included. |
| (*2) | Including cross shareholdings with no available fair value. |
8. Deferred unrealized gains/ losses on hedge accounting applied derivative transactions
[Consolidated]
| Millions of Yen | ||||||||||||
| Sep. 2011 | Mar. 2011 | Change | ||||||||||
Interest rate related | (18,305 | ) | 8,103 | (26,408 | ) | |||||||
Interest rate swaps | (18,305 | ) | 8,103 | (26,408 | ) | |||||||
Currency related | 904 | 1,866 | (962 | ) | ||||||||
|
|
|
|
|
| |||||||
Total | (17,401 | ) | 9,969 | (27,371 | ) | |||||||
|
|
|
|
|
| |||||||
[Non-consolidated (CMTB + STB)]
| Millions of Yen | ||||||||||||||||||||||||||||
| Sep. 2011 | Mar. 2011 | Change | ||||||||||||||||||||||||||
| Total | CMTB | STB | Total | Total | CMTB | STB | ||||||||||||||||||||||
Interest rate related | (14,418 | ) | 5,587 | (20,006 | ) | 9,357 | (23,776 | ) | 1,943 | (25,719 | ) | |||||||||||||||||
Interest rate swaps | (14,418 | ) | 5,587 | (20,006 | ) | 9,357 | (23,776 | ) | 1,943 | (25,719 | ) | |||||||||||||||||
Currency related | 337 | (182 | ) | 519 | (265 | ) | 603 | (142 | ) | 745 | ||||||||||||||||||
|
|
|
|
|
|
|
|
|
|
|
|
|
| |||||||||||||||
Total | (14,081 | ) | 5,405 | (19,486 | ) | 9,091 | (23,172 | ) | 1,800 | (24,973 | ) | |||||||||||||||||
|
|
|
|
|
|
|
|
|
|
|
|
|
| |||||||||||||||
8
Table of Contents
Sumitomo Mitsui Trust Holdings, Inc.
9. BIS capital adequacy ratio (Basel II)
[Consolidated] (No.1 standard: International standard for bank holding company)
| Billions of Yen | ||||
| Sep. 2011 (Preliminary) | ||||
Total qualifying capital | 2,954.0 | |||
|
| |||
Tier I | 2,082.8 | |||
|
| |||
Shareholders’ equity | 1,781.2 | |||
Preferred shares | 109.0 | |||
Less: Unrealized loss on available-for-sale securities | (35.2 | ) | ||
Minority interest | 512.0 | |||
Noncumulative preferred securities issued by overseas special purpose companies | 463.5 | |||
Less: Goodwill equivalents | (115.4 | ) | ||
Less: Equivalent to 50% of the excess of expected loss over qualifying reserves | (20.0 | ) | ||
|
| |||
Tier II | 982.1 | |||
|
| |||
45% of unrealized gain on available-for-sale securities | — | |||
Perpetual subordinated debt | 970.4 | |||
|
| |||
Less: Deduction (double gearing, etc.) | (111.0 | ) | ||
|
| |||
Total risk-weighted assets | 17,874.5 | |||
|
| |||
Amount of credit risk-weighted assets | 16,564.0 | |||
Amount of market risk equivalents | 121.7 | |||
Amount of operational risk equivalents | 1,188.7 | |||
|
| |||
BIS capital adequacy ratio | 16.52 | % | ||
(Tier I capital ratio) | 11.65 | % | ||
|
| |||
| (*) | Risk measurement methodologies are as follows. |
| Credit risk: | Foundation Internal Ratings-Based Approach | |
| Market risk: | Internal Models Approach | |
| Operational risk: | Standardized Approach |
[Consolidated]
| Percentage points | ||||||||||||
| 1HFY2011 | 1HFY2010 | Change | ||||||||||
Return (Net income) on shareholders’ equity | 15.14 | 9.81 | 5.33 | |||||||||
Return (Net income) on equity | 15.36 | 9.77 | 5.59 | |||||||||
|
|
|
|
|
| |||||||
[Non-consolidated (CMTB + CMAB + STB)]
| Percentage points | ||||||||||||||||||||||||||||||||||||
| 1HFY2011 | 1HFY2010 | Change | ||||||||||||||||||||||||||||||||||
| Total | CMTB | CMAB | STB | Total | Total | CMTB | CMAB | STB | ||||||||||||||||||||||||||||
Return (Net income) on shareholders’ equity | 5.99 | 4.47 | 14.42 | 6.78 | 9.29 | (3.30 | ) | (4.47 | ) | (1.89 | ) | (2.48 | ) | |||||||||||||||||||||||
Return (Net income) on equity | 6.07 | 4.64 | 14.42 | 6.76 | 9.26 | (3.19 | ) | (4.30 | ) | (1.89 | ) | (2.44 | ) | |||||||||||||||||||||||
|
|
|
|
|
|
|
|
|
|
|
|
|
|
|
|
|
| |||||||||||||||||||
(*1) Return on shareholders’ equity (equity) formula
= { Net income (Net business profit before credit costs) - Total amount of dividend for preferred shares }
÷[ { (Beginning balance of shareholders’ equity (equity) - Beginning balance of deduction (*))
+ (Ending balance of shareholders’ equity (equity) - Ending balance of deduction (*)) } ÷2 ] X 100 X | 365 | |
| 183 |
(*) Balance of preferred shares issued + Dividend amount for preferred shares
(*2) Shareholders’ equity = Total net assets - Share purchase warrants - Minority interests - Valuation and translation adjustments
(*3) Equity = Total net assets - Share purchase warrants - Minority interests
9
Table of Contents
Sumitomo Mitsui Trust Holdings, Inc.
11. Loans and Deposits (Banking a/c and Principal guaranteed trust a/c combined)
(1) Balance of loans and deposits
[Non-consolidated (CMTB) + (STB)]
| Millions of Yen | ||||||||||||||||||||||||||||||||||||||
| Sep. 2011 (1HFY2011) (A) | Mar. 2011 (Full FY2010) (B) | Change (A) - (B) | ||||||||||||||||||||||||||||||||||||
| STB | STB | |||||||||||||||||||||||||||||||||||||
| Total | CMTB |
| Domestic branches | Total | Total | CMTB |
| Domestic branches | ||||||||||||||||||||||||||||||
Loans and bills discounted | (Ending balance) | 21,246,558 | 9,062,027 | 12,184,530 | 11,239,149 | 21,417,258 | (170,700 | ) | (22,266 | ) | (148,433 | ) | (86,129 | ) | ||||||||||||||||||||||||
| (Average balance) | 20,198,091 | 8,139,932 | 12,058,159 | 11,089,060 | 19,826,802 | 371,289 | 4,329 | 366,959 | 260,328 | |||||||||||||||||||||||||||||
|
|
|
|
|
|
|
|
|
|
|
|
|
|
|
|
|
| |||||||||||||||||||||
Banking account | (Ending balance) | 20,875,210 | 8,845,801 | 12,029,408 | 11,084,027 | 21,015,271 | (140,061 | ) | (15,776 | ) | (124,284 | ) | (61,979 | ) | ||||||||||||||||||||||||
| (Average balance) | 19,853,079 | 7,921,486 | 11,931,592 | 10,962,493 | 19,399,881 | 453,197 | 19,935 | 433,262 | 326,631 | |||||||||||||||||||||||||||||
Principal guaranteed trust account | (Ending balance) | 371,348 | 216,226 | 155,122 | 155,122 | 401,987 | (30,639 | ) | (6,489 | ) | (24,149 | ) | (24,149 | ) | ||||||||||||||||||||||||
| (Average balance) | 345,012 | 218,445 | 126,566 | 126,566 | 426,921 | (81,908 | ) | (15,606 | ) | (66,302 | ) | (66,302 | ) | |||||||||||||||||||||||||
|
|
|
|
|
|
|
|
|
|
|
|
|
|
|
|
|
| |||||||||||||||||||||
Deposits, Trust principal | (Ending balance) | 23,651,933 | 10,341,000 | 13,310,932 | 12,498,030 | 23,327,824 | 324,108 | (105,082 | ) | 429,190 | 138,522 | |||||||||||||||||||||||||||
| (Average balance) | 23,283,270 | 10,240,131 | 13,043,139 | 12,343,184 | 22,463,917 | 819,353 | 119,574 | 699,779 | 583,577 | |||||||||||||||||||||||||||||
|
|
|
|
|
|
|
|
|
|
|
|
|
|
|
|
|
| |||||||||||||||||||||
Deposits (*1) | (Ending balance) | 22,182,062 | 9,372,655 | 12,809,407 | 11,996,505 | 21,639,585 | 542,476 | 36,486 | 505,990 | 215,321 | ||||||||||||||||||||||||||||
| (Average balance) | 21,706,469 | 9,202,794 | 12,503,675 | 11,803,720 | 20,620,801 | 1,085,668 | 315,787 | 769,881 | 653,679 | |||||||||||||||||||||||||||||
|
|
|
|
|
|
|
|
|
|
|
|
|
|
|
|
|
| |||||||||||||||||||||
Time deposits | (Ending balance) | 17,844,543 | 7,865,931 | 9,978,611 | 9,169,985 | 17,275,415 | 569,128 | 162,786 | 406,341 | 114,385 | ||||||||||||||||||||||||||||
| (Average balance) | 17,673,911 | 7,717,990 | 9,955,921 | 9,260,373 | 17,001,065 | 672,846 | 166,004 | 506,841 | 391,201 | |||||||||||||||||||||||||||||
Liquid deposits | (Ending balance) | 3,857,076 | 1,459,217 | 2,397,859 | 2,393,596 | 3,916,673 | (59,597 | ) | (70,933 | ) | 11,335 | 12,224 | ||||||||||||||||||||||||||
| (Average balance) | 3,597,233 | 1,431,587 | 2,165,646 | 2,161,424 | 3,256,759 | 340,474 | 150,430 | 190,043 | 189,564 | |||||||||||||||||||||||||||||
|
|
|
|
|
|
|
|
|
|
|
|
|
|
|
|
|
| |||||||||||||||||||||
Trust principal | (Ending balance) | 1,469,870 | 968,345 | 501,524 | 501,524 | 1,688,238 | (218,368 | ) | (141,568 | ) | (76,799 | ) | (76,799 | ) | ||||||||||||||||||||||||
| (Average balance) | 1,576,800 | 1,037,336 | 539,464 | 539,464 | 1,843,115 | (266,315 | ) | (196,212 | ) | (70,102 | ) | (70,102 | ) | |||||||||||||||||||||||||
|
|
|
|
|
|
|
|
|
|
|
|
|
|
|
|
|
| |||||||||||||||||||||
| (*1) | Excluding NCDs. |
(2) Ending balance of domestic deposits classified by depositors (Domestic branches)
[Non-consolidated (CMTB) + (STB)]
| Millions of Yen | ||||||||||||||||||||||||||||
| Sep. 2011 | Mar. 2011 | Change | ||||||||||||||||||||||||||
| Total | CMTB | STB | Total | Total | CMTB | STB | ||||||||||||||||||||||
Individuals | 17,332,740 | 8,203,982 | 9,128,757 | 17,140,793 | 191,946 | 98,626 | 93,319 | |||||||||||||||||||||
Deposits (*1) | 16,179,812 | 7,441,861 | 8,737,951 | 15,874,678 | 305,133 | 181,498 | 123,635 | |||||||||||||||||||||
Trust principal (Principal guaranteed) | 1,152,927 | 762,121 | 390,806 | 1,266,114 | (113,187 | ) | (82,871 | ) | (30,315 | ) | ||||||||||||||||||
|
|
|
|
|
|
|
|
|
|
|
|
|
| |||||||||||||||
Corporations and other organizations (*2) | 5,325,422 | 2,134,136 | 3,191,286 | 5,544,035 | (218,612 | ) | (199,685 | ) | (18,926 | ) | ||||||||||||||||||
Deposits (*1) | 5,008,479 | 1,927,912 | 3,080,567 | 5,121,911 | (113,431 | ) | (140,988 | ) | 27,557 | |||||||||||||||||||
Trust principal (Principal guaranteed) | 316,942 | 206,223 | 110,718 | 422,123 | (105,181 | ) | (58,697 | ) | (46,483 | ) | ||||||||||||||||||
|
|
|
|
|
|
|
|
|
|
|
|
|
| |||||||||||||||
Total | 22,658,162 | 10,338,119 | 12,320,043 | 22,684,828 | (26,665 | ) | (101,059 | ) | 74,393 | |||||||||||||||||||
|
|
|
|
|
|
|
|
|
|
|
|
|
| |||||||||||||||
| (*1) | Excluding NCDs and offshore accounts. |
| (*2) | Public organizations and financial institutions |
10
Table of Contents
Sumitomo Mitsui Trust Holdings, Inc.
12. Loans (Banking a/c and Principal guaranteed trust a/c combined)
(1) Loans to small and mid-sized enterprises
[Non-consolidated (CMTB) + (STB)]
| (*1) | Based on the location of final exposure. |
| (*2) | STB’s definition has been standardized to that which includes domestic yen-denominated loans to non-Japanese borrowers since previous fiscal year. |
[Non-consolidated (CMTB) + (STB)]
| Millions of Yen | ||||||||||||||||||||||||||||
| Sep. 2011 | Mar. 2011 | Change | ||||||||||||||||||||||||||
| Total | CMTB | STB | Total | Total | CMTB | STB | ||||||||||||||||||||||
Domestic Branches (excluding offshore) | 20,297,779 | 9,058,629 | 11,239,149 | 20,405,414 | (107,635 | ) | (21,505 | ) | (86,129 | ) | ||||||||||||||||||
|
|
|
|
|
|
|
|
|
|
|
|
|
| |||||||||||||||
Manufacturing | 2,767,714 | 917,354 | 1,850,359 | 2,754,487 | 13,226 | 18,152 | (4,926 | ) | ||||||||||||||||||||
Agriculture, forestry, fisheries, mining, quarrying of stone and gravel gathering | 29,119 | 4,999 | 24,119 | 22,562 | 6,556 | 3,937 | 2,618 | |||||||||||||||||||||
Construction | 161,702 | 68,762 | 92,940 | 164,212 | (2,509 | ) | (1,958 | ) | (550 | ) | ||||||||||||||||||
Electricity, gas, heat supply and water | 636,777 | 259,246 | 377,531 | 631,949 | 4,827 | (8,833 | ) | 13,661 | ||||||||||||||||||||
Information and communications | 270,092 | 34,137 | 235,954 | 225,320 | 44,771 | 5,224 | 39,546 | |||||||||||||||||||||
Transport and postal activities | 1,280,715 | 546,640 | 734,075 | 1,275,211 | 5,504 | (12,709 | ) | 18,213 | ||||||||||||||||||||
Wholesale and retail trade | 1,285,676 | 408,159 | 877,517 | 1,337,675 | (51,998 | ) | (20,384 | ) | (31,613 | ) | ||||||||||||||||||
Finance and insurance | 3,395,004 | 1,679,832 | 1,715,171 | 3,544,403 | (149,398 | ) | (7,036 | ) | (142,362 | ) | ||||||||||||||||||
Real estate | 2,882,704 | 1,189,907 | 1,692,797 | 2,961,056 | (78,351 | ) | (49,477 | ) | (28,874 | ) | ||||||||||||||||||
Goods rental and leasing | 730,620 | 125,204 | 605,416 | 785,008 | (54,387 | ) | (14,066 | ) | (40,321 | ) | ||||||||||||||||||
Others | 6,857,649 | 3,824,383 | 3,033,266 | 6,703,525 | 154,124 | 65,647 | 88,477 | |||||||||||||||||||||
|
|
|
|
|
|
|
|
|
|
|
|
|
| |||||||||||||||
Offshore | 948,779 | 3,397 | 945,381 | 1,011,844 | (63,065 | ) | (760 | ) | (62,304 | ) | ||||||||||||||||||
|
|
|
|
|
|
|
|
|
|
|
|
|
| |||||||||||||||
Total | 21,246,558 | 9,062,027 | 12,184,530 | 21,417,258 | (170,700 | ) | (22,266 | ) | (148,433 | ) | ||||||||||||||||||
|
|
|
|
|
|
|
|
|
|
|
|
|
| |||||||||||||||
| (*) | Above table is made based on the categorization of “Survey on loans by industry” of Bank of Japan. |
11
Table of Contents
Sumitomo Mitsui Trust Holdings, Inc.
13. Problem assets based on the Financial Reconstruction Act (Banking a/c and Principal guaranteed trust a/c combined)
(1) Problem assets based on the Financial Reconstruction Act (After partial direct written-off)
[Consolidated]
| Millions of Yen | ||||||||||||
| Sep. 2011 | Mar. 2011 | Change | ||||||||||
Problem assets based on the Financial Reconstruction Act (a) | 300,324 | 304,375 | (4,051 | ) | ||||||||
|
|
|
|
|
| |||||||
Bankrupt and practically bankrupt | 42,248 | 57,982 | (15,734 | ) | ||||||||
Doubtful | 170,055 | 119,621 | 50,433 | |||||||||
Substandard | 88,021 | 126,771 | (38,750 | ) | ||||||||
|
|
|
|
|
| |||||||
Ordinary assets | 22,294,889 | 22,496,326 | (201,436 | ) | ||||||||
|
|
|
|
|
| |||||||
Total balance (b) | 22,595,214 | 22,800,701 | (205,487 | ) | ||||||||
|
|
|
|
|
| |||||||
(Ratio to total balance (a) / (b)) | 1.3 | % | 1.3 | % | 0.0 | % | ||||||
|
|
|
|
|
| |||||||
| (*) | Partial direct written-off: Sep. 2011: 78,350 million yen, Mar. 2011: 85,491 million yen |
[Non-consolidated (CMTB) + (STB)]
| Millions of Yen | ||||||||||||||||||||||||||||
| Sep. 2011 | Mar. 2011 | Change | ||||||||||||||||||||||||||
| Total | CMTB | STB | Total | Total | CMTB | STB | ||||||||||||||||||||||
Problem assets based on the Financial Reconstruction Act (a) | 240,793 | 97,178 | 143,614 | 245,254 | (4,461 | ) | 7,579 | (12,040 | ) | |||||||||||||||||||
|
|
|
|
|
|
|
|
|
|
|
|
|
| |||||||||||||||
Bankrupt and practically bankrupt | 33,742 | 10,787 | 22,955 | 41,252 | (7,510 | ) | (6,554 | ) | (956 | ) | ||||||||||||||||||
Doubtful | 133,928 | 65,291 | 68,637 | 93,662 | 40,266 | 21,262 | 19,004 | |||||||||||||||||||||
Substandard (b) | 73,122 | 21,100 | 52,021 | 110,339 | (37,217 | ) | (7,128 | ) | (30,088 | ) | ||||||||||||||||||
|
|
|
|
|
|
|
|
|
|
|
|
|
| |||||||||||||||
Ordinary assets | 21,685,117 | 9,161,050 | 12,524,067 | 21,827,944 | (142,826 | ) | (31,696 | ) | (111,129 | ) | ||||||||||||||||||
|
|
|
|
|
|
|
|
|
|
|
|
|
| |||||||||||||||
Assets to substandard debtors (excluding Substandard) (c) | 36,040 | 706 | 35,333 | 28,180 | 7,859 | 126 | 7,733 | |||||||||||||||||||||
Assets to other special mention debtors | 690,527 | 287,907 | 402,619 | 711,233 | (20,706 | ) | (47,070 | ) | 26,363 | |||||||||||||||||||
Assets to ordinary debtors | 20,958,550 | 8,872,435 | 12,086,114 | 21,088,529 | (129,979 | ) | 15,247 | (145,227 | ) | |||||||||||||||||||
|
|
|
|
|
|
|
|
|
|
|
|
|
| |||||||||||||||
Total balance (d) | 21,925,910 | 9,258,228 | 12,667,682 | 22,073,198 | (147,288 | ) | (24,117 | ) | (123,170 | ) | ||||||||||||||||||
|
|
|
|
|
|
|
|
|
|
|
|
|
| |||||||||||||||
(Ratio to total balance (a) / (d)) | 1.1 | % | 1.0 | % | 1.1 | % | 1.1 | % | 0.0 | % | 0.0 | % | (0.1 | %) | ||||||||||||||
|
|
|
|
|
|
|
|
|
|
|
|
|
| |||||||||||||||
Assets to substandard debtors (b) + (c) | 109,162 | 21,807 | 87,355 | 138,520 | (29,357 | ) | (7,002 | ) | (22,355 | ) | ||||||||||||||||||
|
|
|
|
|
|
|
|
|
|
|
|
|
| |||||||||||||||
| Note: | CMTB’s partial direct written-off: Sep. 2011: 14,520 million yen, Mar. 2011: 19,319 million yen |
| STB’s partial direct written-off: Sep. 2011: 35,901 billion yen, Mar. 2011: 38,014 million yen |
2) Coverage ratio and allowance ratio of Problem assets based on the Financial Reconstruction Act
[Non-consolidated (CMTB) + (STB)]
| Millions of Yen | ||||||||||||||||||||||||||||
| Sep. 2011 | Mar. 2011 | Change | ||||||||||||||||||||||||||
| Total | CMTB | STB | Total | Total | CMTB | STB | ||||||||||||||||||||||
Problem assets based on the Financial Reconstruction Act | 240,793 | 97,178 | 143,614 | 245,254 | (4,461 | ) | 7,579 | (12,040 | ) | |||||||||||||||||||
|
|
|
|
|
|
|
|
|
|
|
|
|
| |||||||||||||||
Coverage ratio | 87.9 | % | 88.4 | % | 87.5 | % | 77.9 | % | 10.0 | % | 13.9 | % | 7.7 | % | ||||||||||||||
Allowance ratio | 60.3 | % | 46.1 | % | 65.9 | % | 46.3 | % | 14.0 | % | 7.9 | % | 14.9 | % | ||||||||||||||
|
|
|
|
|
|
|
|
|
|
|
|
|
| |||||||||||||||
Bankrupt and practically bankrupt | 33,742 | 10,787 | 22,955 | 41,252 | (7,510 | ) | (6,554 | ) | (956 | ) | ||||||||||||||||||
|
|
|
|
|
|
|
|
|
|
|
|
|
| |||||||||||||||
Coverage ratio | 100.0 | % | 100.0 | % | 100.0 | % | 100.0 | % | — | % | — | % | — | % | ||||||||||||||
Allowance ratio | 100.0 | % | 100.0 | % | 100.0 | % | 100.0 | % | — | % | — | % | — | % | ||||||||||||||
|
|
|
|
|
|
|
|
|
|
|
|
|
| |||||||||||||||
Doubtful | 133,928 | 65,291 | 68,637 | 93,662 | 40,266 | 21,262 | 19,004 | |||||||||||||||||||||
|
|
|
|
|
|
|
|
|
|
|
|
|
| |||||||||||||||
Coverage ratio | 91.7 | % | 91.5 | % | 91.8 | % | 87.9 | % | 3.8 | % | 5.5 | % | 2.2 | % | ||||||||||||||
Allowance ratio | 67.7 | % | 42.2 | % | 77.5 | % | 63.8 | % | 3.9 | % | 2.7 | % | 2.0 | % | ||||||||||||||
|
|
|
|
|
|
|
|
|
|
|
|
|
| |||||||||||||||
Substandard | 73,122 | 21,100 | 52,021 | 110,339 | (37,217 | ) | (7,128 | ) | (30,088 | ) | ||||||||||||||||||
|
|
|
|
|
|
|
|
|
|
|
|
|
| |||||||||||||||
Coverage ratio | 75.4 | % | 73.0 | % | 76.3 | % | 61.2 | % | 14.2 | % | 31.9 | % | 8.2 | % | ||||||||||||||
Allowance ratio | 26.4 | % | 27.5 | % | 25.9 | % | 17.3 | % | 9.1 | % | 14.3 | % | 6.2 | % | ||||||||||||||
|
|
|
|
|
|
|
|
|
|
|
|
|
| |||||||||||||||
| (*1) | Coverage ratio and allowance ratio are calculated by the formula shown below. |
Sep. 2011 (CMTB, STB): Coverage ratio = (Collateral value after considering haircuts + allowance for loan losses) / loan balance Allowance ratio = Allowance for loan losses / (Loan balance - collateral value after considering haircuts)
Mar. 2011 (CMTB): Coverage ratio = (Collateral value after considering haircuts + allowance for loan losses) / loan balance Allowance ratio = Allowance for loan losses / (Loan balance - collateral value after considering haircuts)
Mar. 2011 (STB): Coverage ratio = (Collateral value before considering haircuts + allowance for loan losses) / loan balance Allowance ratio = Allowance for loan losses / (Loan balance - collateral value before considering haircuts)
| (*2) | Other than above mentioned, there are Reserves for loan trust and Reserves for JOMT (Jointly-operated money trust). |
CMTB: Reserves for loan trust 1.1 billion yen, Reserves for JOMT 0.1 billion yen.
STB: Reserves for loan trust 0.0 billion yen, Reserves for JOMT 0.1 billion yen.
12
Table of Contents
Sumitomo Mitsui Trust Holdings, Inc.
(3) Problem assets based on the Financial Reconstruction Act by industry
[Non-consolidated (CMTB) + (STB)]
| Millions of Yen | ||||||||||||||||||||||||||||
| Sep. 2011 | Mar. 2011 | Change | ||||||||||||||||||||||||||
| Total | CMTB | STB | Total | Total | CMTB | STB | ||||||||||||||||||||||
Domestic Branches (excluding offshore) | 238,468 | 97,178 | 141,289 | 242,383 | (3,915 | ) | 7,805 | (11,720 | ) | |||||||||||||||||||
|
|
|
|
|
|
|
|
|
|
|
|
|
| |||||||||||||||
Manufacturing | 19,943 | 884 | 19,059 | 23,895 | (3,952 | ) | (2,379 | ) | (1,572 | ) | ||||||||||||||||||
Agriculture, forestry, fisheries, mining, quarrying of stone and gravel gathering | — | — | — | 64 | (64 | ) | — | (64 | ) | |||||||||||||||||||
Construction | 1,683 | 975 | 708 | 1,830 | (147 | ) | (219 | ) | 71 | |||||||||||||||||||
Electricity, gas, heat supply and water | 192 | 192 | — | 1,362 | (1,170 | ) | — | (1,170 | ) | |||||||||||||||||||
Information and communications | 3,246 | 338 | 2,907 | 13,652 | (10,405 | ) | (63 | ) | (10,341 | ) | ||||||||||||||||||
Transport and postal activities | 2,180 | 929 | 1,250 | 1,753 | 426 | 143 | 282 | |||||||||||||||||||||
Wholesale and retail trade | 3,710 | 2,284 | 1,425 | 6,201 | (2,490 | ) | (2,299 | ) | (190 | ) | ||||||||||||||||||
Finance and insurance | 78,744 | 35,741 | 43,002 | 72,584 | 6,159 | 21,995 | (15,835 | ) | ||||||||||||||||||||
Real estate | 53,267 | 17,430 | 35,836 | 62,780 | (9,513 | ) | (7,365 | ) | (2,147 | ) | ||||||||||||||||||
Goods rental and leasing | 56 | 56 | — | 69 | (13 | ) | (13 | ) | — | |||||||||||||||||||
Others | 75,444 | 38,345 | 37,099 | 58,188 | 17,256 | (1,991 | ) | 19,247 | ||||||||||||||||||||
|
|
|
|
|
|
|
|
|
|
|
|
|
| |||||||||||||||
Offshore | 2,324 | — | 2,324 | 2,870 | (545 | ) | (226 | ) | (319 | ) | ||||||||||||||||||
|
|
|
|
|
|
|
|
|
|
|
|
|
| |||||||||||||||
Total | 240,793 | 97,178 | 143,614 | 245,254 | (4,461 | ) | 7,579 | (12,040 | ) | |||||||||||||||||||
|
|
|
|
|
|
|
|
|
|
|
|
|
| |||||||||||||||
| (*) | Above table is made based on the categorization of “Survey on loans by industry” of Bank of Japan. |
14. Self-Assessment and Problem assets based on the Financial Reconstruction Act (Banking a/c and Principal guaranteed trust a/c combined)
[Non-consolidated (CMTB) + (STB)]
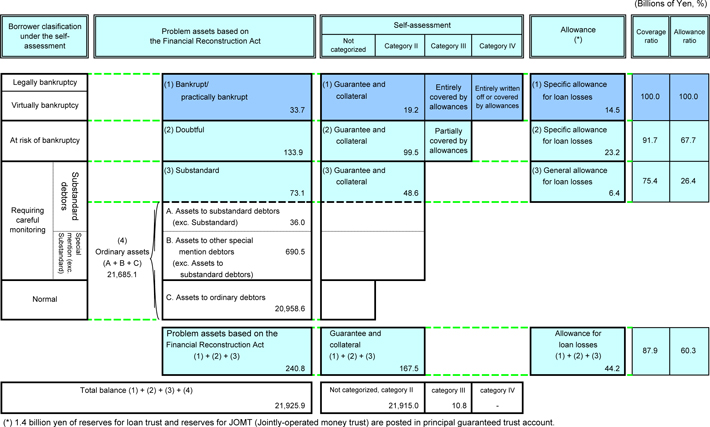
13
Table of Contents
Sumitomo Mitsui Trust Holdings, Inc.
(Banking account)
[Consolidated]
| Millions of Yen | ||||||||||||
| Sep. 2011 | Mar. 2011 | Change | ||||||||||
Allowance for loan losses | 150,660 | 160,464 | (9,804 | ) | ||||||||
|
|
|
|
|
| |||||||
General allowance for loan losses (*) | 84,611 | 103,586 | (18,975 | ) | ||||||||
Specific allowance for loan losses | 66,048 | 56,877 | 9,171 | |||||||||
|
|
|
|
|
| |||||||
Partial direct written-off | 79,074 | 86,132 | (7,058 | ) | ||||||||
|
|
|
|
|
| |||||||
| (*) | Provision of general allowance for loan losses, which was reasonably and comprehensively estimated the effects caused by The Great East Japan Earthquake, is included in General allowance for loan losses: |
Sep. 2011: 17,351 million yen, Mar. 2011: 19,349 million yen
[Non-consolidated (CMTB) + (STB)]
| Millions of Yen | ||||||||||||||||||||||||||||
| Sep. 2011 | Mar. 2011 | Change | ||||||||||||||||||||||||||
| Total | CMTB | STB | Total | Total | CMTB | STB | ||||||||||||||||||||||
Allowance for loan losses | 121,255 | 39,969 | 81,286 | 127,867 | (6,611 | ) | (2,338 | ) | (4,273 | ) | ||||||||||||||||||
|
|
|
|
|
|
|
|
|
|
|
|
|
| |||||||||||||||
General allowance for loan losses (*) | 66,651 | 25,077 | 41,573 | 82,299 | (15,648 | ) | (3,221 | ) | (12,426 | ) | ||||||||||||||||||
Specific allowance for loan losses | 54,604 | 14,891 | 39,712 | 45,567 | 9,036 | 883 | 8,153 | |||||||||||||||||||||
|
|
|
|
|
|
|
|
|
|
|
|
|
| |||||||||||||||
Partial direct written-off | 50,567 | 14,520 | 36,047 | 57,463 | (6,895 | ) | (4,798 | ) | (2,096 | ) | ||||||||||||||||||
|
|
|
|
|
|
|
|
|
|
|
|
|
| |||||||||||||||
| (*) | Provision of general allowance for loan losses, which was reasonably and comprehensively estimated the effects caused by The Great East Japan Earthquake, is included in General allowance for loan losses: |
Sep. 2011: CMTB 6,472 million yen, STB 5,666 million yen
Mar. 2011: CMTB 6,773 million yen, STB 6,091 million yen
(Trust account)
[Non-consolidated (CMTB) + (STB)]
| Millions of Yen | ||||||||||||||||||||||||||||
| Sep. 2011 | Mar. 2011 | Change | ||||||||||||||||||||||||||
| Total | CMTB | STB | Total | Total | CMTB | STB | ||||||||||||||||||||||
Reserves for loan trust | 1,203 | 1,106 | 97 | 1,588 | (385 | ) | (271 | ) | (114 | ) | ||||||||||||||||||
Reserves for JOMT (Jointly-operated money trust) | 270 | 109 | 160 | 311 | (40 | ) | 76 | (116 | ) | |||||||||||||||||||
|
|
|
|
|
|
|
|
|
|
|
|
|
| |||||||||||||||
Total | 1,473 | 1,216 | 257 | 1,899 | (426 | ) | (194 | ) | (231 | ) | ||||||||||||||||||
|
|
|
|
|
|
|
|
|
|
|
|
|
| |||||||||||||||
| (*) | Principal guaranteed trust a/c |
(2) Reserve ratio for loans to special mention/ ordinary debtors (general allowance for loan losses)
(Banking account)
[Non-consolidated (CMTB) + (STB)]
| Percentage points | ||||||||||||||||||||||||||||
| Sep. 2011 | Mar. 2011 | Change | ||||||||||||||||||||||||||
| Total | CMTB | STB | Total | Total | CMTB | STB | ||||||||||||||||||||||
Assets to Special mention debtors | 3.3 | 2.1 | 4.1 | 3.4 | (0.1 | ) | 0.2 | (0.4 | ) | |||||||||||||||||||
|
|
|
|
|
|
|
|
|
|
|
|
|
| |||||||||||||||
Substandard | 8.9 | 10.0 | 8.7 | 8.9 | 0.0 | (2.2 | ) | 0.4 | ||||||||||||||||||||
(Against uncovered portion) | 25.5 | 27.8 | 24.9 | 21.7 | 3.8 | 5.3 | 3.5 | |||||||||||||||||||||
|
|
|
|
|
|
|
|
|
|
|
|
|
| |||||||||||||||
Other special mention | 2.4 | 1.5 | 3.1 | 2.3 | 0.1 | 0.3 | (0.3 | ) | ||||||||||||||||||||
(Against uncovered portion) | 5.6 | 5.2 | 5.8 | 5.3 | 0.3 | 2.1 | (1.2 | ) | ||||||||||||||||||||
|
|
|
|
|
|
|
|
|
|
|
|
|
| |||||||||||||||
Assets to Ordinary debtors | 0.1 | 0.1 | 0.1 | 0.1 | 0.0 | 0.0 | (0.1 | ) | ||||||||||||||||||||
|
|
|
|
|
|
|
|
|
|
|
|
|
| |||||||||||||||
| (*) | Other than specified, above list indicate the ratio of general allowance for loan losses to total loan balance. General allowance for loan losses, which was reasonably and comprehensively estimated the effects caused by The Great East Japan Earthquake, is excluded. |
Sep. 2011 (CMTB, STB): Allowance ratio = Allowance for loan losses / (Loan balance - collateral value after considering haircuts)
Mar. 2011 and Sep. 2010 (CMTB): Allowance ratio = Allowance for loan losses / (Loan balance - collateral value after considering haircuts)
Mar. 2011 and Sep. 2010 (STB): Allowance ratio = Allowance for loan losses / (Loan balance - collateral value before considering haircuts)
14
Table of Contents
Sumitomo Mitsui Trust Holdings, Inc.
[Consolidated]
| Millions of Yen | ||||||||||||
| Sep. 2011 | Mar. 2011 | Change | ||||||||||
Projected benefit obligation | 390,160 | 383,142 | 7,017 | |||||||||
|
|
|
|
|
| |||||||
| Millions of Yen | ||||||||||||
| 1HFY2011 | 1HFY2010 | Change | ||||||||||
Retirement benefit expenses | (1,504 | ) | (10,158 | ) | 8,654 | |||||||
|
|
|
|
|
| |||||||
[Non-consolidated (CMTB) + (CMAB) + (STB)]
| Millions of Yen | ||||||||||||||||||||||||||||||||||||
| Sep. 2011 | Mar. 2011 | Change | ||||||||||||||||||||||||||||||||||
| Total | CMTB | CMAB | STB | Total | Total | CMTB | CMAB | STB | ||||||||||||||||||||||||||||
Projected benefit obligation (A) | 369,796 | 160,366 | 29,416 | 180,014 | 358,872 | 10,924 | 8,250 | 2,715 | (41 | ) | ||||||||||||||||||||||||||
(Discount rate) | — | 1.9 | % | 1.9 | % | 2.0 | % | — | — | — | % | — | % | — | % | |||||||||||||||||||||
|
|
|
|
|
|
|
|
|
|
|
|
|
|
|
|
|
| |||||||||||||||||||
Plan assets (B) | 441,099 | 174,430 | 26,271 | 240,397 | 426,574 | 14,525 | 8,091 | 1,761 | 4,672 | |||||||||||||||||||||||||||
Provision for retirement benefits (C) | 210 | — | — | 210 | 223 | (13 | ) | — | — | (13 | ) | |||||||||||||||||||||||||
Advanced benefit paid (D) | 222,521 | 84,724 | 10,575 | 127,220 | 222,861 | (340 | ) | 728 | (666 | ) | (402 | ) | ||||||||||||||||||||||||
Unrecognized net prior service cost (E) | 366 | — | — | 366 | 414 | (47 | ) | — | — | (47 | ) | |||||||||||||||||||||||||
Unrecognized net actuarial loss (F) | 150,640 | 70,660 | 13,720 | 66,260 | 154,521 | (3,880 | ) | 888 | 288 | (5,056 | ) | |||||||||||||||||||||||||
|
|
|
|
|
|
|
|
|
|
|
|
|
|
|
|
|
| |||||||||||||||||||
| Note: (A) = (B) + (C) - (D) + (E) + (F) | ||||||||||||||||||||||||||||||||||||
| Millions of Yen | ||||||||||||||||||||||||||||||||||||
| 1HFY2011 | 1HFY2011 | Change | ||||||||||||||||||||||||||||||||||
| Total | CMTB | CMAB | STB | Total | Total | CMTB | CMAB | STB | ||||||||||||||||||||||||||||
Retirement benefit expenses | (7,029 | ) | (3,450 | ) | (1,300 | ) | (2,278 | ) | (8,938 | ) | 1,908 | 1,011 | (34 | ) | 932 | |||||||||||||||||||||
|
|
|
|
|
|
|
|
|
|
|
|
|
|
|
|
|
| |||||||||||||||||||
Service cost-benefits earned | (4,478 | ) | (1,909 | ) | (428 | ) | (2,141 | ) | (3,952 | ) | (526 | ) | (426 | ) | (90 | ) | (8 | ) | ||||||||||||||||||
Interest cost on projected benefit obligation | (3,332 | ) | (1,524 | ) | (278 | ) | (1,529 | ) | (3,811 | ) | 478 | (101 | ) | (29 | ) | 609 | ||||||||||||||||||||
Expected return on plan assets | 13,274 | 5,388 | 705 | 7,180 | 12,328 | 946 | 1,239 | 100 | (393 | ) | ||||||||||||||||||||||||||
Disposal of prior service cost | (47 | ) | — | — | (47 | ) | (45 | ) | (2 | ) | — | — | (2 | ) | ||||||||||||||||||||||
Disposal of actuarial loss | (11,712 | ) | (5,356 | ) | (1,299 | ) | (5,056 | ) | (12,996 | ) | 1,283 | 194 | (39 | ) | 1,129 | |||||||||||||||||||||
Others (additional benefit at retirement, etc) | (732 | ) | (49 | ) | — | (683 | ) | (461 | ) | (271 | ) | 106 | 23 | (401 | ) | |||||||||||||||||||||
|
|
|
|
|
|
|
|
|
|
|
|
|
|
|
|
|
| |||||||||||||||||||
15
Table of Contents
Sumitomo Mitsui Trust Holdings, Inc.
1) Major factors for deferred tax assets and deferred tax liabilities
[Consolidated]
| Billions of Yen | ||||||||||||
| Sep. 2011 | Mar. 2011 | Change | ||||||||||
Net deferred tax assets | 275.3 | 239.2 | 36.0 | |||||||||
|
|
|
|
|
| |||||||
Percentage to Tier I | 13.2 | % | ||||||||||
Tier I | 2,082.8 | |||||||||||
|
| |||||||||||
[Non-consolidated (CMTB) + (STB)]
| Billions of Yen | ||||||||||||||||||||||||||||
| Sep. 2011 | Mar. 2011 | Change | ||||||||||||||||||||||||||
| Total | CMTB | STB | Total | Total | CMTB | STB | ||||||||||||||||||||||
Deferred tax assets (A) | 219.3 | 138.6 | 80.7 | 217.3 | 2.0 | 4.1 | (2.1 | ) | ||||||||||||||||||||
|
|
|
|
|
|
|
|
|
|
|
|
|
| |||||||||||||||
Devaluation of securities | 76.1 | 12.5 | 63.6 | 83.3 | (7.1 | ) | (2.1 | ) | (4.9 | ) | ||||||||||||||||||
Allowance for loan losses (including written-off of loans) | 47.9 | 16.2 | 31.7 | 56.0 | (8.0 | ) | (3.9 | ) | (4.1 | ) | ||||||||||||||||||
Provision for retirement benefits | 17.3 | 2.2 | 15.0 | 17.1 | 0.1 | (0.5 | ) | 0.7 | ||||||||||||||||||||
Loss carry forwards | 77.5 | 77.5 | — | 75.0 | 2.5 | 2.5 | — | |||||||||||||||||||||
Valuation difference on available-for-sale securities | 16.3 | 16.3 | — | 11.3 | 4.9 | 4.9 | — | |||||||||||||||||||||
Defined hedge gains/ losses | 3.8 | — | 3.8 | — | 3.8 | — | 3.8 | |||||||||||||||||||||
Provision for investment loss | 0.4 | — | 0.4 | 0.4 | — | — | — | |||||||||||||||||||||
Others | 66.2 | 46.7 | 19.5 | 63.3 | 2.9 | 0.3 | 2.5 | |||||||||||||||||||||
Valuation allowance | (26.7 | ) | (18.8 | ) | (7.9 | ) | (28.7 | ) | 1.9 | 3.4 | (1.5 | ) | ||||||||||||||||
Offset with deferred tax liabilities | (59.8 | ) | (14.2 | ) | (45.5 | ) | (60.6 | ) | 0.8 | (0.5 | ) | 1.3 | ||||||||||||||||
|
|
|
|
|
|
|
|
|
|
|
|
|
| |||||||||||||||
Deferred tax liabilities (B) | — | — | — | — | — | — | — | |||||||||||||||||||||
|
|
|
|
|
|
|
|
|
|
|
|
|
| |||||||||||||||
Employee retirement benefit trust | 45.3 | 8.7 | 36.5 | 41.4 | 3.9 | — | 3.9 | |||||||||||||||||||||
Defined hedge gains/ losses | 2.1 | 2.1 | — | 8.6 | (6.4 | ) | 0.7 | (7.1 | ) | |||||||||||||||||||
Valuation difference on available-for-sale securities | 5.5 | — | 5.5 | 3.3 | 2.2 | — | 2.2 | |||||||||||||||||||||
Others | 6.7 | 3.2 | 3.4 | 7.2 | (0.5 | ) | (0.2 | ) | (0.3 | ) | ||||||||||||||||||
Offset with deferred tax assets | (59.8 | ) | (14.2 | ) | (45.5 | ) | (60.6 | ) | 0.8 | (0.5 | ) | 1.3 | ||||||||||||||||
|
|
|
|
|
|
|
|
|
|
|
|
|
| |||||||||||||||
Net deferred tax assets (A) - (B) | 219.3 | 138.6 | 80.7 | 217.3 | 2.0 | 4.1 | (2.1 | ) | ||||||||||||||||||||
|
|
|
|
|
|
|
|
|
|
|
|
|
| |||||||||||||||
Percentage to Tier I | 10.2 | % | 18.6 | % | 5.8 | % | 10.3 | % | (0.1 | %) | 0.1 | % | (0.2 | %) | ||||||||||||||
Tier I | 2,141.3 | 745.2 | 1,396.0 | 2,109.7 | 31.6 | 19.1 | 12.4 | |||||||||||||||||||||
|
|
|
|
|
|
|
|
|
|
|
|
|
| |||||||||||||||
2) Adequacy for calculating and posting net deferred tax assets
[CMTB Non-consolidated]
(1) Basic policy
To record the deferred tax assets, the amount is calculated pursuant to the practical guideline on assessing the collectability of deferred tax assets issued by JICPA(“Practical Guideline”(*1)) (*1) JICPA Auditing Committee Report No.66 “Auditing Treatment Regarding Judgment of Realizability of Deferred Tax Assets”.
(2) Examples on Practical Guideline, Period for Estimated Future Taxable Income, and Taxable Income for the Past 5 Years
Although there are significant operating loss carryforwards on the tax base, as the loss carryforwards are due to extraordinary factors and temporary factors, “examples (4) proviso” of Practical Guideline is applied. Period for estimated future taxable income is 5 years, which is allowed to record pursuant to Practical Guideline subject to rational earnings projection.
| Billions of Yen | ||||||||||||||||||||
| FY2010 | FY2009 | FY2008 | FY2007 | FY2006 | ||||||||||||||||
Taxable income before deduction of loss carry forwards (*) | 65.5 | 92.8 | (194.8 | ) | 158.4 | 63.0 | ||||||||||||||
Net business profit before credit costs | 88.6 | 92.8 | 93.2 | 127.2 | 148.8 | |||||||||||||||
|
|
|
|
|
|
|
|
|
| |||||||||||
| (*) | Including temporary losses of JPY164.2bn due to sales on Japanese stock related investments. |
(Reference) Estimated taxable income for further 5 years
| Billions of Yen | ||||
Projected amount of net business profit before credit costs used for the estimation (Sum of 5 years) | 537.2 | |||
Projected amount of net income used for the estimation (Sum of 5 years) | 435.3 | |||
Estimated amount of taxable income before adjustments (Sum of 5 years) | 460.4 | |||
|
| |||
| (*) | Estimated amounts of taxable income before adjustments shown above are calculated conservatively, based on revenue projections of 5 years that address uncertainty in each of these future fiscal years. |
[STB Non-consolidated]
(1) Basic policy
STB applies to the company of which performances of past fiscal years are stable. Thus, the item 2 of the practical guideline, “ Treatment for audit of recoverability of deferred tax assets” is applicable. And net deferred tax assets are posted based on the result of tax planning with regard to temporally difference.
| Billions of Yen | ||||||||||||||||||||
| FY2010 | FY2009 | FY2008 | FY2007 | FY2006 | ||||||||||||||||
Taxable income before deduction of loss carry forwards | 42.6 | (3.0 | ) | 86.8 | 144.6 | 199.2 | ||||||||||||||
Net business profit before credit costs | 129.7 | 175.4 | 201.0 | 173.8 | 175.9 | |||||||||||||||
|
|
|
|
|
|
|
|
|
| |||||||||||
16
Table of Contents
Sumitomo Mitsui Trust Holdings, Inc.

17
Table of Contents
Cautionary Statement Regarding Forward-Looking Statements
This material contains forward-looking statements (as defined in the U.S. Private Securities Litigation Reform Act of 1995) regarding our intent, belief or current expectations in respect to our future financial conditions, operating results and overall management. These forward-looking statements may be identified by words such as “believes”, “expects”, “anticipates”, “projects”, “intends”, “should”, “seeks”, “estimates”, “future”, or similar expressions or by discussion of, among other things, strategy, goals, plans or intentions. Such forward-looking statements are not guarantees of future performance and actual results may differ, owing to risks and uncertainties, including without limitation: (1) potential difficulties in integrating the management and business operations of our subsidiaries; (2) our ability to successfully execute our group business strategies; and (3) unanticipated events that result in an increase in our credit costs and a deterioration in the quality of our group companies’ loan portfolios. Given such risks and uncertainties, you should not place undue reliance on forward-looking statements, which speak only as of the release date of this material. We undertake no obligation to update or revise any forward-looking statements. In addition to this material, please refer to our most recently disclosed documents, such as our annual report on Form 20-F filed with the U.S. Securities and Exchange Commission, or press releases we have issued, for a more detailed description of matters that may affect our financial condition and operating results.
18
Table of Contents

Supplemental material on financial results
2nd Quarter of Fiscal Year 2011 ended on Sep. 30 2011
Table of Contents
<Definition of terms in this documents>
| SMTH: Sumitomo Mitsui Trust Holdings, Inc. | CMTH: Former Chuo Mitsui Trust Holdings, Inc. | |
| CMTB: The Chuo Mitsui Trust and Banking Company, Limited | CMAB: Chuo Mitsui Asset Trust and Banking Company, Limited | |
| STB: The Sumitomo Trust and Banking, Co., Ltd. | ||
Legal Disclaimer
Regarding forward-looking Statements contained in this material
This presentation material contains information that constitutes forward-looking statements. Such forward-looking statements are not guarantees of future performance and involve risks and uncertainties, and actual results may differ from those in the forward-looking statements as a result of various factors including but not limited to changes in managerial circumstances. By virtue of the aforementioned reasons, The Sumitomo Trust and Banking Co., Ltd. (referred to hereinafter as “Sumitomo Trust”) hereby cautions against sole reliance on such forward-looking statements in making investment decisions.
Table of Contents
1. Breakdown of profit by business group
(1) Gross business profit before credit costs
[Non-consolidated (CMTB + CMAB + STB)]
| Billions of Yen | ||||||||||||||||||||||||||||
| 1HFY2011 | 1HFY2010 | Change | ||||||||||||||||||||||||||
| Total | CM (*1) | STB | Total | Total | CM (*1) | STB | ||||||||||||||||||||||
Retail financial services | 70.7 | 37.4 | 33.3 | 73.2 | (2.4 | ) | 0.5 | (2.9 | ) | |||||||||||||||||||
Wholesale financial services | 72.8 | 26.4 | 46.3 | 73.8 | (1.0 | ) | (1.7 | ) | 0.7 | |||||||||||||||||||
Stock transfer agency services | 16.5 | 9.3 | 7.1 | 16.8 | (0.3 | ) | (0.2 | ) | (0.0 | ) | ||||||||||||||||||
Treasury and financial products | 80.8 | 29.5 | 51.2 | 58.3 | 22.4 | (5.2 | ) | 27.6 | ||||||||||||||||||||
Fiduciary services | 42.9 | 19.6 | 23.3 | 42.8 | 0.1 | 0.1 | 0.0 | |||||||||||||||||||||
Real estate | 7.5 | 3.3 | 4.2 | 13.1 | (5.5 | ) | (3.2 | ) | (2.2 | ) | ||||||||||||||||||
Fees paid for outsourcing | (20.0 | ) | (8.5 | ) | (11.5 | ) | (19.8 | ) | (0.1 | ) | (0.2 | ) | 0.0 | |||||||||||||||
Stock transfer agency services | (7.6 | ) | (3.9 | ) | (3.7 | ) | (7.6 | ) | 0.0 | (0.1 | ) | 0.1 | ||||||||||||||||
Fiduciary services | (12.3 | ) | (4.6 | ) | (7.7 | ) | (12.1 | ) | (0.1 | ) | (0.1 | ) | (0.0 | ) | ||||||||||||||
Others (*2) | (4.1 | ) | 0.1 | (4.2 | ) | (0.9 | ) | (3.1 | ) | 2.2 | (5.3 | ) | ||||||||||||||||
|
|
|
|
|
|
|
|
|
|
|
|
|
| |||||||||||||||
Gross business profit before credit costs | 250.8 | 108.0 | 142.7 | 240.6 | 10.1 | (7.6 | ) | 17.7 | ||||||||||||||||||||
|
|
|
|
|
|
|
|
|
|
|
|
|
| |||||||||||||||
| (*1) | Combined figures of CMTB and CMAB. Figures of CM are tentative calculations based on certain assumptions (transferpricing, etc.) under managerial accounting. |
| (*2) | Net of dividend income, cost of capital sourcing and head office expense is included. |
1
Table of Contents
(2) Net business profit before credit costs
[Consolidated]
| Billions of Yen | ||||||||||||
| 1HFY2011 (*1) | 1HFY2010 (*1) | Change | ||||||||||
Retail financial services | 14.0 | 16.2 | (2.1 | ) | ||||||||
Wholesale financial services | 61.7 | 63.4 | (1.6 | ) | ||||||||
Stock transfer agency services | 8.0 | 8.1 | (0.0 | ) | ||||||||
Treasury and financial products | 75.0 | 52.9 | 22.1 | |||||||||
Fiduciary services | 22.6 | 22.4 | 0.1 | |||||||||
Real estate | 2.9 | 8.6 | (5.6 | ) | ||||||||
Others (*2) | (0.9 | ) | (15.1 | ) | 14.2 | |||||||
|
|
|
|
|
| |||||||
Net business profit before credit costs | 175.6 | 148.5 | 27.0 | |||||||||
|
|
|
|
|
| |||||||
| (*1) | Consolidated figures are tentative calculations based on certain assumptions (transferpricing, etc.) under managerial accounting. |
| (*2) | Net of dividend income, cost of capital sourcing and head office expense is included. |
[Non-consolidated (CMTB + CMAB + STB)]
| Billions of Yen | ||||||||||||||||||||||||||||
| 1HFY2011 | 1HFY2010 | Change | ||||||||||||||||||||||||||
| Total | CM (*3) | STB | Total | Total | CM (*3) | STB | ||||||||||||||||||||||
Retail financial services | 9.4 | 6.8 | 2.5 | 11.7 | (2.3 | ) | 0.5 | (2.9 | ) | |||||||||||||||||||
Wholesale financial services | 47.3 | 16.1 | 31.2 | 48.7 | (1.3 | ) | (1.9 | ) | 0.5 | |||||||||||||||||||
Stock transfer agency services | 7.3 | 4.4 | 2.8 | 7.6 | (0.2 | ) | (0.3 | ) | 0.0 | |||||||||||||||||||
Treasury and financial products | 75.0 | 28.4 | 46.6 | 52.9 | 22.1 | (5.2 | ) | 27.4 | ||||||||||||||||||||
Fiduciary services | 16.0 | 7.8 | 8.1 | 16.3 | (0.3 | ) | (0.3 | ) | 0.0 | |||||||||||||||||||
Real estate | 2.5 | 1.1 | 1.4 | 7.9 | (5.3 | ) | (3.2 | ) | (2.1 | ) | ||||||||||||||||||
Others (*4) | (20.9 | ) | (9.1 | ) | (11.7 | ) | (18.0 | ) | (2.9 | ) | 2.1 | (5.1 | ) | |||||||||||||||
|
|
|
|
|
|
|
|
|
|
|
|
|
| |||||||||||||||
Net business profit before credit costs | 129.5 | 51.2 | 78.2 | 119.7 | 9.8 | (8.0 | ) | 17.8 | ||||||||||||||||||||
|
|
|
|
|
|
|
|
|
|
|
|
|
| |||||||||||||||
| (*3) | Combined figures of CMTB and CMAB. Figures of CM are tentative calculations based on certain assumptions (transferpricing, etc.) under managerial accounting. |
| (*4) | Net of dividend income, cost of capital sourcing and head office expense is included. |
2
Table of Contents
[Consolidated]
| Millions of Yen | ||||||||||||||||||||||||
| Sep. 2011 | Mar. 2011 | Change | Sep. 2011 | Mar. 2011 | Change | |||||||||||||||||||
| (Banking a/c and Principal guaranteed trust a/c combined) | (Banking a/c) | |||||||||||||||||||||||
Risk monitored loans | 278,879 | 283,870 | (4,990 | ) | 233,683 | 259,779 | (26,095 | ) | ||||||||||||||||
Loans in bankruptcy proceedings | 20,111 | 27,259 | (7,147 | ) | 20,098 | 27,245 | (7,146 | ) | ||||||||||||||||
Other delinquent loans | 170,746 | 129,839 | 40,906 | 126,027 | 114,115 | 11,911 | ||||||||||||||||||
Loans past due 3 months or more | 263 | 43 | 220 | 263 | 43 | 220 | ||||||||||||||||||
Restructured loans | 87,757 | 126,728 | (38,971 | ) | 87,293 | 118,375 | (31,081 | ) | ||||||||||||||||
|
|
|
|
|
|
|
|
|
|
|
| |||||||||||||
Total loan balance | 20,932,626 | 21,061,240 | (128,614 | ) | 20,561,278 | 20,659,253 | (97,975 | ) | ||||||||||||||||
|
|
|
|
|
|
|
|
|
|
|
| |||||||||||||
(Ratio to total loan balance) | 1.3 | % | 1.3 | % | (0.0 | %) | 1.1 | % | 1.3 | % | (0.2 | %) | ||||||||||||
|
|
|
|
|
|
|
|
|
|
|
| |||||||||||||
| (*) | Partial direct written-off: Sep. 2011: 73,272 millions yen, Mar. 2011: 81,231 million yen |
[Non-consolidated (CMTB + STB)]
| Millions of Yen | ||||||||||||||||||||||||||||
| (Banking a/c and Principal guaranteed trust a/c combined) | Sep. 2011 | Mar. 2011 | Change | |||||||||||||||||||||||||
| Total | CMTB | STB | Total | Total | CMTB | STB | ||||||||||||||||||||||
Risk monitored loans | 232,389 | 95,943 | 136,445 | 236,808 | (4,419 | ) | 7,752 | (12,172 | ) | |||||||||||||||||||
|
|
|
|
|
|
|
|
|
|
|
|
|
| |||||||||||||||
Loans in bankruptcy proceedings | 17,995 | 3,661 | 14,334 | 24,512 | (6,517 | ) | (6,340 | ) | (176 | ) | ||||||||||||||||||
Other delinquent loans | 141,271 | 71,181 | �� | 70,089 | 101,956 | 39,314 | 21,221 | 18,092 | ||||||||||||||||||||
Loans past due 3 months or more | 263 | 263 | — | 43 | 220 | 220 | — | |||||||||||||||||||||
Restructured loans | 72,858 | 20,836 | 52,021 | 110,296 | (37,438 | ) | (7,349 | ) | (30,088 | ) | ||||||||||||||||||
|
|
|
|
|
|
|
|
|
|
|
|
|
| |||||||||||||||
Total loan balance | 21,246,558 | 9,062,027 | 12,184,530 | 21,417,258 | (170,700 | ) | (22,266 | ) | (148,433 | ) | ||||||||||||||||||
|
|
|
|
|
|
|
|
|
|
|
|
|
| |||||||||||||||
(Ratio to total loan balance) | 1.1 | % | 1.1 | % | 1.1 | % | 1.1 | % | (0.0 | %) | 0.1 | % | (0.1 | %) | ||||||||||||||
|
|
|
|
|
|
|
|
|
|
|
|
|
| |||||||||||||||
Note: CMTB’s partial direct written-off: Sep. 2011: 14,317 million yen, Mar. 2011: 19,041 million yen
STB’s partial direct written-off: Sep. 2011: 35,901 billion yen, Mar. 2011: 38,014 million yen
| Millions of Yen | ||||||||||||||||||||||||||||
| (Banking a/c) | Sep. 2011 | Mar. 2011 | Change | |||||||||||||||||||||||||
| Total | CMTB | STB | Total | Total | CMTB | STB | ||||||||||||||||||||||
Risk monitored loans | 187,193 | 66,063 | 121,130 | 212,718 | (25,524 | ) | (14,116 | ) | (11,408 | ) | ||||||||||||||||||
|
|
|
|
|
|
|
|
|
|
|
|
|
| |||||||||||||||
Loans in bankruptcy proceedings | 17,982 | 3,648 | 14,334 | 24,499 | (6,516 | ) | (6,340 | ) | (176 | ) | ||||||||||||||||||
Other delinquent loans | 96,552 | 41,314 | 55,237 | 86,233 | 10,319 | (8,492 | ) | 18,811 | ||||||||||||||||||||
Loans past due 3 months or more | 263 | 263 | — | 43 | 220 | 220 | — | |||||||||||||||||||||
Restructured loans | 72,394 | 20,836 | 51,558 | 101,942 | (29,548 | ) | 495 | (30,043 | ) | |||||||||||||||||||
|
|
|
|
|
|
|
|
|
|
|
|
|
| |||||||||||||||
Total loan balance | 20,875,210 | 8,845,801 | 12,029,408 | 21,015,271 | (140,061 | ) | (15,776 | ) | (124,284 | ) | ||||||||||||||||||
|
|
|
|
|
|
|
|
|
|
|
|
|
| |||||||||||||||
(Ratio to total loan balance) | 0.9 | % | 0.7 | % | 1.0 | % | 1.0 | % | (0.1 | %) | (0.2 | %) | (0.1 | %) | ||||||||||||||
|
|
|
|
|
|
|
|
|
|
|
|
|
| |||||||||||||||
3
Table of Contents
(Trust a/c)
| Millions of Yen | ||||||||||||||||||||||||||||
| Sep. 2011 | Mar. 2011 | Change | ||||||||||||||||||||||||||
| Total | CMTB | STB | Total | Total | CMTB | STB | ||||||||||||||||||||||
Risk monitored loans | 45,195 | 29,880 | 15,315 | 24,090 | 21,105 | 21,869 | (764 | ) | ||||||||||||||||||||
|
|
|
|
|
|
|
|
|
|
|
|
|
| |||||||||||||||
Loans in bankruptcy proceedings | 13 | 13 | — | 13 | (0 | ) | (0 | ) | — | |||||||||||||||||||
Other delinquent loans | 44,718 | 29,867 | 14,851 | 15,723 | 28,995 | 29,713 | (718 | ) | ||||||||||||||||||||
Loans past due 3 months or more | — | — | — | — | — | — | — | |||||||||||||||||||||
Restructured loans | 463 | — | 463 | 8,353 | (7,889 | ) | (7,844 | ) | (45 | ) | ||||||||||||||||||
|
|
|
|
|
|
|
|
|
|
|
|
|
| |||||||||||||||
Total loan balance | 371,348 | 216,226 | 155,122 | 401,987 | (30,639 | ) | (6,489 | ) | (24,149 | ) | ||||||||||||||||||
|
|
|
|
|
|
|
|
|
|
|
|
|
| |||||||||||||||
(Ratio to total loan balance) | 12.2 | % | 13.8 | % | 9.9 | % | 6.0 | % | 6.2 | % | 10.2 | % | 0.9 | % | ||||||||||||||
|
|
|
|
|
|
|
|
|
|
|
|
|
| |||||||||||||||
| (*) | Trust a/c is principal guaranteed trust a/c |
(2) Risk monitored loans by industry (Banking a/c and Principal guaranteed trust a/c combined)
[Non-consolidated (CMTB + STB)]
| Millions of Yen | ||||||||||||||||||||||||||||
| Sep. 2011 | Mar. 2011 | Change | ||||||||||||||||||||||||||
| Total | CMTB | STB | Total | Total | CMTB | STB | ||||||||||||||||||||||
Domestic Branches (excluding offshore) | 230,064 | 95,943 | 134,120 | 233,938 | (3,874 | ) | 7,978 | (11,852 | ) | |||||||||||||||||||
|
|
|
|
|
|
|
|
|
|
|
|
|
| |||||||||||||||
Manufacturing | 18,566 | 884 | 17,682 | 23,151 | (4,584 | ) | (2,379 | ) | (2,205 | ) | ||||||||||||||||||
Agriculture, forestry, fisheries, mining, quarrying of stone and gravel gathering | — | — | — | 64 | (64 | ) | — | (64 | ) | |||||||||||||||||||
Construction | 1,683 | 975 | 708 | 1,820 | (137 | ) | (219 | ) | 82 | |||||||||||||||||||
Electricity, gas, heat supply and water | 192 | 192 | — | 1,362 | (1,170 | ) | — | (1,170 | ) | |||||||||||||||||||
Information and communications | 3,246 | 338 | 2,907 | 13,652 | (10,405 | ) | (63 | ) | (10,341 | ) | ||||||||||||||||||
Transport and postal activities | 2,180 | 929 | 1,250 | 1,753 | 426 | 143 | 282 | |||||||||||||||||||||
Wholesale and retail trade | 3,462 | 2,036 | 1,425 | 5,925 | (2,463 | ) | (2,272 | ) | (190 | ) | ||||||||||||||||||
Finance and insurance | 78,744 | 35,741 | 43,002 | 72,584 | 6,159 | 21,995 | (15,835 | ) | ||||||||||||||||||||
Real estate | 52,925 | 17,090 | 35,834 | 62,411 | (9,486 | ) | (7,338 | ) | (2,147 | ) | ||||||||||||||||||
Goods rental and leasing | 56 | 56 | — | 69 | (13 | ) | (13 | ) | — | |||||||||||||||||||
Others | 69,007 | 37,698 | 31,309 | 51,143 | 17,864 | (1,873 | ) | 19,737 | ||||||||||||||||||||
|
|
|
|
|
|
|
|
|
|
|
|
|
| |||||||||||||||
Overseas branches and offshore | 2,324 | — | 2,324 | 2,870 | (545 | ) | (226 | ) | (319 | ) | ||||||||||||||||||
|
|
|
|
|
|
|
|
|
|
|
|
|
| |||||||||||||||
Total | 232,389 | 95,943 | 136,445 | 236,808 | (4,419 | ) | 7,752 | (12,172 | ) | |||||||||||||||||||
|
|
|
|
|
|
|
|
|
|
|
|
|
| |||||||||||||||
Note: Above table is made based on the categorization of “Survey on loans by industry” of Bank of Japan.
4
Table of Contents
(3) Problem assets based on the Financial Reconstruction Act (After partial direct written-off)
[Consolidated]
(Banking a/c)
| Millions of Yen | ||||||||||||
| Sep. 2011 | Mar. 2011 | Change | ||||||||||
Problem assets based on the Financial Reconstruction Act (a) | 255,129 | 280,285 | (25,156 | ) | ||||||||
|
|
|
|
|
| |||||||
Bankrupt and practically bankrupt | 42,208 | 57,926 | (15,718 | ) | ||||||||
Doubtful | 125,363 | 103,940 | 21,423 | |||||||||
Substandard | 87,557 | 118,418 | (30,860 | ) | ||||||||
|
|
|
|
|
| |||||||
Ordinary assets | 21,968,736 | 22,118,429 | (149,692 | ) | ||||||||
|
|
|
|
|
| |||||||
Total balance (b) | 22,223,866 | 22,398,714 | (174,848 | ) | ||||||||
|
|
|
|
|
| |||||||
(Ratio to total balance (a) / (b)) | 1.1 | % | 1.3 | % | (0.2 | %) | ||||||
|
|
|
|
|
| |||||||
Note 1: Partial direct written-off: Sep. 2011: 78,350 million yen, Mar. 2011: 85,491 million yen
Note 2: Figures for Banking a/c and Principal guaranteed trust a/c combined, please refer to “Explanatory Material 2nd Quarter of Fiscal Year 2011 ended on Sep. 30, 2011”.
[Non-consolidated (CMTB + STB)]
(Banking a/c)
| Millions of Yen | ||||||||||||||||||||||||||||
| Sep. 2011 | Mar. 2011 | Change | ||||||||||||||||||||||||||
| Total | CMTB | STB | Total | Total | CMTB | STB | ||||||||||||||||||||||
Problem assets based on the Financial Reconstruction Act (a) | 195,597 | 67,298 | 128,299 | 221,163 | (25,566 | ) | (14,290 | )�� | (11,276 | ) | ||||||||||||||||||
|
|
|
|
|
|
|
|
|
|
|
|
|
| |||||||||||||||
Bankrupt and practically bankrupt | 33,702 | 10,773 | 22,928 | 41,196 | (7,494 | ) | (6,553 | ) | (940 | ) | ||||||||||||||||||
Doubtful | 89,236 | 35,424 | 53,812 | 77,980 | 11,256 | (8,451 | ) | 19,707 | ||||||||||||||||||||
Substandard (b) | 72,658 | 21,100 | 51,558 | 101,985 | (29,327 | ) | 715 | (30,043 | ) | |||||||||||||||||||
|
|
|
|
|
|
|
|
|
|
|
|
|
| |||||||||||||||
Ordinary assets | 21,358,964 | 8,974,704 | 12,384,260 | 21,450,047 | (91,082 | ) | (3,338 | ) | (87,744 | ) | ||||||||||||||||||
|
|
|
|
|
|
|
|
|
|
|
|
|
| |||||||||||||||
Substandard debtors (excluding Substandard) (c) | 36,009 | 706 | 35,302 | 28,148 | 7,861 | 126 | 7,735 | |||||||||||||||||||||
Other special mention debtors (*1) | 678,752 | 279,515 | 399,237 | 707,196 | (28,443 | ) | (55,362 | ) | 26,918 | |||||||||||||||||||
Ordinary debtors | 20,644,202 | 8,694,482 | 11,949,720 | 20,714,702 | (70,499 | ) | 51,898 | (122,398 | ) | |||||||||||||||||||
|
|
|
|
|
|
|
|
|
|
|
|
|
| |||||||||||||||
Total balance (d) | 21,554,562 | 9,042,002 | 12,512,560 | 21,671,211 | (116,648 | ) | (17,628 | ) | (99,020 | ) | ||||||||||||||||||
|
|
|
|
|
|
|
|
|
|
|
|
|
| |||||||||||||||
(Ratio to total balance (a) / (d)) | 0.9 | % | 0.7 | % | 1.0 | % | 1.0 | % | (0.1 | %) | (0.2 | %) | (0.1 | %) | ||||||||||||||
|
|
|
|
|
|
|
|
|
|
|
|
|
| |||||||||||||||
Assets to substandard debtors (b) + (c) | 108,667 | 21,807 | 86,860 | 130,134 | (21,466 | ) | 841 | (22,308 | ) | |||||||||||||||||||
|
|
|
|
|
|
|
|
|
|
|
|
|
| |||||||||||||||
Note: | CMTB’s partial direct written-off: Sep. 2011: 14,520 million yen, Mar. 2011: 19,319 million yen | |
| STB’s partial direct written-off: Sep. 2011: 35,901 billion yen, Mar. 2011: 38,014 million yen | ||
(Principal guaranteed trust a/c)
| Millions of Yen | ||||||||||||||||||||||||||||
| Sep. 2011 | Mar. 2011 | Change | ||||||||||||||||||||||||||
| Total | CMTB | STB | Total | Total | CMTB | STB | ||||||||||||||||||||||
Problem assets based on the Financial Reconstruction Act (a) | 45,195 | 29,880 | 15,315 | 24,090 | 21,105 | 21,869 | (764 | ) | ||||||||||||||||||||
|
|
|
|
|
|
|
|
|
|
|
|
|
| |||||||||||||||
Bankrupt and practically bankrupt | 40 | 13 | 26 | 55 | (15 | ) | (0 | ) | (15 | ) | ||||||||||||||||||
Doubtful | 44,691 | 29,867 | 14,824 | 15,681 | 29,010 | 29,713 | (703 | ) | ||||||||||||||||||||
Substandard (b) | 463 | — | 463 | 8,353 | (7,889 | ) | (7,844 | ) | (45 | ) | ||||||||||||||||||
|
|
|
|
|
|
|
|
|
|
|
|
|
| |||||||||||||||
Ordinary assets | 326,152 | 186,346 | 139,806 | 377,896 | (51,744 | ) | (28,358 | ) | (23,385 | ) | ||||||||||||||||||
|
|
|
|
|
|
|
|
|
|
|
|
|
| |||||||||||||||
Substandard debtors (excluding Substandard) (c) | 30 | — | 30 | 32 | (1 | ) | — | (1 | ) | |||||||||||||||||||
Other special mention debtors (*1) | 11,774 | 8,392 | 3,382 | 4,037 | 7,737 | 8,292 | (555 | ) | ||||||||||||||||||||
Ordinary debtors | 314,347 | 177,953 | 136,393 | 373,826 | (59,479 | ) | (36,650 | ) | (22,828 | ) | ||||||||||||||||||
|
|
|
|
|
|
|
|
|
|
|
|
|
| |||||||||||||||
Total balance (d) | 371,348 | 216,226 | 155,122 | 401,987 | (30,639 | ) | (6,489 | ) | (24,149 | ) | ||||||||||||||||||
|
|
|
|
|
|
|
|
|
|
|
|
|
| |||||||||||||||
(Ratio to total balance (a) / (d)) | 12.2 | % | 13.8 | % | 9.9 | % | 6.0 | % | 6.2 | % | 10.2 | % | 0.9 | % | ||||||||||||||
|
|
|
|
|
|
|
|
|
|
|
|
|
| |||||||||||||||
Assets to substandard debtors (b) + (c) | 494 | — | 494 | 8,386 | (7,891 | ) | (7,844 | ) | (47 | ) | ||||||||||||||||||
|
|
|
|
|
|
|
|
|
|
|
|
|
| |||||||||||||||
Note: Figures for Banking a/c and Principal guaranteed trust a/c combined, please refer to “Explanatory Material 2nd Quarter of Fiscal Year 2011 ended on Sep. 30, 2011”.
5
Table of Contents
(4) Migration analysis of assets to special mention or worse categories (Banking a/c and Principal guaranteed trust a/c combined)
[Non-consolidated (CMTB + STB)]
| Billions of Yen | ||||||||||||||||||||||||||||||||
| Balance | Migration of (A) | |||||||||||||||||||||||||||||||
| Mar. 2011 | Sep. 2011 | Change (A) | Downgrade (+) | Downgrade (-) | Upgrade (+) | Upgrade (-) | Repayment, etc. | |||||||||||||||||||||||||
Bankrupt and practically bankrupt | 41.3 | 33.7 | (7.5 | ) | 3.3 | — | — | (3.8 | ) | (7.0 | ) | |||||||||||||||||||||
Doubtful | 93.7 | 133.9 | 40.3 | 63.0 | (1.2 | ) | 1.4 | (12.1 | ) | (10.8 | ) | |||||||||||||||||||||
Assets to substandard debtor | 138.5 | 109.2 | (29.4 | ) | 9.4 | (9.5 | ) | 1.0 | (20.1 | ) | (10.1 | ) | ||||||||||||||||||||
Other special mention | 711.2 | 690.5 | (20.7 | ) | 223.0 | (19.4 | ) | 14.4 | (165.9 | ) | (72.9 | ) | ||||||||||||||||||||
|
|
|
|
|
|
|
|
|
|
|
|
|
|
|
| |||||||||||||||||
[CMTB] | ||||||||||||||||||||||||||||||||
| Billions of Yen | ||||||||||||||||||||||||||||||||
| Balance | Migration of (A) | |||||||||||||||||||||||||||||||
| Mar. 2011 | Sep. 2011 | Change (A) | Downgrade (+) | Downgrade (-) | Upgrade (+) | Upgrade (-) | Repayment, etc. | |||||||||||||||||||||||||
Bankrupt and practically bankrupt | 17.3 | 10.8 | (6.6 | ) | 2.4 | — | — | (3.1 | ) | (5.8 | ) | |||||||||||||||||||||
Doubtful | 44.0 | 65.3 | 21.3 | 34.9 | (1.0 | ) | 1.3 | (10.4 | ) | (3.5 | ) | |||||||||||||||||||||
Assets to substandard debtor | 28.8 | 21.8 | (7.0 | ) | 7.4 | (8.1 | ) | 0.5 | (6.1 | ) | (0.7 | ) | ||||||||||||||||||||
Other special mention | 335.0 | 287.9 | (47.1 | ) | 100.3 | (7.1 | ) | 9.8 | (137.5 | ) | (12.6 | ) | ||||||||||||||||||||
|
|
|
|
|
|
|
|
|
|
|
|
|
|
|
| |||||||||||||||||
[STB] | ||||||||||||||||||||||||||||||||
| Billions of Yen | ||||||||||||||||||||||||||||||||
| Balance | Migration of (A) | |||||||||||||||||||||||||||||||
| Mar. 2011 | Sep. 2011 | Change (A) | Downgrade (+) | Downgrade (-) | Upgrade (+) | Upgrade (-) | Repayment, etc. | |||||||||||||||||||||||||
Bankrupt and practically bankrupt | 23.9 | 23.0 | (1.0 | ) | 0.9 | — | — | (0.6 | ) | (1.2 | ) | |||||||||||||||||||||
Doubtful | 49.6 | 68.6 | 19.0 | 28.1 | (0.2 | ) | 0.1 | (1.7 | ) | (7.3 | ) | |||||||||||||||||||||
Assets to substandard debtor | 109.7 | 87.4 | (22.4 | ) | 1.9 | (1.4 | ) | 0.5 | (14.0 | ) | (9.3 | ) | ||||||||||||||||||||
Other special mention | 376.3 | 402.6 | 26.4 | 122.7 | (12.2 | ) | 4.6 | (28.4 | ) | (60.3 | ) | |||||||||||||||||||||
|
|
|
|
|
|
|
|
|
|
|
|
|
|
|
| |||||||||||||||||
6
Table of Contents
(5) Final disposal of non-performing loans (Banking a/c and Principal guaranteed trust a/c combined)
(i) Loans outstanding in doubtful or worse categories
[Non-consolidated (CMTB + STB)]
Total
| Billions of Yen | ||||||||||||||||||||||||||||||||||||||||
| Sep. 2008 | Mar. 2009 | Sep. 2009 | Mar. 2010 | Sep. 2010 | Mar. 2011 | Sep. 2011 | Change from | |||||||||||||||||||||||||||||||||
| Total | CMTB | STB | Mar. 2011 | |||||||||||||||||||||||||||||||||||||
Loans in bankrupt/ practically bankrupt | 61.4 | 64.7 | 58.7 | 37.4 | 32.2 | 41.3 | 33.7 | 10.8 | 23.0 | (7.5 | ) | |||||||||||||||||||||||||||||
Doubtful loans | 103.1 | 159.5 | 339.6 | 138.3 | 112.6 | 93.7 | 133.9 | 65.3 | 68.6 | 40.3 | ||||||||||||||||||||||||||||||
Total | 164.5 | 224.1 | 398.4 | 175.8 | 144.8 | 134.9 | 167.7 | 76.1 | 91.6 | 32.8 | ||||||||||||||||||||||||||||||
|
|
|
|
|
|
|
|
|
|
|
|
|
|
|
|
|
|
|
| |||||||||||||||||||||
| Loans outstanding in doubtful or worse categories as of Sep. 2008 and disposal thereafter | ||||||||||||||||||||||||||||||||||||||||
Loans in bankrupt/ practically bankrupt | 61.4 | 44.8 | 39.7 | 18.8 | 17.5 | 17.2 | 9.7 | 3.3 | 6.4 | (7.5 | ) | |||||||||||||||||||||||||||||
Doubtful loans | 103.1 | 78.8 | 59.6 | 61.5 | 40.6 | 35.9 | 32.3 | 16.3 | 16.0 | (3.7 | ) | |||||||||||||||||||||||||||||
Total | 164.5 | 123.6 | 99.3 | 80.3 | 58.1 | 53.1 | 42.0 | 19.6 | 22.4 | (11.1 | ) | |||||||||||||||||||||||||||||
|
|
|
|
|
|
|
|
|
|
|
|
|
|
|
|
|
|
|
| |||||||||||||||||||||
| New entry to doubtful or worse categories during 2HFY2008 and disposal thereafter | ||||||||||||||||||||||||||||||||||||||||
Loans in bankrupt/ practically bankrupt | 19.9 | 13.4 | 9.3 | 1.6 | 0.7 | 0.4 | 0.3 | 0.1 | (0.3 | ) | ||||||||||||||||||||||||||||||
Doubtful loans | 80.6 | 44.7 | 13.2 | 6.6 | 5.5 | 3.8 | 2.8 | 1.0 | (1.8 | ) | ||||||||||||||||||||||||||||||
Total | 100.5 | 58.0 | 22.4 | 8.3 | 6.2 | 4.2 | 3.1 | 1.1 | (2.1 | ) | ||||||||||||||||||||||||||||||
|
|
|
|
|
|
|
|
|
|
|
|
|
|
|
|
|
| |||||||||||||||||||||||
New entry to doubtful or worse categories during 1HFY2009 and disposal thereafter |
| |||||||||||||||||||||||||||||||||||||||
Loans in bankrupt/ practically bankrupt | 5.7 | 6.5 | 8.2 | 4.2 | 3.7 | 3.6 | 0.1 | (0.5 | ) | |||||||||||||||||||||||||||||||
Doubtful loans | 235.4 | 45.1 | 37.8 | 22.6 | 16.3 | 2.7 | 13.6 | (6.3 | ) | |||||||||||||||||||||||||||||||
Total | 241.1 | 51.6 | 46.0 | 26.7 | 20.0 | 6.3 | 13.7 | (6.8 | ) | |||||||||||||||||||||||||||||||
|
|
|
|
|
|
|
|
|
|
|
|
|
|
|
| |||||||||||||||||||||||||
| New entry to doubtful or worse categories during 2HFY2009 and disposal thereafter | ||||||||||||||||||||||||||||||||||||||||
Loans in bankrupt/ practically bankrupt | 2.9 | 2.7 | 1.5 | 0.8 | 0.6 | 0.2 | (0.7 | ) | ||||||||||||||||||||||||||||||||
Doubtful loans | 18.5 | 10.5 | 9.7 | 6.0 | 2.2 | 3.8 | (3.8 | ) | ||||||||||||||||||||||||||||||||
Total | 21.5 | 13.2 | 11.2 | 6.7 | 2.8 | 4.0 | (4.5 | ) | ||||||||||||||||||||||||||||||||
|
|
|
|
|
|
|
|
|
|
|
|
|
| |||||||||||||||||||||||||||
| New entry to doubtful or worse categories during 1HFY2010 and disposal thereafter | ||||||||||||||||||||||||||||||||||||||||
Loans in bankrupt/ practically bankrupt | 2.1 | 1.8 | 1.0 | 0.8 | 0.2 | (0.8 | ) | |||||||||||||||||||||||||||||||||
Doubtful loans | 17.1 | 8.6 | 7.3 | 2.8 | 4.6 | (1.3 | ) | |||||||||||||||||||||||||||||||||
Total | 19.2 | 10.4 | 8.3 | 3.5 | 4.8 | (2.0 | ) | |||||||||||||||||||||||||||||||||
|
|
|
|
|
|
|
|
|
|
|
| |||||||||||||||||||||||||||||
| New entry to doubtful or worse categories during 2HFY2010 and disposal thereafter | ||||||||||||||||||||||||||||||||||||||||
Loans in bankrupt/ practically bankrupt | 15.9 | 16.0 | 0.9 | 15.1 | 0.1 | |||||||||||||||||||||||||||||||||||
Doubtful loans | 11.3 | 5.3 | 3.7 | 1.6 | (6.0 | ) | ||||||||||||||||||||||||||||||||||
Total | 27.2 | 21.3 | 4.6 | 16.7 | (5.9 | ) | ||||||||||||||||||||||||||||||||||
|
|
|
|
|
|
|
|
|
| |||||||||||||||||||||||||||||||
| New entry to doubtful or worse categories during 1HFY2011 and disposal thereafter | ||||||||||||||||||||||||||||||||||||||||
Loans in bankrupt/ practically bankrupt | 2.2 | 1.4 | 0.7 | 2.2 | ||||||||||||||||||||||||||||||||||||
Doubtful loans | 63.0 | 34.9 | 28.1 | 63.0 | ||||||||||||||||||||||||||||||||||||
Total | 65.2 | 36.3 | 28.8 | 65.2 | ||||||||||||||||||||||||||||||||||||
|
|
|
|
|
|
|
| |||||||||||||||||||||||||||||||||
(ii) Progress of final disposal
[Non-consolidated (CMTB + STB)]
(Billions of Yen)
Period | Primary amount (A) | Amount as of Sep. 2011 (B) | Quasi final disposal or in the process of final disposal (C) (Less) | Amount of final disposal during 1HFY2011 (Less) | Ratio of final disposal progression (A-B)/A (%) | Adjusted ratio of final disposal progression (A-B+C)/A (%) (*) | ||||||||||||||||||
Before 1HFY2008 | 2,903.9 | 42.0 | 8.5 | 10.8 | 98.6 | 98.8 | ||||||||||||||||||
2HFY2008 | 100.5 | 4.2 | 0.1 | 2.0 | 95.8 | 96.0 | ||||||||||||||||||
1HFY2009 | 241.1 | 20.0 | 3.5 | 6.7 | 91.7 | 93.2 | ||||||||||||||||||
2HFY2009 | 21.5 | 6.7 | 0.2 | 4.5 | 68.6 | 69.4 | ||||||||||||||||||
1HFY2010 | 19.2 | 8.3 | 0.1 | 2.0 | 56.6 | 57.3 | ||||||||||||||||||
2HFY2010 | 27.2 | 21.3 | 14.8 | 6.4 | 21.7 | 76.3 | ||||||||||||||||||
1HFY2011 | 65.2 | 65.2 | 0.3 | — | — | 0.4 | ||||||||||||||||||
|
|
|
|
|
|
|
|
|
|
|
| |||||||||||||
Total | — | 167.7 | 27.6 | 32.4 | — | — | ||||||||||||||||||
|
|
|
|
|
|
|
|
|
|
|
| |||||||||||||
| (*) | Ratio of final disposal progression considering quasi final disposal |
7
Table of Contents
3. Capital and total risk-weighted assets (Basel II)
(1) BIS capital adequacy ratio
[CMTB] (Domestic standard)
| < Consolidated > | ||||||||||||
| Billions of Yen | ||||||||||||
| Sep. 2011 (Preliminary) | Mar. 2011 | Change | ||||||||||
Total qualifying capital | 1,033.3 | 1,024.7 | 8.5 | |||||||||
Tier I | 713.6 | 696.4 | 17.1 | |||||||||
Tier II | 331.3 | 343.7 | (12.3 | ) | ||||||||
Deduction (double gearing, etc.) | (11.5 | ) | (15.4 | ) | 3.8 | |||||||
|
|
|
|
|
| |||||||
Total risk-weighted assets | 6,421.2 | 6,622.5 | (201.3 | ) | ||||||||
|
|
|
|
|
| |||||||
BIS capital adequacy ratio | 16.09 | % | 15.47 | % | 0.62 | % | ||||||
(Tier I capital ratio) | 11.11 | % | 10.51 | % | 0.60 | % | ||||||
|
|
|
|
|
| |||||||
Note: Non-consolidated BIS capital adequacy ratio and Tier I capital ratio as of Sep. 2011 are 16.32% and 11.45%, respectively.
[CMAB] (Domestic standard)
| < Non-consolidated > | ||||||||||||
| Billions of Yen | ||||||||||||
| Sep. 2011 (Preliminary) | Mar. 2011 | Change | ||||||||||
Total qualifying capital | 37.4 | 35.2 | 2.1 | |||||||||
Tier I | 37.4 | 35.2 | 2.1 | |||||||||
Tier II | — | — | — | |||||||||
Deduction (double gearing, etc.) | — | — | — | |||||||||
|
|
|
|
|
| |||||||
Total risk-weighted assets | 109.9 | 112.2 | (2.3 | ) | ||||||||
|
|
|
|
|
| |||||||
BIS capital adequacy ratio | 34.04 | % | 31.44 | % | 2.60 | % | ||||||
(Tier I capital ratio) | 34.04 | % | 31.44 | % | 2.60 | % | ||||||
|
|
|
|
|
| |||||||
[STB] (International standard)
| < Consolidated > | ||||||||||||
| Billions of Yen | ||||||||||||
| Sep. 2011 (Preliminary) | Mar. 2011 | Change | ||||||||||
Total qualifying capital | 1,909.2 | 1,880.8 | 28.3 | |||||||||
Tier I | 1,365.1 | 1,333.9 | 31.2 | |||||||||
Tier II | 643.3 | 646.6 | (3.2 | ) | ||||||||
Deduction (double gearing, etc.) | (99.3 | ) | (99.6 | ) | 0.3 | |||||||
|
|
|
|
|
| |||||||
Total risk-weighted assets | 11,354.9 | 12,028.0 | (673.0 | ) | ||||||||
|
|
|
|
|
| |||||||
BIS capital adequacy ratio | 16.81 | % | 15.63 | % | 1.18 | % | ||||||
(Tier I capital ratio) | 12.02 | % | 11.09 | % | 0.93 | % | ||||||
|
|
|
|
|
| |||||||
Note: Non-consolidated BIS capital adequacy ratio and Tier I capital ratio as of Sep. 2011 are 18.11% and 13.05%, respectively.
Note: Risk measurement methodologies are as follows.
CMTB Consolidated, | CMAB Non-consolidated | STB Consolidated, Non-consolidated | ||||
Credit risk | Foundation Internal Ratings-Based Approach | Standardized Approach | Foundation Internal Ratings-Based Approach | |||
Operational risk | Standardized Approach | Standardized Approach | Standardized Approach | |||
Market risk (International standard) | Internal Models Approach | |||||
8
Table of Contents
<Reference> Other referential financial figures
[Non-consolidated (CMTB + CMAB + STB)]
| Billions of Yen | ||||||||||||||||||||||||||||||||||||
| Sep. 2011 | Mar. 2011 | Change | ||||||||||||||||||||||||||||||||||
| Total | CMTB | CMAB | STB | Total | CMTB | CMAB | STB | |||||||||||||||||||||||||||||
Assets: | ||||||||||||||||||||||||||||||||||||
Cash and due from banks | 2,032.8 | 554.3 | 20.9 | 1,457.5 | 1,080.1 | 952.6 | 82.4 | (6.5 | ) | 876.7 | ||||||||||||||||||||||||||
Call loans | 34.0 | — | — | 34.0 | 15.3 | 18.6 | — | — | 18.6 | |||||||||||||||||||||||||||
Receivables under resale agreements | 51.5 | — | — | 51.5 | 33.2 | 18.3 | — | — | 18.3 | |||||||||||||||||||||||||||
Receivables under securities borrowing transactions | 7.7 | 6.7 | — | 1.0 | 9.3 | (1.6 | ) | (2.6 | ) | — | 1.0 | |||||||||||||||||||||||||
Monetary claims bought | 272.9 | 100.0 | — | 172.8 | 292.0 | (19.0 | ) | 0.1 | — | (19.2 | ) | |||||||||||||||||||||||||
Trading assets | 694.3 | 47.1 | — | 647.2 | 678.7 | 15.5 | 10.5 | — | 5.0 | |||||||||||||||||||||||||||
Money held in trust | 22.0 | — | — | 22.0 | 22.2 | (0.1 | ) | — | — | (0.1 | ) | |||||||||||||||||||||||||
Securities | 7,368.5 | 2,960.5 | 30.2 | 4,377.7 | 8,721.5 | (1,352.9 | ) | (721.8 | ) | (58.9 | ) | (572.2 | ) | |||||||||||||||||||||||
Loans and bills discounted | 20,875.2 | 8,845.8 | — | 12,029.4 | 21,015.2 | (140.0 | ) | (15.7 | ) | — | (124.2 | ) | ||||||||||||||||||||||||
Foreign exchanges | 6.6 | 1.0 | — | 5.5 | 17.9 | (11.2 | ) | (11.1 | ) | — | (0.0 | ) | ||||||||||||||||||||||||
Other assets | 1,157.8 | 257.9 | 27.8 | 872.1 | 1,416.7 | (258.8 | ) | (97.5 | ) | (2.0 | ) | (159.2 | ) | |||||||||||||||||||||||
Tangible fixed assets | 219.8 | 96.3 | 0.3 | 123.1 | 214.1 | 5.7 | (2.0 | ) | (0.0 | ) | 7.8 | |||||||||||||||||||||||||
Intangible fixed assets | 55.2 | 19.9 | 3.6 | 31.6 | 51.8 | 3.3 | 0.0 | 0.0 | 3.3 | |||||||||||||||||||||||||||
Deferred tax assets | 222.9 | 138.6 | 3.5 | 80.7 | 220.4 | 2.4 | 4.1 | 0.4 | (2.1 | ) | ||||||||||||||||||||||||||
Customers’ liabilities for acceptances and guarantees | 403.7 | 53.2 | — | 350.5 | 385.8 | 17.8 | 3.5 | — | 14.3 | |||||||||||||||||||||||||||
Allowance for loan losses | (121.2 | ) | (39.9 | ) | — | (81.2 | ) | (127.8 | ) | 6.6 | 2.3 | — | 4.2 | |||||||||||||||||||||||
Allowance for investment loss | (1.1 | ) | — | — | (1.1 | ) | (1.1 | ) | — | — | — | — | ||||||||||||||||||||||||
|
|
|
|
|
|
|
|
|
|
|
|
|
|
|
|
|
| |||||||||||||||||||
Total assets | 33,303.2 | 13,041.8 | 86.5 | 20,174.8 | 34,045.8 | (742.6 | ) | (747.6 | ) | (67.1 | ) | 72.1 | ||||||||||||||||||||||||
|
|
|
|
|
|
|
|
|
|
|
|
|
|
|
|
|
| |||||||||||||||||||
Liabilities: | ||||||||||||||||||||||||||||||||||||
Deposits | 22,182.1 | 9,372.6 | 0.0 | 12,809.4 | 21,639.6 | 542.4 | 36.4 | (0.0 | ) | 505.9 | ||||||||||||||||||||||||||
Negotiable certificates of deposit | 2,766.5 | 318.3 | — | 2,448.2 | 2,627.6 | 138.9 | (51.7 | ) | — | 190.6 | ||||||||||||||||||||||||||
Call money | 406.9 | 110.4 | 39.0 | 257.5 | 409.8 | (2.8 | ) | (138.5 | ) | (64.0 | ) | 199.6 | ||||||||||||||||||||||||
Payables under repurchase agreements | 140.5 | 18.5 | — | 121.9 | 620.8 | (480.3 | ) | 18.5 | — | (498.8 | ) | |||||||||||||||||||||||||
Collateral for lending securities | 648.4 | 648.4 | — | — | 1,320.4 | (672.0 | ) | (513.2 | ) | — | (158.7 | ) | ||||||||||||||||||||||||
Trading liabilities | 179.9 | 10.9 | — | 168.9 | 110.4 | 69.4 | 3.2 | — | 66.1 | |||||||||||||||||||||||||||
Borrowed money | 1,546.0 | 659.4 | — | 886.6 | 1,764.7 | (218.6 | ) | (19.5 | ) | — | (199.0 | ) | ||||||||||||||||||||||||
Foreign exchanges | 0.1 | — | — | 0.1 | 0.0 | 0.0 | — | — | 0.0 | |||||||||||||||||||||||||||
Short-term bonds payable | 253.0 | — | — | 253.0 | 325.7 | (72.6 | ) | — | — | (72.6 | ) | |||||||||||||||||||||||||
Corporate bonds | 740.2 | 262.2 | — | 477.9 | 702.1 | 38.0 | (4.9 | ) | — | 43.0 | ||||||||||||||||||||||||||
Borrowed money from trust account | 1,109.6 | 700.7 | — | 408.9 | 1,233.3 | (123.7 | ) | (100.9 | ) | — | (22.7 | ) | ||||||||||||||||||||||||
Other liabilities | 947.7 | 134.4 | 8.5 | 804.8 | 935.2 | 12.5 | 18.0 | 0.2 | (5.7 | ) | ||||||||||||||||||||||||||
Provision for bonuses | 6.5 | 2.0 | 0.4 | 4.1 | 6.8 | (0.2 | ) | 0.0 | 0.0 | (0.2 | ) | |||||||||||||||||||||||||
Provision for directors’ bonuses | — | — | — | — | 0.0 | (0.0 | ) | — | — | (0.0 | ) | |||||||||||||||||||||||||
Provision for retirement benefits | 0.2 | — | — | 0.2 | 0.2 | (0.0 | ) | — | — | (0.0 | ) | |||||||||||||||||||||||||
Provision for reimbursement of deposits | 6.3 | 5.1 | — | 1.1 | 6.4 | (0.0 | ) | (0.1 | ) | — | 0.0 | |||||||||||||||||||||||||
Provision for contingent loss | 17.7 | 7.3 | — | 10.4 | 18.4 | (0.6 | ) | 0.1 | — | (0.8 | ) | |||||||||||||||||||||||||
Provision for relocation expenses | 9.0 | 0.2 | 0.3 | 8.5 | 5.6 | 3.4 | 0.2 | 0.3 | 2.8 | |||||||||||||||||||||||||||
Deferred tax liabilities for land revaluation | 5.1 | — | — | 5.1 | 5.7 | (0.5 | ) | — | — | (0.5 | ) | |||||||||||||||||||||||||
Acceptances and guarantees | 403.7 | 53.2 | — | 350.5 | 385.8 | 17.8 | 3.5 | — | 14.3 | |||||||||||||||||||||||||||
|
|
|
|
|
|
|
|
|
|
|
|
|
|
|
|
|
| |||||||||||||||||||
Total liabilities | 31,370.3 | 12,304.0 | 48.3 | 19,017.9 | 32,119.3 | (749.0 | ) | (748.8 | ) | (63.4 | ) | 63.1 | ||||||||||||||||||||||||
|
|
|
|
|
|
|
|
|
|
|
|
|
|
|
|
|
| |||||||||||||||||||
Net assets: | ||||||||||||||||||||||||||||||||||||
Capital stock | 752.7 | 399.6 | 11.0 | 342.0 | 752.7 | — | — | — | — | |||||||||||||||||||||||||||
Capital surplus | 466.8 | 149.0 | 21.2 | 296.5 | 467.3 | (0.4 | ) | — | — | (0.4 | ) | |||||||||||||||||||||||||
Legal capital surplus | 412.8 | 149.0 | 21.2 | 242.5 | 412.8 | — | — | — | — | |||||||||||||||||||||||||||
Other capital surplus | 54.0 | — | — | 54.0 | 54.4 | (0.4 | ) | — | — | (0.4 | ) | |||||||||||||||||||||||||
Retained earnings | 748.0 | 220.7 | 5.9 | 521.4 | 719.9 | 28.1 | 9.1 | (3.7 | ) | 22.7 | ||||||||||||||||||||||||||
Legal retained earnings | 105.5 | 49.5 | — | 56.0 | 100.8 | 4.7 | 1.6 | — | 3.1 | |||||||||||||||||||||||||||
Other retained earnings | 642.5 | 171.1 | 5.9 | 465.3 | 619.0 | 23.4 | 7.5 | (3.7 | ) | 19.6 | ||||||||||||||||||||||||||
Reserve for overseas investment loss | 0.0 | — | — | 0.0 | 0.0 | (0.0 | ) | — | — | (0.0 | ) | |||||||||||||||||||||||||
Other voluntary reserve | 371.8 | — | — | 371.8 | 371.8 | — | — | — | — | |||||||||||||||||||||||||||
Retained earnings brought forward | 270.6 | 171.1 | 5.9 | 93.5 | 247.2 | 23.4 | 7.5 | (3.7 | ) | 19.6 | ||||||||||||||||||||||||||
Treasury stock | — | — | — | — | (0.4 | ) | 0.4 | — | — | 0.4 | ||||||||||||||||||||||||||
|
|
|
|
|
|
|
|
|
|
|
|
|
|
|
|
|
| |||||||||||||||||||
Shareholders’ equity | 1,967.6 | 769.4 | 38.1 | 1,160.0 | 1,939.4 | 28.1 | 9.1 | (3.7 | ) | 22.7 | ||||||||||||||||||||||||||
|
|
|
|
|
|
|
|
|
|
|
|
|
|
|
|
|
| |||||||||||||||||||
Valuation difference on available-for-sale securities | (10.2 | ) | (18.3 | ) | (0.0 | ) | 8.0 | (4.3 | ) | (5.8 | ) | (9.0 | ) | 0.0 | 3.2 | |||||||||||||||||||||
Deferred gains or losses on hedges | (2.4 | ) | 3.2 | — | (5.6 | ) | 12.6 | (15.0 | ) | 1.0 | — | (16.1 | ) | |||||||||||||||||||||||
Revaluation reserve for land | (22.0 | ) | (16.5 | ) | — | (5.5 | ) | (21.2 | ) | (0.8 | ) | — | — | (0.8 | ) | |||||||||||||||||||||
|
|
|
|
|
|
|
|
|
|
|
|
|
|
|
|
|
| |||||||||||||||||||
Valuation and translation adjustments | (34.7 | ) | (31.6 | ) | (0.0 | ) | (3.0 | ) | (13.0 | ) | (21.7 | ) | (8.0 | ) | 0.0 | (13.7 | ) | |||||||||||||||||||
|
|
|
|
|
|
|
|
|
|
|
|
|
|
|
|
|
| |||||||||||||||||||
Total net assets | 1,932.8 | 737.7 | 38.1 | 1,156.9 | 1,926.4 | 6.4 | 1.1 | (3.6 | ) | 9.0 | ||||||||||||||||||||||||||
|
|
|
|
|
|
|
|
|
|
|
|
|
|
|
|
|
| |||||||||||||||||||
Total liabilities and net assets | 33,303.2 | 13,041.8 | 86.5 | 20,174.8 | 34,045.8 | (742.6 | ) | (747.6 | ) | (67.1 | ) | 72.1 | ||||||||||||||||||||||||
|
|
|
|
|
|
|
|
|
|
|
|
|
|
|
|
|
| |||||||||||||||||||
9
Table of Contents
[Non-consolidated (CMTB + CMAB + STB)]
Items | Billions of Yen | |||||||||||||||||||||||||||||||||||
| 1HFY2011 | 1HFY2010 | Change | ||||||||||||||||||||||||||||||||||
| Total | CMTB | CMAB | STB | Total | CMTB | CMAB | STB | |||||||||||||||||||||||||||||
Ordinary income | 378.3 | 138.0 | 21.2 | 219.0 | 387.4 | (9.1 | ) | (11.5 | ) | (0.1 | ) | 2.5 | ||||||||||||||||||||||||
|
|
|
|
|
|
|
|
|
|
|
|
|
|
|
|
|
| |||||||||||||||||||
Trust fees | 46.9 | 5.0 | 17.3 | 24.5 | 48.5 | (1.5 | ) | (0.7 | ) | (0.1 | ) | (0.5 | ) | |||||||||||||||||||||||
Interest income | 189.1 | 79.6 | 0.0 | 109.4 | 195.0 | (5.8 | ) | (0.4 | ) | (0.0 | ) | (5.4 | ) | |||||||||||||||||||||||
Interest on loans and discounts | 122.0 | 49.7 | — | 72.3 | 131.5 | (9.4 | ) | (4.6 | ) | — | (4.7 | ) | ||||||||||||||||||||||||
Interest on securities | 60.8 | 27.2 | 0.0 | 33.5 | 52.2 | 8.6 | 4.2 | (0.0 | ) | 4.4 | ||||||||||||||||||||||||||
Fees and commissions | 68.9 | 30.0 | 3.8 | 35.0 | 72.7 | (3.8 | ) | (2.8 | ) | 0.0 | (1.0 | ) | ||||||||||||||||||||||||
Trading income | 3.3 | 1.8 | — | 1.5 | 7.1 | (3.7 | ) | 0.3 | — | (4.1 | ) | |||||||||||||||||||||||||
Other ordinary income | 61.5 | 18.2 | — | 43.3 | 50.7 | 10.7 | (5.3 | ) | — | 16.1 | ||||||||||||||||||||||||||
Other income | 8.3 | 3.1 | 0.0 | 5.1 | 13.2 | (4.9 | ) | (2.5 | ) | (0.0 | ) | (2.3 | ) | |||||||||||||||||||||||
|
|
|
|
|
|
|
|
|
|
|
|
|
|
|
|
|
| |||||||||||||||||||
Ordinary expenses | 290.7 | 117.6 | 16.1 | 157.0 | 296.6 | (5.8 | ) | 10.3 | 0.5 | (16.7 | ) | |||||||||||||||||||||||||
|
|
|
|
|
|
|
|
|
|
|
|
|
|
|
|
|
| |||||||||||||||||||
Interest expenses | 71.2 | 27.5 | 0.0 | 43.6 | 76.3 | (5.0 | ) | (3.1 | ) | (0.0 | ) | (1.8 | ) | |||||||||||||||||||||||
Interest on deposits | 44.2 | 18.7 | — | 25.5 | 48.7 | (4.4 | ) | (2.3 | ) | — | (2.1 | ) | ||||||||||||||||||||||||
Fees and commissions payments | 30.9 | 7.4 | 6.4 | 17.1 | 31.3 | (0.4 | ) | 0.0 | (0.0 | ) | (0.3 | ) | ||||||||||||||||||||||||
Trading expenses | 0.2 | 0.2 | — | — | 0.0 | 0.1 | 0.1 | — | — | |||||||||||||||||||||||||||
Other ordinary expenses | 16.7 | 6.4 | — | 10.3 | 25.8 | (9.1 | ) | 1.5 | — | (10.6 | ) | |||||||||||||||||||||||||
General and administrative expenses | 133.3 | 54.2 | 9.2 | 69.8 | 134.4 | (1.1 | ) | (0.2 | ) | 0.3 | (1.1 | ) | ||||||||||||||||||||||||
Other expenses | 38.3 | 21.8 | 0.3 | 16.1 | 28.5 | 9.7 | 12.0 | 0.3 | (2.7 | ) | ||||||||||||||||||||||||||
|
|
|
|
|
|
|
|
|
|
|
|
|
|
|
|
|
| |||||||||||||||||||
Ordinary profit | 87.5 | 20.4 | 5.1 | 61.9 | 90.8 | (3.2 | ) | (21.8 | ) | (0.6 | ) | 19.3 | ||||||||||||||||||||||||
|
|
|
|
|
|
|
|
|
|
|
|
|
|
|
|
|
| |||||||||||||||||||
Extraordinary income | 0.2 | — | — | 0.2 | 15.0 | (14.7 | ) | (8.0 | ) | — | (6.7 | ) | ||||||||||||||||||||||||
Extraordinary loss | 7.8 | 3.0 | 0.3 | 4.4 | 21.3 | (13.5 | ) | 0.8 | 0.0 | (14.4 | ) | |||||||||||||||||||||||||
|
|
|
|
|
|
|
|
|
|
|
|
|
|
|
|
|
| |||||||||||||||||||
Income before Income Taxes | 79.9 | 17.3 | 4.8 | 57.7 | 84.5 | (4.5 | ) | (30.8 | ) | (0.7 | ) | 27.0 | ||||||||||||||||||||||||
|
|
|
|
|
|
|
|
|
|
|
|
|
|
|
|
|
| |||||||||||||||||||
Income taxes-Current | 12.3 | 0.0 | 2.4 | 9.8 | 6.7 | 5.5 | 0.0 | (0.1 | ) | 5.7 | ||||||||||||||||||||||||||
Income taxes-Deferred | 9.9 | 0.1 | (0.4 | ) | 10.3 | (7.1 | ) | 17.1 | (14.9 | ) | (0.1 | ) | 32.2 | |||||||||||||||||||||||
|
|
|
|
|
|
|
|
|
|
|
|
|
|
|
|
|
| |||||||||||||||||||
Income taxes | 22.3 | 0.1 | 1.9 | 20.1 | (0.4 | ) | 22.7 | (14.8 | ) | (0.3 | ) | 37.9 | ||||||||||||||||||||||||
|
|
|
|
|
|
|
|
|
|
|
|
|
|
|
|
|
| |||||||||||||||||||
Net income | 57.6 | 17.1 | 2.8 | 37.6 | 84.9 | (27.2 | ) | (15.9 | ) | (0.4 | ) | (10.8 | ) | |||||||||||||||||||||||
|
|
|
|
|
|
|
|
|
|
|
|
|
|
|
|
|
| |||||||||||||||||||
10
Table of Contents
(3) Statement of trust account
[Non-consolidated (CMTB + CMAB + STB)]
Items | Billions of Yen | |||||||||||||||||||||||||||||||||||
| Sep. 2011 | Mar. 2011 | Change | ||||||||||||||||||||||||||||||||||
| Total | CMTB | CMAB | STB | Total | CMTB | CMAB | STB | |||||||||||||||||||||||||||||
Loans and bills discounted | 543.9 | 219.9 | — | 323.9 | 565.0 | (21.1 | ) | (11.9 | ) | — | (9.2 | ) | ||||||||||||||||||||||||
Securities | 586.2 | 3.1 | 76.1 | 506.9 | 713.1 | (126.8 | ) | (0.1 | ) | (1.0 | ) | (125.6 | ) | |||||||||||||||||||||||
Beneficiary rights | 98,627.6 | 0.0 | 29,895.6 | 68,732.0 | 95,836.2 | 2,791.3 | (0.0 | ) | (702.8 | ) | 3,494.2 | |||||||||||||||||||||||||
Securities held in custody accounts | 190.7 | 0.1 | — | 190.6 | 304.5 | (113.8 | ) | (0.0 | ) | — | (113.8 | ) | ||||||||||||||||||||||||
Money claims | 9,577.3 | 0.1 | 1,334.2 | 8,242.9 | 10,245.3 | (668.0 | ) | (0.0 | ) | (82.6 | ) | (585.3 | ) | |||||||||||||||||||||||
Tangible fixed assets | 9,311.0 | 4,927.5 | — | 4,383.5 | 9,419.0 | (108.0 | ) | (102.2 | ) | — | (5.7 | ) | ||||||||||||||||||||||||
Intangible fixed assets | 66.9 | 30.7 | — | 36.1 | 68.3 | (1.3 | ) | (0.2 | ) | — | (1.1 | ) | ||||||||||||||||||||||||
Other claims | 1,728.6 | 36.3 | — | 1,692.2 | 1,756.3 | (27.7 | ) | (0.6 | ) | — | (27.0 | ) | ||||||||||||||||||||||||
Call loans | 27.8 | — | — | 27.8 | 42.3 | (14.5 | ) | — | — | (14.5 | ) | |||||||||||||||||||||||||
Loans to banking account | 1,109.6 | 700.7 | — | 408.9 | 1,233.3 | (123.7 | ) | (100.9 | ) | — | (22.7 | ) | ||||||||||||||||||||||||
Cash and due from banks | 418.0 | 174.2 | 19.7 | 224.0 | 428.6 | (10.5 | ) | (11.7 | ) | 1.2 | (0.0 | ) | ||||||||||||||||||||||||
|
|
|
|
|
|
|
|
|
|
|
|
|
|
|
|
|
| |||||||||||||||||||
Total assets | 122,188.1 | 6,093.0 | 31,325.7 | 84,769.3 | 120,612.5 | 1,575.6 | (227.9 | ) | (785.2 | ) | 2,588.8 | |||||||||||||||||||||||||
|
|
|
|
|
|
|
|
|
|
|
|
|
|
|
|
|
| |||||||||||||||||||
Money trusts | 21,820.9 | 712.0 | 8,249.5 | 12,859.3 | 22,032.9 | (212.0 | ) | (65.5 | ) | (55.4 | ) | (90.9 | ) | |||||||||||||||||||||||
Pension trusts | 12,725.4 | — | 6,581.0 | 6,144.3 | 13,254.9 | (529.5 | ) | — | (414.4 | ) | (115.0 | ) | ||||||||||||||||||||||||
Property formation benefit trusts | 22.0 | 13.2 | — | 8.7 | 22.1 | (0.0 | ) | (0.0 | ) | — | (0.0 | ) | ||||||||||||||||||||||||
Loan trusts | 180.4 | 179.9 | — | 0.5 | 248.2 | (67.8 | ) | (48.3 | ) | — | (19.4 | ) | ||||||||||||||||||||||||
Securities investment trusts | 38,716.5 | — | 12,242.5 | 26,473.9 | 37,776.4 | 940.0 | — | (251.9 | ) | 1,192.0 | ||||||||||||||||||||||||||
Money entrusted, other than money trusts | 3,090.4 | 0.2 | 326.5 | 2,763.6 | 2,553.3 | 537.0 | (0.0 | ) | (12.6 | ) | 549.7 | |||||||||||||||||||||||||
Securities trusts | 20,168.7 | 0.1 | 1,410.8 | 18,757.7 | 18,550.6 | 1,618.0 | (0.0 | ) | 25.3 | 1,592.6 | ||||||||||||||||||||||||||
Money claim trusts | 9,607.0 | 1.0 | 1,353.5 | 8,252.4 | 10,288.9 | (681.8 | ) | (0.0 | ) | (81.3 | ) | (600.4 | ) | |||||||||||||||||||||||
Land and fixtures trusts | 118.6 | 76.5 | — | 42.0 | 118.1 | 0.4 | 0.3 | — | 0.1 | |||||||||||||||||||||||||||
Composite trusts | 15,737.8 | 5,109.8 | 1,161.6 | 9,466.3 | 15,766.4 | (28.6 | ) | (114.2 | ) | 5.3 | 80.2 | |||||||||||||||||||||||||
Other trusts | 0.0 | 0.0 | — | 0.0 | 0.0 | — | — | — | — | |||||||||||||||||||||||||||
|
|
|
|
|
|
|
|
|
|
|
|
|
|
|
|
|
| |||||||||||||||||||
Total liabilities | 122,188.1 | 6,093.0 | 31,325.7 | 84,769.3 | 120,612.5 | 1,575.6 | (227.9 | ) | (785.2 | ) | 2,588.8 | |||||||||||||||||||||||||
|
|
|
|
|
|
|
|
|
|
|
|
|
|
|
|
|
| |||||||||||||||||||
| (*) | The amount of retrusted assets to Japan Trustee Services Bank, Ltd. as a securities processing is included in Beneficiary rights: |
Sep. 2011: CMAB 29,881.4 billion yen, STB 68,695.2 billion yen
Mar. 2011: CMAB 30,583.8 billion yen, STB 65,200.9 billion yen
11
Table of Contents
(4) Breakdown of principal guaranteed trust a/c
[Non-consolidated (CMTB + STB)]
| Billions of Yen | ||||||||||||||||||||||||||||
| Sep. 2011 | Mar. 2011 | Change | ||||||||||||||||||||||||||
| Total | CMTB | STB | Total | CMTB | STB | |||||||||||||||||||||||
Money trusts | ||||||||||||||||||||||||||||
Loans and bills discounted | 371.3 | 216.2 | 155.1 | 401.9 | (30.6 | ) | (6.4 | ) | (24.1 | ) | ||||||||||||||||||
Securities | 0.0 | — | 0.0 | 0.0 | — | — | — | |||||||||||||||||||||
Others | 920.5 | 573.6 | 346.9 | 1,041.2 | (120.7 | ) | (87.1 | ) | (33.6 | ) | ||||||||||||||||||
|
|
|
|
|
|
|
|
|
|
|
|
|
| |||||||||||||||
Total assets | 1,291.9 | 789.8 | 502.0 | 1,443.3 | (151.4 | ) | (93.6 | ) | (57.7 | ) | ||||||||||||||||||
|
|
|
|
|
|
|
|
|
|
|
|
|
| |||||||||||||||
Principal | 1,290.7 | 789.6 | 501.1 | 1,442.1 | (151.3 | ) | (93.7 | ) | (57.6 | ) | ||||||||||||||||||
Reserves for JOMT (Jointly-operated money trust) | 0.2 | 0.1 | 0.1 | 0.3 | (0.0 | ) | 0.0 | (0.1 | ) | |||||||||||||||||||
Others | 0.8 | 0.0 | 0.8 | 0.8 | 0.0 | 0.0 | (0.0 | ) | ||||||||||||||||||||
|
|
|
|
|
|
|
|
|
|
|
|
|
| |||||||||||||||
Total liabilities | 1,291.9 | 789.8 | 502.0 | 1,443.3 | (151.4 | ) | (93.6 | ) | (57.7 | ) | ||||||||||||||||||
|
|
|
|
|
|
|
|
|
|
|
|
|
| |||||||||||||||
Loan trusts | ||||||||||||||||||||||||||||
Loans and bills discounted | — | — | — | — | — | — | — | |||||||||||||||||||||
Securities | 0.4 | 0.4 | — | 0.4 | (0.0 | ) | (0.0 | ) | — | |||||||||||||||||||
Others | 181.2 | 180.7 | 0.5 | 249.1 | (67.8 | ) | (48.3 | ) | (19.4 | ) | ||||||||||||||||||
|
|
|
|
|
|
|
|
|
|
|
|
|
| |||||||||||||||
Total assets | 181.7 | 181.2 | 0.5 | 249.5 | (67.8 | ) | (48.3 | ) | (19.4 | ) | ||||||||||||||||||
|
|
|
|
|
|
|
|
|
|
|
|
|
| |||||||||||||||
Principal | 179.0 | 178.6 | 0.4 | 246.0 | (66.9 | ) | (47.7 | ) | (19.1 | ) | ||||||||||||||||||
Reserves for loan trust | 1.2 | 1.1 | 0.0 | 1.5 | (0.3 | ) | (0.2 | ) | (0.1 | ) | ||||||||||||||||||
Others | 1.4 | 1.4 | 0.0 | 1.9 | (0.4 | ) | (0.3 | ) | (0.1 | ) | ||||||||||||||||||
|
|
|
|
|
|
|
|
|
|
|
|
|
| |||||||||||||||
Total liabilities | 181.7 | 181.2 | 0.5 | 249.5 | (67.8 | ) | (48.3 | ) | (19.4 | ) | ||||||||||||||||||
|
|
|
|
|
|
|
|
|
|
|
|
|
| |||||||||||||||
12