Filed Pursuant to Rule 424(B)(3)
Registration No. 333-164313
PHILLIPS EDISON – ARC SHOPPING CENTER REIT INC.
SUPPLEMENT NO. 4 DATED FEBRUARY 13, 2012
TO THE PROSPECTUS DATED NOVEMBER 22, 2011
This document supplements, and should be read in conjunction with, our prospectus dated November 22, 2011 relating to our offering of 180 million shares of common stock. Supplement No. 4 supersedes and replaces all prior supplements to the prospectus. Unless otherwise defined in this Supplement No. 4, capitalized terms used have the same meanings as set forth in the prospectus. The purpose of this supplement is to disclose, among other things, the following:
| • | operating information, including the status of the offering, portfolio data, selected financial data, distribution information, dilution information, information about our share repurchase program, and compensation to our advisor, our sub-advisor, our dealer manager, and their affiliates; |
| • | an update to our expected acquisition expenses in our Prospectus Summary; |
| • | an update to our Prior Performance Summary; |
| • | “Experts” information; and |
| • | information incorporated by reference. |
OPERATING INFORMATION
Status of the Offering
We commenced this initial public offering on August 12, 2010, pursuant to which we are offering up to 150 million shares of our common stock in a primary offering at $10.00 per share, with discounts available for certain categories of purchasers, and up to 30 million shares of our common stock pursuant to our dividend reinvestment plan at $9.50 per share. As of January 13, 2012, we had raised aggregate gross offering proceeds of approximately $26.3 million from the sale of approximately 2.8 million shares in our initial public offering, including shares sold under our dividend reinvestment plan, and incurred approximately $8.5 million of related organization and offering costs. As of January 13, 2012, approximately 147.2 million shares of our common stock remain available for sale in our primary offering, and approximately 30 million shares of our common stock remain available for issuance under our dividend reinvestment plan.
The termination date of our primary offering of 150 million shares of common stock will be August 12, 2012, unless extended for an additional year by our board of directors. If we continue our primary offering beyond August 12, 2012, we will provide that information in a prospectus supplement. We may continue to offer shares under our dividend reinvestment plan beyond the conclusion of the primary offering until we have sold 30 million shares of common stock through the reinvestment of distributions. We may terminate this offering at any time.
1
Real Estate Investment Summary
Real Estate Portfolio
We own all of our real estate properties through a joint venture (the “Joint Venture”) formed between a group of institutional international investors advised by CBRE Investors Global Multi Manager (the “CBRE Global Investors”) and our wholly-owned subsidiary. We hold a 54% interest in the Joint Venture and the CBRE Global Investors hold the remaining 46% interest. As of January 13, 2012, we, through the Joint Venture, owned fee simple interests in seven real estate properties acquired from third parties unaffiliated with us or our advisor. The following is a summary of our real estate properties as of January 13, 2012:
Property Name | Location | Property Type | Date Acquired | Contract Purchase Price(1) | Rentable Square Footage | Annualized Effective Rent (2) | Annualized Effective Rent per Leased Square Foot | Average Remaining Lease Term in Years | % Leased | |||||||||||||||||||||||
Lakeside Plaza | Salem, Virginia | Shopping Center | 12/10/10 | $ | 8.75 million | 82,033 | $ | 827,709 | $ | 10.20 | 5.4 years | 98.9 | % | |||||||||||||||||||
Snow View Plaza | Parma, Ohio | Shopping Center | 12/15/10 | $ | 12.30 million | 100,460 | $ | 1,138,495 | $ | 12.31 | 7.3 years | 92.0 | % | |||||||||||||||||||
St. Charles Plaza | Haines City, Florida | Shopping Center | 6/10/11 | $ | 10.10 million | 65,000 | $ | 909,850 | $ | 14.46 | 12.3 years | 96.3 | % | |||||||||||||||||||
Southampton Village | Tyrone, Georgia | Shopping Center | 10/14/11 | $ | 8.35 million | 77,956 | $ | 838,479 | $ | 12.44 | 10.0 years | 86.5 | % | |||||||||||||||||||
Centerpoint | Easley, South Carolina | Shopping Center | 10/14/11 | $ | 6.85 million | 72,287 | $ | 670,592 | $ | 11.21 | 10.3 years | 82.8 | % | |||||||||||||||||||
Burwood Village Center | Glen Burnie, Maryland | Shopping Center | 11/9/11 | $ | 16.60 million | 105,834 | $ | 1,459,676 | $ | 14.24 | 7.4 years | 96.9 | % | |||||||||||||||||||
Cureton Town Center | Waxhaw, North Carolina | Shopping Center | 12/29/11 | $ | 13.95 million | 84,357 | $ | 1,272,021 | $ | 16.25 | 12.2 years | 92.8 | % | |||||||||||||||||||
| (1) | The contract purchase price excludes closing costs and acquisition costs. |
| (2) | We calculate annualized effective rent as the annualized contractual rent, less any tenant concessions. |
We believe that our real estate properties are suitable for their intended purposes and adequately covered by insurance. We do not intend to make significant renovations or improvements to our properties. Our properties are located in markets where there is competition for attracting new tenants and retaining current tenants.
Significant Tenants and Lease Expirations
The following table sets forth information regarding the two tenants occupying ten percent or more of the aggregate rentable square footage at our seven shopping centers as of January 13, 2012:
Tenant Name/Property | Tenant Industry | Annualized Effective Rent(1) | % of Total Portfolio Annualized Effective Rent | Rentable Square Footage | % of Total Portfolio Square Footage | Lease Expiration | ||||||||||||||||||
Giant Eagle Inc./Snow View Plaza | Retail – Grocery Store | $ | 730,843 | 10.3 | % | 58,171 sq. ft. | 9.9 | % | September 2020 | (2) | ||||||||||||||
Publix Super Markets, Inc./ | Retail – Grocery Store | $ | 1,485,087 | 20.9 | % | 141,291 sq. ft. | 24.0 | % | (3) | |||||||||||||||
| (1) | We calculate annualized effective rent as the annualized contractual rent, less any tenant concessions. |
| (2) | Giant Eagle has five options to extend the term of its lease by five years each. |
| (3) | Publix’ leases at St. Charles Plaza, Southampton Village, and Centerpoint expire in October 2027, December 2023, and January 2023, respectively. Publix has six options to extend the term of its lease at St. Charles Plaza by five years each. Publix has seven options to extend the term of its lease at Southampton Village by five years each. Publix has six options to extend the term of its lease at Centerpoint by five years each. |
2
No material tenant credit issues have been identified at this time. As of January 13, 2012, we had no material current tenant rent balances outstanding over 90 days.
The following table lists, on an aggregate basis, all of the scheduled lease expirations after January 13, 2012 over each of the years ending December 31, 2012 and thereafter for our seven shopping centers. The table shows the approximate rentable square feet and annualized effective rent represented by the applicable lease expirations:
Year | Number of Expiring Leases | Annualized Effective Rent(1) | % of Total Portfolio Annualized Effective Rent | Leased Rentable Square Feet Expiring | % of Rentable Square Feet Expiring | |||||||||||||||
2012 | 8 | $ | 257,260 | 3.6 | % | 11,644 | 2.1 | % | ||||||||||||
2013 | 15 | $ | 602,151 | 8.5 | % | 31,726 | 5.8 | % | ||||||||||||
2014 | 16 | $ | 828,949 | 11.6 | % | 55,026 | 10.1 | % | ||||||||||||
2015 | 13 | $ | 613,445 | 8.6 | % | 27,625 | 5.1 | % | ||||||||||||
2016 | 7 | $ | 249,880 | 3.5 | % | 16,653 | 3.0 | % | ||||||||||||
2017 | 4 | $ | 257,946 | 3.6 | % | 14,016 | 2.6 | % | ||||||||||||
2018 | 1 | $ | 41,002 | 0.6 | % | 2,346 | 0.4 | % | ||||||||||||
2019 | 3 | $ | 452,507 | 6.4 | % | 54,533 | 10.0 | % | ||||||||||||
2020 | 3 | $ | 850,667 | 12.0 | % | 67,371 | 12.4 | % | ||||||||||||
2021 | 3 | $ | 162,606 | 2.3 | % | 10,160 | 1.9 | % | ||||||||||||
Thereafter | 9 | $ | 2,800,410 | 39.3 | % | 253,152 | 46.6 | % | ||||||||||||
| (1) | We calculate annualized effective rent as the annualized contractual rent, less any tenant concessions. |
Portfolio Tenancy
Prior to the acquisition of a property, we assess the suitability of the grocery anchor tenant and other tenants in light of our investment objectives, namely, preserving capital and providing stable cash flows for distributions. Generally, we assess the strength of the tenant by consideration of company factors, such as its financial strength and market share in the geographic area of the shopping center, as well as location-specific factors, such as the store’s sales, local competition and demographics. When assessing the tenancy of the non-anchor space at the shopping center, we consider the tenant mix at each shopping center in light of our portfolio, the proportion of national and national franchise tenants, and credit worthiness of specific tenants. When evaluating non-national tenancy, we attempt to obtain credit enhancements to leases, which typically come in the form of deposits and/or guarantees from one or more individuals.
The following table presents the composition of our portfolio by tenant type:
Tenant Type: | Leased Rentable Sq. Ft. | % of Total Portfolio Leased Rentable Sq. Ft. | Annualized Base Rent | % of Total Portfolio Annualized Base Rent | ||||||||||||
Grocery anchor | 338,220 | 62 | % | $ | 3,372,999 | 49 | % | |||||||||
National/national franchise | 102,353 | 19 | % | 1,617,525 | 24 | % | ||||||||||
Regional & local | 103,679 | 19 | % | 1,886,424 | 27 | % | ||||||||||
|
|
|
|
|
|
|
| |||||||||
Totals | 544,252 | 100 | % | $ | 6,876,948 | 100 | % | |||||||||
3
Updated Pro Forma Financial Information
The following information provides on a pro forma basis selected financial information for the nine months ended September 30, 2011 as if St. Charles Plaza, Southampton Village, Centerpoint, and Burwood Village Center had been acquired on January 1, 2010. This pro forma selected financial information does not include Cureton Town Center as the initial accounting for that acquisition is incomplete at the time of this filing due to the fact that Cureton Town Center was acquired on December 29, 2011.
| (in thousands) | ||||
Operating Data: | ||||
Total revenues | $ | 5,054 | ||
Property operating expenses | (1,528 | ) | ||
General and administrative | (926 | ) | ||
Acquisition-related expenses | (505 | ) | ||
Depreciation and amortization | (2,154 | ) | ||
|
| |||
Operating loss | (59 | ) | ||
Interest expense | (1,402 | ) | ||
|
| |||
Net loss | $ | (1,461 | ) | |
|
| |||
Per Share Data: | ||||
Net loss attributable to common shareholders per share – basic and diluted | $ | (0.63 | ) | |
Weighted average distributions per share declared | $ | 0.49 | ||
Weighted average shares outstanding – basic and diluted | 2,319,035 | |||
Recent Acquisition
On December 29, 2011, we, through the Joint Venture, purchased Cureton Town Center, a shopping center containing 84,357 rentable square feet located on approximately 16.6 acres of land in Waxhaw, North Carolina, for approximately $13.95 million, exclusive of closing costs. The Joint Venture funded the purchase price with proceeds of approximately $8.88 from a secured revolving credit facility (the “Cureton Credit Facility”), proceeds of $2.74 million from this offering, and $2.33 million provided by the CBRE Global Investors. Cureton Town Center was constructed in 2007. Cureton Town Center was purchased from Wells Fargo Bank, N.A., which is not affiliated with us, our advisor or our sub-advisor.
Cureton Town Center is approximately 92.8% leased to fourteen tenants. The largest tenant at Cureton Town Center is Harris Teeter, which occupies approximately 57.8% of the rentable square feet at Cureton Town Center. The current aggregate annual base rent for the tenants of Cureton Town Center is approximately $1.16 million and the current weighted-average remaining lease term for the tenants is approximately 12.2 years. The current weighted-average rental rate over the lease term, which is calculated as the annualized base rent divided by the leased rentable square feet, is $14.76 per square foot.
The table below describes the average occupancy rate and the average effective annual rent per leased square foot for Cureton Town Center as of December 31 for each of the last two years:
| 2011 | 2010 | |||||||
Average occupancy rate | 92.8 | % | 94.2 | % | ||||
Average effective annual rent per leased square foot | $ | 14.68 | $ | 14.54 | ||||
4
We calculate average effective annual rental rate per leased square foot as the annualized contractual base rental income, net of free rent, for the year divided by the average leased square feet. The previous owner of Cureton Town Center was unable to provide to us information relating to the occupancy rate and the average effective annual rental rate prior to 2010.
Based on the current condition of Cureton Town Center, we do not believe that it will be necessary to make significant renovations to Cureton Town Center. Our management believes that Cureton Town Center is adequately insured.
Yield on Real Estate Investments
The weighted-average year-one yield of real estate properties we have acquired during the 12 months ending January 13, 2012 is approximately 8.3%. The year-one yield is equal to the estimated first-year net operating income of the property divided by the purchase price of the property, excluding closing costs and acquisition fees. Estimated first-year net operating income on our real estate investments is total estimated gross income (rental income, tenant reimbursements, parking income and other property-related income) derived from the terms of in-place leases at the time we acquire the property on a straight-line basis, less property and related expenses (property operating and maintenance expenses, management fees, property insurance and real estate taxes) based on the operating history of the property. Estimated first-year net operating income excludes other non-property income and expenses, interest expense from financings, depreciation and amortization and company-level general and administrative expenses. Historical operating income for these properties is not necessarily indicative of future operating results.
Debt Obligations
We hold all of our debt obligations through the Joint Venture, in which we have a 54% interest. The following is a summary of the Joint Venture’s debt obligations as of January 13, 2012:
Property and | Outstanding Principal Balance | Interest Rate | Loan Type | Payments | Maturity Date | |||||
Lakeside Loan(1) | $6.13 million | One-month LIBOR plus 2.40% to 2.85%, depending upon debt yield | First mortgage loan | Monthly interest only payments through July 1, 2012, followed by continued monthly interest payments and possible monthly payments of principal(2) | December 10, 2012(3) | |||||
Snow View Loan(1) | $2.34 million | One-month LIBOR plus 2.40% to 2.85%, depending upon debt yield | First mortgage loan | Monthly interest only payments through July 1, 2012 followed by continued monthly interest payments and possible monthly payments of principal(4) | December 15, 2012(5) | |||||
St. Charles Loan(1) | $6.75 million | One-month LIBOR plus 2.40% to 2.85%, depending upon debt yield | First mortgage loan | Monthly interest only payments through January 1, 2013 followed by continued monthly interest payments and possible monthly payments of principal(6) | June 10, 2013(7) | |||||
Southampton | $5.92 million | Daily LIBOR plus 2.25% to 2.50%, depending upon amount outstanding and debt yield | Revolving credit facility | Monthly interest only payments through April 30, 2013 followed by continued monthly interest payments and possible monthly payments of principal(8) | November 1, 2013(9) |
5
Centerpoint | $4.85 million | Daily LIBOR plus 2.25% to 2.50%, depending upon amount outstanding and debt yield | Revolving credit facility | Monthly interest only payments through April 30, 2013 followed by continued monthly interest payments and possible monthly payments of principal(10) | November 1, 2013(11) | |||||
Burwood | $11.92 million | Daily LIBOR plus 2.25% to 2.50%, depending upon amount outstanding and debt yield | Revolving credit facility | Monthly interest only payments through April 30, 2013 followed by continued monthly interest payments and possible monthly payments of principal(12) | November 1, 2013(13) | |||||
Cureton | $8.88 million | One-month LIBOR plus 2.25% to 2.50%, depending upon amount outstanding and debt yield | Revolving credit facility | Monthly interest only payments through July 31, 2013 followed by continued monthly interest payments and possible monthly payments of principal(14) | January 1, 2015 |
| (1) | The Lakeside Loan, the Snow View Loan, and the St. Charles Loan subject Lakeside Plaza, Snow View Plaza, and St. Charles Plaza to cross-collateral and cross-default provisions under separate and corresponding provisions of each loan. A wholly-owned subsidiary of the Joint Venture has guaranteed 25% of the Joint Venture’s obligations under the Lakeside Loan, the Snow View Loan, and the St. Charles Loan. |
| (2) | On or before July 1, 2012, total availability under the loan will be reduced by $675,000, and beginning on July 1, 2012 and continuing through the maturity date, availability will be reduced by $20,415 per month, which may require us to make monthly principal payments (depending on the then-outstanding borrowings under the loan), in addition to continued monthly interest payments. We have the option to prepay any outstanding amounts under the Lakeside Loan at any time in whole or in part without premium or penalty. |
| (3) | We may extend the maturity date of the Lakeside Loan to December 10, 2013 upon payment of an extension fee equal to 0.25% of the amount outstanding on December 10, 2012. |
| (4) | On or before July 1, 2012, total availability under the loan will be reduced by $940,000, and beginning on July 1, 2012 and continuing through the maturity date, availability will be reduced by $28,500 per month, which may require us to make monthly principal payments (depending on the then-outstanding borrowings under the loan), in addition to continued monthly interest payments. We have the option to prepay any outstanding amounts under the Snow View Loan at any time in whole or in part without premium or penalty. |
| (5) | We may extend the maturity date of the Snow View Loan to December 15, 2013 upon payment of an extension fee equal to 0.25% of the amount outstanding on December 15, 2012. |
| (6) | On or before January 1, 2013, total availability under the loan will be reduced by $742,500, and beginning on January 1, 2012 and continuing through the maturity date, availability will be reduced by $22,500 per month, which may require us to make monthly principal payments (depending on the then-outstanding borrowings under the loan), in addition to continued monthly interest payments. We have the option to prepay any outstanding amounts under the St. Charles Loan at any time in whole or in part without premium or penalty. |
| (7) | We may extend the maturity date of the St. Charles Loan to June 10, 2014 upon payment of an extension fee equal to 0.25% of the amount outstanding on June 10, 2013. |
| (8) | Beginning on May 1, 2013 and continuing through the maturity date, the Southampton Credit Facility will be reduced by $9,750 per month, which may require us to make monthly principal payments (depending on the then-outstanding borrowings under the credit facility), in addition to continued monthly interest payments. We have the option to prepay any outstanding amounts under the Southampton Credit Facility at any time in whole or in part without premium or penalty. A wholly-owned subsidiary of the Joint Venture has guaranteed 25% of the Joint Venture’s obligations under the Southampton Credit Facility. |
| (9) | We may extend the maturity date of the Southampton Credit Facility to October 10, 2014 upon payment of an extension fee equal to 0.25% of the amount outstanding under the credit facility on November 1, 2013. |
| (10) | Beginning on May 1, 2013 and continuing through the maturity date, the Centerpoint Credit Facility will be reduced by $8,000 per month, which may require us to make monthly principal payments (depending on the then-outstanding borrowings under the credit facility), in addition to continued monthly interest payments. We have the option to prepay any outstanding amounts under the Centerpoint Credit Facility at any time in whole or in part without premium or penalty. A wholly-owned subsidiary of the Joint Venture has guaranteed 25% of the Joint Venture’s obligations under the Centerpoint Credit Facility. |
6
| (11) | We may extend the maturity date of the Centerpoint Credit Facility to November 1, 2014 upon payment of an extension fee equal to 0.25% of the amount outstanding on November 1, 2013. |
| (12) | Beginning on May 1, 2013 and continuing through the maturity date, the Burwood Credit Facility will be reduced by $19,660 per month, which may require us to make monthly principal payments (depending on the then-outstanding borrowings under the credit facility), in addition to continued monthly interest payments. We have the option to prepay any outstanding amounts under the Burwood Credit Facility at any time in whole or in part without premium or penalty. A wholly-owned subsidiary of the Joint Venture has guaranteed 25% of the Joint Venture’s obligations under the Burwood Credit Facility. |
| (13) | We may extend the maturity date of the Burwood Credit Facility to November 1, 2014 upon payment of an extension fee equal to 0.25% of the amount outstanding on November 1, 2013. |
| (14) | Beginning on August 1, 2013 and continuing through the maturity date, the Cureton Credit Facility will be reduced by $14,000 per month, which may require us to make monthly principal payments (depending on the then-outstanding borrowings under the credit facility), in addition to continued monthly interest payments. We have the option to prepay any outstanding amounts under the Cureton Credit Facility at any time in whole or in part without premium or penalty. A wholly-owned subsidiary of the Joint Venture has guaranteed 25% of the Joint Venture’s obligations under the Cureton Credit Facility. |
Selected Financial Data
The following selected financial data should be read in conjunction with our consolidated financial statements and the notes thereto and “Management’s Discussion and Analysis of Financial Condition and Results of Operations” contained in our Annual Report on Form 10-K for the year ended December 31, 2010 and our Quarterly Report on Form 10-Q for the quarter ended September 30, 2011, both incorporated by reference into this prospectus:
| As of | ||||||||||||
| September 30, 2011 | December 31, 2010 | December 31, 2009 | ||||||||||
(in thousands) | ||||||||||||
Balance Sheet Data: | ||||||||||||
Investment in real estate assets, net | $ | 26,901 | $ | 19,065 | $ | — | ||||||
Acquired intangible lease assets, net | 3,503 | 2,328 | — | |||||||||
Cash and cash equivalents | 404 | 707 | 200 | |||||||||
Other assets | 870 | 604 | 943 | |||||||||
Total assets | $ | 31,678 | $ | 22,704 | $ | 1,143 | ||||||
Mortgage loans payable | $ | 15,290 | $ | 14,695 | $ | — | ||||||
Notes payable – affiliates | — | 600 | — | |||||||||
Accounts payable – affiliates | 7,503 | 5,542 | 943 | |||||||||
Other liabilities | 1,096 | 710 | — | |||||||||
Total liabilities | 23,889 | 21,547 | 943 | |||||||||
Stockholders’ equity | 7,789 | 1,157 | 200 | |||||||||
Total liabilities and stockholders’ equity | $ | 31,678 | $ | 22,704 | $ | 1,143 | ||||||
| For the Nine Months Ended September 30, | For the Year Ended December 31, | |||||||||||||||
| 2011 | 2010 | 2010 | 2009 | |||||||||||||
(in thousands, except share and per share data) | ||||||||||||||||
Operating Data: | ||||||||||||||||
Total revenues | $ | 2,062 | $ | — | $ | 98 | $ | — | ||||||||
Property operating expenses | (358 | ) | — | (32 | ) | — | ||||||||||
General and administrative | (588 | ) | (80 | ) | (228 | ) | — | |||||||||
Acquisition-related expenses | (740 | ) | — | (467 | ) | — | ||||||||||
Depreciation and amortization | (853 | ) | — | (81 | ) | — | ||||||||||
|
|
|
|
|
|
|
| |||||||||
Operating loss | (807 | ) | (80 | ) | (710 | ) | — | |||||||||
Interest expense/other income | (486 | ) | — | (37 | ) | — | ||||||||||
|
|
|
|
|
|
|
| |||||||||
Net loss | $ | (1,293 | ) | $ | (80 | ) | $ | (747 | ) | $ | — | |||||
|
|
|
|
|
|
|
| |||||||||
Cash Flow Data: | ||||||||||||||||
Cash flows provided by (used in) operating activities | $ | 431 | $ | (197 | ) | $ | 201 | $ | — | |||||||
Cash flows used in investing activities | $ | (10,146 | ) | $ | — | $ | (21,249 | ) | $ | — | ||||||
Cash flows provided by financing activities | $ | 9,412 | $ | 3,794 | $ | 21,555 | $ | 200 | ||||||||
Per Share Data: | ||||||||||||||||
Net loss attributable to common shareholders per share – basic and diluted | $ | (1.05 | ) | $ | (2.06 | ) | $ | (4.44 | ) | $ | — | |||||
Weighted average distributions per share declared | $ | 0.49 | $ | — | $ | 0.22 | $ | — | ||||||||
Weighted average shares outstanding – basic and diluted | 1,228,970 | 38,907 | 168,419 | 20,000 | ||||||||||||
7
Distribution Information
During 2010, we declared distributions based on daily record dates for each day during the period from December 1, 2010 through December 31, 2010. During 2011, we declared distributions based on daily record dates for each day during the period from January 1, 2011 through December 31, 2011. All declared distributions equal a daily amount of $0.00178082 (0.178082 cents) per share of common stock. If this rate were paid each day for a 365-day period, it would equal a 6.5% annualized rate based on a purchase price of $10.00 per share. A portion of each distribution may constitute a return of capital for tax purposes. There is no assurance that we will continue to declare daily distributions at this rate. Distributions declared, distributions paid and cash provided by operating activities were as follows for the quarters ended March 31, 2011, June 30, 2011, and September 30, 2011 (in thousands, except per share amounts):
| Distributions Paid | Distributions Declared | Sources of Cash Distributions Paid | ||||||||||||||||||||||||||||||
2011 | Cash | Distributions Reinvested (DRIP) | Total | Cash Provided by (Used in) Operating Activities | Total Distributions Declared | Distributions Declared Per Share | Amount Paid from Operating Activities/ Percent of Total Cash Distributions Paid | Amount Paid from Sub-Advisor Advances/ Percent of Total Cash Distributions Paid | ||||||||||||||||||||||||
First Quarter | $ | 104 | $ | 17 | $ | 121 | $ | 116 | $ | 144 | $ | 0.1625 | $ | 104 / 100 | % | $ | 0 / 0 | % | ||||||||||||||
Second Quarter | $ | 164 | $ | 26 | $ | 190 | $ | (269 | ) | $ | 201 | $ | 0.1625 | $ | 0 / 0 | % | $ | 164 / 100 | % | |||||||||||||
Third Quarter | $ | 194 | $ | 38 | $ | 232 | $ | 584 | $ | 253 | $ | 0.1625 | $ | 194 / 100 | % | $ | 0 / 0 | % | ||||||||||||||
We paid our first distribution in the first quarter of 2011, and since our inception through September 30, 2011, we have paid total distributions, including distributions reinvested through our dividend reinvestment plan, of $543,000. These distributions were funded from operations and advances from Phillips Edison Sub-Advisor (without any corresponding issuance of equity to Phillips Edison Sub-Advisor). Since inception our cumulative funds from operations were $(1,106,000). For a discussion of how we calculate FFO and why our management considers it a useful measure of REIT operating performance, as well as a reconciliation of FFO to our net income, please see “Funds from Operations and Modified Funds from Operations” below.
8
Net Tangible Book Value of our Shares
In connection with this ongoing offering of shares of our common stock, we are providing information about our net tangible book value per share. Our net tangible book value is a rough approximation of value calculated simply as gross book value of real estate assets minus total liabilities, divided by the total number of shares of common stock outstanding. Net tangible book value is used generally as a conservative measure of net worth that we do not believe reflects our estimated value per share. It is not intended to reflect the value of our assets upon an orderly liquidation of the company in accordance with our investment objectives. Our net tangible book value reflects dilution in the value of our common stock from the issue price as a result of (i) operating losses, which reflect accumulated depreciation and amortization of real estate investments, (ii) fees paid in connection with our public offering, including selling commissions and marketing fees re-allowed by our dealer manager to participating broker dealers, and (iii) distributions paid. As of September 30, 2011, our net tangible book value per share was $4.36. To the extent we are able to raise substantial proceeds in this offering, the expenses that cause dilution of the net tangible value per share are expected to decrease on a per share basis, resulting in increases in the net tangible book value per share. The offering price of shares under our primary offering (ignoring purchase price discounts for certain categories of purchasers) at September 30, 2011 was $10.00 per share.
Our offering price was not established on an independent basis and bears no relationship to the net value of our assets. Further, even without depreciation in the value of our assets, the other factors described above with respect to the dilution in the value of our common stock are likely to cause our offering price to be higher than the amount you would receive per share if we were to liquidate at this time.
Funds from Operations and Modified Funds from Operations
Funds from operations, or FFO, is a non-GAAP performance financial measure that is widely recognized as a measure of REIT operating performance. We use FFO as defined by the National Association of Real Estate Investment Trusts to be net income (loss), computed in accordance with GAAP excluding extraordinary items, as defined by GAAP, and gains (or losses) from sales of property (including deemed sales and settlements of pre-existing relationships), plus depreciation and amortization on real estate assets, and after related adjustments for unconsolidated partnerships, joint ventures and subsidiaries and noncontrolling interests. We believe that FFO is helpful to our investors and our management as a measure of operating performance because it excludes real estate-related depreciation and amortization, gains and losses from property dispositions, and extraordinary items, and as a result, when compared year to year, reflects the impact on operations from trends in occupancy rates, rental rates, operating costs, development activities, general and administrative expenses, and interest costs, which are not immediately apparent from net income. Historical cost accounting for real estate assets in accordance with GAAP implicitly assumes that the value of real estate and intangibles diminishes predictably over time. Since real estate values have historically risen or fallen with market conditions, many industry investors and analysts have considered the presentation of operating results for real estate companies that use historical cost accounting alone to be insufficient. As a result, our management believes that the use of FFO, together with the required GAAP presentations, is helpful for our investors in understanding our performance. Factors that impact FFO include start-up costs, fixed costs, delay in buying assets, lower yields on cash held in accounts, income from portfolio properties and other portfolio assets, interest rates on acquisition financing and operating expenses. In addition, FFO will be affected by the types of investments in our targeted portfolio which will consist of, but is not limited to, necessity-based neighborhood and community shopping centers, first- and second-priority mortgage loans, mezzanine loans, bridge and other loans, mortgage-backed securities, collateralized debt obligations, and debt securities of real estate companies.
Since FFO was promulgated, GAAP has expanded to include several new accounting pronouncements, such that management and many investors and analysts have considered the presentation of FFO alone to be insufficient. Accordingly, in addition to FFO, we use modified funds from operations, or MFFO, as defined by the Investment Program Association (“IPA”). MFFO excludes from FFO the following items:
| (1) | acquisition fees and expenses; |
| (2) | straight-line rent amounts, both income and expense; |
| (3) | amortization of above- or below-market intangible lease assets and liabilities; |
| (4) | amortization of discounts and premiums on debt investments; |
| (5) | impairment charges; |
| (6) | gains or losses from the early extinguishment of debt; |
9
| (7) | gains or losses on the extinguishment or sales of hedges, foreign exchange, securities and other derivatives holdings except where the trading of such instruments is a fundamental attribute of our operations; |
| (8) | gains or losses related to fair-value adjustments for derivatives not qualifying for hedge accounting, including interest rate and foreign exchange derivatives; |
| (9) | gains or losses related to consolidation from, or deconsolidation to, equity accounting; |
| (10) | gains or losses related to contingent purchase price adjustments; and |
| (11) | adjustments related to the above items for unconsolidated entities in the application of equity accounting. |
We believe that MFFO is helpful in assisting management and investors assess the sustainability of operating performance in future periods and, in particular, after our offering and acquisition stages are complete, primarily because it excludes acquisition expenses that affect property operations only in the period in which the property is acquired. Thus, MFFO provides helpful information relevant to evaluating our operating performance in periods in which there is no acquisition activity.
As explained below, management’s evaluation of our operating performance excludes the items considered in the calculation based on the following economic considerations. Many of the adjustments in arriving at MFFO are not applicable to us. For example, we have not suffered any impairments. Nevertheless, we explain below the reasons for each of the adjustments made in arriving at our MFFO definition.
| • | Acquisition fees and expenses. In evaluating investments in real estate, including both business combinations and investments accounted for under the equity method of accounting, management’s investment models and analyses differentiate costs to acquire the investment from the operations derived from the investment. Prior to 2009, acquisition costs for both of these types of investments were capitalized under GAAP; however, beginning in 2009, acquisition costs related to business combinations are expensed. Both of these acquisition-related costs have been and will continue to be funded from the proceeds of our offering and generally not from operations. We believe by excluding expensed acquisition costs, MFFO provides useful supplemental information that is comparable for each type of real estate investment and is consistent with management’s analysis of the investing and operating performance of our properties. Acquisition fees and expenses include those paid to AR Capital Advisor, Phillips Edison Sub-Advisor or third parties. |
| • | Adjustments for straight-line rents and amortization of discounts and premiums on debt investments. In the proper application of GAAP, rental receipts and discounts and premiums on debt investments are allocated to periods using various systematic methodologies. This application may result in income recognition that could be significantly different than underlying contract terms. By adjusting for these items, MFFO provides useful supplemental information on the realized economic impact of lease terms and debt investments and aligns results with management’s analysis of operating performance. |
| • | Adjustments for amortization of above or below market intangible lease assets. Similar to depreciation and amortization of other real estate related assets that are excluded from FFO, GAAP implicitly assumes that the value of intangibles diminishes ratably over time and that these charges be recognized currently in revenue. Since real estate values and market lease rates in the aggregate have historically risen or fallen with market conditions, management believes that by excluding these charges, MFFO provides useful supplemental information on the performance of the real estate. |
| • | Impairment charges, gains or losses related to fair-value adjustments for derivatives not qualifying for hedge accounting and gains or losses related to contingent purchase price adjustments. Each of these items relates to a fair value adjustment, which is based on the impact of current market fluctuations and underlying assessments of general market conditions and specific performance of the holding, which may not be directly attributable to current operating performance. As these gains or losses relate to underlying long-term assets and liabilities, management believes MFFO provides useful supplemental information by focusing on the changes in core operating fundamentals rather than changes that may reflect anticipated gains or losses. In particular, because GAAP impairment charges are not allowed to be reversed if the underlying fair values improve or because the timing of impairment charges may lag the onset of certain operating consequences, we believe MFFO provides useful supplemental information related to current consequences, benefits and sustainability related to rental rate, occupancy and other core operating fundamentals. Investors should note, however, that determinations of whether impairment charges have been incurred are based partly on anticipated operating performance, because estimated undiscounted cash flows from a property, including estimated future net rental and lease revenues, net proceeds on the sale of the property, and certain other ancillary cash flows, are taken into account in determining whether an impairment charge has been incurred. While impairment charges are excluded from the calculation of MFFO as described above, as impairments are based on estimated future undiscounted cash flows, investors are cautioned that we may not recover any impairment charges. |
10
| • | Adjustment for gains or losses related to early extinguishment of hedges, debt, consolidation or deconsolidation and contingent purchase price. Similar to extraordinary items excluded from FFO, these adjustments are not related to continuing operations. By excluding these items, management believes that MFFO provides supplemental information related to sustainable operations that will be more comparable between other reporting periods and to other real estate operators. |
By providing MFFO, we believe we are presenting useful information that also assists investors and analysts to better assess the sustainability of our operating performance after our offering and acquisition stages are completed. We also believe that MFFO is a recognized measure of sustainable operating performance by the non-listed REIT industry. MFFO is useful in comparing the sustainability of our operating performance after our offering and acquisition stages are completed with the sustainability of the operating performance of other real estate companies that are not as involved in acquisition activities. However, investors are cautioned that MFFO should only be used to assess the sustainability of our operating performance after our offering and acquisition stages are completed, as it excludes acquisition costs that have a negative effect on our operating performance during the periods in which properties are acquired. Acquisition costs also adversely affect our book value and stockholders’ equity.
FFO or MFFO should not be considered as an alternative to net income (loss), nor as an indication of our liquidity, nor is either indicative of funds available to fund our cash needs, including our ability to fund distributions. In particular, as we are currently in the acquisition phase of our life cycle, acquisition-related costs and other adjustments that are increases to MFFO are, and may continue to be, a significant use of cash. Additionally, the exclusion of impairments limits the usefulness of MFFO as a historical operating performance measure since an impairment indicates that the property’s operating performance has been permanently affected. MFFO has limitations as a performance measure in an offering such as ours where the price of a share of common stock is a stated value and there is no net asset value determination during the offering stage and for a period thereafter. MFFO is not a useful measure in evaluating net asset value because impairments are taken into account in determining net asset value but not in determining MFFO. Accordingly, both FFO and MFFO should be reviewed in connection with other GAAP measurements. Our FFO and MFFO as presented may not be comparable to amounts calculated by other REITs.
The following section presents our calculation of FFO and MFFO and provides additional information related to our operations (in thousands, except per share amounts). As a result of the timing of the commencement of our public offering and our active real estate operations, FFO and MFFO are not relevant to a discussion comparing operations for the two periods presented. We expect revenues and expenses to increase in future periods as we raise additional offering proceeds and use them to acquire additional investments.
| NET LOSS TO FFO/MFFO RECONCILIATION | ||||||||||||
| ($000’s) | ||||||||||||
| For the Three Months Ended September 30, 2011 | For the Nine Months Ended September 30, 2011 | For the Period from September 17, 2010* through December 31, 2010 | ||||||||||
Net loss | $ | (440 | ) | $ | (1,293 | ) | $ | (747 | ) | |||
Depreciation and amortization | 345 | 853 | 81 | |||||||||
|
|
|
|
|
| |||||||
FFO | $ | (95 | ) | $ | (440 | ) | $ | (666 | ) | |||
|
|
|
|
|
| |||||||
Amortization of above or below market leases | 97 | 214 | 17 | |||||||||
Acquisition-related expenses | 246 | 740 | 467 | |||||||||
Straight-line rent | (14 | ) | (34 | ) | — | |||||||
|
|
|
|
|
| |||||||
MFFO | $ | 234 | $ | 480 | $ | (182 | ) | |||||
|
|
|
|
|
| |||||||
Distributions paid | $ | 232 | $ | 543 | $ | — | ||||||
|
|
|
|
|
| |||||||
| * | Date operations commenced |
11
Share Repurchase Program
Our share repurchase program generally requires you to hold your shares for at least one year prior to submitting them for repurchase by us. Our share repurchase program also contains numerous restrictions on your ability to sell your shares to us. During any calendar year, we may repurchase no more than 5.0% of the weighted-average number of shares outstanding during the prior calendar year. Further, the cash available for redemption on any particular date will generally be limited to the proceeds from our dividend reinvestment plan during the period consisting of the preceding four fiscal quarters for which financial statements are available, less any cash already used for repurchases during the same period; however, subject to the limitations described above, we may use other sources of cash at the discretion of our board of directors. These limitations do not apply to shares repurchased in conjunction with a stockholder’s death, “determination of incompetence” or “qualifying disability.” We may amend, suspend or terminate the program at any time upon 30 days’ notice.
As of the nine months ended September 30, 2011, no shares of our common stock eligible to be repurchased under our share repurchase program were tendered for repurchase. For the year ended December 31, 2010, no shares eligible to be repurchased under our share repurchase program were tendered for repurchase.
Fees Earned by and Expenses Reimbursable to Our Advisor, Our Sub-Advisor, Our Dealer Manager and Their Affiliates
Summarized below are the fees earned by and expenses reimbursable to our advisor, our sub-advisor, our dealer manager and their affiliates for the nine months ended September 30, 2011 and the year ended December 31, 2010 and any related amounts payable as of September 30, 2011 and December 31, 2010 (all amounts in thousands):
| Amount | ||||||||||||||||
Form of Compensation | Incurred in the | Payable as of | ||||||||||||||
| Nine Months Ended September 30, 2011 | Year Ended December 31, 2010 | September 30, 2011 | December 31, 2010 | |||||||||||||
Selling commissions (1) | $ | 453 | $ | — | $ | — | $ | — | ||||||||
Dealer manager fee (2) | 160 | — | — | — | ||||||||||||
Reimbursement of organization and offering expenses | 1,685 | 3,847 | 6,475 | 4,790 | ||||||||||||
Acquisition fees | 104 | 210 | — | 210 | ||||||||||||
Debt financing fee | 51 | 110 | — | 110 | ||||||||||||
Asset management fee | — | — | — | — | ||||||||||||
Property management fee | 100 | — | 14 | — | ||||||||||||
Reimbursement of other operating expenses | 601 | 432 | 1,014 | 432 | ||||||||||||
| (1) | Our dealer manager reallows 100% of commissions earned to participating broker-dealers. |
| (2) | Our dealer manager reallows a portion of the dealer manager fee to participating broker-dealers. |
PROSPECTUS UPDATES
Prospectus Summary
Acquisition Expenses
The total of our acquisition fees and acquisition expenses payable with respect to a particular investment are limited to 4.5% of the contract purchase price of each property or 4.5% of the amount advanced for a loan or other investment. However, once we have substantially invested all of the proceeds of this offering, we expect our acquisition expenses to be approximately 0.5% of the purchase price of each property and 0.5% of the amount advanced for each loan or other investment. This information supersedes the information currently contained in the portion of the management compensation table related to acquisition expenses in the “Prospectus Summary” on page 12 of the prospectus dated November 22, 2011.
12
Prior Performance Summary
Prior Programs Sponsored by Phillips Edison
The section of our prospectus entitled “Prior Performance Summary – Prior Programs Sponsored by Phillips Edison” is replaced in its entirety by the following.
Since 1991, Michael C. Phillips and Jeffrey S. Edison, have partnered to acquire, manage and reposition necessity-driven retail properties, primarily grocery-anchored neighborhood and community shopping centers across the United States. Phillips Edison has operated with financial partners through both property-specific and multi-asset discretionary funds, and to date, Phillips Edison has sponsored five private real estate funds and raised approximately $600 million of equity from high-net-worth individuals and institutional investors.
During the 10-year period ended December 31, 2010, Phillips Edison managed five private real estate funds, all of which were multi-investor, commingled funds. All of these private funds were limited partnerships for which affiliates of Messrs. Phillips and Edison act or acted as general partner. In all cases, affiliates of Messrs. Phillips and Edison had responsibility for acquiring, investing, managing, leasing, developing and selling the real estate and real estate-related assets of each of the funds.
Two of the five private real estate funds managed by Phillips Edison raised approximately $395 million of equity capital from 12 institutional investors during the 10-year period ended December 31, 2010. The institutional investors investing in the private funds include public pension funds, sovereign wealth funds, insurance companies, financial institutions, endowments and foundations. For more information regarding the experience of our sponsors in raising funds from investors, see Table I and Table II of the Prior Performance Tables contained in Appendix A of this prospectus.
During the 10-year period ended December 31, 2010, Phillips Edison acquired 249 real estate investments and invested over $1.8 billion in these assets (purchase price) on behalf of the five private funds raising capital for new investments during this period. Debt financing was used to acquire the properties in all of these five private funds.
Four of the five private funds managed by Phillips Edison during the 10-year period ended December 31, 2010 have or had investment objectives that are similar to ours. Like ours, their primary investment objectives are to provide investors with stable returns, to preserve and return investor capital contributions and to realize growth in the value of their investments. In addition, investments in real estate and real estate-related assets involve similar assessments of the risks and rewards of the operation of the underlying real estate and financing thereof as well as an understanding of the real estate and real estate-finance markets. For each of the private funds, Phillips Edison has focused on acquiring a diverse portfolio of real estate investments. Phillips Edison has typically diversified the portfolios of the private funds by geographic region, investment size, and tenant mix. In constructing the portfolios of the five private funds, Phillips Edison specialized in acquiring a mix of value-added and enhanced-return properties. Value-added and enhanced-return assets are assets that are undervalued or that could be repositioned to enhance their value.
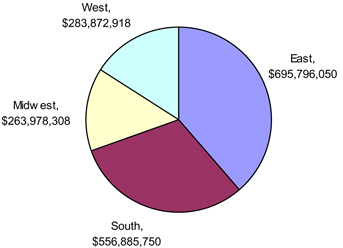
Phillips Edison has sought to diversify investments in its private funds by geographic region as illustrated by the chart below. The chart below outlines investments of the private funds by amounts invested (purchase price) during the 10-year period ended December 31, 2010. All were within the United States. The geographic dispersion of properties acquired during the 10-year period ended December 31, 2010 is as follows: 38% of the amount was invested in 97 properties located in the eastern United States, 31% of the amount was invested in 68 properties located in the southern United States, 16% of the amount was invested in 47 properties located in the western United States and 15% of the amount was invested in 37 properties located in the midwestern United States.
13
PHILLIPS EDISON – PRIVATE PROGRAMS
INVESTMENT BY REGION
In addition to diversifying the private fund portfolios by geographic region, Phillips Edison has primarily focused on necessity-driven retail investments that include the following categories: grocery, general merchandise, discount, health and beauty, and office supply retailers. Unlike industries that are routinely affected by cyclical fluctuations in the economy, shopping centers anchored by these retailers have historically been more resistant to economic downturns. In general, the consistent consumer demand for items such as food, pharmaceutical goods, postal services, general retail and hardware is present in all cycles of the economy.
In seeking to diversify the portfolios of the private funds by investment risk, Phillips Edison has purchased a mix of low-risk, high-quality properties and high-quality but under-performing properties in need of repositioning. The majority of the properties purchased by the private funds had prior owners and operators. For more detailed information regarding acquisitions by the private funds in the three years ended December 31, 2010, see Table VI located in Part II of the registration statement, which is not part of this prospectus. We will provide a copy of Table VI to you upon written request and without charge.
During the 10-year period ended December 31, 2010, Phillips Edison sold 43 properties on behalf of these five private funds. Phillips Edison continues to actively manage the remaining unsold properties of these private funds.
Though the private funds were not subject to the up-front commissions, fees and expenses associated with this offering, the private funds have fee arrangements with Phillips Edison affiliates structured similar to ours. The percentage of the fees varied based on the market factors at the time the particular fund was formed. For more information regarding the fees paid to Phillips Edison affiliates by these private funds and the operating results of these private funds, please see Tables II and III of the Prior Performance Tables in Appendix A of this supplement.
Two of the five private real estate funds managed by Phillips Edison (referred to as Fund I and Fund II) both experienced a liquidity event in 2004, at which time, investors in these funds were given the option to liquidate their investments or to convert their investments into shares of Phillips Edison Limited Partnership. Approximately 80% of the investors in Fund I and Fund II remained in the funds. The remaining three private real estate funds managed by Phillips Edison are fully invested, but have not yet had a liquidity event under the terms of their respective fund agreements. Note that an investment in this offering is substantially different than an investment in any of the Phillips Edison sponsored private offerings. Prior offerings have focused on purchasing value-add grocery-anchored shopping centers. This offering will invest primarily in core and core plus, grocery-anchored shopping centers that are well-occupied, have a higher ratio of national and regional retailers and are located in more heavily populated locations.
Adverse Business Developments and Conditions
Market timing is a strategy of buying or selling assets based on predictions of future market price movements. Phillips Edison has not tried to time the sponsorship of real estate programs based on its predictions of the real estate market as a whole. For most of the last 10 years, sponsored programs have been raising capital in
14
order to acquire a desirable portfolio of real estate. As the money has been raised, sponsored programs have sought to acquire real estate at favorable prices based on then-current market conditions. In other words, such programs have generally sought to put capital to use promptly if suitable investments are available rather than hold substantial amounts of cash for long periods. Although our Phillips Edison sponsor believes that this strategy has generally served the investors in Phillips Edison-sponsored programs well, some of the assets acquired by Phillips Edison-sponsored programs were acquired at times when real estate was generally more expensive than during the later stages of the life of the program. As a result, at any given time some acquired assets of a Phillips Edison-sponsored program might sell for prices that are lower than the prices paid for them if those assets had to be liquidated at that time. This can be true even if the property remains leased to creditworthy tenants with long-term leases such that the program continues to project strong income yields. This possibility is the primary reason why Phillips Edison-sponsored programs are sold as long-term investments. With a long-term investment horizon, Phillips Edison-sponsored programs have more flexibility to liquidate or list at a more favorable time during a real estate cycle. Nevertheless, we cannot make any assurances regarding our ability to liquidate or list at a time when real estate prices are attractive relative to the prices we will pay for our portfolio.
Fund III, and other private real estate funds owned and/or managed by Phillips Edison, acquired properties between 2005 through 2007, a time of historically low capitalization rates. Subsequent to these acquisitions, real property values declined and some of the properties experienced a loss of occupancy. Some of these properties had impairments that were recognized in 2011.
Experts
The following information supplements the disclosure in the prospectus under the heading “Experts.”
The consolidated financial statements and the related financial statement schedule, incorporated in this Prospectus by reference from the Phillips Edison-ARC Shopping Center REIT Inc.’s Annual Report for the year ended December 31, 2010 on Form 10-K, have been audited by Deloitte & Touche LLP, an independent registered public accounting firm, as stated in their report, which is incorporated herein by reference. Such consolidated financial statements and financial statement schedule have been so incorporated in reliance upon the report of such firm given upon their authority as experts in accounting and auditing.
The Statements of Revenues and Certain Operating Expenses of Lakeside Plaza and Snow View Plaza for the year ended December 31, 2009 and of St. Charles Plaza, Southampton Village, Centerpoint, and Burwood Village Center for the year ended December 31, 2010, incorporated by reference in this Prospectus from Phillips Edison – ARC Shopping Center REIT Inc.’s Current Reports on Form 8-K/A as filed with the SEC on February 22, 2011, on August 22, 2011, and on December 27, 2011 have been audited by Deloitte & Touche LLP, independent auditors, as stated in their reports, which are incorporated herein by reference and have been so incorporated in reliance upon the reports of such firm given upon their authority as experts in accounting and auditing.
Incorporation of Certain Information by Reference
We have elected to “incorporate by reference” certain information into this prospectus. By incorporating by reference, we are disclosing important information to you by referring you to documents we have filed separately with the SEC. The information incorporated by reference is deemed to be part of this prospectus, except for information incorporated by reference that is superseded by information contained in this prospectus. You can access documents that are incorporated by reference into this prospectus at our website at http://www.PhillipsEdison-ARC.com (URL for documents: http://phx.corporate-ir.net/phoenix.zhtml?c=244048&p=irol-sec). There is additional information about us, our advisor, our sub-advisor, and their affiliates at the website, but unless specifically incorporated by reference herein as described in the paragraphs below, the contents of that site are not incorporated by reference in or otherwise a part of this prospectus.
15
The following documents filed with the SEC are incorporated by reference in this prospectus (Commission File No. 333-164313), except for any document or portion thereof deemed to be “furnished” and not filed in accordance with SEC rules:
| • | Annual Report on Form 10-K for the fiscal year ended December 31, 2010 filed with the SEC on March 30, 2011; |
| • | Quarterly Report on Form 10-Q for the fiscal quarter ended March 31, 2011 filed with the SEC on May 13, 2011; |
| • | Quarterly Report on Form 10-Q for the fiscal quarter ended June 30, 2011 filed with the SEC on August 11, 2011; |
| • | Quarterly Report on Form 10-Q for the fiscal quarter ended September 30, 2011 filed with the SEC on November 14, 2011; |
| • | Current Report on Form 8-K filed with the SEC on January 5, 2012; |
| • | Current Report on Form 8-K/A filed with the SEC on December 27, 2011; |
| • | Current Report on Form 8-K filed with the SEC on December 22, 2011; |
| • | Current Report on Form 8-K filed with the SEC on December 1, 2011; |
| • | Current Report on Form 8-K filed with the SEC on November 30, 2011; |
| • | Current Report on Form 8-K filed with the SEC on November 10, 2011; |
| • | Current Report on Form 8-K filed with the SEC on October 17, 2011; |
| • | Current Report on Form 8-K filed with the SEC on October 5, 2011; |
| • | Current Report on Form 8-K filed with the SEC on September 21, 2011; |
| • | Current Report on Form 8-K/A filed with the SEC on August 22, 2011; |
| • | Current Report on Form 8-K filed with the SEC on July 18, 2011; |
| • | Current Report on Form 8-K filed with the SEC on June 13, 2011; |
| • | Current Report on Form 8-K filed with the SEC on May 13, 2011; |
| • | Current Report on Form 8-K filed with the SEC on March 28, 2011; |
| • | Current Report on Form 8-K/A filed with the SEC on February 22, 2011; |
| • | Current Report on Form 8-K/A filed with the SEC on January 11, 2011; and |
| • | Current Report on Form 8-K/A filed with the SEC on January 11, 2011. |
16
We will provide to each person, including any beneficial owner, to whom this prospectus is delivered, upon request, a copy of any or all of the information that we have incorporated by reference into this prospectus but not delivered with this prospectus. To receive a free copy of any of the documents incorporated by reference in this prospectus, other than exhibits, unless they are specifically incorporated by reference in those documents, call or write us at:
Realty Capital Securities, LLC
Three Copley Place
Suite 3300
Boston, MA 02116
1-877-373-2522
www.rcsecurities.com
The information relating to us contained in this prospectus does not purport to be comprehensive and should be read together with the information contained in the documents incorporated or deemed to be incorporated by reference in this prospectus.
17
SUPPLEMENTAL INFORMATION – The prospectus of Phillips Edison – ARC Shopping Center REIT Inc. consists of this sticker, the Prospectus dated November 22, 2011 and Supplement No. 4 dated February 13, 2012.
Supplement No. 4 includes:
| • | operating information, including the status of the offering, portfolio data, selected financial data, distribution information, dilution information, information about our share repurchase program, and compensation to our advisor, our sub-advisor, our dealer manager, and their affiliates; |
| • | an update to our expected acquisition expenses in our Prospectus Summary; |
| • | an update to our Prior Performance Summary; |
| • | “Experts” information; and |
| • | information incorporated by reference. |