
February 2012 Lender Presentation

1 Disclaimer Forward-Looking Statements – This presentation contains forward-looking statements regarding anticipated and projected financial performance, capital expenditures, business prospects, operating trends, future results, as well as other market, business and property trends, among other statements. Forward-looking statements involve certain risks and uncertainties and actual results may differ materially from those discussed in each such statement. We undertake no obligation to update or revise the forward-looking statements, whether as a result of new information, future events or otherwise. Actual results or actions may differ materially from those projected in any forward-looking statement as a result of certain risks and uncertainties. Unless otherwise indicated, the information included in this presentation is information regarding Tropicana Entertainment Inc.
2 Table of Contents Section 1 Transaction Overview 4 Section 2 Icahn Enterprises Overview 7 Section 3 Credit Highlights 10 Section 4 Company Overview 17 Section 5 Business Strategy 22 Section 6 Property Descriptions and Competitive Landscape 26 Section 7 Financial Overview 51 Section 8 Terms and Timing 53 Appendix 57
3 Introductions Lance Millage Chief Financial Officer 702.589.3930 lmillage@tropicanaentertainment.com Dan Ninivaggi Interim Chief Executive Officer 212.702.4349 dninivaggi@ielp.com Tony Rodio President and Chief Operating Officer 1 609.340.4544 trodio@tropicana.net (1) Pending regulatory approval

Section 1 Transaction Overview

5 Tropicana Entertainment Inc. ("Tropicana" or the "Company") is pleased to meet with you today regarding the refinancing of its capital structure Tropicana is a leading regional gaming and entertainment company that owns and operates nine properties in New Jersey, Indiana, Louisiana, Mississippi, Nevada and Aruba – 7,581 slot machines, 236 table games and 6,060 hotel rooms – Experienced and geographically diverse regional gaming operator with significant scale – Continued improvement seen in property performance as cost reduction initiatives have been successfully implemented – LTM 9/30/11 Revenue and Adjusted EBITDA1 of $632mm and $78mm, respectively Tropicana was formed in May 2009 to acquire certain assets of Tropicana Entertainment Holdings pursuant to its plan of reorganization – In December 2009 Tropicana entered into an exit facility financing comprised of a $130mm term loan and $20mm revolver – The facility was provided by a group including Icahn Capital, a subsidiary of Icahn Enterprises LP (“Icahn”, the “Sponsor” or “IEP”) which owns approximately 65% of the Company's common stock and is the largest shareholder – Sponsor is an affiliate of Mr. Carl C. Icahn, Chairman of Tropicana's Board of Directors Tropicana is seeking to refinance its existing debt, raise funds for general corporate purposes and put in place a long-term capital structure that maximizes operating flexibility – The Company plans to raise $175mm via a new Senior Secured Term Loan due 2018 (the “Term Loan”) – Pro Forma for the offering, total leverage will be 2.2x, net leverage will be negative and estimated interest coverage will be 6.5x Transaction Overview (1) See Appendix for Adjusted EBITDA reconciliation
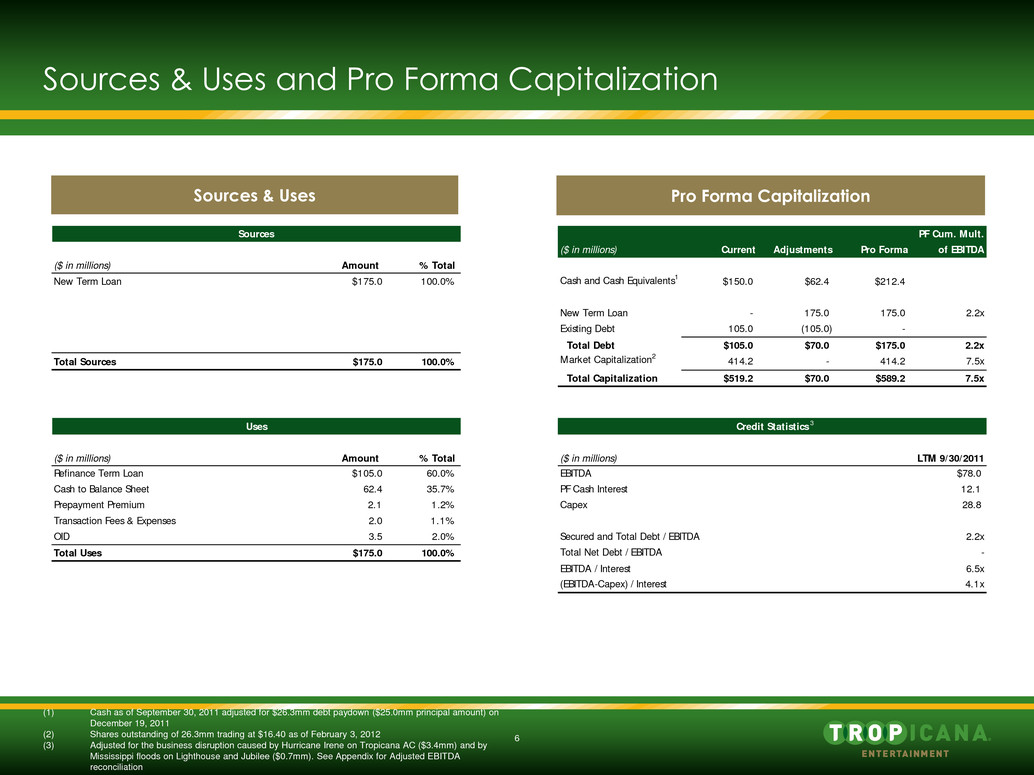
6 Sources & Uses and Pro Forma Capitalization Sources & Uses Pro Forma Capitalization (1) Cash as of September 30, 2011 adjusted for $26.3mm debt paydown ($25.0mm principal amount) on December 19, 2011 (2) Shares outstanding of 26.3mm trading at $16.40 as of February 3, 2012 (3) Adjusted for the business disruption caused by Hurricane Irene on Tropicana AC ($3.4mm) and by Mississippi floods on Lighthouse and Jubilee ($0.7mm). See Appendix for Adjusted EBITDA reconciliation Sources PF Cum. Mult. ($ in millions) Current Adjustments Pro Forma of EBITDA ($ in millions) Amount % Total New Term Loan $175.0 100.0% Cash and Cash Equivalents 1 $150.0 $62.4 $212.4 New Term Loan - 175.0 175.0 2.2x Existing Debt 105.0 (105.0) - Total Debt $105.0 $70.0 $175.0 2.2x Total Sources $175.0 100.0% Market Capitalization 2 414.2 - 414.2 7.5x Total Capitalization $519.2 $70.0 $589.2 7.5x Uses Credit Statistics ($ in millions) Amount % Total ($ in millions) LTM 9/30/2011 Refinance Term Loan $105.0 60.0% EBITDA $78.0 Ca h to Balance Sheet 62.4 35.7% PF Cash Interest 12.1 Prepayment Premium 2.1 1.2% Capex 28.8 Transaction Fees & Expenses 2.0 1.1% OID 3.5 2.0% Secured and Total Debt / EBITDA 2.2x Total Uses $175.0 100.0% Total Net Debt / EBITDA - EBITDA / Interest 6.5x (EBITDA-Capex) / Interest 4.1x 3
Section 2 Icahn Enterprises Overview
8 Icahn Enterprises Overview Extensive track record of enhancing value – History of successfully acquiring undervalued assets and improving and enhancing their operations and financial results – Portfolio companies have generally experienced significant growth in cash flow and value enhancement after acquisition Proven investment team – Led by Carl C. Icahn, IEP is managed by well-seasoned financial and operational executives – Significant investment returns over extended period of time – Mature organization with considerable controls in place Significant investment returns in the gaming industry – American Casino & Entertainment properties (Stratosphere, Arizona Charlie’s Decatur, Arizona Charlie’s Boulder and Aquarius) acquired through a debt position and sold to financial buyer for $1.2bn in 2008 – 10+ year investment period generated 300+% ROI – In the $275mm sale of Sands Atlantic City in 2006, Icahn Enterprises LP realized a gain of $62mm Icahn’s collaboration with Tropicana allows the Company to benefit from – Market insight and sourcing relationships with vendors – Expertise in corporate strategy including evaluating and executing acquisitions and divestitures as well as capital raises – Operational and management advisory Significant asset value – Total assets of ~$25bn distributed across eight operating subsidiaries – Market value of equity in operating subsidiaries estimated to be ~$6.5bn – ~$4.9bn in “market-valued” assets, consisting of Tropicana public equity, Federal-Mogul public equity, IEP liquid interest in private funds and American Railcar public equity Strong liquidity position – Total liquid assets of over $6.0bn – IEP interest in private funds of ~$3.1bn – Subsidiary cash of ~$1.8bn with incremental revolving credit availability over $500mm Selected Icahn Portfolio Companies Proven track-record of value creation and delivery by Icahn
9 Icahn Enterprises Investment Thesis Achieve property and operational improvements – New and experienced management – Value-enhancing and sizable capital investments – Enhanced marketing strategies Disciplined approach to acquisitions, seeking properties with the following characteristics – Ability to improve operations through better management and operational enhancement – Diversify Tropicana’s revenue base – Expand regional footprint, particularly in the Mid-Atlantic region – Located in favorable jurisdictions with low tax rates and/or competitive dynamics – Synergistic within geographic regions and across properties – Select small to mid-level greenfield development projects Strong balance sheet a top priority – Modest leverage (inclusive of potential acquisitions) – Ample liquidity – Plan to reinvest rather than pay dividends, consistent with IEP’s other portfolio investments Utilize Tropicana Entertainment to build a leading, geographically-diverse gaming company by improving operations, achieving synergies across the platform and opportunistically acquiring assets in attractive markets at reasonable valuations

Section 3 Credit Highlights
11 Credit Highlights ($Millions) Geographically Diverse, Regional Properties in Major Gaming Markets 1 Industry Leading Pro Forma Credit Profile 2 Experienced Management Team 4 Significant Capital Reinvestment and Operational Enhancements 3
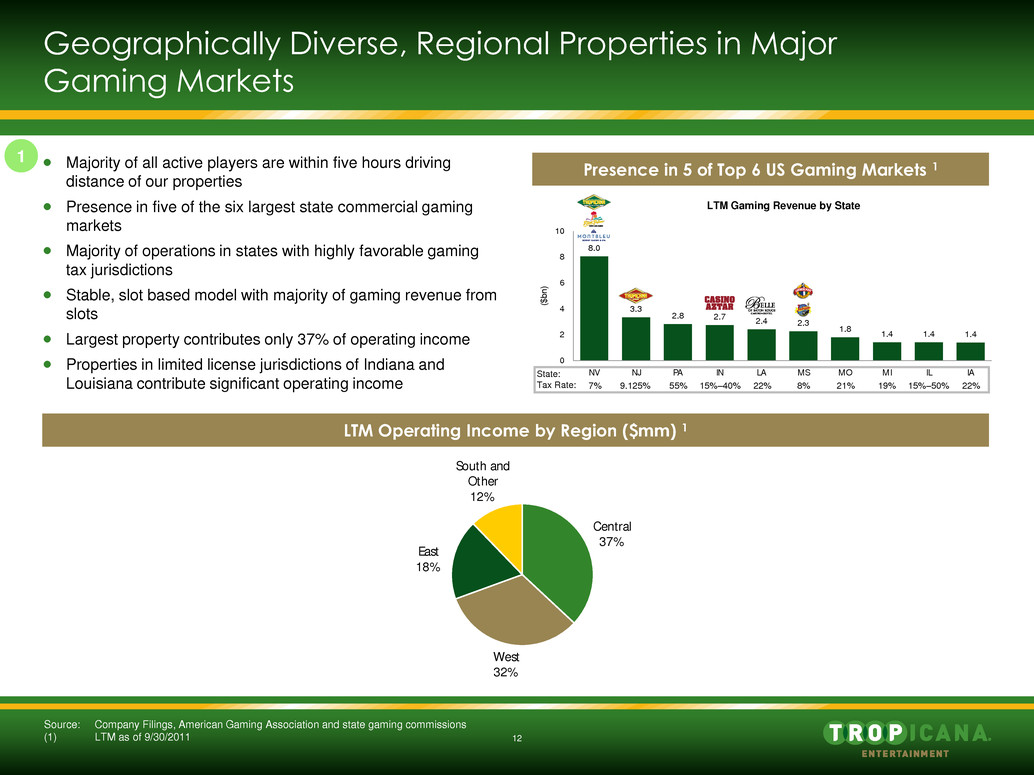
12 8.0 3.3 2.8 2.7 2.4 2.3 1.8 1.4 1.4 1.4 0 2 4 6 8 10 NV NJ PA IN LA MS MO MI IL IA ($bn ) Geographically Diverse, Regional Properties in Major Gaming Markets Presence in 5 of Top 6 US Gaming Markets 1 Majority of all active players are within five hours driving distance of our properties Presence in five of the six largest state commercial gaming markets Majority of operations in states with highly favorable gaming tax jurisdictions Stable, slot based model with majority of gaming revenue from slots Largest property contributes only 37% of operating income Properties in limited license jurisdictions of Indiana and Louisiana contribute significant operating income Source: Company Filings, American Gaming Association and state gaming commissions (1) LTM as of 9/30/2011 LTM Gaming Revenue by State State: Tax Rate: 7% 9.125% 55% 15%–40% 22% 8% 21% 15%–50% 19% 22% 1 LTM Operating Income by Region ($mm) 1 South and Other 12% East 18% West 32% Central 37%

13 7,549 6,060 3,100 2,416 2,400 2,289 402 357 223 0 2,000 4,000 6,000 8,000 BYD TROP ISLE ASCA PENN PNK PENGAM MNTG JACENT 600 416 370 338 277 236 125 77 53 0 200 400 600 800 PENN BYD ISLE ASCA PNK TROP MNTG PENGAM JACENT 25 16 15 13 9 8 7 4 3 0 5 10 15 20 25 30 PENN BYD ISLE JACENT TROP P K PENGAM MNTG 29,000 21,062 15,000 12,870 9,700 7,581 4,570 4,187 3,526 0 10,000 20,000 30,000 4 ,000 PENN BYD ISLE ASCA PNK TROP MNTG PENGAM JACENT Tropicana Asset Base Total Rooms 1 Total Properties 1 Total Slots 1 Total Tables 1 Tropicana Entertainment is already a very substantial competitor among regional peers 1 (1) Boyd Gaming excludes Borgata Hotel & Casino
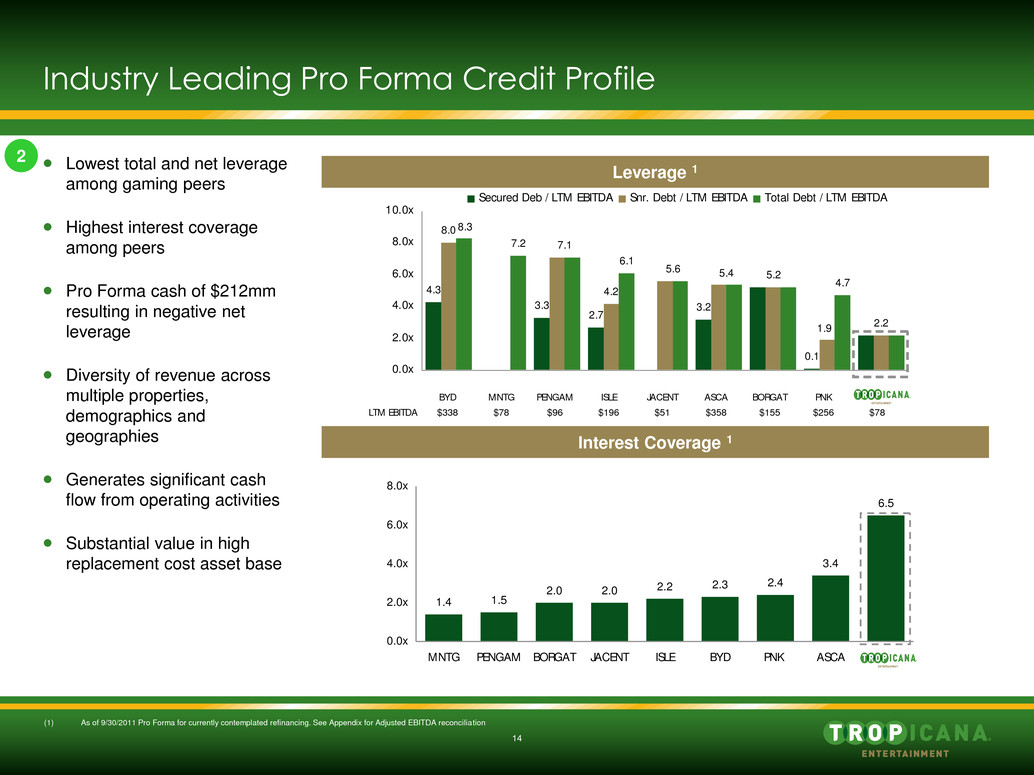
14 1.4 1.5 2.0 2.0 2.2 2.3 2.4 3.4 6.5 0.0x 2.0x 4.0x 6.0x 8.0x MNTG PENGAM BORGAT JACENT ISLE BYD PNK ASCA Tropicana 4.3 3.3 2.7 3.2 0.1 8.0 4.2 2.2 7.2 6.1 4.7 5.6 5.4 5.2 1.9 7.1 8.3 0.0x 2.0x 4.0x 6.0x 8.0x 10.0x Secured Deb / LTM EBITDA Snr. Debt / LTM EBITDA Total Debt / LTM EBITDA BYD MNTG PENGAM ISLE JACENT ASCA BORGAT PNK Trop LTM EBITDA $338 $78 $96 $196 $51 $358 $155 $256 $78 Industry Leading Pro Forma Credit Profile Lowest total and net leverage among gaming peers Highest interest coverage among peers Pro Forma cash of $212mm resulting in negative net leverage Diversity of revenue across multiple properties, demographics and geographies Generates significant cash flow from operating activities Substantial value in high replacement cost asset base Leverage 1 Interest Coverage 1 (1) As of 9/30/2011 Pro Forma for currently contemplated refinancing. See Appendix for Adjusted EBITDA reconciliation 2
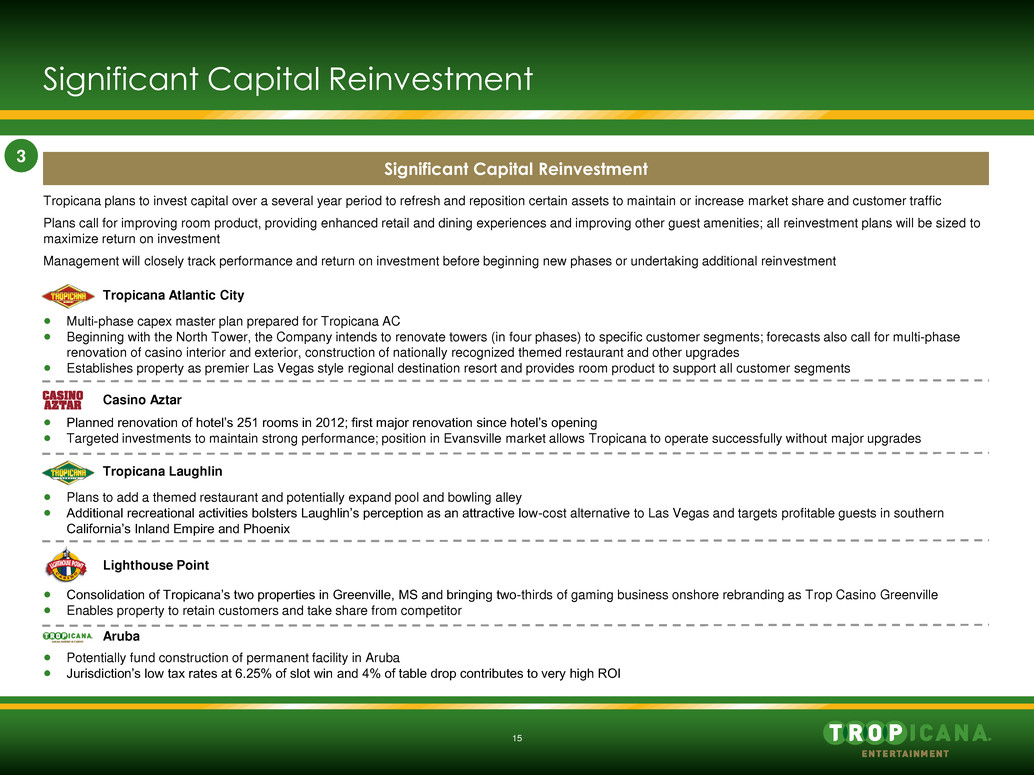
15 Significant Capital Reinvestment Tropicana plans to invest capital over a several year period to refresh and reposition certain assets to maintain or increase market share and customer traffic Plans call for improving room product, providing enhanced retail and dining experiences and improving other guest amenities; all reinvestment plans will be sized to maximize return on investment Management will closely track performance and return on investment before beginning new phases or undertaking additional reinvestment Significant Capital Reinvestment Multi-phase capex master plan prepared for Tropicana AC Beginning with the North Tower, the Company intends to renovate towers (in four phases) to specific customer segments; forecasts also call for multi-phase renovation of casino interior and exterior, construction of nationally recognized themed restaurant and other upgrades Establishes property as premier Las Vegas style regional destination resort and provides room product to support all customer segments Planned renovation of hotel’s 251 rooms in 2012; first major renovation since hotel’s opening Targeted investments to maintain strong performance; position in Evansville market allows Tropicana to operate successfully without major upgrades Plans to add a themed restaurant and potentially expand pool and bowling alley Additional recreational activities bolsters Laughlin’s perception as an attractive low-cost alternative to Las Vegas and targets profitable guests in southern California’s Inland Empire and Phoenix Consolidation of Tropicana’s two properties in Greenville, MS and bringing two-thirds of gaming business onshore rebranding as Trop Casino Greenville Enables property to retain customers and take share from competitor Potentially fund construction of permanent facility in Aruba Jurisdiction’s low tax rates at 6.25% of slot win and 4% of table drop contributes to very high ROI Tropicana Atlantic City Casino Aztar Tropicana Laughlin Lighthouse Point Aruba 3
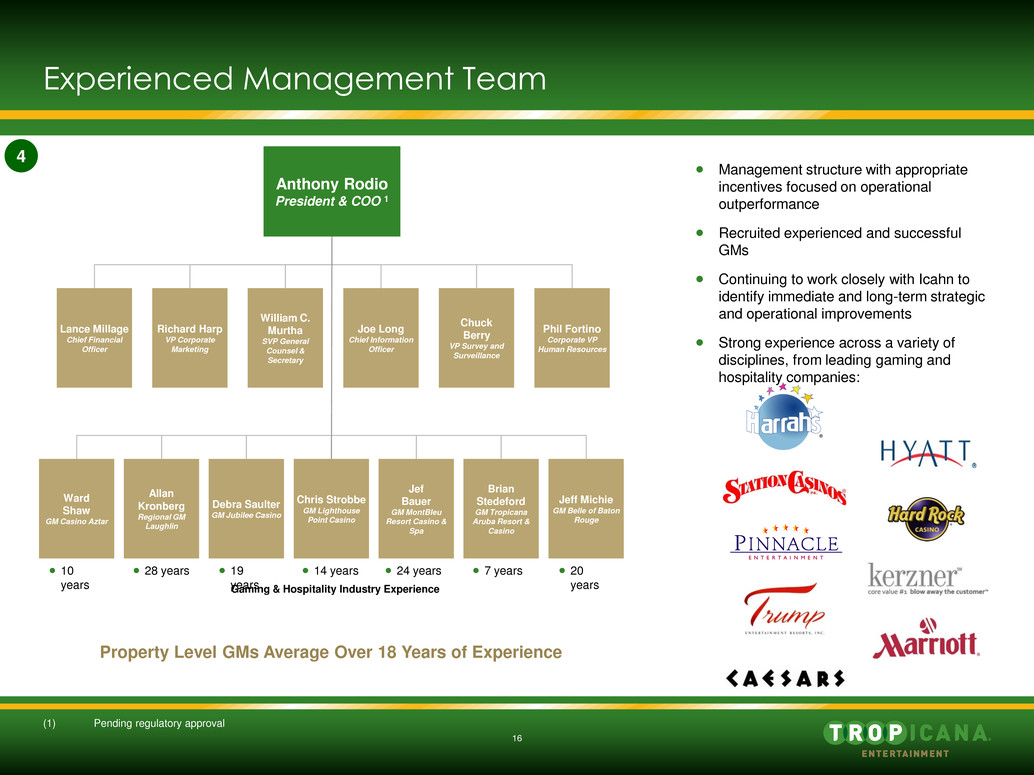
16 Experienced Management Team 10 years 28 years 19 years 14 years 24 years 7 years 20 years Gaming & Hospitality Industry Experience Property Level GMs Average Over 18 Years of Experience Jeff Michie GM Belle of Baton Rouge Ward Shaw GM Casino Aztar Brian Stedeford GM Tropicana Aruba Resort & Casino Allan Kronberg Regional GM Laughlin Chris Strobbe GM Lighthouse Point Casino Debra Saulter GM Jubilee Casino Jef Bauer GM MontBleu Resort Casino & Spa Lance Millage Chief Financial Officer William C. Murtha SVP General Counsel & Secretary Richard Harp VP Corporate Marketing Joe Long Chief Information Officer Phil Fortino Corporate VP Human Resources Chuck Berry VP Survey and Surveillance Management structure with appropriate incentives focused on operational outperformance Recruited experienced and successful GMs Continuing to work closely with Icahn to identify immediate and long-term strategic and operational improvements Strong experience across a variety of disciplines, from leading gaming and hospitality companies: (1) Pending regulatory approval Anthony Rodio President & COO 1 4

Section 4 Company Overview
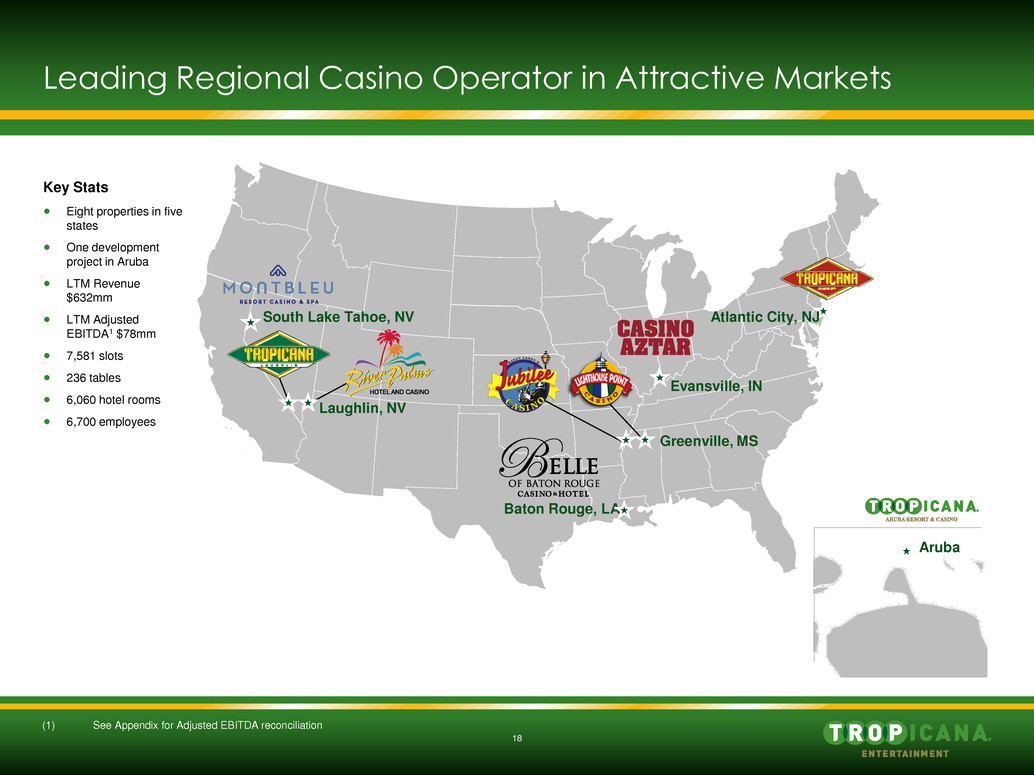
18 Leading Regional Casino Operator in Attractive Markets Aruba Evansville, IN Greenville, MS Baton Rouge, LA Laughlin, NV South Lake Tahoe, NV Atlantic City, NJ Key Stats Eight properties in five states One development project in Aruba LTM Revenue $632mm LTM Adjusted EBITDA1 $78mm 7,581 slots 236 tables 6,060 hotel rooms 6,700 employees (1) See Appendix for Adjusted EBITDA reconciliation

19 Geographically Diversified Portfolio of Properties ($mm) (1) LTM as of 9/30/2011 (2) Temporary casino opened December 2011; plans for permanent facility under development Region Properties Location Gaming Space (sf) Slots Tables Hotel Rooms F & B Venues LTM Revenue ($mm) ¹ East Tropicana AC Atlantic City, NJ 138,130 2,644 113 2,078 28 East Total 138,130 2,644 113 2,078 28 286 Central Casino Aztar Evansville, IN 38,360 914 40 347 9 Central Total 38,360 914 40 347 9 123 South and Other Belle of Baton Rouge Baton Rouge, LA 28,300 850 29 300 4 Lighthouse Point Greenville, MS 22,000 510 - - 2 Jubilee Greenville, MS 28,500 459 7 41 1 Aruba ² Noord, Aruba - - - 361 2 South and Other Total 78,800 1,819 36 702 9 99 West Tropicana Laughlin Laughlin, NV 53,000 976 18 1,495 11 River Palms Laughlin, NV 58,000 700 7 1,001 7 MontBleu South Lake Tahoe, NV 45,000 528 22 437 5 West Total 156,000 2,204 47 2,933 23 124 Total 411,290 7,581 236 6,060 69 632
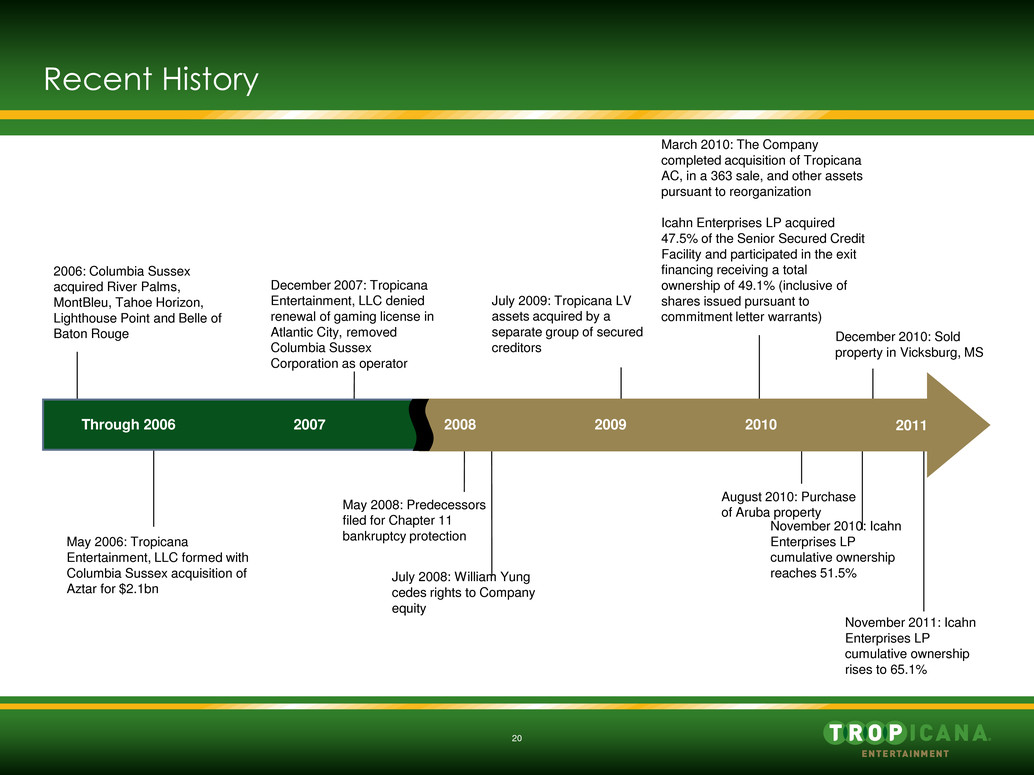
20 November 2010: Icahn Enterprises LP cumulative ownership reaches 51.5% Recent History May 2006: Tropicana Entertainment, LLC formed with Columbia Sussex acquisition of Aztar for $2.1bn May 2008: Predecessors filed for Chapter 11 bankruptcy protection August 2010: Purchase of Aruba property July 2008: William Yung cedes rights to Company equity 2006: Columbia Sussex acquired River Palms, MontBleu, Tahoe Horizon, Lighthouse Point and Belle of Baton Rouge July 2009: Tropicana LV assets acquired by a separate group of secured creditors March 2010: The Company completed acquisition of Tropicana AC, in a 363 sale, and other assets pursuant to reorganization Icahn Enterprises LP acquired 47.5% of the Senior Secured Credit Facility and participated in the exit financing receiving a total ownership of 49.1% (inclusive of shares issued pursuant to commitment letter warrants) December 2007: Tropicana Entertainment, LLC denied renewal of gaming license in Atlantic City, removed Columbia Sussex Corporation as operator 2007 2008 2009 2010 Through 2006 2011 December 2010: Sold property in Vicksburg, MS November 2011: Icahn Enterprises LP cumulative ownership rises to 65.1%
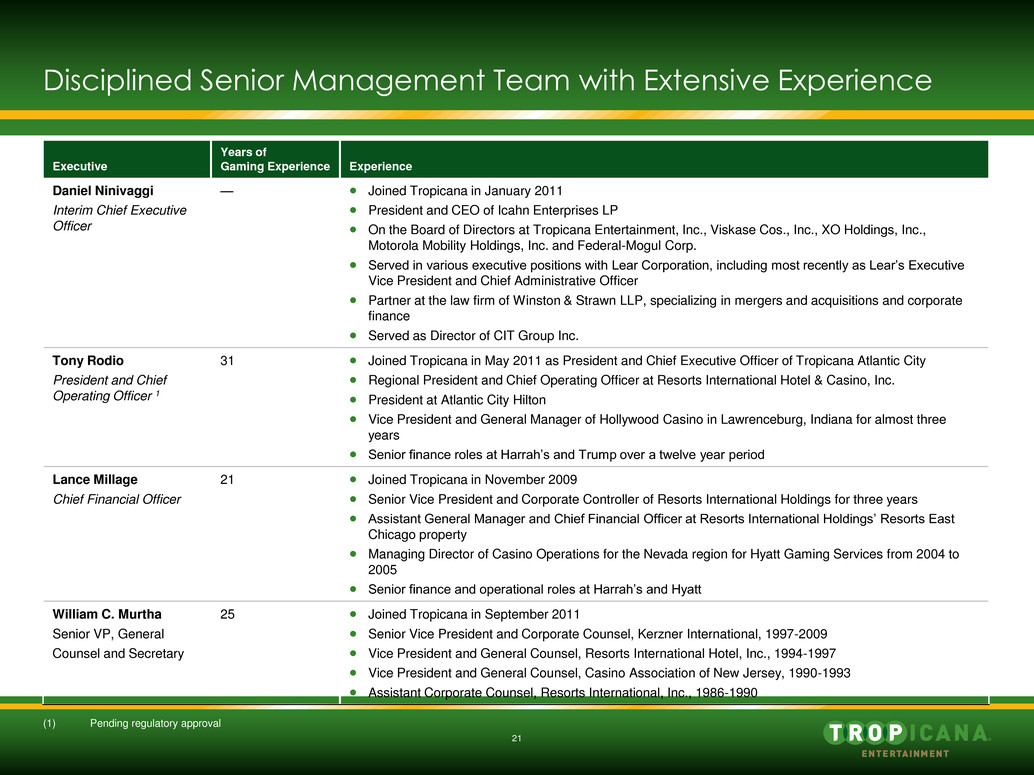
21 Executive Years of Gaming Experience Experience Daniel Ninivaggi Interim Chief Executive Officer — Joined Tropicana in January 2011 President and CEO of Icahn Enterprises LP On the Board of Directors at Tropicana Entertainment, Inc., Viskase Cos., Inc., XO Holdings, Inc., Motorola Mobility Holdings, Inc. and Federal-Mogul Corp. Served in various executive positions with Lear Corporation, including most recently as Lear’s Executive Vice President and Chief Administrative Officer Partner at the law firm of Winston & Strawn LLP, specializing in mergers and acquisitions and corporate finance Served as Director of CIT Group Inc. Tony Rodio President and Chief Operating Officer 1 31 Joined Tropicana in May 2011 as President and Chief Executive Officer of Tropicana Atlantic City Regional President and Chief Operating Officer at Resorts International Hotel & Casino, Inc. President at Atlantic City Hilton Vice President and General Manager of Hollywood Casino in Lawrenceburg, Indiana for almost three years Senior finance roles at Harrah’s and Trump over a twelve year period Lance Millage Chief Financial Officer 21 Joined Tropicana in November 2009 Senior Vice President and Corporate Controller of Resorts International Holdings for three years Assistant General Manager and Chief Financial Officer at Resorts International Holdings’ Resorts East Chicago property Managing Director of Casino Operations for the Nevada region for Hyatt Gaming Services from 2004 to 2005 Senior finance and operational roles at Harrah’s and Hyatt William C. Murtha Senior VP, General Counsel and Secretary 25 Joined Tropicana in September 2011 Senior Vice President and Corporate Counsel, Kerzner International, 1997-2009 Vice President and General Counsel, Resorts International Hotel, Inc., 1994-1997 Vice President and General Counsel, Casino Association of New Jersey, 1990-1993 Assistant Corporate Counsel, Resorts International, Inc., 1986-1990 Disciplined Senior Management Team with Extensive Experience (1) Pending regulatory approval

Section 5 Business Strategy
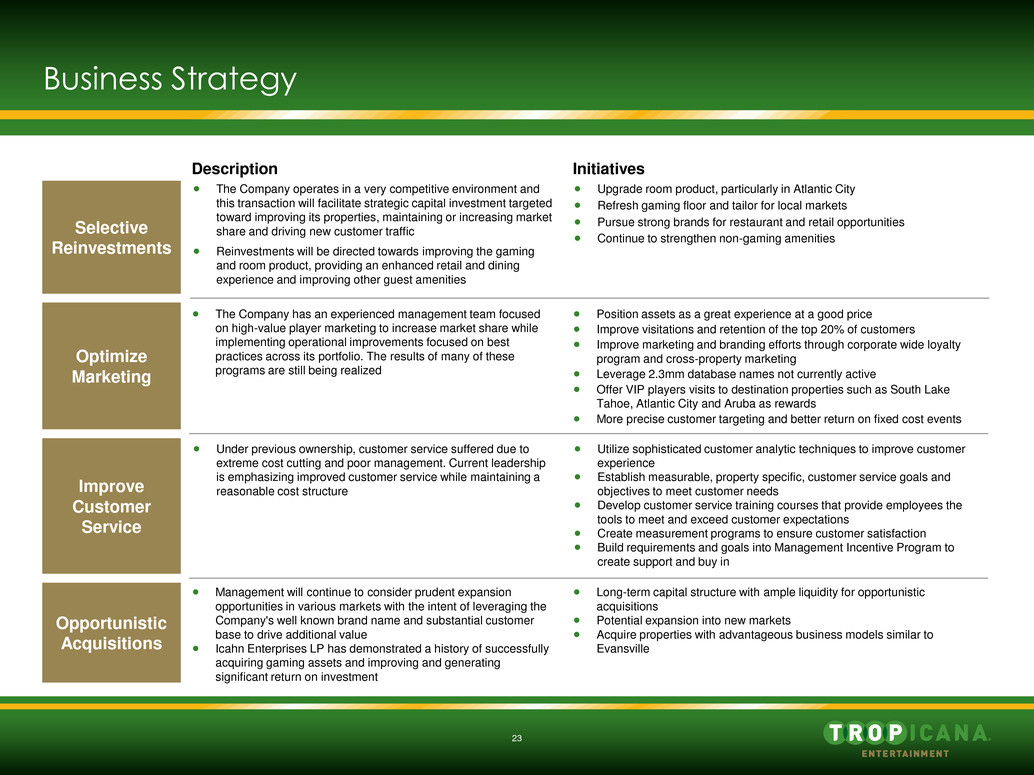
23 Business Strategy Selective Reinvestments Optimize Marketing Improve Customer Service Description Initiatives The Company operates in a very competitive environment and this transaction will facilitate strategic capital investment targeted toward improving its properties, maintaining or increasing market share and driving new customer traffic Reinvestments will be directed towards improving the gaming and room product, providing an enhanced retail and dining experience and improving other guest amenities Upgrade room product, particularly in Atlantic City Refresh gaming floor and tailor for local markets Pursue strong brands for restaurant and retail opportunities Continue to strengthen non-gaming amenities The Company has an experienced management team focused on high-value player marketing to increase market share while implementing operational improvements focused on best practices across its portfolio. The results of many of these programs are still being realized Position assets as a great experience at a good price Improve visitations and retention of the top 20% of customers Improve marketing and branding efforts through corporate wide loyalty program and cross-property marketing Leverage 2.3mm database names not currently active Offer VIP players visits to destination properties such as South Lake Tahoe, Atlantic City and Aruba as rewards More precise customer targeting and better return on fixed cost events Under previous ownership, customer service suffered due to extreme cost cutting and poor management. Current leadership is emphasizing improved customer service while maintaining a reasonable cost structure Utilize sophisticated customer analytic techniques to improve customer experience Establish measurable, property specific, customer service goals and objectives to meet customer needs Develop customer service training courses that provide employees the tools to meet and exceed customer expectations Create measurement programs to ensure customer satisfaction Build requirements and goals into Management Incentive Program to create support and buy in Opportunistic Acquisitions Management will continue to consider prudent expansion opportunities in various markets with the intent of leveraging the Company's well known brand name and substantial customer base to drive additional value Icahn Enterprises LP has demonstrated a history of successfully acquiring gaming assets and improving and generating significant return on investment Long-term capital structure with ample liquidity for opportunistic acquisitions Potential expansion into new markets Acquire properties with advantageous business models similar to Evansville
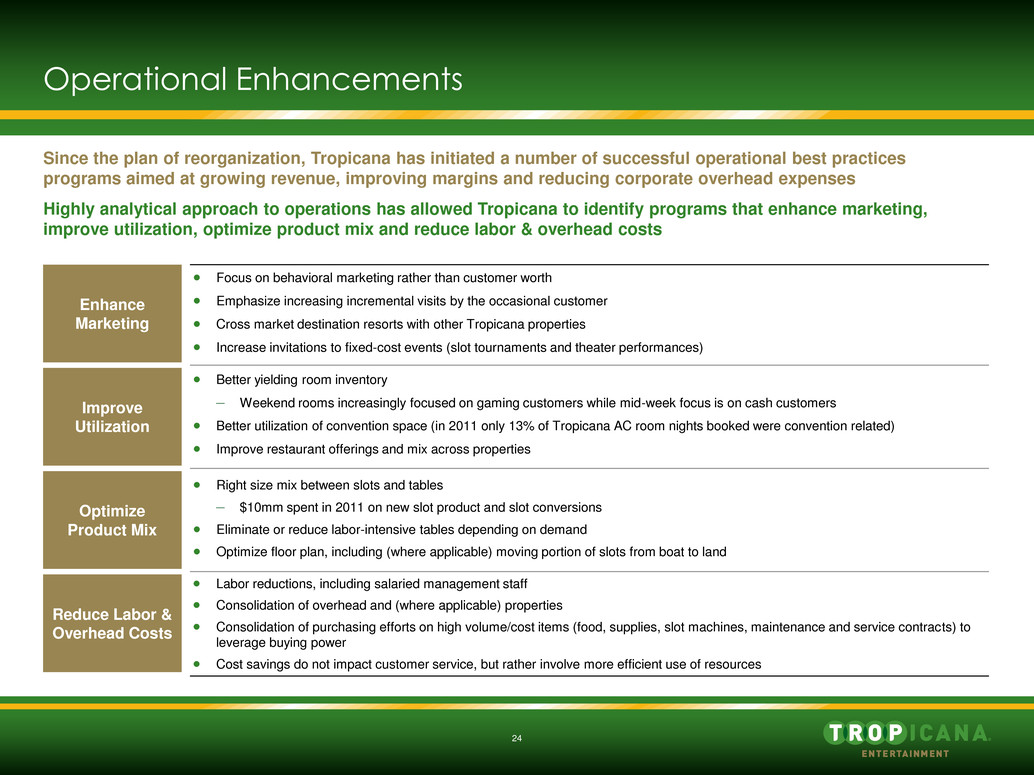
24 Operational Enhancements Enhance Marketing Improve Utilization Optimize Product Mix Focus on behavioral marketing rather than customer worth Emphasize increasing incremental visits by the occasional customer Cross market destination resorts with other Tropicana properties Increase invitations to fixed-cost events (slot tournaments and theater performances) Better yielding room inventory – Weekend rooms increasingly focused on gaming customers while mid-week focus is on cash customers Better utilization of convention space (in 2011 only 13% of Tropicana AC room nights booked were convention related) Improve restaurant offerings and mix across properties Right size mix between slots and tables – $10mm spent in 2011 on new slot product and slot conversions Eliminate or reduce labor-intensive tables depending on demand Optimize floor plan, including (where applicable) moving portion of slots from boat to land Labor reductions, including salaried management staff Consolidation of overhead and (where applicable) properties Consolidation of purchasing efforts on high volume/cost items (food, supplies, slot machines, maintenance and service contracts) to leverage buying power Cost savings do not impact customer service, but rather involve more efficient use of resources Reduce Labor & Overhead Costs Since the plan of reorganization, Tropicana has initiated a number of successful operational best practices programs aimed at growing revenue, improving margins and reducing corporate overhead expenses Highly analytical approach to operations has allowed Tropicana to identify programs that enhance marketing, improve utilization, optimize product mix and reduce labor & overhead costs

25 Targeted Marketing Strategy Focused on Maximizing ROI Increased emphasis on marketing analytics – Expansion of analytic capabilities with new regional analyst roles providing pro-active insights on marketing campaigns, segment profitability and patron behavior – Purchase and implementation of sophisticated business intelligence tools to increase relevance, timeliness and accuracy of customer centric intelligence – Expansion of testing efforts in all markets to include offer and audience testing – Rollout of new rule-based segmentation scheme that has been successfully tested at Tropicana AC – Renewed efforts to target high potential inactive players (2.3mm total inactive players) Leverage distribution network with new cross marketing programs encouraging incremental trips to key destination properties – Inclusion of destination travel benefit within Loyalty Programs (Trop Advantage and Diamond Club) – Inaugural enterprise-wide slot championship to be held at Tropicana AC to reward best players in the system – Special VIP events hosted by destination properties Expansion of Trop Advantage loyalty program, standardize brand and maximize awareness of Tropicana Entertainment properties within its 1mm active customer base – Seven of the Company’s eight properties will be interconnected through the Trop Advantage loyalty program by early 2012 – Lighthouse Point will be rebranded as Trop Casino Greenville

Section 6 Property Descriptions and Competitive Landscape
27 Eastern Region—Atlantic City
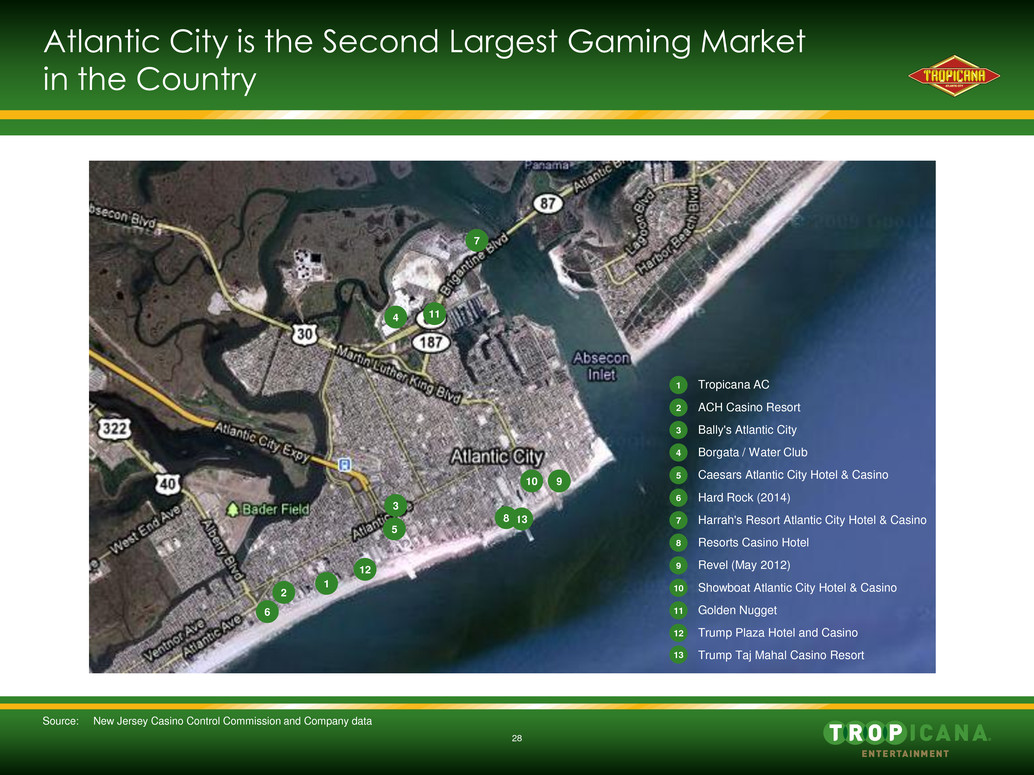
28 Atlantic City is the Second Largest Gaming Market in the Country Source: New Jersey Casino Control Commission and Company data 13 11 5 10 7 3 1 12 2 4 9 6 8 Tropicana AC ACH Casino Resort Bally's Atlantic City Borgata / Water Club Caesars Atlantic City Hotel & Casino Hard Rock (2014) Harrah's Resort Atlantic City Hotel & Casino Resorts Casino Hotel Revel (May 2012) Showboat Atlantic City Hotel & Casino Golden Nugget Trump Plaza Hotel and Casino Trump Taj Mahal Casino Resort 1 2 3 4 5 6 7 8 9 10 11 12 13
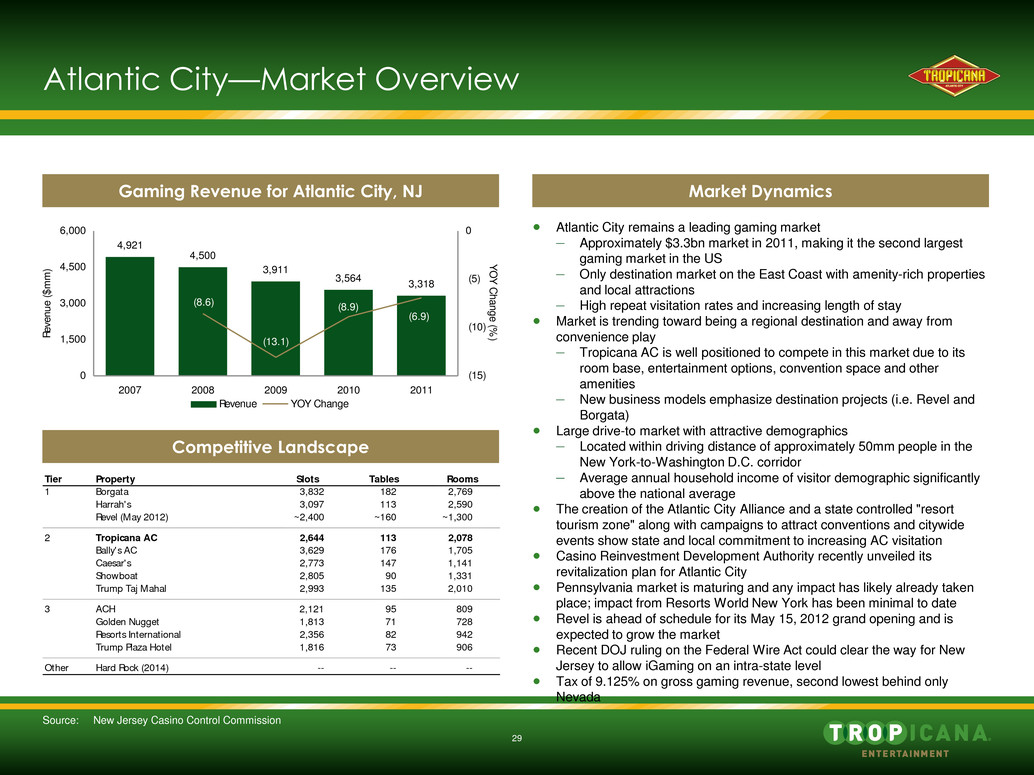
29 Atlantic City—Market Overview Market Dynamics Source: New Jersey Casino Control Commission Gaming Revenue for Atlantic City, NJ Competitive Landscape Atlantic City remains a leading gaming market – Approximately $3.3bn market in 2011, making it the second largest gaming market in the US – Only destination market on the East Coast with amenity-rich properties and local attractions – High repeat visitation rates and increasing length of stay Market is trending toward being a regional destination and away from convenience play – Tropicana AC is well positioned to compete in this market due to its room base, entertainment options, convention space and other amenities – New business models emphasize destination projects (i.e. Revel and Borgata) Large drive-to market with attractive demographics – Located within driving distance of approximately 50mm people in the New York-to-Washington D.C. corridor – Average annual household income of visitor demographic significantly above the national average The creation of the Atlantic City Alliance and a state controlled "resort tourism zone" along with campaigns to attract conventions and citywide events show state and local commitment to increasing AC visitation Casino Reinvestment Development Authority recently unveiled its revitalization plan for Atlantic City Pennsylvania market is maturing and any impact has likely already taken place; impact from Resorts World New York has been minimal to date Revel is ahead of schedule for its May 15, 2012 grand opening and is expected to grow the market Recent DOJ ruling on the Federal Wire Act could clear the way for New Jersey to allow iGaming on an intra-state level Tax of 9.125% on gross gaming revenue, second lowest behind only Nevada 4,921 4,500 3,911 3,564 3,318 (13.1) (8.9)(8.6) (6.9) 0 1,500 3,000 4,500 6,000 2007 2008 2009 2010 2011 Rev enu e ($ mm ) (15) (10) (5) 0 YOY Change (%) Revenue YOY Change Tier Property Slots Tables Rooms 1 Borgata 3,832 182 2,769 Harrah's 3,097 113 2,590 Revel (May 2012) ~2,400 ~160 ~1,300 2 Tropicana AC 2,644 113 2,078 Bally's AC 3,629 176 1,705 Caesar's 2,773 147 1,141 Showboat 2,805 90 1,331 Trump T j M h l 2,993 135 2,010 3 ACH 2,121 95 809 Golden Nugget 1,813 71 728 Resorts I rnational 2,356 82 942 Trump Pl za Hot l 1,816 73 906 Other Hard Rock (2014) -- -- --
30 Revitalization of Atlantic City In 2011, Governor Christie signed the Tourism District Act calling for a tourism district and master revitalization plan for Atlantic City – Shifted control of the Tourism Resort District from the city to the state; the areas covered by the district are: – The Boardwalk, Pacific and Atlantic Avenues – Marina District – Bader Field – Initial focus will be on revitalization of the Boardwalk, Pacific and Atlantic Avenues Atlantic City Alliance (“ACA”) was created to help accomplish the goals of the Tourism District Act – Public/private agency tasked with improving the image of Atlantic City as a regional destination and promoting city-wide convention business and events – Annual payments from Atlantic City casinos of $30mm that previously went to subsidize the horse racing industry will now fund ACA operations and initiatives; no additional costs will be incurred by the casino operators for ACA initiatives – Advertising and image campaigns will promote Atlantic City as a leisure and convention destination – Create image of Atlantic City as a viable convention city – Promote city-wide events to drive incremental visitation Casino Reinvestment Development Authority (“CRDA”) was tasked with creating a master plan for the revitalization of Atlantic City – Ability to provide tax credits and incentives as well as redevelopment loans (e.g. Steel Pier redevelopment loan) – CRDA Tourism District Master Plan was recently approved and calls for: – Focusing on the redevelopment of the Boardwalk and beaches – Continuing the city’s demolition program – Enforcing zoning codes fairly and consistently – Offering Economic Redevelopment and Growth grants and other incentives – “Transforming” Atlantic and Pacific Avenues with restaurants, storefronts and entertainment; Tropicana AC was cited as a positive influence on the new urban district due to the Pacific Avenue entrance to the Quarter The state of New Jersey has taken an active and aggressive role in the revitalization of Atlantic City
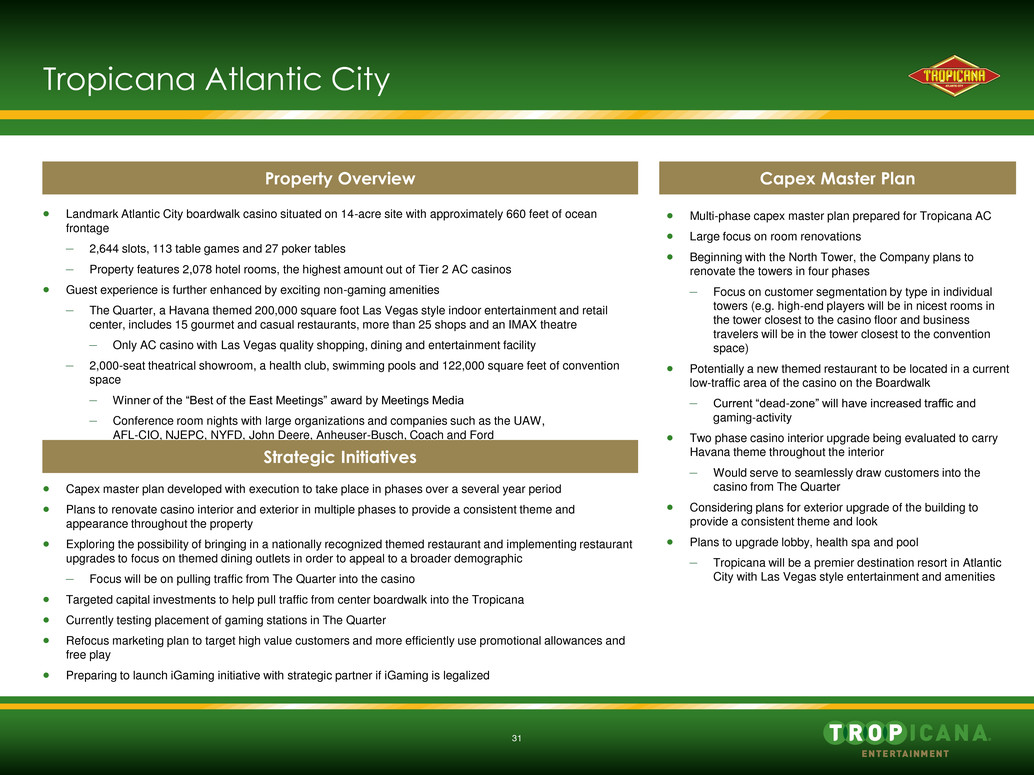
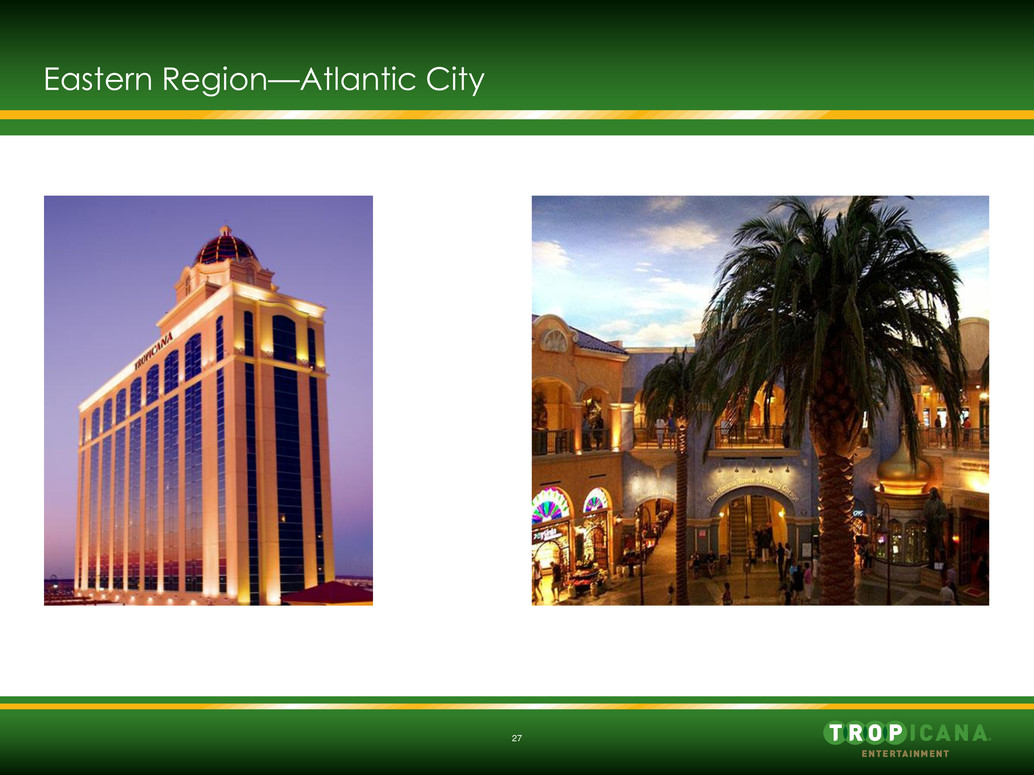
31 Tropicana Atlantic City Landmark Atlantic City boardwalk casino situated on 14-acre site with approximately 660 feet of ocean frontage – 2,644 slots, 113 table games and 27 poker tables – Property features 2,078 hotel rooms, the highest amount out of Tier 2 AC casinos Guest experience is further enhanced by exciting non-gaming amenities – The Quarter, a Havana themed 200,000 square foot Las Vegas style indoor entertainment and retail center, includes 15 gourmet and casual restaurants, more than 25 shops and an IMAX theatre – Only AC casino with Las Vegas quality shopping, dining and entertainment facility – 2,000-seat theatrical showroom, a health club, swimming pools and 122,000 square feet of convention space – Winner of the “Best of the East Meetings” award by Meetings Media – Conference room nights with large organizations and companies such as the UAW, AFL-CIO, NJEPC, NYFD, John Deere, Anheuser-Busch, Coach and Ford Capex master plan developed with execution to take place in phases over a several year period Plans to renovate casino interior and exterior in multiple phases to provide a consistent theme and appearance throughout the property Exploring the possibility of bringing in a nationally recognized themed restaurant and implementing restaurant upgrades to focus on themed dining outlets in order to appeal to a broader demographic – Focus will be on pulling traffic from The Quarter into the casino Targeted capital investments to help pull traffic from center boardwalk into the Tropicana Currently testing placement of gaming stations in The Quarter Refocus marketing plan to target high value customers and more efficiently use promotional allowances and free play Preparing to launch iGaming initiative with strategic partner if iGaming is legalized Strategic Initiatives Property Overview Capex Master Plan Multi-phase capex master plan prepared for Tropicana AC Large focus on room renovations Beginning with the North Tower, the Company plans to renovate the towers in four phases – Focus on customer segmentation by type in individual towers (e.g. high-end players will be in nicest rooms in the tower closest to the casino floor and business travelers will be in the tower closest to the convention space) Potentially a new themed restaurant to be located in a current low-traffic area of the casino on the Boardwalk – Current “dead-zone” will have increased traffic and gaming-activity Two phase casino interior upgrade being evaluated to carry Havana theme throughout the interior – Would serve to seamlessly draw customers into the casino from The Quarter Considering plans for exterior upgrade of the building to provide a consistent theme and look Plans to upgrade lobby, health spa and pool – Tropicana will be a premier destination resort in Atlantic City with Las Vegas style entertainment and amenities
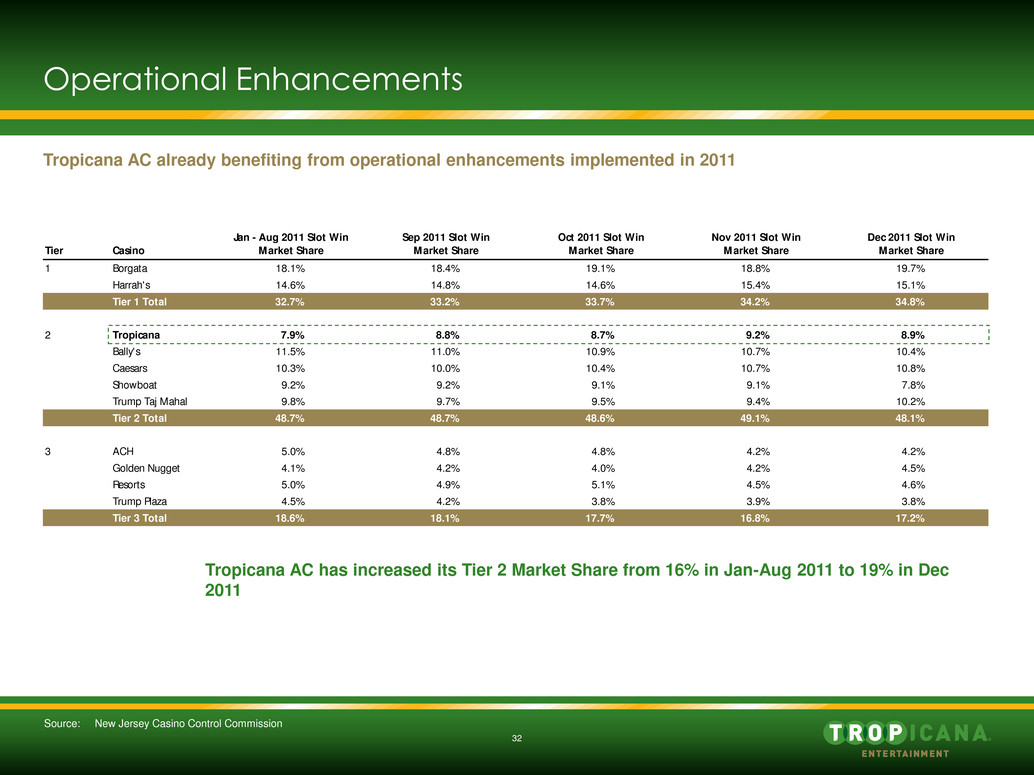
32 Operational Enhancements Tropicana AC already benefiting from operational enhancements implemented in 2011 Source: New Jersey Casino Control Commission Tropicana AC has increased its Tier 2 Market Share from 16% in Jan-Aug 2011 to 19% in Dec 2011 Tier Casino Jan - Aug 2011 Slot Win Market Share Sep 2011 Slot Win Market Share Oct 2011 Slot Win Market Share Nov 2011 Slot Win Market Share Dec 2011 Slot Win Market Share 1 Borgata 18.1% 18.4% 19.1% 18.8% 19.7% Harrah's 14.6% 14.8% 14.6% 15.4% 15.1% Tier 1 Total 32.7% 33.2% 33.7% 34.2% 34.8% 2 Tropicana 7.9% 8.8% 8.7% 9.2% 8.9% Bally's 11.5% 11.0% 10.9% 10.7% 10.4% Caesars 10.3% 10.0% 10.4% 10.7% 10.8% Showboat 9.2% 9.2% 9.1% 9.1% 7.8% Trump Taj Mahal 9.8% 9.7% 9.5% 9.4% 10.2% Tier 2 Total 48.7% 48.7% 48.6% 49.1% 48.1% 3 ACH 5.0% 4.8% 4.8% 4.2% 4.2% Golden Nugget 4.1% 4.2% 4.0% 4.2% 4.5% Resorts 5.0% 4.9% 5.1% 4.5% 4.6% Trump Plaza 4.5% 4.2% 3.8% 3.9% 3.8% Tier 3 Total 18.6% 18.1% 17.7% 16.8% 17.2%
33 Central Region—Evansville
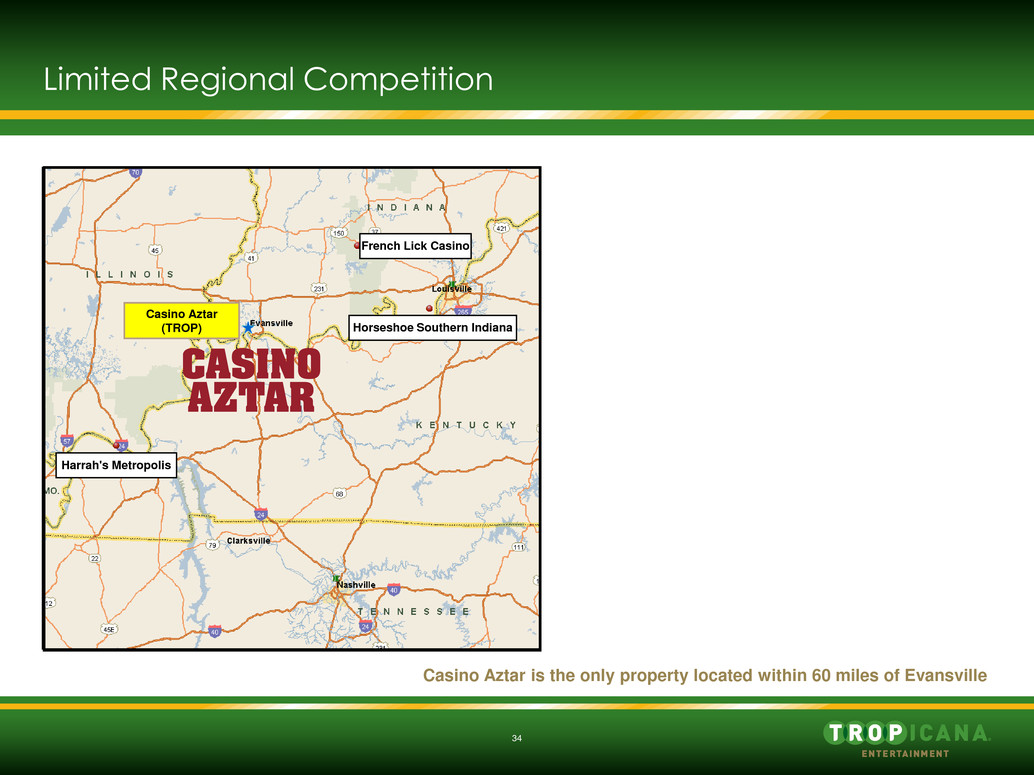
34 Limited Regional Competition Casino Aztar is the only property located within 60 miles of Evansville Harrah's Metropolis French Lick Casino Horseshoe Southern Indiana Casino Aztar (TROP)
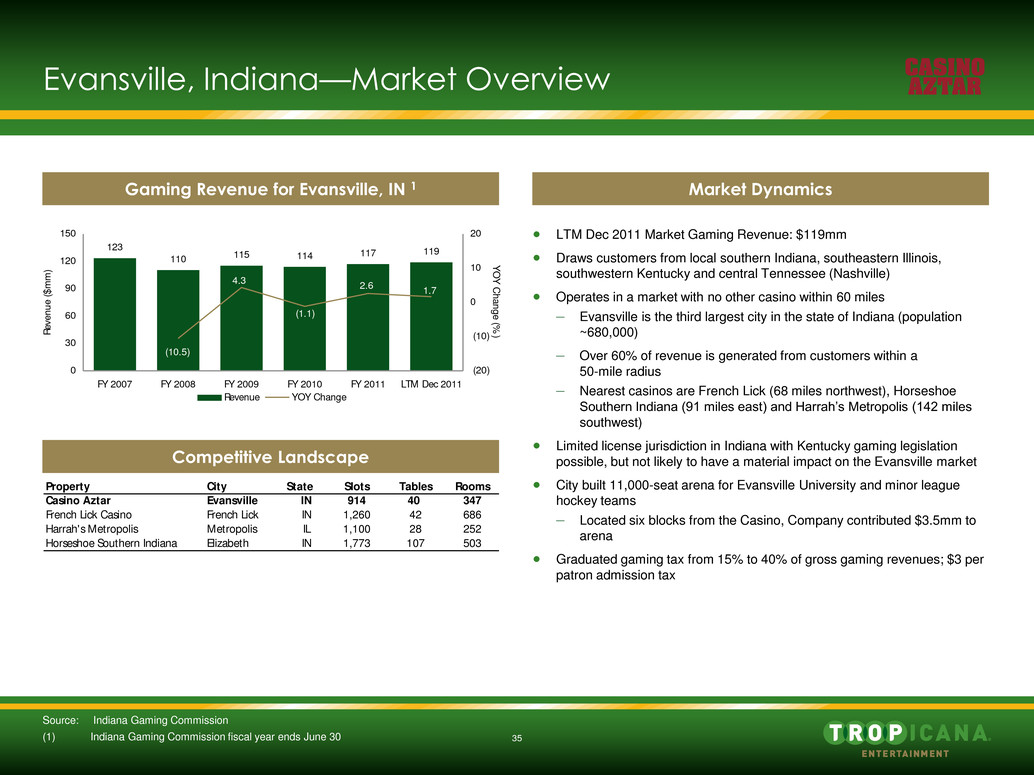
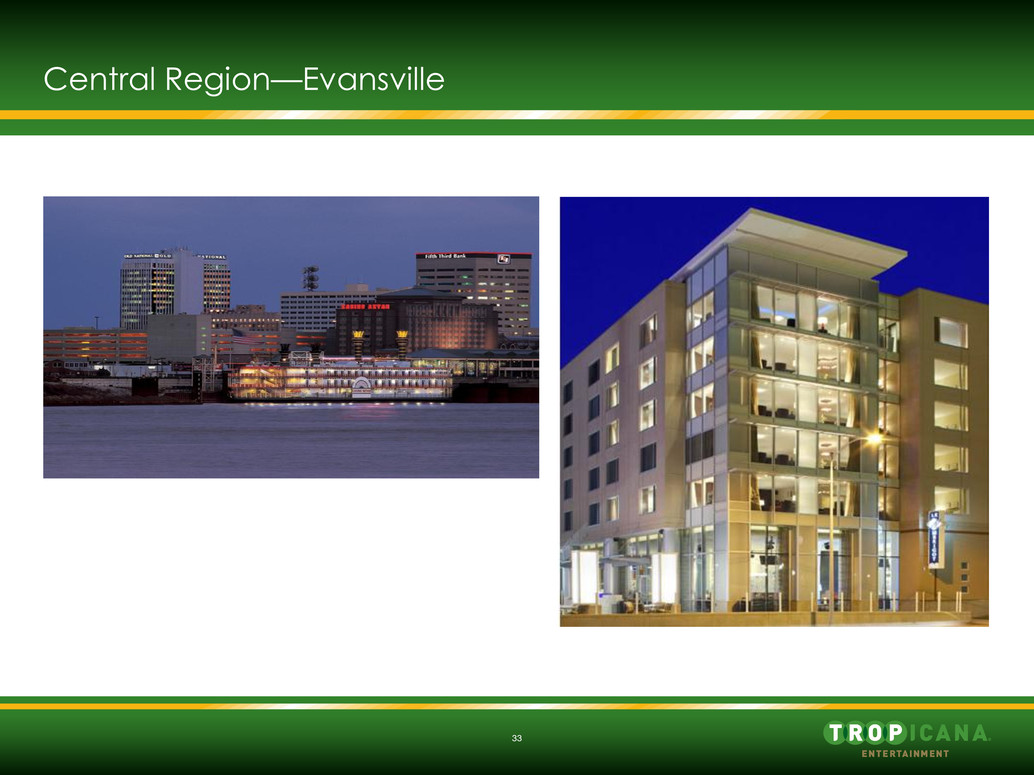
35 Evansville, Indiana—Market Overview Gaming Revenue for Evansville, IN 1 Market Dynamics Competitive Landscape LTM Dec 2011 Market Gaming Revenue: $119mm Draws customers from local southern Indiana, southeastern Illinois, southwestern Kentucky and central Tennessee (Nashville) Operates in a market with no other casino within 60 miles – Evansville is the third largest city in the state of Indiana (population ~680,000) – Over 60% of revenue is generated from customers within a 50-mile radius – Nearest casinos are French Lick (68 miles northwest), Horseshoe Southern Indiana (91 miles east) and Harrah’s Metropolis (142 miles southwest) Limited license jurisdiction in Indiana with Kentucky gaming legislation possible, but not likely to have a material impact on the Evansville market City built 11,000-seat arena for Evansville University and minor league hockey teams – Located six blocks from the Casino, Company contributed $3.5mm to arena Graduated gaming tax from 15% to 40% of gross gaming revenues; $3 per patron admission tax Property City State Slots Tables Rooms Casino Aztar Evansville IN 914 40 347 French Lick Casino French Lick I 1,260 42 686 Harrah's Metropolis Metropolis IL 1,100 28 252 orseshoe Southern Indiana Elizabeth IN 1,773 107 503 123 110 115 114 117 119 1.7 (1.1) (10.5) 4.3 2.6 0 30 60 90 120 150 FY 2007 FY 2008 FY 2009 FY 2010 FY 2011 LTM Dec 2011 Rev enu e ($ mm ) (20) (10) 0 10 20 YOY Change (%) Revenue YOY Change (1) Indiana Gaming Commission fiscal year ends June 30 Source: Indiana Gaming Commission
36 Casino Aztar Strategic Initiatives Plans to renovate 251 room Hotel Aztar Targeted casino improvements to enhance customer experience Continued focus and penetration into underserved middle Tennessee (Nashville) markets – Utilize renovated hotel room product and entertainment venues to drive overnight cash and casino business Evaluate potential to obtain USCG Permanently Moored Status to mitigate marine crew expenses Targeted marketing to customer database to continue improved yield on gaming revenue from promotional expenditures Continued focus on expense management and labor savings – 2011 operating expenses $1.5mm favorable to PY including city rent expense increase of $4mm Property Overview Located in downtown Evansville, IN on approximately 20 acres along the Ohio River 914 slots and 40 table games, including 10 poker tables Two unique hotels catering to a broad demographic – Hotel Aztar includes 251 guest rooms, one restaurant, conference rooms and banquet facilities – Le Merigot, a boutique hotel, includes 96 rooms and an upscale lounge 44,000-square foot pavilion adjacent to the riverboat features three restaurants, an entertainment lounge, gift shop, coffee counter, VIP players lounge and a players club $33mm entertainment complex on a seven acre Waterfront Entertainment District attracts customers to casino zone – Includes two restaurants operated by third party tenants, a large park, and Le Merigot Hotel located across from and connected via pedestrian bridge (to be completed in Q1 2012) to Casino Aztar pavilion Seven-story parking garage and surface parking with a combined total of 2,100 parking spaces 10 of the 20 acres on which Casino Aztar is situated is leased from the City of Evansville
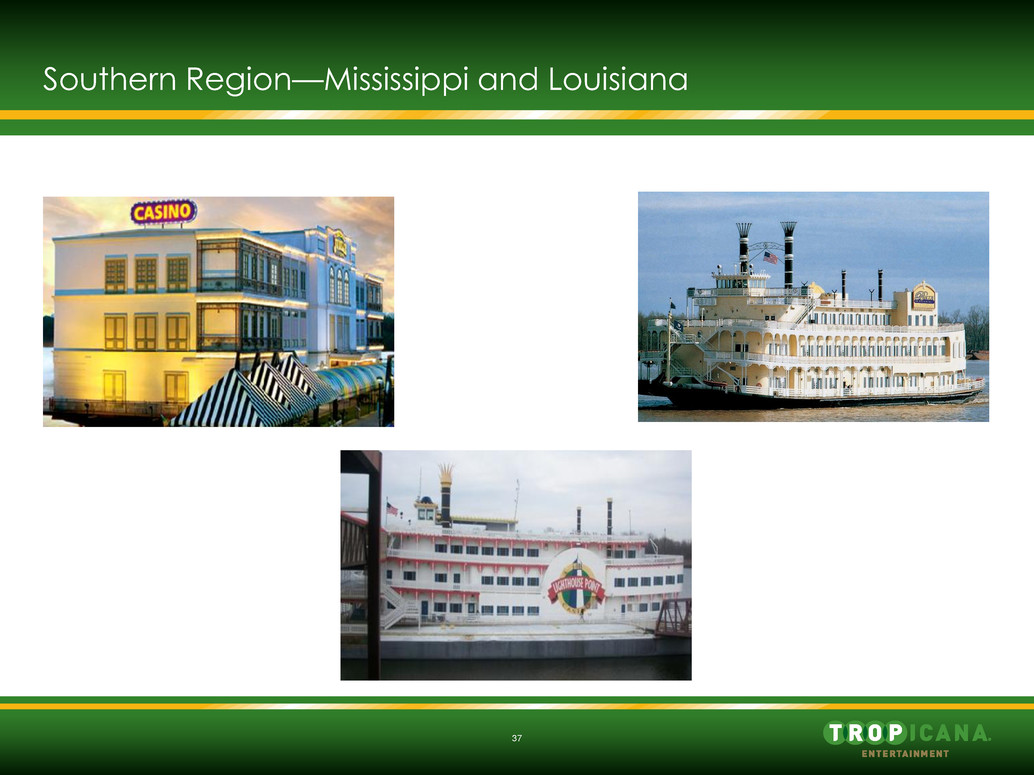
37 Southern Region—Mississippi and Louisiana

38 Baton Rouge, Louisiana—Market Overview Hollywood Casino Baton Rouge (PENN) L’Auberge Casino and Hotel (PNK)
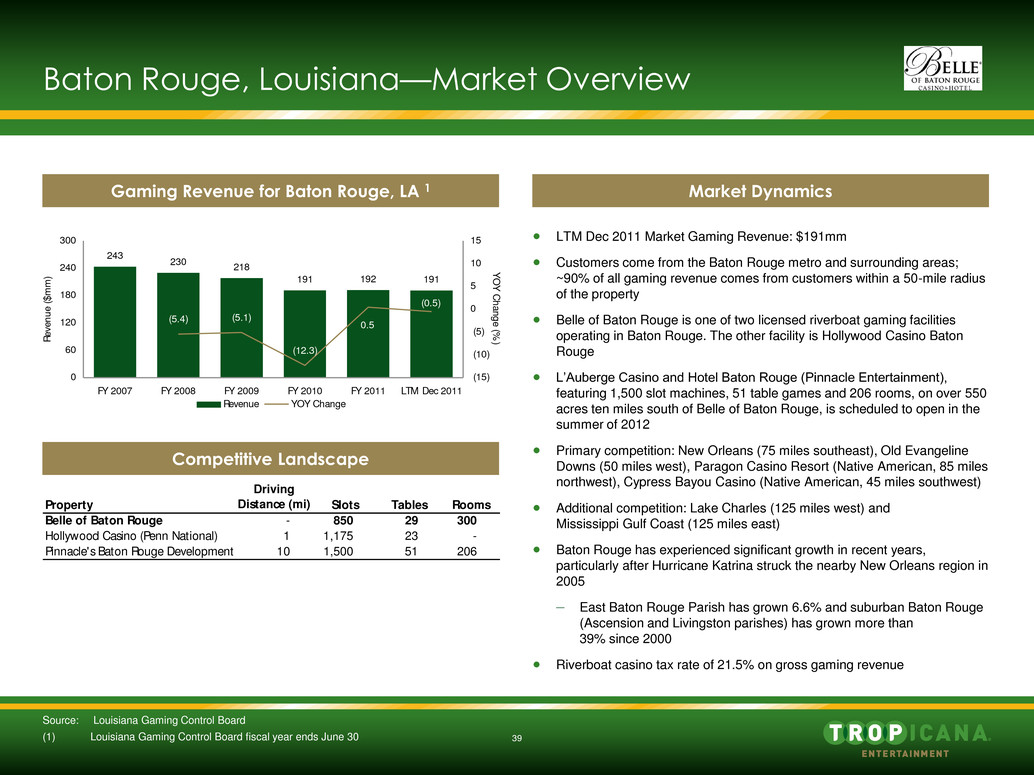
39 Baton Rouge, Louisiana—Market Overview Gaming Revenue for Baton Rouge, LA 1 Market Dynamics Competitive Landscape LTM Dec 2011 Market Gaming Revenue: $191mm Customers come from the Baton Rouge metro and surrounding areas; ~90% of all gaming revenue comes from customers within a 50-mile radius of the property Belle of Baton Rouge is one of two licensed riverboat gaming facilities operating in Baton Rouge. The other facility is Hollywood Casino Baton Rouge L’Auberge Casino and Hotel Baton Rouge (Pinnacle Entertainment), featuring 1,500 slot machines, 51 table games and 206 rooms, on over 550 acres ten miles south of Belle of Baton Rouge, is scheduled to open in the summer of 2012 Primary competition: New Orleans (75 miles southeast), Old Evangeline Downs (50 miles west), Paragon Casino Resort (Native American, 85 miles northwest), Cypress Bayou Casino (Native American, 45 miles southwest) Additional competition: Lake Charles (125 miles west) and Mississippi Gulf Coast (125 miles east) Baton Rouge has experienced significant growth in recent years, particularly after Hurricane Katrina struck the nearby New Orleans region in 2005 – East Baton Rouge Parish has grown 6.6% and suburban Baton Rouge (Ascension and Livingston parishes) has grown more than 39% since 2000 Riverboat casino tax rate of 21.5% on gross gaming revenue 243 230 218 191 192 191 (5.4) (5.1) (12.3) (0.5) 0.5 0 60 120 180 240 300 FY 2007 FY 2008 FY 2009 FY 2010 FY 2011 LTM Dec 2011 Rev enu e ($ mm ) (15) (10) (5) 0 5 10 15 YOY Change (%) Revenue YOY Change Property Driving Distance (mi) Slots Tables Rooms Belle of Baton Rouge - 850 29 300 Hollywood Casino (Penn National) 1 1,175 23 - Pinnacle's Baton Rou Development 10 1,500 51 206 (1) Louisiana Gaming Control Board fiscal year ends June 30 Source: Louisiana Gaming Control Board
40 Belle of Baton Rouge Casino Three-deck, dockside riverboat casino situated on 23 acres on the Mississippi River in the downtown historic district of Baton Rouge – Directly across from the popular River Center area—attractions include the USS Kidd, State Capitol, Baton Rouge Convention Center and museum district 850 slot machines and 29 table games Only casino in the downtown area with hotel rooms with significant non-gaming customers Additional amenities include – 25,000 square feet of Atrium, meeting and convention space, outdoor pool, fitness center and three restaurants Two parking garages with a total of 827 parking spaces – New 326-space parking garage opened June 2008—superior and most convenient parking facility in market Attracts LSU visitors and is within close proximity with shuttle service to the football stadium Easiest and closest driving access for ~70% of local Baton Rouge customer population “Build a fence” around local, known, high value customers in areas that are considered a risk to Pinnacle by increasing marketing and promotional spend targeted on those customers Leverage recent $6mm boat renovations and walkway enclosure to keep market share Focus on bringing third party tenants and events into the Atrium Leverage hotel, downtown location and proximity to convention center Maintain hotel’s focus on mid-week cash business and profitable operations Reduced cost structure in response to Pinnacle opening Strategic Initiatives Property Overview
41 Greenville, MS—Market Overview Gaming Revenue for MS River Counties Market Dynamics Competitive Landscape Greenville gaming market revenues of approximately $75mm Customers primarily come from a 30-mile radius around Greenville, with additional customers from Little Rock, AR metro and surrounding areas Population of approximately 252,000 within a 50 mile radius Harlow’s Casino (land-based) is the only other casino in the Greenville market – Acquired by Churchill Downs for $138mm in December 2010 (estimated 6.5-7.0x EBITDA) – Recently began renovation and expansion project (completion expected early 2013) to address hospitality areas impacted by the severe Mississippi River flooding in Spring 2011 To some extent, the Greenville market competes with the Vicksburg, MS market (90 miles away) and the Tunica, MS market (115 miles away) Mississippi is an unlimited gaming license jurisdiction; however, gaming is restricted to fourteen counties that border the Gulf Coast or Mississippi River Among the most gaming friendly states with respect to taxes and regulatory matters Gaming tax peaks at 12%, third lowest behind only Nevada and New Jersey Property Slots Tables Rooms Lighthouse Point and Jubilee 969 7 41 Harlow's Casino Resort 8 0 15 105 Revenue ($mm) $69.4 $68.3 $62.8 $53.8 $54.7 40.0 50.0 60.0 70.0 80.0 2010A 2011E 2012E 2013E 2014E 1,589 1,463 1,350 1,282 1,142 (7.9) (7.7) (5.0) (11.0) 0 400 800 1,200 1,600 2,000 2007 2008 2009 2010 2011 Rev enu e ($ mm ) (15) (10) (5) 0 5 10 YOY Change (%) Revenue YOY Change Source: Mississippi Gaming Commission
42 Lighthouse Point Casino 210-foot riverboat, housing a three floor casino, with 22,000 square feet of gaming space and 510 slot machines Lighthouse Point and Jubilee are less than a half mile apart and share management 41 room hotel less than half a mile from the property Onsite deli, multiple bars and additional 512-space shared parking lot located offsite $4mm renovation completed in January 2008 Jubilee Casino 240-foot riverboat, three-deck dockside riverboat features a casino on two floors with 28,500 square feet of gaming space and 459 slot machines and seven table games Onsite facility with a deli, multiple bars and a 200-space parking lot with an additional 512-space shared parking lot located offsite $4mm renovation completed in November 2007 Lighthouse Point & Jubilee Jubilee will be closed and resources will be consolidated at Lighthouse Point which will be rebranded as Trop Casino Greenville – Eliminates the duplicative cost structure of two properties while creating a market leading, land based gaming experience Land based pavilion will be renovated with insurance proceeds from the recent Mississippi River flooding ~375-400 slots will be land based in the pavilion ~175 slots will remain on one floor of the riverboat Table games to be added to Lighthouse Point facility Increase in marketing and promotions to retain existing customers and attract new business from competitors Evaluate the potential of additional expansion of the land side facility with complete elimination of casino operations and associated cost structure of the riverboat Strategic Initiatives Property Overview
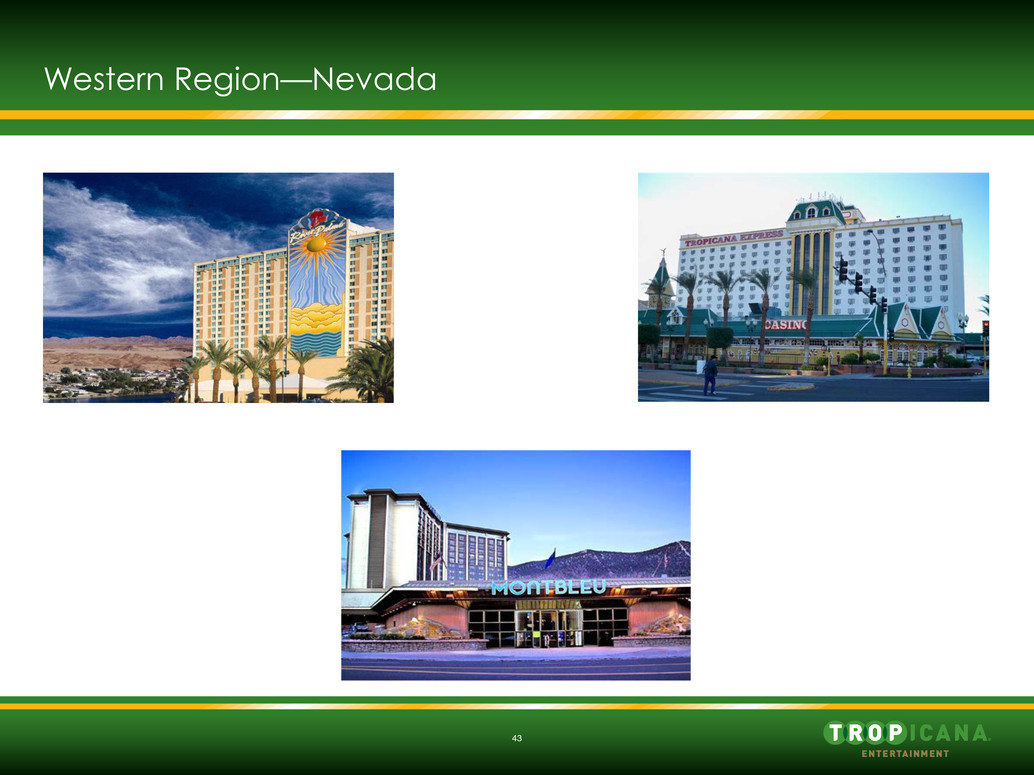
43 Western Region—Nevada
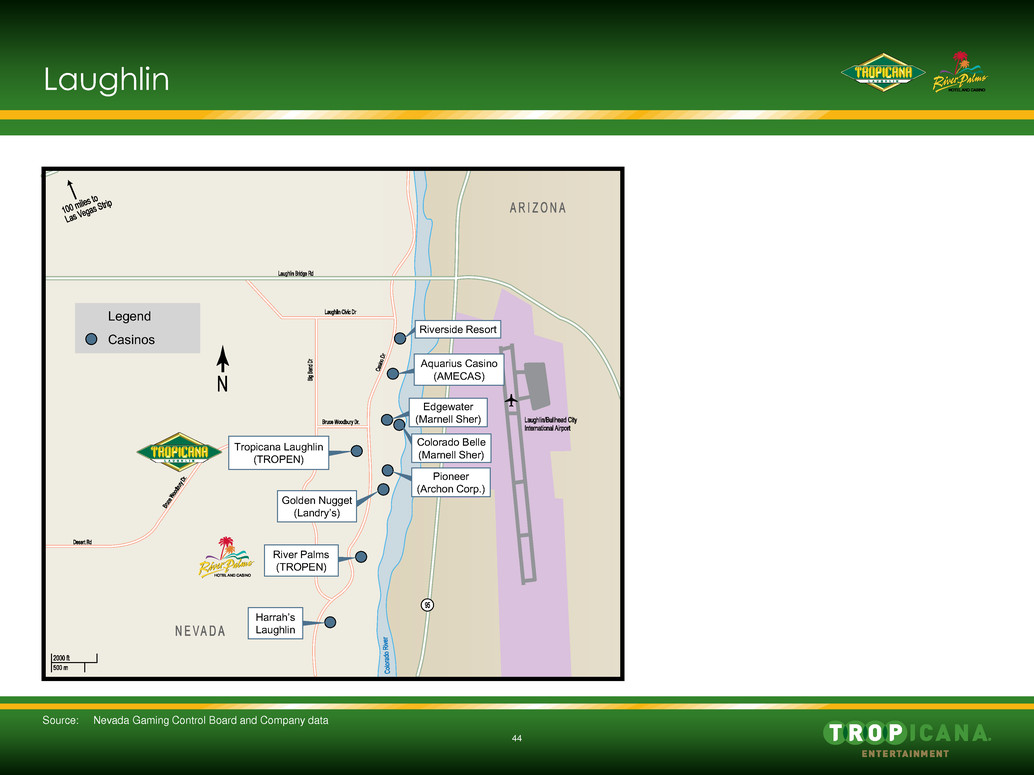
44 Laughlin Source: Nevada Gaming Control Board and Company data River Palms (TROP) Harrah’s Laughlin River Palms (TROPEN) Golden Nugget (Landry’s) Pioneer (Archon Corp.) Colorado Belle (Marnell Sher) Edgewater (Marnell Sher) Riverside Resort Aquarius Casino (AMECAS) Tropicana Laughlin (TROPEN) Legend Casinos
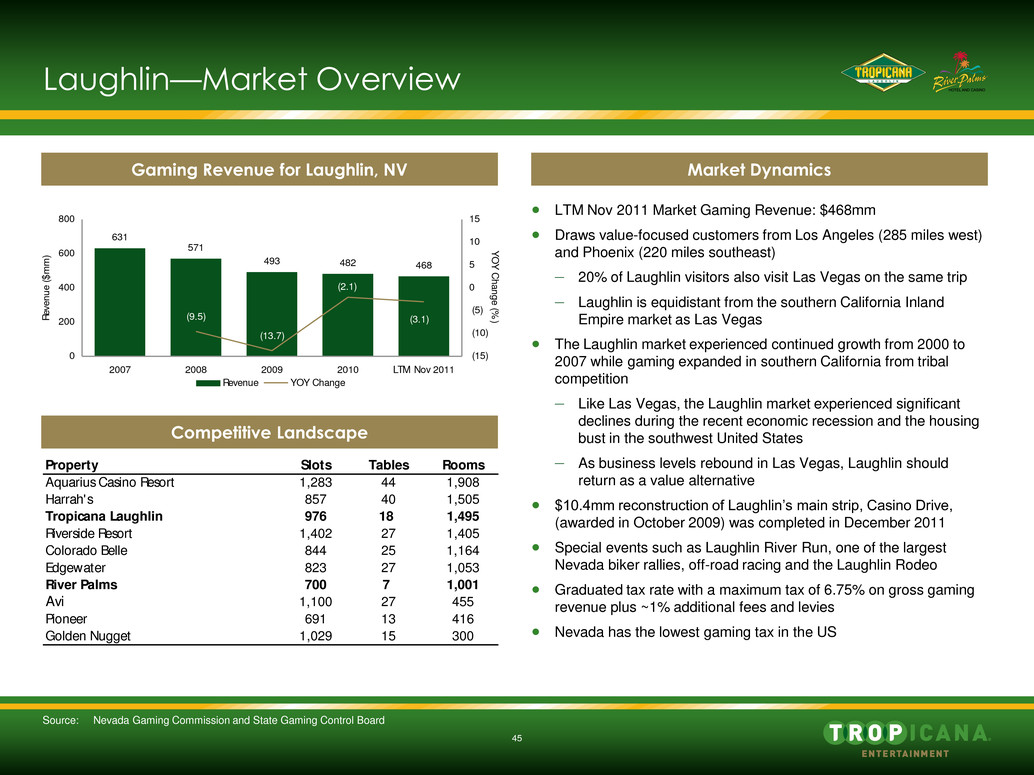
45 Property Slots Tables Rooms Aquarius Casino Resort 1,283 44 1,908 Harrah's 857 40 1,505 Tropicana Laughlin 976 18 1,495 Riverside Resort 1,402 27 1,405 Colorado Belle 844 25 1,164 Edgewater 823 27 1,053 River Palms 700 7 1,001 Avi 1,100 27 455 Pioneer 691 13 416 Golden Nugget 1,029 15 300 Laughlin—Market Overview Gaming Revenue for Laughlin, NV Market Dynamics Competitive Landscape LTM Nov 2011 Market Gaming Revenue: $468mm Draws value-focused customers from Los Angeles (285 miles west) and Phoenix (220 miles southeast) – 20% of Laughlin visitors also visit Las Vegas on the same trip – Laughlin is equidistant from the southern California Inland Empire market as Las Vegas The Laughlin market experienced continued growth from 2000 to 2007 while gaming expanded in southern California from tribal competition – Like Las Vegas, the Laughlin market experienced significant declines during the recent economic recession and the housing bust in the southwest United States – As business levels rebound in Las Vegas, Laughlin should return as a value alternative $10.4mm reconstruction of Laughlin’s main strip, Casino Drive, (awarded in October 2009) was completed in December 2011 Special events such as Laughlin River Run, one of the largest Nevada biker rallies, off-road racing and the Laughlin Rodeo Graduated tax rate with a maximum tax of 6.75% on gross gaming revenue plus ~1% additional fees and levies Nevada has the lowest gaming tax in the US 631 571 493 482 468 (9.5) (1 .7) (3.1) (2.1) 0 200 400 600 800 2007 2008 2009 2010 LTM Nov 2011 Rev enu e ($ mm ) (15) (10) (5) 0 5 10 15 YOY Change (%) Revenue YOY Change Source: Nevada Gaming Commission and State Gaming Control Board
46 Tropicana Laughlin & River Palms Tropicana Laughlin Centrally located on Casino Drive on ~31 acres – 976 slot machines and 18 table games – Voted “Best Accommodations” in Laughlin for 10 years running Locals account for 40% of business 1,495 hotel rooms, swimming pool and spa, seven restaurants, an entertainment lounge, 800 seat multi-purpose event center and a premium lounge for high- end players Completed $11mm hotel room renovation in 2007, remodeled 1,200 hotel rooms, including premium bedding and linen, positioning those hotel rooms as the highest quality standard room product in the Laughlin market River Palms 58,000 square foot casino located on a 35-acre site with ~1,300 feet of frontage on the Colorado River 700 slot machines and 7 table games 1,001 hotel rooms with full service spa, beauty salon, fitness center and restaurants Amenities include 10,500 square feet of meeting and convention space, an outdoor pool, fitness center, three restaurants, three full service bars, a showroom, two entertainment lounges and a covered parking structure Targeted marketing on profitable local customers (Loyal Locals) Focused group sales marketing efforts in Inland Empire and Phoenix to promote Tropicana properties as leaders in Laughlin and as a value alternative to Las Vegas Capital improvements focused on providing slot product and amenities that differentiate the Tropicana properties in the market – Evaluating plan for the addition of a southern California based, well-known Hispanic restaurant River Palms using electronic, virtual table games pit during slow, mid-week periods Exploring strategic alternatives for River Palms to maximize value Strategic Initiatives Property Overview
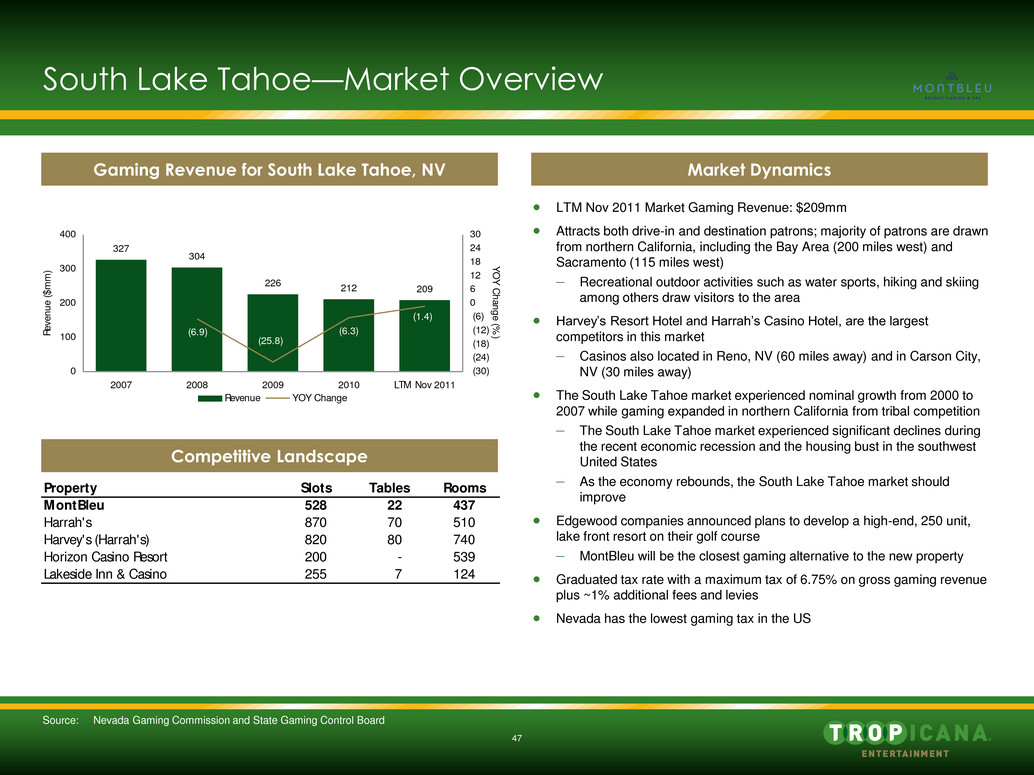
47 South Lake Tahoe—Market Overview Competitive Landscape LTM Nov 2011 Market Gaming Revenue: $209mm Attracts both drive-in and destination patrons; majority of patrons are drawn from northern California, including the Bay Area (200 miles west) and Sacramento (115 miles west) – Recreational outdoor activities such as water sports, hiking and skiing among others draw visitors to the area Harvey’s Resort Hotel and Harrah’s Casino Hotel, are the largest competitors in this market – Casinos also located in Reno, NV (60 miles away) and in Carson City, NV (30 miles away) The South Lake Tahoe market experienced nominal growth from 2000 to 2007 while gaming expanded in northern California from tribal competition – The South Lake Tahoe market experienced significant declines during the recent economic recession and the housing bust in the southwest United States – As the economy rebounds, the South Lake Tahoe market should improve Edgewood companies announced plans to develop a high-end, 250 unit, lake front resort on their golf course – MontBleu will be the closest gaming alternative to the new property Graduated tax rate with a maximum tax of 6.75% on gross gaming revenue plus ~1% additional fees and levies Nevada has the lowest gaming tax in the US Gaming Revenue for South Lake Tahoe, NV Market Dynamics Property Slots Tables Rooms MontBleu 528 22 437 Harrah's 870 70 510 Harvey's (Harrah's) 820 80 740 Horizon Casino Resort 200 - 539 Lakeside Inn & Casino 255 7 124 327 304 226 212 209 (25.8) (1.4) (6.9) (6.3) 0 100 200 300 400 2007 2008 2009 2010 LTM Nov 2011 Rev enu e ($ mm ) (30) (24) (18) (12) (6) 0 6 12 18 24 30 YOY Change (%) Revenue YOY Change Source: Nevada Gaming Commission and State Gaming Control Board
48 MontBleu Casino & Spa 45,000 square foot casino situated on 21 acres surrounded by the breathtaking Sierra Nevada mountains 528 slots machines and 22 table games Property includes 437 hotel rooms In May 2006, an extensive $20mm+ re-branding and refurbishment of the property’s casino, lobby, retail facilities, restaurants and nightclubs was completed Amenities include race and sports book, parking garage, retail shops, three restaurants, two nightclubs, full service health spa and workout area, a 1,500-seat auditorium, 14,000 square feet of convention space and a wedding chapel that seats up to 120 Originally Caesars Tahoe; property’s infrastructure is of high quality Cross market property with other Tropicana affiliated casinos across the country Replace high-priced entertainment with more cost-effective, four wall options Continue to focus on building MontBleu brand with promotions and entertainment schedule – Continue emphasis on establishing MontBleu as the locals choice with value food and entertainment options Establish plan to make MontBleu a market competitive, first class option to Harrah’s and Harvey’s – Significant upside to cash ADR versus competitors – Capture fair share of gaming market Strategic Initiatives Property Overview
49 Aruba
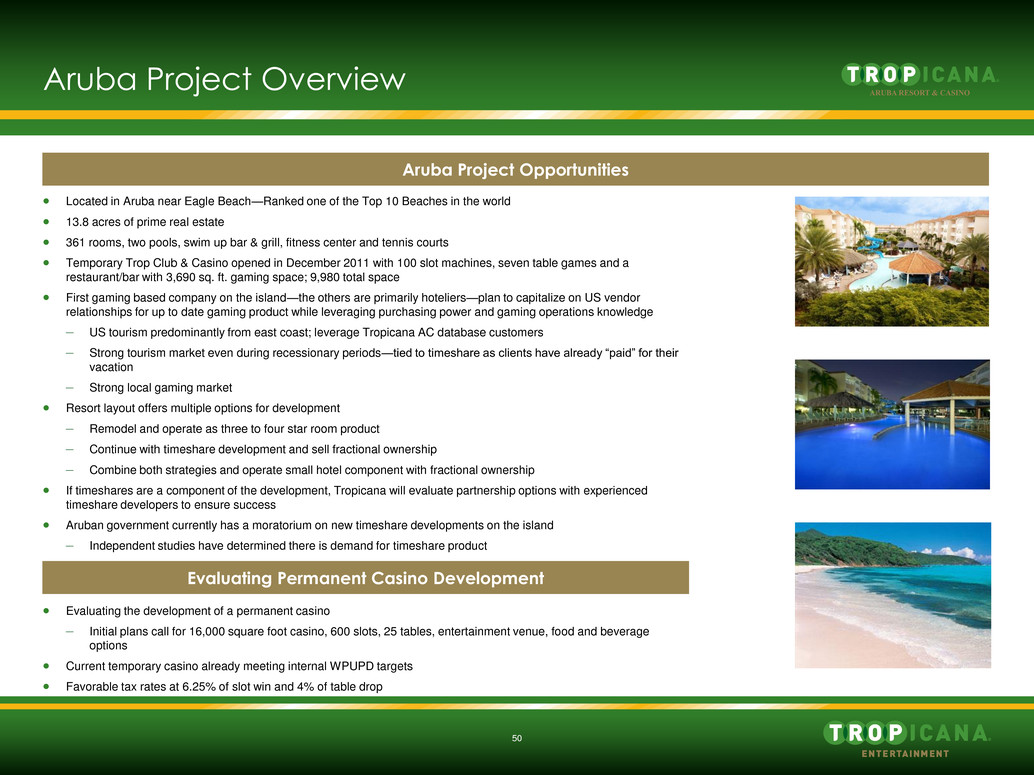
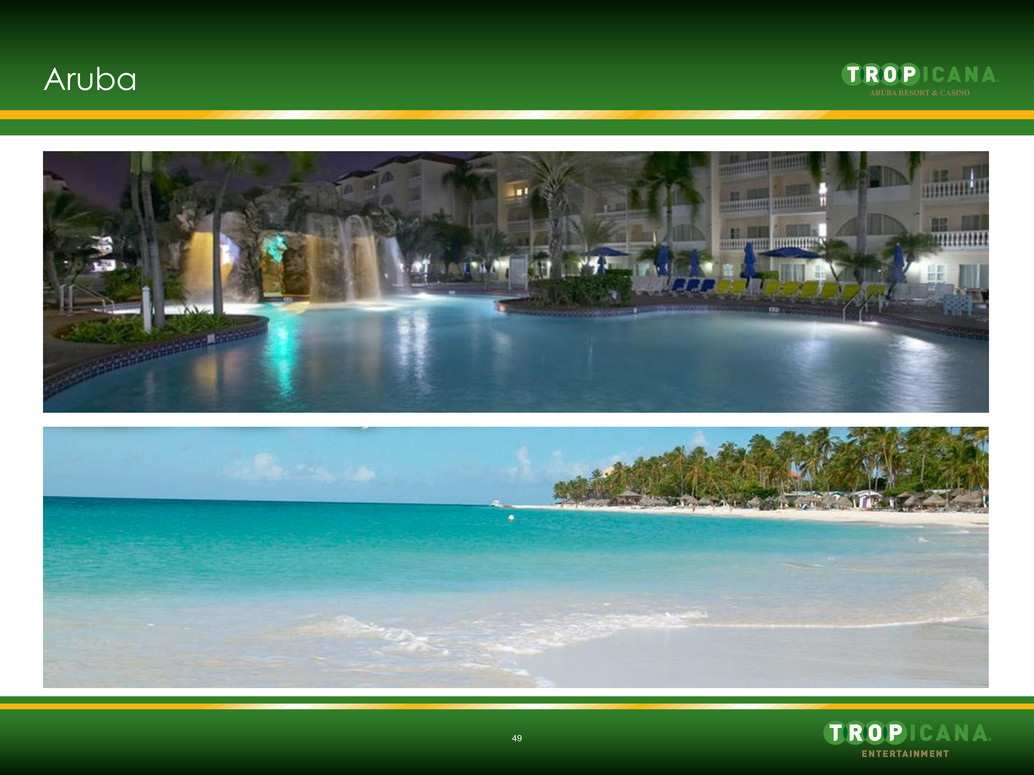
50 Aruba Project Overview Aruba Project Opportunities Evaluating Permanent Casino Development Located in Aruba near Eagle Beach—Ranked one of the Top 10 Beaches in the world 13.8 acres of prime real estate 361 rooms, two pools, swim up bar & grill, fitness center and tennis courts Temporary Trop Club & Casino opened in December 2011 with 100 slot machines, seven table games and a restaurant/bar with 3,690 sq. ft. gaming space; 9,980 total space First gaming based company on the island—the others are primarily hoteliers—plan to capitalize on US vendor relationships for up to date gaming product while leveraging purchasing power and gaming operations knowledge – US tourism predominantly from east coast; leverage Tropicana AC database customers – Strong tourism market even during recessionary periods—tied to timeshare as clients have already “paid” for their vacation – Strong local gaming market Resort layout offers multiple options for development – Remodel and operate as three to four star room product – Continue with timeshare development and sell fractional ownership – Combine both strategies and operate small hotel component with fractional ownership If timeshares are a component of the development, Tropicana will evaluate partnership options with experienced timeshare developers to ensure success Aruban government currently has a moratorium on new timeshare developments on the island – Independent studies have determined there is demand for timeshare product Evaluating the development of a permanent casino – Initial plans call for 16,000 square foot casino, 600 slots, 25 tables, entertainment venue, food and beverage options Current temporary casino already meeting internal WPUPD targets Favorable tax rates at 6.25% of slot win and 4% of table drop

Section 7 Financial Overview
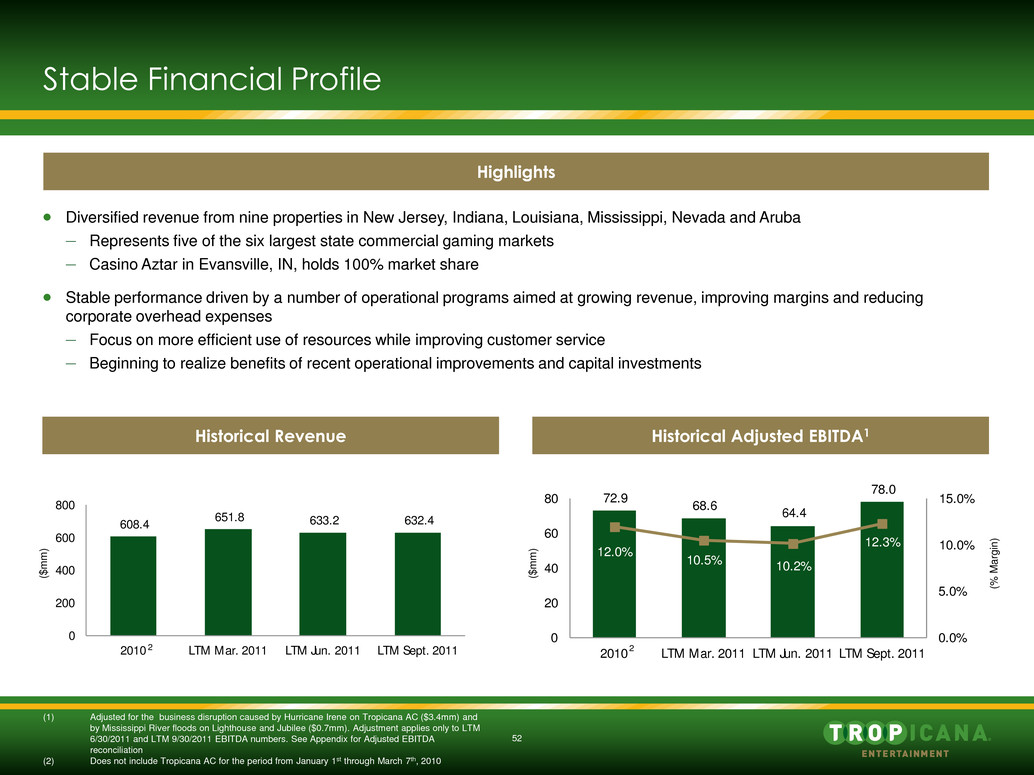
52 Diversified revenue from nine properties in New Jersey, Indiana, Louisiana, Mississippi, Nevada and Aruba – Represents five of the six largest state commercial gaming markets – Casino Aztar in Evansville, IN, holds 100% market share Stable performance driven by a number of operational programs aimed at growing revenue, improving margins and reducing corporate overhead expenses – Focus on more efficient use of resources while improving customer service – Beginning to realize benefits of recent operational improvements and capital investments Stable Financial Profile Historical Revenue Historical Adjusted EBITDA1 Highlights ($ m m ) ($ m m ) (% M ar g in ) (1) Adjusted for the business disruption caused by Hurricane Irene on Tropicana AC ($3.4mm) and by Mississippi River floods on Lighthouse and Jubilee ($0.7mm). Adjustment applies only to LTM 6/30/2011 and LTM 9/30/2011 EBITDA numbers. See Appendix for Adjusted EBITDA reconciliation (2) Does not include Tropicana AC for the period from January 1st through March 7th, 2010 2 2 72.9 68.6 64.4 78.0 12.0% 10.5% 10.2% 12.3% 0.0% 5.0% 10.0% 15.0% 0 20 40 60 80 2010 LTM Mar. 2011 LTM Jun. 2011 LTM Sept. 2011 608.4 651.8 633.2 632.4 0 200 400 600 800 2010 LTM Mar. 2011 LTM Jun. 2011 Sept. 20 1
Section 8 Terms and Timing
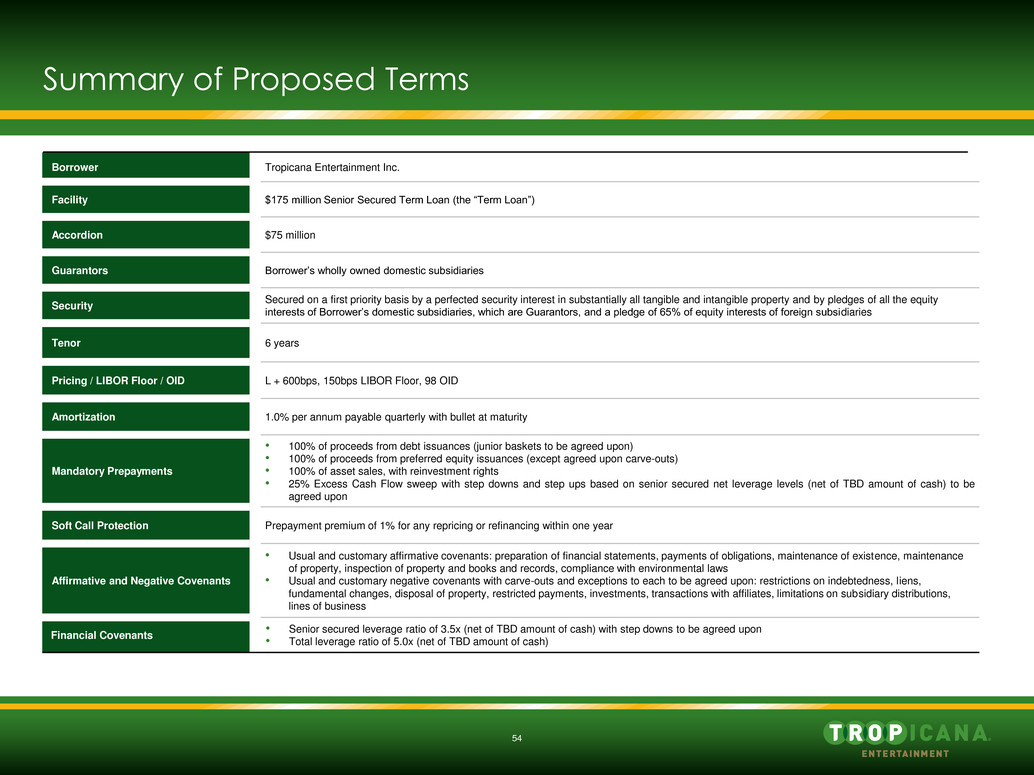
54 Summary of Proposed Terms Borrower Tropicana Entertainment Inc. Facility $175 million Senior Secured Term Loan (the “Term Loan”) Accordion $75 million Guarantors Borrower’s wholly owned domestic subsidiaries Security Secured on a first priority basis by a perfected security interest in substantially all tangible and intangible property and by pledges of all the equity interests of Borrower’s domestic subsidiaries, which are Guarantors, and a pledge of 65% of equity interests of foreign subsidiaries Tenor 6 years Pricing / LIBOR Floor / OID L + 600bps, 150bps LIBOR Floor, 98 OID Amortization 1.0% per annum payable quarterly with bullet at maturity Mandatory Prepayments • 100% of proceeds from debt issuances (junior baskets to be agreed upon) • 100% of proceeds from preferred equity issuances (except agreed upon carve-outs) • 100% of asset sales, with reinvestment rights • 25% Excess Cash Flow sweep with step downs and step ups based on senior secured net leverage levels (net of TBD amount of cash) to be agreed upon Soft Call Protection Prepayment premium of 1% for any repricing or refinancing within one year Affirmative and Negative Covenants • Usual and customary affirmative covenants: preparation of financial statements, payments of obligations, maintenance of existence, maintenance of property, inspection of property and books and records, compliance with environmental laws • Usual and customary negative covenants with carve-outs and exceptions to each to be agreed upon: restrictions on indebtedness, liens, fundamental changes, disposal of property, restricted payments, investments, transactions with affiliates, limitations on subsidiary distributions, lines of business Financial Covenants • Senior secured leverage ratio of 3.5x (net of TBD amount of cash) with step downs to be agreed upon • Total leverage ratio of 5.0x (net of TBD amount of cash)
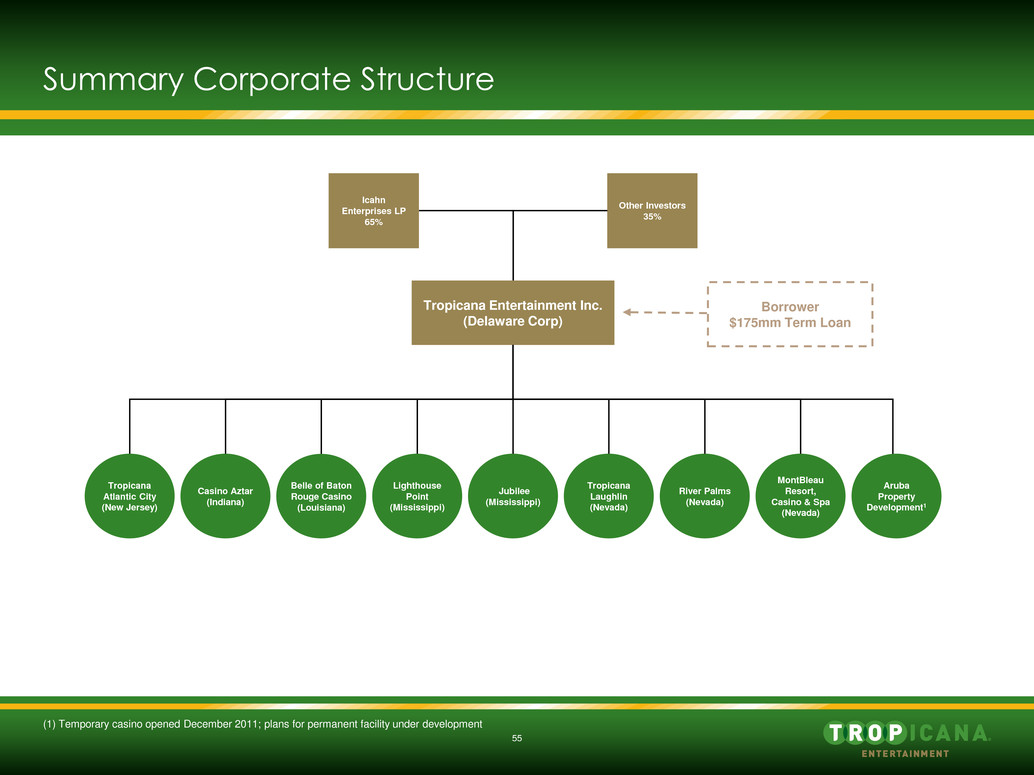
55 Summary Corporate Structure Casino Aztar (Indiana) Tropicana Atlantic City (New Jersey) River Palms (Nevada) MontBleau Resort, Casino & Spa (Nevada) Lighthouse Point (Mississippi) Jubilee (Mississippi) Tropicana Laughlin (Nevada) Belle of Baton Rouge Casino (Louisiana) Aruba Property Development1 Tropicana Entertainment Inc. (Delaware Corp) Icahn Enterprises LP 65% Other Investors 35% Borrower $175mm Term Loan (1) Temporary casino opened December 2011; plans for permanent facility under development
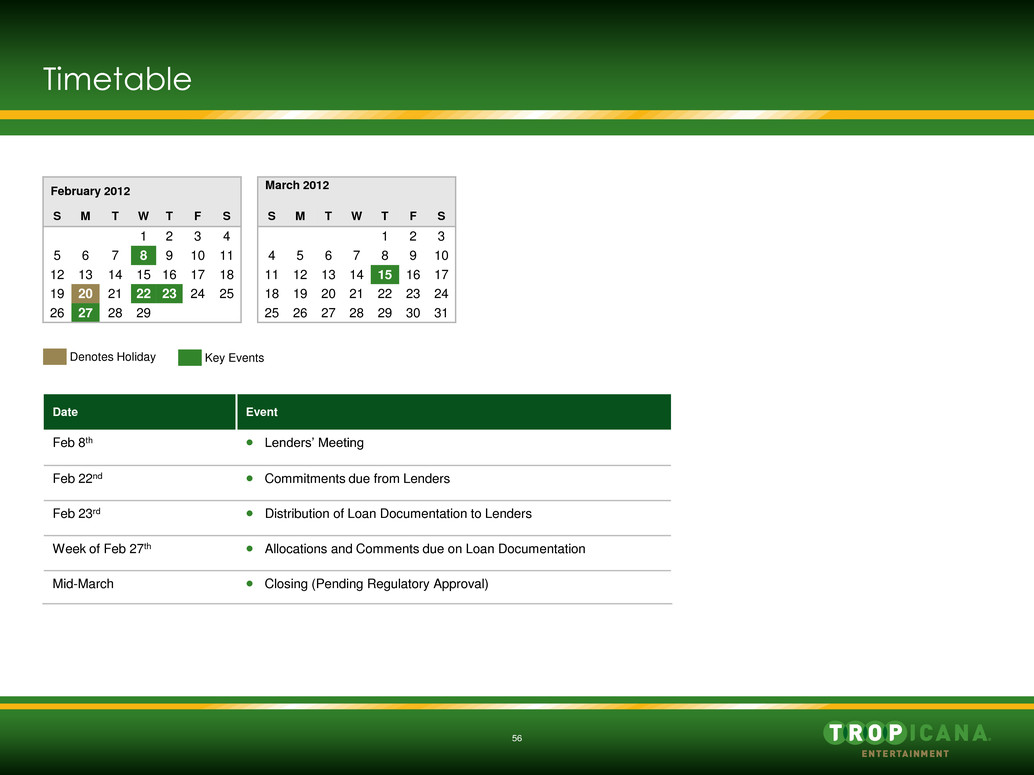
56 Timetable February 2012 March 2012 S M T W T F S S M T W T F S 1 2 3 4 1 2 3 5 6 7 8 9 10 11 4 5 6 7 8 9 10 12 13 14 15 16 17 18 11 12 13 14 15 16 17 19 20 21 22 23 24 25 18 19 20 21 22 23 24 26 27 28 29 25 26 27 28 29 30 31 Denotes Holiday Date Event Feb 8th Lenders’ Meeting Feb 22nd Commitments due from Lenders Feb 23rd Distribution of Loan Documentation to Lenders Week of Feb 27th Allocations and Comments due on Loan Documentation Mid-March Closing (Pending Regulatory Approval) Key Events

Appendix
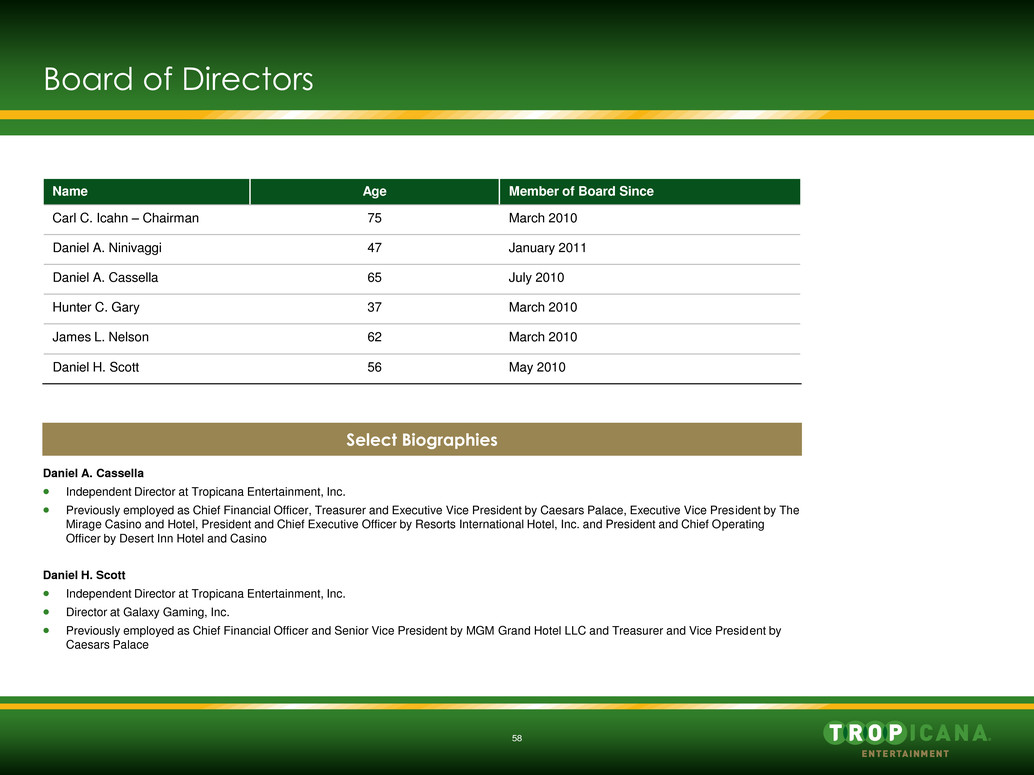
58 Board of Directors Name Age Member of Board Since Carl C. Icahn – Chairman 75 March 2010 Daniel A. Ninivaggi 47 January 2011 Daniel A. Cassella 65 July 2010 Hunter C. Gary 37 March 2010 James L. Nelson 62 March 2010 Daniel H. Scott 56 May 2010 Daniel A. Cassella Independent Director at Tropicana Entertainment, Inc. Previously employed as Chief Financial Officer, Treasurer and Executive Vice President by Caesars Palace, Executive Vice President by The Mirage Casino and Hotel, President and Chief Executive Officer by Resorts International Hotel, Inc. and President and Chief Operating Officer by Desert Inn Hotel and Casino Daniel H. Scott Independent Director at Tropicana Entertainment, Inc. Director at Galaxy Gaming, Inc. Previously employed as Chief Financial Officer and Senior Vice President by MGM Grand Hotel LLC and Treasurer and Vice President by Caesars Palace Select Biographies
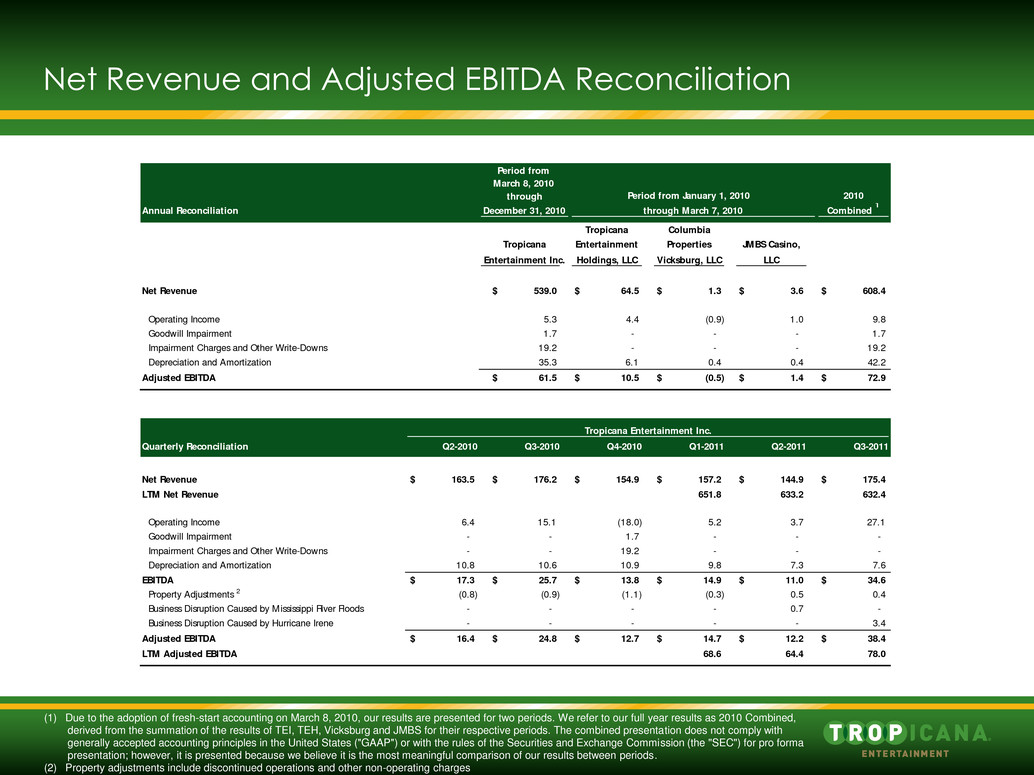
Net Revenue and Adjusted EBITDA Reconciliation (1) Due to the adoption of fresh-start accounting on March 8, 2010, our results are presented for two periods. We refer to our full year results as 2010 Combined, derived from the summation of the results of TEI, TEH, Vicksburg and JMBS for their respective periods. The combined presentation does not comply with generally accepted accounting principles in the United States ("GAAP") or with the rules of the Securities and Exchange Commission (the "SEC") for pro forma presentation; however, it is presented because we believe it is the most meaningful comparison of our results between periods. (2) Property adjustments include discontinued operations and other non-operating charges Period from March 8, 2010 through Period from January 1, 2010 2010 Annual Reconciliation December 31, 2010 through March 7, 2010 Combined 1 Tropicana Columbia Tropicana Entertainment Properties JMBS Casino, Entertainment Inc. Holdings, LLC Vicksburg, LLC LLC Net Revenue 539.0$ 64.5$ 1.3$ 3.6$ 608.4$ Operating Income 5.3 4.4 (0.9) 1.0 9.8 Goodwill Impairment 1.7 - - - 1.7 Impairment Charges and Other Write-Downs 19.2 - - - 19.2 Depreciation and Amortization 35.3 6.1 0.4 0.4 42.2 Adjusted EBITDA 61.5$ 10.5$ (0.5)$ 1.4$ 72.9$ Tropicana Entertainment Inc. Quarterly Reconciliation Q2-2010 Q3-2010 Q4-2010 Q1-2011 Q2-2011 Q3-2011 Net Revenue 163.5$ 176.2$ 154.9$ 157.2$ 144.9$ 175.4$ LTM Net Revenue 651.8 633.2 632.4 Operating Income 6.4 15.1 (18.0) 5.2 3.7 27.1 Goodwill Impairment - - 1.7 - - - Impairment Charges and Other Write-Downs - - 19.2 - - - Depreciation and Amortization 10.8 10.6 10.9 9.8 7.3 7.6 EBITDA 17.3$ 25.7$ 13.8$ 14.9$ 11.0$ 34.6$ Property Adjustments 2 (0.8) (0.9) (1.1) (0.3) 0.5 0.4 Business Disruption Caused by Mississippi River Floods - - - - 0.7 - Business Disruption Caused by Hurricane Irene - - - - - 3.4 Adjusted EBITDA 16.4$ 24.8$ 12.7$ 14.7$ 12.2$ 38.4$ LTM Adjusted EBITDA 68.6 64.4 78.0


