| OMB APPROVAL |
OMB Number: 3235-0570 Expires: January 31, 2014 Estimated average burden hours per response: 20.6 |
UNITED STATES
SECURITIES AND EXCHANGE COMMISSION
Washington, D.C. 20549
FORM N-CSR
CERTIFIED SHAREHOLDER REPORT OF REGISTERED
MANAGEMENT INVESTMENT COMPANIES
Investment Company Act file number 811-22359
Papp Investment Trust
(Exact name of registrant as specified in charter)
| 2201 E. Camelback Road, Suite 227B Phoenix, Arizona | 45419 |
| (Address of principal executive offices) | (Zip code) |
Tina H. Bloom, Esq.
Ultimus Fund Solutions, LLC 225 Pictoria Drive, Suite 450 Cincinnati, Ohio 45246
(Name and address of agent for service)
(Name and address of agent for service)
Registrant's telephone number, including area code: (602) 956-0980
Date of fiscal year end: November 30, 2011
Date of reporting period: November 30, 2011
Form N-CSR is to be used by management investment companies to file reports with the Commission not later than 10 days after the transmission to stockholders of any report that is required to be transmitted to stockholders under Rule 30e-1 under the Investment Company Act of 1940 (17 CFR 270.30e-1). The Commission may use the information provided on Form N-CSR in its regulatory, disclosure review, inspection, and policymaking roles.
A registrant is required to disclose the information specified by Form N-CSR, and the Commission will make this information public. A registrant is not required to respond to the collection of information contained in Form N-CSR unless the Form displays a currently valid Office of Management and Budget ("OMB") control number. Please direct comments concerning the accuracy of the information collection burden estimate and any suggestions for reducing the burden to Secretary, Securities and Exchange Commission, 450 Fifth Street, NW, Washington, DC 20549-0609. The OMB has reviewed this collection of information under the clearance requirements of 44 U.S.C. § 3507.
| Item 1. | Reports to Stockholders. |
Papp Investment Trust Papp Small & Mid-Cap Growth Fund | ||
 | ||
Annual Report November 30, 2011 | ||
Investment Adviser L. Roy Papp & Associates, LLP Phoenix, AZ | ||
Papp Investment Trust
Papp Small & Mid-Cap Growth Fund
Annual Report as of November 30, 2011
Dear Fellow Shareholder,
We are writing to report on the fiscal year ended November 30, 2011 and the results for Papp Small & Mid-Cap Growth Fund (the “Fund”) for the year. This past year saw very volatile financial markets driven in large part by concerns over the ongoing financial crisis occurring in Europe. Global financial markets have been concerned that severe problems in Greece and Ireland will spread to Portugal, Spain and Italy. These concerns caused global markets to decline from higher levels earlier this year by roughly 20% in late summer and early fall. During October and November, the markets recovered substantially as many European countries appear to be committed to dealing with the European financial problems, at least in the near term.
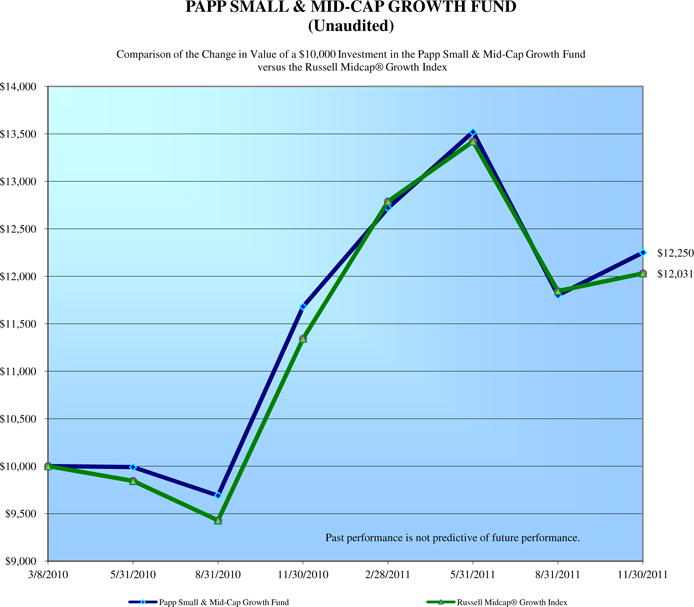
Against this market backdrop, the Fund produced a total return of 4.88% during the fiscal year ended November 30, 2011. By comparison, the Russell Midcap Growth Index produced a total return of 6.07% over the same period. Since inception on March 8, 2010, the Fund produced a cumulative total return of 22.50% through November 30, 2011, as compared to the Russell Midcap Growth Index which produced a total return of 20.31% over the same period.
While we always strive to produce a positive total return and to perform better than our benchmark, we recognize that from time to time the Fund will trail its benchmark over some time periods. While we measure performance over months, quarters, and years, we invest for the long term and we are pleased with strong results since inception, both nominally and relative to the benchmark.
Over the long term, stock prices reflect the financial health of the underlying businesses. We are happy to report the stocks that we are invested in are performing well at the company level. At a broader level, the U.S. economy continues to grow, but at a relatively modest pace. Many people are frustrated that the U.S. economy isn’t growing fast enough and there is much debate about the causes. The important thing to us is that the economy is growing, and therefore we expect a gradual pickup in employment and continued improvement to consumer sentiment. Over the next year, there will be considerable attention paid to the upcoming elections. We are hopeful that we can elect candidates on both sides that are more focused on creating realistic solutions to real problems rather than bickering for political advantage.
2
Over the year ended November 30, 2011, small and mid-cap stocks slightly underperformed larger companies. We suspect this was driven by demand for the perceived safety of larger, more well-known companies as opposed to the less well-known small and mid-cap companies. This underperformance of small and mid-cap stocks may also be due to relatively strong performance prior to this fiscal year.
The Fund’s net asset value on November 30, 2011 was $12.25 per share, up from $11.68 per share on November 30, 2010, and $10.00 per share on March 8, 2010, the date of inception.
We try to manage the Fund as tax efficiently as possible. During the fiscal year ended November 30, 2011, there were no capital gains distributions, nor were there any income distributions.
We continue to manage the Fund using the investment style that has served our firm well for over 30 years. We focus on very high quality companies with a consistent track record of superior earnings growth. Unlike many other funds in the small and mid-cap area, we focus on established companies with proven track records as opposed to startups, initial public offerings, and other companies perceived to have great growth potentials, but in many cases lacking a proven track record. In most cases, the companies in the Fund’s portfolio operate in fairly narrow market niches so they are able to maintain a leadership position in their markets, even with their smaller market capitalizations. We believe that this strategy, in addition to providing good, long-term returns, controls risk and provides safety, particularly in volatile market conditions.
The Fund is reasonably diversified, holding 34 individual companies as of November 30, 2011. We typically try to keep the Fund close to fully invested in stocks, with a typical money market position in the 1-2% range. The Fund is currently underweight relative to its benchmark in Consumer Discretionary companies and in Energy companies. The Fund is overweight in the Health Care and Information Technology sectors, where we feel growth potential for the future is the brightest.
During the fiscal year, no one economic sector on balance dramatically benefited or detracted from performance. Rather, performance was most strongly impacted by individual stock selection. Some of the Fund’s best performers included Nuance Communications, which is a leader in voice recognition software. The Fund enjoyed strong performance from Gardner Denver, Pioneer Natural Resources and FMC Technologies, all of which are niche businesses focused on oil and gas production. The Fund also enjoyed strong performance from auto parts retailer O’Reilly Automotive and pet products retailer PetSmart. Both companies produced strong revenue and earnings growth and both probably benefited from a total lack of exposure to Europe.
3
The Fund’s weaker performers over the fiscal year included Federated Investors and State Street, two financial services companies, which were negatively impacted by low interest rates and regulatory fees. The Fund also experienced weakness in Whiting Petroleum and Forest Oil, each of which reported production below expectations while continuing to invest money for the future in capital expenditures. We continue to believe in Whiting Petroleum and its long-term strategy. Forest Oil was eliminated from the portfolio in favor of Pioneer Natural Resources, where we think prospects are brighter. Rovi Corporation was negatively impacted by the company’s exposure to consumer electronics, particularly digital television. We believe that this is a temporary phenomenon.
The Fund continues to see new cash being invested despite the market volatility. As cash has come into the Fund, we have added broadly across the holdings in the Fund. We thank you for your confidence in the Fund and for investing with us. If you have any questions about the Fund, we would be happy to have you call us at 1-800-421-0131.
Warmest regards,
 |  |
| L. Roy Papp | Rosellen C. Papp |
| November 30, 2011 | November 30, 2011 |
Subsequent event:
It is with great sadness that we report the passing of L. Roy Papp on December 16, 2011. Roy lived a long, happy, and productive life. He was healthy up until the last week of his life. Roy loved investing and being here at L. Roy Papp & Associates, LLP, the advisor to the Fund. He was particularly proud of the Papp Small & Mid-Cap Growth Fund. While we will all miss Roy’s presence at the firm, we are all committed to continuing Roy’s legacy.
4
On Friday, December 23, 2011, the Board of Trustees of the Papp Investment Trust appointed Rosellen C. Papp as sole Portfolio Manager of the Fund and nominated and elected Harry A. Papp as Trustee and President of the Papp Investment Trust.
 |  | |
Harry A. Papp, President December 30, 2011 | Rosellen C. Papp, Portfolio Manager December 30, 2011 |
Past performance is not predictive of future performance. Investment results and principal value will fluctuate so that shares, when redeemed, may be worth more or less than their original cost. Current performance may be higher or lower than the performance data quoted. Performance current through the most recent month end is available by calling 1-877-370-7277.
An investor should consider the investment objectives, risks, charges and expenses of the Fund carefully before investing. The Fund’s prospectus contains this and other important information. To obtain a copy of the Fund’s prospectus please call 1-877-370-7277 and a copy will be sent to you free of charge. Please read the prospectus carefully before you invest. The Fund is distributed by Ultimus Fund Distributors, LLC.
The Letter to Shareholders seeks to describe some of the Adviser’s current opinions and views of the financial markets. Although the Adviser believes it has a reasonable basis for any opinions or views expressed, actual results may differ, sometimes significantly so, from those expected or expressed.
5
Average Annual Total Returns(a) | ||||
| (for periods ended November 30, 2011) | ||||
| 1 Year | Since Inception(b) | |||
| Papp Small & Mid-Cap Growth Fund | 4.88% | 12.43% | ||
Russell Midcap ® Growth Index | 6.07% | 11.27% | ||
(a) The total returns shown do not reflect the deduction of taxes a shareholder would pay on Fund distributions or the redemption of Fund shares.
(b) Commencement of operations was March 8, 2010.
6
| PAPP SMALL & MID-CAP GROWTH FUND | |
| PORTFOLIO INFORMATION | |
| November 30, 2011 (Unaudited) | |

| Top 10 Equity Holdings |
| Security Description | % of Net Assets | |
| O'Reilly Automotive, Inc. | 5.2% | |
| Gardner Denver, Inc. | 5.2% | |
| Nuance Communications, Inc. | 5.1% | |
| Coach, Inc. | 5.0% | |
| PetSmart, Inc. | 4.7% | |
| Mettler-Toledo International, Inc. | 4.3% | |
| Ecolab, Inc. | 4.1% | |
| C.R. Bard, Inc. | 4.1% | |
| Informatica Corp. | 3.9% | |
| AMETEK, Inc. | 3.9% |
7
| PAPP SMALL & MID-CAP GROWTH FUND | |||||||||
| SCHEDULE OF INVESTMENTS | |||||||||
| November 30, 2011 | |||||||||
| COMMON STOCKS — 98.0% | Shares | Value | ||||||
| Consumer Discretionary - 14.9% | ||||||||
| Specialty Retail - 9.9% | ||||||||
| O'Reilly Automotive, Inc.* | 8,000 | $ | 617,920 | |||||
| PetSmart, Inc. | 11,600 | 559,700 | ||||||
| 1,177,620 | ||||||||
| Textiles, Apparel & Luxury Goods - 5.0% | ||||||||
| Coach, Inc. | 9,400 | 588,346 | ||||||
| Consumer Staples - 4.7% | ||||||||
| Food Products - 2.1% | ||||||||
| McCormick & Co., Inc. | 5,100 | 248,370 | ||||||
| Household Products - 2.6% | ||||||||
| Clorox Co. (The) | 4,800 | 311,808 | ||||||
| Energy - 3.8% | ||||||||
| Energy Equipment & Services - 1.9% | ||||||||
| FMC Technologies, Inc.* | 4,300 | 225,148 | ||||||
| Oil, Gas & Consumable Fuels - 1.9% | ||||||||
| Pioneer Natural Resources Co. | 600 | 56,724 | ||||||
| Whiting Petroleum Corp.* | 3,700 | 172,087 | ||||||
| 228,811 | ||||||||
| Financials - 7.2% | ||||||||
| Capital Markets - 7.2% | ||||||||
| Federated Investors, Inc. - Class B | 15,000 | 238,050 | ||||||
| State Street Corp. | 4,200 | 166,530 | ||||||
| T. Rowe Price Group, Inc. | 7,800 | 442,728 | ||||||
| 847,308 | ||||||||
| Health Care - 18.4% | ||||||||
| Health Care Equipment & Supplies - 7.0% | ||||||||
| C.R. Bard, Inc. | 5,600 | 488,264 | ||||||
| DENTSPLY International, Inc. | 2,900 | 104,719 | ||||||
| ResMed, Inc.* | 8,800 | 229,240 | ||||||
| 822,223 | ||||||||
| Health Care Services - 3.7% | ||||||||
| Express Scripts, Inc.* | 5,500 | 251,075 | ||||||
| Medco Health Solutions, Inc.* | 3,300 | 187,011 | ||||||
| 438,086 | ||||||||
| Life Sciences Tools & Services - 7.7% | ||||||||
| Mettler-Toledo International, Inc.* | 3,150 | 503,370 | ||||||
| PAREXEL International Corp.* | 17,000 | 340,850 | ||||||
| Techne Corp. | 1,000 | 67,490 | ||||||
| 911,710 | ||||||||
| Industrials - 18.6% | ||||||||
| Air Freight & Logistics - 3.4% | ||||||||
| Expeditors International of Washington, Inc. | 9,300 | 404,643 | ||||||
| Commercial Services - 3.1% | ||||||||
| Stericycle, Inc.* | 4,500 | 364,590 | ||||||
8
| PAPP SMALL & MID-CAP GROWTH FUND | |||||||||
| SCHEDULE OF INVESTMENTS (Continued) | |||||||||
| COMMON STOCKS — 98.0% (Continued) | Shares | Value | ||||||
| Industrials - 18.6% (Continued) | ||||||||
| Electrical Equipment - 3.9% | ||||||||
| AMETEK, Inc. | 10,600 | $ | 454,104 | |||||
| Machinery - 8.2% | ||||||||
| Gardner Denver, Inc. | 7,200 | 617,184 | ||||||
| IDEX Corp. | 9,700 | 353,662 | ||||||
| 970,846 | ||||||||
| Information Technology - 23.7% | ||||||||
| Semiconductors & Semiconductor Equipment - 5.6% | ||||||||
| Linear Technology Corp. | 7,300 | 223,599 | ||||||
| Microchip Technology, Inc. | 7,300 | 254,843 | ||||||
| Silicon Laboratories, Inc.* | 4,100 | 177,202 | ||||||
| 655,644 | ||||||||
| Software - 18.1% | ||||||||
| Factset Research Systems, Inc. | 3,600 | 335,628 | ||||||
| Informatica Corp.* | 10,300 | 463,037 | ||||||
| MICROS Systems, Inc.* | 9,500 | 448,115 | ||||||
| Nuance Communications, Inc.* | 24,500 | 602,210 | ||||||
| Rovi Corp.* | 10,500 | 291,375 | ||||||
| 2,140,365 | ||||||||
| Materials - 6.7% | ||||||||
| Specialty Chemicals - 6.7% | ||||||||
| Ecolab, Inc. | 8,600 | 490,372 | ||||||
| Sigma-Aldrich Corp. | 4,700 | 304,607 | ||||||
| 794,979 | ||||||||
Total Common Stocks (Cost $9,811,461) | $ | 11,584,601 | ||||||
| MONEY MARKET FUNDS — 2.7% | Shares | Value | ||||||
Fidelity Institutional Money Market Government Portfolio - Class I, 0.01%(a) | ||||||||
| (Cost $320,432) | 320,432 | $ | 320,432 | |||||
| �� | ||||||||
Total Investments at Value — 100.7% (Cost $10,131,893) | $ | 11,905,033 | ||||||
| Liabilities in Excess of Other Assets — (0.7%) | (88,027 | ) | ||||||
| Net Assets — 100.0% | $ | 11,817,006 | ||||||
| * | Non-income producing security. |
| (a) | The rate shown is the 7-day effective yield as of November 30, 2011. |
See accompanying notes to financial statements.
9
| PAPP SMALL & MID-CAP GROWTH FUND | |||
| STATEMENT OF ASSETS AND LIABILITIES | |||
| November 30, 2011 |
| ASSETS | ||||
| Investments in securities: | ||||
| At acquisition cost | $ | 10,131,893 | ||
| At value (Note 2) | $ | 11,905,033 | ||
| Dividends receivable | 6,764 | |||
| Other assets | 5,063 | |||
| Total assets | 11,916,860 | |||
| LIABILITIES | ||||
| Payable for investment securities purchased | 88,984 | |||
| Payable to Adviser (Note 4) | 4,280 | |||
| Payable to administrator (Note 4) | 5,150 | |||
| Other accrued expenses | 1,440 | |||
| Total liabilities | 99,854 | |||
| NET ASSETS | $ | 11,817,006 | ||
| NET ASSETS CONSIST OF: | ||||
| Paid-in capital | $ | 10,198,660 | ||
| Accumulated net realized losses from security transactions | (154,794 | ) | ||
| Net unrealized appreciation on investments | 1,773,140 | |||
| NET ASSETS | $ | 11,817,006 | ||
| Shares of beneficial interest outstanding (unlimited number of shares authorized, no par value) | 964,544 | |||
| Net asset value, offering price and redemption price per share | $ | 12.25 | ||
| See accompanying notes to financial statements. | ||||
10
| PAPP SMALL & MID-CAP GROWTH FUND | |||
| STATEMENT OF OPERATIONS | |||
| For the Year Ended November 30, 2011 |
| INVESTMENT INCOME | ||||
| Dividend income | $ | 97,398 | ||
| EXPENSES | ||||
| Investment advisory fees (Note 4) | 109,051 | |||
| Professional fees | 33,850 | |||
| Fund accounting fees (Note 4) | 26,033 | |||
| Administration fees (Note 4) | 20,100 | |||
| Insurance expense | 18,028 | |||
| Transfer agent fees (Note 4) | 15,000 | |||
| Registration fees | 14,322 | |||
| Custody and bank service fees | 9,456 | |||
| Postage and supplies | 4,058 | |||
| Trustees' fees and expenses (Note 4) | 3,894 | |||
| Other expenses | 11,598 | |||
| Total expenses | 265,390 | |||
| Less fee reductions and expense reimbursements by the Adviser (Note 4) | (129,075 | ) | ||
| Net expenses | 136,315 | |||
| NET INVESTMENT LOSS | (38,917 | ) | ||
| REALIZED AND UNREALIZED GAINS (LOSSES) ON INVESTMENTS | ||||
| Net realized losses from security transactions | (154,794 | ) | ||
| Net change in unrealized appreciation/depreciation on investments | 612,868 | |||
| NET REALIZED AND UNREALIZED GAINS ON INVESTMENTS | 458,074 | |||
| NET INCREASE IN NET ASSETS FROM OPERATIONS | $ | 419,157 | ||
| See accompanying notes to financial statements. | ||||
11
| PAPP SMALL & MID-CAP GROWTH FUND | ||||||
| STATEMENTS OF CHANGES IN NET ASSETS |
| Year | Period | |||||||
| Ended | Ended | |||||||
| November 30, | November 30, | |||||||
| 2011 | 2010 (a) | |||||||
| FROM OPERATIONS | ||||||||
| Net investment loss | $ | (38,917 | ) | $ | (11,303 | ) | ||
| Net realized gains (losses) from security transactions | (154,794 | ) | 9,706 | |||||
| Net change in unrealized appreciation/depreciation on investments | 612,868 | 1,057,584 | ||||||
| Net increase in net assets from operations | 419,157 | 1,055,987 | ||||||
| CAPITAL SHARE TRANSACTIONS | ||||||||
| Proceeds from shares sold | 2,447,398 | 8,026,644 | ||||||
| Payments for shares redeemed | (202,096 | ) | (30,084 | ) | ||||
| Net increase in net assets from capital share transactions | 2,245,302 | 7,996,560 | ||||||
| TOTAL INCREASE IN NET ASSETS | 2,664,459 | 9,052,547 | ||||||
| NET ASSETS | ||||||||
| Beginning of period | 9,152,547 | 100,000 | ||||||
| End of period | $ | 11,817,006 | $ | 9,152,547 | ||||
| ACCUMULATED NET INVESTMENT INCOME | $ | - | $ | - | ||||
| CAPITAL SHARE ACTIVITY | ||||||||
| Shares sold | 197,450 | 776,207 | ||||||
| Shares redeemed | (16,271 | ) | (2,842 | ) | ||||
| Net increase in shares outstanding | 181,179 | 773,365 | ||||||
| Shares outstanding at beginning of period | 783,365 | 10,000 | ||||||
| Shares outstanding at end of period | 964,544 | 783,365 | ||||||
| (a) | Represents the period from the commencement of operations (March 8, 2010) through November 30, 2010. | |||||||
| See accompanying notes to financial statements. |
12
| PAPP SMALL & MID-CAP GROWTH FUND | ||||||
| FINANCIAL HIGHLIGHTS | ||||||
| Per Share Data for a Share Outstanding Throughout Each Period |
| Year | Period | ||||||||
| Ended | Ended | ||||||||
| November 30, | November 30, | ||||||||
| 2011 | 2010 (a) | ||||||||
| Net asset value at beginning of period | $ | 11.68 | $ | 10.00 | |||||
| Income (loss) from investment operations: | |||||||||
| Net investment loss | (0.04 | ) | (0.01 | ) | |||||
| Net realized and unrealized gains on investments | 0.61 | 1.69 | |||||||
| Total from investment operations | 0.57 | 1.68 | |||||||
| Net asset value at end of period | $ | 12.25 | $ | 11.68 | |||||
Total return (b) | 4.88% | 16.80% | (c) | ||||||
| Net assets at end of period | $ | 11,817,006 | $ | 9,152,547 | |||||
| Ratios/supplementary data: | |||||||||
| Ratio of total expenses to average net assets | 2.43% | 3.03% | (e) | ||||||
Ratio of net expenses to average net assets (d) | 1.25% | 1.25% | (e) | ||||||
Ratio of net investment loss to average net assets (d) | (0.36% | ) | (0.25% | ) | (e) | ||||
| Portfolio turnover rate | 5% | 2% | (c) | ||||||
| (a) | Represents the period from the commencement of operations (March 8, 2010) through November 30, 2010. | |||||||
| (b) | Total return is a measure of the change in value of an investment in the Fund over the periods covered. | |||||||
| (c) | Not annualized. | |||||||
| (d) | Ratio was determined after advisory fee reductions and expense reimbursements (Note 4). | |||||||
| (e) | Annualized. | |||||||
| See accompanying notes to financial statements. | ||||||||
13
PAPP SMALL & MID-CAP GROWTH FUND
NOTES TO FINANCIAL STATEMENTS
November 30, 2011
1. Organization
Papp Small & Mid-Cap Growth Fund (the “Fund”) is a diversified series of Papp Investment Trust (the “Trust”), an open-end investment company established as an Ohio business trust under a Declaration of Trust dated November 12, 2009. The Fund commenced operations on March 8, 2010.
The investment objective of the Fund is long-term capital growth.
2. Significant Accounting Policies
The following is a summary of the Fund's significant accounting policies. The policies are in conformity with accounting principles generally accepted in the United States of America (“GAAP”).
Securities valuation – The Fund’s portfolio securities are valued at market value as of the close of regular trading on the New York Stock Exchange (the “NYSE”) (normally 4:00 p.m. Eastern time) on each business day the NYSE is open. Securities listed on the NYSE or other exchanges are valued on the basis of their last sales prices on the exchanges on which they are primarily traded. If there are no sales on that day, the securities are valued at the closing bid price on the NYSE or other primary exchange for that day. NASDAQ listed securities are valued at the NASDAQ Official Closing Price. If there are no sales on that day, the securities are valued at the last bid price as reported by NASDAQ. Securities traded in the over-the-counter market are valued at the last sale price, if available, otherwise at the mean of the closing bid and ask prices. In the event that market quotations are not readily available, securities and other assets are valued at fair value as determined in good faith in accordance with procedures adopted by the Board of Trustees of the Trust and will be classified as Level 2 or 3 (see below) within the fair value hierarchy, depending on the inputs used. Factors determining portfolio investments subject to fair value determination include, but are not limited to, the following: the spread between bid and asked prices is substantial; infrequency of sales; thinness of market; the size of reported trades; a temporary lapse in the provision of prices by any reliable pricing source; and actions of the securities or future markets, such as the suspension or limitation of trading. Debt securities are valued at their current market value when available or at their fair value, which for securities with remaining maturities of 60 days or less has been determined in good faith by the Board of Trustees to be represented by amortized cost value, absent unusual circumstances.
GAAP establishes a single authoritative definition of fair value, sets out a framework for measuring fair value and requires additional disclosures about fair value measurement.
Various inputs are used in determining the value of the Fund’s investments. These inputs are summarized in the three broad levels listed below:
• Level 1 – quoted prices in active markets for identical securities
• Level 2 – other significant observable inputs
• Level 3 – significant unobservable inputs
14
PAPP SMALL & MID-CAP GROWTH FUND
NOTES TO FINANCIAL STATEMENTS (Continued)
The inputs or methodology used for valuing securities are not necessarily an indication of the risks associated with investing in those securities. The inputs used to measure fair value may fall into different levels of the fair value hierarchy. In such cases, for disclosure purposes, the level in the fair value hierarchy within which the fair value measurement falls in its entirety is determined based on the lowest level input that is significant to the fair value measurement.
The following is a summary of the inputs used to value the Fund’s investments as of November 30, 2011:
| Level 1 | Level 2 | Level 3 | Total | |||||||||||||
| Common Stocks | $ | 11,584,601 | $ | - | $ | - | $ | 11,584,601 | ||||||||
| Money Market Funds | 320,432 | - | - | 320,432 | ||||||||||||
| Total | $ | 11,905,033 | $ | - | $ | - | $ | 11,905,033 | ||||||||
Refer to the Fund’s Schedule of Investments for a listing of the common stocks valued using Level 1 inputs by industry type. During the year ended November 30, 2011, the Fund did not have any significant transfers in and out of any Level. In addition, the Fund did not have any assets or liabilities that were measured at fair value on a recurring basis using significant unobservable inputs (Level 3) as of or during the year ended November 30, 2011. It is the Fund’s policy to recognize transfers into and out of any Level at the end of the reporting period.
Share valuation – The net asset value per share of the Fund is calculated daily by dividing the total value of the Fund’s assets, less liabilities, by the number of shares outstanding. The offering price and redemption price per share of the Fund is equal to the net asset value per share.
Investment income – Dividend income is recorded on the ex-dividend date. Interest income is accrued as earned. Other non-cash dividends are recognized as investment income at the fair value of the property received.
Security transactions – Security transactions are accounted for on the trade date. Gains and losses on securities sold are determined on a specific identification basis.
Distributions to shareholders – Distributions to shareholders arising from net investment income and net realized capital gains, if any, are distributed at least once each year. The amount of distributions from net investment income and net realized gains are determined in accordance with federal income tax regulations, which may differ from GAAP. Dividends and distributions to shareholders are recorded on the ex-dividend date. There were no distributions paid to shareholders during the periods ended November 30, 2011 and November 30, 2010.
Estimates – The preparation of financial statements in conformity with GAAP requires management to make estimates and assumptions that affect the reported amounts of assets and liabilities and disclosure of contingent assets and liabilities at the date of the financial statements and the reported amounts of income and expenses during the reporting period. Actual results could differ from those estimates.
Federal income tax – It is the Fund’s policy to comply with the special provisions of Subchapter M of the Internal Revenue Code applicable to regulated investment companies. As provided therein, in any fiscal year in which the Fund so qualifies and distributes at least 90% of its taxable net income, the Fund (but not the shareholders) will be relieved of federal income tax on the income distributed. Accordingly, no provision for income taxes is required.
15
PAPP SMALL & MID-CAP GROWTH FUND
NOTES TO FINANCIAL STATEMENTS (Continued)
In order to avoid imposition of the excise tax applicable to regulated investment companies, it is also the Fund's intention to declare as dividends in each calendar year at least 98% of its net investment income (earned during the calendar year) and 98.2% of its net realized capital gains (earned during the twelve months ended November 30) plus undistributed amounts from prior years.
The following information is computed on a tax basis for each item as of November 30, 2011:
| Tax cost of portfolio investments | $ | 10,131,893 | ||
| Gross unrealized appreciation | $ | 2,222,556 | ||
| Gross unrealized depreciation | (449,416 | ) | ||
| Net unrealized appreciation | 1,773,140 | |||
| Capital loss carryforward | (154,794 | ) | ||
| Distributable earnings | $ | 1,618,346 |
During the year ended November 30, 2011, the Fund reclassified accumulated net investment losses of $38,917 against paid-in capital on the Statement of Assets and Liabilities. Such reclassification, the result of permanent differences between the financial statement and income tax reporting requirements, has no effect on the Fund’s net assets or net asset value per share.
As of November 30, 2011, the Fund had a capital loss carryforward for federal income tax purposes of $154,794 which expires on November 30, 2019. This capital loss carryforward may be used in future years to offset net realized capital gains, if any, prior to distribution to shareholders.
The Fund recognizes the tax benefits or expenses of uncertain tax positions only when the position is “more likely than not” to be sustained assuming examination by tax authorities. Management has reviewed the Fund’s tax positions taken on Federal income tax returns for the previous and current tax years and has concluded that no provision for unrecognized tax benefits or expenses is required in these financial statements.
3. Investment Transactions
During the year ended November 30, 2011, cost of purchases and proceeds from sales of investment securities, other than short-term investments, were $2,749,495 and $553,383, respectively.
4. Transactions with Affiliates
Certain Trustees and officers of the Trust are directors and officers of the Adviser or of Ultimus Fund Solutions, LLC (“Ultimus”), the Fund’s administrator, transfer agent and fund accounting agent, and Ultimus Fund Distributors, LLC (the “Distributor”), the Fund’s principal underwriter.
INVESTMENT ADVISORY AGREEMENT
The Fund’s investments are managed by the Adviser pursuant to the terms of an Investment Advisory Agreement. For its services, the Fund pays the Adviser an advisory fee, computed daily and paid monthly, at the annual rate of 1.00% of its average daily net assets.
16
PAPP SMALL & MID-CAP GROWTH FUND
NOTES TO FINANCIAL STATEMENTS (Continued)
The Adviser has contractually agreed to reduce its advisory fees and to reimburse the Fund’s operating expenses to the extent necessary so that the Fund’s annual ordinary operating expenses do not exceed an amount equal to 1.25% of its average daily net assets. This Expense Limitation Agreement remains in effect until at least March 8, 2013. During the year ended November 30, 2011, the Adviser did not collect any of its investment advisory fees of $109,051 and reimbursed other operating expenses totaling $20,024.
The Expense Limitation Agreement permits the Adviser to recover fee reductions and expense reimbursements on behalf of the Fund, but only for a period of three years after such reduction or reimbursement and only if such recovery will not cause the Fund’s expense ratio to exceed the annual rate of 1.25%. As of November 30, 2011, the Adviser may in the future recover fee reductions and expense reimbursements totaling $210,138. The Adviser may recover a portion of this amount no later than the dates as stated below:
| November 30, 2013 | November 30, 2014 | ||||
| $ | 81,063 | $ | 129,075 | ||
ADMINISTRATION AGREEMENT
Under the terms of an Administration Agreement with the Trust, Ultimus provides internal regulatory compliance services and executive and administrative services for the Fund. Ultimus supervises the preparation of tax returns, reports to shareholders of the Fund, reports to and filings with the Securities and Exchange Commission (the “SEC”) and state securities commissions and materials for meetings of the Board of Trustees. For these services, the Fund pays to Ultimus, on a monthly basis, a fee equal to 0.15% per annum of the Fund’s average daily net assets up to $50 million, 0.125% of such assets from $50 million to $100 million, 0.10% of such assets from $100 million to $250 million, 0.075% of such assets from $250 million to $500 million and 0.05% of such assets in excess of $500 million, provided, however, that the minimum fee is $2,000 per month. The fee payable to Ultimus is discounted by 20% during the first year of the Fund’s operations and 15% during the second year of operations, or until such time as the Fund’s net assets reach $20 million, but in no event later than two years from the date of commencement of operations.
FUND ACCOUNTING AGREEMENT
Under the terms of a Fund Accounting Agreement with the Trust, Ultimus calculates the daily net asset value per share and maintains the financial books and records of the Fund. For these services, the Fund pays to Ultimus a base fee of $2,500 per month, plus an asset-based fee at the annual rate of 0.01% of the Fund’s average daily net assets up to $500 million and 0.005% of such assets in excess of $500 million. In addition, the Fund pays all costs of external pricing services. The fee payable to Ultimus is discounted by 20% during the first year of the Fund’s operations and 15% during the second year of operations, or until such time as the Fund’s net assets reach $20 million, but in no event later than two years from the date of commencement of operations.
17
PAPP SMALL & MID-CAP GROWTH FUND
NOTES TO FINANCIAL STATEMENTS (Continued)
TRANSFER AGENT AND SHAREHOLDER SERVICES AGREEMENT
Under the terms of a Transfer Agent and Shareholder Services Agreement with the Trust, Ultimus maintains the records of each shareholder’s account, answers shareholders’ inquiries concerning their accounts, processes purchases and redemptions of the Fund’s shares, acts as dividend and distribution disbursing agent and performs other shareholder service functions. For these services, Ultimus receives from the Fund an annual fee of $20 per shareholder account, subject to a monthly minimum fee. The minimum monthly fee is $1,500 if the Fund has 100 or more shareholder accounts; $1,250 if the Fund has between 25 and 100 shareholder accounts; and $1,000 if the Fund has 25 or less shareholder accounts. In addition, the Fund pays out-of-pocket expenses, including, but not limited to, postage and supplies.
DISTRIBUTION AGREEMENT
Under the terms of a Distribution Agreement with the Trust, the Distributor serves as principal underwriter to the Fund. The Distributor is a wholly-owned subsidiary of Ultimus. The Distributor receives annual compensation of $6,000 for such services. The Distributor is compensated by the Adviser (not the Fund) for acting as principal underwriter.
PLAN OF DISTRIBUTION
The Trust has adopted a plan of distribution (the “Plan”) pursuant to which the Fund may incur certain expenses related to the distribution of its shares. The annual limitation of payment of expenses pursuant to the Plan is 0.25% of the Fund’s average daily net assets. The Board of Trustees has not authorized the payment of any fees pursuant to the Plan until at least April 1, 2012.
TRUSTEE COMPENSATION
Each Trustee who is not an interested person of the Trust (“Independent Trustees”) receives from the Fund a fee of $250 for each Board meeting attended.
5. Contingencies and Commitments
The Fund indemnifies the Trust's officers and Trustees for certain liabilities that might arise from their performance of their duties to the Fund. Additionally, in the normal course of business the Fund enters into contracts that contain a variety of representations and warranties and which provide general indemnifications. The Fund’s maximum exposure under these arrangements is unknown, as this would involve future claims that may be made against the Fund that have not yet occurred. However, based on experience, the Fund expects the risk of loss to be remote.
6. Subsequent Events
The Fund is required to recognize in the financial statements the effects of all subsequent events that provide additional evidence about conditions that existed as of the date of the Statement of Assets and Liabilities. For non-recognized subsequent events that must be disclosed to keep the financial statements from being misleading, the Fund is required to disclose the nature of the event as well as an estimate of its financial effect, or a statement that such an estimate cannot be made. Management has evaluated subsequent events through the issuance of these financial statements and has noted no such events.
18
PAPP SMALL & MID-CAP GROWTH FUND
NOTES TO FINANCIAL STATEMENTS (Continued)
7. New Legislation and Recent Accounting Pronouncement
The Regulated Investment Company Modernization Act of 2010 (the “Act”) was enacted on December 22, 2010. The Act makes changes to several tax rules impacting the Fund. In general, the provisions of the Act will be effective for the Fund’s fiscal year ending November 30, 2012. Although the Act provides several benefits, including unlimited carryover on future capital losses, there may be greater likelihood that all or a portion of the Fund’s pre-enactment capital loss carryovers may expire without being utilized due to the fact that post-enactment capital losses get utilized before pre-enactment capital loss carryovers. Relevant information regarding the impact of the Act on the Fund, if any, will be included in the Annual Report for the year ended November 30, 2012.
In May 2011, the Financial Accounting Standards Board issued Accounting Standards Update (“ASU”) No. 2011-04 “Amendments to Achieve Common Fair Value Measurement and Disclosure Requirements in U.S. GAAP and IFRSs.” ASU No. 2011-04 establishes common requirements for measuring fair value and for disclosing information about fair value measurements in accordance with GAAP and International Financial Reporting Standards. ASU No. 2011-04 is effective for interim and annual periods beginning after December 15, 2011 and is applied prospectively. Management is currently evaluating the impact ASU No. 2011-04 may have on financial statement disclosures.
19
REPORT OF INDEPENDENT REGISTERED PUBLIC ACCOUNTING FIRM
To the Board of Trustees of Papp Investment Trust
and the Shareholders of Papp Small & Mid-Cap Growth Fund
We have audited the accompanying statement of assets and liabilities of Papp Small & Mid-Cap Growth Fund, a series of shares of beneficial interest of Papp Investment Trust (the “Fund”), including the schedule of investments, as of November 30, 2011, the related statement of operations for the year then ended, and the statements of changes in net assets and the financial highlights for the year then ended and for the period March 8, 2010 (commencement of operations) through November 30, 2010. These financial statements and financial highlights are the responsibility of the Fund's management. Our responsibility is to express an opinion on these financial statements and financial highlights based on our audits.
We conducted our audits in accordance with the standards of the Public Company Accounting Oversight Board (United States). Those standards require that we plan and perform the audits to obtain reasonable assurance about whether the financial statements and financial highlights are free of material misstatement. An audit includes examining, on a test basis, evidence supporting the amounts and disclosures in the financial statements. Our procedures included confirmation of securities owned as of November 30, 2011 by correspondence with the custodian and broker. An audit also includes assessing the accounting principles used and significant estimates made by management, as well as evaluating the overall financial statement presentation. We believe that our audits provide a reasonable basis for our opinion.
In our opinion, the financial statements and financial highlights referred to above present fairly, in all material respects, the financial position of Papp Small & Mid-Cap Growth Fund as of November 30, 2011, the results of its operations for the year then ended, and the changes in its net assets and its financial highlights for the year then ended and for the period March 8, 2010 through November 30, 2010, in conformity with accounting principles generally accepted in the United States of America.
 | |
| BBD, LLP |
Philadelphia, Pennsylvania
January 17, 2012
20
PAPP SMALL & MID-CAP GROWTH FUND
ABOUT YOUR FUND’S EXPENSES (Unaudited)
We believe it is important for you to understand the impact of costs on your investment. As a shareholder of the Fund, you incur ongoing costs, including management fees and other operating expenses. The following examples are intended to help you understand your ongoing costs (in dollars) of investing in the Fund and to compare these costs with the ongoing costs of investing in other mutual funds.
A mutual fund’s ongoing costs are expressed as a percentage of its average net assets. This figure is known as the expense ratio. The expenses in the table below are based on an investment of $1,000 made at the beginning of the most recent period (June 1, 2011) and held until the end of the period (November 30, 2011).
The table below illustrates the Fund’s ongoing costs in two ways:
Actual fund return – This section helps you to estimate the actual expenses that you paid over the period. The “Ending Account Value” shown is derived from the Fund’s actual return, and the third column shows the dollar amount of operating expenses that would have been paid by an investor who started with $1,000 in the Fund. You may use the information here, together with the amount you invested, to estimate the expenses that you paid over the period.
To do so, simply divide your account value by $1,000 (for example, an $8,600 account value divided by $1,000 = 8.6), then multiply the result by the number given for the Fund under the heading “Expenses Paid During Period.”
Hypothetical 5% return – This section is intended to help you compare the Fund’s ongoing costs with those of other mutual funds. It assumes that the Fund had an annual return of 5% before expenses during the period shown, but that the expense ratio is unchanged. In this case, because the return used is not the Fund’s actual return, the results do not apply to your investment. The example is useful in making comparisons because the SEC requires all mutual funds to calculate expenses based on a 5% return. You can assess the Fund’s ongoing costs by comparing this hypothetical example with the hypothetical examples that appear in shareholder reports of other funds.
Note that expenses shown in the table are meant to highlight and help you compare ongoing costs only. The Fund does not charge transaction fees, such as purchase or redemption fees, nor does it carry a “sales load.”
The calculations assume no shares were bought or sold during the period. Your actual costs may have been higher or lower, depending on the amount of your investment and the timing of any purchases or redemptions.
More information about the Fund’s expenses, including historical annual expense ratios, can be found in this report. For additional information on operating expenses and other shareholder costs, please refer to the Fund’s prospectus.
21
PAPP SMALL & MID-CAP GROWTH FUND
ABOUT YOUR FUND’S EXPENSES (Unaudited) (Continued)
Beginning Account Value June 1, 2011 | Ending Account Value November 30, 2011 | Expenses Paid During Period* | |
| Based on Actual Fund Return | $1,000.00 | $ 906.10 | $5.97 |
| Based on Hypothetical 5% Return (before expenses) | $1,000.00 | $1,018.80 | $6.33 |
| * | Expenses are equal to the Fund’s annualized expense ratio of 1.25% for the period, multiplied by the average account value over the period, multiplied by 183/365 (to reflect the one-half year period). |
OTHER INFORMATION (Unaudited)
A description of the policies and procedures that the Fund uses to vote proxies relating to portfolio securities is available without charge upon request by calling toll-free 1-877-370-7277, or on the SEC’s website at http://www.sec.gov. Information regarding how the Fund voted proxies relating to portfolio securities during the most recent 12-month period ended June 30 is available without charge upon request by calling toll-free 1-877-370-7277, or on the SEC’s website at http://www.sec.gov.
The Trust files a complete listing of portfolio holdings for the Fund with the SEC as of the end of the first and third quarters of each fiscal year on Form N-Q. These filings are available upon request by calling 1-877-370-7277. Furthermore, you may obtain a copy of the filings on the SEC's website at http://www.sec.gov. The Trust's Forms N-Q may also be reviewed and copied at the SEC's Public Reference Room in Washington, DC, and information on the operation of the Public Reference Room may be obtained by calling 1-800-SEC-0330.
22
PAPP SMALL & MID-CAP GROWTH FUND
BOARD OF TRUSTEES AND EXECUTIVE OFFICERS (Unaudited)
The Board of Trustees has overall responsibility for management of the Trust’s affairs. The Trustees serve during the lifetime of the Trust and until its termination, or until death, resignation, retirement, or removal. The Trustees, in turn, elect the officers of the Trust to actively supervise its day-to-day operations. The officers have been elected for an annual term. The following are the Trustees and executive officers of the Trust:
| Name, Address and Age | Position(s) Held with Trust and Length of Time Served | Principal Occupation(s) During Past 5 Years and Directorships of Public Companies | Number of Funds in Trust Overseen by Trustee |
Interested Trustees: | |||
*Harry A. Papp Born: January 1954 2201 E. Camelback Road Suite 227B Phoenix, AZ 85016 | President and Trustee since December 2011; Vice President February 2010 to December 2011 | Managing Partner of L. Roy Papp & Associates, LLP | 1 |
*Rosellen C. Papp Born: December 1954 2201 E. Camelback Road Suite 227B Phoenix, AZ 85016 | Trustee since February 2010 | Partner and Research Director of L. Roy Papp & Associates, LLP | 1 |
Independent Trustees: | |||
James K. Ballinger Born: July 1949 2201 E. Camelback Road Suite 227B Phoenix, AZ 85016 | Trustee since February 2010 | Executive Director, Phoenix Art Museum | 1 |
Cynthia P. Hubiak Born: June 1959 2201 E. Camelback Road Suite 227B Phoenix, AZ 85016 | Trustee since February 2010 | President and Chief Executive Officer, Arizona Society of CPAs | 1 |
Carolyn P. O’Malley Born: September 1947 2201 E. Camelback Road Suite 227B Phoenix, AZ 85016 | Trustee since February 2010 | Retired; Executive Director, Dorrance Family Foundation (a private foundation providing educational, conservation and other grants) from 2001-2009. | 1 |
| * | Harry A. Papp and Rosellen C. Papp, as partners of the Adviser, are considered “interested persons” of the Trust within the meaning of Section 2(a)(19) of the Investment Company Act of 1940. Harry A. Papp and Rosellen C. Papp are married. |
23
PAPP SMALL & MID-CAP GROWTH FUND
BOARD OF TRUSTEES AND EXECUTIVE OFFICERS (Unaudited) (Continued)
| Name, Address and Age | Position(s) Held with Trust and Length of Time Served | Principal Occupation(s) During Past 5 Years |
Executive Officers: | ||
Robert G. Dorsey Born: April 1957 225 Pictoria Drive, Suite 450 Cincinnati, Ohio 45246 | Vice President since November 2009 | Managing Director of Ultimus Fund Solutions, LLC and Ultimus Fund Distributors, LLC |
Mark J. Seger Born: January 1962 225 Pictoria Drive, Suite 450 Cincinnati, Ohio 45246 | Treasurer since November 2009 | Managing Director of Ultimus Fund Solutions, LLC and Ultimus Fund Distributors, LLC |
Tina H. Bloom Born: August 1968 225 Pictoria Drive, Suite 450 Cincinnati, Ohio 45246 | Secretary since July 2011 | Director of Administration of Ultimus Fund Solutions, LLC and Vice President of Ultimus Fund Distributors, LLC |
Julie A. Hein Born: April 1962 2201 E. Camelback Road Suite 227B Phoenix, AZ 85016 | Chief Compliance Officer since February 2010 | Partner and Chief Compliance Officer of L. Roy Papp & Associates, LLP |
Additional information about members of the Board and executive officers is available in the Fund’s Statement of Additional Information (“SAI”). To obtain a free copy of the SAI, please call 1-877-370-7277.
24
| Item 2. | Code of Ethics. |
As of the end of the period covered by this report, the registrant has adopted a code of ethics that applies to the registrant’s principal executive officer, principal financial officer, principal accounting officer or controller, or persons performing similar functions, regardless of whether these individuals are employed by the registrant or a third party. Pursuant to Item 12(a)(1), a copy of registrant’s code of ethics is filed as an exhibit to this Form N-CSR. During the period covered by this report, the code of ethics has not been amended, and the registrant has not granted any waivers, including implicit waivers, from the provisions of the code of ethics.
| Item 3. | Audit Committee Financial Expert. |
The registrant’s board of trustees has determined that the registrant has at least one audit committee financial expert serving on its audit committee. The name of the audit committee financial expert is Cynthia P. Hubiak. Ms. Hubiak is “independent” for purposes of this Item.
| Item 4. | Principal Accountant Fees and Services. |
| (a) | Audit Fees. The aggregate fees billed for professional services rendered by the principal accountant for the audit of the registrant’s annual financial statements or for services that are normally provided by the accountant in connection with statutory and regulatory filings or engagements were $11,500 and $11,500 with respect to the registrant’s fiscal years ended November 30, 2011 and 2010, respectively. |
| (b) | Audit-Related Fees. No fees were billed in the last fiscal year for assurance and related services by the principal accountant that are reasonably related to the performance of the audit of the registrant’s financial statements and are not reported under paragraph (a) of this Item. |
| (c) | Tax Fees. The aggregate fees billed for professional services rendered by the principal accountant for tax compliance, tax advice, and tax planning were $2,000 and $2,000 with respect to the registrant’s fiscal years ended November 30, 2011 and 2010, respectively. The services comprising these fees are the preparation of the registrant’s federal income and excise tax returns. |
| (d) | All Other Fees. No fees were billed in either of the last two fiscal years for products and services provided by the principal accountant, other than the services reported in paragraphs (a) through (c) of this Item. |
| (e)(1) | The audit committee has not adopted pre-approval policies and procedures described in paragraph (c)(7) of Rule 2-01 of Regulation S-X. |
| (e)(2) | None of the services described in paragraph (b) through (d) of this Item were approved by the audit committee pursuant to paragraph (c)(7)(i)(C) of Rule 2-01 of Regulation S-X. |
| (f) | Less than 50% of hours expended on the principal accountant’s engagement to audit the registrant’s financial statements for the most recent fiscal year were attributed to work performed by persons other than the principal accountant’s full-time, permanent employees. |
| (g) | During the fiscal years ended November 30, 2011 and 2010, aggregate non-audit fees of $2,000 and $2,000, respectively, were billed by the registrant’s principal accountant for services rendered to the registrant. No non-audit fees were billed in the last fiscal year by the registrant’s principal accountant for services rendered to the registrant’s investment adviser (not including any sub-adviser whose role is primarily portfolio management and is subcontracted with or overseen by another investment adviser), and any entity controlling, controlled by, or under common control with the adviser that provides ongoing services to the registrant. |
| (h) | The principal accountant has not provided any non-audit services to the registrant’s investment adviser (not including any sub-adviser whose role is primarily portfolio management and is subcontracted with or overseen by another investment adviser), and any entity controlling, controlled by, or under common control with the investment adviser that provides ongoing services to the registrant. |
| Item 5. | Audit Committee of Listed Registrants. |
Not applicable
| Item 6. | Schedule of Investments. |
| (a) | Not applicable [schedule filed with Item 1] |
| (b) | Not applicable |
| Item 7. | Disclosure of Proxy Voting Policies and Procedures for Closed-End Management Investment Companies. |
Not applicable
| Item 8. | Portfolio Managers of Closed-End Management Investment Companies. |
Not applicable
| Item 9. | Purchases of Equity Securities by Closed-End Management Investment Company and Affiliated Purchasers. |
Not applicable
| Item 10. | Submission of Matters to a Vote of Security Holders. |
The registrant’s Committee of Independent Trustees shall review shareholder recommendations to fill vacancies on the registrant’s board of trustees if such recommendations are submitted in writing, addressed to the Committee at the registrant’s offices and meet any minimum qualifications adopted by the Committee. The Committee may adopt, by resolution, a policy regarding its procedures for considering candidates for the board of trustees, including any recommended by shareholders.
| Item 11. | Controls and Procedures. |
(a) Based on their evaluation of the registrant’s disclosure controls and procedures (as defined in Rule 30a-3(c) under the Investment Company Act of 1940) as of a date within 90 days of the filing date of this report, the registrant’s principal executive officer and principal financial officer have concluded that such disclosure controls and procedures are reasonably designed and are operating effectively to ensure that material information relating to the registrant, including its consolidated subsidiaries, is made known to them by others within those entities, particularly during the period in which this report is being prepared, and that the information required in filings on Form N-CSR is recorded, processed, summarized, and reported on a timely basis.
(b) There were no changes in the registrant’s internal control over financial reporting (as defined in Rule 30a-3(d) under the Investment Company Act of 1940) that occurred during the second fiscal quarter of the period covered by this report that have materially affected, or are reasonably likely to materially affect, the registrant’s internal control over financial reporting.
| Item 12. | Exhibits. |
File the exhibits listed below as part of this Form. Letter or number the exhibits in the sequence indicated.
(a)(1) Any code of ethics, or amendment thereto, that is the subject of the disclosure required by Item 2, to the extent that the registrant intends to satisfy the Item 2 requirements through filing of an exhibit: Attached hereto
(a)(2) A separate certification for each principal executive officer and principal financial officer of the registrant as required by Rule 30a-2(a) under the Act (17 CFR 270.30a-2(a)): Attached hereto
(a)(3) Any written solicitation to purchase securities under Rule 23c-1 under the Act (17 CFR 270.23c-1) sent or given during the period covered by the report by or on behalf of the registrant to 10 or more persons: Not applicable
(b) Certifications required by Rule 30a-2(b) under the Act (17 CFR 270.30a-2(b)): Attached hereto
| Exhibit 99.CODE ETH | Code of Ethics |
| Exhibit 99.CERT | Certifications required by Rule 30a-2(a) under the Act |
| Exhibit 99.906CERT | Certifications required by Rule 30a-2(b) under the Act |
SIGNATURES
Pursuant to the requirements of the Securities Exchange Act of 1934 and the Investment Company Act of 1940, the registrant has duly caused this report to be signed on its behalf by the undersigned, thereunto duly authorized.
(Registrant) Papp Investment Trust
| By (Signature and Title)* | /s/ Harry A. Papp | ||
| Harry A. Papp, President | |||
| Date | February 6, 2012 | ||
Pursuant to the requirements of the Securities Exchange Act of 1934 and the Investment Company Act of 1940, this report has been signed below by the following persons on behalf of the registrant and in the capacities and on the dates indicated.
| By (Signature and Title)* | /s/ Harry A. Papp | ||
| Harry A. Papp, President | |||
| Date | February 6, 2012 | ||
| By (Signature and Title)* | /s/ Mark J. Seger | ||
| Mark J. Seger, Treasurer | |||
| Date | February 6, 2012 | ||
* Print the name and title of each signing officer under his or her signature.