| OMB APPROVAL |
OMB Number: 3235-0570 Expires: January 31, 2014 Estimated average burden hours per response: 20.6 |
UNITED STATES
SECURITIES AND EXCHANGE COMMISSION
Washington, D.C. 20549
FORM N-CSR
CERTIFIED SHAREHOLDER REPORT OF REGISTERED
MANAGEMENT INVESTMENT COMPANIES
Investment Company Act file number 811-22359
Papp Investment Trust
(Exact name of registrant as specified in charter)
2201 E. Camelback Road, Suite 227B Phoenix, Arizona 45419
(Address of principal executive offices) (Zip code)
Tina H. Bloom, Esq.
Ultimus Fund Solutions, LLC 225 Pictoria Drive, Suite 450 Cincinnati, Ohio 45246
(Name and address of agent for service)
Registrant's telephone number, including area code: (602) 956-0980
Date of fiscal year end: November 30, 2013
Date of reporting period: November 30, 2013
Form N-CSR is to be used by management investment companies to file reports with the Commission not later than 10 days after the transmission to stockholders of any report that is required to be transmitted to stockholders under Rule 30e-1 under the Investment Company Act of 1940 (17 CFR 270.30e-1). The Commission may use the information provided on Form N-CSR in its regulatory, disclosure review, inspection, and policymaking roles.
A registrant is required to disclose the information specified by Form N-CSR, and the Commission will make this information public. A registrant is not required to respond to the collection of information contained in Form N-CSR unless the Form displays a currently valid Office of Management and Budget ("OMB") control number. Please direct comments concerning the accuracy of the information collection burden estimate and any suggestions for reducing the burden to Secretary, Securities and Exchange Commission, 450 Fifth Street, NW, Washington, DC 20549-0609. The OMB has reviewed this collection of information under the clearance requirements of 44 U.S.C. § 3507.
| Item 1. | Reports to Stockholders. |
Papp Investment Trust Papp Small & Mid-Cap Growth Fund  Annual Report November 30, 2013 Investment Adviser L. Roy Papp & Associates, LLP Phoenix, AZ |
Papp Investment Trust
Papp Small & Mid-Cap Growth Fund
Annual Report as of November 30, 2013
Dear Fellow Shareholders,
We are writing to report on the results for the Papp Small & Mid-Cap Growth Fund (the “Fund”) for the fiscal year ended November 30, 2013. This past year has been extraordinary for the U.S. stock market. Depending on the index you choose, the U.S. markets were up between 20% and 40% for the 12 months ended November 30, 2013. This is against a backdrop where the U.S. economy continued to grow, but at a relatively modest pace. Employment expanded, but again this occurred at a relatively modest pace. Many investors attributed the strong market conditions to the Federal Reserve’s quantitative easing policy in which the Fed has continued to purchase $85 billion a month worth of Treasuries and mortgage backed securities. The Fed has been doing this to keep interest rates low, to stimulate the economy and to steer investors into stocks, real estate and other longer term investments, in the hopes that it would help get the economy growing on its own. In this environment, investors have enthusiastically been buying stocks, which has produced the investment returns cited above.
For the year ended November 30, 2013, our Fund produced a strong total return of 22.99%. It could not match the performance of the Russell Midcap® Growth Index (the “Benchmark”), which produced a total return of 33.91%. As we have told you before, during periods of very strong market conditions, the Fund will normally lag the performance of the Benchmark. We buy established companies with consistent operating track records and very strong financial quality. This past year has been a market where speculative stocks, which may or may not succeed in the long term, and in many cases lack the financial strength that we require to control our overall investment risk, performed the best. We are obviously disappointed that the Fund trailed the Benchmark this past year, but we are more than content with a total return of almost 23%. Over the long term, the Fund strives to produce a good and consistent total return in good markets and in bad markets, while limiting risk to tolerable levels.
We have analyzed the performance of the Fund compared to the Benchmark over the past year to get a better perspective on the under-performance. This could have been due to one or more stocks “blowing up.” It could have been due to significant holdings in companies that just didn’t work. Finally, it could have been due to investments tied to a broader economic bet such as oil prices, commodity prices, currency valuations, interest rates or inflation. Our analysis indicates that none of these factors were present. The key driver of the Fund’s under-performance is not what the Fund owns, but rather what the Fund didn’t own. 2013 was a year of extreme momentum for a number of stocks in the market in general, but also in the small and mid-cap universe as measured by the Russell Midcap® Growth Index. Some of the companies that the Fund didn’t own include Netflix, Inc., SolarCity Corporation, Tesla Motors, Inc., Pandora Media, Inc., Best Buy Co., Inc. and Delta Airlines, Inc. Each of these stocks was up more than 200% for the twelve months ended November 30, 2013. While they did well and we would have loved to enjoy the performance, these are the types of investments that our firm has never owned in our 35 year history and we don’t intend to own going forward. In a less enthusiastic market or if something goes wrong with one of these individual stocks, there are potentially significant downside risks. We are unwilling to take this level of risk with your money or ours.
1
The Fund’s Net Asset Value (NAV) on November 30, 2013 was $16.48 per share, up from $13.40 per share on November 30, 2012.
This year, for the first time, the Fund paid a long term capital gain distribution, effective December 31, 2013, in the amount of 6.68 cents per share, which was 0.4% of net asset value. During the year, we sold one of the Fund’s holdings, Gardner Denver, Inc., anticipating its acquisition by KKR & Co. L.P. Another portfolio company, Harris Teeter Supermarkets, Inc., is likely to be acquired soon by The Kroger Co. During the year we also sold the Fund’s positions in Microchip Technology, Inc. and Nuance Communications, Inc. Together, these actions generated the capital gains which were required to be distributed to shareholders. We will continue to manage the Fund as tax efficiently as possible.
The Fund remained well diversified, holding 34 individual companies as of November 30, 2013. The Fund is normally fully invested, and as of November 30, 2013, had 98.7% invested in stocks and 1.3% in a money market fund. The Fund is currently underweight relative to its Benchmark in Consumer Discretionary companies and Financial companies. The Fund is overweight in Health Care and Information Technology companies, where we feel the relative valuations are compelling. During the fiscal year, the Fund’s underweight of the Consumer Discretionary sector held back performance compared to the Benchmark.
Turning to individual companies in the portfolio, performance was held back by four holdings. Catamaran Corp. is a pharmacy benefit manager whose stock price has been negatively impacted by uncertainties relating to health care reform in the U.S. and concerns that large employers may force employees on to private exchanges. The company and its two predecessor companies that merged during 2012, performed particularly well last year. The Fund continues to hold this position as we are confident that the company will retain covered lives and grow its business. Nuance Communications, Inc., a leading voice recognition technology company, performed poorly in 2013 due to changes in their revenue model, contract disputes with some customers, and internal execution issues. We ultimately sold the Fund’s position based on our concerns that management may not be up to correcting these problems. PetSmart, Inc. is the largest specialty pet retailer in North America. The stock took a breather in 2013 following a very strong run in the last few years. The combination of tough prior year comparisons and a change in both the CEO and CFO contributed to investor concerns in 2013. We continue to believe in the long term outlook for the company. Finally, Coach, Inc., a leading designer of luxury accessory items (primarily for women), has lost some market share in its core U.S. business and a transition in leadership is taking place. We still believe Coach is a strong brand, but we have reduced the Fund’s position as we believe this transition may take some time.
Performance was helped this year by IDEX Corp., a global, industrial provider of pumps, flow meters and other systems to a broad range of customers. The strong stock performance was driven by strong earnings as customers’ markets improved and the company’s strong execution continues to drive operating margin expansion. Another holding, Ecolab, Inc., operates in the areas of water, hygiene and energy technology. The company has made two major acquisitions in the past several years which have resulted in a substantial margin improvement and realization of cost and revenue synergies. Informatica Corp. is a leading provider of enterprise data integration software. After a difficult year in 2012, the company has reported four consecutive strong earnings reports. Demand for the company’s solutions continues to be strong, driven by long term trends in “big data,” increased regulation and compliance and cloud computing. This is why we retain this position in the Fund even after a difficult year in 2012. Finally, C.R. Bard, Inc., a global medical, surgical, and patient care device manufacturer, has enjoyed a strong year thanks to a turn-around plan that involved reinvesting a large patent settlement in growth initiatives. Investors are encouraged by growth expectations over the next few years.
2
Looking forward, we expect the U.S. economy to continue to grow into 2014 and 2015. We are seeing some evidence that growth may be picking up slightly. After prolonged economic weakness in Europe and Japan, things seem to be stabilizing in Europe. Japan has finally embarked on financial policies which could allow its economy to pick up after 20 years of stagnation. The Chinese government is adopting policies designed to allow China’s economy to continue to grow at somewhat lower rates than in the past ten years, but hopefully on a more sustainable basis. All of this leads us to believe that the earnings of the companies in the Fund’s portfolio are likely to grow on average at a low double digit rate during 2014, which we believe will lead to good stock performance.
Most investors expect that over the next year the Federal Reserve will gradually phase out its quantitative easing program designed to hold down interest rates. We suspect that the stock market may encounter a dislocation as market valuations shift from Federal Reserve driven policy to conditions driven by fundamentals. We believe that stocks are roughly fairly priced and, therefore, if the market does experience a dislocation, it is likely to be temporary.
Investors continue to add new cash into the Fund. As cash has become available, we have added broadly across the holdings within the Fund. We appreciate your confidence in the Fund and we thank you for investing with us. Both of us would be happy to answer any questions about the Fund that you may have. We invite you to call either of us at 1-800-421-0131. We wish you a happy, healthy and prosperous 2014.
Warmest regards,
 |  |
| Rosellen C. Papp, CFA | Harry Papp, CFA |
| Portfolio Manager | President |
| November 30, 2013 | November 30, 2013 |
Past performance is not predictive of future performance. Investment results and principal value will fluctuate so that shares, when redeemed, may be worth more or less than their original cost. Current performance may be higher or lower than the performance data quoted. Performance current through the most recent month end is available by calling 1-877-370-7277.
An investor should consider the investment objectives, risks, charges and expenses of the Fund carefully before investing. The Fund’s prospectus contains this and other important information. To obtain a copy of the Fund’s prospectus please call 1-877-370-7277 and a copy will be sent to you free of charge. Please read the prospectus carefully before you invest. The Fund is distributed by Ultimus Fund Distributors, LLC.
The Letter to Shareholders seeks to describe some of the Adviser’s current opinions and views of the financial markets. Although the Adviser believes it has a reasonable basis for any opinions or views expressed, actual results may differ, sometimes significantly so, from those expected or expressed.
3
PAPP SMALL & MID-CAP GROWTH FUND
(Unaudited)
Comparison of the Change in Value of a $10,000 Investment in the Papp Small & Mid-Cap Growth Fund
versus the Russell Midcap® Growth Index
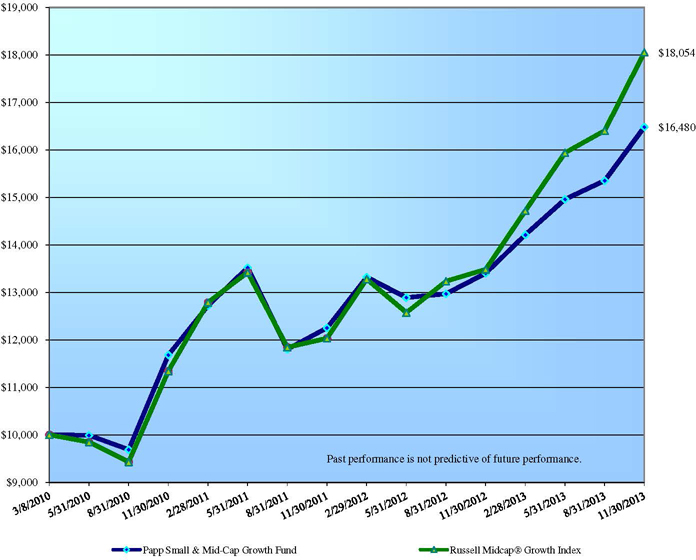
| Average Annual Total Returns(a) (for periods ended November 30, 2013) | ||
| 1 Year | Since Inception(b) | |
| Papp Small & Mid-Cap Growth Fund | 22.99% | 14.33% |
Russell Midcap ® Growth Index | 33.91% | 17.15% |
| (a) | The total returns shown do not reflect the deduction of taxes a shareholder would pay on Fund distributions or the redemption of Fund shares. |
| (b) | Commencement of operations was March 8, 2010. |
4
| PAPP SMALL & MID-CAP GROWTH FUND | ||
| PORTFOLIO INFORMATION | ||
| November 30, 2013 (Unaudited) |

Top 10 Equity Holdings
| Security Description | % of Net Assets | |
| Ecolab, Inc. | 4.7% | |
| IDEX Corp. | 4.4% | |
| O'Reilly Automotive, Inc. | 4.4% | |
| AMETEK, Inc. | 4.4% | |
| C.R. Bard, Inc. | 4.1% | |
| T. Rowe Price Group, Inc. | 4.0% | |
| Mettler-Toledo International, Inc. | 4.0% | |
| FactSet Research Systems, Inc. | 3.7% | |
| Informatica Corp. | 3.6% | |
| Stericycle, Inc. | 3.5% |
5
| PAPP SMALL & MID-CAP GROWTH FUND | |||||||||
| SCHEDULE OF INVESTMENTS | |||||||||
| November 30, 2013 | |||||||||
| COMMON STOCKS — 98.7% | Shares | Value | ||||||
| Consumer Discretionary - 13.7% | ||||||||
| Specialty Retail - 11.0% | ||||||||
| O'Reilly Automotive, Inc.* | 8,000 | $ | 999,680 | |||||
| PetSmart, Inc. | 9,900 | 733,689 | ||||||
| Williams-Sonoma, Inc. | 13,100 | 774,472 | ||||||
| 2,507,841 | ||||||||
| Textiles, Apparel & Luxury Goods - 2.7% | ||||||||
| Coach, Inc. | 10,400 | 602,160 | ||||||
| Consumer Staples - 6.6% | ||||||||
| Food & Staples Retailing - 2.3% | ||||||||
| Harris Teeter Supermarkets, Inc. | 10,500 | 518,490 | ||||||
| Food Products - 2.9% | ||||||||
| McCormick & Co., Inc. | 9,700 | 669,300 | ||||||
| Household Products - 1.4% | ||||||||
| Clorox Co. (The) | 3,500 | 326,095 | ||||||
| Energy - 5.3% | ||||||||
| Energy Equipment & Services - 1.5% | ||||||||
| FMC Technologies, Inc.* | 7,200 | 346,320 | ||||||
| Oil, Gas & Consumable Fuels - 3.8% | ||||||||
| Pioneer Natural Resources Co. | 2,300 | 408,825 | ||||||
| Whiting Petroleum Corp.* | 7,300 | 440,920 | ||||||
| 849,745 | ||||||||
| Financials - 5.8% | ||||||||
| Capital Markets - 4.0% | ||||||||
| T. Rowe Price Group, Inc. | 11,200 | 901,152 | ||||||
| Commercial Banks - 1.8% | ||||||||
| UMB Financial Corp. | 6,500 | 416,780 | ||||||
| Health Care - 18.7% | ||||||||
| Health Care Equipment & Supplies - 8.5% | ||||||||
| C.R. Bard, Inc. | 6,700 | 930,496 | ||||||
| ResMed, Inc. | 8,800 | 429,528 | ||||||
| Varian Medical Systems, Inc.* | 7,300 | 569,765 | ||||||
| 1,929,789 | ||||||||
6
| PAPP SMALL & MID-CAP GROWTH FUND | |||||||||
| SCHEDULE OF INVESTMENTS (Continued) | |||||||||
| COMMON STOCKS — 98.7% (Continued) | Shares | Value | ||||||
| Health Care - 18.7% (Continued) | ||||||||
| Health Care Providers & Services - 3.0% | ||||||||
| Catamaran Corp.* | 15,100 | $ | 689,013 | |||||
| �� | ||||||||
| Life Sciences Tools & Services - 7.2% | ||||||||
| Mettler-Toledo International, Inc.* | 3,650 | 899,980 | ||||||
| PAREXEL International Corp.* | 18,000 | 741,960 | ||||||
| 1,641,940 | ||||||||
| Industrials - 19.9% | ||||||||
| Air Freight & Logistics - 3.2% | ||||||||
| Expeditors International of Washington, Inc. | 17,000 | 738,480 | ||||||
| Commercial Services - 3.5% | ||||||||
| Stericycle, Inc.* | 6,800 | 798,864 | ||||||
| Electrical Equipment - 4.4% | ||||||||
| AMETEK, Inc. | 20,100 | 989,322 | ||||||
| Machinery - 7.1% | ||||||||
| IDEX Corp. | 14,200 | 1,012,886 | ||||||
| Valmont Industries, Inc. | 4,200 | 607,782 | ||||||
| 1,620,668 | ||||||||
| Professional Services - 1.7% | ||||||||
| IHS, Inc. - Class A * | 3,400 | 389,062 | ||||||
| Information Technology - 19.2% | ||||||||
| Electronic Equipment, Instruments & Components - 3.4% | ||||||||
| Trimble Navigation Ltd.* | 24,500 | 781,550 | ||||||
| Internet Software & Services - 2.4% | ||||||||
| CoStar Group, Inc.* | 2,900 | 540,096 | ||||||
| Semiconductors & Semiconductor Equipment - 2.8% | ||||||||
| Linear Technology Corp. | 8,300 | 353,165 | ||||||
| Silicon Laboratories, Inc.* | 7,100 | 277,255 | ||||||
| 630,420 | ||||||||
| Software - 10.6% | ||||||||
| FactSet Research Systems, Inc. | 7,500 | 847,500 | ||||||
| Informatica Corp.* | 21,100 | 818,891 | ||||||
| MICROS Systems, Inc.* | 14,100 | 757,452 | ||||||
| 2,423,843 | ||||||||
7
| PAPP SMALL & MID-CAP GROWTH FUND | |||||||||
| SCHEDULE OF INVESTMENTS (Continued) | |||||||||
| COMMON STOCKS — 98.7% (Continued) | Shares | Value | ||||||
| Materials - 9.5% | ||||||||
| Industrial Gases - 3.0% | ||||||||
| Airgas, Inc. | 6,300 | $ | 684,369 | |||||
| Specialty Chemicals - 6.5% | ||||||||
| Ecolab, Inc. | 10,000 | 1,071,700 | ||||||
| Sigma-Aldrich Corp. | 4,700 | 405,328 | ||||||
| 1,477,028 | ||||||||
Total Common Stocks (Cost $15,270,030) | $ | 22,472,327 | ||||||
| MONEY MARKET FUNDS — 1.3% | Shares | Value | ||||||
Fidelity Institutional Money Market Government Portfolio - Class I, 0.01%(a) (Cost $290,718) | 290,718 | $ | 290,718 | |||||
Total Investments at Value — 100.0% (Cost $15,560,748) | $ | 22,763,045 | ||||||
Other Assets in Excess of Liabilities — 0.0% (b) | 1,208 | |||||||
| Net Assets — 100.0% | $ | 22,764,253 | ||||||
| * | Non-income producing security. |
| (a) | The rate shown is the 7-day effective yield as of November 30, 2013. |
| (b) | Amount rounds to less than 0.1%. |
| See accompanying notes to financial statements. | |||||||||
8
| PAPP SMALL & MID-CAP GROWTH FUND | |||
| STATEMENT OF ASSETS AND LIABILITIES | |||
| November 30, 2013 |
| ASSETS | ||||
| Investments in securities: | ||||
| At acquisition cost | $ | 15,560,748 | ||
| At value (Note 2) | $ | 22,763,045 | ||
| Dividends receivable | 10,938 | |||
| Receivable for capital shares sold | 100 | |||
| Other assets | 12,760 | |||
| TOTAL ASSETS | 22,786,843 | |||
| LIABILITIES | ||||
| Payable to Adviser (Note 4) | 10,879 | |||
| Payable to administrator (Note 4) | 5,940 | |||
| Other accrued expenses | 5,771 | |||
| TOTAL LIABILITIES | 22,590 | |||
| NET ASSETS | $ | 22,764,253 | ||
| NET ASSETS CONSIST OF: | ||||
| Paid-in capital | $ | 15,570,274 | ||
| Accumulated net investment loss | (100,607 | ) | ||
| Undistributed net realized gains from security transactions | 92,289 | |||
| Net unrealized appreciation on investments | 7,202,297 | |||
| NET ASSETS | $ | 22,764,253 | ||
| Shares of beneficial interest outstanding (unlimited number of shares authorized, | ||||
| no par value) | 1,380,931 | |||
| Net asset value, offering price and redemption price per share (Note 2) | $ | 16.48 | ||
| See accompanying notes to financial statements. | ||||
9
| PAPP SMALL & MID-CAP GROWTH FUND | |||
| STATEMENT OF OPERATIONS | |||
| For the Year Ended November 30, 2013 |
| INVESTMENT INCOME | ||||
| Dividend income | $ | 173,973 | ||
| EXPENSES | ||||
| Investment advisory fees (Note 4) | 203,092 | |||
| Fund accounting fees (Note 4) | 32,028 | |||
| Professional fees | 30,353 | |||
| Registration and filing fees | 26,407 | |||
| Administration fees (Note 4) | 24,000 | |||
| Insurance expense | 19,850 | |||
| Transfer agent fees (Note 4) | 15,000 | |||
| Custody and bank service fees | 9,368 | |||
| Postage and supplies | 4,439 | |||
| Trustees' fees (Note 4) | 5,950 | |||
| Other expenses | 7,183 | |||
| TOTAL EXPENSES | 377,670 | |||
| Less fee reductions by the Adviser (Note 4) | (123,805 | ) | ||
| NET EXPENSES | 253,865 | |||
| NET INVESTMENT LOSS | (79,892 | ) | ||
| REALIZED AND UNREALIZED GAINS ON INVESTMENTS | ||||
| Net realized gains from security transactions | 358,811 | |||
| Net change in unrealized appreciation/depreciation on investments | 3,887,219 | |||
| NET REALIZED AND UNREALIZED GAINS ON INVESTMENTS | 4,246,030 | |||
| NET INCREASE IN NET ASSETS FROM OPERATIONS | $ | 4,166,138 | ||
| See accompanying notes to financial statements. |
10
| PAPP SMALL & MID-CAP GROWTH FUND | ||||||
| STATEMENTS OF CHANGES IN NET ASSETS |
| Year | Year | |||||||
| Ended | Ended | |||||||
| November 30, | November 30, | |||||||
| 2013 | 2012 | |||||||
| FROM OPERATIONS | ||||||||
| Net investment loss | $ | (79,892 | ) | $ | (59,362 | ) | ||
| Net realized gains (losses) from security transactions | 358,811 | (111,728 | ) | |||||
| Net change in unrealized appreciation/depreciation on investments | 3,887,219 | 1,541,938 | ||||||
| Net increase in net assets from operations | 4,166,138 | 1,370,848 | ||||||
| CAPITAL SHARE TRANSACTIONS | ||||||||
| Proceeds from shares sold | 1,172,410 | 4,554,696 | ||||||
| Payments for shares redeemed | (131,662 | ) | (185,183 | ) | ||||
| Net increase in net assets from capital share transactions | 1,040,748 | 4,369,513 | ||||||
| TOTAL INCREASE IN NET ASSETS | 5,206,886 | 5,740,361 | ||||||
| NET ASSETS | ||||||||
| Beginning of year | 17,557,367 | 11,817,006 | ||||||
| End of year | $ | 22,764,253 | $ | 17,557,367 | ||||
| ACCUMULATED NET INVESTMENT LOSS | $ | (100,607 | ) | $ | (56,450 | ) | ||
| CAPITAL SHARE ACTIVITY | ||||||||
| Shares sold | 79,212 | 359,837 | ||||||
| Shares redeemed | (8,755 | ) | (13,907 | ) | ||||
| Net increase in shares outstanding | 70,457 | 345,930 | ||||||
| Shares outstanding at beginning of year | 1,310,474 | 964,544 | ||||||
| Shares outstanding at end of year | 1,380,931 | 1,310,474 | ||||||
| See accompanying notes to financial statements. |
11
| PAPP SMALL & MID-CAP GROWTH FUND | |||||||||||||
| FINANCIAL HIGHLIGHTS | |||||||||||||
| Per Share Data for a Share Outstanding Throughout Each Period | |||||||||||||
| Year | Year | Year | Period | ||||||||||||||
| Ended | Ended | Ended | Ended | ||||||||||||||
| November 30, | November 30, | November 30, | November 30, | ||||||||||||||
| 2013 | 2012 | 2011 | 2010 (a) | ||||||||||||||
| Net asset value at beginning of period | $ | 13.40 | $ | 12.25 | $ | 11.68 | $ | 10.00 | |||||||||
| Income (loss) from investment operations: | |||||||||||||||||
| Net investment loss | (0.06 | ) | (0.05 | ) | (0.04 | ) | (0.01 | ) | |||||||||
| Net realized and unrealized gains on investments | 3.14 | 1.20 | 0.61 | 1.69 | |||||||||||||
| Total from investment operations | 3.08 | 1.15 | 0.57 | 1.68 | |||||||||||||
| Net asset value at end of period | $ | 16.48 | $ | 13.40 | $ | 12.25 | $ | 11.68 | |||||||||
Total return (b) | 22.99% | 9.39% | 4.88% | 16.80% | (c) | ||||||||||||
| Net assets at end of period | $ | 22,764,253 | $ | 17,557,367 | $ | 11,817,006 | $ | 9,152,547 | |||||||||
| Ratios/supplementary data: | |||||||||||||||||
| Ratio of total expenses to average net assets | 1.86% | 2.05% | 2.43% | 3.03% | (e) | ||||||||||||
Ratio of net expenses to average net assets (d) | 1.25% | 1.25% | 1.25% | 1.25% | (e) | ||||||||||||
Ratio of net investment loss to average net assets (d) | (0.39% | ) | (0.37% | ) | (0.36% | ) | (0.25% | ) | (e) | ||||||||
| Portfolio turnover rate | 10% | 13% | 5% | 2% | (c) | ||||||||||||
| (a) | Represents the period from the commencement of operations (March 8, 2010) through November 30, 2010. | ||||||||||||||
| (b) | Total return is a measure of the change in value of an investment in the Fund over the periods covered. The returns shown do not reflect the deduction of taxes a shareholder would pay on Fund distributions, if any, or the redemption of Fund shares. Had the Adviser not waived all or a portion of its fees, total returns would have been lower. | ||||||||||||||
| (c) | Not annualized. | ||||||||||||||
| (d) | Ratio was determined after advisory fee reductions and expense reimbursements (Note 4). | ||||||||||||||
| (e) | Annualized. | ||||||||||||||
| See accompanying notes to financial statements. |
12
PAPP SMALL & MID-CAP GROWTH FUND
NOTES TO FINANCIAL STATEMENTS
November 30, 2013
| 1. | Organization |
Papp Small & Mid-Cap Growth Fund (the “Fund”) is a diversified series of Papp Investment Trust (the “Trust”), an open-end investment company established as an Ohio business trust under a Declaration of Trust dated November 12, 2009. The Fund commenced operations on March 8, 2010.
The investment objective of the Fund is long-term capital growth.
| 2. | Significant Accounting Policies |
The following is a summary of the Fund's significant accounting policies. The policies are in conformity with accounting principles generally accepted in the United States of America (“GAAP”).
Securities valuation – The Fund’s portfolio securities are valued at market value as of the close of regular trading on the New York Stock Exchange (the “NYSE”) (normally 4:00 p.m. Eastern time) on each business day the NYSE is open. Securities listed on the NYSE or other exchanges are valued on the basis of their last sales prices on the exchanges on which they are primarily traded. If there are no sales on that day, the securities are valued at the closing bid price on the NYSE or other primary exchange for that day. NASDAQ listed securities are valued at the NASDAQ Official Closing Price. If there are no sales on that day, the securities are valued at the last bid price as reported by NASDAQ. Securities traded in the over-the-counter market are valued at the last reported sale price, if available, otherwise at the most recently quote bid price. In the event that market quotations are not readily available, securities and other assets are valued at fair value as determined in good faith in accordance with procedures adopted by the Board of Trustees and will be classified as Level 2 or 3 within the fair value hierarchy (see below), depending on the inputs used. Factors determining portfolio investments subject to fair value determination include, but are not limited to, the following: the spread between bid and asked prices is substantial; infrequency of sales; thinness of market; the size of reported trades; a temporary lapse in the provision of prices by any reliable pricing source; and actions of the securities or future markets, such as the suspension or limitation of trading. Securities with remaining maturities of 60 days or less are valued at amortized cost value, absent unusual circumstances.
GAAP establishes a single authoritative definition of fair value, sets out a framework for measuring fair value and requires additional disclosures about fair value measurements.
Various inputs are used in determining the value of the Fund’s investments. These inputs are summarized in the three broad levels listed below:
• Level 1 – quoted prices in active markets for identical securities
• Level 2 – other significant observable inputs
• Level 3 – significant unobservable inputs
The inputs or methodology used for valuing securities are not necessarily an indication of the risks associated with investing in those securities. The inputs used to measure fair value may fall into different levels of the fair value hierarchy. In such cases, for disclosure purposes, the level in the fair value hierarchy within which the fair value measurement falls in its entirety is determined based on the lowest level input that is significant to the fair value measurement.
13
PAPP SMALL & MID-CAP GROWTH FUND
NOTES TO FINANCIAL STATEMENTS (Continued)
The following is a summary of the inputs used to value the Fund’s investments as of November 30, 2013:
| Level 1 | Level 2 | Level 3 | Total | |||||||||||||
| Common Stocks | $ | 22,472,327 | $ | - | $ | - | $ | 22,472,327 | ||||||||
| Money Market Funds | 290,718 | - | - | 290,718 | ||||||||||||
| Total | $ | 22,763,045 | $ | - | $ | - | $ | 22,763,045 | ||||||||
Refer to the Fund’s Schedule of Investments for a listing of the common stocks by industry type. As of November 30, 2013, the Fund did not have any transfers in or out of any Level. In addition, the Fund did not have derivative instruments or any assets or liabilities that were measured at fair value on a recurring basis using significant unobservable inputs (Level 3) as of November 30, 2013. It is the Fund’s policy to recognize transfers into or out of any Level at the end of the reporting period.
Share valuation – The net asset value per share of the Fund is calculated daily by dividing the total value of the Fund’s assets, less liabilities, by the number of shares outstanding. The offering price and redemption price per share of the Fund is equal to the net asset value per share.
Investment income – Dividend income is recorded on the ex-dividend date. Interest income is accrued as earned.
Security transactions – Security transactions are accounted for on the trade date. Gains and losses on securities sold are determined on a specific identification basis.
Distributions to shareholders – Distributions to shareholders arising from net investment income and net realized capital gains, if any, are distributed at least once each year. The amount of distributions from net investment income and net realized gains are determined in accordance with federal income tax regulations, which may differ from GAAP. Dividends and distributions to shareholders are recorded on the ex-dividend date. There were no distributions paid to shareholders during the years ended November 30, 2013 and November 30, 2012. On December 31, 2013, a capital gain distribution of $0.0668 per share was declared for the Fund. The distribution was paid on December 31, 2013 to shareholders of record on December 30, 2013.
Estimates – The preparation of financial statements in conformity with GAAP requires management to make estimates and assumptions that affect the reported amounts of assets and liabilities and disclosure of contingent assets and liabilities as of the date of the financial statements and the reported amounts of income and expenses during the reporting period. Actual results could differ from those estimates.
Federal income tax – The Fund intends to continue to qualify each year as a “regulated investment company” under Subchapter M of the Internal Revenue Code of 1986 (the “Code”). By so qualifying, the Fund will not be subject to federal income taxes to the extent that it distributes its net investment income and any realized capital gains in accordance with the Code. Accordingly, no provision for income taxes has been made.
In order to avoid imposition of the excise tax applicable to regulated investment companies, it is also the Fund's intention to declare as dividends in each calendar year at least 98% of its net investment income (earned during the calendar year) and 98.2% of its net realized capital gains (earned during the twelve months ended November 30) plus undistributed amounts from prior years.
14
PAPP SMALL & MID-CAP GROWTH FUND
NOTES TO FINANCIAL STATEMENTS (Continued)
The following information is computed on a tax basis for each item as of November 30, 2013:
| Tax cost of portfolio investments | $ | 15,560,748 | ||
| Gross unrealized appreciation | $ | 7,308,825 | ||
| Gross unrealized depreciation | (106,528 | ) | ||
| Net unrealized appreciation | 7,202,297 | |||
| Qualified late year ordinary losses | (100,607 | ) | ||
| Undistributed long-term gains | 92,289 | |||
| Distributable earnings | $ | 7,193,979 |
Net qualified late year ordinary losses incurred after December 31, 2012 and within the taxable year are deemed to arise on the first day of the Fund’s next taxable year. For the year ended November 30, 2013, the Fund intends to defer $100,607 of late year ordinary losses to December 1, 2013 for federal tax purposes.
For the year ended November 30, 2013, the Fund reclassified $35,735 of net investment loss against paid-in capital on the Statement of Assets and Liabilities. Such reclassification, the result of permanent differences between the financial statement and income tax reporting requirements, had no effect on the Fund’s net assets or net asset value per share.
During the year ended November 30, 2013, the Fund utilized capital loss carryforwards of $266,522 to offset current year realized gains.
The Fund recognizes the tax benefits or expenses of uncertain tax positions only when the position is “more likely than not” to be sustained assuming examination by tax authorities. Management has reviewed the Fund’s tax positions taken on federal income tax returns for all open tax years (November 30, 2010 through November 30, 2013) and has concluded that no provision for unrecognized tax benefits or expenses is required in these financial statements and does not expect this to change over the next twelve months. The Fund identifies its major tax jurisdiction as U.S. Federal.
| 3. | Investment Transactions |
During the year ended November 30, 2013, cost of purchases and proceeds from sales of investment securities, other than short-term investments, were $2,855,890 and $1,914,281, respectively.
| 4. | Transactions with Related Parties |
Certain Trustees and officers of the Trust are directors and officers of L. Roy Papp & Associates, LLP (the “Adviser”) or of Ultimus Fund Solutions, LLC (“Ultimus”), the Fund’s administrator, transfer agent and fund accounting agent, and Ultimus Fund Distributors, LLC (the “Distributor”), the Fund’s principal underwriter.
15
PAPP SMALL & MID-CAP GROWTH FUND
NOTES TO FINANCIAL STATEMENTS (Continued)
INVESTMENT ADVISORY AGREEMENT
The Fund’s investments are managed by the Adviser pursuant to the terms of an Investment Advisory Agreement. For its services, the Fund pays the Adviser an advisory fee, computed daily and paid monthly, at the annual rate of 1.00% of its average daily net assets.
The Adviser has contractually agreed to reduce its advisory fees and to reimburse the Fund’s operating expenses to the extent necessary so that the Fund’s annual ordinary operating expenses (excluding brokerage costs, taxes, interest, costs to organize the Fund, acquired fund fees and expenses and extraordinary expenses, if any) do not exceed an amount equal to 1.25% of its average daily net assets. This Expense Limitation Agreement remains in effect until at least April 1, 2014. Accordingly, the Adviser reduced its advisory fees by $123,805 during the year ended November 30, 2013.
The Expense Limitation Agreement permits the Adviser to recover fee reductions and expense reimbursements made on behalf of the Fund, but only for a period of three years after such reduction or reimbursement and only if such recovery will not cause the Fund’s expense ratio to exceed the annual rate of 1.25%. As of November 30, 2013, the Adviser may in the future recover fee reductions and expense reimbursements totaling $382,395. The Adviser may recover a portion of this amount no later than the dates as stated below:
| November 30, 2014 | $ | 129,075 | ||
| November 30, 2015 | 129,515 | |||
| November 30, 2016 | 123,805 | |||
| $ | 382,395 |
ADMINISTRATION AGREEMENT
Under the terms of an Administration Agreement with the Trust, Ultimus provides internal regulatory compliance services and executive and administrative services for the Fund. Ultimus supervises the preparation of tax returns, reports to shareholders of the Fund, reports to and filings with the Securities and Exchange Commission (the “SEC”) and state securities commissions and materials for meetings of the Board of Trustees. For these services, the Fund pays to Ultimus, on a monthly basis, a fee equal to 0.10% per annum of the Fund’s average daily net assets up to $250 million, 0.075% of such assets from $250 million to $500 million and 0.05% of such assets in excess of $500 million, provided, however, that the minimum fee is $2,000 per month.
FUND ACCOUNTING AGREEMENT
Under the terms of a Fund Accounting Agreement with the Trust, Ultimus calculates the daily net asset value per share and maintains the financial books and records of the Fund. For these services, the Fund pays to Ultimus a base fee of $2,500 per month, plus an asset-based fee at the annual rate of 0.01% of the Fund’s average daily net assets up to $500 million and 0.005% of such assets in excess of $500 million. In addition, the Fund pays all costs of external pricing services.
16
PAPP SMALL & MID-CAP GROWTH FUND
NOTES TO FINANCIAL STATEMENTS (Continued)
TRANSFER AGENT AND SHAREHOLDER SERVICES AGREEMENT
Under the terms of a Transfer Agent and Shareholder Services Agreement with the Trust, Ultimus maintains the records of each shareholder’s account, answers shareholders’ inquiries concerning their accounts, processes purchases and redemptions of the Fund’s shares, acts as dividend and distribution disbursing agent and performs other shareholder service functions. For these services, Ultimus receives from the Fund an annual fee of $20 per shareholder account, subject to a monthly minimum fee. The minimum monthly fee is $1,500 if the Fund has 100 or more shareholder accounts; $1,250 if the Fund has between 25 and 100 shareholder accounts; and $1,000 if the Fund has 25 or less shareholder accounts. In addition, the Fund pays out-of-pocket expenses, including, but not limited to, postage and supplies.
DISTRIBUTION AGREEMENT
Under the terms of a Distribution Agreement with the Trust, the Distributor serves as principal underwriter to the Fund. The Distributor is a wholly-owned subsidiary of Ultimus. The Distributor receives annual compensation of $6,000 for such services. The Distributor is compensated by the Adviser (not the Fund) for acting as principal underwriter.
PLAN OF DISTRIBUTION
The Trust has adopted a plan of distribution (the “Plan”) pursuant to which the Fund may incur certain expenses related to the distribution of its shares. The annual limitation of payment of expenses pursuant to the Plan is 0.25% of the Fund’s average daily net assets. The Board of Trustees has not authorized the payment of any fees pursuant to the Plan until at least April 1, 2014.
TRUSTEE COMPENSATION
Effective April 16, 2013, each Trustee who is not an interested person of the Trust (“Independent Trustees”) receives from the Fund a fee of $500 for each Board meeting attended, except that the Chair of the Committee of Independent Trustees receives a fee of $700 for each Board meeting attended. Prior to April 16, 2013, each Independent Trustee received from the Fund a fee of $250 for each Board meeting attended, except that the Chair of the Committee of Independent Trustees received a fee of $350 for each Board meeting attended.
| 5. | Contingencies and Commitments |
The Fund indemnifies the Trust's officers and Trustees for certain liabilities that might arise from their performance of their duties to the Fund. Additionally, in the normal course of business the Fund enters into contracts that contain a variety of representations and warranties and which provide general indemnifications. The Fund’s maximum exposure under these arrangements is unknown, as this would involve future claims that may be made against the Fund that have not yet occurred. However, based on experience, the Fund expects the risk of loss to be remote.
| 6. | Subsequent Events |
The Fund is required to recognize in the financial statements the effects of all subsequent events that provide additional evidence about conditions that existed as of the date of the Statement of Assets and Liabilities. For non-recognized subsequent events that must be disclosed to keep the financial statements from being misleading, the Fund is required to disclose the nature of the event as well as an estimate of its financial effect, or a statement that such an estimate cannot be made. Management has evaluated subsequent events through the issuance of these financial statements and has noted no such events.
17
REPORT OF INDEPENDENT REGISTERED PUBLIC ACCOUNTING FIRM
To the Board of Trustees of Papp Investment Trust
and the Shareholders of Papp Small & Mid-Cap Growth Fund
We have audited the accompanying statement of assets and liabilities of Papp Small & Mid-Cap Growth Fund (the “Fund”), a series of shares of beneficial interest of Papp Investment Trust, including the schedule of investments, as of November 30, 2013, and the related statement of operations for the year then ended, the statements of changes in net assets for each of the years in the two-year period then ended and the financial highlights for each of the years in the three-year period then ended and for the period March 8, 2010 (commencement of operations) through November 30, 2010. These financial statements and financial highlights are the responsibility of the Fund's management. Our responsibility is to express an opinion on these financial statements and financial highlights based on our audits.
We conducted our audits in accordance with the standards of the Public Company Accounting Oversight Board (United States). Those standards require that we plan and perform the audits to obtain reasonable assurance about whether the financial statements and financial highlights are free of material misstatement. An audit includes examining, on a test basis, evidence supporting the amounts and disclosures in the financial statements. Our procedures included confirmation of securities owned as of November 30, 2013 by correspondence with the custodian. An audit also includes assessing the accounting principles used and significant estimates made by management, as well as evaluating the overall financial statement presentation. We believe that our audits provide a reasonable basis for our opinion.
In our opinion, the financial statements and financial highlights referred to above present fairly, in all material respects, the financial position of Papp Small & Mid-Cap Growth Fund as of November 30, 2013, the results of its operations for the year then ended, the changes in its net assets for each of the years in the two-year period then ended and its financial highlights for each of the years in the three-year period then ended and for the period March 8, 2010 through November 30, 2010, in conformity with accounting principles generally accepted in the United States of America.
 | |
| BBD, LLP |
Philadelphia, Pennsylvania
January 22, 2014
18
PAPP SMALL & MID-CAP GROWTH FUND
ABOUT YOUR FUND’S EXPENSES (Unaudited)
We believe it is important for you to understand the impact of costs on your investment. As a shareholder of the Fund, you incur ongoing costs, including management fees and other operating expenses. The following examples are intended to help you understand your ongoing costs (in dollars) of investing in the Fund and to compare these costs with the ongoing costs of investing in other mutual funds.
A mutual fund’s ongoing costs are expressed as a percentage of its average net assets. This figure is known as the expense ratio. The expenses in the table below are based on an investment of $1,000 made at the beginning of the most recent period (June 1, 2013) and held until the end of the period (November 30, 2013).
The table below illustrates the Fund’s ongoing costs in two ways:
Actual fund return – This section helps you to estimate the actual expenses that you paid over the period. The “Ending Account Value” shown is derived from the Fund’s actual return, and the third column shows the dollar amount of operating expenses that would have been paid by an investor who started with $1,000 in the Fund. You may use the information here, together with the amount you invested, to estimate the expenses that you paid over the period.
To do so, simply divide your account value by $1,000 (for example, an $8,600 account value divided by $1,000 = 8.6), then multiply the result by the number given for the Fund under the heading “Expenses Paid During Period.”
Hypothetical 5% return – This section is intended to help you compare the Fund’s ongoing costs with those of other mutual funds. It assumes that the Fund had an annual return of 5% before expenses during the period shown, but that the expense ratio is unchanged. In this case, because the return used is not the Fund’s actual return, the results do not apply to your investment. The example is useful in making comparisons because the SEC requires all mutual funds to calculate expenses based on a 5% return. You can assess the Fund’s ongoing costs by comparing this hypothetical example with the hypothetical examples that appear in shareholder reports of other funds.
Note that expenses shown in the table are meant to highlight and help you compare ongoing costs only. The Fund does not charge transaction fees, such as purchase or redemption fees, nor does it carry a “sales load.”
The calculations assume no shares were bought or sold during the period. Your actual costs may have been higher or lower, depending on the amount of your investment and the timing of any purchases or redemptions.
More information about the Fund’s expenses, including historical annual expense ratios, can be found in this report. For additional information on operating expenses and other shareholder costs, please refer to the Fund’s prospectus.
Beginning Account Value | Ending Account Value | Expenses Paid During | |
| Based on Actual Fund Return | $1,000.00 | $1,101.60 | $6.59 |
| Based on Hypothetical 5% Return (before expenses) | $1,000.00 | $1,018.80 | $6.33 |
| * | Expenses are equal to the Fund’s annualized expense ratio of 1.25% for the period, multiplied by the average account value over the period, multiplied by 183/365 (to reflect the one-half year period). |
19
PAPP SMALL & MID-CAP GROWTH FUND
OTHER INFORMATION (Unaudited)
A description of the policies and procedures that the Fund uses to vote proxies relating to portfolio securities is available without charge upon request by calling toll-free 1-877-370-7277, or on the SEC’s website at http://www.sec.gov. Information regarding how the Fund voted proxies relating to portfolio securities during the most recent 12-month period ended June 30 is available without charge upon request by calling toll-free 1-877-370-7277, or on the SEC’s website at http://www.sec.gov.
The Trust files a complete listing of portfolio holdings for the Fund with the SEC as of the end of the first and third quarters of each fiscal year on Form N-Q. These filings are available upon request by calling 1-877-370-7277. Furthermore, you may obtain a copy of the filings on the SEC's website at http://www.sec.gov. The Trust's Forms N-Q may also be reviewed and copied at the SEC's Public Reference Room in Washington, DC, and information on the operation of the Public Reference Room may be obtained by calling 1-800-SEC-0330.
20
PAPP SMALL & MID-CAP GROWTH FUND
BOARD OF TRUSTEES AND EXECUTIVE OFFICERS (Unaudited)
The Board of Trustees has overall responsibility for management of the Trust’s affairs. The Trustees serve during the lifetime of the Trust and until its termination, or until death, resignation, retirement, or removal. The Trustees, in turn, elect the officers of the Trust to actively supervise its day-to-day operations. The officers have been elected for an annual term. The following are the Trustees and executive officers of the Trust:
| Name, Address and Age | Position(s) Held with Trust and Length of Time Served | Principal Occupation(s) During Past 5 Years and Directorships of Public Companies | Number of Funds in Trust Overseen by Trustee |
Interested Trustees: | |||
*Harry A. Papp Born: January 1954 2201 E. Camelback Road Suite 227B Phoenix, AZ 85016 | President and Trustee since December 2011; Vice President February 2010 to December 2011 | Managing Partner of L. Roy Papp & Associates, LLP | 1 |
*Rosellen C. Papp Born: December 1954 2201 E. Camelback Road Suite 227B Phoenix, AZ 85016 | Trustee since February 2010 | Partner and Research Director of L. Roy Papp & Associates, LLP | 1 |
Independent Trustees: | |||
James K. Ballinger Born: July 1949 2201 E. Camelback Road Suite 227B Phoenix, AZ 85016 | Trustee since February 2010 | Executive Director, Phoenix Art Museum | 1 |
Cynthia P. Hubiak Born: June 1959 2201 E. Camelback Road Suite 227B Phoenix, AZ 85016 | Trustee since February 2010 | President and Chief Executive Officer, Arizona Society of CPAs | 1 |
Carolyn P. O’Malley Born: September 1947 2201 E. Camelback Road Suite 227B Phoenix, AZ 85016 | Trustee since February 2010 | Retired; Executive Director, Dorrance Family Foundation (a private foundation providing educational, conservation and other grants) from 2001-2009. | 1 |
| * | Harry A. Papp and Rosellen C. Papp, as partners of the Adviser, are considered “interested persons” of the Trust within the meaning of Section 2(a)(19) of the Investment Company Act of 1940. Harry A. Papp and Rosellen C. Papp are married. |
21
PAPP SMALL & MID-CAP GROWTH FUND
BOARD OF TRUSTEES AND EXECUTIVE OFFICERS (Unaudited) (Continued)
| Name, Address and Age | Position(s) Held with Trust and Length of Time Served | Principal Occupation(s) During Past 5 Years |
Executive Officers: | ||
Brian M. Riordan Born: July 1973 2201 E. Camelback Road Suite 227B Phoenix, AZ 85016 | Vice President since February 2012 | Partner and Research Analyst of L. Roy Papp & Associates, LLP |
Robert G. Dorsey Born: April 1957 225 Pictoria Drive, Suite 450 Cincinnati, Ohio 45246 | Vice President since November 2009 | Managing Director of Ultimus Fund Solutions, LLC and Ultimus Fund Distributors, LLC |
Theresa M. Bridge Born: December 1969 225 Pictoria Drive, Suite 450 Cincinnati, Ohio 45246 | Treasurer since January 2013 | Vice President, Mutual Fund Controller of Ultimus Fund Solutions, LLC |
Tina H. Bloom Born: August 1968 225 Pictoria Drive, Suite 450 Cincinnati, Ohio 45246 | Secretary since July 2011 | Director of Administration of Ultimus Fund Solutions, LLC and Vice President of Ultimus Fund Distributors, LLC |
Julie A. Hein Born: April 1962 2201 E. Camelback Road Suite 227B Phoenix, AZ 85016 | Chief Compliance Officer since February 2010 | Partner and Chief Compliance Officer of L. Roy Papp & Associates, LLP |
Additional information about members of the Board and executive officers is available in the Fund’s Statement of Additional Information (“SAI”). To obtain a free copy of the SAI, please call 1-877-370-7277.
22
| Item 2. | Code of Ethics. |
As of the end of the period covered by this report, the registrant has adopted a code of ethics that applies to the registrant’s principal executive officer, principal financial officer, principal accounting officer or controller, or persons performing similar functions, regardless of whether these individuals are employed by the registrant or a third party. Pursuant to Item 12(a)(1), a copy of registrant’s code of ethics is filed as an exhibit to this Form N-CSR. During the period covered by this report, the code of ethics has not been amended, and the registrant has not granted any waivers, including implicit waivers, from the provisions of the code of ethics.
| Item 3. | Audit Committee Financial Expert. |
The registrant’s board of trustees has determined that the registrant has at least one audit committee financial expert serving on its audit committee. The name of the audit committee financial expert is Cynthia P. Hubiak. Ms. Hubiak is “independent” for purposes of this Item.
| Item 4. | Principal Accountant Fees and Services. |
| (a) | Audit Fees. The aggregate fees billed for professional services rendered by the principal accountant for the audit of the registrant’s annual financial statements or for services that are normally provided by the accountant in connection with statutory and regulatory filings or engagements were $11,500 and $11,500 with respect to the registrant’s fiscal years ended November 30, 2013 and 2012, respectively. |
| (b) | Audit-Related Fees. No fees were billed in the last fiscal year for assurance and related services by the principal accountant that are reasonably related to the performance of the audit of the registrant’s financial statements and are not reported under paragraph (a) of this Item. |
| (c) | Tax Fees. The aggregate fees billed for professional services rendered by the principal accountant for tax compliance, tax advice, and tax planning were $2,000 and $2,000 with respect to the registrant’s fiscal years ended November 30, 2013 and 2012, respectively. The services comprising these fees are the preparation of the registrant’s federal income and excise tax returns. |
| (d) | All Other Fees. No fees were billed in either of the last two fiscal years for products and services provided by the principal accountant, other than the services reported in paragraphs (a) through (c) of this Item. |
| (e)(1) | The audit committee has not adopted pre-approval policies and procedures described in paragraph (c)(7) of Rule 2-01 of Regulation S-X. |
| (e)(2) | None of the services described in paragraph (b) through (d) of this Item were approved by the audit committee pursuant to paragraph (c)(7)(i)(C) of Rule 2-01 of Regulation S-X. |
| (f) | Less than 50% of hours expended on the principal accountant’s engagement to audit the registrant’s financial statements for the most recent fiscal year were attributed to work performed by persons other than the principal accountant’s full-time, permanent employees. |
| (g) | During the fiscal years ended November 30, 2013 and 2012, aggregate non-audit fees of $2,000 and $2,000, respectively, were billed by the registrant’s principal accountant for services rendered to the registrant. No non-audit fees were billed in the last fiscal year by the registrant’s principal accountant for services rendered to the registrant’s investment adviser (not including any sub-adviser whose role is primarily portfolio management and is subcontracted with or overseen by another investment adviser), and any entity controlling, controlled by, or under common control with the adviser that provides ongoing services to the registrant. |
| (h) | The principal accountant has not provided any non-audit services to the registrant’s investment adviser (not including any sub-adviser whose role is primarily portfolio management and is subcontracted with or overseen by another investment adviser), and any entity controlling, controlled by, or under common control with the investment adviser that provides ongoing services to the registrant. |
| Item 5. | Audit Committee of Listed Registrants. |
Not applicable
| Item 6. | Schedule of Investments. |
| (a) | Not applicable [schedule filed with Item 1] |
| (b) | Not applicable |
| Item 7. | Disclosure of Proxy Voting Policies and Procedures for Closed-End Management Investment Companies. |
| Not applicable |
| Item 8. | Portfolio Managers of Closed-End Management Investment Companies. |
| Not applicable |
| Item 9. | Purchases of Equity Securities by Closed-End Management Investment Company and Affiliated Purchasers. |
| Not applicable |
| Item 10. | Submission of Matters to a Vote of Security Holders. |
The registrant’s Committee of Independent Trustees shall review shareholder recommendations to fill vacancies on the registrant’s board of trustees if such recommendations are submitted in writing, addressed to the Committee at the registrant’s offices and meet any minimum qualifications adopted by the Committee. The Committee may adopt, by resolution, a policy regarding its procedures for considering candidates for the board of trustees, including any recommended by shareholders.
| Item 11. | Controls and Procedures. |
(a) Based on their evaluation of the registrant’s disclosure controls and procedures (as defined in Rule 30a-3(c) under the Investment Company Act of 1940) as of a date within 90 days of the filing date of this report, the registrant’s principal executive officer and principal financial officer have concluded that such disclosure controls and procedures are reasonably designed and are operating effectively to ensure that material information relating to the registrant, including its consolidated subsidiaries, is made known to them by others within those entities, particularly during the period in which this report is being prepared, and that the information required in filings on Form N-CSR is recorded, processed, summarized, and reported on a timely basis.
(b) There were no changes in the registrant’s internal control over financial reporting (as defined in Rule 30a-3(d) under the Investment Company Act of 1940) that occurred during the second fiscal quarter of the period covered by this report that have materially affected, or are reasonably likely to materially affect, the registrant’s internal control over financial reporting.
| Item 12. | Exhibits. |
File the exhibits listed below as part of this Form. Letter or number the exhibits in the sequence indicated.
(a)(1) Any code of ethics, or amendment thereto, that is the subject of the disclosure required by Item 2, to the extent that the registrant intends to satisfy the Item 2 requirements through filing of an exhibit: Attached hereto
(a)(2) A separate certification for each principal executive officer and principal financial officer of the registrant as required by Rule 30a-2(a) under the Act (17 CFR 270.30a-2(a)): Attached hereto
(a)(3) Any written solicitation to purchase securities under Rule 23c-1 under the Act (17 CFR 270.23c-1) sent or given during the period covered by the report by or on behalf of the registrant to 10 or more persons: Not applicable
(b) Certifications required by Rule 30a-2(b) under the Act (17 CFR 270.30a-2(b)): Attached hereto
| Exhibit 99.CODE ETH | Code of Ethics |
| Exhibit 99.CERT | Certifications required by Rule 30a-2(a) under the Act |
| Exhibit 99.906CERT | Certifications required by Rule 30a-2(b) under the Act |
SIGNATURES
Pursuant to the requirements of the Securities Exchange Act of 1934 and the Investment Company Act of 1940, the registrant has duly caused this report to be signed on its behalf by the undersigned, thereunto duly authorized.
(Registrant) Papp Investment Trust
| By (Signature and Title)* | /s/ Harry A. Papp | ||
| Harry A. Papp, President | |||
| Date | January 29, 2014 | ||
Pursuant to the requirements of the Securities Exchange Act of 1934 and the Investment Company Act of 1940, this report has been signed below by the following persons on behalf of the registrant and in the capacities and on the dates indicated.
| By (Signature and Title)* | /s/ Harry A. Papp | ||
| Harry A. Papp, President | |||
| Date | January 29, 2014 | ||
| By (Signature and Title)* | /s/ Theresa M. Bridge | ||
| Theresa M. Bridge, Treasurer | |||
| Date | January 29, 2014 | ||
| * | Print the name and title of each signing officer under his or her signature. |