| OMB APPROVAL |
OMB Number: 3235-0570 Expires: January 31, 2017 Estimated average burden hours per response: 20.6 |
| Investment Company Act file number | 811-22359 |
| Papp Investment Trust |
| (Exact name of registrant as specified in charter) |
| 2201 E. Camelback Road, Suite 227B Phoenix, Arizona | 45419 |
| (Address of principal executive offices) | (Zip code) |
| Ultimus Fund Solutions, LLC 225 Pictoria Drive, Suite 450 Cincinnati, Ohio 45246 |
| (Name and address of agent for service) |
| Registrant's telephone number, including area code: | (602) 956-0980 |
| Date of fiscal year end: | November 30 | |
| Date of reporting period: | November 30, 2016 |
| Item 1. | Reports to Stockholders. |
Papp Investment Trust Papp Small & Mid-Cap Growth Fund
Annual Report
November 30, 2016
Investment Adviser L. Roy Papp & Associates, LLP Phoenix, AZ |

PAPP SMALL & MID-CAP GROWTH FUND | |
LETTER TO SHAREHOLDERS | November 30, 2016 |
Dear Fellow Shareholder,
We are writing to report on the results of the Papp Small & Mid-Cap Growth Fund (the “Fund”) for the fiscal year ended November 30, 2016. This past year, the U.S. stock market experienced a correction in January and February and a quick recovery in March and April. In June when Britain voted to leave the EU, we experienced a sharp decline followed by a recovery over the next five days. After the presidential election results in early November, we experienced strong market conditions which continued past November 30th through December of 2016. The Fund performed directionally as we would have expected. In January and February the Fund’s holdings were down less than the market. The Fund also did not decline as much as the market after the Brexit vote. The Fund trailed its benchmark index, the Russell MidCap® Growth Index (the “Benchmark”) in the recoveries and in the post-election market strength. Over the year we experienced a number of market forces, including concern about Chinese financial markets in January and February which led to a market sell off and very low oil prices. Later concerns about China diminished and oil prices recovered nicely. Throughout the year markets were trying to assess the likely behavior of the Federal Reserve (the “Fed”), which ultimately came out with one interest rate increase in December. The Fed did indicate that approximately three rate increases were likely during 2017. Higher rates have hurt utilities and REITs, which the Fund does not own.
The Fund’s investment strategy is designed to identify high quality companies with consistent earnings and cash flow growth. We expect this strategy to work reasonably well during most market conditions, but its best relative performance is likely to come during difficult economic times. Once again we saw this play out during the dips in 2016, but the strong recoveries and the strength in the market after the election boosted what we consider to be lower quality companies and several high flyers, which are large components of the Benchmark.
For the year ended November 30, 2016, our Fund produced a total return of 0.14% as compared to the Benchmark, which returned 4.54%. While we are disappointed with this year’s performance, it does come after relatively strong performance compared to the Benchmark last fiscal year.
The Fund’s net asset value on November 30, 2016 was $17.73 per share, down from $18.14 per share on November 30, 2015. During the first quarter of this fiscal year, the Fund paid a capital gain of $0.4157 cents per share, which accounts for the Fund’s decline in its share price. The distribution was due primarily to the gain on the sale of several companies held by the Fund being acquired during the fiscal year, including: Sigma-Aldrich, Informatica and Catamaran Corporation. Once again we are reminded that one of the benefits of investing in small and mid-cap companies is that if the stock price does not eventually reflect the true economic value of the underlying businesses, other companies will from time to time acquire those businesses. We do our best to
1
manage the tax impact of the Fund’s portfolio, but it is difficult to avoid capital gains distributions when Fund holdings are acquired. As a result of the operations during the fiscal year ended November 30, 2016, we were able to avoid any capital gains distributions for calendar year 2016.
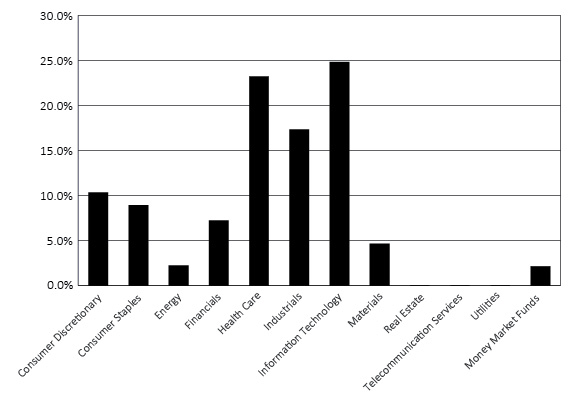
The Fund remains well diversified, holding 31 companies as of November 30, 2016. The Fund is normally fully invested, and as of November 30, 2016 had 98.5% of its assets invested in stocks, with the balance in a money market fund. The Fund is currently underweight relative to its Benchmark in the Consumer Discretionary and Real Estate sectors. The Fund is overweight in the Health Care and Industrial sectors, which we continue to feel offer attractive relative valuations.
Turning to individual companies in the portfolio, performance was helped by Mettler-Toledo, which experienced strong earnings reports and a stabilizing business in the Chinese industrial space. Diversified manufacturer IDEX Corporation enjoyed strong sales in both their health and science segment and a stabilization in demand in its energy and commodity customers. The Fund also benefited from several technology company acquisitions this year: FEI Company, which was acquired by Thermo Fisher Scientific; Linear Technology, which announced an acquisition by Analog Devices; and NXP Semiconductors, which is set to be acquired by Qualcomm. We also saw strong results from healthcare equipment provider C.R. Bard and software company Pegasystems.
Performance was hurt by disappointing results from Stericycle, which led us to exit the position. We also experienced weakness in Polaris Industries, an ATV, snowmobile and motorcycle manufacturer where we also exited the position. PAREXEL, which does contract research services for the drug industry, experienced weakness due to earnings disappointments. We continue to be optimistic about the long-term opportunities for PAREXEL and the contract research industry so we have retained a position. We also experienced weakness in industrial manufacturer AMETEK, which continues to experience slower sales to energy and commodity customers. Retailers Williams-Sonoma and Tractor Supply both experienced a highly promotional environment which led to earnings disappointments.
Looking forward, the U.S. economy seems poised to grow at a slightly faster pace. Third quarter GDP, prior to the election, came in at a relatively strong 3.5% annualized rate. Since the election, the market is pricing in tax cuts for corporations and a significant reduction in regulatory burden, which should be good for reported earnings and should also help growth and employment. The Fed did increase rates in December and is now poised to raise rates approximately three times in 2017. We think the economy will do better once the Fed stops holding interest rates at artificially low levels and we look for a pick-up in inflation as the U.S. economy appears to be near full employment. Against this backdrop, the Fund’s focus on balance sheet strength should position it well as highly leveraged companies that have been benefitting from cheap money feel the strain of rising interest rates. In addition, as economic growth improves, we believe some of the speculative areas of the market that the Fund avoids may come under pressure as investors shift their focus to companies delivering actual profit growth on the back of improving economic conditions.
2
All of us would be happy to answer any questions that you may have about the Fund. We invite you to call any of us at 1-800-421-0131. We wish you a happy, healthy and prosperous 2017.
Warmest regards,
|
|
Rosellen C. Papp, CFA | Harry Papp, CFA |
Portfolio Manager | President |
November 30, 2016 | November 30, 2016 |


|
Brian Riordan, CFA |
Assistant Portfolio Manager |
November 30, 2016 |

Past performance is not predictive of future performance. Investment results and principal value will fluctuate so that shares, when redeemed, may be worth more or less than their original cost. Current performance may be higher or lower than the performance data quoted. Performance current through the most recent month end is available by calling 1-877-370-7277.
An investor should consider the investment objectives, risks, charges and expenses of the Fund carefully before investing. The Fund’s prospectus contains this and other important information. To obtain a copy of the Fund’s prospectus please call 1-877-370-7277 and a copy will be sent to you free of charge. Please read the prospectus carefully before you invest. The Fund is distributed by Ultimus Fund Distributors, LLC.
The Letter to Shareholders seeks to describe some of the Adviser’s current opinions and views of the financial markets. Although the Adviser believes it has a reasonable basis for any opinions or views expressed, actual results may differ, sometimes significantly so, from those expected or expressed.
3
PAPP SMALL & MID-CAP GROWTH FUND
PERFORMANCE INFORMATION
November 30, 2016 (Unaudited)
Comparison of the Change in Value of a $10,000 Investment in
the Papp Small & Mid-Cap Growth Fund versus
the Russell Midcap® Growth Index
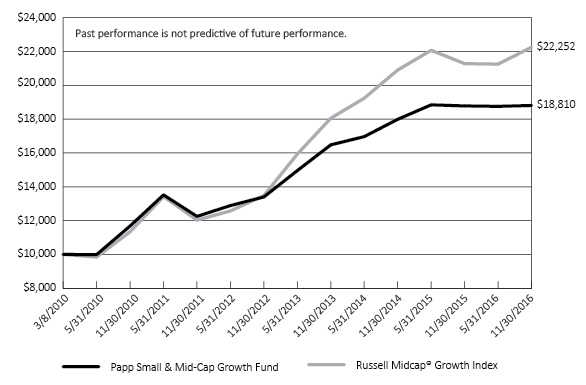
Average Annual Total Returns | |||
One | Five | Since | |
Papp Small & Mid-Cap Growth Fund(a) | 0.14% | 8.96% | 9.84% |
Russell Midcap® Growth Index | 4.54% | 13.09% | 12.62% |
(a) | The total returns shown do not reflect the deduction of taxes that a shareholder would pay on Fund distributions or the redemption of Fund shares. |
(b) | Commencement of operations was March 8, 2010. |
4
PAPP SMALL & MID-CAP GROWTH FUND
PORTFOLIO INFORMATION
November 30, 2016 (Unaudited)
Sector Diversification (% of Net Assets)
Top 10 Equity Holdings
Security Description | % of |
Mettler-Toledo International, Inc. | 6.0% |
O’Reilly Automotive, Inc. | 5.9% |
IDEX Corporation | 5.3% |
C.R. Bard, Inc. | 5.1% |
Expeditors International of Washington, Inc. | 4.8% |
FactSet Research Systems, Inc. | 4.8% |
Ecolab, Inc. | 4.6% |
PAREXEL International Corporation | 4.2% |
T. Rowe Price Group, Inc. | 3.9% |
AMETEK, Inc. | 3.8% |
5
PAPP SMALL & MID-CAP GROWTH FUND | ||||||||
COMMON STOCKS — 96.4% | Shares | Value | ||||||
Consumer Discretionary — 10.3% | ||||||||
Specialty Retail — 10.3% | ||||||||
O'Reilly Automotive, Inc. * | 5,400 | $ | 1,482,300 | |||||
Tractor Supply Company | 9,000 | 675,630 | ||||||
Williams-Sonoma, Inc. | 7,600 | 416,328 | ||||||
2,574,258 | ||||||||
Consumer Staples — 8.9% | ||||||||
Food Products — 4.3% | ||||||||
McCormick & Company, Inc. | 8,700 | 793,440 | ||||||
TreeHouse Foods, Inc. * | 4,000 | 277,280 | ||||||
1,070,720 | ||||||||
Household Products — 4.6% | ||||||||
Church & Dwight Company, Inc. | 17,000 | 744,430 | ||||||
Clorox Company (The) | 3,500 | 404,460 | ||||||
1,148,890 | ||||||||
Energy — 2.2% | ||||||||
Oil, Gas & Consumable Fuels — 2.2% | ||||||||
Pioneer Natural Resources Company | 2,900 | 554,016 | ||||||
Financials — 7.2% | ||||||||
Capital Markets — 7.2% | ||||||||
Federated Investors, Inc. - Class B | 30,000 | 824,700 | ||||||
T. Rowe Price Group, Inc. | 13,200 | 977,592 | ||||||
1,802,292 | ||||||||
Health Care — 21.1% | ||||||||
Health Care Equipment & Supplies — 9.1% | ||||||||
C.R. Bard, Inc. | 6,100 | 1,284,355 | ||||||
ResMed, Inc. | 5,300 | 325,844 | ||||||
Varian Medical Systems, Inc. * | 7,300 | 655,759 | ||||||
2,265,958 | ||||||||
Health Care Providers and Services — 1.8% | ||||||||
MEDNAX, Inc.* | 7,000 | 458,290 | ||||||
Life Sciences Tools & Services — 10.2% | ||||||||
Mettler-Toledo International, Inc. * | 3,650 | 1,503,873 | ||||||
PAREXEL International Corporation * | 18,000 | 1,062,000 | ||||||
2,565,873 | ||||||||
6
PAPP SMALL & MID-CAP GROWTH FUND | ||||||||
COMMON STOCKS — 96.4% (Continued) | Shares | Value | ||||||
Industrials — 17.3% | ||||||||
Air Freight & Logistics — 4.8% | ||||||||
Expeditors International of Washington, Inc. | 23,000 | $ | 1,213,020 | |||||
Electrical Equipment — 3.8% | ||||||||
AMETEK, Inc. | 20,100 | 951,735 | ||||||
Machinery — 8.7% | ||||||||
IDEX Corporation | 14,200 | 1,329,262 | ||||||
Wabtec Corporation | 9,900 | 838,233 | ||||||
2,167,495 | ||||||||
Information Technology — 24.8% | ||||||||
Electronic Equipment, Instruments & Components — 2.6% | ||||||||
Trimble Navigation Ltd. * | 23,000 | 648,370 | ||||||
Internet Software & Services — 3.2% | ||||||||
CoStar Group, Inc. * | 2,900 | 554,219 | ||||||
Criteo S.A. - ADR * | 6,000 | 247,620 | ||||||
801,839 | ||||||||
Semiconductors & Semiconductor Equipment — 7.5% | ||||||||
Linear Technology Corporation | 8,300 | 518,999 | ||||||
NXP Semiconductors N.V. * | 9,000 | 892,350 | ||||||
Silicon Laboratories, Inc. * | 7,100 | 471,085 | ||||||
1,882,434 | ||||||||
Software — 11.5% | ||||||||
ANSYS, Inc. * | 8,900 | 836,867 | ||||||
FactSet Research Systems, Inc. | 7,500 | 1,201,275 | ||||||
Pegasystems, Inc. | 23,400 | 844,740 | ||||||
2,882,882 | ||||||||
Materials — 4.6% | ||||||||
Chemicals — 4.6% | ||||||||
Ecolab, Inc. | 10,000 | 1,167,300 | ||||||
Total Common Stocks (Cost $14,894,513) | $ | 24,155,372 | ||||||
EXCHANGE-TRADED FUND — 2.1% | Shares | Value | ||||||
SPDR® S&P® Biotech ETF (Cost $448,871) | 8,300 | $ | 520,161 | |||||
7
PAPP SMALL & MID-CAP GROWTH FUND | ||||||||
MONEY MARKET FUND — 2.5% | Shares | Value | ||||||
Fidelity Institutional Money Market Government Portfolio - Class I, 0.28% (a) (Cost $634,861) | 634,861 | $ | 634,861 | |||||
Total Investments at Value — 101.0% (Cost $15,978,245) | $ | 25,310,394 | ||||||
Liabilities in Excess of Other Assets — (1.0%) | (242,993 | ) | ||||||
Net Assets — 100.0% | $ | 25,067,401 | ||||||
ADR - American Depositary Receipt |
ETF - Exchange-Traded Fund |
* | Non-income producing security. |
(a) | The rate shown is the 7-day effective yield as of November 30, 2016. |
See accompanying notes to financial statements. |
8
PAPP SMALL & MID-CAP GROWTH FUND | ||||
ASSETS | ||||
Investments in securities: | ||||
At acquisition cost | $ | 15,978,245 | ||
At value (Note 2) | $ | 25,310,394 | ||
Dividends receivable | 17,915 | |||
Other assets | 8,934 | |||
TOTAL ASSETS | 25,337,243 | |||
LIABILITIES | ||||
Payable for investment securities purchased | 249,862 | |||
Payable to Adviser (Note 4) | 10,280 | |||
Payable to administrator (Note 4) | 5,960 | |||
Other accrued expenses | 3,740 | |||
TOTAL LIABILITIES | 269,842 | |||
NET ASSETS | $ | 25,067,401 | ||
NET ASSETS CONSIST OF: | ||||
Paid-in capital | $ | 15,783,168 | ||
Accumulated net investment loss | (43,639 | ) | ||
Accumulated net realized losses from investments | (4,277 | ) | ||
Net unrealized appreciation on investments | 9,332,149 | |||
NET ASSETS | $ | 25,067,401 | ||
Shares of beneficial interest outstanding (unlimited number of shares authorized, no par value) | 1,413,929 | |||
Net asset value, offering price and redemption price per share (Note 2) | $ | 17.73 | ||
See accompanying notes to financial statements. |
9
PAPP SMALL & MID-CAP GROWTH FUND | ||||
INVESTMENT INCOME | ||||
Dividend income | $ | 270,676 | ||
EXPENSES | ||||
Investment advisory fees (Note 4) | 254,178 | |||
Professional fees | 42,058 | |||
Fund accounting fees (Note 4) | 32,542 | |||
Registration and filing fees | 26,901 | |||
Administration fees (Note 4) | 25,557 | |||
Transfer agent fees (Note 4) | 15,000 | |||
Insurance expense | 11,147 | |||
Custody and bank service fees | 10,379 | |||
Trustees' fees (Note 4) | 6,800 | |||
Postage and supplies | 5,412 | |||
Printing of shareholder reports | 3,641 | |||
Other expenses | 6,038 | |||
TOTAL EXPENSES | 439,653 | |||
Less fee reductions by the Adviser (Note 4) | (121,931 | ) | ||
NET EXPENSES | 317,722 | |||
NET INVESTMENT LOSS | (47,046 | ) | ||
REALIZED AND UNREALIZED GAINS (LOSSES) ON INVESTMENTS | ||||
Net realized losses from investments | (4,277 | ) | ||
Net change in unrealized appreciation (depreciation) on investments | 105,611 | |||
NET REALIZED AND UNREALIZED GAINS ON INVESTMENTS | 101,334 | |||
NET INCREASE IN NET ASSETS FROM OPERATIONS | $ | 54,288 | ||
See accompanying notes to financial statements. |
10
PAPP SMALL & MID-CAP GROWTH FUND | ||||||||
| Year 2016 | Year 2015 | ||||||
FROM OPERATIONS | ||||||||
Net investment loss | $ | (47,046 | ) | $ | (74,621 | ) | ||
Net realized gains (losses) from investments | (4,277 | ) | 618,823 | |||||
Net change in unrealized appreciation (depreciation) on investments | 105,611 | 591,139 | ||||||
Net increase in net assets from operations | 54,288 | 1,135,341 | ||||||
DISTRIBUTIONS TO SHAREHOLDERS | ||||||||
From net realized gains from security transactions | (618,784 | ) | (772,213 | ) | ||||
CAPITAL SHARE TRANSACTIONS | ||||||||
Proceeds from shares sold | 1,168,264 | 1,497,305 | ||||||
Net asset value of shares issued in reinvestment of distributions to shareholders | 613,731 | 765,609 | ||||||
Payments for shares redeemed | (2,797,922 | ) | (1,319,948 | ) | ||||
Net increase (decrease) in net assets from capital share transactions | (1,015,927 | ) | 942,966 | |||||
TOTAL INCREASE (DECREASE) IN NET ASSETS | (1,580,423 | ) | 1,306,094 | |||||
NET ASSETS | ||||||||
Beginning of year | 26,647,824 | 25,341,730 | ||||||
End of year | $ | 25,067,401 | $ | 26,647,824 | ||||
ACCUMULATED NET INVESTMENT LOSS | $ | (43,639 | ) | $ | (70,638 | ) | ||
CAPITAL SHARE ACTIVITY | ||||||||
Shares sold | 67,332 | 83,849 | ||||||
Shares reinvested | 36,251 | 44,026 | ||||||
Shares redeemed | (158,736 | ) | (73,320 | ) | ||||
Net increase (decrease) in shares outstanding | (55,153 | ) | 54,555 | |||||
Shares outstanding at beginning of year | 1,469,082 | 1,414,527 | ||||||
Shares outstanding at end of year | 1,413,929 | 1,469,082 | ||||||
See accompanying notes to financial statements. |
11
PAPP SMALL & MID-CAP GROWTH FUND | ||||||||||||||||||||
Per Share Data for a Share Outstanding Throughout Each Year | ||||||||||||||||||||
| Year | Year | Year | Year | Year | |||||||||||||||
Net asset value at beginning of year | $ | 18.14 | $ | 17.92 | $ | 16.48 | $ | 13.40 | $ | 12.25 | ||||||||||
Income (loss) from investment operations: | ||||||||||||||||||||
Net investment loss | (0.04 | ) | (0.05 | ) | (0.07 | ) | (0.06 | ) | (0.05 | ) | ||||||||||
Net realized and unrealized gains on investments | 0.05 | 0.82 | 1.58 | 3.14 | 1.20 | |||||||||||||||
Total from investment operations | 0.01 | 0.77 | 1.51 | 3.08 | 1.15 | |||||||||||||||
Less distributions: | ||||||||||||||||||||
From net realized gains from security transactions | (0.42 | ) | (0.55 | ) | (0.07 | ) | — | — | ||||||||||||
Net asset value at end of year | $ | 17.73 | $ | 18.14 | $ | 17.92 | $ | 16.48 | $ | 13.40 | ||||||||||
Total return (a) | 0.14 | % | 4.41 | % | 9.17 | % | 22.99 | % | 9.39 | % | ||||||||||
Net assets at end of year (000's) | $ | 25,067 | $ | 26,648 | $ | 25,342 | $ | 22,764 | $ | 17,557 | ||||||||||
Ratios/supplementary data: | ||||||||||||||||||||
Ratio of total expenses to average net assets (b) | 1.73 | % | 1.70 | % | 1.79 | % | 1.86 | % | 2.05 | % | ||||||||||
Ratio of net expenses to average net assets (b)(c) | 1.25 | % | 1.25 | % | 1.25 | % | 1.25 | % | 1.25 | % | ||||||||||
Ratio of net investment loss to average net assets (b)(c) | (0.19 | %) | (0.29 | %) | (0.42 | %) | (0.39 | %) | (0.37 | %) | ||||||||||
Portfolio turnover rate | 14 | % | 18 | % | 14 | % | 10 | % | 13 | % | ||||||||||
(a) | Total return is a measure of the change in value of an investment in the Fund over the years covered. The returns shown do not reflect the deduction of taxes a shareholder would pay on Fund distributions, if any, or the redemption of Fund shares. Had the Adviser not reduced its fees, total returns would have been lower. |
(b) | The ratios of expenses and net investment loss to average net assets do not reflect the Fund’s proportionate share of expenses of the underlying investment companies in which the Fund invests. |
(c) | Ratio was determined after advisory fee reductions (Note 4). |
See accompanying notes to financial statements. |
12
PAPP SMALL & MID-CAP GROWTH FUND
NOTES TO FINANCIAL STATEMENTS
November 30, 2016
1. Organization
Papp Small & Mid-Cap Growth Fund (the “Fund”) is a diversified series of Papp Investment Trust (the “Trust”), an open-end investment company established as an Ohio business trust under a Declaration of Trust dated November 12, 2009. The Fund commenced operations on March 8, 2010.
The investment objective of the Fund is long-term capital growth.
2. Significant Accounting Policies
The following is a summary of the Fund’s significant accounting policies. The policies are in conformity with accounting principles generally accepted in the United States of America (“GAAP”). As an investment company, as defined in Financial Accounting Standards Board (“FASB”) Accounting Standards Update 2013-08, the Fund follows accounting and reporting guidance under FASB Accounting Standards Codification Topic 946, “Financial Services – Investment Companies.”
In October 2016, the Securities and Exchange Commission (the “SEC”) released its final rule on Investment Company Reporting Modernization (the “Rule”). The Rule, which introduces two new regulatory reporting forms for investment companies – Form N-PORT and Form N-CEN, also contains amendments to Regulation S-X which impact financial statement presentation, particularly the presentation of derivative investments. Although still evaluating the impact of the Rule, management believes that many of the Regulation S-X amendments are consistent with the Fund’s current financial statement presentation and expects that the Fund will be able to comply with the Rule’s Regulation S-X amendments by the August 1, 2017 compliance date.
Securities valuation – The Fund’s portfolio securities are valued at market value as of the close of regular trading on the New York Stock Exchange (the “NYSE”) (normally 4:00 p.m. Eastern time) on each business day the NYSE is open. Securities, including common stocks and ETFs, listed on the NYSE or other exchanges are valued on the basis of their last sale price on the exchanges on which they are primarily traded. If there are no sales on that day, the securities are valued at the closing bid price on the NYSE or other primary exchange for that day. NASDAQ listed securities are valued at the NASDAQ Official Closing Price. If there are no sales on that day, the securities are valued at the last bid price as reported by NASDAQ. Securities traded in the over-the-counter market are valued at the last reported sale price, if available, otherwise at the most recently quoted bid price. To the extent the Fund is invested in other open-end investment companies, including money market funds, that are registered under the Investment Company Act of 1940 (the “1940 Act”), the Fund’s net asset value per share (“NAV”) is calculated based upon the NAVs reported by such registered open-end companies,
13
PAPP SMALL & MID-CAP GROWTH FUND
NOTES TO FINANCIAL STATEMENTS (Continued)
and the prospectuses for these companies explain the circumstances under which they will use fair value pricing and the effects of using fair value pricing. In the event that market quotations are not readily available or are considered unreliable due to market or other events, securities and other assets are valued at fair value as determined in good faith in accordance with procedures adopted by the Board of Trustees and will be classified as Level 2 or 3 within the fair value hierarchy (see below), depending on the inputs used. Factors for determining when portfolio investments are subject to fair value determination include, but are not limited to, the following: the spread between bid and asked prices is substantial; infrequency of sales; thinness of market; the size of reported trades; a temporary lapse in the provision of prices by any reliable pricing source; and actions of the securities or future markets, such as the suspension or limitation of trading.
GAAP establishes a single authoritative definition of fair value, sets out a framework for measuring fair value and requires additional disclosures about fair value measurements.
Various inputs are used in determining the value of the Fund’s investments. These inputs are summarized in the three broad levels listed below:
● | Level 1 – quoted prices in active markets for identical securities |
● | Level 2 – other significant observable inputs |
● | Level 3 – significant unobservable inputs |
The inputs or methodology used for valuing securities are not necessarily an indication of the risks associated with investing in those securities. The inputs used to measure fair value may fall into different levels of the fair value hierarchy. In such cases, for disclosure purposes, the level in the fair value hierarchy within which the fair value measurement falls in its entirety is determined based on the lowest level input that is significant to the fair value measurement.
The following is a summary of the inputs used to value the Fund’s investments as of November 30, 2016:
| Level 1 | Level 2 | Level 3 | Total | ||||||||||||
Common Stocks | $ | 24,155,372 | $ | — | $ | — | $ | 24,155,372 | ||||||||
Exchange-Traded Fund | 520,161 | — | — | 520,161 | ||||||||||||
Money Market Fund | 634,861 | — | — | 634,861 | ||||||||||||
Total | $ | 25,310,394 | $ | — | $ | — | $ | 25,310,394 | ||||||||
14
PAPP SMALL & MID-CAP GROWTH FUND
NOTES TO FINANCIAL STATEMENTS (Continued)
Refer to the Fund’s Schedule of Investments for a listing of the common stocks by industry type. As of November 30, 2016, the Fund did not have any transfers into or out of any Level. In addition, the Fund did not hold derivative instruments or any assets or liabilities that were measured at fair value on a recurring basis using significant unobservable inputs (Level 3) as of November 30, 2016. It is the Fund’s policy to recognize transfers into or out of any Level at the end of the reporting period.
Share valuation – The NAV of the Fund is calculated daily by dividing the total value of the Fund’s assets, less liabilities, by the number of shares outstanding. The offering price and redemption price per share of the Fund is equal to the NAV.
Investment income – Dividend income is recorded on the ex-dividend date. Interest income is accrued as earned.
Security transactions – Security transactions are accounted for on the trade date. Realized gains and losses on securities sold are determined on a specific identification basis.
Distributions to shareholders – Distributions to shareholders arising from net investment income and net realized capital gains, if any, are distributed at least once each year. The amount of distributions from net investment income and net realized capital gains are determined in accordance with federal income tax regulations, which may differ from GAAP. Dividends and distributions to shareholders are recorded on the ex-dividend date. The tax character of distributions paid during the years ended November 30, 2016 and 2015 was long-term capital gains.
Estimates – The preparation of financial statements in conformity with GAAP requires management to make estimates and assumptions that affect the reported amounts of assets and liabilities and disclosure of contingent assets and liabilities as of the date of the financial statements and the reported amounts of income and expenses during the reporting period. Actual results could differ from those estimates.
Federal income tax – The Fund has qualified and intends to continue to qualify each year as a “regulated investment company” under Subchapter M of the Internal Revenue Code of 1986 (the “Code”). By so qualifying, the Fund will not be subject to federal income taxes to the extent that it distributes its net investment income and any net realized capital gains in accordance with the Code.
In order to avoid imposition of the excise tax applicable to regulated investment companies, it is also the Fund’s intention to declare as dividends in each calendar year at least 98% of its net investment income (earned during the calendar year) and 98.2% of its net realized capital gains (earned during the twelve months ended November 30) plus undistributed amounts from prior years.
15
PAPP SMALL & MID-CAP GROWTH FUND
NOTES TO FINANCIAL STATEMENTS (Continued)
The following information is computed on a tax basis for each item as of November 30, 2016:
Tax cost of portfolio investments | $ | 15,978,245 | ||
Gross unrealized appreciation | $ | 9,604,879 | ||
Gross unrealized depreciation | (272,730 | ) | ||
Net unrealized appreciation | 9,332,149 | |||
Accumulated capital and other losses | (47,916 | ) | ||
Accumulated earnings | $ | 9,284,233 |
Qualified late year ordinary losses incurred after December 31, 2015 and within the taxable year are deemed to arise on the first day of the Fund’s next taxable year. For the year ended November 30, 2016, the Fund deferred $43,639 of late year ordinary losses to December 1, 2016 for federal income tax purposes.
As of November 30, 2016, the Fund had short-term capital loss carryforwards of $4,277 for federal income tax purposes, which may be carried forward indefinitely. These capital loss carryforwards are available to offset realized gains in future years, thereby reducing future taxable gains distributions.
For the year ended November 30, 2016, the Fund reclassified $74,045 of net investment loss and $80 of over-distribution of net realized gains against paid-in capital on the Statement of Assets and Liabilities. Such reclassifications, the result of permanent differences between the financial statement and income tax reporting requirements, had no effect on the Fund’s net assets or NAV.
The Fund recognizes the tax benefits or expenses of uncertain tax positions only when the position is “more likely than not” to be sustained assuming examination by tax authorities. Management has reviewed the Fund’s tax positions taken on federal income tax returns for all open tax years (November 30, 2013 through November 30, 2016) and has concluded that no provision for unrecognized tax benefits or expenses is required in these financial statements and does not expect this to change over the next twelve months. The Fund identifies its major tax jurisdiction as U.S. Federal.
3. Investment Transactions
During the year ended November 30, 2016, cost of purchases and proceeds from sales of investment securities, other than short-term investments, were $3,568,704 and $5,117,247, respectively.
16
PAPP SMALL & MID-CAP GROWTH FUND
NOTES TO FINANCIAL STATEMENTS (Continued)
4. Transactions with Related Parties
Certain Trustees and officers of the Trust are directors and officers of L. Roy Papp & Associates, LLP (the “Adviser”) or of Ultimus Fund Solutions, LLC (“Ultimus”), the Fund’s administrator, transfer agent and fund accounting agent, and Ultimus Fund Distributors, LLC (the “Distributor”), the Fund’s principal underwriter. These Trustees and officers are not compensated by the Fund for their services as Trustees and officers of the Fund.
INVESTMENT ADVISORY AGREEMENT
The Fund’s investments are managed by the Adviser pursuant to the terms of an Investment Advisory Agreement. For its services, the Fund pays the Adviser an advisory fee, computed daily and paid monthly, at the annual rate of 1.00% of its average daily net assets.
The Adviser has contractually agreed to reduce its advisory fees and to reimburse the Fund’s operating expenses to the extent necessary so that the Fund’s annual ordinary operating expenses (excluding brokerage costs, taxes, interest, acquired fund fees and expenses and extraordinary expenses, if any) do not exceed an amount equal to 1.25% of its average daily net assets. This Expense Limitation Agreement (“ELA”) remains in effect until at least April 1, 2017. Accordingly, the Adviser reduced its advisory fees by $121,931 during the year ended November 30, 2016.
The ELA permits the Adviser to recover fee reductions and expense reimbursements made on behalf of the Fund, but only for a period of three years after such reduction or reimbursement were incurred and only if such recovery will not cause the Fund’s expense ratio to exceed the annual rate of 1.25%. As of November 30, 2016, the Adviser may in the future recover fee reductions and expense reimbursements totaling $367,231. The Adviser may recover a portion of this amount no later than the dates as stated below:
November 30, 2017 | $ | 127,948 | ||
November 30, 2018 | 117,352 | |||
November 30, 2019 | 121,931 | |||
$ | 367,231 |
OTHER SERVICE PROVIDERS
Ultimus provides administration, fund accounting and transfer agency services to the Fund. The Fund pays Ultimus fees in accordance with the agreements for such services. In addition, the Fund pays out-of-pocket expenses including but not limited to postage, supplies and costs of pricing the Fund’s portfolio securities. The Distributor is a wholly-owned subsidiary of Ultimus. The Distributor is compensated by the Adviser (not the Fund) for acting as principal underwriter.
17
PAPP SMALL & MID-CAP GROWTH FUND
NOTES TO FINANCIAL STATEMENTS (Continued)
PLAN OF DISTRIBUTION
The Trust has adopted a plan of distribution (the “Plan”) pursuant to which the Fund may incur certain expenses related to the distribution of its shares. The annual limitation of payment of expenses pursuant to the Plan is 0.25% of the Fund’s average daily net assets. The Board of Trustees has not authorized the payment of any fees pursuant to the Plan until at least April 1, 2017.
TRUSTEE COMPENSATION
Each Trustee who is not an interested person of the Trust (“Independent Trustee”) receives from the Fund a fee of $500 for each Board meeting attended, except that the Chair of the Committee of Independent Trustees receives a fee of $700 for each Board meeting attended.
PRINCIPAL HOLDERS OF FUND SHARES
As of November 30, 2016, the following shareholders owned of record 5% or more of the outstanding shares of the Fund:
NAME OF RECORD OWNER | % Ownership |
Charles Schwab & Company, Inc. (for the benefit of its customers) | 57% |
Victoria S. Cavallero | 12% |
Harry A. Papp | 9% |
A beneficial owner of 25% or more of the Fund’s outstanding shares may be considered a controlling person. That shareholder’s vote could have a more significant effect on matters presented at a shareholder’s meeting.
5. Contingencies and Commitments
The Fund indemnifies the Trust’s officers and Trustees for certain liabilities that might arise from their performance of their duties to the Fund. Additionally, in the normal course of business the Fund enters into contracts that contain a variety of representations and warranties and which provide general indemnifications. The Fund’s maximum exposure under these arrangements is unknown, as this would involve future claims that may be made against the Fund that have not yet occurred. However, based on experience, the Fund expects the risk of loss to be remote.
18
PAPP SMALL & MID-CAP GROWTH FUND
NOTES TO FINANCIAL STATEMENTS (Continued)
6. Subsequent Events
The Fund is required to recognize in the financial statements the effects of all subsequent events that provide additional evidence about conditions that existed as of the date of the Statement of Assets and Liabilities. For non-recognized subsequent events that must be disclosed to keep the financial statements from being misleading, the Fund is required to disclose the nature of the event as well as an estimate of its financial effect, or a statement that such an estimate cannot be made. Management has evaluated subsequent events through the issuance of these financial statements and has noted no such events.
19
PAPP SMALL & MID-CAP GROWTH FUND |
To the Board of Trustees of Papp Investment Trust
and the Shareholders of Papp Small & Mid-Cap Growth Fund
We have audited the accompanying statement of assets and liabilities of Papp Small & Mid-Cap Growth Fund, a series of shares of beneficial interest in Papp Investment Trust, (the “Fund”) including the schedule of investments, as of November 30, 2016, and the related statement of operations for the year then ended, the statements of changes in net assets for each of the years in the two-year period then ended and the financial highlights for each of the years in the five-year period then ended. These financial statements and financial highlights are the responsibility of the Fund’s management. Our responsibility is to express an opinion on these financial statements and financial highlights based on our audits.
We conducted our audits in accordance with the standards of the Public Company Accounting Oversight Board (United States). Those standards require that we plan and perform the audits to obtain reasonable assurance about whether the financial statements and financial highlights are free of material misstatement. An audit includes examining, on a test basis, evidence supporting the amounts and disclosures in the financial statements. Our procedures included confirmation of securities owned as of November 30, 2016 by correspondence with the custodian and brokers. An audit also includes assessing the accounting principles used and significant estimates made by management, as well as evaluating the overall financial statement presentation. We believe that our audits provide a reasonable basis for our opinion.
In our opinion, the financial statements and financial highlights referred to above present fairly, in all material respects, the financial position of Papp Small & Mid-Cap Growth Fund as of November 30, 2016, and the results of its operations for the year then ended, the changes in its net assets for each of the years in the two-year period then ended and its financial highlights for each of the years in the five-year period then ended, in conformity with accounting principles generally accepted in the United States of America.
| |
BBD, LLP |

Philadelphia, Pennsylvania
January 26, 2017
20
PAPP SMALL & MID-CAP GROWTH FUND |
We believe it is important for you to understand the impact of costs on your investment. As a shareholder of the Fund, you incur ongoing costs, including management fees and other operating expenses. The following examples are intended to help you understand your ongoing costs (in dollars) of investing in the Fund and to compare these costs with the ongoing costs of investing in other mutual funds.
A mutual fund’s ongoing costs are expressed as a percentage of its average net assets. This figure is known as the expense ratio. The expenses in the table below are based on an investment of $1,000 made at the beginning of the most recent period (June 1, 2016) and held until the end of the period (November 30, 2016).
The table below illustrates the Fund’s ongoing costs in two ways:
Actual fund return – This section helps you to estimate the actual expenses that you paid over the period. The “Ending Account Value” shown is derived from the Fund’s actual return, and the third column shows the dollar amount of operating expenses that would have been paid by an investor who started with $1,000 in the Fund. You may use the information here, together with the amount you invested, to estimate the expenses that you paid over the period.
To do so, simply divide your account value by $1,000 (for example, an $8,600 account value divided by $1,000 = 8.6), then multiply the result by the number given for the Fund under the heading “Expenses Paid During Period.”
Hypothetical 5% return – This section is intended to help you compare the Fund’s ongoing costs with those of other mutual funds. It assumes that the Fund had an annual return of 5% before expenses during the period shown, but that the expense ratio is unchanged. In this case, because the return used is not the Fund’s actual return, the results do not apply to your investment. The example is useful in making comparisons because the Securities and Exchange Commission (“SEC”) requires all mutual funds to calculate expenses based on a 5% return. You can assess the Fund’s ongoing costs by comparing this hypothetical example with the hypothetical examples that appear in shareholder reports of other funds.
Note that expenses shown in the table are meant to highlight and help you compare ongoing costs only. The Fund does not charge transaction fees, such as purchase or redemption fees, nor does it carry a “sales load.”
The calculations assume no shares were bought or sold during the period. Your actual costs may have been higher or lower, depending on the amount of your investment and the timing of any purchases or redemptions.
21
PAPP SMALL & MID-CAP GROWTH FUND
ABOUT YOUR FUND’S EXPENSES (Unaudited) (Continued)
More information about the Fund’s expenses, including historical annual expense ratios, can be found in this report. For additional information on operating expenses and other shareholder costs, please refer to the Fund’s prospectus.
Beginning | Ending | Expenses | |
Based on Actual Fund Return | $1,000.00 | $1,002.80 | $6.26 |
Based on Hypothetical 5% Return (before expenses) | $1,000.00 | $1,018.75 | $6.31 |
* | Expenses are equal to the Fund’s annualized net expense ratio of 1.25% for the period, multiplied by the average account value over the period, multiplied by 183/366 (to reflect the one-half year period). |
22
PAPP SMALL & MID-CAP GROWTH FUND |
A description of the policies and procedures that the Fund uses to vote proxies relating to portfolio securities is available without charge upon request by calling toll-free 1-877-370-7277, or on the SEC’s website at http://www.sec.gov. Information regarding how the Fund voted proxies relating to portfolio securities during the most recent 12-month period ended June 30 is available without charge upon request by calling toll-free 1-877-370-7277, or on the SEC’s website at http://www.sec.gov.
The Trust files a complete listing of portfolio holdings for the Fund with the SEC as of the end of the first and third quarters of each fiscal year on Form N-Q. These filings are available upon request by calling 1-877-370-7277. Furthermore, you may obtain a copy of the filings on the SEC’s website at http://www.sec.gov. The Trust’s Forms N-Q may also be reviewed and copied at the SEC’s Public Reference Room in Washington, DC, and information on the operation of the Public Reference Room may be obtained by calling 1-800-SEC-0330.
FEDERAL TAX INFORMATION (Unaudited)
In accordance with federal tax requirements, the following provides shareholders with information concerning distributions from net realized gains made by the Fund during the fiscal year ended November 30, 2016. Certain dividends paid by the Fund may be subject to a maximum tax rate of 23.8%. During the year ended November 30, 2016, the Fund designated $618,704 as 20% long-term capital gain distributions. As required by federal regulations, complete information was computed and reported in conjunction with your 2015 Form 1099-DIV.
23
PAPP SMALL & MID-CAP GROWTH FUND
BOARD OF TRUSTEES AND EXECUTIVE OFFICERS (Unaudited)
The Board of Trustees has overall responsibility for management of the Trust’s affairs. The Trustees serve during the lifetime of the Trust and until its termination, or until death, resignation, retirement, or removal. The Trustees, in turn, elect the officers of the Trust to actively supervise its day-to-day operations. The officers have been elected for an annual term. The following are the Trustees and executive officers of the Trust:
Name, Address and | Position(s) Held with Trust and Length of Time Served | Principal Occupation(s) During | Number of |
Interested Trustees: | |||
*Harry A. Papp | President and Trustee since December 2011 | Managing Partner of L. Roy Papp & Associates, LLP | 1 |
*Rosellen C. Papp | Trustee since February 2010 | Partner and Research Director of L. Roy Papp & Associates, LLP | 1 |
Independent Trustees: | |||
Jean C. Bingham | Trustee since October 2016 | Retired; Vice President, GreenPoint Financial (a holding company providing banking and mortgage services) from 1993-2004; President, GreenPoint Credit (a wholly owned subsidiary of GreenPoint Financial) from 2003-2004. | 1 |
Cynthia P. Hubiak | Trustee since February 2010 | President and Chief Executive Officer, Arizona Society of CPAs | 1 |
Carolyn P. O’Malley | Trustee since February 2010 | Retired; Executive Director, Dorrance Family Foundation (a private foundation providing educational, conservation and other grants) from 2001-2009. | 1 |
* | Harry A. Papp and Rosellen C. Papp, as partners of the Adviser, are considered “interested persons” of the Trust within the meaning of Section 2(a)(19) of the 1940 Act. Harry A. Papp and Rosellen C. Papp are married. |
24
PAPP SMALL & MID-CAP GROWTH FUND
BOARD OF TRUSTEES AND EXECUTIVE OFFICERS (Unaudited) (Continued)
Name, Address and | Position(s) Held with Trust and Length of Time Served | Principal Occupation(s) During Past 5 Years |
Executive Officers: | ||
Brian M. Riordan | Vice President since February 2012 | Partner and Research Analyst of L. Roy Papp & Associates, LLP |
Robert G. Dorsey | Vice President since November 2009 | Managing Director of Ultimus Fund Solutions, LLC and Ultimus Fund Distributors, LLC |
Theresa M. Bridge | Treasurer since January 2013 | Vice President, Director of Financial Administration of Ultimus Fund Solutions, LLC |
Tina H. Bloom | Secretary since July 2011 | Vice President, Director of Administration of Ultimus Fund Solutions, LLC |
Julie A. Hein | Chief Compliance Officer since February 2010 | Partner and Chief Compliance Officer of L. Roy Papp & Associates, LLP |
Additional information about members of the Board and executive officers is available in the Fund’s Statement of Additional Information (“SAI”). To obtain a free copy of the SAI, please call 1-877-370-7277.
25
| Item 2. | Code of Ethics. |
| Item 3. | Audit Committee Financial Expert. |
| Item 4. | Principal Accountant Fees and Services. |
| (a) | Audit Fees. The aggregate fees billed for professional services rendered by the principal accountant for the audit of the registrant’s annual financial statements or for services that are normally provided by the accountant in connection with statutory and regulatory filings or engagements were $12,500 and $12,000 with respect to the registrant’s fiscal years ended November 30, 2016 and 2015, respectively. |
| (b) | Audit-Related Fees. No fees were billed in the last fiscal year for assurance and related services by the principal accountant that are reasonably related to the performance of the audit of the registrant’s financial statements and are not reported under paragraph (a) of this Item. |
| (c) | Tax Fees. The aggregate fees billed for professional services rendered by the principal accountant for tax compliance, tax advice, and tax planning were $2,000 and $2,000 with respect to the registrant’s fiscal years ended November 30, 2016 and 2015, respectively. The services comprising these fees are the preparation of the registrant’s federal income and excise tax returns. |
| (d) | All Other Fees. No fees were billed in either of the last two fiscal years for products and services provided by the principal accountant, other than the services reported in paragraphs (a) through (c) of this Item. |
| (e)(1) | The audit committee has not adopted pre-approval policies and procedures described in paragraph (c)(7) of Rule 2-01 of Regulation S-X. |
| (e)(2) | None of the services described in paragraph (b) through (d) of this Item were approved by the audit committee pursuant to paragraph (c)(7)(i)(C) of Rule 2-01 of Regulation S-X. |
| (f) | Less than 50% of hours expended on the principal accountant’s engagement to audit the registrant’s financial statements for the most recent fiscal year were attributed to work performed by persons other than the principal accountant’s full-time, permanent employees. |
| (g) | During the fiscal years ended November 30, 2016 and 2015, aggregate non-audit fees of $2,000 and $2,000, respectively, were billed by the registrant’s principal accountant for services rendered to the registrant. No non-audit fees were billed in the last fiscal year by the registrant’s principal accountant for services rendered to the registrant’s investment adviser (not including any sub-adviser whose role is primarily portfolio management and is subcontracted with or overseen by another investment adviser), and any entity controlling, controlled by, or under common control with the adviser that provides ongoing services to the registrant. |
| (h) | The principal accountant has not provided any non-audit services to the registrant’s investment adviser (not including any sub-adviser whose role is primarily portfolio management and is subcontracted with or overseen by another investment adviser), and any entity controlling, controlled by, or under common control with the investment adviser that provides ongoing services to the registrant. |
| Item 5. | Audit Committee of Listed Registrants. |
| Item 6. | Schedule of Investments. |
| (a) | Not applicable [schedule filed with Item 1] |
| (b) | Not applicable |
| Item 7. | Disclosure of Proxy Voting Policies and Procedures for Closed-End Management Investment Companies. |
| Item 8. | Portfolio Managers of Closed-End Management Investment Companies. |
| Item 9. | Purchases of Equity Securities by Closed-End Management Investment Company and Affiliated Purchasers. |
| Item 10. | Submission of Matters to a Vote of Security Holders. |
| Item 11. | Controls and Procedures. |
| Item 12. | Exhibits. |
| Exhibit 99.CODE ETH | Code of Ethics |
| Exhibit 99.CERT | Certifications required by Rule 30a-2(a) under the Act |
| Exhibit 99.906CERT | Certifications required by Rule 30a-2(b) under the Act |
| (Registrant) | Papp Investment Trust | ||
| By (Signature and Title)* | /s/ Harry A. Papp | ||
| Harry A. Papp, President | |||
| Date | February 1, 2017 | ||
| By (Signature and Title)* | /s/ Harry A. Papp | ||
| Harry A. Papp, President | |||
| Date | February 1, 2017 | ||
| By (Signature and Title)* | /s/ Theresa M. Bridge | ||
| Theresa M. Bridge, Treasurer and Principal Financial Officer | |||
| Date | February 1, 2017 | ||
* | Print the name and title of each signing officer under his or her signature. |